A Quality Rural Lifestyle in a vibrant, caring and sustainable community 30 Oct 2012 7 Nov 2012 19 Dec 2012 11 Jan 2013 19 Feb 2013 22 Mar 2013 Adopted by Council: 24 June 2013

Welcome message from author
This document is posted to help you gain knowledge. Please leave a comment to let me know what you think about it! Share it to your friends and learn new things together.
Transcript

A Quality Rural Lifestylein a vibrant, caring and sustainable community
30 Oct 2012
7 Nov 2012
19 Dec 2012
11 Jan 2013
19 Feb 2013
22 Mar 2013
Adopted by Council: 24 June 2013

Front Cover: Replacement of Cuan Bridge, Bunnan Road, 20km west of Scone

Upper Hunter Shire Council Delivery Program & Operational Plan 2013/14 – 2014/15
CONTENTS
PART 1: Introduction to the Delivery & Operational Plan and Your Council 1.1 Introduction – Mayor Michael Johnsen ............................................................................................ 1 1.2 Overview – General Manager .............................................................................................................. 3 1.3 Public Participation and Submissions ................................................................................................. 4 1.4 Council’s Vision, Mission, Charter and Corporate Values ............................................................ 5 1.5 What is the Community Strategic Plan – 2010+? ............................................................................ 6 1.6 What is Council’s Delivery Program & Operational Plan? ............................................................ 6 1.7 How does the Delivery Program & Operational Plan link with and support the
Community Strategic Plan? .................................................................................................................... 6 1.8 Statement of Business Ethics .................................................................................................................. 7 1.9 Integrated Planning and Reporting ..................................................................................................... 9 1.10 Council’s Goals/Strategies for Key Functions ................................................................................ 10 1.11 How Your Council Works .................................................................................................................... 17 1.12 Council ...................................................................................................................................................... 18 1.13 Staff & Organisational Chart .............................................................................................................. 19 1.14 Committees & Council Delegates ...................................................................................................... 20 1.15 Definition of Terms and Indicators ................................................................................................... 22
PART 2: Statement of Functions and Indicators 2.1 List of Functions and Services ............................................................................................................... 23 2.2 Objectives, Performance Targets, Means and Assessment .......................................................... 25 2.3 Asset Replacement Programs ............................................................................................................... 26 2.4 Capital Projects .......................................................................................................................................... 29 2.5 Business and Commercial Activities .................................................................................................... 45 2.6 Human Resources Activities .................................................................................................................. 46 2.7 Environmental Activities: Response to the “State of the Environment” Report .................... 48 2.8 Access and Equity – Community Plan ................................................................................................ 49
PART 3: Statement of Revenue Policy 3.1 Rates .......................................................................................................................................................... 50 3.2 Fees and Charges .................................................................................................................................. 52 3.3 Hardship Policy for Rates & Charges ............................................................................................... 59 3.4 Pricing Policies for Services and Private Works ............................................................................. 60 3.5 Proposed Borrowings .......................................................................................................................... 62 3.6 Budget Summary & Income Statement .......................................................................................... 64
PART 4: Details of Budget 4.1 Budget Commentary and Trend Analysis ...................................................................................... 69 4.2 General Fund – Budgets and Services ............................................................................................ 71
Administration .................................................................................................................................... 72 Agriculture .......................................................................................................................................... 97 Community Services & Education ..............................................................................................101 Economic Affairs ..............................................................................................................................120 Environment .....................................................................................................................................136 General Purpose Revenues ..........................................................................................................146 Governance ......................................................................................................................................150 Health .................................................................................................................................................154 Housing & Community Amenities ..............................................................................................158 Mining, Manufacturing & Construction ...................................................................................170 Public Order & Safety .....................................................................................................................176 Recreation & Culture ......................................................................................................................186 Transport & Communication .......................................................................................................204
4.3 Water Funds – Budgets and Services ............................................................................................220 4.4 Sewer Funds – Budgets and Services ............................................................................................227 4.5 Restricted Assets, all Funds ..............................................................................................................233 4.6 Net Current Assets, Non-Current Cash & Investments ...........................................................237
PART 5: Delivery Plan Reporting 5.1 Periodic Reports ...................................................................................................................................240 5.2 Annual Reports ....................................................................................................................................240
ATTACHMENTS 1. Fees and Charges Schedule2. Access & Equity Activity Statement3. Rate Category Maps

Part 1 | Introduction to the Delivery Program & Operational Plan and your Council
1.1 Introduction: Mayor, Michael Johnsen
The Upper Hunter Shire Council Delivery Program & Operational Plan 2013/14 to 2016/17 is the document that establishes the future direction of Council’s activities over the next four years. Its primary purpose is to provide the community with information about the works and services provided by Council, how these activities are funded, what is planned for future years and particular details of Council’s financial position.
This Delivery Program & Operational Plan incorporates the requirements of the Minister for Local Government to limit general rate revenue increase to the rate pegging limit of 3.4% together with an additional Special Rate Variation, subject to IPART approval, of 2.5% above the rate pegging limit. Whilst the budget presented with this Delivery Program & Operational Plan represents a near balanced budget, restrictions as to revenue and increased costs make each year increasingly difficult to provide effective services at a reasonable cost to residents and ratepayers. The rate pegging limit is significantly less than cost increase, impacting on Council’s ability to provide the works and services from reduced funding.
Water, Sewer and Waste Services are not subject to the rate pegging limit and are increased to enable capital works and/or payment of the NSW Government Waste Levy.
The Water Augmentation for Scone/Aberdeen has commenced with the completion of the Scone Pipeline from Glenbawn Dam, with the proposed Water Treatment Plant and Aberdeen backfeed to be completed over the next three (3) financial years.
Council determined that it would apply for a Special Rate Variation as proposed. The draft Budget has been prepared with the scenario of a 2.5% Special Rate Variation above the Rate Pegging Limit each year, for three (3) years.
Revenue raised from the Special Rate Variation will be fully utilised on specific Road, Street and Bridge projects, identified separately in the budget, utilizing subsidized loans under the State Government’s Local Infrastructure Renewal Scheme. Should the SRV not proceed, these works will not proceed. Increases to water access charges are in line with the rate pegging limit, increases to water usage charges are approximately 7.5%.
Sewer charges will increase in line with inflationary costs and future asset replacements and capital works.
Waste Charges have had to be increased due to two factors outside of Council’s control. Firstly there has been a significant increase in the waste landfill charges for the waste disposed through the Muswellbrook facility. Secondly, a charge has been imposed on Council by the State Government for waste disposal. This “waste” levy equates to $38.60 per assessment in 2012/13 and will increase by approximately $12.00 plus cpi per assessment each year for several more years. There will also be significant rises in the tip charges as a result of this new levy. Proceeds of this levy will go to the State Government as a tax on waste services, with virtually no benefit to Upper Hunter Shire Council, if Council is unsuccessful in its four (4) year fight to be excluded from the levy area, which has been recommended to Government in a recent waste .
Council will separately identify the Waste Levy in its charges so these may be removed on determination of the new threshold limits for payment of the Waste Levy.
Kerbside recycling will continue to be available. Council encourages more recycling as the use of this service per household has declined.
Annual charges for onsite sewerage systems (OSSM) will increase by the rate pegging limit of 3.4%. The income from this fee allows additional resources to be applied to this important environmental monitoring program.
Land developments will continue in Aberdeen, Merriwa, Murrurundi, and Scone to meet residential demand and provide land for industrial/commercial purposes. Council has residential land available for purchase in both Merriwa and Murrurundi and the first stage of the Aberdeen Heights residential land development is complete with lots now sold. Any enquiries should be directed to the local Council offices or Agents responsible.

A key component of this Delivery Program & Operational Plan is the incorporation of considerable capital works associated with Water Augmentation, further Bridge Replacements, Town Street Reconstruction, Rural Road Reconstruction, together with increased gravel re-sheeting in rural areas.
Your submissions to the draft Plan will help Council to determine its proposed activities and direction. Council is keen to continue to work closely with the community it represents. Your submissions will be appreciated and carefully considered.
Thank you in advance for your involvement with Council in this planning and budget process.
Cr Michael Johnsen MAYOR

1.2 Overview: General Manager
This Delivery Program & Operational Plan is presented to Council and the community as the document that communicates Council’s activities and budget for the next four years. The Delivery Program & Operational Plan is also the reference document for Council and staff to manage the works and services provided for the community and to measure the achievement of its goals and strategies. Council’s 2013/14 to 2016/17 Delivery Program & Operational Plan demonstrates that the Upper Hunter Shire Council’s financial position continues to be sound, providing significant funding for capital works, particularly for roads, bridges and water supply. Council has a strong focus on its Road and Bridge Assets Management.
Council has adopted a strategic ten year financial plan that incorporates both the period of the Delivery Program & Operational Plan (4 years) and the Community Strategic Plan, focusing on infrastructure, asset renewal and maintenance.
The detailed budget, incorporating Council’s functions and services, objectives and performance assessment are outlined in Part 4 of this document.
Council has reviewed its Community Strategic Plan and Future Works Program. The Community Strategic Plan outlines the long term objectives well beyond the four year Delivery Program & Operational Plan and the term of Council. Submissions are invited for both the revised Community Strategic Plan and the draft Delivery Program & Operational Plan. The NSW Government’s rate pegging legislation limits Council’s total rate revenue. This year the limit is 3.4%.
The budget reflects Council’s continuous effort towards maintenance and upgrading of Council’s roads and bridges. The ongoing funding provided by the renewal of the Federal Government’s Roads to Recovery and Local Infrastructure Programs are an essential component of Council’s asset management programs. Council has included a continued program of replacement of bridges in the 2013/14 and future budget years, funded from a combination of developer contributions, grant funds and loans, subject to approval in the Local Infrastructure Renewal Scheme (LIRS) initiated by the NSW Government, together with the proposed Special Rate Variation (SRV). The SRV has been submitted to IPART and, if approved and adopted by Council, will increase general rates by 2.5% above the rate pegging limit each year for three (3) years.
The Council’s financial position is strengthened by the use of restricted assets (reserves) and the level of unrestricted assets (working funds). Council will continue to monitor closely its financial position to ensure that adequate resources are available to meet current expenditure requirements and long term liabilities. Future constraints of rate pegging will need to be addressed, with revenue limitations and increased costs to maintain significant lengths of road and timber bridges.
Proposed borrowings this financial year include further bridge replacements, rural road reconstruction and Town Street Construction, subject to subsidy of interest through the NSW Government’s Local Infrastructure Renewal Scheme.
Should Council not proceed with the Special Rate Variation, these borrowings under the subsidised LIRS scheme will not proceed, neither will the road, town street and bridge projects identified in the budget detail, proceed.
Land development works were undertaken in Merriwa, Murrurundi and Aberdeen. These projects are self-funded through a land development restricted asset and income from the sale of land.
Other capital works planned for 2013/14 to 2016/17 are included in Section 2.4 of this document, including the source of funding and year of construction. Town streets, roads and bridges remain the priority for Council.
Submissions are specifically invited on this draft Delivery Program & Operational Plan as required by the Local Government Act, however, submissions are also welcome on Council’s supporting documentations such as the Community Strategic Plan/Future Works Program, Social Plan and State of the Environment Reports.
I look forward to those submissions and their consideration by Council.
Daryl Dutton GENERAL MANAGER

1.3 Public Participation and Submissions
The Local Government Act, 1993 provides for Council to prepare a draft Delivery Program & Operational Plan which must be placed on public exhibition for a period of at least twenty-eight (28) days.
During the exhibition period, members of the public are provided with free and available access to the draft Delivery Program & Operational Plan through Council’s website, Council’s offices and the libraries at Aberdeen, Cassilis, Merriwa, Murrurundi and Scone.
Council will undertake a series of community consultation meetings prior to finalising the draft Delivery Program & Operational Plan in Aberdeen Merriwa, Murrurundi and Scone. The dates and venues were separately advertised.
Council actively invites the community to make submissions in relation to the draft Delivery Program & Operational Plan.
At the conclusion of the exhibition period, Council will consider the submissions made prior to the adoption of the Delivery Program & Operational Plan.
The Delivery Program & Operational Plan, as adopted by Council, sets out its expenditure and revenue requirements to enable the issue of notices for rates and charges for the ensuing year.
The Delivery Program & Operational Plan will be exhibited and adopted in accordance with the following timetable:
22/04/13 Consideration of draft Delivery Program & Operational Plan by Council, prior to exhibition.
23/04/13 Public Notice of exhibition period and receipt of submissions to the draft Delivery Program & Operational Plan.
31/05/13 Close of exhibition and receipt of submissions.
24/06/13 Consideration of submissions and adoption of Delivery Program & Operational Plan, as amended.
Submissions are requested to be in writing and to be lodged by mail, facsimile or email at the following address:
The General ManagerUpper Hunter Shire Council
PO Box 208SCONE NSW 2337
Facsimile:(02) 6545 2671
E-mail:[email protected]
The community is also invited to obtain further information or assistance by telephoning Council and discussing any matters with staff, or by writing to Council at the above address.

1.4 Council’s Vision, Mission, Charter and Corporate Values
VisionA Quality Rural Lifestyle
in a Vibrant, Caring and Sustainable Community
Mission
To enhance the quality of life of all Shire residents by the provision of appropriate services and facilities through effective and efficient management of resources. To serve the community through equality of opportunity and involvement. To build a prosperous environmentally sustainable future. To foster sustainable, economic and social growth.
Charter
The Local Government Act 1993 (s8) determines Council’s Charter which establishes the principles that are to guide the Council in the carrying out of its functions reflected in this Delivery Program & Operational Plan.
To provide directly or on behalf of other levels of government, after due consultation, adequate, equitable and appropriate services and facilities for the community and to ensure that those services and facilities are managed efficiently and effectively; To exercise community leadership; To exercise its functions in a manner that is consistent with and actively promotes the principles of multiculturalism; To promote and to provide and plan for the needs of children; To properly manage, develop, protect, restore, enhance and conserve the environment of the area for which it is responsible in a manner that is consistent with and promotes the principles of ecological sustainable development; To have regard to the long term and cumulative effects of its decisions; To bear in mind that it is the custodian and trustee of public assets and to effectively plan for, account for and manage the assets for which it is responsible; To engage in long term strategic planning on behalf of the local communityTo exercise its functions in a manner that is consistent with and promotes social justice principles of equity, access, participation and rights To facilitate the involvement of Councillors, members of the public, users of facilities and services and Council staff in the development, improvement and co-ordination of local government; To raise funds for local purposes by the fair imposition of rates, charges and fees, by income earned from investments and, when appropriate, by borrowings and grants; To keep the local community and the State Government (and through it, the wider community) informed about its activities; To ensure that, in the exercise of its regulatory functions, it acts consistently and without bias, particularly where an activity of Council is affected; and To be a responsible employer.
Corporate Values
Council’s corporate values are the foundation for the performance of Council’s Charter in the achievement of its mission and vision.
These values reflect the attitudes and beliefs of the Councillors and staff and will guide the implementation of this Delivery Program & Operational Plan.
We are and will continue to abide by these corporate values:
ACCESSIBILITY AND EQUITY
OPENNESS AND ACCOUNTABILITY
COURTESY, HONESTY AND INTEGRITY
COMPETENT, EFFICIENT AND EFFECTIVE SERVICE
TEAMWORK
ENVIRONMENTAL RESPONSIBILITY

1.5 What is the Community Strategic Plan ?
The Community Strategic Plan is a document that must be prepared at least every four (4) years and must cover a period of at least 10 years, at the commencement date. The Community Strategic Plan is the formation plan for the community and Council, identifying and reflecting the focus areas and aspirations of the community for its future, identifying and prioritising community strategic objectives, and the strategic goals and milestones for Council’s activities, again reflecting these community strategic objectives. The Plan is renewed each four years by the new incoming Council following the four yearly elections.
The Community Strategic Plan is guided and informed by State and Regional Plans (where available) and relevant information from Council’s resourcing strategies, including asset management plans, long term financial plan and workforce plan.
The Upper Hunter Shire Council last Community Strategic Plan, the Community Strategic Plan – 2010+ was adopted by Council on 27 April 2010. The draft Community Strategic Plan 2013 + is currently also on public exhibition with the exhibition period due to close on 31 May 2013. The previous plan and the current draft plan are available from Council’s website www.upperhunter.nsw.gov.au or at all Council offices in the Shire.
1.6 What is Council’s Delivery Program & Operational Plan 2013/14 to 2016/17?
This document (DPOP) establishes the future direction, activities and budget for the four (4) year period, commencing 2013/14, in line with the strategic objectives identified in the draft Community Strategic Plan – 2013+.
The functions and activities of Council over the four (4) year period are detailed in the DPOP, including full budget details of revenue, operating and capital expenditures. Similarly, for each activity and sub-activity, details of the objectives and measures of achievement are identified to enable Council and the community to assess Council’s delivery of services against such measures outlined in its Operation Plan.
The DPOP details Council’s financial position at the commencement and conclusion of the four (4) year period.
1.7 How does the Delivery Program & Operational Plan link with and support the draftCommunity Strategic Plan – 2013+?
The draft Community Strategic Plan – 2013+ is the overarching Plan, with at least a 10 year horizon. The draft CSP-2013+ reflects the community’s desire to shape and work towards achieving the community’s strategic objectives, outlined in that document.
The DPOP is the Council’s plan to work towards achieving the community’s strategic objectives over the four (4) year period, aligning with the Council term from September 2012.
The DPOP is intrinsically linked to the draft CSP-2013+ document through the detailed activities and sub-activities in both documents, identifying the community strategic objectives of the CSP, linked to the Budget and Operational Plans of the DPOP.
Both documents are similarly formatted through the Functions, Activities and Sub-Activities, providing the reference for the community and Council in working towards the same objectives.
Council reports monthly on its DPOP and its Annual Report demonstrate, in the same format, the achievements each year in working towards those Strategic Objectives, Aspirations and Key Focus Areas of the Community Strategic Plan.

1.8 Statement of Business Ethics
Council’s key business principles
Council expects its Councillors, staff, officials and representatives (including consultants and contractors) to comply with its adopted Code of Conduct. The Code of Conduct is actively promoted and developed by Council to ensure that the highest standard of integrity and ethical conduct is maintained. Council also expects the private sector and its representatives to maintain similar standards of ethical conduct in their dealings with Council.
At the core of Council’s business relationships with suppliers of goods and services (providers) is the principle of value for money. In this context, Council will consider all relevant factors including initial and on-going costs, quality, reliability, safety and timelines.
All business relationships will be honest, impartial, ethical, fair and consistent and all dealings not subject to commercial-in-confidence limitations will be transparent and open to public scrutiny. The process surrounding any commercial-in-confidence transactions will nonetheless be transparent and open.
What providers can expect from Council officials
In its tendering, contracting and purchasing activities, Council strives to ensure that its policies, procedures and practices are consistent with best practice and the highest standards of ethical conduct.
When doing business with the private sector (providers of goods and services including tenderers, suppliers, consultants and contractors), Council staff, Councillors and officials are accountable for their actions and are expected to:
use public resources effectively and efficiently; be accountable and act in the public interest; deal fairly, honestly and ethically with all individuals and organisations and be timely in paying accounts;not solicit nor accept any private benefit from a provider for the discharge of official duties; avoid situations where private interest could conflict with public duty (whether real or perceived); treat all potential suppliers with impartiality and fairness and give equal access to information and opportunities; respond promptly to reasonable requests for advice and information; promote fair and open competition whilst seeking value for money; respect and follow Council’s policies and procedures and abide by the law; fully and clearly document all procurement activities and decisions to provide an effective audit trail to allow for effective performance review of contracts; purchase energy efficient equipment, products containing recycled materials and environmentally friendly products wherever reasonably possible; not call tenders unless Council has a firm intention to proceed to contract; not disclose confidential or privacy protected information; not encourage or entertain lobbying or canvassing (lobbying or canvassing of Councillors and officials during a tender process may disqualify tenders); promote a safe and healthy working environment.
What Council expects from providers
Private sector providers of goods and services will observe and abide by the following principles when doing business with Council:
deliver value for money; comply with Council’s relevant policies and procedures affecting the provider’s involvement with Council respect the conditions set out in documents supplied by Council; disclose beneficial interest in contracts wherever possible; provide accurate and reliable advice and information where required; declare actual or perceived conflicts of interest as soon as you become aware of the conflict; act ethically, fairly and honestly in all dealings with Council; respect the obligations of Council officials to adhere to Council’s policies; refrain from divulging privileged or confidential information to unauthorised persons;

refrain from engaging in any form of collusive practice; refrain from offering Council officials inducements or incentives designed to improperly influence the conduct of their duties; refrain from discussing Council business or information in the media without Council’s consent; if required, co-operate with Council’s post separation employment requirements; assist Council to prevent unethical practices in our business relationship; behave in an ethically, socially and economically responsible way in the conduct of their business; refrain from lobbying or canvassing Council officials during the tender process; assist Council in providing a safe and healthy working environment.
Why you need to comply
All of Council’s providers of goods and services are required to comply with this statement. The principles of this statement are consistent with Council’s corporate values and the ethical requirements of other public sector agencies. Compliance will advance your business objectives and interests, in a fair and ethical manner.
Non-compliance with the requirements of this statement that may result in potential or demonstrated corrupt or unethical conduct could lead to:
termination of contracts; loss of future work; loss of reputation; matters being referred for corruption investigation; matters being referred for criminal investigation; disqualification of tender.

1.9 Integrated Planning and Reporting
In 2009, the NSW Government introduced new legislation, entitled Integrated Planning and Reporting for Local Government, implementing a new regime for Councils in NSW for Strategic Planning, Budgeting.
Council has continued to develop its Community Strategic Plan with the forth version since amalgamation with the draft Community Strategic Plan 2013 + currently also on public exhibition. Upper Hunter Shire Council has recently adopted revised versions of:-
1. Long Term Financial Plan 2. Workforce Management Plan 3. Various Asset Management Plans
These plans assist Council in translating strategic objectives into actions and meeting the goals of the Delivery Program and Operational Plan.
The integration of Council’s Planning Process is demonstrated within the draft Delivery Program and Operational Plan (DPOP) by identification within each Function/Activity of Council, the Community Strategic Objectives and Goals/Milestones to be achieved within the four (4) year timeframe for the DPOP.
Council’s Operational Plan details the Statement of Revenue Policy (Rates, Fees & Charges) for 2013/14, together with a detailed plan of revenue and expenditure for the next four (4) years, including Capital Works.
The following diagram outlines how the Integrated Planning and Reporting Process works.

1.10 Council’s Goals/Strategies for Key Functions
1.10.1 Administration
The Corporate Support function provides core administrative support to the organisation. Its objective is to provide an effective and cost efficient level of service to meet the reasonable needs of the residents and ratepayers of Upper Hunter Shire and Council staff.
Goals for the short term include:
Corporate Services – Manage and provide support and guidance to the services within the Corporate Services Department. Financial Services – Maintain the integrity of the general and subsidiary ledgers. Provide timely internal and statutory financial reports and analysis. Provide efficient accounts payable function, and an effective cash management service. Provide long term financial guidance and alternative to Council through the annual updating of Council’s Long Term Financial Plan. General Management – To effectively and efficiently manage the business of the Council according to the needs of the community and resources provided by Council. Human Resources – Provide and facilitate systems of human resource management for the organisation incorporating merit selection, job sizing, salary administration, performance appraisal, WHS, EEO, training and provide efficient payroll function. Continually review Council’s Workforce Plan to enable Council to meet its long term objectives. Information Systems – Manage Council’s information systems hardware, software and networks. Provide effective desktop support, system maintenance and development to improve the efficiency of staff. Identify areas of productivity improvement and service enhancement through the better use of technology. Manage Council’s telecommunications and data communications infrastructure. Records Services – Implement the State Records Act 1998 and provide a records management system that ensures easy access to paper and electronic records. Continue to develop the electronic document management system (TRIM) across the organization. Revenue Services - Provide a rates and charges revenue raising service and maintain debtors at an acceptable level.
Goals for the longer term include:
Corporate Services – Regular review of the administrative principles and procedures of the organisation to improve efficiency and effectiveness. Financial Services – Provide enhanced assistance to budget holders in the financial control of their area of responsibility. General Management – Regular review of strategic plans, future works programs and delivery program and operational plans to meet long term objectives. Ongoing review of opportunities for improved efficiency and sustainability through best practice and resource sharing. Human Resources – Continuous improvement of human resources, EEO and WHS systems. Information Systems – Continue to investigate opportunities for productivity increases by utilising technology improvements. Records Services – Manage the electronic document management system (TRIM) across the organisation to ensure compliance with the State Records Act. Revenue Services – Maintain the outstanding rates ratio below the average of group 10 councils within NSW.
Technical Services is responsible for delivering services to the community in accordance with Council’s Delivery Program & Operational Plan. These services are provided by way of operational divisions:
Civil Assets Recreation Engineering Operations Technical Support Services Plant & Depot Services Water/Waste

The objectives are to provide, improve and maintain:
a network of rural and urban roads; associated drainage systems and traffic facilities; parks and gardens; solid waste management system; water & sewerage systems; regional saleyards; regional airport; cemeteries; action request system; and Long Term Asset Management Plans
1.10.2 Agriculture
This function previously includes the Crops for Hunter project. The objective of this function was to provide a farm diversification grant program across the Shires of Upper Hunter, Muswellbrook and Singleton. The Crops For Hunter function was wound up on the agreement of all stakeholders in 2013.
1.10.3 Community Services & Education
The objective of the Community Services and Education function is to assist in the achievement of a high quality of life for Upper Hunter Shire residents, by ensuring the community has access to a range of services and resources that will minimise existing and future social problems and maximise participation in decision making.
This function includes the activities of Administration, Aged Care, Family Day Care, Long Day Care, Out of School Hours (childcare) and Youth Services.
Goals for the short term:
provide continued support for community groups operating in the Shire; management of residential aged care at Merriwa and independent living units at Merriwa and Murrurundi; administer and deliver services of the Upper Hunter Family Day Care Scheme, Upper Hunter Early Learning Centre (Long Day Care) and Scone Out of School Hours Service; engage young people in the delivery of youth services and activities across the Shire.
Goals for the short and long term:
incorporate environmental, social, and economic considerations in Council’s future planning processes, recognising the interrelationship between these variables; continue to hold local public meetings and to consult with residents, in their community of interest in the Shire; develop relevant strategies which will assist in the future planning for community services within the Shire.
1.10.4 Economic Affairs
This function includes management of camping areas, Community Technology Centres at Merriwa and Murrurundi, tourism and area promotion, management of the Scone Regional Saleyards, real estate development (residential), and other business undertakings such as promotion of economic development and private works requested by the community.
The objectives of the economic affairs function are to:
provide an effective and cost efficient level of service to meet the reasonable needs of the residents, ratepayers, and visitors to the Upper Hunter Shire; assist with business and economic development in, and promotion of the Shire; promote Scone as a regional livestock selling centre by providing a certified livestock weighing facility and public livestock market place, maintained to the standards required by Safe Food Production NSW – Meat Branch.

Goals for the short and long term include the encouragement of economic development and tourism in the Shire. Council will continue to encourage the development of industrial and residential land in the Shire. Land development activities will include:
industrial development at the Scone and Upper Hunter Regional Airport; residential development of Council owned land at Aberdeen, Merriwa and Murrurundi.
1.10.5 Environment
This key function includes noxious plant control, solid waste management, stormwater management and street cleaning.
The objectives are to:-
provide protection and enhancement of the natural environment, including the promotion of development, which is compatible with the area’s natural environment and which will enhance the area as a place to live and work; provide an efficient and effective domestic waste collection service, a self-funding recycling service, and appropriate other waste management facilities; implement, subject to budgetary constraints, the recommendations contained within Council's Stormwater Management Plan; maintain and improve domestic waste collection service in the Shire; continue to review the hours of operation of the Aberdeen, Merriwa, Murrurundi and Scone tips with the objective of improving the cost effectiveness of the tips; further develop the strategic planning to ensure the ongoing viability of the waste depots at Murrurundi, Scone and Aberdeen, through development of existing facility, extension or replacement of the facility; continue to improve the existing tip facilities, in terms of access, service and environmental safeguards; investigate options for weighbridge operations; provide adequate areas at all cemeteries for interments; provide an urban stormwater system that meets the requirements of urban areas within the Local Government Area.
1.10.6 Governance
The corporate goal is to achieve Council’s Mission and Charter in the delivery of efficient and effective services to the community.
The role of governance is to support the Mayor and Councillors in their respective positions. Council’s codes for meeting practice and conduct for Councillors and staff, establish the framework within which the Council operates under the NSW Local Government Act.
Council has adopted its fourth Strategic Plan for the Upper Hunter Shire which, together with this Draft Delivery Program & Operational Plan, set out the future direction of the Council across its broad range of functions and activities.
These documents focus on the maintenance and provisions of infrastructure, such as roads and bridges and reliable utility services, such as Water, Sewer and Waste.
1.10.7 Health
Includes food control, noxious plants, administration and inspections of regulated premises and sewerage disposal systems.
The regulations and compliance officers carry out the majority of inspections of existing on-site sewerage systems. The officers have received the required training and provide details of rectification works that are necessary, if any. Council has a legislative requirement to undertake such inspections with a focus on villages and those areas in close proximity to watercourses.
The objectives of this function are to provide:

efficient and effective services to the community that comply with all relevant State legislation, and Council policies and plans; efficient and effective waste management systems which comply with the requirements of the Environment Protection Authority and the principles of waste minimisation.
Goals for the short and long term:
continue with the inspection program of all on-site waste disposal systems within the Shire to ascertain and minimize their impact on the environment; utilise Council’s adopted guidelines for implementing the most appropriate methods of onsite sewer management within the Upper Hunter Shire. improve levels of knowledge of food handling and preparation for food handing premises via annual information sessions and inspection program.
1.10.8 Housing & Community Amenities
This key function includes town planning, street lighting, public cemeteries and public conveniences.
The objectives of this function are to provide:
administration of development applications to ensure compliance with the statutory requirements of the Environmental Planning and Assessment Act, 1979; community amenities that meet the needs of the Shire;
Goals for the short and long term:
provide development advice and control; issue land use planning certificates; continue the preparation of the Shire strategy which is the basis for the new single Upper Hunter Local Environmental Plan (LEP) which reflects the current and future needs of the Shire. Planning Workshop Australia has been engaged to undertake the work with close co-operation and assistance from staff. A Local Environmental Plan Community Advisory Committee has been established which includes community member representing various interests and localities within the Shire. Although Upper Hunter Shire Council has not been identified as a priority Council for completion of new LEP’s by the Department of Planning, work will continue towards finalising documentation and mapping; ongoing development of a new Flood Study for the township of Aberdeen. This is the first step in the Floodplain Management Process. Consultants are undertaking the work. Council’s Floodplain Management Committee as a function of the Development and Environmental Services Committee, has an important role in liaising with the consultants. The Committee has representatives form the Department of Conservation, Climate Control and Water, local SES and the community; implement floodplain management plan recommendations for Scone including the house raising program if requested; complete the review of existing and potential items of environmental heritage that are listed in the three existing Local Environmental Plans for Merriwa, Murrurundi and Scone as part of the ongoing finalisation of a community heritage study of the local government area for inclusion in the new Shire LEP; maintain and improve data management of historical records for cemeteries; maintain Council’s public toilet facilities in a clean and hygienic condition for use by the general public; investigate funding options for public facilities; continue to review proposed amendments to the Local Environmental Plan as spot rezoning in the interim period, pending completion of the comprehensive LEP for the Shire;promote safe vehicular and pedestrian passage by night by adequate lighting in residential and arterial roads, in accordance with Australian Standards.
1.10.9 Mining, Manufacturing & Construction
This function includes the provision of building assessment and building control services, and quarry operations.

Goals for the short and long term:
ensure legislative requirements in respect of BASIX are complied with in terms of initial applications and completion of all ‘commitments’ at final inspection stage; provide advice and direction to Council on building aspects of physical development in the Shire;administer applicable acts, regulations and Council policies so as to facilitate, maintain, protect and promote development which is compatible with the area’s natural environment and which will enhance the area as a place to live and work; provide cost effective management of resources in addressing the priorities of Council; provide a high level of professional service, having regard to the fiscal, physical and technological resources available; ensure appropriate services are provided to customers from all offices as permitted by available resources; quarry operations in line with Department of Primary Industry management practices; quarry operations in accordance with Development Conditions.
1.10.10 Public Order & Safety
In accordance with the Service Level Agreement between Council and the NSW Rural Fire Service, Council provides financial support for the 29 rural fire brigades, 830 registered volunteers and 38 fire trucks within the Shire.
Council also financially contributes to the NSW Fire Brigades, Rural Fire Services and financially supports the State Emergency Services. They are responsible for emergency response and implementing a wide range of regulations, all of which contribute to public order and safety
Emergency management plans are also developed to ensure a sense of preparedness for emergency situations within the Shire, including natural, biological and technological hazards. These plans are tested by way of desktop exercises, for example Exercise Avion based on an airport disaster was conducted in 2011.
Council administers legislation in relation to privately owned swimming pools and companion animals (dogs and cats). It also provides an emergency after hours animal control service, investigates animal and stock complaints and general nuisances (e.g. overgrown properties, abandoned vehicles).
Provision of appropriate controls for companion animals and stock in accordance with relevant legislation and compliance with local government regulations, is an important function of council. Pound facilities are available and maintained in Merriwa, Murrurundi and Scone with officers available to respond as necessary.
Goals for the short and longer term:
Protect life, property and the environment from the effects of disasters by maintaining the:
Rural Fire Service in a state of preparedness State Emergency Service in a state of preparedness Emergency Operations Centre, equipment and personnel Emergency preparedness plans developed for the Shire Investigating funding options for emergency response and preparedness
continue the inspection of existing on-site sewerage systems; maintain adequate levels of companion animal and stock control within the Shire area; provide appropriate responses to complaints; maintain a satisfactory level of service generally and provide an emergency only, after-hours animal control service.
1.10.11 Recreation & Culture
The objective of this function is to provide for the public library branches at Aberdeen, Cassilis, Merriwa, Murrurundi and Scone, as well as museums, public halls, cultural services, swimming pools, sporting grounds, parks and gardens, and other sport & recreation.

Goals for the short and long term:
promote the increased participation of young people in organised sporting activities for improved wellbeing and greater utilisation of sports infrastructure in the Shire; provide, maintain and improve the Shire's sporting fields, swimming pools, public halls, parks and gardens assets; development of sport and recreational facilities within the shire including outdoor gym equipment;provide and maintain safe, enjoyable, aesthetically attractive recreation, cultural and leisure facilities;provide a library service that meets the expectations of each of the individual communities;promote the health, wellbeing and lifestyle benefits by increasing the participation of sports in the Upper Hunter Shire.
1.10.12 Transport & Communications
The objective is to maintain and improve Council’s roads, bridges, footpaths, bus shelters, street lighting and airport within budgetary constraints. This function includes works undertaken for the Roads and Maritime Services (RMS) by single invitation contract.
Goals in this area of Council’s activities are:
provide sustainable transportation systems; maintain and improve the quality of roads; ongoing community education on road safety; attract sponsorship of Council’s road safety initiatives; update the capital works program to allow for improvements to network capacity and improvement to public transport; maintain asset management of road network; construct additional cycleways and footpaths; facilitate communication between airport users, land owners and Council; airport management and development which is suitable for a wide range of aircraft interests and operations; airport runway upgrade works and the continued sourcing of appropriate funding arrangements to assist with financing such works.
1.10.13 Water Supplies
The purpose of the water supplies function of Council is to provide the residents of Aberdeen, Cassilis, Merriwa, Murrurundi and Scone with a water supply which conforms to the National Health Guidelines 2004, and meets customer demand within the constraints of cost efficiency.
Goals for the short term:
complete Stage 2 of the Scone Water Augmentation Scheme including the Aberdeen backfeed, and the construction of a water treatment plant; ongoing investigation of the Rural Water Scheme (RWS) proposal in consultation with the community. This proposal would utilise the water supply pipeline from Lake Glenbawn to transport rural water quotas to the rural properties and provide an alternative water supply source for Murrurundi and service villages such as Wingen en-route; maintenance and upgrade of water reservoirs and facilities;
implement a progressive set of charges to encourage a reduced and more efficient use of water by residential property owners; develop and implement a Water Quality Management Plan.
Goals for the long term:
implement a demand management strategy to allow Council to provide for growth and development within the limits of available water quotas under the current water reform program; continue with the mains replacement program to ensure the water supply can be maintained and that maintenance works are reduced.

1.10.14 Sewerage Services
The purpose of the Sewerage Services function is to provide the residents of Aberdeen, Merriwa, Murrurundi and Scone with a wastewater reticulation and treatment system which is designed to meet the community’s requirements and satisfy the EPA license, within a competitive cost framework.
Goals for the short term:
management of trade waste to meet legislative requirements; continuation of the effluent reuse scheme in Scone and Murrurundi and to investigate re-use schemes in other areas; continue investigating and develop a system to improve effluent quality at All Sewage Treatment Plants to reduce the cost of load based licenses where relevant and reduce algae blooms; develop procedures and photographic processes for investigating sewer mains. These procedures/processes will be of such a standard as to enable Council to outsource mains re-lining on a timely basis.
Goals for the long term:
ongoing planning to replace the trickling filter sewage treatment plant located at Scone. The proposal is to construct a 6,000 equivalent persons (EP) capacity extended aeration plant beside the existing 4,000 EP capacity plant. The construction work is proposed for 2020, or when the capacity reaches 6,000 EP; install an automatic screen cleaner at Aberdeen and Merriwa Sewage Treatment Plants; continue to use best practice for mains replacement/re-lining to ensure that the sewerage system is capable of delivering the required service whilst minimizing maintenance.

1.11 How Your Council Works

11.12 COUNCIL
Cr Michael JohnsenMayorPO Box 233 SCONE 2337 Mob: 0419 696 756 [email protected]
Cr Maurice Collison“Trevallyn”863 Stewarts Brook Road WOOLOOMA NSW 2337 Ph: 6546 1113 (H) Mob: 0407 232 [email protected]
Cr Wayne BBedggoodCressfield Homestead 3663 New England Highway PARKVILLE NSW 2337 Mob: 0419 226 551 Fax: 6545 0238 [email protected]
Cr Ron Campbell“Woodlands” Forest Reserve Road MERRIWA NSW 2329 Ph: 6548 5153 (H) Mob: 0428 485 153 Fax: 6548 5012 [email protected]
Cr Lorna Driscoll45 Graeme Street ABERDEEN NSW 2336 Ph: 6543 7394 (W) Mob: 0402 658 774 Fax: 6543 7157 [email protected]
Cr Peter BishopDeputy Mayor“Wootton” Bunnan Road SCONE NSW 2337 Ph: 6545 4157 (H) Fax: 6545 4200 [email protected]
Cr Kiwa Fisher501 Rouchel Road ABERDEEN NSW 2336 Ph: 6543 7725 (H) Mob: 0419 278 724 [email protected]
Cr Deirdre Peebles62 Vennacher Street MERRIWA 2329 Ph: 6548 2068 (H) Mob: 0429 320 821 Fax: 6548 2068 [email protected]
Cr Lee Watts29 Parker Street
SCONE NSW 2337 Mob: 0413 036 628 [email protected]

Cor
pora
te S
ervi
ces:
Ste
ve P
ryor
, Dire
ctor • CORPORATE SERVICES
• Privacy, GIPAA, insurance claims, rating, debtors, property, RMS agency, stores & procurement, records and office administration, community engagement.
• ECONOMIC DEVELOPMENT & TOURISM• Economic promotion, real
estate development, Visitor Information Centres, promotions & events, Community Technology Centres, community grants
• COMMUNITY SERVICES• Aged services, cultural services,
Family Day Care, Long Day Care, libraries, Out of School Hours Service, aged Merriwa Hostel and youth services
• FINANCE & ADMINISTRATION• Accounts Payable, financial
reporting, investments and taxation
• HUMAN RESOURCES• Recruitment, merit selection, job
sizing, competency assessments, performance appraisal, training, WH&S & HR policies, payroll and plant.
• INFORMATION SYSTEMS• Corporate communications
and information systems and technology
Envi
ronm
enta
l Ser
vice
s: B
en O
liver
,Dire
ctor • BUILDING SERVICES
• Approval of construction certificates, building inspections and advice
• ENVIRONMENTAL HEALTH• Inspection of food shops,
hairdressers, skin penetration premises, health complaints, on-site sewer installation, state of the environment reporting
• LANDUSE PLANNING• Approval of development and
subdivision applications, strategic planning, LEP amendments, advice to developers and community
• COMPLIANCE• Companion animal and stock
control, on-site sewerage inspections, camping areas, swimming pool fencing, compliant investigation and action
Tech
nica
l Ser
vice
s: A
lan
Flet
cher
, Dire
ctor • ENGINEERING OPERATIONS
• Management and operation of works and services for Depots at Merriwa, Murrurundi and Scone, including roads and bridges, town services and parks and gardens. Management of RMS Single Invitation Contract and QA pre-qualification
• CIVIL ASSETS• Strategic management of
Council's civil assets (roads, bridges, stormwater, footpaths, sports fields, swimming pools, traffic facilities etc), Council buildings including public halls and museums, replacement programs, design, traffic management, development assessment and control, rolling capital works programs and pre-construction tasks. Recreation facilities and swimming pools (Merriwa, Murrurundi and Scone)
• TECHNICAL SUPPORT• Administration, procurement
and business support to the division. Management of airport, saleyards, Rural Fire Service and cemeteries. Local Emergency Management Officer. Building maintenance. Risk Management.
• WATER/WASTE• Water supply and treatment,
sewage treatment and effluent reuse and solid waste services. Capital works such as Lake Glenbawn water augmentation and reservoir construction
• PLANT SERVICES• Management of plant services
including three mechanic workshops, Council's and RFS plant fleets
1.13 Staff & Organisational Chart
COMMUNITY
COUNCIL
GENERAL MANAGER Daryl Dutton
Internal AuditorTony Perkins
Executive Personal Assistant Robyn Cox

1.14 Committees & Council Delegates
COUNCIL’S STANDING COMMITTEES DELEGATES
FINANCE COMMITTEE Crs Bishop, Bedggood, Fisher & Johnsen
DEVELOPMENT & ENVIRONMENTAL SERVICES COMMITTEE Crs Bishop, Peebles, Watts & Fisher
WORKS AND TECHNICAL SERVICES COMMITTEE Crs Peebles, Collison, Campbell & Driscoll
OTHER COMMITTEES DELEGATES
ABERDEEN CBD COMMITTEE TBA
AIRPORT MANAGEMENT COMMITTEE Crs Collison & Bedggood (alt)
ARTS UPPER HUNTER COMMITTEE Cr Bishop
AUDIT ADVISORY COMMITTEE Mayor & Deputy Mayor
AUSTRALIA DAY WORKING PARTY - MERRIWA DISTRICT Crs Peebles (Chair) & Campbell
AUSTRALIA DAY WORKING PARTY - MURRURUNDI DISTRICT Cr Watts
AUSTRALIA DAY COMMITTEE - SCONE DISTRICT & ABERDEEN DISTRICT Crs Watts & Driscoll
CASSILIS COMMUNITY CENTRE Crs Peebles & Cr Campbell (alt) or Community Services Officer
COMMUNITY SERVICES COMMITTEE Crs Watts & Driscoll
CONDUCT REVIEW COMMITTEE Hunter Councils panel appointed by Mayor or GM
CROPS FOR HUNTER MANAGEMENT COMMITTEE Crs Peebles & Bedggood (alt)
FLOODPLAIN MANAGEMENT COMMITTEE Crs Driscoll, Bedggood, Johnsen & Fisher
HERITAGE ADVISORY COMMITTEE Crs Peebles, Bedggood & Driscoll
HUNTER VALLEY MUSEUM OF RURAL LIFE COMMITTEE Crs Driscoll & Fisher, Cr Johnsen (alt)
LOCAL ENVIRONMENTAL PLAN COMMUNITY ADVISORY COMMITTEE Crs Johnsen, Fisher, Bedggood, Bishop, Watts
MERRIWA AGED HOSTEL COMMITTEE Cr Peebles, Cr Campbell (alt)
MERRIWA CBD COMMITTEE TBA
MERRIWA FESTIVAL OF THE FLEECES COMMITTEE Cr Peebles, Cr Campbell (alt)
MERRIWA SHOWGROUND MANAGEMENT COMMITTEE Manager Engineering Operations
MERRIWA SPORTS ASSOCIATION COMMITTEE Cr Campbell, Cr Peebles (alt),Works Engineer, Merriwa
MERRIWA TOURISM & PROMOTION COMMITTEE Cr Campbell, Cr Peebles (alt)
MURRURUNDI CBD COMMITTEE Crs Watts & Bedggood
MURRURUNDI SPORTS ASSOCIATION Cr Bedggood
RISK MANAGEMENT COMMITTEE Staff
RURAL WATER SUPPLY SCHEME Crs Johnsen, Bishop, Bedggood & Campbell
RURAL WOMEN’S GATHERING EVENT COMMITTEE Cr Watts
SCONE & ABERDEEN SPORTS ASSOCIATION Cr Fisher & Manager Civil Assets
SCONE CBD COMMITTEE Mayor, Crs Peebles & Watts
SCONE & UPPER HUNTER REGIONAL SALEYARDS COMMITTEE Crs Collison, Bedggood & Campbell
SETTLEMENT HALL COMMITTEE Cr Peebles, Cr Campbell (alt)
TIDY TOWNS COMMITTEE Cr Peebles, Cr Johnsen (alt)
UPPER HUNTER ECONOMIC DEVELOPMENT & TOURISM COMMITTEE Crs Peebles, Fisher, Bedggood, Campbell, Cr Discoll (alt)

OTHER COMMITTEES DELEGATES
UPPER HUNTER EQUINE INFRASTRUCTURE WORKING PARTY Cr Johnsen, Fisher, Bishop, Cr Bedggood (alt)
UPPER HUNTER FAMILY DAY CARE JOINT ADVISORY COMMITTEE Cr Driscoll (Chair), Cr Johnsen
UPPER HUNTER LIBRARY SERVICES ADVISORYCOMMITTEE Crs Peebles, Driscoll & Bishop
UPPER HUNTER SHIRE LAND COMMITTEE Mayor, Deputy Mayor, Crs Driscoll &, Watts
UPPER HUNTER SHIRE TRAFFIC COMMITTEE Crs Collison & Bishop
WHITE PARK MANAGEMENT & DEVELOPMENT COMMITTEE Crs Johnsen, Fisher & Bedggood, Cr Bishop (alt)
YOUTH SERVICES COMMITTEE Crs Watts & Driscoll
EXTERNAL COMMITTEES/BODIES DELEGATES
AGL HUNTER GAS PROJECT COMMUNITY CONSULTATIVE COMMITTEE Cr Bedggood
ARTS UPPER HUNTER BOARD Cr Bishop
DARTBROOK COAL MINE CONSULTATIVE COMMITTEE Cr Fisher, Cr Driscoll (alt)
DEVILARK COMMITTEE Crs Watts & Peebles
GOLDEN HIGHWAY COMMITTEE Cr Peebles ,Cr Campbell (alt)
HUNTER COUNCILS INCORPORATED Cr Johnsen
KINGDON PONDS & TRIBUTARIES WATER USERS ASSOCIATION MANAGEMENT COMMITTEE
Cr Bedggood
LIVERPOOL RANGE ZONE BUSHFIRE COMMITTEE Cr Collison, Cr Campbell (alt)
MACQUARIE GENERATION COMMUNITY CONSULT COMMITTEE Cr Bedggood & Director Environmental Services
MID NORTH COAST WEIGHT OF LOADS Manager Civil Assets
MOOBI SCHOOL SITE COMMITTEE Manager Technical Support
MURRURUNDI & DISTRICT HISTORICAL SOCIETY Cr Watts, Community Services Officer, Murrurundi
MURRURUNDI FRONTIER FESTIVAL Crs Fisher & Bedggood (alt)
NSW ASSOCIATION OF MINING RELATED COUNCILS INC Cr Bishop
SANTOS COMMUNITY CONSULTATIVE COMMITTEE Cr Bedggood
SCONE & DISTRICT CHAMBER OF COMMERCE & INDUSTRY Crs Johnsen & Bedggood
SCONE & UPPER HUNTER HORSE FESTIVAL COMMITTEE Cr Watts
UPPER HUNTER COUNTY COUNCIL (Weeds) Crs Collison, Campbell & Johnsen
UPPER HUNTER LOCAL EMERGENCY MANAGEMENT COMMITTEE Cr Collison
UPPER HUNTER LIBRARY NETWORK MANAGEMENT COMMITTEE Staff
WALFERTAN TANNERY COMMUNITY CONSULTATIVE COMMITTEE Cr Johnsen

1.15 Definition of Terms and Indicators
PRINCIPAL ACTIVITY: THE MAJOR ACTIVITIES OF THE COUNCIL IN ACHIEVING DELIVERYPLANNING OBJECTIVES
Objective: AA target for performance
Performance Indicator:
- WWorkload:
- Effectiveness:
- Efficiency:
- Service:
A measure of the volume, throughput or productivity of an activity
A measure of the quality or satisfaction of the activity
A measure of unit cost of the activity
A measure of achievement of a predetermined level of service
Level of Service: AA determined performance outcome i.e. grading all unsealed roads atleast twice per year
Working Funds: TThe net funds available after internal and external restrictions
Restricted Asset: FFunds set aside for a specified purpose in the future
Nett Surplus/Deficit: TThe actual cash surplus or deficit excluding depreciation of non-commercial assets after setting aside restricted assets and unexpendedgrants, comparing one year to another

Part 2 | Statement of Functions and Indicators
2.1 List of Functions & Services
The following list of functions, activities, services and management responsibilities align with Council’s budget estimates for income and expenditure.
Functions/Activities Service Directorate* ManagementResponsibility#
Administration: Corporate Support
Engineering & Works
Corporate Services Financial Services General Management Human Resources Information Services Revenue Services Asset Management Depot Operations Plant Services Stores/Purchasing Services Technical Support Services
CSCSGMCSCSCSTS TS TS CSTS
DCSFMGM
HRMMISSRO MCA MEO DTS DCSDTS
Agriculture Crops for Hunter CS MEDT Community Services & Education Administration & Education
Aged Care – Gummun Place Hostel Aged Care – Indep’t Living Units Children’s Services - Before/After School Care Children’s Services – Early Learning Children’s Services – Family Day Care Social Protection Youth Services
CSCSCSCSCSCSCSCS
MCS DCSMCS CSCCSCCSCMCS MCS
Economic Affairs Camping Areas & Caravan Parks Community Technology Centres Economic Promotion Private Works Real EstateSaleyards Tourism & Area Promotion
ES CSCSTS CSTS CS
DES MEDTMEDTMEO MEDTMTSS MEDT
Environment Noxious Plants & Insect/Vermin Control Solid Waste Management Stormwater Management Street Cleaning
TS TS TS
MWWMCA/MEOMCA/MEO
General Purpose Revenues Rates, Grants & Interest CS FMFM/SRO Governance Council Services GM GM Health Health Services ES DES Housing & Community Amenities Low Incoming Housing
Public Cemeteries Public Conveniences Street Lighting Town Planning
CSTS TS TS ES
MCS MTSS
MCA/MEOMCA/MEO
DES Mining, Manufacturing & Construction Building Control
Quarry Operations ES TS
DES MEO
Public Order & Safety Animal Control Emergency Services Fire Service Levy & Fire Protection LG Regulation Enforcement
ES TS TS ES
DES MTSS MTSS DES
Recreation & Culture Community Centres & Halls Cultural Services Museums Other Sport & Recreation Parks & Gardens Public Libraries Sporting Grounds & Venues Swimming Pools
CSCSCSTS TS CSTS TS
DCSMCS DCS
MCA/MEOMCA/MEO
MCS MCA/MEO
MCA Transport and Communication Aerodromes
Footpaths Roads & Bridges - Local Roads & Bridges - Regional RTA – State Roads Transport Ancillaries
TS TS TS TS TS TS
MTSS MCA
MCA/MEOMCA/MEO
MEO MCA/MEO
Water Supplies Merriwa/Cassilis, Murrurundi, Scone/Aberdeen TS MWW Sewerage Services Merriwa, Murrurundi, Scone/Aberdeen TS MWW

Key* Key#
CS ESGMTS
Corporate Services Environmental Services General Management Technical Services
MEDTCSC DCSDESDTSGMHRCMCAMCSMEOFMMISSROMTTS MWW
Manager Economic Development & Tourism Children’s Services Co-ordinator Director Corporate Services Director Environmental Services Director Technical Services General Manager Human Resources Manager Manager Civil Assets Manager Community Services Manager Engineering Operations Finance Manager Manager Information Services Senior Revenue Officer Manager Technical Support Services Manager Water & Waste

2.2 Objectives, Performance Targets, Means and Assessment
Council’s Delivery Program & Operational Plan is able to demonstrate that for each of Council’s functions, activities and services, objectives have been set which enable performance targets to be established and a methodology to assess performance against these targets and objectives.
Included in Parts 4.2 to 4.4 of this document are the details of objectives and performance assessments for each principal activity/service coinciding with the budget analysis for that activity/service. This presentation enables a more objective assessment of the activity/service and its cost to the Council, and therefore to the community.
Within each of Council’s activity areas, there is a consistent set of performance indicators shown, ie:
WorkloadEffectiveness EfficiencyService
The workload indicator provides a basis for comparison of volume of work over time and reflects the resources required for the task.
The effectiveness indicator aims to measure the level to which services are being utilised on a usage per customer basis.
The efficiency indicator provides a unit cost basis for comparison over time or benchmark to other service providers.
The service indicator is a qualitative measure, rather than cost, and is measured in response times, complaints or satisfaction with the services provided.
The assessment of performance against the indicators is undertaken constantly by staff and reported monthly to Council’s Finance Committee, through the Operational Report. The Local Government Act provides for quarterly reporting, however, the process provided by the Upper Hunter Shire Council demonstrates its commitment to continuous improvement and value for money to the community for Council services.
Parts 4.2, 4.3 and 4.4 set out the details of Council’s objectives, performance targets, means and assessment for each function, activity and service that Council provides.

2.3 Asset Replacement Programs
The Upper Hunter Shire Council has a range of management strategies for the maintenance and replacement of its infrastructure and information technology (IT) assets.
2.3.1 Road Pavement/Footpaths
Upper Hunter Shire Council has a significant portfolio of pavement and footpath assets under its care and control. Asset management plans have been developed outlining Council’s strategic goals for the management of these assets. Council’s goal is to provide and maintain the community’s environmental, physical, social, cultural, recreational and investment assets, owned by the Council, in a cost effective manner and at a level acceptable to the community.
The asset management strategy is to manage the utilization of the assets to provide the best value for the available budget.
There are a number of programs in place to achieve these strategies in regards to pavements and footpaths, which are:
Capital Works: Pavement Replacement Program Footpath/Cycling extension Program
Maintenance: Reactive Maintenance Preventative Maintenance Routine Maintenance
2.3.2 Plant
Each year, in conjunction with its review of the Delivery Program & Operational Plan, Council adopts a ten-year plant replacement program.
The maintenance and replacement of Council's plant fleet is achieved within a closed financial subsystem. Revenue to fund the replacement program is generated from the hire of plant to internal and external groups, and from plant sales. Revenue in excess of a year's programmed requirements is held as a restricted asset to fund later years of the program.
2.3.3 Motor Vehicles
Council practice is to replace motor vehicles by outright purchase. Motor vehicles (sedans, wagons and utilities) generally will be replaced every two years or at 40,000 km, whichever is the first occurring. Council has however, in recent years, adopted a more flexible program and motor vehicles will be replaced at those intervals considered to be most beneficial to Council in the business environment prevailing at the time.
2.3.4 Surplus/Obsolete Goods, Material
Council has an Administrative Principle that deals with surplus goods and materials whereby materials that are found to be obsolete, surplus or scrap shall be listed and submitted to Council from time to time or to an officer who has delegated authority from Council to approve the write-off of such materials.
Where slow moving stock is identified, action shall be taken to reduce the amount of that stock to a level commensurate with expected usage patterns
Excessive quantities of obsolete slow moving or any scrap shall not be allowed to accumulate. Sales, on the basis of tenders, quotes or auction shall be made regularly to dispose of them.
2.3.5 Computer Systems
Council leases the majority of its computer hardware on a 4 year turn-around cycle. The last major upgrade of personal computers in all offices was in October 2009 with the transfer of staff to the new building. The next upgrade for IT infrastructure is scheduled for August 2013.

2.3.6 Roads
Upper Hunter Shire Council has a significant length of sealed and unsealed pavement network to maintain under the allocated budget. Council maintains 161km of sealed regional road, 13km of unsealed regional road, (Merriwa to Willow Tree), 316km of sealed rural roads, 1155km of unsealed rural roads and 108km of town streets. In addition the work extends to the maintenance of over 137 bridges and major culverts which are located within the Shire.
Council’s goal is to provide an effective and cost efficient level of service at a level acceptable to the community for the management, maintenance and capital upgrade of the Shire’s rural and urban road networks which are funded from various sources including Council, Government grants and community contributions.
Council has submitted projects under Round 1 and Round 2 of the Local Infrastructure Renewal Scheme totalling $5.23 million. Council already has received approval for Round 1 and is awaiting approval for Round 2. The projects to be funded over the next two years under the scheme include urban streets rehabilitation (Short, St Aubins and Aberdeen Streets Scone, Graeme & Mount Streets Aberdeen, and Haydon Street, Murrurundi), rural roads sealed rehabilitation (various locations) and the timber bridge replacement program (Broad Crossing, Doolans Gully, Garlands, Starr Crossing and Sandy Creek Bridges).
Council has carried out extensive community consultation over an extended period of time on the need for a Special Rate Variation. The additional income will repay the subsidised renewal scheme plus additional infrastructure works.
Council is a core service provider to the RMS, providing maintenance and construction works under quality assurance on State Highway No.27 (Golden Highway) under the RMS Road Maintenance Council Contract Specifications. Council will actively pursue additional work orders to improve the quality of the Golden Highway and maximise the safety of the road users, minimising risk and litigation against Council and the RMS.
Council has secured ongoing funding through the RMS Initial Seal program which will provide funds in 2013/14 towards the continuation of the extension of bitumen pavement on MR358 Willow Tree Rd, meeting Council’s strategic goal of providing an all-weather sealed access route between Merriwa and the New England highway at Willow Tree. This work will continue over the next few years.
Government grants from the Roads to Recovery Program have allowed Council to continue the upgrade of the Shire’s rural and urban road networks.
Council has a significant sealed pavement network to maintain with varying ages of bitumen seals. The strategic and future works program has identified a sealing strategy for the sealed road network, with funding being provided in 2013/14 towards a Shire wide reseal program to protect the deteriorating pavements and water ingress into the sub grade.
Council will focus its maintenance and capital works program in 2013/14 on the regional, urban and rural road networks towards the improvement in storm water drainage, shoulder restoration and bitumen reseals, in addition to gravel re-sheeting on the gravel rural road network areas to provide the best value for the available budget.
2.3.7 Water Supply
Mains and Water Service Replacement:
An ongoing replacement program is designed to ensure mains are replaced as they reach the end of their economic life.
Projects for 2013/14:-
Replace existing mains at Scone, Aberdeen, Merriwa and Murrurundi. Aberdeen – Bedford St – Mains replacement from Segenhoe St to Macqueen St. Merriwa – Telemetry upgrade Murrurundi – Telemetry upgrade Murrurundi – Mayne St – Mains replacement east of Brook and Victoria St. Murrurundi - Investigation of options for Secure Water Supply

Scone – St Aubins St – Mains from Guernsey St to Main St. Scone – Gundy Rd – <Mains extension from Barton St to Kilgallin Cl. Scone – Kingdon St Main.
Water Meter Replacement Strategy
Council has a continual replacement program for its aged meters across the shire. The annual replacement program for Residential meters will continue to allow for the replacement of the meter every 10 years or 3.8Ml throughput.
Reservoirs
Refurbishment and repainting the 4ML Reservoir in Scone.
Water Augmentation
Construction of Stage 2 of the Scone-Aberdeen Water Augmentation Scheme that involves the commencement of constructing a water treatment plant in 2013/14 and Aberdeen backfeed in 2014/15.
Murrurundi Water Augmentation is proposed to commence in 2016/17, dependant on the option chosen.
Rural Water Scheme
This service would transport water to on-farm irrigation storages. A concept design has been completed for this project and the purchase of water, final design and formation of the RWS will be put on hold pending completion of the water augmentation project and availability of funding.
2.3.8 Sewerage
Asset Replacement
The annual mains replacement component is designed to meet the needs of main replacement as the economic life of the existing pipe reaches its end. The asset replacement program also allows for the refurbishment of the Scone sewerage treatment plant tertiary ponds during the next three years.
Major projects are:
Rehabilitation of mains around Scone, Actual areas to be repaired are dependant on the CCTV inspections of the sewerage system. Continuation of the refurbishment of Scone tertiary ponds Mains upgrade in Merriwa and Murrurundi (dependant on CCTV inspections). Carryout improvements to the current effluent reuse system at Scone. Capital projects including:
- Merriwa - Upgrade screens at the Sewerage Treatment Plant - Merriwa - Implement algae strategy at tertiary dam - Aberdeen - Upgrade screens at the Sewerage Treatment Plant - Aberdeen - St Andrews St main upgrade - Aberdeen - Campbell Street main upgrade - Aberdeen - Upgrade to Aberdeen Street pump station - Scone - Koala St main upgrade - Scone – Storm water infiltration investigation

2.4
Cap
italP
roje
cts
20
13
/14
to2
01
6/1
7
Pro
pose
dE
xpen
ditu
re20
14-2
017
Sou
rce
ofof
Fun
ding
for
2014
Pro
ject
s
Cap
italP
roje
cts
2013
/14
to20
16/1
720
13/1
4B
udge
t20
14/1
5B
udge
t20
15/1
6B
udge
t20
16/1
7B
udge
t
Con
trib
utio
ns&
Don
atio
nsLo
anF
undi
ngG
rant
Fun
ding
Tfr
from RA
Ope
ratin
gR
even
ue
Gen
eral
Fun
dA
dmin
istr
atio
nD
epot
Ope
ratio
ns
11
60. M
wa
Oil/
Che
mic
al S
heds
Upg
rade
30,0
000
00
00
0-3
0,00
00
11
64. M
wa
Dep
ot -
Am
eniti
es U
pg20
,000
00
00
00
-20,
000
0
12
00. S
cn -
Yar
d S
ealin
g20
,000
00
00
00
-20,
000
0
12
01. S
cn -
Yar
d R
etai
ning
Wal
l20
,000
00
00
00
-20,
000
0
42
06. T
rade
Was
te P
roje
ct -
Mer
riwa
050
,000
00
00
00
0
42
07. T
rade
Was
te P
roje
ct -
Mdi
00
50,0
0050
,000
00
00
0
43
28. M
wa-
Gro
undw
ater
Wel
ls &
Tan
k R
emed
iatio
n15
,000
00
00
00
-15,
000
0
44
07. M
di D
epot
- L
and
Impr
ovem
ents
20,0
000
00
00
0-2
0,00
00
Fin
anci
alS
ervi
ces
08
80. M
wa
Offi
ce U
pgra
de20
,000
100,
000
00
00
0-2
0,00
00
11
51. M
di A
dmin
Bld
g -
Pai
ntin
g10
,000
00
00
00
-10,
000
0
20
42. M
di -
Car
port
012
,000
00
00
00
0
Info
rmat
ion
Ser
vice
s
07
03. I
T C
apita
l Exp
endi
ture
030
,000
25,0
0030
,000
00
00
0
10
43. E
xcha
nge
Ser
ver
repl
acem
ent
31,0
000
00
00
0-3
1,00
00
20
43. W
irele
ss B
ridge
s2,
000
00
00
00
-2,0
000
20
44. C
anon
Plo
tter/
Sca
nner
Rep
lace
men
t18
,500
00
00
00
-18,
500
0
20
45. M
itel U
pgra
de &
uni
fied
Com
ms
Sol
utio
n15
,000
00
00
00
-15,
000
0
20
46. A
dditi
onal
thin
Clie
nts
2,00
00
00
00
0-2
,000
0
20
47. B
uyou
t thi
n cl
ient
s &
scr
eens
& s
erve
rs7,
000
00
00
00
-7,0
000
20
48. P
roje
ctor
s &
scr
een
6,00
00
00
00
0-6
,000
0
Pla
ntS
ervi
ces
41
33. P
lant
Pur
chas
es C
apita
l Exp
endi
ture
2,29
2,00
02,
344,
000
2,84
0,00
02,
183,
300
00
00
-2,2
92,0
00

Pro
pose
dE
xpen
ditu
re20
14-2
017
Sou
rce
ofof
Fun
ding
for
2014
Pro
ject
s
Cap
italP
roje
cts
2013
/14
to20
16/1
720
13/1
4B
udge
t20
14/1
5B
udge
t20
15/1
6B
udge
t20
16/1
7B
udge
t
Con
trib
utio
ns&
Don
atio
nsLo
anF
undi
ngG
rant
Fun
ding
Tfr
from RA
Ope
ratin
gR
even
ue
Sto
res/
Pur
chas
ing
Ser
vice
s
40
13. U
pgra
de S
tora
ge F
acili
ties
010
,000
020
,000
00
00
0
50
37. B
arco
de F
acili
ties
5,00
00
00
00
0-5
,000
0
Tec
hnic
alS
uppo
rtS
ervi
ces
35,5
0000
00
00
0-3
5,50
00
08
77. I
nves
tigat
e N
ew K
ey S
yste
m35
,500
00
00
00
-35,
500
0
Com
mun
ityS
ervi
ces
&E
duca
tion
Age
dC
are
-G
umm
unP
lace
Hos
tel
10
99. H
oste
l Pow
er S
uppl
y U
pgra
de30
,000
00
00
0-9
,000
0-2
1,00
0
11
00. H
oste
l Exp
ansi
on F
easi
bilit
y S
tudy
00
020
,000
00
00
0
11
01. H
oste
l Air
Con
ditio
ning
Upg
rade
5,00
00
00
00
00
-5,0
00
40
21. C
omm
erci
al K
itche
n -
Hos
tel
010
0,00
00
00
00
00
40
43. H
oste
l Roo
m U
pg o
n C
hang
eove
r3,
000
3,00
03,
000
3,00
00
00
0-3
,000
41
63. H
oste
l - F
undr
aisi
ng c
apita
l wor
ks0
010
,000
00
00
00
42
89. P
enda
nt w
arni
ng s
yste
m0
010
,000
00
00
00
42
90. I
ndus
tria
l Car
pet C
lean
er5,
000
00
00
00
0-5
,000
Age
dC
are
-In
depe
nden
tLiv
ing
Uni
ts
10
25. I
LUs
Bat
hroo
m U
pgra
des
05,
500
010
,500
00
00
0
10
26. M
di IL
U C
arpo
rts
10,0
000
00
00
0-1
0,00
00
10
27. M
di IL
U R
epla
ce F
loor
Cov
erin
gs3,
000
03,
000
00
00
0-3
,000
10
29. M
wa
ILU
Rep
lace
Air
Con
ditio
ner
1,70
01,
700
1,70
00
00
0-1
,700
0
10
34. M
di IL
U P
aint
ing
5,00
00
5,00
00
00
00
-5,0
00
10
35. M
wa
ILU
Pai
ntin
g0
4,00
00
00
00
00
10
37. M
di IL
U R
epla
ce A
ir C
ondi
tione
r2,
000
02,
000
00
00
0-2
,000
10
38. M
wa
ILU
Rep
lace
Flo
or C
over
ings
2,50
00
2,50
02,
500
00
00
-2,5
00
10
40. M
wa
ILU
Kitc
hen
Upg
rade
s0
05,
000
00
00
00
10
42. M
wa
ILU
s B
athr
oom
upg
rade
s0
00
5,00
00
00
00
11
49. M
di IL
U D
esig
n 2
x A
ddtn
l Uni
ts0
06,
500
00
00
00
11
50. M
di IL
U C
onst
ruct
2 x
Add
tnl U
nits
00
075
,000
00
00
0
12
35. I
nsta
ll R
esid
ent S
tora
ge6,
500
6,50
00
00
00
-6,5
000
12
36. I
nsta
ll T
WS
to C
otta
ge3,
000
00
00
00
-2,2
42-7
58

Pro
pose
dE
xpen
ditu
re20
14-2
017
Sou
rce
ofof
Fun
ding
for
2014
Pro
ject
s
Cap
italP
roje
cts
2013
/14
to20
16/1
720
13/1
4B
udge
t20
14/1
5B
udge
t20
15/1
6B
udge
t20
16/1
7B
udge
t
Con
trib
utio
ns&
Don
atio
nsLo
anF
undi
ngG
rant
Fun
ding
Tfr
from RA
Ope
ratin
gR
even
ue
12
37. I
nsta
ll M
ailb
oxes
2,00
00
00
00
00
-2,0
00
12
38. O
utdo
or E
nter
tain
men
t are
a/P
aint
ing
05,
000
5,00
00
00
00
0
12
39. U
pgra
de s
mok
e al
arm
sys
tem
04,
000
00
00
00
0
12
40. L
ands
capi
ng2,
000
00
00
00
0-2
,000
12
41. F
easi
bilit
y S
tudy
06,
500
00
00
00
0
Chi
ldre
n`s
Ser
vice
s-
Bef
ore
&A
fter
Sch
oolC
are
11
58. O
OS
H -
Out
door
Sto
rage
00
2,00
00
00
00
0
12
42. I
nsta
ll w
indo
w a
wni
ng a
nd b
linds
00
05,
000
00
00
0
12
43. M
inor
bui
ldin
g im
prov
emen
ts2,
500
3,00
01,
000
00
00
0-2
,500
Chi
ldre
n`s
Ser
vice
s-
Ear
lyLe
arni
ngC
entr
e
10
30. E
LC P
aint
ing
Wor
ks5,
000
5,00
05,
000
5,00
00
00
0-5
,000
10
94. P
aren
t Gro
up C
apita
l Wor
ks2,
000
2,00
02,
000
2,00
00
00
0-2
,000
11
12. P
layg
roun
d de
velo
pmen
t8,
000
010
,000
5,00
00
00
0-8
,000
11
13. R
enew
Sof
tfall
03,
500
6,00
06,
000
00
00
0
11
65. E
LC -
Rep
lace
Whi
tego
ods
4,00
06,
000
00
00
00
-4,0
00
Soc
ialP
rote
ctio
n
09
83. M
di M
ens
She
d8,
000
00
00
0-8
,000
00
You
thS
ervi
ces
07
86. N
ew S
cn Y
outh
Cen
tre
01,
500
00
00
00
0
10
31. M
di Y
outh
Cen
tre
Wal
l Lin
ing
8,00
00
00
00
0-8
,000
0
10
33. Y
outh
Equ
ipm
ent U
pgra
de3,
000
3,00
02,
000
2,00
00
00
0-3
,000
11
66. Y
th C
tr -
Kitc
hen
Upg
rade
s0
010
,000
00
00
00
11
67. Y
th C
tr -
Pai
ntin
g0
00
7,00
00
00
00
11
68. S
cn Y
th C
tr -
Cov
ered
Wal
kway
010
,000
00
00
00
0
11
69. S
cn Y
th C
tr -
Dis
play
Boa
rds
02,
500
00
00
00
0
11
70. Y
th C
tr -
Com
pute
r U
pgra
de0
00
3,00
00
00
00
43
16. M
arke
ting
Str
ateg
ies
3,00
00
00
00
00
-3,0
00
43
17. S
cn-R
epla
ce F
ence
s10
,000
00
00
00
-10,
000
0
43
18. N
ew A
wni
ngs
Scn
/Mw
a0
2,50
02,
500
00
00
00

Pro
pose
dE
xpen
ditu
re20
14-2
017
Sou
rce
ofof
Fun
ding
for
2014
Pro
ject
s
Cap
italP
roje
cts
2013
/14
to20
16/1
720
13/1
4B
udge
t20
14/1
5B
udge
t20
15/1
6B
udge
t20
16/1
7B
udge
t
Con
trib
utio
ns&
Don
atio
nsLo
anF
undi
ngG
rant
Fun
ding
Tfr
from RA
Ope
ratin
gR
even
ue
43
19. M
wa
- F
loor
Cov
erin
gs0
05,
000
00
00
00
43
20. M
di -
Flo
or C
over
ings
05,
000
00
00
00
0
43
23. E
lect
rical
Upg
rade
s M
wa/
Mdi
3,00
00
00
00
00
-3,0
00
Eco
nom
icA
ffairs
Cam
ping
Are
as&
Car
avan
Par
ks
41
21. S
tew
arts
Bro
ok C
ampi
ng A
men
ities
30,0
000
00
00
0-3
0,00
00
50
34. M
oona
n F
lat -
Add
Pow
er0
5,00
00
00
00
00
50
35. M
aste
rpla
n P
repa
ratio
n/Im
plem
enta
tion
010
,000
00
00
00
0
Com
mun
ityT
echn
olog
yC
entr
es
09
00. C
TC
Edu
One
Pro
ject
- M
erriw
a1,
200
00
00
0-1
,200
00
09
03. C
TC
Edu
One
Pro
ject
- M
urru
rund
i1,
600
00
00
0-1
,600
00
Rea
lEst
ate
08
99. A
berd
een
Hts
Sub
divi
sion
- S
tg 2
, 5 &
60
50,0
0015
,000
1,05
0,00
00
00
00
09
81. A
berd
een
Hei
ghts
Sub
divi
sion
- S
tg 7
02,
000,
000
00
00
00
0
09
84. O
xley
Vie
w S
tage
20
00
15,0
000
00
00
10
00. M
di -
Ros
edal
e E
stat
e0
15,0
0050
0,00
00
00
00
0
41
49. M
wa
Sho
ps F
loor
Cov
erin
gs6,
000
00
00
00
0-6
,000
41
50. R
esid
entia
l Cap
ital W
orks
2,00
02,
000
2,00
02,
000
00
00
-2,0
00
Sal
eyar
ds
07
24. H
oldi
ng Y
ards
020
,000
20,0
0020
,000
00
00
0
07
44. Y
ard
Wor
ks10
,000
020
,000
00
00
0-1
0,00
0
08
74. S
aley
ards
Sec
urity
Sys
tem
55,1
005,
000
00
00
-50,
100
-5,0
000
08
81. S
aley
ards
Wat
er R
euse
Str
ateg
y0
200,
000
200,
000
00
00
00
12
65. F
ront
Ent
ry &
Dra
ins
15,0
000
00
00
00
-15,
000
12
66. S
ellin
g R
ing
Sea
t Upg
rade
5,00
05,
000
00
00
00
-5,0
00
12
67. A
gent
Cov
er5,
000
00
00
00
0-5
,000
12
68. H
ydra
ulic
Gat
es50
,000
00
00
00
-50,
000
0
12
70. D
rain
age
& S
torm
wat
er IM
P0
40,0
000
00
00
00
12
71. R
efur
bish
Toi
lets
00
40,0
000
00
00
0
12
74. S
taff
Am
eniti
es40
,000
00
00
00
-17,
708
-22,
292

Pro
pose
dE
xpen
ditu
re20
14-2
017
Sou
rce
ofof
Fun
ding
for
2014
Pro
ject
s
Cap
italP
roje
cts
2013
/14
to20
16/1
720
13/1
4B
udge
t20
14/1
5B
udge
t20
15/1
6B
udge
t20
16/1
7B
udge
t
Con
trib
utio
ns&
Don
atio
nsLo
anF
undi
ngG
rant
Fun
ding
Tfr
from RA
Ope
ratin
gR
even
ue
Tou
rism
&A
rea
Pro
mot
ion
40
07. E
D &
T P
roje
cts
44,0
0030
,000
30,0
0030
,000
00
0-3
8,00
0-6
,000
Env
ironm
ent
Sol
idW
aste
Man
agem
ent
08
13. W
aste
Abn
- L
and
Pur
chas
e25
0,00
00
00
00
0-2
50,0
000
08
15. W
aste
Mw
a -
00
050
,000
00
00
0
08
17. W
aste
Red
uctio
n Im
plem
enta
tion
10,0
0010
,000
10,0
0010
,000
00
00
-10,
000
08
22. W
aste
Scn
- L
and
Pur
chas
e25
0,00
00
00
00
0-2
50,0
000
08
25. I
nteg
rate
d W
aste
Man
agem
ent S
trat
egy
50,0
0020
,000
00
00
0-5
0,00
00
11
73. S
cn -
Lan
dfill
Dev
elop
men
t Ext
ensi
on75
,000
00
00
00
-75,
000
0
11
74. A
bn -
Lan
dfill
Dev
elop
men
t Ext
ensi
on75
,000
00
00
00
-75,
000
0
12
75. A
bn-T
ree
Pla
ntin
g ar
ound
faci
lity
30,0
000
00
00
00
-30,
000
12
76. M
di-D
esig
n &
Con
stru
ct T
rf S
tatio
n20
,000
70,0
000
00
00
-20,
000
0
12
77. R
ehab
ilita
tion
of L
andf
ill S
ites
010
0,00
020
,000
20,0
000
00
00
Sto
rmw
ater
Man
agem
ent
40
02. D
art S
tree
t Abn
65,0
000
00
00
00
-65,
000
40
60. D
art S
t Abn
80,0
000
00
00
0-8
0,00
00
40
62. S
unsh
ine
St M
di0
35,0
000
00
00
00
40
65. M
acqu
een
St A
bn0
70,0
000
00
00
00
40
66. H
ayes
St M
wa
015
,000
00
00
00
0
40
67. M
ount
St M
di0
045
,000
00
00
00
40
68. L
iver
pool
St S
cn50
,000
40,0
0060
,000
00
00
0-5
0,00
0
40
70. S
ydne
y S
t Scn
00
040
,000
00
00
0
40
71. A
berd
een
St S
cn0
070
,000
00
00
00
40
72. S
cn G
PT
00
060
,000
00
00
0
42
45. S
cn -
Bar
ton
& C
arly
le S
ts In
ters
ectio
n35
,000
00
00
00
0-3
5,00
0
42
47. S
cn -
Liv
erpo
ol&
Abe
rdee
n S
t Int
erse
ctio
n0
00
40,0
000
00
00
42
48. M
di -
Mur
ulla
St -
Isis
Ln
00
040
,000
00
00
0
43
05. H
aydo
n S
t Mdi
(M
ount
to P
age
St)
00
030
,000
00
00
0

Pro
pose
dE
xpen
ditu
re20
14-2
017
Sou
rce
ofof
Fun
ding
for
2014
Pro
ject
s
Cap
italP
roje
cts
2013
/14
to20
16/1
720
13/1
4B
udge
t20
14/1
5B
udge
t20
15/1
6B
udge
t20
16/1
7B
udge
t
Con
trib
utio
ns&
Don
atio
nsLo
anF
undi
ngG
rant
Fun
ding
Tfr
from RA
Ope
ratin
gR
even
ue
Gov
erna
nce
Cou
ncil
Ser
vice
s
07
14. A
sset
Pur
chas
es5,
000
2,00
02,
000
2,00
00
00
0-5
,000
Hou
sing
&C
omm
unity
Am
eniti
esLo
wIn
com
eH
ousi
ng
10
36. L
ow in
com
e H
ousi
ng P
aint
ing
00
05,
000
00
00
0
10
39. L
ow In
com
e R
epla
ce F
loor
cov
erin
gs0
3,00
00
00
00
00
Pub
licC
emet
erie
s
07
02. S
cone
Law
n C
emet
ery
Ext
ensi
on0
20,0
000
00
00
00
07
13. G
undy
Cem
eter
y F
ence
2,00
00
2,00
00
00
00
-2,0
00
07
41. C
emet
ery
Str
ateg
ic P
lan
Impl
emen
tatio
n0
12,0
0025
,000
27,0
000
00
00
12
59. S
igna
ge P
rogr
am3,
000
3,00
03,
000
3,00
00
00
0-3
,000
12
60. D
igiti
satio
n of
Rec
ords
5,00
05,
000
00
00
0-4
,350
-650
12
61. T
ree
Pla
ntin
g10
,000
010
,000
10,0
000
00
0-1
0,00
0
Str
eetL
ight
ing
07
65. S
tree
t & P
ublic
Lig
htin
g C
apita
l Wor
ks20
,000
20,0
0020
,000
20,0
000
00
-20,
000
0
Min
ing,
Man
ufac
turin
g&
Con
stru
ctio
nQ
uarr
yO
pera
tions
08
06. G
rave
l Exp
lora
tion
50,0
0050
,000
50,0
0050
,000
00
00
-50,
000
42
67. C
uan
Pit
Ero
sion
& S
edim
enta
tion
wor
ks20
,000
00
00
00
0-2
0,00
0
Pub
licO
rder
&S
afet
yA
nim
alC
ontr
ol
40
59. R
egul
ator
y -P
ound
s U
pgra
de0
10,0
000
00
00
00
Fire
Ser
vice
Levy
&F
ireP
rote
ctio
n
07
30. B
uild
ing
Cap
ital W
orks
090
,000
90,0
0090
,000
00
00
0
12
72. S
tew
arts
Bro
ok A
men
ities
45,0
000
00
00
-45,
000
00
12
73. A
irbas
e O
pera
tions
45,0
000
00
00
-45,
000
00

Pro
pose
dE
xpen
ditu
re20
14-2
017
Sou
rce
ofof
Fun
ding
for
2014
Pro
ject
s
Cap
italP
roje
cts
2013
/14
to20
16/1
720
13/1
4B
udge
t20
14/1
5B
udge
t20
15/1
6B
udge
t20
16/1
7B
udge
t
Con
trib
utio
ns&
Don
atio
nsLo
anF
undi
ngG
rant
Fun
ding
Tfr
from RA
Ope
ratin
gR
even
ue
Rec
reat
ion
&C
ultu
reC
omm
unity
Cen
tres
&H
alls
10
45. S
SC
- In
tern
al P
aint
ing
00
10,0
000
00
00
0
10
53. C
assi
lis H
all -
Flo
ors
08,
000
00
00
00
0
10
58. S
ettle
men
t Hal
l - F
loor
s0
00
6,00
00
00
00
10
61. S
ettle
men
t Hal
l - W
indo
ws
Upg
rade
5,00
04,
000
4,00
00
00
0-5
,000
0
10
75. A
bn H
all U
pgra
de20
,000
20,0
000
00
00
-20,
000
0
11
19. S
cn Y
outh
Cen
tre
Hal
l - F
loor
Upg
00
010
,000
00
00
0
11
45. M
di R
SL
Hal
l - P
aint
ing
00
8,00
05,
000
00
00
0
11
53. M
wa
Sch
ool o
f Art
s -
Pai
ntin
g0
10,0
000
00
00
00
11
54. M
wa
Sch
ool o
f Art
s -
Gut
ter
Rep
lace
men
t10
,000
00
00
00
-10,
000
0
11
55. M
wa
Sch
ool o
f Art
s -
Sou
nd S
yste
m0
00
12,0
000
00
00
42
83. S
CA
DS
Bui
ldin
g12
5,00
012
5,00
00
00
0-1
25,0
000
0
43
14. R
epla
ce F
urni
ture
& E
quip
2,00
02,
000
2,00
02,
000
00
0-2
,000
0
Mus
eum
s
07
87. P
ione
er C
otta
ge R
ear
Ext
(P
lan&
Des
ign)
00
10,0
000
00
00
0
07
89. M
di N
orvi
ll A
ircra
ft M
useu
m68
5,00
00
00
-200
,000
0-4
85,0
000
0
07
90. M
di M
useu
m R
oof R
epai
rs0
6,00
00
00
00
00
07
96. M
di M
useu
m E
xt a
t Rea
r (P
lan&
Des
ign)
00
040
,000
00
00
0
10
65. S
cn M
useu
m -
Bric
k W
ork
Upg
rade
00
10,0
000
00
00
0
10
66. S
cn M
useu
m -
Und
erpi
nnin
g0
015
,000
00
00
00
10
67. S
cn M
useu
m -
Wat
er &
Pip
es0
00
15,0
000
00
00
10
68. M
useu
ms
- S
afe
Sto
rage
Col
lect
ions
00
5,00
05,
000
00
00
0
10
74. M
di M
useu
m -
Pai
ntin
g0
00
4,00
00
00
00
11
71. M
useu
m S
igna
ge0
3,00
00
00
00
00
42
41. V
G G
rant
201
1 -
Mdi
His
toric
al S
ocie
ty36
036
036
013
10
0-3
600
0
Par
ks&
Gar
dens
07
09. T
ree
Pla
ntin
g S
cn26
,000
26,0
0026
,000
26,0
000
00
0-2
6,00
0
07
11. B
unna
n P
ark
Dev
elop
men
t0
00
10,0
000
00
00
08
02. T
ree
Pla
ntin
g A
bn7,
000
7,00
07,
000
7,00
00
00
0-7
,000

Pro
pose
dE
xpen
ditu
re20
14-2
017
Sou
rce
ofof
Fun
ding
for
2014
Pro
ject
s
Cap
italP
roje
cts
2013
/14
to20
16/1
720
13/1
4B
udge
t20
14/1
5B
udge
t20
15/1
6B
udge
t20
16/1
7B
udge
t
Con
trib
utio
ns&
Don
atio
nsLo
anF
undi
ngG
rant
Fun
ding
Tfr
from RA
Ope
ratin
gR
even
ue
08
03. T
ree
Pla
ntin
g M
wa
11,0
0011
,000
11,0
0011
,000
00
00
-11,
000
08
04. T
ree
Pla
ntin
g M
di11
,000
11,0
0011
,000
11,0
000
00
0-1
1,00
0
08
05. W
ilson
Mem
Pk
- O
utdo
or E
xerc
ise
Equ
ip40
,000
00
00
0-2
0,00
00
-20,
000
08
42. C
assi
lis -
Pla
y E
quip
men
t15
,000
00
00
00
-15,
000
0
08
43. S
heed
y P
ark
- La
ndsc
apin
g0
00
20,0
000
00
00
12
50. M
di -
Impr
ove
Nth
app
roac
h20
,000
00
00
0-2
0,00
00
0
12
52. S
cn -
Impr
ove
Nth
App
roac
h40
,000
00
00
0-4
0,00
00
0
12
53. S
cn -
Eliz
abet
h P
ark
Pla
y E
quip
Sha
de0
30,0
000
00
00
00
12
54. A
bn -
Brid
ge P
icni
c A
rea
Land
scap
ing
00
20,0
000
00
00
0
12
55. W
inge
n- P
layg
roun
d E
quip
men
t Stg
20
015
,000
00
00
00
12
56. M
di -
Wils
on P
ark
Sha
de0
030
,000
00
00
00
Pub
licLi
brar
ies
12
26. M
ovea
ble
Sig
nage
Ban
ners
2,00
00
00
00
00
-2,0
00
12
27. A
bn -
Lib
rary
Upg
rade
10,0
0010
,000
10,0
000
00
00
-10,
000
12
28. M
wa-
Add
sta
ff w
orks
pace
& s
helv
ing
00
20,0
000
00
00
0
12
29. A
dditi
onal
Fur
nitu
re5,
000
5,00
05,
000
5,00
00
00
0-5
,000
12
30. R
etur
n F
acili
ties
at L
ibra
ries
06,
000
00
00
00
0
12
31. O
utdo
or r
eadi
ng a
reas
00
2,00
00
00
00
0
12
32. Y
oung
adu
lts s
ectio
n fu
rnitu
re0
5,00
00
5,00
00
00
00
12
33. S
cn -
Dis
able
d T
oile
t20
,000
00
00
00
-20,
000
0
12
34. D
ispl
ay B
oard
s3,
000
2,00
02,
000
2,00
00
00
0-3
,000
12
78. R
evita
lisin
g Li
brar
ies
16,0
000
00
00
0-1
6,00
00
Spo
rtin
gG
roun
ds&
Ven
ues
08
27. B
ill R
ose
Com
plex
Clu
b H
ouse
00
265,
000
00
00
00
08
29. A
berd
een
Ska
te P
ark
100,
000
00
00
0-1
00,0
000
0
08
30. S
cone
Ska
te P
ark
020
0,00
00
00
00
00
08
45. M
di C
ricke
t Pitc
h7,
000
00
00
00
-7,0
000
08
47. W
hite
Par
k D
evel
opm
ent
500,
000
20,0
0020
,000
00
0-2
00,0
00-3
00,0
000
10
84. M
erriw
a S
kate
Par
k10
,000
100,
000
00
00
0-1
0,00
00
41
05. J
effe
rson
Par
k P
ower
Upg
rade
20,0
000
00
00
-5,0
00-1
5,00
00
41
09. M
wa
Sho
wgr
ound
Upg
rade
20,0
0020
,000
20,0
0020
,000
00
0-2
0,00
00

Pro
pose
dE
xpen
ditu
re20
14-2
017
Sou
rce
ofof
Fun
ding
for
2014
Pro
ject
s
Cap
italP
roje
cts
2013
/14
to20
16/1
720
13/1
4B
udge
t20
14/1
5B
udge
t20
15/1
6B
udge
t20
16/1
7B
udge
t
Con
trib
utio
ns&
Don
atio
nsLo
anF
undi
ngG
rant
Fun
ding
Tfr
from RA
Ope
ratin
gR
even
ue
41
59. S
cn P
ark
Upg
rade
00
060
,000
00
00
0
43
06. R
osed
ale
- R
enew
Offi
ce B
uild
ing
5,00
00
00
00
00
-5,0
00
43
07. R
osed
ale
- S
tock
yar
d up
grad
e10
,000
00
00
00
0-1
0,00
0
43
08. R
osed
ale
- R
enew
wat
er m
ains
025
,000
00
00
00
0
43
09. R
osed
ale
- in
stal
l pow
er o
utle
ts0
3,50
00
00
00
00
44
03. R
ecre
atio
n &
Ope
n S
pace
Nee
ds S
tudy
35,0
000
00
00
0-3
5,00
00
44
04. S
cn-W
hite
Par
k se
atin
g &
Sha
de tr
ees
10,0
000
00
00
0-1
0,00
00
44
05. S
cn B
aske
tbal
l Sta
dium
-Upg
rade
Lig
htin
g0
15,0
000
00
00
00
Sw
imm
ing
Poo
ls
11
28. M
wa
- R
ecau
lk S
cum
Gut
ters
6,00
00
00
00
0-6
,000
0
11
29. M
wa
- S
ecur
ity U
pg in
cl C
amer
as0
05,
000
00
00
00
11
37. S
cn -
Rep
l Tod
dler
Poo
l Con
cour
se0
010
,000
00
00
00
11
40. S
cn -
Cha
nger
oom
Ret
rofit
00
10,0
0020
,000
00
00
0
11
44. M
di -
Val
ve R
epla
cem
ent &
Pla
ntro
om U
pg5,
000
00
00
00
-5,0
000
11
56. M
di -
Per
imet
er F
ence
Upg
06,
000
00
00
00
0
40
92. M
wa
Cha
nge
Roo
m U
pgra
de0
10,0
000
00
00
00
40
94. S
cn -
Val
ve R
epla
cem
ent i
n P
lant
room
15,0
000
10,0
000
00
0-1
5,00
00
40
97. M
di N
ew B
BQ
00
7,50
00
00
00
0
41
02. S
cn N
ew S
hade
Cov
ers
010
,000
00
00
00
0
41
66. S
cn R
LCIP
3 -
Pum
p U
pgra
de0
25,0
000
00
00
00
42
93. M
wa
- re
loca
te o
ffice
02,
000
00
00
00
0
42
94. M
wa
- re
plac
e rt
n lin
e ea
st s
cum
gut
ter
020
,000
00
00
00
0
42
95. M
wa
- U
pgra
de E
lect
rical
Sw
itchb
oard
12,0
000
00
00
0-1
2,00
00
42
96. M
di -
Tile
rep
lace
men
t & p
ool p
aint
ing
08,
000
00
00
00
0
42
97. M
di -
Dis
able
d en
try
step
s0
00
7,00
00
00
00
42
98. M
di -
Rep
lace
sta
rtin
g pl
atfo
rms
3,00
00
09,
000
00
0-3
,000
0
42
99. M
di -
Kio
sk/o
ffice
- g
utte
r re
new
al2,
000
00
00
00
-2,0
000
43
00. M
di -
poo
l bla
nket
/cov
ers
rene
wal
08,
000
00
00
00
0
43
01. M
di -
Sha
de C
over
25m
poo
l0
016
,000
00
00
00
43
03. M
di -
Pla
nt r
oom
aut
o P
H a
djus
ter
05,
000
00
00
00
0
43
29. M
wa
- D
isab
led
Ste
ps0
00
7,00
00
00
00
43
30. S
cn -
Dis
able
d S
teps
00
07,
000
00
00
0

Pro
pose
dE
xpen
ditu
re20
14-2
017
Sou
rce
ofof
Fun
ding
for
2014
Pro
ject
s
Cap
italP
roje
cts
2013
/14
to20
16/1
720
13/1
4B
udge
t20
14/1
5B
udge
t20
15/1
6B
udge
t20
16/1
7B
udge
t
Con
trib
utio
ns&
Don
atio
nsLo
anF
undi
ngG
rant
Fun
ding
Tfr
from RA
Ope
ratin
gR
even
ue
Tra
nspo
rt&
Com
mun
icat
ion
Aer
odro
mes
11
15. A
irpor
t - D
rain
age
Wor
ks20
,000
00
00
00
0-2
0,00
0
11
87. A
irpor
t - C
ertif
icat
ion
Wor
ks0
20,0
000
00
00
00
Foo
tpat
hs
11
81. F
tpth
- K
ingd
on S
t, S
cn (
Hill
-Gue
rnse
y)30
,000
00
0-1
2,00
00
00
-18,
000
11
82. F
tpth
- P
ages
Riv
er W
alk,
Mdi
10,0
005,
000
05,
000
00
00
-10,
000
12
02. F
tpth
- P
erth
St,A
bn(N
E H
wy-
Cam
pbel
l)72
,000
00
0-3
0,00
00
00
-42,
000
40
44. F
tpth
- H
aydo
n S
t,Mdi
(Vic
toria
-Ade
laid
e)0
030
,000
00
00
00
40
83. F
tpth
- G
raem
e S
t, A
bn0
030
,000
00
00
00
40
87. F
tpth
- G
raem
e S
t,Abn
(Mac
quee
n-C
ampb
ell)
00
055
,000
00
00
0
43
27. K
erb
Ram
p U
pgra
de20
,000
20,0
0020
,000
20,0
000
00
0-2
0,00
0
43
50. S
cn-B
arto
n S
t (A
laba
ma
to S
usan
St)
050
,000
050
,000
00
00
0
43
51. S
cn-G
undy
Rd
(Bar
ton
to K
ilgal
in S
t)0
00
25,0
000
00
00
43
52. S
cn -
Moo
bi R
d C
ycle
way
050
,000
00
00
00
0
Roa
ds&
Brid
ges
-Lo
cal(
Sea
led,
Uns
eale
d&
Urb
an)
07
72. R
2R C
ampb
ell S
t, A
bn0
96,0
000
00
00
00
08
19. M
oobi
Rd
Cul
vert
s70
,000
00
00
00
-70,
000
0
08
34. T
imor
Rd,
Mdi
100,
000
00
0-1
00,0
000
00
0
08
50. R
othe
rwoo
d R
d (S
eale
d) U
pgra
de18
1,00
00
00
00
0-1
00,0
00-8
1,00
0
08
51. M
t Erin
Rd
Upg
rade
00
71,0
000
00
00
0
08
54. R
2R S
usan
& M
ain
St R
ound
abou
t0
250,
000
00
00
00
0
08
56. R
2R H
aydo
n S
t, M
di K
&G
00
70,0
000
00
00
0
08
57. R
2R S
usan
St,
Scn
K&
G0
019
6,00
00
00
00
0
08
58. R
2R M
arqu
et S
t, M
wa
K&
G R
epla
ce0
20,0
000
00
00
00
08
59. R
2R S
hort
St,
Scn
K&
G R
epla
ce0
50,0
000
00
00
00
08
60. R
2R W
aver
ley
St,
Scn
K&
G R
epla
ce0
300,
000
00
00
00
0
08
61. R
2R T
imor
Cra
wne
y R
d R
eshe
et0
050
,000
00
00
00
08
62. R
2R W
aver
ley
Rd
Res
heet
00
50,0
000
00
00
0
08
63. R
2R C
ampb
ell S
t, A
bn K
&G
(Gra
eme/
Bed
ford
)0
00
100,
000
00
00
0

Pro
pose
dE
xpen
ditu
re20
14-2
017
Sou
rce
ofof
Fun
ding
for
2014
Pro
ject
s
Cap
italP
roje
cts
2013
/14
to20
16/1
720
13/1
4B
udge
t20
14/1
5B
udge
t20
15/1
6B
udge
t20
16/1
7B
udge
t
Con
trib
utio
ns&
Don
atio
nsLo
anF
undi
ngG
rant
Fun
ding
Tfr
from RA
Ope
ratin
gR
even
ue
08
64. R
2R S
ydne
y S
t, S
cn K
&G
00
100,
000
100,
000
00
00
0
08
65. R
2R A
rche
r S
t, B
unna
n In
itial
Sea
l0
20,0
000
00
00
00
08
66. R
2R B
ourk
e S
t, B
land
ford
Initi
al S
eal
00
20,0
000
00
00
0
08
67. R
2R P
ages
Riv
er X
ing,
Gle
nbaw
n R
d0
00
50,0
000
00
00
08
69. R
2R K
ars
Spr
ings
Rd
Res
heet
00
010
0,00
00
00
00
08
70. R
2R U
pper
Dar
tbro
ok R
d R
eshe
et0
075
,000
00
00
00
08
71. R
2R D
ry C
reek
Rd
Res
heet
075
,000
00
00
00
0
08
84. G
lenb
awn
Rd
Reh
abili
tatio
n14
0,00
010
0,00
010
0,00
010
0,00
00
00
-40,
000
-100
,000
08
85. S
egen
hoe
Rd
Reh
abili
tatio
n10
0,00
010
0,00
00
00
00
0-1
00,0
00
08
87. M
ain
St,
Scn
Reh
abili
tatio
n0
010
0,00
00
00
00
0
08
90. R
idge
land
s R
d R
eshe
et50
,000
00
00
00
0-5
0,00
0
08
91. M
oobi
Rd
Res
heet
00
50,0
000
00
00
0
10
13. R
2R H
unte
r R
oad
Hal
f Moo
n38
,000
200,
000
100,
000
100,
000
00
-38,
000
00
10
20. R
2R K
elly
St S
cn K
&G
(Eve
leig
h to
For
bes)
010
0,00
00
00
00
00
10
23. R
2R M
R10
5 G
undy
Rd
Reh
abili
tatio
n0
020
0,00
00
00
00
0
10
85. F
lags
Rd
(Tow
n B
ound
ary
to R
acec
ours
e)90
,000
90,0
000
00
00
0-9
0,00
0
11
88. M
ount
ain
Sta
tion
Rd
Upg
37,0
000
00
00
00
-37,
000
11
89. G
umm
un R
d U
pg82
,000
00
00
00
0-8
2,00
0
11
91. Y
arra
won
ga R
d U
pg0
00
50,0
000
00
00
11
92. C
BD
Upg
rade
- M
wa
00
013
5,00
00
00
00
11
94. R
2R R
ouch
el R
d C
ulve
rt25
9,00
00
00
00
-259
,000
00
11
95. R
2R M
R62
Wid
enin
g0
00
250,
000
00
00
0
11
96. R
2R M
iddl
ebro
ok R
d R
ehab
00
016
1,00
00
00
00
12
03. R
2R D
art S
t, A
bn K
&G
+ R
econ
stru
ctio
n69
,000
00
00
0-6
9,00
00
0
12
07. B
edfo
rd S
t, A
bn (
Kyu
ga-M
ount
) K
&G
40,0
000
00
-18,
000
00
0-2
2,00
0
12
15. S
usan
St,
Scn
K&
G (
Gue
rnse
y-H
ill)
00
042
,300
00
00
0
40
28. G
lenb
awn
Rd
- P
ages
Cro
ssin
g75
,000
00
00
0-7
5,00
00
0
40
40. L
IRS
-Bro
ad C
ross
ing
1,70
0,00
00
00
0-1
,200
,000
-500
,000
00
40
47. L
IRS
-Doo
lans
Gul
ly B
ridge
260,
000
00
00
-260
,000
00
0
40
52. L
IRS
-St A
ubin
s S
t,Scn
(Gue
rnse
y-A
berd
een)
400,
000
00
00
-400
,000
00
0
40
53. L
IRS
-Abe
rdee
n S
t, S
cn (
Live
rpoo
l-Sus
an)
130,
000
00
00
-130
,000
00
0
40
54. L
IRS
-Hay
don
St,
Mdi
(A
dela
ide-
Pol
ding
)10
0,00
00
00
0-1
00,0
000
00
40
55. L
IRS
-Gra
eme
St,
Abn
(W
alke
r-K
yuga
)20
0,00
00
00
0-2
00,0
000
00

Pro
pose
dE
xpen
ditu
re20
14-2
017
Sou
rce
ofof
Fun
ding
for
2014
Pro
ject
s
Cap
italP
roje
cts
2013
/14
to20
16/1
720
13/1
4B
udge
t20
14/1
5B
udge
t20
15/1
6B
udge
t20
16/1
7B
udge
t
Con
trib
utio
ns&
Don
atio
nsLo
anF
undi
ngG
rant
Fun
ding
Tfr
from RA
Ope
ratin
gR
even
ue
40
56. L
IRS
-Mou
nt S
t, A
bn (
Gra
eme-
Mor
ay)
100,
000
00
00
-100
,000
00
0
41
42. D
oola
ns G
ully
Brid
ge A
ppro
ache
s60
,000
00
00
00
0-6
0,00
0
43
56. K
illoe
Rd,
Mw
a G
rave
l Res
heet
50,0
000
00
00
00
-50,
000
43
57. F
light
Spr
ings
Rd,
Mw
a G
rave
l Res
heet
00
50,0
000
00
00
0
43
58. S
arge
ants
Gap
Rd,
Tim
or G
rave
l Res
heet
00
50,0
000
00
00
0
43
59. S
umm
erhi
ll R
d, M
wa
Gra
vel R
eshe
et0
050
,000
00
00
00
43
60. P
ages
Crk
Rd,
Elle
rsto
n G
rave
l Res
heet
00
50,0
000
00
00
0
43
61. W
oron
di R
d, M
wa
Gra
vel R
eshe
et0
00
50,0
000
00
00
43
62. C
ooga
h R
d, T
imor
Gra
vel R
eshe
et0
00
50,0
000
00
00
43
63. T
uran
ville
Rd,
Scn
Gra
vel R
eshe
et0
00
50,0
000
00
00
51
06. L
IRS
- S
egen
hoe
Rd
80,0
000
00
0-8
0,00
00
00
51
07. L
IRS
- G
undy
Rd
012
0,00
00
00
00
00
51
08. L
IRS
- H
aydo
ns L
ane
40,0
000
00
0-4
0,00
00
00
51
09. L
IRS
- M
iddl
ebro
ok R
d10
0,00
00
00
0-1
00,0
000
00
51
10. L
IRS
- T
imor
Rd
00
160,
000
00
00
00
51
11. L
IRS
- G
lenb
awn
Rd
110,
000
00
00
-110
,000
00
0
51
12. L
IRS
- Id
avill
e R
d0
150,
000
00
00
00
0
51
13. L
IRS
- D
artb
rook
Rd
100,
000
00
00
-100
,000
00
0
51
14. L
IRS
- L
lang
olle
n15
0,00
00
00
0-1
50,0
000
00
51
15. L
IRS
- R
ingw
ood
Rd
00
40,0
000
00
00
0
51
16. L
IRS
- G
arla
nds
Brid
ge62
0,00
00
00
0-6
20,0
000
00
51
17. L
IRS
- S
tarr
s C
ross
ing
340,
000
00
00
-340
,000
00
0
51
18. L
IRS
- S
andy
Cre
ek B
ridge
115,
000
00
00
-115
,000
00
0
Roa
ds&
Brid
ges
-R
egio
nal
07
57. M
R10
5 -
Moo
nan
Cut
ting
50,0
0050
,000
50,0
0025
0,00
00
0-5
0,00
00
0
07
59. M
R35
8 W
iden
ing
& In
itial
Sea
l40
0,00
040
0,00
040
0,00
040
0,00
00
0-2
00,0
00-2
00,0
000
07
74. M
R62
Ow
ens
Gap
Wid
enin
g0
025
0,00
00
00
00
0
07
75. M
R62
Gua
rdra
il R
epla
cem
ent
40,0
0040
,000
40,0
0040
,000
00
00
-40,
000
12
24. M
R 1
05 O
rato
ra R
ehab
stg
120
0,00
00
00
00
-200
,000
00
12
25. M
R 1
05 O
rato
ra R
ehab
stg
220
0,00
00
00
00
-200
,000
00

Pro
pose
dE
xpen
ditu
re20
14-2
017
Sou
rce
ofof
Fun
ding
for
2014
Pro
ject
s
Cap
italP
roje
cts
2013
/14
to20
16/1
720
13/1
4B
udge
t20
14/1
5B
udge
t20
15/1
6B
udge
t20
16/1
7B
udge
t
Con
trib
utio
ns&
Don
atio
nsLo
anF
undi
ngG
rant
Fun
ding
Tfr
from RA
Ope
ratin
gR
even
ue
Tra
nspo
rtA
ncill
arie
s
07
47. B
us S
helte
r C
apita
l Wor
ks15
,000
15,0
0015
,000
15,0
000
0-1
5,00
00
0
07
49. C
BD
& S
tree
t Fur
nitu
re8,
000
8,00
08,
000
8,00
00
00
0-8
,000
07
53. C
BD
Scn
- U
pgra
de58
,000
00
00
00
-58,
000
0
08
07. P
urch
ase
of P
rope
rty
10,0
000
00
00
00
-10,
000
11
92. C
BD
Upg
rade
- M
wa
00
135,
000
00
00
00
40
78. F
arra
m L
ane
Con
stru
ctio
n0
120,
000
00
00
00
0
40
79. S
tree
t Sig
ns10
,000
10,0
0010
,000
10,0
000
00
0-1
0,00
0
43
32. S
cn-W
aver
ly S
t tra
ffic
impr
ovem
ents
00
20,0
000
00
00
0
43
33. A
bn-B
edfo
rd S
t Ins
tall
pick
up/
off z
ones
02,
000
00
00
00
0
43
34. A
bn-B
edfo
rd S
t Ins
tall
refu
ge is
land
015
,000
00
00
00
0
43
35. M
oona
n/B
arrin
gton
Rd
- G
uard
rail
Ext
.0
010
0,00
00
00
00
0
43
38. M
di C
BD
- F
enci
ng15
,000
00
00
00
0-1
5,00
0
43
39. M
di C
BD
- S
tree
t Fur
nitu
re10
,000
00
00
00
0-1
0,00
0
43
43. S
cone
CB
D -
Wal
k of
Fam
e10
,000
00
00
00
0-1
0,00
0
Wat
erF
und
Wat
erS
uppl
ies
Mer
riwa/
Cas
silis
Wat
er
20
25. M
wa
- M
eter
Rep
lace
men
ts10
,000
10,0
0010
,000
10,0
000
00
0-1
0,00
0
41
83. M
wa
- T
elem
etry
Upg
rade
20,0
0020
,000
00
00
00
-20,
000
41
84. M
wa
- M
ains
/Val
ve R
epla
cem
ent P
rogr
am0
60,0
000
00
00
00
43
74. M
wa
-Lan
gley
St B
ore
Pum
p R
epla
cem
ent
00
43,0
000
00
00
0
43
84. P
otab
le w
ater
mgn
mt p
lan
10,0
000
00
00
00
-10,
000
Mur
ruru
ndiW
ater
10
77. M
ayne
St M
ain
(Ade
laid
e to
Wils
on M
em)
39,0
000
00
00
0-3
9,00
00
20
14. M
ains
20,0
0020
,000
20,0
0020
,000
00
00
-20,
000
20
26. M
di -
Met
er R
epla
cem
ents
10,0
0010
,000
10,0
0010
,000
00
00
-10,
000
42
32. W
ater
Aug
men
tatio
n -
Sta
ge 1
00
01,
500,
000
00
00
0
43
77. M
di -
Inst
alla
tion
of T
elem
etry
35,0
000
00
00
00
-35,
000
43
84. P
otab
le w
ater
mgn
mt p
lan
10,0
000
00
00
00
-10,
000
43
88. M
di-M
ayne
St M
ains
rep
l(Bro
ok-V
icto
ria)
123,
000
00
00
00
0-1
23,0
00
Sco
ne/A
berd
een
Wat
er

Pro
pose
dE
xpen
ditu
re20
14-2
017
Sou
rce
ofof
Fun
ding
for
2014
Pro
ject
s
Cap
italP
roje
cts
2013
/14
to20
16/1
720
13/1
4B
udge
t20
14/1
5B
udge
t20
15/1
6B
udge
t20
16/1
7B
udge
t
Con
trib
utio
ns&
Don
atio
nsLo
anF
undi
ngG
rant
Fun
ding
Tfr
from RA
Ope
ratin
gR
even
ue
11
05. S
cn/A
bn -
Min
or R
eser
voir
Rep
airs
40,0
0060
,000
00
00
0-4
0,00
00
12
12. S
cn -
New
St M
ain
(Birr
ell-N
ew-P
ark)
225,
000
00
00
00
-225
,000
0
12
13. S
cn -
Sus
an &
Mai
n S
ts In
ters
ectio
n M
ain
140,
000
00
00
00
-140
,000
0
12
14. S
cn -
Sus
an S
t Mai
n (G
uern
sey-
Hill
)0
00
44,0
000
00
00
20
27. S
cn/A
bn -
Met
er R
epla
cem
ents
40,0
0040
,000
40,0
0040
,000
00
00
-40,
000
20
28. W
A T
reat
men
t Pla
nt20
0,00
05,
000,
000
800,
000
0-1
00,0
000
-100
,000
00
20
29. W
A A
bn B
ackf
eed
00
2,66
0,00
00
00
00
0
40
39. S
t Aub
ins
St,
Scn
- M
ajor
Mai
ns30
0,00
00
00
00
0-3
00,0
000
41
57. S
cn -
Res
ervo
ir P
aint
ing
240,
000
00
00
00
0-2
40,0
00
41
88. A
bn -
Eld
on S
t0
00
44,0
000
00
00
41
89. A
bn -
Wal
ker
St (
Mor
ay to
Mou
nt)
00
046
,000
00
00
0
41
90. A
bn -
Upp
Cam
pbel
l St (
Gra
ham
-Res
ervo
ir)0
117,
000
00
00
00
0
42
08. S
cn -
Kin
gdon
St,
Und
erbo
re R
ail T
rack
s69
,000
00
00
00
0-6
9,00
0
42
10. S
cn -
Dav
ies
St M
ain
024
,000
00
00
00
0
42
13. S
cn -
Mai
n S
t Mai
n(Li
verp
ool t
o P
hilip
)0
016
9,00
00
00
00
0
42
15. S
cn -
Far
ram
Ln
Mai
n (b
ehin
d sh
ops)
035
,000
00
00
00
0
42
16. S
cn -
Sco
tt S
t Mai
n(C
oope
r to
Liv
erpo
ol)
020
5,00
00
00
00
00
42
19. S
cn -
Min
or M
ain
& S
ervi
ce R
epla
cem
ents
40,0
0040
,000
40,0
0040
,000
00
00
-40,
000
42
75. A
bn-S
hort
St M
ains
Rep
lace
men
t0
53,0
000
00
00
00
43
64. S
cn -
Upg
rade
mai
n w
ater
sup
ply
00
032
0,00
00
00
00
43
65. A
bn -
Rev
iew
of H
igh
Tow
er0
065
,000
00
00
00
43
66. S
cn -
St A
ubin
s S
t (A
berd
een-
Gue
rnse
y)0
00
152,
000
00
00
0
43
68. S
cn -
Gun
dy R
d M
ain
(Bar
ton
to K
ilgal
in)
32,0
000
00
00
00
-32,
000
43
70. A
bn -
Bed
ford
St M
ain(
Seg
enho
e-M
acqu
een)
46,0
000
00
00
00
-46,
000
43
72. A
bn-W
alke
r S
t Mai
n (M
oray
-Mou
nt)
00
52,0
000
00
00
0
43
78. S
cn -
Hill
St M
ain
(St A
ubin
s to
Par
ker)
00
54,0
000
00
00
0
43
79. S
cn H
ill S
t (K
ingd
on to
St A
ubin
s)0
152,
000
00
00
00
0
43
81. S
cn -
Abe
rdee
n S
t (S
t Aub
ins
to P
arke
r)0
057
,000
00
00
00
43
83. S
cn -
Gue
rnse
y S
t (Li
verp
ool t
o K
ingd
on)
00
68,0
000
00
00
0
43
84. P
otab
le w
ater
mgn
mt p
lan
20,0
000
00
00
00
-20,
000
43
85. A
bn -
Bed
ford
St (
Cam
pbel
l-Gra
ham
)0
00
58,0
000
00
00
43
86. S
cn -
Con
nect
Mai
n (L
iver
pool
-Kel
ly S
t)0
00
120,
000
00
00
0
43
87. A
bn-S
egen
hoe
St M
ain(
Bed
ford
-St A
ndre
ws)
00
039
,000
00
00
0

Pro
pose
dE
xpen
ditu
re20
14-2
017
Sou
rce
ofof
Fun
ding
for
2014
Pro
ject
s
Cap
italP
roje
cts
2013
/14
to20
16/1
720
13/1
4B
udge
t20
14/1
5B
udge
t20
15/1
6B
udge
t20
16/1
7B
udge
t
Con
trib
utio
ns&
Don
atio
nsLo
anF
undi
ngG
rant
Fun
ding
Tfr
from RA
Ope
ratin
gR
even
ue
Sew
erF
und
Sew
erag
eS
ervi
ces
Mer
riwa
Sew
erag
e
41
97. M
wa
- S
torm
wat
er In
filtr
atio
n S
tudy
025
,000
00
00
00
0
41
98. M
wa
- N
utrie
nt R
educ
tion
Stu
dy30
,000
00
00
00
0-3
0,00
0
41
99. M
wa
- S
ewer
Mai
n C
CT
V5,
000
5,00
05,
000
5,00
00
00
0-5
,000
44
01. M
wa
- S
TP
Inle
t Upg
rade
Scr
eens
85,0
000
00
00
0-1
5,33
6-6
9,66
4
Mur
ruru
ndiS
ewer
age
11
08. M
di -
Sew
er M
ain
CC
TV
10,0
0010
,000
10,0
0010
,000
00
00
-10,
000
44
02. M
di-
Sew
er M
ain
Rep
lace
men
t0
20,0
0020
,000
20,0
000
00
00
Sco
ne/A
berd
een
Sew
erag
e
11
25. S
cn -
ST
P O
pera
tions
Rep
ort
50,0
000
00
00
00
-50,
000
12
10. S
cn -
Upd
ate
Wat
er R
euse
Mgt
Pla
n50
,000
00
00
00
0-5
0,00
0
12
11. A
bn -
St A
ndre
ws
St M
ain
Re-
linin
g88
,000
00
00
00
0-8
8,00
0
30
16. P
umpi
ng S
tatio
ns0
030
,000
00
00
00
40
17. S
cn -
Abe
rdee
n S
t Pum
p S
tn U
pg13
0,00
00
00
00
0-1
30,0
000
40
19. S
cn -
Ref
urbi
sh T
ertia
ry P
onds
25,0
000
00
00
00
-25,
000
40
26. S
cn -
ST
P F
low
Met
er &
Out
flow
Upg
00
020
,000
00
00
0
40
27. S
cn -
Des
ludg
e La
goon
s20
,000
00
00
00
0-2
0,00
0
42
15. S
cn -
Far
ram
Ln
Mai
n (b
ehin
d sh
ops)
022
,000
00
00
00
0
42
20. S
cn -
ST
P S
eptic
/Gre
ase
Was
te D
ump
Poi
nt20
,000
00
00
00
0-2
0,00
0
42
22. S
cn -
Syd
ney
St M
ain
028
,000
00
00
00
0
42
23. S
cn -
Birr
ell &
Sco
tt S
ts M
ains
064
,000
00
00
00
0
42
24. S
cn -
Wav
erle
y S
t Mai
n0
43,0
0050
,000
00
00
00
42
25. S
cn -
Phi
lip S
t Mai
n0
017
,000
00
00
00
42
26. S
cn -
Coo
per
St M
ain
00
012
,000
00
00
0
42
27. S
cn -
Koa
la S
t Mai
n32
,000
00
00
00
0-3
2,00
0
43
89. S
cn -
Soi
l & W
ater
Mon
itorin
g P
rogr
am30
,000
30,0
000
00
00
0-3
0,00
0
43
90. S
cn-S
ewer
Ris
ing
Mai
n(M
oobi
Rd
SP
S-S
TP
)0
00
277,
000
00
00
0
43
91. S
cn-S
ewer
Mai
n In
filtr
atio
n P
rogr
am40
,000
40,0
0040
,000
00
00
0-4
0,00
0
43
92. S
cn -
ST
P S
tudy
EP
Cap
acity
13,0
000
00
00
00
-13,
000

Pro
pose
dE
xpen
ditu
re20
14-2
017
Sou
rce
ofof
Fun
ding
for
2014
Pro
ject
s
Cap
italP
roje
cts
2013
/14
to20
16/1
720
13/1
4B
udge
t20
14/1
5B
udge
t20
15/1
6B
udge
t20
16/1
7B
udge
t
Con
trib
utio
ns&
Don
atio
nsLo
anF
undi
ngG
rant
Fun
ding
Tfr
from RA
Ope
ratin
gR
even
ue
43
94. S
cn -
Mai
n R
plcm
ent N
E H
WY
(K
elly
St)
00
37,0
000
00
00
0
43
97. S
ewer
Mai
n C
CT
V40
,000
40,0
0040
,000
40,0
000
00
0-4
0,00
0
43
98. S
cn-B
ingl
e, A
skin
Ren
shaw
Mai
n0
055
,000
00
00
00
43
99. A
bn-S
egen
hoe
St M
ain
00
18,0
000
00
00
0
44
00. A
bn -
ST
P In
let u
pgra
de s
cree
ns85
,000
00
00
00
-8,3
82-7
6,61
8
Gra
ndT
otal
15,5
85,4
6015
,101
,060
11,9
35,0
609,
417,
731
-460
,000
-4,0
45,0
00-2
,861
,260
-3,1
74,2
18-5
,044
,982

2.5 Business and Commercial Activities
National Competition Policy
The National Competition Policy requires local government to apply the principles of competitive neutrality to its activities where these activities may be seen as competitive to commercial providers.
In accordance with the NSW Government Policy Statement for the Application of National Competition Policy to Local Government, the Upper Hunter Shire Council has two Category 1 Business Activities, with $2.0m and above in total annual operating revenues which must be separately reported for the purposes of competitive neutrality and to demonstrate any cross-subsidy or anti-competitive practices – Water Supplies and sewerage services.
Council is involved in one Category 2 Business Activities, with less than $2.0m total annual operating revenues where Council establishes the principle of competitive neutrality by applying full cost attribution to these services. These small business undertakings are managed on a commercial basis by applying corporate overheads and contributions appropriate to the scale and utilisation of overheads. This activity is a joint venture between all Hunter Councils for the provision of a Records Storage Facility at Thornton.
These activities are not included in Council’s Delivery Program and Operational Plan.
Council conducts a number of other activities that can be defined as business or commercial activities but are not classified as business units for the purpose of National Competition Policy. These activities are undertaken to provide a service and/or to generate income to supplement rating and other sources of income.
Aerodrome User fees and charges Service provision
Long Day Care Grants and user charges Service provision
Family Day Care Grants and user charges Service provision
Out Of School Hours Service (Scone) Grants and user charges Service provision
Plant Management Hire rates and charges Fund replacement program
Private works Private hire – contract rates and tenders
Supplement rating and other income
Saleyards (Scone) User fees Service provision
Waste Management User fees and charges Service provision
Aged Hostel Grants and user charges Service provision

2.6 Human Resources Activities
The Local Government Act 1993 (s403 (b)) requires particulars of “human resource activities (such as training programs) to be undertaken by the council”. Council resources its Human Resources by employing both a Human Resources Co-ordinator and a part-time Human Resources Assistant.
Council also has an obligation under the Work Health and Safety Act and related Regulations to ensure a safe work environment and implement safe systems of work. To assist in ensuring these obligations are met, Council employs a Work Health & Safety Co-ordinator and part-time Return – to – Work and WHS Co-ordinator.
Some specialist activities are undertaken by committees and other officers.
Staff recruitment is completed by individual Department and Division Managers.
Major objectives for 2013/14 are:
2.6.1 Industrial Relations, Salary system and Workplace Agreements
Monitor and review Council’s salary system and workplace agreement for the Upper Hunter Shire Council.Facilitate annual competency reviews utilising National Competency Standards where possible. Provide accurate information and training on human resources and industrial relations matters. Ensure that all staff are aware of any changes to industrial relations legislation which may affect them.Maintain positive and constructive relationships with employees and unions to ensure effective communication and in-house resolution of grievances.
2.6.2 Workforce Planning
Review Council’s current Workforce plan. Implement the strategies outlined in the plan.
2.6.3 Staff Administrative Principles and Policies
Review staff related administrative principles and policies to ensure that they are both current and relevant. Update and review all forms and procedures where necessary. Train managers and supervisors in requirements of HR administrative principles and policies.
2.6.4 Human Resources Information System
Continue implementation Human Resources module of Civica and ensure that data is up-to-date and current. Increase reporting capabilities to provide a greater capacity for providing relevant information to managers. Implement online recruiting process.
2.6.5 Equal Employment Opportunity
Review all policies, plans and procedures required for the effective management of EEO issues. Implement strategies from EEO Management Plan. Provide training and information to staff and management on the new and reviewed EEO policies. Formally train all new staff in EEO, bullying and harassment. Also provide training to supervisors and managers on bullying and harassment in the workplace.
2.6.5 Performance Management
Review Council’s new performance management system and review the effectiveness of the system.

2.6.6 Training Program
A Training Plan for 2013/14 will be developed from the competency assessments and performance reviews undertaken prior to July 2014, as well as staff-supervisor agreed training activities will be added as required. Develop and implement online training modules for Work Health and Safety, Code of Conduct and EEO. Training records will be maintained in the human resources module in Civica. These records will be utilised to assist in future timetabling of legislative training e.g. Traffic Controllers & First Aid. Continue to implement training plans to address future needs of Council and to facilitate staff progression within the salary system. Ensure statutory training requirements are met. Pro-actively seek alternatives for delivery of training to staff and Councillors to allow flexibility and cost reductions. Provide training to all members of the WHS & Consultative committees.
2.6.7 Work Health & Safety
Review Council’s Risk Assessment processes to ensure effectiveness and consistency. Continue the ongoing development of safe work method statements, particularly for tasks identified as high risk. Continue the development and implementation of a comprehensive WHS inspection regime. Provide feedback to management and the WHS Committee on inspection outcomes. Provide advice to Managers/supervisors to ensure working knowledge of employment practices, legislation and Council’s WHS systems. Review and ensure implementation of Council’s Work Health & Safety (WHS) Management System and associated WHS Handbook ensuring relevance and compliance with current legislation.Encourage early rehabilitation and return to work outcomes for staff and reduce the people and financial costs of workplace injuries and illness to Council. Continue the development and promotion of WHS in all work areas. Develop an ongoing program which is aimed at improving employee’s health & well being.
2.6.8 General
Monitor Council’s trainee and apprenticeship programs. Undertake staff survey.

2.7 Environmental Activities
2.7.1 Preparation of Comprehensive Local Environmental Plan
Council is progressing with the preparation of the Draft Upper Hunter Local Environmental Plan which involves a consolidation of the Scone, Merriwa and Murrurundi LEP’s. The new comprehensive LEP is expected to be finalised in 2013. The comprehensive LEP adopts the basis template and clauses of the standard instrument LEP and includes several additional natural resource provisions which will result in improved sustainability and biodiversity outcomes, through the protection of remnant vegetation and vulnerable groundwater aquifers and surface waterways.
2.7.2 Flood Studies
Council is progressively working towards preparing and updating Flood Studies for each of the main townships. The Aberdeen Flood Study will be finalised in 2013 and Council has applied for grant funding in 2013/14 from the Office of Environment and Heritage for the preparation of a Flood Risk Management Study and implementation of the Plan for Aberdeen.
2.7.3 Contaminated Lands
Council continues to identify areas and individual sites which are classified as contaminated or potentially contaminated by virtue of current or previous land uses. These sites consist mainly of service stations/vehicle repair, noxious industries, garbage tips and sewerage treatment works.
When a contaminated site is re-developed, Council requires that a site contamination report in accordance with SEPP55 is to be obtained which identifies the level and nature of contamination and the type of action necessary to remediate the site.
2.7.4 Energy Efficient Housing
BASIX legislation which commenced 01/07/05 is the primary method of ensuring energy efficient housing is designed and constructed. All development applications for new dwellings must include a BASIX certificate. This is also the case for major additions to dwellings. Council staff must ensure that legislative requirements are met at the initial application stage and also at final inspection stage for new dwellings.
The requirements of BASIX have in general been well received with any additional costs being returned in energy savings over a reasonable period of time to the home owner, as well as playing a part in reducing greenhouse emissions through such savings.
2.7.5 On-site Sewerage Management
Council continues to inspect on-site sewage management systems across the Shire in accordance with the Local Government (General) Regulation 2005. Through the implementation of an annual charge additional resources are being applied to undertaking inspections.
The inspections monitor the operation of systems and systems that are not functioning to acceptable standards based on a risk assessment, are required to be upgraded.
2.7.6 Effluent Reuse Strategies
Scone Sewage Treatment plant is currently 100% irrigation to land. The effluent at Murrurundi sewerage treatment plant is partially utilised on the sporting grounds. Options are being investigated for the reuse of effluent water from Aberdeen and Merriwa sewerage treatment works.
2.7.7 Waste Management Plan
A waste management plan is currently under development. In general terms the following proposals are being investigated and/or implemented:
1. Extension of the current landfills 2. The discontinuation of acceptance of waste from outside Council’s area. 3. Waste minimisation.

2.8 Access and Equity - Community Plan
Council’s Social/Community Plan recognises the needs of the community and provides and/or advocate for appropriate, accessible services and facilities for the benefit of the community. Community consultation will be held annually to keep the Community Plan updated.
The Social/Community Plan identifies actions to be undertaken by Council. These actions have been included in Council’s strategic plan and the priorities included in the relevant service level in part 4 of this document.
Access and Equity activities are any activities that aim to promote social justice and enhance community wellbeing. Council’s Access & Equity Plan is included as Attachment 2.
An access and equity activity is defined as one that assists Council to:
Promote fairness in the distribution of resources, particularly for those most in need; Recognise and promote people’s rights and improve the accountability of decision makers; Ensure that people have fairer access to the economic resources and services essential to meeting their basic needs and improving their quality of life; and, Give people better opportunities for genuine participation and consultation about decisions affecting their lives.
A summary of achievements over the preceding 12 months is provided in Council’s annual report.

Part 3 | Statement of Revenue Policy
3.1 Rates
For 2013/14, Council has applied to the Independent Pricing and Regulatory Tribunal (IPART) for a special rate variation of 2.5% per annum above the ratepegging limit for the next three years. For 2013/14, the ratepegging limit set by IPART is 3.4%.
The 2012/13 rates (cents in the $) and the proposed 2013/14 rates, including the 3.4% rate pegging limit and the proposed 2.5% special rate variation, for Upper Hunter Shire are shown in the following table:-
2012/13 Sub-Category
Category 2013/14Rate
(cents inthe $)
MinimumRate
EstimatedYield
%Yield
Rate(cents in
the $)
MinimumRate
EstimatedYield
%Yield
0.3636 $406 4,516,153 53.83 Farmland 0.3844 $474 4,798,187 53.87
0.4755 $439 374,636 4.47 Aberdeen Residential 0.504 $464 394,404 4.43
0.4755 $406 21,518 0.26 Cassilis 0.504 $430 21,930 0.25
0.4755 $439 227,022 2.71 Merriwa 0.504 $464 240,089 2.70
0.4755 $439 226,509 2.70 Murrurundi 0.504 $464 241,058 2.71
0.676 $458 1,702,103 20.29 Scone 0.7166 $474 1,804,978 20.27
0.4755 $406 691,253 8.24 Ordinary 0.504 $430 730,388 8.20
0.9248 $439 54,757 0.65 Aberdeen Business 0.98 $464 66,962 0.75
0.9248 $439 37,078 0.44 Merriwa 0.98 $464 37,956 0.43
0.9248 $439 26,751 0.32 Murrurundi 0.98 $464 28,342 0.32
0.9363 $458 303,552 3.62 Scone 0.9922 $474 321,070 3.60
0.4755 $406 132,666 1.58 Ordinary 0.504 $430 141,943 1.59
37.1119 $40 74,818 0.89 Mining 39.35 $40 79,330 0.89
Total Estimated Notional Yield - $8,388,817 Total Estimated Notional Yield - $8,906,638
Refer to Attachment 3 for rate category maps.

DEFINITIONS
Farmland
Land which is a parcel of rateable land valued as one assessment and its dominant use is for farming (that is, the business or industry of grazing, animal feedlots, dairying, pig farming, poultry farming, viticulture, orcharding, beekeeping, horticulture, vegetable growing, the growing of crops of any kind, forestry, oyster farming, or fish farming within the meaning of the Fisheries and Oyster Farm Act, 1935, or any combination of these businesses or industries) which:
a. has a significant and substantial commercial purpose or character, and b. is engaged in for the purpose of profit on a continuous or repetitive basis (whether or not a profit is
actually made) and is not rural residential land.
Residential
Land in the centres of population of Aberdeen, Cassilis, Merriwa, Murrurundi and Scone towns respectively (on maps displayed in the Council Chambers) which is valued as one rateable assessment and has:
a. its dominant use is for residential accommodation (otherwise than as a hotel, motel, guest house, boarding house or nursing home or any other form of residential accommodation prescribed by the regulations); or
b. in the case of vacant land it is zoned or otherwise designated for use under an environmental planning instrument (with or without development consent) for residential purposes.
Residential Ordinary
Land that is categorised “residential” throughout the whole of the Upper Hunter Shire area excepting that land which is categorised “residential” within the centres of population of Aberdeen, Cassilis, Merriwa, Murrurundi and Scone, as displayed on maps in the Council Chambers.
Business
Land which is not residential and is within the Aberdeen, Cassilis, Merriwa, Murrurundi and Scone centres of population as displayed on the maps in the Council Chambers.
Business Ordinary
Land which is not farmland, residential or mining and is not within the Aberdeen, Cassilis, Merriwa, Murrurundi and Scone centres of population as displayed on maps in the Council Chambers.
Mining
Parcels of rateable land valued as one assessment and its dominant use is for a coal mine or metalliferous mine.

3.2 Fees and Charges
3.2.1 Water charges
Council has adopted a 30 year Capital Works and Asset Replacement Program. In order to achieve that program the water annual access charges will increase by 3.4% in line with the IPART approved increase for general rates for 2013/14, and the water usage charges will increase by 7.5% being 4.1% plus the IPART approved increase of 3.4% for 2013/14.
Annual (access) Charge Aberdeen / Scone Cassilis / Merriwa Murrurundi
For all users (domestic, units/flats/apartments trunk main, commercial, industrial and non-rateable) based on water meter size:
20mm
25mm
32mm
40mm
50mm
80mm
100mm
200mm
2012/13
$290
$370
$468
$587
$728
$1,179
$1,473
$3,077
2013/14
$300
$383
$484
$607
$753
$1,219
$1,523
$3,182
2012/13
$290
$370
$468
$587
$728
$1,179
$1,473
$3,077
2013/14
$300
$383
$484
$607
$753
$1,219
$1,523
$3,182
2012/13
$361
$450
$598
$720
$893
$1,434
$1,877
$3,748
2013/14
$374
$465
$618
$745
$924
$1,483
$1,941
$3,875
Total Yield $909,315 $1,074,071 $174,716 $197,241 $167,138 $201,946
Each allotment of unconnected land on a rate assessment within 225m of water main and capable of connecting
$220 $228 $220 $228 $269 $278
Total Yield $45,100 $44,688 $18,260 $18,240 $42,435 $31,414
User Charges (per kilolitre)
Residential users –
domestic & trunk main users –
First 75 kl per quarter
Over 75 kl per quarter $1.48
$2.12
$1.59
$2.28
$1.48
$2.12
$1.59
$2.28
$1.79
$2.12
$1.93
$2.28
Kidney dialysis users $0.68 $0.74 $0.68 $0.74 $0.68 $0.74
Total Yield $992,085 $1,066,491 $148,778 $159,936 $111,934 $120,329
Non residential user - commercial, industrial & non-rateables
Scone Saleyards
Primo Aust Scone Abattoir
$1.18 $1.27 n/a n/a n/a n/a
Council parks, gardens, cemeteries and pools
$0.66 $0.71 $0.66 $0.71 $0.66 $0.71
Other $1.73 $1.86 $1.73 $1.86 $1.78 $1.91
Total Yield $658,234 $707,602 $55,710 $59,888 $18,072 $19,428

The annual (access) charge applies to each water service:
If a property has two water meters, then the customer will be invoiced for two annual charges. Each unit/flat/apartment will be invoiced for one annual charge. The strata or non-strata status of unit/flat/apartment does not affect the charge. Properties may consist of several allotments of land. The principle used for determining the number and type of annual charges is that where the allotments are capable of being separately connected and separately developed, then the customer will be invoiced for one annual charge for each allotment. Some examples of this principle are given below:
- Where a property consists of two allotments and the second allotment is not able to be separately developed (e.g. it might be in a designated flood plain), then the customer will be invoiced for one annual charge only.
- Where a property consists of two allotments with a house on one allotment and the other vacant, then the customer will be invoiced for one connected annual charge and one unconnected annual charge.
- Where a property consists of two allotments with a house (or other substantial improvement) built across the two allotments and the second allotment is not able to be separately developed, then the customer will be invoiced for one connected annual charge only.
Water usage is invoiced quarterly on the water accounts. A pro-rata charge will be calculated for water consumption when a water meter ceases to function, based on previous water consumption.
Council’s water pricing policy has been reviewed in line with the DEUS water pricing guidelines.
3.2.2 Sewerage Services
Council has adopted a 30 year Capital Works and Asset Replacement Program. In order to achieve that program sewer charges will increase by 3.4% in line with the IPART approved increase for general rates for 2013/14.
Annual (Access) Charge AAberdeen, Merriwa
Murrurundi and Scone
2012/13 22013/14
Residential inc. units/flats/ apartments $439 $$454
Total Yield $1,645,811 $$1,709,764
Each allotment of unconnected land within 75m of sewer main and capable of connecting.
$329 $$340
Total Yield $133,574 $$131,580
Commercial, industrial and non-rateables, the access charge is based on water meter size
20mm
25mm
32mm
40mm
50mm
80mm
100mm
$529
$664
$795
$1,064
$1,330
$2,127
$2,659
$547
$687
$822
$1,100
$1,375
$2,199
$2,749
Total Yield $241,294 $$249,099
User Charge
Residential $0 $$0
Commercial, Industrial and Non-rateables $0.82 per kilolitre x the discharge
factor (see over page)
$0.88 pper kilolitre xthe discharge
factor (see overpage)

The annual (access) charge applies to each sewer service:
Each unit/flat/apartment will be invoiced for one annual charge. The strata or non-strata status of unit/flat/apartment does not affect the charge. Properties may consist of several allotments of land. The principle used for determining the number and type of annual charges is that where the allotments are capable of being separately connected and separately developed, then the customer will be invoiced for one annual charge for each allotment. Some examples of this principle are given below:
- Where a property consists of two allotments and the second allotment is not able to be separately developed (e.g. it might be in a designated flood plain), then the customer will be invoiced for one annual charge only.
- Where a property consists of two allotments with a house on one allotment and the other vacant, then the customer will be invoiced for one connected annual charge and one unconnected annual charge.
- Where a property consists of two allotments with a house (or other substantial improvement) built across the two allotments and the second allotment is not able to be separately developed, then the customer will be invoiced for one connected annual charge only.
Capital Contributions
Contributions to Morse Street Sewer - $1,160 per annum
Capital Contribution for Morse Street area to be raised annually for 7 properties for a 20 year period. Final payment is due in 2025/26. There will be no CPI increase.
Trade Waste Charges
2012/13 Charge 22013/14 Charge
Annual Charges $349 $361
Multi installation (per equivalent tenement)
$349 $361
Application fee
Class 1 +2 $73.00 $75.00
Class 3 $755.00 $781.00
Re-inspection fee $105.00 $109.00
Non Compliance fee (per KL) $15.00 $16.00
Excess Mass charge for Class 3 discharges ($/kg)
Please refer to Attachment 1
(Fees & Charges Schedule)
Please refer to Attachment 1
(Fees & Charges Schedule)
Discharge Factors
Business Type Discharge Factor Business Type Discharge Factor
Bakery 0.95 Hotel 0.85
Bowling Club with bowling greens 0.45 Laundromat 0.92
Butcher 0.85 Motel 0.95
Cakes/Hot Bread 0.95 Nursing home 0.85
Caravan Park (for canteen/laundry) 0.50 Office 0.95
Car Detailing 0.95 Optometrist 0.95
Car Washing 0.95 Panel Beating/Spray Painting 0.95
Charcoal Chicken 0.95 Printer 0.85

Business Type Discharge Factor Business Type Discharge Factor
Club 0.85 Public Amenities Block 1.00
Chemical Industry 0.85 Restaurant 0.95
Coal Mine 1.00 School 0.50
College 0.50 Service Station 0.95
Cold Store 0.07 Shop 0.95
Concrete Batching Plant 0.02 Shopping Centre 0.85
Craft/Stonemason 0.95 Steam Laundry 0.65
Delicatessen 0.95 Swimming Pool 0.85
Dental Surgery 0.95 Takeaway Shop 0.95
Fresh Fish Outlet 0.95 Unit/flat/apartment 0.80
Hospital 0.85
3.2.3 Domestic Waste Management Charges
In accordance with s496 of the Act, Council is proposing to strike the following annual charges for the provision of waste management services for each assessment of rateable land and improved non-rateable land, for which the weekly or fortnightly (rural areas) service is available.
2012/13 22013/14
Users Per Annum
Yield CCategory Users PerAnnum
Yield
DOMESTIC
3,402 $306.00 $1,041,012 Aberdeen, Scone, villages *1 3,424 $316.00 $1,081,984
516 $328.00 $169,248 Cassilis, Merriwa 518 $339.00 $175,602
506 $300.00 $151,800 Blandford, Murrurundi 508 $310.00 $157,480
4,400 $38.60 $169,840 State Government Levy *2 4,423 $52.40 $231,765
VACANT LAND
232 $76.00 $17,632 Aberdeen, Gundy, Parkville, Scone, Wingen 221 $79.00 $17,459
27 $40.00 $1,080 Bunnan, Moonan Flat (fortnightly service) 27 $40.00 $1,080
98 $76.00 $7,448 Cassilis, Merriwa 94 $79.00 $7,426
92 $76.00 $6,992 Blandford, Murrurundi 85 $79.00 $6,715
RECYCLING
4,536 $92.00 $417,312 Aberdeen, Blandford, Bunnan, Cassilis, Gundy, Merriwa, Moonan, Murrurundi, Parkville, Scone and Wingen
4,566 $95.00 $433,770
Domestic charges include rateable and non rateable assessments. Pro-rata charges are applied.
*1 Villages serviced by domestic waste management kerbside collection - Bunnan, Gundy, Moonan Flat, Moonan Brook, Parkville, Wingen.
*2 State waste levy increases by $10.00 plus cpi each year for the next 3 years

3.2.4 Non-Domestic Waste Management Charges
In accordance with s501 of the Act, Council is preparing to strike the following annual charges for the provision of waste management services for each assessment of rateable land and improved non-rateable land.
*1 The category “Environmental Waste Control” is a charge applicable to rural areas and is for following up illegal rubbish dumping, access to Council tips, litter control, roadside public bins and education activities. It is in addition to all othercharges in Sections 3.2.3 & 3.2.4.
*2 State waste levy increases by $10.00 plus cpi each year for the next 3 years
*3 Subject to clarification on GST.
3.2.5 Stormwater Charges
A charge is raised in accordance with the Local Government Amendment (Stormwater) Act 2005. An annual amount of $25.00 will be charged on all non-vacant urban residential and business properties ($12.50 per strata lot). The funds will be used for the development of appropriate Stormwater Management Plans and additional stormwater projects over and above the average level previous funded from Council’s General Funds.
3.2.6 Onsite Sewerage Management Administration Charge
This charge is for all ratepayers who have an onsite sewerage system on their property. The charge is a monitoring and inspection charge of $34.00 per annum per onsite sewerage management system. There will be no fee attributable to initial inspections of OSSMs carried out, however a fee will be charged if a further inspection is required to be undertaken. Funds raised will be used to enhance the monitoring and operation of Onsite Sewerage Management Systems throughout the local government area, and to better comply with the necessary legislative requirements, and most importantly improve environmental outcomes.
2012/13 22013/14
Users Per Annum
Yield
$
Category Users PerAnnum
Yield
$
COMMERCIAL *3
211 $306.00 $64,566 Aberdeen, Scone, villages 214 $358.00 $76,612
99 $328.00 $32,472 Cassilis, Merriwa 98 $356.00 $34,888
70 $300.00 $21,000 Blandford, Murrurundi 71 $327.00 $23,217
373 $38.60 $14,398 State Government Levy *2 373 $52.40 $19,545
ENVIRONMENTAL WASTE CONTROL*1
2,374 $40.00 $94,960 All rural areas 2,359 $41.00 $96,719
2012/13 22013/14
No of
Assessments
Rate Anticipated Yield NNo of
Assessments
Rate Anticipated Yield
3,593 $25.00 $89,825 3,612 $25.00 $90,300
178 Strata Lots $12.50 $2,225 180 Strata Lots $12.50 $2,250
2012/13 22013/14
No of
Assessments
Rate Anticipated Yield NNo of
Assessments
Rate Anticipated Yield
2,467 $33.00 $81,411 2,459 $34.00 $83,606

Those ratepayers who have only one system will not be charged for their initial inspection by Council officers. Any required follow up inspections or inspection of second or additional OSSM systems will be charged at a reduced fee of $48 per system / inspection.
3.2.7 Miscellaneous Fees & Charges
Introduction
Each year, Council is required to determine fees and charges for services it provides.
The fees and charges are made up of fees provided under relevant Acts, fees determined by Council and also recommendations from the Local Government and Shires Associations of NSW.
Section 608 (1) of the Local Government Act 1993, provides that "a Council may charge and recover an approved fee for any service it provides..."
Subsection 2 describes the services for which an approved fee may be charged. These include:
* Supplying a service, product or commodity. * Giving information. * Providing a service in connection with the exercise of a Council’s regulatory functions - including receiving an
application for approval, granting an approval, making an inspection or issuing a certificate. * Allowing admission to any building or enclosure.
Section 610. Effect of other Acts
“(1) If the amount of a fee for a service is determined under another Act:
(a) a Council may not determine an amount that is inconsistent with the amount determined under the other Act, and
(b) a Council may not charge a fee in addition to the amount determined under the other Act.”
“(2) If the charging of a fee for a service is prohibited under another Act, a Council must not charge a fee for the service under this Act.”
How does Council determine the amount of a fee for a service?
Section 610D(1) provides "a Council, if it determines the amount of an approved fee for a service, must take into consideration the following factors:
* the cost to the Council of providing the service. * the price suggested for that service by any relevant industry body or in any schedule of charges published,
from time to time, by the Department. * the importance of the service to the community. * any factors specified in the regulations.
Section 610D(2) states "that the cost to the Council of providing a service in connection with the exercise of a regulatory function need not be the only basis for determining the approved fee for that service". Further "a higher fee or an additional fee may be charged for an expedited service provided, for example, in a case of urgency".
Attachment 1 of this Delivery Program and Operational Plan sets out the range of miscellaneous fees and charges determined by Council in accordance with Section 608 of the Local Government Act, 1993.
Council may vary any such fee or charge or determine a new fee or charge subject to the statutory period of 28 days exhibition and consideration of public comment, prior to adoption.
Charges under Sections 501 and 502, Local Government Act 1993
Charges referred to in these sections relating to Domestic Waste Management and Water charges are detailed in sections 3.2.1 and 3.2.2 above.

Goods and Services Tax (GST)
From 1st July 2000, a goods and services tax (GST) applied to a number of goods and/or services supplied by Council.
Those goods and/or services that are subject to GST have been identified in the attached Schedule of Fees and Charges as such and the prices shown for those goods and/or services are the GST inclusive price.
Some goods and/or services supplied by Council have been declared “GST free” or are excluded under Division 81 of the legislation. Those goods and/or services which are “GST free” or excluded from GST are indicated in the Schedule of Fees and Charges as GST not applying
Refund Policy
Fees and charges are generally for goods and services provided and therefore not refundable. However, Council has the following policies on refunds:
Development Application Fee
Council charges a minimum advertising fee for development applications and the fee are fixed annually. No refund of development application fees paid is to be made, except where a development application has been lodged and none is required. The advertising fee may be refunded if an application is withdrawn prior to the proposed development application being advertised.
Reduced or Waived Fees
Reduced fees apply in certain cases. Waiving of fees may be considered in certain cases.

3.3 Hardship Policy for Rates and Charges
UPPER HUNTER SHIRE COUNCIL RATES AND VALUATIONS – POLICY – Hardship
Policy
1. Council may write off interest charges in accordance with an arrangement to finalise a debt owed to Council by a ratepayer who is suffering personal financial hardship under sections 564 and 567 of the Local Government Act 1993.
2. The General Manager has delegated authority from Council to write off amounts up to $1,000.00. The Director Corporate Services has delegated authority from Council to write off amounts up to $300.00.
3. The General Manager and Director Corporate Services may determine whether a ratepayer is suffering personal financial hardship.
4. Under section 577 of the Local Government Act 1993, Council may write off rates due to hardship where a pensioner is solely responsible for the rates on a property.
5. Under section 601 of the Local Government Act 1993, Council may write off rates due to hardship in the first year of new valuations. In general, no rates are written off by Council in relation to the personal financial hardship of ratepayers in these circumstances.
Objective
To clearly state the circumstances under which Council will consider the personal financial hardship of ratepayers.
Procedures/Practice
A ratepayer who is suffering personal financial hardship may apply to Council to pay a debt to Council by making regular payments in order to finalise that debt. Council or the General Manager or Director Corporate Services under delegated authority from Council may write off interest if they are of the view that the ratepayer is suffering genuine personal financial hardship.
References
Local Government Act 1993 Delegations of Authority from Council This policy was adopted by Council at its meeting on 25 February 2013. It replaces that of the
same name adopted by Council at its meeting on 28 September 2009.
Review Date
October 2016 by Senior Revenue Officer.
Authorised by: ………………………………………………… ................................. Daryl Dutton, General Manager Date

3.4 Pricing Policies for Services and Private Works
3.4.1 Level of Charges
In determining an appropriate level of user charges, Council shall consider:-
a. the full cost of providing the service; b. market rates applicable for comparable goods, services or works; c. the implication of charges for encouraging rational choice by users; and, d. the impact of charges on the achievement of social objectives implicit in service delivery
Whilst the supplier is required to firstly determine rates which will recover the full costs of providing the service, a user charge rate based on full costs may not be appropriate where: -
a. an active market exists for the goods, services or works and where the higher of full cost or market price shall apply;
b. the supplier operates as a business or quasi-business undertaking and is seeking to utilise spare capacity, in which case normal commercial pricing considerations shall prevail; and
c. the Government has directed that a particular price or charge rate, or method for determining the same, shall apply.
3.4.2 User Charging will not apply where:
a. no improvement to resource allocation will result; b. the government has directed that goods and services will be provided without charge; c. the transaction is of a "one off" nature and immaterial in amount; or, d. the ongoing administrative costs of charging exceed the expected long term efficiency gains.
3.4.3 Full Costs
Full costs shall reflect the opportunity cost of resources employed and will include, but need not be restricted to:-
a. direct and indirect labour and management costs (including accruing staff entitlements, workers compensation etc);
b. materials (including oncosts to cover handling and holding costs etc); c. capital charges (including rent or hire charges etc or as the case requires, an appropriate depreciation
charge and interest at the prevailing long term bond rate on the depreciated current value of assets employed); and
d. such general margin as may be appropriate.
3.4.4 Rounding
Rounding of resultant calculations are performed on a consistent basis. As a general rule, rounding should be applied as follows:
Up to and including $10 nearest 10¢ Over $10 and up to and including $50 nearest 50¢ Over $50 and up to and including $100 nearest $1 Over $100 nearest $5
While the application of rounding may result in an increase for some items above the Consumer Price Index (CPI), the opposite should be true for other items.
3.4.5 Frequency of Review
As a general rule, fees and charges should be reviewed annually. However, practical or policy considerations (including prevailing market conditions, accepted industry practice, government policy determination) may dictate that reviews be more or less frequent.
Council reserves the right to vary its charges at any time, subject to advertising and consideration of submissions.

3.4.6 Private Works
Council undertakes private works as a service to its residents and ratepayers and to assist in the utilisation of Council’s plant and equipment. Council’s position in relation to charging for works on private lands is:
“Where work is carried out on private property by Council labour, utilising materials purchased by Council, the work is charged at actual costs, together with a loading on wages to cover overheads. An additional percentage is added to the total so derived to cover administrative expenses.”
Council undertakes a wide range of private works such as access construction, grading of private roadworks, driveways, mowing/slashing and construction of subdivisions and carparks.
Council also submits competitive bids for commercial projects within the Upper Hunter Shire area.
To improve the utilisation of its plant fleet, Council also hires its plant together with operator, to external clients on a commercially competitive basis. External hire rates for Council plant are included as Attachment 1 (Fees and Charges Schedule).

3.5 Proposed Borrowings
All Loans are secured as per Council’s Loans Policy.
Schedule of Loan Repayments 2013/14
General Fund
LoanNo.
Purpose Institution MaturityDate
InterestRate
OriginalPrincipal
PrincipalOwing at
1/7/13
Principal tobe repaid2013/14
Interest tobe repaid2013/14
1 UH Early Learning Centre
NAB 30/4/2029 6.68% $720,000 643,397 23,563 41,772
2 Medical Centre WBC 30/04/2034 6.90% $1,400,000 1,225,461 27,396 83,248
3 Administration Centre
NAB 30/4/2029 6.37% $3,100,000 2,759,557 103,803 170,644
4 Medical Centre extension
NAB 01/07/2030 8.10% $350,000 328,574 9,373 26,018
5 Saleyards NAB 24/06/2031 7.74% $1,000,000 960,539 25,680 72,229
6 Airport runway NAB 24/06/2031 7.74% $550,000 528,296 14,124 39,726
7 Bridges (Barsham, Timor Crk, Scotts Crk)
NAB 24/06/2031 7.74% $1,300,000 1,248,701 33,384 93,897
9.1* LIRS Round 1 - Timber Bridges Replacement Program
NAB 01/03/2023 5.19% $1,675,000 1,664,708 133,543 81,600
9.2* LIRS Round 1 - Urban Streets Renewal/Upgrade Program
NAB 01/03/2023 5.19% $1,540,000 1,530,508 122,777 75,022
10.1** LIRS Round 2 – BridgereplacementProgram
TBA 31/07/2023 5.50% est $1,015,000 Funded 2013/2014
58,405 41,073
10.2** LIRS Round 2 RoadsRenewal/Upgrade Program
TBA 31/07/2023 5.50% est $1,000,000 Funded 2013/2014
57,541 40466
11 Middlebrook BridgeReplacement
TBA 31/07/2037 NK $815,000 Funded 2017/2018
-
Total $609,589 $765,695
* Subject to a NSW Government LIRS subsidy of 4% ** Subject to approval under the NSW Government LIRS second round with a Subsidy of Interest (3%) Should Council not proceed with the proposed Special Rate Variation, Council will not proceed with
the proposed subsidised borrowing under LIRS Round 2.
Debt Service Percentage General Fund (2012) 2.75% (2013) 3.53% (2014) 5.19%

Water Fund
LoanNo
Purpose Institution MaturityDate
InterestRate
OriginalPrincipal
PrincipalOwing at
1/7/13
Principal tobe repaid2013/14
Interest tobe repaid2013/14
8 Glenbawn Dam Augmentation – Pipeline
NAB 29/06/2032 6.19% $4,400,000 $4,305,839 $122,114 $261,318
3 Glenbawn Dam Augmentation –Treatment Plant
TBA 31/07/2034 NK $2,200,000 Funded 2014/2015
- -
4Glenbawn Dam Augmentation – WTP Backfeed
TBA 31/07/2035 NK $1,600,000 Funded 2015/2016
- -
Total $122,114 $261,318
Debt Service Percentage Water Fund (2012) 0% (2013) 12.48%
(2014) 10.20% Overall Council Debt Service Percentage (2012) 2.20% (2013) 4.29% ((2014) 5.38%

3.6 Budget Summary & Income Statement
RevisedBudget
2012/13
2013/14DPOP
Budget2014/15Budget
2015/16Budget
2016/17Budget
General FundOperating Revenue
Administration (1,263,800) (1,159,338) (1,242,338) (1,402,338) (1,523,338)
Community Services & Education (2,705,209) (2,830,280) (2,699,227) (2,699,227) (2,774,227)
Economic Affairs (3,394,015) (3,719,234) (3,106,024) (2,659,424) (2,458,924)
Environment (3,240,544) (3,358,503) (3,358,503) (3,358,503) (3,358,503)
General Purpose Revenues (11,283,783) (10,585,593) (12,053,002) (12,278,302) (12,278,302)
Health (107,330) (112,900) (112,900) (112,900) (112,900)
Housing & Community Amenities (586,337) (671,300) (581,300) (581,300) (581,300)
Mining, Manufacturing & Construction (210,500) (215,100) (215,100) (215,100) (215,100)
Public Order & Safety (565,446) (453,440) (453,440) (453,440) (453,440)
Recreation & Culture (346,162) (1,462,452) (578,452) (399,452) (273,452)
Transport & Communication (9,249,714) (6,565,683) (7,004,833) (6,838,610) (6,807,485)
Total Operating Revenue (32,952,840) (31,133,823) (31,405,119) (30,998,596) (30,836,971)
Non Operating Revenue
Administration (6,347,611) (6,433,925) (6,440,525) (6,326,263) (6,226,525)
Agriculture (35,387) 0 0 0 0
Community Services & Education (230,320) (235,752) (182,963) (117,295) (99,553)
Economic Affairs (1,507,321) (385,249) (795,080) (265,911) (225,643)
Environment (543,877) (795,182) (373,339) (312,019) (312,019)
General Purpose Revenues (1,191,524) (1,247,609) 0 0 0
Governance (65,000) 0 0 0 (75,000)
Health (15,000) 0 0 0 0
Housing & Community Amenities (100,208) (92,288) (58,809) (57,922) (49,809)
Mining, Manufacturing & Construction (583,949) (567,949) (567,949) (567,949) (567,949)
Public Order & Safety (80,066) (55,684) (59,174) (59,174) (59,174)
Recreation & Culture (844,207) (1,355,626) (966,426) (1,021,926) (827,197)
Transport & Communication (12,114,329) (12,459,588) (6,812,201) (6,851,201) (6,596,201)
Total Non Operating Revenue (23,658,799) (23,628,852) (16,256,466) (15,579,660) (15,039,070)
Operating Expenditure
Administration 4,611,547 4,902,595 4,881,219 4,868,594 4,860,491
Agriculture 24,424 0 0 0 0
Community Services & Education 3,080,728 3,258,088 3,058,612 3,043,261 3,041,315
Economic Affairs 1,935,577 2,077,836 1,990,800 1,955,070 1,931,357
Environment 3,278,567 3,338,190 3,322,740 3,347,740 3,322,740
General Purpose Revenues 41,762 42,957 42,957 42,957 42,957
Governance 669,178 601,518 601,268 601,268 701,268
Health 245,505 226,243 226,243 226,243 226,243
Housing & Community Amenities 1,171,510 1,247,124 1,092,158 1,092,158 1,092,158
Mining, Manufacturing & Construction 758,245 826,812 826,812 826,812 826,812
Public Order & Safety 972,844 978,059 981,549 981,549 981,549
Recreation & Culture 3,044,031 3,327,291 3,331,191 3,315,191 3,331,191
Transport & Communication 16,593,526 16,315,675 16,250,681 16,224,343 16,195,295
Total Operating Expenditure 36,427,444 37,142,388 36,606,230 36,525,186 36,553,376
Upper Hunter Shire Council2013/14 - 2016/17
Delivery Program & Operational Plan

RevisedBudget
2012/13
2013/14DPOP
Budget2014/15Budget
2015/16Budget
2016/17Budget
Upper Hunter Shire Council2013/14 - 2016/17
Delivery Program & Operational Plan
Non Operating Expenditure
Administration 530,308 379,066 396,350 116,877 852,941
Community Services & Education 154,382 53,940 50,099 63,673 65,523
Economic Affairs 139,428 2,317,208 121,065 716,026 208,971
Environment 497,869 240,330 473,937 557,617 532,617
General Purpose Revenues 1,257,609 10,000 10,000 10,000 10,000
Governance 0 25,000 25,000 25,000 0
Housing & Community Amenities 155,050 154,613 152,500 154,613 152,500
Mining, Manufacturing & Construction 58,082 61,788 81,788 81,788 81,788
Public Order & Safety 3,696 0 0 0 0
Recreation & Culture 73,748 48,432 48,432 48,432 48,432
Transport & Communication 4,167,006 1,192,559 775,459 781,795 810,845
Total Non Operating Expenditure 7,037,178 4,482,936 2,134,630 2,555,821 2,763,617
Capital Expenditure
Administration 2,636,095 2,569,000 2,546,000 2,915,000 2,283,300
Community Services & Education 51,324 137,200 180,200 99,200 151,000
Economic Affairs 3,367,190 264,900 2,382,000 827,000 1,117,000
Environment 394,884 990,000 360,000 205,000 290,000
Governance 10,000 5,000 2,000 2,000 2,000
Health 872 0 0 0 0
Housing & Community Amenities 58,771 40,000 63,000 60,000 65,000
Mining, Manufacturing & Construction 60,000 70,000 50,000 50,000 50,000
Public Order & Safety 175,900 90,000 100,000 90,000 90,000
Recreation & Culture 509,109 1,833,360 768,860 586,860 326,131
Transport & Communication 5,877,112 7,164,000 2,476,000 2,690,000 2,216,300
Total Capital Expenditure 13,141,257 13,163,460 8,928,060 7,525,060 6,590,731
Total General Fund (5,760) 26,109 7,335 27,811 31,683

RevisedBudget
2012/13
2013/14DPOP
Budget2014/15Budget
2015/16Budget
2016/17Budget
Upper Hunter Shire Council2013/14 - 2016/17
Delivery Program & Operational Plan
Sewer FundOperating Revenue
Sewerage Services (2,676,989) (2,590,183) (2,590,183) (2,590,183) (2,590,183)
Total Operating Revenue (2,676,989) (2,590,183) (2,590,183) (2,590,183) (2,590,183)
Non Operating Revenue
Sewerage Services (906,041) (1,004,252) (865,667) (865,667) (865,667)
Total Non Operating Revenue (906,041) (1,004,252) (865,667) (865,667) (865,667)
Operating Expenditure
Sewerage Services 2,636,461 2,629,814 2,629,814 2,629,814 2,629,814
Total Operating Expenditure 2,636,461 2,629,814 2,629,814 2,629,814 2,629,814
Non Operating Expenditure
Sewerage Services 474,838 211,621 499,036 504,036 442,036
Total Non Operating Expenditure 474,838 211,621 499,036 504,036 442,036
Capital Expenditure
Sewerage Services 475,161 753,000 327,000 322,000 384,000
Total Capital Expenditure 475,161 753,000 327,000 322,000 384,000
Total Sewer Fund 3,430 0 0 0 0

RevisedBudget
2012/13
2013/14DPOP
Budget2014/15Budget
2015/16Budget
2016/17Budget
Upper Hunter Shire Council2013/14 - 2016/17
Delivery Program & Operational Plan
Water FundOperating Revenue
Water Supplies (6,292,698) (4,948,425) (7,134,425) (5,865,225) (5,617,425)
Total Operating Revenue (6,292,698) (4,948,425) (7,134,425) (5,865,225) (5,617,425)
Non Operating Revenue
Water Supplies (2,827,487) (848,682) (2,954,870) (2,608,346) (1,991,682)
Total Non Operating Revenue (2,827,487) (848,682) (2,954,870) (2,608,346) (1,991,682)
Operating Expenditure
Water Supplies 3,420,367 3,365,474 3,498,849 3,574,380 3,559,767
Total Operating Expenditure 3,420,367 3,365,474 3,498,849 3,574,380 3,559,767
Non Operating Expenditure
Water Supplies 1,113,112 762,633 744,446 811,191 1,606,340
Total Non Operating Expenditure 1,113,112 762,633 744,446 811,191 1,606,340
Capital Expenditure
Water Supplies 4,586,706 1,669,000 5,846,000 4,088,000 2,443,000
Total Capital Expenditure 4,586,706 1,669,000 5,846,000 4,088,000 2,443,000
Total Water Fund 0 0 0 0 0
TOTAL (2,330) 26,109 7,335 27,811 31,683

2014Operating Revenues $'000Rates & Annual Charges 11,674 User Fees & Charges 11,661 Interest Received 1,289 Grants & Contributions - Operating 4,951 Grants & Contributions - Capital 3,101 Other Operating Revenues 3,000 Total Operating Revenues 35,675
Operating ExpensesEmployee Costs 12,932 Materials & Contracts 10,734 Depreciation 10,900 Interest Charges/Borrowing Costs 1,027 Other Operating Expenses 6,276 Total Operating Expenses 41,870
Operating Result Surplus/(Deficit) (6,194)
Operating Result Before Capital Amounts Surplus/(Deficit) (9,295)
RECONCILIATION TO BUDGET SUMMARY
Operating Result Surplus/(Deficit) (6,194)
Add back expenses not involving flows of fundsDepreciation 10,900 Increase in employee leave entitlements 20 Subtotal 10,920
Add non-operating funds employedCarrying amount of assets sold 712 Carrying amount of real estate assets sold 1,760 Plant income 4,350 Transfers from restricted assets 7,158 Loan Funds 2,015 Subtotal 15,995
Subtract funds deployed for non operating purposesAcquisition of Assets - Plant 2,292 Development of Real Estate - Acquisition of Assets - Other 13,293 Repayments of loans 732 Transfers to Restricted Assets 4,430 Subtotal 20,747
Estimated Budget Result Surplus/(Deficit) (26)
INCOME STATEMENT FORECAST for year ended 30 June 2014

Part 4 | Details of Budget 2013/14 to 2016/17
4.1 Budget Commentary and Trend Analysis
The 2013/14 budget has been prepared on the basis of a 5.90% rate increase for the General Fund including a Special Rate Variation of 2.50%.
The budget, inclusive of the 5.90% increase, results in a minor cash deficit of $24,109 in 2013/14. The predicted cash results for 2014/15, 2015/16 and 2016/17 are subject to further reviews and include further special rate variations to the rate pegging limit of 2.50% for both 2014/15 and 2015/16
Graph 4.1 below outlines the level of working funds over time with a target level of funds for future years. The forecast level of working funds is satisfactory to meet the needs of Council.
GRAPH 4.1
Restricted assets (reserves) have been established for particular purposes and represent prudent financial management. Graph 4.2 below charts the level of these restricted assets over time. Council had internal restrictions of $10.5m at 30 June 2012. At its March 2013 meeting, the Finance Committee noted that the internal restrictions were forecast to be $6.7m at 30 June 2013. This decrease was planned and resulted from accumulation construction of Aberdeen Land Development in 2012/13 with sales in both 2012/13 and 2013/14 and the early payment of part of 50% of Council’s Financial Assistance Grant for 2013/14 in the previous year.
The budget for 2013/14 provides for a continued satisfactory level of restricted assets and a continued focus on roads and bridges. The fast tracking of capital works through the Local Infrastructure Renewal Scheme will have substantial improvement on Council’s Road and Bridge Network.
0
5,000,000
10,000,000
15,000,000
20,000,000
200920102011201220132014201520162017201820192020202120222023
Net Current Assets & Non-current Cash and Investments - General Fund
Forecast Net Current Asset Position

GRAPH 4.2
4.1.1 Aberdeen and Scone Water Fund
User fees have generally increased by 7.5% in line with cost increases and recommendations from the independent review of Council’s Water and Sewerage long term plans. Major infrastructure works being the augmentation commenced in 2011/12 and stage 1 was completed in 2012/13. The next phase of the major works will be the construction of a Treatment Plant in Scone and the back feed to Aberdeen, these projects are planned to be completed over the next 3 to 4 years. Accumulated reserves will be utilised along with a NSW State Government subsidy and loans.
4.1.2 Cassilis and Merriwa Water fund
User fees have generally increased by 7.5% in line with inflation cost increases and recommendations from the independent review of Council’s Water and Sewerage long term plans. This fund will be in a re-building phase over the next few years following major capital works four years ago.
4.1.3 Murrurundi Water Fund
User fees have generally increased by 7.5% in line with cost increases and recommendations from the independent review of Council’s Water and Sewerage long term plans. Normal levels of capital works are programmed with a transfer back to reserves after increased levels in past years.
4.1.4 Aberdeen and Scone Sewer Fund
User fees have generally increased by 3.4% in line with cost increases and recommendations from the independent review of Council’s Water and Sewerage long term plans. Numerous capital works are planned for 2013/14 but additional funds raised will result in an increase in the reserves held in the fund for future necessary works.
4.1.5 Merriwa Sewer Fund
User charges have generally increased by 3.4% in line with cost increases and recommendations from the independent review of Council’s Water and Sewerage long term plans. Some additional one off works are planned for 2013/14 which will result in funds being transferred from the reserves held in this fund. It is expected that future years will return to the normal transfer to reserves which will be required for future infrastructure works.
4.1.6 Murrurundi Sewer Fund
User charges have generally increased by 3.4% in line with cost increases and recommendations from the independent review of Council’s Water and Sewerage long term plans. Only minor capital works are planned for 2013/14 which will result in funds being transferred to the reserves held in this fund which will be required for future infrastructure works.
0
2,000,000
4,000,000
6,000,000
8,000,000
10,000,000
12,000,000
200920102011201220132014201520162017201820192020202120222023
Internal Restrictions on Cash Assets - General Fund Total Internal Restrictions
TotalRestrictions other than ELE & Plant
Employees Leave Entitlements
PlantReplacement

4.2 General Fund - Budgets and Services
ADMINISTRATION
AGRICULTURE
COMMUNITY SERVICES & EDUCATION
ECONOMIC AFFAIRS
ENVIRONMENT
GENERAL PURPOSE REVENUES
GOVERNANCE
HEALTH
HOUSING & COMMUNITY AMENITIES
MINING, MANUFACTURING & CONSTRUCTION
PUBLIC ORDER & SAFETY
RECREATION & CULTURE
TRANSPORT & COMMUNICATION

ADMINISTRATION
Summary ........................................................................ 73
Asset Management .................................................... 74
Corporate Services ..................................................... 76
Depot Operations ...................................................... 78
Financial Services ........................................................ 80
General Management ............................................... 83
Human Resources ...................................................... 85
Information Services .................................................. 87
Plant Services ............................................................... 89
Revenue Services ........................................................ 91
Stores/Purchasing Services ...................................... 93
Technical Support Services ...................................... 95
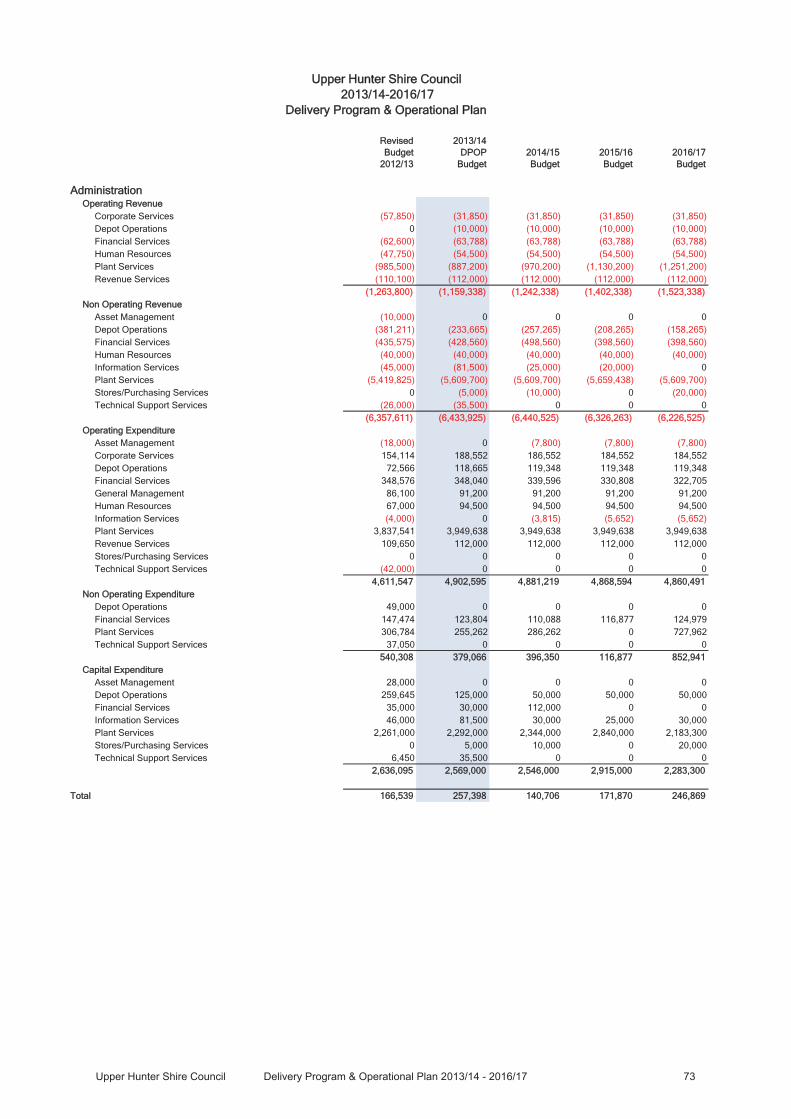
RevisedBudget
2012/13
2013/14DPOP
Budget2014/15Budget
2015/16Budget
2016/17Budget
AdministrationOperating Revenue
Corporate Services (57,850) (31,850) (31,850) (31,850) (31,850) Depot Operations 0 (10,000) (10,000) (10,000) (10,000) Financial Services (62,600) (63,788) (63,788) (63,788) (63,788) Human Resources (47,750) (54,500) (54,500) (54,500) (54,500) Plant Services (985,500) (887,200) (970,200) (1,130,200) (1,251,200) Revenue Services (110,100) (112,000) (112,000) (112,000) (112,000)
(1,263,800) (1,159,338) (1,242,338) (1,402,338) (1,523,338)Non Operating Revenue
Asset Management (10,000) 0 0 0 0 Depot Operations (381,211) (233,665) (257,265) (208,265) (158,265) Financial Services (435,575) (428,560) (498,560) (398,560) (398,560) Human Resources (40,000) (40,000) (40,000) (40,000) (40,000) Information Services (45,000) (81,500) (25,000) (20,000) 0 Plant Services (5,419,825) (5,609,700) (5,609,700) (5,659,438) (5,609,700) Stores/Purchasing Services 0 (5,000) (10,000) 0 (20,000) Technical Support Services (26,000) (35,500) 0 0 0
(6,357,611) (6,433,925) (6,440,525) (6,326,263) (6,226,525)Operating Expenditure
Asset Management (18,000) 0 (7,800) (7,800) (7,800) Corporate Services 154,114 188,552 186,552 184,552 184,552 Depot Operations 72,566 118,665 119,348 119,348 119,348 Financial Services 348,576 348,040 339,596 330,808 322,705 General Management 86,100 91,200 91,200 91,200 91,200 Human Resources 67,000 94,500 94,500 94,500 94,500 Information Services (4,000) 0 (3,815) (5,652) (5,652) Plant Services 3,837,541 3,949,638 3,949,638 3,949,638 3,949,638 Revenue Services 109,650 112,000 112,000 112,000 112,000 Stores/Purchasing Services 0 0 0 0 0 Technical Support Services (42,000) 0 0 0 0
4,611,547 4,902,595 4,881,219 4,868,594 4,860,491Non Operating Expenditure
Depot Operations 49,000 0 0 0 0 Financial Services 147,474 123,804 110,088 116,877 124,979 Plant Services 306,784 255,262 286,262 0 727,962 Technical Support Services 37,050 0 0 0 0
540,308 379,066 396,350 116,877 852,941Capital Expenditure
Asset Management 28,000 0 0 0 0 Depot Operations 259,645 125,000 50,000 50,000 50,000 Financial Services 35,000 30,000 112,000 0 0 Information Services 46,000 81,500 30,000 25,000 30,000 Plant Services 2,261,000 2,292,000 2,344,000 2,840,000 2,183,300 Stores/Purchasing Services 0 5,000 10,000 0 20,000 Technical Support Services 6,450 35,500 0 0 0
2,636,095 2,569,000 2,546,000 2,915,000 2,283,300
Total 166,539 257,398 140,706 171,870 246,869
Upper Hunter Shire Council2013/14-2016/17
Delivery Program & Operational Plan

AAsssseett MMaannaaggeemmeennttCOMMUNITY STRATEGIC OBJECTIVES (CSO’S)
Provide for replacement and improvement of community infrastructure through best practice and risk management.
Develop economic and intergenerational plans for future infrastructure needs
Provide secure portable water supply and sewerage services to meet the demands of future generations to urban areas of the shire
Connect our communities through activities and events, online technologies and infrastructure
Encourage and implement systems for minimization of the environmental footprint of the Shire, including energy efficiency and consumption of natural resources
Encourage an open and participatory Council, with an emphasis on community engagement, action and response
Effectively and efficiently manage the business of the Council within its Charter
OBJECTIVE
Establish and maintain assets which enhance the public domain and improve the amenity of the Shire.
MAJOR ACTIVITIES
Managing the public and civil liability exposure of the department.
Develop a comprehensive maintenance strategy for all Council assets.
Develop and maintain Future Works Program.
Provide Project Development & Designs for capital works programs.
PERFORMANCE INDICATORS AAnticipated2012/13
Estimate/Target2013/14
Workload: RRisk management of assets under department’s control. Minimise public liability exposure. Achieved Achieved
Effectiveness: Manage the implementation and maintenance of Best Practices into asset management within the department.
90% 90%
Efficiency: Overall Risk Management Audit result > 70% compliance
> 70% compliance
Service: (YTD) No. of designs completed YTD
No. of outstanding designs year end
30 0
300
LEVEL OF SERVICEParticipation in Statewide Risk Management audit.

RevisedBudget
2012/13
2013/14DPOP
Budget2014/15Budget
2015/16Budget
2016/17Budget
Asset ManagementNon Operating Revenue
6006. F-19016.8514.6385 Asset Mgt Purchases (10,000) 0 0 0 0(10,000) 0 0 0 0
Operating Expenditure0301. Administration Costs 376,454 389,600 381,800 381,800 381,8000350. General Expenses 45,250 43,850 43,850 43,850 43,8500980. Administration Overheads (439,704) (433,450) (433,450) (433,450) (433,450)
(18,000) 0 (7,800) (7,800) (7,800)Capital Expenditure
1180. GPS Purchase 28,000 0 0 0 028,000 0 0 0 0
Total 0 0 (7,800) (7,800) (7,800)
Upper Hunter Shire Council2013/14-2016/17
Delivery Program & Operational Plan

CCoorrppoorraattee SSeerrvviicceessCOMMUNITY STRATEGIC OBJECTIVES (CSO’S)
To efficiently & effectively manage the business of the council within its charter To encourage an open & participatory Council, with emphasis on community engagement, action & response To participate in & encourage regional & local alliances with other councils, government or non-government partners Develop economic and intergenerational plans for future infrastructure needs. Encourage & build local community capacity within the context of the shire
OBJECTIVES
To provide an effective and cost efficient level of service to meet the reasonable needs of the residents and ratepayers of Upper Hunter Shire, and the staff of Council. Provide internal audit function to Council as a whole Provide policies and administrative principles that are both current and meet the needs of Council. Provision of a Records System that ensures easy access to paper & electronic records
MAJOR ACTIVITIES
Corporate – provide advice, policy development and decision making support to Council and the General Manager; implement Council policies and General Manager's administrative principles, priorities and decisions; provide primary input into development, maintenance and review of Council's corporate plans.
Risk Management – policy renewals by due dates, timely submission of insurance claims.
Records – provision of a records system that ensures easy access to paper and electronic records, continuing implementation of the State Records Act 1998.
Department - co-ordinate the Department's operations and performance, ensure output is monitored and services provided in an effective and cost- efficient manner.
Social/Community Plan 2006 – 2009 “People with a Disability” p 64 PERFORMANCE INDICATORS AAnticipated
2012/13Estimate/Target
2013/14
Workload: Delivery Program and Operational Plan developed and adopted.Finance Committee review of the Delivery Program and Operational Plan’s budget and performance indicators. Annual Report(prior year) developed and furnished to Minister. Risk ManagementNumber of insurance claims submitted RecordsInwards correspondence items registered Request for information under the GIPA Act File retrieval requests from Hunter Records Repository
By 30 June
Monthly
By 30 November
20
15,000 5
180
By 30 June
Monthly
By 30 November
20
15,0004
150
Effectiveness: Achievement of the objectives in the Delivery Program and Operational Plan for each Corporate Support service. Risk ManagementFollow-up requests from Insurers for additional information RecordsOperating cost of records section divided by number of inwards items registered
95%
0
$12.00
95%
0
$12.00
Efficiency: Achievement of the objectives in the Delivery Program and Operational Plan within the budget allocations. Risk ManagementPercentage of insurance claims finalised within 3 months RecordsMonitor and assess outstanding correspondence requiring a response against total received Monitor and assess outstanding Actions from Council Resolutions greater than one month
95%
100%
>95% completed
0
95%
100%
>95% completed
0
Service: Annual performance reviews of staff in Corporate Services indicate satisfactory (or better) performance.
100% 100%
LEVEL OF SERVICEAll statutory reporting and insurance requirements are met within necessary timeframes. Integrity of Council’s electronic records system maintained at levels to meet the needs of both internal and external customers.

RevisedBudget
2012/13
2013/14DPOP
Budget2014/15Budget
2015/16Budget
2016/17Budget
Upper Hunter Shire Council2013/14-2016/17
Delivery Program & Operational Plan
Corporate ServicesOperating Revenue
0110. User Fees & Charges (350) (350) (350) (350) (350)0150. Risk Management Revenue (57,500) (31,500) (31,500) (31,500) (31,500)
(57,850) (31,850) (31,850) (31,850) (31,850)Operating Expenditure
0301. Administration Costs 205,500 218,500 218,500 218,500 218,5000302. Records Management 183,500 200,500 200,500 200,500 200,5000303. Risk Management 291,627 305,039 305,039 305,039 305,0390350. General Expenses 27,800 16,600 14,600 12,600 12,6000980. Administration Overheads (554,313) (552,087) (552,087) (552,087) (552,087)
154,114 188,552 186,552 184,552 184,552
Total 96,264 156,702 154,702 152,702 152,702
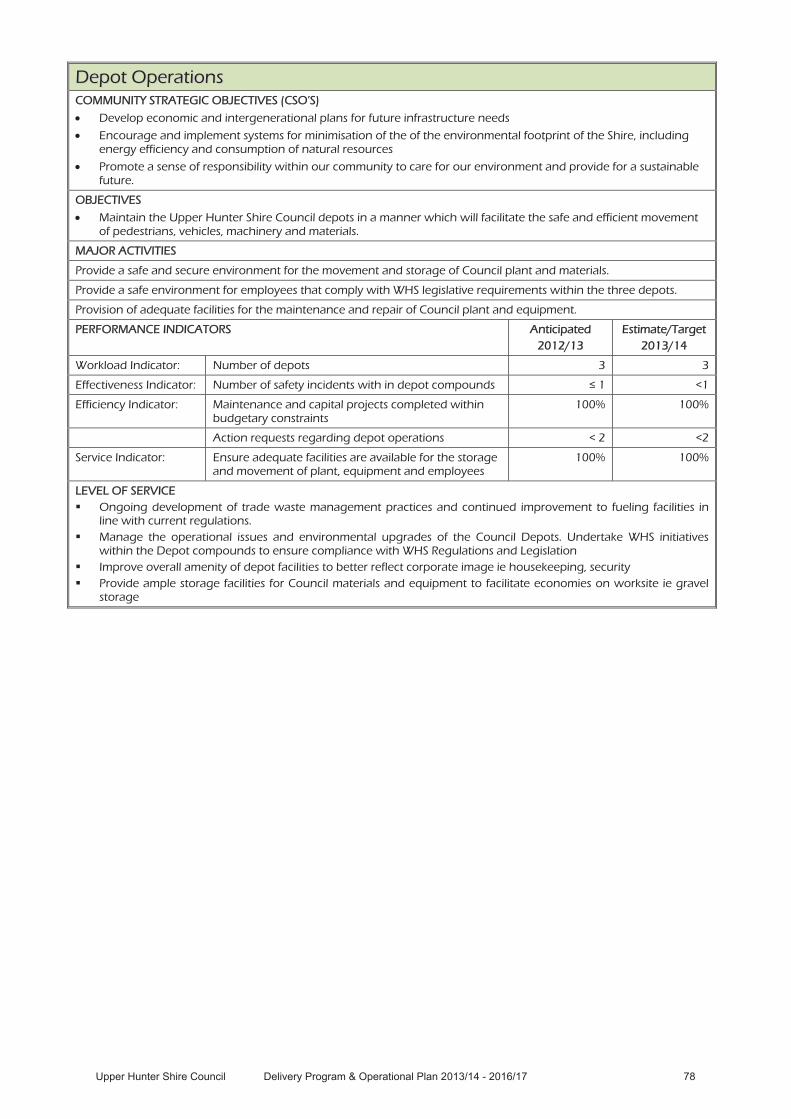
DDeeppoott OOppeerraattiioonnssCOMMUNITY STRATEGIC OBJECTIVES (CSO’S)
Develop economic and intergenerational plans for future infrastructure needs
Encourage and implement systems for minimisation of the of the environmental footprint of the Shire, including energy efficiency and consumption of natural resources
Promote a sense of responsibility within our community to care for our environment and provide for a sustainable future.
OBJECTIVES
Maintain the Upper Hunter Shire Council depots in a manner which will facilitate the safe and efficient movement of pedestrians, vehicles, machinery and materials.
MAJOR ACTIVITIES
Provide a safe and secure environment for the movement and storage of Council plant and materials.
Provide a safe environment for employees that comply with WHS legislative requirements within the three depots.
Provision of adequate facilities for the maintenance and repair of Council plant and equipment.
PERFORMANCE INDICATORS AAnticipated2012/13
Estimate/Target2013/14
Workload Indicator: Number of depots 3 3
Effectiveness Indicator: Number of safety incidents with in depot compounds 1 <1
Efficiency Indicator: Maintenance and capital projects completed within budgetary constraints
100% 100%
Action requests regarding depot operations < 2 <2
Service Indicator: Ensure adequate facilities are available for the storage and movement of plant, equipment and employees
100% 100%
LEVEL OF SERVICEOngoing development of trade waste management practices and continued improvement to fueling facilities in line with current regulations. Manage the operational issues and environmental upgrades of the Council Depots. Undertake WHS initiatives within the Depot compounds to ensure compliance with WHS Regulations and Legislation Improve overall amenity of depot facilities to better reflect corporate image ie housekeeping, security Provide ample storage facilities for Council materials and equipment to facilitate economies on worksite ie gravel storage

RevisedBudget
2012/13
2013/14DPOP
Budget2014/15Budget
2015/16Budget
2016/17Budget
Upper Hunter Shire Council2013/14-2016/17
Delivery Program & Operational Plan
Depot OperationsOperating Revenue
0110. User Fees & Charges 0 (10,000) (10,000) (10,000) (10,000)0 (10,000) (10,000) (10,000) (10,000)
Non Operating Revenue0920. Depreciation (52,366) (98,065) (98,065) (98,065) (98,065)6008. F-19016.8514.6383 Plant Replacement (318,645) (125,000) (100,000) (100,000) (50,000)6009. F-19016.8514.6384 Trade Waste Audit 0 0 (49,000) 0 06157. Cont from Scn/Abn Sewer (10,200) (10,600) (10,200) (10,200) (10,200)
(381,211) (233,665) (257,265) (208,265) (158,265)Operating Expenditure
0350. General Expenses 4,195 12,610 12,610 12,610 12,6100351. Trade Waste Operations 9,567 10,926 10,926 10,926 10,9260415. Utilities 43,322 44,505 45,188 45,188 45,1880425. Cleaning Costs 30,679 25,519 25,519 25,519 25,5190450. Sundry Expenses 1,000 1,000 1,000 1,000 1,0000530. Building Maintenance 42,367 40,706 40,706 40,706 40,7060680. Depreciation 52,366 98,065 98,065 98,065 98,0650980. Administration Overheads (110,930) (116,666) (116,666) (116,666) (116,666)0995. 2 Way Radio Communications 0 2,000 2,000 2,000 2,000
72,566 118,665 119,348 119,348 119,348Non Operating Expenditure
7228. T-19016.8514.6384 Trade Waste Audit 49,000 0 0 0 049,000 0 0 0 0
Capital Expenditure1160. Mwa Oil/Chemical Sheds Upgrade 0 30,000 0 0 01163. Scn Depot - Amenities Upg 25,600 0 0 0 01164. Mwa Depot - Amenities Upg 20,000 20,000 0 0 01200. Scn - Yard Sealing 2,400 20,000 0 0 01201. Scn - Yard Retaining Wall 10,000 20,000 0 0 04008. Scn-Groundwater Wells & Tank Remediation 200,645 0 0 0 04206. Trade Waste Project - Merriwa 1,000 0 50,000 0 04207. Trade Waste Project - Mdi 0 0 0 50,000 50,0004328. Mwa-Groundwater Wells & Tank Remediation 0 15,000 0 0 04407. Mdi Depot - Land Improvements 0 20,000 0 0 0
259,645 125,000 50,000 50,000 50,000
Total 0 0 (97,917) (48,917) 1,083

FFiinnaanncciiaall SSeerrvviicceessCOMMUNITY STRATEGIC OBJECTIVES (CSO’S)
To effectively & efficiently manage the business of the Council within its charter.
To encourage an open & participatory Council, with emphasis on community engagement, action & response
Develop economic and intergenerational plans for future infrastructure needs.
OBJECTIVES
Provide a general ledger, budgetary control, financial management and reporting, and internal audit service for the organisation which is effective and cost efficient in its operation while being regarded as better than satisfactory in overall service delivery by managers and other users of the finance systems.
Provide efficient secretarial and administrative service to the organisation and Council.
Provide efficient and prompt customer service for the organisation to internal and external customers.
Maintain Council’s Administration buildings for the safety of staff and public.
MAJOR ACTIVITIES
Ensure that Council and statutory reporting requirements are adhered to
Provide Council with a timely, efficient and accurate accounts payable service
Monitor allocation of revenues & expenses in the general ledger for reporting processes
Provision of customer & secretariat services.
PERFORMANCE INDICATORS AAnticipated2012/13
Estimate/Target2013/14
Workload Indicator: Finance:Number of Finance Committee reports prepared Number of statutory & other reports provided General ledger – no of journal transaction lines Account Payable:Number of transaction line entries Number of creditor payments EFT Number of creditor payments CHQ Administrative/Customer Assistance:Number of incoming telephone calls to switchboard Number of counter enquiries Number of receipts (non electronic) Number of electronic receipts RMS Agency enquiries/receipts
12 20
4,500
30,000 5,000
750
80,000 12,000 14,500 48,000
7,000
1220
4,000
33,0006,000
600
80,00012,00012,00050,000
7,000
Effectiveness Indicator: Finance:Number of Finance Committee meetings where agenda papers are provided three days before the meeting. Number of statutory reports provided by the due date Unrestricted current ratio. Accounts Payable:Accounts Payable invoices paid within prescribed timeframes. Reduction in cheque payments offset by increase in EFT payments.Administrative/Customer Assistance:RMS Agency Commission Provision of agendas & reports within reasonable timeframe
100%
100% >2
100%
$45,000
100%
100%
100%>2
100%
20%
$45,000
100%
Efficiency Indicator: Performance plan and indicators achieved within budget
100% 100%
Service Indicator: Finance:Council & management satisfied with the quality of reports provided by Finance.
Satisfied Satisfied
LEVEL OF SERVICEMaintain integrity of financial reporting in accordance with DLG & Council.

RevisedBudget
2012/13
2013/14DPOP
Budget2014/15Budget
2015/16Budget
2016/17Budget
Upper Hunter Shire Council2013/14-2016/17
Delivery Program & Operational Plan
Financial ServicesOperating Revenue
0110. User Fees & Charges (4,000) (3,588) (3,588) (3,588) (3,588)0130. Other Income (58,600) (60,200) (60,200) (60,200) (60,200)
(62,600) (63,788) (63,788) (63,788) (63,788)Non Operating Revenue
0920. Depreciation (250,575) (253,560) (253,560) (253,560) (253,560)6002. F-19016.8514.6373 Council Admin Bldgs (30,000) (10,000) 0 0 06003. F-19016.8523.6445 Special Projects (50,000) (70,000) (150,000) (50,000) (50,000)6004. Cont from Water/Waste/Sewer (95,000) (95,000) (95,000) (95,000) (95,000)
(425,575) (428,560) (498,560) (398,560) (398,560)Operating Expenditure
0301. Administration Costs 287,000 345,082 342,922 340,922 340,9220304. Customer Services 281,000 300,545 300,545 300,545 300,5450350. General Expenses 128,088 99,200 99,200 99,200 99,2000360. Audit Services 28,470 30,200 30,200 30,200 30,2000380. Bank Charges 49,600 57,120 57,120 57,120 57,1200396. Scn Admin Centre Loan -NAB 176,975 170,644 164,360 157,572 149,4690415. Utilities 62,025 71,605 71,605 71,605 71,6050425. Cleaning Costs 82,500 85,700 85,700 85,700 85,7000527. Admin Centre Exp - Scn 38,140 27,788 27,788 27,788 27,7880528. Admin Centre Exp - Mdi 13,900 15,618 15,618 15,618 15,6180529. Admin Centre Exp - Mwa 7,000 21,810 21,810 21,810 21,8100605. Fringe Benefits Tax 34,812 26,000 26,000 26,000 26,0000680. Depreciation 250,575 253,560 253,560 253,560 253,5600980. Administration Overheads (1,091,509) (1,156,832) (1,156,832) (1,156,832) (1,156,832)
348,576 348,040 339,596 330,808 322,705Non Operating Expenditure
0396. Scn Admin Centre Loan -NAB 97,474 103,804 110,088 116,877 124,9797148. T-19016.8514.6377 Provision for ELE 40,000 20,000 0 0 0
137,474 123,804 110,088 116,877 124,979Capital Expenditure
0880. Mwa Office Upgrade 0 20,000 100,000 0 01109. Mwa Office Roof Upgrade 25,000 0 0 0 01151. Mdi Admin Bldg - Painting 10,000 10,000 0 0 02042. Mdi - Carport 0 0 12,000 0 0
35,000 30,000 112,000 0 0
Total 32,875 9,496 (664) (14,663) (14,664)

CORPORATE SUPPORTFinancial Services
2013/14Budget
2014/15Budget
2015/16Budget
2016/17Budget
OPERATING EXPENSES
Employee Leave Entitlements - (A/L & L/S/L) 1,120,000 1,120,000 1,120,000 1,120,000 Public Holidays 435,000 435,000 435,000 435,000 Sick Leave 375,000 375,000 375,000 375,000 Other leave 125,000 125,000 125,000 125,000 Workers Compensation 700,000 700,000 700,000 700,000 Superannuation 1,475,000 1,475,000 1,475,000 1,475,000 Fringe Benefits Tax - - - -
TOTAL 4,230,000 4,230,000 4,230,000 4,230,000 Less:
On Costs Distributed to Functions (4,230,000) (4,230,000) (4,230,000) (4,230,000)
OPERATIONS REPORT

GGeenneerraall MMaannaaggeemmeennttCOMMUNITY STRATEGIC OBJECTIVES (CSO’S)
To effectively & efficiently manage the business of the Council within its charter
To encourage an open & participatory Council, with emphasis on community engagement, action & response
To participate in & encourage regional & local alliances with other Councils, Government or non- government partners
Encourage & build local community capacity within the context of the shire
Develop economic and intergenerational plans for future infrastructure needs.
Advocate to State & Federal Government for a fair & equitable share of fiscal resources & provision of government services for the community.
OBJECTIVES
To effectively and efficiently manage a Shire with an area of 8,100 sq kms and a population of 14,000 according to the needs of the community and resources provided by Council.
MAJOR ACTIVITIES
To ensure, under Council’s Delivery Program and Operational Plan, that departments perform to agreed Council expectations in the conduct of Council’s functions and provision of works and services and programs to residents and ratepayers; and with a commitment to providing a quality value for money service for ratepayers and residents.
Provide necessary support for the Mayor and Councillors to fulfill their respective roles.
Community Strategic Plan and 10 year Financial Plan – 2013 and 2015
Delivery Program and Operational Plan including the Annual Budget – Annually
Review Policies and Codes – within 12 months of election – Sept 2012
Implement Structural Reform – ongoing focus on value for money
MAJOR ACTIVITIES FOR 2013/14
Consolidated LEP finalised
Progress Competitive provision of services
Advocate for Railway Overpass and Heavy Vehicle Alternative Route Project in Scone – funding and construction
Advise Council on Local Government review and Local government Act reviews for assessment and response.
PERFORMANCE INDICATORS AAnticipated2012/13
Estimate/Target2013/14
Workload Indicator: Number of Council and Committee meetings Council - Ordinary: - Extraordinary: Finance Works & Technical Services: Development & Environmental Services
12 3
12 11 11
123
121111
Effectiveness Indicator: Achievement of the Operational & Delivery Plan 100% 100%
Efficiency Indicator: Operational & Delivery Plan outcomes achieved within budget
100% 100%
Service Indicator: Number of written compliments and complaints about the achievement of the Operational & Delivery Plan outcomes
0 complaints 0 complaints
LEVEL OF SERVICEAll of Council’s functions carried out at a level that meets the community needs and within authorised budgets.

RevisedBudget
2012/13
2013/14DPOP
Budget2014/15Budget
2015/16Budget
2016/17Budget
Upper Hunter Shire Council2013/14-2016/17
Delivery Program & Operational Plan
General ManagementOperating Expenditure
0301. Administration - Salaries & Oncosts 158,000 159,200 159,200 159,200 159,2000350. General Expenses 18,200 23,200 23,200 23,200 23,2000980. Administration Overheads (90,100) (91,200) (91,200) (91,200) (91,200)
86,100 91,200 91,200 91,200 91,200
Total 86,100 91,200 91,200 91,200 91,200

HHuummaann RReessoouurrcceessCOMMUNITY STRATEGIC OBJECTIVES (CSO’S)
To effectively & efficiently manage the business of the Council with its charter.
OBJECTIVES
To provide a appropriate human resources, work health and safety and payroll services that meets Council’s requirements and assist in the achievement of the organisation’s objectives.
MAJOR ACTIVITIES
Human Resources
Monitor staff recruitment and selection, ensuring the principles of selection on merit.
Provide advice and support to management on human resources and industrial relations matters
Industrial relations matters negotiated satisfactorily – Award Implementation, Council Agreement and current legislation
Training and development co-ordination, including the co-ordination and development of the organisational training plan
Implementation of workforce planning strategies outlined in the Workforce Plan
Administration of Council salary system and job evaluation system
Ensure Council’s Equal Employment Opportunity requirements are met
Administration of Council’s Performance Management System
Review and implement organisational human resources polices and procedures
Work Health & Safety
Review and implement Council’s Work Health and Safety Management System
Raise level of awareness of WHS throughout the organization and ensure compliance with legislation
Injury prevention, rehabilitation and management
Payroll
Provide Council with a timely, efficient and accurate payroll service
PERFORMANCE INDICATORS AAnticipated2012/13
Estimate/Target2013/14
Workload Indicator: Number of equivalent full time staff
Average number of employee’s pays processed
205
250
205
250
Effectiveness Indicator: Sick leave – average sick leave hours as a % of all paid hours (does not include casual hours) Workers compensation – average workers compensation hours as a % of all paid hours (includes hours worked by all staff) Resignations – cumulative number of resignation (includes all permanent FT & PT staff and temporary staff who resign before completing their employment period)WH&S Incidents – cumulative number of reported incidents/near misses.
<3.5
<0.6
<20
<55
<3.5
<0.5
<20
<55
Efficiency Indicator: Total operating expenses of HR (including WH&S) service per EFT (excluding trainees & uniforms)
$1,010 $1,100
Service Indicator: Satisfaction of staff and management with level of service provided. (Survey, 3 = satisfactory, 4 = good)
>3.5 >3.5
LEVEL OF SERVICE:Level of service provided by Human Resources in 2012/13 to be maintained in 2013/14.

RevisedBudget
2012/13
2013/14DPOP
Budget2014/15Budget
2015/16Budget
2016/17Budget
Upper Hunter Shire Council2013/14-2016/17
Delivery Program & Operational Plan
Human ResourcesOperating Revenue
0115. Grants (45,785) (48,500) (48,500) (48,500) (48,500)0125. Reimbursements (1,965) (6,000) (6,000) (6,000) (6,000)
(47,750) (54,500) (54,500) (54,500) (54,500)Non Operating Revenue
6176. Cont from Oncosts - RTW Co-ordinator (40,000) (40,000) (40,000) (40,000) (40,000)(40,000) (40,000) (40,000) (40,000) (40,000)
Operating Expenditure0301. Administration Costs 116,500 117,600 117,600 117,600 117,6000308. Payroll Group 135,000 134,000 134,000 134,000 134,0000320. Trainee Costs 112,100 116,500 116,500 116,500 116,5000325. Workplace Health & Safety/Return to Work 114,500 129,000 129,000 129,000 129,0000350. General Expenses 35,500 36,500 36,500 36,500 36,5000980. Administration Overheads (446,600) (439,100) (439,100) (439,100) (439,100)
67,000 94,500 94,500 94,500 94,500
Total (20,750) 0 0 0 0

IInnffoorrmmaattiioonn SSeerrvviicceessCOMMUNITY STRATEGIC OBJECTIVES (CSO’S)
To effectively & efficiently manage the business of the Council with its charter.
To encourage an open & participatory Council, with emphasis on community engagement, action & response
Connect our communities through activities and events, online technologies and infrastructure.
OBJECTIVES
To provide effective information and communication systems which meet the current and foreseeable technological needs for each of Council’s departments.
MAJOR ACTIVITIES
To implement the Civica Authority e-services solution as a replacement for payment enquiries and DA tracking.
To undertake the 4 year major refresh of councils core IT infrastructure, including Servers, PC's, Thinclients, and Storage Area Network.
To investigate and implement more effective mobile technologies using smartphones, tablets or laptops in a field environment.
To upgrade the performance of councils private network communications between its primary sites.
To implement a more robust Disaster Recovery strategy including backup to the cloud with automated failover to online site if required.
Upgrade council’s intranet to a more functional system.
PERFORMANCE INDICATORS AAnticipated2012/13
Estimate/Target2013/14
Workload Indicator: List of monthly Activities / Achievements – satisfactory completion
Satisfactory Satisfactory
Monthly helpdesk tickets 100 Received 100 Closed
120 Received120 Closed
No. of PCs supported 145 Council PCs, 30
Community PC’s (CTC, Library, Aged Care, Youth Centre)
plus home users
150 Council PCs, 30 Community PC’s
(CTC, Library, Aged Care, Youth Centre)
plus home users
Effectiveness Indicator: Link to remote sites out of operation (7am-6pm)
< 1 hour/month < 1 hour/month
Monthly helpdesk tickets Outstanding tickets < 75
Outstanding tickets < 75
Server downtime (7am – 6pm work days) < 20 minutes/month
< 20 minutes/month
Critical Microsoft flaws addressed Patches applied Monthly
Patches appliedMonthly
Virus impact < =1 < =1
All networked PC’s operational >99% >99%
Efficiency Indicator: Satisfactory completion of major tasks as per agreed action plan.
95% 95%
Service Indicator: Satisfaction of staff and management with level of service provided, and review of helpdesk reporting.
Satisfactory Satisfactory
LEVEL OF SERVICE:Council’s technology is sourced and maintained at a level that meets Council’s increasing requirements.

RevisedBudget
2012/13
2013/14DPOP
Budget2014/15Budget
2015/16Budget
2016/17Budget
Upper Hunter Shire Council2013/14-2016/17
Delivery Program & Operational Plan
Information ServicesNon Operating Revenue
6010. F-19016.8514.6378 Information Systems (45,000) (57,500) (25,000) (20,000) 06222. F-19016.8514.6372 Office Equipment 0 (24,000) 0 0 0
(45,000) (81,500) (25,000) (20,000) 0Operating Expenditure
0301. Administration Costs 260,309 275,957 272,142 270,305 270,3050355. Information Systems Management 411,704 423,314 423,314 423,314 423,3140356. Communications Management 126,880 155,880 155,880 155,880 155,8800980. Administration Overheads (802,893) (855,151) (855,151) (855,151) (855,151)
(4,000) 0 (3,815) (5,652) (5,652)Capital Expenditure
0703. IT Capital Expenditure 19,000 0 30,000 25,000 30,0001043. Exchange Server replacement 0 31,000 0 0 01120. Additional PCs & Tablets 3,500 0 0 0 01121. Back-up Streaming 0 0 0 0 01122. Wireless Upgrade 23,500 0 0 0 02043. Wireless Bridges 0 2,000 0 0 02044. Canon Plotter/Scanner Replacement 0 18,500 0 0 02045. Mitel Upgrade & unified Comms Solution 0 15,000 0 0 02046. Additional thin Clients 0 2,000 0 0 02047. Buyout thin clients & screens & servers 0 7,000 0 0 02048. Projectors & screen 0 6,000 0 0 0
46,000 81,500 30,000 25,000 30,000
Total (3,000) 0 1,185 (652) 24,348

PPllaanntt SSeerrvviicceessCOMMUNITY STRATEGIC OBJECTIVES (CSO’S)
Develop economic and intergenerational plans for future infrastructure needs
Promote a sense of responsibility within our community to care for our environment and provide for a sustainable future
Encourage and implement systems for minimisation of the environment footprint of the Shire, including energy efficiency and consumption of natural resources
OBJECTIVE
To efficiently manage Council’s plant fleet in accordance with Council’s Delivery Program & Operations Plan and the 10 year plant replacement program.
MAJOR ACTIVITIES
Managing the maintenance and scheduled replacement of Council’s plant fleet.
Establish and maintain a Plant Replacement Reserve.
Monitor plant operating costs, Maintain a mechanical workshop and associated staff and equipment.
Ensure all plant and d vehicle items are inspected for RMS registration.
PERFORMANCE INDICATORS AAnticipated2012/13
Estimate/Target2013/14
Workload: Number of plant items managed - Light vehicles - Small plant /miscellaneous items - Large plant items
58 234 109
58241103
Effectiveness: Plant replacement achieved according to the plant replacement schedule and within budget constraints.
100% 100%
Efficiency: Plant utilisation – total 92% 90%
Plant registrations completed in April and September 100% 100%
Service: All scheduled maintenance completed within a timeframe that will both minimise disruption to works and ensure plant is serviced within intervals specified by manufacturers. Servicing within 10 hours or 200kms of manufacturers specifications
98% 98%
LEVEL OF SERVICEReview of existing and new models for fleet and operational cost efficiencies. Obtain best pricing for purchase and trade of plant items with consideration of market conditions and operational and environmental factors.

RevisedBudget
2012/13
2013/14DPOP
Budget2014/15Budget
2015/16Budget
2016/17Budget
Upper Hunter Shire Council2013/14-2016/17
Delivery Program & Operational Plan
Plant ServicesOperating Revenue
0130. Other Income (106,000) (111,200) (111,200) (111,200) (111,200)0951. Proceeds Sale of Passenger Vehicles (563,000) (532,000) (572,000) (710,000) (533,000)0952. Proceeds Sale of Heavy Plant Vehicles (316,500) (244,000) (287,000) (309,000) (607,000)
(985,500) (887,200) (970,200) (1,130,200) (1,251,200)Non Operating Revenue
0920. Depreciation (1,168,961) (1,259,700) (1,259,700) (1,259,700) (1,259,700)0975. Plant Hire Recovery (Internal) (4,234,500) (4,350,000) (4,350,000) (4,350,000) (4,350,000)6008. F-19016.8514.6383 Plant Replacement 0 0 0 (49,738) 06156. Cont from Scn/Abn Water (16,364) 0 0 0 0
(5,419,825) (5,609,700) (5,609,700) (5,659,438) (5,609,700)Operating Expenditure
0301. Administration Costs 23,000 13,845 13,845 13,845 13,8450305. Plant Expenses 1,119,000 1,008,606 1,008,606 1,008,606 1,008,6060310. Staff Training 14,000 39,251 39,251 39,251 39,2510410. Insurance 182,000 245,080 245,080 245,080 245,0800641. Fuel 953,000 950,000 950,000 950,000 950,0000642. Supervision 54,000 85,527 85,527 85,527 85,5270643. Electricity 12,000 11,000 11,000 11,000 11,0000644. Telephone 1,500 1,250 1,250 1,250 1,2500645. Registration 80,500 87,000 87,000 87,000 87,0000680. Depreciation 1,168,961 1,259,700 1,259,700 1,259,700 1,259,7000980. Administration Overheads 229,580 248,379 248,379 248,379 248,379
3,837,541 3,949,638 3,949,638 3,949,638 3,949,638Non Operating Expenditure
7008. T-19016.8514.6383 Plant Replacement 306,784 255,262 286,262 0 727,962306,784 255,262 286,262 0 727,962
Capital Expenditure4133. Plant Purchases Capital Expenditure 2,261,000 2,292,000 2,344,000 2,840,000 2,183,300
2,261,000 2,292,000 2,344,000 2,840,000 2,183,300
Total 0 0 0 0 0

RReevveennuuee SSeerrvviicceessCOMMUNITY STRATEGIC OBJECTIVES (CSO’S)
To effectively & efficiently manage the business of the Council within its charter.
To encourage an open & participatory Council, with emphasis on community engagement, action & response.
OBJECTIVES
To achieve Council’s budgeted rate and annual charges revenues within budgetary constraints, while providing a responsive billing and property enquiry service.
MAJOR ACTIVITIES
The issue, reconciling and recovery of debtor amounts.
Debtor and property enquiry service.
Provision of a parcel based property database with a (limited) mapping interface to generate a visual representation of land based features.
PERFORMANCE INDICATORS AAnticipated2012/13
Estimate/Target2013/14
Workload Indicator: Accounts issued per annum 49,000 52,000
Effectiveness Indicator: Outstanding rates and annual charges. Percentage reported to the Department of Local Government at 30/6 each year
Number of days that rate notices are issued from the start of the financial year
Average days per quarterly water billing cycle
5.0%
<31
91 days/quarter
5.0%
<31
91 days/quarter
Efficiency Indicator: Reconciliation of rates, water and sundry debtor subsidiary ledgers to general ledger within 5 days of end of month
100% 100%
Service Indicator: Average number of days to process applications for s603 certificates
<5 days <5 days
LEVEL OF SERVICERates levied by due dates and recovery action taken to ensure that the levels of outstanding rates are kept at an appropriate level. Water accounts are issued on a timely basis, four times a year.

RevisedBudget
2012/13
2013/14DPOP
Budget2014/15Budget
2015/16Budget
2016/17Budget
Upper Hunter Shire Council2013/14-2016/17
Delivery Program & Operational Plan
Revenue ServicesOperating Revenue
0110. User Fees & Charges (99,100) (101,000) (101,000) (101,000) (101,000)0130. Other Income (11,000) (11,000) (11,000) (11,000) (11,000)
(110,100) (112,000) (112,000) (112,000) (112,000)Operating Expenditure
0301. Administration Costs 153,548 158,878 158,878 158,878 158,8780350. General Expenses 67,179 72,200 72,200 72,200 72,2000365. Legal & Debt Recovery Costs 69,100 65,000 65,000 65,000 65,0000980. Administration Overheads (180,177) (184,078) (184,078) (184,078) (184,078)
109,650 112,000 112,000 112,000 112,000
Total (450) 0 0 0 0

SSttoorreess // PPuurrcchhaassiinngg SSeerrvviicceessCOMMUNITY STRATEGIC OBJECTIVES (CSO’S)
To effectively & efficiently manage the business of the Council within its charter
Participate in and encourage regional and local alliances with other Councils, government or non0government partners
To encourage an open & participatory Council, with emphasis on community engagement, action & response.
OBJECTIVES
To efficiently manage Council’s procurement function and so allow the other divisions and departments to maximise their delivery of services to the community in accordance with Council’s Delivery Program and Operational Plan.
MAJOR ACTIVITIES
Stock levels are appropriate and reflect the usage requirements of Council, all purchases are at the most competitive cost and highest quality and all items supplied under contract are in accordance with contract terms.
Provide a supply contract administration, purchasing, storage and distribution facility which is cost effective.
Provide personal protective equipment (PPE) to staff in accordance with Council policies and Administrative Principles.
Participate in joint purchasing and contract functions with Hunter Councils whenever possible and where applicable.
Rationalise purchasing and contracts between Council’s two main stores.
Review the inventory to identify opportunities to reduce stockholdings on an on-going basis.
PERFORMANCE INDICATORS AAnticipated2012/13
Estimate/Target2013/14
Workload Indicator: Stocktakes completed during year 6 6
Number of stock issues Number of orders issued Number of stock lines Value of Annual Stock Issues
15,000 5,500 1,300
1,500,000
15,0005,0001,300
1,500,000
Effectiveness Indicator: Number of complaints regarding timing of receipts or incorrectly ordered goods
1 1
Efficiency Indicator: Stocktake variations to value of total stores on hand <1% <1%
Service Indicator: Number of complaints regarding timing of receipts or incorrectly ordered goods
1 1
LEVEL OF SERVICEProvision of Stores Officers in Scone and Merriwa and minor facilities at Murrurundi

RevisedBudget
2012/13
2013/14DPOP
Budget2014/15Budget
2015/16Budget
2016/17Budget
Upper Hunter Shire Council2013/14-2016/17
Delivery Program & Operational Plan
Stores/Purchasing ServicesNon Operating Revenue
6008. F-19016.8514.6383 Plant Replacement 0 (5,000) (10,000) 0 (20,000)0 (5,000) (10,000) 0 (20,000)
Operating Expenditure0301. Administration Costs 131,200 140,450 140,450 140,450 140,4500350. General Expenses 4,700 5,200 5,200 5,200 5,2000450. Sundry Expenses 500 500 500 500 5000452. Suspense account 0 0 0 0 00980. Administration Overheads (136,400) (146,150) (146,150) (146,150) (146,150)
0 0 0 0 0Capital Expenditure
1160. Mwa Oil/Chemical Sheds Upgrade 0 0 0 0 04013. Upgrade Storage Facilities 0 0 10,000 0 20,0005037. Barcode Facilities 0 5,000 0 0 0
0 5,000 10,000 0 20,000
Total 0 0 0 0 0

TTeecchhnniiccaall SSuuppppoorrtt SSeerrvviicceessCOMMUNITY STRATEGIC OBJECTIVES (CSO’S)
Develop economic and intergenerational plans for future infrastructure needs.
To effectively and efficiently manage the business of the Council within its Charter.
To encourage an open and participatory Council, with an emphasis on community engagement, action and response.
OBJECTIVE
To efficiently manage the capital, labour, plant and materials resources made available to the Department and so allow the four operational divisions to maximise their delivery of technical services to the community in accordance with Council’s Delivery Program and Operational Plan.
MAJOR ACTIVITIES
Manage the Technical Services activities of Council.
Exercising effective financial control in relation to the Maintenance and Capital Works Programs set out in Council’s Delivery Program and Operational Plan.
Managing the Department’s Action Request systems (Technical and Water/Sewer).
Managing the public liability risk management exposure of the department.
Coordinating the preparation of Council and Committee reports.
Providing administrative and technical assistance to Division managers
System development to enhance competitive provision of services.
PERFORMANCE INDICATORS Anticipated2012/13
Estimate/Target2013/14
Workload: AAction request system – number of requests
Technical services general
Water/Sewer/Waste
1,700 750
1,3501,200
Effectiveness: Provide a clear and concise audit trail for all action requests SystemImplemented
SystemImplemented
Efficiency: Average completion time for routine jobs not scheduled for programmed maintenance. < 7 days < 7 days
Service: Complaints registered within Customers in Context (CIC) within 4 hours
100% 100%
100%100%
Workload: Monitor technical services works are being carried out efficiently and effectively including capital projects
Achieved Achieved
Effectiveness: Monitor maintenance and Capital Works Programs completed within budget constraints 100% 100%
Efficiency: Monitor maintenance and capital works completed within scheduled program 100% 100%
Service: Complaints registered within Customer Request Management (CRM) relating to capital works and identified for future works
<5 <5
LEVEL OF SERVICE
Improved systems to assist departmental managers in meeting customer requirements.
To efficiently manage the capital, labour, plant and materials resources made available to the Department and so allow the four operational divisions to maximize their delivery of technical services to the community.
Manage customer request system to ensure service delivery and community expectations are addressed.
Improved customer communication systems

RevisedBudget
2012/13
2013/14DPOP
Budget2014/15Budget
2015/16Budget
2016/17Budget
Upper Hunter Shire Council2013/14-2016/17
Delivery Program & Operational Plan
Technical Support ServicesNon Operating Revenue
6156. Cont from Scn/Abn Water (10,000) 0 0 0 06157. Cont from Scn/Abn Sewer (10,000) 0 0 0 06181. F-19016.8523.6522 Riskemap Project (6,000) 0 0 0 06227. F-19016.8514.6547 Key Audit 0 (35,500) 0 0 0
(26,000) (35,500) 0 0 0Operating Expenditure
0301. Administration Costs 278,245 336,224 336,224 336,224 336,2240350. General Expenses 13,000 10,500 10,500 10,500 10,5000980. Administration Overheads (333,245) (346,724) (346,724) (346,724) (346,724)
(42,000) 0 0 0 0Non Operating Expenditure
7200. T-19016.8523.6522 Riskemap Project 1,550 0 0 0 07227. T-19016.8514.6547 Key Audit 35,500 0 0 0 0
37,050 0 0 0 0Capital Expenditure
0877. Investigate New Key System 2,000 35,500 0 0 01205. Riskemap Setup 4,450 0 0 0 0
6,450 35,500 0 0 0
Total (24,500) 0 0 0 0

AGRICULTURE
Summary .................................................................. 98
Crops for Hunter ...................................................... 99

RevisedBudget
2012/13
2013/14DPOP
Budget2014/15Budget
2015/16Budget
2016/17Budget
Upper Hunter Shire Council2013/14-2016/17
Delivery Program & Operational Plan
AgricultureNon Operating Revenue
Crops for Hunter (35,387) 0 0 0 0(35,387) 0 0 0 0
Operating Expenditure Crops for Hunter 24,424 0 0 0 0
24,424 0 0 0 0
Total (10,963) 0 0 0 0

CCrrooppss ffoorr HHuunntteerrCOMMUNITY STRATEGIC OBJECTIVES (CSO’S)
Support and develop a thriving, safe and growing business community with increased employment
PERFORMANCE INDICATORS Anticipated2012/13
Estimate/Target2013/14
Workload: Number of committee meetings per annum
Farm Diversification Grant Scheme managed
2Achieved
NANA
Effectiveness: Grant provided to successful applicant $10,000 NA
Efficiency: Grant administered effectively Achieved NA
Service: Successful operation of annual grant program Achieved NA
LEVEL OF SERVICEThe Crops For Hunter Project was wound up in March 2013 by agreement of the member Councils being Upper Hunter Shire, Muswellbrook Shire and Singleton Councils.

RevisedBudget
2012/13
2013/14DPOP
Budget2014/15Budget
2015/16Budget
2016/17Budget
Upper Hunter Shire Council2013/14-2016/17
Delivery Program & Operational Plan
Crops for HunterNon Operating Revenue
6020. F-19015.8513.6361 Crops for Hunter (35,387) 0 0 0 0(35,387) 0 0 0 0
Operating Expenditure0478. Crops for the Hunter 24,424 0 0 0 0
24,424 0 0 0 0
Total (10,963) 0 0 0 0

COMMUNITY SERVICES & EDUCATION
Summary ......................................................................... 102
Administration & Education ........................................ 103
Aged Care – Gummun Place Hostel ......................... 105
Aged Care – Independent Living Units ................... 107
Children’s Services – Before & After School Care . 109
Children’s Services – Early Learning ......................... 111
Children’s Services – Family Day Care ...................... 113
Social Protection ............................................................. 115
Youth Services ................................................................. 117

RevisedBudget
2012/13
2013/14DPOP
Budget2014/15Budget
2015/16Budget
2016/17Budget
Upper Hunter Shire Council2013/14-2016/17
Delivery Program & Operational Plan
Community Services & EducationOperating Revenue
Administration & Education (184,648) (250,930) (150,930) (150,930) (150,930) Aged Care - Gummun Place Hostel (692,180) (812,852) (801,852) (801,852) (801,852) Aged Care - Independent Living Units (78,796) (82,000) (82,000) (82,000) (157,000) Children`s Services - Before & After School Care (167,490) (172,983) (172,983) (172,983) (172,983) Children`s Services - Early Learning Centre (739,865) (761,450) (761,450) (761,450) (761,450) Children`s Services - Family Day Care (619,523) (549,202) (549,202) (549,202) (549,202) Social Protection (4,224) (13,030) (5,030) (5,030) (5,030) Youth Services (218,483) (187,833) (175,780) (175,780) (175,780)
(2,705,209) (2,830,280) (2,699,227) (2,699,227) (2,774,227)Non Operating Revenue
Administration & Education 0 (58,950) 0 0 0 Aged Care - Gummun Place Hostel (138,422) (51,632) (116,300) (52,632) (42,632) Aged Care - Independent Living Units (29,025) (30,351) (23,351) (21,351) (13,609) Children`s Services - Before & After School Care (2,309) (2,325) (2,325) (2,325) (2,325) Children`s Services - Early Learning Centre (21,648) (9,727) (9,727) (9,727) (9,727) Children`s Services - Family Day Care (4,795) 0 0 0 0 Social Protection (17,366) (17,460) (17,460) (17,460) (17,460) Youth Services (16,755) (65,307) (13,800) (13,800) (13,800)
(230,320) (235,752) (182,963) (117,295) (99,553)Operating Expenditure
Administration & Education 323,935 503,513 338,563 338,563 338,563 Aged Care - Gummun Place Hostel 807,329 810,152 810,152 810,152 810,152 Aged Care - Independent Living Units 79,422 65,711 65,711 65,711 65,711 Children`s Services - Before & After School Care 163,850 167,764 167,764 167,764 167,764 Children`s Services - Early Learning Centre 731,104 750,139 748,643 747,022 745,076 Children`s Services - Family Day Care 624,282 546,180 546,180 546,180 546,180 Social Protection 27,651 36,010 34,810 34,810 34,810 Youth Services 323,155 378,619 346,789 333,059 333,059
154,382 53,940 50,099 63,673 65,523Non Operating Expenditure
Administration & Education 47,950 0 0 0 0 Aged Care - Gummun Place Hostel 14,448 11,332 5,000 21,332 11,332 Aged Care - Independent Living Units 24,433 8,940 6,440 6,940 11,898 Children`s Services - Before & After School Care 3,540 5,044 4,544 4,544 2,544 Children`s Services - Early Learning Centre 22,468 25,602 31,093 27,835 36,727 Children`s Services - Family Day Care 36 3,022 3,022 3,022 3,022 Youth Services 41,507 0 0 0 0
154,382 53,940 50,099 63,673 65,523Capital Expenditure
Aged Care - Gummun Place Hostel 8,825 43,000 103,000 23,000 23,000 Aged Care - Independent Living Units 3,966 37,700 33,200 30,700 93,000 Children`s Services - Before & After School Care 2,409 2,500 3,000 3,000 5,000 Children`s Services - Early Learning Centre 30,000 19,000 16,500 23,000 18,000 Social Protection 624 8,000 0 0 0 Youth Services 5,500 27,000 24,500 19,500 12,000
51,324 137,200 180,200 99,200 151,000
Total 350,905 383,196 406,721 389,612 384,058

AAddmmiinniissttrraattiioonn && EEdduuccaattiioonnCOMMUNITY STRATEGIC OBJECTIVES (CSO’S)
Effectively and efficiently manage the business of the Council within its Charter. Form partnerships and participate in networks which address the needs & interest of disadvantaged groups in our community Advocate for, support & provide services & facilities for families, children & young people Facilitate partnerships which create and support a caring community To encourage an open & participatory Council, with emphasis on community engagement, action and response To participate in and encourage regional and local alliances with other Councils, Government and non-government partners Facilitate and provide for a growing population, including, for example, affordable housing, community amenities, health and welfare services. Promote a sense of responsibility within our community to care for our environment and provide for a sustainable future. Advocate for, develop and implement programs, services and facilities for our ageing community. Encourage and build local community capacity and connectivity, within the context of both the Upper Hunter Shire and local areas.
PERFORMANCE INDICATORS Anticipated2012/13
Estimate/Target2013/14
Workload Indicator SSkills Training Programs/Community WorkshopsNo. of skills development/training programs held No. of organisations involved in the skills development/training programs held No Community Workshops No. participants
6 p/a
30
6p/a
302
16Resources DevelopedDirectories/WebsitesBrochures, adverts, flyers, newsletters No. participating Organisations/readers
430
230
49
1,330
Community/ Sector Capacity BuildingNo. Organisations attending Merriwa Events held Total Participants
20 204
580Sector PlanningMapping/Planning Days to identify needs No Organisations participating
660
660
Partnership projectsLed by Council to address common identified needs in the region No. of organisations involved
18
57
18
57Community Networks/Groups supportedNo. of meetings supported No. of Participants
14251
Clean Up Australia DayNo. of Clean Up Australia Day sites organised 4 4
Effectiveness Indicator Report on achievements submitted Achieved Achieved
No of community groups who participate in a Clean Up Australia Day site
8 8
No of community organisations supported 50 50Community directories/Website produced, New Residents Information updated annually, Community Services Plans updated
Achieved Achieved
Efficiency Indicator Achievement of major activities within budget 100% 100%Service Indicator No of complaints received from community
members 0 0
LEVEL OF SERVICECommunities in the Upper Hunter Shire are kept informed of opportunities available to them and participate in those opportunities provided, eg Community Builders and CUAD.

RevisedBudget
2012/13
2013/14DPOP
Budget2014/15Budget
2015/16Budget
2016/17Budget
Upper Hunter Shire Council2013/14-2016/17
Delivery Program & Operational Plan
Administration & EducationOperating Revenue
0115. Grants (183,648) (150,880) (150,880) (150,880) (150,880)0130. Other Income (1,000) (100,050) (50) (50) (50)
(184,648) (250,930) (150,930) (150,930) (150,930)Non Operating Revenue
6104. F-19016.8515.6386 Community Services 0 (20,000) 0 0 06221. F-19015.8511.6542 Womens Gathering 0 (38,950) 0 0 0
0 (58,950) 0 0 0Operating Expenditure
0301. Administration Costs 257,056 293,200 266,200 266,200 266,2000350. General Expenses 3,240 3,420 3,420 3,420 3,4200980. Administration Overheads 56,511 60,453 60,453 60,453 60,4535011. Clean up Australia Expenses 3,628 5,990 5,990 5,990 5,9905028. Community Svces Committee 2,500 2,500 2,500 2,500 2,5005099. Womens Gathering 1,000 137,950 0 0 0
323,935 503,513 338,563 338,563 338,563Non Operating Expenditure
7102. T-19016.8515.6386 Community Services 9,000 0 0 0 07221. T-19015.8511.6542 Womens Gathering 38,950 0 0 0 0
47,950 0 0 0 0
Total 187,237 193,633 187,633 187,633 187,633

AAggeedd CCaarree –– GGuummmmuunn PPllaaccee HHoosstteellCOMMUNITY STRATEGIC OBJECTIVES (CSO’S)
Advocate for, develop & implement programs, services & facilities for our ageing community.
Effectively and efficiently manage the business of Council within its Charter.
Facilitate partnerships which create and support a caring community
Form partnerships & participate in networks which address the needs & interest of disadvantaged groups within the community.
OBJECTIVES
Maintain Gummun Place Hostel as an accredited 16 bed low care facility in Merriwa, which Council is the Trustee of the facility.
To provide aged care facilities that are self sufficient over the long term
To promote accessible aged services and facilities in the Shire
To provide for asset refurbishment of the current facility
MAJOR ACTIVITIES
Provide high quality low care residential care to the aged
Operate an accredited Aged Hostel in accordance with Commonwealth guidelines.
Maintain policies, procedures and standards to ensure Aged Care Accreditation is achieved at each 3-year review.
Operate within approved Food Standards and Food Accreditation is met.
PERFORMANCE INDICATORS AAnticipated2012/13
Estimate/Target2013/14
Workload Indicator: Provide aged care (hostel) services to residents in accordance with the Aged Care Act and the Aged Care standards.
Percentage of year that rooms are occupied.
Number of accreditation visits per year.
100%
98%
4
100%
98%
4
Effectiveness Indicator: Hostel Compliance with Accreditation standards, food standards and Building Certification.
Number of issues raised during Accreditation visits.
100%
8
100%
8
Efficiency Indicator: Achievement of the major activities within budget. 100% 100%
Service Indicator: Satisfaction of residents at Hostel as measured by Residents survey held annually.
Satisfaction with food as measured in annual food survey.
96%
97%
96%
97%
LEVEL OF SERVICEProvision of 16 bed low care facility in Merriwa that meets all accreditation standards by regulatory agencies.

RevisedBudget
2012/13
2013/14DPOP
Budget2014/15Budget
2015/16Budget
2016/17Budget
Upper Hunter Shire Council2013/14-2016/17
Delivery Program & Operational Plan
Aged Care - Gummun Place HostelOperating Revenue
0110. User Fees & Charges (255,000) (260,000) (260,000) (260,000) (260,000)0115. Grants (378,600) (491,000) (480,000) (480,000) (480,000)0120. Interest & Investment Income (40,000) (40,000) (40,000) (40,000) (40,000)0130. Other Income (6,580) (7,500) (7,500) (7,500) (7,500)0140. Contributions (12,000) (14,352) (14,352) (14,352) (14,352)
(692,180) (812,852) (801,852) (801,852) (801,852)Non Operating Revenue
0920. Depreciation (40,663) (42,632) (42,632) (42,632) (42,632)6015. F-49016.8515.6393 Mwa Hostel Working (84,584) 0 (73,668) 0 06016. F-49016.8515.6358 Mwa Hostel Auxilliary (13,175) 0 0 (10,000) 06233. F-49016.8511.6551 Community Builders 0 (9,000) 0 0 0
(138,422) (51,632) (116,300) (52,632) (42,632)Operating Expenditure
0301. Administration Costs 50,400 55,000 55,000 55,000 55,0000310. Staff Training 12,000 17,000 17,000 17,000 17,0000321. Personal Care 359,000 358,000 358,000 358,000 358,0000322. Cooking & Ancillary 102,600 91,000 91,000 91,000 91,0000350. General Expenses 116,790 114,900 114,900 114,900 114,9000415. Utilities 41,744 43,700 43,700 43,700 43,7000510. Grounds Maintenance 6,500 7,000 7,000 7,000 7,0000530. Building Maintenance 32,000 32,500 32,500 32,500 32,5000653. Fundraising Other Expenses 632 0 0 0 00680. Depreciation 40,663 42,632 42,632 42,632 42,6320980. Administration Overheads 45,000 48,420 48,420 48,420 48,420
807,329 810,152 810,152 810,152 810,152Non Operating Expenditure
7015. T-49016.8515.6393 Hostel Working Funds 0 5,332 0 16,332 6,3327016. T-49016.8515.6358 Hostel Auxiliary Funds 5,448 6,000 5,000 5,000 5,0007233. T-49016.8511.6551 Community Builders 9,000 0 0 0 0
14,448 11,332 5,000 21,332 11,332Capital Expenditure
1099. Hostel Power Supply Upgrade 0 30,000 0 0 01100. Hostel Expansion Feasibility Study 0 0 0 0 20,0001101. Hostel Air Conditioning Upgrade 0 5,000 0 0 04021. Commercial Kitchen - Hostel 0 0 100,000 0 04043. Hostel Room Upg on Changeover 2,000 3,000 3,000 3,000 3,0004163. Hostel - Fundraising capital works 6,825 0 0 10,000 04289. Pendant warning system 0 0 0 10,000 04290. Industrial Carpet Cleaner 0 5,000 0 0 0
8,825 43,000 103,000 23,000 23,000
Total 0 0 0 0 0

AAggeedd CCaarree –– IInnddeeppeennddeenntt LLiivviinngg UUnniittssCOMMUNITY STRATEGIC OBJECTIVES (CSO’S)
Advocate for, develop & implement programs, services & facilities for our ageing community.
Form partnerships and participate in networks which address the needs & interest of disadvantaged groups in our community.
Facilitate partnerships which create and support a caring community.
Effectively and efficiently manage the business of the Council within it's Charter
OBJECTIVESTo provide safe, comfortable and affordable living to residents aged 55 years and over, in the Merriwa & Murrurundi areas through independent living units. To provide accessible services for people with disabilities living in the Shire including affordable accommodation where possible (ILU’s in Merriwa & Murrurundi). To provide for maintenance and Asset refurbishment of current units
MAJOR ACTIVITIES
Oversee maintenance and upkeep of 16 units and one cottage (8 units – Merriwa; 8 units & one house – Murrurundi).
Hold residents meetings.
Operate in accordance with Residential Tenancies Act.
Assist residents to access the required services.
Annual Inspections to be carried out to determine any works that need to be completed.
PERFORMANCE INDICATORS AAnticipated2012/13
Estimate/Target2013/14
Workload Indicator: Rents reviewed annually.
Number of maintenance requests from tenants.
No of residents meetings held (Quarterly in Mdi, with each tenant annually Mwa)
Annual inspections to be held determining works required.
February
30
12 pa
17
February
30
12 pa
17
Effectiveness Indicator: Percentage of year that units are tenanted. 95% 95%
Efficiency Indicator: Achievement of the major activities (detailed above) within budget.
100% 100%
Service Indicator: Positive condition reports received with no unplanned major maintenance works required.
No of complaints received, including breach of Disability Discrimination Act.
17
0
17
0
LEVEL OF SERVICEIndependent living units are provided and maintained for older residents and people with a disability who live in our communities.

RevisedBudget
2012/13
2013/14DPOP
Budget2014/15Budget
2015/16Budget
2016/17Budget
Upper Hunter Shire Council2013/14-2016/17
Delivery Program & Operational Plan
Aged Care - Independent Living UnitsOperating Revenue
0110. User Fees & Charges (78,796) (82,000) (82,000) (82,000) (82,000)0115. Grants 0 0 0 0 (75,000)
(78,796) (82,000) (82,000) (82,000) (157,000)Non Operating Revenue
0920. Depreciation (29,025) (13,609) (13,609) (13,609) (13,609)6027. F-19016.8515.6391 ILUs Liverpool Lodge 0 (16,742) (9,742) (7,742) 0
(29,025) (30,351) (23,351) (21,351) (13,609)Operating Expenditure
0415. Utilities 24,713 25,350 25,350 25,350 25,3500530. Building Maintenance 24,000 25,000 25,000 25,000 25,0000680. Depreciation 29,025 13,609 13,609 13,609 13,6090980. Administration Overheads 1,684 1,752 1,752 1,752 1,752
79,422 65,711 65,711 65,711 65,711Non Operating Expenditure
7026. T-19016.8515.6392 ILUs Mwa 10,986 8,940 6,440 6,940 3,6407027. T-19016.8515.6391 ILUs Mdi 13,447 0 0 0 8,258
24,433 8,940 6,440 6,940 11,898Capital Expenditure
1025. ILUs Bathroom Upgrades 0 0 5,500 0 10,5001026. Mdi ILU Carports 0 10,000 0 0 01027. Mdi ILU Replace Floor Coverings 0 3,000 0 3,000 01029. Mwa ILU Replace Air Conditioner 0 1,700 1,700 1,700 01034. Mdi ILU Painting 0 5,000 0 5,000 01035. Mwa ILU Painting 0 0 4,000 0 01037. Mdi ILU Replace Air Conditioner 1,985 2,000 0 2,000 01038. Mwa ILU Replace Floor Coverings 1,981 2,500 0 2,500 2,5001040. Mwa ILU Kitchen Upgrades 0 0 0 5,000 01042. Mwa ILUs Bathroom upgrades 0 0 0 0 5,0001149. Mdi ILU Design 2 x Addtnl Units 0 0 0 6,500 01150. Mdi ILU Construct 2 x Addtnl Units 0 0 0 0 75,0001235. Install Resident Storage 0 6,500 6,500 0 01236. Install TWS to Cottage 0 3,000 0 0 01237. Install Mailboxes 0 2,000 0 0 01238. Outdoor Entertainment area/Painting 0 0 5,000 5,000 01239. Upgrade smoke alarm system 0 0 4,000 0 01240. Landscaping 0 2,000 0 0 01241. Feasibility Study 0 0 6,500 0 0
3,966 37,700 33,200 30,700 93,000
Total 0 0 0 0 0

CChhiillddrreenn’’ss SSeerrvviicceess –– BBeeffoorree && AAfftteerr SScchhooooll CCaarreeCOMMUNITY STRATEGIC OBJECTIVES (CSO’S)
Form partnerships and participate in networks which address the needs & interests of disadvantaged groups in our community.
Effectively and efficiently manage the business of Council within its Charter.
Facilitate healthy lifestyles through participation by and in partnership with the community in sports, cultural activities and active lifestyles
Advocate for, support & provide services & facilities for families, children & young people.
Facilitate partnerships which create and support a caring community.
OBJECTIVES
To provide high quality services for children aged 5 – 12 years in a fun, safe and caring environment that will meet the child care needs of families within the Scone district and foster the growth and development of each child.
MAJOR ACTIVITIES
Provision of Before & After School Care during school terms for up to 41 weeks.
Provision of Vacation Care during school term holidays for up to 9 weeks.
Operation of the service in accordance with: - requirements of the Commonwealth Department of Education, Employment and Workplace Relations (DEEWR)- requirements of the National Rating and Assessment process - service policies - Education and Care Services National Law and Regulations, and National Quality Standard
Maintenance of a supportive and collaborative partnership with the venue providers, St Mary’s Primary School, Scone.
PERFORMANCE INDICATORS AAnticipated2012/13
Estimate/Target2013/14
Workload Indicator: After School Care:Number of days of service Average number of children per day Before School Care:Number of days of service Average number of children per day Vacation Care:Number of days of service Average number of children per day
205 25
205 12
43 28
20220
2025
4426
Effectiveness Indicator: Survey of parents indicates that OOSH Service has better than satisfactory performance. (3 = “satisfactory”, 4 = “good”) Service Approval is obtained Service is successfully assessed and rated in accordance with the National Quality Standard
3.5
Achieved Achieved
3.5
AchievedAchieved
Efficiency Indicator: After School Care:Total expenses in period. Cost per child per afternoon (based on expense divided by average number of children divided by number of days of service pa) Before School Care:Total expenses in period. Cost per child per afternoon (based on expense divided by average number of children divided by number of days of service pa) Vacation Care:Total expenses in period. Cost per child per day (based on expense divided by average number of children divided by number of days of service pa)
$77,005
$15.48
$19,266
$8.42
$71,488
$49.09
$90,505
$22.40
$20,789
$20.58
$56,470
$49.36
LEVEL OF SERVICEScone Out Of School Hours services (After School Care, Before School Care and Vacation Care) obtains a Service Approval under the Education and Care Services National Law and Regulation, as determined by the Department of Education and Training Scone Out Of School Hours services (After School Care, Before School Care and Vacation Care) are assessed and rated as Meeting or Exceeding the National Quality Standard

RevisedBudget
2012/13
2013/14DPOP
Budget2014/15Budget
2015/16Budget
2016/17Budget
Upper Hunter Shire Council2013/14-2016/17
Delivery Program & Operational Plan
Children`s Services - Before & After School CareOperating Revenue
0110. User Fees & Charges (138,050) (145,943) (145,943) (145,943) (145,943)0115. Grants (29,440) (27,040) (27,040) (27,040) (27,040)0130. Other Income 0 0 0 0 0
(167,490) (172,983) (172,983) (172,983) (172,983)Non Operating Revenue
0920. Depreciation (2,309) (2,325) (2,325) (2,325) (2,325)(2,309) (2,325) (2,325) (2,325) (2,325)
Operating Expenditure0301. Administration Costs 1,000 1,200 1,200 1,200 1,2000350. General Expenses 3,750 5,269 5,269 5,269 5,2690530. Building Maintenance 1,790 2,850 2,850 2,850 2,8500680. Depreciation 2,309 2,325 2,325 2,325 2,3250980. Administration Overheads 5,000 449 449 449 4495002. After School Hours Care Expenses 70,109 74,726 74,726 74,726 74,7265003. Vacation Care Expenses 51,822 49,370 49,370 49,370 49,3705040. Oosh Shared Expenses 9,830 9,000 9,000 9,000 9,0005041. Oosh-Active After School Care Exp 4,440 4,400 4,400 4,400 4,4005086. Before School Care Expenses 13,800 18,175 18,175 18,175 18,175
163,850 167,764 167,764 167,764 167,764Non Operating Expenditure
7007. T-19016.8515.6489 Out of School Hours 200 5,044 4,544 4,544 2,5447009. T-19016.8514.6379 ELE-Soosh Loan 3,340 0 0 0 0
3,540 5,044 4,544 4,544 2,544Capital Expenditure
1157. OOSH - Replace Air Conditioner 2,409 0 0 0 01158. OOSH - Outdoor Storage 0 0 0 2,000 01242. Install window awning and blinds 0 0 0 0 5,0001243. Minor building improvements 0 2,500 3,000 1,000 0
2,409 2,500 3,000 3,000 5,000
Total 0 0 0 0 0

CChhiillddrreenn’’ss SSeerrvviicceess –– EEaarrllyy LLeeaarrnniinngg CCeennttrreeCOMMUNITY STRATEGIC OBJECTIVES (CSO’S)
Effectively and efficiently manage the business of Council within its Charter.
Support existing education facilities and enhance learning opportunities
Form partnerships and participate in networks which address the needs & interest of disadvantaged groups in our community.
Advocate for, support & provide services & facilities for families, children & young people.
Facilitate partnerships which create and support a caring community.
OBJECTIVES
To provide high quality long day care services through Upper Hunter Early Learning Centre for children from 6 weeks to 5 years in a fun, safe and caring environment that will meet the child care needs of families within the Scone district and foster the growth and development of each child.
MAJOR ACTIVITIES
Provision of Long Day Care for up to 51 weeks.
Operation of the service in accordance with: - requirements of the Commonwealth Department of Education, Employment and Workplace Relations
(DEEWR)- the licensing requirements of the National Quality Framework - the requirements of the Australian Children's Education and Care Authority - service policies
PERFORMANCE INDICATORS AAnticipated2012/13
Estimate/Target2013/14
Workload Indicator: Number of days of service Average number of children under 2 per day Average number of children 2 - under 3 per day Average number of children 3 - under 6 per day Capacity level
6.8 12.7 15.7 85%
7.513.5
1888% of full
licence
Effectiveness Indicator: Survey of parents indicates that LDC Service has better than satisfactory performance. (3 = “satisfactory”, 4 = “good”) License is maintained Accreditation is maintained
3.8
Achieved Achieved
3.8
AchievedAchieved
Efficiency Indicator: Number of children enrolled Number of children on waiting list On staffing ceiling of 39 children with 1 EC Teacher On staffing ceiling of 44 children with 2 EC Teachers
95 30
66.6
11030
NA6.6
Service Indicator No. of complaints 0 0
LEVEL OF SERVICEUpper Hunter Early Learning Centre is;
Licensed through the NSW Department of Human Services, Community Services
Accredited through Australian Children's Education and Care Quality Authority (ACECQA).

RevisedBudget
2012/13
2013/14DPOP
Budget2014/15Budget
2015/16Budget
2016/17Budget
Upper Hunter Shire Council2013/14-2016/17
Delivery Program & Operational Plan
Children`s Services - Early Learning CentreOperating Revenue
0110. User Fees & Charges (527,600) (554,750) (554,750) (554,750) (554,750)0115. Grants (27,100) (21,700) (21,700) (21,700) (21,700)0130. Other Income (5,865) (3,000) (3,000) (3,000) (3,000)0155. Childcare Benefits (179,300) (182,000) (182,000) (182,000) (182,000)
(739,865) (761,450) (761,450) (761,450) (761,450)Non Operating Revenue
0920. Depreciation (9,648) (9,727) (9,727) (9,727) (9,727)6119. F-19016.8515.6395 Upper Hunter ELC (2,000) 0 0 0 06195. F-19015.8511.6534 ELC Community Building (10,000) 0 0 0 0
(21,648) (9,727) (9,727) (9,727) (9,727)Operating Expenditure
0301. Administration Costs 588,333 594,450 594,450 594,450 594,4500350. General Expenses 35,001 43,710 43,710 43,710 43,7100415. Utilities 14,350 14,700 14,700 14,700 14,7000425. Cleaning Costs 17,050 17,050 17,050 17,050 17,0500530. Building Maintenance 15,600 14,400 14,400 14,400 14,4000680. Depreciation 9,648 9,727 9,727 9,727 9,7270980. Administration Overheads 6,954 14,329 14,329 14,329 14,3295098. Parent Group Op Expenses 891 0 0 0 06901. NAB - Loan - ELC 43,277 41,773 40,277 38,656 36,710
731,104 750,139 748,643 747,022 745,076Non Operating Expenditure
6901. NAB - Loan - ELC 22,059 23,564 25,059 26,680 28,6267075. T-19016.8515.6395 Upper Hunter ELC 0 2,038 6,034 1,155 8,1017146. T-19016.8515.6494 ELC Parent Fundraising 409 0 0 0 0
22,468 25,602 31,093 27,835 36,727Capital Expenditure
1030. ELC Painting Works 5,000 5,000 5,000 5,000 5,0001094. Parent Group Capital Works 0 2,000 2,000 2,000 2,0001110. Replace Fencing 11,000 0 0 0 01111. Resurface Bathroom 14,000 0 0 0 01112. Playground development 0 8,000 0 10,000 5,0001113. Renew Softfall 0 0 3,500 6,000 6,0001165. ELC - Replace Whitegoods 0 4,000 6,000 0 0
30,000 19,000 16,500 23,000 18,000
Total 22,059 23,564 25,059 26,680 28,626

CChhiillddrreenn’’ss SSeerrvviicceess -- FFaammiillyy DDaayy CCaarreeCOMMUNITY STRATEGIC OBJECTIVES (CSO’S)
Effectively and efficiently manage the business of Council within its Charter.
Form partnerships and participate in networks which address the needs & interest of disadvantaged groups in our community.
Advocate for, support & provide services & facilities for families, children & young people.
Facilitate partnerships which create and support a caring community.
OBJECTIVE
To provide home-based child care which reflects a high quality standard of children’s service which is able to meet the diverse child care needs of families within the Muswellbrook and Upper Hunter Shires.
MAJOR ACTIVITIES
Operation of the Upper Hunter Family Day Care (UHFDC) scheme in accordance with: - requirements of the Commonwealth Department of Education, Employment and Workplace Relations
(DEEWR)- requirements of the Education and Care Services National Law and Regulations - the requirements of the National Quality Standard rating and Assessment system - service policies - the Child Care Management System
Management of UHFDC ensuring the scheme functions in the best interests of the children in care, their families, care providers and the sponsoring body, Upper Hunter Shire Council.
Provision of pre-registration training for prospective Educators and in-service training for existing Educators and staff members.
Regular field visits to monitor compliance with regulations and safety standards.
Processing of applicable child care benefit and child care rebate payments to Educators in accordance with approval under the Child Care Management System
PERFORMANCE INDICATORS AAnticipated2012/13
Estimate/Target2013/14
Workload Indicator: Number of field (Educator visits: based on 1 visit per month per Educator with 1 extra per month Number of payments processed Number of placements Number of Registered Educators Available
312
8,500 170
25
276
7,900150
22
Effectiveness Indicator: Average Equivalent Full Time (EFT) utilised Number of children enrolled Number of children on waiting list Number of vacant child care positions (per week) Service Approval is maintained Service is successfully assessed and rated in accordance with the National Quality Standard
85 280
65 5
Achieved Achieved
70300
6510
AchievedAchieved
Service Indicator: Number of complaints 0 0
LEVEL OF SERVICEUpper Hunter Family Day Care:
holds a Service Approval under the Education and Care Services National Law and Regulation, as determined by the Department of Education and Training
is assessed and rated as Meeting or Exceeding the National Quality Standard

RevisedBudget
2012/13
2013/14DPOP
Budget2014/15Budget
2015/16Budget
2016/17Budget
Upper Hunter Shire Council2013/14-2016/17
Delivery Program & Operational Plan
Children`s Services - Family Day CareOperating Revenue
0110. User Fees & Charges (129,718) (134,144) (134,144) (134,144) (134,144)0115. Grants (105,405) (94,158) (94,158) (94,158) (94,158)0130. Other Income (4,400) (5,000) (5,000) (5,000) (5,000)0155. Childcare Benefits (380,000) (315,900) (315,900) (315,900) (315,900)
(619,523) (549,202) (549,202) (549,202) (549,202)Non Operating Revenue
6077. F-19015.8511.6329 Early Intervention (4,795) 0 0 0 0(4,795) 0 0 0 0
Operating Expenditure0301. Administration Costs 222,561 214,685 214,685 214,685 214,6850350. General Expenses 7,124 6,730 6,730 6,730 6,7300393. CCB Agency - Carer Payments 380,000 316,650 316,650 316,650 316,6500394. Educators 4,300 3,135 3,135 3,135 3,1350980. Administration Overheads 10,297 4,980 4,980 4,980 4,980
624,282 546,180 546,180 546,180 546,180Non Operating Expenditure
7147. T-19016.8515.6394 Family Day Care 36 3,022 3,022 3,022 3,02236 3,022 3,022 3,022 3,022
Total 0 0 0 0 0

SSoocciiaall PPrrootteeccttiioonnCOMMUNITY STRATEGIC OBJECTIVES (CSO’S)
Form partnerships and participate in networks which address the needs & interest of disadvantaged groups in our community.
Advocate for, support & provide services & facilities for families, children & young people.
Facilitate partnerships which create and support a caring community.
Facilitate healthy lifestyles through participation by & in partnership with the community in sports & cultural activities.
Effectively and efficiently manage the business of the Council within it’s Charter
OBJECTIVESTo advocate for and promote access to services & facilities available within the Upper Hunter Shire community for special target groups, as identified in the Social/Community Plan. To work with local organizations and community groups to provide a safe community, encouraging a healthy lifestyle through education and promotion to residents of Upper Hunter Shire. To promote and facilitate volunteering in the Shire Exercising effective financial control in relation to maintenance and Capital Works Programs set out in Council’s Delivery Program and operational Plan To advocate and lobby to ensure the community has access to essential health services
MAJOR ACTIVITIES
To facilitate the implementation of the Disability Access Action (DDA) Plan for Council.
Prioritising disability access needs of the community, and to coordinate DDA compliance in all aspects of Council.
To ensure Senior Residents are aware of services & facilities available to them and their input and achievements are recognised and promoted in the community.
To ensure Council’s child protection policy is compliant with regulations and implemented into Council’s operations where required.
Implement Council’s Volunteer Administrative Principle.
To update the crime prevention plan ensuring it remains relevant.
Raise awareness of transport options to the community including the provision of the Merriwa district community bus.
Participate in Transport Working Group to develop strategies and ideas and investigate opportunities to address issues raised in the community, including enhancing train and air services to Scone to provide better linkages to urban areas.
To ensure health facilities in Upper Hunter Shire provide appropriate and essential health services to the community.
Implement and encourage healthy lifestyle opportunities in Upper Hunter Shire, e.g. Cancer Council Partnership..
PERFORMANCE INDICATORS AAnticipated2012/13
Estimate/Target2013/14
Workload Indicator: No of Seniors Week activities planned Council represented on Upper Hunter Transport Working Party Organize an event for International Women’s Day Assist with Cancer Council related activities & Development
4Achieved
Achieved Achieved
4Achieved
AchievedAchieved
Effectiveness Indicator: Attendance at Seniors Week activities No of organisations participating in Seniors Expo No of community members attended Seniors Expo
250 10 50
2001050
Efficiency Indicator: Achievement of the major activities within budget. 100% 100%
Service Indicator: No of complaints received from community members 0 0
LEVEL OF SERVICEInformation, services, facilities and activities are available within the Upper Hunter Shire community for special target groups.

RevisedBudget
2012/13
2013/14DPOP
Budget2014/15Budget
2015/16Budget
2016/17Budget
Upper Hunter Shire Council2013/14-2016/17
Delivery Program & Operational Plan
Social ProtectionOperating Revenue
0115. Grants (1,100) (9,000) (1,000) (1,000) (1,000)0130. Other Income (2,324) (2,200) (2,200) (2,200) (2,200)0140. Contributions (800) (1,830) (1,830) (1,830) (1,830)
(4,224) (13,030) (5,030) (5,030) (5,030)Non Operating Revenue
0920. Depreciation (16,961) (17,460) (17,460) (17,460) (17,460)6196. F-19015.8511.6535 Local Dom Violence (405) 0 0 0 0
(17,366) (17,460) (17,460) (17,460) (17,460)Operating Expenditure
0350. General Expenses 1,500 6,350 5,150 5,150 5,1500415. Utilities 3,285 3,300 3,300 3,300 3,3000660. 11/12 Local Domestic Violence Committee 405 0 0 0 00680. Depreciation 16,961 17,460 17,460 17,460 17,4605001. International Women's Day Exp 1,500 2,700 2,700 2,700 2,7005012. Senior Citizens Week Exp 4,000 6,200 6,200 6,200 6,200
27,651 36,010 34,810 34,810 34,810Capital Expenditure
0841. Men's Shed Upgrade 624 0 0 0 00983. Mdi Mens Shed 0 8,000 0 0 0
624 8,000 0 0 0
Total 6,685 13,520 12,320 12,320 12,320

YYoouutthh SSeerrvviicceessCOMMUNITY STRATEGIC OBJECTIVES (CSO’S)
Advocate for, support & provide services & facilities for families, children & young people.
Facilitate partnerships which create and support a caring community.
Connect our communities through activities and events, online technologies and infrastructure
Support existing education facilities & enhance learning opportunities.
Facilitate healthy lifestyles through participation by and in partnership with the community in sports & cultural activities.
OBJECTIVESTo support young people and their families so that they can enhance their independence, safety, self esteem and/or quality of life within the community. To provide effective youth services that meet the needs of young people and comply with Department of Human Services EIPP funding and relevant legislation. To liaise with schools in the area to encourage partnerships to promote the planning and development of a range of community services which respond to the needs of young people in the Shire. To support new youth initiatives and encourage self-driven activities for young people. To provide young people with new and unique experiences aimed at enhancing leadership and team work skills To create community connections with young people. To provide an early intervention casework and referral service for young people at risk or harm to reduce the need for Departmental intervention and placement.
MAJOR ACTIVITIES
Support and act as mentors to youth community groups such as Upper Hunter Youth Council
Provide a voice for youth of the Shire through Youth Groups, Upper Hunter Youth Council, Youth Services Committee
Develop Youth Week events each year with representatives of other youth focused groups in the community.
Showcase the skills, talents and abilities of young people in our communities.
Resource and support Youth Services including; Merriwa Youth Centre, Merriwa Youth Activities Project, Murrurundi Youth Centre, Murrurundi Homework Project, Scone Youth Centre.
Plan, promote and implement a range of social, educational and recreational programs in consultation with young people in Upper Hunter Shire.
Include young people in decision making.
Work towards development of partnership with schools to promote opportunities for skills development of staff and linkages with youth centres.
Source external funding for youth related projects.
Gather sponsorship and provide 6 community sponsored berths on the Young Endeavour in December/January.
Liaise with the Community Development Committee to oversee the Young Endeavour Scheme.
Provide Casework and Skills training services to meet Service specifications under the Early Intervention and Placement (EIPP) Program to support young people
PERFORMANCE INDICATORS AAnticipated2012/13
Estimate/ Target2013/14
Workload Indicator: MMerriwa Youth CentreNo of hours Merriwa Youth Centre opens per week:- Drop In CaseworkNo of monthly youth program calendars/Newsletters
Murrurundi Youth CentreNo of hours Murrurundi Youth Centre opens per week:- Drop In CaseworkNo of monthly youth program calendars/Newsletters
Scone Youth ClubNo of hours Scone Youth Club opens per week:- Drop in
10hrs/week
12 pa
8 hrs/week
12 pa
6hrs/week
73
12pa
62
12pa
7

YYoouutthh SSeerrvviicceessCaseworkNo of monthly youth program calendars/Newsletters Youth Week activities held in each service centre annually No of berths offered on the Young Endeavour Scheme
EIPP Requirements (transitional) -Advice & support - Casework -Skills Groups Holiday Activity
12 pa 16
246 units total 20 units 40 units
144 units 42 units
312pa
16
246 total units20 units40 units
144 units42 units
Effectiveness Indicator:
Average attendees at the Merriwa Youth Centre per month. Average attendees at the M’di Youth Centre per month. Average attendees at the Scone Youth Club per month. Number of different services involved in programs offered to young people in Upper Hunter Shire. No of participants in Youth Week events Number of nominees for the Young Endeavour Scheme
160 40
200
10 100
25
10070
120
10100
25
Efficiency Indicator: Achievement of the major activities within budget 90% 90%
Service Indicator: Satisfaction of stakeholders, as measured by the outcome of a survey. (2 = poor, 3 = satisfactory, 4 = good)
3.5 3.5
LEVEL OF SERVICEYouth services are relevant to the target group and programs and Casework, are delivered from each centre weekly. Skills groups , excursions and referrals are regularly undertaken.

RevisedBudget
2012/13
2013/14DPOP
Budget2014/15Budget
2015/16Budget
2016/17Budget
Upper Hunter Shire Council2013/14-2016/17
Delivery Program & Operational Plan
Youth ServicesOperating Revenue
0110. User Fees & Charges (9,180) (11,650) (11,650) (11,650) (11,650)0115. Grants (182,746) (159,610) (143,880) (143,880) (143,880)0140. Contributions (26,557) (16,573) (20,250) (20,250) (20,250)
(218,483) (187,833) (175,780) (175,780) (175,780)Non Operating Revenue
0920. Depreciation (16,325) (13,800) (13,800) (13,800) (13,800)6029. F-19015.8513.6356 Young Endeavour Cont 0 (3,677) 0 0 06030. F-19016.8515.6390 Scn Youth Club 0 (8,000) 0 0 06067. F-19015.8510.6308 s94 R&C Scn 0 (10,000) 0 0 06113. F-19015.8513.6355 Putt Putt Golf Contrib (430) 0 0 0 06226. F-19015.8511.6546 Yth Opportunity Grant 0 (29,830) 0 0 0
(16,755) (65,307) (13,800) (13,800) (13,800)Operating Expenditure
0300. Employee Costs 159,445 173,170 173,170 173,170 173,1700350. General Expenses 29,680 32,900 32,900 32,900 32,9000415. Utilities 10,070 10,650 10,650 10,650 10,6500425. Cleaning Costs 2,300 2,300 2,300 2,300 2,3000512. Youth Centre Building Maintenance 18,700 12,800 12,800 12,800 12,8000651. Youth Transport 9,000 8,500 8,500 8,500 8,5000652. Youth Programs 12,500 17,500 17,500 17,500 17,5000663. Youth Council Expenses 0 2,500 2,500 2,500 2,5000680. Depreciation 16,325 13,800 13,800 13,800 13,8000980. Administration Overheads 16,084 21,889 21,889 21,889 21,8895044. YS-Putt Putt Golf Project 700 400 400 400 4005047. Young Endeavour Scheme Exp 30,821 30,500 30,500 30,500 30,5005049. Youth Week Program Exp 5,950 6,150 6,150 6,150 6,1505103. Youth Opportunities 8,830 43,560 13,730 0 05104. Country Arts Support Program 2,750 2,000 0 0 0
323,155 378,619 346,789 333,059 333,059Non Operating Expenditure
7028. T-19016.8515.6389 Youth Services 8,000 0 0 0 07029. T-19015.8513.6356 Young Endeavour Cont 3,677 0 0 0 07226. T-19015.8511.6546 Yth Opportunitie Grant 29,830 0 0 0 0
41,507 0 0 0 0Capital Expenditure
0786. New Scn Youth Centre 3,500 0 1,500 0 01031. Mdi Youth Centre Wall Lining 0 8,000 0 0 01033. Youth Equipment Upgrade 2,000 3,000 3,000 2,000 2,0001166. Yth Ctr - Kitchen Upgrades 0 0 0 10,000 01167. Yth Ctr - Painting 0 0 0 0 7,0001168. Scn Yth Ctr - Covered Walkway 0 0 10,000 0 01169. Scn Yth Ctr - Display Boards 0 0 2,500 0 01170. Yth Ctr - Computer Upgrade 0 0 0 0 3,0004316. Marketing Strategies 0 3,000 0 0 04317. Scn-Replace Fences 0 10,000 0 0 04318. New Awnings Scn/Mwa 0 0 2,500 2,500 04319. Mwa - Floor Coverings 0 0 0 5,000 04320. Mdi - Floor Coverings 0 0 5,000 0 04323. Electrical Upgrades Mwa/Mdi 0 3,000 0 0 0
5,500 27,000 24,500 19,500 12,000
Total 134,924 152,479 181,709 162,979 155,479

ECONOMIC AFFAIRS
Summary .................................................................. 121
Camping Areas & Caravan Parks ..................... 122
Community Technology Centres ..................... 124
Economic Promotion ........................................... 126
Private Works ......................................................... 128
Real Estate ............................................................. 130
Saleyards ................................................................. 132
Tourism & Area Promotion ................................ 134

RevisedBudget
2012/13
2013/14DPOP
Budget2014/15Budget
2015/16Budget
2016/17Budget
Upper Hunter Shire Council2013/14-2016/17
Delivery Program & Operational Plan
Economic AffairsOperating Revenue
Camping Areas & Caravan Parks (43,200) (41,500) (41,500) (41,500) (41,500) Community Technology Centres (42,623) (39,250) (36,450) (36,450) (36,450) Economic Promotion (50,500) (50,500) (50,500) (500) (500) Private Works (236,000) (300,000) (300,000) (300,000) (300,000) Real Estate (2,348,159) (2,557,576) (1,867,266) (1,470,666) (1,470,166) Saleyards (534,833) (593,508) (743,408) (743,408) (543,408) Tourism & Area Promotion (138,700) (136,900) (66,900) (66,900) (66,900)
(3,394,015) (3,719,234) (3,106,024) (2,659,424) (2,458,924)Non Operating Revenue
Camping Areas & Caravan Parks (23,753) (39,857) (9,857) (9,857) (9,857) Community Technology Centres (7,108) (12,486) (12,486) (12,486) (12,486) Economic Promotion 0 (5,000) 0 (18,300) 0 Real Estate (721,461) (108,948) (658,279) (100,810) (100,810) Saleyards (734,857) (162,428) (102,428) (112,428) (90,460) Tourism & Area Promotion (20,142) (56,530) (12,030) (12,030) (12,030)
(1,507,321) (385,249) (795,080) (265,911) (225,643)Operating Expenditure
Camping Areas & Caravan Parks 88,427 90,089 90,089 90,089 90,089 Community Technology Centres 87,414 89,085 89,085 89,085 89,085 Economic Promotion 194,879 224,946 219,946 189,096 170,796 Private Works 168,156 244,110 244,110 244,110 244,110 Real Estate 448,317 423,156 415,358 412,488 409,266 Saleyards 492,514 550,155 548,117 546,107 543,916 Tourism & Area Promotion 455,870 456,295 384,095 384,095 384,095
1,935,577 2,077,836 1,990,800 1,955,070 1,931,357Non Operating Expenditure
Economic Promotion 27,600 5,850 5,850 0 0 Real Estate 67,830 2,285,677 87,496 686,297 139,019 Saleyards 23,998 25,681 27,719 29,729 69,952 Tourism & Area Promotion 20,000 0 0 0 0
139,428 2,317,208 121,065 716,026 208,971Capital Expenditure
Camping Areas & Caravan Parks 14,151 30,000 15,000 0 0 Community Technology Centres 3,250 2,800 0 0 0 Real Estate 2,587,010 8,000 2,067,000 517,000 1,067,000 Saleyards 753,178 180,100 270,000 280,000 20,000 Tourism & Area Promotion 8,752 44,000 30,000 30,000 30,000
3,366,341 264,900 2,382,000 827,000 1,117,000
Total 540,010 555,461 592,761 572,761 572,761

CCaammppiinngg AArreeaass && CCaarraavvaann PPaarrkkssCOMMUNITY STRATEGIC OBJECTIVES (CSO’S)
Advocate for support and provide services and facilities for families, children and young people. Facilitate healthy lifestyles through participation by and in partnership with the community in sports, cultural activities and active lifestyles. Provide for replacement and improvement of community infrastructure through best practice and risk management.
OBJECTIVESTo provide camping areas which provide a basic level of services to users of the facility. To provide a Caravan Park in Merriwa which provides a basic level of service to users of the facility.
MAJOR ACTIVITIES
Undertake routine maintenance of the amenities building and associated park infrastructure and make improvements where identified. .
PERFORMANCE INDICATORS AAnticipated2012/13
Estimate / Target2013/14
Camping Areas
Workload: Numbers of camping sites utilised during the year 500 500
Effectiveness Number of campers who utilise the camping grounds Moonan Flat: StewartsBrook
300
200
MoonanFlat: StewartsBrook
300
200
Efficiency Major activities managed within budget allocation. Achieved Achieved
Service: Number of complaints 0 0
Caravan Parks
Workload: Numbers of caravan sites utilised during the year 1,000 1,000
Effectiveness Number of caravans which utilise the Caravan Park 1,000 1,000
Efficiency Major activities managed within budget allocation. Achieved Achieved
Service: Number of complaints 0 0
LEVEL OF SERVICELevel of service to remain at the same level as that in 2012/13

RevisedBudget
2012/13
2013/14DPOP
Budget2014/15Budget
2015/16Budget
2016/17Budget
Upper Hunter Shire Council2013/14-2016/17
Delivery Program & Operational Plan
Camping Areas & Caravan ParksOperating Revenue
0273. Camping Grounds Revenue (10,200) (8,500) (8,500) (8,500) (8,500)0274. Caravan Park Revenue (33,000) (33,000) (33,000) (33,000) (33,000)
(43,200) (41,500) (41,500) (41,500) (41,500)Non Operating Revenue
0920. Depreciation (8,753) (9,857) (9,857) (9,857) (9,857)6064. F-19016.8516.6471 Camping Grounds 0 (30,000) 0 0 06074. F-19015.8510.6305 s94A Contributions (15,000) 0 0 0 0
(23,753) (39,857) (9,857) (9,857) (9,857)Operating Expenditure
0415. Utilities 15,620 15,660 15,660 15,660 15,6600473. Camping Grounds Expenses 8,200 8,250 8,250 8,250 8,2500474. Caravan Park Expenses 42,386 42,550 42,550 42,550 42,5500530. Building Maintenance 10,550 10,550 10,550 10,550 10,5500680. Depreciation 8,753 9,857 9,857 9,857 9,8570980. Administration Overheads 2,918 3,222 3,222 3,222 3,222
88,427 90,089 90,089 90,089 90,089Capital Expenditure
1204. Moonan Flat Playground Equipment 15,000 0 0 0 04121. Stewarts Brook Camping Amenities 0 30,000 0 0 05034. Moonan Flat - Add Power 0 0 5,000 0 05035. Masterplan Preparation/Implementation 0 0 10,000 0 0
15,000 30,000 15,000 0 0
Total 36,474 38,732 53,732 38,732 38,732

CCoommmmuunniittyy TTeecchhnnoollooggyy CCeennttrreessCOMMUNITY STRATEGIC OBJECTIVES (CSO’S)
Advocate for, support & provide services & facilities for families, children and young people.
Facilitate partnerships which create and support a caring community.
Connect our communities through activities and events, online technologies and infrastructure
Advocate for, develop and implement programs, services and facilities for our ageing community
Support existing education facilities & enhance learning opportunities.
Facilitate healthy lifestyles through participation by and in partnership with the community in sports & culture.
OBJECTIVES
To promote and encourage access and use of information technology to the community.
To encourage and offer training opportunities and skills development in information technology to the community.
Provision of other Government services to the community.
MAJOR ACTIVITIES
To provide affordable high-speed access to internet, access to computers and software.
To provide access to a range of new technologies and services that would otherwise not be available in the community.
To provide training facilities to meet the needs of the community.
To provide services (eg: Links, training) that assist with maintaining the financial sustainability of the CTC’s.
PERFORMANCE INDICATORS AAnticipated2012/13
Estimate/Target2013/14
Workload Indicator: No of hours per week allocated to achieving the major activities
Merriwa 7 days per week
Murrurundi 20 hrs/week
Merriwa 7 days per week
Murrurundi 20 hrs/week
Effectiveness Indicator: Number of customers using the Centres. 5,000 4,000
Efficiency Indicator: Achievement of the major activities within budget. 95% 95%
Service Indicator: Number of complaints received Number of training participants Number of Centrelink customers Internet usage
0400
1,500 1,400
0200
1,0001,200
LEVEL OF SERVICEMerriwa is staffed by a full time staff member who does both CTC and Visitor Information Centre (VIC) functions. The centre is supplemented by casual and weekend VIC staff and by volunteers. Murrurundi is staffed by a part time officer for 20 hours per week together with a part-time casual employee and some assistance from the VIC volunteers. Both Centres provide a professional service as a government Centrelink agency.

RevisedBudget
2012/13
2013/14DPOP
Budget2014/15Budget
2015/16Budget
2016/17Budget
Upper Hunter Shire Council2013/14-2016/17
Delivery Program & Operational Plan
Community Technology CentresOperating Revenue
0275. CTC - Mdi (26,723) (23,750) (22,150) (22,150) (22,150)0276. CTC - Mwa (15,900) (15,500) (14,300) (14,300) (14,300)
(42,623) (39,250) (36,450) (36,450) (36,450)Non Operating Revenue
0920. Depreciation (4,908) (12,486) (12,486) (12,486) (12,486)6189. F-19015.8513.6529 Edu One Projects (2,200) 0 0 0 0
(7,108) (12,486) (12,486) (12,486) (12,486)Operating Expenditure
0415. Utilities 8,000 5,500 5,500 5,500 5,5000475. CTC- Mdi 33,800 30,909 30,909 30,909 30,9090476. CTC- Mwa 31,400 30,200 30,200 30,200 30,2000680. Depreciation 4,908 12,486 12,486 12,486 12,4860980. Administration Overheads 9,306 9,990 9,990 9,990 9,990
87,414 89,085 89,085 89,085 89,085Capital Expenditure
0900. CTC Edu One Project - Merriwa 0 1,200 0 0 00903. CTC Edu One Project - Murrurundi 3,250 1,600 0 0 0
3,250 2,800 0 0 0
Total 40,933 40,149 40,149 40,149 40,149

EEccoonnoommiicc PPrroommoottiioonnCOMMUNITY STRATEGIC OBJECTIVES (CSO’S)
Effectively and efficiently manage the business of Council within its Charter
Encourage Shire and Local Area Recognition through promotion and marketing..
Support and develop a thriving and growing business community with increased employment and available commercial and industrial land.
Encourage a diverse economy whilst promoting and preserving our agricultural and equine industries
Establish the Shire as a preferred destination for visitors.
Facilitate and provide for a growing resident population, including, for example, affordable housing, community amenities, health and welfare services.
OBJECTIVESTo deliver outcomes as identified in the Economic Development and Tourism Strategic Plan. To provide a reasonable level of support for the economic promotion of the Shire.
MAJOR ACTIVITIES
Encourage sustainable development in the Upper Hunter Shire.
Assist committees of Council, Progress/Development Associations and Chambers of Commerce with economic development activities associated with their communities.
Financial support for other organisations involved in the economic promotion of the Shire.
Development and maintenance of an Upper Hunter Shire Economic Development & Tourism Plan that is consistent with Council’s Community Plans.
PERFORMANCE INDICATORS AAnticipated2012/13
Estimate/Target2013/14
Business Development
Workload: Number of enquiries
Number of enquiries leading to a face to face meeting
Number of Chamber/Business meetings attended
Number of business breakfasts organised
40 30 12
4
403012
0
Efficiency: Major activities managed within budget allocation Achieved Achieved
Effectiveness: Council land developments achieved within timeframe Achieved Achieved
Service: Council reports prepared in a timely manner Achieved Achieved
Workload: Implementation of projects identified within the ED&T Strategic Plan 2010
Number of successful funding applications
Provide assistance to festival committees within the Upper Hunter Shire
Provide assistance to business representative organisations such as Chambers of Commerce
Achieved
4Achieved
Achieved
Achieved
4Achieved
Achieved
Efficiency: Major activities managed within budget allocation. Achieved Achieved
Effectiveness: No of chamber and business group meetings attended 8 12
Service: Council reports completed in a timely manner Achieved Achieved
Workload: Number of community organisations worked with and assisted with grant applications
Number of workshops conducted
Number of applications lodged or assisted with
Value of applications – Community
Value of applications - Council
250
230
$150,000 $4,000,000
200
230
150,0002,000,000
Efficiency: Major activities managed within budget allocation Achieved Achieved
Effectiveness: Number of attendees at workshops 40 40
LEVEL OF SERVICEConsistent with levels provided in 2012/13

RevisedBudget
2012/13
2013/14DPOP
Budget2014/15Budget
2015/16Budget
2016/17Budget
Upper Hunter Shire Council2013/14-2016/17
Delivery Program & Operational Plan
Economic PromotionOperating Revenue
0115. Grants (50,000) (50,000) (50,000) 0 00140. Contributions (500) (500) (500) (500) (500)0277. Community Grants Officer 0 0 0 0 0
(50,500) (50,500) (50,500) (500) (500)Non Operating Revenue
6022. F-19015.8511.6332 C&A Community Grants 0 0 0 (18,300) 06153. F-19016.8516.6504 Econ Prom Projects 0 (5,000) 0 0 0
0 (5,000) 0 (18,300) 0Operating Expenditure
0350. General Expenses 15,600 14,270 14,270 14,270 14,2700391. Business Development Expenses 96,000 97,000 97,000 97,000 97,0000477. Community Grants Officer 37,400 44,150 44,150 18,300 00980. Administration Overheads 32,479 34,326 34,326 34,326 34,3265062. Scn Chamber of Commerce 1,700 1,700 1,700 1,700 1,7005064. UH Economic Diversity Project 5,000 10,000 5,000 5,000 5,0005067. Hunter Region BEC 1,500 1,500 1,500 1,500 1,5005068. Financial Loss Control Projects 0 5,000 5,000 0 05069. Marketing Projects incl Country Week 3,000 15,000 15,000 15,000 15,0005072. Mwa Progress Association 500 500 500 500 5005073. Mdi Chamber of Commerce 500 500 500 500 5005078. Welcome to Upper Hunter Project 700 500 500 500 5005100. Mwa Xmas Party 500 500 500 500 500
194,879 224,946 219,946 189,096 170,796Non Operating Expenditure
7022. T-19015.8511.6332 C & A Comm Grants 12,600 5,850 5,850 0 07163. T-19016.8516.6504 Econ Prom Projects 15,000 0 0 0 0
27,600 5,850 5,850 0 0
Total 171,979 175,296 175,296 170,296 170,296

PPrriivvaattee WWoorrkkssCOMMUNITY STRATEGIC OBJECTIVES (CSO’S)
Support and develop a thriving and growing business with increase employment.
To effectively and efficiently manage the business of Council within its charter.
Develop economic and intergenerational plans for future infrastructure needs
Encourage and implement systems for minimisation of the environmental footprint of the Shire, including energy efficiency and consumption of natural resources
Encourage a diverse economy whilst promoting and preserving our agricultural and equine industries
OBJECTIVESTo provide all residents access to services at commercial rates. To generate additional revenue for Council by undertaking appropriate work for profit. To increase the utilization of Council’s plant and equipment. To provide a high level of competence for all works undertaken. To undertake all works in accordance with the relevant standards and legislative requirements.
MAJOR ACTIVITIES
Infrastructure design and construction for developers, business, individuals and other government departments.
Road/driveway maintenance and construction activities.
Concrete works.
PERFORMANCE INDICATORS AAnticipated2012/13
Estimate/Target2013/14
Workload Indicator: Number of private works invoices issuedTotal revenue
200 $341,000
200$300,000
Effectiveness Indicator: Works carried out meets industry standards and customer expectations
100% 100%
Efficiency Indicator: Level of profit achieved 20% 20%
Service Indicator: Number of unresolved complaints from clients 0 0
LEVEL OF SERVICEDependant on the level of requests for private works to be carried out, not expected to vary greatly from 2012/13.

RevisedBudget
2012/13
2013/14DPOP
Budget2014/15Budget
2015/16Budget
2016/17Budget
Upper Hunter Shire Council2013/14-2016/17
Delivery Program & Operational Plan
Private WorksOperating Revenue
0110. User Fees & Charges (236,000) (300,000) (300,000) (300,000) (300,000)(236,000) (300,000) (300,000) (300,000) (300,000)
Operating Expenditure0695. Private Works 152,096 227,002 227,002 227,002 227,0020980. Administration Overheads 16,060 17,108 17,108 17,108 17,108
168,156 244,110 244,110 244,110 244,110
Total (67,844) (55,890) (55,890) (55,890) (55,890)

RReeaall EEssttaatteeCOMMUNITY STRATEGIC OBJECTIVES (CSO’S)
Support and develop a thriving and growing business community with increased employment and available commercial and industrial land.
Facilitate and provide for a growing population, including, for example, affordable housing, community amenities, health and welfare services.
Develop economic and intergenerational plans for future infrastructure needs.
OBJECTIVES
To effectively manage and monitor the portfolio of Residential Land, Commercial Property and Residential Property owned by Council throughout the shire. To ensure, where possible, that the community needs in these three areas are met at no cost to general rate payers.
MAJOR ACTIVITIES
Cost effective development and sale of residential land in towns that Council has a land bank and there is a market need.
The purchase and maintenance of commercial properties as required.
The purchase and maintenance of residential properties as required.
PERFORMANCE INDICATORS AAnticipated2012/13
Estimate/Target2013/14
Land Development
Workload: Number of Land Development meetings in relation to the development, marketing and sale of the residential land.
Number of lots developed.
Number of lots sold
4
34 25
4
2030
Effectiveness: Residential land is developed in accordance with Council’s policies.
Achieved Achieved
Efficiency: Residential land is developed within budget Achieved Achieved
Service: Residential land is available for sale in the three towns at all times as market demands dictate.
Achieved Achieved
Residential Property
Workload Indicator: Number of houses maintained 7 6
Effectiveness Indicator:
Major activities managed within budget Achieved Achieved
Efficiency Indicator: Number of properties fully occupied 6 6
Service Indicator: Number of complaints received 0 0
Commercial Property
Workload Indicator: Number of properties maintained 6 6
Effectiveness Indicator:
Major activities managed within budget Achieved Achieved
Efficiency Indicator: Number of properties fully occupied 6 6
Service Indicator: Number of complaints received 0 0
LEVEL OF SERVICETo be provided to meet the requirements of current real estate markets. Council owned buildings are maintained to a standard expected by the community given reasonable cost.

RevisedBudget
2012/13
2013/14DPOP
Budget2014/15Budget
2015/16Budget
2016/17Budget
Upper Hunter Shire Council2013/14-2016/17
Delivery Program & Operational Plan
Real EstateOperating Revenue
0280. Commercial Properties Revenue (199,406) (197,716) (199,406) (199,406) (199,406)0281. Residential Properties Revenue (81,400) (81,860) (87,860) (91,260) (90,760)0287. Land Development Revenue (2,067,353) (2,278,000) (1,580,000) (1,180,000) (1,180,000)0950. Proceeds on Sales of Assets 0 0 0 0 0
(2,348,159) (2,557,576) (1,867,266) (1,470,666) (1,470,166)Non Operating Revenue
0920. Depreciation (107,810) (108,948) (100,810) (100,810) (100,810)6121. F-19016.8516.6403 Other Cncl Residences (44,517) 0 0 0 06126. F-19016.8523.6446 Special Proj Land Dev (569,134) 0 (557,469) 0 0
(721,461) (108,948) (658,279) (100,810) (100,810)Operating Expenditure
0350. General Expenses 300 500 500 500 5000398. Scn Medical Ctr Loan - Wpac 85,070 83,249 81,297 79,207 76,9670399. Scn Medical Ctr Ext Loan 26,737 26,019 25,311 24,531 23,5490415. Utilities 93,000 75,900 78,900 78,900 78,9000425. Cleaning Costs 14,000 15,000 15,000 15,000 15,0000480. Other Commercial Properties 12,150 12,300 12,300 12,300 12,3000482. Land Development Maintenance Expenses 10,500 7,500 7,500 7,500 7,5000530. Building Maintenance 27,700 27,100 27,100 27,100 27,1000611. Land Development Other Expenses 24,000 15,000 15,000 15,000 15,0000680. Depreciation 107,810 108,948 100,810 100,810 100,8100980. Administration Overheads 47,050 51,640 51,640 51,640 51,640
448,317 423,156 415,358 412,488 409,266Non Operating Expenditure
0398. Scn Medical Ctr Loan - Wpac 25,575 27,396 29,347 31,437 33,6760399. Scn Medical Ctr Ext Loan 8,655 9,374 10,081 10,861 11,8447011. T-19016.8516.6402 Bottlebrush Pl Units 6,500 6,400 6,400 6,400 6,4007013. T-19016.8516.6404 YHA, Segenhoe 15,990 30,800 30,800 30,800 30,8007014. T-19016.8516.6403 Other Cncl Residences 0 2,760 2,760 2,760 2,7607034. T-19016.8523.6446 Special Proj Land Dev 0 2,200,839 0 595,931 45,4317076. T-19016.8516.6401 Medical Centre, Scn 11,110 8,108 8,108 8,108 8,108
67,830 2,285,677 87,496 686,297 139,019Capital Expenditure
0899. Aberdeen Hts Subdivision - Stg 2, 5 & 6 2,530,000 0 50,000 15,000 1,050,0000981. Aberdeen Heights Subdivision - Stg 7 0 0 2,000,000 0 00984. Oxley View Stage 2 0 0 0 0 15,0001000. Mdi - Rosedale Estate 0 0 15,000 500,000 01117. Youth Hostel Segenhoe Upgrade 14,010 0 0 0 04136. Abn Medical Centre Scope 2,000 0 0 0 04149. Mwa Shops Floor Coverings 0 6,000 0 0 04150. Residential Capital Works 5,210 2,000 2,000 2,000 2,0004623. William St Residence Upgrade 35,790 0 0 0 0
2,587,010 8,000 2,067,000 517,000 1,067,000
Total 33,537 50,309 44,309 44,309 44,309

SSaalleeyyaarrddssCOMMUNITY STRATEGIC OBJECTIVES (CSO’S)
Develop economic and intergenerational plans for future infrastructure needs.
Encourage Shire and Local Area Recognition through promotion and marketing.
Encourage and implement systems for minimisation of the environment footprint of the Shire, including energy efficiency and consumption of natural resources.
Encourage a diverse economy whilst promoting and preserving our agricultural and equine industries.
Effectively and efficiently manage the business of the Council within its Charter.
OBJECTIVES
To operate a quality livestock selling facility that observes all regulations, legislation, codes of practice governing the handling, movement, welfare, disposal and sale of livestock which operates at no cost to ratepayers and generates income to undertake improvements.
MAJOR ACTIVITIES
Operate the Scone and Upper Hunter Regional Saleyards and promote the market to the livestock industry.
Maintain EU accreditation for the saleyards.
Provision of NLIS and scanning services.
Undertake asset management in accordance with Council’s Strategic Works Program.
Implementation and management of OHS system.
Maintain status within top 10 of the major livestock selling facility in NSW.
Maintain membership of the Australian Livestock Marketing Association and encourage Association management to actively promote the benefits of the Saleyard System of selling.
Review the effectiveness of electronic scanning equipment installed at the Scone and Upper Hunter Regional Saleyards as part of the National Livestock Identification Scheme.
Capital improvement works to assets.
Maintain computer hardware, peripherals and software to maintain level of service.
PERFORMANCE INDICATORS AAnticipated2012/13
Estimate/Target2013/14
Workload Indicator: Cattle throughput 76,000 76,000
No. of sale days 65 64
Effectiveness Indicator: Average ranking in NSW saleyards 7 7
Efficiency Indicator: Average cost per head to operate saleyards $3.80 $4.00
Service Indicator: % of agents/vendors/buyers/ who rate facilities and operations as satisfactory
98 98
LEVEL OF SERVICE
Ongoing planning for the development of improved facilities including additional shade, to improve animal welfare, toilet upgrades and seating
Implementation of the “Effluent Reuse Strategy” prepared by EnviroAg The Scone and Upper Hunter Regional Saleyards Complex is recognized as being one of the market leaders in terms of volume and selling price achieved. NLIS and EU audit completed with satisfactory results. Maintain cattle throughput. WHS aware and ongoing system improvements.

RevisedBudget
2012/13
2013/14DPOP
Budget2014/15Budget
2015/16Budget
2016/17Budget
Upper Hunter Shire Council2013/14-2016/17
Delivery Program & Operational Plan
SaleyardsOperating Revenue
0110. User Fees & Charges (533,333) (541,908) (541,908) (541,908) (541,908)0115. Grants 0 (50,100) (200,000) (200,000) 00130. Other Income (1,500) (1,500) (1,500) (1,500) (1,500)
(534,833) (593,508) (743,408) (743,408) (543,408)Non Operating Revenue
0920. Depreciation (58,329) (90,460) (90,460) (90,460) (90,460)6049. F-19016.8516.6408 Saleyards (203,290) (71,968) (11,968) (21,968) 06141. F-19015.8512.6495 Saleyards Unspent Loan (473,238) 0 0 0 0
(734,857) (162,428) (102,428) (112,428) (90,460)Operating Expenditure
0301. Administration Costs 146,033 150,560 150,560 150,560 150,5600415. Utilities 41,612 39,950 39,950 39,950 39,9500508. Yards & Facility Maintenance 125,131 138,384 138,384 138,384 138,3840530. Building Maintenance 8,500 12,200 12,200 12,200 12,2000680. Depreciation 58,329 90,460 90,460 90,460 90,4600945. Loan Repayments 73,911 72,229 70,191 68,181 65,9900980. Administration Overheads 38,998 46,372 46,372 46,372 46,372
492,514 550,155 548,117 546,107 543,916Non Operating Expenditure
0945. Loan Repayments 23,998 25,681 27,719 29,729 31,9207049. T-19016.8516.6408 Saleyards 0 0 0 0 38,032
23,998 25,681 27,719 29,729 69,952Capital Expenditure
0724. Holding Yards 20,000 0 20,000 20,000 20,0000725. Saleyards Upgrade Power 33,178 0 0 0 00744. Yard Works 20,000 10,000 0 20,000 00755. Roofing 585,000 0 0 0 00873. Raised Lanes 35,000 0 0 0 00874. Saleyards Security System 0 55,100 5,000 0 00881. Saleyards Water Reuse Strategy 40,000 0 200,000 200,000 01017. Saleyards Kitchen Upgrade 20,000 0 0 0 01265. Front Entry & Drains 0 15,000 0 0 01266. Selling Ring Seat Upgrade 0 5,000 5,000 0 01267. Agent Cover 0 5,000 0 0 01268. Hydraulic Gates 0 50,000 0 0 01270. Drainage & Stormwater IMP 0 0 40,000 0 01271. Refurbish Toilets 0 0 0 40,000 01274. Staff Amenities 0 40,000 0 0 0
753,178 180,100 270,000 280,000 20,000
Total 0 0 0 0 0

TToouurriissmm && AArreeaa PPrroommoottiioonnCOMMUNITY STRATEGIC OBJECTIVES (CSO’S)
Encourage Shire and Local Area Recognition through promotion and marketing.
Encourage and build local community capacity and connectivity, within the context of both the Upper Hunter Shire and local areas.
OBJECTIVES
To deliver outcomes identified in the Economic Development & Tourism Strategic Plan
To provide a visitor information service through the Merriwa (Level 2 accreditation), Murrurundi (Level 3 accreditation), Aberdeen (Local I) and the Scone Visitor Information Centres (Level 1 accreditation), as an important component of the economic growth of the Upper Hunter Shire.
To deliver this service through impartial representation of all Shire operators to the Hunter, intra-state, interstate and international visitors and the community.
MAJOR ACTIVITIES
Manage the: - Merriwa VIC – 7 days per week; staffing includes volunteers, Tourist Officer and Casuals. - Murrurundi VIC – 7 days per week; staffing includes a number of dedicated volunteers with one volunteer also the
roster co-ordinator. - Scone VIC – 7 days per week, staffing includes a Tourism Coordinator, a trainee Tourist Officer and a small number of
Ambassadors - Aberdeen Information Centre - provision of financial support for a manned information centre co-located with the
Aberdeen Library
Promote the Upper Hunter Shire and tourism within and outside the Shire
Maximise revenue opportunities to reduce the overall cost to Council of service provision.
Foster partnerships between the Economic Development and Tourism Committee, town-based progress/development associations and chambers of commerce, and tourism organisations that operate in the Upper Hunter.
Increase visitation and bookings through the Council managed online booking system.
Develop partnerships with community event organisers in the Upper Hunter, and co-ordinate tourism events.
Promote the Merriwa Volunteers Programme, Murrurundi Volunteer Programme and the Scone Ambassador Programme to the community.
Improve the attractiveness of all Upper Hunter Shire VICs to blend with township culture/heritage and to be consistent with the overall shire brand.
To undertake activities identified in the Economic Development & Tourism Strategic Plan specific to tourism
PERFORMANCE INDICATORS AAnticipated2012/13
Estimate/Target2013/14
Workload Indicator: Visitors through the Visitor Information Centres 20,000 20,000
Effectiveness Indicator: Provision of a service that provides a high visitor experience satisfaction rating
Achieved Achieved
Efficiency Indicator: Operating expense per visitor through the Visitor Information Centres
$15.00 $18.00
Service Indicator: Enquiries:- WebsiteFaxTelephoneReferrals to Accommodation Ambassador/Volunteer Hours
1,000 900
3,000 3,000 2,500
1,0001,2003,0003,0002,800
LEVEL OF SERVICETo maintain a high level of professional and impartial tourism services to visitors and the community alike for the benefit of the Upper Hunter Shire and to work in partnership with other like minded departments and organisations to implement the Economic Development and Tourism Strategic Plan 2010.

RevisedBudget
2012/13
2013/14DPOP
Budget2014/15Budget
2015/16Budget
2016/17Budget
Upper Hunter Shire Council2013/14-2016/17
Delivery Program & Operational Plan
Tourism & Area PromotionOperating Revenue
0110. User Fees & Charges (500) (200) (200) (200) (200)0115. Grants 0 0 0 0 00130. Other Income (119,600) (118,700) (48,700) (48,700) (48,700)0140. Contributions (18,600) (18,000) (18,000) (18,000) (18,000)
(138,700) (136,900) (66,900) (66,900) (66,900)Non Operating Revenue
0920. Depreciation (11,959) (12,030) (12,030) (12,030) (12,030)6025. F-19015.8513.6469 Mwa Business Signage (2,720) 0 0 0 06051. F-19016.8516.6406 Festival of Fleeces (3,552) 0 0 0 06137. F-19016.8516.6519 Mdi Frontier Festival (1,411) 0 0 0 06143. F-19016.8516.6498 Tourism Projects (500) (44,500) 0 0 0
(20,142) (56,530) (12,030) (12,030) (12,030)Operating Expenditure
0301. Administration Costs 168,000 159,700 159,700 159,700 159,7000320. Trainee Costs 25,547 29,690 29,690 29,690 29,6900350. General Expenses 32,213 31,900 31,900 31,900 31,9000415. Utilities 13,450 12,300 12,300 12,300 12,3000510. Grounds Maintenance 3,800 3,800 3,800 3,800 3,8000530. Building Maintenance 10,100 9,600 9,600 9,600 9,6000578. PBR Event - White Park 65,500 65,700 0 0 00680. Depreciation 11,959 12,030 12,030 12,030 12,0300980. Administration Overheads 39,295 41,575 41,575 41,575 41,5755013. Promotion Expenses 9,500 8,000 8,000 8,000 8,0005021. Mwa Festival of Fleeces 20,000 20,000 20,000 20,000 20,0005022. Scn Horse Festival 5,000 5,000 5,000 5,000 5,0005023. Abn Highland Games 3,000 3,000 3,000 3,000 3,0005024. Other Small Festivals Contributions 3,000 3,000 3,000 3,000 3,0005025. Mdi King of the Ranges 3,500 3,500 3,500 3,500 3,5005027. Scone Silhouettes 500 11,500 5,000 5,000 5,0005052. Scn Monthly Markets Promotions Exp 500 0 0 0 05053. Abn Information Centre 17,500 17,500 17,500 17,500 17,5005091. Home Hosting Expense 1,800 500 500 500 5005093. Mdi Frontier Festival 18,986 18,000 18,000 18,000 18,0005102. Merriwa Brochure 2,720 0 0 0 0
455,870 456,295 384,095 384,095 384,095Non Operating Expenditure
7152. T-19016.8516.6498 Tourism Projects 20,000 0 0 0 020,000 0 0 0 0
Capital Expenditure0716. Scn Thoroughbred Walk of Fame 0 0 0 0 00718. Mdi Historical Walk Plaques 4,500 0 0 0 00719. Town Main Sts - Banners & Frames 752 0 0 0 04007. ED & T Projects 3,500 44,000 30,000 30,000 30,000
8,752 44,000 30,000 30,000 30,000
Total 325,780 306,865 335,165 335,165 335,165

ENVIRONMENT
Summary .................................................................. 137
Noxious Plants & Insect/Vermin Control ....... 138
Solid Waste Management .................................. 140
Stormwater Management ................................. 142
Street Cleaning ...................................................... 144

RevisedBudget
2012/13
2013/14DPOP
Budget2014/15Budget
2015/16Budget
2016/17Budget
Upper Hunter Shire Council2013/14-2016/17
Delivery Program & Operational Plan
EnvironmentOperating Revenue
Solid Waste Management (3,136,898) (3,264,503) (3,264,503) (3,264,503) (3,264,503) Stormwater Management (103,646) (94,000) (94,000) (94,000) (94,000)
(3,240,544) (3,358,503) (3,358,503) (3,358,503) (3,358,503)Non Operating Revenue
Solid Waste Management (150,655) (467,712) (125,869) (64,549) (64,549) Stormwater Management (411,292) (292,470) (212,470) (212,470) (212,470) Street Cleaning (25,000) (35,000) (35,000) (35,000) (35,000)
(586,947) (795,182) (373,339) (312,019) (312,019)Operating Expenditure
Noxious Plants & Insect/Vermin Control 130,500 136,500 136,500 136,500 136,500 Solid Waste Management 2,592,922 2,606,885 2,591,435 2,616,435 2,591,435 Stormwater Management 396,480 420,745 420,745 420,745 420,745 Street Cleaning 158,665 174,060 174,060 174,060 174,060
3,278,567 3,338,190 3,322,740 3,347,740 3,322,740Non Operating Expenditure
Solid Waste Management 424,726 205,330 438,937 522,617 497,617 Stormwater Management 116,213 35,000 35,000 35,000 35,000
540,939 240,330 473,937 557,617 532,617Capital Expenditure
Solid Waste Management 110,069 760,000 200,000 30,000 80,000 Stormwater Management 284,815 230,000 160,000 175,000 210,000
394,884 990,000 360,000 205,000 290,000
Total 386,899 414,835 424,835 439,835 474,835

NNooxxiioouuss PPllaannttss && IInnsseecctt//VVeerrmmiinn CCoonnttrroollCOMMUNITY STRATEGIC OBJECTIVES (CSO’S)
To participate in and encourage regional and local alliances with other Councils, Government or non-government partners.
OBJECTIVES
To contribute to the effective control of noxious weeds within the LGA and broader region.
MAJOR ACTIVITIES
The control of noxious weeds both on private properties and on public land.
PERFORMANCE INDICATORS AAnticipated2012/13
Estimate/Target2013/14
Effectiveness Indicator: Costs as per budget. Achieved Achieved
Efficiency Indicator: Cost per farmland assessment $78.14 $81.54
LEVEL OF SERVICE:No major changes from previous years

RevisedBudget
2012/13
2013/14DPOP
Budget2014/15Budget
2015/16Budget
2016/17Budget
Upper Hunter Shire Council2013/14-2016/17
Delivery Program & Operational Plan
Noxious Plants & Insect/Vermin ControlOperating Expenditure
5058. Noxious Weed Control Exp 130,500 136,500 136,500 136,500 136,500130,500 136,500 136,500 136,500 136,500
Total 130,500 136,500 136,500 136,500 136,500

SSoolliidd WWaassttee MMaannaaggeemmeennttCOMMUNITY STRATEGIC OBJECTIVES (CSO’S)
Develop economic and intergenerational plans for future infrastructure needs.
Advocate to State and Federal Government for a fair and equitable share of fiscal resources and provision of Government services for the community.
Participate in and encourage regional and local alliances with other Councils, Government or non-government partners.
Encourage and implement systems for minimisation of the environmental footprint of the Shire, including energy efficiency and consumption of natural resources
Promote a sense of responsibility within our community to care for our environment and provide for a sustainable future.
Effectively and efficiently manage the business of the Council within its Charter.
OBJECTIVES
To achieve and maintain environmentally sound waste management practices to meet community and statutory expectations.
MAJOR ACTIVITIES
The provision and maintenance of a waste pick up and disposal service to domestic and commercial premises in the designated collection areas. The provision of an alternative service in the form of strategically located three cubic metre bins or convenient access to a solid waste landfill site.
The provision of a solid waste disposal and a limited recycling service to the residents of the Shire within the statutory guidelines set by the Environmental Protection Authority (EPA).
Promotion of waste reduction, reuse and recycling, including resource recovery.
Move towards achieving the State Government’s target of a 60% reduction in waste going to landfill.
Minimisation of pollution of the environment due to waste disposal.
Investigation of future landfill site operations and rehabilitation of current sites.
Develop Management Plans for all landfill sites and implement Waste Management Strategy.
PERFORMANCE INDICATORS AAnticipated2012/13
Estimate/Target2013/14
Workload Indicator: Number of residential properties serviced Merriwa Murrurundi Scone
513 504
3,373
518508
3,424
Effectiveness Indicator: Provision of services within agreed levels - All garbage bins collected on due day - Access to tips - Aberdeen - - Cassilis
- Murrurundi - Scone - Merriwa
98% 5 days/week 1 day/week
4 days/week 7 days/week 4 days/week
98%5 days/week1 day/week
4 days/week7 days/week4 days/week
Efficiency Indicator: Recycling – total gross per annum – tonnes RRA reported waste to landfill – tonnes
1,000 7,500
1,5007,000
Service Indicator: Number of complaints per year
Contracted domestic waste collection
Contracted recycling collection
<20pa<10pa
<20pa<10pa
LEVEL OF SERVICEProvision of a weekly DWM collection and a fortnightly Recycling collection within the designated collection area and where 98% of all bins are collected on the due dates.

RevisedBudget
2012/13
2013/14DPOP
Budget2014/15Budget
2015/16Budget
2016/17Budget
Upper Hunter Shire Council2013/14-2016/17
Delivery Program & Operational Plan
Solid Waste ManagementOperating Revenue
0115. Grants (132,642) (102,600) (102,600) (102,600) (102,600)0283. Commercial Waste Revenue (134,036) (154,262) (154,262) (154,262) (154,262)0284. Domestic Waste User Fees & Charges (1,929,966) (2,034,681) (2,034,681) (2,034,681) (2,034,681)0285. Other Waste Revenue (225,960) (172,960) (172,960) (172,960) (172,960)0286. Landfill Collection Revenue (714,294) (800,000) (800,000) (800,000) (800,000)
(3,136,898) (3,264,503) (3,264,503) (3,264,503) (3,264,503)Non Operating Revenue
0920. Depreciation (107,585) (64,549) (64,549) (64,549) (64,549)6035. F-19016.8519.6412 Other Waste 0 (187,910) 0 0 06037. F-19015.8512.6349 Domestic Waste Mgt 0 (215,253) 0 0 06172. F-19015.8512.6518 Dom Waste Mgt-Mdi Upg 0 0 (61,320) 0 0
(107,585) (467,712) (125,869) (64,549) (64,549)Operating Expenditure
0301. Administration Costs 19,318 21,518 21,518 21,518 21,5180415. Utilities 2,785 2,935 2,935 2,935 2,9350466. Waste Service Audit 0 0 0 25,000 00469. Landfill Operations- Mwa/Cassilis 167,750 183,200 167,750 167,750 167,7500484. MGB Waste Collection 1,073,344 1,121,275 1,121,275 1,121,275 1,121,2750486. Landfill Operations- Scn 392,156 427,246 427,246 427,246 427,2460487. Landfill Operations- Abn 189,262 206,450 206,450 206,450 206,4500488. Landfill Operations- Mdi 127,233 106,450 106,450 106,450 106,4500613. e-waste 70,815 11,149 11,149 11,149 11,1490632. State Govt Waste Levy 282,264 300,000 300,000 300,000 300,0000680. Depreciation 107,585 64,549 64,549 64,549 64,5490980. Administration Overheads 160,410 162,113 162,113 162,113 162,113
2,592,922 2,606,885 2,591,435 2,616,435 2,591,435Non Operating Expenditure
7019. T-19015.8512.6349 Domestic Waste Mgt 45,975 0 121,459 164,989 151,9897021. T-19015.8512.6419 Waste Levy (Rates) 0 0 0 0 07023. T-19015.8512.6490 Waste Levy (Other) 0 0 0 0 07032. T-19016.8519.6412 Other Waste 106,709 0 112,148 152,298 140,2987081. Cont to Loan Repayments 25,000 25,000 25,000 25,000 25,0007131. Cont to Urban Rds Maintenance 100,000 105,000 105,000 105,000 105,0007137. T-19015.8511.6336 RRA Grant 88,642 60,000 60,000 60,000 60,0007193. T-19015.8512.6518 Dom Waste Mgt-Mdi Upg 15,330 15,330 15,330 15,330 15,330
381,656 205,330 438,937 522,617 497,617Capital Expenditure
0813. Waste Abn - Land Purchase 60,069 250,000 0 0 00814. Waste Abn - Land Licences/Fees 0 0 0 0 00815. Waste Mwa - 0 0 0 0 50,0000817. Waste Reduction Implementation 10,000 10,000 10,000 10,000 10,0000822. Waste Scn - Land Purchase 10,000 250,000 0 0 00824. Waste Scn - Land Licences/Fees 0 0 0 0 00825. Integrated Waste Management Strategy 0 50,000 20,000 0 01173. Scn - Landfill Development Extension 0 75,000 0 0 01174. Abn - Landfill Development Extension 0 75,000 0 0 01219. Abn - Fire Prevention Strategy 30,000 0 0 0 01275. Abn-Tree Planting around facility 0 30,000 0 0 01276. Mdi-Design & Construct Trf Station 0 20,000 70,000 0 01277. Rehabilitation of Landfill Sites 0 0 100,000 20,000 20,000
110,069 760,000 200,000 30,000 80,000
Total (159,836) (160,000) (160,000) (160,000) (160,000)

SSttoorrmmwwaatteerr MMaannaaggeemmeennttCOMMUNITY STRATEGIC OBJECTIVES (CSO’S)
Participate in and encourage regional and local alliances with other councils, governments or non-government partners.
Develop economic and intergrational plans for future infrastructure needs.
OBJECTIVESTo provide stormwater drainage systems to manage flows. To provide kerb and gutter networks as an adjunct to the drainage network. To maintain flow conditions in main creeks. To implement the Stormwater Management Plan.
MAJOR ACTIVITIES
Repair damaged and deteriorated drainage structures.
Remove debris to ensure drains are clear.
Bitumen seal gravel shoulders to reduce gravel ingress into stormwater system.
Monitor the condition of kerb and guttering and undertake repairs as programmed.
Assess need for creek clearing works and arrange suitable clearing treatment.
Support community groups in maintaining and enhancing creeks.
Review of Stormwater Management Plan for the Shire.
PERFORMANCE INDICATORS AAnticipated2012/13
Estimate/Target2013/14
Workload Indicator: Percentage of drainage network rated as in satisfactory condition at end of any period
90% 90%
Effectiveness Indicator: Complaints received due to drainage overflows <55pa <20
Efficiency Indicator: Maintenance and capital projects managed within budget allocation.
90% 90%
Service Indicator: Time taken to respond to drainage request. <5 days 5 days
LEVEL OF SERVICE
Ongoing replacement of stormwater infrastructure will result in a reduction of works requests resulting from stormwater/flooding events
In 2013/14 the proposed budget will sustain the ability to maintain the existing condition of the stormwater network
Capital upgrade of stormwater drainage across the shire
Review of Stormwater Management Plan for the shire.

RevisedBudget
2012/13
2013/14DPOP
Budget2014/15Budget
2015/16Budget
2016/17Budget
Upper Hunter Shire Council2013/14-2016/17
Delivery Program & Operational Plan
Stormwater ManagementOperating Revenue
0110. User Fees & Charges (93,646) (94,000) (94,000) (94,000) (94,000)0115. Grants (10,000) 0 0 0 0
(103,646) (94,000) (94,000) (94,000) (94,000)Non Operating Revenue
0920. Depreciation (206,477) (212,470) (212,470) (212,470) (212,470)6100. F-19016.8519.6475 Stormwater C/o project (204,815) (80,000) 0 0 0
(411,292) (292,470) (212,470) (212,470) (212,470)Operating Expenditure
0570. Stormwater Drainage Maintenance 77,993 90,589 90,589 90,589 90,5890680. Depreciation 206,477 212,470 212,470 212,470 212,4700980. Administration Overheads 112,010 117,686 117,686 117,686 117,686
396,480 420,745 420,745 420,745 420,745Non Operating Expenditure
7100. T-19016.8519.6475 Stormwater C/o project 91,213 0 0 0 07101. Cont to Street Cleaning 25,000 35,000 35,000 35,000 35,000
116,213 35,000 35,000 35,000 35,000Capital Expenditure
1082. Scn - Kookaburra Ave Extension 28,000 0 0 0 04002. Dart Street Abn 27,815 65,000 0 0 04022. Liverpool St, Scn (Park to Waverley) 160,000 0 0 0 04060. Dart St Abn 0 80,000 0 0 04061. Mwa GPT 0 0 0 0 04062. Sunshine St Mdi 0 0 35,000 0 04064. Koala St Scn 59,000 0 0 0 04065. Macqueen St Abn 0 0 70,000 0 04066. Hayes St Mwa 0 0 15,000 0 04067. Mount St Mdi 0 0 0 45,000 04068. Liverpool St Scn 0 50,000 40,000 60,000 04070. Sydney St Scn 0 0 0 0 40,0004071. Aberdeen St Scn 0 0 0 70,000 04072. Scn GPT 0 0 0 0 60,0004245. Scn - Barton & Carlyle Sts Intersection 0 35,000 0 0 04247. Scn - Liverpool&Aberdeen St Intersection 0 0 0 0 40,0004248. Mdi - Murulla St - Isis Ln 0 0 0 0 40,0004288. Fig Tree Gully Pollution Control 10,000 0 0 0 04305. Haydon St Mdi (Mount to Page St) 0 0 0 0 30,0004410. Barton St Stormwater extension 0 0 0 0 0
284,815 230,000 160,000 175,000 210,000
Total 282,570 299,275 309,275 324,275 359,275

SSttrreeeett CClleeaanniinnggCOMMUNITY STRATEGIC OBJECTIVES (CSO’S)
Develop economic and intergenerational plans for future infrastructure needs.
Promote a sense of responsibility within our community to care for our environment and provide for a sustainable future.
Effectively and efficiently manage the business of the Council within its Charter.
Encourage and implement systems for minimisation of the environmental footprint of the Shire, including energy efficiency and consumption of natural resources.
OBJECTIVES
To provide and maintain street cleaning for the CBD area to a satisfactory and acceptable standard.
Improve the appearance and presentation of streets within the main CBD area.
Clean urban streets using street sweeper
MAJOR ACTIVITIES
Provide street cleaning services within the CBD areas to a high standard of service.
Continued upgrade to street furniture.
Minimise Council’s liability through the introduction of risk management.
Maintain and maximise urban streets beautification, developing partnership with community members to maximise appeal and effective streetscape management
PERFORMANCE INDICATORS AAnticipated2012/13
Estimate/Target2013/14
Workload Indicator: Sealed urban streets within the townships of Scone, Aberdeen, Merriwa & Murrurundi receiving scheduled street sweeping.
Graffiti removal - Within 24 hours of reporting
90%
100%
90%
100%
Effectiveness Indicator: Cleansing of garbage and offensive matter by collection from streets, public places and from Council property. Includes removal of graffiti from buildings and public places generally
90% 90%
Efficiency Indicator: Street sweeper utilisation – hours pa 900 900
Service Indicator: No. of service and action requests received annually concerning the state of street verges, bins, ash trays, seats, posters, graffiti and footpath cleanliness
<25 <10
LEVEL OF SERVICEClean streets and remove litter from streets and public places on a regular basis.

RevisedBudget
2012/13
2013/14DPOP
Budget2014/15Budget
2015/16Budget
2016/17Budget
Upper Hunter Shire Council2013/14-2016/17
Delivery Program & Operational Plan
Street CleaningNon Operating Revenue
6101. Cont from Stormwater Drainage (25,000) (35,000) (35,000) (35,000) (35,000)(25,000) (35,000) (35,000) (35,000) (35,000)
Operating Expenditure0625. Street & Gutter Cleaning 158,665 174,060 174,060 174,060 174,060
158,665 174,060 174,060 174,060 174,060
Total 133,665 139,060 139,060 139,060 139,060

GENERAL PURPOSE REVENUES
Summary .................................................................. 147
Rates, Grants & Interest Revenues ................... 148

RevisedBudget
2012/13
2013/14DPOP
Budget2014/15Budget
2015/16Budget
2016/17Budget
Upper Hunter Shire Council2013/14-2016/17
Delivery Program & Operational Plan
General Purpose RevenuesOperating Revenue
Rates, Grants & Interest Revenues (11,283,783) (10,585,593) (12,053,002) (12,278,302) (12,278,302)(11,283,783) (10,585,593) (12,053,002) (12,278,302) (12,278,302)
Non Operating Revenue Rates, Grants & Interest Revenues (1,191,524) (1,247,609) 0 0 0
(1,191,524) (1,247,609) 0 0 0Operating Expenditure
Rates, Grants & Interest Revenues 41,762 42,957 42,957 42,957 42,95741,762 42,957 42,957 42,957 42,957
Non Operating Expenditure Rates, Grants & Interest Revenues 1,257,609 10,000 10,000 10,000 10,000
1,257,609 10,000 10,000 10,000 10,000
Total (11,175,936) (11,780,245) (12,000,045) (12,225,345) (12,225,345)

RRaatteess,, GGrraannttss && IInntteerreesstt RReevveennuueessCOMMUNITY STRATEGIC OBJECTIVES (CSO’S)
To effectively & efficiently manage the business of the Council within its charter.
OBJECTIVESTo maximize Council’s ability to secure appropriate funding for General Fund Projects
MAJOR ACTIVITIES
Issue of rates and charges
Investment of Council’s surplus funds
Ensure appropriate levels of income received through the distribution of the Federal Grants
PERFORMANCE INDICATORS AAnticipated2012/13
Estimate/Target2013/14
Workload Indicator: Rates are levied in accordance with the Local Government Act and Regulations
Yes Yes
Effectiveness Indicator: Rates are levied in accordance with Notional Income calculations. Excess Cash requirements are invested within the guidelines established within Council’s Investment Policy. Data supplied that is included in the Financial Assistance Grant calculation is checked to ensure both accurate and maximum return to Council. Outstanding rates at year end
100%
100%
100%
5%
100%
100%
100%
5%
Efficiency Indicator: Funds are raised in accordance with Council’s budget 100% 100%
Service Indicator: Rates levied within 30 days of start of new year Interest income distributed monthly to ensure accurate reporting
100% 100%
100%100%
LEVEL OF SERVICE:As per previous year

RevisedBudget
2012/13
2013/14DPOP
Budget2014/15Budget
2015/16Budget
2016/17Budget
Upper Hunter Shire Council2013/14-2016/17
Delivery Program & Operational Plan
Rates, Grants & Interest RevenuesOperating Revenue
0100. Rates & Charges (8,324,406) (8,791,913) (9,011,713) (9,237,013) (9,237,013)0115. Grants (2,449,377) (1,263,680) (2,511,289) (2,511,289) (2,511,289)0120. Interest & Investment Income (510,000) (530,000) (530,000) (530,000) (530,000)
(11,283,783) (10,585,593) (12,053,002) (12,278,302) (12,278,302)Non Operating Revenue
6050. F-19016.8517.6409 FAG (1,191,524) (1,247,609) 0 0 0(1,191,524) (1,247,609) 0 0 0
Operating Expenditure0980. Administration Overheads 41,762 42,957 42,957 42,957 42,957
41,762 42,957 42,957 42,957 42,957Non Operating Expenditure
7050. T-19016.8517.6409 FAG 1,247,609 0 0 0 07195. T-19015.8510.6300 s94 Interest 10,000 10,000 10,000 10,000 10,000
1,257,609 10,000 10,000 10,000 10,000
Total (11,175,936) (11,780,245) (12,000,045) (12,225,345) (12,225,345)

GOVERNANCE
Summary .................................................................. 151
Council Services .................................................... 152

RevisedBudget
2012/13
2013/14DPOP
Budget2014/15Budget
2015/16Budget
2016/17Budget
Upper Hunter Shire Council2013/14-2016/17
Delivery Program & Operational Plan
GovernanceNon Operating Revenue
Council Services (65,000) 0 0 0 (75,000)(65,000) 0 0 0 (75,000)
Operating Expenditure Council Services 669,178 601,518 601,268 601,268 701,268
669,178 601,518 601,268 601,268 701,268Non Operating Expenditure
Council Services 0 25,000 25,000 25,000 00 25,000 25,000 25,000 0
Capital Expenditure Council Services 10,000 5,000 2,000 2,000 2,000
10,000 5,000 2,000 2,000 2,000
Total 614,178 631,518 628,268 628,268 628,268

CCoouunncciill SSeerrvviicceessCOMMUNITY STRATEGIC OBJECTIVES (CSO’S)
To effectively & efficiently manage the business of the Council within its charter.
To encourage an open & participatory Council, with emphasis on community engagement, action & response.
To participate in & encourage regional & local alliances with other Councils, Government or non- government partners.
Encourage & build local community capacity within the context of the Shire.
Advocate to State & Federal Government for a fair & equitable share of fiscal resources & provision of government services for the community.
OBJECTIVES
To effectively and efficiently manage a Shire with an area of approximately 8,100 sq kms and a population of approximately 14,000 according to the needs of the community.
MAJOR ACTIVITIES
Review Community Strategic Plan 2013 and 2015
Review Delivery & Operation Plan - Annually
Review Policies and Codes – within 12 months of election – Sept 2012
Review Organisational Structure – within 12 months of election – Sept 2012
Implement Structural Reform – Ongoing focus on value for money
MAJOR ACTIVITIES FOR 2013/14
Land Use Planning –consolidated LEP finalised
Advocate for New England Highway rail overpass/heavy vehicle alternative route project – funding and construction
Local Government Review – assessment and response to proposed outcomes from the Independent Local Government Act Review Panel
Local Government Act – assessment and response to proposed outcomes of the Local Government Act Review Panel
PERFORMANCE INDICATORS AAnticipated2012/13
Estimate/Target2013/14
Workload Indicator: Number of Council and Committee meetings Council - Ordinary: - Extraordinary: Finance Works & Technical Services: Development & Environmental Services
12 2
12 11 11
122
121111
Effectiveness Indicator: Achievement of the Delivery Program and Operational Plan
100% 100%
Efficiency Indicator: Delivery Program and Operational Plan outcomes achieved within budget
100% 100%
Service Indicator: Number of complaints about the achievement of the Delivery Program and Operational Plan.
0 0
LEVEL OF SERVICENo Significant oversights, compliance with Policies and Strategic Direction

RevisedBudget
2012/13
2013/14DPOP
Budget2014/15Budget
2015/16Budget
2016/17Budget
Upper Hunter Shire Council2013/14-2016/17
Delivery Program & Operational Plan
Council ServicesNon Operating Revenue
6018. F-19016.8518.6410 Council Elections (65,000) 0 0 0 (75,000)(65,000) 0 0 0 (75,000)
Operating Expenditure0301. Administration Costs 154,800 154,300 154,300 154,300 154,3000330. Mayor & Elected Member Expenses 141,000 151,000 151,000 151,000 151,0000335. Election Expenses 90,000 0 0 0 100,0000345. Meals Entertainment & Other Functions 9,000 13,000 13,000 13,000 13,0000350. General Expenses 19,500 16,100 16,100 16,100 16,1000440. Community Consultation 42,000 40,000 40,000 40,000 40,0000980. Administration Overheads 146,378 154,868 154,868 154,868 154,8685016. s356 Contributions Expenses 17,000 21,000 21,000 21,000 21,0005087. Cont - Hunter Councils 4,700 3,000 3,000 3,000 3,0005088. Cont - Local Govt & Shires Assoc 29,800 33,300 33,300 33,300 33,3005089. Cont - Hunter Valley Research Foundation 7,500 7,750 7,500 7,500 7,5005090. Cont - Mining Related Councils 7,500 7,200 7,200 7,200 7,200
669,178 601,518 601,268 601,268 701,268Non Operating Expenditure
7018. T-19016.8518.6410 Council Elections 0 25,000 25,000 25,000 00 25,000 25,000 25,000 0
Capital Expenditure0714. Asset Purchases 10,000 5,000 2,000 2,000 2,000
10,000 5,000 2,000 2,000 2,000
Total 614,178 631,518 628,268 628,268 628,268

HEALTH
Summary .................................................................. 155
Health Services ...................................................... 156
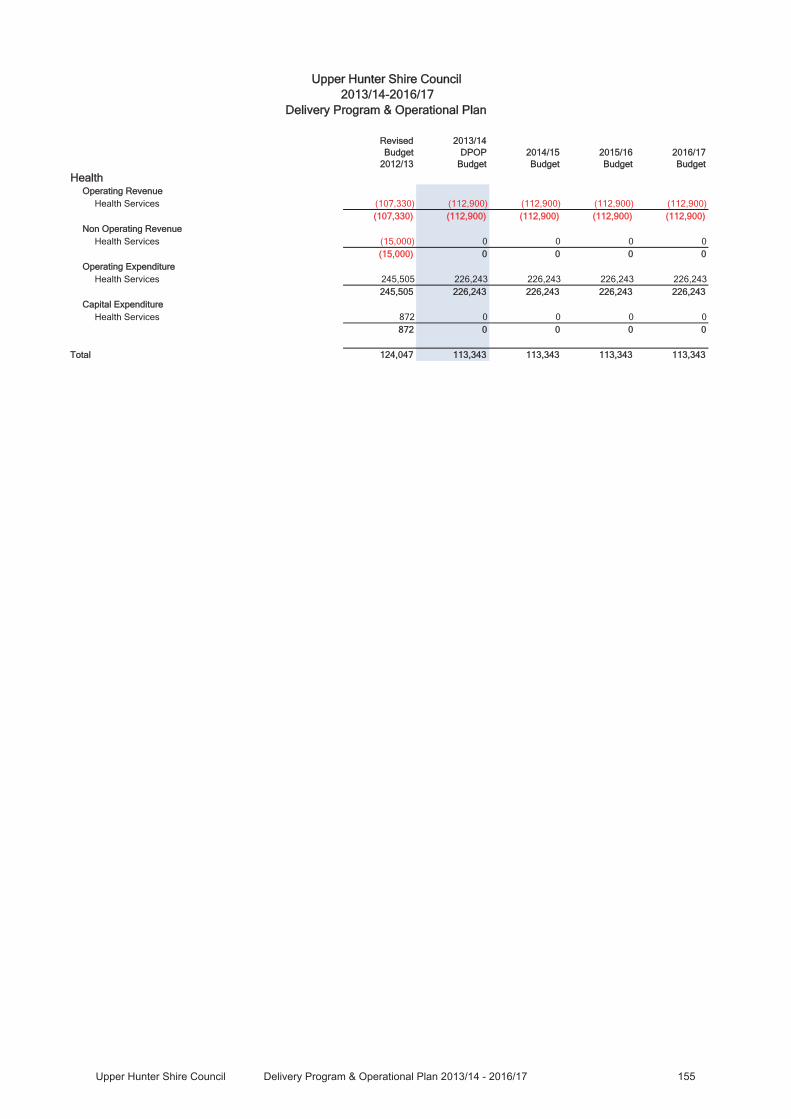
RevisedBudget
2012/13
2013/14DPOP
Budget2014/15Budget
2015/16Budget
2016/17Budget
Upper Hunter Shire Council2013/14-2016/17
Delivery Program & Operational Plan
HealthOperating Revenue
Health Services (107,330) (112,900) (112,900) (112,900) (112,900)(107,330) (112,900) (112,900) (112,900) (112,900)
Non Operating Revenue Health Services (15,000) 0 0 0 0
(15,000) 0 0 0 0Operating Expenditure
Health Services 245,505 226,243 226,243 226,243 226,243245,505 226,243 226,243 226,243 226,243
Capital Expenditure Health Services 872 0 0 0 0
872 0 0 0 0
Total 124,047 113,343 113,343 113,343 113,343

HHeeaalltthh SSeerrvviicceessCOMMUNITY STRATEGIC OBJECTIVES (CSO’S)
Effectively and efficiently manage the business of Council within its Charter. Facilitate and provide for a growing population, including, for example, affordable housing, community amenities, health and welfare services. Facilitate partnerships which create and support a caring community. Provide efficient and effective advisory, assessment and regulatory services focused on being customer “friendly” and responsive.Promote a sense of responsibility within our community to care for our environment and provide for a sustainable future.
OBJECTIVESTo administer applicable acts, regulations and Council policies so as to achieve the highest level of welfare and well-being of the whole community. To provide cost effective management of resources in addressing the priorities of Council. To monitor and report against key environmental indicators of health and sustainability.
MAJOR ACTIVITIES
Public health education, complaints investigation, inspections of regulated premises and related services.
Ongoing implementation of requirements of on-site waste disposal legislation and on-site wastewater management guidelines.
Continue with the inspection program of all on-site waste management systems within the Shire to ascertain their impact on the environment.
PERFORMANCE INDICATORS AAnticipated2012/13
Estimate/Target2013/14
Health Inspections
Workload Indicator: Number of premises to be inspected 140 140
Effectiveness Indicator: Number of inspections during period 140 140
Efficiency Indicator: Average time taken to respond to complaints (days) 2 2
Service Indicator: Number of health complaints received during period Number of odour complaints from industry (abattoir)
36 10
305
On Site Sewer Management Systems
Workload Indicator: Estimated that there are 2,400 on-site sewer management systems within the Shire Inspection of OSSMS to be completed 200 inspections 300 inspections
Service Indicator: No of complaints received during period <5 <5
LEVEL OF SERVICEHealth & nuisance complaints will continue to be a priority and resources available may impact on the number of on-site sewer management system inspections undertaken in 2012/13 period.

RevisedBudget
2012/13
2013/14DPOP
Budget2014/15Budget
2015/16Budget
2016/17Budget
Upper Hunter Shire Council2013/14-2016/17
Delivery Program & Operational Plan
Health ServicesOperating Revenue
0105. Statutory Fees & Charges (27,300) (27,800) (27,800) (27,800) (27,800)0110. User Fees & Charges (77,530) (83,600) (83,600) (83,600) (83,600)0130. Other Income (2,500) (1,500) (1,500) (1,500) (1,500)
(107,330) (112,900) (112,900) (112,900) (112,900)Non Operating Revenue
6182. F-19015.8511.6523 CMA 2011/12 Ptnrships (15,000) 0 0 0 0(15,000) 0 0 0 0
Operating Expenditure0304. Customer Services 41,000 38,900 38,900 38,900 38,9000350. General Expenses 1,000 1,000 1,000 1,000 1,0000497. Health Inspections 83,500 73,200 73,200 73,200 73,2000624. Onsite Sewerage Management 72,119 76,500 76,500 76,500 76,5000662. CMA 2011/12 Partnerships Program 15,000 0 0 0 00980. Administration Overheads 32,886 34,643 34,643 34,643 34,6435059. Food Handling Course Exp 0 2,000 2,000 2,000 2,000
245,505 226,243 226,243 226,243 226,243Capital Expenditure
0840. IT Hardware for Health Services 872 0 0 0 0872 0 0 0 0
Total 124,047 113,343 113,343 113,343 113,343

HOUSING & COMMUNITY AMENITIES
Summary .................................................................. 159
Low Income Housing .......................................... 160
Public Cemeteries ................................................. 162
Public Conveniences ........................................... 164
Street Lighting ....................................................... 166
Town Planning ...................................................... 168

RevisedBudget
2012/13
2013/14DPOP
Budget2014/15Budget
2015/16Budget
2016/17Budget
Upper Hunter Shire Council2013/14-2016/17
Delivery Program & Operational Plan
Housing & Community AmenitiesOperating Revenue
Low Income Housing (4,487) (6,000) (6,000) (6,000) (6,000) Public Cemeteries (102,300) (117,300) (117,300) (117,300) (117,300) Street Lighting (40,000) (41,000) (41,000) (41,000) (41,000) Town Planning (439,550) (507,000) (417,000) (417,000) (417,000)
(586,337) (671,300) (581,300) (581,300) (581,300)Non Operating Revenue
Low Income Housing (14,587) (6,516) (7,387) (6,500) (9,387) Public Cemeteries (10,752) (15,595) (11,245) (11,245) (11,245) Public Conveniences (17,369) (20,177) (20,177) (20,177) (20,177) Street Lighting (20,000) (20,000) (20,000) (20,000) (9,000) Town Planning (37,500) (30,000) 0 0 0
(100,208) (92,288) (58,809) (57,922) (49,809)Operating Expenditure
Low Income Housing 10,303 10,403 10,387 10,387 10,387 Public Cemeteries 137,300 136,806 136,806 136,806 136,806 Public Conveniences 174,021 194,955 195,005 195,005 195,005 Street Lighting 273,000 287,000 287,000 287,000 287,000 Town Planning 576,886 617,960 462,960 462,960 462,960
1,171,510 1,247,124 1,092,158 1,092,158 1,092,158Non Operating Expenditure
Low Income Housing 0 2,113 0 2,113 0 Town Planning 155,050 152,500 152,500 152,500 152,500
155,050 154,613 152,500 154,613 152,500Capital Expenditure
Low Income Housing 8,771 0 3,000 0 5,000 Public Cemeteries 30,000 20,000 40,000 40,000 40,000 Street Lighting 20,000 20,000 20,000 20,000 20,000
58,771 40,000 63,000 60,000 65,000
Total 698,786 678,149 667,549 667,549 678,549

LLooww IInnccoommee HHoouussiinnggCOMMUNITY STRATEGIC OBJECTIVES (CSO’S)
Form partnerships & participate in networks which address the needs & interests of disadvantaged groups in our community
Facilitate partnerships which create & support a caring community
OBJECTIVES
To provide safe and comfortable accommodation for people of low income who cannot access the private rental market.
MAJOR ACTIVITIES
To provide low income housing units in compliance with the NSW Office of Community Housing registration guidelines in the township of Merriwa.
To maintain the units to a safe and comfortable standard.
To maintain efficiency at periods of changeover to keep the units fully tenanted.
Annual inspections carried out to determine any works that need to be completed.
PERFORMANCE INDICATORS AAnticipated2012/13
Estimate/Target2013/14
Workload Indicator: Review rents completed annually.
Maintenance performed as required.
Annual inspections to be held determining works required.
April
Maintenanceachieved within
10 working days of request
received
2
April
Maintenanceachieved within
10 working days of request
received
2
Effectiveness Indicator: Percentage of time tenanted. 98% 98%
Efficiency Indicator: Achievement of the major activities (detailed above) within budget.
100% 100%
Service Indicator: Number of complaints received.
Positive condition reports received.
<2
2
<2
2
LEVEL OF SERVICETwo affordable units are provided for the Merriwa community to ensure access to adequate accommodation.

RevisedBudget
2012/13
2013/14DPOP
Budget2014/15Budget
2015/16Budget
2016/17Budget
Upper Hunter Shire Council2013/14-2016/17
Delivery Program & Operational Plan
Low Income HousingOperating Revenue
0110. User Fees & Charges (4,487) (6,000) (6,000) (6,000) (6,000)(4,487) (6,000) (6,000) (6,000) (6,000)
Non Operating Revenue0920. Depreciation (6,500) (6,516) (6,500) (6,500) (6,500)6003. F-19016.8523.6445 Special Projects (1,874) 0 0 0 06131. F-19016.8519.6421 Low Income Housing (6,213) 0 (887) 0 (2,887)
(14,587) (6,516) (7,387) (6,500) (9,387)Operating Expenditure
0415. Utilities 1,930 2,050 2,050 2,050 2,0500530. Building Maintenance 1,000 1,000 1,000 1,000 1,0000680. Depreciation 6,500 6,516 6,500 6,500 6,5000980. Administration Overheads 873 837 837 837 837
10,303 10,403 10,387 10,387 10,387Non Operating Expenditure
7024. T-19016.8519.6421 Low Income Housing 0 2,113 0 2,113 00 2,113 0 2,113 0
Capital Expenditure1036. Low income Housing Painting 4,200 0 0 0 5,0001039. Low Income Replace Floor coverings 0 0 3,000 0 01041. Low Income Kitchen Upgrades 4,571 0 0 0 0
8,771 0 3,000 0 5,000
Total 0 0 0 0 0

PPuubblliicc CCeemmeetteerriieessCOMMUNITY STRATEGIC OBJECTIVES (CSO’S)
Develop economic and intergenerational plans for future infrastructure needs.
Identify and preserve heritage items through appropriate planning instruments.
Effectively and efficiently manage the business of the Council within its Charter.
Connect our communities through activities and events, online technologies and infrastructure.
Provide for replacement and improvement of community infrastructure through best practice and risk management.
OBJECTIVES
To provide a cost effective and sympathetic cemetery service and facility to the community.
To provide, improve and maintain public cemeteries of a high standard commensurate with allocated resources.
MAJOR ACTIVITIES
Council's cemetery facilities are available when required for interments and maintained at a reasonable standard.
Development of a comprehensive cemetery record database.
Provide information for historic cemetery enquiries.
Complete regular audits of cemeteries.
Improve aesthetic impact of cemeteries and facilities.
Continue long term upgrading and maintenance program.
No examples of complaints received in regard to interment and maintenance programs.
Monitor the security of Council’s Cemeteries and report to Council as necessary on Cemetery security and vandalism issues.
Undertake consultation with of residents and local funeral directors to gauge satisfaction level of cemetery services and seek advice on improvement to service provision.
Prepare (and review) a Management Plan for the Upper Hunter Shire Council cemeteries.
Encourage community groups to contribute towards improvement of cemeteries.
Provision of facilities as identified and finances available.
No examples of complaints received in regard to interment and maintenance programs.
PERFORMANCE INDICATORS AAnticipated2012/13
Estimate/Target2013/14
Workload Indicator: Number of cemeteries serviced (including non Council controlled cemeteries)
17 17
Effectiveness Indicator: 98% 98%
Efficiency Indicator: Maintenance and capital projects managed within budget allocation.
Plaque proof and quotation obtained within 5 days of customer request
Achieved
100%
Achieved
100%
Service Indicator: Number of action requests <7 <7
LEVEL OF SERVICE
Meet customer requirements including non-traditional interments eg tree planting, family groups
Development of a customer computer access system for cemetery records to allow Internet access to records, plans and photos
Development of individual cemetery management plans including historic and natural asset protection strategies
Involvement in Hunter Councils Cemetery Taskforce.
Signposting of Cemeteries including historic information

RevisedBudget
2012/13
2013/14DPOP
Budget2014/15Budget
2015/16Budget
2016/17Budget
Upper Hunter Shire Council2013/14-2016/17
Delivery Program & Operational Plan
Public CemeteriesOperating Revenue
0110. User Fees & Charges (102,300) (117,300) (117,300) (117,300) (117,300)(102,300) (117,300) (117,300) (117,300) (117,300)
Non Operating Revenue0920. Depreciation (10,752) (11,245) (11,245) (11,245) (11,245)6160. F-19016.8519.6420 Cemetery Works 0 (4,350) 0 0 0
(10,752) (15,595) (11,245) (11,245) (11,245)Operating Expenditure
0301. Administration Costs 2,207 5,855 5,855 5,855 5,8550415. Utilities 5,400 3,800 3,800 3,800 3,8000630. Cemetery Maintenance 82,787 77,057 77,057 77,057 77,0570647. Grave Excavation - Mwa & Mdi 8,765 10,792 10,792 10,792 10,7920648. Cemetery Plaques 21,400 21,600 21,600 21,600 21,6000680. Depreciation 10,752 11,245 11,245 11,245 11,2450980. Administration Overheads 5,989 6,457 6,457 6,457 6,457
137,300 136,806 136,806 136,806 136,806Capital Expenditure
0702. Scone Lawn Cemetery Extension 0 0 20,000 0 00713. Gundy Cemetery Fence 6,000 2,000 0 2,000 00739. Rouchel Columbarium 6,000 0 0 0 00741. Cemetery Strategic Plan Implementation 0 0 12,000 25,000 27,0000809. Scn Cemetery - Road Upgrades 8,000 0 0 0 01114. Abn Cemetery - Water Upgrade 10,000 0 0 0 01259. Signage Program 0 3,000 3,000 3,000 3,0001260. Digitisation of Records 0 5,000 5,000 0 01261. Tree Planting 0 10,000 0 10,000 10,000
30,000 20,000 40,000 40,000 40,000
Total 54,248 23,911 48,261 48,261 48,261

PPuubblliicc CCoonnvveenniieenncceessCOMMUNITY STRATEGIC OBJECTIVES (CSO’S)
Provide for replacement and improvement of community infrastructure through best practice and risk management.
Effectively and efficiently manage the business of the Council within its Charter.
OBJECTIVES
To provide and maintain public conveniences for the local community and travelling public to a satisfactory and acceptable standard.
Improve the appearance and presentation of public conveniences.
MAJOR ACTIVITIES
Provide cleaning services to public facilities to achieve a high standard of service.
Minimise Council’s liability through the introduction of risk management.
Safety
The provision of all public toilets must be safe and inviting to use for all in the community.
Public toilets must present well and ensure that users feel that the facility is safe, clean and well managed.
Public toilets should be located in the most visible position possible to maximise public surveillance of the facility.
Public toilets should cater for all expected users, including the aged, disabled and young families.
Accessibility
The provision of public toilets must be accessible to all in the community
Public toilets should comply with the accessibility requirements as outlined within the Disability Discrimination Act 1992
Public toilets should be accessible and open at all times during daylight hours
Where public toilets are located within privately owned buildings, the use of the building must be compatible and accessible to the public during daylight hours
Public toilets should provide for 24 hour access within the major activity precincts and within entertainment precincts.
Demand
The provision of public toilets must be located in areas of high demand within the community
Public toilets should be located in public and private areas where high pedestrian traffic volumes exist including activity centres, major tourist destinations and parks.
Public toilets should be located where there are public ‘activity generators’ such as BBQ facilities, play equipment etc.
PERFORMANCE INDICATORS AAnticipated2012/13
Estimate/Target2013/14
Workload Indicator: Number of public conveniences maintained during any given period
15 15
Effectiveness Indicator: Public toilets should be accessible and open at all times during daylight hours
100% 100%
Efficiency Indicator: Maintenance and capital projects managed within budget allocation.
Within budget allocation
Within budget allocation
Service Indicator: Number of complaints of unsatisfactory cleanliness made to Council in any given period.
<4 <5
LEVEL OF SERVICEOngoing upgrade and maintenance of public toilet facilities across the shire, including the facilities within Council controlled roadside rest areas and camping ground ie Belmador Camping Area, Burning Mountain

RevisedBudget
2012/13
2013/14DPOP
Budget2014/15Budget
2015/16Budget
2016/17Budget
Upper Hunter Shire Council2013/14-2016/17
Delivery Program & Operational Plan
Public ConveniencesNon Operating Revenue
0920. Depreciation (17,369) (20,177) (20,177) (20,177) (20,177)(17,369) (20,177) (20,177) (20,177) (20,177)
Operating Expenditure0415. Utilities 5,500 5,450 5,500 5,500 5,5000531. Public Amenities Maintenance 144,057 155,854 155,854 155,854 155,8540680. Depreciation 17,369 20,177 20,177 20,177 20,1770980. Administration Overheads 7,095 13,474 13,474 13,474 13,474
174,021 194,955 195,005 195,005 195,005
Total 156,652 174,778 174,828 174,828 174,828

SSttrreeeett LLiigghhttiinnggCOMMUNITY STRATEGIC OBJECTIVES (CSO’S)
Provide for replacement and improvement on community infrastructure through best practice and risk management.
Develop intergenerational plans for future infrastructure through best practice and risk management.
OBJECTIVES
To promote safe vehicular and pedestrian passage at night by achieving adequate lighting in residential and arterial roads in accordance with Australian Standards.
MAJOR ACTIVITIES
To maximise safety for road users.
Installation of new street lights in the shire to achieve the minimum Australian Standard lighting within urban areas.
Continued implementation of best practice standards to maintain quality of services provided.
Minimising total life cycle costs
Reduce light pollution, including obtrusive light into resident properties
Improve energy efficiency and reduce green house gas emissions
PERFORMANCE INDICATORS - STREET LIGHTING SERVICES AAnticipated2012/13
Estimate/Target2013/14
Workload Indicator: Provision of adequate number of street lights to achieve minimum Australian Standards
Achieved Achieved
Effectiveness Indicator: Ensuring progressive yearly installation of new street lights to meet Council's standard
5 5
Efficiency Indicator: Liaise with Electricity Authority to ensure prompt maintenance of unserviceable street lights
<5 days <5 days
Service Indicator: Number of complaints received on street lighting 5 <5
Number of outages reported to electricity authority < 5pa < 5pa
LEVEL OF SERVICECouncil’s Street Lighting Policy updated and implemented across the Shire.

RevisedBudget
2012/13
2013/14DPOP
Budget2014/15Budget
2015/16Budget
2016/17Budget
Upper Hunter Shire Council2013/14-2016/17
Delivery Program & Operational Plan
Street LightingOperating Revenue
0115. Grants (40,000) (41,000) (41,000) (41,000) (41,000)(40,000) (41,000) (41,000) (41,000) (41,000)
Non Operating Revenue6061. F-19016.8523.6444 Street Lighting (20,000) (20,000) (20,000) (20,000) (9,000)
(20,000) (20,000) (20,000) (20,000) (9,000)Operating Expenditure
0415. Utilities 273,000 287,000 287,000 287,000 287,000273,000 287,000 287,000 287,000 287,000
Capital Expenditure0765. Street & Public Lighting Capital Works 20,000 20,000 20,000 20,000 20,000
20,000 20,000 20,000 20,000 20,000
Total 233,000 246,000 246,000 246,000 257,000

TToowwnn PPllaannnniinnggCOMMUNITY STRATEGIC OBJECTIVES (CSO’S)
Effectively and efficiently manage the business if the Council within its Charter. Participate in and encourage regional and local alliances with other Councils, government or non-government partners.Encourage and implement systems for minimisation of the environmental footprint of the Shire, including energy efficiency, and consumption of natural resources. Promote a sense of responsibility within our community to care for our environment and provide for a sustainable future. Support and develop a thriving and growing business community with increased employment and available employment land.Facilitate and provide for a growing population, including, for example, affordable housing, community amenities health and welfare services. Encourage an open and participatory Council, with an emphasis on community engagement, action and response.
Implement and regularly review Local Environmental Planning Instruments which reflect the needs and expectations of the broad community.
Provide efficient and effective advisory, assessment and regulatory services focused on being customer “friendly” and responsive.
Identify and preserve heritage items through appropriate planning instruments.
Provide incentives and preserve heritage items by provision of adequate information and funding opportunities.
OBJECTIVES
To provide efficient and effective statutory planning activity which processes and assesses development applications in a timely and appropriate manner and complies with all relevant State and local planning legislation.
To demonstrate to the community that Council can provide such services in a competitive manner as compared with other bodies capable of such functions.
To provide an ongoing review to the local planning instruments to ensure that they are appropriate for current local and regional circumstances.
MAJOR ACTIVITIES
Advisory service to the community for appropriate development, in accordance with relevant planning instruments.
Implementation of planning legislation.
Preparation of Aberdeen Flood Risk Management Study and Plan
Issue of Land-use Planning Certificates.
Preparation of new comprehensive Upper Hunter Shire LEP including consideration of issues raised through public consultation including Social/ Community Plan.
PERFORMANCE INDICATORS AAnticipated2012/13
Estimate/Target2013/14
Development Applications
Workload Indicator: Number of development applications lodged in the period
325 275
Effectiveness Indicator: Average time taken to determine applications < 40 days < 40 days
Efficiency Indicator: % approved in 40 day statutory period > 80% > 80%
Service Indicator: Number of justified complaints received per 10 applications
<1 <1
149 Certificates
Workload: Number of certificates lodged in the period 500 500
Effectiveness: Average time taken to issue certificates <5 <5
Service: Number of justified complaints received per 100 applications
<1 <1
LEVEL OF SERVICETown Planning functions provided to the community at levels that meet their expectations within approved budget

RevisedBudget
2012/13
2013/14DPOP
Budget2014/15Budget
2015/16Budget
2016/17Budget
Upper Hunter Shire Council2013/14-2016/17
Delivery Program & Operational Plan
Town PlanningOperating Revenue
0105. Statutory Fees & Charges (236,300) (250,000) (250,000) (250,000) (250,000)0110. User Fees & Charges (2,500) (3,000) (3,000) (3,000) (3,000)0115. Grants (31,200) (100,000) (10,000) (10,000) (10,000)0130. Other Income (14,500) (1,500) (1,500) (1,500) (1,500)0140. Contributions (155,050) (152,500) (152,500) (152,500) (152,500)
(439,550) (507,000) (417,000) (417,000) (417,000)Non Operating Revenue
6067. F-19015.8510.6308 s94 R&C Scn (24,000) 0 0 0 06179. F-19016.8519.6417 Floodplain Mgt (13,500) (30,000) 0 0 0
(37,500) (30,000) 0 0 0Operating Expenditure
0304. Customer Services 144,350 102,200 102,200 102,200 102,2000491. Floodplain Management 19,500 0 0 0 00493. Planning 290,800 285,100 265,100 265,100 265,1000654. LEP Review 35,233 30,000 0 0 00655. DCP Review 5,800 15,000 0 0 00656. Heritage Advisor 22,000 15,000 15,000 15,000 15,0000658. Local Heritage 7,620 25,000 25,000 25,000 25,0000980. Administration Overheads 51,583 55,660 55,660 55,660 55,6600996. Abn Flood Risk Mgt Study & Plan 0 90,000 0 0 0
576,886 617,960 462,960 462,960 462,960Non Operating Expenditure
7065. T-19015.8510.6303 s94 RFS Mwa 550 1,000 1,000 1,000 1,0007066. T-19015.8510.6302 s94 RFS Mdi 0 1,000 1,000 1,000 1,0007067. T-19015.8510.6308 s94 R&C Scn 94,000 65,000 65,000 65,000 65,0007068. T-19015.8510.6306 s94 R&C Mwa 2,000 1,000 1,000 1,000 1,0007069. T-19015.8510.6497 s94 R&C Mdi 0 1,000 1,000 1,000 1,0007070. T-19015.8510.6309 s94 Open Space Scn 6,500 6,500 6,500 6,500 6,5007071. T-19015.8510.6307 s94 Open Space Mwa 2,000 1,000 1,000 1,000 1,0007072. T-19015.8510.6304 s94 Open Space Mdi 0 1,000 1,000 1,000 1,0007074. T-19015.8510.6305 s94A Contributions 50,000 75,000 75,000 75,000 75,000
155,050 152,500 152,500 152,500 152,500
Total 254,886 233,460 198,460 198,460 198,460

MINING, MANUFACTURING & CONSTRUCTION
Summary .................................................................. 171
Building Control .................................................... 172
Quarry Operations ............................................... 174

RevisedBudget
2012/13
2013/14DPOP
Budget2014/15Budget
2015/16Budget
2016/17Budget
Upper Hunter Shire Council2013/14-2016/17
Delivery Program & Operational Plan
Mining, Manufacturing & ConstructionOperating Revenue
Building Control (210,500) (215,100) (215,100) (215,100) (215,100)(210,500) (215,100) (215,100) (215,100) (215,100)
Non Operating Revenue Quarry Operations (583,949) (567,949) (567,949) (567,949) (567,949)
(583,949) (567,949) (567,949) (567,949) (567,949)Operating Expenditure
Building Control 292,378 390,651 390,651 390,651 390,651 Quarry Operations 465,867 436,161 436,161 436,161 436,161
758,245 826,812 826,812 826,812 826,812Non Operating Expenditure
Quarry Operations 58,082 61,788 81,788 81,788 81,78858,082 61,788 81,788 81,788 81,788
Capital Expenditure Building Control 0 0 0 0 0 Quarry Operations 60,000 70,000 50,000 50,000 50,000
60,000 70,000 50,000 50,000 50,000
Total 81,878 175,551 175,551 175,551 175,551

BBuuiillddiinngg CCoonnttrroollCOMMUNITY STRATEGIC OBJECTIVES (CSO’S)
Effectively and efficiently manage the business if the Council within its Charter. Participate in and encourage regional and local alliances with other Councils, government or non-government partners.Encourage an open and participatory Council, with and emphasis on community engagement, action and response. Encourage and implement systems for minimization of the environmental footprint of the Shire, including energy efficiency, and consumption of natural resources. Promote a sense of responsibility within our community to care for our environment and provide for a sustainable future. Provide efficient and effective advisory, assessment and regulatory services focused on being customer “friendly” and responsive.
OBJECTIVESTo provide advice and direction to Council on building and development in the Shire. To administer applicable acts, regulations and Council policies so as to facilitate, maintain, protect and promote development which is compatible with the area’s servicing capacity and natural environment and which will enhance the area as a place to live and work. To provide cost effective management of resources in addressing the priorities of Council. To provide a high level of excellence and professionalism having regard to the fiscal, physical and technological resources available.
MAJOR ACTIVITIES
Provision of building assessment, control, inspectorial and advisory services throughout the Upper Hunter Shire area.
Implement legislative changes.
PERFORMANCE INDICATORS AAnticipated2012/13
Estimate/Target2013/14
Workload Indicator: Number of construction certificates lodged in period 200 200
Effectiveness Indicator: Average time taken to process construction certificates (days) where correct information is provided
14 14
Efficiency Indicator: Number of inspections undertaken during period. 1,000 1,000
Service Indicator: Building inspections undertaken within 48 hours of request
100% 100%
LEVEL OF SERVICEUnchanged from 2012/13

RevisedBudget
2012/13
2013/14DPOP
Budget2014/15Budget
2015/16Budget
2016/17Budget
Upper Hunter Shire Council2013/14-2016/17
Delivery Program & Operational Plan
Building ControlOperating Revenue
0105. Statutory Fees & Charges (208,500) (213,100) (213,100) (213,100) (213,100)0110. User Fees & Charges (2,000) (2,000) (2,000) (2,000) (2,000)0130. Other Income 0 0 0 0 0
(210,500) (215,100) (215,100) (215,100) (215,100)Operating Expenditure
0304. Customer Services 62,000 84,000 84,000 84,000 84,0000494. Building Services 168,600 240,700 240,700 240,700 240,7000980. Administration Overheads 61,778 65,951 65,951 65,951 65,951
292,378 390,651 390,651 390,651 390,651Capital Expenditure
0839. IT Hardware for Building Control 0 0 0 0 00 0 0 0 0
Total 81,878 175,551 175,551 175,551 175,551

QQuuaarrrryy OOppeerraattiioonnssCOMMUNITY STRATEGIC OBJECTIVES (CSO’S)
Provide for replacement and improvement of community infrastructure through best practice and risk management.
OBJECTIVESTo effectively and responsibly manage, maintain and develop Council’s quarry operations. To win, produce and supply quality road making materials for internal and external works at a competitive cost. Safe operation of Council’s quarries to meet legislative requirements.
MAJOR ACTIVITIES
Operate the quarries in accordance with relevant regulations and license agreements.
Compliance with operation schedules.
Review operating procedures at quarries.
Review Council’s gravel production to improve final product.
Continued review of mine safety management plan.
Training for Council personnel in safe operation of Council quarry operations.
PERFORMANCE INDICATORS AAnticipated2012/13
Estimate/Target2013/14
Workload Indicator: Compliance with operations schedule 100% 100%
Effectiveness Indicator: Compliance with Mines Safety Management Plan No. of quarries maintained
95% 21
95%21
Efficiency Indicator: Target annual production – tonnes
Mines Safety OHS reports submitted annually
90,000
2
90,000
2
Service Indicator: No. of complaints regarding quarry operations <2 <2
LEVEL OF SERVICEOperate Council’s quarries in accordance with the Mine Safety Management Plan Rehabilitation of quarries as identified Ongoing training and monitoring of Council staff, contractors and visitors to Council quarries

RevisedBudget
2012/13
2013/14DPOP
Budget2014/15Budget
2015/16Budget
2016/17Budget
Upper Hunter Shire Council2013/14-2016/17
Delivery Program & Operational Plan
Quarry OperationsNon Operating Revenue
0910. Quarry Revenue (489,000) (538,000) (538,000) (538,000) (538,000)0920. Depreciation (29,949) (29,949) (29,949) (29,949) (29,949)6138. F-19016.8520.6422 Gravel Pit Rehab (65,000) 0 0 0 0
(583,949) (567,949) (567,949) (567,949) (567,949)Operating Expenditure
0415. Utilities 3,400 3,600 3,600 3,600 3,6000640. Quarry Operations 402,608 372,000 372,000 372,000 372,0000680. Depreciation 29,949 29,949 29,949 29,949 29,9490980. Administration Overheads 29,910 30,612 30,612 30,612 30,612
465,867 436,161 436,161 436,161 436,161Non Operating Expenditure
7132. Cont to Rds Maintenance 50,000 50,000 50,000 50,000 50,0007138. T-19016.8520.6422 Gravel Pit Rehab 8,082 11,788 31,788 31,788 31,788
58,082 61,788 81,788 81,788 81,788Capital Expenditure
0795. Comiala Rd - Gravel Pit Development 5,000 0 0 0 00806. Gravel Exploration 45,000 50,000 50,000 50,000 50,0004267. Cuan Pit Erosion & Sedimentation works 10,000 20,000 0 0 0
60,000 70,000 50,000 50,000 50,000
Total 0 0 0 0 0

PUBLIC ORDER & SAFETY
Summary ..................................................................... 177
Animal Control ......................................................... 178
Emergency Services ................................................ 180
Fire Service Levy & Fire Protection ..................... 182
Local Government Regulation Enforcement .. 184

RevisedBudget
2012/13
2013/14DPOP
Budget2014/15Budget
2015/16Budget
2016/17Budget
Upper Hunter Shire Council2013/14-2016/17
Delivery Program & Operational Plan
Public Order & SafetyOperating Revenue
Animal Control (23,300) (25,150) (25,150) (25,150) (25,150) Emergency Services (17,000) (4,500) (4,500) (4,500) (4,500) Fire Service Levy & Fire Protection (524,546) (417,590) (417,590) (417,590) (417,590) LG Regulation Enforcement (600) (6,200) (6,200) (6,200) (6,200)
(565,446) (453,440) (453,440) (453,440) (453,440)Non Operating Revenue
Animal Control (19,737) (7,093) (7,093) (7,093) (7,093) Emergency Services (39,415) (27,596) (31,086) (31,086) (31,086) Fire Service Levy & Fire Protection (20,914) (20,995) (20,995) (20,995) (20,995)
(80,066) (55,684) (59,174) (59,174) (59,174)Operating Expenditure
Animal Control 156,010 153,742 153,742 153,742 153,742 Emergency Services 152,866 157,590 161,080 161,080 161,080 Fire Service Levy & Fire Protection 590,807 573,661 573,661 573,661 573,661 LG Regulation Enforcement 73,161 93,066 93,066 93,066 93,066
972,844 978,059 981,549 981,549 981,549Non Operating Expenditure
Emergency Services 3,696 0 0 0 03,696 0 0 0 0
Capital Expenditure Animal Control 15,900 0 10,000 0 0 Fire Service Levy & Fire Protection 160,000 90,000 90,000 90,000 90,000
175,900 90,000 100,000 90,000 90,000
Total 506,928 558,935 568,935 558,935 558,935

AAnniimmaall CCoonnttrroollCOMMUNITY STRATEGIC OBJECTIVES (CSO’S)
Effectively and efficiently manage the business of Council within its Charter Promote a sense of responsibility within our community to care for our environment and provide for a sustainable future.
Provide efficient and effective advisory, assessment and regulatory services focused on being customer “friendly” and responsive.
OBJECTIVES
Monitor and enforce NSW Acts and Regulations and Council’s policies in the areas of animal and stock control, impounding, and other regulatory functions..
MAJOR ACTIVITIES
Administer the Companion Animals Act.
Maintain an efficient and effective complaint investigation system relating to companion animals and stock.
Provide an emergency-only after-hours animal control service.
PERFORMANCE INDICATORS AAnticipated2012/13
Estimate/Target2013/14
Workload Indicator: Number of companion animals impounded. Number of companion animal complaints reported/investigated.Number of other complaints reported/investigated including straying stock.
150 200
25
150150
25
Effectiveness Indicator: Number of reasonable significant, formal external and internal complaints from Council and/or customers concerning the service levels provided or action taken
<5 <5
Efficiency Indicator: Average time taken to respond to more serious and/or urgent complaints.
<1hr <1hr
Service Indicator: Response to all customer complaints/inquiries within 24 hours.
95% 95%
LEVEL OF SERVICEComplaints regarding companion animals continue to require considerable resources. Staff commitment in this area is expected to impact on the number of on site sewer management inspections achieved.

RevisedBudget
2012/13
2013/14DPOP
Budget2014/15Budget
2015/16Budget
2016/17Budget
Upper Hunter Shire Council2013/14-2016/17
Delivery Program & Operational Plan
Animal ControlOperating Revenue
0295. Animal Control Revenue (23,300) (25,150) (25,150) (25,150) (25,150)(23,300) (25,150) (25,150) (25,150) (25,150)
Non Operating Revenue0920. Depreciation (3,837) (7,093) (7,093) (7,093) (7,093)6132. F-19016.8521.6425 Scn Pound Upgrade (15,900) 0 0 0 0
(19,737) (7,093) (7,093) (7,093) (7,093)Operating Expenditure
0415. Utilities 3,410 3,400 3,400 3,400 3,4000495. Animal Control 131,650 125,500 125,500 125,500 125,5000530. Building Maintenance 5,620 6,950 6,950 6,950 6,9500680. Depreciation 3,837 7,093 7,093 7,093 7,0930980. Administration Overheads 11,493 10,799 10,799 10,799 10,799
156,010 153,742 153,742 153,742 153,742Capital Expenditure
4059. Regulatory -Pounds Upgrade 15,900 0 10,000 0 015,900 0 10,000 0 0
Total 128,873 121,499 131,499 121,499 121,499

EEmmeerrggeennccyy SSeerrvviicceessCOMMUNITY STRATEGIC OBJECTIVES (CSO’S)
Facilitate partnerships which create and support a caring community.
Facilitate and provide for a growing population.
Advocate to State and Federal Government for a fair and equitable share of fiscal resources and provision of Government services for the community.
Provide for replacement and improvement of community infrastructure through best practice and risk management
OBJECTIVESTo maintain an efficient and effective local emergency system for the protection of life and property. To protect life, property and the environment from the effects of natural and man made disasters. Ensure appropriate integration of emergency services activities in accordance with the State Emergency Management and Rescue Act. Provide adequate assistance to SES and VRA. Provide appropriate emergency management facilities.
MAJOR ACTIVITIES
Disasters and emergencies, such as floods, fires and major accidents, can have a profound impact on a close-knit community. Emergencies, while not everyday occurrences, can and do occur. Acknowledging this, Council will work together with other government groups and the community to:
protect the individual and minimise damage to property under threat from natural disasters; implement, on an ongoing basis, management plans in the areas of fire management, fuel management and disaster management (including biological, technical and natural); review all these emergency management plans regularly; convene meetings of the Upper Hunter Emergency Management Committee at 4 monthly intervals; participate in required disaster planning, risk management and training exercises; liaise with combat agencies and all those involved in emergency services;
Review Council Department responsibilities in relation to Emergency Services
Support Murrurundi VRA operations in joint consultation with Liverpool Plains Shire and Scone SES
PERFORMANCE INDICATORS AAnticipated2012/13
Estimate/Target2013/14
Workload Indicator: Ensure the successful operations of the SES/VRA organisation under the State Emergency Management and Rescue Act.
Attendance at LEMC meetings
by Agencies
Attendance at LEMC meetings
by Agencies
Effectiveness Indicator: Maintain effective structure of emergency services and control centres.
SES Units VRA units Murrurundi VRA as part of Quirindi VRA
411
411
Efficiency Indicator: Response time in attending control centre in emergencies
<5 minutes <5 minutes
Service Indicator: Number of complaints received concerning delays in attending emergencies
0 0
LEVEL OF SERVICEReview of Emergency Risk Management process for natural, biological and technological hazards within the Shire Update of Displan and operating procedures in accordance with state guidelines Development of Local Emergency Operations Centres and procedures Undertake emergency management exercises and training. Improved systems for emergency management awareness and preparedness Implementation of emergency mapping system for the shire in consultation with other government authorities Further development of animal health and airport emergency plans.

RevisedBudget
2012/13
2013/14DPOP
Budget2014/15Budget
2015/16Budget
2016/17Budget
Upper Hunter Shire Council2013/14-2016/17
Delivery Program & Operational Plan
Emergency ServicesOperating Revenue
0110. User Fees & Charges (12,500) 0 0 0 00125. Reimbursements (4,500) (4,500) (4,500) (4,500) (4,500)
(17,000) (4,500) (4,500) (4,500) (4,500)Non Operating Revenue
0920. Depreciation (31,086) (27,596) (31,086) (31,086) (31,086)6194. F-19015.8511.6533 NDMP Barrington Tops (8,329) 0 0 0 0
(39,415) (27,596) (31,086) (31,086) (31,086)Operating Expenditure
0301. Administration Costs 6,611 11,678 11,678 11,678 11,6780350. General Expenses 14,450 14,300 14,300 14,300 14,3000415. Utilities 25,706 25,500 25,500 25,500 25,5000425. Cleaning Costs 2,800 2,900 2,900 2,900 2,9000530. Building Maintenance 9,500 10,200 10,200 10,200 10,2000680. Depreciation 31,086 27,596 31,086 31,086 31,0860980. Administration Overheads 23,580 25,416 25,416 25,416 25,4165039. Contributions-State Emergency Fund 34,500 40,000 40,000 40,000 40,0005096. NDMP - Barrington Tops 4,633 0 0 0 0
152,866 157,590 161,080 161,080 161,080Non Operating Expenditure
7218. T-19015.8511.6533 NDMP Barrington Tops 3,696 0 0 0 03,696 0 0 0 0
Total 100,147 125,494 125,494 125,494 125,494

FFiirree SSeerrvviiccee LLeevvyy && FFiirree PPrrootteeccttiioonnCOMMUNITY STRATEGIC OBJECTIVES (CSO’S)
Facilitate partnerships which create and support a caring community.
Facilitate and provide for a growing population.
Advocate to State and Federal Government for a fair and equitable share of fiscal resources and provision of Government services for the community.
Provide for replacement and improvement of community infrastructure through best practice and risk management.
OBJECTIVESTo protect life, property and the environment from the effects of bushfire disasters within the Upper Hunter Shire area. Maintain local representation and autonomy of volunteer brigades. Ensure Council’s OHS responsibilities are met. Remove Council from obligations and liability for bush fire management.
MAJOR ACTIVITIES
Council will continue to liaise with the State Government to ensure that high level fire services, both volunteer and retained, are provided to ensure the safety, security and well being of residents is enhanced.
Continue to support the Rural Fire Service and provide commitment to the Volunteer Fire Service network.
Provide support and assistance to the brigades of the shire, including replacement of tankers and other equipment.
Active involvement in the implementation of the Liverpool Range Zone Service Level Agreement (SLA) and Service Delivery Model (SDM).
Maintain local representation and autonomy of brigades.
Provide input and support to development of bushfire planning and mapping activities within the Shire area.
Participate in required disaster planning management and training exercises.
Ongoing consultation with government bodies to change the funding basis for RFS.
Zone Manager to attend Council on six monthly basis.
Ongoing liaison with NSWFB at both local and regional level.
PERFORMANCE INDICATORS AAnticipated2012/13
Estimate/Target2013/14
Workload Indicator: Ensure the successful operations of the bush fire organisation under the Rural Fires Act (1997) and other relevant legislation.
Achieved Achieved
Effectiveness Indicator: The Rural Fire Service is maintained in a state of preparedness, as indicated by the number of brigades and active volunteers Meet standards of fire cover as determined by the Rural Fire Service.
Brigades 27 Active Volunteers
850 98%
Brigades 25Active Volunteers
85098%
Efficiency Indicator: Response time in attending brigade station on report of a incident.
5 minutes 5 minutes
Service Indicator: Number of complaints received regarding delay in attending fire related incident.
<2 <2
LEVEL OF SERVICE
Ongoing replacement of bushfire ‘red fleet’ with new tankers
‘White fleet’ plant provided for use by Group Captains and volunteers to respond to incidents, training and meetings
Additional stations constructed to house fire tankers and equipment.
Water tanks provided for water supply at fire shed including appropriate fittings.
Fire trails maintained and upgraded.
To protect life, property and the environment from the effects of bushfire disasters within the Upper Hunter Shire area.
Maintain local representation and autonomy of volunteer brigades.
Ensure Council’s WHS and risk management responsibilities are met.
Community engagement to improve bushfire awareness and preparedness.

RevisedBudget
2012/13
2013/14DPOP
Budget2014/15Budget
2015/16Budget
2016/17Budget
Upper Hunter Shire Council2013/14-2016/17
Delivery Program & Operational Plan
Fire Service Levy & Fire ProtectionOperating Revenue
0115. Grants (160,000) (90,000) (90,000) (90,000) (90,000)0125. Reimbursements (364,546) (327,590) (327,590) (327,590) (327,590)
(524,546) (417,590) (417,590) (417,590) (417,590)Non Operating Revenue
0920. Depreciation (20,914) (20,995) (20,995) (20,995) (20,995)(20,914) (20,995) (20,995) (20,995) (20,995)
Operating Expenditure0301. Administration Costs 10,138 6,951 6,951 6,951 6,9510350. General Expenses 11,000 10,250 10,250 10,250 10,2500415. Utilities 5,000 6,000 6,000 6,000 6,0000485. Hazard Reduction 40,000 50,000 50,000 50,000 50,0000530. Building Maintenance 9,250 10,000 10,000 10,000 10,0000591. RFS Vehicle Maintenance 57,944 22,000 22,000 22,000 22,0000680. Depreciation 20,914 20,995 20,995 20,995 20,9950980. Administration Overheads 46,615 50,965 50,965 50,965 50,9655010. Maintenance-Radios 5,750 9,500 9,500 9,500 9,5005033. Maintenance-Pumps 1,000 1,000 1,000 1,000 1,0005037. RFS - Vehicles Insurance 1,500 2,000 2,000 2,000 2,0005038. RFS Shed Insurance 7,000 7,000 7,000 7,000 7,0005060. Contributions-NSW FB 61,500 65,000 65,000 65,000 65,0005061. Contributions - RFS 301,333 312,000 312,000 312,000 312,0005101. S44 Glenrock 11,863 0 0 0 0
590,807 573,661 573,661 573,661 573,661Capital Expenditure
0730. Building Capital Works 0 0 90,000 90,000 90,0001220. Ellerston Shed 40,000 0 0 0 01221. Moonan Shed 35,000 0 0 0 01222. Killoe Shed 45,000 0 0 0 01223. Collaroy Shed 40,000 0 0 0 01272. Stewarts Brook Amenities 0 45,000 0 0 01273. Airbase Operations 0 45,000 0 0 0
160,000 90,000 90,000 90,000 90,000
Total 205,347 225,076 225,076 225,076 225,076

LLooccaall GGoovveerrnnmmeenntt RReegguullaattiioonn EEnnffoorrcceemmeennttCOMMUNITY STRATEGIC OBJECTIVES (CSO’S)
Effectively and efficiently manage the business of Council within its Charter
Provide efficient and effective advisory, assessment and regulatory services focused on being customer “friendly” and responsive.
Promote a sense of responsibility within our community to care for our environment and provide for a sustainable future.
OBJECTIVES
Monitor and enforce NSW Acts and Regulations and Council’s policies in the areas of private swimming pool safety fences, alcohol free zones and other regulatory functions. .
MAJOR ACTIVITIES
Maintain an efficient and effective complaint investigation system relating to abandoned vehicles and articles, overgrown properties/other nuisance complaints, inspection of private swimming pool fencing.
PERFORMANCE INDICATORS AAnticipated2012/13
Estimate/Target2013/14
Regulatory Services
Workload Indicator: Inspection of:-
On-site sewer management systems
Private Swimming pool
Number of other complaints reported/investigated including nuisance and health.
300
150
180
300
75
100
Effectiveness Indicator: Number of reasonable significant, formal external and internal complaints from Council and/or customers concerning the service levels provided or action taken
<5 <5
Efficiency Indicator: Average time taken to respond to more serious and/or urgent complaints.
<1hr <1hr
Service Indicator: Response to all customer complaints/inquiries within 48 hours.
95% 95%
LEVEL OF SERVICEOn-site sewer management systems will continue to require higher levels of services, especially high risk systems.

RevisedBudget
2012/13
2013/14DPOP
Budget2014/15Budget
2015/16Budget
2016/17Budget
Upper Hunter Shire Council2013/14-2016/17
Delivery Program & Operational Plan
LG Regulation EnforcementOperating Revenue
0296. LG Regulation Enforcement Revenue (600) (6,200) (6,200) (6,200) (6,200)(600) (6,200) (6,200) (6,200) (6,200)
Operating Expenditure0304. Customer Services 18,000 17,000 17,000 17,000 17,0000350. General Expenses 500 1,000 1,000 1,000 1,0000498. Private Swimming Pool Regulations 18,200 25,000 25,000 25,000 25,0000499. Nuisance & Health 12,300 26,000 26,000 26,000 26,0000980. Administration Overheads 24,161 24,066 24,066 24,066 24,066
73,161 93,066 93,066 93,066 93,066
Total 72,561 86,866 86,866 86,866 86,866

RECREATION & CULTURE
Summary .................................................................. 187
Community Centres & Halls .............................. 188
Cultural Services .................................................... 190
Museums ................................................................. 192
Other Sport & Recreation ................................... 194
Parks & Gardens .................................................... 196
Public Libraries ...................................................... 198
Sporting Grounds & Venues ............................. 200
Swimming Pools ................................................... 202

RevisedBudget
2012/13
2013/14DPOP
Budget2014/15Budget
2015/16Budget
2016/17Budget
Upper Hunter Shire Council2013/14-2016/17
Delivery Program & Operational Plan
Recreation & CultureOperating Revenue
Community Centres & Halls (16,200) (144,500) (144,500) (19,500) (19,500) Cultural Services 0 (1,600) (7,600) (1,600) (7,600) Museums (12,000) (697,000) (12,000) (12,000) (12,000) Other Sport & Recreation (3,000) (2,500) (2,500) (2,500) (2,500) Parks & Gardens (20,760) (80,000) 0 (20,000) 0 Public Libraries (100,988) (86,420) (86,420) (86,420) (86,420) Sporting Grounds & Venues (172,214) (427,432) (302,432) (234,432) (122,432) Swimming Pools (21,000) (23,000) (23,000) (23,000) (23,000)
(346,162) (1,462,452) (578,452) (399,452) (273,452)Non Operating Revenue
Community Centres & Halls (111,072) (113,913) (97,713) (111,713) (97,713) Cultural Services 0 (10,000) 0 0 0 Museums (30,854) (22,214) (21,214) (21,214) (20,985) Other Sport & Recreation (54,032) (51,150) (51,150) (51,150) (51,150) Parks & Gardens (107,751) (122,386) (102,386) (87,386) (87,386) Public Libraries (100,994) (127,758) (71,758) (71,758) (71,758) Sporting Grounds & Venues (253,834) (682,478) (345,478) (437,478) (305,478) Swimming Pools (186,614) (225,727) (276,727) (241,227) (192,727)
(845,151) (1,355,626) (966,426) (1,021,926) (827,197)Operating Expenditure
Community Centres & Halls 268,195 288,964 288,964 288,964 288,964 Cultural Services 79,045 96,184 101,084 85,084 101,084 Museums 69,519 72,027 71,027 71,027 71,027 Other Sport & Recreation 57,032 53,650 53,650 53,650 53,650 Parks & Gardens 555,727 589,778 589,778 589,778 589,778 Public Libraries 618,080 609,560 609,560 609,560 609,560 Sporting Grounds & Venues 929,215 1,074,283 1,074,283 1,074,283 1,074,283 Swimming Pools 467,218 542,845 542,845 542,845 542,845
3,044,031 3,327,291 3,331,191 3,315,191 3,331,191Non Operating Expenditure
Community Centres & Halls 8,008 0 0 0 0 Museums 9,640 0 0 0 0 Public Libraries 16,000 0 0 0 0 Sporting Grounds & Venues 40,100 48,432 48,432 48,432 48,432
73,748 48,432 48,432 48,432 48,432Capital Expenditure
Community Centres & Halls 34,660 162,000 169,000 24,000 35,000 Museums 12,360 685,360 9,360 40,360 64,131 Parks & Gardens 128,260 170,000 85,000 120,000 85,000 Public Libraries 11,273 56,000 28,000 39,000 12,000 Sporting Grounds & Venues 257,205 717,000 383,500 305,000 80,000 Swimming Pools 65,351 43,000 94,000 58,500 50,000
509,109 1,833,360 768,860 586,860 326,131
Total 2,435,575 2,391,005 2,603,605 2,529,105 2,605,105

CCoommmmuunniittyy CCeennttrreess && HHaallllssCOMMUNITY STRATEGIC OBJECTIVES (CSO’S)
Facilitate partnerships which create and support a caring community.
Form partnerships and participate in networks which address the needs and interests of disadvantaged groups in the community
Advocate for, develop and implement programs, services and facilities for our ageing community
Provide for replacement and improvement of community infrastructure through best practice and risk management.
Advocate for, support and provide services and facilities for families, children and young people.
Facilitate healthy lifestyles through participation by an in partnership with the community in sports and cultural activities.
Provide for replacement and improvement of community infrastructure through best practice and risk management.
OBJECTIVESTo provide and maintain public halls for the use of the community for social, recreational, educational and cultural activities.To provide affordable rental premises for community services to encourage such services to be based locally. To provide a purpose built centre for the use of activities and services for Senior Citizens in the Scone and Upper Hunter communities. To ensure asset refurbishment of facilities.
MAJOR ACTIVITIES
Public Halls include; Aberdeen Community Hall, Cassilis Community Centre, Merriwa School of Arts, Murrurundi RSL Hall, Murrurundi Church Hall, Settlement Hall, Woolooma Recreation Centre and Senior Citizens Centre.
Enhance and maintain current facilities in accordance with asset maintenance schedule and requests.
Provide safe and accessible facilities as a meeting place for the community.
Provide subsidised facilities in accordance with Council policy.
Facilitate the partnerships between organisations co-located in the building.
Maintain buildings in accordance with safety including fire safety standards.
To encourage the community to assist in enhancing facilities through artworks or work for the dole programs.
PERFORMANCE INDICATORS AAnticipated2012/13
Estimate/Target2013/14
Workload Indicator: Buildings from which Council operates in partnership with a community group or Committee Number of bookings made per annum
8
600
8
600
Effectiveness Indicator: Scheduled capital works completed as listed Achieved Achieved
Efficiency Indicator: Annual maintenance inspection carried out for each building.Major activities managed within budget allocation.
Achieved
100%
Achieved
100%
Service Indicator: Number of complaints received regarding maintenance not carried out as programmed.
0 0
LEVEL OF SERVICE
Public Halls and facilities are provided and maintained for the use of the community for social, recreational, educational and cultural activities.
Facilities are functional and historic items are safely preserved, displayed and housed.
Services and groups have available space and resources to utilise.
Grant funding opportunities identified for capital improvements.

RevisedBudget
2012/13
2013/14DPOP
Budget2014/15Budget
2015/16Budget
2016/17Budget
Upper Hunter Shire Council2013/14-2016/17
Delivery Program & Operational Plan
Community Centres & HallsOperating Revenue
0110. User Fees & Charges (11,000) (14,500) (14,500) (14,500) (14,500)0115. Grants 0 (125,000) (125,000) 0 00140. Contributions (5,200) (5,000) (5,000) (5,000) (5,000)
(16,200) (144,500) (144,500) (19,500) (19,500)Non Operating Revenue
0920. Depreciation (73,764) (77,713) (77,713) (77,713) (77,713)6003. F-19016.8523.6445 Special Projects (5,000) (5,000) 0 (14,000) 06067. F-19015.8510.6308 s94 R&C Scn 0 (20,000) 0 0 06080. F-19016.8522.6437 Mwa School of Arts 0 (11,200) 0 0 06082. F-19016.8522.6434 Public Halls (32,308) 0 0 0 06220. F-19015.8510.6541 S94A 0 0 (20,000) (20,000) (20,000)
(111,072) (113,913) (97,713) (111,713) (97,713)Operating Expenditure
0415. Utilities 47,865 49,500 49,500 49,500 49,5000550. Community Centres 22,200 23,200 23,200 23,200 23,2000551. Public Halls 45,340 31,500 31,500 31,500 31,5000574. Rural Public Halls Grants Program 4,500 10,000 10,000 10,000 10,0000664. Old Crt Theatre Building Maintenance 5,000 8,000 8,000 8,000 8,0000680. Depreciation 73,764 77,713 77,713 77,713 77,7130980. Administration Overheads 69,526 89,051 89,051 89,051 89,051
268,195 288,964 288,964 288,964 288,964Non Operating Expenditure
7140. T-19016.8522.6434 Public Halls 5,500 0 0 0 07232. T-19016.8522.6549 Settlement Hall 2,508 0 0 0 0
8,008 0 0 0 0Capital Expenditure
1045. SSC - Internal Painting 5,160 0 0 10,000 01051. Mdi RSL Hall - Acoustics 20,000 0 0 0 01053. Cassilis Hall - Floors 0 0 8,000 0 01058. Settlement Hall - Floors 0 0 0 0 6,0001061. Settlement Hall - Windows Upgrade 5,000 5,000 4,000 4,000 01062. Abn Hall - Painting 4,500 0 0 0 01075. Abn Hall Upgrade 0 20,000 20,000 0 01119. Scn Youth Centre Hall - Floor Upg 0 0 0 0 10,0001145. Mdi RSL Hall - Painting 0 0 0 8,000 5,0001153. Mwa School of Arts - Painting 0 0 10,000 0 01154. Mwa School of Arts - Gutter Replacement 0 10,000 0 0 01155. Mwa School of Arts - Sound System 0 0 0 0 12,0004283. SCADS Building 0 125,000 125,000 0 04314. Replace Furniture & Equip 0 2,000 2,000 2,000 2,000
34,660 162,000 169,000 24,000 35,000
Total 183,591 192,551 215,751 181,751 206,751

CCuullttuurraall SSeerrvviicceessCOMMUNITY STRATEGIC OBJECTIVES (CSO’S)
Advocate for, support and provide services and facilities for families, children and young people.
Connect our communities through activities and events, online technologies and infrastructure.
Advocate for, develop and implement programs, services and facilities for our ageing community.
Facilitate healthy lifestyles through participation by and in partnership with the community in sports and cultural activities.
Support existing education facilities and enhance learning opportunities.
Encourage and build local community capacity, within the context of the Upper Hunter Shire, i.e. Horse Capital, local festivals, local Progress Associations / Chambers of Commerce. etc
OBJECTIVESTo promote and financially support cultural activities in the Shire and encourage civic pride. To promote citizenship and celebrate Australia Day and other national days as appropriate to Upper Hunter Shire community.
MAJOR ACTIVITIES
Assist in the coordination of cultural awareness building and participation in activities.
Administer the Cultural Activities Grant program to encourage local community groups to hold small cultural activities in the Shire.
Encourage participation by providing contributions to Art Prizes in Upper Hunter Shire.
Acknowledgment of traditional owners.
Work with target groups in the community to initiate culturally appropriate activities.
Involve schools and broader community in local government week activities.
Utilise community events to highlight local government processes and achievements as well as encourage public participation.
Manage the School Achievement and Creative Arts Excellence Awards in the four local secondary schools.
Plan, develop and coordinate information sessions and volunteer support.
PERFORMANCE INDICATORS AAnticipated2012/13
Estimate/Target2013/14
Workload Indicator: Upper Hunter Shire School Achievement and Creative Arts Excellence Awards presented annuallyLocal Government Week activities held annually Cultural Activity Grants Program run annually Australia Day Awards and activities held annually Cultural Plan developed and updated annually
Achieved
Achieved Achieved Achieved Achieved
Achieved
AchievedAchievedAchievedAchieved
Effectiveness Indicator: No of cultural activities supported Achievement Awards presented Participation in Local Government Week activitiesApplications received for Cultural Activity Grants Australia Day celebrated in Aberdeen, Merriwa, Murrurundi and Scone Community members and visitors participating in Australia Day activities
24
100 20
Achieved 800
24
10020
Achieved800
Efficiency Indicator: Achievement of the major activities (detailed above) within budget.
100% 100%
Service Indicator: No of complaints received by community members
0 0
LEVEL OF SERVICETo support and encourage participation in cultural activities in the communities of the Upper Hunter Shire.

RevisedBudget
2012/13
2013/14DPOP
Budget2014/15Budget
2015/16Budget
2016/17Budget
Upper Hunter Shire Council2013/14-2016/17
Delivery Program & Operational Plan
Cultural ServicesOperating Revenue
0115. Grants 0 0 (6,000) 0 (6,000)0130. Other Income 0 (1,600) (1,600) (1,600) (1,600)
0 (1,600) (7,600) (1,600) (7,600)Non Operating Revenue
6076. F-19016.8522.6432 UHSC Public Arts 0 (10,000) 0 0 00 (10,000) 0 0 0
Operating Expenditure0350. General Expenses 200 200 200 200 2000405. Grants / Donations Paid 19,360 29,100 34,000 18,000 34,0000415. Utilities 600 600 600 600 6000460. Community Programs & Events 55,470 62,400 62,400 62,400 62,4000516. SBS Self Help Subsidy for Mdi 1,750 2,000 2,000 2,000 2,0000980. Administration Overheads 1,665 1,884 1,884 1,884 1,884
79,045 96,184 101,084 85,084 101,084
Total 79,045 84,584 93,484 83,484 93,484

MMuusseeuummssCOMMUNITY STRATEGIC OBJECTIVES (CSO’S)
Facilitate partnerships which create and support a caring community.
Provide incentives and preserve heritage items by provision of adequate information and funding opportunities.
Connect our communities through activities and events, inline technologies and infrastructure.
Facilitate healthy lifestyles through participation by an in partnership with the community in sports and cultural activities.
Provide for replacement and improvement of community infrastructure through best practice and risk management.
OBJECTIVESTo provide and maintain suitable space for the display, preservation and storage of items of historical and cultural importance to the local areas.
MAJOR ACTIVITIES
Museums include; Merriwa Bottle Museum, Merriwa Historical Museum, Murrurundi & District Historical Society (Murrurundi Literary Institute), Scone & Upper Hunter Historical Society (museum, research centre, back storage building & garage), Pioneer Cottage, Murrurundi.
Enhance and maintain current facilities in accordance with asset maintenance schedule and requests.
Provide subsidised facilities in accordance with Council policy.
Facilitate the partnerships between organisations co-located in the building.
Maintain buildings in accordance with safety including fire safety standards.
PERFORMANCE INDICATORS AAnticipated2012/13
Estimate/Target2013/14
Effectiveness Indicator: Scheduled capital works completed as listed Achieved Achieved
Efficiency Indicator: Annual maintenance inspection carried out for each building.Major activities managed within budget allocation.
Achieved
100%
Achieved
100%
Service Indicator: Number of complaints received regarding maintenance not carried out as programmed.
0 0
LEVEL OF SERVICE
Museums are provided and maintained for the use of the community for social, recreational, educational and cultural activities.
Facilities are functional and historic items are safely preserved, displayed and housed.
Grant funding opportunities identified for capital improvements.

RevisedBudget
2012/13
2013/14DPOP
Budget2014/15Budget
2015/16Budget
2016/17Budget
Upper Hunter Shire Council2013/14-2016/17
Delivery Program & Operational Plan
MuseumsOperating Revenue
0115. Grants (12,000) (497,000) (12,000) (12,000) (12,000)0140. Contributions 0 (200,000) 0 0 0
(12,000) (697,000) (12,000) (12,000) (12,000)Non Operating Revenue
0920. Depreciation (20,854) (20,854) (20,854) (20,854) (20,854)6187. F-19016.8522.6527 Norvill Aircraft Mus'm (10,000) 0 0 0 06192. F-19015.8511.6532 Museum VG Grant 2011 0 (360) (360) (360) (131)6229. F-19016.8522.6548 Museum Works 0 (1,000) 0 0 0
(30,854) (22,214) (21,214) (21,214) (20,985)Operating Expenditure
0350. General Expenses 1,500 1,800 1,800 1,800 1,8000415. Utilities 3,637 3,700 3,700 3,700 3,7000530. Building Maintenance 10,000 12,500 11,500 11,500 11,5000557. Museum Advisor Program 19,000 19,000 19,000 19,000 19,0000680. Depreciation 20,854 20,854 20,854 20,854 20,8540980. Administration Overheads 14,528 14,173 14,173 14,173 14,173
69,519 72,027 71,027 71,027 71,027Non Operating Expenditure
7214. T-19015.8511.6532 Museum VG Grant 2011 (360) 0 0 0 07229. T-19016.8522.6548 Museum Works 10,000 0 0 0 0
9,640 0 0 0 0Capital Expenditure
0787. Pioneer Cottage Rear Ext (Plan&Design) 0 0 0 10,000 00789. Mdi Norvill Aircraft Museum 10,000 685,000 0 0 00790. Mdi Museum Roof Repairs 0 0 6,000 0 00796. Mdi Museum Ext at Rear (Plan& Design) 0 0 0 0 40,0001065. Scn Museum - Brick Work Upgrade 0 0 0 10,000 01066. Scn Museum - Underpinning 0 0 0 15,000 01067. Scn Museum - Water & Pipes 0 0 0 0 15,0001068. Museums - Safe Storage Collections 0 0 0 5,000 5,0001074. Mdi Museum - Painting 2,000 0 0 0 4,0001171. Museum Signage 0 0 3,000 0 01172. Museum Disabled Access Improvement 0 0 0 0 04241. VG Grant 2011 - Mdi Historical Society 360 360 360 360 131
12,360 685,360 9,360 40,360 64,131
Total 48,665 38,173 47,173 78,173 102,173

OOtthheerr SSppoorrtt && RReeccrreeaattiioonnCOMMUNITY STRATEGIC OBJECTIVES (CSO’S)
Facilitate healthy lifestyles through participation by and in partnership with the community in sports and cultural activities.
Advocate for, support and provide services and facilities for families, children and young people.
To increase the number of young people involved in organised sport within the shire
Advocate for, develop and implement programs, services and facilities for our ageing community.
OBJECTIVESTo provide educational, recreational and sporting opportunities for residents and visitors. To ensure that Upper Hunter Shire residents and visitors have the opportunity to participate in a diverse range of passive recreational pursuits.
MAJOR ACTIVITIES
Promotion of the benefits of sporting activities within the shire
Develop and implement strategies to increase young people’s awareness of sporting organisations within the LGA
PERFORMANCE INDICATORS AAnticipated2012/13
Estimate/Target2013/14
Workload Indicator: Conduct Sports activity days in school holidays (participants per school holiday period)
Undertake Sports Development and Participation Programs per annum Undertake School visits to encourage sports participation per annum
80
6
6
80
6
6
Effectiveness Indicator: Positive feedback from Schools
Increased sports participation numbers
Achieved Achieved
Achieved
Efficiency Indicator: Number of active sporting groups within LGA 25 25
LEVEL OF SERVICEOne part-time staff member funded from Sports User fees.

RevisedBudget
2012/13
2013/14DPOP
Budget2014/15Budget
2015/16Budget
2016/17Budget
Upper Hunter Shire Council2013/14-2016/17
Delivery Program & Operational Plan
Other Sport & RecreationOperating Revenue
0115. Grants (2,200) (2,000) (2,000) (2,000) (2,000)0140. Contributions (800) (500) (500) (500) (500)
(3,000) (2,500) (2,500) (2,500) (2,500)Non Operating Revenue
6099. F-19016.8522.6431-Childrens Sports Prom (52,000) (51,150) (51,150) (51,150) (51,150)6188. F-19015.8511.6528 Tennis Participation (2,032) 0 0 0 0
(54,032) (51,150) (51,150) (51,150) (51,150)Operating Expenditure
0301. Administration Costs 52,800 51,650 51,650 51,650 51,6500661. Tennis Participation Grant 2,032 0 0 0 05085. Bike Week Expenses 2,200 2,000 2,000 2,000 2,000
57,032 53,650 53,650 53,650 53,650
Total 0 0 0 0 0

PPaarrkkss && GGaarrddeennssCOMMUNITY STRATEGIC OBJECTIVES (CSO’S)
Develop economic and intergenerational plans for future infrastructure needs.
Effectively and efficiently manage the business of the Council within its Charter.
Encourage and implement systems for minimization of the environment footprint of the Shire, including energy efficiency and consumption of natural resources.
Advocate for, support and provide services and facilities for families, children and young people.
Advocate for, develop and implement programs, services and facilities for our ageing community.
OBJECTIVESTo facilitate the provision of recreation and cultural facilities to meet identified community need providing appropriate user support is available. To provide educational, recreational, sporting and cultural opportunities for residents and visitors. To ensure that Upper Hunter Shire residents and visitors have the opportunity to participate in a diverse range of passive recreational pursuits and to provide landcare services for the rehabilitation and protection of the urban and rural environment and promote biodiversity in a cost effective and efficient manner.
MAJOR ACTIVITIES
To upgrade parks and amenities.
Update and upgrade parks and playground equipment and safety standards.
Upgrade toilets.
Upgrade water/irrigation facilities wherever possible.
Encourage local community contributions and/or input by offering finance from Council to committees as appropriate and as funds are available.
Minimise cost recovery ratio for all facilities.
Social/Community Plan 2006–2009 “Aberdeen” pp 84 – 93, “Merriwa” p 127, “Murrurundi” pp 138 – 143, , “Scone” p 160
PERFORMANCE INDICATORS AAnticipated2012/13
Estimate/Target2013/14
Workload Indicator: Number of passive parks maintained during the period. 26 26
Effectiveness Indicator: % of passive parks rated as satisfactory within any period.
>90% >90%
Efficiency Indicator: Maintenance and capital projects completed within budget allocation.
Capital Works completed and within budget
Achieved
100%
Achieved
100%
Service Indicator: Number of complaints of unsatisfactory ground condition made to Council in the period.
<10 <10
LEVEL OF SERVICEIn 2013/14 the proposed budget will sustain the ability to maintain the existing condition of the parks and gardens network, however there will be challenges ahead with the rapid rate of increase in electricity prices. Develop and maintain the Council’s parks and gardens to a high standard to meet contemporary community expectations.Ongoing communication and consultation with sporting groups to further develop sporting facilities within the shire Seek further grants for the development of sporting and recreational facilities through Government and private sources.

RevisedBudget
2012/13
2013/14DPOP
Budget2014/15Budget
2015/16Budget
2016/17Budget
Upper Hunter Shire Council2013/14-2016/17
Delivery Program & Operational Plan
Parks & GardensOperating Revenue
0115. Grants 0 (80,000) 0 (20,000) 00140. Contributions (20,760) 0 0 0 0
(20,760) (80,000) 0 (20,000) 0Non Operating Revenue
0920. Depreciation (66,807) (87,386) (87,386) (87,386) (87,386)6067. F-19015.8510.6308 s94 R&C Scn (28,000) 0 0 0 06068. F-19015.8510.6306 s94 R&C Mwa 0 (15,000) 0 0 06070. F-19015.8510.6309 s94 Open Space Scn (11,000) 0 (15,000) 0 06074. F-19015.8510.6305 s94A Contributions (1,000) (20,000) 0 0 0
(106,807) (122,386) (102,386) (87,386) (87,386)Operating Expenditure
0301. Administration Costs 700 700 700 700 7000415. Utilities 33,797 35,625 35,625 35,625 35,6250515. Tree Maintenance/Management 61,531 63,623 63,623 63,623 63,6230521. Passive Parks & Reserves 289,813 295,327 295,327 295,327 295,3270680. Depreciation 66,807 87,386 87,386 87,386 87,3860980. Administration Overheads 103,079 107,117 107,117 107,117 107,117
555,727 589,778 589,778 589,778 589,778Capital Expenditure
0704. Elizabeth Park Upgrade 3,500 0 0 0 00709. Tree Planting Scn 27,000 26,000 26,000 26,000 26,0000711. Bunnan Park Development 0 0 0 0 10,0000802. Tree Planting Abn 10,500 7,000 7,000 7,000 7,0000803. Tree Planting Mwa 11,000 11,000 11,000 11,000 11,0000804. Tree Planting Mdi 10,000 11,000 11,000 11,000 11,0000805. Wilson Mem Pk - Outdoor Exercise Equip 0 40,000 0 0 00842. Cassilis - Play Equipment 0 15,000 0 0 00843. Sheedy Park - Landscaping 0 0 0 0 20,0001179. Abn Lions Park Upg 17,000 0 0 0 01216. Abn Outdoor Gym Equipment 49,260 0 0 0 01250. Mdi - Improve Nth approach 0 20,000 0 0 01252. Scn - Improve Nth Approach 0 40,000 0 0 01253. Scn - Elizabeth Park Play Equip Shade 0 0 30,000 0 01254. Abn - Bridge Picnic Area Landscaping 0 0 0 20,000 01255. Wingen- Playground Equipment Stg 2 0 0 0 15,000 01256. Mdi - Wilson Park Shade 0 0 0 30,000 0
128,260 170,000 85,000 120,000 85,000
Total 556,420 557,392 572,392 602,392 587,392

PPuubblliicc LLiibbrraarriieessCOMMUNITY STRATEGIC OBJECTIVES (CSO’S)
Advocate for, support & provide services & facilities for families, children & young people. Facilitate partnerships which create and support a caring community. Connect our communities through activities and events, online technologies and infrastructure Provision for replacement and improvement of community infrastructure through best practice and risk management Support existing education facilities & enhance learning opportunities. Facilitate healthy lifestyles through participation by and in partnership with the community in sports & cultural activities.To participate in & encourage regional and local alliances with other Councils, Government or non-government partners.
OBJECTIVES
To provide an effective accessible library service for recreational and informational needs of the residents.
MAJOR ACTIVITIES
Increase the use of library services through promotional activities, new stock and facility enhancements.
Management of Aberdeen, Cassilis, Merriwa, Murrurundi and Scone branch buildings and maintenance.
Management of library agreement between the Upper Hunter Shire Council and Muswellbrook Shire Council.
PERFORMANCE INDICATORS AAnticipated2012/13
Estimate/Target2013/14
Workload Indicator: Number of loans Aberdeen Cassilis MerriwaMurrurundi Scone TotalNumber of circulating items Aberdeen Cassilis MerriwaMurrurundi Scone TotalNumber of Library members Aberdeen Cassilis MerriwaMurrurundi Scone TotalNumber of Group visits, activities & Displays Aberdeen Cassilis MerriwaMurrurundi Scone TotalPopulation (NSW Census 2006)
6,000 1,000 5,000 6,000
28,000 46,000
4,700 1,640 7,400 7,500
17,000 38,240
620 150 800 650
3,500 5,720
35 15 55 85
110 300
12,975
6,000600
4,3005,300
26,50042,700
4,7001,6006,6007,400
16,10036,400
390105470530
2,3603,855
35155585
110300
13,754
Effectiveness Indicator: Loans per head of population 3.5 2.6
Efficiency Indicator: DPOP: operational expenditure within budget: Gross operating expenses per capita
$635,000 $47.01
$609,560$44.32
Service Indicator: Turnover ratio = total loans / total no of circulating items.
1 1
LEVEL OF SERVICEHigh quality, accessible library facilities and services are maintained for the recreational and informational needs of the residents of the Upper Hunter.

RevisedBudget
2012/13
2013/14DPOP
Budget2014/15Budget
2015/16Budget
2016/17Budget
Upper Hunter Shire Council2013/14-2016/17
Delivery Program & Operational Plan
Public LibrariesOperating Revenue
0110. User Fees & Charges (10,108) (9,320) (9,320) (9,320) (9,320)0115. Grants (90,293) (76,300) (76,300) (76,300) (76,300)0130. Other Income (587) (800) (800) (800) (800)
(100,988) (86,420) (86,420) (86,420) (86,420)Non Operating Revenue
0920. Depreciation (96,027) (71,758) (71,758) (71,758) (71,758)6067. F-19015.8510.6308 s94 R&C Scn 0 (20,000) 0 0 06074. F-19015.8510.6305 s94A Contributions 0 (20,000) 0 0 06084. F-19016.8522.6433 Library Improvements (4,967) 0 0 0 06230. F-19015.8511.6550 Library Revitalisation 0 (16,000) 0 0 0
(100,994) (127,758) (71,758) (71,758) (71,758)Operating Expenditure
0301. Administration Costs 228,000 232,460 232,460 232,460 232,4600350. General Expenses 103,694 114,280 114,280 114,280 114,2800415. Utilities 38,494 39,400 39,400 39,400 39,4000425. Cleaning Costs 29,300 28,400 28,400 28,400 28,4000530. Building Maintenance 16,000 13,000 13,000 13,000 13,0000680. Depreciation 96,027 71,758 71,758 71,758 71,7580980. Administration Overheads 20,065 21,762 21,762 21,762 21,7625019. Regional Library Contribution 72,000 73,500 73,500 73,500 73,5005105. Local Priority Works 14,500 15,000 15,000 15,000 15,000
618,080 609,560 609,560 609,560 609,560Non Operating Expenditure
7231. T-19015.8511.6550 Library Revitalisation 16,000 0 0 0 016,000 0 0 0 0
Capital Expenditure0793. Scn Library Relocation 1,008 0 0 0 00808. Upgrade Public PCs 1,796 0 0 0 01152. Mdi - Air Conditioning 2,169 0 0 0 01217. Abn Library - Air Conditioning 6,300 0 0 0 01226. Moveable Signage Banners 0 2,000 0 0 01227. Abn - Library Upgrade 0 10,000 10,000 10,000 01228. Mwa-Add staff workspace & shelving 0 0 0 20,000 01229. Additional Furniture 0 5,000 5,000 5,000 5,0001230. Return Facilities at Libraries 0 0 6,000 0 01231. Outdoor reading areas 0 0 0 2,000 01232. Young adults section furniture 0 0 5,000 0 5,0001233. Scn - Disabled Toilet 0 20,000 0 0 01234. Display Boards 0 3,000 2,000 2,000 2,0001278. Revitalising Libraries 0 16,000 0 0 0
11,273 56,000 28,000 39,000 12,000
Total 443,371 451,382 479,382 490,382 463,382

SSppoorrttiinngg GGrroouunnddss && VVeennuueessCOMMUNITY STRATEGIC OBJECTIVES (CSO’S)
Provide for replacement and improvement of community infrastructure through best practice and risk management.
Develop economic and intergenerational plans for future infrastructure needs.
Advocate for, support and provide services and facilities for families, children and young people.
Connect our communities through activities and events, online technologies and infrastructure.
Advocate for, develop and implement programs, services and facilities for our ageing community.
OBJECTIVESTo facilitate the provision of recreation and cultural facilities to meet identified community need providing appropriate user support is available. To provide educational, recreational, sporting and cultural opportunities for residents and visitors. To ensure that Upper Hunter Shire residents and visitors have the opportunity to participate in a diverse range of sporting and recreational pursuits and to provide landcare services for the rehabilitation and protection of the urban and rural environment and promote biodiversity in a cost effective and efficient manner.
MAJOR ACTIVITIES
To upgrade sports grounds and amenities.
Upgrade change rooms and toilets.
Upgrade water/irrigation facilities wherever possible.
Encourage local community contributions and/or input by offering finance from Council to committees as appropriate and as funds are available.
Minimise cost recovery ratio for all facilities.
Social/Community Plan 2006–2009 “Aberdeen” pp 84 – 93, “Merriwa” p 127, “Murrurundi” pp 138 – 143, , “Scone” p 160
PERFORMANCE INDICATORS AAnticipated2012/13
Estimate/Target2013/14
Workload Indicator: Hectares of active sporting grounds maintained during period
82ha 82ha
Effectiveness Indicator: % of playing surfaces rated as satisfactory within any period.
>90% >90%
Efficiency Indicator: Maintenance and capital projects completed within budget allocation.
Sports Board Meetings conducted during year Murrurundi Scone/Aberdeen Merriwa Capital Works completed and within budget
Achieved
464
100%
Achieved
444
100%
Service Indicator: Number of complaints of unsatisfactory ground condition made to Council in the period.
<10 <10
LEVEL OF SERVICEIn 2013/14 the proposed budget will sustain the ability to maintain the existing condition of the sporting grounds network, however there will be challenges ahead with the rapid rate of increase in electricity prices. Develop and maintain the Council’s sporting facilities to a high standard to meet contemporary Community expectations. Ongoing communication and consultation with sporting groups to further develop sporting facilities within the Shire Seek further grants for the development of sporting and recreational facilities through Government and private sources.

RevisedBudget
2012/13
2013/14DPOP
Budget2014/15Budget
2015/16Budget
2016/17Budget
Upper Hunter Shire Council2013/14-2016/17
Delivery Program & Operational Plan
Sporting Grounds & VenuesOperating Revenue
0110. User Fees & Charges (52,100) (48,432) (48,432) (48,432) (48,432)0112. White Park Horse Stalls Revenue (42,000) (44,000) (44,000) (44,000) (44,000)0115. Grants (40,000) (325,000) (200,000) (132,000) (20,000)0140. Contributions (38,114) (10,000) (10,000) (10,000) (10,000)
(172,214) (427,432) (302,432) (234,432) (122,432)Non Operating Revenue
0920. Depreciation (156,107) (285,478) (285,478) (285,478) (285,478)6003. F-19016.8523.6445 Special Projects (35,000) (20,000) (30,000) (20,000) (20,000)6028. F-19016.8522.6467 Property Disposal 0 (300,000) 0 0 06043. F-19015.8510.6307 s94 Open Space Mwa 0 (10,000) 0 0 06067. F-19015.8510.6308 s94 R&C Scn (25,500) (15,000) 0 0 06070. F-19015.8510.6309 s94 Open Space Scn 0 (10,000) 0 0 06074. F-19015.8510.6305 s94A Contributions (37,227) (42,000) (30,000) (132,000) 0
(253,834) (682,478) (345,478) (437,478) (305,478)Operating Expenditure
0301. Administration Costs 4,114 4,255 4,255 4,255 4,2550415. Utilities 121,535 135,835 135,835 135,835 135,8350520. Sporting Grounds 483,837 479,090 479,090 479,090 479,0900523. White Park Horse Stalls 43,543 40,888 40,888 40,888 40,8880680. Depreciation 156,107 285,478 285,478 285,478 285,4780980. Administration Overheads 103,079 108,037 108,037 108,037 108,0375084. Mobile Amenities 17,000 20,700 20,700 20,700 20,700
929,215 1,074,283 1,074,283 1,074,283 1,074,283Non Operating Expenditure
7099. T-19016.8522.6431 Childrens Sports Prom 40,100 48,432 48,432 48,432 48,43240,100 48,432 48,432 48,432 48,432
Capital Expenditure0827. Bill Rose Complex Club House 0 0 0 265,000 00829. Aberdeen Skate Park 0 100,000 0 0 00830. Scone Skate Park 0 0 200,000 0 00845. Mdi Cricket Pitch 0 7,000 0 0 00847. White Park Development 0 500,000 20,000 20,000 01084. Merriwa Skate Park 48,114 10,000 100,000 0 01184. Bill Rose Complex - Canteen Awning 33,000 0 0 0 01185. Mdi Gym - Lining of Shed Walls 15,000 0 0 0 04105. Jefferson Park Power Upgrade 0 20,000 0 0 04108. Risk Management Signage 8,000 0 0 0 04109. Mwa Showground Upgrade 19,668 20,000 20,000 20,000 20,0004159. Scn Park Upgrade 0 0 0 0 60,0004237. Rosedale Amenities-Roof & D'sbld Toilets 48,500 0 0 0 04266. Harrison Oval Disabled toilets 22,000 0 0 0 04280. Picnic Shelters Wingen Rodeo Grds 0 0 0 0 04284. Mwa Showground Fence 45,332 0 0 0 04286. Rosedale Sports Complex - Stock Chutes 7,727 0 0 0 04292. Scn Basketball Stadium - Toilet Upgrade 3,500 0 0 0 04306. Rosedale - Renew Office Building 0 5,000 0 0 04307. Rosedale - Stock yard upgrade 0 10,000 0 0 04308. Rosedale - Renew water mains 0 0 25,000 0 04309. Rosedale - install power outlets 0 0 3,500 0 04315. Scn Netball Courts Rehab 6,364 0 0 0 04403. Recreation & Open Space Needs Study 0 35,000 0 0 04404. Scn-White Park seating & Shade trees 0 10,000 0 0 04405. Scn Basketball Stadium-Upgrade Lighting 0 0 15,000 0 0
257,205 717,000 383,500 305,000 80,000
Total 800,472 729,805 858,305 755,805 774,805

SSwwiimmmmiinngg PPoooollssCOMMUNITY STRATEGIC OBJECTIVES (CSO’S)
Facilitate healthy lifestyles through participation by and in partnership with the community in sports and cultural activities.
Provide for replacement and improvement of community infrastructure through best practice and risk management.
Facilitate and provide for a growing population.
Advocate for, develop and implement programs, services and facilities for our ageing community.
OBJECTIVES
To provide recreational facilities for the Upper Hunter community, which are operated in a safe, efficient and effective manner.
MAJOR ACTIVITIES
To undertake routine maintenance to the plant and facilities.
To continue with capital improvements.
Improve access for people with disabilities to all Pools.
Upgrade security at swimming pools
Ensure compliance with Water Safety legislation and Best Practice Guidelines
PERFORMANCE INDICATORS AAnticipated2012/13
Estimate/Target2013/14
Workload Indicator: Number of entries to swimming pools Season ticket holders Non-Season ticket holders School sports
27,000 12,000 14,000
28,00014,00016,000
Efficiency indicator: Operational expenditure and capital projects completed within budget and timeframes
100% 100%
Effectiveness Indicator: Pools available and meeting water quality standards 100% 100%
Service Indicator: Number of complaints received during period 5 5
LEVEL OF SERVICESwimming Pools level of service to be provided on same level as 2012/13. Contract management, where deemed appropriate, in accordance with Council’s requirements. Seek additional funding options for the continual development of swimming pools.

RevisedBudget
2012/13
2013/14DPOP
Budget2014/15Budget
2015/16Budget
2016/17Budget
Upper Hunter Shire Council2013/14-2016/17
Delivery Program & Operational Plan
Swimming PoolsOperating Revenue
0110. User Fees & Charges (21,000) (23,000) (23,000) (23,000) (23,000)(21,000) (23,000) (23,000) (23,000) (23,000)
Non Operating Revenue0920. Depreciation (117,114) (182,727) (182,727) (182,727) (182,727)6003. F-19016.8523.6445 Special Projects (25,000) (18,000) (32,000) (5,000) (10,000)6063. F-19016.8522.6464 Swimming Pool C/o Work (31,000) 0 0 0 06067. F-19015.8510.6308 s94 R&C Scn 0 (15,000) 0 0 06070. F-19015.8510.6309 s94 Open Space Scn (10,000) 0 0 0 06072. F-19015.8510.6304 s94 Open Space Mdi 0 (3,000) 0 0 06074. F-19015.8510.6305 s94A Contributions (3,500) (7,000) (62,000) (53,500) 0
(186,614) (225,727) (276,727) (241,227) (192,727)Operating Expenditure
0415. Utilities 42,149 41,700 41,700 41,700 41,7000524. Scn Maintenance 92,100 104,400 104,400 104,400 104,4000525. Mdi Maintenance 85,000 78,400 78,400 78,400 78,4000526. Mwa Maintenance 92,100 95,000 95,000 95,000 95,0000680. Depreciation 117,114 182,727 182,727 182,727 182,7270980. Administration Overheads 38,755 40,618 40,618 40,618 40,618
467,218 542,845 542,845 542,845 542,845Capital Expenditure
1127. Mwa - Circulation Pump Installation 25,000 0 0 0 01128. Mwa - Recaulk Scum Gutters 0 6,000 0 0 01129. Mwa - Security Upg incl Cameras 0 0 0 5,000 01132. Mdi - Kiosk Security Doors & Grills 2,500 0 0 0 01133. Mdi - Security Upg incl Cameras 5,000 0 0 0 01136. Scn - Renew Depth Markers 1,851 0 0 0 01137. Scn - Repl Toddler Pool Concourse 0 0 0 10,000 01139. Scn - Storage Shed 9,000 0 0 0 01140. Scn - Changeroom Retrofit 0 0 0 10,000 20,0001144. Mdi - Valve Replacement & Plantroom Upg 0 5,000 0 0 01156. Mdi - Perimeter Fence Upg 2,500 0 6,000 0 04092. Mwa Change Room Upgrade 0 0 10,000 0 04094. Scn - Valve Replacement in Plantroom 0 15,000 0 10,000 04097. Mdi New BBQ 0 0 0 7,500 04101. Scn Security System 4,000 0 0 0 04102. Scn New Shade Covers 0 0 10,000 0 04103. Scn Kiosk Awning Extension 5,000 0 0 0 04166. Scn RLCIP3 - Pump Upgrade 0 0 25,000 0 04172. Scn Secure Lifting Locks 5,000 0 0 0 04272. Magnum Jnr Auto Pool Cleaner 5,500 0 0 0 04293. Mwa - relocate office 0 0 2,000 0 04294. Mwa - replace rtn line east scum gutter 0 0 20,000 0 04295. Mwa - Upgrade Electrical Switchboard 0 12,000 0 0 04296. Mdi - Tile replacement & pool painting 0 0 8,000 0 04297. Mdi - Disabled entry steps 0 0 0 0 7,0004298. Mdi - Replace starting platforms 0 3,000 0 0 9,0004299. Mdi - Kiosk/office - gutter renewal 0 2,000 0 0 04300. Mdi - pool blanket/covers renewal 0 0 8,000 0 04301. Mdi - Shade Cover 25m pool 0 0 0 16,000 04303. Mdi - Plant room auto PH adjuster 0 0 5,000 0 04329. Mwa - Disabled Steps 0 0 0 0 7,0004330. Scn - Disabled Steps 0 0 0 0 7,000
65,351 43,000 94,000 58,500 50,000
Total 324,955 337,118 337,118 337,118 377,118

TRANSPORT & COMMUNICATION
Summary .................................................................. 205
Aerodromes .......................................................... 206
Footpaths ................................................................ 208
Roads & Bridges – Local ..................................... 210
Roads & Bridges – Regional ............................... 214
RMS – State Roads ................................................. 216
Transport Ancillaries ............................................ 218

RevisedBudget
2012/13
2013/14DPOP
Budget2014/15Budget
2015/16Budget
2016/17Budget
Upper Hunter Shire Council2013/14-2016/17
Delivery Program & Operational Plan
Transport & CommunicationOperating Revenue
Aerodromes (45,000) (49,000) (49,000) (49,000) (49,000) Footpaths (13,626) (46,000) (44,200) (28,000) (28,000) RMS - State Roads (3,430,000) (2,620,000) (2,620,000) (2,620,000) (2,620,000) Roads & Bridges - Local (Sealed, Unsealed & Urban) (4,144,208) (2,244,583) (2,967,533) (2,802,510) (2,786,385) Roads & Bridges - Regional (1,528,000) (1,513,000) (1,256,000) (1,256,000) (1,256,000) Transport Ancillaries (88,880) (93,100) (68,100) (83,100) (68,100)
(9,249,714) (6,565,683) (7,004,833) (6,838,610) (6,807,485)Non Operating Revenue
Aerodromes (49,924) (152,944) (152,944) (152,944) (152,944) Footpaths (31,250) (62,277) (57,250) (31,250) (31,250) Roads & Bridges - Local (Sealed, Unsealed & Urban) (10,579,898) (10,785,641) (5,215,762) (5,145,762) (5,045,762) Roads & Bridges - Regional (1,409,546) (1,358,315) (1,343,834) (1,343,834) (1,343,834) Transport Ancillaries (43,711) (100,411) (42,411) (177,411) (22,411)
(12,114,329) (12,459,588) (6,812,201) (6,851,201) (6,596,201)Operating Expenditure
Aerodromes 260,262 360,681 354,060 352,954 351,749 Footpaths 115,497 89,180 120,430 120,430 120,430 RMS - State Roads 2,926,243 2,369,467 2,369,467 2,369,467 2,369,467 Roads & Bridges - Local (Sealed, Unsealed & Urban) 10,914,996 10,789,241 10,579,397 10,554,165 10,526,322 Roads & Bridges - Regional 1,994,773 2,312,774 2,435,795 2,435,795 2,435,795 Transport Ancillaries 381,755 394,332 391,532 391,532 391,532
16,593,526 16,315,675 16,250,681 16,224,343 16,195,295Non Operating Expenditure
Aerodromes 33,199 34,124 35,245 36,351 37,556 Footpaths 25,225 0 0 0 0 RMS - State Roads 439,000 250,533 250,533 250,533 250,533 Roads & Bridges - Local (Sealed, Unsealed & Urban) 3,851,247 877,902 469,681 494,911 522,756 Roads & Bridges - Regional (220,045) 0 0 0 0 Transport Ancillaries 38,380 30,000 20,000 0 0
4,167,006 1,192,559 775,459 781,795 810,845Capital Expenditure
Aerodromes 0 20,000 20,000 0 0 Footpaths 53,401 132,000 125,000 80,000 155,000 Roads & Bridges - Local (Sealed, Unsealed & Urban) 4,173,744 5,986,000 1,671,000 1,582,000 1,338,300 Roads & Bridges - Regional 1,616,657 890,000 490,000 740,000 690,000 Transport Ancillaries 33,310 136,000 170,000 288,000 33,000
5,877,112 7,164,000 2,476,000 2,690,000 2,216,300
Total 5,273,601 5,646,963 5,685,106 6,006,327 5,818,754

AAeerrooddrroommeessCOMMUNITY STRATEGIC OBJECTIVES (CSO’S)
Advocate to State and Federal Government for a fair and equitable share of fiscal resources and provision of Government services for the community.
Provide for replacement and improvement of community infrastructure through best practice and risk management.
Advocate, facilitate and provide traffic management and public transport facilities to meet the needs of the community.
To effectively and efficiently manage the business of the Council within its Charter.
Support and develop a thriving and growing business community with increased employment..
OBJECTIVES
To provide an airport; approved by the Civil Aviation Safety Authority that caters for private and commercial aviation operators.
An airport facility is provided which operates on a user pays basis and meets the needs of commuters to and from Scone.
Improve airport facilities and infrastructure to meet community and user expectations.
To reintroduce a regular passenger transport from Scone to Sydney to meet customer demands.
Ongoing certification of the airport in accordance with CASA guidelines.
To continue development and sale of airport light industrial land and hangar sites.
MAJOR ACTIVITIES
Undertake regular building and infrastructure maintenance.
Conduct regular and statutory maintenance and inspections to meet CASA requirements.
Conduct regular mowing and slashing to maintain grounds in a clean and tidy state at all times.
Maintain runway in a safe working condition.
The airport operates in accordance with relevant regulations and perceived emergency needs can be responded to.
Undertake detailed inspection of airside pavements and update 20 year pavement maintenance program.
Undertake Safety/Technical Audit utilising CASA approved auditor.
Undertake an annual emergency exercise.
Attract additional air industries relocated to Scone Airport.
PERFORMANCE INDICATORS AAnticipated2012/13
Estimate/Target2013/14
Workload Indicator: Airside and landside areas maintained to CASA and Air Services standards
Achieved Achieved
Effectiveness Indicator: Number of inspections that satisfy CASA requirements 4 per week 4 per week
Capital Works completed and within budget 100% 100%
% of availability of aerodrome for unrestricted use 100% 100%
Efficiency Indicator: Notams issued within appropriate timeframe 100% 100%
CASA audit completed < 4 actions required
< 4 actions required
Service Indicator: Number of action requests <2 <2
Number of landings per annum 3,730 3,750
LEVEL OF SERVICE
Obstacle limitation survey (OLS) completed annually
Funding options for airport infrastructure, both airside and landside, be investigated to allow for upgrade to meet current and future requirements.
Ongoing facilitation and consultation regarding future RPT service to Scone

RevisedBudget
2012/13
2013/14DPOP
Budget2014/15Budget
2015/16Budget
2016/17Budget
Upper Hunter Shire Council2013/14-2016/17
Delivery Program & Operational Plan
AerodromesOperating Revenue
0110. User Fees & Charges (45,000) (49,000) (49,000) (49,000) (49,000)(45,000) (49,000) (49,000) (49,000) (49,000)
Non Operating Revenue0920. Depreciation (49,924) (152,944) (152,944) (152,944) (152,944)
(49,924) (152,944) (152,944) (152,944) (152,944)Operating Expenditure
0301. Administration Costs 8,689 8,505 8,505 8,505 8,5050350. General Expenses 8,900 10,700 10,700 10,700 10,7000415. Utilities 13,250 13,750 13,750 13,750 13,7500425. Cleaning Costs 1,000 1,000 1,500 1,500 1,5000510. Grounds Maintenance 55,418 49,658 49,658 49,658 49,6580530. Building Maintenance 6,500 11,000 5,000 5,000 5,0000610. Airside Services Maintenance 16,360 12,151 12,151 12,151 12,1510680. Depreciation 49,924 152,944 152,944 152,944 152,9440980. Administration Overheads 59,570 61,247 61,247 61,247 61,2476903. Loan - Aerodrome 40,651 39,726 38,605 37,499 36,294
260,262 360,681 354,060 352,954 351,749Non Operating Expenditure
6903. Loan - Aerodrome 13,199 14,124 15,245 16,351 17,5567128. T-19016.8523.6439 Airport, Scn 20,000 20,000 20,000 20,000 20,000
33,199 34,124 35,245 36,351 37,556Capital Expenditure
1115. Airport - Drainage Works 0 20,000 0 0 01187. Airport - Certification Works 0 0 20,000 0 0
0 20,000 20,000 0 0
Total 198,537 212,861 207,361 187,361 187,361

FFoooottppaatthhssCOMMUNITY STRATEGIC OBJECTIVES (CSO’S)
Provide for replacement and improvement on community infrastructure through best practice and risk management.
Connect our communities through activities and events, online technologies and infrastructure.
Develop economic and intergenerational plans for future infrastructure needs.
OBJECTIVES
Provide and maintain a cycleway / footpath network that will contribute to the accessibility, safety and amenity of streets in Council’s towns and villages.
MAJOR ACTIVITIES
To maximise safety for footpath users.
Continued implementation of best practice standards to maintain quality of services provided.
Ongoing assessment of paved footpaths in accordance with Council’s Maintenance and Inspection Policy.
Maintain paved and unpaved footpaths to agreed levels in accordance with Councils Intervention and Risk Assessment procedures.
Social/Community Plan 2006 – 2009
PERFORMANCE INDICATORS – PUBLIC TRANSPORT AAnticipated2012/13
Estimate/Target2013/14
Workload Indicator: % of network rated as in satisfactory condition on an annual basis
90 90
Effectiveness Indicator:
Time taken to carry out essential maintenance in accordance with Council's Best Practice Policies Programmed work completed within time and budget constraints. Monitored through maintenance management systems
<10 days
95%
<10 days
95%
Efficiency Indicator: Major activities managed within budget allocation. Achieved Achieved
Service Indicator: Number of complaints received concerning unsafe conditions.
<10 <10
LEVEL OF SERVICEFootpaths to be regularly inspected for any deterioration or uneven surfaces.

RevisedBudget
2012/13
2013/14DPOP
Budget2014/15Budget
2015/16Budget
2016/17Budget
Upper Hunter Shire Council2013/14-2016/17
Delivery Program & Operational Plan
FootpathsOperating Revenue (13,626) (46,000) (44,200) (28,000) (28,000)
0140. Contributions (13,626) (46,000) (44,200) (28,000) (28,000)
Non Operating Revenue (31,250) (62,277) (57,250) (31,250) (31,250)0920. Depreciation (31,250) 0 (31,250) (31,250) (31,250)6086. F-19015.8510.6312 Footpath/Cycleway, Abn 0 (37,052) 0 0 06167. F-19016.8523.6514 Footpaths, Scn 00 (25,225) (26,000) 0 0
Operating Expenditure 115,497 89,180 120,430 120,430 120,4300560. Footpath Maintenance 84,247 89,180 89,180 89,180 89,1800680. Depreciation 331,250 0 31,250 31,250 31,250
Non Operating Expenditure 25,225 0 0 0 07189. T-19016.8523.6514 Footpaths, Scn 225,225 0 0 0 0
Capital Expenditure 53,401 132,000 125,000 80,000 155,0001181. Ftpth - Kingdon St, Scn (Hill-Guernsey) 0 30,000 0 0 01182. Ftpth - Pages River Walk, Mdi 4,000 10,000 5,000 0 5,0001202. Ftpth - Perth St,Abn(NE Hwy-Campbell) 0 72,000 0 0 04044. Ftpth - Haydon St,Mdi(Victoria-Adelaide) 0 0 0 30,000 04058. Ftpth - Kelly St, Scn (McD to Eveleigh) 8,544 0 0 0 04081. Ftpth - Park St, Scn 40,857 0 0 0 04083. Ftpth - Graeme St, Abn 0 0 0 30,000 04087. Ftpth - Graeme St,Abn(Macqueen-Campbell) 0 0 0 0 55,0004327. Kerb Ramp Upgrade 0 20,000 20,000 20,000 20,0004350. Scn-Barton St (Alabama to Susan St) 0 0 50,000 0 50,0004351. Scn-Gundy Rd (Barton to Kilgalin St) 0 0 0 0 25,0004352. Scn - Moobi Rd Cycleway 0 0 50,000 0 0
Total 149,247 112,903 143,980 141,180 216,180

RRooaaddss && BBrriiddggeess –– LLooccaallCOMMUNITY STRATEGIC OBJECTIVES (CSO’S)
Provide for replacement and improvement of community infrastructure through best practice and risk management. Effectively and efficiently manage the business of the Council within its Charter. Connect our communities through activities and events, online technologies and infrastructure. Develop economic and intergenerational plans for future infrastructure needs. Advocate, facilitate and provide traffic management and public transport facilities to meet the needs of the
community.Advocate to State and Federal government for a fair and equitable share of fiscal resources and provision of Government services for the community. Encourage and implement systems for minimisation of the environmental footprint of the Shire, including energy efficiency and consumption of natural resources.
OBJECTIVESTo undertake roads and bridge maintenance and construction works to acceptable standards in a cost-effective, cost-efficient and safe manner, so as to minimise future expenses.
MAJOR ACTIVITIESMaintain emphasis on roads and bridges as Council’s priority. Town street reconstruction program, pothole patching/urgent repair items, drainage maintenance. Increase effectiveness of preventative maintenance work as part of maintenance management works practices. Heavy overlay patching (sealed Shire roads). Determine construction and quality specifications for road construction and communicate criteria to staff. Social/Community Plan 2006 – 2009 “Improving Local Roads” PERFORMANCE INDICATORS AAnticipated
2012/13Estimate/Target
2013/14
Local Roads
Workload Indicator: Non-urban sealed (km) 314 317
Non-urban unsealed (km) 1,157.70 1,154
Bridges & Major Culverts on Local Roads 87 87
Effectiveness: Percentage of pavement surface rated as in satisfactory condition at end of any period
75% 75%
Efficiency: Time taken to carry out essential maintenance in accordance with Council’s Best Practice Policies. Capital works projects completed.
<10 days
95%
<10 days
95%
Service Number of complaints received concerning condition of network.
<320 <320
Urban Roads
Workload: Sealed (km) 107.42 109
Unsealed (km) 21 21
Bridges and major culverts on Non Regional Urban Roads
5 5
Effectiveness: Percentage of pavement surface rated as in satisfactory condition at end of any period
80% 80%
Efficiency: Time taken to carry out essential maintenance in accordance with Council’s Best Practice Policies. Programmed work completed within time and budget constraints.
<10 days
95%
<10 days
95%
Service Number of complaints received concerning condition of network.
<100 <80
Unsealed Roads
Maintenance Grading 950km 950km
Gravel Placed 30,000m3 30,000m3
LEVEL OF SERVICE
The level of service provided to roads and bridges is affected by variations in weather and limited resources.
Roads and bridges are a focus of Council for additional resources, including the Local Infrastructure Renewal Scheme, subject to Special Rate Variation.

RevisedBudget
2012/13
2013/14DPOP
Budget2014/15Budget
2015/16Budget
2016/17Budget
Upper Hunter Shire Council2013/14-2016/17
Delivery Program & Operational Plan
Roads & Bridges - Local (Sealed, Unsealed & Urban)Operating Revenue
0110. User Fees & Charges (6,000) (4,000) (6,000) (6,000) (6,000)0115. Grants (3,853,499) (1,910,004) (2,771,080) (2,621,080) (2,621,080)0130. Other Income (54,208) (167,829) (169,703) (154,680) (138,555)0140. Contributions (230,501) (162,750) (20,750) (20,750) (20,750)
(4,144,208) (2,244,583) (2,967,533) (2,802,510) (2,786,385)Non Operating Revenue
0920. Depreciation (4,790,762) (4,874,658) (4,790,762) (4,790,762) (4,790,762)0941. LIRS Loan Funding (3,215,000) (2,015,000) 0 0 06003. F-19016.8523.6445 Special Projects (400,000) 0 0 0 (100,000)6050. F-19016.8517.6409 FAG (885,818) (866,983) 0 0 06092. F-19015.8511.6346 R2R Projects Carryover (283,818) 0 0 0 06127. F-19016.8523.6480 Turanville Causeway (22,000) 0 0 0 06129. F-19016.8523.6492 Roadworks Incompleted (357,500) (140,000) 0 0 06130. Cont from Waste Management (100,000) (105,000) (105,000) (105,000) (105,000)6157. Cont from Scn/Abn Sewer (30,000) (70,000) 0 0 06175. Cont from Quarry Operations (50,000) (50,000) (50,000) (50,000) (50,000)6177. F-19016.8523.6453 Scn-Reseals & Resheets (351,000) (80,000) 0 0 06185. F-19016.8523.6525 Middlebrook Rd (20,000) 0 0 0 06186. F-19016.8523.6526 Coolibah St, Scn (74,000) 0 0 0 06219. F-19016.8523.6540 Local Infra Renewal 0 (84,000) 0 0 06224. F-19015.8512.6544 LIRS Brdg Unspent Loan 0 (1,545,000) 0 0 06225. F-19015.8512.6544 LIRS Urb Unspent Loan 0 (955,000) (270,000) (200,000) 0
(10,579,898) (10,785,641) (5,215,762) (5,145,762) (5,045,762)Operating Expenditure
0301. Administration Costs 172,022 168,000 168,000 168,000 168,0000387. LIRS 1 Bridge Loan 35,126 81,600 74,878 67,838 59,8260388. LIRS 1 Urban Rds Loan 12,489 75,022 68,842 62,370 55,0030389. Bridges Loan 96,085 93,898 91,249 88,635 85,7870539. Urban Rds Reseals 225,000 283,500 258,500 258,500 258,5000540. Rural Rds (Sealed) Maintenance 821,757 857,999 857,999 857,999 857,9990541. Rural Rds Reseals 672,000 444,000 389,000 389,000 389,0000542. Rural Rds (Unsealed) Maintenance 2,000,307 2,128,305 2,128,305 2,128,305 2,128,3050543. Urban Rds (Sealed) Maintenance 386,195 445,001 445,001 445,001 445,0010544. Urban Rds (Unsealed) Maintenance 57,768 41,200 41,200 41,200 41,2000545. Bridge & Culvert Maintenance (Sealed) 224,903 239,000 239,000 239,000 239,0000558. Rural Rds Gravel Resheets 220,000 207,000 207,000 207,000 207,0000576. Flood Restoration - Jun 11 18,000 0 0 0 00577. Flood Damage - Feb 12 42,000 0 0 0 00579. Flood Damage - Nov 11 24,000 0 0 0 00603. Flood Damage March 2012 122,000 0 0 0 00604. Floods Damage - Jan 13 63,000 50,000 0 0 00606. Flags Road re-instatement works 12,710 0 0 0 00680. Depreciation 4,790,762 4,874,658 4,790,762 4,790,762 4,790,7620980. Administration Overheads 918,872 718,519 718,519 718,519 718,5190991. LIRS 2 Bridge Loan 0 41,073 50,947 46,360 41,5170993. LIRS 2 Urban Rds Loan 0 40,466 50,195 45,676 40,903
10,914,996 10,789,241 10,579,397 10,554,165 10,526,322Non Operating Expenditure
0387. LIRS 1 Bridge Loan 40,683 133,543 140,265 147,305 155,3170388. LIRS 1 Urban Rds Loan 14,383 122,778 128,958 135,430 142,7970389. Bridges Loan 31,198 33,385 36,034 38,648 41,4960991. LIRS 2 Bridge Loan 0 58,405 81,690 86,276 91,1220993. LIRS 2 Urban Rds Loan 0 57,541 80,484 85,002 89,7747050. T-19016.8517.6409 FAG 866,983 0 0 0 07057. T-19015.8510.6310 Nandowra Rd Constr 6,000 0 0 0 07129. T-19016.8523.6492 Roadworks Incompleted 228,000 0 0 0 07143. T-19015.8510.6316 Cressfield Rd Constr 0 2,250 2,250 2,250 2,2507196. T-19016.8523.6453 Scn-Reseals & Resheets 80,000 0 0 0 07219. T-19016.8523.6540 Local Infra Renewal 84,000 0 0 0 07224. T-19015.8512.6544 LIRS Brdg Unspent Loan 1,545,000 0 0 0 07225. T-19015.8512.6545 LIRS Urb Unspent Loan 955,000 470,000 0 0 0
3,851,247 877,902 469,681 494,911 522,756Capital Expenditure
0769. R2R McLoughlin St, Scn 124,000 0 0 0 00772. R2R Campbell St, Abn 0 0 96,000 0 00773. R2R Coolibah St, Scn 200,000 0 0 0 00818. Moonan Brook Footbridge Replacement 205,000 0 0 0 00819. Moobi Rd Culverts 30,000 70,000 0 0 00834. Timor Rd, Mdi 0 100,000 0 0 00835. McLoughlin St, Scn - Stg 1 23,000 0 0 0 00836. Middlebrook Rd - Initial Seal 22,000 0 0 0 00837. Cressfield Rd - Initial Seal 35,500 0 0 0 00848. Turanville Causeway 33,000 0 0 0 00850. Rotherwood Rd (Sealed) Upgrade 0 181,000 0 0 00851. Mt Erin Rd Upgrade 0 0 0 71,000 00853. R2R Cuan Approaches 190,000 0 0 0 00854. R2R Susan & Main St Roundabout 0 0 250,000 0 00856. R2R Haydon St, Mdi K&G 0 0 0 70,000 00857. R2R Susan St, Scn K&G 0 0 0 196,000 00858. R2R Marquet St, Mwa K&G Replace 0 0 20,000 0 0

RevisedBudget
2012/13
2013/14DPOP
Budget2014/15Budget
2015/16Budget
2016/17Budget
Upper Hunter Shire Council2013/14-2016/17
Delivery Program & Operational Plan
0859. R2R Short St, Scn K&G Replace 0 0 50,000 0 00860. R2R Waverley St, Scn K&G Replace 0 0 300,000 0 00861. R2R Timor Crawney Rd Resheet 0 0 0 50,000 00862. R2R Waverley Rd Resheet 0 0 0 50,000 00863. R2R Campbell St, Abn K&G(Graeme/Bedford) 0 0 0 0 100,0000864. R2R Sydney St, Scn K&G 0 0 0 100,000 100,0000865. R2R Archer St, Bunnan Initial Seal 0 0 20,000 0 00866. R2R Bourke St, Blandford Initial Seal 0 0 0 20,000 00867. R2R Pages River Xing, Glenbawn Rd 0 0 0 0 50,0000869. R2R Kars Springs Rd Resheet 0 0 0 0 100,0000870. R2R Upper Dartbrook Rd Resheet 0 0 0 75,000 00871. R2R Dry Creek Rd Resheet 0 0 75,000 0 00878. Alec Cone Bridge Replacement 476,000 0 0 0 00879. Stewarts Brook Footbridge Replacement 235,000 0 0 0 00884. Glenbawn Rd Rehabilitation 60,000 140,000 100,000 100,000 100,0000885. Segenhoe Rd Rehabilitation 0 100,000 100,000 0 00887. Main St, Scn Rehabilitation 0 0 0 100,000 00889. Scott's Crk Rd Resheet 29,000 0 0 0 00890. Ridgelands Rd Resheet 48,000 50,000 0 0 00891. Moobi Rd Resheet 0 0 0 50,000 01001. Ringwood Road Upgrade 50,000 0 0 0 01002. Coolibah St Rehabilitation 74,000 0 0 0 01003. Segenhoe St Abn - Traffic Safety 50,000 0 0 0 01006. CBD Upgrade - Kelly St, Scn 2,000 0 0 0 01007. Susan & Main St, Scn Intersection 0 0 0 0 01009. Culvert Kingdon St, Scn 257,000 0 0 0 01013. R2R Hunter Road Half Moon 0 38,000 200,000 100,000 100,0001014. R2R Waverley St, Scn Reconstruction 240,000 0 0 0 01020. R2R Kelly St Scn K&G(Eveleigh to Forbes) 0 0 100,000 0 01021. R2R Middlebrook Rd - Initial Seal 164,000 0 0 0 01023. R2R MR105 Gundy Rd Rehabilitation 0 0 0 200,000 01085. Flags Rd (Town Boundary to Racecourse) 0 90,000 90,000 0 01188. Mountain Station Rd Upg 0 37,000 0 0 01189. Gummun Rd Upg 0 82,000 0 0 01191. Yarrawonga Rd Upg 0 0 0 0 50,0001192. CBD Upgrade - Mwa 0 0 0 0 135,0001194. R2R Rouchel Rd Culvert 3,000 259,000 0 0 01195. R2R MR62 Widening 0 0 0 0 250,0001196. R2R Middlebrook Rd Rehab 0 0 0 0 161,0001203. R2R Dart St, Abn K&G + Reconstruction 2,000 69,000 0 0 01206. Kyuga St, Abn (Graeme-Bedford) K&G 59,063 0 0 0 01207. Bedford St, Abn (Kyuga-Mount) K&G 0 40,000 0 0 01215. Susan St, Scn K&G (Guernsey-Hill) 0 0 0 0 42,3001218. Idaville Road Rehabilitation 150,000 0 0 0 04028. Glenbawn Rd - Pages Crossing 85,000 75,000 0 0 04040. LIRS-Broad Crossing 200,000 1,700,000 0 0 04046. LIRS-Middlebrook Bridge 15,000 0 0 0 04047. LIRS-Doolans Gully Bridge 15,000 260,000 0 0 04048. LIRS-Coolibah St, Scn (Scott-Koala) 230,000 0 0 0 04049. LIRS-Koala St, Scn (Coolibah-Mulga) 60,000 0 0 0 04050. LIRS-Short St, Scn (Stafford-Scott) 100,000 0 0 0 04051. LIRS-Scott St, Scn (Short-Sthn End) 80,000 0 0 0 04052. LIRS-St Aubins St,Scn(Guernsey-Aberdeen) 0 400,000 0 0 04053. LIRS-Aberdeen St, Scn (Liverpool-Susan) 0 130,000 0 0 04054. LIRS-Haydon St, Mdi (Adelaide-Polding) 0 100,000 0 0 04055. LIRS-Graeme St, Abn (Walker-Kyuga) 0 200,000 0 0 04056. LIRS-Mount St, Abn (Graeme-Moray) 0 100,000 0 0 04057. LIRS-Scott St, Scn (Liverpool-Short) 115,000 0 0 0 04142. Doolans Gully Bridge Approaches 0 60,000 0 0 04264. Upgrade Perth St 381,000 0 0 0 04282. Scn Emergency Rail Crossing 63,000 0 0 0 04356. Killoe Rd, Mwa Gravel Resheet 0 50,000 0 0 04357. Flight Springs Rd, Mwa Gravel Resheet 0 0 0 50,000 04358. Sargeants Gap Rd, Timor Gravel Resheet 0 0 0 50,000 04359. Summerhill Rd, Mwa Gravel Resheet 0 0 0 50,000 04360. Pages Crk Rd, Ellerston Gravel Resheet 0 0 0 50,000 04361. Worondi Rd, Mwa Gravel Resheet 0 0 0 0 50,0004362. Coogah Rd, Timor Gravel Resheet 0 0 0 0 50,0004363. Turanville Rd, Scn Gravel Resheet 0 0 0 0 50,0004409. Murrurundi Streets Renewal (ARTC) 68,181 0 0 0 05106. LIRS - Segenhoe Rd 0 80,000 0 0 05107. LIRS - Gundy Rd 0 0 120,000 0 05108. LIRS - Haydons Lane 0 40,000 0 0 05109. LIRS - Middlebrook Rd 0 100,000 0 0 05110. LIRS - Timor Rd 0 0 0 160,000 05111. LIRS - Glenbawn Rd 0 110,000 0 0 05112. LIRS - Idaville Rd 0 0 150,000 0 05113. LIRS - Dartbrook Rd 0 100,000 0 0 05114. LIRS - Llangollen 0 150,000 0 0 05115. LIRS - Ringwood Rd 0 0 0 40,000 05116. LIRS - Garlands Bridge 0 620,000 0 0 05117. LIRS - Starrs Crossing 0 340,000 0 0 0

RevisedBudget
2012/13
2013/14DPOP
Budget2014/15Budget
2015/16Budget
2016/17Budget
Upper Hunter Shire Council2013/14-2016/17
Delivery Program & Operational Plan
5118. LIRS - Sandy Creek Bridge 0 115,000 0 0 04,173,744 5,986,000 1,671,000 1,582,000 1,338,300
Total 4,215,881 4,622,919 4,536,783 4,682,804 4,555,231

RRooaaddss && BBrriiddggeess -- RReeggiioonnaallCOMMUNITY STRATEGIC OBJECTIVES (CSO’S)
Provide for replacement and improvement on community infrastructure through best practice and risk management.
Develop economic and intergenerational plans for future infrastructure through best practice and risk management.
Advocate, facilitate and provide traffic management and public transport facilities to meet the needs of the community.
Advocate to State and Federal Government for a fair and equitable share of fiscal resources and provision of Government services for the community.
Effectively and efficiently manage the business of the Council within its Charter
Connect our communities through activities and events, online technologies and infrastructure.
OBJECTIVESTo undertake roads and bridge maintenance and construction works to acceptable standards in a cost-effective, cost-efficient and safe manner, so as to minimise future expenses.
MAJOR ACTIVITIES
Maintain emphasis on roads and bridges as Council’s priority.
Maintenance tasks which remove a possibly dangerous situation (eg pothole and edge patching, urgent repairs to damaged roads).
Roads to Recovery construction works.
Reseal program.
Shoulder reconstruction program.
Determine construction and quality specifications for road construction and communicate criteria to staff.
Social/Community Plan 2006 – 2009 “Improving Local Roads”
PERFORMANCE INDICATORS AAnticipated2012/13
Estimate/Target2013/14
Workload: Sealed (km) 161 163
Unsealed (km) 13 11
Bridges & Major Culverts on Regional Roads 45 45
Effectiveness: Percentage of pavement surface rated as in satisfactory condition at end of any period
80% 80%
Efficiency: Time taken to carry out essential maintenance in accordance with Council’s Best Practice Policies. Maintenance and Capital projects completed within budgetCapital works projects completed.
<10 days
95% 95%
<10 days
95%95%
Service Number of complaints received concerning condition of network.
<20 <20
LEVEL OF SERVICE
In 2013/14 the proposed budget will sustain the ability to maintain the existing condition of the regional bridge and road network.
Council will continue to lobby for increased road funding

RevisedBudget
2012/13
2013/14DPOP
Budget2014/15Budget
2015/16Budget
2016/17Budget
Upper Hunter Shire Council2013/14-2016/17
Delivery Program & Operational Plan
Roads & Bridges - RegionalOperating Revenue
0115. Grants (1,135,000) (1,113,000) (1,056,000) (1,056,000) (1,056,000)0135. Capital Grants Received (393,000) (400,000) (200,000) (200,000) (200,000)
(1,528,000) (1,513,000) (1,256,000) (1,256,000) (1,256,000)Non Operating Revenue
0920. Depreciation (1,143,834) (1,158,315) (1,143,834) (1,143,834) (1,143,834)6003. F-19016.8523.6445 Special Projects (265,712) (200,000) (200,000) (200,000) (200,000)
(1,409,546) (1,358,315) (1,343,834) (1,343,834) (1,343,834)Operating Expenditure
0545. Bridge & Culvert Maintenance (Sealed) 2,500 4,000 4,000 4,000 4,0000566. MR62 (East) Maintenance 141,650 147,717 169,984 169,984 169,9840567. MR62 (West) Maintenance 39,001 148,075 178,001 178,001 178,0010568. MR105 Maintenance 158,131 192,209 284,217 284,217 284,2170569. MR358 Maintenance 143,603 78,918 102,498 102,498 102,4980572. MR214 Maintenance 15,800 21,320 40,800 40,800 40,8000573. Regional Rds Reseals 128,500 178,500 127,000 127,000 127,0000579. Flood Damage - Nov 11 8,000 0 0 0 00603. Flood Damage March 2012 1,000 0 0 0 00604. Floods Damage - Jan 13 31,000 0 0 0 00612. MR618 Maintenance 10,241 10,500 12,241 12,241 12,2410680. Depreciation 1,143,834 1,158,315 1,143,834 1,143,834 1,143,8340980. Administration Overheads 171,513 373,220 373,220 373,220 373,220
1,994,773 2,312,774 2,435,795 2,435,795 2,435,795Non Operating Expenditure
7169. T-19016.8523.6456 MR105 Moonan Cutting (64,000) 0 0 0 07188. T-19016.8523.6513 MR358 Upgrade (50,045) 0 0 0 07206. T-19016.8523.6454 MR62 Route Development (106,000) 0 0 0 0
(220,045) 0 0 0 0Capital Expenditure
0757. MR105 - Moonan Cutting 0 50,000 50,000 50,000 250,0000759. MR358 Widening & Initial Seal 400,000 400,000 400,000 400,000 400,0000764. MR62 Cuan Bridge Construction 662,212 0 0 0 00774. MR62 Owens Gap Widening 244,500 0 0 250,000 00775. MR62 Guardrail Replacement 0 40,000 40,000 40,000 40,0001097. MR358 Capital Carryover Works 50,045 0 0 0 01193. Cuan Bridge Approaches 259,900 0 0 0 01224. MR 105 Oratora Rehab stg 1 0 200,000 0 0 01225. MR 105 Oratora Rehab stg 2 0 200,000 0 0 0
1,616,657 890,000 490,000 740,000 690,000
Total 453,839 331,459 325,961 575,961 525,961

RRMMSS -- SSttaattee RRooaaddssCOMMUNITY STRATEGIC OBJECTIVES (CSO’S)
Connect our communities through activities and events, online technologies and infrastructure.
Advocate to State and Federal Government for a fair and equitable share of fiscal resources and provision of Government services for the community.
Effectively and efficiently manage the business of the Council within its Charter.
OBJECTIVESRemain a core service provider to the RMS.
MAJOR ACTIVITIES
Undertake maintenance and construction works on State Highway No.27 (Golden Highway) in accordance with the RMS Road Maintenance Council Contract Specifications and Quality Assurance systems.
Continued upgrade to Council’s Quality Assurance systems in accordance with the RMS Road Maintenance Council Contract Specifications.
Actively pursue work orders to improve the quality of the Golden Highway and maximise the safety of the road users, minimising risk and litigation against Council and the RMS.
Actively pursue funding initiatives through consultation with the RMS.
PERFORMANCE INDICATORS AAnticipated2012/13
Estimate/Target2013/14
Workload Indicator: RMS tendering pre-qualification requirements maintained at appropriate level.
100% 100%
Effectiveness Indicator: Compliance with RMS requirements 85% 85%
Efficiency Indicator: No of warranty claims for defects within works Average days after end of month claim submitted Operational maintenance and capital projects completed within budget and timeframe
<10<7
95%
<10<7
95%
Service Indicator: Meet RMS prequalification, specification, service level agreements and tender requirements for Road Maintenance Council Contract
100% 100%
LEVEL OF SERVICEAs per RMS Road Maintenance Council Contract works schedule

RevisedBudget
2012/13
2013/14DPOP
Budget2014/15Budget
2015/16Budget
2016/17Budget
Upper Hunter Shire Council2013/14-2016/17
Delivery Program & Operational Plan
RMS - State RoadsOperating Revenue
0110. User Fees & Charges (3,430,000) (2,620,000) (2,620,000) (2,620,000) (2,620,000)(3,430,000) (2,620,000) (2,620,000) (2,620,000) (2,620,000)
Operating Expenditure0502. General Contract Works RMS 510,000 515,000 515,000 515,000 515,0000503. Individual Priced Work Orders 2,310,000 1,740,000 1,740,000 1,740,000 1,740,0000980. Administration Overheads 106,243 114,467 114,467 114,467 114,467
2,926,243 2,369,467 2,369,467 2,369,467 2,369,467Non Operating Expenditure
7003. T-19016.8523.6445 Special Projects 439,000 250,533 250,533 250,533 250,533439,000 250,533 250,533 250,533 250,533
Total (64,757) 0 0 0 0

TTrraannssppoorrtt AAnncciillllaarriieessCOMMUNITY STRATEGIC OBJECTIVES (CSO’S)
Provide for replacement and improvement on community infrastructure through best practice and risk management.
Develop economic and intergenerational plans for future infrastructure through best practice and risk management.
Effectively and efficiently manage the business of the Council within its Charter.
Advocate to State and Federal Government for a fair and equitable share of fiscal resources and provision of Government services for the community.
Connect our communities through activities and events, online technologies and infrastructure.
OBJECTIVES
To promote traffic and pedestrian safety by the provision and maintenance of regulatory and advisory signage and pavement markings.
To maintain high standards of street cleaning and street furniture, and to maintain and enhance street tree planting.
MAJOR ACTIVITIES
To maximise safety for road users.
To minimise road trauma.
Provide secretarial services to the Traffic Committee.
Promote traffic safety by maintaining traffic signs and markings.
Administer road functions.
Complete the signposting of rural roads.
Provide name plates to village streets and all unsignposted urban streets.
Monitor daily and weekly schedules to ensure coverage and quality of service.
Continued implementation of best practice standards to maintain quality of services provided.
Ongoing assessment of street trees and road side furniture in accordance with Council’s Maintenance and Inspection Policy.
Social/Community Plan 2006 – 2009
PERFORMANCE INDICATORS – PUBLIC TRANSPORT AAnticipated2012/13
Estimate/Target2013/14
Workload Indicator: % of network rated as in satisfactory condition on an annual basis
90 90
Effectiveness Indicator:
Time taken to carry out essential maintenance in accordance with Council's Best Practice Policies Programmed work completed within time and budget constraints. Monitored through maintenance management systems
<10 days
95%
<10 days
95%
Efficiency Indicator: Major activities managed within budget allocation. Achieved Achieved
Service Indicator: Number of complaints received concerning unsafe conditions.
<10 <10
PERFORMANCE INDICATORS - TRAFFIC MANAGEMENT
Effectiveness Indicator:
Percentage of traffic signs/markings maintained in good condition.
95% 95%
Efficiency Indicator: Response time for replacing destroyed/damaged signs. Major activities managed within budget allocation. Capital Works completed and within Budget
<10 days 100% 100%
<10 days100%100%
Service Indicator: Number of complaints received regarding missing or deteriorated signs.
20 <20
LEVEL OF SERVICESigns will be changed on a 15 year cycle (manufacturers recommended cycle is 12 years) and pavement markings will be repainted as required. Transport service assets will be maintained to acceptable standards.

RevisedBudget
2012/13
2013/14DPOP
Budget2014/15Budget
2015/16Budget
2016/17Budget
Upper Hunter Shire Council2013/14-2016/17
Delivery Program & Operational Plan
Transport AncillariesOperating Revenue
0110. User Fees & Charges (600) (1,100) (1,100) (1,100) (1,100)0115. Grants (66,000) (67,000) (67,000) (67,000) (67,000)0135. Capital Grants Received 0 (15,000) 0 (15,000) 00140. Contributions (22,280) (10,000) 0 0 0
(88,880) (93,100) (68,100) (83,100) (68,100)Non Operating Revenue
0920. Depreciation (15,689) (22,411) (22,411) (22,411) (22,411)6003. F-19016.8523.6445 Special Projects (20,000) (20,000) (20,000) (20,000) 06059. F-19015.8511.6473 Bus Shelters (3,922) 0 0 0 06062. F-19016.8523.6443 Farram Ln Carpark, Scn (8,000) 0 0 0 06085. F-19015.8510.6311 Carparking, Scn 3,900 0 0 0 06124. F-19016.8523.6449 Mwa Main St Upgrade 0 0 0 (135,000) 06136. F-19016.8523.6455 CBD Upg, Scn 0 (58,000) 0 0 0
(43,711) (100,411) (42,411) (177,411) (22,411)Operating Expenditure
0547. Road Furniture Maintenance 1,050 1,050 1,050 1,050 1,0500548. Signs & Marking - Local roads 76,193 81,880 81,880 81,880 81,8800549. Parking Area Maintenance 6,420 6,700 6,700 6,700 6,7000559. Traffic Facilities (Block Grant) Exp 66,000 67,000 67,000 67,000 67,0000561. Cycleway Maintenance 11,000 7,300 5,000 5,000 5,0000562. Bus Shelter Maintenance 5,500 8,000 7,500 7,500 7,5000680. Depreciation 15,689 22,411 22,411 22,411 22,4110980. Administration Overheads 194,903 199,991 199,991 199,991 199,9915097. Mwa Town Street Numbering 5,000 0 0 0 0
381,755 394,332 391,532 391,532 391,532Non Operating Expenditure
7124. T-19016.8523.6449 Mwa Main St Upgrade 20,000 20,000 20,000 0 07144. T-19015.8510.6313 Cycleways, Scn 18,380 10,000 0 0 0
38,380 30,000 20,000 0 0Capital Expenditure
0747. Bus Shelter Capital Works 4,000 15,000 15,000 15,000 15,0000749. CBD & Street Furniture 8,000 8,000 8,000 8,000 8,0000753. CBD Scn - Upgrade 0 58,000 0 0 00807. Purchase of Property 0 10,000 0 0 01192. CBD Upgrade - Mwa 0 0 0 135,000 04078. Farram Lane Construction 8,000 0 120,000 0 04079. Street Signs 13,310 10,000 10,000 10,000 10,0004332. Scn-Waverly St traffic improvements 0 0 0 20,000 04333. Abn-Bedford St Install pick up/off zones 0 0 2,000 0 04334. Abn-Bedford St Install refuge island 0 0 15,000 0 04335. Moonan/Barrington Rd - Guardrail Ext. 0 0 0 100,000 04338. Mdi CBD - Fencing 0 15,000 0 0 04339. Mdi CBD - Street Furniture 0 10,000 0 0 04343. Scone CBD - Walk of Fame 0 10,000 0 0 0
33,310 136,000 170,000 288,000 33,000
Total 320,854 366,821 471,021 419,021 334,021

4.3 Water Funds - Budgets and Services
WATER SUPPLIES
Summary .................................................................. 221
Merriwa/Cassilis ..................................................... 222
Murrurundi .............................................................. 224
Scone/Aberdeen ................................................... 226

RevisedBudget
2012/13
2013/14DPOP
Budget2014/15Budget
2015/16Budget
2016/17Budget
Upper Hunter Shire Council2013/14-2016/17
Delivery Program & Operational Plan
Water SuppliesOperating Revenue
Merriwa/Cassilis Water (564,758) (550,087) (550,087) (550,087) (550,087) Murrurundi Water (451,224) (455,037) (455,037) (455,037) (1,205,037) Scone/Aberdeen Water (5,276,716) (3,943,301) (6,129,301) (4,860,101) (3,862,301)
(6,292,698) (4,948,425) (7,134,425) (5,865,225) (5,617,425)Non Operating Revenue
Merriwa/Cassilis Water (147,216) (132,000) (132,000) (132,000) (132,000) Murrurundi Water (245,360) (313,812) (220,000) (220,000) (856,812) Scone/Aberdeen Water (2,434,911) (402,870) (2,602,870) (2,256,346) (1,002,870)
(2,827,487) (848,682) (2,954,870) (2,608,346) (1,991,682)Operating Expenditure
Merriwa/Cassilis Water 481,136 459,099 453,099 453,099 453,099 Murrurundi Water 522,873 522,799 522,799 522,799 522,799 Scone/Aberdeen Water 2,416,358 2,383,576 2,522,951 2,598,482 2,583,869
3,420,367 3,365,474 3,498,849 3,574,380 3,559,767Non Operating Expenditure
Merriwa/Cassilis Water 191,718 182,988 138,988 175,988 218,988 Murrurundi Water 78,901 9,050 122,238 122,238 9,050 Scone/Aberdeen Water 842,493 570,595 483,220 512,965 1,378,302
1,113,112 762,633 744,446 811,191 1,606,340Capital Expenditure
Merriwa/Cassilis Water 39,120 40,000 90,000 53,000 10,000 Murrurundi Water 94,810 237,000 30,000 30,000 1,530,000 Scone/Aberdeen Water 4,452,776 1,392,000 5,726,000 4,005,000 903,000
4,586,706 1,669,000 5,846,000 4,088,000 2,443,000
Total 0 0 0 0 0

WWaatteerr SSuupppplliieessCOMMUNITY STRATEGIC OBJECTIVES (CSO’S)
Provide secure potable water supply to meet the demands of future generations to urban areas of the Shire.
Provide for replacement and improvement of community infrastructure through best practice.
Develop intergenerational plans for future infrastructure needs.
Advocate to State and Federal Government for a fair and equitable share of fiscal resources and provision of Government services for the community.
To participate in and encourage regional and local alliances with other Councils, Government or non-government partners.
OBJECTIVESTo provide an adequate and secure potable water supply to recognised standards in defined areas on a cost effective basis.
MAJOR ACTIVITIES
The provision and maintenance of infrastructure for the supply of potable water to the residents and commercial undertakings. The provision of a water quality monitoring service to safeguard the public health as per NSW Health requirements. Asset replacement program to minimize mains failures and ensure adequate supply can be maintained to residents with in the designated area. Continued investigations into requirements to ensure that an adequate water supply can be maintained into the future. Social/Community Plan 2006–2009 “Appropriate Development” pp 36–39, “Aberdeen” p 91, “Scone” p 161-2. Implementation of the Integrated water management strategy Completion of Stage 2 & 3 of the Water Augmentation project including the construction of a Water Treatment Plant east of Scone and a back feed to Aberdeen
PERFORMANCE INDICATORS AAnticipated2012/13
Estimate/Target2013/14
Workload Indicator: Water Connections Scone and Aberdeen Merriwa and Cassilis Murrurundi
3,382 639525
3,350630520
Effectiveness Indicator: Operational expenditure within budget Capital projects within budget Capital works program completed
100% 100% 100%
100%100%100%
Legislative license and reporting requirements met within timeframes
100% 100%
Efficiency Indicator: Water Supply Service Interruptions - Mains Scone and Aberdeen Merriwa Murrurundi Cassilis
36241212
402012
5
Water Supply Service Interruptions – Service Pipes Scone and Aberdeen MerriwaMurrurundi Cassilis
120 48 12 12
120481010
Service Indicator: Average response time to system failures Water quality meet NHMRC quality guidelines
<2hrs98%
< 2hrs98%
LEVEL OF SERVICE
Provision of suitable water supply from Scone/Aberdeen, Murrurundi and Merriwa/Cassilis Water Supplies that meets the demands of the users and the requirements of the Australian Drinking Water Guidelines.

RevisedBudget
2012/13
2013/14DPOP
Budget2014/15Budget
2015/16Budget
2016/17Budget
Upper Hunter Shire Council2013/14-2016/17
Delivery Program & Operational Plan
Merriwa/Cassilis WaterOperating Revenue
0100. Rates & Charges (196,020) (203,481) (203,481) (203,481) (203,481)0110. User Fees & Charges (314,988) (293,226) (293,226) (293,226) (293,226)0115. Grants (7,000) (7,000) (7,000) (7,000) (7,000)0120. Interest & Investment Income (31,500) (38,130) (38,130) (38,130) (38,130)0130. Other Income (250) (250) (250) (250) (250)0132. Private Works Revenue (3,000) (3,000) (3,000) (3,000) (3,000)0140. Contributions (12,000) (5,000) (5,000) (5,000) (5,000)
(564,758) (550,087) (550,087) (550,087) (550,087)Non Operating Revenue
0920. Depreciation (147,216) (132,000) (132,000) (132,000) (132,000)(147,216) (132,000) (132,000) (132,000) (132,000)
Operating Expenditure0680. Depreciation 147,216 132,000 132,000 132,000 132,0000980. Administration Overheads 99,578 81,413 81,413 81,413 81,4132001. Administration 0 0 0 0 02002. Engineering & Supervision 21,700 21,850 21,850 21,850 21,8502003. Dams & Weirs 0 0 0 0 02004. Mains 75,944 78,400 78,400 78,400 78,4002005. Reservoirs 12,102 10,050 10,050 10,050 10,0502006. Pumping Stations 49,076 54,550 54,550 54,550 54,5502007. Water Treatment 63,520 66,836 60,836 60,836 60,8362008. Water Other 9,500 11,500 11,500 11,500 11,5002009. Private Works 2,500 2,500 2,500 2,500 2,500
481,136 459,099 453,099 453,099 453,099Non Operating Expenditure
7051. T-29016.8524.6484 Bal Mwa/Cassilis Water 173,218 169,913 125,913 162,913 205,9137052. T-29016.8510.6321 s64 Mwa Water 13,500 8,075 8,075 8,075 8,0757081. Cont to Loan Repayments 5,000 5,000 5,000 5,000 5,000
191,718 182,988 138,988 175,988 218,988Capital Expenditure
2025. Mwa - Meter Replacements 10,000 10,000 10,000 10,000 10,0004176. Mwa - Quigley St Mains replacement 0 0 0 0 04183. Mwa - Telemetry Upgrade 0 20,000 20,000 0 04184. Mwa - Mains/Valve Replacement Program 10,800 0 60,000 0 04185. Mwa - Reservoir Roof Infill 3,320 0 0 0 04374. Mwa -Langley St Bore Pump Replacement 0 0 0 43,000 04384. Potable water mgnmt plan 0 10,000 0 0 04406. Mwa - Macarntey St Mains extension 15,000 0 0 0 0
39,120 40,000 90,000 53,000 10,000
Total 0 0 0 0 0

RevisedBudget
2012/13
2013/14DPOP
Budget2014/15Budget
2015/16Budget
2016/17Budget
Upper Hunter Shire Council2013/14-2016/17
Delivery Program & Operational Plan
Murrurundi WaterOperating Revenue
0100. Rates & Charges (217,018) (220,860) (220,860) (220,860) (220,860)0110. User Fees & Charges (154,206) (142,957) (142,957) (142,957) (142,957)0115. Grants (7,000) (7,000) (7,000) (7,000) (757,000)0120. Interest & Investment Income (65,000) (79,720) (79,720) (79,720) (79,720)0132. Private Works Revenue (8,000) (2,500) (2,500) (2,500) (2,500)0140. Contributions 0 (2,000) (2,000) (2,000) (2,000)
(451,224) (455,037) (455,037) (455,037) (1,205,037)Non Operating Revenue
0920. Depreciation (245,360) (220,000) (220,000) (220,000) (220,000)6053. F-29016.8524.6483 Bal Water Fund Mdi 0 (93,812) 0 0 (636,812)
(245,360) (313,812) (220,000) (220,000) (856,812)Operating Expenditure
0680. Depreciation 245,360 220,000 220,000 220,000 220,0000980. Administration Overheads 77,329 106,449 106,449 106,449 106,4492001. Administration 0 0 0 0 02002. Engineering & Supervision 13,450 16,450 16,450 16,450 16,4502003. Dams & Weirs 49,485 38,450 38,450 38,450 38,4502004. Mains 73,441 72,050 72,050 72,050 72,0502005. Reservoirs 4,824 7,000 7,000 7,000 7,0002006. Pumping Stations 32,998 27,700 27,700 27,700 27,7002007. Water Treatment 21,186 24,750 24,750 24,750 24,7502008. Water Other 3,800 8,450 8,450 8,450 8,4502009. Private Works 1,000 1,500 1,500 1,500 1,500
522,873 522,799 522,799 522,799 522,799Non Operating Expenditure
7053. T-29016.8524.6483 Bal Mdi Water 67,901 0 113,188 113,188 07054. T-29016.8510.6322 s64 Mdi Water 6,000 4,050 4,050 4,050 4,0507081. Cont to Loan Repayments 5,000 5,000 5,000 5,000 5,000
78,901 9,050 122,238 122,238 9,050Capital Expenditure
1077. Mayne St Main (Adelaide to Wilson Mem) 304 39,000 0 0 01161. Mdi - Haydon St Main (Victoria-Adelaide) 48,000 0 0 0 02014. Mains 0 20,000 20,000 20,000 20,0002026. Mdi - Meter Replacements 5,000 10,000 10,000 10,000 10,0004232. Water Augmentation - Stage 1 0 0 0 0 1,500,0004278. Mdi Dam Yield/Options Studies 41,506 0 0 0 04377. Mdi - Installation of Telemetry 0 35,000 0 0 0

RevisedBudget
2012/13
2013/14DPOP
Budget2014/15Budget
2015/16Budget
2016/17Budget
Upper Hunter Shire Council2013/14-2016/17
Delivery Program & Operational Plan
4384. Potable water mgnmt plan 0 10,000 0 0 04388. Mdi-Mayne St Mains repl(Brook-Victoria) 0 123,000 0 0 0
94,810 237,000 30,000 30,000 1,530,000
Total 0 0 0 0 0

RevisedBudget
2012/13
2013/14DPOP
Budget2014/15Budget
2015/16Budget
2016/17Budget
Upper Hunter Shire Council2013/14-2016/17
Delivery Program & Operational Plan
Scone/Aberdeen WaterOperating Revenue
0100. Rates & Charges (1,039,291) (1,070,759) (1,070,759) (1,070,759) (1,070,759)0110. User Fees & Charges (1,918,319) (2,221,042) (2,221,042) (2,221,042) (2,221,042)0115. Grants (27,000) (27,000) (27,000) (27,000) (27,000)0120. Interest & Investment Income (230,000) (234,000) (234,000) (234,000) (247,000)0130. Other Income (26,500) (26,500) (26,500) (26,500) (26,500)0132. Private Works Revenue (20,000) (20,000) (20,000) (20,000) (20,000)0135. Capital Grants Received (1,209,606) (94,000) (2,280,000) (1,010,800) 00140. Contributions (806,000) (250,000) (250,000) (250,000) (250,000)
(5,276,716) (3,943,301) (6,129,301) (4,860,101) (3,862,301)Non Operating Revenue
0920. Depreciation (434,911) (402,870) (402,870) (402,870) (402,870)0940. Loan Funding Received (2,000,000) 0 (2,200,000) (1,600,000) 06055. F-29016.8524.6482 Bal Scn/Abn Water 0 0 0 (253,476) 06056. F-29016.8510.6320 s64 Scn Water 0 0 0 0 (600,000)
(2,434,911) (402,870) (2,602,870) (2,256,346) (1,002,870)Operating Expenditure
0680. Depreciation 434,911 402,870 402,870 402,870 402,8700945. Loan Repayments 258,985 261,319 400,694 476,225 461,6120980. Administration Overheads 392,547 384,848 384,848 384,848 384,8482001. Administration 18,000 15,770 15,770 15,770 15,7702002. Engineering & Supervision 201,237 211,150 211,150 211,150 211,1502003. Dams & Weirs 2,803 10,000 10,000 10,000 10,0002004. Mains 463,439 469,879 469,879 469,879 469,8792005. Reservoirs 99,804 89,050 89,050 89,050 89,0502006. Pumping Stations 321,881 311,050 311,050 311,050 311,0502007. Water Treatment 51,086 49,050 49,050 49,050 49,0502008. Water Other 158,665 161,740 161,740 161,740 161,7402009. Private Works 12,500 14,850 14,850 14,850 14,8502019. Rainwater Tank Rebates 500 2,000 2,000 2,000 2,000
2,416,358 2,383,576 2,522,951 2,598,482 2,583,869Non Operating Expenditure
0945. Loan Repayments 124,447 122,114 181,422 237,965 252,3807055. T-29016.8524.6482 Bal Scn/Abn Water 228,072 173,481 26,798 0 850,9227056. T-29016.8510.6320 s64 Scn/Abn Water 438,610 250,000 250,000 250,000 250,0007081. Cont to Loan Repayments 25,000 25,000 25,000 25,000 25,0007167. Cont to New Key System Investigation 10,000 0 0 0 07230. Cont to additional Plant 16,364 0 0 0 0
842,493 570,595 483,220 512,965 1,378,302Capital Expenditure
0784. Scn High Level Reservoir 648,000 0 0 0 01104. Scn - Susan St Main(Aberdeen - Guernsey) 137,147 0 0 0 01105. Scn/Abn - Minor Reservoir Repairs 20,000 40,000 60,000 0 01212. Scn - New St Main (Birrell-New-Park) 0 225,000 0 0 01213. Scn - Susan & Main Sts Intersection Main 0 140,000 0 0 01214. Scn - Susan St Main (Guernsey-Hill) 0 0 0 0 44,0002020. WA Project Management (non contract) 107,796 0 0 0 02021. WA Survey/Design (non contract) 40,000 0 0 0 02022. WA Pipeline 935,547 0 0 0 02023. WA Pipeline Outlets 317,175 0 0 0 02024. WA Pipeline Site Establishment 95,070 0 0 0 02027. Scn/Abn - Meter Replacements 36,000 40,000 40,000 40,000 40,0002028. WA Treatment Plant 37,000 200,000 5,000,000 800,000 02029. WA Abn Backfeed 0 0 0 2,660,000 02032. WA Pipeline Pump Station 468,034 0 0 0 02033. WA Pipeline NaCIO Dosing Plant 27,390 0 0 0 02034. WA Pipeline EMP, Testing & Commissioning 34,456 0 0 0 02035. WA Pipeline Road Re-instatement 27,273 0 0 0 02036. WA Pipeline Telemetry Pole 28,499 0 0 0 02037. WA Pipeline Provisional Items 614,580 0 0 0 02038. WA Pipeline Telemetry (non contract) 72,000 0 0 0 02039. WA Balance Tank 0 0 0 0 02040. WA Balance Tank Telemetry 10,000 0 0 0 02041. WA Land Matters (non contract) 1,000 0 0 0 04039. St Aubins St, Scn - Major Mains 1,027 300,000 0 0 04041. Oxford Rd, Scn(Susan to Short) 222,100 0 0 0 04157. Scn - Reservoir Painting 2,936 240,000 0 0 04188. Abn - Eldon St 0 0 0 0 44,0004189. Abn - Walker St (Moray to Mount) 0 0 0 0 46,0004190. Abn - Upp Campbell St (Graham-Reservoir) 0 0 117,000 0 04191. Abn - Bedford St (Rail Tracks-Campbell) 75,000 0 0 0 04208. Scn - Kingdon St, Underbore Rail Tracks 2,000 69,000 0 0 04210. Scn - Davies St Main 0 0 24,000 0 04212. Scn - Carlyle St Main 70,000 0 0 0 04213. Scn - Main St Main(Liverpool to Philip) 0 0 0 169,000 04215. Scn - Farram Ln Main (behind shops) 0 0 35,000 0 0

4.4 Sewer Funds - Budgets and Services
SEWERAGE SERVICES
Summary .................................................................. 228
Merriwa .................................................................... 230
Murrurundi .............................................................. 231
Scone/Aberdeen ................................................... 232

RevisedBudget
2012/13
2013/14DPOP
Budget2014/15Budget
2015/16Budget
2016/17Budget
Upper Hunter Shire Council2013/14-2016/17
Delivery Program & Operational Plan
Sewerage ServicesOperating Revenue
Merriwa Sewerage (288,673) (294,887) (294,887) (294,887) (294,887) Murrurundi Sewerage (346,491) (347,285) (347,285) (347,285) (347,285) Scone/Aberdeen Sewerage (2,041,825) (1,948,011) (1,948,011) (1,948,011) (1,948,011)
(2,676,989) (2,590,183) (2,590,183) (2,590,183) (2,590,183)Non Operating Revenue
Merriwa Sewerage (70,000) (122,076) (70,000) (70,000) (70,000) Murrurundi Sewerage (72,239) (75,000) (75,000) (75,000) (75,000) Scone/Aberdeen Sewerage (763,802) (807,176) (720,667) (720,667) (720,667)
(906,041) (1,004,252) (865,667) (865,667) (865,667)Operating Expenditure
Merriwa Sewerage 268,532 287,123 287,123 287,123 287,123 Murrurundi Sewerage 276,086 272,104 272,104 272,104 272,104 Scone/Aberdeen Sewerage 2,091,843 2,070,587 2,070,587 2,070,587 2,070,587
2,636,461 2,629,814 2,629,814 2,629,814 2,629,814Non Operating Expenditure
Merriwa Sewerage 37,995 9,840 47,764 72,764 72,764 Murrurundi Sewerage 36,953 140,181 120,181 120,181 120,181 Scone/Aberdeen Sewerage 399,890 61,600 331,091 311,091 249,091
474,838 211,621 499,036 504,036 442,036Capital Expenditure
Merriwa Sewerage 52,146 120,000 30,000 5,000 5,000 Murrurundi Sewerage 105,691 10,000 30,000 30,000 30,000 Scone/Aberdeen Sewerage 317,324 623,000 267,000 287,000 349,000
475,161 753,000 327,000 322,000 384,000
Total 3,430 0 0 0 0

SSeewweerraaggee SSeerrvviicceessCOMMUNITY STRATEGIC OBJECTIVES (CSO’S)
Provide for replacement and improvement of community infrastructure through best practice and risk management.
Effectively and efficiently manage the business of the Council within its Charter.
Promote a sense of responsibility within our community
Develop economic and intergenerational plans for future infrastructure needs.
Advocate to State and Federal Government for a fair and equitable share of fiscal resources and provision of Government services for the community.
Participate in and encourage regional and local alliances with other Councils, Government or non-government partners.
Increase the level of effluent re-use across the Shire.
OBJECTIVES
To maintain a sewerage system for the transportation and treatment of sewage to licence requirements and encourage appropriate further expansion of services.
MAJOR ACTIVITIES
Sewer urban communities at a reasonable cost to the people.
Improve effluent quality for discharge.
Eliminate discharge of fats and greases into the reticulation system.
Reduce infiltration and inflow into reticulation system.
Implement long-term asset replacement strategy.
Operate sewerage schemes to meet licence requirements
Environmental management plan requirements are met
Social/Community Plan 2006 – 2009 “Appropriate Development” pp 36 - 39
PERFORMANCE INDICATORS AAnticipated2012/13
Estimate/Target2013/14
Workload Indicator: Sewer Connections Merriwa Murrurundi Scone
470 476
3,153
474480
3,184
Effectiveness Indicator: Provision of ongoing service to/from: Sewer mains Availability of treated water to identified facilities (excluding emergency use)
95%
95%
95%
95%
Efficiency Indicator: Number of Sewer requests – including odour, chokes and overflows Merriwa Murrurundi Scone
100 100 200
5050
300
Operating costs including depreciation ($ per connected property) Merriwa Murrurundi Scone
$530 $515 $600
$573$552$643
Service Indicator: Average response time to system failures < 2hrs < 2hrs
LEVEL OF SERVICEProvision of efficient Sewerage systems for Scone/Aberdeen, Murrurundi and Merriwa that meet both the health standards and the demands of the users. Legislative reporting and license requirements are met as required.

RevisedBudget
2012/13
2013/14DPOP
Budget2014/15Budget
2015/16Budget
2016/17Budget
Upper Hunter Shire Council2013/14-2016/17
Delivery Program & Operational Plan
Merriwa SewerageOperating Revenue
0100. Rates & Charges (227,383) (236,391) (236,391) (236,391) (236,391)0110. User Fees & Charges (13,750) (13,880) (13,880) (13,880) (13,880)0115. Grants (5,500) (4,800) (4,800) (4,800) (4,800)0120. Interest & Investment Income (35,200) (30,976) (30,976) (30,976) (30,976)0132. Private Works Revenue (4,000) (6,000) (6,000) (6,000) (6,000)0140. Contributions (2,840) (2,840) (2,840) (2,840) (2,840)
(288,673) (294,887) (294,887) (294,887) (294,887)Non Operating Revenue
0920. Depreciation (70,000) (70,000) (70,000) (70,000) (70,000)6040. F-39016.8525.6487 Bal Sewer Fund Mwa 0 (52,076) 0 0 0
(70,000) (122,076) (70,000) (70,000) (70,000)Operating Expenditure
0680. Depreciation 70,000 70,000 70,000 70,000 70,0000980. Administration Overheads 51,258 66,149 66,149 66,149 66,1493002. Engineering & Supervision 16,812 17,200 17,200 17,200 17,2003004. Sewer Mains 13,232 16,650 16,650 16,650 16,6503006. Pumping Stations 17,429 18,050 18,050 18,050 18,0503007. Sewer Treatment 87,877 85,650 85,650 85,650 85,6503008. Sewer Other 300 300 300 300 3003009. Private Works 3,624 4,624 4,624 4,624 4,6245031. Trade Waste 8,000 8,500 8,500 8,500 8,500
268,532 287,123 287,123 287,123 287,123Non Operating Expenditure
7039. T-39016.8510.6325 s64 Mwa Sewer 4,840 4,840 4,840 4,840 4,8407040. T-39016.8525.6487 Bal Mwa Sewer 28,155 0 37,924 62,924 62,9247081. Cont to Loan Repayments 5,000 5,000 5,000 5,000 5,000
37,995 9,840 47,764 72,764 72,764Capital Expenditure
1124. Mwa - STP Replace Grinder Pumps x 2 7,500 0 0 0 04197. Mwa - Stormwater Infiltration Study 0 0 25,000 0 04198. Mwa - Nutrient Reduction Study 0 30,000 0 0 04199. Mwa - Sewer Main CCTV 20,000 5,000 5,000 5,000 5,0004200. Mwa - STW - Amenities Bldg Renovation 2,636 0 0 0 04201. Mwa - Digester Upgrade 0 0 0 0 04268. Purchase of trailer mounted sewer jetter 14,510 0 0 0 04287. Mwa - SPS pump replacement 7,500 0 0 0 04401. Mwa - STP Inlet Upgrade Screens 0 85,000 0 0 0
52,146 120,000 30,000 5,000 5,000
Total 0 0 0 0 0

RevisedBudget
2012/13
2013/14DPOP
Budget2014/15Budget
2015/16Budget
2016/17Budget
Upper Hunter Shire Council2013/14-2016/17
Delivery Program & Operational Plan
Murrurundi SewerageOperating Revenue
0100. Rates & Charges (242,871) (251,067) (251,067) (251,067) (251,067)0110. User Fees & Charges (10,100) (9,819) (9,819) (9,819) (9,819)0115. Grants (6,520) (6,520) (6,520) (6,520) (6,520)0120. Interest & Investment Income (86,000) (78,879) (78,879) (78,879) (78,879)0132. Private Works Revenue (1,000) (1,000) (1,000) (1,000) (1,000)
(346,491) (347,285) (347,285) (347,285) (347,285)Non Operating Revenue
0920. Depreciation (72,239) (75,000) (75,000) (75,000) (75,000)(72,239) (75,000) (75,000) (75,000) (75,000)
Operating Expenditure0680. Depreciation 72,239 75,000 75,000 75,000 75,0000980. Administration Overheads 65,906 57,409 57,409 57,409 57,4093002. Engineering & Supervision 5,950 6,000 6,000 6,000 6,0003004. Sewer Mains 26,957 27,895 27,895 27,895 27,8953006. Pumping Stations 12,569 11,750 11,750 11,750 11,7503007. Sewer Treatment 85,165 84,550 84,550 84,550 84,5503008. Sewer Other 1,500 1,600 1,600 1,600 1,6003009. Private Works 800 900 900 900 9005031. Trade Waste 5,000 7,000 7,000 7,000 7,000
276,086 272,104 272,104 272,104 272,104Non Operating Expenditure
7041. T-39016.8510.6324 s64 Mdi Sewer 2,000 1,610 1,610 1,610 1,6107042. T-39016.8525.6486 Bal Mdi Sewer 29,953 133,571 113,571 113,571 113,5717081. Cont to Loan Repayments 5,000 5,000 5,000 5,000 5,000
36,953 140,181 120,181 120,181 120,181Capital Expenditure
1108. Mdi - Sewer Main CCTV 16,516 10,000 10,000 10,000 10,0003013. Property Purch - 36 Liverpool St, Mdi 35,191 0 0 0 04203. Mdi - Lilly to Elizabeth St Main 9,564 0 0 0 04268. Purchase of trailer mounted sewer jetter 15,000 0 0 0 04271. Effluent Reuse Rosedale 19,420 0 0 0 04279. Mdi Effluent Re-Use Mgmt Plan 10,000 0 0 0 04402. Mdi- Sewer Main Replacement 0 0 20,000 20,000 20,000
105,691 10,000 30,000 30,000 30,000
Total 0 0 0 0 0

RevisedBudget
2012/13
2013/14DPOP
Budget2014/15Budget
2015/16Budget
2016/17Budget
Upper Hunter Shire Council2013/14-2016/17
Delivery Program & Operational Plan
Scone/Aberdeen SewerageOperating Revenue
0100. Rates & Charges (1,496,915) (1,534,885) (1,534,885) (1,534,885) (1,534,885)0110. User Fees & Charges (136,500) (140,880) (140,880) (140,880) (140,880)0115. Grants (26,000) (25,700) (25,700) (25,700) (25,700)0120. Interest & Investment Income (223,000) (200,426) (200,426) (200,426) (200,426)0132. Private Works Revenue (16,600) (12,000) (12,000) (12,000) (12,000)0140. Contributions (142,810) (34,120) (34,120) (34,120) (34,120)
(2,041,825) (1,948,011) (1,948,011) (1,948,011) (1,948,011)Non Operating Revenue
0920. Depreciation (749,472) (720,667) (720,667) (720,667) (720,667)6044. F-39016.8525.6485 Bal Sewer Fund Scn (14,330) (86,509) 0 0 0
(763,802) (807,176) (720,667) (720,667) (720,667)Operating Expenditure
0680. Depreciation 749,472 720,667 720,667 720,667 720,6670980. Administration Overheads 373,716 373,696 373,696 373,696 373,6963002. Engineering & Supervision 135,209 130,550 130,550 130,550 130,5503004. Sewer Mains 282,315 334,100 334,100 334,100 334,1003006. Pumping Stations 131,807 127,250 127,250 127,250 127,2503007. Sewer Treatment 359,124 339,124 339,124 339,124 339,1243008. Sewer Other 2,200 2,200 2,200 2,200 2,2003009. Private Works 14,000 10,000 10,000 10,000 10,0005031. Trade Waste 44,000 33,000 33,000 33,000 33,000
2,091,843 2,070,587 2,070,587 2,070,587 2,070,587Non Operating Expenditure
7044. T-39016.8525.6485 Bal Scn/Abn Sewer 50,000 0 269,891 249,891 187,8917045. T-39016.8510.6323 s64 Scn/Abn Sewer 204,690 26,000 26,000 26,000 26,0007081. Cont to Loan Repayments 25,000 25,000 25,000 25,000 25,0007167. Cont to New Key System Investigation 10,000 0 0 0 07190. Cont to Depot Trade Waste System Maint 10,200 10,600 10,200 10,200 10,2007192. Cont to Moobi Rd Culverts 100,000 0 0 0 0
399,890 61,600 331,091 311,091 249,091Capital Expenditure
1125. Scn - STP Operations Report 0 50,000 0 0 01208. Scn - Barton St Main 0 0 0 0 01210. Scn - Update Water Reuse Mgt Plan 0 50,000 0 0 01211. Abn - St Andrews St Main Re-lining 88,000 88,000 0 0 03016. Pumping Stations 0 0 0 30,000 04017. Scn - Aberdeen St Pump Stn Upg 0 130,000 0 0 04019. Scn - Refurbish Tertiary Ponds 20,490 25,000 0 0 04026. Scn - STP Flow Meter & Outflow Upg 0 0 0 0 20,0004027. Scn - Desludge Lagoons 0 20,000 0 0 04155. Scn Airpark Sewer Upgrade Stg 2 3,430 0 0 0 04215. Scn - Farram Ln Main (behind shops) 0 0 22,000 0 04220. Scn - STP Septic/Grease Waste Dump Point 0 20,000 0 0 04221. Scn - Treatment Plant Minor Addtns/Renew 20,000 0 0 0 04222. Scn - Sydney St Main 0 0 28,000 0 04223. Scn - Birrell & Scott Sts Mains 0 0 64,000 0 04224. Scn - Waverley St Main 0 0 43,000 50,000 04225. Scn - Philip St Main 0 0 0 17,000 04226. Scn - Cooper St Main 0 0 0 0 12,0004227. Scn - Koala St Main 0 32,000 0 0 04265. Perth St water sewer realignment 108,563 0 0 0 04268. Purchase of trailer mounted sewer jetter 48,040 0 0 0 04269. Joan St Pump replacement 28,801 0 0 0 04389. Scn - Soil & Water Monitoring Program 0 30,000 30,000 0 04390. Scn-Sewer Rising Main(Moobi Rd SPS-STP) 0 0 0 0 277,0004391. Scn-Sewer Main Infiltration Program 0 40,000 40,000 40,000 04392. Scn - STP Study EP Capacity 0 13,000 0 0 04394. Scn - Main Rplcment NE HWY (Kelly St) 0 0 0 37,000 04397. Sewer Main CCTV 0 40,000 40,000 40,000 40,0004398. Scn-Bingle, Askin Renshaw Main 0 0 0 55,000 04399. Abn-Segenhoe St Main 0 0 0 18,000 04400. Abn - STP Inlet upgrade screens 0 85,000 0 0 0
317,324 623,000 267,000 287,000 349,000
Total 3,430 0 0 0 0

4.5 Restricted Assets Report Forecast 2014
Revised as at 28/3/13
DPOPTfrs
to
DPOPtfrs
from
ProjectedBal
30/6/2014
EXTERNAL RESTRICTIONSDEVELOPER CONTRIBUTIONS
s94 INTEREST19015.8510.6300 s94 INTEREST 0 10,000 10,000HOUSING AND COMMUNITY19015.8510.6301 WASTE DEPOT, MDI 1,513 1,513PUBLIC ORDER AND SAFETY19015.8510.6302 RURAL FIRE SERVICES (MDI) 10,542 1,000 11,54219015.8510.6303 RURAL FIRE SERVICES (MWA) 7,816 1,000 8,816RECREATION AND CULTURE19015.8510.6304 OPEN SPACE (MDI) 3,026 1,000 3,000 1,02619015.8510.6305 s94A CONTRIBUTIONS 16,877 75,000 82,000 9,87719015.8510.6306 REC & COMMUNITY FACILITIES (MWA) 5,510 1,000 6,51019015.8510.6307 OPEN SPACE (MWA) 19,690 1,000 10,000 10,69019015.8510.6308 REC & COMMUNITY FACILITIES (SCN) 58,713 65,000 80,000 43,71319015.8510.6309 OPEN SPACE (SCN) 7,911 6,500 10,000 4,41119015.8510.6497 REC & COMMUNITY FACILITIES (MDI) 2,000 1,000 3,000TRANSPORT AND COMMUNICATION19015.8510.6310 NANDOWRA RD CONSTRUCTION 6,037 6,03719015.8510.6311 CARPARKING, SCN 3,900 3,90019015.8510.6312 FOOTPATH/CYCLEWAY, ABN 37,052 37,052 019015.8510.6313 CYCLEWAYS, SCN 78,033 10,000 88,03319015.8510.6314 ASHBROOKE RD, WINGEN 6,129 6,12919015.8510.6315 PARADISE LANE, MDI 5,195 5,19519015.8510.6316 CRESSFIELD RD CONSTRUCTION 5,886 2,250 8,13619015.8510.6317 ROSSGOLE RD CONSTRUCTIONS 3,385 3,38519015.8510.6318 YARRANDI RD CONSTRUCTION 4,009 4,009, ,19015.8510.6319 FOOTPATH/CYCLEWAY, MDI 11,048 11,04819015.8510.6460 S94 WOOLWORTHS 10,969 10,96919015.8510.6468 BANOOL RD CONSTRUCTION 4,208 4,20819015.8510.6481 MOOBI ROAD CONSTRUCTION 1,475 1,47519015.8510.6539 MOOBI RD CYCLEWAY 0 0WATER FUND29016.8510.6320 s64 - ABN/SCN WATER 370,610 250,000 620,61029016.8510.6321 s64 - MWA WATER 61,651 8,075 69,72629016.8510.6322 s64 - MDI WATER 23,544 4,050 27,594SEWER FUND39016.8510.6323 s64 - ABN/SCN SEWER 1,689,172 26,000 1,715,17239016.8510.6324 s64 - MDI SEWER 26,442 1,610 28,05239016.8510.6325 s64 - MWA SEWER 42,599 4,840 47,439
TOTAL DEVELOPER CONTRIBUTIONS 2,524,942 469,325 222,052 2,772,215UNEXPENDED GRANTS
COMMUNITY SERVICES AND EDUCATION19015.8511.6329 EARLY INTERVENTION PROGRAM 4,795 4,79519015.8511.6542 WOMENS GATHERING 31,510 31,510 019015.8511.6546 YOUTH OPPORTUNITIES GRANT 10,000 10,000 0ECONOMIC AFFAIRS19015.8511.6332 C & A COMMUNITY GRANTS OFFICER 6,600 5,850 12,450HEALTH19015.8511.6523 CMA 2011/12 PARTNERSHIPS 0 0HOUSING AND COMMUNITY AMENITIES19015.8511.6336 REGIONAL REGULATED AREA (RRA) GRANT 244,087 60,000 304,08719015.8511.6530 FLOODPLAIN MANAGEMENT 17,323 17,323RECREATION AND CULTURE19015.8511.6339 FOLKLORIC PROJECT, MWA 1,488 1,48819015.8511.6528 TENNIS PARTICIPATION 0 019015.8511.6532 MUSEUM VG GRANT 2011 1,211 360 851TRANSPORT AND COMMUNICATIONTRANSPORT AND COMMUNICATION19015.8511.6346 R2R PROJECTS NOT COMPLETED 0 0TOTAL UNEXPENDED GRANTS 317,014 65,850 41,870 340,994

4.5 Restricted Assets Report Forecast 2014Revised as at
28/3/13
DPOPTfrs
to
DPOPtfrs
from
ProjectedBal
30/6/2014OTHER EXTERNAL RESTRICTIONS
OTHER19015.8512.6348 WOOLWORTHS BLISTERS - KELLY ST, SCN 6,261 6,26119015.8512.6349 DOMESTIC WASTE MANAGEMENT 468,469 215,253 253,21619015.8512.6350 BONDS & DEPOSITS 145,429 145,42919015.8512.6518 DOMESTIC WASTE MGT - MDI FUTURE UPGRADE 30,660 15,330 45,99019015.8512.6520 RFS VEHICLE PROCEEDS 32,800 32,80049016.8512.6351 TENANTS BONDS, GUMMUN PLACE HOSTEL 27,608 27,60819015.8512.6544 LIRS BRIDGE UNSPENT LOAN 1,545,000 1,545,000 019015.8512.6545 LIRS ROADS UNSPENT LOAN 955,000 470,000 955,000 470,000TOTAL OTHER EXTERNAL RESTRICTIONS 3,211,227 15,330 2,715,253 981,304
CONTRIBUTIONSOTHER19015.8513.6352 BOOMERANG YOUTH GROUP, SCN 1,981 1,98119015.8513.6353 MDI & DIST HISTORICAL SOCIETY FUNDS 3,819 3,81919015.8513.6354 MDI PIONEER COTTAGE FUNDS 3,780 3,78019015.8513.6357 SCONE GARDEN RAMBLE GARDENERS 4,664 4,664COMMUNITY SERVICES AND EDUCATION19015.8513.6355 PUTT PUTT GOLF, MWA, CONTRIBUTIONS 1,670 1,67019015.8513.6537 FDC FUNDRAISING 1,800 1,80049016.8515.6358 MWA HOSTEL AUXILIARY FUNDS 16,313 6,000 22,313ECONOMIC AFFAIRS19015.8513.6360 UPPER HUNTER VALLEY MUSEUM OF RURAL LIF 126 12619015.8513.6469 MERRIWA BUSINESS SIGNAGE 431 431TOTAL CONTRIBUTIONS 34,584 6,000 0 40,584
BALANCE OF WATER & SEWER FUNDSWATER FUND29016.8524.6482 BAL. WATER FUND ABN/SCN 5,304,263 607,481 5,911,74429016.8524.6483 BAL. WATER FUND MDI 1,294,895 54,812 1,240,08329016.8524.6484 BAL. WATER FUND MWA/CASSILIS 673,103 169,913 843,01629016.8512.6458 RURAL WATER SCHEME LEASE REVENUE 142,210 142,210TOTAL WATER FUND 7,414,471 777,394 54,812 8,137,053
SEWER FUND39016.8525.6485 BAL. SEWER FUND ABN/SCN 2,046,009 156,491 2,202,50039016.8525.6486 BAL. SEWER FUND MDI 1,711,675 133,571 1,845,24639016.8525.6487 BAL. SEWER FUND MWA 686,684 52,076 634,608TOTAL SEWER FUND 4,444,368 290,062 52,076 4,682,354
TOTAL EXTERNAL RESTRICTIONS 17,946,606 1,623,961 3,086,063 16,954,504

4.5 Restricted Assets Report Forecast 2014Revised as at
28/3/13
DPOPTfrs
to
DPOPtfrs
from
ProjectedBal
30/6/2014
INTERNAL RESTRICTIONS
ADMINISTRATIONGENERAL19016.8514.6372 OFFICE EQUIPMENT 81,500 24,000 57,50019016.8514.6373 COUNCIL ADMIN BUILDINGS 173,945 10,000 163,94519016.8514.6376 COMMUNITY WATCH 401 40119016.8514.6377 PROV FOR EMPLOYEE LEAVE ENTITLEMENTS 1,295,000 20,000 1,315,00019016.8514.6378 INFORMATION SYSTEMS 56,000 26,500 29,500PLANT AND DEPOT MANAGEMENT19016.8514.6383 PLANT REPLACEMENT 2,310,612 255,262 130,000 2,435,87419016.8514.6512 DEPOT GROUNDWATER MONITORING 142,612 142,61219016.8514.6384 TRADE WASTE AUDIT 49,000 49,000TECHNICAL SUPPORT SERVICES19016.8523.6522 RISKEMAP PROJECT 0 019016.8514.6547 KEY AUDIT 30,000 30,000 0TOTAL ADMINISTRATION 4,139,070 275,262 220,500 4,193,832
COMMUNITY SERVICES & EDUCATIONADMINISTRATION19016.8515.6386 COMMUNITY SERVICES 20,000 20,000 019016.8515.6390 SCN YOUTH CLUB 8,000 8,000 0AGED CARE19016.8515.6391 ILUs LIVERPOOL LODGE, MDI 131,207 16,742 114,46519016.8515.6392 ILUs MERRIWA 20,845 8,940 29,78549016.8515.6393 WORKING FUNDS, GUMMUN PLACE, MWA 194,115 5,332 199,447CHILD CARE19016 8515 6394 FAMILY DAY CARE 36 3 022 3 05819016.8515.6394 FAMILY DAY CARE 36 3,022 3,05819016.8515.6395 UH EARLY LEARNING CENTRE (ELC) 15,000 2,038 17,03819016.8515.6489 OUT OF SCHOOL HOURS 3,540 5,044 8,58419016.8515.6494 ELC PARENT GROUP FUNDRAISING 2,650 2,650TOTAL COMMUNITY SERVICES & EDUCATION 395,393 24,376 44,742 375,027
ECONOMIC AFFAIRSECONOMIC PROMOTION19016.8516.6399 STORYBOARDS, HIST PATHWAY, ABN 7,277 7,27719016.8516.6471 CAMPING GROUNDS 30,000 30,000 019016.8516.6504 ECONOMIC PROMOTION PROJECTS 19,500 19,50019016.8516.6519 MDI FRONTIER FESTIVAL 2,949 2,949REAL ESTATE DEVELOPMENT19016.8516.6401 MEDICAL CENTRE, SCN 64,045 8,108 72,153RESIDENTIAL PROPERTIES19016.8516.6402 BOTTLEBRUSH PLACE UNITS 36,802 6,400 43,20219016.8516.6403 OTHER COUNCIL RESIDENCES -19,862 2,760 -17,10219016.8516.6404 FORMER YHA BUILDING, SEGENHOE 147,794 30,800 178,594TOURISM & AREA PROMOTION19016.8516.6406 FESTIVAL OF THE FLEECES, MWA 11,393 11,39319016.8516.6498 TOURISM PROJECTS 24,000 24,000 0OTHER19016.8516.6408 SALEYARDS 241,024 66,968 174,056TOTAL ECONOMIC AFFAIRS 564,922 48,068 120,968 492,022
GENERAL PURPOSE REVENUESRATES, GRANTS & INTEREST19016.8517.6409 FINANCIAL ASSISTANCE GRANT 0 0TOTAL GENERAL PURPOSE REVENUES 0 0 0 0
GOVERNANCECOUNCIL SERVICES19016.8518.6410 COUNCIL ELECTIONS 10,000 25,000 35,000TOTAL GOVERNANCE 10,000 25,000 0 35,000

4.5 Restricted Assets Report Forecast 2014Revised as at
28/3/13
DPOPTfrs
to
DPOPtfrs
from
ProjectedBal
30/6/2014HOUSING & COMMUNITY AMENITIES
OTHER WASTE MANAGEMENT19016.8519.6412 OTHER WASTE 798,256 187,910 610,346TOWN PLANNING19016.8519.6416 FLOODPLAIN MGT - VOLUNTARY PURCHASE 88,619 88,61919016.8519.6417 FLOODPLAIN MGT 42,500 30,000 12,50019016.8519.6491 LOCAL ENVIRONMENTAL PLAN (LEP) 11,700 11,700CEMETERY19016.8519.6420 CEMETERY WORKS 4,350 4,350 0HOUSING - LOW INCOME19016.8519.6421 LOW INCOME HOUSING 6,369 2,113 8,482TOTAL HOUSING & COMMUNITY AMENITIES 951,794 2,113 222,260 731,647
MINING, MANUFACTURING & CONSTRUCTIONQUARRIES19016.8520.6422 GRAVEL PIT REHABILITATION 128,308 11,788 140,096
TOTAL MINING, MANUFACTURING & CONSTRUCTION 128,308 11,788 0 140,096
PUBLIC ORDER & SAFETYEMERGENCY SERVICES19016.8521.6493 EMERGENCY SERVICES 22,300 22,300RURAL FIRE SERVICES19016.8521.6424 PROCEEDS FROM ASSET DISPOSAL 13,559 13,55919016.8521.6474 RFS WORKS 41,400 41,400TOTAL PUBLIC ORDER & SAFETY 77,259 0 0 77,259
RECREATION & CULTURESPORTING GROUNDS19016.8522.6463 INDOOR SPORTS CENTRE FEASIBILITY 10,000 10,00019016.8522.6429 BILL ROSE SPORTS COMPLEX AMENITIES 54,701 54,701OTHER SPORTS AND REC19016.8522.6431 CHILDREN'S SPORTS PROMOTIONS 32,950 48,432 51,150 30,232CULTURAL ACTIVITIES19016.8522.6432 UHSC PUBLIC ARTS PROJECTS 10,000 10,000 0PUBLIC HALLS & COMMUNITY BUILDINGS19016.8522.6434 PUBLIC HALLS 46,808 46,80819016.8522.6437 MWA SCHOOL OF ARTS 11,200 11,200 019016.8522.6438 PRE SCHOOL, SCN 15,000 15,00019016.8522.6467 PROPERTY DISPOSAL 378,334 300,000 78,334TOTAL RECREATION AND CULTURE 558,993 48,432 372,350 235,075
TRANSPORT & COMMUNICATIONAERODROMES19016.8523.6439 AIRPORT, SCN 383,230 20,000 403,230TRANSPORT ANCILLARIES19016.8523.6444 STREET LIGHTING 49,000 20,000 29,00019016.8523.6449 MWA MAIN STREET UPGRADE 75,000 20,000 95,00019016.8523.6455 CBD UPGRADE SCONE 50,000 50,000 0ROADS & BRIDGES19016.8523.6445 SPECIAL PROJECTS 329,037 250,533 333,000 246,57019016.8523.6446 SPECIAL PROJECTS - LAND DEVELOPMENT -1,077,928 2,132,839 1,054,91119016.8523.6450 HAYDON ST, MDI (K&G) 13,750 13,75019016.8523.6492 ROADWORKS NOT COMPLETED 0 019016.8523.6514 FOOTPATHS, SCN 25,225 25,225 019016.8523.6540 LOCAL INFRASTRUCTURE RENEWAL 84,000 84,000 0TOTAL TRANSPORT & COMMUNICATION -68,686 2,423,372 512,225 1,842,461
TOTAL INTERNAL RESTRICTIONS 6,757,053 2,858,411 1,493,045 8,122,419
TOTAL RESTRICTIONS ON CASH AND INVESTMENTS 24,703,659 4,482,372 4,579,108 25,076,923

4.6 Net Current Assets & Non-Current Cash & Investments - 2013/14 - 2016/17
General FundBalances @
30/6/12(Aud Fin Stat)
Revised Forecast for 30/6/13
Proposed Balance as at 30/6/14
Proposed Balance as at 30/6/15
Proposed Balance as at 30/6/16
Proposed Balance as at 30/6/17
Cash & Investments(current & non-current) 13,964,000 10,795,944 11,549,720 10,954,385 11,595,574 12,944,611
Receivables 3,821,000 3,800,000 3,800,000 3,800,000 3,800,000 3,800,000
Prepayments 172,000 235,000 235,000 235,000 235,000 235,000
Inventory 353,000 320,000 320,000 320,000 320,000 320,000
Real Estate 1,884,000 1,800,000 1,800,000 1,800,000 1,800,000 1,800,000
TOTAL CURRENT ASSETS 20,194,000 16,950,944 17,704,720 17,109,385 17,750,574 19,099,611
Payables 3,340,000 2,500,000 2,500,000 2,500,000 2,500,000 2,500,000
Borrowings 222,000 476,000 610,000 684,000 724,000 769,000
Provisions (Employee Leave Entitlements) 4,134,000 4,134,000 4,134,000 4,134,000 4,134,000 4,134,000
Less liabilities greater than 12 months (3,561,000) (3,561,000) (3,561,000) (3,561,000) (3,561,000) (3,561,000)
Quarry & Tip Remediation - - - - - -
TOTAL CURRENT LIABILITIES 4,135,000 3,549,000 3,683,000 3,757,000 3,797,000 3,842,000
NET CURRENT ASSET POSITION 16,059,000 13,401,944 14,021,720 13,352,385 13,953,574 15,257,611
Restriction on Cash & Investments
- External 1,996,990 1,766,515 1,626,000 1,426,000 1,400,000 1,778,000
- Internal 10,493,644 7,337,599 8,122,000 7,664,000 8,323,000 9,274,000
TOTAL RESTRICTIONS 12,490,634 9,104,114 9,748,000 9,090,000 9,723,000 11,052,000
NET CURRENT ASSETS FORECAST AFTER ALL RESTRICTIONS 3,568,366 4,297,830 4,273,720 4,262,385 4,230,574 4,205,611

4.6 Net Current Assets & Non-Current Cash & Investments - 2013/14 - 2016/17
Water FundBalances @
30/6/12(Aud Fin Stat)
Revised Forecast for 30/6/13
Proposed Balance as at 30/6/14
Proposed Balance as at 30/6/15
Proposed Balance as at 30/6/16
Proposed Balance as at 30/6/17
Cash & Investments 6,813,000 7,871,978 8,856,685 9,384,709 9,669,449 9,526,597
Receivables 745,000 1,000,000 1,000,000 1,000,000 1,000,000 1,000,000
Inventory 234,000 215,000 215,000 215,000 215,000 215,000
Prepayments 74,000 - 80,000 80,000 80,000 80,000
TOTAL CURRENT ASSETS 7,866,000 9,086,978 10,151,685 10,679,709 10,964,449 10,821,597
Payables 1,339,000 250,000 250,000 250,000 250,000 250,000
Borrowings 63,000 204,000 122,000 181,000 238,000 252,000
Provisions 150,000 160,000 160,000 160,000 160,000 160,000
TOTAL CURRENT LIABILITIES 1,552,000 614,000 532,000 591,000 648,000 662,000
NET CURRENT ASSET POSITION 6,314,000 8,472,978 9,619,685 10,088,709 10,316,449 10,159,597
Restriction on Cash & Investments
- s64 Contributions 71,695 455,795 717,920 980,045 1,242,170 504,295
- Unexpended Grants - - - - - -
- RWS Funds held 142,210 142,210 142,210 142,210 142,210 142,210
NET CURRENT ASSETS FORECAST AFTERALL RESTRICTIONS 6,100,095 7,874,973 8,759,555 8,966,454 8,932,069 9,513,092

4.6 Net Current Assets & Non-Current Cash & Investments - 2013/14 - 2016/17
Sewer FundBalances @
30/6/12(Aud Fin Stat)
Revised Forecast for 30/6/13
Proposed Balance as at 30/6/14
Proposed Balance as at 30/6/15
Proposed Balance as at 30/6/16
Proposed Balance as at 30/6/17
Cash & Investments 6,027,000 6,292,879 6,563,315 7,017,151 7,470,987 7,867,823
Receivables 482,000 300,000 480,000 480,000 480,000 480,000
Inventory 57,000 60,000 60,000 60,000 60,000 60,000
Prepayments 65,000 - 65,000 65,000 65,000 65,000
TOTAL CURRENT ASSETS 6,631,000 6,652,879 7,168,315 7,622,151 8,075,987 8,472,823
Payables 101,000 100,000 100,000 100,000 100,000 100,000
Provisions 150,000 160,000 160,000 160,000 160,000 160,000
TOTAL CURRENT LIABILITIES 251,000 260,000 260,000 260,000 260,000 260,000
NET CURRENT ASSET POSITION 6,380,000 6,392,879 6,908,315 7,362,151 7,815,987 8,212,823
Restriction on Cash & Investments
- s64 Contributions 1,546,683 1,758,213 1,790,663 1,823,113 1,855,563 1,888,013
- Unexpended Grants - - - - - -
NET CURRENT ASSETS FORECAST AFTERALL RESTRICTIONS 4,833,317 4,634,666 5,117,652 5,539,038 5,960,424 6,324,810

Part 5 | Delivery Plan Reporting
5.1 Periodic Reports
The Local Government Act, 1993 prescribes that the General Manager is to report to Council, at least quarterly throughout the year, on the extent of achievement of the performance targets and objectives outlined in the Delivery Program and Operational Plan.
In addition, Council is also to receive, within six weeks of the close of each quarter, a report on the budget outlining any variances and any revisions proposed for the remainder of the budget period.
Upper Hunter Shire Council had adopted a methodology whereby these reports are presented each month to the Council through the Council’s Finance Committee. The Finance Committee considers the monthly operational reports and budget variances and makes recommendation to Council for adoption or amendment.
5.2 Annual Reports
Section 428 of the Local Government Act, 1993 requires that Council prepare and furnish to the Division of Local Government, and certain other persons, an annual report as to Council’s achievements with respect to the objectives and performance targets set out in Council’s Delivery Program and Operational Plan for the previous year.
The report must contain, amongst other things, a copy of Council’s audited financial reports, a comparison of performance of functions and activities with reasons for variances, environmental reports and condition reports of public works, fees to the Mayor, Councillors and Senior Staff Employment Contract details.
Statements of activities are also required for bushfire hazard reduction, access and equity, subsidised private works, if any, human resources and equal employment.
Council must also state any interest in any companies, partnerships, co-operatives or joint ventures.
Council’s Annual Reports are available at Council’s branch libraries for perusal, on Council’s website, www.upperhunter.nsw.gov.au and at the Council offices in Merriwa, Murrurundi and Scone.

UUPPER HUNTER SHIRE COUNCIL
FFEEEESS && CCHHAARRGGEESSSSCCHHEEDDUULLEE
11 JJuullyy 22001133 ttoo 3300 JJuunnee 22001144
Adopted by Council on 24 June 13

FEES AND CHARGES SCHEDULE
1 July 2013 – 30 June 2014
TABLE OF CONTENTS
Aerodrome (Scone) .................................. 1
Air Handling Systems ................................ 1
Art Show (Merriwa) ................................... 1
Building – Other ........................................ 1
Business Papers ....................................... 1
Camping Grounds ..................................... 1
Caravan Park (Merriwa) ............................ 2
Cemeteries ................................................ 2
Certificates ................................................ 3
Childcare Services .................................... 4
Circus ........................................................ 4
Community Bus (Merriwa) ......................... 4
Community Plan ......................................... 4
Community Profile ..................................... 4
Companion Animals .................................. 5
CTC@Murrurundi ...................................... 5
Development Applications ........................ 6
Government Information (Public Access) 10
Hall Hire .................................................. 10
Horse Boxes ........................................... 12
Horse Sales ............................................ 12
Hostel ...................................................... 12
Impounded Articles ................................. 12
Impounded Stock .................................... 13
Independent Living Units ........................ 13
Inspection, License & Registration .......... 13
Labour Hire Rates ................................... 13
Laminating .............................................. 13
Library Services ...................................... 14
Local Environment Plan .......................... 15
Photocopying & Printing .......................... 15
Plan Printing ......................................... 15
Plant Hire Rates ................................... 16
Private Works ....................................... 16
Rates Enquiries .................................... 16
Resource Centre (Merriwa) .................. 17
Roads & Streets ................................... 18
Road Materials ..................................... 18
Rural Addressing .................................. 18
Saleyards ............................................. 18
Sewerage ............................................. 18
Sewerage Plans ................................... 19
Sporting Fields ..................................... 20
Swimming Pool Act .............................. 21
Swimming Pool Entrance Fees ............ 21
Tender Documents ............................... 21
Traffic Control Device Hire ................... 21
Waste Disposal .................................... 22
Waste Management – Tipping Fees ..... 24
Water Supply ........................................ 26
Youth Services ..................................... 26

The following details provide a statement of the types of fees proposed to be charged by Council andthe amount of such fee. This is in accordance with Section 404(1) of the Local Government Act1993. Also, included in the list of fees and charges is a fee type. The fee types are described asfollows:
Fee Type A This is a fee charged under relevant legislation. Council is unable to varythe amount of these fees. (s 610)
Fee Type B This is generally an indicative fee which is recommended by the LocalGovernment and Shires Association of NSW and Department of LocalGovernment. This is done to maintain as much as possible a comparativefee for all Councils. It relates particularly to the supply of property andzoning certificates. (s 609)
Fee Type C These fees are for hire of Council premises and facilities. They havegenerally been reviewed by Council officers to gain the current marketvalue for lease properties on the commercial market.
Fee Type D These are fees and charges generally for documents and minor servicesprovided by the Council. In most cases, the amount fixed represents aminimal fee and is designed to basically cover the cost of materials andother fixed costs in providing the information.
Fee Type E This fee sets out to try and recover full cost of goods and services provided.
Fees & Charges Pricing PolicyUpper Hunter Shire Council

2012/13 2013/14 change ($) change (%) Fee GST$ $ Type (Y/N)
AERODROME (Scone)Aircraft - up to 10,000 kg
Landing fee - minimum, per occasion 15.10 15.60 0.50 3.31% E Y
Landing fee - per tonne 15.10 15.60 0.50 3.31% E YAircraft - over 10,000 kg
Landing fee - minimum, per occasion 17.50 18.50 1.00 5.71% E Y
Landing fee - per tonne 17.50 18.50 1.00 5.71% E YHelicopters per landing 5.00 5.50 0.50 10.00% E YScone based commercial aircraft - per aircraft/per annum 1,150.00 1,190.00 40.00 3.48% E YScone based recreational aircraft - per aircraft/per annum 605.00 630.00 25.00 4.13% E YPCN advice and inspection following pavement concession landing 106.00 110.00 4.00 3.77% E YUltra light 0.00 0.00 0.00 0.00% E YFee exemptions or reductions* Scone based (commercial) aircraft Pays Air Service Warbirds (maximum of
2)392.00 405.00 13.00 3.32% E Y
Parachuting operations - landing feesPer 1000kgs MTOW 15.10 15.10 100.00% E YPer parachutist (including instructors) 10.00 10.00 100.00% E Y
Exempt from charges Careflight, Child Flight, Angel Flight, Air Ambulance, Westpace HelicopterAircraft assoicated with s44 bushfires in local area
AIR HANDLING SYSTEMSInspection/registration of premises with water cooling towers and other types of 120.00 125.00 5.00 4.17% E Nregulated air handling systems capable of harbouring Legionella bacteria,per system plus $38.00 per additional system
ART SHOW (Merriwa)Entry fee - Paintings 12.00 15.00 3.00 25.00% E YEntry fee - Photographs 6.00 7.00 1.00 16.67% E Y
BUILDING - OTHERApplication for permission to occupy "temporary dwelling" 140.00 145.00 5.00 3.57% E YApplication to occupy moveable dwelling or structures (other than a dwelling) on 140.00 145.00 5.00 3.57% E Ybuilding sitesApplication to refix building line 140.00 145.00 5.00 3.57% E YCopy of building plans - per sheet 13.00 14.00 1.00 7.69% E YRe-inspection fee for building certificates 90.00 95.00 5.00 5.56% E YSearch of building returns - per hour 70.00 70.00 0.00 0.00% E YStamping of additional plans and specifications - each additional copy 10.00 10.00 0.00 0.00% D Y (up to maximum 4 copies)Drainage inspections - excl those associated with a Council approved Construction 120.00 125.00 5.00 4.17% E YCertificate
BUSINESS PAPERSAgenda papers - per month - hard copy 33.00 N/A N/A N/A D NAgenda papers - per annum - hard copy 270.00 N/A N/A N/A D NMinutes - per month - hard copy 18.00 N/A N/A N/A D NMinutes - per annum - hard copy 135.00 N/A N/A N/A D N
CAMPING GROUNDSMoonan Flat Camping GroundDaily (per person without power) 8.00 8.00 0.00 0.00% E Y
(per person with power) 9.00 10.00 1.00 11.11% E YWeekly (per site without power) 72.00 72.00 0.00 0.00% E Y
(per site with power) 80.00 85.00 5.00 6.25% E YStewarts Brook Recreation ReserveDaily (per site without power) 8.00 8.00 0.00 0.00% E YWeekly (per site without power) 46.00 48.00 2.00 4.35% E YWhite Park - see White Park section
FEES AND CHARGES SCHEDULE 1 July 2013 to 30 June 2014
Description of Fees and Charges
1

2012/13 2013/14 change ($) change (%) Fee GST$ $ Type (Y/N)
FEES AND CHARGES SCHEDULE 1 July 2013 to 30 June 2014
Description of Fees and Charges
CARAVAN PARK (Merriwa)Powered sites - per day (Children under 14 free)
1 or 2 persons, over 14 years 25.00 28.00 3.00 12.00% E YExtra person 8.00 8.00 0.00 0.00% E Y
Non-powered sites - per day (Children under 14 free)1 or 2 persons, over 14 years 20.00 22.00 2.00 10.00% E YExtra person 8.00 8.00 0.00 0.00% E Y
Cabin - per day (Children under 12 free)1 or 2 persons, over 14 years 65.00 68.00 3.00 4.62% E YExtra person 8.00 8.00 0.00 0.00% E Y
Bulk booking of parkFlat fee 240.00 245.00 5.00 2.08% E YPer person 8.00 8.00 0.00 0.00% E YSecurity 110.00 115.00 5.00 4.55% E Y
Refundable Key Deposit 16.00 16.00 0.00 0.00% E NWashing Machine Hire 1.00 1.00 0.00 0.00% E Y
CEMETERIESInterment/Pre-purchase Permit for Burial/Reservation
165.00 200.00 35.00 21.21% B N
Plaque Purchase At cost At cost E YPlaque handling and placement 100.00 200.00 100.00 100.00% E YPermission to erect headstone/masonry work
50.00 75.00 25.00 50.00% E Y
ColumbariumPurchase or pre-purchase of Niche 150.00 170.00 20.00 13.33% E YVase 75.00 78.00 3.00 4.00% E YAshes interment and tree planting 750.00 775.00 25.00 3.33% E Y
General CemeteryPurchase or pre-purchase of 2.4 x 1.2m plot
200.00 300.00 100.00 50.00% E Y
Interment - when requested for Council to complete - in any cemetery
POA POA E Y
Single depth 500.00 500.00 100.00% E YDouble depth 600.00 600.00 100.00% E Y
Re-opening second interment 300.00 300.00 100.00% E YPerpetual maintenance - Merriwa area only
Not available Not available E Y
Ashes - interment in existing plot At cost At cost E YLawn cemetery
Purchase or pre-purchase of single depth - 2.4 x 1.2 plot - includes perpetual maintenance
900.00 950.00 50.00 5.56% E Y
Purchase or pre-purchase of double depth - 2.4 x 1.2 plot - includes perpetual maintenance
1,025.00 1,075.00 50.00 4.88% E Y
Interment - when requested for Council to complete - in any cemetery
POA POA E Y
2

2012/13 2013/14 change ($) change (%) Fee GST$ $ Type (Y/N)
FEES AND CHARGES SCHEDULE 1 July 2013 to 30 June 2014
Description of Fees and Charges
CERTIFICATESBuilding certificate (s149D) - (From 1/8/04)Residential - per dwelling unit 250.00 250.00 0.00 0.00% A NOther less than 200 m2 250.00 250.00 0.00 0.00% A N
200 - 2000 m2 250.00 250.00 0.00 0.00% A N(plus $0.50 per each additional m2) 0.50 0.50 0.00 0.00% A Nmore than 2000 m2 1,165.00 1,165.00 0.00 0.00% A N(plus $0.075 per each additional m2) 0.075 0.075 0.00 0.00% A N
Reinspection for building certificates 90.00 90.00 0.00 0.00% A NAdditional copies of building certificate ($13.00 pre copy) 13.00 13.00 0.00 0.00% A NCertified copy of a document, map or plan - each 55.00 55.00 0.00 0.00% A N
120.00 125.00 5.00 4.17% E Y
Reinspections in relation to compliance inspections where works have been found 120.00 125.00 5.00 4.17% E Yto be unsatisfactoryCertificate Section 121ZP(EPAA) 75.00 80.00 5.00 6.67% E NCertificate 735(a) (LGA) 75.00 80.00 5.00 6.67% E N
Construction certificate / Complying Development Certificate (approvals)Value of development up to $10,000 165.00 170.00 5.00 3.03% E YExceeding $10,001 up to $1,000,000 165.00 170.00 5.00 3.03% E Y
Plus an additional $2.00 for each $1,000 (or part of $1,000) of the estimated costs exceeding $10,000
E Y
Exceeding $1,000,001 - quote to be confirmed by Director or Manager ES
quote quote E Y
Plus an additional $2.00 for each $1,000 (or part of $1,000) of the estimated costs exceeding $1,000,000
ORFull cost recovery for service where referred to external party for determination.
E Y
Occupation Certificate 100.00 110.00 10.00 10.00% E YConstruction/Occupation certificate - private certifier 36.00 36.00 0.00 0.00% A NAmended Construction Certificate
Modification to a Construction Certificate 100.00 110.00 10.00 10.00% E Y
Resubmission of a Construction Certificate following previous refusal
50% of original fee
50% of original fee
E Y
Amended Complying Development Certificate Modification to a Complying Development certificate
100.00 100.00 0.00 0.00% E Y
Resubmission of a Complying Development Certificate following previous refusal
50% of original fee
50% of original fee
E Y
Essential Services compliance certificate 25.00 28.00 3.00 12.00% E YExisting holdings search for building entitlement 45.00 55.00 10.00 22.22% E Y(lodgement and recording of private construction/occupation certificate)Planning certificate
s149 (2) certificate 53.00 53.00 0.00 0.00% A Ns149 (5) certificate 80.00 80.00 0.00 0.00% A NAdditional urgency fee, if certificate is required within 48 hours
77.00 80.00 3.00 3.90% E Y
Rating certificate (s603, Local Government Act 1993) 65.00 70.00 5.00 7.69% A NAdditional urgency fee, if certificate is required within 48 hours
77.00 80.00 3.00 3.90% E Y
Subdivision CertificatesBoundary Adjustment 115.00 130.00 15.00 13.04% E YConsolidation 115.00 130.00 15.00 13.04% E YSubdivision (2 lots) 115.00 130.00 15.00 13.04% E YSubdivision (3 lots) 230.00 240.00 10.00 4.35% E YSubdivision (4 lots) 350.00 360.00 10.00 2.86% E YSubdivision (5 lots) 450.00 460.00 10.00 2.22% E YSubdivision (6 lots or more) 570.00 580.00 10.00 1.75% E YCompliance Certificate - associated with follow up site inspection*
120.00 120.00 0.00 0.00% E Y*Where associated subdivision works are unsatisfactory a follow up site inspection may be required. This will attract an additional fee of $120
Compliance inspection certificate (Critical Point Inspections, ie. pre-commencement, internal drainage, footings/piers, slab/piers, frame, wet areas, external drainage, stormwater, occupation)
3

2012/13 2013/14 change ($) change (%) Fee GST$ $ Type (Y/N)
FEES AND CHARGES SCHEDULE 1 July 2013 to 30 June 2014
Description of Fees and Charges
CHILDCARE SERVICESFamily Day CareParent administration levy - per child per hour 0.80 0.90 0.10 12.50% E NEducator administration levy - per Educator per week 8.00 9.00 1.00 12.50% E NFamily enrolment fee - new enrolments 40.00 40.00 0.00 0.00% E NAdditional new siblings N/A N/A N/A N/A E NAnnual re-enrolment Fee per family and Return to service within 6 months 20.00 20.00 0.00 0.00% E NPlaygroup fee - per child in attendance 3.00 3.00 0.00 0.00% E NProspective Educator Training 250.00 300.00 50.00 20.00% E YRecord / Information Administration fee - per hour (calculated in 15 minute increments) N/A 60.00 60.00 100.00% E Y(no charge under 15 minutes)
Out Of School Hours serviceFamily Annual Enrolment Fee (Vacation Care) 35.00 35.00 0.00 0.00% E NFamily Annual Enrolment Fee (Out of School Care) 35.00 35.00 0.00 0.00% E NVacation Care (per day) 40.00 42.00 2.00 5.00% E NBefore School Care (per session booked) 16.00 16.00 0.00 0.00% E NBefore School Care (per session casual) 17.00 17.00 0.00 0.00% E NAfter School Care (per session, booked) 17.00 19.00 2.00 11.76% E NAfter School Care (per session, casual) 18.00 20.00 2.00 11.11% E NLate fee (per 15 minutes after 6 pm) Vacation Ca 10.00 11.00 1.00 10.00% E NLate fee (per 15 minutes after 6 pm) After School Care 10.00 11.00 1.00 10.00% E N
Long Day Care servicesEnrolment Fees (per family) 52.00 54.00 2.00 3.85% E NDaily Fees Nursery 73.00 76.00 3.00 4.11% E NDaily Fees Pre Kindy 70.50 73.50 3.00 4.26% E NDaily Fees Preschool 68.00 71.00 3.00 4.41% E N
CIRCUS (on Council owned land)Large circus operations which may include exotic animals
Rent - up to 2 nights 450.00 465.00 15.00 3.33% E YRent - each subsequent night 200.00 210.00 10.00 5.00% E YTent fees - per night 60.00 65.00 5.00 8.33% E YRefundable Security Deposit 500.00 500.00 0.00 0.00% E N
Rent - up to 2 nights 250.00 265.00 15.00 6.00% E YRent - each subsequent night 100.00 110.00 10.00 10.00% E YRefundable Security Deposit 300.00 300.00 0.00 0.00% E N
COMMUNITY BUS (Merriwa)General users charge per km 1.50 1.60 0.10 6.67% C YDay Care/Senior Citizens (Around Merriwa town, return trip) 2.50 2.50 0.00 0.00% C YCleaning deposit (refundable) 100.00 100.00 0.00 0.00% C N
COMMUNITY PLANCopy available for purchase 25.00 30.00 5.00 20.00% D YCopy available in the Abn, Mdi, Mwa, Cassilis and Scn libraries for review 0.00 0.00 0.00 #DIV/0! D Y
COMMUNITY PROFILECopy available for purchase 25.00 30.00 5.00 20.00% D YCopy available in the Abn, Mdi, Mwa, Cassilis and Scn libraries for review 0.00 0.00 0.00 0.00% D Y
Small circus operations which may include only human skills and small domestic animals
4

2012/13 2013/14 change ($) change (%) Fee GST$ $ Type (Y/N)
FEES AND CHARGES SCHEDULE 1 July 2013 to 30 June 2014
Description of Fees and Charges
COMPANION ANIMALSRegistration fee (s95 Companion Animals Act 1998)
Desexed 40.00 40.00 0.00 0.00% A NDesexed - owned by an eligible pensioner
15.00 15.00 0.00 0.00% A N
Not desexed 150.00 150.00 0.00 0.00% A NNot desexed - owned by an eligible pensioner
150.00 150.00 0.00 0.00% A N
Not desexed - kept by a recognised breeder
40.00 40.00 0.00 0.00% A N
Assistance animals 0.00 0.00 0.00 0.00% A NGreyhounds, working dogs and other Various A N - refer to the Companion Animal Regulations
Dangerous dog enclosure Certificate of Compliance 100.00 100.00 0.00 0.00% A NMicrochip fee in advance for impounded animals
Per animal by Council staff 40.00 42.00 2.00 5.00% E YPer animal on special microchipping days 20.00 22.00 2.00 10.00% E Y
Per animal by Veterinarian POA POA E YImpounding fees
Release fee - first day or part thereof 50.00 52.00 2.00 4.00% E NSecond & subsequent release 50.00 52.00 2.00 4.00% E NRelease fee - each subsequent day or part thereof
20.00 22.00 2.00 10.00% E N
Treating sick or injured animals Actual Actual N/A N/A E NSurrender of companion animal for disposal (delivered by owner)
55.00 58.00 3.00 5.45% E N
Surrender of companion animal with litter under 6 months
45.00 48.00 3.00 6.67% E N
(Additional fees for pick up beyond 10 km radius from Aberdeen, Merriwa, Murrurundi or Scone based on time & km travelled)
At cost At cost N/A N/A
Sale of companion animal - under six months 25.00 28.00 3.00 12.00% E Y
Sale of companion animal - other 32.00 35.00 3.00 9.38% E YTraps hire (refundable security deposit) - Pensioners 25.00 25.00 0.00 0.00% E NTraps hire (refundable security deposit) 75.00 75.00 0.00 0.00% E N
CTC@MURRURUNDIAdvertising Front and back cover of The Links 70.00 70.00 0.00 0.00% E Y
Inside The Links 35.00 35.00 0.00 0.00% E YComputer access - Adult (per half hour) 3.00 3.00 0.00 0.00% D YComputer access - Adult (per hour) 5.00 5.00 0.00 0.00% D YComputer access - Children (per half hour) 2.50 2.50 0.00 0.00% D YComputer access - Children (per hour) 4.00 4.00 0.00 0.00% D YComputer access - Quick Jump (15 minutes) 2.50 2.50 0.00 0.00% D YComputer access - Student in School Holidays (2 hr block) 4.00 4.00 0.00 0.00% D YCD writer staff assisted (per hour) 40.00 40.00 0.00 0.00% D YOne-on-one tuition (per hour) 55.00 55.00 0.00 0.00% D YBlack & white printing (see photocopying) D YScanning - staff assisted (per page) 1.00 1.00 0.00 0.00% D YDisks & CDs CD-R 4.00 4.00 0.00 0.00% D YDisks & CDs CD-W 6.00 6.00 0.00 0.00% D YData ProjectorPer day 62.00 62.00 0.00 0.00% D YMinimum 3 hours 36.00 36.00 0.00 0.00% D YRefundable Security Deposit 100.00 100.00 0.00 0.00% D NDigital Camera Four hours hire 26.00 26.00 0.00 0.00% D YEight hours hire 50.00 50.00 0.00 0.00% D YRefundable Security Deposit 100.00 100.00 0.00 0.00% D NFacsimilesTo send Australia first page (then $0.80 per page thereafter)
2.50 2.50 0.00 0.00% D Y
To send overseas first page (then $0.80 per page thereafter)
6.00 6.00 0.00 0.00% D Y
To receive (per page) 0.90 0.90 0.00 0.00% D Y
5

2012/13 2013/14 change ($) change (%) Fee GST$ $ Type (Y/N)
FEES AND CHARGES SCHEDULE 1 July 2013 to 30 June 2014
Description of Fees and Charges
LaminatingBusiness card size 2.00 2.00 0.00 0.00% D YA4 size 3.50 3.50 0.00 0.00% D YA3 size 5.00 5.00 0.00 0.00% D YFoils 3.50 3.50 0.00 0.00% D YPhotocopyingA4 (RC) paper (per page) (B & W) 0.50 0.50 0.00 0.00% D YA4 (RC) paper dbl sided (per page) (B & W) 0.70 0.70 0.00 0.00% D YA4 own paper (per page) (B & W) 0.40 0.40 0.00 0.00% D YA4 paper double sided (per page) (B & W) own paper 0.50 0.50 0.00 0.00% D YA4 (RC) paper (per page) (Colour) 1.20 1.20 0.00 0.00% D YA4 (RC) paper (per page) (Part Colour) 0.90 0.90 0.00 0.00% D YA4 (RC) paper double sided (part colour)(per page) 1.80 1.80 0.00 0.00% D YA3 (RC) paper double sided(B & W) (per page) 1.60 1.60 0.00 0.00% D YA3 (RC) paper double sided (colour)(per page) 2.30 2.30 0.00 0.00% C YA3 (RC) single sided (B&W)(per page) 1.00 1.00 0.00 0.00% D YA3 (RC) Single sided (Colour)(per page) 2.40 2.40 0.00 0.00% E YBulk photocopy over 50 sheets (per 50 pages)S/S 14.00 14.00 0.00 0.00% E YBulk photocopy over 50 sheets (per 50 pages) D/S 19.00 19.00 0.00 0.00% D YBulk photocopy over 50 sheets (per 50 pages) -Colour 50.00 50.00 0.00 0.00% D NBulk photocopy over 50 sheets (per 50 pages) -Colour D/S 70.00 70.00 0.00 0.00% D YTraining Room Hire (Room hire includes training facilities)Commercial (per hour) 40.00 40.00 0.00 0.00% D YCommunity groups (per hour) 15.00 15.00 0.00 0.00% D Y - half day 23.00 23.00 0.00 0.00% D Y - full day 34.00 34.00 0.00 0.00% D YTypingPer hour - customer to provide content & layout 40.00 40.00 0.00 0.00% D YWork involving layout and design (brochures etc) Quotes
providedQuotes
providedD Y
PrintingColour Inkjet Printing A4 photo printing text only A4 0.90 0.90 0.00 0.00% D Y
text & graphics A4 3.50 3.50 0.00 0.00% D YLaminating - Own sheets A4 1.50 1.50 0.00 0.00% D Y
A3 2.50 2.50 0.00 0.00% D YPrinting - Own Paper A4 B&W single sided 0.40 0.40 0.00 0.00% D Y
A4 B&W double sided 0.90 0.90 0.00 0.00% D YA4 double side colour 1.60 1.60 0.00 0.00% D YA4 colour single sided 1.10 1.10 0.00 0.00% D Y
DEVELOPMENT APPLICATIONS
Up to $5000 110.00 110.00 0.00 0.00% A N$5,000 - $ 50,000 170.00 170.00 0.00 0.00% A Nplus an additional $3 for each $1,000 (or part
of $1,000) of the estimated cost.$50,001 - $250,000 352.00 352.00 0.00 0.00% A Nplus an additional $3.64 for each $1,000 (or
part of $1,000) of the estimated cost.
$ 250,001 - $ 500,000 1,160.00 1,160.00 0.00 0.00% A Nplus an additional $2.34 for each $1,000 (or
part of $1,000) by which the estimated cost exceeds $250,000.
$ 500,001 - $ 1,000,000 1,745.00 1,745.00 0.00 0.00% A Nplus an additional $1.64 for each $1,000 (or
part of $1,000) by which the estimated cost exceeds $500,000.
$ 1,000,001 - $ 10,000,000 2,615.00 2,615.00 0.00 0.00% A Nplus an additional $1.44 for each $1,000 (or
part of $1,000) by which the estimated cost exceeds $1m.
More than $ 10,000,000 15,875.00 15,875.00 0.00 0.00% A Nplus an additional $1.19 for each $1,000 (or
part of ($1,000) by which the estimated cost exceeds $10m.
(for development involving the erection of a building other than a dwelling house, the carrying out of work or the demolition of a work or a building)
6

2012/13 2013/14 change ($) change (%) Fee GST$ $ Type (Y/N)
FEES AND CHARGES SCHEDULE 1 July 2013 to 30 June 2014
Description of Fees and Charges
a) Dep't Planning fee for DAs exceeding $50,000
Erection of a dwelling house with an estimated value of $100,000 or less 455.00 455.00 0.00 0.00% A N285.00 285.00 0.00 0.00% A N
Advertising signs (for 1 only) 285.00 285.00 0.00 0.00% A Nplus for each additional sign (if any) 95.00 95.00 0.00 0.00% A N
b) Subdivisions/Consolidations/Boundary Adjustment(for development involving the subdivision of land)New roads 665.00 665.00 0.00 0.00% A Nplus each additional lot 65.00 65.00 0.00 0.00% A NNo new roads 330.00 330.00 0.00 0.00% A Nplus each additional lot 53.00 53.00 0.00 0.00% A NStrata title 330.00 330.00 0.00 0.00% A Nplus each additional lot 65.00 65.00 0.00 0.00% A N
c) AdvertisingDevelopment Application advertising/notification fee 110.00 115.00 5.00 4.55% E YNotice fees - when required for the development:Advertised development 1,105.00 1,105.00 0.00 0.00% A NDesignated development 2,220.00 2,220.00 0.00 0.00% A NProhibited development 1,105.00 1,105.00 0.00 0.00% A N
830.00 830.00 0.00 0.00% A N
d) Designated Development920.00 920.00 0.00 0.00% A N
e) Integrated DevelopmentAn additional fee per approval body 140.00 140.00 0.00 0.00% A N
320.00 320.00 0.00 0.00% A N
What if two or more fees are applicable to a single development application?
f) Modification of a consent for local development or State significant developmentApplication under s96 (1) EP&A Act (maximum) 71.00 71.00 0.00 0.00% A N
645.00 645.00 0.00 0.00% A NApplication under s96 (2) or S96 AA (1) EP&A Act:If the original application fee was less than $100.00, 50% of that fee, or
190.00 190.00 0.00 0.00% A N
In all other cases:Up to $5000 55.00 55.00 0.00 0.00% A N$5001 - $ 250,000 85.00 85.00 0.00 0.00% A Nplus an additional $1.50 for each $1,000 (or
part of $1,000) of the estimated cost
$ 250,001 - $ 500,000 500.00 500.00 0.00 0.00% A Nplus an additional $0.85 for each $1,000 (or
part of $1,000) by which the estimated cost exceeds $250,000.
$ 500,001 - $ 1,000,000 712.00 712.00 0.00 0.00% A Nplus an additional $0.50 for each $1,000 (or
part of $1,000) by which the estimated cost exceeds $500,000.
$ 1,000,001 - $ 10,000,000 987.00 987.00 0.00 0.00% A Nplus an additional $0.40 for each $1,000 (or
part of $1,000) by which the estimated cost exceeds $1m.
More than $ 10,000,000 4,737.00 4,737.00 0.00 0.00% A Nplus an additional $0.27 for each $1,000 (or
part of ($1,000) by which the estimated cost exceeds $10m
In addition to any other fees payable, a maximum fee of $920 is payable for designated development.
A further fee for the referral and provision of advice in respect to the general terms of approval to be granted by Council, per approval body.
Other, for example, not involving the erection of a building, the carrying out of work or the subdivision of land.
Despite the provisions of Fees for Development Applications there is a minimum fee of $555 for designated development.
NB an additional amount of not more than $665 if notice of the application is required under s96 (2) of the Act. Council will refund so much of the additional amount as is not spent in giving the notice under s96 (2) of the Act.
In the case of a development application that involves the erection of a dwelling house of $100,000 or less
When an environmental planning instrument requires notice to be given, other than developments above Council, will refund so much of the fee paid.
Application under s96 (1A) or S96 AA (1) EP&A Act, $645 or,
P=0.64 x E - 5 / 1,000 where P represents the $ to be set aside, expressed in $ rounded down to the nearest $, and E represents the estimated cost of development expressed in $ rounded up to the nearest thousand.
If two or more fees are applicable to a single development application (such as to subdivide land and erect a building on one or more lots created by the subdivision), the maximum fee payable for the development is the sum of those fees.
7

2012/13 2013/14 change ($) change (%) Fee GST$ $ Type (Y/N)
FEES AND CHARGES SCHEDULE 1 July 2013 to 30 June 2014
Description of Fees and Charges
f)(i) Request for a review of a determination under Section 82A(3) of the Act50% of DA
fee50% of DA
fee190.00 190.00 0.00 0.00% A N
In all other cases:Up to $5000 55.00 55.00 0.00 0.00% A N$5001 - $ 250,000 85.00 85.00 0.00 0.00% A Nplus an additional $1.50 for each $1,000 (or
part of $1,000) of the estimated cost
$ 250,001 - $ 500,000 500.00 500.00 0.00 0.00% A Nplus an additional $0.85 for each $1,000 (or
part of $1,000) by which the estimated cost exceeds $250,000.
$ 500,001 - $ 1,000,000 712.00 712.00 0.00 0.00% A Nplus an additional $0.50 for each $1,000 (or
part of $1,000) by which the estimated cost exceeds $500,000.
$ 1,000,001 - $ 10,000,000 987.00 987.00 0.00 0.00% A Nplus an additional $0.40 for each $1,000 (or
part of $1,000) by which the estimated cost exceeds $1m.
More than $ 10,000,000 4,737.00 4,737.00 0.00 0.00% A Nplus an additional $0.27for each $1,000 (or
part of ($1,000) by which the estimated cost exceeds $10m
f)(ii) Request for a review of a determination under Section 82B of the Act
If the estimated costs of the development is less than $100,000 55.00 55.00 0.00 0.00% A N150.00 150.00 0.00 0.00% A N
If the estimated costs of the development is more than $1,000,000 250.00 250.00 0.00 0.00% A N
g) State Environmental Planning Policy No. 1Referral to Department of Planning
(variation >10% of Council standard delegated authority)
150.00 160.00 10.00 6.67% E Y
plus Concurrence Fee (if required) 320.00 320.00 0.00 0.00% A N(variation <10% of Council standard) 100.00 100.00 0.00 0.00% E Y
h) State Environmental Planning Policy No. 4Application for development without consent 50.00 50.00 0.00 0.00% E Y
i) Development ContributionsMerriwa LEP
S94Bushfire fighting facilities per additional lot 275.00 284.00 9.00 3.27% E NSocial & Community facilities per additional lot 360.00 370.00 10.00 2.78% E N
Public Open Space per additional lot 360.00 370.00 10.00 2.78% E NRoad Network Contribution per additional lot 2,150.00 2,215.00 65.00 3.02% E N
S64 contributions per equivalent tenement
Water (Cassilis) per additional lot 600.00 618.00 18.00 3.00% E NWater (Merriwa) per additional lot 3,000.00 3,090.00 90.00 3.00% E NSewerage (Merriwa) per additional lot 1,500.00 1,545.00 45.00 3.00% E N
Murrurundi LEP
S94Bush Fire Fighting Services - Per dwelling/allotment Rural, Blandford, Murrurundi 400.00 412.00 12.00 3.00% E N
250.00 258.00 8.00 3.20% E N
Public Open SpaceRural, Blandford, Murrurundi (Per dwelling/allotment) 800.00 824.00 24.00 3.00% E NRural, Blandford, Murrurundi 340.00 351.00 11.00 3.24% E N
If the estimated costs of the development is $100,000 or more and less than or equal to $1,000,000
Development contributions for water and sewer are based on additional lots created with access to Council's water and sewerage systems.
Development contributions for water and sewer are based on additional lots created with access to Council's water and sewerage systems.
Per employee engaged in mining extractive industries (excluding coal mines), tourism and intensive agricultural enterprises.
NB an additional amount of not more than $620 if notice of the application is required under s96 (2) of the Act. Council will refund so much of the additional amount as is not spent in giving the notice under s96 (2) of the Act.
In the case of a development application that involves the erection of a dwelling house of $100,000 or less
In the case of a development that does not involve the erection of a building, the carrying out of a work or the demolition of a work or building, 50% of that fee, or
8

2012/13 2013/14 change ($) change (%) Fee GST$ $ Type (Y/N)
FEES AND CHARGES SCHEDULE 1 July 2013 to 30 June 2014
Description of Fees and Charges
Waste DisposalPer dwelling/allotment Blandford, Murrurundi, Rural 64.00 66.00 2.00 3.13% E NS64 contributions per equivalent tenement
Water - Murrurundi 3,000.00 3,090.00 90.00 3.00% E NSewerage - Murrurundi 1,500.00 1,545.00 45.00 3.00% E Ns94 Roads
Aberdeen & Scone LEP
Residential subdivisionS64 contributions per equivalent tenementWater 6,550.00 6,747.00 197.00 3.01% E NHigh Level Reservoir - East Scone (above 230 AHD) 6,200.00 6,386.00 186.00 3.00% E NSewerage 1,460.00 1,504.00 44.00 3.01% E NS94Recreation and community facilities (within 20 km radius of Scone) 1,000.00 1,030.00 30.00 3.00% E NOpen space embellishment 200.00 206.00 6.00 3.00% E N(applies to subdivisions of 4 lots or more, if no open space is provided)Cycleway - applies to subdivision or additional residential units of 4 or more 560.00 577.00 17.00 3.04% E NCar Parking in lieu of the provision of off-street car parking Rate to be determined by CouncilS94A Levy ContributionsLevy contributions are based on a percentage of the estimated cost of development & CPI indexed.
0.0% 0.00% 0.00 0.00% E N
0.5% 0.50% 0.00 0.00% E N
1.0% 1.0% 0.00 0.00% E N
Other fees and chargesAmended DA (prior to approval) 60.00 65.00 5.00 8.33% E YFire safety inspection fee 150.00 155.00 5.00 3.33% E YObjection to application of Regulations and Local Policies (s82 LG Act) 280.00 285.00 5.00 1.79% E Y
1,810.00 2,000.00 190.00 10.50% E Y5,000.00 5,000.00 100.00% E Y
10,000.00 10,000.00 100.00% E Y
Development consent list - per month 30.00 35.00 5.00 16.67% E YDevelopment consent list - per annum 170.00 175.00 5.00 2.94% E YBushfire Attack Level Risk Assessment Certificate 350.00 365.00 15.00 4.29% E YFlood Risk Certificate 50.00 55.00 5.00 10.00% E YFlood information 180.00 185.00 5.00 2.78% E Y88B Variation 110.00 125.00 15.00 13.64% E YHoarding Application (Type A) Maximum of 4 weeks 110.00 110.00 0.00 0.00% E Y
Renewal (every 4 weeks there after) 55.00 55.00 0.00 0.00% E Y
Approvals under S68 LGAInstall manufactured home, moveable dwelling on land 300.00 320.00 20.00 6.67% E N
150.00 165.00 15.00 10.00% E N
200.00 220.00 20.00 10.00% E N
The Director of Technical Services will undertake an assessment of the proposed road at the time of lodgement of the relevant application, calculate existing usage and maintenance costs over a six (6) year period, determine the appropriate standard (degree of upgrading) required to cater for new development and associated cost. The contribution will be apportioned between the cost normally attributed to Council given existing usage/maintenance program and that which results as a consequence of the development.
Development contributions for water & sewer are based on additional lots created with access to Council's systems. Developments in Satur & along Moobi and Alan Cunningham Rds are serviced by the Satur trunk water main & attract an additional contribution.
All development where the estimated cost of carrying out the development is greater than $100,000 and up to $200,000.
Sewerage and stormwater drainage work in conjunction with DA, CC or CDC lodged with Council plus an additional $25.00 for each closet proposal
All development where the estimated cost of carrying out the development is greater than
Sewerage and stormwater drainage work not in conjunction with DA, CC or CDC lodged with Council plus an additional $25.00 for each closet proposal
Rezoning Application/Planning Proposal - where the proposed minimum lot size would allow for a maximum of 3 additional lots
Rezoning Applications/Planning Proposal - where the proposed minimum lot size would allow for more than 3 additional lots
Rezoning Applications/Planning Proposal - additional permitted uses and where the
All development where the proposed cost of carrying out the development is less than $100,000.
9

2012/13 2013/14 change ($) change (%) Fee GST$ $ Type (Y/N)
FEES AND CHARGES SCHEDULE 1 July 2013 to 30 June 2014
Description of Fees and Charges
Onsite Sewer Management200.00 220.00 20.00 10.00% E N
350.00 360.00 10.00 2.86% E N
Approval to operate - residential (annual) - refer to Revenue Policy 33.00 34.00 1.00 3.03% E NApproval to operate - Commercial (annual) - refer to Revenue Policy 33.00 34.00 1.00 3.03% E NInspection fee per system (Additional and reinspections) 45.00 48.00 3.00 6.67% E NInspection fee of primary system at request of owner/solicitor, etc 120.00 125.00 5.00 4.17% E N
Miscellaneous Approvals under Section 68 LGAUse community land 150.00 155.00 5.00 3.33% E NSwing hoist goods over road 250.00 250.00 0.00 0.00% E NGeneral approvals not mentioned above 200.00 200.00 0.00 0.00% E NInspections associated with approvals 120.00 125.00 5.00 4.17% E Y
Approvals under Section 138 Roads ActIn conjunction with DA, CC or CDC lodged with Council 60.00 70.00 10.00 16.67% E NNot in conjunction with DA, CC, or CDC 170.00 175.00 5.00 2.94% E NInspections associated with approvals 120.00 125.00 5.00 4.17% E Y
GOVERNMENT INFORMATION PRIVATE ACCESS (GIPA)Standard application - each 30.00 30.00 0.00 0.00% A NNon-standard application - per hour 30.00 30.00 0.00 0.00% A NSearch fee - per hour 30.00 30.00 0.00 0.00% A NInternal review 40.00 40.00 0.00 0.00% A N
HALL HIREAberdeen Community HallHire of building - casual user, per day 18.00 20.00 2.00 11.11% C YHire of building - casual user, per half-day 10.00 10.00 0.00 0.00% C YHire of building - casual user, per night 18.00 20.00 2.00 11.11% C YHire of building - regular user, per day 15.00 15.00 0.00 0.00% C YHire of building - regular user, per half-day 8.00 10.00 2.00 25.00% C YRefundable Security Deposit - casual user, no alcohol 25.00 25.00 0.00 0.00% E NRefundable Security Deposit - casual user, with alcohol 250.00 250.00 0.00 0.00% E NRefundable Security Deposit - regular user n/a n/a E NCassilis Community CentreMain Hall (per day) 39.00 40.00 1.00 2.56% C YSupper room (per day) 34.00 35.00 1.00 2.94% C YHall & Supper Room (per day) 57.00 58.00 1.00 1.75% C YKitchen (no cutlery or crockery) (per day) 41.00 42.00 1.00 2.44% C YKitchen - Commercial Use (per day) 72.00 73.00 1.00 1.39% C YCutlery & Crockery 34.00 35.00 1.00 2.94% C YTables (each) 14.00 15.00 1.00 7.14% C YChairs (each) 4.00 5.00 1.00 25.00% C YRefundable Security Deposit - tables & chairs 268.00 270.00 2.00 0.75% C NRehearsals 6.00 10.00 4.00 66.67% C YOvernight Auction storage charges 57.00 60.00 3.00 5.26% C YRefundable Security Deposit - hall use 320.00 320.00 0.00 0.00% E N
Merriwa OfficeNot for profit organisations 0.00 0.00 0.00 0.00% C YChambers (per hour) 15.00 16.00 1.00 6.67% C YKitchen use (per hour) 10.00 10.00 0.00 0.00% C YScone OfficeNot for profit organisations 0.00 0.00 0.00 0.00% C YChambers (per hour) 15.00 17.00 2.00 13.33% C YBarry Rose Committee Room (per hour) 10.00 12.00 2.00 20.00% C YUse of video and/or teleconferencing facilities (first hour) 50.00 50.00 0.00 0.00% C Y
(each additional hour) 15.00 15.00 0.00 0.00% C YCommittee Room No.2 (per hour) 10.00 12.00 2.00 20.00% C YUse of video and/or teleconferencing facilities (first hour) 50.00 50.00 0.00 0.00% C Y
(each additional hour) 15.00 15.00 0.00 0.00% C YTraining Room (per hour) 20.00 25.00 5.00 25.00% C YKitchen use (per hour) 10.00 10.00 0.00 0.00% C YInterview Room No. 1 (per hour) 10.00 10.00 0.00 0.00% C Y
Condition of hire - incorporated bodies, sporting clubs or associations of any kind must provide their own public liability insurance ($10 million).
Application to install, construct, modify a commercial onsite sewer management systems greater than 10 persons - includes preliminary inspection
Application to install, construct, modify onsite sewer management systems up to 10 persons - includes preliminary inspection
10

2012/13 2013/14 change ($) change (%) Fee GST$ $ Type (Y/N)
FEES AND CHARGES SCHEDULE 1 July 2013 to 30 June 2014
Description of Fees and Charges
SNRC/Library(Old Admin Building - Scone)Exhibition RoomCommunity Groups (per hour) 11.00 12.00 1.00 9.09% C YFull Day 27.00 30.00 3.00 11.11% C YCancellation 7.00 12.00 5.00 71.43% C YGovt/Corp per day 65.00 65.00 0.00 0.00% C YRefundable Security Deposit 100.00 100.00 0.00 0.00% E NTenants 0.00 0.00 0.00 0.00% E NMeeting RoomsRoom Hire (per hour) 7.00 7.00 0.00 0.00% C Y1/2 day 14.00 15.00 1.00 7.14% C YFull Day 27.00 30.00 3.00 11.11% C YCancellation 7.00 7.00 0.00 0.00% C YTenants 0.00 0.00 0.00 0.00% E N
Merriwa School of ArtsMain Hall (per day) 71.00 78.00 7.00 9.86% C YMain Hall (1/2 day) - minimum charge 36.00 36.00 100.00% C YMain Hall (per hour) 21.00 NA C YSupper room (per day) 38.00 40.00 2.00 5.26% C YHall & Supper Room (per day) 81.00 85.00 4.00 4.94% C YSmall Room at rear 23.00 25.00 2.00 8.70% C YKitchen (no cutlery or crockery) (per day) 81.00 83.00 2.00 2.47% C YKitchen - Commercial Use (no cutlery or crockery (per day) 105.00 105.00 0.00 0.00% C YCutlery & Crockery 38.00 40.00 2.00 5.26% C YTables (each) 14.00 15.00 1.00 7.14% C YChairs (each) 3.50 5.00 1.50 42.86% C YRefundable Security Deposit - tables & chairs 250.00 250.00 0.00 0.00% C N
Rehearsals 8.00 10.00 2.00 25.00% C YOvernight Auction storage charges 53.00 55.00 2.00 3.77% C YCancellation fee 50.00 55.00 5.00 10.00% E YRefundable Security Deposit - hall use 350.00 350.00 0.00 0.00% E N
Murrurundi RSL HallRetail Sales - per day 265.00 275.00 10.00 3.77% C YBalls, Markets, Birthdays, Dances, Shows, Weddings, Concerts - per day 130.00 135.00 5.00 3.85% C YExhibits, Fashion Parades, Displays, Classes (commercial) per day 66.00 70.00 4.00 6.06% C YUse by non-profit organisations - Shire based 0.00 0.00 0.00 0.00% C YSchool Functions including rehearsals 0.00 0.00 0.00 0.00% C YPre-School Kindergarten - per week 9.00 9.50 0.50 5.56% C YRefundable Security & Key Deposit - no alcohol 100.00 100.00 0.00 0.00% E NRefundable Security & Key Deposit - with alcohol 200.00 210.00 10.00 5.00% E NMinimum hourly rate 16.00 16.50 0.50 3.13% C Y
Old Court Theatre (Scone)Daily use 135.00 135.00 100.00% C YHalf day use 70.00 70.00 100.00% C YRefundable Security Deposit - hall use 200.00 200.00 100.00% E N
Senior Citizens Centre (Scone)Small meeting room - community groups, per hour 7.00 7.50 0.50 7.14% C YSmall meeting room - other organisations, per hour 9.00 10.00 1.00 11.11% C YLarge meeting room - community groups, per hour 9.00 9.50 0.50 5.56% C YLarge meeting room - other organisations, per hour 12.00 13.00 1.00 8.33% C YLarge entertainment area - community groups, per hour 10.00 10.50 0.50 5.00% C YLarge entertainment area - other organisations, per hour 17.00 18.00 1.00 5.88% C Y
Condition of hire - incorporated bodies, sporting clubs or associations of any kind must provide their own public liability insurance ($10 million).
Condition of hire - incorporated bodies, sporting clubs or associations of any kind must provide their own public liability insurance ($10 million).
Condition of hire - incorporated bodies, sporting clubs or associations of any kind must provide their own public liability insurance ($10 million).
11

2012/13 2013/14 change ($) change (%) Fee GST$ $ Type (Y/N)
FEES AND CHARGES SCHEDULE 1 July 2013 to 30 June 2014
Description of Fees and Charges
Settlement Hall (20km south west of Merriwa)Party Hire 57.00 60.00 3.00 5.26% C YMeeting Hire 31.00 34.00 3.00 9.68% C YB & S Ball or Ute Muster 500.00 500.00 0.00 0.00% C YToy box Hire (per use) 20.00 34.00 14.00 70.00% C YRefundable Security Deposit -party hire 200.00 200.00 0.00 0.00% E NRefundable Security Deposit - B & S Ball or Ute Muster 500.00 500.00 0.00 0.00% E NRefundable Cleaning Bond for meetings 30.00 30.00 0.00 0.00% E N
Scone Youth Club (Hall at rear) - Hall HireHire of building - casual user, per day 15.50 20.00 4.50 29.03% C YHire of building - casual user, per half-day 8.00 10.00 2.00 25.00% C YHire of building - casual user, per night 15.50 17.00 1.50 9.68% C YHire of building - regular user, per day 13.00 15.00 2.00 15.38% C YHire of building - regular user, per half-day 7.00 9.00 2.00 28.57% C YRefundable Security Deposit - casual user, no alcohol 30.00 30.00 0.00 0.00% E NRefundable Security Deposit - regular user 15.00 15.00 0.00 0.00% E NLittle Rascals Playgroup, per session 5.00 0.00 (5.00) -100.00% C Y
HORSE BOXESPermanent hire - weekly-bedding not included 17.50 18.10 0.60 3.43% E YStore room hire - weekly-bedding not included 10.00 10.40 0.40 4.00% E YOvernight hire-bedding not included 12.00 12.40 0.40 3.33% E YOvernight hire - bedding included (reused up to 3 times) - must be cleaned before exit 22.00 22.80 0.80 3.64% E YClub/Committee hire - per day/night up to three days-bedding not included 8.50 8.80 0.30 3.53% E YClub/Committee hire - weekly over 3 days 24.00 24.80 0.80 3.33% E YNOTE: Discounts for Club/Committee hire will
only apply when bulk bookings and stall allocations are carried out by Club/Committee secretaries, etc.
Horse sales - per day/night 12.70 13.10 0.40 3.15% E Y(additional commission is paid, see below)
Bedding All users Type and cost of material (ie rice husks/wood shavings) subject to availability. approximately $20 per bag of materials
Cost+10% Cost + 10% E Y
Cleaning fee 40.00 41.50 1.50 3.75% E Y
HORSE SALES - commissionsHorse sales - commission calculated on gross of the sale value (excl GST), 1% + GST 1% + GST E Ythen GST is added to the base commission value
HOSTELAccommodation Bonds 144,000.00 144,000.00 0.00 0.00% E N
E N
Annual Retention amount (Maximum set by Dept of Heath & Ageing) 3,588.00 3,588.00 0.00 0.00% E NResidents Fees (set by the Department of Health & Ageing) E N
IMPOUNDED ARTICLES - eg cars, trolleys, signs etc.Conveyance of impounded article to pound - labour and plantRefer to Council's "labour & plant hire rates" Cost+10% Cost+10% N/A N/A E NStorage of an impounded article 0.00 0.00%Per item 35.00 36.00 1.00 2.86% E NNotice advising the owner of an impounded item 35.00 36.00 1.00 2.86% E N
130.00 133.00 3.00 2.31% E N
Interest on outstanding Bonds (Lesser of max set by Dept of Health & Ageing & Council rates)
Advertising of article/vehicle prior to sale, where necessary and when the owner not known.
Condition of hire - incorporated bodies, sporting clubs or associations of any kind must provide their own public liability insurance ($10 million).
Condition of hire - incorporated bodies, sporting clubs or associations of any kind must provide their own public liability insurance ($10 million).
12

2012/13 2013/14 change ($) change (%) Fee GST$ $ Type (Y/N)
FEES AND CHARGES SCHEDULE 1 July 2013 to 30 June 2014
Description of Fees and Charges
IMPOUNDED STOCKConveyance of impounded stock to pound or other approved site Cost+10% Cost+10% N/A N/A E N(See "labour hire rates" and "plant hire rates")Temporary facility hire Cost+10% Cost+10% N/A N/A E NStock vehicle equipment charge per hour 20.00 20.00 0.00 0.00% E NCharge for loss or trespassing of stock per incident Cost+10% Cost+10% N/A N/A E NNotice advising the owner of impounded stock 35.00 35.00 0.00 0.00% E NAdvertising of stock prior to sale, where necessary and when the owner not known. 130.00 135.00 5.00 3.85% E NSustenance and maintenanceSmall animal (sheep, goat, pig etc) - per head per day 30.00 35.00 5.00 16.67% E NLarge animal (horse, cow etc) - per head per day 30.00 45.00 15.00 50.00% E N
INDEPENDENT LIVING UNITSLiverpool Lodge, unit (per fortnight) 182.00 189.00 7.00 3.85% C NLiverpool Lodge, cottage (per fortnight) 190.00 197.00 7.00 3.68% C NBettington & Vennacher Sts (variable rate based on 25% of household income) Variable Variable 0.00 0.00% C NLangley Street (variable rate based on 25% of household income) Variable Variable 0.00 0.00% C N
INSPECTION, LICENCE and REGISTRATION FEESCaravan Parks (per site) Licence 6.00 7.00 1.00 16.67% E YPublic halls inspection n/a n/a 0.00 0.00% E YCombined inspection - Schools (ie places of public entertainment and food shop) 170.00 175.00 5.00 2.94% E Y
40.00 40.00 0.00 0.00% E N
Health Premises
Annual Administration Fee - General (other than Food Shops) 60.00 65.00 5.00 8.33% E Y - Skin Penetration Premises 60.00 65.00 5.00 8.33% E N - Food Shops - Charitable organisation food stalls E Y - Temporary Food Stall 60.00 65.00 5.00 8.33% E Y - Minor food (P4) 80.00 85.00 5.00 6.25% E Y - Major food (P1-3) 120.00 125.00 5.00 4.17% E Y
Inspection Fees - General (other than Food Shops) 80.00 85.00 5.00 6.25% E Y - Skin Penetration Premises 80.00 85.00 5.00 6.25% E N - Food Shops - Charitable organisations 0.00 0.00 0.00 0.00% E Y - Temporary Food Stalls 80.00 85.00 5.00 6.25% E Y - Minor food (P4) 110.00 115.00 5.00 4.55% E Y - Major food (P1-3) 150.00 155.00 5.00 3.33% E Y - Reinspection fee (after 2nd inspection if deemed necessary) 150.00 155.00 5.00 3.33% E Y* as per Food Authority classificationWater carters licence 120.00 122.00 2.00 1.67% E NWater sampling - private (exclusive of water analysis costs) 120.00 122.00 2.00 1.67% E Y
LABOUR HIRE RATES
Engineering assessment - senior engineer 160.00 165.00 5.00 3.13% E YEngineering assessment - assistant engineer 120.00 125.00 5.00 4.17% E YHealth and building assessment 132.00 137.00 5.00 3.79% E YPlant operator - Normal Time (7am - 4pm Mon-Fri) 42.50 44.00 1.50 3.53% E YPlant operator - Overtime (all other times) 66.00 67.50 1.50 2.27% E YRate and administrative enquiries 70.00 72.00 2.00 2.86% E YPlumber 64.00 66.18 2.18 3.40% E YLabourer 38.00 39.25 1.25 3.29% E YOther labour is at cost plus an administrative overhead and GST.
LAMINATING (at Council Administration Buildings)Business card size 2.50 3.00 0.50 20.00% E YA4 size 3.50 4.00 0.50 14.29% E YA3 size 6.50 7.00 0.50 7.69% E Y
Footpath Trading Licence (charities exempt) annual fee per article incl chair, table, A frames, etc
Estimate per hour including on-costs. This information is provided to assist in determining costs where the services of a Council officer are involved.
General: includes Food shops, Mobile vending, Bed & Breakfast, Hairdressers, Barbers , Beauty Salons etcSkin Penetration Premises: includes Hairdressers, Tattooists, Barbers, Beauty Salons, Chemists etc who perform body piercing
13

2012/13 2013/14 change ($) change (%) Fee GST$ $ Type (Y/N)
FEES AND CHARGES SCHEDULE 1 July 2013 to 30 June 2014
Description of Fees and Charges
LIBRARY SERVICESBorrowersReciprocal Borrowers FREE FREENon Residential Borrowers (Refundable Deposit) 25.00 25.00 0.00 0.00% E NFax MachineSending - for the first page 2.00 2.50 0.50 25.00% E YSending - for each additional page 2.00 2.00 0.00 0.00% E YReceiving - for the first page 2.00 2.00 0.00 0.00% E YReceiving - for each additional page 2.00 2.00 0.00 0.00% E YOverseas- sending & receiving 2.50 6.00 3.50 140.00% E YLaminatingSized Pouch 60mm x 95mm Per card 1.50 2.00 0.50 33.33% E YSized Pouch 216mm x 303mm Per A4 2.50 3.50 1.00 40.00% E YSized Pouch - 203mm x 426mm Per A3 4.50 5.00 0.50 11.11% E YLost and Damaged MaterialWhere information on the purchase cost is available, the replacementcost will be that price , plus a processing fee of 6.30 6.00 (0.30) -4.76% E YWhere purchase price is unavailable the cost shall be the default feefrom UHRL database, plus 6.30 6.00 (0.30) -4.76% E Y
Borrowers Cards and Barcode Labels 2.50 2.50 0.00 0.00% E YAdult Non -Fiction 58.80 58.80 0.00 0.00% E YAdult Fiction 58.80 58.80 0.00 0.00% E YAdult Paper backs 32.00 32.00 0.00 0.00% E Y
Large Print 53.10 53.10 0.00 0.00% E YHear - A - Books, per cassette 11.90 11.90 0.00 0.00% E YCassettes 17.00 17.00 0.00 0.00% E YCompact Discs 35.10 35.10 0.00 0.00% E YJunior Non-Fiction 37.15 37.15 0.00 0.00% E YYoung Adult and Junior Fiction 21.70 21.70 0.00 0.00% E YYoung Adult and Junior Paperbacks 16.00 16.00 0.00 0.00% E YEasies 32.00 32.00 0.00 0.00% E YMagazines 10.80 10.80 0.00 0.00% E YVideos 32.00 32.00 0.00 0.00% E YPosters 12.90 12.90 0.00 0.00% E YCD-ROM 37.15 37.15 0.00 0.00% E YDVD 40.25 40.25 0.00 0.00% E YILL Jackets 2.50 2.50 0.00 0.00% E YCD/DVD Cases 2.50 2.50 0.00 0.00% E Y
OverduesPer Item per day immediately it is overdue Per item per day n/a n/a N/A N/A E YProcessing Fee from second notice 4.00 4.00 0.00 0.00% E Y
PhotocopyingB/W, per copy A4 0.25 0.50 0.25 100.00% E YColour, per copy A4, (At HQ only) 1.30 1.20 (0.10) -7.69% E YB/W, per copy A3 0.40 1.60 1.20 300.00% E YColour, per copy A3, (At HQ only) 3.00 3.00 0.00 0.00% E Y
Public Access Computers - incl. Word ProcessingBooking Fee Per Hour 4.50 5.00 0.50 11.11% E Y
Per Half Hour 3.50 3.50 0.00 0.00% E YPer 15 minutes 2.50 2.50 0.00 0.00% E Y
Printing (Branch Charges) Per A4 Page of Text 0.25 0.50 0.25 100.00% E YPer A4 Page of Graphics/pictures- Colour 1.00 1.20 0.20 20.00% E Y
Binding Documents (at Scone only)A4 documents only Up to 25 Sheets 4.50 n/a n/a n/a E Y
Up to 50 Sheets 5.50 n/a n/a n/a E YUp to 100 Sheets 6.50 n/a n/a n/a E YUp to 145 sheets 7.00 n/a n/a n/a E YUp to 240 sheets 7.50 n/a n/a n/a E Y
14

2012/13 2013/14 change ($) change (%) Fee GST$ $ Type (Y/N)
FEES AND CHARGES SCHEDULE 1 July 2013 to 30 June 2014
Description of Fees and Charges
Book ReservationsAll books held in the Upper Hunter Library Network to be reserved
Per request 0.00 0.00 0.00 0.00% E Y
Inter-Library Loan Requests Per request 5.80 6.00 0.20 3.45% E YInter-Library Loan Requests Pensioners and School/ Uni Students,
per request2.40 3.00 0.60 25.00% E Y
ILRS Charges passed on when Library charged
Per Request 13.20 16.80 3.60 27.27% E Y
LOCAL ENVIRONMENT PLANScone LEP 1986 - booklet 25.00 30.00 5.00 20.00% E NAberdeen, Scone, villages, Shire plans - each 25.00 30.00 5.00 20.00% E NBooklet and each of the four plans - set 65.00 70.00 5.00 7.69% E NMurrurundi, complete set (plan plus maps) 80.00 85.00 5.00 6.25% E NMurrurundi, maps only - each 30.00 35.00 5.00 16.67% E NMurrurundi, gazetted plan 30.00 35.00 5.00 16.67% E NMerriwa, LEP certified certificate 40.00 45.00 5.00 12.50% E NMerriwa, printed LEP maps & written plan or electronic version 60.00 65.00 5.00 8.33% E NMerriwa, written plan only 25.00 30.00 5.00 20.00% E NDevelopment control plans 25.00 30.00 5.00 20.00% E NComprehensive Standard Instrument LEP 30.00
PHOTOCOPYING & PRINTING (ADMINISTRAION OFFICES)A4 size, B&W per copy single sided 0.70 0.75 0.05 7.14% D Y
per copy double sided 0.85 0.90 0.05 5.88% D Yper 50 copies 16.50 17.00 0.50 3.03% D Yper 50 copies double sided 22.00 23.00 1.00 4.55% D Y
A4 size, Colour per copy single sided (text & graphics) 3.00 3.20 0.20 6.67% D Y
per copy single sided (heavy graphics 8.00 8.40 0.40 5.00% D Y
per 50 copies (text & graphics) 70.00 72.00 2.00 2.86% D Yper 50 copies (heavy graphics) 175.00 180.00 5.00 2.86% D Y
A3 size, B&W per copy single sided 0.85 0.90 0.05 5.88% D Yper copy double sided 1.10 1.20 0.10 9.09% D Yper 50 copies 22.00 23.00 1.00 4.55% D Yper 50 copies double sided 28.00 29.00 1.00 3.57% D Y
A3 size, Colour per copy single sided (text & graphics) 5.00 5.40 0.40 8.00% D Y
per copy single sided (heavy graphics 13.00 14.00 1.00 7.69% D Y
per 50 copies (text & graphics) 115.00 120.00 5.00 4.35% D Yper 50 copies (heavy graphics) 300.00 310.00 10.00 3.33% D Y
PLAN COPYING (Plotter)A2 size, B&W per copy 4.00 4.20 0.20 5.00% D YA1 size, B&W per copy 7.50 7.75 0.25 3.33% D YA0 size, B&W per copy 10.00 10.50 0.50 5.00% D Y
15

2012/13 2013/14 change ($) change (%) Fee GST$ $ Type (Y/N)
FEES AND CHARGES SCHEDULE 1 July 2013 to 30 June 2014
Description of Fees and Charges
PLANT HIRE RATES
Per HourBackhoe 105.00 109.00 4.00 3.81% E YDozer 153.00 158.00 5.00 3.27% E YExcavator 137.00 142.00 5.00 3.65% E YGrader 137.00 142.00 5.00 3.65% E YKerb & Guttering Machine 90.00 93.00 3.00 3.33% E YLoader - rubber tyred 116.00 120.00 4.00 3.45% E YPrime Mover & Float per hour 100.00 103.00 3.00 3.00% E Y
per km both ways 2.00 2.07 0.07 3.40% E YRoller 107.00 111.00 4.00 3.74% E YSewer Viewer 69.00 71.00 2.00 2.90% E YSkid Steer Loader 79.00 82.00 3.00 3.80% E YTractor 70HP - bare 74.00 77.00 3.00 4.05% E YTractor 90HP - bare 90.00 93.00 3.00 3.33% E YSlasher 15.50 16.00 0.50 3.23% E YUtility per hour 47.50 49.00 1.50 3.16% E Y
per km both ways 0.65 0.67 0.02 3.40% E YTruck (2 tonne Crew Cab) per hour 49.50 51.00 1.50 3.03% E Y
per km both ways 0.80 0.83 0.03 3.40% E YTruck (3- 6 tonne Tippers and Crew Cabs) per hour 57.00 59.00 2.00 3.51% E Y
per km both ways 0.80 0.83 0.03 3.40% E YTruck (6 - 9 tonne Tippers) per hour 57.00 59.00 2.00 3.51% E Y
per km both ways 1.06 1.10 0.04 3.40% E YTruck (10 - 13 tonne Tippers) per hour 74.00 76.50 2.50 3.38% E Y
per km both ways 1.20 1.24 0.04 3.40% E YTruck and Dog (25 tonne) per hour 87.50 90.50 3.00 3.43% E Y
per km both ways 1.20 1.24 0.04 3.40% E YWater Snorter 61.00 63.00 2.00 3.28% E YWater Tanker 90.00 93.00 3.00 3.33% E YWorkshop Truck plus Mechanic 116.50 120.50 4.00 3.43% E YPlant Compliance Inspection 59.00 61.00 2.00 3.39% E YGrading Crew (already on site) - **Includes grader, roller and water cart 328.50 340.00 11.50 3.50% E YTar Patching Truck (includes 2 operators) per hour 201.00 208.00 7.00 3.48% E Y
per km both ways 1.20 1.24 0.04 3.40% E YStreet sweeper 116.00 120.00 4.00 3.45% E YHire of Generator Refundable Security Deposit 212.00 220.00 8.00 3.77% E NHire of shower/toilet block Refundable Security Deposit 210.00 215.00 5.00 2.38% E NHire of Mobile Shower/Toilet block per event 200.00 205.00 5.00 2.50% E Y
PRIVATE WORKSCommercial
ratesCommercial
RatesN/A N/A E Y
RATE ENQUIRIESSearch fee - per hour See "labour hire rates" 70.00 72.00 2.00 2.86% E YSearch fee - per hour (overtime) 100.00 100.00 0.00 0.00% E YSearch fee - minimum fee 35.00 35.00 0.00 0.00% E YComputer listing of assessments/ratepayers 122.00 122.00 0.00 0.00% D NSales register 62.00 62.00 0.00 0.00% D NMapInfo document thematically coloured maps, each 78.00 80.00 2.00 2.56% D Y
black and white maps, each 62.00 64.00 2.00 3.23% D Yin addition, a search fee applies 24.00 25.00 1.00 4.17% D Y
Copy of rate notice 5.00 5.00 0.00 0.00% D NInstalment notice 5.00 5.00 0.00 0.00% D NWater account 5.00 5.00 0.00 0.00% D NSundry debtor invoice 5.00 5.00 0.00 0.00% D YValuation search 5.00 5.00 0.00 0.00% D YValuation listings 190.00 200.00 10.00 5.26% D NInspection of Notices of Sale 5.00 5.00 0.00 0.00% D NInterest on overdue rates and charges 10.0% 9.0% 0.00% A NCourt attendance (staff) - see Labour Hire Rates Various Various N/A N/A E YLegal fees - as set out by Court House At Cost At Cost N/A N/A E Y
Idle and travelling time are charged at the rate of hire. (Note, all plant is hired with an operator)
Idle and travelling time are charged at the rate of hire. All plant is hired with an operator.These rates are for 'normal' time (7am - 4pm Mon - Fri). For hire outside these hours add $25 per hour for penalty rates. Rates are subject to variation.
16

2012/13 2013/14 change ($) change (%) Fee GST$ $ Type (Y/N)
FEES AND CHARGES SCHEDULE 1 July 2013 to 30 June 2014
Description of Fees and Charges
RESOURCE CENTRE (Merriwa)Computer access - Adult (per half hour) 3.00 3.00 0.00 0.00% D YComputer access - Adult (per hour) 5.00 5.00 0.00 0.00% D YComputer access - Children (per half hour) 2.50 2.50 0.00 0.00% D YComputer access - Children (per hour) 4.00 4.00 0.00 0.00% D YComputer access - Quick Jump (15 minutes) 2.50 2.50 0.00 0.00% D YComputer access - Child in School Holidays (2hr block) 4.00 4.00 0.00 0.00% D YCD writer staff assisted (per hour) 40.00 40.00 0.00 0.00% D YOne-on-one tuition (per hour) 55.00 55.00 0.00 0.00% D YBlack & white printing (see photocopying)Scanning - staff assisted (per page) 1.00 1.00 0.00 0.00% D YDisks & CD's CD-R 4.00 4.00 0.00 0.00% D YDisks & CD's CD-W 6.00 6.00 0.00 0.00% D YData ProjectorPer day 62.00 62.00 0.00 0.00% D YMinimum 3 hours 36.00 36.00 0.00 0.00% D YRefundable Security Deposit 100.00 100.00 0.00 0.00% D NDigital Camera Four hours hire 26.00 26.00 0.00 0.00% D YEight hours hire 50.00 50.00 0.00 0.00% D YRefundable Security Deposit 100.00 100.00 0.00 0.00% D NFacsimilesTo send Australia first page (then $0.80 per page thereafter)
2.50 2.50 0.00 0.00% D Y
To send overseas first page (then $0.80 per page thereafter)
6.00 6.00 0.00 0.00% D Y
To receive (per page) 0.90 0.90 0.00 0.00% D YLaminatingBusiness card size 2.00 2.00 0.00 0.00% D YA4 size 3.50 3.50 0.00 0.00% D YA3 size 5.00 5.00 0.00 0.00% D YFoils 3.50 3.50 0.00 0.00% D YPhotocopyingA4 (RC) paper (per page) (B & W) 0.50 0.50 0.00 0.00% D YA4 (RC) paper dbl sided (per page) (B & W) 0.70 0.70 0.00 0.00% D YA4 own paper (per page) (B & W) 0.40 0.40 0.00 0.00% D YA4 paper double sided (per page) (B & W) own paper 0.50 0.50 0.00 0.00% D YA4 (RC) paper (per page) (Colour) 1.20 1.20 0.00 0.00% D YA4 (RC) paper (per page) (Part Colour) 0.90 0.90 0.00 0.00% D YA4 (RC) paper double sided (part colour)(per page) 1.80 1.80 0.00 0.00% D YA3 (RC) paper double sided(B & W) (per page) 1.60 1.60 0.00 0.00% D YA3 (RC) paper double sided (colour)(per page) 2.30 2.30 0.00 0.00% D YA3 (RC) single sided (B&W)(per page) 1.00 1.00 0.00 0.00% D YA3 (RC) Single sided (Colour)(per page) 2.40 2.40 0.00 0.00% D YBulk photocopy over 50 sheets (per 50 pages)S/S 14.00 14.00 0.00 0.00% D YBulk photocopy over 50 sheets (per 50 pages) D/S 19.00 19.00 0.00 0.00% D YBulk photocopy over 50 sheets (per 50 pages) -Colour 50.00 50.00 0.00 0.00% D YBulk photocopy over 50 sheets (per 50 pages) -Colour D/S 70.00 70.00 0.00 0.00% D YPrintingColour Inkjet Printing A4 photo printing text only A4 0.90 0.90 0.00 0.00% D Y
text & graphics A4 3.50 0.90 (2.60) -74.29% D YLaminating - Own sheets A4 1.50 1.50 0.00 0.00% D Y
A3 2.50 2.50 0.00 0.00% D YPrinting - Own Paper A4 B&W single sided 0.40 0.40 0.00 0.00% D Y
A4 B&W double sided 0.90 0.90 0.00 0.00% D YA4 double side colour 1.60 1.60 0.00 0.00% D YA4 colour single sided 1.10 1.10 0.00 0.00% D Y
Training Room Hire (Room hire includes training facilities)Commercial (per hour) 40.00 40.00 0.00 0.00% D YCommunity groups (per hour) 15.00 15.00 0.00 0.00% D Y - half day 23.00 23.00 0.00 0.00% D Y - full day 34.00 34.00 0.00 0.00% D YTypingPer hour - customer to provide content & layout 40.00 40.00 0.00 0.00% D YWork involving layout and design (brochures etc) Quotes
providedQuotes
providedD Y
17

2012/13 2013/14 change ($) change (%) Fee GST$ $ Type (Y/N)
FEES AND CHARGES SCHEDULE 1 July 2013 to 30 June 2014
Description of Fees and Charges
ROADS & STREETSBore site - rent per annum 176.00 182.00 6.00 3.41% E YFootpath opening fee - Minimum 95.00 99.00 4.00 4.21% E YFootpath/road opening fee - Restoration At cost At cost E YRefundable Security Deposit - road opening 675.00 700.00 25.00 3.70% E NGravel road opening fee 200.00 210.00 10.00 5.00% E NSealed road opening fee - Minimum 350.00 365.00 15.00 4.29% E NGrids and gates - application fee, inspection and advertising 985.00 1,015.00 30.00 3.05% E YKerb, guttering and footpath - 45% of the cost of new work, s217
Roads Act, 199347.5%of
cost47.5%of cost E Y
Inspection of levels for layback & driveway construction (minimum) 155.00 160.00 5.00 3.23% E YLocal facility sign - annual charge 58.50 60.00 1.50 2.56% E YLocal facility sign - initial charge 176.00 180.00 4.00 2.27% E YPermanent closure & transfer of land title Cost + 40% Cost + 40% E YAdvertising permanent closure (minimum charge, actual costs charged) 352.00 365.00 13.00 3.69% E YTemporary Closure - advertising & signage Cost + 40% Cost + 40% E NTraffic Control Plans 350.00 Cost + 40% E YRoads repairs Cost + 40% Cost + 40% E YRoads Ancillary Install Kerb & Gutter Cost + 40% Cost + 40% E Y
Install Footpath Cost + 40% Cost + 40% E YSaw cutting Cost + 40% Cost + 40% E Y
Gutter Crossings/Pipe EntrancesInspection fee when Council not contractor
192.00 200.00 8.00 4.17% E Y
Reinspection fee 192.00 200.00 8.00 4.17% E Y
ROAD MATERIALSBombo dust - (ex pit) per cubic metre 1m³ = 2 tonne 30.00 31.50 1.50 5.00% E YBombo dust - (ex depot) per cubic metre 1m³ = 2 tonne 75.00 78.50 3.50 4.67% E YGravel - (ex pit stockpile) per cubic metre 1m³ = 2 tonne 17.50 18.10 0.59 3.40% E YPremix - (ex bin) per cubic metre 1m³ = 2.4 tonne 650.00 672.10 22.10 3.40% E YRoad metal 7mm Aggregate - (ex bin) per cubic 1m³ = 2.2 tonne cost + 20% cost+20% E YEmulsion - per litre (minimum 200L) 1.70 1.80 0.10 5.88% E YSubject to variation throughout the year due to variations in oil prices)
RURAL ADDRESSINGBacking plate Free Free N/A N/A E YIndividual numbers (each) Free Free N/A N/A E YCombined backing plate & up to 4 numbers Free Free N/A N/A E YPostage or delivery At cost At cost N/A N/A E Y
SALEYARDSYard dues Horses 3.85 4.00 0.15 3.90% E Y
Sheep 0.22 0.23 0.01 3.40% E YCattle 1.98 2.05 0.07 3.40% E YStud Cattle 4.42 4.57 0.15 3.40% E Y
Weighing fees - all cattle sold live weight 1.22 1.26 0.04 3.40% E YCapital Works Loan repayment fee per head 2.00 2.00 0.00 0.00% E YEuropean Union (EU) scanning fee - fat 2.45 2.53 0.08 3.40% E Y
- store 1.22 1.26 0.04 3.40% E YNLIS scanning fee - fat 1.35 1.40 0.05 3.40% E Y
- pre sale 0.35 0.40 0.05 14.29% E Y- store - per unit 1.35 1.40 0.05 3.40% E Y
Issue of emergency NLIS tags (each) 21.50 22.50 1.00 4.65% E YHire of portable scanner - per head 1.35 1.40 0.05 3.40% E YAgent selling fees Horses 1.81 1.87 0.06 3.40% E Y
Sheep 0.19 0.20 0.01 3.40% E YCattle 1.33 1.38 0.05 3.40% E YStud Cattle 2.13 2.20 0.07 3.40% E Y
Overnight Use of Saleyards Cattle per head 0.80 0.83 0.03 3.40% E YHorses per head 0.43 0.44 0.01 3.40% E Y
Special Weighings per head 1 to 99 3.94 4.07 0.13 3.40% E Yper head 100+ 3.04 3.14 0.10 3.40% E Y
Other charges Use of yards for assessing schools per day
74.50 77.00 2.50 3.36% E Y
Agents entry licence fee 6,734.00 6,960.00 226.00 3.36% E YTruck Wash per minute 0.44 0.45 0.01 3.40% E Y
minimum charge 4.40 4.50 0.10 2.27% E YIssue of truck wash key 50.00 50.00 100.00% E Y
Signage (fence panels/buildings)Large 400.00 415.00 15.00 3.75% E YSmall 145.00 150.00 5.00 3.45% E Y
Dead beast removal Transport & waste disposal fees 325.00 325.00 100.00% E Y
SEWERAGE - Aberdeen, Murrurundi, SconeConnection fee At private
works rateAt private
works rateN/A N/A E N
18

2012/13 2013/14 change ($) change (%) Fee GST$ $ Type (Y/N)
FEES AND CHARGES SCHEDULE 1 July 2013 to 30 June 2014
Description of Fees and Charges
Sewerage inspection (per inspection) 0.00 135.00 135.00 100.00% E NSeptic waste disposal at Scone Sewerage Treatment Works(waste accepted from Upper Hunter Shire area only) first 3 kilolitres (minimum charge) 43.50 45.24 1.74 4.00% E N each kilolitre thereafter per load 10.50 11.00 0.50 4.76% E NDisposal of bulk effluent at Merriwa Treatment Works 203.50 215.70 12.20 6.00% E NRecycled sewerage effluent (kl) 0.00 0.50 0.50 100.00% E NLiquid Trade WasteExcess Mass Charges for Category C Discharges (large volumes) per kgAcid Demand, pH>10 0.00 0.00 0.00 0.00% E NAlkali Demand, pH<7 0.00 0.00 0.00 0.00% E NAluminium 0.00 0.00 0.00 0.00% E NAmmonia (asN) 0.00 0.00 0.00 0.00% E NArsenic 70.00 72.10 2.10 3.00% E NBarium 35.00 36.05 1.05 3.00% E NBiochemical Oxygen Demand (BOD) 70.00 72.10 2.10 3.00% E NBoron 70.00 72.10 2.10 3.00% E NBromine 13.75 14.15 0.40 2.91% E NCadmium 320.00 329.60 9.60 3.00% E NChloride No Charge No Charge 0.00 0.00% E NChlorinated Hydrocarbons 35.00 36.05 1.05 3.00% E NChlorinated Phenolics 0.00 0.00 0.00 0.00% E NChlorine 1.40 1.40 0.00 0.00% E NChromium 23.00 23.70 0.70 3.04% E NCobalt 14.20 14.25 0.05 0.35% E NCopper 14.20 14.25 0.05 0.35% E NCyanide 69.50 71.10 1.60 2.30% E NFluoride 3.50 3.50 0.00 0.00% E NFormaldehyde 1.40 1.40 0.00 0.00% E NOil & Grease (Total O and G) 1.20 1.20 0.00 0.00% E NHerbicides / Defoliants 695.00 715.80 20.80 2.99% E NIron 1.40 1.40 0.00 0.00% E NLead 35.00 36.05 1.05 3.00% E NLithium 7.00 7.00 0.00 0.00% E NManganese 7.00 7.00 0.00 0.00% E NMercepians 70.00 72.10 2.10 3.00% E NMercury 2,315.00 2,372.80 57.80 2.50% E NMethylene Blue Active Substances (MBAS) 0.70 0.70 0.00 0.00% E NMolybdenum 0.70 0.70 0.00 0.00% E NNickel 23.00 23.70 0.70 3.04% E NNitrogen (as TKN - Total Kjeidahi Nitrogen) 0.20 0.20 0.00 0.00% E N
Organo arsenic Compounds 695.00 715.80 20.80 2.99% E NPesticides General (excludes organochlorins and organophosphates)
292.00 300.50 8.50 2.91% E N
Petroleum Hydrocarbons (non-flammable) 0.00 0.00 0.00 0.00% E NPhenolic Compounds (non-chlorinated) 7.00 7.00 0.00 0.00% E NPhosphorous (Total P) 1.40 1.40 0.00 0.00% E NPolynuclear Aromatic Hydrocarbons (PAHs) 14.00 14.10 0.10 0.71% E N
Selenium 49.00 50.45 1.45 2.96% E NSilver 2.00 2.00 0.00 0.00% E NSulphate (SO4) 0.10 0.10 0.00 0.00% E NSulphide 1.50 1.50 0.00 0.00% E NSulphite 1.50 1.50 0.00 0.00% E NSuspended Solids (SS) 0.90 0.90 0.00 0.00% E NThiosulphate 30.00 31.00 1.00 3.33% E NTin 7.00 7.00 0.00 0.00% E NTotal Dissolved Solids (TDS) 0.10 0.10 0.00 0.00% E NUranium 7.00 7.10 0.10 1.43% E NZinc 14.00 14.20 0.20 1.43% E NSewer junction inspection (per inspection) 0.00 125.00 125.00 100.00% E N
SEWERAGE PLANSAlterations to plans 117.00 121.00 4.00 3.42% E NCopy of prepaid plan (Water/Drainage diagram) 48.00 48.00 0.00 0.00% D N
19

2012/13 2013/14 change ($) change (%) Fee GST$ $ Type (Y/N)
FEES AND CHARGES SCHEDULE 1 July 2013 to 30 June 2014
Description of Fees and Charges
SPORTING FIELDS USER FEESIssue of keys to sporting bodies (2 sets) 30.00 31.00 1.00 3.33% E Y
Merriwa ShowgroundOther functions/sports where no gate charge (as per sports oval) 44.00 45.00 1.00 2.27% E YRefundable Security Deposit 220.00 228.00 8.00 3.64% E NFees for lights / power usage (casual hire) 33.00 34.00 1.00 3.03% E Y
Merriwa Sports OvalDaytime hire minimum fee all sports (Casual hire) 44.00 45.00 1.00 2.27% E YFees for lights / power usage (casual hire) 33.20 34.00 0.80 2.41% E YDaytime hire hourly fee fitness training (Casual hire) 15.50 16.00 0.50 3.23% E YRosedale Complex, MurrurundiRosedale ground users combined annual usage fee 1,120.00 1,160.00 40.00 3.57% E YRough riding or campdraft (arena/day) (for non-profit groups) 144.00 150.00 6.00 4.17% E Y
(for profit groups) 495.00 512.00 17.00 3.43% E YGround User Fees for Clover Leaf Cruisers 525.00 543.00 18.00 3.43% E YRosedale Complex - Designated AreasWhole area (excluding campdraft & rodeo arenas) - per day 197.00 204.00 7.00 3.55% E YPer designated area - per day 144.00 150.00 6.00 4.17% E Y
White Park, SconeArena UseRough riding or campdraft (arena/day) (for non-profit groups) 166.00 172.00 6.00 3.61% E Y
(for profit groups) 485.00 501.50 16.50 3.40% E YDressage arena (per horse, per day or part thereof) 12.50 13.00 0.50 4.00% E YDesignated AreasWhole area (excluding campdraft & rodeo arenas) - per day 197.00 204.00 7.00 3.55% E YPer designated area, or part thereof (Attachment 2) - per day 144.00 150.00 6.00 4.17% E YHire of chutes (per event) 2,500.00 2,500.00 100.00% E Y
Horse EventsAberdeen Pony club 543.00 562.00 19.00 3.50% E YAberdeen Bushman's and Roughriders Association (Annual) 330.00 341.00 11.00 3.33% E YMerriwa Pony Club 544.00 562.00 18.00 3.31% E YMerriwa PAH & I Exhibition and Bushmen's Carnival (Annual) 330.00 341.00 11.00 3.33% E YMurrurundi Pony Club 544.00 562.00 18.00 3.31% E YScone Campdraft & Rodeo Association 330.00 341.00 11.00 3.33% E YScone Grammar Horse Sports 990.00 1,023.00 33.00 3.33% E YScone Pony Club 202.00 209.00 7.00 3.47% E YUpper Hunter Dressage Club Scone 990.00 1,023.00 33.00 3.33% E YUpper Hunter Team Penning 544.00 562.00 18.00 3.31% E YCamping - associated with horse shows etc - overnight, per powered site 11.00 11.50 0.50 4.55% E Y
Sports GroundsHire of Council ground for non sporting events eg family fun day 55.00 57.00 2.00 3.64% E YRefundable Bond for Carnivals etc 544.00 562.00 18.00 3.31% E NOther Sports Associated FeesAberdeen Golf Club Lease Lease N/A N/A E YAberdeen Junior Cricket 330.00 341.00 11.00 3.33% E YAberdeen Junior Rugby League 495.00 512.00 17.00 3.43% E YAberdeen Little Athletics 495.00 512.00 17.00 3.43% E YAberdeen Senior Rugby League 2,248.00 2,324.00 76.00 3.38% E YAberdeen Tennis Club 550.00 569.00 19.00 3.45% E YMerriwa Junior Rugby League 494.00 510.00 16.00 3.24% E YMerriwa Little Athletics 494.00 510.00 16.00 3.24% E YMerriwa Netball 330.00 341.00 11.00 3.33% E YMerriwa Rugby Union 935.00 967.00 32.00 3.42% E YMerriwa Senior Cricket 330.00 341.00 11.00 3.33% E YMerriwa Senior Rugby League 935.00 967.00 32.00 3.42% E YMerriwa Tennis 550.00 569.00 19.00 3.45% E YMerriwa Touch Football Association - combined comp 615.00 635.00 20.00 3.25% E YMurrurundi Senior Cricket 330.00 341.00 11.00 3.33% E YMurrurundi Senior Rugby League 935.00 967.00 32.00 3.42% E YMurrurundi Tennis Club 550.00 569.00 19.00 3.45% E YMurrurundi Touch Football Association - Junior comp 507.00 524.00 17.00 3.35% E YMurrurundi Touch Football Association - Senior comp 2,587.00 2,675.00 88.00 3.40% E YScone Athletics Association 1,373.00 1,420.00 47.00 3.42% E YScone Basketball Association 768.00 794.00 26.00 3.39% E YScone Golf Club Lease Lease N/A N/A E YScone Junior Cricket 888.00 910.00 22.00 2.48% E YScone Junior Hockey 494.00 510.00 16.00 3.24% E YScone Junior Rugby League 965.00 998.00 33.00 3.42% E YScone Netball Association 1,648.00 1,704.00 56.00 3.40% E YScone Rugby Union (use of Scone Park amenities) 330.00 341.00 11.00 3.33% E Y
Where a user group is not listed below a fee is determined on a case by case basis.
20

2012/13 2013/14 change ($) change (%) Fee GST$ $ Type (Y/N)
FEES AND CHARGES SCHEDULE 1 July 2013 to 30 June 2014
Description of Fees and Charges
Scone Senior Cricket (Upper Hunter) 1,450.00 1,500.00 50.00 3.45% E YScone Senior Hockey 1,207.00 1,250.00 43.00 3.56% E YScone Senior Rugby League 2,250.00 2,324.00 74.00 3.29% E YScone Soccer Club 2,635.00 2,725.00 90.00 3.42% E YScone Tennis Club 1,098.00 1,135.00 37.00 3.37% E YScone Touch Football Association - Junior comp 1,498.00 1,550.00 52.00 3.47% E YScone Touch Football Association - senior comp 5,112.00 5,285.00 173.00 3.38% E YAll schools within Shire - per annumAll schools < 250 students within Shire - per annum 290.00 300.00 10.00 3.45% E YAll schools > 250 and < 500 students within Shire - per annum 394.00 408.00 14.00 3.55% E YAll schools >500 students within Shire - per annum 550.00 570.00 20.00 3.64% E Y
SWIMMING POOL ACTPool Posters 30.00 35.00 5.00 16.67% E YCertificate of compliance 70.00 70.00 0.00 0.00% A NSwimming pool inspection fee 150.00 150.00 100.00% A YSwimming pool re-inspection fee 100.00 100.00 100.00% A Y
SWIMMING POOL ENTRANCE FEESMerriwaCarers for Learner to Swim Classes free freeCasual entry 3.20 3.50 0.30 9.37% E YSpectator 1.60 1.70 0.10 6.25% E YSchool sport 2.00 2.10 0.10 5.00% E YPensioner - per entrance 2.00 2.10 0.10 5.00% E YPensioner Pass - per season 64.00 65.00 1.00 1.56% E YAdult Pass - per season 112.00 118.00 6.00 5.36% E YFamily Pass - per season 225.00 235.00 10.00 4.44% E YChild Pass (2 - 16 yrs inclusive) - per season 85.00 87.00 2.00 2.35% E YPool hire (eg carnivals/special events) 104.00 120.00 16.00 15.38% E YMurrurundiCarers for Learner to Swim Classes free* freeCasual entry 3.20 3.50 0.30 9.37% E YSpectator 1.60 1.70 0.10 6.25% E YSchool Sport 2.00 2.10 0.10 5.00% E YPensioner - per entrance 2.00 2.10 0.10 5.00% E YPensioner Pass - per season 64.00 65.00 1.00 1.56% E YAdult Pass - per season 112.00 118.00 6.00 5.36% E YFamily Pass - per season 185.00 195.00 10.00 5.41% E YChild Pass (2 - 16 yrs inclusive) - per season 85.00 87.00 2.00 2.35% E Y* subject to variation on lease agreementSconeCarers for Learner to Swim Classes free* freeCasual entry 3.20 3.50 0.30 9.37% E YSpectator - per entrance 1.60 1.70 0.10 6.25% E YSchool Sport 2.00 2.10 0.10 5.00% E YPensioner - per entrance 2.00 2.10 0.10 5.00% E YPensioner Pass - per season 64.00 65.00 1.00 1.56% E YSingle Pass - per season 112.00 118.00 6.00 5.36% E YFamily Pass - per season 225.00 235.00 10.00 4.44% E YChild Pass (2 - 16 yrs inclusive) - per season 85.00 87.00 2.00 2.35% E Y* subject to variation on lease agreement
TENDER DOCUMENTSCopies where value of tender less than $150,000;Electronic copy 0.00 0.00 0.00 0.00% E YHard copy 125.00 130.00 5.00 4.00% E YCopies where value of tender greater than $150,000;Electronic copy 0.00 0.00 0.00 0.00% E YHard copy 245.00 250.00 5.00 2.04% E Y
TRAFFIC CONTROL DEVICE HIRERefundable Security Deposit 300.00 310.00 10.00 3.33% E NBarricades including legs (each) 0.00 0.00 0.00 E NFlashing lights including batteries (each) 26.00 27.00 1.00 3.85% E NSigns (each) 48.00 49.50 1.50 3.13% E N
21

2012/13 2013/14 change ($) change (%) Fee GST$ $ Type (Y/N)
FEES AND CHARGES SCHEDULE 1 July 2013 to 30 June 2014
Description of Fees and Charges
WASTE DISPOSALFor residents within collection district only including replacement bins:Mobile garbage bin (MGB) (Red or Yellow Lid) 104.00 116.00 12.00 11.54% E YAdditional MGB collection, per occasion (other than scheduled collection) 9.50 10.50 1.00 10.53% E Y
WASTE MANAGEMENT - TIPPING FEES (UHSC LGA only) - with WCMR levyWaste from outside of LGA will not be acceptedClean fill - per tonne
Small VehiclesA - Car/Station Wagon $5.70 $6.50 0.80 14.04% E YB - Van/Ute/Trailer (6x4, single axle) $28.50 $32.50 4.00 14.04% E YB1- Trailer - dual axle $51.00 $55.75 4.75 9.31% E YOpen TrucksC - Single rear axle, two rear wheels (or four small rear)
$125.00 $154.00 29.00 23.20% E Y
D - Single rear axle, with four normal size wheels
$301.00 $367.00 66.00 21.93% E Y
E - Tandem rear axle (bogie drive) $439.00 $564.00 125.00 28.47% E YF - Twin steer with twin rear axles $546.00 $675.00 129.00 23.63% E YG - Tipping semi trailer $796.00 $973.00 177.00 22.24% E Y
Green Waste (Lawn clippings, tree prunings, straw)Small VehiclesA - Car/Station Wagon $6.00 $6.80 0.80 13.33% E YB - Van/Ute/Trailer (6x4, single axle) $17.00 $20.60 3.60 21.18% E YB1- Trailer - dual axle $22.00 $25.75 3.75 17.05% E YOpen TrucksC - Single rear axle, two rear wheels (or four small rear)
$70.00 $78.60 8.60 12.29% E Y
D - Single rear axle, with four normal size wheels
$108.00 $123.00 15.00 13.89% E Y
E - Tandem rear axle (bogie drive) $265.00 $311.50 46.50 17.55% E YF - Twin steer with twin rear axles $380.00 $449.00 69.00 18.16% E YG - Tipping semi trailer $425.00 $497.00 72.00 16.94% E Y
Construction & Demolition - Minimum 1/2 loadSmall VehiclesA - Car/Station Wagon $6.00 $6.80 0.80 13.33% E YB - Van/Ute/Trailer (6x4, single axle) $24.00 $27.85 3.85 16.04% E YB1- Trailer - dual axle $32.00 $36.00 4.00 12.50% E YOpen TrucksC - Single rear axle, two rear wheels (or four small rear)
$79.00 $91.50 12.50 15.82% E Y
D - Single rear axle, with four normal size wheels
$203.00 $237.50 34.50 17.00% E Y
E - Tandem rear axle (bogie drive) $455.00 $542.00 87.00 19.12% E YF - Twin steer with twin rear axles $499.00 $592.00 93.00 18.64% E YG - Tipping semi trailer $930.00 $1,112.00 182.00 19.57% E Y
Small VehiclesA - Car/Station Wagon $9.75 $10.70 0.95 9.74% E YB - Van/Ute/Trailer (6x4, single axle) $27.00 $31.00 4.00 14.81% E YB1- Trailer - dual axle $37.00 $41.25 4.25 11.49% E YMGB - per mobile garbage bin $9.75 $10.70 0.95 9.74% E YOpen TrucksC - Single rear axle, two rear wheels (or four small rear)
$98.00 $107.50 9.50 9.69% E Y
D - Single rear axle, with four normal size wheels
$178.00 $196.00 18.00 10.11% E Y
E - Tandem rear axle (bogie drive) $490.00 $544.00 54.00 11.02% E YF - Twin steer with twin rear axles $725.00 $805.00 80.00 11.03% E YG - Tipping semi trailer $742.00 $825.00 83.00 11.19% E Y
Compacted WasteH - single steer with single rear axle $448.00 $490.50 42.50 9.49% E YI - single steer with tandem rear axle $1,025.00 $1,124.00 99.00 9.66% E YJ - twin steer with tandem rear axles $1,190.00 $1,310.00 120.00 10.08% E YK - Waste Transfer Truck $3,155.00 $3,462.00 307.00 9.73% E Y
Mixed Waste/Compacted Commercial - Minimum 1/2 load - 20% discount if sorted on site
22

2012/13 2013/14 change ($) change (%) Fee GST$ $ Type (Y/N)
FEES AND CHARGES SCHEDULE 1 July 2013 to 30 June 2014
Description of Fees and Charges
AsbestosSmall VehiclesA - Car/Station Wagon $35.00 $36.80 1.80 5.14% E YB - Van/Ute/Trailer (6x4, single axle) $74.00 $80.00 6.00 8.11% E YB1- Trailer - dual axle $108.00 $115.00 7.00 6.48% E YMGB - per mobile garbage bin $35.00 $37.00 2.00 5.71% E YOpen TrucksC - Single rear axle, two rear wheels (or four small rear)
$352.00 $374.00 22.00 6.25% E Y
D - Single rear axle, with four normal size wheels
$718.00 $770.00 52.00 7.24% E Y
E - Tandem rear axle (bogie drive) $1,215.00 $1,328.00 113.00 9.30% E YF - Twin steer with twin rear axles $1,685.00 $1,818.00 133.00 7.89% E YG - Tipping semi trailer $2,860.00 $3,107.00 247.00 8.64% E Y(must meet Work Cover and EPA standards)(waste not accepted if non properly wrapped and transported)Penalty for not declaring and wrapping asbestos
$215.00 $222.50 7.50 3.49% E Y
Other WasteBattery 0.00 0.00 0.00 0.00%Recyclables sorted glass/plastic/metal containers 0.00 0.00 0.00 0.00%
commercial loads / loads larger than 1 mgb
0.00 0.00 0.00 0.00%
Clean scrap metal 0.00 0.00 0.00 0.00%Car bodies 0.00 0.00 0.00 0.00%Dead animals dog/cat 16.50 18.00 1.50 9.09% E Y
large dog/sheep/goat/pig 40.50 43.00 2.50 6.17% E Ycattle/horse (Aberdeen Only) - requiring burial
186.00 195.00 9.00 4.84% E Y
Refrigerators/air conditioners 24.00 25.00 1.00 4.17% E Ywith degassing certificate 11.50 12.00 0.50 4.35% E Y
Tyres - no commercial disposalscar 9.50 10.50 1.00 10.53% E Ysmall truck / large 4WD 21.00 25.00 4.00 19.05% E Ytruck 46.00 50.00 4.00 8.70% E Ytractor/loader Not
acceptedNot accepted
shredded (per m3) Notaccepted
Not accepted
Oil by volumeRural Tip Ticket 52 x 240 litre plus 1 trailer load 326.00 338.00 12.00 3.68% E Y
Sale of Items ( plus $50 jour loader fee if required)Shredded Mulch (m3) 14.00 15.75 1.75 12.50% E YStraw (m3) 18.00 19.50 1.50 8.33% E Y
Skip binsup to 2m3 65.00 70.00 5.00 7.69% E Y2m3 to 3m3 98.00 102.00 4.00 4.08% E Y3m3 to 4m3 131.00 136.00 5.00 3.82% E Y4m3 to 6m3 196.00 209.00 13.00 6.63% E Y6m3 to 8m3 262.00 282.50 20.50 7.82% E Y8m3 to 10m3 328.00 376.50 48.50 14.79% E Y10 m3 to 15m3 492.00 546.50 54.50 11.08% E Y15m3 to 20m3 656.00 736.00 80.00 12.20% E Y
23

2012/13 2013/14 change ($) change (%) Fee GST$ $ Type (Y/N)
FEES AND CHARGES SCHEDULE 1 July 2013 to 30 June 2014
Description of Fees and Charges
WASTE MANAGEMENT - TIPPING FEES (UHSC LGA only)- NO WCMR levyWaste from outside of LGA will not be acceptedClean fill - per tonne
Small VehiclesA - Car/Station Wagon $5.70 5.90 0.20 3.51% E YB - Van/Ute/Trailer (6x4, single axle) $28.50 29.50 1.00 3.51% E YB1- Trailer - dual axle $51.00 53.00 2.00 3.92% E YOpen Trucks 0.00C - Single rear axle, two rear wheels (or four small rear)
$125.00 130.00 5.00 4.00% E Y
D - Single rear axle, with four normal size wheels
$301.00 310.00 9.00 2.99% E Y
E - Tandem rear axle (bogie drive) $439.00 455.00 16.00 3.64% E YF - Twin steer with twin rear axles $546.00 565.00 19.00 3.48% E YG - Tipping semi trailer $796.00 825.00 29.00 3.64% E Y
Green Waste (Lawn clippings, tree prunings, straw)Small VehiclesA - Car/Station Wagon $6.00 6.20 0.20 3.33% E YB - Van/Ute/Trailer (6x4, single axle) $17.00 17.50 0.50 2.94% E YB1- Trailer - dual axle $22.00 23.00 1.00 4.55% E YOpen TrucksC - Single rear axle, two rear wheels (or four small rear)
$70.00 72.50 2.50 3.57% E Y
D - Single rear axle, with four normal size wheels
$108.00 112.00 4.00 3.70% E Y
E - Tandem rear axle (bogie drive) $265.00 275.00 10.00 3.77% E YF - Twin steer with twin rear axles $380.00 393.00 13.00 3.42% E YG - Tipping semi trailer $425.00 440.00 15.00 3.53% E Y
Construction & Demolition - Minimum 1/2 loadSmall VehiclesA - Car/Station Wagon $6.00 6.20 0.20 3.33% E YB - Van/Ute/Trailer (6x4, single axle) $24.00 25.00 1.00 4.17% E YB1- Trailer - dual axle $32.00 33.00 1.00 3.13% E YOpen TrucksC - Single rear axle, two rear wheels (or four small rear)
$79.00 82.00 3.00 3.80% E Y
D - Single rear axle, with four normal size wheels
$203.00 210.00 7.00 3.45% E Y
E - Tandem rear axle (bogie drive) $455.00 470.00 15.00 3.30% E YF - Twin steer with twin rear axles $499.00 516.00 17.00 3.41% E YG - Tipping semi trailer $930.00 962.00 32.00 3.44% E Y
Small VehiclesA - Car/Station Wagon $9.75 10.00 0.25 2.56% E YB - Van/Ute/Trailer (6x4, single axle) $27.00 28.00 1.00 3.70% E YB1- Trailer - dual axle $37.00 38.00 1.00 2.70% E YMGB - per mobile garbage bin $9.75 10.00 0.25 2.56% E YOpen TrucksC - Single rear axle, two rear wheels (or four small rear)
$98.00 101.00 3.00 3.06% E Y
D - Single rear axle, with four normal size wheels
$178.00 184.00 6.00 3.37% E Y
E - Tandem rear axle (bogie drive) $490.00 507.00 17.00 3.47% E YF - Twin steer with twin rear axles $725.00 750.00 25.00 3.45% E YG - Tipping semi trailer $742.00 767.00 25.00 3.37% E Y
Compacted WasteH - single steer with single rear axle $448.00 463.00 15.00 3.35% E YI - single steer with tandem rear axle $1,025.00 1,060.00 35.00 3.41% E YJ - twin steer with tandem rear axles $1,190.00 1,230.00 40.00 3.36% E YK - Waste Transfer Truck $3,155.00 3,263.00 108.00 3.42% E Y
AsbestosSmall VehiclesA - Car/Station Wagon $35.00 35.20 0.20 0.57% E YB - Van/Ute/Trailer (6x4, single axle) $74.00 76.50 2.50 3.38% E YB1- Trailer - dual axle $108.00 112.00 4.00 3.70% E YMGB - per mobile garbage bin $35.00 36.00 1.00 2.86% E Y
Mixed Waste/Compacted Commercial - Minimum 1/2 load - 20% discount if sorted on site
24

2012/13 2013/14 change ($) change (%) Fee GST$ $ Type (Y/N)
FEES AND CHARGES SCHEDULE 1 July 2013 to 30 June 2014
Description of Fees and Charges
Open Trucks 0.00C - Single rear axle, two rear wheels (or four small rear)
$352.00 364.00 12.00 3.41% E Y
D - Single rear axle, with four normal size wheels
$718.00 742.00 24.00 3.34% E Y
E - Tandem rear axle (bogie drive) $1,215.00 1,256.00 41.00 3.37% E YF - Twin steer with twin rear axles $1,685.00 1,742.00 57.00 3.38% E YG - Tipping semi trailer $2,860.00 2,958.00 98.00 3.43% E Y(must meet Work Cover and EPA standards)(waste not accepted if non properly wrapped and transported)Penalty for not declaring and wrapping asbestos
$215.00 222.50 7.50 3.49% E Y
Other WasteBattery 0.00 0.00 0.00 0.00% E YRecyclables sorted glass/plastic/metal containers 0.00 0.00 0.00 0.00% E Y
commercial loads / loads larger than 1 mgb
0.00 0.00 0.00 0.00% E Y
Clean scrap metal 0.00 0.00 0.00 0.00% E YCar bodies 0.00 0.00 0.00 0.00% E YDead animals dog/cat 16.50 17.00 0.50 3.03% E Y
large dog/sheep/goat/pig 40.50 42.00 1.50 3.70% E Ycattle/horse (Aberdeen Only) - requiring burial
186.00 192.00 6.00 3.23% E Y
Refrigerators/air conditioners 24.00 25.00 1.00 4.17% E Ywith degassing certificate 11.50 12.00 0.50 4.35% E Y
Tyres - no commercial disposals 0.00 0.00% E Ycar 9.50 10.00 0.50 5.26% E Ysmall truck / large 4WD 21.00 22.00 1.00 4.76% E Ytruck 46.00 50.00 4.00 8.70% E Ytractor/loader Not
acceptedshredded (per m3) Not
acceptedOil by volumeRural Tip Ticket 52 x 240 litre plus 1 trailer load 326.00 338.00 12.00 3.68% E Y
Sale of Items ( plus $50 jour loader fee if required) 0.00Shredded Mulch (m3) 14.00 14.50 0.50 3.57% E YStraw (m3) 18.00 19.00 1.00 5.56% E Y
Skip binsup to 2m3 65.00 70.00 5.00 7.69% E Y2m3 to 3m3 98.00 102.00 4.00 4.08% E Y3m3 to 4m3 131.00 136.00 5.00 3.82% E Y4m3 to 6m3 196.00 209.00 13.00 6.63% E Y6m3 to 8m3 262.00 282.50 20.50 7.82% E Y8m3 to 10m3 328.00 376.50 48.50 14.79% E Y10 m3 to 15m3 492.00 546.50 54.50 11.08% E Y15m3 to 20m3 656.00 736.00 80.00 12.20% E Y
25

2012/13 2013/14 change ($) change (%) Fee GST$ $ Type (Y/N)
FEES AND CHARGES SCHEDULE 1 July 2013 to 30 June 2014
Description of Fees and Charges
WATER SUPPLYConnections 20mm including meter (standard) 926.00 958.00 32.00 3.46% E N
25 mm including meter 1,298.00 1,345.00 47.00 3.62% E N32 mm including meter 3,099.00 3,205.00 106.00 3.42% E N40 mm including meter 3,855.00 3,986.00 131.00 3.40% E N50 mm including meter 4,375.00 4,525.00 150.00 3.43% E NNon standard connections Private
Work RatesPrivate Work
RatesN/A N/A E N
Costs may be subject to private works rate depending on inspectionsRoad crossings required 4,875.00 4,875.00 0.00 0.00% E N
Larger sizes - price on application 156.0020mm water meter only 150.00 190.00 40.00 26.67% E NMeter testing (refundable if defective) 190.00 57.50 (132.50) -69.74% E NWater meter reading fee 55.50 57.20 1.70 3.06% E NRe-reading of meter (refundable if original reading error) 55.50 57.20 1.70 3.06% E NDisconnection of meter 0.00 0.00 0.00 0.00% E NReplacement of meter damaged by ratepayer Private
Work RatesPrivate Work
RatesNA NA E N
Water standpipe - Refundable key deposit 67.50 69.50 2.00 2.96% E NWater standpipe - water (per kilolitre) - (minimum charge $15) 1.50 2.28 0.78 52.00% E NEffluent water standpipe - annual licence fee 0.00 0.00 0.00 0.00% E NEffluent water standpipe - effluent water (per kilolitre) 0.00 1.55 1.55 100.00% E NAnnual Licence - metered hydrant for Domestic Purposes 358.50 358.50 0.00 0.00% E N
Usage Charge - $/kl 0.00 0.00 0.00 0.00% E NFire Flow test 155.50 159.60 4.10 2.64% E NRestrictor charge (includes both installation & removal) 102.50 105.60 3.10 3.02% E N
YOUTH SERVICES
Entry Fees - SconeAnnual membership 10.00 10.00 0.00 0.00% D YMembers - per session 1.00 1.00 0.00 0.00% D YNon-members - per session 4.00 4.00 0.00 0.00% D YEntry Fees - MurrurundiAnnual membership 10.00 10.00 0.00 0.00% D YMembers - per session 1.00 1.00 0.00 0.00% D YEntry Fees - MerriwaAnnual membership 10.00 10.00 0.00 0.00% D YMembers - per session 1.00 1.00 0.00 0.00% D Y
26

ATT
AC
HM
EN
T 2
AC
CES
S &
EQ
UIT
Y A
CTI
VITY
STA
TEM
ENT
(REF
ER T
O S
ECTI
ON
2.8
)
Acc
ess
and
Equi
ty a
ctiv
ities
are
any
act
iviti
es th
at a
im to
pro
mot
e so
cial
just
ice
and
enha
nce
com
mun
ity w
ellb
eing
.
An
acce
ss a
nd e
quity
act
ivity
is d
efin
ed a
s on
e th
at a
ssis
ts C
ounc
il to
:
Pro
mot
e fa
irnes
s in
the
dist
ribut
ion
of re
sour
ces,
par
ticul
arly
for t
hose
mos
t in
need
;
Rec
ogni
se a
nd p
rom
ote
peop
le’s
righ
ts a
nd im
prov
e th
e ac
coun
tabi
lity
of d
ecis
ion
mak
ers;
Ens
ure
that
peo
ple
have
faire
r acc
ess
to th
e ec
onom
ic re
sour
ces
and
serv
ices
ess
entia
l to
mee
ting
thei
r bas
ic n
eeds
and
impr
ovin
g th
eir q
ualit
y of
life
; and
,
Giv
e pe
ople
bet
ter o
ppor
tuni
ties
for g
enui
ne p
artic
ipat
ion
and
cons
ulta
tion
abou
t dec
isio
ns a
ffect
ing
thei
r liv
es.
Act
ions
to m
eet t
hese
sta
tem
ents
are
iden
tifie
d on
an
annu
al b
asis
. The
se a
ctio
ns w
ill va
ry a
ccor
ding
to a
cces
s an
d eq
uity
issu
es id
entif
ied
by th
e co
mm
unity
, and
by
Cou
ncil
staf
f, an
d in
line
with
the
reso
urce
cap
abilit
y of
the
orga
nisa
tion
to a
ddre
ss th
em.
Add
ress
ing
acce
ss a
nd e
quity
requ
ires
an o
ngoi
ng p
roce
ss re
spon
sive
to c
omm
unity
nee
ds.
PLA
NN
ED A
CC
ESS
& E
QU
ITY
AC
TIVI
TY
OB
JEC
TIVE
S PE
RFO
RM
AN
CE
TAR
GET
/TIM
EFR
AM
E R
ESPO
NSI
BIL
ITY
Acc
ess
and
equi
ty
activ
ities
w
ill
be
incl
uded
in
th
e ob
ject
ives
an
d /
or
perfo
rman
ce i
ndic
ator
s fo
r ea
ch p
art
of
the
Del
iver
y P
rogr
am
and
Ope
ratio
nal
Plan
and
rep
orte
d on
at
the
end
of e
ach
finan
cial
yea
r (s
ee D
eliv
ery
Pro
gram
and
O
pera
tiona
l Pla
n, s
ectio
n 2.
8).
To
enco
urag
e a
“who
le
of
Cou
ncil”
ap
proa
ch t
o ad
dres
sing
acc
ess
and
equi
ty
issu
es.
Cou
ncil’
s So
cial
/Com
mun
ity P
lan
2006
- 20
09 in
clud
es a
cces
s an
d eq
uity
ac
tivity
st
atem
ents
w
hich
ar
e su
bseq
uent
ly
inco
rpor
ated
into
the
annu
al D
eliv
ery
Prog
ram
and
Ope
ratio
nal
Pla
n an
d in
eac
h re
leva
nt fu
nctio
n.
Cor
pora
te S
ervi
ces
Dep
artm
ent,
Env
ironm
enta
l Ser
vice
s D
epar
tmen
t,
Tech
nica
l Ser
vice
s D
epar
tmen
t
Con
sulta
tion
is h
eld
with
the
com
mun
ity
rega
rdin
g th
e al
loca
tions
and
pro
pose
d ex
pend
iture
, fee
s an
d ch
arge
s of
Cou
ncil
as d
evel
oped
in it
s D
eliv
ery
Prog
ram
and
O
pera
tiona
l Pla
n (s
ectio
n 1.
3).
That
the
gen
eral
com
mun
ity,
incl
usiv
e of
th
e ta
rget
gro
ups
such
as
Abor
igin
al a
nd
Torre
s S
trait
Isla
nder
s, C
hild
ren,
Cul
tura
lly
and
lingu
istic
ally
di
vers
e,
Old
er
peop
le,
Peo
ple
with
a d
isab
ility,
is c
onsu
lted.
The
com
mun
ity i
s co
nsul
ted
rega
rdin
g th
e al
loca
tions
and
pr
opos
ed
expe
nditu
re,
fees
an
d ch
arge
s of
C
ounc
il as
de
velo
ped
in it
s D
eliv
ery
Prog
ram
and
Ope
ratio
nal P
lan.
(A
pril
– M
ay, f
our d
iffer
ent l
ocal
ities
).
Cor
pora
te S
ervi
ces
Dep
artm
ent
Upd
ate
the
Com
mun
ity P
lan
iden
tifyi
ng
com
mun
ity
need
s an
d st
rate
gies
to
ad
dres
s th
ose
need
s (s
ectio
ns 1
.5.2
, 4.2
).
To p
rovi
de a
nd/o
r adv
ocat
e fo
r app
ropr
iate
, ac
cess
ible
ser
vice
s an
d fa
cilit
ies
for
the
bene
fit o
f the
com
mun
ity.
A
sect
ion
of
the
Soc
ial/C
omm
unity
P
lan
2006
-
2009
is
re
view
ed
by
the
Com
mun
ity
Dev
elop
men
t C
omm
ittee
, up
date
d, a
nd a
ctio
n im
plem
ente
d as
nec
essa
ry.
Upd
ated
com
mun
ity p
lan
pres
ente
d to
Cou
ncil
annu
ally
.
Com
mun
ity S
ervi
ces
Div
isio
n
Est
ablis
h fu
ndin
g m
etho
ds f
or s
trate
gies
id
entif
ied
in th
e C
omm
unity
Pla
n (s
ectio
ns
4.2)
.
To p
rovi
de a
nd/o
r adv
ocat
e fo
r app
ropr
iate
, ac
cess
ible
ser
vice
s an
d fa
cilit
ies
for
the
bene
fit o
f the
com
mun
ity.
Opp
ortu
nitie
s fo
r fu
ndin
g ar
e in
vest
igat
ed a
nd in
corp
orat
ed in
th
e an
nual
Del
iver
y Pr
ogra
m a
nd O
pera
tiona
l Pl
anni
ng a
nd
budg
etar
y pr
oces
ses
(Mar
ch)
Com
mun
ity S
ervi
ces
Div
isio
n

PLA
NN
ED A
CC
ESS
& E
QU
ITY
AC
TIVI
TY
OB
JEC
TIVE
S PE
RFO
RM
AN
CE
TAR
GET
/TIM
EFR
AM
E R
ESPO
NSI
BIL
ITY
Cou
ncil
cont
inue
s to
pro
vide
; re
side
ntia
l ag
ed
care
se
rvic
es
in
Mer
riwa,
an
d in
depe
nden
t liv
ing
units
in
Mer
riwa
and
Mur
ruru
ndi (
sect
ions
1.5
.2, 4
.2).
To
prov
ide
and
prom
ote
acce
ss
to
appr
opria
te,
affo
rdab
le
and
acce
ssib
le
acco
mm
odat
ion
for
olde
r pe
ople
an
d pe
ople
w
ith
a di
sabi
lity
livin
g in
th
e co
mm
unity
.
Perc
enta
ge
of
room
s oc
cupi
ed
at
Gum
mun
Pl
ace
Hos
tel,
Mer
riwa
– 98
% p
er a
nnum
. Pe
rcen
tage
of
inde
pend
ent
livin
g un
its o
ccup
ied
at M
erriw
a an
d M
urru
rund
i - 9
5% p
er a
nnum
.
Com
mun
ity S
ervi
ces
Div
isio
n
Ens
ure
that
all
staf
f ar
e em
ploy
ed u
nder
E
qual
Em
ploy
men
t Opp
ortu
nity
legi
slat
ion
(sec
tion
4.2,
Hum
an R
esou
rces
).
Job
appl
ican
ts w
ith C
ounc
il ar
e tre
ated
in a
fa
ir an
d eq
uita
ble
way
reg
ardl
ess
of a
ge,
gend
er, r
ace,
etc
.
Hum
an
Res
ourc
es
Offi
cer
mon
itors
th
e re
crui
tmen
t an
d in
duct
ion
proc
esse
s of
Cou
ncil
(ong
oing
). C
orpo
rate
Ser
vice
s D
epar
tmen
t
Pro
vide
inc
reas
ed a
cces
s to
inf
orm
atio
n ab
out
serv
ices
and
fac
ilitie
s pr
ovid
ed b
y C
ounc
il vi
a its
w
ebsi
te
(sec
tion
4.2,
In
form
atio
n S
ervi
ces)
.
The
gene
ral
com
mun
ity
can
acce
ss
rele
vant
info
rmat
ion
via
Cou
ncil’s
web
site
. An
in
crea
se
of
info
rmat
ion
prov
ided
by
re
leva
nt
Cou
ncil
depa
rtmen
ts i
s ac
cess
ible
to
the
com
mun
ity v
ia i
ts w
ebsi
te
(ong
oing
).
Cor
pora
te S
ervi
ces
Dep
artm
ent,
Env
ironm
enta
l Ser
vice
s D
epar
tmen
t,Te
chni
cal S
ervi
ces
Dep
artm
ent
Cou
ncil
reco
rds
are
acce
ssib
le
to
the
com
mun
ity
thro
ugh
the
Gov
ernm
ent
Info
rmat
ion
Pub
lic
Acc
ess
Act
(s
ectio
n 4.
2, C
orpo
rate
Ser
vice
s).
The
gene
ral
com
mun
ity
can
acce
ss
Cou
ncil
reco
rds
and
info
rmat
ion
in
acco
rdan
ce w
ith th
e re
leva
nt le
gisl
atio
n.
Publ
ic
Info
rmat
ion
requ
ests
ar
e pr
oces
sed
acco
rdin
g to
pr
oced
ure
(ong
oing
).
Cor
pora
te S
ervi
ces
Dep
artm
ent
Pro
vide
a
com
mun
ity
dire
ctor
y th
at
prom
otes
the
ser
vice
s av
aila
ble
to t
he
com
mun
ity.
(sec
tion
4.2,
C
omm
unity
S
ervi
ces
& E
duca
tion,
Adm
inis
tratio
n)
To i
mpr
ove
acce
ss o
f in
form
atio
n to
the
ge
nera
l co
mm
unity
as
w
ell
as
spec
ific
targ
et
grou
ps
such
as
A
borig
inal
an
d To
rres
Stra
it Is
land
ers,
Chi
ldre
n, C
ultu
rally
an
d lin
guis
tical
ly d
iver
se, O
lder
peo
ple,
and
Pe
ople
with
a d
isab
ility
.
Com
mun
ity D
irect
ory
avai
labl
e on
Cou
ncil’
s w
ebsi
te a
nd i
s re
view
ed a
nnua
lly (o
ngoi
ng).
Com
mun
ity S
ervi
ces
Div
isio
n
Dis
abilit
y Ac
tion
Plan
dev
elop
ed (
sect
ion
4.2,
C
omm
unity
S
ervi
ces
&
Edu
catio
n,
Adm
inis
tratio
n).
To p
rovi
de a
pla
n th
at a
ssis
ts p
eopl
e w
ith a
di
sabi
lity
to a
cces
s th
e re
leva
nt s
ervi
ces
in
the
com
mun
ity.
Dis
abilit
y Ac
cess
Ac
tion
Plan
ad
opte
d by
th
e S
enio
r M
anag
emen
t G
roup
in
Ja
nuar
y 20
08,
impl
emen
ted,
an
d up
date
d an
nual
ly (o
ngoi
ng).
Com
mun
ity S
ervi
ces
Div
isio
n
Kee
p ab
reas
t of i
ssue
s as
soci
ated
with
an
agei
ng
popu
latio
n (s
ectio
n 4.
2,
Com
mun
ity
Ser
vice
s &
E
duca
tion,
A
dmin
istra
tion)
.
Enco
urag
e ap
prop
riate
pla
nnin
g fo
r fu
ture
he
alth
and
wel
fare
ser
vice
s pr
ovid
ed f
or
olde
r pe
ople
and
peo
ple
with
a d
isab
ility
livin
g in
the
com
mun
ity
Atte
nd H
unte
r C
ounc
il’s
Com
mun
ity D
evel
opm
ent
and
Soc
ial
Plan
ning
Tea
m w
orki
ng p
arty
mee
tings
on
Age
ing
and
Plac
e to
de
velo
p a
wor
king
doc
umen
t for
Hun
ter C
ounc
ils (o
ngoi
ng).
Com
mun
ity S
ervi
ces
Div
isio
n
Com
mun
ity S
ervi
ces
staf
f ar
e aw
are
of
serv
ices
ava
ilabl
e to
resi
dent
s of
the
loca
l go
vern
men
t are
a (s
ectio
n 4.
2, C
omm
unity
S
ervi
ces
& E
duca
tion,
Adm
inis
tratio
n)
Info
rmat
ion
abou
t av
aila
ble
serv
ices
is
ac
cess
ible
for c
hild
ren,
you
ng p
eopl
e, o
lder
pe
ople
, w
omen
, pe
ople
with
a d
isab
ility,
A
borig
inal
an
d To
rres
Stra
it Is
land
ers,
cu
ltura
lly a
nd li
ngui
stic
ally
div
erse
.
Net
wor
k/R
egio
nal
(incl
U
pper
H
unte
r In
tera
genc
y,
You
th
Net
wor
k,
Age
d an
d D
isab
ility
N
etw
ork
mee
tings
) at
tend
ed
annu
ally
- 12
. In
form
atio
n re
leva
nt to
the
com
mun
ity is
ava
ilabl
e pr
ovid
ed in
C
ounc
il of
fice
front
co
unte
r ar
eas,
Y
outh
C
entre
s,
Upp
er
Hun
ter
Fam
ily D
ay C
are
and
Scon
e O
ut o
f Sc
hool
Hou
rs
Ser
vice
s.
Com
mun
ity S
ervi
ces
Div
isio
n

PLA
NN
ED A
CC
ESS
& E
QU
ITY
AC
TIVI
TY
OB
JEC
TIVE
S PE
RFO
RM
AN
CE
TAR
GET
/TIM
EFR
AM
E R
ESPO
NSI
BIL
ITY
Com
mun
ity
Dev
elop
men
t C
omm
ittee
m
eetin
gs h
eld
mon
thly
w
ith c
omm
unity
re
pres
enta
tion
(sec
tion
4.2,
C
omm
unity
S
ervi
ces
& E
duca
tion,
Adm
inis
tratio
n).
Feed
back
pr
ovid
ed
to
Cou
ncil
abou
t co
mm
unity
issu
es.
Min
utes
of m
eetin
gs c
onsi
dere
d by
Cou
ncil
(ong
oing
). C
omm
unity
Ser
vice
s D
ivis
ion
Pro
vide
equ
itabl
e ac
cess
to
Fam
ily D
ay
Car
e, l
ong
day
care
and
Out
of
Scho
ol
Hou
rs s
ervi
ces
subj
ect
to a
vaila
bilit
y of
ca
rers
(se
ctio
n 4.
2, C
omm
unity
Ser
vice
s &
Edu
catio
n, F
amily
Day
Car
e, E
LC &
S
OO
SH
).P
rovi
de
supp
ort
to
pres
choo
ls
(sec
tion
4.2,
C
omm
unity
S
ervi
ces
&
Edu
catio
n,
Adm
inis
tratio
n)
To p
rovi
de a
cces
s to
qua
lity
and
affo
rdab
le
child
care
for c
hild
ren.
An
ave
rage
of 3
0 ca
rers
are
ava
ilabl
e an
d pr
ovid
e se
rvic
es.
SO
OS
H p
rovi
des
both
Bef
ore
Sch
ool
& A
fter
Sch
ool
and
Vaca
tion
Car
e (o
ngoi
ng).
Early
Lea
rnin
g C
entre
pro
vide
s lo
ng
day
care
fac
ilitie
s an
d Fa
mily
Day
Car
e pr
ovid
es c
hild
car
e fa
cilit
ies.
Com
mun
ity S
ervi
ces
Div
isio
n
Arti
cles
ab
out
com
mun
ity
serv
ices
pu
blis
hed
in
com
mun
ity
new
slet
ters
. (s
ectio
n 4.
2,
Com
mun
ity
Ser
vice
s &
E
duca
tion,
Oth
er F
amilie
s &
Chi
ldre
n)
Incr
ease
aw
aren
ess
of s
ervi
ces
avai
labl
e to
chi
ldre
n, y
oung
peo
ple,
old
er p
eopl
e,
wom
en,
peop
le w
ith a
dis
abilit
y, p
eopl
e of
ab
orig
inal
an
d To
rres
stra
it is
land
er
desc
ent,
peop
le
from
cu
ltura
lly
and
lingu
istic
ally
div
erse
bac
kgro
unds
.
No
of
med
ia
rele
ases
, fly
ers,
ad
verti
sem
ents
, po
ster
s de
velo
ped
for c
omm
unity
info
rmat
ion
– 50
per
ann
um.
Cor
pora
te S
ervi
ces
Dep
artm
ent,
Com
mun
ity S
ervi
ces
Div
isio
n
Hol
d S
enio
rs W
eek
activ
ities
thr
ough
out
LGA
(se
ctio
n 4.
2, C
omm
unity
Ser
vice
s &
E
duca
tion,
Oth
er F
amili
es &
Chi
ldre
n).
To
prom
ote
the
cont
ribut
ions
to
th
e co
mm
unity
mad
e by
old
er p
eopl
e.
Sen
iors
Wee
k ac
tiviti
es h
eld
Mar
ch –
Apr
il (o
ngoi
ng)
Com
mun
ity S
ervi
ces
Div
isio
n
Tran
spor
t op
tions
are
pro
mot
ed t
o th
e co
mm
unity
an
d su
ppor
ted
by
Cou
ncil.
(s
ectio
n 4.
2,
Com
mun
ity
Ser
vice
s &
E
duca
tion,
Oth
er F
amilie
s &
Chi
ldre
n)
Adv
ocat
e fo
r th
e av
aila
bilit
y of
tra
nspo
rt se
rvic
es f
or o
lder
peo
ple,
Peo
ple
with
a
disa
bilit
y, y
oung
peo
ple
and
thos
e w
ho a
re
geog
raph
ical
ly is
olat
ed.
Com
mun
ity S
ervi
ces
staf
f at
tend
the
Upp
er H
unte
r Tr
ansp
ort
wor
king
gro
up (o
ngoi
ng).
Com
mun
ity S
ervi
ces
Div
isio
n
Yout
h C
entre
s ar
e ac
cess
ible
to
youn
g pe
ople
in
the
com
mun
ity.
(sec
tion
4.2,
C
omm
unity
Ser
vice
s &
Edu
catio
n, Y
outh
S
ervi
ces)
Plan
and
dev
elop
a r
ange
of
com
mun
ity
serv
ices
whi
ch r
espo
nd t
o th
e ne
eds
of
youn
g pe
ople
in th
e Sh
ire.
Coo
rdin
ate
You
th F
orum
(bia
nnua
lly, s
ubje
ct to
fund
ing)
. Pr
ovid
e m
ento
rshi
p op
portu
nitie
s to
yo
ung
peop
le
thro
ugh
yout
h gr
oups
(Sco
ne B
oom
eran
g, M
erriw
a M
AD
) Y
outh
repr
esen
tativ
e C
omm
unity
Dev
elop
men
t Com
mitt
ee
You
th
Cen
tres
(Mer
riwa,
M
urru
rund
i &
S
cone
) op
ened
ac
cess
ible
hou
rs
Tran
spor
t opt
ions
for
Aber
deen
you
ng p
eopl
e to
atte
nd S
cone
Y
outh
Cen
tre a
re in
vest
igat
ed.
Cor
pora
te S
ervi
ces
Dep
artm
ent,
Com
mun
ity S
ervi
ces
Div
isio
n
Supp
ort a
rang
e of
you
th re
late
d ac
tiviti
es
thro
ugho
ut th
e S
hire
. To
pr
omot
e th
e co
ntrib
utio
ns
to
the
com
mun
ity m
ade
by y
oung
peo
ple
Youn
g pe
ople
in th
e Sh
ire a
re e
ncou
rage
d to
par
ticip
ate
in th
e Y
oung
End
eavo
ur S
chem
e. C
ounc
il w
orks
with
the
com
mun
ity
to s
pons
or fo
ur b
erth
s on
the
STS
You
ng E
ndea
vour
ann
ually
.
Com
mun
ity S
ervi
ces
Div
isio
n

PLA
NN
ED A
CC
ESS
& E
QU
ITY
AC
TIVI
TY
OB
JEC
TIVE
S PE
RFO
RM
AN
CE
TAR
GET
/TIM
EFR
AM
E R
ESPO
NSI
BIL
ITY
Hol
d Y
outh
W
eek
activ
ities
th
roug
hout
LG
A.
(sec
tion
4.2,
Com
mun
ity S
ervi
ces
&
Edu
catio
n, Y
outh
Ser
vice
s)
Cou
ncil
prov
ides
sch
olar
ship
s an
d sp
onso
rshi
p to
sch
ools
for
pr
ize
givi
ng d
ays.
Cou
ncil
prov
ides
sch
ool
achi
evem
ent
crea
tive
arts
exc
elle
nce
awar
ds f
or o
ne p
erso
n at
eac
h se
cond
ary
scho
ol,
and
tow
n-ba
sed
youn
g ci
tizen
and
spo
rts s
tar a
war
ds a
nnua
lly.
You
th W
eek
activ
ities
hel
d A
pril.
Pro
vide
affo
rdab
le h
igh
spee
d ac
cess
to
inte
rnet
, co
mpu
ters
and
sof
twar
e th
roug
h C
omm
unity
Tec
hnol
ogy
Cen
tres
(sec
tion
4.2,
E
cono
mic
A
ffairs
, C
omm
unity
Te
chno
logy
Cen
tres)
.
To p
rom
ote
and
enco
urag
e ac
cess
and
use
of
inf
orm
atio
n te
chno
logy
to
the
gene
ral
com
mun
ity
CTC
s (M
erriw
a &
Mur
ruru
ndi)
open
ed a
t ac
cess
ible
hou
rs t
o th
e co
mm
unity
C
orpo
rate
Ser
vice
s D
epar
tmen
t
All n
ew p
ublic
bui
ldin
gs o
r re
nova
tions
to
publ
ic
build
ings
to
be
ac
cess
ible
in
ac
cord
ance
w
ith
the
Dis
abilit
y D
iscr
imin
atio
n A
ct
1992
(s
ectio
n 4.
2,
Hou
sing
&
C
omm
unity
Am
eniti
es,
Pla
nnin
g S
ervi
ces)
Enco
urag
e th
e pr
ovis
ion
of
disa
bilit
y ac
cess
to b
uild
ings
D
evel
opm
ent a
pplic
atio
ns fo
r pu
blic
bui
ldin
gs r
eque
st d
isab
led
acce
ss p
rovi
sion
in a
ccor
danc
e w
ith A
S14
28.
Env
ironm
enta
l Ser
vice
s D
epar
tmen
t
That
sta
ff w
ho d
eal
with
the
com
mun
ity
are
train
ed in
cul
tura
l aw
aren
ess
and
are
awar
e of
in
terp
rete
r se
rvic
es
and
reso
urce
s av
aila
ble
to a
ssis
t cu
stom
ers
(sec
tion
4.2,
Rec
reat
ion
& C
ultu
re,
Oth
er
Cul
tura
l Ser
vice
s).
To i
mpr
ove
acce
ss t
o in
form
atio
n by
the
co
mm
unity
, sp
ecifi
cally
to
cu
ltura
lly
and
lingu
istic
ally
div
erse
peo
ple,
old
er p
eopl
e,
and
peop
le w
ith a
dis
abili
ty.
Whe
re p
ract
icab
le, a
cces
s to
Cou
ncil
publ
icat
ions
in la
ngua
ges
othe
r th
an E
nglis
h or
in la
rger
prin
t w
ill b
e m
ade
avai
labl
e on
re
ques
t.
Cor
pora
te S
ervi
ces
Dep
artm
ent,
Com
mun
ity S
ervi
ces
Div
isio
n
The
ATSI
fla
gs a
re f
low
n on
Cou
ncil’s
fla
gpol
es t
o m
ark
sign
ifica
nt o
ccas
ions
. (s
ectio
n 4.
2, R
ecre
atio
n &
Cul
ture
, O
ther
C
ultu
ral S
ervi
ces)
Cou
ncil
reco
gnis
es th
e im
porta
nce
of A
TSI
cele
brat
ions
.Th
e A
TSI f
lag
is fl
own
durin
g A
TSI W
eek
and
othe
r app
ropr
iate
oc
casi
ons
Cor
pora
te S
ervi
ces
Dep
artm
ent,
Com
mun
ity S
ervi
ces
Div
isio
n
Mul
ticul
tura
l act
iviti
es a
re e
ncou
rage
d an
d su
ppor
ted
(sec
tion
4.2,
R
ecre
atio
n &
C
ultu
re, O
ther
Cul
tura
l Ser
vice
s)
Cou
ncil
parti
cipa
tes
in
prom
otin
g co
mm
unity
har
mon
y.
Loca
l cu
ltura
l gr
oups
are
enc
oura
ged
to p
rovi
de m
ultic
ultu
ral
activ
ities
ann
ually
. C
omm
unity
Ser
vice
s D
ivis
ion
Plan
and
im
plem
ent
Loca
l G
over
nmen
t W
eek
activ
ities
thro
ugho
ut th
e sh
ire. (
see
sect
ion
4.2,
Rec
reat
ion
& C
ultu
re,
Oth
er
Cul
tura
l Ser
vice
s)
Pro
mot
e se
rvic
es p
rovi
ded
by C
ounc
il fo
r th
e be
nefit
of t
he c
omm
unity
. Ac
tiviti
es a
re o
rgan
ised
in re
latio
n th
e th
eme
prov
ided
by
Loca
l G
over
nmen
t and
Shi
res
Ass
ocia
tion
annu
ally
. C
omm
unity
Ser
vice
s D
ivis
ion
Com
mun
ity
can
prov
ide
inpu
t in
to
the
mai
nten
ance
of
Cou
ncil
faci
litie
s an
d th
e pr
ovis
ion
of
serv
ices
th
roug
h th
e C
omm
unity
Stra
tegi
c Pl
an a
nd D
eliv
ery
The
gene
ral
com
mun
ity,
incl
usiv
e of
the
ta
rget
gr
oups
su
ch
as
ATSI
, C
hild
ren,
C
ALD
, O
lder
pe
ople
, pe
ople
w
ith
a di
sabi
lity,
hav
e th
e op
portu
nity
to
prov
ide
Com
mun
ity
Stra
tegi
c Pl
an
and
Del
iver
y Pr
ogra
m
and
Ope
ratio
nal
Pla
n ar
e ad
verti
sed
to
the
com
mun
ity
and
subm
issi
ons
are
enco
urag
ed
bian
nual
ly
and
annu
ally
re
spec
tivel
y
Cor
pora
te S
ervi
ces
Dep
artm
ent,
Tech
nica
l Ser
vice
s

PLA
NN
ED A
CC
ESS
& E
QU
ITY
AC
TIVI
TY
OB
JEC
TIVE
S PE
RFO
RM
AN
CE
TAR
GET
/TIM
EFR
AM
E R
ESPO
NSI
BIL
ITY
Prog
ram
and
Ope
ratio
nal P
lan
proc
esse
s.
(sec
tion
4.2,
Tra
nspo
rt &
Com
mun
icat
ion,
R
oads
and
Brid
ges)
inpu
t in
to C
ounc
il’s S
trate
gic
and
Del
iver
y Pr
ogra
m a
nd O
pera
tiona
l Pla
ns b
iann
ually
an
d an
nual
ly re
spec
tivel
y.
Dep
artm
ent
Cou
ncil
serv
ices
are
acc
essi
ble
to p
eopl
e w
ith d
isab
ilitie
s C
ounc
il bu
ildin
gs,
cust
omer
ser
vice
poi
nts
and
mee
tings
are
acc
essi
ble
in a
ccor
danc
e w
ith A
S14
28.
Exi
stin
g bu
ildin
gs a
re c
ompl
iant
and
con
tinue
to c
ompl
y.
Dis
abilit
y ai
ds in
corp
orat
ed in
to C
ounc
il’s
new
adm
inis
tratio
n ce
ntre
.
Cor
pora
te S
ervi
ces
Dep
artm
ent,
Tech
nica
l S
ervi
ces
Dep
artm
ent

ATT
AC
HM
EN
T 3
RA
TE C
ATE
GO
RY
MA
PS (R
EFER
TO
SEC
TIO
N 3
.1)


Related Documents


