Delivering the climate transition: Exploring the assumed costs of capital in EU energy and economic modelling

Welcome message from author
This document is posted to help you gain knowledge. Please leave a comment to let me know what you think about it! Share it to your friends and learn new things together.
Transcript

Delivering the climate transition: Exploring the assumed costs of capital in EU energy and economic modelling

1
Delivering the climate transition:
Exploring the assumed costs of capital in EU energy and economic modelling
The University of Cambridge Institute
for Sustainability Leadership
The University of Cambridge Institute for Sustainability Leadership (CISL)
is a globally influential Institute developing leadership and solutions for a
sustainable economy. We believe the economy can be ‘rewired’, through
focused collaboration between business, government and finance
institutions, to deliver positive outcomes for people and environment.
For over three decades we have built the leadership capacity and
capabilities of individuals and organisations, and created industry-leading
collaborations, to catalyse change and accelerate the path to a
sustainable economy. Our interdisciplinary research engagement builds
the evidence base for practical action.
CLG Europe
CLG Europe develops credible, ambitious positions amongst its membership
and deploys effective strategic communications to engage with the highest
levels of policy audiences. CLG Europe is diverse in its membership and
representative of Europe in both geography and sector, welcoming the
innovative talent of SMEs as well as leading established companies. The group
works closely with policymakers – particularly the Green Growth Group of EU
climate and environment ministers, and supportive Members of the European
Parliament through its Green Growth Partnership. The group also maintains a
network of sister groups across the EU and works in partnership with some of
the largest business-focused organisations in support of climate action as one
of the founders of the We Mean Business coalition, for which it provides the
EU policy lead.
Cambridge Econometrics
Cambridge Econometrics is an award-winning global economics consultancy.
Their mission is to provide clear and useful insights, based on rigorous and
independent economic analysis, to address the complex challenges facing
society. Cambridge Econometrics developed the E3ME model which is widely
used by governments, large international organisations and the European
Commission.

2
Delivering the climate transition:
Exploring the assumed costs of capital in EU energy and economic modelling
Authors This Technical Report was authored by Boglarka Molnar and Philip
Summerton (Cambridge Econometrics), with inputs from Sanna Markkanen,
Eliot Whittington and Ursula Woodburn and support from Isabelle Cross and
Krisztina Zalnoky (CISL).
Citing this report Please cite this report as: University of Cambridge Institute for Sustainability
Leadership (CISL). (2021). Delivering the climate transition: Exploring the
assumed costs of capital in EU energy and economic modelling. Technical
Report. Cambridge, UK: CLG Europe.
Acknowledgements We would like to acknowledge the support of CLG Europe member, the
ROCKWOOL Group.
We would like thank Brook Riley, Head of EU affairs at the ROCKWOOL Group
for his time and contribution.

3
Delivering the climate transition:
Exploring the assumed costs of capital in EU energy and economic modelling
Foreword
In 2021, hopes are high for progress on climate, but major gaps still exist between the pledges being
made and the reductions necessary to combat climate change. COP26 – the global climate
conference due in Glasgow at the end of this year – is a critical moment for pledges to be ratcheted
up. The pressure is now on for global economies to take action.
Propelled by its Green Deal and agreement on increased ambition for 2030, the EU is due to propose
critical legislation this year to ensure that it can achieve net 55 per cent emissions reductions by
2030, or, if the European Parliament has its way, even greater ambition. In June, the Commission is
due to propose the first part of the ‘Fit for 55%’ package, including revisions of the EU’s Emissions
Trading System, the Effort Sharing Regulation, the Renewable Energy Directive, the Energy Efficiency
Directive, CO2 standards for cars and light commercial vehicles, and the Regulation on the inclusion
of greenhouse gas emissions and removals from land use, land-use change and forestry (LULUCF).
Last September, the European Commission published its 2030 Impact Assessment, which explored
what types of policy packages would need to be implemented to mobilise sufficient investment in
low carbon technologies to achieve 55 per cent reduction in greenhouse gas emissions by 2030
(compared to 1990). However, a growing number of commentators are raising questions about
whether the projections included in the Impact Assessment are ambitious enough, and whether the
estimated investment need appropriately reflects the reality. In other words, is the modelling that
forms the backbone of the new ambition in line with current macroeconomic conditions, including
how different technologies are financed, and is it taking into account how effective policy can be in
de-risking investments?
To address these questions, we asked Cambridge Econometrics – whose E3ME model is a central
tool in the 2030 Impact Assessment – to explore how discount rates and interest rates are used in
the modelling, and what implications these assumptions have on the modelling outcomes. The
analysis presented in this report indicates that the discount rate and interest rate assumptions that
are currently used in the EU’s modelling could in fact be leading to inflated assessments of both the
level of cost and the policies required to achieve a given emissions reduction. This matters, because
high discount rate assumptions have the effect of biasing the modelling results in favour of a high
carbon future and undermining the EU’s climate action commitments. Similarly, the 10 per cent
interest rate used in the macroeconomic modelling artificially increases the up-front capital cost
difference between high carbon and low carbon technologies, hiding the fact that the lifetime cost of
low carbon technologies is in fact typically lower.
These complex considerations shape government decisions and business assumptions about the
costs and benefits of different actions, the risks of investments and indeed what emissions
reductions are possible. At this moment in time, we have a historic opportunity to invest in a green
recovery in the aftermath of Covid-19. A substantial proportion of the €750 billion EU recovery fund,
for which the Commission has issued bonds with rates under 1 per cent, could be directed to support
economic recovery that is compatible with the EU’s longer-term climate target.

4
Delivering the climate transition:
Exploring the assumed costs of capital in EU energy and economic modelling
However, for the EU to lead by delivering a best-in-class set of climate policies, it is essential that the
modelling that informs these policies – which is already excellent – is further improved to reflect the
current conditions in terms of access and cost of finance as well as the impacts of policies that are
already in place to de-risk and incentivise low carbon investment.
In a world where it is critical to assess how policies can effectively achieve ambitions – and indeed
see where ambitions can be ramped up – it is essential to get the modelling right.
This report aims to draw out the different assumptions at play and outline recommendations for how
modelling could be improved in the future.
5
Delivering the climate transition:
Exploring the assumed costs of capital in EU energy and economic modelling
Executive summary Context and rationale
This paper investigates and discusses the role of discount rate and interest rate assumptions in modelling the low carbon energy transition in Europe. Specifically, we discuss the implications and plausibility of the discount rate and interest rate assumptions used in the European Commission’s (EC) Impact Assessment1,2 of the 2030 greenhouse gas (GHG) emissions reductions target.
In its Impact Assessment, the EC is attempting to understand the socio-economic implications of the low carbon transition. Analytically, this requires quantifying (at least) two different scenarios for the future:
• a business-as-usual (relatively) high carbon baseline, which does not put the EU on track to meet its 2050 climate neutrality target.
• a low carbon scenario(s) which meets a given GHG reduction target(s).
The two scenarios are compared to provide an insight into the net costs and benefits at different points in time and across Member States and sectors. Such analysis requires a considerable amount of data and number of assumptions. The discount rate is one such assumption that informs this analysis. Given this context, this paper discusses the following questions:
• What is the role of discount rate and interest rate assumptions in the EC’s modelling?
• How do the discount rate and interest rate assumptions affect the results?
• Is a 10 per cent discount rate assumption too high?
• Is it reasonable to assume a ‘blanket’ (homogenous) rate across sectors and Member States?
• How does policy interact with the discount rate?
Finally, we make some recommendations to improve future modelling analysis.
What are the roles of discount rate and interest rate assumptions
in the EC’s modelling?
The roles of the discount rate and interest rate assumptions in the EC’s modelling2 are as follows:
• Discount rates are applied in the PRIMES (Price-Induced Market Equilibrium System) energy system modelling to inform which technologies will be taken up. They are used to reduce the value of future costs and benefits relative to the first year of an investment. A range of discount rates are applied to reflect factors affecting investors in different sectors and in response to policy. The rates applied range between around 7.5 to 11 per cent (for businesses) and 10 to 15 per cent (for households).
• An interest rate, representing the cost of borrowing, is applied to the capital costs from the energy system modelling to ‘annualise’ the capital costs feeding into the economic modelling to determine the overall economic cost of the low carbon scenarios. Here, a single rate of 10 per cent is applied.
6
Delivering the climate transition:
Exploring the assumed costs of capital in EU energy and economic modelling
How do the discount rate and interest rate assumptions affect
the results?
The discount rate and interest rate assumptions matter. A transition to a low carbon economy requires relatively more capital-intensive investment across all sectors of the economy than renewing high carbon technologies (instead of repairing or replacing old technologies with like-for-like, new technologies are needed, and these require high up-front capital investment). Although the higher capital costs of low carbon technologies are (at least partially) offset by lower running costs in most cases, the higher capital intensity (up-front cost) of low carbon technology options means that a higher interest rate assumption increases the relative cost of low carbon technologies. If the rates assumed in the modelling are higher than the ‘real-world’ rates, there would be a bias against the low carbon scenarios. In the modelling this comes about in two different ways:
• In the energy system modelling in PRIMES, it means that stronger policies are required to bring about a given emissions reduction that might be needed in the real world, leading to higher policy costs (such as a higher carbon price). Alternatively, it means that with lower discount rates a more ambitious emissions reduction could be achieved with the same policy mix.
• In the economic modelling, the economic costs of a low carbon transition would be higher for a given emissions reduction because the annualised capital costs reflect an assumed rate that is above market rates, and also because of the higher policy costs arising from the initial energy system modelling. Overall, this would serve to worsen the gross domestic product (GDP) and employment outcomes.
Is a 10 per cent interest rate assumption too high?
The interest rate assumption of 10 per cent that is applied to calculate the annualised cost of capital in the economic modelling is too high in the current context of sustained low interest rates across Europe. We find evidence that market rates available to governments, businesses and even households are often significantly below the 10 per cent assumption. The implication is that the economic costs of achieving a 55 per cent reduction in emissions presented in the 2030 Impact Assessment are exacerbated. However, without further analysis it is not clear what the scale of this bias is on the results.
It is less clear whether the range of discount rates used in the energy system modelling are too high, because they are intended to reflect not only the cost of financing but also the required return on investment (which is typically higher and depends on factors such as how a project is financed). Moreover, it is not clear whether the rates used have been updated from the EU Reference Scenario 20163 that the 2030 Impact Assessment refers to. On balance, we suggest that the discount rates used are at the high end of a plausible range, given the context of the extremely low market interest rate environment (which could persist for some time), policies that have sought to de-risk low carbon investment, and new financing instruments that have sought to improve access to debt financing for low carbon investors.

7
Delivering the climate transition:
Exploring the assumed costs of capital in EU energy and economic modelling
Is it reasonable to assume a ‘blanket’ (homogenous) rate across
sectors and Member States?
In the energy system modelling undertaken in PRIMES, a range of discount rates are used to reflect the preferences of different sectors as well as differences in borrowing costs and expectations about the return on equity. This heterogeneity (diversity) is backed up by our partial assessment of market borrowing rates across sectors in four European countries.
However, the single 10 per cent rate that is applied to annualise the capital costs in the economic modelling (the ‘borrowing cost’) is misleading and does not reflect differences in who is doing the investing and what they are investing in.
Our partial review of lending rates across sectors in four European countries shows a wide range of borrowing costs, nearly all of which are below the assumed 10 per cent rate, even for households. Only unsecured loans and credit cards (which households are unlikely to use for large home improvement projects or to purchase a car) attract a borrowing rate above 10 per cent, whereas government bonds, business borrowing, mortgage rates and secured loans to households all attract lower rates that increase with the default risk (governments are very low risk, then corporates, businesses and finally, households). We find some evidence of heterogeneity across the four European countries assessed, but it is small compared to the differences between sectors.
How does policy interact with the discount rate and cost of
borrowing?
The policies put in place to meet climate and energy goals can reduce investment risk and change the rate of return required by businesses and households to make investments. As a result, we suggest that the cost of finance should not be ‘exogenous’ to policy since it is clearly influenced by policy. Broadly there are two ways this comes about:
• If the government is partly funding the investment (eg direct grants and subsidies) then the interest rate should reflect the much lower cost of government borrowing for its part.
• If the government is proving guarantees to the market (eg loan guarantees, feed-in tariffs, etc) then the risk is reduced, which should lower the required rate of return.
Indeed, according to the EU Reference Scenario 2016 publication,3 the PRIMES energy system modelling does partly reflect this by lowering the discount rate in certain sectors because of policy.
Moreover, as new technologies become mature over the projection period, the investment risk is further reduced which should, in turn, lead to lower rates. In part, this ‘virtuous circle’ between lower risk and increasing investment explains why policies such as the UK’s Contracts for Difference have been so successful in bringing about low carbon investment.
Finally, it is no longer clear that established high carbon technologies should automatically attract lower interest rates as they risk being ‘stranded’ because of policy that requires a low (and, ultimately, zero) carbon transition.
8
Delivering the climate transition:
Exploring the assumed costs of capital in EU energy and economic modelling
Recommendations for future modelling
Economic and energy modelling will never perfectly reflect every real-world condition; some abstraction is always necessary. The modelling undertaken by the EC is detailed, robust, transparent and comprehensive. However, modelling should try to reflect known conditions where possible and explore uncertainty accordingly. To that end, our recommendations to improve future analysis are as follows:
• Undertake sensitivity analysis by applying a range of discount rate assumptions to provide an insight into the extent to which the discount rate assumption affects the economic outcomes.
• Review discount rate assumptions on a sector-by-sector basis and revise the discount rate assumptions accordingly to reflect the heterogeneity in market interest rates, attitude to risk and perceived barriers to investment (hurdles). We recommend developing a range for each broad sector.
• Ensure consistency in the rates applied between the energy modelling and the economic modelling to reflect who is investing. By consistency, we do not mean the same rates, rather that the economic modelling should reflect differences in the financing costs in different sectors as is currently reflected, at least partially, in the energy modelling.
• More explicitly model the relationship between policies and the risk premium and/or hurdle rate component of the discount rate assumption. Specifically consider the extent to which policies intended to bring about a low carbon transition might either lower the risk premium and/or hurdle rate (for example by guaranteeing the electricity price as some feed-in tariffs have, or by making it easier for households to access funding and expert advice for building renovation) or lower the rate because it is financed directly by government.
• Consider modelling the relationship between technology deployment and the risk premium and/or hurdle rate. Empirically, we know that ‘learning from doing’ lowers the technology cost but it also reduces the risk and removes some of the barriers (hurdles) to investment.

9
Delivering the climate transition:
Exploring the assumed costs of capital in EU energy and economic modelling
1. Understanding the importance of interest rates in the low carbon transition 1.1 Introduction
At its core, the transition to a low carbon economy is a question of investment in technology development and deployment. That is not to suggest that human behaviour is not important but simply to recognise that to meet international climate obligations requires a complete transformation of a high carbon capital stock (including buildings, machines, production assets, cars etc) to a low, or zero, carbon capital stock.
In Europe, the European Commission (EC) assesses the impact of reaching different greenhouse gas (GHG) emissions targets for 2030 on a pathway to net zero based on economic and energy modelling. The purpose of this modelling exercise, reported in an Impact Assessment,1,2 is to understand the scale and nature of changes in energy generation and use (power stations, industrial processes, cars, trucks, heating systems, etc) and the impact of these changes on the wider economy.
Such modelling exercises, by their nature, require assumptions to be developed. The central aim of this brief report is to discuss the important issue of the discount rate and interest rate assumptions and their implications for the economy.
In undertaking its Impact Assessment, the EC is attempting to understand the socio-economic implications of the low carbon transition. Analytically, this requires quantifying (at least) two different scenarios for the future:
• a business-as-usual high carbon baseline, which is not compatible with the target of achieving net zero GHG emissions by 2050
• a low carbon scenario(s) which meets a given GHG reduction target(s) needed to achieve net zero GHG emissions by 2050.
The two scenarios are compared to provide an insight into the net costs and benefits of the transition at different points in time and across Member States and sectors. Such analysis requires a considerable amount of data and number of assumptions. The discount rate and interest rate are among the assumptions that inform this analysis.
Given this context, this paper discusses the following questions:
• What is the role of the discount rate and interest rate assumptions in the EC’s modelling? (addressed in Section 2.1)
• How do the discount rate and interest rate assumptions affect the results? (addressed in Section 2.2)
• Is a 10 per cent interest rate assumption too high? (addressed in Section 3)
• Is it reasonable to assume a ‘blanket’ (homogenous) rate across sectors and Member States? (addressed in Section 3)
• How does policy interact with the discount rate? (addressed in Section 4)
Finally, we draw some conclusions (in Section 5) and make some recommendations to improve future modelling analysis.
10
Delivering the climate transition:
Exploring the assumed costs of capital in EU energy and economic modelling
Before turning to the questions above, the next section of this report sets out a discussion on some of the terms used in this report.
1.2 Key terms in the report
This section sets out a discussion on the terms used in this analysis: interest rates, discount rates (private and social), internal rate of return and opportunity costs, weighted average cost of capital and hurdle rates.
Interest rates
An interest rate is the amount a lender charges a borrower for taking out a loan, typically expressed as an annual rate and applied to the loan value. It is also used to express the return on savings or investments. A borrower will need to incur an interest rate charge so that they can have money today at the expense of money in the future. On the other side of the deal, a lender charges interest for having to forego money today for money in the future. The rate charged is usually expressed as an annual rate that is typically referred to as the interest rate, or ‘the cost of borrowing’.
Discount rates (private and social)
Investors face decisions where the costs and benefits of a given investment are separated by many years. To convert costs and benefits at different points in time into comparable costs and benefits at a single point in time, discount rates are used to reflect a preference for money today rather than money in the future – this is known as the time value of money (TVM).
When investments are to be undertaken by the private sector (businesses, households, individuals) or other entities that are affected by the real-world risk premiums, private discount rates are used in the analysis. The value of the private discount rate is influenced by several factors,3 such as the interest rates prevailing in the capital markets, the degree of access to such markets for fund raising, perceptions of risk and the preferences of the investor. Private discount rates therefore tend to be substantially higher than the base interest rates alone, or social discount rates. The EC’s 2030 Impact Assessment uses private discount rates in the energy sector modelling.
The social discount rate is intended to reflect a society’s (or government’s) overall preference for money today rather than money in the future. Typically, social discount rates applied to government investment decisions are much lower than private discount rates, reflecting not only that borrowing rates are much lower, in some cases negligible, to governments but also that a government should take ‘the long view’, not least because private investors tend not to. Social discount rates are used widely in cost–benefit analysis, to assess the costs and benefits of competing uses of public funds for purposes where the beneficiary is the society as a whole.
The process of applying a discount rate to reduce the value of money in the future compared to money today is known as discounting.
Internal rate of return and opportunity costs
The internal rate of return (IRR) is an indicator reflecting the relative attractiveness of an investment; it is defined as the discount rate that zeroes out the net present value (calculated using a discount rate) of flows of costs and benefits of the given investment.4 A simpler way of thinking about this is that the internal rate of return reflects the desired profitability of an investment.
Investors weigh up the opportunity cost of different investment options by comparing the internal rate of return on different options. The internal rate of return is typically set higher than market
11
Delivering the climate transition:
Exploring the assumed costs of capital in EU energy and economic modelling
interest rates because otherwise it would be better to either invest in these safer financial instruments or, more typically, just pay down any existing debt expressed at the market rate. Investors and businesses will want to make profitable investments. By definition, this requires that the internal rate of return on any project is set higher than the market interest rates available to it, otherwise why undertake the investment?
If investors and businesses set internal rates of return above market rates to reflect the required profitability of investment decisions, it is worth thinking about what would determine this margin. The answer to this question is the investors’ appetite for risk and their perception of non-monetary barriers to the investment (hurdles).
In line with a general capital asset pricing model (CAPM) approach, no matter what the investment is, some level of risk will always exist. Therefore, investors naturally seek a rate of return that compensates for that risk. Interest rates can be used to reflect the actual borrowing conditions available in the economy. There is, however, a set of non-financial factors in making investment decisions. Therefore, a rate reflecting the cost of capital is only part of the picture, with another part reflecting perceived investment constraints (the ‘hurdle rate’, capturing the minimum acceptable rate of return on the project). The internal rate of return (the rate investors require before making an investment) consists of the ‘simple’ (market) interest rate and a risk premium, representing the case-specific perceived investment constraints.
Weighted average cost of capital
Relatedly, it is important to flag the concept of the weighted average cost of capital (WACC) that reflects a blend of cost of debt and equity based on the company’s profile, and that is used for discount rates in the PRIMES energy system modelling. Investments can be funded by equity or debt – typically equity investors require higher returns, whereas debt is repaid at lower rates.
Hurdle rates
In the PRIMES energy system modelling, the discount rate is also intended to represent so-called ‘hurdle rates’, which are non-monetary barriers to investment. For the most part this is used to explain why households do not invest in cost-effective insulation measures. Since the hurdle rate is meant to capture non-monetary barriers to investment decisions, it is not obvious that it should be proportional to the required investment.

12
Delivering the climate transition:
Exploring the assumed costs of capital in EU energy and economic modelling
2. Interest rates and discounting in climate and energy modelling 2.1 An overview of the application of interest and discount rates
The choice of interest rate and discount rate assumptions in modelling needs to reflect the purpose of the modelling. Here it is worth distinguishing between Integrated Assessment Modelling, which attempts to put an economic value on the costs of climate change and compare them to the cost of climate change mitigation action, and the modelling undertaken by the EC in its impact assessment.
Discounting in Integrated Assessment Modelling
In the context of Integrated Assessment Modelling, a discount rate is typically used to calculate a ‘net present value’ of the monetised benefits of climate change mitigation investments. A higher discount rate shrinks the present value of climate benefits (to be realised in the future, in the form of avoided damages), relative to their costs (to be made in the present, in the form of green investments). Relatively small differences in the choice of this rate can make a large difference in the policy assessment.5
A key conclusion of the 2007 economic analysis of the Stern Review on The Economics of Climate Change6 was that the benefits of early action in carbon abatement outweigh its costs. A central argument underlying this conclusion of the Review was that the choice of discount rate in this type of modelling should be based almost entirely on ethical considerations and not on empirical observations (eg behaviour that is reflected in market rates).5
The EC’s Impact Assessment
However, the EC’s Impact Assessment does not attempt to quantify the impact of climate change; its scope is narrower. Instead, it attempts to understand the economic and social impact in Europe of meeting different GHG emissions targets. Policymakers are then expected to compare this against the costs of climate change (which are determined by global action).
The role of the discount rate and interest rate assumption is two-fold in the EC’s modelling:2
• Private discount rates are applied in the PRIMES energy system modelling to inform which technologies will be deployed. They are used to reduce the value of future costs and benefits relative to the first year of an investment. A range of discount rates are applied to reflect factors affecting investors in different sectors and in response to policy. The rates applied range between around 7.5 to 11 per cent (for businesses) and 10 to 15 per cent (for households).
• An interest rate (cost of borrowing) is applied to the capital costs from the energy system modelling to ‘annualise’ the capital costs feeding into the economic models to determine the overall cost of the low carbon scenarios. Here, a single rate of 10 per cent is applied.
The EC’s PRIMES3 modelling applies private discount rates to represent the decision-making of investors. It differentiates between investors in different sectors by using rates that reflect the weighted average cost of capital, and for households it uses rates that are intended to reflect ‘non market’ barriers to investment, so-called ‘hurdle’ rates. This is broadly the correct approach in that it is attempting to reflect the real-world investment decisions in the private sector. It would not be applicable to apply a social discount rate in this context, other than to represent investments made by government.
13
Delivering the climate transition:
Exploring the assumed costs of capital in EU energy and economic modelling
It is also appropriate to apply an interest rate that reflects real-world market conditions to the economic modelling to represent the cost of borrowing incurred by investors. The question that arises is whether a single 10 per cent rate is representative of most borrowing for low carbon investment.
2.2 Why the discount rate and interest rate assumptions matter
A central concern in modelling is whether a particular assumption biases the results. In its 2030 Impact Assessment, the EC compares socioeconomic indicators (GDP, jobs, incomes, energy bills, etc) across different scenarios for GHG emissions reduction and compares these to a baseline in which GHG emissions are not significantly reduced.
One question that arises is therefore whether the discount rate and interest rate assumptions bias the socioeconomic outcomes in a particular direction. Given that the low carbon transition is typically more capital intensive than a high carbon baseline, we assert that a higher discount rate implicitly favours a high carbon future, while a lower discount rate favours a low carbon future. This is why it is so important to accurately represent discount rates when carrying out the modelling.
There are two ways of thinking about this implication of the discount and interest rate assumptions and these are reflected in the EC’s modelling:
• Discount rates are applied in the PRIMES energy system modelling to inform which technologies will be taken up. They are used to reduce the value of future costs and benefits relative to the first year of an investment. A range of discount rates are applied to reflect factors affecting investors in different sectors and in response to policy. The rates applied range between around 7.5 to 11 per cent (for businesses) and 10 to 15 per cent (for households).
• An interest rate, representing the cost of borrowing, is applied to the capital costs from the energy system modelling to ‘annualise’ the capital costs feeding into the economic modelling to determine the overall economic cost of the low carbon scenarios. Here, a single rate of 10 per cent is applied.
This of course does not necessarily mean that low carbon technologies are always more expensive over their lifetime, just that they are relatively more capital intensive because high carbon technologies tend to be more mature and produced in large quantities, and a large proportion of the cost of high carbon technologies is the ongoing fuel cost.
To illustrate this point, we compare the following pairs of technologies in three important low carbon markets:
• Transport – comparing internal combustion engine cars (ICEs) with battery electric vehicles (BEVs)
• Power sector – comparing gas-fired power (CCGT) with onshore wind
• Heating – comparing a conventional gas boiler with an air source heat pump.
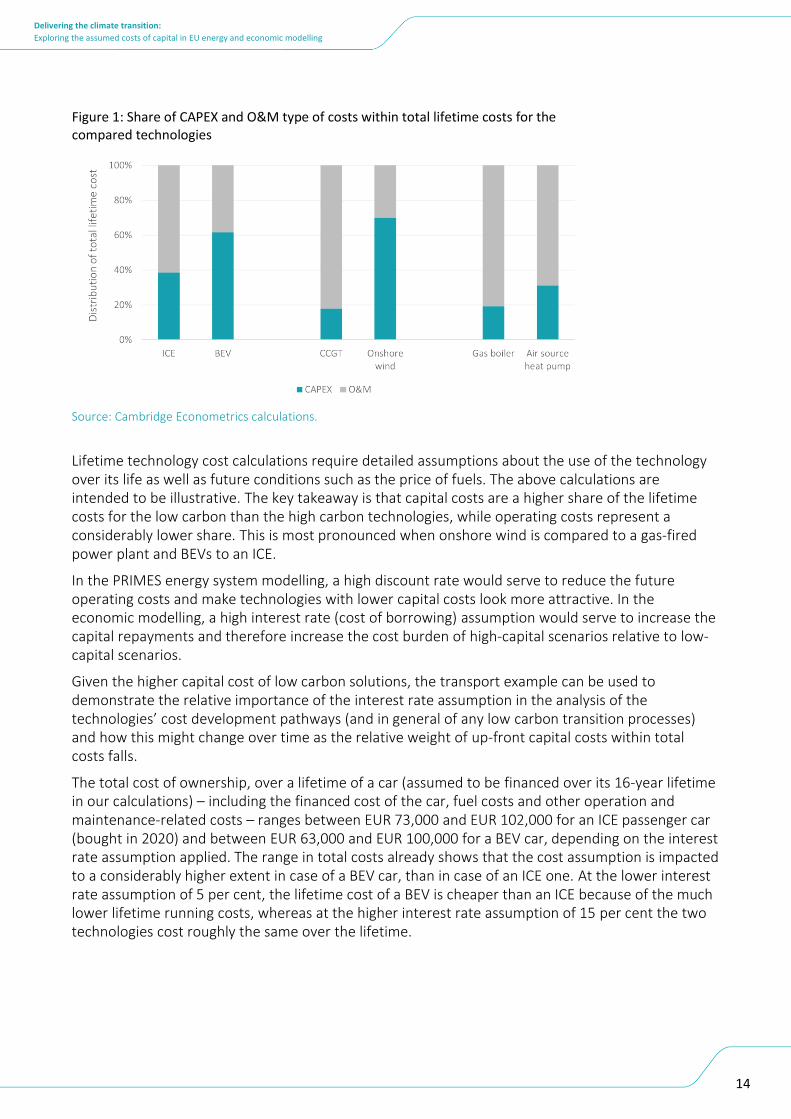
In each market comparison, we estimated how the lifetime cost that consumers bear (transport and heating) or the unit cost of electricity generated that producers face (power) is distributed between the capital cost (CAPEX) and the operating and maintenance costs (O&M) over the lifetime (Figure 2.1).
14
Delivering the climate transition:
Exploring the assumed costs of capital in EU energy and economic modelling
Source: Cambridge Econometrics calculations.
Lifetime technology cost calculations require detailed assumptions about the use of the technology over its life as well as future conditions such as the price of fuels. The above calculations are intended to be illustrative. The key takeaway is that capital costs are a higher share of the lifetime costs for the low carbon than the high carbon technologies, while operating costs represent a considerably lower share. This is most pronounced when onshore wind is compared to a gas-fired power plant and BEVs to an ICE.
In the PRIMES energy system modelling, a high discount rate would serve to reduce the future operating costs and make technologies with lower capital costs look more attractive. In the economic modelling, a high interest rate (cost of borrowing) assumption would serve to increase the capital repayments and therefore increase the cost burden of high-capital scenarios relative to low-capital scenarios.
Given the higher capital cost of low carbon solutions, the transport example can be used to demonstrate the relative importance of the interest rate assumption in the analysis of the technologies’ cost development pathways (and in general of any low carbon transition processes) and how this might change over time as the relative weight of up-front capital costs within total costs falls.
The total cost of ownership, over a lifetime of a car (assumed to be financed over its 16-year lifetime in our calculations) – including the financed cost of the car, fuel costs and other operation and maintenance-related costs – ranges between EUR 73,000 and EUR 102,000 for an ICE passenger car (bought in 2020) and between EUR 63,000 and EUR 100,000 for a BEV car, depending on the interest rate assumption applied. The range in total costs already shows that the cost assumption is impacted to a considerably higher extent in case of a BEV car, than in case of an ICE one. At the lower interest rate assumption of 5 per cent, the lifetime cost of a BEV is cheaper than an ICE because of the much lower lifetime running costs, whereas at the higher interest rate assumption of 15 per cent the two technologies cost roughly the same over the lifetime.
Figure 1: Share of CAPEX and O&M type of costs within total lifetime costs for the compared technologies

15
Delivering the climate transition:
Exploring the assumed costs of capital in EU energy and economic modelling
Source: Cambridge Econometrics calculations.
Figure 2: Lifetime cost of an Internal Combustion Engine (ICE) and Battery Electric Vehicle (BEV), 2020

16
Delivering the climate transition:
Exploring the assumed costs of capital in EU energy and economic modelling
3. A review of market interest rates Section 2.2 demonstrates that a higher interest rate assumption favours higher carbon investments (that typically have lower risks associated with them because they are established rather than novel technologies), while a lower interest rate favours lower carbon investment. That begs the question: is a 10 per cent interest rate assumption too high or too low?
A further question that arises is whether assuming the same interest rate is appropriate in all circumstances. To what extent does, or should, the interest rate vary across sectors (or investor types) and across European countries?
To start to answer these questions, we reviewed market interest rates across four European countries and in a series of lending markets. The countries were selected to represent small and large economies both inside and outside the Eurozone, as follows:
• United Kingdom (non-Euro, large economy)
• Hungary (non-Euro, small economy)
• Germany (Euro, large economy)
• Slovakia (Euro, small economy).
To reflect the fact that investments will be made by different organisations in the economy, and under different financing arrangements, we reviewed a wide range of market interest rates:
• government (gilts/bond yields: short term, long term)
• large businesses (corporate bonds, large corporate loans)
• businesses (small and medium-sized enterprise (SME) loans)
• retail (consumers with assets to securitise loans: mortgage, other secured loans)
• retail (consumers without assets: unsecured loans, credit cards)
• retail (personal contract purchase (PCP)/car loans).
This review is intended to be illustrative rather than comprehensive and exhaustive. We have reviewed the official financial market statistics of the central banks (for government bond yields, SME and large corporate loan rates), the publicly available offers of the top 3–5 retail banks in each country (for retail rates), as well as other relevant online sources (where data was not available from either of the previous sources).
Government bond yields are provided as a single ‘snapshot’ of data (as of January/February 2021), while small and large business loans, and retail rates are all given as ranges, from lowest to highest rates observed based on sources reviewed as of end-February 2021. All the individual country-level data is available as part of the tables included in Appendix A of this report.
A key observation, mostly in line with our initial assumptions, is that the set of interest rates is highly heterogeneous across the market segments, suggesting that it matters a lot ‘who’ is doing the investment.
Across the countries, overall rates seem to be slightly higher in non-Euro countries (Hungary, the United Kingdom) than in Euro-area countries (Slovakia, Germany). At the same time, the size of the economy seems to be a less decisive factor with regard to the observed market rates, especially in the Eurozone.

17
Delivering the climate transition:
Exploring the assumed costs of capital in EU energy and economic modelling
There is a clear tendency – applicable for all the countries – of rates increasing from the lowest-risk investment options (government bonds) through the rates of commercial (large corporate and smaller business) financing options to the highest-risk retail rates (unsecured loans, credit cards).
In the case of the relatively more mature financial markets (the United Kingdom and Germany), the interest rate applicable for all of the identified categories (except for credit cards), even for unsecured personal loans, remains below 10 per cent. For the two smaller and relatively less mature markets (Hungary and Slovakia), some other higher-risk consumer product categories (loans without a security) may, in certain cases, also have an average yearly interest rate of above 10 per cent. Rates applicable for mortgage loans and for certain other-purpose secured loans (with relatively low own contribution or relatively longer pay-back period) range from an annual interest rate of 0.8 per cent to a maximum of 8 to 9 per cent in all the investigated countries. Considering that we do not expect consumers to invest in low carbon technologies using credit cards, these rates are included to show where a 10 per cent assumption sits in the range of borrowing costs available in different markets.
Table 1 shows the market rates observable as of February 2021 in the four countries.
Table 1. Observed (ranges of) market rates in the selected countries in per cent per annum (annual percentage rate of charge)
Markets / groups Hungary United
Kingdom Slovakia Germany
Government
Short term (1–2 years) 0.5 0.1 -0.6 -0.7
Long term (10 years) 2.3% 0.8% -0.1% -0.3%
Corporate
Bonds 1.9–3.8 1.7–3.5 3.0–9.0 0.8
Bank loan 1.8% 5.1% 1.6–1.8 % 1.0–1.5 %
Business (SME)
Bank loan 2.5 1.0–3.4 2.3–3.5 1.5–2.3
Retail
Mortgage 4.7–8.0 2.5–4.4 0.8–2 0.8–2.2
Secured loan 3.4–6.9 3.5–7.9 0.9–5.9 0.8–1.9
Unsecured loan 7.4–15.5 3.5–7.9 5.5–18.9 2.0–8.0
Credit cards 28–39 10–22 19–20 14–15
PCP (UK) / Car loan 8.7–15.5 0–5 4–6 1.5–8 Source: Various, see Appendix. Note: Countries ordered based on government bond yields (ascending). Ranges provided indicate the lowest and highest observed
rates based on the reviewed sources.
18
Delivering the climate transition:
Exploring the assumed costs of capital in EU energy and economic modelling
4. Interest rates and the role of policy 4.1 Policies that support financing low carbon investments
Perhaps the most relevant question arising from the discussion is whether the interest rate is exogenous to (unaffected by) policy choices or whether it is affected by policy, and whether this should be included in the modelling.
According to the EC’s EU Reference Scenario 2016,3 discount rates are reduced in response to changes in policy but this is not mirrored in the economic modelling, where a single 10 per cent interest rate (borrowing cost) is applied to all capital investments.
The previous section shows that market interest rates are typically well below 10 per cent and highly heterogeneous across different sectors. However, the discount rates used by investors will sometimes differ from the cost of borrowing to reflect investors’ required returns and perceptions of risk. Policy can therefore play a central role in influencing the rate used by investors.
Certain low carbon transition policies are aimed at lowering the (perceived) risk of investment in low carbon technologies by providing guarantees in the market (eg feed-in tariffs or carbon Contracts for Difference), reducing the up-front capital cost difference between high carbon and low carbon technologies (eg subsidies for BEV purchase) or improving access to low-cost finance (eg home energy efficiency improvement loans and grants, and green mortgages for properties that meet certain emissions efficiency standards). These types of instruments indirectly lower the required rates of return on low carbon investments. In particular, the part of the capital investment provided through government grants should bear a much lower (near zero) interest rate.
Some examples of successful policy interventions/regulations seeking to incentivise and de-risk green investments, and to improve access to finance, include:
• the UK Green Investment Bank,7 which helped to de-risk offshore wind
• the EU ETS Modernisation Fund8
• Italy’s ‘Super Ecobonus’9 scheme, aimed at boosting energy-efficient building renovation across the country
• other successful national/regional renovation schemes for residential buildings across Europe10
• the Task Force on Climate-related Financial Disclosures (TCFD – https://www.fsb-tcfd.org), which some countries and the EU are now considering making obligatory, and which would strongly incentivise financial institutions to consider the emissions associated with the companies they finance.
In the energy sector, considerable impact has already been achieved through policies aimed at de-risking investments, such as the feed-in tariff in Germany and the Contracts for Difference scheme (as part of the Electricity Market Reform) in the United Kingdom. These two support schemes, which are designed to reduce the investment risk (the market risk) by guaranteeing a purchase price for the electricity generated from different technologies, are briefly described below.

19
Delivering the climate transition:
Exploring the assumed costs of capital in EU energy and economic modelling
Germany: Feed-in tariff
Germany has been focusing on scaling up domestic renewable electricity generation since the 2000 introduction of its feed-in tariff11 system, under which the network connection is guaranteed, green power has priority access to the grid but most importantly, every kilowatt-hour (kWh) generated is paid for at a pre-set feed-in remuneration, guaranteed for 20 years. While the scheme is expected to end running in its current form as of 2021, regulators are positive that the scheme has already been highly successful in developing the German renewable energy market over the past decades and the clean energy technologies are matured enough to go on their own, and they do not expect any sudden, large-scale dismantling of old renewable plants with the stop of the feed-in funding.
United Kingdom: Contracts for Difference
The Contracts for Difference12 scheme is the UK government’s key mechanism for supporting low carbon electricity generation. In accordance with the scheme, the government incentivises investment in renewable energy by providing investors facing high upfront costs and long lifetimes with direct protection from volatile wholesale prices: developers are paid a flat rate for the electricity they generate over a 15-year period. The scheme is in continuous operation and regular amendments13 are made to it to ensure it appropriately reflects actual market conditions and supports developers.
4.2 Interest rate and policy choices
As the above examples illustrate, policies can be designed and implemented to lower the expected risk premium of low carbon investment options, and can be an efficient and effective means of supporting low carbon investment. Moreover, as deployment of new low carbon technologies is achieved at scale, the perceived market risks fall further, creating a ‘virtuous circle’ that policy can directly stimulate.
Of course, there is a wide range of behavioural issues to account for, for example, diverse consumer preferences: even if a policy makes one technology cheaper on average than its fossil fuel alternatives, it does not necessarily become more attractive for all households, eg in certain cases, heating with fossil fuels may still remain the preferred option.
Nevertheless, as a recent opinion piece14 also concludes, the real agenda of policymaking in combatting climate change (across the globe, but in the EU specifically, too) is to address investment barriers and tackle investment constraints. That is the key point of climate and energy policies: to shape future investment decisions. When it comes to modelling the impacts of certain policies, the use of lower discount rates in the higher-ambition scenarios is therefore a justified and advised approach in line with the increasing deployment of those low carbon technologies.
Policies may also be targeted at increasing the operating cost (or even operating limits, such as banning coal-fired power generation) of fossil-intensive technologies in the future, which would increase the risk associated with investing in them, and thereby affect the relative attractiveness of low carbon technologies in the present.

20
Delivering the climate transition:
Exploring the assumed costs of capital in EU energy and economic modelling
5. Conclusions and recommendations 5.1 Conclusions
The analysis presented in this short report is intended to be illustrative. It is not intended to be a comprehensive assessment of the use of interest rates and discount rates in economic modelling, nor is it a comprehensive critique of the European Commission’s Impact Assessment. Instead, it offers some insight into the role of discount rates and interest rates in the context of the energy and economic modelling of a low carbon transition, and specifically relates that to the approach used in the EC’s recent Impact Assessment.
We assert that a high discount rate assumption has the effect of favouring a high carbon future in comparison to a low carbon future, while a lower discount rate assumption would favour a low carbon future. This arises because in nearly all cases, the low carbon option is relatively more capital intensive, despite nearly always having lower operating costs. Although capital costs of low carbon technologies are expected to fall, these technologies will remain relatively capital intensive compared to the high carbon alternatives, which typically have lower capital costs but at the expense of higher operating (fuel) costs. We demonstrated this to be the case by comparing illustrative high and low carbon technologies in three important sectors: power, transport and heating.
We have separated out the application of discount rates in the EC’s energy modelling with the application of a single interest rate in the economic modelling. In the energy modelling a variety of rates are applied, not only intended to reflect market borrowing rates but also the opportunity cost of investment, risk premium and so-called ‘hurdle’ rates to investment. These factors drive a wedge between the market rates and the rates required to undertake any given investment. This is the correct approach, although we suggest that the rates applied might be towards the high end of a plausible range given how low market interest rates are.
By contrast, we believe that the blanket assumption of a 10 per cent interest rate to annualise the capital cost is too high and therefore implicitly overstates the economic costs of a low carbon transition. Our brief review of interest rates available in different European countries and markets suggests that this assumption is higher than the interest rates that will be incurred by most investors. Moreover, the review of market interest rates showed a wide range of interest rates available to different investors (governments, large corporates, businesses and consumers/households) who will ultimately finance the low carbon transition. We therefore also conclude that a blanket assumption across all countries and sectors is a simplifying modelling assumption, rather than a reflection of what might occur in the real world. Without undertaking further modelling, it is not possible to estimate the impact of revising the interest rates assumption on the economic costs.
We also suggest that since policy can be designed to lower risk, as is the case for the feed-in tariffs in Germany and the Contracts for Difference in the UK, there should be a relationship between policy and discount rates as well as the maturity of technologies and discount rates. Moreover, in some cases, governments are directly financing the transition at near zero interest rates. This should be reflected in the economic analysis by using low interest rates for the part of the investment funded by government and attributing the investment to the government sector.
5.2 Recommendations for future modelling
All economic modelling is an abstraction from the real world and it is usually necessary to make simplifying assumptions in quantitative analysis that tries to inform policy decisions.
21
Delivering the climate transition:
Exploring the assumed costs of capital in EU energy and economic modelling
In a perfect world, we would know future interest rates and the discount rates applied by different investors in their decision-making, and we would include these in the modelling. However, in reality it is not feasible to include such detailed differentiation in a modelling exercise. Moreover, interest rates and discount rates are both likely to change over time, partly as a result of policy. Although interest rates are currently low, we do not know what future interest rates will be and it is therefore somewhat futile to try to be too precise in a modelling exercise.
However, given that we find the discount rate and interest rate assumptions to be on the high side and that this assumption biases the results, we recommend the following improvements (in order of ease of implementation):
• Undertake sensitivity analysis by applying a range of discount rate assumptions to provide an insight into the extent to which the discount rate assumption affects the economic outcomes.
• Review discount rate assumptions on a sector-by-sector basis and revise the discount rate assumptions accordingly to reflect the heterogeneity in market interest rates, attitude to risk and perceived barriers to investment (hurdles). We recommend developing a range for each broad sector.
• Ensure consistency in the rates applied between the energy modelling and the economic modelling to reflect who is investing. By consistency, we do not mean the same rates, rather that the economic modelling should reflect differences in the financing costs in different sectors as is currently reflected, at least partially, in the energy modelling.
• More explicitly model the relationship between policies and the risk premium and/or hurdle rate component of the discount rate assumption. Specifically consider the extent to which policies intended to bring about a low carbon transition might either lower the risk premium and/or hurdle rate (for example by guaranteeing the electricity price as some feed-in tariffs have, or by making it easier for households to access funding and expert advice for building renovation) or lower the rate because it is financed directly by government.
• Consider modelling the relationship between technology deployment and the risk premium and/or hurdle rate. Empirically, we know that ‘learning from doing’ lowers the technology cost but it also reduces the risk and removes some of the barriers (hurdles) to investment.

22
Delivering the climate transition:
Exploring the assumed costs of capital in EU energy and economic modelling
Appendix A Market rates – Summary of the country reviews
The below tables show the market rate ranges evidenced by the reviewed sources in the four investigated countries and specifies the sources used. For retail rates, the largest retail banks’ offers have been reviewed in each country.
Table 1: Observed (ranges of) market rates in the UK (annual percentage rate of charge, low and high values based on the reviewed sources
Source: Cambridge Econometrics desk search.
Markets/groups
Observed
interest rate
ranges (% per
annum)
Sources
Government
Short term (1–2
years)
0.09 Bloomberg
Long term (10 years) 0.78 Bloomberg
Corporate
Bonds 1.7–3.5 schroders.com
Bank loan 5.1 lloydsbank.com
Business (SME)
Bank loan 0.98–3.44 Bank of England
Retail HSBC Lloyds Barclays NatWest Santander Nationwide Halifax
Mortgage 2.8–4.3 2.8–4.3 2.6–3.8 2.8–4.0 2.5–3.5 2.8–3.5 3.3–4.4
Secured loan 6.7 3.9 7.9 4.9 3.5 - -
Unsecured loan 6.7 3.9 7.9 4.9 3.5 - -
Credit cards 18.9 18.9 21.9 9.9 18.9 - -
Retail VW Ford Toyota
PCP 4.9 0 4.9
23
Delivering the climate transition:
Exploring the assumed costs of capital in EU energy and economic modelling
Table 2: Observed (ranges of) market rates in Hungary (annual percentage rate of charge, low and high values based on the reviewed sources
Source: Cambridge Econometrics desk search.
Markets/groups
Observed
interest rate
ranges (% per
annum)
Sources
Government
Short term (1–2 years) 0.45 Central Bank of Hungary
Long term (10 years) 2.31 Central Bank of Hungary
Corporate
Bonds 1.9–3.8 portfolio.hu
Bank loan 1.79 Central Bank of Hungary
Business (SME)
Bank loan 2.5 Central Bank of Hungary
Retail OTP K&H Erste UniCredit Raiffeisen
Mortgage 7.4–9 7.8 4.74 6.28–7.86 5.22
Secured loan 4.7–6.9 3.39 3.5 4.48–5.62 3.45
Unsecured loan 15.53 8 10.6 7.39 8.16
Credit cards 38.6 28.4 38.8 39.3 37.2
Retail OTP K&H Erste UniCredit Raiffeisen
Car loan 15.5 12.9 10.6 10.2 8.7
24
Delivering the climate transition:
Exploring the assumed costs of capital in EU energy and economic modelling
Table 3: Observed (ranges of) market rates in Germany (annual percentage rate of charge, low and
high values based on the reviewed sources
Markets/groups
Observed
interest rate
ranges (% per
annum)
Sources
Government
Short term (1–2 years) -0.69 Bloomberg
Long term (10 years) -0.31 Bloomberg
Corporate
Bonds 0.8 Bundesbank
Bank loan 0.96–1.47 Bundesbank
Business (SME)
Bank loan 1.53–2.25 Bundesbank
Retail Deutsche Bank Commerzbank HypoVereinsbank
(UniCredit)
ING-DiBA Santander
Mortgage - - 0.96 - -
Secured loan - - 0.96 - -
Unsecured loan n.a. n.a. n.a. 3.09 1.99–7.98
Credit cards n.a. n.a. n.a. - 13.98
Retail Deutsche Bank Commerzbank HypoVereinsbank
(UniCredit)
ING-DiBA Santander
Car loan n.a. n.a. n.a. 2.39 3.99
Source: Cambridge Econometrics desk search.
25
Delivering the climate transition:
Exploring the assumed costs of capital in EU energy and economic modelling
Table 4: Observed (ranges of) market rates in Slovakia (annual percentage rate of charge, low and
high values based on the reviewed sources
Markets/groups Observed interest rate
ranges (% per annum) Sources
Government
Short term (1–2 years) -0.55 National Bank of Slovakia
Long term (10 years) -0.07 National Bank of Slovakia
Corporate
Bonds 3–9 finax.eu
Bank loan 1.59–1.81 National Bank of Slovakia
Business (SME)
Bank loan 2.31–3.45 National Bank of Slovakia
Retail Slovenská sporiteľňa VÚB Banka Tatra banka CSOB
Mortgage 0.79 0.89–1.99 0.85–1.55 0.89–1.29
Secured loan n.a. 5.9 0.85–1.55 3.9
Unsecured loan 5.9 18.9 5.99 5.5
Credit cards n.a. 19.9 18.8 19.5
Retail Slovenská sporiteľňa VÚB Banka Tatra banka CSOB
Car loan n.a. 5.9 5.99 3.99
Source: Cambridge Econometrics desk search.
26
Delivering the climate transition:
Exploring the assumed costs of capital in EU energy and economic modelling
References
1 European Commission. (2020). Impact Assessment Part 1, Stepping up Europe’s 2030 climate ambition. Investing in a
climate-neutral future for the benefit of our people. Retrieved from: https://ec.europa.eu/clima/sites/clima/files/eu-
climate-action/docs/impact_en.pdf 2 European Commission. (2020). Impact Assessment Part 2, Stepping up Europe’s 2030 climate ambition. Investing in a
climate-neutral future for the benefit of our people. Retrieved from: https://ec.europa.eu/clima/sites/clima/files/eu-
climate-action/docs/impact_part2_en.pdf 3 European Commission. (2016). EU reference scenario 2016: Energy, transport and GHG emissions – Trends to 2050.
Retrieved from:
https://ec.europa.eu/clima/sites/default/files/strategies/analysis/models/docs/ref20160729_report_en.pdf 4 European Commission. (2008). Guide to Cost Benefit Analysis of Investment Projects. Retrieved from:
https://ec.europa.eu/regional_policy/sources/docgener/guides/cost/guide2008_en.pdf 5 Goulder, L. H., & Williams, R. C. (2012). The Choice of Discount Rate for Climate Policy Evaluation. Climate Change
Economics, 3(4)
6 Stern, N. (2008). The economics of climate change. American Economic Review, 98(2), 1–37 7 Green Investment Group. (2015). UK Green Investment Bank helps mobilise £10bn of capital into UK green infrastructure. Retrieved from: https://www.greeninvestmentgroup.com/news/2015/ukgib-helps-mobilise-gbp10bn-of-capital-into-uk-green-infrastructure.html 8 European Commission. (2021). Modernisation Fund. Retrieved from: https://ec.europa.eu/clima/policies/budget/modernisation-fund_en 9 Pauline, P. (2019). How a revolutionary new renovation scheme will rebuild Italy’s shattered economy. Knauf Insulation. Retrieved from: https://www.knaufinsulation.com/news/how-a-revolutionary-new-renovation-scheme-will-rebuild-italys-shattered-economy 10 The European Portal for Energy Efficiency in Buildings. (2021). Practices. BUILDUP.EU. Retrieved from: https://www.buildup.eu/en/nationalregional-schemes-residential-buildings 11 Appunn, K., & Wehrmann, B. (2021). Germany 2021: when fixed feed-in tariffs end, how will renewables fare?
EnergyPost.eu. Retrieved from: https://energypost.eu/germany-2021-when-fixed-feed-in-tariffs-end-how-will-
renewables-fare/ 12 Department for Business, Energy & Industrial Strategy. (2021). Contracts for Difference: policy paper. GOV.UK Retrieved
from: https://www.gov.uk/government/publications/contracts-for-difference/contract-for-difference 13 GOV.UK. (2021). Contracts for Difference (CfD): proposed amendments to the scheme 2020. Retrieved from: https://www.gov.uk/government/consultations/contracts-for-difference-cfd-proposed-amendments-to-the-scheme-2020 14 Riley, B. (2021). Why the Commission is getting it wrong on climate number-crunching. EURACTIV. Retrieved from:
https://www.euractiv.com/section/energy-environment/opinion/why-the-commission-is-getting-it-wrong-on-climate-
number-crunching/
Related Documents