riotinto.com/ar2014 2014 Annual report Delivering sustainable shareholder returns For personal use only

Welcome message from author
This document is posted to help you gain knowledge. Please leave a comment to let me know what you think about it! Share it to your friends and learn new things together.
Transcript
riotinto.com/ar2014
2014 Annual report
Delivering sustainableshareholder returns
For
per
sona
l use
onl
y

Contents
Strategic reportPerformance highlights 1Group overview 2Chairman’s letter 4Chief executive’s statement 5Strategic context 7Group strategy 8Business model 11Key performance indicators 12Principal risks and uncertainties 14Capital allocation 18Sustainable development 20Independent limited assurance report 27
Product groupsAluminium 28Copper 30Diamonds & Minerals 32Energy 34Iron Ore 36
Exploration 38Technology & Innovation 39Financial overview 40Five year review 41
Directors’ reportDirectors’ report 44Board of directors 49Executive Committee 52Corporate governance 53Remuneration ReportAnnual statement by the RemunerationCommittee chairman 64Remuneration Policy 66Remuneration Implementation Report 74
Financial statementsGroup income statement 103Group statement of comprehensive income 104Group cash flow statement 105Group balance sheet 106Group statement of changes in equity 107Notes to the 2014 financial statements 110Rio Tinto plc company balance sheet 175Rio Tinto financial information by business unit 178Australian Corporations Act – summary of ASIC relief 183Directors’ declaration 184Auditor’s independence declaration 185Independent auditors’ report 186Financial summary 2005-2014 192Summary financial data 194
Production, reserves and operationsMetals and minerals production 195Ore reserves 199Mineral resources 204Competent Persons 210Mines and production facilities 212
Additional informationShareholder information 220UK Listing Rules cross reference table 226Financial calendar 227Contact details 228
Navigating through Rio Tinto’s Annual and Strategic reportAs of 2013, the UK’s regulatory reporting framework requires companies to produce a strategic report. The intention isto provide investors with the option of receiving a document which is more concise than the full annual report, andwhich is strategic in its focus.
The first 41 pages of Rio Tinto’s 2014 Annual report constitute its 2014 Strategic report. References to page numbersbeyond 41 are references to pages in the full 2014 Annual report. This is available online at riotinto.com/ar2014 orshareholders may obtain a hard copy free of charge by contacting Rio Tinto’s registrars, whose details are set out onpage 228.
Please visit Rio Tinto’s website to learn more about the Group’s performance in 2014.
This Annual report, which includes the Group’s 2014 Strategic report, complies with Australian and UK reportingrequirements.
Copies of Rio Tinto’s shareholder documents – the 2014 Annual report and 2014 Strategic report, along with the2015 Notices of annual general meeting – are available to view on the Group’s website: riotinto.com
Rio Tinto is reducing the print run of this document to be more environmentallyfriendly. We encourage you to visit: riotinto.com/ar2014 to access a full library ofPDFs of this Annual report.
Cautionary statement about forward-looking statements
This document contains certain forward-looking statements with respect to the financial condition, results of operationsand business of the Rio Tinto Group. These statements are forward-looking statements within the meaning of Section 27Aof the US Securities Act of 1933, and Section 21E of the US Securities Exchange Act of 1934. The words “intend”, “aim”,“project”, “anticipate”, “estimate”, “plan”, “believes”, “expects”, “may”, “should”, “will”, “target”, “set to” or similarexpressions, commonly identify such forward-looking statements.
Examples of forward-looking statements in this Annual report include those regarding estimated ore reserves, anticipatedproduction or construction dates, costs, outputs and productive lives of assets or similar factors. Forward-lookingstatements involve known and unknown risks, uncertainties, assumptions and other factors set forth in this documentthat are beyond the Group’s control. For example, future ore reserves will be based in part on market prices that may varysignificantly from current levels. These may materially affect the timing and feasibility of particular developments. Otherfactors include the ability to produce and transport products profitably, demand for our products, changes to theassumptions regarding the recoverable value of our tangible and intangible assets, the effect of foreign currencyexchange rates on market prices and operating costs, and activities by governmental authorities, such as changes intaxation or regulation, and political uncertainty.
In light of these risks, uncertainties and assumptions, actual results could be materially different from projected futureresults expressed or implied by these forward-looking statements which speak only as to the date of this Annual report.Except as required by applicable regulations or by law, the Group does not undertake any obligation to publicly update orrevise any forward-looking statements, whether as a result of new information or future events. The Group cannotguarantee that its forward-looking statements will not differ materially from actual results.
For
per
sona
l use
onl
y

Performance highlights
2014 results demonstrate clear delivery against our commitmentsIn 2014, Rio Tinto made a commitment to materially increase cash returns to shareholders. The Group delivered this through a 12 per cent increase in the full yeardividend and announced a US$2.0 billion share buy-back. These represent a total cash return to shareholders, in respect of 2014, of almost US$6.0 billion.
During 2014, Rio Tinto’s continued financial and operating discipline enabled the Group to offset much of the impact of lower commodity prices. By increasingvolumes and reducing costs, Rio Tinto achieved underlying earnings(a) of US$9.3 billion and maintained the EBITDA margin(b) at 39 per cent. Free cash flow wasassisted by a further reduction in capital expenditure(c) and a successful programme to release working capital. As a consequence, net debt(d) reduced byUS$5.6 billion to US$12.5 billion.
Decisive early action taken throughout the Group delivered the strong balance sheet, enabling the additional material cash return to shareholders.
With lower commodity prices and uncertain global economic trends, the operating environment remains tough. However, in these conditions Rio Tinto’s qualities andcompetitive advantages deliver superior value. The Group’s combination of world-class assets, disciplined capital allocation, balance sheet strength, operating andcommercial excellence, and a culture of safety and integrity gives Rio Tinto confidence in its ability to continue generating sustainable returns for shareholders.
Year to 31 December 2014 2013 Change
Pg 12 Underlying earnings (US$ millions) (a) 9,305 10,217 -9%Net earnings (US$ millions) (a) 6,527 3,665 +78%
Pg 12 Net cash generated from operating activities (US$ millions) 14,286 15,078 -5%Pg 13 Capital expenditure (US$ millions) (c) 8,162 13,001 -37%
Underlying earnings per share (US cents) 503.4 553.1 -9%Basic earnings per share (US cents) 353.1 198.4 +78%Ordinary dividends per share (US cents) 215.0 192.0 +12%
At 31 December 2014 2013 Change
Pg 13 Net debt (US$ millions) (d) 12,495 18,055 -31%
Gearing ratio (e) 19% 25% -6%
The financial results are prepared in accordance with IFRS and are audited.(a) Underlying earnings is the key financial performance indicator which management uses internally to assess performance. It is presented here to provide greater understanding of
the underlying business performance of the Group’s operations. Net and underlying earnings relate to profit attributable to the owners of Rio Tinto. Underlying earnings is definedand reconciled to net earnings on pages 124 and 125.
(b) EBITDA margin is defined as Group underlying EBITDA divided by product group total revenues as per the Financial information by business unit on pages 178 and 179 where it isreconciled to profit on ordinary activities before finance items and taxation.
(c) Capital expenditure is presented gross, before taking into account any disposals of property, plant and equipment.
(d) Net debt is defined and reconciled to the balance sheet on page 41.
(e) Gearing ratio is defined as net debt divided by the sum of net debt and total equity at each period end.
Revenues and earnings– Achieved consolidated sales revenues of US$47.7 billion, as a
US$5.4 billion (pre-tax) decline in pricing was partially offset byUS$3.0 billion from higher volumes.
– Sustained the EBITDA margin at 39 per cent, unchanged from 2013,with volume gains and cost improvements offsetting the impact oflower prices.
– Achieved underlying earnings of US$9.3 billion, nine per cent lower than2013 despite the US$4.1 billion (post-tax) impact of lower prices.
– Delivered underlying earnings per share of 503.4 US cents.
– Generated net earnings of US$6.5 billion, reflecting non-cash exchangerate losses of US$1.9 billion, a US$0.4 billion charge following the repealof the Minerals Resource Rent Tax and other charges of US$0.5 billion. Animpairment charge of US$1.2 billion mainly related to the Kitimat projectas reported at the half year was mostly offset by an impairment reversal ofUS$1.0 billion in the second half of 2014 related to an uplift in carryingvalue for the Pacific Aluminium business.
Production– Set production records for iron ore and Hunter Valley thermal coal,and delivered a strong operational performance in bauxite, copperand aluminium.
Cash flow and balance sheet– Achieved US$4.8 billion of sustainable operating cash cost
improvements and exploration and evaluation savings since 2012, ofwhich US$1.5 billion were in 2014.
– Generated net cash from operating activities of US$14.3 billion,including working capital improvements of US$1.5 billion, principallyfrom lower inventories and lower receivables.
– Reduced capital expenditure by US$4.8 billion to US$8.2 billion in2014, reflecting completion of existing major projects and continuedcapital discipline.
– Decreased net debt by US$5.6 billion in 2014 to US$12.5 billion at31 December 2014, with gearing of 18.6 per cent. This compares withUS$18.1 billion and 25.2 per cent gearing at 31 December 2013.
Capital returns– Increased full year dividend by 12 per cent to 215 US cents per share.
– Announced an additional capital return of US$2.0 billion,which comprises a A$500 million (c. US$0.4 billion) off-market sharebuy-back tender of Rio Tinto Limited shares and the balance ofapproximately US$1.6 billion for an on-market buy-back of Rio Tintoplc shares.
– These represent a total cash return to shareholders, in respect of 2014,of almost US$6.0 billion, an increase of approximately 64 per centon 2013.
riotinto.com 1
ST
RA
TE
GIC
RE
PO
RT
DIRECTO
RS’R
EPORT
FINANCIA
LSTA
TEMEN
TSPR
ODUCTIO
N,R
ESERVES
ANDOPER
ATIO
NS
ADDITIO
NALINFO
RMATIO
N
For
per
sona
l use
onl
y

Group overview
Introduction to Rio TintoRio Tinto is a leading global mining group that focuses on finding, mining andprocessing the Earth’s mineral resources. Our goal is to deliver strong andsustainable shareholder returns from our portfolio of world-class assets andour compelling pipeline of projects.
We take a long-term, disciplined approach, developing and running long-life,low-cost, expandable operations that are capable of delivering valuethroughout the cycle. Supported by our Exploration and Technology &Innovation groups, our five product groups represent a diversity ofcommodities that give us exposure to demand across the economicdevelopment spectrum(a).
Supporting our world-class assets is a company of world-class people who arethe foundation of our success. This 60,000-strong workforce, across morethan 40 countries, pulls together as a powerful team committed to getting thebest out of our operations. Their safety is always our first concern. We alsofoster a culture of innovation, where our people are proud to achieve and arealways learning.
Our vision is to be a company that is admired and respected for deliveringsuperior value, as the industry’s most trusted partner. Our operations give usthe opportunity to create mutual benefit with the communities, regions andcountries in which we work, and our metals and minerals are transformed intoend products that contribute to higher living standards. (Find out more onpage 11.)
Underpinning everything we do are our values: respect, integrity, teamworkand accountability. They are fundamental to the way we operate and engagewith those around us, and form the foundation of a long-term, reliablebusiness that generates sustainable returns for shareholders.
Aluminium product groupBuilding on more than a century of experience and expertise, Rio Tinto is aglobal leader in the aluminium industry. Our business includes high-qualitybauxite mines, large-scale alumina refineries, and some of the world’s lowest-cost, most technologically-advanced primary aluminium smelters.
ProductsBauxiteBauxite is the natural ore used to make aluminium. It is refined into aluminawhich is smelted into aluminium metal. Our wholly- and partly-owned bauxitemines are located in Australia, Brazil and Guinea.
AluminaAlumina (aluminium oxide) is extracted from bauxite via a refining process.Approximately four tonnes of bauxite are required to produce two tonnes ofalumina, which in turn makes one tonne of aluminium metal. Our wholly- andpartly-owned alumina refineries are located in Australia, Brazil and Canada.
AluminiumAluminium is a unique and versatile modern metal. Light, strong, flexible,corrosion-resistant and infinitely recyclable, aluminium is one of the mostwidely-used metals in the world. Its largest markets are transportation,machinery and construction. Our smelters are mainly concentrated in Canada.We also have plants in France, Australia, New Zealand, Iceland, the UK andOman.
Strategic advantages– Access to the largest and best-quality bauxite ore reserves in the industry,
strategically located to serve growing Chinese bauxite demand.
– One of the lowest-cost bauxite producers.
– Unrivalled hydropower position, which delivers significant cost andother advantages in an energy intensive industry and today’s carbon-constrained world.
– Rio Tinto has a first-quartile cost position for aluminium smelting, withindustry-leading smelting technology.
Key production locations Key sales destinations
– Canada – Asia– Europe – Americas– Australia – Europe
Full operating review on page 28.
Copper product groupRio Tinto’s Copper group is made up of four world-class operating assets andtwo attractive development projects. We are managing the portfolio to bringon new production when the market demands it.
ProductsCopperCopper is a malleable, corrosion resistant, antimicrobial metal and a highlyeffective conductor of heat and electricity. It is an essential component ofnearly all modern electrical systems, including renewable energy sources suchas solar, wind, geothermal and hydro-electric technologies. Global informationand communication technologies rely on it, as do hybrid and electric cars andhospitals and medical facilities, where it is used to prevent the spread ofdiseases and infections. We produce gold, silver and molybdenum as co-products of our copper production.
GoldGold is used as a store of value. It is also highly conductive, malleable andinert, making it a key component in the electronics, chemical production,jewellery, aerospace and medical industries.
SilverSilver has applications in art, science, and industry. It is used in manyelectronic devices, in aerospace applications and semiconductors. A preciousmetal, silver is used to make jewellery and as an investment.
MolybdenumMolybdenum is a metallic element frequently used to produce stainless steeland other metal alloys. It enhances the metal’s toughness, high-temperaturestrength and corrosion resistance.
Strategic advantages– A portfolio of high-quality assets and growth opportunities.
– Attractive growth options that can be delivered when the market requires.
– Clear pathway to deliver superior profitability.
– Industry-leading technology and innovation.
Key production locations Key sales destinations
– US – US– Chile – China– Mongolia – Japan
Full operating review on page 30.
(a) On 27 February 2015, Rio Tinto announced that it would be streamlining its portfolio of assets into four product groups: Aluminium, Copper & Coal, Diamonds & Minerals and IronOre, with immediate effect. The coal assets of the former Energy product group became part of a new Copper & Coal product group, and the uranium assets of the former Energyproduct group became part of the Diamonds & Minerals product group. In this Annual report, references to Copper, Diamonds & Minerals and Energy refer to the product groupsas they existed in 2014.
2 riotinto.com
For
per
sona
l use
onl
y

Diamonds & Minerals product groupThe Diamonds & Minerals product group comprises a suite of industry-leading, demand-led businesses, which include mining, refining and marketingoperations across four sectors. Rio Tinto Diamonds is one of the world’sleading diamond producers, active in mining, manufacturing, selling, andmarketing diamonds. Rio Tinto Minerals is a world leader in borates, withmines, processing plants, and commercial and research facilities. Dampier Saltis one of the world’s largest producers of seaborne salt. Rio Tinto Iron &Titanium is an industry leader in high-grade titanium dioxide feedstocks. TheDiamonds & Minerals group also includes the Simandou iron ore project inGuinea, one of the largest known undeveloped high-grade iron ore resourcesin the world.
ProductsDiamondsDiamonds are an important component in both affordable and higher-end jewellery. We are able to service all established and emergingmarkets as we produce the full range of diamonds in terms of size, qualityand colour distribution.
Titanium dioxideThe minerals ilmenite and rutile, together with titanium dioxide slag, can betransformed into a white titanium dioxide pigment or titanium metal. Thewhite pigment is a key component in paints, plastics, paper, inks, textiles, food,sunscreen and cosmetics. Titanium metal’s key properties of light weight,chemical inertness and high strength make it ideal for use in medicalapplications and in the aerospace industry.
BoratesRefined borates are used in hundreds of products and processes. They are avital ingredient of many home and automotive applications, and are essentialnutrients for crops. They are commonly used in glass and ceramic applicationsincluding fibreglass, television screens, floor and wall tiles, and heat-resistant glass.
SaltSalt is one of the basic raw materials for the chemicals industry and isindispensable to a wide array of automotive, construction and electronicproducts, as well as for water treatment, food and healthcare. Other productsinclude high purity iron, metal powders and zircon.
Strategic advantages– Portfolio of industry-leading businesses operating in attractive markets.
– Demand-led, integrated operations that are responsive to the changingexternal environment.
– Poised to benefit from mid to late-cycle demand growth as consumptionincreases in emerging markets.
Key production locations Key sales destinations
– North America – North America– Australia – South East Asia– South Africa – India
Full operating review on page 32.
Energy product groupEnergy is essential for modern life and the demand for energy continues togrow. Rio Tinto’s Energy product group produced coal and uranium, twoimportant sources of energy from mining. The thermal coal and uranium weproduce is used to generate electricity and our uranium is subject to strictsafeguards and non-proliferation conditions to ensure it is only used forpeaceful purposes. We also produce coking or metallurgical coal, whichis an important ingredient in steel and cement production. We haveoperations, exploration and development projects in Australia, Namibia,South Africa and Canada.
ProductsCoalCoal is a cost effective and abundant energy source and we are a leadingsupplier to the seaborne thermal coal market. Thermal coal is used forelectricity generation in power stations. We also produce higher-value cokingor metallurgical coal, which produces steel when mixed in furnaces with ironore. We have five operating mines in Australia and one in South Africa.
UraniumUranium is one of the most powerful known natural energy sources, and isused in the production of clean, stable, base-load electricity. After uranium oreis mined, it is processed into uranium oxide. This is the product that is sold forprocessing into fuel rods for use in nuclear power stations. We have uraniumoperations in Australia and Namibia, and an exploration project in Canada.
Strategic advantages– Premium Australian coal assets located close to existing infrastructure and
growing Asian markets.
– Successfully transforming the business by reducing costs, increasingproductivity and improving our position on the cost curve.
– Strong product stewardship strategy, including investment in technologiesto reduce emissions from our products.
Key production locations Key sales destinations
– Australia – Japan– Namibia – South Korea
– Taiwan
Full operating review on page 34.
Iron Ore product groupRio Tinto operates a world-class iron ore portfolio, supplying the globalseaborne iron ore trade. We are well positioned to benefit from continuingdemand across China and the developing world. In Western Australia, themajority of our production continues to achieve industry-leading marginsthrough effective cost saving measures, automation and a relentless focus onoptimising operational efficiencies and marketing expertise.
ProductsIron oreIron ore is the key ingredient in the production of steel, one of the mostfundamental and durable products for modern-day living, with uses fromrailways to paperclips. Our iron ore mines are located in Australia and Canada.
Strategic advantages– Proximity of the expanded Pilbara operations in Australia to Asian markets.
– Position as lowest cost major iron ore producer in the Pilbara, with aPilbara cash unit cost of US$19.50 in 2014.
– World-class assets comprising a seamless supply chain withunencumbered optionality.
– A premium product suite driving strong customer relationships supportedby technical and commercial marketing expertise.
Key production locations Key sales destinations
– Australia – China– Canada – Japan
– South Korea
Full operating review on page 36.
riotinto.com 3
ST
RA
TE
GIC
RE
PO
RT
DIRECTO
RS’R
EPORT
FINANCIA
LSTA
TEMEN
TSPR
ODUCTIO
N,R
ESERVES
ANDOPER
ATIO
NS
ADDITIO
NALINFO
RMATIO
N
For
per
sona
l use
onl
y

Chairman’s letter
Dear shareholders,During 2014, your company maintained its steadfast commitment to generatesustainable shareholder returns by supplying the commodities essential formodern life. As this report shows, we delivered strong financial and operationalperformance against a challenging market backdrop. Our success isunderpinned by our strong safety performance, operational excellence,values-driven approach and the best people in the industry.
I am very pleased to report we delivered on our commitments during 2014. Weachieved underlying earnings of US$9.3 billion and our focus on cashgeneration led to net cash from operating activities of US$14.3 billion. Weexceeded our cost reduction target and lowered net debt significantly whilereducing capital expenditure to US$8.2 billion.
Most importantly we fulfilled our promise to you, the owners of our company,to materially increase cash returns. Our primary commitment in terms ofshareholder returns is our progressive dividend policy. In February 2015 weannounced a 12 per cent increase in our full year dividend as well as aUS$2.0 billion share buy-back. These represent a total cash return toshareholders, in respect of 2014, of almost US$6.0 billion. They underscore theconfidence your board has in the resilience and strength of the companydespite ongoing uncertainties in our external markets. We believe thatdelivering returns to shareholders is an important component of our overallapproach to creating shareholder value.
Value through the economic cycleThis improved performance reflects the strategic approach the company hasembedded throughout our more than 140 year history: to invest in andoperate long-life, low-cost, expandable operations in the most attractiveindustry sectors. We focus on the best assets, because they are capable ofdelivering value throughout the cycle.
Volatility has become a characteristic of the rapidly-evolving world in which weoperate. Each year presents a new economic challenge. The past six monthsin particular have seen increased uncertainty in energy, metals and foreignexchange markets. The prices for many of the commodities we produce weresignificantly lower during 2014, with average iron ore prices down 30 per centyear-on-year.
However, given the decisive action we have taken over the past two years, yourcompany is in a strong position to capitalise on the positive long-termfundamentals for our key commodities, despite the short-termmarket challenges.
Rio Tinto’s position as a pre-eminent supplier of raw materials and refinedmetals and minerals products places us in an enviable position. At a time ofsignificant distress for late-entrant or high-cost producers, Rio Tinto has beenable to go about its business in a disciplined and orderly way. This is due toour world-class assets, the quality of our products and customer relationships,and the decisive actions we have taken to strengthen our balance sheet.
We continue to focus on maximising returns from our existing assets whileensuring only the best growth projects attract fresh capital.
We also continue to optimise our portfolio, and in 2014 divested the ClermontJoint Venture and Rio Tinto Coal Mozambique coal businesses, the Søral andAlucam aluminium businesses, and the Copper group’s Sulawesi and Pebbleprojects.
As we disclosed in October 2014, Glencore contacted Rio Tinto regarding apotential merger in July 2014. The Rio Tinto board, after consultation with itsfinancial and legal advisers, concluded unanimously that a combination wasnot in the best interests of Rio Tinto shareholders.
A responsible and transparent businessThe methods the company employs to deliver superior results are asimportant as the results themselves. We remain deeply committed to being aresponsible company providing products the world over to support economicimprovement and social progress.
We operate in a complex and interconnected world where global and localissues – such as biodiversity, climate change, livelihoods, and regionaleconomic development – bring both risk and opportunity to the design,development and management of our operations.
Society’s expectations are increasing, and we will continue to listen carefully toour stakeholders, as we strive to create mutual value.
Our operations can have a substantial positive economic impact on theregions and countries in which we operate. Over the past four years, oureconomic contribution has exceeded US$230 billion.
We lead our industry with our ongoing commitment to tax transparency,publishing our annual Taxes Paid report to hold ourselves and host governmentsto account. We hope others will be encouraged to follow our example.
It is through this combination of facilitating social development, acting as acatalyst for growth, and behaving in an environmentally responsible way, thatwe manage our risks and deliver value for you, our shareholders, and alsocreate projects of worth for the communities in which we work.
Governance – a balance of diversity and depthThe past year has again seen a broadening of experience and diversity on yourboard as we welcomed a number of new non-executive directors.Michael L’Estrange joined the board in September 2014 and Megan Clark inNovember. They bring to Rio Tinto a mix of backgrounds deeply relevant toour strategy and culture, including mining, science and technology, publicpolicy and international relations. At our Australian annual general meeting inearly May, Lord Kerr and Michael Fitzpatrick will step down after many years ofwonderful service. I thank them both for their dedication and immensecontribution to Rio Tinto.
I am delighted that Sam Walsh and Chris Lynch agreed to extend their tenurewith open-ended contracts. They have provided transformative leadershipsince 2013, and I am confident that their experience will continue to drive thedelivery of sustainable results.
A key role of the board is to ensure it has the appropriate successionarrangements for its senior leadership team and that it has the nextgeneration of leaders moving through the company.
Rio Tinto has always prided itself on the breadth and depth of the talent withinour organisation, and the capabilities of our people – across more than40 countries – are highly regarded. I would like to thank Sam, the ExecutiveCommittee, and all of our 60,000 employees across the world for theircommitment, leadership and resilience.
Looking forward with confidenceMarkets are challenging, and in this environment investors seek strength,reliability and consistency. It is in these periods that your company thrives andthe quality of its assets, operational excellence and balance sheet strengthshines through.
Let me assure you that your board, our management, and all our people,are committed to delivering sustainable returns to you, our shareholders.
Thank you for your continued investment in Rio Tinto. I look forward toreviewing progress in 2015 with you next year.
Jan du PlessisChairman
4 March 2015
4 riotinto.com
For
per
sona
l use
onl
y
Chief executive’s statement
Dear shareholders,Your company had a strong year, making truly satisfying progress towardsbuilding a safer, more resilient, world-class business. Our relentless focuson improving performance at all of our operations, driving down costs andstrengthening our balance sheet has enabled us to deliver materiallyincreased cash returns to shareholders. We remain committed to pursuingfurther improvement in the year ahead.
In 2014 we delivered excellent results and upheld our commitment to improveperformance and strengthen the balance sheet. In challenging conditions wedelivered on, and in many cases exceeded, expectations.
It is clear that in the short term we will continue to face challengingcommodity markets as economic and geopolitical uncertainty continues.Divergent monetary policy paths in Europe, the US and parts of Asia arecontributing to financial volatility. China is now experiencing slower, but stillsignificant, economic growth as it rebalances its economic priorities frominvestment towards consumption.
But we also know that against a backdrop of uncertainty, Rio Tinto thrives.Our combination of world-class assets, disciplined capital allocation, balancesheet strength, operating and commercial excellence, and our culture ofsafety and integrity gives me confidence we are best placed to make the mostof the positive long-term demand fundamentals to generate sustainablereturns.
Our strong 2014 results are first and foremost due to the efforts of ourhardworking and dedicated employees around the world. I had the greatpleasure of visiting many of our operations during the year, and yet again I wasinspired by the commitment of our people, and impressed by their expertise.I thank them all for their contributions.
I would like to thank the Executive Committee – including Alfredo Barrios andGreg Lilleyman who we welcomed to the team this year – for their strong andpassionate leadership.
Putting safety firstWe strive to put safety first in everything we do. From small things such asstarting our meetings with what we call a “safety share”, to supportingcommunity mental health initiatives and understanding our critical risks,safety is deeply embedded in our culture.
We reduced our all injury frequency rate by nine per cent in 2014 comparedwith 2013. This was our best year ever in terms of injury rate performance, andover the past five years we have reduced our all injury frequency rate by14.5 per cent.
However success really means everyone returning home safely, every day.Therefore it is with much sadness I report the deaths of two employees atmanaged operations during 2014. In February, at the Gove alumina refinery inAustralia, our colleague Darryl Manderson died due to an equipment incidentwhile carrying out maintenance work. In November, Enrick Gagnon died whena landslide derailed an iron ore train in Canada. I was also greatly saddened bytwo further fatalities earlier in 2015, at QIT Madagascar Minerals and atZululand Anthracite Colliery in South Africa. Both of these 2015 fatalities arecurrently being investigated.
These deaths have had a major impact on the family, friends and workmates ofthese colleagues. We will learn from these tragedies to prevent future ones.
Although our safety performance leads our industry, we need to be constantlyvigilant and focused on improvement. We refreshed our safety strategy in2014 and our goal, above all, remains to eliminate fatalities.
Managing a world-class portfolioOver decades and across our product suite we have built a strong portfolioof businesses. Across the Group in 2014, we saw numerous examples of thestrength of our portfolio. Among the highlights of our operational performancewere the production records we set for iron ore and Hunter Valley thermal coal.
Our Pilbara iron ore business reached its 290 Mt/a run rate two months aheadof schedule. Expanding our Pilbara operations to 360 Mt/a rests comfortablywith our view of the longer-term demand for iron ore. These operations areworld class in terms of assets, optionality, and low-cost operatingperformance, as well as in our marketing expertise and leading-edgeapplication of technology.
The expansion translated into excellent product group earnings and cash flowfor Iron Ore. Despite significant price declines for its products, Iron Ore’sunderlying earnings reached US$8.1 billion. This was a reduction of only18 per cent on 2013, thanks to continued cost reduction efforts and thefavourable effect of the weaker Australian dollar.
The turnaround of our Aluminium business continued in 2014. Higher prices foraluminium and our focus on efficiency and productivity saw the product group’sunderlying earnings more than double, from US$557 million in 2013 toUS$1.2 billion in 2014. Our bauxite business is generating handsome margins,but more work is needed in the alumina side of the portfolio. So we have setsome tough targets for 2015, and we expect alumina’s profile to steadilyimprove.
The Copper group delivered an 11 per cent increase in underlying earnings.This was despite a seven per cent reduction in average copper prices, andreflects the group’s success in reducing costs and boosting productivity.Copper also increased production volumes and made more good progress insimplifying the portfolio.
The Diamonds & Minerals group continued to focus on maximising cash flowmatching capacity to the market – the right approach for these specialistproducts. The product group achieved underlying earnings of US$401 million,a 15 per cent increase on 2013, as higher volumes and lower costs more thanoffset lower prices in the minerals portfolio.
Lower prices across the coal sector decreased our Energy group’s earnings byUS$434million. Not all of this could be offset by the good progress the Energyteam continued tomake in reducing operating costs andmaximising efficiencies.Ultimately this resulted in a loss of US$210million of underlying earnings.
All of our product groups have high-quality growth options, which we continueto pursue in a disciplined manner. We believe we have the right capitalallocation framework and the right level of spending to support value-accretivegrowth while ensuring we retain a strong balance sheet and meet ourcommitment to deliver sustainable returns.
As part of our continued focus on efficiency and costs, we announced on27 February 2015 that we would be streamlining our product group structure,with immediate effect. Under the new arrangements, Rio Tinto’s world-classportfolio of assets has been condensed into four product groups: Aluminium,Copper & Coal, Diamonds & Minerals and Iron Ore.
I would like to recognise the significant contributions of Jacynthe Côté andHarry Kenyon-Slaney who left or will leave the company during 2014 and early2015 respectively. I thank them both and wish them both well.
riotinto.com 5
ST
RA
TE
GIC
RE
PO
RT
DIRECTO
RS’R
EPORT
FINANCIA
LSTA
TEMEN
TSPR
ODUCTIO
N,R
ESERVES
ANDOPER
ATIO
NS
ADDITIO
NALINFO
RMATIO
N
For
per
sona
l use
onl
y

Chief executive’s statement continued
Focus and agilityIn many respects, our industry-leading businesses are where others wish tobe; however, now is not the time for complacency.
We must anticipate, adapt and respond with urgency to changing conditions,sustaining our focus on efficiency in areas that make a difference – rein in ourcosts, ensure every dollar is spent wisely and remove wasteful working capital.
Rio Tinto’s balance sheet is strong and sound and we are committed tomaintaining this position. In a period of market instability, a robust balance sheet isamajor advantage. It protects the business, it protects shareholders and it createsa platform for future growth. It provides flexibility to undertake future projects – asand when required – and to find the best ways to reward shareholders.
On page 10, you can read more about the areas we will be focusing on in 2015as we strive to enhance our performance even further.
Delivering sustainable valueIn 2014, your company fulfilled its commitment to deliver greater value forshareholders. In doing so, we have also created value for many of ourpartners around the world who are so integral to the continuing successof our business.
I believe the quality and commitment of our people sets us apart, as doesthe way they embrace and embody our values: respect, integrity, teamworkand accountability.
I would like to thank our employees for their dedication and hard work, ourstakeholders for continuing to partner with us, and you, our shareholders forinvesting in our company.
SamWalsh AOChief executive
4 March 2015
6 riotinto.com
For
per
sona
l use
onl
y

Strategic context
Global economyThe positive momentum in developed economies in late 2013 fuelledexpectations of an acceleration in global growth, but that faded in early 2014.In the end, the US remained one of the few bright spots in the global economyin 2014 while China’s slowdown became more entrenched. Europe failed toemerge meaningfully from imposed austerity, Japan’s growth was negativelyimpacted by a consumption tax hike and emerging economies suffered fromthe delayed recovery in global trade. As a result, the global economy grew byonly just over three per cent in 2014, in line with growth in the previous twoyears, and below the International Monetary Fund’s forecast of 3.7 per centgrowth at the start of the year.
Despite most economies continuing to deal with consequences from the2008/09 global financial crisis (GFC), volatility in financial markets fell to lowlevels during the first part of 2014. Equity markets reached record levels,supported by sustained loose monetary policies. Nervousness howeverreturned to the markets towards the end of year on the back of risinggeopolitical tensions, a very sharp drop in oil prices and reminders of fragilitiesin the eurozone.
In China, growth in 2014 came just below the government’s target of 7.5 percent. The new leadership attempted to bring the credit boom of the past fiveyears under control while preventing a contagion from weak property andexport sectors to the broader economy. This balancing act is likely to continueinto 2015 and we expect China’s GDP growth to slow further to around sevenper cent. The economy is in the middle of a long-signalled transition awayfrom the investment-led and commodity-intensive growth model of the pastcouple of decades towards a stronger focus on consumption and services aswell as a cleaner environment. This “new normal” implies still-significant butslower GDP growth and maturing commodity demand.
Among developed economies, monetary policies are moving on divergentpaths. The US managed to shrug off severe winter disruptions at the start of2014 to sustain a robust pace of growth. Manufacturing activity was strongthroughout the year and the labour market strengthened appreciably. As aresult, the Federal Reserve unwound its Quantitative Easing (QE) programmeand the focus has now shifted towards the timing of the first interest rate hikein the US since the financial crisis, expected in 2015. In contrast, the EuropeanCentral Bank has embarked on a new QE initiative in an attempt to kick-start arecovery in Europe’s periphery countries, stimulate growth in the core beyondGermany and counter growing deflation risks. With the Bank of Japan alsoextending its QE programme in October 2014 there is an increasinglypronounced dual track in the post-GFC recovery process within Organisationfor Economic Co-operation and Development (OECD) economies.
The divergent monetary policies are putting upward pressure on the US dollar,which rallied strongly against most currencies in the later part of 2014.Meanwhile, the euro fell to a nine-year low against the US currency by thestart of 2015. The broad US dollar strength, combined with weaker metals andminerals prices, also put downward pressure on commodity-dependentcurrencies such as the Australian and Canadian dollars, both of whichdepreciated by around eight per cent in the course of 2014. Unlike foreignexchange, the US bond market was resilient to the anticipated shift inmonetary policy last year. This could reflect concerns that even as developedeconomies finally emerge from post-GFC adjustment, they might only returnto a growth trajectory that is lower than that of the early-2000s.
Drivers of commodity pricesLong-term structural economic trends are important drivers of futurecommodity prices through their effects on commodity demand. The economicdevelopment and urbanisation of emerging countries goes through an initialinvestment-led growth phase, which is particularly commodity-intensive. Thisbenefits commodities such as steel and copper used in construction andinfrastructure. As economies evolve, other commodities such as light metals,energy products and industrial minerals tend to take over as the mainenablers of consumption-led growth models.
While the macroeconomic environment provides a common demand context,supply-side factors can result in stark structural differences betweencommodities. In principle, commodity prices will tend to have a relationshipwith the cost of developing and extracting metal and mineral resources.However the exact nature of that relationship depends on barriers to entry andexit, which are specific to each sector and evolve over time.
The long-term nature of mining investment, combined with high capital-intensity and long project lead-times, tends to result in cyclical investmentpatterns in the industry as a whole, which also translates into cyclicalcommodity prices.
Across many commodity sectors, the general supply trends in recent yearshave pointed towards fewer discoveries, falling ore grades and maturing existingoperations as well as greater complexity of projects. In a context of acceleratingdemand from China, a period of higher prices and margins was required toincentivise the necessary supply-side response. With supply finally catching upwith demand for most commodities, focus has naturally switched towardsmanaging margin compressions and extracting productivity gains from recentinvestment instead of committing significant capital into new projects.
Commodity marketsThe subdued global macro environment combined with strong supply resultedin significant downturns for most commodity prices in 2014 and into 2015.
Prices for iron ore, which had been one of the most resilient commodities in2013, were down 30 per cent on average year-on-year in 2014. The addition ofseaborne iron ore capacity exceeded demand growth, tipping the markets intooversupply. Pressured by falling prices, about 125 million tonnes of high costproduction from China and non-traditional seaborne suppliers exited the marketin 2014. The continued ramp-up of committed supply is expected to once againexceed the growth in iron ore demand in 2015. However, with further exits ofhigh-cost producers anticipated, the market will be more in balance.
Thermal and metallurgical coal had already experienced large price falls in2013 and continued on a declining trend in 2014, reaching five- and seven-year lows respectively. Production has been slow to react to the new priceenvironment, in particular in China where State Owned Enterprises account fora large share of output, which, combined with further cost reductions acrossthe industry, led to lower prices.
Aluminium was one of the few commodities to see an increase in prices in2014 when considering rising regional premiums. A combination of continuedstock financing and more disciplined supply contributed to the improvedmarket environment. Indonesia’s bauxite ore export ban remained in placethroughout 2014, resulting in higher Chinese demand for alumina and bauxitefrom alternative sources. Lower bauxite inventories in China should supportimports of Australian bauxite into China in 2015.
In copper, despite the stronger ramp-up in new mine supply, low reportedinventories moderated the price decline in 2014. Concerns over near-termdemand have weighed more heavily on copper prices so far in 2015.
Titanium dioxide prices remained under pressure in 2014 as inventoriescontinued to be absorbed.
OutlookEconomic growth is likely to remain modest and only mildly supportive forcommodity demand in the near term. The start of 2015 suggests it will be achallenging year with continued industry-wide margin compression. The fallsin oil prices and applicable exchange rates will provide some relief for miners,but could also delay the exit of higher cost producers. It is therefore likely thatthe industry will continue to put strong controls over capital budgets andfurther focus on productivity, costs and margins.
Although the outlook for our operating environment remains tough, Rio Tintois positioned to perform better than many competitors in challengingconditions. Our strong balance sheet and world-class portfolio are competitiveadvantages that equip us to generate sustainable returns through the cycle.
riotinto.com 7
ST
RA
TE
GIC
RE
PO
RT
DIRECTO
RS’R
EPORT
FINANCIA
LSTA
TEMEN
TSPR
ODUCTIO
N,R
ESERVES
ANDOPER
ATIO
NS
ADDITIO
NALINFO
RMATIO
N
For
per
sona
l use
onl
y

Group strategy
External pressures continueThe mining industry is cyclical. Following a decade-long growth phase, it hasnow firmly entered a period of lower prices, driven by a subdued global macroenvironment combined with strong supply. We expect the current phase ofmargin compression to continue as previously committed supply enters ourmarkets and the key drivers of demand growth taper off. Meanwhile, volatility –a feature of the macroeconomic environment since the global financial crisis –is expected to continue, bringing with it further short-term risk.
Our response to this has been to continue to focus on productivity, costreductions and capital discipline – squeezing maximum returns out of ourexisting businesses while ensuring only the best growth projects attractcapital. Others in the sector have embarked upon similar paths. Inefficienciesare being exposed, and so reductions in costs and capital expenditure,productivity improvements, and project deferrals and cancellations havebecome widespread across the mining industry.
Despite the uncertain conditions that we currently face, the long-term outlookfor our sector remains positive. These factors drive demand for the mineralsand metals we produce, as essential ingredients of modern life. They make ourbusiness a sustainable and valuable one to be in.
Consistent strategy underpinned by six value driversIn today’s challenging market conditions it is all the more important to have aclear and effective strategy. We remain convinced that our longstanding andconsistent strategy is the right one: to invest in and operate long-life, low-cost,expandable operations in the most attractive industry sectors.
Sustainable shareholder returnsIn 2014 we reaffirmed our commitment to deliver sustainable returns toshareholders. Six critical value drivers underpin this commitment, andcombine to create a platform for our ongoing success.
Free cashflow generation
Operating and commercial
excellence
Balance sheetstrength
Capitalallocationdiscipline
A world-class portfolio
Quality growth
Sustainableshareholderreturns
1. World-class portfolioAt the heart of Rio Tinto is a portfolio of world-class assets – from our Pilbarairon ore business, to our Queensland bauxite ore reserves, hydro-poweredaluminium smelters, our global suite of copper mines and sector-leadingenergy, diamonds and minerals assets. We use a clear strategic framework toassess our existing assets and new opportunities – taking into account theindustry attractiveness and the competitive advantage of each asset, and itscapacity to deliver best-in-class returns.
2. Quality growthWe have a compelling pipeline of near-term and longer dated projects acrossthe portfolio. By reinforcing capital discipline and reshaping our projects, wehave retained significant, high quality growth despite significantly reducing ourcapital expenditure. Our project pipeline has a compelling internal rate ofreturn and is expected to deliver strong compound annual growth.
3. Operating and commercial excellenceThe safety of our people is core to everything we do, and we remain atthe forefront of the industry in safety performance. A well-run operation isa safe operation.
We have established a leading position in the development and use oftechnology and innovation – allowing us to increase productivity and reducerisk. As the industry faces increasingly complex geological, environmental andcost pressures, our technology advantage will be an increasingly importantvalue driver.
Our commercial activities aim to ensure we reap the maximum value fromeach of our businesses. Our marketing teams work hand-in-hand with ouroperations, so that our resource management is fully aligned to the market.
Over the years we have leveraged our understanding of customer needs tocreate new markets for our products, including high temperature Weipabauxite, and champagne and pink diamonds. We deploy industry-leadingcapabilities in supply chain optimisation and a variety of logistics solutionsacross the Group – and have in-house centres of excellence for value-in-useanalysis, pricing and contracting strategies. Together, these activities allow usto manage risk and capture value in all market conditions.
4. Balance sheet strengthIn a cyclical and capital intensive industry such as mining, a strong balancesheet is essential in order to preserve optionality and generate shareholderwealth at all points in the cycle. We target a net gearing ratio of 20 to30 per cent in order to maintain our robust balance sheet – and aim to stay atthe lower end of this range at the current point in the cycle. This positions usfavourably to withstand current industry pressures, protect shareholders andseize on any opportunities these market conditions create.
5. Capital allocation disciplineWe have a consistent and disciplined approach to capital allocation. Our firstallocation is to essential sustaining capital for our operations. Next, we fundour primary contract with our shareholders – the progressive dividend. Finally,we assess the best use of the remaining capital between alternatives ofcompelling growth, debt reduction and further cash returns to shareholders.At each stage, we apply stringent governance and assessment criteria as weseek to maximise return on every dollar spent.
6. Free cash flow generationOver recent years we have made improvements to our business – increasingour productivity, reducing operating and capital costs and deliveringincremental volume expansions from high quality projects. Together with thequality of our asset base, these actions enhance our capacity to generate freecash flows, and underpin our confidence in our ability to deliver sustainablereturns to shareholders.
8 riotinto.com
For
per
sona
l use
onl
y
Progress against strategy
What we said we would do in 2014 What we did
World-class portfolio
Continue reshaping our portfolio Announced or completed asset sales of US$3.9 billion since 2013(see page 19)
Curtail the Gove alumina refinery during the first half of 2014 Production at Gove curtailed in May 2014(see pages 28 to 29)
Keep sustaining capital expenditure at 2013 levels of around US$3 billion Reduced sustaining capital expenditure to US$2.7 billion(see page 13)
Quality growth
Reduce total capital expenditure to less than US$11 billion in 2014 and to aroundUS$8 billion in 2015, while delivering steady growth
Reduced capital expenditure from US$13.0 billion in 2013 to US$8.2 billion,completing two major projects which enabled us to bring on significantnew volumes(see page 18)
Continue to progress key evaluation projects at a pace that matches our overallview of investment priorities
Progressed studies at South of Embley (bauxite), La Granja and Resolution(copper), Zulti South (titanium dioxide), Mount Pleasant (thermal coal) andRanger 3 Deeps (uranium)(see pages 28 to 37)
Ramp up the Pilbara operations to reach an annual production rate of 290 Mt/abefore the end of the first half of 2014
Annual production rate of 290 Mt/a from the Pilbara reached in May 2014,two months ahead of schedule.
Increase Pilbara mine production capacity by 60 Mt/a between 2014 and 2017, byfocusing predominately on brownfield expansions and low-cost productivity gains
40 Mt/a of low-cost, brownfield growth in implementation. Investmentdecision on Silvergrass mine not required in 2015.(see pages 36 to 37)
Continue to discuss the pathway forward for Oyu Tolgoi underground expansionwith the Government of Mongolia
Continued discussions with the Government of Mongolia over thedevelopment pathway. Finalised underground feasibility study andtechnical report(see pages 30 to 31)
Operating and commercial excellence
Target, above all, the elimination of workplace fatalities Regrettably, our Group had two fatalities at our managed operationsduring 2014(see page 22)
Achieve year-on-year improvement in AIFR and lost time injuries Our all injury frequency rate (AIFR) improved from 0.65 per 200,000 hoursworked in 2013 to 0.59 in 2014(see page 22)
Improve how we manage critical risks and learn from serious potential accidents Updated our safety strategy to confirm our focus on injury reductionand strengthen our emphasis on fatality elimination and catastrophicevent prevention(see page 22)
Deliver further savings to reach US$3 billion full-year improvement in 2014versus 2012 in operating cash costs
Achieved a further US$1.3 billion of operating unit cash cost improvements in2014, delivering total operating cash cost savings of US$3.6 billion versus2012(see page 40)
Maintain the reduced exploration and evaluation spend achieved in 2013 Reduced exploration and evaluation spend by a further US$0.2 billion(see page 38)
Increase sales volumes at Oyu Tolgoi Increased mined copper and gold production at Oyu Tolgoi by 94% and 275%respectively compared with 2013, with copper sales increasing seven-fold(see pages 30 to 31)
riotinto.com 9
ST
RA
TE
GIC
RE
PO
RT
DIRECTO
RS’R
EPORT
FINANCIA
LSTA
TEMEN
TSPR
ODUCTIO
N,R
ESERVES
ANDOPER
ATIO
NS
ADDITIO
NALINFO
RMATIO
N
For
per
sona
l use
onl
y
Group strategy continued
What we said we would do in 2014 What we did
Balance sheet strength
Pay down debt to a more sustainable level Reduced net debt from US$22.1 billion in June 2013 to US$12.5 billion at31 December 2014. The gearing ratio at the end of 2014 was 18.6%,compared with 25.2% at the end of 2013(see page 13)
Capital allocation discipline
Continue to apply our enhanced capital allocation systems and controls Maintained “cash generation offices” to strengthen the focus on cash andimprove visibility for senior managers in this areaContinued to reinforce Investment Committee approvals process(see pages 18 to 19)
Allocate capital in the following order of priority: essential sustaining capitalexpenditure; progressive dividends; iterative cycle of compelling growth, debtreduction, and further cash returns to shareholders
Disciplined capital allocation framework adhered to, resulting in: sustainingcapital of US$2.7 billion, progressive dividend of US$3.7 billion, compellinggrowth of US$5.5 billion and net debt reduction of US$5.6 billion(see pages 18 to 19)
Free cash flow generation
Reduce working capital Released US$1.5 billion of working capital(see page 1)
Materially increase returns to shareholders Increased our progressive dividend by 12 per cent and announced on12 February 2015 a share buy-back of US$2.0 billion (a combined increase of64 per cent compared with 2013)(see pages 18 to 19)
Our 2015 strategic prioritiesWe will continue to focus on our critical value drivers in 2015, in order to meetour commitment to deliver sustainable returns to shareholders.
As always, we will maintain our relentless focus on safety, as measured byboth the elimination of fatalities and minimising all injury frequency ratesand lost time injuries.
We will continue to shape our world-class portfolio – ensuring that we focus ononly the highest returning assets in our preferred industry sectors, and thatour capital is deployed in the most efficient way.
We will further enhance our portfolio as we complete a number of key growthprojects, including the infrastructure for our 360 Mt/a iron ore expansion andour new Kitimat smelter. Beyond this, we will progress our South of Embleybauxite project and will continue our work on creating the conditionsnecessary to further advance the underground expansion of Oyu Tolgoi.Importantly, we will deliver measured, value-adding growth while reducing ourcapital expenditure to less than US$7.0 billion in 2015.
Our strong focus on costs will continue in 2015, as we target further operatingcash cost savings of US$750 million and continue to optimise our workingcapital. We will further leverage our strength in technology and innovation, andour leading commercial capabilities, to ensure we remain the supplier of choiceto our customers and maximise the cash generated from every business.
Maintaining our balance sheet strength will remain a core priority. We aim tomaintain our gearing ratio at the low end of the 20 per cent to 30 per cent range.
10 riotinto.com
For
per
sona
l use
onl
y
Business model
How we create valueRio Tinto owns a portfolio of world-class assets, the result of investmentdecisions made in line with our longstanding strategy. The way we find,develop and operate these assets; the way we market the minerals and metalswe produce; and the legacy we leave at the end of these assets’ lives enablesus to create value and deliver sustainable shareholder returns.
Through productivity improvements, cost reductions and prudent growth wepreserve and enhance value from our portfolio. We commit to finding eversafer, smarter and more sustainable ways to run our businesses, and ourcompetitive advantages – which spring from a combination of our assets, ourpeople, our capabilities and our values – keep us strong throughout the cycle.
Explore and evaluateOur experienced in-house exploration team has a proven track record ofdiscovering Tier 1 orebodies: the highest-value deposits that are profitablethroughout the commodity cycle. We maximise opportunities by exploring forand evaluating deposits in new geographies and in our preferred commodities.We also explore the orbits of our current operations, like Weipa in Australia orBingham Canyon in the US, which sustains the value of our existingbusinesses. So that we can keep our focus on targets that are important toRio Tinto, we operate the majority of exploration programmes ourselves, ratherthan outsourcing. We will, however, partner with others if it gives us access toattractive opportunities, or skills, that we do not possess in-house, and whichsupport the quality of our exploration pipeline.
Our orebody knowledge allows us to find value-enhancing ways of developingour resources and positioning our products in the marketplace, and helpssupport the Group’s investment decision-making. Our geological expertisegives us the confidence to keep hunting for the most elusive discoveries. Andwe have a strong tradition of developing and applying innovative technologiesto resolve specific exploration challenges.
DevelopWe develop orebodies for long-term value delivery. We have strengthened ourinvestment assessment criteria, our levels of independent review ofopportunities and our investment approval processes. We approve investmentonly in opportunities that, after prudent assessment, offer attractive returnsthat are well above our cost of capital.
During the development phase, we plan the most efficient configurationfor mining the orebody and for getting the products to market. We workclosely with our customers, to create demand for the optimal suite ofproducts, thus maximising value over the deposit’s lifetime. Once the valueof the resource is confirmed, and internal and external approvals are received,the project moves into implementation and construction. We aim to deliverprojects on time and on budget – such as reaching our targeted 290 Mt/aannual production rate from the Pilbara iron ore operations in May 2014,two months ahead of schedule.
Mine and processWe create value by safely and efficiently operating assets that fit with ourstrategy. By focusing on operating excellence we will sustain our low-costleadership position and drive our operations even further down the cost curve.
Our global operating model allows us to implement standard processes andsystems across the Group, for instance in procurement, operations andmaintenance. This increases the life of our equipment and optimises theextraction of ore. In turn, we enjoy higher production and reduced costs, andwe maximise value.
Our commitment to technology and innovation sets us apart from our peersand allows us to take advantage of opportunities that may not be available toothers. Our world-class technologies bring us ongoing productivity benefits, andhelp us tailor our products to our customers’ needs. Through our network ofpartnerships with academia, technology suppliers and other experts, we gainaccess to knowledge and technical prowess that augment our own capabilities.
Market and deliverSupplying high-quality products, which have been developed to meet ourcustomers’ needs, is the basis of our business. Our diverse portfolio of metals
andminerals allows us to respond to demand across the development cycle: wesupply basic rawmaterials and refined products that are the building blocks ofadded-value goods. Most of our customers are industrial companies that processour products further and supply numerous sectors – including construction andinfrastructure, automotive, machinery, energy and consumer goods.
Our marketing teams work closely with our operations, so that our resourcemanagement is fully aligned to the market, and we innovate and improve ourproducts and services to maximise value to customers.
We are constantly adding to our knowledge of our markets and our customers’requirements, allowing us to improve our investment decisions. In manycases, we are responsible for delivering product to our customers, and do soefficiently, reliably and cost-effectively. We have capabilities across a varietyof logistics solutions, including our own networks of rail, ports and ships.
Close down and rehabilitateWe integrate closure planning throughout an asset’s life cycle, from theearliest stages of project development, and aim to progressively rehabilitate asmuch land as possible before closure. When a resource reaches the end of itslife, we seek sustainable and beneficial future land uses, to minimise financial,social and environmental impact. We work together with our stakeholders toidentify post-closure options that take into account their concerns and theirpriorities for the use of the land. By partnering with external conservationorganisations, we access expertise that helps us improve our rehabilitationperformance. Our approach helps us to maintain a positive reputation anduphold our licence to operate.
Read more about how we embed sustainability throughout our business onpages 20 to 26.
Delivering value for our stakeholdersRio Tinto’s primary focus is on the delivery of value for our shareholders. Webalance disciplined investment with prudent management of our balancesheet and cash returns to shareholders. We offer a long-term investmentopportunity, and commit to sustainable growth in returns to shareholdersthrough our progressive dividend policy. As we work, fixed on this core aim,our activities also give us the opportunity to create value for our otherstakeholders, in a variety of ways.
CustomersWe supply our customers with the right products at the right time. They thenadd further value, by turning them into the end products that society needs tomake modern life work.
CommunitiesOur operations create employment and career development opportunities forour local communities, as well as business opportunities for local suppliers.Communities often benefit from the infrastructure we put in place to serve ourfacilities and, once our operations are closed, we restore the sites – often forcommunity use, new industry, or back to native vegetation.
Our peopleWe invest in our people throughout their careers, offering diverse employmentprospects, opportunities for development, and competitive rewards andbenefits that have a clear link to performance.
GovernmentsWe are often a major economic contributor to the local, state and nationaljurisdictions in which we operate. Our tax and sovereign equity contributionsenable governments to develop and maintain public works, services andinstitutions. We work together to facilitate growth of diverse and sustainableeconomies that endure far beyond the active life of our operations.
SuppliersBy seeking a balance of global, national and local supply capability, andsupporting local supplier development, we drive value for our shareholdersand deliver economic benefits for the communities in which we operate.
riotinto.com 11
ST
RA
TE
GIC
RE
PO
RT
DIRECTO
RS’R
EPORT
FINANCIA
LSTA
TEMEN
TSPR
ODUCTIO
N,R
ESERVES
ANDOPER
ATIO
NS
ADDITIO
NALINFO
RMATIO
N
For
per
sona
l use
onl
y

Key performance indicators
Our key performance indicators (KPIs)enable us to measure our financial andsustainable development performance.Their relevance to our strategy and ourperformance against these measures in2014 are explained below.
Some KPIs are used as a measure in thelong-term incentive arrangements for theremuneration of executives. These areidentified with this symbol:
KPI trend dataThe Group’s performance against each KPIis covered in more detail in later sectionsof this Annual report. Explanations of theactions taken by management to maintainand improve performance against eachKPI support the data.
See the Remuneration Report onpage 64
Notes
(a) The accounting information in these chartsis drawn up in accordance with IFRS.
(b) Underlying earnings is the key financialperformance indicator which managementuses internally to assess performance. It ispresented here as a measure of earnings toprovide greater understanding of theunderlying business performance of theGroup’s operations. Items excluded fromnet earnings to arrive at underlyingearnings are explained in note 2 to the2014 financial statements. Both netearnings and underlying earnings deal withamounts attributable to the owners ofRio Tinto. However, IFRS requires that theprofit for the year reported in the incomestatement should also include earningsattributable to non-controlling interestsin subsidiaries.
Indicator
All injury frequency rate (AIFR)Per 200,000 hours worked
Underlying earnings(a) (b)
US$ millionsNet cash generated from operatingactivities(a)
US$ millions
Relevance to strategy
The safety of our people is core toeverything we do. Our goal is zero harm,including, above all, the elimination ofworkplace fatalities. We are committedto reinforcing our strong safety culture,and improving safety leadership.
This is the key financial performanceindicator used across the Group. Itgives insight to cost management,production growth and performanceefficiency. We are focused on reducingour costs and increasing productivity toimprove earnings and deliversustainable returns to shareholders.
Net cash generated from operating activitiesis a complementary measure demonstratingconversion of underlying earnings to cash. Itprovides additional insight to how we aremanaging costs and increasing efficiency andproductivity across the business in order todeliver increased returns.
Performance
20142013201220112010 20142013201220112010
0.67
0.67 0.65
0.59
0.69
15,572
9,269
10,217
9,305
13,987
20142013201220112010
20,235
9,430
18,277
15,078
14,286
Our AIFR has improved by 14 percent over the last five years. Weimproved our AIFR by nine per cent from2013. However, we did not meet our goalof zero fatalities and two people diedwhile working at Rio Tinto managedoperations in 2014.
Underlying earnings have decreased byUS$912 million compared with 2013.This reflects strong volumes (primarilyin iron ore), favourable exchange rates,operating cash cost improvements andreductions in exploration andevaluation expenditure, which largelyoffset the unfavourable effect of pricemovements on major commodities.
Net cash generated from operatingactivities of US$14,286 million, which includeUS$298 million of dividends from equityaccounted units, are five per cent lower thanin 2013, primarily as a result of lower priceswhich were partially offset by higher volumes,cash cost improvements and favourablemovements in working capital.
Definition
AIFR is calculated based on the numberof injuries per 200,000 hours worked.This includes medical treatment cases,and restricted work-day and lost-dayinjuries for employees and contractors.
Items excluded from net earnings toarrive at underlying earnings areexplained in note 2 to the 2014financial statements.
Net cash generated from operating activitiesrepresents the cash generated by the Group’sconsolidated operations, after payment ofinterest, taxes, and dividends to non-controlling interests in subsidiaries.
More information
Page 22 Pages 178 to 179 Page 105
12 riotinto.com
For
per
sona
l use
onl
y

Total shareholder return (TSR)%
Net debt(a)US$ millions
Capital expenditure(a)US$ millions
Greenhouse gas (GHG) emissionsintensityIndexed relative to 2008 (2008 beingequivalent to 100)
The aim of our strategy is to maximisetotal shareholder return over the longterm. This KPI measures performance interms of shareholder wealth generation.We also monitor our relative TSRperformance against peers.
Net debt is a measure of how we aremanaging our balance sheet andcapital structure. A strong balancesheet is essential for withstandingexternal pressures and seizingopportunities through the cycle. Weconstantly evaluate and balance thealternative uses for our cash betweendisciplined investment, strengtheningour balance sheet, and returning cashto investors.
We adopt a consistent approach tocapital allocation. We are committed toa disciplined and rigorous investmentprocess – investing capital only inassets that, after prudent assessment,offer attractive returns that are wellabove our cost of capital.
Our GHG performance is animportant indicator of ourcommitment and ability to manageexposure to future climate policyand legislative costs, and is closelylinked to our energy use and cost.We are focusing on reducing theenergy intensity of our operationsas well as the carbon intensity ofour energy, including through thedevelopment and implementationof innovative technologies.
20142013201220112010 20142013201220112010 20142013201220112010
8,342
4,071
19,192
18,055
12,495
70
96.1
95.9 94.1
83.2 82.0
12,573
17,615
13,001
8,162
4,591
20142013201220112010
(31.2)
14.8
2.1
(9.7)
31.6
Rio Tinto’s TSR performance over thefive-year period from 2010 to 2014 wascharacterised by continued nervousnessin global equity markets. Total dividendspaid in calendar year 2014 were 204.5 UScents per share, a 15 per cent increase on2013. The subdued global macroenvironment coupled with a strongsupply response caused prices for manyof our commodities to decrease, which, inturn, pushed the Rio Tinto plc andRio Tinto Limited share prices lower in2014. These factors resulted in theRio Tinto Group registering a TSR of -9.7 per cent in 2014.
Net debt decreased from US$18,055million at 31 December 2013 toUS$12,495 million at 31 December2014 due to operating cash inflowsfrom divestment proceeds and theTurquoise Hill rights offering farexceeding outflows relating to capitalexpenditure and the increaseddividend payment.
Capital expenditure declined byUS$4,839 million or 37 per cent toUS$8,162 million in 2014, following thecompletion of five major capitalprojects in 2013 (Pilbara iron oreinfrastructure expansion to 290 Mt/a,Oyu Tolgoi copper/gold mine, AP60aluminium smelter, Kestrel cokingcoal mine and Argyle undergrounddiamond mine).
We have reduced our total GHGemissions intensity by 18 per centbetween 2008 and 2014. This islargely a result of the aluminiumsmelter divestments (Ningxia in2009, Sebree and Saint Jean in2013), closure of the Lynemouthsmelter in 2012, commissioningof our low intensity AP60 smelterin late 2013 and improvedmeasurement methodology forcoal seam gas at our Australiancoal mines.
TSR combines share priceappreciation and dividends paid to showthe total return to the shareholder.
Net debt is calculated as: the netborrowings after adjusting for amountsdue to equity accounted units originallyfunded by Rio Tinto, cash and cashequivalents, other liquid resourcesand derivatives related to net debt.This is further explained in note 24“Consolidated net debt” to the 2014financial statements.
Capital expenditure comprises the cashoutflow on purchases of property, plantand equipment, and intangible assets.
Our GHG emissions intensitymeasure is the change in totalGHG emissions per unit ofcommodity production relative to abase year. Total GHG emissionsare direct emissions, plusemissions from imports ofelectricity and steam, minuselectricity and steam exports andnet carbon credits purchased from,or sold to, recognised sources.
Page 90 Page 141 Pages 180 to 181 Page 24
riotinto.com 13
ST
RA
TE
GIC
RE
PO
RT
DIRECTO
RS’R
EPORT
FINANCIA
LSTA
TEMEN
TSPR
ODUCTIO
N,R
ESERVES
ANDOPER
ATIO
NS
ADDITIO
NALINFO
RMATIO
N
For
per
sona
l use
onl
y

Principal risks and uncertainties
The focus on the six value drivers articulated on pages 8 to 10 has been accompanied by a significant review of the principal risks and uncertainties thebusiness faces.
Overview of Rio Tinto’s risk management frameworkOur risk management framework recognises that managing risk effectively is an integral part of how we create value, and fundamental to our businesssuccess. The responsibility for identifying and managing risks lies with all of Rio Tinto’s managers and business leaders. They operate within the Group-wideframework to ensure that risks are managed within agreed thresholds. The framework, underpinned by Rio Tinto’s Risk policy and standard, includes clearly-defined oversight responsibilities for the board of directors and the Executive Committee, supported by the Risk Management Committee. It also outlines the rolesplayed by central support functions, by Group Risk, and by Group Audit & Assurance to support effective risk analysis and management across Rio Tinto.
This approach reflects a “three lines of defence” model for the management of risks and controls:
– First line of defence: ownership of risk by the operations.
– Second line of defence: control of risk by Group functions and management committees.
– Third line of defence: assurance of our systems by Group Audit & Assurance.
More information on the Group’s approach to risk management can be found in the corporate governance section on page 62.
Business risk ownersManagers across the businessare accountable and responsiblefor effective risk identification
and management
Board of directors and board committeesProvides oversight across the risk management process,confirms that management’s risk thresholds reflect the level of risk the board is willing to accept in pursuit ofstrategic objectives and monitors Group-level risks
Group Audit & AssuranceResponsible for providing reasonable assurance that thesystems for internal control are adequate and effective
Central support functionsProvide targeted expertise and
support to risk owners, develop andmaintain risk specific controls toensure effective management ofmaterial Group-level risk within
agreed thresholds
Group RiskResponsible for maintaining
appropriate risk policy and standard,providing co-ordination and supportof Group-level risk management
activity and risk reporting
Risk Management CommitteeResponsible for ensuring thatsignificant risks to Group-levelobjectives are identified and forensuring the risk management
process is effective
Executive CommitteeResponsible for risk strategy andaccepting risks inherent in keyinvestments and in strategic,business or annual plans
Risk factorsRio Tinto’s business units and functions assess the potential economic andnon-economic consequences of their respective risks using the frameworkdefined by the Group’s Risk policy and standard. Principal risks anduncertainties are those that the Risk Management Committee, business unitor function determine to have potential material consequences at a Grouplevel. They also include factors that may trigger a succession of events that, inaggregate, become material to the Group. Once identified, each principal riskor uncertainty is reviewed by the relevant internal experts and by the RiskManagement Committee.
Pages 15 to 17 describe the currently-known principal risks and uncertaintiesthat could materially affect Rio Tinto or its ability to meet its strategicobjectives. There may be additional risks unknown to Rio Tinto and other risks,currently not believed to be material, which could turn out to be material. Therisk factors outlined do not include the management detail on how each ismanaged and mitigated, or the controls established to decrease the likelihoodor impact of these risks occurring. This is discussed in more detail on page 62.
Risks may materialise individually, simultaneously or in combination and couldsignificantly affect the Group’s:
– short, medium and long-term business and prospects;
– earnings, cash flow and financial position;
– overall financial results and product demand;
– current asset values;
– future asset values and growth potential;
– safety record and the long, medium and short-term health of itsemployees;
– environmental and social impact on neighbouring communities;
– social licence to operate; or
– Group or business unit reputation.
The principal risks and uncertainties should be considered in connectionwith any forward-looking statements in this document and the cautionarystatement on the inside front cover.
14 riotinto.com
For
per
sona
l use
onl
y
External risks
Factor Nature
Commodity prices and globaldemand for the Group’sproducts are expected to remainuncertain
Commodity prices and demand are volatile and strongly influenced by fluctuating world economic conditions. The Group’spolicy is to sell its products at prices that reflect the value of our products in the market and not to enter into price hedgingarrangements.
Past strong demand for theGroup’s products in China couldbe affected by futuredevelopments in that country
The Group is highly exposed to the Chinese market. China’s demand for any of the Group’s products, and iron ore inparticular, could be substantially affected by:
– an economic slowdown in China;
– financial or banking market conditions impacting investment;
– an accelerated shift from infrastructure-led to service-oriented growth; or
– a material change in energy policy.
Any or all of these may adversely affect the Group’s profitability and cash position.
Rio Tinto is exposed tofluctuations in exchange rates
The vast majority of the Group’s sales are denominated in US dollars, which is also the currency used for holding surpluscash, financing operations, and presenting external and internal results. Although many costs are incurred in US dollars,a significant portion are incurred in, or influenced by, the local currencies of the countries where the Group operates,principally the Australian dollar and Canadian dollar. The Group’s normal policy is not to hedge foreign exchange rates andso the Group may be adversely affected by appreciation in the value of other currencies against the US dollar, or toprolonged periods of exchange rate volatility. Currency fluctuations may negatively impact the Group’s profitability anddividend payments as well as rating agency metrics and asset carrying values.
Political, legal and commercialchanges in the places where theGroup operates
The Group operates across a large number of jurisdictions, resulting in exposure to a broad spectrum of economies, politicaland legal frameworks and societal norms. Each jurisdiction poses unique complexities and challenges that in turn imposerisks on the value chain, from new business development through to closure and rehabilitation, and on asset carrying values.
These can include:
– difficulty in obtaining agreements, leases or permits for new activities;
– renegotiation, unilateral variation or nullification of existing agreements, leases and permits;
– changes in government ownership levels in Group businesses;
– changes in taxation rates, regimes or international tax agreements;
– currency and foreign investment restrictions;
– limitations to power, water, energy and infrastructure access; and
– general increases in regulation and compliance requirements.
Jurisdiction-specific behaviour or circumstance may also present uncertainties to our operating environment: unclear landtitle and rights to land and resources (including Indigenous title); political and administrative change, policy reform, andchanges in law or government regulation; an inherent culture of bribery and corruption; violent criminal or sectariantensions. Any such jurisdictional instability or legislative uncertainty that impacts the Group’s operations may result inincreased costs, curtail or negatively impact existing operations and/or prevent the Group from making future investments.
Community disputes in thecountries and territories inwhich the Group operates
Some of the Group’s current and potential operations are located in or near communities that may regard these operationsas being detrimental to them. Community expectations are typically complex, with the potential for multiple inconsistentstakeholder views that may be difficult to resolve. Stakeholder opinion and community acceptance can be subject to manyinfluences, for example, related industries, operations of other groups, or local, regional or national events in any of theplaces where we operate. These disputes can disrupt our operations and may increase our costs, thereby potentiallyimpacting our revenue and profitability. In the extreme, our operations may be a focus for civil unrest or criminal activity,which can impact our operational and financial performance, as well as our reputation.
Increased regulation ofgreenhouse gas emissions couldadversely affect the Group’scost of operations
Rio Tinto’s operations are energy-intensive and depend on fossil fuels. In numerous jurisdictions, there is increasingregulation of greenhouse gas emissions, tighter emission reduction targets and progressive introduction of carbon pricingmechanisms. These may raise worldwide energy, production and transport costs over the medium to long term, which mayincrease the Group’s cost base and potentially negatively impact the Group’s profitability.
Regulations, standards andstakeholder expectationsregarding health, safety,environment and communityevolve over time and unforeseenchanges could have an adverseeffect on the Group’s sociallicence to operate, businessviability and reputation
The resources sector is subject to extensive health, safety and environmental laws, regulations and standards alongsidecommunity and stakeholder expectations. Evolving regulation, standards and stakeholder expectations could result inincreased costs, regulatory action, litigation or, in extreme cases, threaten the viability of an operation.
riotinto.com 15
ST
RA
TE
GIC
RE
PO
RT
DIRECTO
RS’R
EPORT
FINANCIA
LSTA
TEMEN
TSPR
ODUCTIO
N,R
ESERVES
ANDOPER
ATIO
NS
ADDITIO
NALINFO
RMATIO
N
For
per
sona
l use
onl
y

Principal risks and uncertainties continued
Strategic risks
Factor Nature
The Group’s exploration anddevelopment of new projectsmight be unsuccessful
Rio Tinto identifies new orebodies and mining properties through its exploration programme, and develops or expands otheroperations as a means of generating shareholder value. Exploration is not always successful and there is a high degree ofcompetition for world-class orebodies. The Group may also not be able to source or maintain adequate financing, or may beunable to find willing and suitable joint venture partners to share the cost of developing large projects. Furthermore, projectexecution may not proceed as planned and project budgets and schedules may prove inaccurate, all of which may negativelyimpact the Group’s profitability and the mineral resources from which future cash flows should come.
Rio Tinto may fail tosuccessfully executedivestments and acquisitions
Potential acquisitions may not succeed and the Group may not be able to successfully divest assets it wishes to sell, resultingin unforeseen pressure on the Group’s cash position or reducing the Group’s ability to expand operations as a means ofgenerating shareholder value. All business combinations or acquisitions entail a number of risks, including the cost ofeffectively integrating acquisitions to realise synergies, significant write-offs or restructuring charges, and unanticipated costsand liabilities. The Group may also be liable for the past acts, omissions or liabilities it has acquired that were unforeseen orgreater than anticipated. The Group may also face liabilities for divested entities if the buyer fails to honour all commitmentsor the Group agrees to retain certain liabilities.
Large outsourcing programmesmay result in exposure to third-party failure, or loss ofintellectual property
The Group is implementing business transformation programmes to increase efficiency. These include outsourcing and off-shoring elements of important business support delivery as well as increasing procurement of goods and services fromemerging market suppliers. The Group may be exposed to business continuity failure impacting financial performance, loss ofintellectual property or data, data privacy violations and/or reputational damage as a result of third-party failure or actions.
Financial risks
Factor Nature
The Group’s reported resultscould be adversely affected bythe impairment of assetsincluding goodwill
The Group may be required to record impairment charges as a result of adverse developments in the recoverable values of itsassets (including goodwill). Significant assumptions in the determination of recoverable value include, but are not limited to:pricing of the Group’s commodities and products, reserves and resources, infrastructure availability, discount and foreigncurrency exchange rates, operating and development cost projections, and the timing of expenditure and revenues related tomajor projects. In addition, the occurrence of unexpected events, or events beyond the Group’s control that adversely impactits business, may have an impact on the assumptions underlying the recoverable value of its assets. The foregoing itemsare not exhaustive and impairments may be caused by factors currently unknown to the Group. To the extent that therecoverable value of an asset is impaired, such impairment will negatively impact the Group’s profitability during therelevant period.
Discount rates used indetermining provisions andasset valuations may change,causing changes to provisions,asset carrying values andcapital allocation
Discount rates are utilised to determine provisions for costs of known future obligations (such as close-down andremediation) as well as valuing assets for impairment testing and capital allocation purposes. Discount rates may vary overtime as underlying assumptions change. These assumptions include observable long term government bond yields, marketrisk premiums, and other situational changes (such as change in political stability in a particular jurisdiction).
Changes to the discount rate may impact the size of provisions recognised, lead to changes in the carrying value of assets, oralter the capital allocated to various projects.
The Group’s liquidity andcash flow expectations maynot be realised, inhibitingplanned expenditure
Both the Group’s ability to fund planned expenditure such as capital growth, mergers and acquisitions, innovation and otherobjectives or obligations as well as the ability to weather a major economic downturn could be compromised by inadequateaccess to sufficient liquidity, including external financing sources such as bank financing or capital markets.
Failure to reduce costs mayresult in reduced margins
Failure to reduce costs may have an adverse impact on our operating margins and the viability of our capitalexpansion projects.
Operational risks
Factor Nature
Estimates of ore reserves arebased on uncertain assumptionsthat, if changed, could result inthe need to restate ore reserves
There are numerous uncertainties inherent in estimating ore reserves, including subjective judgments and determinationsthat are based on available geological, technical, contract and economic information. Previously valid assumptions maychange significantly with new information, which may result in changes to the economic viability of some ore reserves andthe need for them to be restated. In addition, volatility in commodity prices can result in substantial adjustments in theGroup’s recognition of ore reserves.
Labour disputes could leadto lost production and/orincreased costs
Some of the Group’s employees, including employees in non-managed operations, are represented by labour unions undervarious collective labour agreements. The Group may not be able to renegotiate agreements satisfactorily when they expireand may face difficult negotiations, higher wage demands or industrial action. In addition, labour agreements may notprevent a strike or work stoppage and labour disputes may arise even in circumstances where the Group’s employees are notrepresented by labour unions.
16 riotinto.com
For
per
sona
l use
onl
y
Factor Nature
Some of the Group’stechnologies are unproven andfailures could adversely impactcosts and/or productivity
The Group has invested in and implemented new technologies both in information systems and in operational initiatives,some of which are unproven and their eventual viability cannot be assessed with certainty. The actual benefits of thesetechnologies may differ materially from expectations.
The Group may be exposed tomajor failures in the supplychain for specialist services,equipment and materials
Rio Tinto operates within a complex supply chain depending on suppliers of materials, services, equipment, andinfrastructure, and on providers of logistics. Supply chain failures, or significantly increased costs within the supply chain,for whatever reason, could have an adverse effect on the Group’s business.
Joint ventures, strategicpartnerships or non-managedoperations may not besuccessful and may not complywith the Group’s standards
The Group participates in several joint venture and partnership arrangements, and it may enter into others, all of whichinvolve risk. Whether or not the Group holds majority interests or maintains operational control in its joint ventures, itspartners may:
– have economic or business interests or goals that are inconsistent with, or opposed to, those of the Group;
– exercise veto rights to block actions that the Group believes are in its or the joint venture’s best interests; or
– be unable or unwilling to fulfil their obligations under the joint venture or other agreements, such as contributing capitalto expansion or maintenance projects.
Where these joint ventures are controlled and managed by others, the Group may provide expertise and advice but haslimited control over compliance with its standards and objectives. Controlling partners may take action contrary to theGroup’s interests or policies, resulting in adverse impact to the Group’s operations, financial performance, legal liabilityor reputation.
The Group’s operations arevulnerable to a range ofinterruptions, not all of whichare covered fully by insurance
1. Natural disasters and events
Mining, smelting, refining and infrastructure installations are vulnerable to natural events including earthquakes, subsidence,drought, flood, fire, storm and climate change.
2. Sustained operational difficulties
Operating difficulties are many and various, ranging from geological variations that could result in significant ground orcontainment failure to breakdown of key capital equipment. Reliable roads, rail networks, ports, power generation andtransmission, and water supplies are required to access and conduct our operations and deliver product to market.Limitations, delayed development, bottlenecks or interruptions in infrastructure, including as a result of third parties gainingaccess to our integrated facilities, could impede our ability to deliver products.
3. Information technology and cyber security
The Group relies heavily on information technology and process control systems to support our business. In common withmost large global companies, the Group has experienced cyber attacks and is faced with ongoing threats to theconfidentiality, integrity and availability of such systems. An extended failure of critical system components, caused byaccidental or malicious actions, including those resulting from a cyber security attack, could result in a significantenvironmental, health or safety incident, commercial loss or interruption to operations.
4. Major operational failure
The Group’s operations involve chemicals and other substances stored under high temperature and pressure, with thepotential for fire, explosion or other loss of control of the process, leading to a release of hazardous materials. This couldoccur by accident, systems failure or a breach of operating standards, and could result in a significant environmental, healthor safety incident.
5. Sustained pandemic
The Group has exploration, development projects and operations in numerous countries and is reliant on effective globalshipping/transportation movements to deliver product to markets. The sustained outbreak of a pandemic may result inhealth exposure to our workforce as well as the temporary closure of a site or access to shipping/transportation movements,adversely impacting financial performance.
The Group’s insurance does not cover every potential loss associated with its operations and adequate coverage at reasonablerates is not always obtainable. In addition, insurance provision may not fully cover its liability or the consequences of anybusiness interruption. Any occurrence not fully covered by insurance could have an adverse effect on the Group’s business.
The Group depends onthe continued services ofkey personnel
The Group’s ability to maintain its competitive position is dependent on the services of a wide range of highly-skilled andexperienced personnel available in the locations where they are needed. Failure to recruit and retain key staff, and theinability to deploy staff worldwide, where they are most needed, could affect the Group’s business. Similar constraints may befelt by the Group’s key consultants, contractors and suppliers, thereby impacting the Group’s operations, expansion plans orbusiness more generally.
The Group’s costs of close-down, reclamation, andrehabilitation could be higherthan expected
Close-down and reclamation works to return operating sites to the community can be extensive and costly. Estimated costsare provided for, and updated annually, over the life of each operation but the provisions might prove to be inadequate due tochanges in legislation, standards and the emergence of new, or increases in the cost of, reclamation techniques. In addition,the expected timing of expenditure could change significantly due to changes in the business environment that might varythe life of an operation.
riotinto.com 17
ST
RA
TE
GIC
RE
PO
RT
DIRECTO
RS’R
EPORT
FINANCIA
LSTA
TEMEN
TSPR
ODUCTIO
N,R
ESERVES
ANDOPER
ATIO
NS
ADDITIO
NALINFO
RMATIO
N
For
per
sona
l use
onl
y
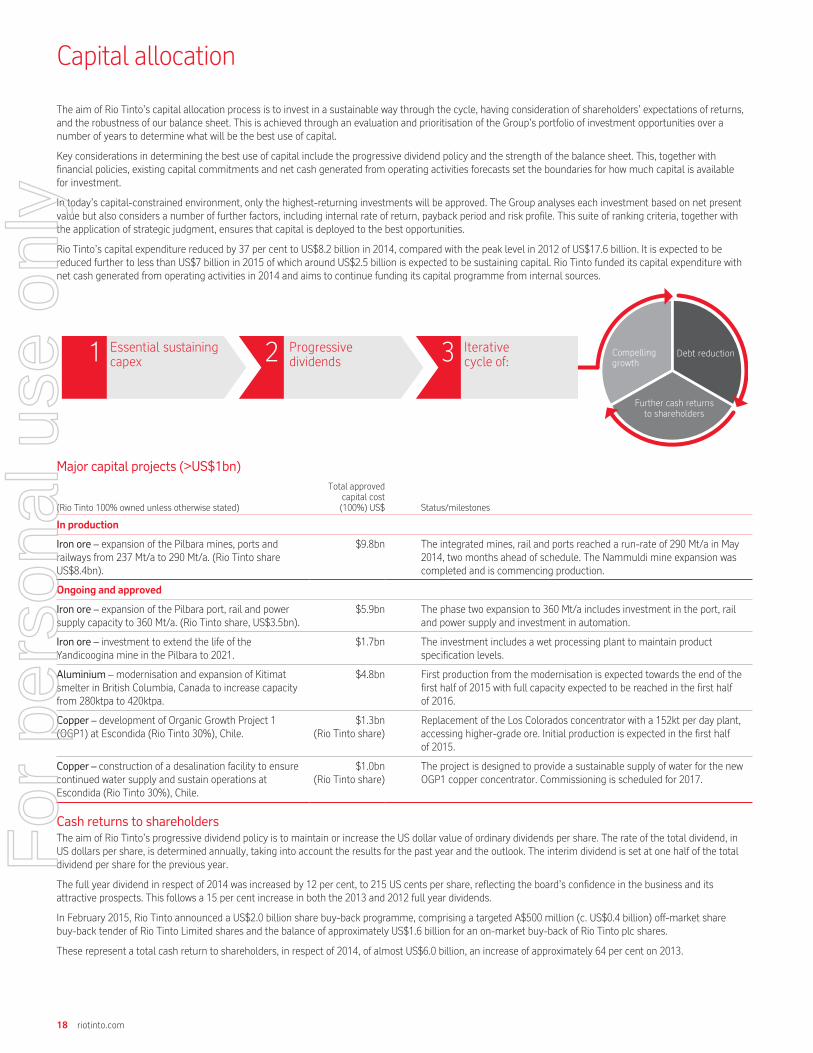
Capital allocation
The aim of Rio Tinto’s capital allocation process is to invest in a sustainable way through the cycle, having consideration of shareholders’ expectations of returns,and the robustness of our balance sheet. This is achieved through an evaluation and prioritisation of the Group’s portfolio of investment opportunities over anumber of years to determine what will be the best use of capital.
Key considerations in determining the best use of capital include the progressive dividend policy and the strength of the balance sheet. This, together withfinancial policies, existing capital commitments and net cash generated from operating activities forecasts set the boundaries for how much capital is availablefor investment.
In today’s capital-constrained environment, only the highest-returning investments will be approved. The Group analyses each investment based on net presentvalue but also considers a number of further factors, including internal rate of return, payback period and risk profile. This suite of ranking criteria, together withthe application of strategic judgment, ensures that capital is deployed to the best opportunities.
Rio Tinto’s capital expenditure reduced by 37 per cent to US$8.2 billion in 2014, compared with the peak level in 2012 of US$17.6 billion. It is expected to bereduced further to less than US$7 billion in 2015 of which around US$2.5 billion is expected to be sustaining capital. Rio Tinto funded its capital expenditure withnet cash generated from operating activities in 2014 and aims to continue funding its capital programme from internal sources.
Compelling growth
Further cash returns to shareholders
Debt reduction21 Essential sustaining capex
Progressive dividends
Iterative cycle of:3
Major capital projects (>US$1bn)
(Rio Tinto 100% owned unless otherwise stated)
Total approvedcapital cost(100%) US$ Status/milestones
In production
Iron ore – expansion of the Pilbara mines, ports andrailways from 237 Mt/a to 290 Mt/a. (Rio Tinto shareUS$8.4bn).
$9.8bn The integrated mines, rail and ports reached a run-rate of 290 Mt/a in May2014, two months ahead of schedule. The Nammuldi mine expansion wascompleted and is commencing production.
Ongoing and approved
Iron ore – expansion of the Pilbara port, rail and powersupply capacity to 360 Mt/a. (Rio Tinto share, US$3.5bn).
$5.9bn The phase two expansion to 360 Mt/a includes investment in the port, railand power supply and investment in automation.
Iron ore – investment to extend the life of theYandicoogina mine in the Pilbara to 2021.
$1.7bn The investment includes a wet processing plant to maintain productspecification levels.
Aluminium – modernisation and expansion of Kitimatsmelter in British Columbia, Canada to increase capacityfrom 280ktpa to 420ktpa.
$4.8bn First production from the modernisation is expected towards the end of thefirst half of 2015 with full capacity expected to be reached in the first halfof 2016.
Copper – development of Organic Growth Project 1(OGP1) at Escondida (Rio Tinto 30%), Chile.
$1.3bn(Rio Tinto share)
Replacement of the Los Colorados concentrator with a 152kt per day plant,accessing higher-grade ore. Initial production is expected in the first halfof 2015.
Copper – construction of a desalination facility to ensurecontinued water supply and sustain operations atEscondida (Rio Tinto 30%), Chile.
$1.0bn(Rio Tinto share)
The project is designed to provide a sustainable supply of water for the newOGP1 copper concentrator. Commissioning is scheduled for 2017.
Cash returns to shareholdersThe aim of Rio Tinto’s progressive dividend policy is to maintain or increase the US dollar value of ordinary dividends per share. The rate of the total dividend, inUS dollars per share, is determined annually, taking into account the results for the past year and the outlook. The interim dividend is set at one half of the totaldividend per share for the previous year.
The full year dividend in respect of 2014 was increased by 12 per cent, to 215 US cents per share, reflecting the board’s confidence in the business and itsattractive prospects. This follows a 15 per cent increase in both the 2013 and 2012 full year dividends.
In February 2015, Rio Tinto announced a US$2.0 billion share buy-back programme, comprising a targeted A$500 million (c. US$0.4 billion) off-market sharebuy-back tender of Rio Tinto Limited shares and the balance of approximately US$1.6 billion for an on-market buy-back of Rio Tinto plc shares.
These represent a total cash return to shareholders, in respect of 2014, of almost US$6.0 billion, an increase of approximately 64 per cent on 2013.
18 riotinto.com
For
per
sona
l use
onl
y

Divestments and acquisitions
AssetConsideration
US$m Status
Divested in 2014
Clermont Joint Venture 1,015(a) Sold to GS Coal Pty Ltd.
Rio Tinto Coal Mozambique 50(a) Sold to International Coal Ventures Private Limited (ICVL).
Søral Undisclosed Sold to Norsk Hydro.
Alucam Undisclosed Sold to the Government of Cameroon.
Divested in 2013
Northparkes mine 820 Sold to China Molybdenum Co. Ltd.
Constellium 671 Shares sold to general public.
Palabora Mining Company Limited 373 Sold to a consortium led by Industrial Development Corporation of SouthAfrica and Hebei Iron & Steel Group.
Eagle nickel – copper project 315 Sold to Lundin Mining Corporation.
Altynalmas Gold 235 Sold to Sumeru Gold B.V.
Inova Resources Limited 81 Sold to Shanxi Donghui Coal Coking & Chemicals Group Co.
Sebree 48 Sold to Century Aluminum Co.
Divested in 2012
Alcan Cable 229 Sold to General Cable Corporation.
Specialty Alumina businesses Undisclosed Sold to H.I.G.
Lynemouth Power Station Undisclosed Sold to RWE.
Energy – Extract Resources Ltd/Kalahari Minerals plc 429 Equity investment sold to Taurus Mineral Limited.
Acquired in 2012
Copper – Turquoise Hill Resources Ltd.(formerly Ivanhoe Mines Limited) 307
Purchase of additional shares increasing the Group’s holdings to51 per cent.
Minerals – Richards Bay Mining Proprietary Limited 1,700 Acquisition of BHP Billiton Group’s entire interests in Richards BayMinerals, doubling the Group’s holding to 74 per cent.
(a) Before working capital and completion adjustments.
There were no material acquisitions in 2014 or 2013.
riotinto.com 19
ST
RA
TE
GIC
RE
PO
RT
DIRECTO
RS’R
EPORT
FINANCIA
LSTA
TEMEN
TSPR
ODUCTIO
N,R
ESERVES
ANDOPER
ATIO
NS
ADDITIO
NALINFO
RMATIO
N
For
per
sona
l use
onl
y

Sustainable development
Rio Tinto’s vision is to be a company that is admired and respected fordelivering superior business value and for being the industry’s trusted partner.To earn this trust we must continually find safer, smarter, more sustainableways to run our business.
We are always looking for new answers to the complex global and localchallenges we face, which include resource scarcity, climate change,community employment and regional economic development. We see thesechallenges as opportunities to advance our reputation and create value for ourbusiness, our shareholders and the people we are proud to work alongside. Toachieve our sustainable development goals, we work hand-in-hand with ourpartners and communities on the ground, where it matters most.
The foundation is The way we work, our global code of business conduct. Itcontains the principles and standards of conduct which reaffirm ourcommitment to sustainable development, and operational excellence at oursites. All of our sites must meet a minimum set of performance standards forhealth, safety, environment, closure and community and social performance.These ensure we meet or go beyond our statutory and regulatoryrequirements. The standards are backed up by strong processes to assuremanagement that we are performing to the right levels and establishinglonger-term identification and management of risks.
We also measure ourselves against the performance of other companies in oursector as well as leaders in other industries. Over many years we have playeda leading role in developing sustainable development standards in the miningand metals sector through organisations such as the International Council onMining and Metals (ICMM), and national bodies, particularly in Australia. Welook to learn from other sectors where leading companies’ performance caninform us and help us improve.
MaterialityWe use a materiality assessment to focus our report on the sustainabledevelopment issues that matter most. This tells us which issues are materialto our stakeholders and to our business. We run this process annually as partof our corporate reporting cycle, to ensure that each year we provide theinformation that our stakeholders are looking for.
Current or potential impact on our business
Level of concern to
stakeholders
Issues of highest materiality reported in the Annual report
Issues addressed through direct communications, not reported in normal channels
Issues reported in the sustainable development website
Low
Medium
High
Low Medium High
Our process has been developed in line with the Global Reporting Initiative(GRI) guidance on materiality and completeness (www.globalreporting.org).This specifies that sustainable development reports should cover topics andindicators that “reflect the organisation’s significant economic, environmentaland social impacts” or that “substantively influence the assessments anddecisions of stakeholders”. It involves identifying and prioritising issues thatmay affect our business and stakeholders over the next three years, takinginternal and external perspectives into account.
We create a materiality matrix which plots external stakeholders’ level ofconcern against the current or potential impact on our business. Each issue isgiven a rating of “low”, “medium” or “high” from both internal and externalperspectives. An impact can be either positive or negative.
Issues that are of high importance to both our external and internalstakeholders are reported in this section of our Annual report. Those ofmedium-to-high importance are reported in the full Sustainable developmentreport on our website.
Having determined which topics to include in our 2014 materiality matrix, wereviewed these with internal experts from each of our sustainabledevelopment focus areas to determine their validity and relative importance.The results of this assessment were reviewed and approved by theSustainability Committee.
Further information on the Sustainability Committee is included in theDirectors’ report on page 59.
Performance overviewPerformance progress in 2014 included:
– A nine per cent reduction in our all injury frequency rate (AIFR) comparedwith 2013.
– A 12 per cent reduction in our lost time injury frequency rate (LTIFR)compared with 2013.
– An 18 per cent reduction in our greenhouse gas emissions intensityfrom 2008.
– Receiving the CDP leadership award for the largest absolute carbonreduction on the ASX 200.
– Meeting our communities target that all operations have locally-appropriate, publicly-reported indicators in place consistent with theMillennium Development Goals.
– Being recognised as having good practice on human rights reporting inline with the UN Guiding Principles on Business and Human Rights.
– Improving our listing as a leading company on the FTSE4Good and DowJones Sustainability Indexes, which investors use to monitor businesses’sustainability performance.
However, we did not achieve all our goals and there are areas where we needto improve. Above all, we must achieve our target of zero fatalities. Tragically,two colleagues lost their lives while working at our managed operations in2014.
Also, in addition to complying with statutory reporting obligations, we reported12 environmental incidents to the Executive Committee with the potential toimpact the environment or to concern local communities. In 2013, we reported15 such incidents.
Our priorities for 2015 are to:
– Deliver our refreshed safety strategy for fatality elimination, injuryreduction and catastrophic risk management.
– Maintain progress on reducing greenhouse gas emissions intensity.
– Achieve our target to implement critical control monitoring plans againstmaterial health risks.
– Complete an epidemiology study of the workforce at RössingUranium Limited.
– Further develop and implement our Mental Health Framework throughoutthe business.
20 riotinto.com
For
per
sona
l use
onl
y

– Implement our updated Health, Safety, Environment & Communities(HSEC) and Closure standards throughout our operations.
– Enhance businessmanagement of water risks and rehabilitation performance.
– Meet our diversity and inclusion targets for women and graduates.
– Advance our talent pipeline and the continued implementation of diversityand inclusion.
– Develop a regional economic development toolkit in partnership with localcommunities and our Procurement function.
– Further streamline the integration of human rights considerations intoexisting corporate processes. We will also develop a more targeted risk-based approach for stand-alone human rights studies.
– Continue developing our integrity and compliance programme. We willfocus on ways in which we can improve risk assessments where they relateto business integrity, third party due diligence and monitoring.
– Refresh The way we work, to ensure it remains relevant to our employees,the business and the risks we face.
Performance dataOur sustainable development performance data are reported for calendar yearsand, unless stated otherwise, represent 100 per cent of the parameters at eachmanaged operation, even though Rio Tinto may have only partial ownership.
Data reported in previous years may be modified if verification processes detectmaterial errors, or if changes are required to ensure comparability over time.
Wherever possible, data for operations acquired prior to 1 October of thereporting period are included. Divested operations are included in datacollection processes up until the transfer of management control.
We have incorporated the requirements of the ten sustainable developmentprinciples of the ICMM and the mandatory requirements set out in ICMMPosition statements into our own policies, strategies and standards. We reportin line with the GRI G3 guidelines at Application level A+. In 2015, we willbegin reporting in accordance with the GRI G4 guidelines.
Further information on our data definitions, our GRI-checked report and ouralignment with the ICMM sustainable development principles and supportingposition statement can be found online at riotinto.com/sd2014
Goals and targetsAs part of our commitment to continuous improvement, we have set Group targets for a range of sustainable development metrics. These help us driveperformance improvement and manage risk. Further information on the risk framework that Rio Tinto applies to identify these metrics and drive decision-makingcan be found on pages 14 to 17.
Targets Performance to date
Our goal is zero harm, including, above all, the elimination ofworkplace fatalities.
2 fatalities at managed operations in 2014.
Performance against this goal is measured by the number of fatalities and ayear-on-year improvement in our all injury frequency rate (AIFR) per 200,000hours worked.
9 per cent reduction in our AIFR compared with 2013.
A year-on-year improvement in the rate of new cases of occupational illnessper 10,000 employees annually.
6 per cent reduction in the rate of new cases of occupational illnesscompared with 2013.
All managed operations will have reviewed – and increased their focus onmanaging – their health risks, through implementation of critical controlmanagement plans (CCMPs) to address their specific material health risks, bythe end of 2015.
41 per cent of managed operations have identified their critical health risksand implemented CCMPs.
Ten per cent reduction in total greenhouse gas emissions intensity between2008 and 2015.
18 per cent reduction in our total greenhouse gas emissions intensitycompared with 2008, currently beating our 2015 target.
All managed operations with material water risk will have achieved theirapproved local water performance targets by 2018.
66 per cent of managed operations are on track to meet their recentlyapproved local water performance targets.
Our diversity goal is to employ people based on job requirements that representthe diversity of our surrounding communities.
We are targeting:
– Women to represent 20 per cent of our senior management by 2015. – Women represented 15.5 per cent of our senior management in 2014.
– Women to represent 40 per cent of our 2015 graduate intake. – Women represented 31.8 per cent of our 2014 graduate intake.
– 15 per cent of our 2015 graduate intake to be nationals from regions wherewe are developing new businesses.
– 17.8 per cent of our 2014 graduate intake were nationals from regionswhere we are developing new businesses.
By 2015, all operations have in place locally-appropriate, publicly-reportedsocial performance indicators that demonstrate a positive contribution to theeconomic development of the communities and regions where we work,consistent with the Millennium Development Goals.
We met our target and all operations have locally-appropriate, publicly-reported indicators in place.
riotinto.com 21
ST
RA
TE
GIC
RE
PO
RT
DIRECTO
RS’R
EPORT
FINANCIA
LSTA
TEMEN
TSPR
ODUCTIO
N,R
ESERVES
ANDOPER
ATIO
NS
ADDITIO
NALINFO
RMATIO
N
For
per
sona
l use
onl
y

Sustainable development continued
Performance data 2010-2014
2014 2013 2012 2011 2010
Social
Fatalities at managed operations from safety incidents 2 3 2 6 3
Fatalities at managed operations from health incidents – – 1 – –
All injury frequency rate (per 200,000 hours worked) 0.59 0.65 0.67 0.67 0.69
New cases of occupational illness (per 10,000 employees) 15 16 15 13 20
Employees (number) (a) 60,000 66,000 71,000 68,000 77,000
Environment
Greenhouse gas emissions intensity (indexed relative to 2008) 82.0 83.2* 94.1 95.9 96.1
Total energy use (petajoules) 450 484* 502 516 513
Freshwater used (billion litres) 465 436* 446 465 457
Land footprint – disturbed (square kilometres) 3,592 3,556 3,530 3,485 3,453
Land footprint – rehabilitated (square kilometres) 502 472 446 422 420
Economic contribution
Value add (US$ million) (a) (b) 29,178 31,818 26,195 38,193 33,812
Payments to suppliers (US$ million) (a) 21,370 26,054 30,271 28,444 27,486Community contributions (US$ million) 261 331 291 294 166
* Numbers restated from those originally published to ensure comparability over time. Amendments due to changes in measurement and calculation methodologies or immaterialupdates to data.
(a) These figures include the Group’s share of joint ventures and associates.
(b) Value add is the sum of labour costs, payments to governments and returns on capital invested in operations.
SocialSafety2014 proved to be our best year ever in terms of injury rate performance. Ourall injury frequency rate (AIFR), which includes data for employees andcontractors, is one of the key safety measures we consider in monitoring ourperformance. At the end of 2014, our AIFR was 0.59 per 200,000 hours worked.Over the last five years we have reduced our AIFR by 14.5 per cent. Our losttime injury frequency rate (LTIFR) was 0.37 per 200,000 hours worked in 2014.
Our commitment to safety is the foundation of how we operate, as we work toachieve our vision of everyone going home safe and healthy after eachworking day. We believe we can prevent fatalities, injuries and illness byeffectively identifying and controlling risks in our business.
For us to achieve our goal of zero fatalities, every person working at Rio Tintomust be fully engaged. To this end we are building a positive safety culture,where everyone contributes to improving our safety performance and has theconfidence to stop work and ensure it is safe.
We have a long history of good safety performance and strive to improve onthis every year. In 2014, we updated our safety strategy to confirm our focuson injury reduction and strengthen our emphasis on fatality elimination andcatastrophic event prevention. This helps us drive effective risk management,identify critical risks, verify that we have controls in place and provide ourpeople with appropriate training.
Regrettably, we did not meet our goal of zero fatalities in 2014. Two peoplelost their lives while working at Rio Tinto managed operations. DarrylManderson died due to an equipment incident during maintenance activities atthe Gove alumina refinery in Australia. Enrick Gagnon died in a trainderailment incident at the Iron Ore Company of Canada. These are tragicevents that affect families, friends and workmates. We provide support andcounselling to those who have lost loved ones.
To achieve our target of zero fatalities it is essential we learn from both actualand potential significant incidents to prevent them happening again. We arestrengthening our investigative process so that we improve our understandingof the factors that lead to fatalities, and the behavioural and process changesneeded to eliminate them. We continue to collaborate industry-wide to shareand apply best practice.
This focus on investigation and sharing lessons learned extends to our non-managed operations. Further discussion of this is covered on page 25.
We continued our focus on incorporating learnings from the Oil and Gasindustry into our management of process safety . We have projects in place to:
– build leader awareness and competence;
– improve incident reporting and investigation; and
– deepen our understanding of the process safety risks and the effectivenessof controls through rigorous process hazard risk analysis studies.
HealthWe provide a healthy environment for our workforce. We continue to focus onidentifying, minimising and managing key occupational health risks to controloccupational exposures. We also focus on promoting the fundamentals offitness for work, particularly for safety-critical roles.
We are targeting a year-on-year improvement in the rate of new cases ofoccupational illness. In 2014, we reduced our rate of new cases of occupationalillness by six per cent from 2013. The main types of occupational illnessesrecorded relate to musculo-skeletal disorders (49 per cent), stress (33 percent) and noise-induced hearing loss (four per cent).
Worldwide, our employees face occupational health risks that vary significantlybecause of the diversity and geographic spread of our operations. We nowhave a 2015 Group target for all managed operations to have reviewed – andincreased their focus on managing – their health risks, throughimplementation of critical control management plans (CCMPs) to address theirspecific material health risks, by the end of 2015. This will help businesses tofocus on the right issues and have the right critical controls in place.
The process we are using to help businesses put these plans in place has ledto a more pragmatic, focused approach to the control of material health risks.We have helped businesses to develop internal competency in this area. Fortyone per cent of managed operations have identified their critical health risksand implemented CCMPs. Most (89 per cent) believe they are well placed tomeet the CCMP target by the end of 2015.
In 2014, we revised our health standards to simplify them, to provide aconsistent framework for managing health risks and focus on material risks forthe Group. These will be rolled out in 2015. This change aims to encourageimproved ownership of the standards by operations’ leaders and ensure we aremanaging the impacts and risks related to our operations in order to protectemployees and improve our workplaces.
22 riotinto.com
For
per
sona
l use
onl
y
The potential for fatigue to contribute to safety incidents is well understood.To improve fatigue management we use research tools and technology tocomplement our programmes, including: personal alerting tools; personalmonitors to measure sleep quantity, quality and associated mentaleffectiveness; and scheduling.
Across many industries, the potential for mental health problems to lead toshort and long-term disability, employee turnover and occupational injuries isbecoming better understood. In partnership with subject matter experts in thisfield we have developed tools and training that will support the management ofmental health risks for our workers. These cover a broad range of areas acrossmental health management, including crisis response, understanding mentalhealth and ultimately improving the wellbeing and resilience of our workforce.
March 2015 marks one year since the World Health Organisation (WHO) wasnotified of an outbreak of Ebola in West Africa. In Guinea, where we haveoperations, 2,730 cases were reported and 1,739 deaths since the outbreakbegan. Responding to the outbreak, a Rio Tinto Business Resilience Team wasestablished and a number of control measures have been implemented inpartnership with the Guinean Government, WHO and other internationalorganisations. We have put prevention measures in place both for ouremployees and the local Guinean communities. We have supported theGovernment and communities through awareness raising and providinglogistics and food. As part of our efforts we have organised and conductedprevention and awareness campaigns, distributed hygiene kits and providedsupport to local hospitals with protective equipment and medical supplies. Todate, none of our employees or their families in Guinea have been affected bythe disease.
Rössing was challenged by local and international stakeholders in relation tothe long-term health of, and impacts from radiation on, its employees at theRössing mine in Namibia. It was alleged that employees were not givenaccess to their medical records. In fact, since the mine started in 1976, allemployees have had access to their own health records and Rössing haslongstanding standards and programmes to help manage health risksincluding monitoring and academic review. For 2015, Rössing will undertakea new epidemiological study. This study will be conducted by independentexperts and will be peer reviewed.
PeopleThe way we work sets out the principles that form the foundation of ourbusiness: collaboration, fair treatment and living our values of respect,integrity, teamwork and accountability.
We seek to hire, motivate and retain people who demonstrate our values andare passionate about making a difference to our business and thecommunities in which we live and work. We employ people on the basis of jobrequirements and do not discriminate on grounds of age, ethnic or socialorigin, gender, sexual orientation, politics, religion, disability or any otherstatus. We do not employ forced, bonded or child labour. We recognise theright of all employees to choose to belong to a union and seek to bargaincollectively. We employ people with disabilities and make considerable effortsto offer suitable alternative employment and retraining to employees whobecome disabled and can no longer perform their regular duties.
To ensure that what we do creates long-term value for all our stakeholders,we set clear performance objectives for employees. We have Group-wideperformance and remuneration systems that ensure we assess employeesconsistently and transparently. By engaging with employees about thebusiness and their career aspirations, we make a clear link betweenperformance and reward.
In 2014, we employed 60,000 people (including the Group’s share of jointarrangements and associates). Of these, approximately 31,000 were located inAustralasia, 16,000 in North America, 7,000 in Africa, 4,000 in Europe and2,000 in Central and South America. See page 180 for a breakdown ofemployees by business units.
Throughout 2014, we remained one of the largest private sector employers ofIndigenous Australians, with over 1,650 full time Indigenous employees whorepresented approximately 7.5 per cent of our permanent Australian workforce.In addition to our permanent Indigenous workforce we had over 550 Indigenouscontractors working on our Australian mine sites. Our local employmentcommitments are often managed through directly-negotiated agreements withTraditional Owners.
Diversity helps us generate new and innovative ways of thinking. We arecommitted to increasing the representation of women in our business andremain focused on ensuring our workforce is representative of the countriesand communities in which we operate. Women represented 31.8 per cent(female: 34; male: 73) of our graduate intake in 2014, 21.4 per cent (female: 3;male: 11) of the board, 15.5 per cent (female: 104; male: 565) of our seniormanagement, and 18.7 per cent (female: 9,963; male: 43,122) (c) of our totalworkforce. In 2014, 17.8 per cent of our graduate intake were nationals fromregions where we are developing new businesses. Further information ondiversity and inclusion can be found on page 60 in the Corporategovernance section.
We recognise we have further work to do to deliver on our diversity targets for2015 and this is reflected in our work plan. We will continue to develop ourgraduate talent to build on the completion of a successful three-yearemerging regions graduate intake programme from 2011 to 2014.
Our 2014 employee survey showed that our people continue to report highlevels of engagement, with employees feeling that safety, efficiency andflexibility have improved since the last survey. They believe that we can domore to celebrate our successes and manage personal performance. Actionplanning has occurred across the Group, with improvement plans developedin partnership between leaders and employees. The implementation of theseplans will continue throughout 2015.
Good communication and open, honest dialogue are vital if we are to meetthe expectations of our employees. Rio Tinto’s culture of leader-ledcommunication and engagement is supported by a number of communicationtools. These include myRioTinto, a portal dedicated to employment needs, andkeeping employees informed of Group updates, news and announcements.
Communities and regional developmentWe strive to build good relationships with our host communities. We engagewith them to understand the social, environmental and economic implicationsof our activities, seeking to minimise negative impacts and bring shared valueto the places where we work.
We work to a Communities and Social Performance (CSP) framework based onbuilding knowledge, engaging with communities and developing programmesthat reflect local community priorities. Our CSP programme and our policy,standards and guidance notes support this.
During 2014, our business contributed to just under 2,200 socio-economicprogrammes covering a wide range of activities such as health, education,environmental protection, housing, agricultural and business development.In 2014, we spent US$261 million on these community contributionprogrammes. There was a decrease in overall community contributions of21 per cent compared to 2013, which reflects prevailing market conditions,divestments and completion of key programmes at developing projects suchas Oyu Tolgoi and La Granja.
Our Communities target requires that, by 2015, all operations must havein place locally-appropriate, publicly-reported social performance indicatorsthat demonstrate a positive contribution to the economic development of thecommunities and regions where we work. This is consistent with the UN’sMillennium Development Goals. We met our target and 100 per cent ofoperations have the indicators in place and have reported them publicly, in2014. During 2015 we will establish a new Group target, to apply from 2016,to indicate progress and results of our Communities and Social Performancework in our businesses.
(c) Gender distribution for our total workforce is based on managed operations(excludes non-managed operations and joint ventures) as of 31 December 2014.
riotinto.com 23
ST
RA
TE
GIC
RE
PO
RT
DIRECTO
RS’R
EPORT
FINANCIA
LSTA
TEMEN
TSPR
ODUCTIO
N,R
ESERVES
ANDOPER
ATIO
NS
ADDITIO
NALINFO
RMATIO
N
For
per
sona
l use
onl
y
Sustainable development continued
We accept that we cannot meet everybody’s concerns and expectations.However, wherever we operate we seek to do so with broad-based communitysupport. By listening carefully to the concerns of our stakeholders, andconsistently aiming to align their needs with our own, we work to createmutually beneficial outcomes through collaboration with our partners tomanage the shared risks, responsibilities and benefits of the long-lifeinvestments we make.
EnvironmentClimate changeThe scale of necessary emissions reductions – coupled with the world’sincreasing requirements for secure, affordable energy – create largechallenges which require worldwide attention. Our climate change programmefocuses on reducing the energy intensity of our operations, as well as thecarbon intensity of our energy.
Our total greenhouse gas (GHG) emissions were 33.9 million tonnes of carbondioxide equivalent (CO2-e) in 2014, 3.5 million tonnes lower than in 2013. In2008 we set a target of a ten per cent reduction in total GHG emissionsintensity, to be achieved by 2015. We have reduced our total GHG emissionsintensity by 18 per cent compared with 2008, currently beating our 2015target. Over the same period absolute emissions were reduced by 31 per cent.
A new target will be set in 2015 that extends the existing external target to2020. This will focus on the challenge to increase energy efficiency. Targetswill be developed in collaboration with businesses, and take into account theircurrent circumstances and future plans.
Our business is inherently energy intensive. The majority of our GHGemissions are generated from energy use (electricity, fuel) and chemicalprocesses (anodes and reductants) during mining, milling and smeltingactivities at our sites. The majority (65 per cent) of the electricity we use isfrom hydropower.
Transportation, processing and use of our products also contributesignificantly to GHG emissions. In 2014, the three most significant sources ofindirect emissions associated with our products were:
– Approximately 5.3 million tonnes of CO2-e associated with third partytransport of our products and raw materials.
– An estimated 129.6 million tonnes of CO2-e associated with customersusing our coal in electricity generation and steel production.
– Approximately 459.4 million tonnes of CO2-e associated with customersusing our iron ore to produce steel (these emissions are not all in additionto the coal-use emissions above, as some customers use both our iron oreand our coal to produce steel).
To assess how carbon policy and regulation will affect our businesses and ourproducts in the future, we closely monitor national and international climateand energy policy developments and we advocate constructively for policiesthat are environmentally effective, economically efficient and equitable. Wealso assess the potential risks to the resilience of our operations fromchanging climatic events.
Further information on the Group’s greenhouse gas emissions is included inthe Directors’ report on page 48.
ClosureAlthough it may extend over decades, mining is a temporary land use.It is a priority that we plan ahead for the closure of our operations after thecommercially recoverable ore is exhausted. We must balance the needs andexpectations of the present with those of future generations, while respondingto environmental and social challenges of mine closure.
The Closure standard applies to all our managed operations and to non-operational (legacy) sites. This provides consistency in closure planning andmanagement. It also helps us identify opportunities for generating positivesocio-economic benefits from our activities.
Closure planning is integrated into our operational activities and we aim toprogressively rehabilitate as much land as possible prior to closure. In 2014,26 per cent of our disturbed land (excluding land disturbed for hydroelectricitydams) had been rehabilitated. Our biodiversity goal is also closely connected toclosure planning and management. At sites with high or very high biodiversityvalues, we aim to have achieved a net positive impact (NPI) on biodiversity, orhave a clear set of criteria that demonstrates trajectory to NPI, agreed by thetime we close operations. These sites are determined by their proximity tobiodiversity-rich habitats, species of conservation significance and the siteconservation context. In 2014, 32 of our operations were prioritised with eitherhigh (eight), or very high (24) biodiversity values. To achieve our goal thesesites are required to develop and implement biodiversity action plans.
Stakeholder consultation – with local communities, including traditionallandowners, governments, and employees – is a fundamental part of ourclosure planning.
WaterWherever possible we prevent – or otherwise minimise, mitigate andremediate – the impact that our operations may have on water resources. Ourapproach to water management is based on the identification, assessment andcontrol of water-related risks. We seek risk-based local solutions to promotesustainable water supply for our operations and communities.
For many years, our focus has been on reducing the freshwater use per tonneof product and we set ourselves a target for this metric from 2008 to 2013.However, over this period, we learnt that this metric alone did not alwaysaddress the issues that have the greatest potential to impact our performance,or that were of most concern to local stakeholders.
Water challenges and risks vary by region and site, so we have redefined ourGroup water target to better reflect the local and regional conditions and therisks to the environment where we operate. The current Group water targetrequires that, by 2018, all managed operations with material water risk willhave reviewed and improved their management of these material water risks,and will have achieved their approved local water performance targets.
A site is identified as having a material water risk where there is potential for ahigh or critical impact on the business through effects on the environment,production, community, compliance or reputation.
Local water performance targets have been set to improve the site-specificwater performance. These cover three areas: water supply, ecological impacts,and water surplus management. Each site has a target that is appropriate to itsspecific operational circumstances. At the end of 2014, 66 per cent of managedoperations were on track to meet their approved local water performancetargets by 2018 and the remaining sites are committed to making progress andwill have submitted, by the end of 2015, clear plans to meet these targets.
Unfortunately, five incidents related to water were reported to the ExecutiveCommittee in 2014. These are listed in the environmental regulation sectionincluded in the Directors’ report on page 47. We use these incidents and ourannual assessment of performance against the targets to focus attention andeffort on those sites and businesses that need support to improve their watermanagement performance.
In 2014, our total water use was 834 billion litres and total recycled water was264 billion litres. This is consistent with 2013 performance.
Environmental regulationWe are subject to various environmental regulations and are required todisclose Group-level environmental incidents and fines. Further information onthe Group’s environmental regulation is included in the Directors’ report onpage 47.
24 riotinto.com
For
per
sona
l use
onl
y

EconomicEconomic contributionsOur operations can have a substantial impact on the regions and countries inwhich we operate through our tax payments to local and nationalgovernments, the direct and indirect employment we generate and ourcommunity programmes.
Globally, the Group’s economic contribution was US$51 billion(d) in 2014. Thisincludes:
– US$29 billion in value add, made up of payments to employees, paymentsto governments and returns to capital.
– US$21 billion as payments to suppliers.
We are committed to contributing to the social and economic development ofour host communities. It is important to our shareholders, employees andmany other stakeholders that we contribute to social stability through localemployment opportunities, procurement and the transparent payment of taxand dividends.
Details of payments to governments are available in our report on Taxes paidin 2014, which is made available on the Group’s website.
The figures presented in this section include the Group’s share of jointventures and associates.
Non-managed operations and joint venturesRio Tinto holds interests in companies and joint ventures that it does notmanage, including the Escondida copper mine in Chile and the Grasbergcopper-gold mine in Indonesia. We actively engage with our partners aroundsustainable development through formal governance structures and technicalexchanges. In this way we endeavour to ensure that the principles in The waywe work are respected at all times and encourage them to embed a strongsafety and security culture in their workforces.
EscondidaRio Tinto has a 30 per cent interest in Escondida, which is managed by BHPBilliton. Our seats on the Owners’ Council ensure we have regular input onstrategic and policy matters. In 2014, Escondida began construction of theEscondida Water Supply project to develop a new 2,500 litre per secondseawater desalination facility. This project will ensure a continued water supplyto sustain operations while minimising Escondida’s need to use groundwater.Escondida is recognised as having a world-class process for managingsignificant health, safety and environmental risks. Rio Tinto is in the process ofadopting the Escondida process to effectively manage critical fatality risk andhas benefited from Escondida’s guidance and willingness to openly shareits learnings.
GrasbergPT Freeport Indonesia (PTFI), a subsidiary of Freeport-McMoRan Inc., ownsand operates the Grasberg mine in Papua, Indonesia. Rio Tinto has a jointventure interest attributable to the 1995 mine expansion, which entitles it to a40 per cent share of production above specified levels until the end of 2021and 40 per cent of all production after 2021. We engage with and influencePTFI through five formal channels: the Operating, Technical, Communities andSustainable Development committees and the Tailings board.
Tragically, there were six industrial fatalities at PTFI in 2014: four at thesurface mine involving a collision between a light vehicle and a haul truck; onedue to a fall of ground in the underground operation; and one due to a roll-over involving a concrete mixer truck in the surface area of the operation. Wehave worked closely with, and continue to support, the PTFI leadership team inthe investigations and in the post-investigation lesson implementation. In2014 senior Rio Tinto leaders and technical specialists visited the site, sharedour Group’s knowledge and provided practical advice to support PTFI’s actionsto learn from, and avoid a recurrence of these, tragic accidents. There was afurther fatality at Grasberg in early 2015, as a result of an equipment/pedestrian interaction.
(d) Due to rounding, sum does not equal the total shown.
The operation employs controlled riverine tailings transport, a process that theWorld Bank does not consider as good industry practice, on the basis that it iscontrary to the International Finance Corporation’s 2007 Environmental,Health, and Safety Guidelines for mining. However, several independent expertreviews concluded that this method represents the best available option forthis operation because of the extremely rugged topography, high rainfall andsignificant seismic activity. We continue to believe that this method isappropriate given these conditions, but have adopted the standard thatriverine and shallow marine disposal of mining and processing mineral wastewill not be used at new Rio Tinto managed operations.
Rio Tinto technical personnel review and provide guidance and oversight ofthe controlled riverine tailings management system with a focus ongeotechnical, geochemical and environmental issues. There is an officialmultidisciplinary Technical Committee which addresses environmental issuesalong with technical issues related to geology, worker health and safety, mineplanning, processing and tailings management. Rio Tinto is represented by asenior environmental manager on the PTFI Tailings Management board,which meets twice a year at Grasberg and includes third-party experts. Theemphasis of Rio Tinto’s involvement is to promote continuous improvementsin the environmental performance of the existing tailings managementsystem. Historic and ongoing improvements since Rio Tinto’s involvementbegan include:
– construction, extension and maintenance of a levee system to limit thelowlands depositional footprint;
– diversion of the Ajkwa River system in the lowlands out of the permittedtailings deposition area;
– ongoing re-vegetation programmes in the deposition area;
– ongoing efforts to increase tailings retention within the depositionarea; and
– ongoing efforts to ensure that the tailings remain geochemically benignand will therefore not pose an acid rock drainage risk.
GovernanceHuman rightsRio Tinto respects and supports human rights wherever it operates in a waythat is consistent with the Universal Declaration of Human Rights. Our humanrights approach is founded in The way we work, our human rights policy andvoluntary commitments. It is also consistent with the UN Guiding Principles onBusiness and Human Rights (UNGPs). In implementing our policies, we aresubject to local laws. We build on compliance with local laws and, where ourpolicies and procedures are more stringent, we operate to these standards.
In line with the human rights due diligence process in the UNGPs, we look tounderstand our potential and actual human rights impacts, ensure we aremanaging them, and communicate our performance. We embed human rightsconsiderations into existing corporate processes including risk analysis, impactassessment and complaints handling and may also conduct standalonehuman rights studies where appropriate. While we respect all internationally-recognised human rights, there are some issues to which we pay particularlyclose attention because of our geographical and operating footprint. Theseinclude: security; land access and resettlement; environment including accessto water and sanitation; cultural heritage including the rights of Indigenouspeoples; labour rights; and in-migration related impacts on local communities,including access to health services.
riotinto.com 25
ST
RA
TE
GIC
RE
PO
RT
DIRECTO
RS’R
EPORT
FINANCIA
LSTA
TEMEN
TSPR
ODUCTIO
N,R
ESERVES
ANDOPER
ATIO
NS
ADDITIO
NALINFO
RMATIO
N
For
per
sona
l use
onl
y

Sustainable development continued
We work with suppliers, contractors and other partners to avoid ourinvolvement in human rights harm, and to positively influence human rightsthrough those business relationships. The way we work and our Procurementprinciples apply to all suppliers and contractors working with Rio Tinto or on itsbehalf. The principles reiterate that we oppose and prohibit forced, bonded orchild labour. They specify that suppliers should maintain human rights policiesand have a process to assure compliance. Prequalification checks, contractualarrangements and ongoing monitoring help us to ensure that suppliers followthese principles.
We provide employees an online human rights training programme. It explainswhy respecting human rights is important, what human rights impacts wemight have, and internal resources and mechanisms to help manage them.Last year, approximately 1,500 employees, a large proportion of whom work inour Procurement function, completed this training. We also provide site-specific training and in 2014 developed a training package that sites can adaptto address their priority human rights issues.
Rio Tinto has made voluntary commitments to the OECD Guidelines forMultinational Enterprises, UN Global Compact and the Voluntary Principles onSecurity and Human Rights (VPSHR). To avoid human rights violationsthrough our security arrangements, we provide training for security personneland continue to conduct security and human rights assessments at all highrisk sites. We have developed practical guidelines, toolkits and training onimplementing the VPSHR. Our online VPSHR training became mandatory forall security personnel at high risk sites from January 2014, and is stronglyrecommended for all other sites. In 2014 we conducted in-person VPSHR andUse of Force training for guards at four sites in Africa. This training involvedboth private and public security.
Under our Communities standard all sites must have a complaints, disputesand grievance mechanism in place, in line with the effectiveness criteria foroperational-level grievance mechanisms in the UNGPs. Speak-OUT, theGroup’s confidential and independently-operated whistleblowing programme,can also be used to lodge human rights-related complaints.
We respect the land connection of Indigenous communities and seek mutuallybeneficial agreement with affected communities in the development andperformance of our operations. We strive to achieve the free, prior andinformed consent of Indigenous communities as defined in the 2012International Finance Corporation Performance Standard 7 and the 2013 ICMMPosition Statement on Indigenous Peoples and Mining. We seek consent asdefined in relevant jurisdictions, and ensure agreement-making processes areconsistent with such definitions.
Integrity and complianceThe way we work sets out our overall commitment to integrity andcompliance. It puts our values – respect, integrity, teamwork andaccountability – into practice, and holds us to the highest ethical standards tobehave in ways that earn the trust of others. We operate within all applicablelaws and regulations and are dedicated to open and transparent dealings withour stakeholders.
Our compliance standards are core to our Integrity and Complianceprogramme. In 2014, we introduced a new Business Integrity standard, whichapplies to all Rio Tinto businesses and functions. Developed in consultationwith compliance managers from across the businesses, it consolidates andstreamlines four previous business integrity-related standards: anti-briberydue diligence; fraud; business integrity (anti-corruption); and businessintegrity (conflicts of interest). This ensures that employees and contractorshave a single point of reference for integrity and compliance matters. Thestandard applies a risk-based approach, with simplified language andimproved readability.
We refreshed our online training to ensure it is geared more towards the risksencountered by each individual. The new system incorporates a wider rangeof shorter task-based or awareness modules, which tailor the trainingdepending on the individual’s role. Each person then completes a set of coreand elective modules.
We are committed to a culture of transparency and speaking up about issues.We provide our businesses with internal and external channels for raisingconcerns, anonymously if required. Speak-OUT, the Group’s confidential andindependently-operated whistleblowing programme, enables employees toreport anonymously, subject to local law, any significant concerns about thebusiness or behaviour of individuals. This could include suspicion aroundsafety violations, environmental procedures, human rights, financial reporting,or business integrity issues in general. We encourage employees to raisetheir concerns to management first; Speak-OUT is always available as analternative option.
In 2014, 588 Speak-OUT reports were lodged, representing approximately fiveper cent fewer than the number reported in 2013.
In line with our commitment to transparency and good governance, we issueinformation on the Group’s operational, financial and sustainable developmentperformance in a timely way through a number of channels, such as mediareleases and regulatory filings. We communicate views to governments andothers on matters affecting our business interests.
AssuranceWe engaged an independent external assurance organisation,PricewaterhouseCoopers, to provide the board of directors of Rio Tinto plc andRio Tinto Limited with assurance on selected sustainable development subjectmatters, as explained on the next page.
PricewaterhouseCoopers’ assurance statement satisfies the requirementsof subject matters 1 to 4 of the ICMM assurance procedure whilst our onlineGRI report has been checked by GRI, satisfying subject matter 5 of theICMM procedure.
Further information on external auditors and internal assurance is included inthe Directors’ report under the Corporate governance section on pages 62and 63.
26 riotinto.com
For
per
sona
l use
onl
y

Independent limited assurance report
What we found
Based on the work described below, nothing has come to our attention that causes us to believe that the selected
subject matter for the year ended 31 December 2014 has not been prepared, in all material respects, in accordance
with the Reporting criteria.
To the directors of Rio Tinto plc and Rio Tinto Limited (together Rio Tinto),
What we didRio Tinto engaged us to perform a limited assurance engagement on theselected subject matter within the Sustainable development sections of theRio Tinto 2014 Annual report and the Rio Tinto 2014 Strategic report for theyear ended 31 December 2014.
Selected subject matter– Rio Tinto’s assertion that it has incorporated the requirements of the
10 sustainable development principles of the International Council onMining and Metals (ICMM) and the mandatory requirements set out inICMM Position Statements into its own policies, strategies and standards
– Rio Tinto’s assertions regarding the approach that it has adopted toidentify and prioritise its material sustainable development risksand opportunities
– Rio Tinto’s assertions regarding the existence and status ofimplementation of systems and approaches used to manage thefollowing selected sustainable development risk areas:
– Safety
– Greenhouse gas emissions
– Energy use
– Water
– The following Rio Tinto performance data related to the selectedsustainable development risk areas:
– Number of fatalities
– All injury frequency rate
– Lost time injury frequency rate
– Number of lost time injuries (numerator of the lost time injuryfrequency rate)
– Total greenhouse gas emissions
– Greenhouse gas emissions intensity
– Total energy use
– Percentage of managed operations with material water risk that are ontrack to achieving their approved local water performance targets
Reporting criteriaThe subject matter above has been assessed against the definitions andapproaches which will be presented at www.riotinto.com/sd2014 as at6 March 2015.
ResponsibilitiesPricewaterhouseCoopersOur responsibility is to express a conclusion based on the work we performed.
Rio TintoRio Tinto management is responsible for the preparation and presentation ofthe selected subject matter in accordance with the Reporting criteria.
What our work involvedWe conducted our work in accordance with the International Standard onAssurance Engagements 3000 Assurance Engagements Other than Audits orReviews of Historical Financial Information and (for selected subject matterrelating to greenhouse gas emissions) the International Standard on AssuranceEngagements 3410 Assurance Engagements on Greenhouse Gas Statements.These Standards require that we comply with independence and ethicalrequirements and plan the engagement so that it will be performed effectively.
Main procedures performed– Making enquiries of relevant management of Rio Tinto
– Evaluating the design and effectiveness of the key processes and controlsfor capturing, collating and reporting the performance data within theselected subject matter
– Testing performance data, on a selective basis, substantively at both anoperational and corporate level, which included testing at a selection ofoperations from across Aluminium, Energy, Iron Ore, Copper, andDiamonds & Minerals
– Undertaking analytical procedures over the performance data
– Reviewing a sample of relevant management information anddocumentation supporting assertions made in the selected subject matter
We believe that the information we have obtained is sufficient and appropriateto provide a basis for our conclusion.
Liza Maimone PricewaterhouseCoopersPartner Canberra
4 March 2015
Liability limited by a scheme approved under Professional Standards Legislation
Inherent limitationsInherent limitations exist in all assurance engagementsdue to the selective testing of the information beingexamined. Therefore fraud, error or non-compliance mayoccur and not be detected. Additionally, non-financialdata may be subject to more inherent limitations thanfinancial data, given both its nature and the methodsused for determining, calculating and sampling orestimating such data.
Restriction on useThis report has been prepared in accordance with ourengagement terms to assist Rio Tinto in reporting itssustainable development performance. We do not acceptor assume responsibility for the consequences of anyreliance on this report for any other purpose or to anyother person or organisation. Any reliance on this reportby any third party is entirely at its own risk.
We consent to the inclusion of this report in the Rio Tinto2014 Annual report and the Rio Tinto 2014 Strategicreport to assist Rio Tinto’s members in assessing whether
the directors have discharged their responsibilities bycommissioning an independent assurance report inconnection with the selected subject matter.
Limited assuranceThis engagement is aimed at obtaining limited assurancefor our conclusions. As a limited assurance engagementis restricted primarily to enquiries and analyticalprocedures and the work is substantially less detailedthan that undertaken for a reasonable assuranceengagement, the level of assurance is lower than wouldbe obtained in a reasonable assurance engagement.
riotinto.com 27
ST
RA
TE
GIC
RE
PO
RT
DIRECTO
RS’R
EPORT
FINANCIA
LSTA
TEMEN
TSPR
ODUCTIO
N,R
ESERVES
ANDOPER
ATIO
NS
ADDITIO
NALINFO
RMATIO
N
For
per
sona
l use
onl
y

Aluminium
Financial performance
2014US$ million
2013US$ million
Revenue 12,123 12,463
Net cash generated from operating activities 2,550 1,696
Underlying earnings 1,248 557
Capital expenditures 2,021 2,226
Net operating assets 18,297 18,814
Strategy and strategic prioritiesRio Tinto’s Aluminium group is focused on delivering industry-leadingperformance through the cycle and strong returns in the years to come. Thebusiness has been reshaped around the core pillars of bauxite and the group’ssmelting assets that are in the first quartile of the industry. By taking action tomove the smelting asset base down the cost curve, the portfolio has beenpositioned squarely into the first quartile. Upon completion of the KitimatModernisation Project, more than 80 per cent of the Aluminium group’ssmelter assets will be in the first quartile compared with only 40 per cent in2011. Following the transition of Gove to a bauxite export business, the grouphas ramped up bauxite exports and supplied around 50 per cent of Chinesebauxite imports in 2014. Its goal is to establish its Cape York bauxite as theproduct of choice for Chinese seaborne demand.
In 2015 the Aluminium group intends to capitalise on its competitiveadvantages through:
– Growing the group’s sector-leading, high-margin bauxite positionwhile further enhancing performance and cash generation from itslow-cost smelters.
– Driving operating excellence at the group’s alumina refineries, providingcompetitive supply security to its first-quartile smelter portfolio.
– Capitalising on its commercial and trading capabilities to increase marginsand value.
– Achieving continuous improvement from driving sustainable costreduction, productivity improvement initiatives and working capitalreductions across all the Aluminium group’s operations.
– Optimising the portfolio by divesting non-core operations to concentrateon strategic, top-tier assets.
– Exercising a disciplined approach to capital allocation, geared to deliveringkey brownfield and modernisation projects that leverage the group’scompetitive advantages in bauxite ore reserves and self-generated energy.
SafetyThe Aluminium group’s all-injury frequency rate continued its steadydownward trend in 2014. The key all-injury metric at the year’s end was 0.53,which represented a 20 per cent improvement over the 0.66 rate at the end of2013. However, despite showing an incremental improvement in the group’soverall safety performance, the tragic death of Darryl Manderson at the Goveoperations in Australia in the first half of 2014 is a sobering reminder of theimportance of the relentless focus on safety. The Aluminium group iscommitted to a zero harm workplace and there is simply no room for thesekinds of accidents. The group has therefore redoubled its efforts to improvefurther through initiatives such as the “Zero Harm by Choice” leadershipdevelopment programme, a Human Performance initiative and activities toimprove process safety. Drawing on lessons learned from previous incidents,the group is constantly working to implement enhanced policies, systems andprocedures to improve performance.
Greenhouse gas emissionsRio Tinto’s Aluminium group has one of the lowest carbon footprints in thealuminium industry. The group has reduced greenhouse gas emissions by40 per cent since 2008. Almost 80 per cent of its total power needs comesfrom non-fossil-fuel based hydro (72 per cent) and nuclear (six per cent)power compared with an industry average of 35 per cent for non-fossil-fuelbased power. This means that the emissions intensity from the group’ssmelters is around half of the industry average – less than six tonnes of CO2
equivalent per tonne of aluminium versus an industry average of around11 tonnes.
Review of operationsWith effect from 1 June 2014, Alfredo Barrios succeeded Jacynthe Côtéas chief executive of the Aluminium group and also joined the Rio TintoExecutive Committee.
The group’s position as a sector-leading business is demonstrated in itsfinancial performance in 2014. The Aluminium group’s underlying earningsincreased by 124 per cent to US$1,248 million, US$691 million higher than in2013. The group achieved underlying EBITDA of US$2,930 million, whichrepresented a gain of 55 per cent from 2013, while widening the gap with thecompetition on the strength of its industry-leading EBITDA margins. Theimproved underlying EBITDA, combined with reduced working capital levels,has increased net cash generated from operating activities by US$854 millionto US$2,550 million and generated positive free cash flow. The solid financialresults reflected numerous ongoing cost reduction and productivityimprovement initiatives across the Aluminium group, as well as benefitsderived from rising regional and product premiums and the impact of theweaker Australian and Canadian dollars. Value-added products, which areproduced to individual customer specifications, represented some 62 per centof the primary metal produced by Rio Tinto in 2014, which translated intosuperior realised prices and margins.
The average London Metal Exchange price for aluminium in 2014 wasUS$1,867 per tonne, which compares with an average of US$1,845 per tonnein 2013. Rio Tinto’s average realised price for primary metal products –including market and product premiums – was US$2,395 per tonne in 2014,compared with US$2,249 per tonne in 2013.
Cash cost improvements lifted earnings by US$168 million (US$232 millionpre-tax). Greater production efficiencies, lower raw material prices, reducedfunctional costs, and increased production at various operations all helped toreduce unit cash costs of production.
In 2014, record bauxite production was achieved at the Sangaredi mine inGuinea and the Weipa mine in Australia delivered a similarly strongperformance to that achieved in 2013. However, global bauxite production wasmarginally lower in 2014 compared with 2013 as Gove production wasimpacted by infrastructure constraints following the shift to bauxite exports,after curtailment of the refinery. Exports are expected to ramp up towards arun rate of eight million tonnes per annum in 2015 as export infrastructureconstraints are addressed.
Alumina production increased by six per cent in 2014. This position will befurther improved during the second half of 2015, when the expanded Yarwunrefinery in Australia is expected to reach full capacity as design andconstruction challenges are progressively addressed.
Rio Tinto’s share of aluminium production for 2014 totalled 3.4 million tonnes,which was broadly in line with 2013. Production from the new AP60 plant, andcapacity creep across the smelter portfolio offset the closure of Shawinigan inNovember 2013 and the partial shutdown at Kitimat as preparations are madeto commission the modernised smelter. Eight smelters, representing 54 percent of 2014 production volumes, achieved annual production records.
28 riotinto.com
For
per
sona
l use
onl
y

The Aluminium group continues to make some difficult but necessarydecisions with respect to portfolio management. The Gove site in Australia isnow operating as a bauxite export business, following the curtailment ofrefinery operations in May 2014. The plan is to ramp up export capacity fromsix to eight million tonnes per annum towards the end of 2015, followingupgrades to export infrastructure. While the workforce at Gove has beenreduced, the bauxite business will be used to sustain an important economicbase for the region and its Indigenous population.
Since 2009, Rio Tinto has closed, curtailed or divested approximately onemillion tonnes of primary aluminium capacity and three million tonnes ofalumina capacity. In October 2014, Rio Tinto sold its 50 per cent interest in theSØRAL aluminium smelter in Norway, and in December divested its 46.67 percent interest in the Alucam smelter in Cameroon.
The new Arvida Aluminium Smelter – AP60 Technology Centre in Quebec’sSaguenay-Lac-Saint-Jean region was inaugurated in January 2014. With aninitial capacity of 60,000 tonnes per annum, the smelter provides anindustrial-scale Research & Development platform for commercialisation ofRio Tinto’s latest-generation AP Technology™. This facility also benefits fromlow-cost, self-generated hydropower.
In Iceland, modernisation of the ISAL smelter, including the addition of aleading-edge casting facility to produce value-added billet, was completed inthe first half of 2014. Annual capacity has been increased from 190,000 to205,000 tonnes.
In June 2014, as a result of further revisions to future capital required tocomplete the modernisation project at Kitimat in British Columbia, and relatedimpacts on the project, the Kitimat assets were impaired by US$800 million(net of tax). In December 2014, an impairment reversal of US$1 billion (net oftax) was recognised relating to the Pacific Aluminium operations, wheresignificant cost improvements and high regional and product premiums haveincreased the value of the assets.
Development projectsThe Aluminium group’s development pipeline is focused on leveraging theproduct group’s two sustainable competitive advantages: unrivalled positionsin energy and bauxite.
At the year’s end, preparations were being finalised for full commissioning ofthe transformed Kitimat smelter in the first half of 2015. Leveraging theAluminium group’s wholly-owned Kemano hydropower resource and high-efficiency AP smelting technology, the Kitimat Modernisation Project willincrease production capacity at the smelter by more than 48 per cent toapproximately 420,000 tonnes per year, while reducing overall environmentalemissions by nearly 50 per cent. Kitimat will be one of the lowest-costsmelters in the world – in the first decile of the cost curve – and is strategicallylocated to supply key emerging markets in the Pacific Rim. In August 2014,the board approved additional capital of US$1.5 billion to complete the Kitimatproject, taking the total approved capital cost to US$4.8 billion.
In early 2014, Rio Tinto entered into an option agreement with LNG Canada foran undisclosed sum. Exercise of the option would entitle LNG Canada toacquire or lease a wharf and associated land at the Kitimat port to facilitate aproposed liquid natural gas export project. The exercise of this option wouldnot impact the group’s ability to operate the Kitimat aluminium smelter.
Rio Tinto is now prioritising the South of Embley bauxite growth project atCape York, Queensland in Australia. With mining costs in the first quartile andwith attractive returns, this is a Tier 1 investment opportunity. The projectincludes mine, port and infrastructure elements, with a planned initial outputof 22.8 million tonnes per year and options, using the same infrastructure, tolater expand up to 50 million tonnes. The project feasibility study is under way.The project will be brought to the board for approval in 2015.
OutlookAfter several very challenging years, there is growing optimism and positivesentiment about the prospects for the aluminium industry. The fundamentalsare strong, with forecasters anticipating a healthy market deficit outside Chinafor the coming years.
Global primary demand reached around 54 million tonnes in 2014, and isexpected to grow in the range of six to seven per cent during 2015. Aluminiumprices gradually improved over the course of 2014, and regional premiumshave continued to increase, reflecting the tight market outside China.
A combination of current forecast production rates and strong demand isexpected to result in the global market maintaining a supply deficit for 2015.Crucially, the ex-China market appears set to continue a strong rate ofdrawdown of stored metal in the coming years, which is expected to result ininventory returning to pre-financial crisis levels when measured againstgrowing demand.
Over the medium term, forecasters envisage compound annual aluminiumdemand growth of around four per cent through 2025, supported by increasedintensities in key applications, most notably the transportation sector.
Aluminium’s unique properties – light weight, strength and resistance tocorrosion – are driving increasing market penetration in the automotive market.It is expected that within the next ten years, seven out of ten new pickup trucksproduced in North America will be aluminium-bodied, as competitors follow thelead of Ford, which recently introduced its first aluminium-bodied F-150. Manyother leading automakers also have been increasing the amount of aluminiumused in lightweight and fuel-efficient car models.
Demand for alumina will be underpinned by aluminium and will be nearlybalanced, given that alumina cannot be stored as easily as aluminiumor bauxite.
Prospects for bauxite – a sector where Rio Tinto enjoys an unrivalled position –are particularly bright, with a projected rate of growth outpacing that ofaluminium, thanks in large part to robust demand in the Chinese market. Theemerging Middle East market represents an additional opportunity.
On the supply side, exports from Indonesia, a major bauxite producer, haveceased in the wake of an export ban imposed by the Indonesian Governmentthat took effect in January 2014. Although medium-term uncertainty remains,sustained tightness in supply is expected. With attractive growth opportunitiesranging from South of Embley to rich deposits in Brazil and Guinea, theAluminium group is well positioned to capitalise on increased demand forseaborne bauxite.
riotinto.com 29
ST
RA
TE
GIC
RE
PO
RT
DIRECTO
RS’R
EPORT
FINANCIA
LSTA
TEMEN
TSPR
ODUCTIO
N,R
ESERVES
ANDOPER
ATIO
NS
ADDITIO
NALINFO
RMATIO
N
For
per
sona
l use
onl
y

Copper
Financial performance
2014US$ million
2013US$ million
Revenue 6,282 5,916
Net cash generated from operating activities (a) 1,701 379
Underlying earnings 912 821
Capital expenditure 1,011 1,866
Net operating assets 10,581 12,070
(a) Net cash generated from operating activities excludes that from equity accountedunits (Escondida) but includes dividends from equity accounted units.
Strategy and strategic prioritiesThe Copper group’s strategy is to focus its resources on generating value froma core portfolio of low-cost, high-value, world-class assets. This includesexisting operations at Rio Tinto Kennecott, Oyu Tolgoi, Escondida andGrasberg, and greenfield growth opportunities at La Granja and Resolution.
The Copper group’s goal is to set an industry profitability benchmark by:
– Focusing on a world-class asset portfolio.
– Positioning itself in the first or second quartile of the cost curve.
– Delivering quality earnings by reducing costs and improving productivity.
– Making selective investments that can deliver growth to meetmarket opportunities.
The group’s strategic priorities are to:
– Improve productivity through safer, better and smarter practices, andselected technology investments.
– Drive maximum value out of the products the group mines and optimisethe entire supply chain.
– Develop strong leadership and an aligned, capable, engaged andcollaborative workforce.
SafetyIn 2014, the Copper product group’s all injury frequency rate was 0.51,compared with 0.49 in 2013. While there has not been a fatal incident in theCopper group’s managed operations in the past two years, unfortunately sixemployees were killed at the non-managed Grasberg operation during 2014:four in a haul truck incident, one due to a fall of ground in the undergroundoperation and one due to a roll-over involving a concrete mixer truck.
During 2014, the group launched several new safety initiatives:
– A Critical Risk Management programme aimed at easily identifying andmitigating the common risks that can lead to fatalities and catastrophicaccidents. The programme was built on the principles of the MaterialSafety Risk Management process at Escondida, where there have been nofatalities since the process was put in place in 2011.
– A Hand Safety campaign designed to increase employee awareness of safepractices and decrease common injuries to hands and fingers.
– Drilling safety standards and improvements to underground controlsafety standards.
Greenhouse gas emissionsThe Copper group’s 2014 greenhouse gas (GHG) emissions were 8.57 tonnesof carbon dioxide equivalent per tonne of copper cathode produced, comparedwith 8.34 tonnes in 2013. The decrease in efficiency resulted from a plannedmaintenance shutdown of the Kennecott smelter, which reduced coppercathode production year-on-year despite the continued operation of the mineand concentrator during the shutdown period. As a result, GHG emissions pertonne of copper cathode produced were higher.
Review of operationsThe Copper group is focused on creating long-term value for shareholders. Inthe short term, it aims to achieve this by improving earnings quality throughongoing cost improvements and productivity gains. In the medium term, itaims to develop attractive brownfield projects at Kennecott and Oyu Tolgoi toleverage the next copper market cycle. In the longer term, the group isfocused on two greenfield projects designed to deliver world-class returns andsteady cash flows.
In 2014, the group delivered significant improvements in productivity, with aseven per cent increase in mined copper from its operations at Kennecott andOyu Tolgoi, making Rio Tinto the world’s sixth largest supplier. The groupproduced 603 thousand tonnes of mined copper (Rio Tinto share). Copperoperations also produced 487 thousand ounces of mined gold, 4,699 thousandounces of mined silver and 11.5 thousand tonnes of molybdenum as by-products.
The Copper group’s underlying earnings of US$912 million were 11 per centhigher than 2013, driven by increased gold and molybdenum salesat Kennecott, the ramp-up of Oyu Tolgoi and delivery of further cash costsavings. The group generated sustainable cost reductions of more thanUS$900 million in 2013 and 2014, and is making good progress improvingoperating costs. In 2014, the Copper group reduced working capital byUS$500 million, generated positive free cash flow for the first time since2010 – delivering US$800 million in free cash flow – and delivered underlyingEBITDA margin improvement of 26 per cent, compared with 2013, closing thegap with its peer companies.
The group’s impairment charge resulted from a review of the investment casefor the Molybdenum Autoclave Process project at Kennecott. The reviewconcluded that the project, which has been on care and maintenance sinceearly 2013, will be terminated. The recoverable amount was determined basedon anticipated net disposal proceeds. As a result, a pre-tax impairment chargeof US$559 million has been recorded against property, plant and equipment.
As part of ongoing work to focus its portfolio on high-value, world-class assets,the group divested its ownership in the Sulawesi nickel project in Indonesia,and its 19.1 per cent stake in Northern Dynasty Minerals, owner of the Pebblecopper and gold project in the Bristol Bay region of Alaska.
Core operating assetsRio Tinto Kennecott (Rio Tinto: 100 per cent)Kennecott supplies approximately 20 per cent of US refined copperrequirements, and is one of the world’s few fully-integrated mining,concentrating, smelting and refining operations.
In 2014, Kennecott produced 204.1 thousand tonnes of refined copper,252.2 thousand ounces of refined gold, and 11.5 thousand tonnes ofmolybdenum. Production in 2014 was impacted by ongoing recovery from the130 million-tonne landslide on the north-east wall of the Bingham CanyonMine, which occurred in April 2013, and a 65-day planned smelter shutdowncompleted in the fourth quarter of 2014. Recovery work will continue in 2015,with production in the near- and medium-term impacted by continued removalof slide material and constrained by ongoing management of pit wall stability.
Oyu Tolgoi (Rio Tinto: 50.8 per cent interest in Turquoise Hill Resources)Located in Mongolia’s South Gobi Desert, Oyu Tolgoi is one of the world’slargest copper-gold-silver mines. In 2014, Oyu Tolgoi produced 148 thousandtonnes of copper and 589 thousand ounces of mined gold (100 per cent basis).Since the second half of 2014, deliveries to Oyu Tolgoi customers haveoutstripped production and the operation ended the year with inventories atnormalised levels.
Escondida (Rio Tinto: 30 per cent interest)Located in Chile’s Atacama Desert, Escondida is the world’s largest copper-producing mine. In 2014, Escondida produced 1,137.6 thousand tonnes ofmined copper (100 per cent basis). Copper production was higher year-on-year due to increased mill throughput and increased ore stacked for leaching.Water constraints at Escondida are expected to create some risk to productionvolumes in 2015.
30 riotinto.com
For
per
sona
l use
onl
y

Grasberg (a joint venture that gives Rio Tinto a 40 per cent share of productionabove specified levels until the end of 2021 and 40 per cent of all productionafter 2021)Grasberg is owned and operated by PT Freeport Indonesia (PTFI), a subsidiaryof US-based Freeport-McMoRan, Inc. Located in the province of Papua,Indonesia, it is one of the world’s largest copper mines. Rio Tinto’s share ofmined copper production at Grasberg was 7.7 thousand tonnes in 2014.
Development projectsThe Copper group is focused on delivering high-quality, medium-term projectsto extend mine life at its existing operations, creating future options withworld-class greenfield projects and developing innovations that drive safety,growth and productivity. A phased development approach allows the group todeploy capital in a way that maximises shareholder return, minimises risk andtimes new production to come online when the market requires.
Productivity and mine life extensionRio Tinto KennecottKennecott is at the early stages of its South Pushback project which mayallow the Copper group to extend the life of Bingham Canyon throughaccessing additional copper units from approximately 510 million tonnes ofore reserves(b).
GrasbergPTFI continues to develop the large-scale, high-grade underground orebodieslocated beneath and nearby the Grasberg open pit. In aggregate, theseunderground orebodies are expected to ramp up over several years toapproximately 240,000 tonnes of ore per day following the anticipatedtransition from the Grasberg open pit in 2017.
Oyu TolgoiThe Copper group is focused on unlocking the full value of Oyu Tolgoi andremains committed to the underground development, pending appropriateinvestment conditions. Rio Tinto continues to engage with the Governmentof Mongolia to resolve a number of outstanding shareholder matters, progressproject financing and meet certain conditions needed to proceed with theproposed underground development project, where a significant portion ofthe value is contained.
Greenfield projectsLa Granja (Rio Tinto: 100 per cent)Located in northern Peru, the La Granja project is one of the world’s largest-known undeveloped copper resources.
The project team is assessing a range of options to develop the large near-surface resource at La Granja, including staged development with earlyproduction from leaching of both secondary sulphide and primary sulphidemineralisation. The team continues to successfully prove very good recoveriesfrom the leaching of chalcopyrite-dominant ore, and has continued to build astrong social consensus for the project.
Resolution Copper (Rio Tinto: 55 per cent)The Resolution Copper project, located in Arizona, US, is one of the world’slargest undeveloped copper deposits. In 2014, drilling continued and theproject completed construction of the #10 mine shaft to final depth of 2,116metres. Drilling, underground development and engineering studies continueas the Copper group works to optimise the business case.
(b) This is only a portion of Rio Tinto Kennecott’s current ore reserves. See Orereserves section of this report for Rio Tinto Kennecott’s ore reserves includingbreakout of all metals and classifications.
Resolution submitted a General Mine Plan of Operations in 2013. In December2014, President Obama signed legislation that will allow the US FederalGovernment to exchange 2,400 acres of federally owned land immediatelyadjacent to Resolution’s operational site, for 5,300 acres of important wildlifehabitat, conservation and recreational land owned by Resolution. Both the landexchange and proposed mine plan will now undergo a comprehensiveenvironmental and regulatory review that includes an assessment under theUS National Environmental Policy Act. This process will include public input,government-to-government consultation with Arizona Native American tribes,and a US Federal Government appraisal of the exchange lands.
Growth and innovationRio Tinto Copper is testing and evaluating technologies to drive improved safetyand productivity at its current mines and development projects. The innovationportfolio is being prioritised to ensure that the best projects are being pursued,and that there is a balance between short and long-term initiatives.
In 2014, Rio Tinto opened the Processing Excellence Centre after successfultrials at a number of copper and energy sites. The Centre is improvingconcentrator performance by linking experts with operations across theglobe in real-time, which has driven significant improvements at Oyu Tolgoiand Kennecott.
During an industrial-scale chalcopyrite heap leaching demonstration atKennecott, the group achieved expected copper extraction targets. The Growth& Innovation team is now conducting laboratory tests at its Bundoora facilitynear Melbourne, Australia with the aim of enhancing leaching recovery further.This will allow the group to develop chalcopyrite deposits such as La Granjamore efficiently.
The Copper group is working with a variety of partners in areas such as thedevelopment of safer and more productive underground mining equipmentand processes, as well as technologies for dynamic measurement ofunderground rock mass and caving performance. The goal of these projects isto significantly improve safety and productivity during construction andoperation of underground mines.
OutlookThe copper market is expected to see a period of continued price weakness inthe short term as, despite continued demand growth, the market moves into asurplus resulting from a number of new projects coming online. However,beyond this challenging short-term picture, the medium and long-termfundamentals remain robust, with a substantial supply gap expected by theend of the decade requiring further significant investment in new capacity. Thecontinued urbanisation, industrialisation and electrification of China and otherlarge markets creates a solid demand outlook, while supply will be constrainedby the industry’s need to invest to offset grade declines and closures atexisting mines, and by the many challenges of bringing on new projects.
These market dynamics create opportunity for Rio Tinto Copper. The grouphas a world-class portfolio of low-cost assets and high-quality growthopportunities. It has made material progress in reducing costs and is oncourse to become a producer in the first or second quartile of the cost curveand deliver superior profitability. It is leveraging technology to make Coppergroup operations safer, more productive and more sustainable. The group ispursuing high-value growth opportunities at its existing operations in themedium term and greenfield development projects in the longer term, usinga phased approach to manage risk and time new production to come onlinewhen the market requires. Finally, the Copper group is building strongcommunity partnerships and encouraging its employees to deliver resultsthrough collaboration and sharing of best practices. The group believes thisstrategy will generate significant and sustainable shareholder value.
riotinto.com 31
ST
RA
TE
GIC
RE
PO
RT
DIRECTO
RS’R
EPORT
FINANCIA
LSTA
TEMEN
TSPR
ODUCTIO
N,R
ESERVES
ANDOPER
ATIO
NS
ADDITIO
NALINFO
RMATIO
N
For
per
sona
l use
onl
y
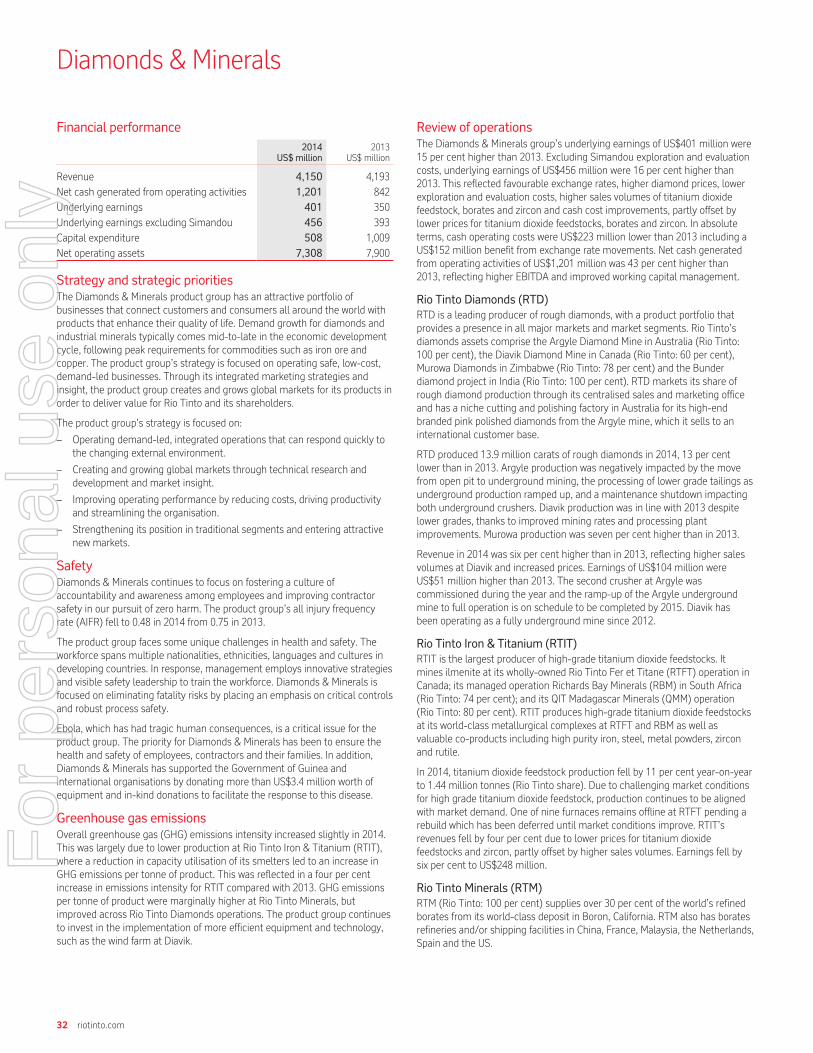
Diamonds & Minerals
Financial performance
2014US$ million
2013US$ million
Revenue 4,150 4,193
Net cash generated from operating activities 1,201 842
Underlying earnings 401 350
Underlying earnings excluding Simandou 456 393
Capital expenditure 508 1,009
Net operating assets 7,308 7,900
Strategy and strategic prioritiesThe Diamonds & Minerals product group has an attractive portfolio ofbusinesses that connect customers and consumers all around the world withproducts that enhance their quality of life. Demand growth for diamonds andindustrial minerals typically comes mid-to-late in the economic developmentcycle, following peak requirements for commodities such as iron ore andcopper. The product group’s strategy is focused on operating safe, low-cost,demand-led businesses. Through its integrated marketing strategies andinsight, the product group creates and grows global markets for its products inorder to deliver value for Rio Tinto and its shareholders.
The product group’s strategy is focused on:
– Operating demand-led, integrated operations that can respond quickly tothe changing external environment.
– Creating and growing global markets through technical research anddevelopment and market insight.
– Improving operating performance by reducing costs, driving productivityand streamlining the organisation.
– Strengthening its position in traditional segments and entering attractivenew markets.
SafetyDiamonds & Minerals continues to focus on fostering a culture ofaccountability and awareness among employees and improving contractorsafety in our pursuit of zero harm. The product group’s all injury frequencyrate (AIFR) fell to 0.48 in 2014 from 0.75 in 2013.
The product group faces some unique challenges in health and safety. Theworkforce spans multiple nationalities, ethnicities, languages and cultures indeveloping countries. In response, management employs innovative strategiesand visible safety leadership to train the workforce. Diamonds & Minerals isfocused on eliminating fatality risks by placing an emphasis on critical controlsand robust process safety.
Ebola, which has had tragic human consequences, is a critical issue for theproduct group. The priority for Diamonds & Minerals has been to ensure thehealth and safety of employees, contractors and their families. In addition,Diamonds & Minerals has supported the Government of Guinea andinternational organisations by donating more than US$3.4 million worth ofequipment and in-kind donations to facilitate the response to this disease.
Greenhouse gas emissionsOverall greenhouse gas (GHG) emissions intensity increased slightly in 2014.This was largely due to lower production at Rio Tinto Iron & Titanium (RTIT),where a reduction in capacity utilisation of its smelters led to an increase inGHG emissions per tonne of product. This was reflected in a four per centincrease in emissions intensity for RTIT compared with 2013. GHG emissionsper tonne of product were marginally higher at Rio Tinto Minerals, butimproved across Rio Tinto Diamonds operations. The product group continuesto invest in the implementation of more efficient equipment and technology,such as the wind farm at Diavik.
Review of operationsThe Diamonds & Minerals group’s underlying earnings of US$401 million were15 per cent higher than 2013. Excluding Simandou exploration and evaluationcosts, underlying earnings of US$456 million were 16 per cent higher than2013. This reflected favourable exchange rates, higher diamond prices, lowerexploration and evaluation costs, higher sales volumes of titanium dioxidefeedstock, borates and zircon and cash cost improvements, partly offset bylower prices for titanium dioxide feedstocks, borates and zircon. In absoluteterms, cash operating costs were US$223 million lower than 2013 including aUS$152 million benefit from exchange rate movements. Net cash generatedfrom operating activities of US$1,201 million was 43 per cent higher than2013, reflecting higher EBITDA and improved working capital management.
Rio Tinto Diamonds (RTD)RTD is a leading producer of rough diamonds, with a product portfolio thatprovides a presence in all major markets and market segments. Rio Tinto’sdiamonds assets comprise the Argyle Diamond Mine in Australia (Rio Tinto:100 per cent), the Diavik Diamond Mine in Canada (Rio Tinto: 60 per cent),Murowa Diamonds in Zimbabwe (Rio Tinto: 78 per cent) and the Bunderdiamond project in India (Rio Tinto: 100 per cent). RTD markets its share ofrough diamond production through its centralised sales and marketing officeand has a niche cutting and polishing factory in Australia for its high-endbranded pink polished diamonds from the Argyle mine, which it sells to aninternational customer base.
RTD produced 13.9 million carats of rough diamonds in 2014, 13 per centlower than in 2013. Argyle production was negatively impacted by the movefrom open pit to underground mining, the processing of lower grade tailings asunderground production ramped up, and a maintenance shutdown impactingboth underground crushers. Diavik production was in line with 2013 despitelower grades, thanks to improved mining rates and processing plantimprovements. Murowa production was seven per cent higher than in 2013.
Revenue in 2014 was six per cent higher than in 2013, reflecting higher salesvolumes at Diavik and increased prices. Earnings of US$104 million wereUS$51 million higher than 2013. The second crusher at Argyle wascommissioned during the year and the ramp-up of the Argyle undergroundmine to full operation is on schedule to be completed by 2015. Diavik hasbeen operating as a fully underground mine since 2012.
Rio Tinto Iron & Titanium (RTIT)RTIT is the largest producer of high-grade titanium dioxide feedstocks. Itmines ilmenite at its wholly-owned Rio Tinto Fer et Titane (RTFT) operation inCanada; its managed operation Richards Bay Minerals (RBM) in South Africa(Rio Tinto: 74 per cent); and its QIT Madagascar Minerals (QMM) operation(Rio Tinto: 80 per cent). RTIT produces high-grade titanium dioxide feedstocksat its world-class metallurgical complexes at RTFT and RBM as well asvaluable co-products including high purity iron, steel, metal powders, zirconand rutile.
In 2014, titanium dioxide feedstock production fell by 11 per cent year-on-yearto 1.44 million tonnes (Rio Tinto share). Due to challenging market conditionsfor high grade titanium dioxide feedstock, production continues to be alignedwith market demand. One of nine furnaces remains offline at RTFT pending arebuild which has been deferred until market conditions improve. RTIT’srevenues fell by four per cent due to lower prices for titanium dioxidefeedstocks and zircon, partly offset by higher sales volumes. Earnings fell bysix per cent to US$248 million.
Rio Tinto Minerals (RTM)RTM (Rio Tinto: 100 per cent) supplies over 30 per cent of the world’s refinedborates from its world-class deposit in Boron, California. RTM also has boratesrefineries and/or shipping facilities in China, France, Malaysia, the Netherlands,Spain and the US.
32 riotinto.com
For
per
sona
l use
onl
y

Borates production of 508,000 tonnes boric oxide equivalent was three percent higher than in 2013 in response to higher sales demand. Global demandfor RTM refined borates improved slightly with revenue three per cent higherthan 2013. Earnings of US$121 million were eight per cent lower than 2013due to a decrease in product prices and the absence of prior year tax benefits.During the year, Rio Tinto Minerals completed the modified direct dissolving ofkernite (MDDK) project, which allows for more efficient orebody utilisation.
Dampier Salt (DSL)DSL (Rio Tinto: 68 per cent), the world’s largest solar salt exporter, producesindustrial salt by solar evaporation of seawater at Dampier and Port Hedland,and from underground brine at Lake MacLeod, all in Western Australia. Salt issold principally to base chemical industry markets in Asia. Salt production of6.8 million tonnes (Rio Tinto share) was one per cent higher than 2013.
Development projectsThe feasibility study to develop the A21 kimberlite pipe at Diavik wascompleted and approved in 2014. This development will provide an importantsource of incremental production to maintain existing production levels. A21 isestimated to cost US$350 million (Rio Tinto share US$210 million), with firstproduction expected in 2018.
Work continued on the feasibility study for the Zulti South mine expansion atRBM, which will maintain the low-cost RBM smelter capacity post-2017. If theproject is approved in 2015, commissioning is scheduled for 2017. The mineralsands exploration programme in Mozambique and other brownfield studies atthe group’s operations also continued throughout the year.
The Simandou iron ore project in Guinea is one of the largest-knownundeveloped high-grade iron ore resources in the world. The concession willenable the development of the largest mine and infrastructure project everundertaken in Africa. This will include the progressive development of a100 million tonne per annummine, a 650-kilometre trans-Guinean railway anda new deep-water port.
In May 2014, Rio Tinto and its partners, Chinalco and the International FinanceCorporation, signed the Investment Framework with the Government ofGuinea for the development of the Simandou iron ore project. This providesthe legal and commercial foundation for the project and formally separatesthe infrastructure from the mine development. The Investment Frameworkwas approved for ratification by the Guinean National Assembly in June 2014,followed by Presidential promulgation and Supreme Court review and tookeffect in August 2014.
The project partners are continuing to work towards the completion of abankable feasibility study and the establishment of a funding consortium tobuild the infrastructure. These two elements will provide the basis fordisciplined capital allocation decisions.
The Bunder diamond project is progressing its prefeasibility study, whichbegan in July 2010. These studies have confirmed the economic potential ofthe orebody and work is under way on the mine plan, environmental andforestry approvals required to execute a Mining Lease.
The Jadar Project in Serbia is potentially a world-class lithium-borate depositdiscovered by Rio Tinto in 2004. If developed, the deposit could supply asignificant proportion of global demand for lithium and borates. Findings so farare encouraging and feasibility assessments are ongoing to build an economicbusiness case and advance the environmental and social-economic impactassessments for the project. Lithium carbonate’s fastest-growing application isin batteries that provide clean power to industrial systems and electric andhybrid vehicles.
In 2011, Diamonds & Minerals re-entered the potash business through anexploration joint venture with North Atlantic Potash Inc. (NAPI), a subsidiary ofJSC Acron. Acron is a world leader in fertiliser production and holds multiplepotash exploration permits in Saskatchewan, Canada. Rio Tinto has completedan extensive exploration programme on the joint venture properties, withpromising results and is in discussions with NAPI and Acron regarding thefuture of the joint venture. Higher nutritional standards, population growth andlimited arable land make potash a critical factor in maintaining global foodsecurity, and a natural complement to RTM’s existing borate fertiliser business.
OutlookDiamonds & Minerals’ businesses serve a range of different industries, buthave in common a track record of creating and defining new and profitablemarkets for the group’s products. Demand softened in these markets in 2013and 2014 in response to broader economic trends. The group’s key marketsare beginning to stabilise, although the pace of recovery is slower thanpreviously thought and unlikely to fully manifest during 2015. However, themedium- to long-term outlook continues to be positive across all products asurbanisation and rising standards of living, particularly in China, drive higherlevels of demand.
RTM will continue to seek to capture profitable growth in emerging economiesand maintain its position in its established markets. Ongoing supply chainimprovements will facilitate speed and flexibility in shifting supply to promisingsectors and regions. Demand for borates is expected to remain stable in thenear term, and the long-term industry fundamentals remain attractive. RTMwill focus on increasing refined borates capacity to meet higher-than-GDPdemand growth while achieving world-class safety performance and improvingits cost position.
Demand for titanium dioxide feedstock is expected to continue to grow in themedium to long term, in line with improving global economic conditions,urbanisation and demand growth in emerging markets supported by rising percapita incomes. In response to weak demand and excess inventory in thefeedstock supply chain, and in order to reduce operating costs and inventory,RTIT has taken action at a number of its operations, including temporaryclosures of the QMMmine and the upgraded slag (UGS) plant and deferral of afurnace rebuild at RTFT. Pigment and feedstock inventories within the supplychain are now returning towards historical levels.
The medium to long-term fundamentals for the diamond industry are positiveand expected to support sustainable future price growth. The global mineralresource base is steadily declining, compounded by limited explorationinvestment and success, and expected reductions in supply over the mediumto longer term. Demand in India and China is expected to continue to grow,and to represent nearly 50 per cent of global diamond consumption by 2025.Demand in mature markets is expected to continue to grow in line with GDP.
riotinto.com 33
ST
RA
TE
GIC
RE
PO
RT
DIRECTO
RS’R
EPORT
FINANCIA
LSTA
TEMEN
TSPR
ODUCTIO
N,R
ESERVES
ANDOPER
ATIO
NS
ADDITIO
NALINFO
RMATIO
N
For
per
sona
l use
onl
y

Energy
Financial performance
2014US$ million
2013US$ million
Revenue 4,308 5,454
Net cash generated from operating activities 355 919
Underlying earnings/(loss) (210) 33
Capital expenditure 224 732
Net operating assets 3,794 4,872
Strategy and strategic prioritiesThe Energy product group aimed to safely deliver superior margins and growthfrom a strong existing resource base to serve growing global energy demand.
Its strategic priorities were:
– Extract full value from the group’s assets.
– Leverage technology and deliver competitive projects.
– Maintain the group’s licence to operate.
– Build and steer a resilient, high-return portfolio.
SafetyThe Energy product group’s 2014 all injury frequency rate was 0.74 comparedto 0.67 in 2013 with a large number of hand injuries recorded during the year.
Energy strives to foster a culture of shared and personal accountability forhealth and safety, and to create a workplace where everyone goes home safeand well at the end of every shift. Throughout 2014, the group’s health andsafety efforts focused on:
– Strengthening the management of critical risks, specifically in areas ofprocess safety, underground operations, and vehicles and driving.
– Improving contractor safety performance through active engagement andinteraction with contract partners.
– Comprehensively refreshing the safety culture and systems at all sites toraise personal awareness and commitment to improve hazardmanagement processes, and to strengthen the implementation of lessonsarising from incidents.
– Reducing high frequency incidents such as hand injuries.
Greenhouse gas emissionsThe Energy group’s greenhouse gas emissions decreased to approximately3.3 million tonnes of carbon dioxide equivalent in 2014, compared with3.6 million tonnes in 2013. This reduction was mainly due to the divestment ofthe Clermont Mine and the closure of the Blair Athol Mine, and the continuedefforts of the group to increase the energy efficiency of its operations through arange of initiatives including equipment optimisation and engine improvements.
Over the past 15 years, Rio Tinto has spent more than US$100 million onresearch and development into technologies that will reduce emissions fromcoal-fired power plants. In 2014, the Energy product group continued itssponsorship of The Otway Project, Australia’s first industrial-scaledemonstration of geological carbon dioxide capture and storage.
Review of operations2014 was another challenging year for the Energy product group as thebusiness environment for both coal and uranium remained very difficult. Thegroup’s underlying loss of US$210 million compared with underlying earningsof US$33 million in 2013.
Annual site production records at Hail Creek, Hunter Valley Operations andBengalla, cost improvements and benefits from a weaker Australian dollarwere more than offset by lower prices, which reduced earnings byUS$434 million, and lower uranium production. Energy continued to focus onpositioning its assets further down the cost curve through a range of cost,productivity and revenue enhancements. An aggressive programme of costand productivity improvements delivered US$795 million of pre-tax cashsavings in 2014 and 2013 compared with 2012, contributing to the productgroup’s cash flow generation in 2014.
Energy’s focus has been on safely creating value, reducing costs, eliminatingwaste and improving asset and labour productivity. This work coupled with theagility to adjust production mix in response to changing market conditions, isprotecting value in very challenging times.
The product group’s extensive operational and marketing expertise enabledfurther volume, cost and margin improvements to be secured. Energy retainsdeep and enduring relationships with its customers, built upon a foundationof high-quality products supplied reliably and consistently, over long periodsof time. On average over the past three years, Energy’s marketing teamhas delivered a price premium to spot market benchmarks of approximatelyeight per cent for coking coal, ten per cent for thermal coal and 35 per centfor uranium.
In April 2014, the group’s two uranium operations – Rössing and EnergyResources of Australia – each entered into a new marketing and salesagreement with Rio Tinto Uranium (RTU). Under the new agreements, RTU willpurchase uranium oxide from both operations and market the combined pooldirectly to customers. This new arrangement provides Energy’s uraniumcustomers with the benefit of multi-sourced supply.
In 2014 Rio Tinto sold its 50.1 per cent share in the Clermont coal mine inQueensland to GS Coal Pty Ltd for US$1.015 billion, and its coal operations inMozambique to International Coal Ventures Private Limited for US$50 million,both before net debt and working capital adjustments.
Rio Tinto Coal Australia (Rio Tinto: 100 per cent)In Queensland, Rio Tinto Coal Australia (RTCA) manages the Hail Creek(Rio Tinto: 82 per cent) and Kestrel (80 per cent) coal mines. As stated above,Rio Tinto sold its interest in the Clermont Mine in May 2014.
In New South Wales, RTCA manages Coal & Allied’s coal mines which includeHunter Valley Operations (80 per cent), Bengalla (32 per cent), Mount Thorley(64 per cent) and Warkworth (44.5 per cent).
Lower prices for all types of coal saw RTCA’s net earnings decline fromUS$367 million in 2013 to US$21 million in 2014. In very difficult marketsRTCA has worked hard to improve its operational performance. Its coal minesremain cash flow positive with the majority placed in the lowest quartile of thecost curve.
Significant productivity gains across the Australian coal business deliveredannual site production records at Hail Creek, Hunter Valley Operations andBengalla. Excluding production from the Clermont Mine which was divestedduring the year, thermal coal production increased by 15 per cent (Rio Tintoshare) in 2014 compared with 2013.
The product group declared a significant increase in its Hunter Valleymanaged thermal coal reserves in November 2014, compared with theprevious estimates reported in Rio Tinto’s 2013 Annual report.
RTCA is using technology and innovation to boost its competitive edge. TheRio Tinto Processing Excellence Centre located in Brisbane is helping improveyields at its sites; an Integrated Operations Centre planned to open in 2015 inSingleton is supporting the optimisation of mine performance; and automateddrilling is being piloted at Hunter Valley Operations.
RTCA is also demonstrating operational and commercial excellence byadjusting semi-soft coal production to deliver improved margins at its HunterValley sites. In response to deteriorating coking coal markets its Hail CreekMine began producing a thermal coal product for targeted customers.
RTCA has been working for nearly five years to secure a long-term future forMount Thorley Warkworth mine. In 2014, it continued to seek approvals tomaintain operations at the 30 year old mine, on land it owns within thefootprint of existing mining leases. Approval is critical for the future of theoperation and its 1,300 employees and contractors as existing approvalsonly allow the mine to maintain production and employment at currentlevels until the end of 2015. Two separate planning applications have beensubmitted for the integrated operation and the NSW Department of Planningand Environment has recommended approval. A decision on both applicationsis expected in 2015.
34 riotinto.com
For
per
sona
l use
onl
y

Zululand Anthracite Colliery (Rio Tinto: 74 per cent)ZAC is an anthracite coal mine in South Africa which was held for sale until1 April 2014 when it became a Rio Tinto managed operation.
Rio Tinto Coal Mozambique (formerly Rio Tinto: 100 per cent)In October 2014, Rio Tinto completed the sale of RTCM, which includes theBenga coal mine in the Tete province of Mozambique, to International CoalVentures Private Limited.
Energy Resources of Australia (Rio Tinto: 68.4 per cent)ERA is a publicly-listed company which operates the Ranger Mine in theNorthern Territory of Australia. No uranium oxide was produced in the firsthalf of 2014 due to a leach tank failure on 7 December 2013 which triggeredthe suspension of processing operations and a series of investigations. AGovernment-appointed taskforce was established to oversee the regulatoryresponse to the leach tank failure. A progressive restart of the Rangerprocessing plant began on 5 June 2014, with the mill processing lower-grade stockpiled material, following receipt of written approval from theCommonwealth Minister for Industry and the Northern Territory Departmentof Mines and Energy.
ERA produced a total of 1,757 thousand pounds (Rio Tinto share) of uraniumoxide in 2014. Its 2014 full-year earnings were unfavourably impacted by costsassociated with the leach tank failure and subsequent suspension ofprocessing plant operations. Uranium oxide was purchased to fulfil higherprice contracted sales, partly mitigating effects of the suspension.
Progressive rehabilitation over the Ranger Project Area advanced during 2014.A total of more than 33 million tonnes of material has been returned to Pit 3,and rehabilitation of Pit 1 is well advanced.
The Ranger 3 Deeps project remains in prefeasibility. On 3 October 2014 ERAlodged a Draft Environmental Impact Statement for the proposed Ranger 3Deeps underground mine with the Northern Territory EnvironmentalProtection Authority and the Commonwealth Department of the Environment.
During 2014 ERA achieved cash savings of more than A$23 million, surpassingits objective of saving a cumulative A$150 million in operating costs during theperiod 2011-2014.
Rössing Uranium Limited (Rio Tinto: 68.6 per cent)Rio Tinto’s share of uranium production at Rössing was 2,333 thousandpounds in 2014. Production was impacted by a leach tank failure in late 2013and the introduction of a new operating model in mid-2014. Under this newmodel Rössing is tailoring production to meet only existing long-termcustomer requirements.
In June, a planned shutdown of the processing plant allowed for majormaintenance work to be carried out. The work was completed without anysafety incidents and plant operations were successfully restarted on1 July 2014.
In light of continued low prices for uranium, Rössing embarked on anaggressive cash generation programme in 2014. The business exceeded itssavings target for the year, delivering US$14 million against a target ofUS$12 million from a range of initiatives.
Rio Tinto Canada Uranium (Rio Tinto: 100 per cent)Rio Tinto Canada Uranium’s Roughrider project is an exploration site located inCanada’s Athabasca Basin in north-east Saskatchewan. The basin suppliesapproximately 20 per cent of the world’s uranium.
In 2014, the Canadian Government and the European Union signed aComprehensive Economic Trade Agreement which provides an exemption toeligible companies from the Non-Resident Ownership Policy as it applies toforeign ownership of uranium mines. Once ratified, this change meansRio Tinto could, if economical to do so, develop a uranium operation withoutthe need to first find a Canadian majority partner.
Exploration and development studies on the project progressed during 2014.
Development projectsRio Tinto’s premium coal assets in Australia’s Hunter Valley present a numberof low-capital, high-quality growth options.
The Mount Pleasant project is the largest undeveloped deposit in the HunterValley and has high quality coal, a low strip ratio, existing consents andcommitted rail and port facilities. Located adjacent to Bengalla mine, MountPleasant is an attractive, low-capital expansion option and is in the advancedstages of study. It has a capital intensity of between A$100 and A$150 persaleable tonne with an expected capacity of 8.5 million tonnes per annum ofsaleable product.
In late 2014, the Hunter Blend project was launched. The project aims toenable Rio Tinto to operate its Hunter Valley coal mines, plants and logisticsinfrastructure as one integrated system to deliver greater value and synergiesthan through the present standalone operations.
The Mount Pleasant and Hunter Blend projects are both opportunities tofurther improve the overall efficiency of Rio Tinto’s operations in the HunterValley and to maximise the synergies that exist across the business. Whilst thegroup’s world class resource base offers a range of further brownfieldopportunities, these two projects, when combined with the existing businesstransformation programme, effectively deliver 67 per cent volume growth anda 40 per cent cost reduction against 2012 levels.
Rio Tinto is continuing to assess options for open cut mining on the easternside of Hail Creek Mine in Queensland. It is also exploring the potential forunderground mining. Government approvals and a prefeasibility study are inprogress. A decision on the timing and nature of future development at HailCreek will be made once these are complete.
Other options in the Australian coal portfolio include the Valeria and WinchesterSouth projects. Valeria is a large, predominantly semi-soft and thermal coaldeposit in central Queensland. It is close to existing infrastructure, with 40km ofrail needed to reach Kestrel Mine. Winchester South is a coking coal deposit incentral Queensland.
OutlookWhilst the short-term outlook for coal and uranium remains challenging, thelong-term outlook is more positive. Energy demand continues to grow.Globally, it grew by 50 per cent between 1990 and 2011 and the InternationalEnergy Agency expects it to grow by a further 40 per cent to 2035.
All energy sources will be needed to meet increased demand. However, muchof it is expected to be met by coal – the cheapest and most readily availablesource of energy. High quality thermal coal is likely to be in demand forefficiency and air quality reasons, which aligns with Rio Tinto’s premiumresource and product profile.
Demand for uranium is expected to grow steadily in the longer term, andnuclear power remains the only base-load energy source that does notproduce greenhouse gases.
Geologically, coking coal remains a relatively scarce commodity found in asmall number of discrete locations of which the Bowen Basin in Australia is oneof the most significant. Long-term demand appears to be firm, underpinned byurbanisation and industrialisation in the major developing economies of Chinaand India, causing steady growth in steel output.
Rio Tinto is ideally positioned to continue supplying premium energy productsto traditional markets in Japan, Taiwan and Korea, which are dependent onimports for all of their primary energy needs, while capturing growthopportunities in emerging markets. India’s coal imports have been increasingand are rapidly becoming as significant as China, while a number of ASEAN(Association of Southeast Asian Nations) countries are also looking to securereliable international coal supplies.
riotinto.com 35
ST
RA
TE
GIC
RE
PO
RT
DIRECTO
RS’R
EPORT
FINANCIA
LSTA
TEMEN
TSPR
ODUCTIO
N,R
ESERVES
ANDOPER
ATIO
NS
ADDITIO
NALINFO
RMATIO
N
For
per
sona
l use
onl
y

Iron Ore
Financial performance
2014US$ million
2013US$ million
Revenue 23,281 25,994
Net cash generated from operating activities 10,274 14,008
Underlying earnings 8,107 9,858
Capital expenditure 4,211 6,814
Net operating assets 20,987 21,062
Strategy and strategic prioritiesThe Iron Ore product group’s vision is to remain the best iron ore producer inthe world by focusing on three strategic goals:
– Production at the right cost, delivered through high-performing teams withthe support of unrivalled technology.
– Value-driven growth through disciplined phasing and low-cost growthoptions.
– Maximising portfolio value through specialist sales and marketing expertise.
SafetyIn 2014, Iron Ore’s all injury frequency rate was 0.73 compared with 0.70 in theprevious year. This result was reached amidst a challenging environment inwhich Iron Ore completed 80 per cent of the infrastructure component of thePilbara 360 million tonne per annum (Mt/a) expansion programme andrecovered from a severe tropical cyclone. Sadly, there was one fatality inNovember 2014 at the Iron Ore Company of Canada. Train driver EnrickGagnon lost his life as a result of a train derailment on the Quebec NorthShore and Labrador railway (QNS&L) that was caused by a landslide.
During 2014 Iron Ore initiated a health, safety and environment system reviewand continued with the roll-out of improvements to safety interactions,pre-start safety meetings and safety training programmes. The group hascontinued the implementation of its innovative THINK safety programme,which is focused on increasing employee engagement and leadership insafety management.
In Western Australia the group maintained a strong focus on the mental healthof employees, including the development of a three-year wellbeing strategy.This focuses on building both mental and physical wellbeing, raising awarenessand better equipping leaders to provide support and recovery assistance whenrequired. Implementation of the strategy will commence in 2015.
The Pilbara Utilities team received the 2014 Group-wide Chief Executive SafetyAward, which recognises the sites and teams with the best annual safetyperformance over the prior three years.
Greenhouse gas emissionsDuring 2014 there was a significant change in the external legislativeenvironment for energy and climate change. The Australian Governmentrepealed both the Energy Efficiency Opportunities (EEO) Act and the CleanEnergy Act, effective 1 July 2014, introducing a review of the renewable energytarget and commissioning a white paper on energy issues.
Throughout 2014, Iron Ore continued to implement high value opportunitiesidentified in the final round of EEO, establishing more than 35 initiatives acrossmines, rail and ports. For example at Yandicoogina, greenhouse gas emissionshave been reduced by approximately 8,700 tonnes of carbon dioxide per yearthrough the use of a Le Tourneau 2350 loader, which uses regenerativetechnology to achieve a low fuel burn rate.
Iron Ore met all legislative requirements in 2014, including reporting, under theNational Greenhouse and Energy Reporting Scheme, the Clean Energy Act, theClean Energy Repeal Bill, and the EEO Act, until it was repealed in July.
The product group’s total greenhouse gas emission intensity has improved6.7 per cent on the baseline target set in 2008.
Greenhouse gas (GHG) intensity of saleable production at the Iron OreCompany of Canada marginally improved during 2014 despite a product mixthat saw a greater fraction of total concentrate production converted to themore GHG-intensive pellet product. Although being more GHG intensive toproduce than concentrate, pellet ultimately provides a lower GHG intensityroute to finished steel for the end user.
Review of operationsRio Tinto operates a world-class iron ore portfolio. Operations in the Pilbararegion of Western Australia comprise 15 mines, four independent portterminals, the largest privately-owned heavy freight railway in Australia andsupporting infrastructure, including the Operations Centre in Perth. The IronOre Company of Canada (IOC) operates a mine, concentrator and pelletisingplant in the province of Newfoundland and Labrador, together with portfacilities in Sept-Îles, Quebec. Rio Tinto Marine delivers shipping services tothe wider Rio Tinto Group, including Iron Ore.
In 2014 Iron Ore achieved underlying earnings of US$8,107 million. Recordsales volumes, continued cash cost savings and lower taxes following therepeal of Mineral Resources Rent Tax in September 2014 were offset byweaker iron ore prices, down 30 per cent on average year-on-year, reducingearnings by US$3.8 billion on 2013.
Iron Ore met global production guidance in 2014, producing 295.4 milliontonnes globally. Rio Tinto’s share of production was 233.6 million tonnes – anincrease of 12 per cent on 2013.
Quarterly production and sales records were consistently achieved throughthe year. This strong performance was delivered despite interruptions causedby severe weather conditions in both the Pilbara and Canada. In January 2014,all Pilbara coastal and some mine operations were suspended as a result oftropical cyclone Christine and heavy rainfall that continued into February.North America’s extreme weather in Q1 also significantly affected IOC’sproduction and shipments in the first half of 2014.
Pilbara production improved as the year progressed, contributing to the earlyachievement of a 290 Mt/a run rate. Production at IOC stabilised as phase twoof the Concentrate Expansion Project (CEP) was successfully completed,delivering 8.7 million tonnes of pellets and 6.0 million tonnes of concentratefor sale for the year.
Steel demand in China, while robust, did not grow at the strong rateswitnessed for most of the past decade. Combined with strong growth inseaborne iron ore supply, this put downward pressure on the iron ore price,with the Platts 62 per cent iron fines index averaging US$96.70 per dry metrictonne, a landed price in China that excludes moisture content. Iron Ore’sglobal shipments in 2014 were 303 million tonnes at an average realised freeon board (FOB) price of US$84.30 per wet metric tonne for Pilbara volume.
Rio Tinto Marine shipped 238 Mt of dry bulk cargo on behalf of the widerGroup, an increase of 25 per cent on 2013. Rio Tinto is now the largest drybulk shipping business in the world in terms of volume, with a contract fleet ofmore than 200 vessels at any given time, including 17 vessels owned byRio Tinto. Average freight rates in 2014 tracked below 2013 and forwardvoyage rate curves are flat, reflecting vessel oversupply and a drop in bunkerfuel prices.
In the Pilbara, a new nameplate capacity of 290 Mt/a capacity was achieved inMay 2014, two months ahead of schedule. Effective coordination between theexpansion and operations teams enabled an almost seamless transition to theincreased nameplate capacity, overseen by the Operations Centre to ensureoptimal supply chain performance.
“Production at the Right Cost” improvement initiatives focused heavily onreducing costs and driving productivity gains, contributing US$710 million inpre-tax savings to the wider Rio Tinto Group since 2012. These includedreducing the use of contractors, external service providers and consultants,finding low-cost production improvements, increasing the utilisation of assetsand maximising the value of new technologies. People remained a key driverin reducing costs and increasing productivity throughout 2014. An example ofthis was the Training Transformation strategy, which returned an overall
36 riotinto.com
For
per
sona
l use
onl
y

376,000 productive hours to the business and delivered an overall saving ofUS$48 million through a focus on future innovation and technology solutions,and real-time field training.
The Mine of the Future™ programme continued to deliver efficiencies in 2014across production, health, safety and environmental performance. Inconjunction with the Technology & Innovation group, Iron Ore successfullyconverted four drills at the West Angelas mine to an Autonomous DrillingSystem, adding to the two units already in operation. The autonomoushaulage system (AHS) continued to be deployed across the Pilbara, deliveringlower load and haul operating costs, increased productivity and safer operatingenvironments. At the Hope Downs 4 mine, autonomous haulage exceeded theIron Ore Pilbara site with the highest manned effective utilisation by 14 percent, and decreased load and haul operating costs by approximately 13 percent. Hope Downs 4 and Nammuldi mines became the first fully-operationalAHS sites, with 19 Komatsu 830E AHS haul trucks at Hope Downs 4 and 25Komatsu 930E AHS trucks at Nammuldi. A further 13 930E AHS trucks arealso in operation at Yandicoogina. Iron Ore continues to be the world’s largestoperator of AHS trucks and a proud leader in automated mining technologies.
Progress was also made towards AutoHaul®, the world’s first autonomousheavy-haul rail system, with the project moving through a number of testingphases and the first autonomous train journey piloted in the fourth quarter.
Throughout the year, the US$300 million Wickham town upgrade project,supporting the Cape Lambert rail and port operations workforce, was largelycompleted. It included construction of more than 240 houses, the WickhamLodge fly-in, fly-out accommodation and the Julutharndu Maya centralfacilities building as well as new parks, roads and other town infrastructure.
In 2014, a key focus for Iron Ore remained on supporting local communities,businesses and people within the company’s operational footprint. Sixty threeper cent of expenditure outlayed to businesses located in the Pilbara, was withPilbara Aboriginal businesses and their joint venture partners, providingintegral services to various operations and projects, and saw millions of dollarsreinvested into local economies. Iron Ore remains one of the largest privatesector employers of Aboriginal people, with more than 1,100 workers in 2014.
Iron Ore continued to actively implement key participation agreements withTraditional Owners in the Pilbara, which secures land access for the life ofmining operations. These agreements incorporate mutual obligations todeliver outcomes in employment, financial compensation, education andtraining, heritage surveys and practices, environmental care and land use.
IOC (Rio Tinto share 58.7 per cent) continued to be an important operationwithin Iron Ore’s portfolio, maintaining a strong position as a supplier of highquality, premium pellets and high quality, low contaminant concentrate. Thecompany is poised to realise the full potential of an enviable orebody andadditional capacity brought online through recently completed expansions,while the operation remains dedicated to the journey towards zero harm.
Development projectsIn May, Iron Ore announced that the Pilbara network of mines, rail and portshad reached a run rate of 290 Mt/a, two months ahead of schedule, followingcompletion of first-phase port and rail expansion works in late 2013. Thismajor milestone signalled a step change in production performance and pavedthe way for second-phase developments to 360 Mt/a.
Infrastructure to support the 360 Mt/a expansion is 80 per cent complete, withall marine and wharf works commissioned. A new shiploader at Cape LambertPort B has been installed along with the early commissioning of a new stackerand reclaimer. First ore through a new car dumper was achieved ahead ofschedule in the third quarter and all rail works for the expansion to 360 Mt/ahave been completed, including AutoHaul® wayside rail works.
Iron Ore’s breakthrough pathway to match the upgraded port and rail capacitywill see Pilbara mine production capacity increase towards 350 Mt/a through aseries of low-cost brownfield expansions. US$400 million of capital expenditurewas also approved for plant equipment and modification, as well as additionalheavy machinery for use at various mines in the Pilbara. The rapid low-cost
growth pathway from existing mines such as West Angelas deposit B,Paraburdoo, Brockman 2, Nammuldi and Yandicoogina is well advanced, witharound 40 Mt/a approved and in implementation. This will enable a targetproduction rate of more than 330 Mt/a in 2015 and support delivery towards350 Mt/a in 2017. An investment decision regarding development of thegreenfield Silvergrass mine has been deferred until 2016.
The brownfield mine growth is being achieved at an average mine productioncapital intensity of approximately US$9 per tonne and the full expansion from220 Mt/a to 360 Mt/a is expected to be delivered at an industry-leading capitalintensity of US$110-120 per tonne.
Iron Ore’s Pilbara expansion programme remains the largest integrated miningproject in Australian history and has a proven record of delivering projectstages on time and budget.
Milestones from 2014 include first ore delivered from a new 21-kilometreconveyor system at Western Turner Syncline to Tom Price in the first quarter.Completion of this project contributed to the 360 Mt/a expansion plan andprovides a safer, more efficient alternative to the previous road haul operation.Rio Tinto has also approved development of Western Turner Syncline phasetwo, which will increase production by an additional 7 Mt/a.
The Nammuldi Below Water Table process plant delivered first ore to thestockyards in November and is expected to be in full production by the end ofthe first quarter of 2015.
First ore was also delivered through the new fines circuit and stacker at WestAngelas deposit B in mid-November, five weeks ahead of plan. Development ofdeposit B included a new pit, fines circuit, stacker, and a haul road connectingto deposit A. All other non-processing infrastructure is scheduled forcompletion in the first quarter of 2015.
Marandoo phase two, which includes construction of a new wet processingplant to access ore reserves below the water table, was completed in 2014 andwill extend the life of Marandoo operations.
At IOC, the completion of stage two of the Concentrate Expansion Project inthe first half helped remove pit-to-plant bottlenecks and aided extra capacityto grow production. The project commissioned an additional ball mill andmining equipment, and upgraded power distribution infrastructure providingan additional 1.3 Mt concentrate capacity.
OutlookThe demand outlook for iron ore remains sound with expected contestableiron ore demand growth in excess of 100 Mt/a by 2020. In the longer term,there is significant potential for growth in demand in emerging markets suchas ASEAN and India due to population growth, urbanisation and risingincomes.
Supply growth is expected to outpace demand growth, with approximately300 Mt/a of additional seaborne capacity currently under construction or inramp-up. These volumes will be spread out across the remainder of thisdecade and, as a consequence, supply-side exits from Chinese domesticsuppliers and some high-cost seaborne suppliers will continue. Approximately125 Mt of high-cost supply from China and non-traditional seaborne suppliersexited in 2014.
With its low-cost position, proximity to China and emerging markets, and suiteof iron ore products, Rio Tinto is well placed to take advantage of demandgrowth for seaborne iron ore through its expansion options.
riotinto.com 37
ST
RA
TE
GIC
RE
PO
RT
DIRECTO
RS’R
EPORT
FINANCIA
LSTA
TEMEN
TSPR
ODUCTIO
N,R
ESERVES
ANDOPER
ATIO
NS
ADDITIO
NALINFO
RMATIO
N
For
per
sona
l use
onl
y

Exploration
Rio Tinto has had a sustained commitment to exploration since 1946, with anexceptional track record in mineral discovery. Mature operations such asWeipa, the Pilbara and Rössing were Tier 1 greenfield discoveries by Rio TintoExploration where value is still being realised after more than 40 years ofproduction.
StrategyThe goal of Exploration is to create value for Rio Tinto through the discovery oracquisition of well-located, high-grade Tier 1 resources to supplement theGroup’s existing high-quality resource base. The Exploration group performsboth greenfield and brownfield exploration programmes and undertakesfocused research and development to aid the exploration effort. Greenfieldexploration aims to establish completely new operating business units,involving, among other objectives, geographic or commodity diversification.Brownfield exploration is directed at sustaining or growing existing Groupbusinesses in the orbit of existing operations, providing significant value to theproduct groups.
Additionally, Exploration is supporting an increasing array of projects acrossthe business. This includes providing orebody knowledge expertise to theproduct groups, helping business development groups to evaluate merger andacquisition opportunities and assisting the Economics team with industryanalysis and intelligence to support supply forecasts. In 2014, Exploration alsoreviewed the orebody knowledge content for all projects that were progressedto the Investment Committee.
The exploration process can take over 20 years to progress from targetgeneration to development decisions, due to community, sustainability andinvestment requirements. Rio Tinto’s core exploration capability and rigorousglobal prioritisation process has consistently delivered Tier 1 discoveries.Tier 1 discoveries over the past decade include:
Year Discovery Commodity Location
2005 La Granja Copper Peru2005 Caliwingina Iron ore Australia2008 Sulawesi Nickel Indonesia2008 Mutamba Titanium Mozambique2009 Jadar Lithium/borates Serbia2011 Amargosa Bauxite Brazil2013 KP405 Potash Canada2014 Yandi Braid Iron ore Australia
At the end of 2014, the Exploration group was active in 19 countries andassessing opportunities in other countries across a range of commoditiesincluding copper, nickel, iron ore, bauxite, coking coal, uranium, diamonds andmineral sands. Exploration activities in China were conducted through CRTX,the joint venture between Chinalco (51 per cent) and Rio Tinto (49 per cent).
The Exploration group is organised into regional multi-commodity teamsheadquartered in Melbourne, London, Salt Lake City, Perth, Brisbane and Beijing;supported by a team of technical and commodity professionals. This structureprovides a global reach with a local presence that allows for effective communityengagement and development of the Group’s social licence to operate.
SafetyAt the end of 2014 the Exploration group’s all injury frequency rate was 0.47, afurther improvement on the 0.49 rate at the end of 2013. A multi-year changeprogramme rolled out across the Exploration group has helped to sustain thesignificant safety improvement gained in 2013 and as a result Rio TintoExploration was awarded the “2014 Chief Executive Safety Award – mostimproved”. This programme also contributed to measureable improvements inoperational performance across all regions.
PerformanceDuring 2014, commercial activities provided access to quality projects andsupported the progression of projects through the Exploration project pipeline.Exploration joint ventures were established in Canada, the US, Chile, Mexico
and Australia. In addition, Exploration divested part of its interest in theTamarack project in Minnesota, US thereby securing funding to increase thepace of the multi-year drilling programme required to continue testing forextensions to the nickel-copper-precious metal resource.
Resource knowledge of the Roughrider uranium project in Saskatchewan hasincreased, with further drilling and resource modelling. In 2015 the Explorationgroup will focus on identifying potential for additional resources in the orbitsurrounding the project. In addition, Rio Tinto’s Saskatchewan regional tenurehas been prioritised and rationalised following further drilling. At the Sanxaibauxite project in Laos, ongoing exploration provided greater certainty aroundresource size whilst infrastructure studies targeting a range of options havebeen progressing. The Amargosa bauxite project in Brazil has progressed, withdrilling and mapping advancing a number of brownfield areas in the Amargosaorbit as well as adding new prospects in the region.
Brownfield projects generated good drilling results at iron ore projects inthe Pilbara, coking coal projects in the Bowen Basin, and in the Weipa orbitin Australia. In the Bingham orbit, drilling continued to extend themineralisation envelope.
Exploration activities are underpinned by data and information management.The focus on data accuracy and availability has continued to driveefficiency improvements.
Research and development projects have progressed, with new analyticaltechniques for mineral geochemistry supporting exploration targeting. Progresscontinued on the development of the VK1 airborne gravity gradiometer, with asignificant improvement in detection levels achieved in 2014.
In addition to Exploration’s projects, the Group’s major evaluation projects in2014 were:
Project Commodity Country
La Granja Copper PeruResolution Copper USPilbara Iron ore AustraliaBowen Basin Coking coal AustraliaHunter Valley Thermal coal AustraliaZulti South Mineral sands South AfricaSimandou Iron ore GuineaWeipa Bauxite Australia
In 2014, the Group reduced its exploration and evaluation expenditure toUS$747 million(a). This represented a 21 per cent decrease compared with2013 expenditure of US$948 million. Of the 2014 spend, US$209 millionrelates to centrally-controlled exploration and evaluation activity. In total,Rio Tinto’s exploration and evaluation activity covered ten commodities in2014, across a range of greenfield and brownfield environments.
OutlookIn 2015 the Exploration group will continue to work on a prioritised portfolio ofgreenfield and brownfield projects. The downturn in commodity prices isexpected to produce further cost-effective commercial opportunities, byproviding access to high quality projects. However, challenges aroundtimeframes to access ground, the need to increasingly explore for orebodiesbeneath cover rocks, and the decreasing grade and quality of potentialorebodies are expected to continue. The Exploration group will focus on projectgeneration in a number of key geographies, as well as testing of targets withinthe portfolio. For 2015, exploration projects at a more advanced stage include:
Project Commodity Country Type Stage
Tamarack Nickel US Greenfield Project of MeritRoughrider Uranium Canada Greenfield Order of MagnitudeSanxai Bauxite Laos Greenfield Project of MeritAmargosa orbit Bauxite Brazil Greenfield Order of MagnitudeBowen Basin Coking coal Australia Brownfield Project of MeritPilbara Iron ore Australia Brownfield Project of Merit
(a) An additional US$18m loss on an undeveloped evaluation project was recordedseparately in Loss relating to interests in undeveloped projects.
38 riotinto.com
For
per
sona
l use
onl
y

Technology & Innovation
Rio Tinto’s Technology & Innovation group (T&I) partners with the productgroups to achieve operating excellence. T&I has a recognised track record ofvalue creation and protection, while embedding fundamental changes that willkeep Rio Tinto competitive for the long term. Gross costs in 2014 wereUS$340 million, compared with US$370 million in 2013 and US$415 million in2012. The total number of employees in T&I increased from 730 at year-end2013 to 919 at year-end 2014, primarily attributed to the transfer of Iron Oreproject teams into T&I.
StrategyT&I delivers value through three levers:
– Project shaping and delivery: ensuring the Group “does the right projects”and “does the projects right”.
– Productivity: focusing on asset performance, technology deployment andglobal processes to sustainably improve operations, maximise margins andcapture value.
– Innovation: creating step-change improvements to address the significantchallenges facing the mining industry.
SafetyT&I is committed to the safe operation of its managed facilities and the safedeployment of its personnel. The all injury frequency rate for T&I in 2014 was0.57 compared with 0.63 in 2013. The improvement resulted from severalchanges, including improved supervision and leadership in the field, improvedHSE resourcing of construction projects, focus on specific construction injuryrisks and work planning, and attention to critical controls in the workplace. In2014, the Cornerstone project at Rio Tinto Kennecott, US under the leadershipof Rio Tinto Projects, won the Chief Executive Safety Award for the bestproject. This annual award recognises the project that has achievedoutstanding safety performance and embodies a strong safety culture.
PerformanceProject shaping and deliveryThe Strategic Planning team works with product groups to identify valuabledevelopment options. In 2014, the team developed and successfully piloted aproject shaping process. This considers the full spectrum of options andstakeholder interests early in the capital project life cycle, so that attractiveprojects get the best start and non-economic ones are culled early. Theprocess will continue to be rolled out across the Group in 2015.
Rio Tinto Projects was established in 2014 by combining the T&I and Iron Oreproject teams. Rio Tinto now has a single projects organisation, responsible forexecuting capital development projects and using a consistent accountabilitymodel. In 2014, Rio Tinto Projects worked on delivering the following:
– Pilbara 360 project, Australia – continuing in 2015
– Concentrate expansion project at the Iron Ore Company of Canada
– Exploration decline at Energy Resources of Australia
– Modernisation of the ISAL aluminium smelter, Iceland
– AP60 project at the Arvida aluminium smelter, Canada
– Modified direct dissolving of kernite project at Boron Operations, US
– Cornerstone project – continuing in 2015
– Kitimat modernisation project, Canada – continuing in 2015
Rio Tinto Projects also contributed to studies for the South of Embley bauxiteproject, Mount Pleasant coal project, Hail Creek mine expansion, Zulti Southmine expansion, Simandou iron ore project and Oyu Tolgoi copper expansionproject phase 2.
The Technical Assurance team provides independent assessments to theRio Tinto Investment Committee and board to ensure investment decisions arethoroughly reviewed and technically sound. Technical Assurance hasdeveloped and applied more rigorous project review, due diligence, and post-investment review processes to Rio Tinto’s governance. This has beeneffective in helping prioritise 2014’s reduced capital spend and will continue tosupport future capital allocation.
ProductivityT&I’s Productivity team continues to help operations attain the best operatingperformance from an asset. Key initiatives in 2014 included:
– Productivity programmes to improve the performance of mines andprocessing plants: For example, improving throughput in a number ofoperations, improving haul truck payloads and reducing train loadingtimes in the Pilbara, increasing concentrator throughput at Oyu Tolgoi,improving recoveries at Escondida through process modelling and de-bottlenecking the beneficiation plant at Weipa. T&I’s Integrated ValueChain Engagement (IVCE) programme undertaken by the Brockman ironore mine since 2012 has delivered seven million tonnes of additionalsaleable ore and an additional 45 million tonnes of material movementwithout introducing new assets. Many other operations have benefitedfrom the IVCE programme.
– Asset management: Including maintenance tactics, shutdown strategiesand defect elimination protocols – to enhance the reliability, utilisation andlife of operating assets.
– Process development: Using sophisticated laboratory and pilot plantfacilities, and world-class modelling capabilities, to provide support tooperations and projects. Examples include a step-change in leachextraction from copper sulphides and low-cost tailings de-watering.
– Technical risk mitigation: Supporting projects like Pilbara 360, theKennecott landslide recovery, and tailings dam design and operations.
InnovationAutomation programmes continued to progress under the Mine of theFuture™ programme with 57 autonomous trucks in operation in the Pilbara atyear end and the world’s first autonomous heavy-haul railway (Autohaul®)under construction. In 2014, T&I deployed three new technologies under theMine of the Future™ programme:
– Processing Excellence Centre (PEC): Following successful trials thatdelivered significant value at Rio Tinto copper process plants, the PEC wasofficially opened in March. This state-of-the-art facility provides advancedremote technical support to operations. The excellence centre platformwill be further developed across the Group.
– RTVis™: This visualisation software allows novel analysis of in-ground data,improving understanding of the orebody at an operation. Application ofRTVis™ at the Yandicoogina mine has seen a reclassification of more thanone million tonnes of material to a high silica ore product for blending. AtWest Angelas, the high-grade recovery programme enabled by RTVis™
created a two per cent increase in high-grade ore recovery.
– Autonomous drilling system (ADS): West Angelas is now the world’s firstfull-time autonomous drill mine, with six rigs in operation. Functionality ofthe system is being extended to allow use by Rio Tinto Energy. ADS hasdemonstrated a ten per cent increase in use of equipment availability andsignificant improvement in labour productivity at West Angelas.
In addition, the Rio Tinto Chinalco Innovation Joint Venture (RTCI) wasestablished in November. Combining Rio Tinto’s global leadership in mininginnovation with the resources and expertise of Chinalco’s world-class researchand development and engineering teams will provide a solid basis to developand/or commercialise next-generation technologies.
OutlookIn 2015, T&I will continue to build on its 2014 successes by:
– implementing the project shaping process and improving capitalproject performance;
– ramping up the delivery of industry-leading productivity improvements;
– moving to the next phase of Mine of the Future™ by harnessing “big data”and predictive analytics, further equipment automation, furtherimplementation of operation centres, excellence centres andimplementation of other step-change innovations.
riotinto.com 39
ST
RA
TE
GIC
RE
PO
RT
DIRECTO
RS’R
EPORT
FINANCIA
LSTA
TEMEN
TSPR
ODUCTIO
N,R
ESERVES
ANDOPER
ATIO
NS
ADDITIO
NALINFO
RMATIO
N
For
per
sona
l use
onl
y

Financial overview
The key metrics for Group financial management and planning aresummarised below.
2014US$ million
2013US$ million
2012US$ million
Underlying earnings (a) 9,305 10,217 9,269
Net earnings/(loss) (a) 6,527 3,665 (3,028)
Net cash generated fromoperating activities 14,286 15,078 9,430
Net debt 12,495 18,055 19,192Total capital (b) 67,089 71,557 76,932
(a) Underlying earnings is the key financial performance indicator which managementuses internally to assess performance. It is presented here as a measure of earningsto provide greater understanding of the underlying business performance of theGroup. Items excluded from net earnings to arrive at underlying earnings areexplained in note 2 to the financial statements. Both net earnings and underlyingearnings deal with amounts attributable to the owners of Rio Tinto. However, IFRSrequires that the profit for the year reported in the income statement should alsoinclude earnings attributable to non-controlling interests in subsidiaries.
(b) Total capital is defined as equity attributable to owners of Rio Tinto plus equityattributable to non-controlling interests plus net debt.
Decreased underlying earnings reflect the unfavourable impact of lower pricesin the Group’s main commodities, other than aluminium and diamonds. Thiswas offset by the favourable impact of improved sales volumes, operating cashcost improvements and continued overall strengthening of the US dollaragainst local currencies.
Net earnings of US$6.5 billion reflect non-cash exchange losses ofUS$1.9 billion; impairment reversals of US$1.0 billion offset by impairmentcharges of US$1.1 billion; a US$0.4 billion write-off of deferred tax assetsfollowing the repeal of the Mineral Resources Rent Tax by the Australiansenate; and losses on disposal of businesses during the period of US$0.3billion.
Net cash generated from operating activities, which include dividends fromequity accounted units, reflect the negative impact of lower commodity pricespartially offset by the favourable impact from higher volumes and costreduction initiatives and a reduction in net interest paid as a result of lowernet debt.
Net debt decreased from US$18.1 billion at 31 December 2013 toUS$12.5 billion at 31 December 2014 as operating cash inflows, divestmentproceeds and proceeds from the disposal of the Group’s St James’s Squareproperties more than offset the outflows relating to capital expenditure andthe increased dividend payment. Gearing ratio decreased from 25.2 per cent at31 December 2013 to 18.6 per cent at 31 December 2014. Interest coverremained unchanged from the prior year at 13 times. The board’s objectivewhen managing capital is to safeguard the business as a going concern whilstmaximising returns for the Group’s shareholders. In practice, this involvesregular reviews by the board and senior management. These reviews take intoaccount the Group’s strategic priorities, economic and business conditions, andopportunities that are identified to invest across all points of the commoditiescycle. The resulting capital structure provides the Group with a high degree offinancial flexibility at a low cost of capital.
In addition to the information provided on the product groups on pages 28 to37, further information on their financial performance can be found in notes 2and 3 to the financial statements on pages 123 to 126 and the financialinformation by business unit on pages 178 to 182.
40 riotinto.com
For
per
sona
l use
onl
y

Five year review
Selected financial dataThe selected consolidated financial information below has been derived from the historical audited consolidated financial statements of the Rio Tinto Group. Theselected consolidated financial data should be read in conjunction with, and qualified in their entirety by reference to, the 2014 financial statements and notesthereto. The financial statements as included on pages 103 to 194 have been prepared in accordance with IFRS as defined in note 1.
Rio Tinto GroupIncome statement data
For the years ending 31 DecemberAmounts in accordance with IFRS
2014US$m
2013US$m
2012US$m
2011US$m
2010US$m
Consolidated sales revenue 47,664 51,171 50,942 60,529 55,171
Group operating (loss)/profit (a) 11,346 7,430 (1,925) 14,037 19,608
Profit/(loss) for the year from continuing operations 6,499 1,079 (3,020) 6,800 15,195
Loss after tax from discontinued operations – – (7) (10) (97)
Profit/(loss) for the year 6,499 1,079 (3,027) 6,790 15,098
Basic earnings/(losses) per share (b)
Profit/(loss) from continuing operations (US cents) 353.1 198.4 (163.4) 303.9 731.0
Loss after tax from discontinued operations (US cents) – – (0.4) (0.5) (4.9)
Profit/(loss) for the year per share (US cents) 353.1 198.4 (163.8) 303.4 726.1
Diluted earnings/(losses) per share (b)
Profit/(loss) from continuing operations (US cents) 351.2 197.3 (163.4) 302.0 726.7
Loss after tax from discontinued operations (US cents) – – (0.4) (0.5) (4.9)
Profit/(loss) for the year per share (US cents) 351.2 197.3 (163.8) 301.5 721.8
Dividends per share 2014 2013 2012 2012 2010
Dividends declared during the year
US cents
– interim 96.0 83.5 72.5 54.0 45.0
– final 119.0 108.5 94.5 91.0 63.0
UK pence
– interim 56.9 54.3 46.4 33.1 28.2
– final 78.0 65.8 60.3 57.3 39.1
Australian cents
– interim 103.1 93.0 68.5 49.8 49.3
– final 153.0 120.14 91.7 84.2 61.9
Dividends paid during the year (US cents)
– ordinary 204.5 178.0 163.5 117.0 90.0
Weighted average number of shares – basic (millions) 1,848.4 1,847.3 1,849.1 1,923.1 1,961.0
Weighted average number of shares – diluted (millions) (b) 1,858.7 1,857.7 1,849.1 1,935.5 1,972.6
Balance sheet data
at 31 DecemberAmounts in accordance with IFRS 2014 US$m
2013US$m
2012US$m
2011US$m
2010US$m
Total assets 107,827 111,025 118,437 120,152 112,773
Share capital/premium 9,053 9,410 10,189 10,024 10,105
Total equity/Net assets 54,594 53,502 57,740 58,884 64,512Equity attributable to owners of Rio Tinto 46,285 45,886 46,553 52,199 58,247
(a) Group operating profit or loss includes the effects of charges and reversals resulting from impairments (other than impairments of equity accounted units) and profit and loss ondisposals of interests in businesses. Group operating loss or profit amounts shown above exclude equity accounted operations, finance items, tax and discontinued operations.
(b) The effects of anti-dilutive potential have not been included when calculating diluted loss per share for the year ended 31 December 2012.
riotinto.com 41
ST
RA
TE
GIC
RE
PO
RT
DIRECTO
RS’R
EPORT
FINANCIA
LSTA
TEMEN
TSPR
ODUCTIO
N,R
ESERVES
ANDOPER
ATIO
NS
ADDITIO
NALINFO
RMATIO
N
For
per
sona
l use
onl
y

Directors’ approval statementThis Strategic report is delivered in accordance with a resolution of the board, and has been signed on behalf of the board by:
Jan du PlessisChairman
4 March 2015
42 riotinto.com
For
per
sona
l use
onl
y
Contents
Directors’ report
Dual listed structure and constitutional documents 44
Operating and financial review 44
Risk identification, assessment and management 45
Share capital 45
Purchases 46
Substantial shareholders 46
Dividends 46
Secretaries 46
Corporate governance 46
Indemnities and insurance 47
Employment policies and communication 47
Political donations 47
Government regulations 47
Environmental regulations 47
Greenhouse gas emissions 48
Exploration, research and development 48
Auditors 48
Fees for audit and non-audit services 48
Financial instruments 48
Board of directors 49
Executive Committee 52
Corporate governance 53
Remuneration Report 64
riotinto.com 43
STRATEG
ICREPO
RT
DIR
EC
TO
RS
’R
EP
OR
TFIN
ANCIA
LSTA
TEMEN
TSPR
ODUCTIO
N,R
ESERVES
ANDOPER
ATIO
NS
ADDITIO
NALINFO
RMATIO
N
For
per
sona
l use
onl
y

Directors’ report
The directors present their report and audited consolidated financialstatements for the year ended 31 December 2014.
Dual listed structure and constitutional documentsAn explanation of the dual listed companies structure (DLC) of Rio Tinto plcand Rio Tinto Limited, and of the Companies’ constitutional documents can befound on pages 220 to 222. This section also provides a description of votingrights under the DLC arrangements, including restrictions which may apply inrespect of the shares of either Company under specified circumstances.
Operating and financial reviewThe Strategic report set out on pages 1 to 42 provides a comprehensive reviewof Rio Tinto’s operations, its financial position and its business strategies andprospects, and is incorporated by reference into, and forms part of, thisdirectors’ report.
Rio Tinto’s principal activities during 2014 were minerals and metalsexploration, development, production and processing.
Pages 1 to 39 of the Strategic report provides a comprehensive review of thedevelopment and performance of Rio Tinto’s operations for the year ended31 December 2014 and the potential future developments and expectedresults of those operations.
The subsidiary and associated undertakings principally affecting the profitsor net assets of the Group in the year are listed in notes 33 to 36 to thefinancial statements.
Significant changes and events affecting the Group during 2014 and until thedate of this report have been:
– On 13 January 2014, Rio Tinto acquired 510,983,220 common shares ofTurquoise Hill under Turquoise Hill’s rights offering at a total cost ofC$1,292,787,546.60 or C$2.53 per share, together with additionalanti-dilution share warrants. The purchase represented approximately50.8 per cent of the common shares offered under the rights offering andenabled Rio Tinto to maintain its existing percentage shareholding inTurquoise Hill. The rights offering was fully subscribed. Turquoise Hill useda portion of the funds it received under the rights offering to repay allamounts outstanding under the US$1.8 billion interim funding facility andthe US$600 million secured bridge funding facility each provided toTurquoise Hill by Rio Tinto.
– On 28 January 2014, Rio Tinto Mining and Exploration Limited (RTMEL)received 44,126,780 common shares of Minera IRL Limited (IRL),representing approximately 19.44 per cent of the issued and outstandingcommon shares of IRL. The shares formed part of the consideration agreedto in the 2006 option agreement on the Ollachea Gold Project betweenRTMEL and IRL. The consideration for each share was C$0.1790. Theshares were issued from IRL’s treasury and were not purchased by RTMELvia a market transaction. Should RTMEL not sell any of the shares for aperiod of one year, RTMEL shall be entitled to a cash incentive payment.
– On 12 February 2014, Rio Tinto entered into an option agreement withLNG Canada, a joint venture comprising Shell Canada Energy, PhoenixEnergy Holdings Limited (an affiliate of Petro-China Investment (HongKong) Limited), Kogas Canada LNG Ltd. (an affiliate of Korea GasCorporation) and Diamond LNG Canada Ltd. (an affiliate of MitsubishiCorporation) to acquire or lease a wharf and associated land at its portfacility at Kitimat, British Columbia, Canada. LNG Canada is proposing toconstruct and operate a natural gas liquefaction plant and marine terminalexport facility at Kitimat.
– On 7 April 2014, Rio Tinto announced its intention to gift its 19.1 per centshareholding in Northern Dynasty Minerals Ltd (Northern Dynasty), ownerof the Pebble Project, to two local Alaskan charitable foundations. Thedecision followed the strategic review announced in 2013 of Rio Tinto’sinterest in Northern Dynasty, which concluded the Pebble Project did notfit with Rio Tinto’s strategy. The shares in Northern Dynasty were dividedequally between the Alaska Community Foundation to fund educationaland vocational training and the Bristol Bay Native Corporation EducationFoundation, which supports educational and cultural programmes inthe region.
– On 30 April 2014, Rio Tinto filed a complaint in the United States DistrictCourt for the Southern District of New York against: Vale, S.A., BenySteinmetz, BSG Resources Limited, BSG Resources (Guinea) Ltd. aka BSGResources Guinée Ltd, BSGR Guinea Ltd. BVI, BSG Resources Guinée SARLaka BSG Resources (Guinea) SARL aka VBG-Vale BSGR Guinea, FredericCilins, Michael Noy, Avraham Lev Ran, Mamadie Touré, and MahmoudThiam. The Complaint relates to the loss of half of Rio Tinto’s miningconcession in the Simandou region of south-east Guinea in 2008. Rio Tintoasked the Court to award compensatory, consequential, exemplary andpunitive damages to Rio Tinto in an amount to be determined at trial.
– On 13 May 2014, Rio Tinto announced that its Pilbara iron ore system ofmines, rail and ports had reached a run rate of 290 million tonnes a year,two months ahead of schedule.
– On 26 May 2014, the Government of Guinea and its partners, Rio Tinto,Chinalco and the IFC, signed the Investment Framework for blocks 3 and 4of Simandou. The signing provided the continued legal and commercialfoundation for the project.
– On 27 May 2014, the Group announced that it had appointed AlfredoBarrios as chief executive of its Aluminium business, to succeed JacyntheCôté with effect from 1 June 2014.
– On 2 June 2014, Rio Tinto completed the sale of its 50.1 per cent interestin the Clermont Joint Venture to GS Coal Pty Ltd, a company jointly ownedby Glencore and Sumitomo Corporation, for US$1,015 million. Under theterms of the sale, Glencore took over management of Clermont mine,which produces thermal coal in central Queensland.
– On 30 July 2014, Rio Tinto announced that it had reached an agreement tosell Rio Tinto Coal Mozambique, which comprises the Benga coal mine andother projects in the Tete province of Mozambique, to International CoalVentures Private Limited for US$50 million (before net debt and workingcapital adjustments). On 8 October 2014, Rio Tinto announced that it hadcompleted the sale.
– On 18 August 2014, the Group announced that following recentdevelopments in Papua New Guinea, including the new mining legislationpassed by the Autonomous Bougainville Government, it had decided toreview all options for its 53.83 per cent stake in Bougainville CopperLimited.
– On 2 September 2014, Talon Metals Corp., a company listed on theToronto Stock Exchange, announced an independent mineral resourceestimate prepared in accordance with Canadian National Instrument43-101 (NI 43-101) on the Tamarack Nickel-Copper-Platinum Project(Tamarack Project) located in Minnesota, US. Talon has the right to acquirean initial 30 per cent stake in the Tamarack Project from KennecottExploration Company, a subsidiary of the Group.
44 riotinto.com
For
per
sona
l use
onl
y

– On 7 October 2014, the Group announced that in July 2014, Glencore hadcontacted it regarding a potential merger of Rio Tinto and Glencore andthat the Rio Tinto board, after consultation with its financial and legaladvisers, had concluded unanimously that a combination was not in thebest interests of Rio Tinto’s shareholders, and that the board’s rejectionwas communicated to Glencore in early August.
– 17 November 2014, Rio Tinto announced that it had signed a Heads ofAgreement with Sinosteel Corporation (SC) and it intended to advancediscussions with SC for a second extension to the Channar Mining iron orejoint venture in Western Australia’s Pilbara region.
– On 27 November 2014, Rio Tinto announced that it had formally approvedthe development of a fourth pipe, known as A21, at the Diavik DiamondMine.
– On 28 November 2014, Rio Tinto Coal Australia declared a significantincrease of its managed thermal coal reserves in the Hunter Valley of NewSouth Wales, Australia, compared with the previous estimates reported inRio Tinto’s 2013 Annual Report.
– On 12 February 2015, the Group announced a capital return ofUS$2.0 billion which comprises a targeted A$500 million (c. US$0.4 billion)off-market share buy-back tender of Rio Tinto Limited shares and thebalance of approximately US$1.6 billion for an on-market buy-back ofRio Tinto plc shares.
– On 27 February 2015, the Group announced that it would be streamliningits product groups and corporate functions as part of the continued focuson efficiency and costs, with immediate effect. Under the newarrangements, Rio Tinto’s world-class portfolio of assets have beencondensed into four product groups: Aluminium, Copper & Coal, Diamonds& Minerals and Iron Ore.
Details of events after the balance sheet date are further described in note 43to the financial statements.
Risk identification, assessment andmanagementThe Group’s principal risks and uncertainties are set out on pages 14 to 17.The Group’s approach to risk management is discussed on page 62.
Share capitalDetails of the Group’s share capital as at 31 December 2014 can be foundat notes 27 and 28 to the financial statements. Details of the rights andobligations attached to each class of shares can be found on pages 220and 221 under the heading “Voting rights”.
Where under an employee share plan operated by the Company, participantsare the beneficial owners of the shares, but not the registered owners, thevoting rights are normally exercised by the registered owner at the directionof the participant.
Details of certain consequences triggered on a change of control can be foundon page 220 under the heading “Dual listed companies structure”.
Details of certain restrictions on holding shares in Rio Tinto are described onpage 221 under the heading “Limitations on ownership of shares”. There areno other restrictions on the transfer of ordinary Rio Tinto shares save for:
– restrictions that may from time-to-time be imposed by laws, regulationsor Rio Tinto policy (for example, those relating to market abuse or insiderdealing or share trading and, in Australia, including those relating toforeign investment);
– restrictions on the transfer of shares that may be imposed following afailure to supply information required to be disclosed, or in relation tounmarketable parcels of shares;
– restrictions on the transfer of shares held under certain employee shareplans while they remain subject to the plan.
At the annual general meetings held in 2014, shareholders authorised:
– the purchase by Rio Tinto Limited and its subsidiaries, and the on-marketrepurchase by Rio Tinto plc, of up to 141,340,869 Rio Tinto plc shares(representing approximately ten per cent of Rio Tinto plc’s issued sharecapital at that time);
– the off-market purchase by Rio Tinto plc of up to 141,340,869 Rio Tinto plcshares acquired by Rio Tinto Limited or its subsidiaries under the aboveauthority; and
– the off-market or on-market buy-back by Rio Tinto Limited of up to43.5 million Rio Tinto Limited shares (representing approximately tenper cent of Rio Tinto Limited’s issued share capital at the time).
riotinto.com 45
STRATEG
ICREPO
RT
DIR
EC
TO
RS
’R
EP
OR
T:
DIRECTORS’R
EPORT
FINANCIA
LSTA
TEMEN
TSPR
ODUCTIO
N,R
ESERVES
ANDOPER
ATIO
NS
ADDITIO
NALINFO
RMATIO
N
For
per
sona
l use
onl
y

Directors’ report continued
PurchasesRio Tinto plc Rio Tinto Limited
Total number (a)
of sharespurchased
Average price (b)
paid pershare US$
Total number (c)
of sharespurchased as
part ofpublicly
announcedplans or
programmes
Total number (a)
of sharespurchased
Average price (b)
paid per shareUS$
Total number (c)
of sharespurchased as
part ofpublicly
announcedplans or
programmes
Rio Tinto GroupApproximate dollarvalue of shares that
may yet be purchasedunder the plans or
programmesUS$ (e)
2014
1 Jan to 31 Jan – – – 10,436 60.62 – –
1 Feb to 28 Feb – – – 579,000 62.46 – –
1 Mar to 31 Mar – – – – – – –
1 Apr to 30 Apr 667,292 56.57 – 1,099,277 61.02 – –
1 May to 31 May – – – – – – –
1 Jun to 30 Jun 12,751 53.44 – – – – –
1 Jul to 31 Jul – – – – – – –
1 Aug to 31 Aug 58,003 55.58 – 53,827 60.68 – –
1 Sep to 30 Sep 777,165 52.29 – 933,259 56.01 – –
1 Oct to 31 Oct 649,261 48.45 – 1,726,644 51.39 – –
1 Nov to 30 Nov 198,482 51.69 – – – – –
1 Dec to 31 Dec – – – – – – –
Total 2,362,954 (d) 52.48 – 4,402,443 56.36 – –
2015 – – – – – – –
1 Jan to 31 Jan – – – – – – –1 Feb to 16 Feb – – – – – – –
Notes
(a) Rio Tinto plc ordinary shares of 10p each; Rio Tinto plc ADRs; Rio Tinto Limited shares.
(b) The average prices paid have been translated into US dollars at the exchange rate on the day of settlement.
(c) Shares purchased by the Companies’ registrars in connection with the dividend reinvestment plans and employee share plans are not deemed to form part of any publiclyannounced plan or programme.
(d) This figure represents 1.66 per cent of Rio Tinto plc issued share capital at 31 December 2014.
(e) Rio Tinto announced a US$2.0 billion buy-back programme on 12 February 2015. At 16 February 2015, no Rio Tinto plc or Rio Tinto Limited shares had been purchasedunder this programme.
During 2014, in order to satisfy obligations under employee share plans,Rio Tinto plc issued 1,450,659 shares from treasury and allotted 971 newlyissued shares. The trustees of Rio Tinto plc’s employee share trusts purchasedon-market 961,451shares and 27,493 ADRs. The trustee of Rio Tinto Limited’semployee share trusts purchased 2,483,214 shares on-market. In total,2,298,707 Rio Tinto plc shares, 5,504 ADRs, and 1,229,122 Rio Tinto Limitedshares were delivered to plan participants.
Also during the year, the Companies’ registrars purchased 1,374,010 Rio Tintoplc shares and 1,919,229 Rio Tinto Limited shares on-market to satisfyobligations to shareholders under the dividend reinvestment plans.
For the period 1 January 2015 to 16 February 2015, Rio Tinto plc issued316,583 shares from treasury in connection with employee share plans andallotted 253 newly issued shares. During this period, 791,957 Rio Tinto plcshares, 350 ADRs, and 581,972 Rio Tinto Limited shares were delivered toplan participants.
Awards over 1,919,507 Rio Tinto plc shares and 1,515,972 Rio Tinto Limitedshares were granted under employee share plans during 2014. As at16 February 2015, awards were outstanding over 6,434,325 Rio Tinto plcshares, 124,530 ADRs and 5,074,494 Rio Tinto Limited shares. Upon vesting,awards may be satisfied by the issue of new shares, the purchase of shareson-market, or, in the case of Rio Tinto plc, by issuing treasury shares.
On 12 February 2015, Rio Tinto announced a US$2.0 billion buy-backprogramme comprising a targeted A$500 million (c. US$0.4 billion) off-marketshare buy-back tender of Rio Tinto Limited shares and the balance ofapproximately US$1.6 billion for an on-market buy-back of Rio Tinto plc shares.
Substantial shareholdersDetails of substantial shareholders can be found on page 222.
DividendsDetails of dividends paid and the progressive dividend policy can be found onpage 224.
DirectorsThe names of the directors who served during the year, together with theirbiographical details and other information, are shown on pages 49 to 51.
All directors will stand for election or re-election at the 2015 annual generalmeetings with the exception of Lord Kerr and Michael Fitzpatrick who willretire at the conclusion of the Rio Tinto Limited annual general meeting to beheld on 7 May 2015.
A table of directors’ attendance at board and committee meetings during 2014is on page 55.
SecretariesDetails of the company secretary of Rio Tinto plc and the joint companysecretaries of Rio Tinto Limited together with their qualifications andexperience are set out on page 51.
Corporate governanceA full report on corporate governance can be found on pages 53 to 63 andforms part of this Directors’ report.
46 riotinto.com
For
per
sona
l use
onl
y

Indemnities and insuranceThe Articles of Association and Constitution of the Companies provide forthem to indemnify, to the extent permitted by law, officers of the Companies,including officers of wholly owned subsidiaries, against liabilities arising fromthe conduct of the Group’s business. The directors of the Companies, thecompany secretary of Rio Tinto plc and the joint company secretaries ofRio Tinto Limited, and certain employees serving as directors of subsidiariesat the Group’s request have been indemnified in accordance with theseprovisions. No amount has been paid under any of these indemnities duringthe year. The Group has purchased directors’ and officers’ insurance duringthe year. In broad terms, the insurance cover indemnifies individual directors’and officers’ personal legal liability and legal defence costs for claims arisingout of actions taken in connection with Group business. It is a condition of theinsurance policy that detailed terms and premiums paid cannot be disclosed.
Employment policies and communicationInformation about the Group’s employment policies and our employees isavailable on page 23.
Political donationsNo donations were made during 2014 for political purposes in the EU, Australiaor elsewhere, as defined by the UK Companies Act 2006.
Government regulationsOur operations in over 40 countries are subject to extensive regulationsimposed by local, state, provincial and federal governments. These regulationsgovern many aspects of our operations – how we explore, mine and processore, conditions of land tenure and use, health, safety and environmentalrequirements, how we operate as a company including laws regardingsecurities, taxation, intellectual property, competition and foreign investment,provisions to protect data privacy, conditions of trade and export andinfrastructure access. In addition to these laws, several operations are alsogoverned by the provisions of specific agreements which have been made withgovernments. Some of these agreements are enshrined in acts of parliament.
The geographic and product diversity of our operations reduces the likelihoodof any single government regulation having a material effect on the Group’sbusiness. Our many internal controls – codes of conduct, standards andprocedures coupled with our high standards of practice also mitigate againstthe impact of regulation.
In Australia and Namibia, Rio Tinto’s uranium operations are subject to specificregulations governing the mining and export of uranium.
In Canada, our hydroelectric power generation assets are regulated by theQuebec and British Columbia provincial agencies covering issues of waterrights, power sales and purchases.
In Mongolia, starting from 1 January 2015, we are potentially subject to legalrequirements under the so-called “Glass Account Law” on publicly disclosingcertain financial information related to the company’s procurement, tenderprocess and debts. The law applies to companies in which the governmentowns at least one-third of its common shares (the government owns34 per cent of Oyu Tolgoi LLC). The company already broadly discloses muchof the information covered in the new law, but the practical impact to thebusiness is still unclear as the government is yet to provide detailed guidanceon minimum compliance standards.
In South Africa, our operations are subject to and have complied with blackeconomic empowerment legislation which required companies to transfer (forfair value) 26 per cent of the Group’s South African mining assets to historicallydisadvantaged South Africans by 2014. Rio Tinto also complies with the mininglegislation’s transformation imperatives which includes empowerment of SouthAfrica’s Historically Disadvantaged Employees and Communities.
Environmental regulationsRio Tinto is subject to various environmental regulations includingregulations that cover air, land, water, ecology and noise in the countrieswhere it has operations. Rio Tinto measures its performance againstenvironmental regulation to which its operations are subject by tracking andrating incidents according to their environmental impact. Issues of Group-levelimportance are reported to the Executive Committee and the SustainabilityCommittee. Prosecutions and other breaches are also used to gaugeRio Tinto’s performance.
In 2014, there were 12 one-off or repeated environmental incidents reportedto the Executive Committee with impact to the environment or of concern tolocal communities. Five resulted from air discharges, four from waterdischarges, one from spillage into a water body, one related to soil runoff andone related to injury to fauna.
They were:
– Several releases of coal dust and sulphur dioxide beyond specified limitsfrom a plant in the Netherlands.
– Elevated potroom particulate emission at an aluminium smelter in Canada.
– Complaints of blast dust cloud drifting over private land adjacent to a coalmine in Australia.
– Multiple releases of fluorine gas from scrubber and exhaust fanmalfunctions at an aluminium smelter in Canada.
– Several releases of dust emissions beyond specified limits from a plantin France.
– Release of caustic, spent liquor and other substances due to waterdischarge overflow at an alumina refinery in Australia.
– Exceedances of total suspended solids and pH requirements during heavyrain at a refinery in Australia.
– Release of effluent from a settling tank into surface water from a plant inthe Netherlands.
– Release of oil into a river outlet at an aluminium smelter in Canada.
– A diesel spill into a river as a result of a train derailment in Canada.
– Presence of adult salmon in an industrial lagoon in violation of wildliferegulations at a smelter in Canada.
– Soil runoff into a rice field following insufficient rehabilitation of anexhausted exploration borrow pit in Guinea.
During 2014, six operations incurred fines amounting to US$319,513(2013: US$190,279).
Australian corporations that exceed specific greenhouse gas emissions orenergy use thresholds have obligations under the Australian NationalGreenhouse and Energy Reporting Act 2007 (NGER). All Rio Tinto entitiescovered under this Act met their annual NGER reporting obligations by therequired 31 October 2014 deadline.
A number of Australian Rio Tinto entities were also subject to the CleanEnergy Act 2011 and the Energy Efficiency Opportunities Act 2006 for the firsthalf of 2014 and both these Acts were repealed retrospectively, with effectfrom 1 July 2014. All compliance requirements under these Acts were satisfiedwithin the stipulated timeframes.
Further information on the Group’s environmental performance is included inthe sustainable development section of this Annual report, on pages 20 to 26,and on the website.
riotinto.com 47
STRATEG
ICREPO
RT
DIR
EC
TO
RS
’R
EP
OR
T:
DIRECTORS’R
EPORT
FINANCIA
LSTA
TEMEN
TSPR
ODUCTIO
N,R
ESERVES
ANDOPER
ATIO
NS
ADDITIO
NALINFO
RMATIO
N
For
per
sona
l use
onl
y

Directors’ report continued
Greenhouse gas emissionsGreenhouse gas emissions (in million tCO2 -e) (a)(b)
2014 2013
Scope 1 (c) 21.9 23.6 (g)
Scope 2 (d) 12.5 14.4
Total emissions (e) 33.9 37.4 (g)
Ratios
GH intensity index (f) 82.0 83.2 (g)
GH intensity (tCO2 -e/t of product) 0.082 0.095
(a) Rio Tinto’s greenhouse gas emissions for managed operations are reported inaccordance with requirements under Part 7 of The UK Companies Act 2006(Strategic Report and Directors’ Report) Regulations 2013. Our approach andmethodology used for the determination of these emissions are available at:http://www.riotinto.com/sd2014/pdfs/climate_change. pdf andhttp://www.riotinto.com/sd2014/pdfs/glossary.pdf
(b) Rio Tinto’s greenhouse gas emission inventory is based on definitions provided byThe World Resource Institute/World Business Council for Sustainable DevelopmentGreenhouse Gas Protocol: A Carbon Reporting and Accounting Standard,March 2004.
(c) Scope 1 emissions include “emissions from combustion of fuel and operation ofmanaged facilities”. It includes emissions from land management and livestockmanagement at those facilities.
(d) Scope 2 emissions include “emissions from the purchase of electricity, heat, steamor cooling”.
(e) Total emissions is the sum of scope 1 and scope 2 emissions minus emissions thatare associated with the generation of electricity, heat, steam or cooling supplied toothers. These emissions exclude indirect emissions associated with transportationand use of our products reported on page 24.
(f) Rio Tinto greenhouse gas intensity index is the weighted emissions intensity foreach of Rio Tinto’s main commodities relative to the commodity intensities in the2008 base year (set to 100). This index incorporates approximately 97 per cent ofRio Tinto’s emissions from managed operations.
(g) Number restated to ensure comparability over time. Amendment due to changes inmeasurement and calculation methodologies or immaterial updates to data.
Exploration, research and developmentThe Group carries out exploration as well as research and development insupport of its activities as described more fully under Exploration andTechnology & Innovation on pages 38 to 39. Amounts charged for the year,net of any gains on disposal, generated a net loss before tax for explorationand evaluation of US$783 million (2013: US$1,109 million). Research anddevelopment costs were US$112 million (2013: US$231 million).
AuditorsPricewaterhouseCoopers LLP and PricewaterhouseCoopers (together, PwC)are the auditors of Rio Tinto plc and Rio Tinto Limited respectively.PricewaterhouseCoopers LLP have indicated their willingness to continuein office as auditors of Rio Tinto plc and a resolution to reappoint them asauditors of Rio Tinto plc will be proposed at the 2015 annual general meetings.A separate resolution will seek authority for the Audit Committee to determinetheir remuneration. PricewaterhouseCoopers will continue in office as auditorsof Rio Tinto Limited.
A copy of the declaration given by PricewaterhouseCoopers as the Group’sexternal auditors to the directors in relation to the auditors’ compliance withthe independence requirements of the Australian Corporations Act 2001 andthe professional code of conduct for external auditors is set out on page 185 inthe financial statements.
No person who was an officer of Rio Tinto during 2014 was a director orpartner of the auditors at a time when they conducted an audit of the Group.
Each person who held the office of director at the date the board resolved toapprove this report makes the following statements:
– so far as the directors are aware, there is no relevant audit information ofwhich the auditors are unaware; and
– each director has taken all steps that he or she ought to have taken as adirector to make him or herself aware of any relevant audit information andto establish that the auditors are aware of that information.
Fees for audit and non-audit servicesThe amounts payable to the Group’s auditors, PwC, were:
2014US$m
2013US$m
Audit fees (a) 14.7 15.3
Assurance services (b) 2.1 4.2
Taxation services 0.9 0.9
All other fees (c) 0.4 1.3
18.1 21.7
(a) Audit fees relating to statutory audits.
(b) Assurance services in 2014 are mainly related to half year review procedures,sustainability assurance and limited assurance over the 2014 Taxes Paid Report.
(c) All other fees include services in connection with the divestment programme andother corporate projects.
Further information on auditor’s remuneration see note 39 to thefinancial statements.
During the year, the Audit Committee reviewed the effectiveness of PwC forGroup audit and local, statutory audit work. The evaluation took the form of asurvey comprising a range of questions covering objectivity, quality andefficiency and was completed by individual Rio Tinto business units. Theresults of this survey and review were presented to the Audit Committee whichconcluded that PwC continued to provide a high-quality audit and an effectiveand independent challenge to management. The Audit Committee wassatisfied with the external audit process and the independence of theexternal auditors.
PwC have been the external auditors since before the formation of the duallisted companies structure in 1995. For the reasons noted on page 58 the AuditCommittee does not consider it necessary at the present time to undertake atender process for the Group’s external audit. Since 2002, PwC have followedthe requirements of the Sarbanes-Oxley Act 2002 and APB Ethical Standardsand rotated both the lead UK and Australian audit partners at least every fiveyears. In the UK, the audit engagement partner was appointed in 2011, and inAustralia the audit engagement partner was appointed in 2012. They are due totransition after 2015 and 2016 respectively. This continued refreshing of theteam brings new perspectives to the audit and promotes healthy debatebetween auditors and management as well as the Committee.
Based on advice provided by the Audit Committee as set out in the report ofthe Audit Committee on pages 57 to 59, the directors are satisfied that theprovision of non-audit services by PwC is compatible with the general standardof independence for auditors and the standards imposed by Australian, UK andUS legislation.
Financial instrumentsDetails of the Group’s financial risk management objectives and policies andexposure to risk are described in note 30 to the 2014 financial statements.
48 riotinto.com
For
per
sona
l use
onl
y

Board of directors
Key for committee memberships:(A) Audit Committee
(R) Remuneration Committee
(N) Nominations Committee
(S) Sustainability Committee
(C) Chairman’s Committee
(I) Independent
Jan du Plessis (R, N and C)Chairman, BCom, LLB, CA(SA), age 61
Appointment: Director of Rio Tinto since 2008. Jan was appointed chairman in2009. He is the chairman of the Nominations Committee.
Skills and experience: Jan, a South African and British citizen, became groupfinance director of Compagnie Financière Richemont, the Swiss luxury goodsgroup, in 1988. In 2004, he was appointed chairman of British AmericanTobacco plc, a position which he held until 2009.
External appointments (current and recent): Non-executive director ofSABMiller plc since 2014 and chairman-elect, non-executive director andsenior independent non-executive director of Marks and Spencer Group plcsince 2008 and 2012 respectively. Jan stepped down from the board of Marksand Spencer Group plc in March 2015.
SamWalsh AO (C)Chief executive, BCom (Melbourne), age 65
Appointment: Director of Rio Tinto since 2009. He was appointed chiefexecutive in 2013.
Skills and experience: Sam, an Australian citizen, joined Rio Tinto in 1991,following 20 years in the automotive industry at General Motors and NissanAustralia. He has held a number of management positions during his career atRio Tinto including chief executive of the Aluminium group from 2001 to 2004,chief executive of the Iron Ore group from 2004 to 2009 and chief executive,Iron Ore and Australia from 2009 to 2013. Sam is a Fellow of the AustralianInstitute of Management, the Australasian Institute of Mining and Metallurgy,the Chartered Institute of Purchasing and Supply Management, the AustralianInstitute of Company Directors and the Australian Academy of TechnicalScience and Engineering. In 2010, he was appointed an Officer in the GeneralDivision of the Order of Australia.
External appointments (current and recent): Trustee of the Royal Opera HouseCovent Garden Foundation since 2014, Member of the Council of theInternational Council on Mining & Metals and a director of The InternationalCouncil on Mining and Metals (UK) Limited since 2013, non-executive directorof Seven West Media Limited from 2008 until 2013.
Chris Lynch (C)Chief financial officer, BCom, MBA, age 61
Appointment: Director of Rio Tinto since 2011 (non-executive) and chieffinancial officer since 2013.
Skills and experience: Chris, an Australian citizen, has nearly 30 years’experience in the mining and metals industry. He was chief executive officer ofthe Transurban Group, an international toll road developer and manager withinterests in Australia and North America, until 2012. His career has includedseven years at BHP Billiton, where he was chief financial officer and thenexecutive director and group president – Carbon Steel Materials. Prior to this,Chris spent 20 years with Alcoa Inc. where he was vice-president and chiefinformation officer based in Pittsburgh, and chief financial officer Alcoa Europein Switzerland. He was also managing director of KAAL Australia Limited, ajoint venture company formed by Alcoa and Kobe Steel.
External appointments (current and recent): Chief executive officer of theTransurban Group Limited from 2008 until 2012, commissioner of theAustralian Football League from 2008 until 2014.
Robert Brown (A, N and I)Non-executive director, BSc, age 70
Appointment: Director of Rio Tinto since 2010.
Skills and experience: Bob is a Canadian citizen and contributes hisconsiderable experience in large, high-profile Canadian companies. He ischairman of Aimia Inc., a customer loyalty management provider, andserves on the board of BCE Inc. (Bell Canada Enterprises), Canada’s largestcommunications company. He was previously president and chief executiveofficer of CAE Inc., a world leader in flight simulation and training. Beforethat he spent 16 years at Bombardier Inc., the aerospace and transportationcompany, where he was firstly head of the Aerospace Group and thenpresident and chief executive officer. He has also served as chairman of AirCanada and of the Aerospace Industries Association of Canada. Bob wasinducted to the Order of Canada as well as l’Ordre National du Québec. Hehas been awarded honorary doctorates from five Canadian universities.
External appointments (current and recent): Non-executive director of BCEInc. and Bell Canada since 2009, non-executive director and chairman of AimiaInc. since 2005 and 2008 respectively, non-executive director of Fier CPVC-Montreal L.P. from 2005 until 2014.
Megan Clark AC (S, N and I)Non-executive director, BSc, PhD, age 56
Appointment: Director of Rio Tinto since November 2014.
Skills and experience:Megan, an Australian citizen, was chief executive of theCommonwealth Scientific and Industrial Research Organisation (CSIRO) from2009 until 2014. Prior to that, Megan held various mineral exploration, minegeology and strategy roles with Western Mining Corporation, was a director atNM Rothschild and Sons (Australia) and was vice president, Technology andsubsequently vice president, Health, Safety, Environment, Community andSustainability with BHP Billiton from 2003 to 2008. She holds a PhD ineconomic geology from Queen’s University, Canada and is a Fellow of theAustralian Academy of Technological Sciences and Engineering, the AustralianInstitute of Mining and Metallurgy and the Australian Institute of CompanyDirectors. In 2014 she was appointed a Companion of the Order of Australia.
External appointments (current and recent): Member of the Global Foundationboard since 2014, member of the Monash University Council since 2014,member of the advisory board of the World Economic Forum’s 2015 GlobalRisk Report, member of the Australian advisory board of Bank of AmericaMerrill Lynch since 2010, chief executive and director of CSIRO from 2009 to2014, member of the Prime Minister’s Science, Industry, and EngineeringCouncil from 2009 until 2014.
Michael Fitzpatrick (A, R, N and I)Non-executive director, BEng, BA (Oxon), age 62
Appointment: Director of Rio Tinto since 2006.
Skills and experience:Michael, an Australian citizen, contributes wide-ranginginvestment and local knowledge of Australian business. He is chairman ofTreasury Group Limited, a Sydney-based incubator of fund managementcompanies, chairman of the Australian Football League and a former chairmanof the Australian Sports Commission. After leaving professional football in 1983and working for the Treasury of the State of Victoria and with investment banksin New York, Michael founded the pioneering infrastructure asset managementcompany Hastings Funds Management Limited in 1994. He was a RhodesScholar in 1975.
External appointments (current and recent): Non-executive director ofLatAm Autos Limited since November 2014, non-executive director ofCarnegie Wave Energy Limited since 2012, non-executive director andchairman of Infrastructure Capital Group Limited since 2009, chairman ofthe Treasury Group Limited since 2005, commissioner and chairman of theAustralian Football League since 2003 and 2007 respectively, director of theWalter & Eliza Hall Institute of Medical Research since 2001.
riotinto.com 49
STRATEG
ICREPO
RT
DIR
EC
TO
RS
’R
EP
OR
T:
BOARDOFDIRECTORS
FINANCIA
LSTA
TEMEN
TSPR
ODUCTIO
N,R
ESERVES
ANDOPER
ATIO
NS
ADDITIO
NALINFO
RMATIO
N
For
per
sona
l use
onl
y
Board of directors continued
Ann Godbehere (A, N and I)Non-executive director, FCPA, FCGA, age 59
Appointment: Director of Rio Tinto and chairman of the Audit Committeesince 2010.
Skills and experience: Ann, a Canadian and British citizen, has more than25 years’ experience in the financial services industry. She spent ten years atSwiss Re, a global reinsurer, latterly as chief financial officer from 2003 until2007. She was interim chief financial officer and executive director of NorthernRock bank after its nationalisation. Ann is a qualified accountant.
External appointments (current and recent): Non-executive director ofUBS Group AG since 2014 and non-executive director of UBS AG since2009, non-executive director of British American Tobacco plc since 2011,non-executive director of Atrium Underwriting Group Limited from 2007until 2014, non-executive director of Arden Holdings Ltd from 2007 until2014, non-executive director and chairman of the audit committee ofPrudential Public Limited Company since 2007 and 2009 respectively.
Richard Goodmanson (R, S, N and I)Non-executive director, B. Econ, BCom, MBA, MCE, age 67
Appointment: Director of Rio Tinto since 2004 and chairman of theSustainability Committee.
Skills and experience: Richard, a US citizen, was executive vice president andchief operating officer of DuPont until 2009. Prior to this he was president andchief executive officer of America West Airlines and senior vice president ofoperations for Frito-Lay, Inc., a subsidiary of PepsiCo. Richard has worked atsenior levels for McKinsey & Co, where he led client service teams on majorprogrammes of strategy development. He spent ten years in heavy civilengineering project management, principally in South East Asia, including theconstruction of the Hong Kong Subway System.
External appointments (current and recent): Non-executive director of QantasAirways Limited since 2008.
Lord Kerr of Kinlochard (S, N and I)Non-executive director, GCMG, MA (Oxon), age 73
Appointment: Director of Rio Tinto since 2003.
Skills and experience: John, a British citizen, was a member of the UKDiplomatic Service for 36 years and headed it from 1997 to 2002 as permanentunder secretary at the Foreign Office. He previously served in HM Treasuryand in the former Soviet Union and Pakistan, and was ambassador to theEuropean Union and the US. He has been an Independent member of theHouse of Lords since 2004.
External appointments (current and recent): Advisory board member ofEdinburgh Partners Limited since 2012, director and vice chairman of ScottishPower Limited since 2009 and 2012 respectively, chairman of the Centre forEuropean Reform (London) since 2008, vice president of the European PolicyCentre (Brussels) since 2007, trustee of the Carnegie Trust for the Universitiesof Scotland since 2005, director of The Scottish American InvestmentCompany plc since 2002, deputy chairman of Royal Dutch Shell plc from 2005until 2012, chairman of the Court and Council of Imperial College London from2005 until 2011, advisory board member of BAE Systems from 2008 until2011, trustee of the National Gallery in London from 2002 until 2010, trusteeof the Rhodes Trust from 1997 until 2010.
Anne Lauvergeon (S, N and I)Non-executive director, PhD, age 55
Appointment: Director of Rio Tinto since March 2014.
Skills and experience: Anne, a French citizen, started her professional career in1983 in the steel industry and in 1990 was named adviser for economicinternational affairs at the French Presidency and deputy chief of its staff in1991. In 1995, she became a partner of Lazard Frères & Cie, subsequentlyjoining Alcatel Telecom as senior executive vice president in 1997, where shewas responsible for international activities and the group’s industrialshareholdings in the energy and securities sectors. She served as chairmanand chief executive officer of COGEMA from 1999 until 2011 and chiefexecutive officer of AREVA Group from 2001 until 2011.
External appointments (current and recent): Chairman of SIGFOX since 2014,non-executive director of American Express Company since 2013, non-executive director of EADS N.V. since 2013, non-executive director of Total SAsince 2000, chairman and chief executive officer of French advisory company,A.L.P., non-executive director of GDF SUEZ from 2001 until 2012, chiefexecutive officer of AREVA Group from 2001 until 2011, and non-executivedirector of Vodafone plc from 2005 until 2014.
Michael L’Estrange AO (S, N and I)Non-executive director, BA, MA (Oxon), age 62
Appointment: Director of Rio Tinto since September 2014.
Skills and experience:Michael, an Australian citizen, joined the AustralianGovernment’s Department of Prime Minister and Cabinet in 1981. From 1989to 1994, he worked in a range of policy advisory positions before he wasappointed the inaugural executive director of the Menzies Research Centre inCanberra in 1995. In 1996, he was appointed by the Prime Minister assecretary to cabinet and head of the Cabinet Policy Unit. He served in that roleuntil 2000 when he became Australia’s high commissioner to the UnitedKingdom. He returned to Australia as secretary of the Department of ForeignAffairs and Trade from 2005 to 2009. In 2007, he was appointed as an Officerin the Order of Australia. Michael served as head of college of the NationalSecurity College at the Australian National University from 2009 until 2014 andhe is a professor at the college.
External Appointments (current and recent): Director of the University of NotreDame, Australia since 2014, and head of college of the National SecurityCollege at the Australian National University from 2009 until 2014.
Hon. Paul Tellier (A, R, N and I)Non-executive director, LLL, BLitt (Oxon), LL.D, C.C. age 75
Appointment: Director of Rio Tinto since 2007.
Skills and experience: Paul, a Canadian citizen, entered the civil service in the1970s. He was clerk of the Privy Council Office and secretary to the Cabinet ofthe Government of Canada from 1985 to 1992. He was president and chiefexecutive officer of the Canadian National Railway Company from 1992 until2002. Until 2004, he was president and chief executive officer of BombardierInc., the aerospace and transportation company.
External appointments (current and recent): Chairman of Global ContainerTerminals Inc. since 2007, member of the advisory board of General Motorsof Canada since 2005, trustee of the International Accounting StandardsFoundation from 2007 until 2012, co-chair of the Prime Minister of Canada’sAdvisory Committee on the Renewal of the Public Service from 2006 until2014, strategic adviser to Société Générale (Canada) from 2005 until 2013,director of BCE Inc. (Bell Canada Enterprises) from 1999 until 2010, directorof Bell Canada from 1996 until 2010, director of McCain Foods Limited from1996 until 2014.
50 riotinto.com
For
per
sona
l use
onl
y
Simon Thompson (S, N and I)Non-executive director, MA (Oxon), age 55
Appointment: Director of Rio Tinto since April 2014.
Skills and experience: Simon, a British citizen, was an executive director ofAnglo American plc, chairman and chief executive of the Base Metals Division,chairman of the Exploration Division and chairman of Tarmac. Prior to hiscareer with Anglo American he held investment banking positions at S. G.Warburg and N M Rothschild & Sons Ltd.
External appointments (current and recent): Chairman of Tullow Oil plc since2012, non-executive director of Amec Foster Wheeler plc since 2009 andsenior independent director since 2014, non-executive director of Sandvik ABsince 2008, non-executive director of Newmont Mining Corporation from 2008to 2014.
John Varley (A, R, N and I)Non-executive director, BA, MA (Oxon), age 58
Appointment: Director of Rio Tinto and chairman of the RemunerationCommittee since 2011 and senior independent director since 2012.
Skills and experience: John, a British citizen, joined Barclays plc in 1982 afterworking as a solicitor. He was chief executive of Barclays from 2004 until 2010.During a 28-year career with the bank he held several senior positions,including chairman of the Asset Management division, group finance directorand deputy chief executive.
External appointments (current and recent): Director of Barclays plc andBarclays Bank plc from 1998 until 2010, non-executive director of BlackRockInc. since 2009, non-executive director and senior independent director ofAstraZeneca plc since 2006 and 2012 respectively, chairman of Marie CurieCancer Care since 2011 and chairman of Business Action on Homelessnesssince 2006.
Directors who left the boardVivienne CoxNon-executive director, MA (Oxon), MBA (INSEAD), age 55
Appointment: Director of Rio Tinto from 2005 until April 2014.
Skills and experience: Vivienne is a British citizen. She was executive vicepresident of Gas, Power and Renewables at BP and former chief executiveof BP Alternative Energy. During her career at BP she served in a variety ofpositions ranging from supply and trading, to commercial, finance andexploration and renewable energy. Vivienne holds degrees in chemistryfrom Oxford University and in business administration from INSEAD.
External appointments (current and recent):Member of Kingfisher plc NetPositive Advisory Council since 2013, non-executive director of BG Group plcsince 2012, non-executive director and senior independent non-executivedirector of Pearson plc since 2012 and 2013 respectively, non-executivedirector of the UK Department for International Development since 2010,non-executive director of The Climate Change Organisation since 2010,non-executive director and non-executive chairman of Climate Change CapitalLimited from 2008 and 2009 respectively until 2012, member and chairman ofthe supervisory board of Vallourec, since 2010 and 2013 respectively, memberof the offshore advisory committee of Mainstream Renewable Power from2010 until 2012, a member of the board of INSEAD business school from 2009until 2013.
Company secretariesEleanor EvansLLB (Lond), Solicitor, age 48
Skills and experience: Eleanor joined the Group as company secretary ofRio Tinto plc and joint company secretary of Rio Tinto Limited in 2013.
Prior to joining Rio Tinto, Eleanor was general counsel and company secretaryat Amec Foster Wheeler plc and chief legal officer and company secretary atCobham plc. In both roles Eleanor was responsible for legal, compliance andsecretariat matters globally, was a member of the executive committee andthe risk committee, and was secretary to the board of directors and theirprincipal committees. Eleanor commenced her career as a solicitorspecialising in corporate and financial law with Norton Rose Fulbright and inher earlier career held senior legal roles at The BOC Group plc and CorusGroup plc.
External appointments (current and recent): Eleanor is a member of theexecutive committee of GC100, the Association of General Counsel andCompany Secretaries of the FTSE 100, a trustee of the StepChangeFoundation UK, a charity, and is an advisory board member of Women inMining UK.
Tim PaineBEc, LLB, FGIA, FCIS, age 51
Skills and experience: Tim joined the Group as joint company secretary ofRio Tinto Limited in 2012. He has over 20 years’ experience in corporatecounsel and company secretary roles, including at ANZ Bank, Mayne Group,Symbion Health and Skilled Group. Tim commenced his career as a solicitor inprivate practice and has also managed his own consulting company.
External appointments (current and recent): He has no external appointments.
riotinto.com 51
STRATEG
ICREPO
RT
DIR
EC
TO
RS
’R
EP
OR
T:
BOARDOFDIRECTORS
FINANCIA
LSTA
TEMEN
TSPR
ODUCTIO
N,R
ESERVES
ANDOPER
ATIO
NS
ADDITIO
NALINFO
RMATIO
N
For
per
sona
l use
onl
y

Executive Committee
Hugo BagueMA (Linguistics), age 54
Hugo Bague was appointed Group executive, Organisational Resources in2013 after joining Rio Tinto as global head of Human Resources in 2007.Previously he worked for Hewlett-Packard where he was the global vicepresident, Human Resources for the Technology Solutions Group, based inthe US. Prior to this he worked for Compaq Computers, Nortel Networks andAbbott Laboratories based in Switzerland, France and Germany.
He has been a non-executive director and member of the nominating andgovernance committee, and the compensation committee of Jones LangLaSalle Incorporated, a global real estate services firm, since 2011.
Alfredo BarriosPhD (Energy Economics), BSc (Physics), MSc (Management), age 49
Alfredo was appointed chief executive, Aluminium in June 2014. He joined theGroup after a wide-ranging career in leadership positions with BP plc. His mostrecent role was executive director and executive vice president Downstream atTNK-BP, based in Moscow, where he was directly responsible for the refining,trading, supply, logistics, and marketing businesses. Prior to this, he led BP’soperations in Spain and Portugal where he was responsible for establishingand developing the Fuels Value Chain organisation, combining this with therole of BP Head of Country Spain.
Alfredo has held board positions in a number of companies, including CLH(Spain) from 2007 until 2011 where he was chairman of the Audit Committee,and OAO NGK Slavneft (Russia) from 2012 until 2013. He was president of theSpanish National Oil Industry Association (AOP) from 2009 until 2011.
Alan DaviesBBus (Acctcy) LLB, LLM, FCA, age 44
Alan was appointed chief executive, Diamonds & Minerals in 2012. He joinedthe Group in 1997 and has held management positions in Australia, London andthe US for the Iron Ore and Energy businesses. Prior to his current role, Alanwas president, international operations for Rio Tinto’s Iron Ore business withglobal accountability for operations and projects in Canada, India and Guinea,and was also previously chief financial officer of the Iron Ore business. Alanassumed responsibility for the Uranium business on 27 February 2015. Alan is aFellow of the Institute of Chartered Accountants in Australia.
He was a director of the Art Gallery of Western Australia from 2010 to 2012.
Andrew HardingBEng (Mining Engineering), MBA, age 48
Andrew Harding was appointed chief executive, Iron Ore in 2013. Prior to hiscurrent role, Andrew spent three years as chief executive, Copper, where hewas responsible for a range of mines and projects including the developmentof the world-class Oyu Tolgoi copper-gold mine in Mongolia. Andrew joinedRio Tinto in 1992 and spent seven years in Rio Tinto Iron Ore. He has also helda range of positions in Technology & Innovation, Energy and Aluminium andwas president and chief executive officer of Kennecott Utah Copper.
He was a director of Turquoise Hill Resources Ltd between 2009 and 2010 andbetween 2011 and 2013.
Jean-Sébastien JacquesMSc, age 43
Jean-Sébastien was appointed chief executive, Copper & Coal in February2015, having previously been chief executive, Copper since 2013. He joinedRio Tinto in 2011 as president, International Operations – Copper, where he leda senior team and oversaw Rio Tinto’s interests in the Palabora MiningCompany in South Africa, Northparkes Mines in Australia, Kennecott EagleMinerals, the Pebble Mine in the US and Sulawesi in Indonesia. Prior to joiningRio Tinto, Jean-Sébastien spent more than 15 years working across Europe,South East Asia, India and the US in operational and strategy roles in the
aluminium, bauxite and steel industries. He served as group director, Strategyand was on the executive committee at Tata Steel Group from 2007 to 2011.
Jean-Sébastien was appointed chairman of the International Copper Associationin October 2014, having served as vice chairman since 2013. He was a directorof Turquoise Hill Resources Ltd during 2013, a director of Bougainville CopperLimited from 2012 until 2013, and a director of Palabora Mining CompanyLimited from 2011 until 2013.
Harry Kenyon-SlaneyBSc (Geology), age 54
Harry was appointed chief executive, Energy in 2012. He joined the Group in1990 from Anglo American Corporation and has held management positions inSouth Africa, Australia and the UK. Harry spent his early career at Rio Tinto inmarketing and operational roles in the uranium, copper and industrialminerals businesses. In 2004, he was appointed chief executive of EnergyResources of Australia and in 2007, managing director of Rio Tinto Iron &Titanium. Prior to his current role, he was chief executive of Rio Tinto’sDiamonds & Minerals product group. Harry will be leaving Rio Tinto in March2015 following the announcement made on 27 February 2015.
Harry has been a director of the World Coal Association since 2012 and wasappointed chairman in 2014. He became a director of the Coal IndustryAdvisory Board to the IEA in 2013.
Greg LilleymanBEng (Construction), age 48
Greg was appointed Group executive, Technology & Innovation in January2014. He joined the Group in 1990 and held a number of operational rolesacross the Pilbara, Hunter Valley and Canada with both the Iron Ore andEnergy businesses. In 2011 Greg was appointed president, Pilbara Operationsfor Rio Tinto Iron Ore and in 2013 assumed the role of head of productivityimprovement with Technology & Innovation.
Greg was a board member of the Australian Institute of Management ofWestern Australia from 2012 until 2013, a board member of the Energy &Minerals Institute from 2011 until 2013, and a director of the Chamber ofMinerals and Energy of Western Australia from 2008 until 2013, holding theposition of president from 2011 until 2013. Since 2012 he has been a boardmember of the Curtin University Foundation.
Debra ValentineBA (History), JD, age 61
Debra was appointed Group executive, Legal & Regulatory Affairs in 2009having joined Rio Tinto as global head of Legal in 2008. She previously workedat United Technologies Corporation in the US where she was vice president,deputy general counsel and corporate secretary. Before then, she was apartner with the law firm O’Melveny & Myers, in Washington DC. Debra servedas general counsel at the US Federal Trade Commission from 1997 to 2001.
She has been a member of the board of the Extractive Industries TransparencyInitiative since 2012, the North American Advisory Council at Chatham Housesince 2013, the UK-Japan 21st Century Group since October 2014 and the‘Your Life’ Corporate Advisory Board since November 2014.
Executive director membersSam Walsh and Chris Lynch were also members of the Executive Committeein 2014 through their positions as chief executive and chief financial officerrespectively. Their biographies are shown on page 49.
52 riotinto.com
For
per
sona
l use
onl
y

Corporate governance
Rio Tinto takes a unified approach to corporate governance to comply with theregulatory obligations associated with its three principal stock exchangelistings in the UK, Australia and the US.
Statement of compliance with governance codes andstandards in 2014In compiling this report, the directors have referred to the September 2012edition of the UK Corporate Governance Code (the Code), the ASX CorporateGovernance Council’s Corporate Governance Principles andRecommendations (2nd edition with 2010 amendments) (the ASX Principles),and the New York Stock Exchange (NYSE) Corporate Governance Standards(the NYSE Standards).
Throughout 2014, and at the date of this report, the Group applied theprinciples of, and was compliant with the provisions of, the ASX Principles andwith the Code.
Rio Tinto plc, as a foreign issuer with American Depositary Shares listed on theNYSE, is obliged by the NYSE Standards to disclose any significant ways inwhich its practices of corporate governance differ from the NYSE Standards.
The Company has reviewed the NYSE Standards and believes that its practicesare broadly consistent with them, with the following exceptions where thestrict requirements of the NYSE Standards are not met.
The NYSE Standards state that companies must have a nominating/corporategovernance committee composed entirely of independent directors which, inaddition to identifying individuals qualified to become board members,develops and recommends to the board a set of corporate governanceprinciples applicable to the company. Rio Tinto has a Nominations Committee,information about which is set out on page 59. This committee does notdevelop corporate governance principles for the board’s approval. The boarditself performs this task.
Under US securities law and the NYSE Standards, the company is required tohave an audit committee that is directly responsible for the appointment,compensation, retention and oversight of the work of external auditors. Whilethe Rio Tinto Audit Committee makes recommendations to the board on thesematters, the ultimate responsibility for the appointment of the externalauditors rests with the shareholders.
A discussion of the Group’s position on audit tenders is set out on page 58 ofthis report.
Further information about the corporate governance framework is available inthe “Corporate governance” section of Rio Tinto’s website.
The boardRio Tinto plc and Rio Tinto Limited have a common board of directors. Thedirectors are responsible for the success of the Group and, through theindependent oversight of management, are accountable to shareholders forthe performance of the business.
Role and responsibilitiesThe principal role of the board is to set the Group’s strategy and to reviewregularly its strategic direction. In doing this, the board also has responsibilityfor corporate governance.
A formal schedule of matters reserved by the board has been established bythe directors. This covers areas such as the Group’s strategy, majorinvestments, acquisitions and divestments and oversight of risk. It is availableon the website.
Responsibility for day-to-day management of the business is delegated to thechief executive and the Executive Committee. In turn, authorities are alsodelegated to individual members of the Executive Committee.
As part of the annual financial planning process, the board sets annualperformance targets, which include personal and business performancemeasures, under the Group’s short-term incentive plan (detailed on page 76)for the chief executive. These performance targets are determined by theRemuneration Committee on behalf of the board. The chief executiveestablishes targets for the Executive Committee. Those objectives arecascaded throughout management teams.
Further details of the performance evaluation of the executive directors andother senior executives are discussed in the Implementation Report section ofthe Remuneration Report on page 75.
Board balance and independenceBoard compositionThe names, skills and experience of each director together with their terms inoffice are shown in the biographical details on pages 49 to 51. Details ofchanges to the board during 2014 and in the year to date are set out in theDirectors’ report on page 46.
Director independenceThe tests of independence of a non-executive director vary between thejurisdictions where Rio Tinto has listings. The Nominations Committee hasadopted a formal policy for the determination of the independence of thenon-executive directors.
Among the key criteria of the independence policy are independence frommanagement and the absence of any business relationship which couldmaterially interfere with the director’s independence of judgment and ability toprovide a strong, valuable contribution to the board’s deliberations, or whichcould interfere with the director’s ability to act in the best interests of the Group.Where contracts in the ordinary course of business exist between Rio Tinto anda company in which a director has declared an interest, these are reviewed formateriality both to the Group, and the other party to the contract. “Material” isdefined in the policy as being where the relationship accounts for more thantwo per cent of either party’s consolidated gross revenue per annum, althoughthe test also takes other circumstances into account. The Code includes criteriato assess independence where a director has served on the board for more thannine years from the date of their first election.
The chairman was considered independent upon his appointment under theCode, and in the board’s view he continues to satisfy the tests forindependence under the ASX Principles and the NYSE Standards.
Applying the criteria of the independence policy, the board is satisfied that allof its non-executive directors are and remain independent. Lord Kerr andMichael Fitzpatrick are not standing for re-election in 2015.
riotinto.com 53
STRATEG
ICREPO
RT
DIR
EC
TO
RS
’R
EP
OR
T:
CORPORATEGOVERNANCE
FINANCIA
LSTA
TEMEN
TSPR
ODUCTIO
N,R
ESERVES
ANDOPER
ATIO
NS
ADDITIO
NALINFO
RMATIO
N
For
per
sona
l use
onl
y

Corporate governance continued
Richard Goodmanson, who has been a non-executive director since 2004, hasagreed to stand for re-election to the board at the annual general meetings in2015. The board believes that Richard makes an outstanding contribution tothe board, and particularly as chairman of the Sustainability Committee.Richard provides continuity to the board, given his significant knowledge of thebusiness and the board has confirmed that he continues to satisfy the tests forindependence in carrying out his role.
Executive directors’ other directorshipsExecutive directors may be invited to become non-executive directors of othercompanies. The Nominations Committee, on behalf of the board, operates aprocedure under which approval may be given to accept such invitations,recognising the benefit to be derived to the individual and to Rio Tinto fromsuch appointments. Details of the chief executive’s external appointments areset out on page 49.
Election and re-electionThe directors may appoint additional members to join the board during theyear. Directors appointed in this way will be subject to election by shareholdersat the first annual general meetings after their appointment. In subsequentyears, the directors are expected to submit themselves for re-election at theannual general meetings each year.
Non-executive directors are normally expected to serve at least six years andwould not normally serve more than nine years.
On 29 May 2014, Rio Tinto announced the appointment of Michael L’Estrangeas an independent non-executive director effective 1 September 2014. On20 November 2014 Rio Tinto announced the appointment of Dr Megan Clarkas an independent non-executive director effective immediately. Both will offerthemselves for election at the annual general meetings in 2015 and furtherdetails about them are set out in the notices of annual general meetings.
Governance processesIn 2014, there were nine scheduled board meetings. Details of the directors’attendance at all of the board and committee meetings held in 2014 are setout on the following page.
The board has regular discussions with senior management on the Group’sstrategy. These discussions typically include presentations given by seniormanagement during the year. The board attends an annual two-day strategymeeting with the Executive Committee, which includes broader, detailedreview sessions on the Group’s strategic direction. The outputs from this eventhelp underpin the board’s annual financial planning exercise and providestrategic direction and focus to the Executive Committee.
Directors receive timely, regular and appropriate information to enable themto fulfil their duties. They also have direct access to the advice and services ofthe Rio Tinto company secretary. The directors are also able to obtainindependent professional advice at the Group’s expense.
The chairman and non-executive directors meet, typically at the start of eachboard meeting, without the executive directors present, to create anopportunity for non-executive directors to raise any issues in private session.
In addition, the directors are in regular informal communication with membersof the Executive Committee and other members of senior management. Thishelps to foster an open and regular exchange of knowledge and experience.
All new non-executive directors undertake a full, formal and tailored inductionon joining the board. The board is provided with training and developmentopportunities during the year. The directors are also encouraged to participatein site visits to the Group’s operations around the world and to meet withemployees and, from time to time, shareholders and other key stakeholders. In2014, the board visited our coal mining operations in the Hunter Valley,Australia. These events are arranged by the Rio Tinto company secretary onbehalf of the chairman, and seek to ensure directors have appropriateknowledge of the company and access to its operations and staff.
Progress against our prioritiesThe progress made towards achieving the priorities set by the board during2014 are set out on pages 9 and 10.
Annual performance evaluationAn annual exercise is undertaken to evaluate the effectiveness of the board,board committees and individual directors.
For 2014, the board and committee (audit, nominations, remunerationand sustainability) evaluation process was conducted by the Rio Tintocompany secretary.
The process involved agreeing with the chairman, board and committeechairmen a series of questions for discussion and interviews with directorsseeking their views with regard to progress on the actions arising from the2013 evaluation and generally upon the performance of the board and itscommittees in 2014.
The findings from the evaluation reports for the board and its committees andrecommended actions were discussed with the chairman and the chairmen ofthe committees ahead of a full review at the February 2015 meetings of theboard and its committees.
The non-executive directors, led by the senior independent director, wereresponsible for the performance evaluation of the chairman. Non-executivedirectors met to give their views and the senior independent director alsosought the views of the executive directors. The senior independent directorgave feedback on the chairman’s performance to him in February.
The chairman continues to be responsible for the assessment of eachindividual director’s performance and contribution.
54 riotinto.com
For
per
sona
l use
onl
y
Directors’ attendance at board and committee meetings during 2014
BoardScheduled (g)
AuditCommittee (g)
RemunerationCommittee (g) (h)
SustainabilityCommittee (g)
NominationsCommittee (g)
Chairman’sCommittee (g)
Jan du Plessis 9/9 – 9/9 – 5/5 13/13
Chris Lynch 9/9 – – – – 10/13
Sam Walsh 9/9 – – – – 11/13
Robert Brown (a) 9/9 2/2 – 4/4 5/5 –
Megan Clark (b) 1/1 – – – – –
Vivienne Cox (c) 3/3 – – 2/2 1/1 –
Michael Fitzpatrick 9/9 6/6 8/9 – 5/5 –
Ann Godbehere 9/9 6/6 – – 5/5 –
Richard Goodmanson 9/9 – 8/9 5/5 5/5 –
Lord Kerr 9/9 – – 5/5 5/5 –
Anne Lauvergeon (d) 6/6 – – 3/3 4/4 –
Michael L’Estrange (e) 3/3 – – 1/1 2/2 –
Paul Tellier 9/9 6/6 9/9 – 5/5 –
Simon Thompson (f) 5/6 – – 3/3 3/4 –
John Varley 9/9 6/6 9/9 – 5/5 –
(a) Stepped down from the Sustainability Committee and joined the Audit Committee on 15 October 2014.
(b) Joined the board on 20 November 2014.
(c) Stood down from the board on 15 April 2014.
(d) Joined the board on 15 March 2014.
(e) Joined the board on 1 September 2014.
(f) Joined the board on 1 April 2014 and had a prior conflict for meetings in September 2014.
(g) The number of meetings attended/maximum number the director could have attended.
(h) This included three meetings convened at short notice.
riotinto.com 55
STRATEG
ICREPO
RT
DIR
EC
TO
RS
’R
EP
OR
T:
CORPORATEGOVERNANCE
FINANCIA
LSTA
TEMEN
TSPR
ODUCTIO
N,R
ESERVES
ANDOPER
ATIO
NS
ADDITIO
NALINFO
RMATIO
N
For
per
sona
l use
onl
y

Corporate governance continued
Governance structureThe board has established sub-committees which are responsible for audit,remuneration, sustainability and nominations issues. In addition, a Chairman’sCommittee operates under delegated authority between scheduled boardmeetings. These committees support the board in ensuring that highstandards of corporate governance are maintained across the Group.
The committees are governed by terms of reference, set and approved bythe board, which are reviewed annually. The terms of reference of the audit,nominations, remuneration and sustainability committees (revised versionsof those for the audit, sustainability and nominations committees wereissued in February 2015) can be viewed in the “Corporate governance”section of the website.
The chief executive is assisted by the key management committees notedbelow in monitoring performance and delivering Rio Tinto’s strategy.
Audit Committee
DisclosureCommittee
InvestmentCommittee
ExecutiveCommittee
ClosureCommittee
Ore ReservesSteering Committee
Risk ManagementCommittee
Board committees Management committees
Board of directors
Chief executive
SustainabilityCommittee
RemunerationCommittee
NominationsCommittee
Chairman’sCommittee
56 riotinto.com
For
per
sona
l use
onl
y

Board committeesAudit CommitteeMembers of the Committee are Ann Godbehere (chairman), Robert Brown,Michael Fitzpatrick, Paul Tellier and John Varley. Robert Brown was appointedto the Committee on 15 October 2014.
Key responsibilitiesThe objective of the Audit Committee is to assist the board to monitordecisions and processes designed to ensure the integrity of financial reporting,sound systems of internal control and risk management.
The Committee’s terms of reference set out its main responsibilities, and areavailable to view on the website. The Committee is responsible for:
– Financial reporting;
– Internal control, including internal control over financial reporting;
– Internal audit and assurance;
– The external auditors (appointment and relationship);
– The effectiveness of the risk management framework; and
– The integrity and compliance programme including the Group’s Speak-OUT whistleblowing programme.
In carrying out its responsibilities, the Committee has full authority toinvestigate all matters that fall within its terms of reference. Accordingly, theCommittee may:
– obtain independent professional advice in the satisfaction of its duties atthe cost of the Group; and
– have direct access to the resources of the Group as it may reasonablyrequire including the external and internal auditors.
Financial reportingDuring 2014 the Committee’s deliberations included the following matterswhich it considered to be significant:
– Impairments in the 2013 accounts, and the continued monitoring ofmanagement’s determination of cash-generating units, review ofimpairment triggers and consideration of potential impairment chargesand reversals over the course of the year.
– Management’s key accounting judgments and policies, and the applicationof these in the accounts, including:
– the justification for exclusion of certain items from underlying earnings;
– the Group’s tax exposure, the consequences of the repeal of theMineral Resources Rent Tax and the appropriateness of provisions foruncertain tax positions; and
– accounting for divestments announced in 2013 and 2014 withcontractual obligations which remain with the Group followingcompletion of the divestments.
The Committee also considered:
– the impact on internal financial controls of the overall cost reductionprogramme which has been implemented across the Group.
– the impact of the Group’s finance transformation programme whichincludes the centralisation and outsourcing of certain finance activities(excluding key controls) to a third party provider. Group Audit & Assurancehas performed a series of point-in-time reviews of the effectiveness of thefinance transformation governance structure and the transition of certainprocesses to the outsourcing provider and reported to the Committee onthe findings from these reviews.
– closure provisions.
– the Group’s resources and reserves report in the 2013 Annual report andreceived updates during the year.
To date in 2015 the Committee has reviewed, amongst others, thefollowing matters which it considered to be significant in relation to the2014 financial statements:
– carrying values in the draft 2014 Annual report, including assessment ofimpairment charges (particularly at the Kitimat modernisation project andthe Molybdenum Autoclave Process (MAP)) and impairment reversals (atPacific Aluminium).
– closure provisions and an increase to the provision adjusted through fixedassets at Rio Tinto Kennecott. The Committee noted that this significantadjustment is primarily a result of updating the existing estimate to anOrder of Magnitude level reflecting the latest data and business plan.
– management’s key accounting judgments and policies, and the applicationof these in the accounts, including:
– the justifications for exclusion of certain items from underlyingearnings; and
– the Group’s tax exposure, the recoverability of deferred tax assets andthe appropriateness of provisions for uncertain tax positions.
– the Group’s resources and reserves report in the 2014 Annual report.
Key judgments consideredIn preparing the financial statements, a number of judgments and estimatesare required involving assumptions and consideration of future events that areinherently uncertain. The Committee focused its work on assessingmanagement’s ongoing judgments and estimates against available evidence,and evaluating the disclosures in the financial statements. The Committeealso considered the external auditors’ views on these matters.
Of the judgments and key sources of estimation uncertainty listed as criticalaccounting policies and estimates in note 1 to the financial statements, thefollowing areas received specific focus from the Committee over the year:
– Assessment of the carrying value and annual impairment reviewsof: assets dependent on the approval of major capital spend (Oyu Tolgoiand Simandou); major assets under construction (Kitimat modernisationproject and MAP); and for impairment reversals derived from thesustainability of improved business performances (Aluminium groupincluding Pacific Aluminium) due to the size and degree of subjectivityrelated to the recoverable amount for these assets and the complexjudgments about the expected future performance of the business.
– Valuation reports and indicators for the above assets to corroborate theinternally prepared valuations. For listed subsidiaries (Turquoise HillResources and Energy Resources of Australia), the Committee consideredthe carrying value of these separate businesses against external marketdata, including market capitalisation and broker reports.
– The assumptions on discount rate, long-term pricing and risk factors forfuture growth projects were considered and challenged by the Committee,by understanding how they compare with external market data.
– For Oyu Tolgoi, the timing of the underground development is animportant factor in determining potential impairment, and the Committeereviewed and challenged the likely timing in light of the progress ofdiscussions with the Government of Mongolia and changes in Governmentin late 2014. The Committee satisfied itself with regard to the carryingvalue for Oyu Tolgoi and the likely impact of further delays to the projecton the carrying value as noted in note 6 on page 128.
– Close-down, restoration and environmental obligations.
– Estimates of risk free discount rates in light of the ongoing impact offiscal interventions. The Committee also focused on the differentremediation or closure outcomes which could realistically arise whenassessing the adequacy of the provisioning for these obligations. Bothinvolve complex judgments.
riotinto.com 57
STRATEG
ICREPO
RT
DIR
EC
TO
RS
’R
EP
OR
T:
CORPORATEGOVERNANCE
FINANCIA
LSTA
TEMEN
TSPR
ODUCTIO
N,R
ESERVES
ANDOPER
ATIO
NS
ADDITIO
NALINFO
RMATIO
N
For
per
sona
l use
onl
y

Corporate governance continued
– Recoverability of potential deferred tax assets.
– Appropriateness of continued recognition of deferred tax assets,particularly tax losses in France, recovery of which is restrictedby legislation.
– Defined benefit pension plan surpluses and deficits. During 2014 the boardreceived an update on the status of funding, investment and governance ofpensions and other retirement benefits provided to current and formeremployees of the Company. The Committee received reports in 2014 and2015 on PwC’s audit procedures over the Group’s pension and post-retirement defined benefit assets and liabilities. The Committee reviewedthe disclosures on pensions in note 45 on pages 168 to 173.
In addition, the Committee critically assessed the projections of future cashflows under different scenarios and compared these with cash balances andcommitted facilities available in order that the Committee could recommendto the board that the adoption by the Group of the going concern basis ofpreparation was appropriate.
Governance processesThe Committee met six times in 2014. The chairman of the board, chieffinancial officer, other senior management and external and internal auditorsregularly attended its meetings. The Committee carries out its businessfollowing an agreed annual cycle of meetings and topics for consideration.
The members of the Committee are independent and free of any relationshipthat would affect their impartiality in carrying out their responsibilities. Themembers meet the independence requirements of the Code, the ASXPrinciples and the NYSE Standards. The Committee meets the composition,operation and responsibility requirements of the ASX Principles.
The Committee is also bound by SEC requirements for audit committees’financial experts and the Code and ASX Principles requirement that at leastone committee member should have recent and relevant financialqualifications and experience. Ann Godbehere, chairman of the Committee, isconsidered by the board to have recent and relevant financial experience, andfinancial qualifications, and has been designated the Committee’s financialexpert. All other members of the Committee are, in the opinion of the board,deemed to be financially literate by virtue of their business experience.
The Committee applies policies for the pre-approval of permitted servicesprovided by the Group’s external auditors PwC. All of the engagements forservices provided by PwC were either within the pre-approval policies orseparately approved by the Committee. The Committee members aresatisfied that the provision of non-audit services by PwC in accordance withthis procedure is compatible with the general standard of independence forauditors imposed by relevant regulations, including Australian, UK andUS legislation.
The Committee considered reports from PwC and Group Audit & Assurance onthe activities undertaken in reviewing and auditing the control environment inorder to assess the quality and effectiveness of the internal control system.This included an evaluation of the effectiveness of the Group’s internalcontrols over financial reporting and the Group’s disclosure controls andprocedures in accordance with sections 404 and 302 of the Sarbanes-OxleyAct 2002.
The external auditors attended all six Committee meetings during the year. Inadvance of the Committee meetings, the audit partners brief the chairman ofthe Committee on key matters. Private discussion sessions were routinely heldbetween PwC and the Committee without management present to discuss thestatus of the audit and nature of interaction with management.
During the year, the Committee reviewed the effectiveness of PwC for Groupaudit and local statutory audit work. The evaluation, managed by the Group’sfinancial controllers, took the form of a survey comprising a range of questionscovering objectivity, quality, and efficiency, and was completed by individualRio Tinto business units. The results of this survey and review were assessedby the Committee which concluded that PwC continued to provide a high-quality audit and effective and independent challenge to management. TheCommittee was satisfied with the external audit process and that theindependence of the external auditors was in no way compromised.
PwC have been the external auditors since before the formation of the DLCstructure in 1995, and acted as external auditors to a number of thecompany’s legacy entities prior to the formation of the DLC. In the UK, theaudit engagement partner Richard Hughes was appointed in 2011, and inAustralia the audit engagement partner Paul Bendall was appointed in 2012.They are due to transition off the audit after the December 2015 and 2016year-end audits respectively.
The Committee considers its recommendations to the board on theappointment and reappointment of auditors annually and specifically hasresponsibility for establishing formal and transparent arrangements with PwC.The Committee has reviewed the timetable for tendering and has taken intoaccount all relevant regulation and guidance. New EU regulations and therecent ruling by the Competition and Markets Authority will impose mandatoryrotation requirements from 2016 which require that the Group’s auditors mustbe changed by 2021. In light of these requirements, it is likely that the auditwill be tendered in 2017 or 2018 with the new auditors appointed for the 2019or 2020 financial year.
The Committee believes that the requirements of good governance and theneeds of Rio Tinto are best served by tendering in the above timeframe for thefollowing reasons:
– Rio Tinto is undergoing significant business process change through thecost saving programme, which includes outsourcing of certain activities(including the finance transformation programme), and is currentlyimplementing a new financial reporting consolidation system. A measuredrotation timetable maintains stability in the independent oversightprovided by the external auditors while the business fully implements thechanges to maximise efficiency and effectiveness.
– Rio Tinto draws on expertise from a number of accounting firms andtherefore a rotation of external audit services will require careful planningof transition periods to ensure that all services are fully contractedthroughout the rotation process.
Rio Tinto ensures independence through other means, including detailedreview, challenge and reporting of all work performed by accounting firms. Asummary is presented annually to the Audit Committee of the fees incurredand nature of work performed. Further information on fees paid to PwC in 2014for audit and non-audit services are set out on page 48 of the Directors’ report.
The Committee meets privately with the Head of Group Audit & Assurancefrom time to time without management present and the chairman of theCommittee has regular discussions with him.
OtherIn 2014 the Committee also:
– Conducted an ongoing review and monitoring of the Group’s controlenvironment and risk management processes and effectiveness.
– Reviewed Group Audit & Assurance findings and approved the InternalAudit Plan and associated resources for 2015.
– Monitored Internal Control over Financial Reporting (SOx) testing results.
– Monitored the effectiveness of the Group’s internal controls and internalcontrol systems.
– Reviewed reports from the Head of Group Compliance.
– Monitored the effectiveness of the Group’s risk management system withthe Head of Group Risk.
– Reviewed Legal and Tax disputes reports from the Group Executive,Legal & Regulatory Affairs and the Head of Tax respectively.
– Considered the requirement for the Annual report and accounts, taken as awhole, to be fair, balanced and understandable.
– Reviewed the controls and processes in place over reporting of costsavings achieved under the Group’s cost reduction programme.
– Considered the findings from the 2013 evaluation of the Committee’sperformance and supported the recommended action.
– Conducted ongoing monitoring of non-audit activities performed by theGroup’s external auditors and approval of their audit engagementcontracts and remuneration.
58 riotinto.com
For
per
sona
l use
onl
y

– Considered proposals from various regulators (including the FinancialReporting Council and Competition and Markets Authority) on AuditorIndependence and the Audit Committee’s responsibilities in this regard.
– Underwent training and development on relevant accounting topics.
In the first part of 2015, the Committee:
– Evaluated, at the request of the board, the 2014 Annual report andaccounts, to assess whether they are, taken as a whole, fair, balancedand understandable.
– Considered findings from the 2014 evaluation of theCommittee’s performance.
During the remainder of 2015 the Committee will follow its annual schedule ofmeetings and topics for discussion and will report on the same in 2016.
Sustainability CommitteeMembers of the Committee are Richard Goodmanson (chairman), AnneLauvergeon, Michael L’Estrange, Lord Kerr, Simon Thompson and MeganClark. Anne Lauvergeon was appointed to the Committee with effect from15 March 2014. Simon Thompson was appointed to the Committee with effectfrom 1 April 2014. Robert Brown stood down from the Committee and MichaelL’Estrange was appointed to the Committee on 15 October 2014. Megan Clarkwas appointed to the Committee with effect from 20 November 2014. VivienneCox stood down from the Committee with effect from 15 April 2014.
Key responsibilitiesThe Committee assists the board with overseeing strategies designed tomanage social and environmental risks, overseeing management processesand standards and achieving compliance with social and environmentalresponsibilities and commitments. The Committee reviews the effectiveness ofmanagement policies and procedures relating to safety, health, employmentpractices, relationships with neighbouring communities, environment, humanrights, land access, political involvement and sustainable development. TheCommittee’s terms of reference are available to view on the website.
Governance processesIn 2014, the Committee met five times. The chairman of the board, chiefexecutive, and other senior management regularly attend its meetings. TheCommittee carries out its business following an agreed annual cycle ofmeetings and topics for consideration.
The members of the Committee are all independent in accordance with theindependence policy adopted by the board.
2014 activitiesIn 2014 the Committee:
– Reviewed key risks associated with process safety and communities andsocial performance, and management’s plans for tackling them;
– Reviewed work plans formulated for health, safety, environment,communities and employment practices, and assurance over selectedareas within the Committee’s terms of reference;
– Undertook reviews around major risk areas, including mine closures andlegacy matters and energy, environment and climate change;
– Received updates on findings following the pit wall slide at BinghamCanyon and the fatality at Gove; and
– Considered the findings from the 2013 evaluation of the Committee’sperformance and implemented the recommendations.
We draw to your attention the Sustainable development report on pages 20 to26 of this report.
Remuneration CommitteeMembers of the Committee are John Varley (chairman), Jan du Plessis,Michael Fitzpatrick, Richard Goodmanson and Paul Tellier.
Key responsibilitiesThe Remuneration Committee assists the board with fulfilling its oversightresponsibility to shareholders. In particular, the Committee seeks to spendcompensation resource fairly and responsibly to ensure that remunerationpolicy and practices are properly linked to corporate and individual performanceand to the delivery of the Group’s strategy on behalf of our owners. TheCommittee’s terms of reference are available to view on the website.
The report of the Remuneration Committee on pages 64 to 100 has beenrecommended by the Committee for approval by the board, and was approvedby the board on 4 March 2015. On page 75 we have included sections dealingwith the responsibilities of the Remuneration Committee and how it spent itstime in 2014.
Governance processesThe Committee met nine times in 2014, including three ad hoc meetingscalled at short notice. The Committee carries out its business following anagreed annual cycle of meetings and topics for consideration.
In addition to the matters noted on page 75, the Committee considered thefindings from the 2013 external evaluation of the Committee’s performance. Inearly 2015, the Committee considered the findings from the 2014 evaluationof the Committee’s performance.
As set out in the Committee chairman’s annual statement on pages 64 to 65,we are committed to a continuing dialogue with our owners.
Chairman’s CommitteeMembers of the Committee are Jan du Plessis (chairman), Sam Walsh andChris Lynch.
Key responsibilitiesThe Committee acts on behalf of the board between scheduled boardmeetings either in accordance with authority delegated by the board or asspecifically set out within its terms of reference. It supports the functioning ofthe board and ensures that the business of the board and its committees isproperly planned and aligned with management. When mandated by theboard, the Chairman’s Committee will consider urgent matters between boardmeetings, and deals with the implementation of board decisions ontransactions and other corporate matters. Other than for the chairman of theboard, the Committee performs the annual review of non-executive directors’fees and makes a recommendation to the board.
Nominations CommitteeMembers of the Committee comprise Jan du Plessis (chairman) and allnon-executive directors.
Key responsibilitiesThe Committee is responsible, on behalf of the board, for regularly assessingthe balance of executive and non-executive directors and the composition ofthe board in terms of the diversity and capacity required to oversee thedelivery of Rio Tinto’s strategy.
The Committee develops and agrees in advance the desired profiles ofpotential candidates for board membership. It oversees the recruitmentprocess and engages external search consultants to manage searches on itsbehalf, including constructing shortlists comprising candidates from diversebackgrounds. Following a final review of shortlisted candidates, the Committeemakes recommendations for new board members to the board for approval.
The Committee engages Egon Zehnder from time to time. Egon Zehnderconducts searches for a number of Rio Tinto positions and not only at boardand Executive Committee level. Egon Zehnder has no other connection withthe Company.
On behalf of the board, the Committee also reviews proposals forappointments to the Executive Committee and monitors executivesuccession planning.
The Committee’s terms of reference are available to view on the website.
riotinto.com 59
STRATEG
ICREPO
RT
DIR
EC
TO
RS
’R
EP
OR
T:
CORPORATEGOVERNANCE
FINANCIA
LSTA
TEMEN
TSPR
ODUCTIO
N,R
ESERVES
ANDOPER
ATIO
NS
ADDITIO
NALINFO
RMATIO
N
For
per
sona
l use
onl
y

Corporate governance continued
Governance processesThe Committee meets as required and in 2014, met five times. The membersof the Committee are independent in accordance with the independencepolicy adopted by the board.
The Committee in its proceedings takes account of the Group’s Diversity &Inclusion policy and progress in the diversity and inclusion arena, discussedfurther below.
In 2014, the Committee:
– Continued regular executive and non-executive succession planning reviews.
– Considered the findings from the 2013 evaluation of the Committee’sperformance and supported the recommended actions.
– Reviewed the mix of skills required for non-executive directors and briefedthe search firm accordingly.
– Recommended to the board the appointment of Michael L’Estrange andMegan Clark as non-executive directors.
– Received and considered a leadership assessment and development reporton senior management talent from Egon Zehnder, and discussed the samewith them.
– Considered, under the direction of John Varley, as senior independentdirector, the chairman’s appointment as non-executive director andchairman-designate of SABMiller plc, and its impact on his commitmentto Rio Tinto.
– Considered and recommended the appointment of Alfredo Barrios asAluminium product group chief executive.
– Reviewed the proposal to amend the service contracts of the chiefexecutive and chief financial officer to twelve months’ notice.
In 2015, the Committee will continue its regular executive and non-executivesuccession planning reviews. In early 2015, the Committee considered thefindings from the 2014 evaluation of the Committee’s performance.
Board diversityMore information about the board’s process for the selection, appointmentand election of directors is available in the “Corporate governance” section ofthe website.
The Nominations Committee regularly reviews the structure, size andcomposition of the board.
In leading a global mining and metals company, the board seeks to continuallyevolve its membership by seeking non-executive directors with diverse andcomplementary skills and perspectives, as well as experience which reflectsthe geographic spread of the Group’s operations. Core skills required for non-executive membership of the board are maintained. These skills may,depending upon the circumstances, comprise international business, financialor public policy experience, strategic acumen or mining or metals industryexperience. The board aspires to increase other aspects of diversity, includinggender and nationality, of directors in order to bring a diversity of skills,experience and perspective to the governance of the Group. The boardrecognises that the evolution of the mix of skills and diversity is a long-termprocess and weighs the various factors relevant to board balance and diversitywhen vacancies arise.
In 2012 the board established two objectives relating to board diversity:
– The Nominations Committee will undertake a review of board diversity.
– For each director selection and appointment process, the external searchfirm supporting the Nominations Committee will put forward at least onecredible and suitably experienced female candidate.
These objectives were met in 2013 and 2014.
Diversity and inclusion
Our commitment to diversity and inclusionWe are a global company and, wherever we operate and across every part ofour business, we strive to create an inclusive culture in which difference isrecognised and valued. By bringing together men and women from diversebackgrounds and giving each person the opportunity to contribute theirskills, experience and perspectives, we believe that we are able to developthe best solutions to challenges and deliver sustainable value for Rio Tintoand its stakeholders.
The board received a presentation in 2014 on diversity and inclusion acrossthe whole Group.
What diversity and inclusion means for Rio Tinto– Embracing workforce diversity – age, gender, race, national or ethnic origin,
religion, language, political beliefs, sexual orientation, and physical ability.
– Valuing diversity of perspective – leveraging the diverse thinking, skills,experience and working styles of our employees and other stakeholders.
– Building a flexible organisation – providing opportunities for workarrangements that accommodate the diverse needs of individuals atdifferent career and life stages.
– Respecting stakeholder diversity – developing strong and sustainablerelationships with diverse shareholders, communities, employees,governments, customers and suppliers.
How we support diversity and inclusionWe use the following to drive action and build awareness about diversityand inclusion:
– Governance models
– Policies, practices and targets
– Leadership and cultural competence
– Stakeholder relationships
– Education and communication
We prioritise long and short-term programmes based on need and impact.
Read a summary of our Diversity and inclusion policy in the “Corporategovernance” section of our website.
Our current focusOur goal is to have a workforce that is representative of the countries andcommunities in which we operate. Currently, our focus is to improve therepresentation of women and of people from nationalities which are under-represented in our workforce, and to continue to build an inclusive culture inwhich all talent can thrive.
Some of the activities and initiatives relating to diversity that we undertookduring the year are:
– The development of executive-sponsored diversity and inclusion planswithin the product groups and geographies which align with business goalsand the Group Diversity and inclusion strategy, the aim being to increasethe diversity in our workforce at all levels and build a more inclusiveculture. Progress is evaluated each year by the Executive Committee andGroup Diversity Council and began in 2013.
– Embed diversity and inclusion scorecards to accompany the above planswith metrics in three areas:
1. Who we are (demographics)
2. How we behave (performance and development)
3. What we stand for (values)
to be applied across Rio Tinto to help baseline, trend and track progressas well as to address areas where we may be underperforming.
60 riotinto.com
For
per
sona
l use
onl
y

– Active involvement with Women in Mining groups, professional women’sassociations and other targeted recruiting efforts to raise awareness aboutRio Tinto and to increase the attraction, development and retention oftalented women wherever we operate.
– Expansion of our diversity champions network group to include additionalgeographies and operations, and the establishment of several newbusiness unit diversity councils and committees across Rio Tinto. Theseare increasing leadership engagement, cross-company collaboration, andthe sharing and replication of best practices.
– The expansion of training programmes aimed at countering unconsciousbias. These have targeted senior leaders, hiring managers and recruiters tohelp minimise the impact of bias in recruitment and developmentpractices, as well as to improve the cross-cultural interactions andrelationship-building needed to globalise our business.
– The continuation of a three-year commitment by the chairman tomentoring high-potential female board candidates through the FTSE100Cross-company Mentoring Programme.
The chief executive became the chairman of the Group Diversity Council inJanuary 2015.
Proportion of women employees and board membersIn 2014, the proportion of women on the board was 21.4 per cent (ie 3 outof 14), in senior management 15.5 per cent and in the overall workforce18.7 per cent.
Measurable objectives and progressWe established the following five-year measurable objectives for workforcediversity at the start of 2011.
Measurable objective Progress during 2014
Women to represent 20 per cent of oursenior management by 2015.
Women represented 15.5 per cent ofour senior management in 2014.
Women to represent 40 per cent of our2015 graduate intake.
Women represented 31.8 per cent ofour 2014 graduate intake.
15 per cent of our 2015 graduateintake to be nationals from regionswhere we are developingnew businesses.
17.8 per cent of our 2014 graduateintake were nationals from regionswhere we are developingnew businesses.
Subsidiary board diversityIn addition to the measurable objectives described above, women alsorepresented 10.6 per cent of the directors of our principal controlled subsidiaryundertakings during 2014 (15 female; 126 male).
Other disclosuresPolicies and standardsRio Tinto’s commitment to integrity is set out in our global code of businessconduct: The way we work. This contains principles and standards of conductwhich reaffirm the Group’s commitment to integrity. It is inspired by our fourcore values: respect, integrity, teamwork and accountability. It is available onthe website.
It is supported by a number of policies and standards. Core policies areadopted after wide consultation, externally and within the Group. Onceadopted, they are communicated to business units worldwide, together withrelated standards, guidance notes and resources to support implementation.Business unit management are required to devote the necessary effort toimplement and report on these policies and standards.
Rio Tinto policies and standards include policies on a variety of importanttopics. They apply to all Rio Tinto managed businesses. Where the Group doesnot have operating responsibility for a business, Rio Tinto’s policies andstandards are communicated to its business partners and they are encouragedto adopt similar policies of their own.
Rio Tinto employees are required to undertake training about therequirements of The way we work and other core policies.
“Whistleblowing” programmeThe board has adopted a confidential and independently operatedwhistleblowing programme called Speak-OUT. This offers an avenue whereemployees, contractors, suppliers and customers of Rio Tinto managed sitescan report concerns anonymously if they so choose, subject to local law. Thiscan include any significant concerns about the business, or behaviour ofindividuals, including suspicion of violations of financial reporting, safety orenvironmental procedures or business integrity issues generally. Theprogramme features web submission, a case management tool to bettermanage cases, and a reporting tool to allow for improved analysis of casestatistics and reporting. Rio Tinto is also looking at ways to increase thepositive awareness of Speak-OUT. The Audit Committee receives a reporttwice annually on Speak-OUT activity as does the Sustainability Committeewith regard to calls to Speak-OUT impacting sustainable development issues.
Dealing in Rio Tinto securitiesRio Tinto operates rules which restrict the dealing in Rio Tinto securities bydirectors and employees with access to “inside information”. These rulesrequire those people to seek clearance before any proposed dealing and placerestrictions on when some people can deal.
Communication with stakeholdersRio Tinto recognises the importance of effective timely communication withshareholders and the wider investment community.
The Disclosure Committee is responsible for determining whether informationrelating to Rio Tinto may require disclosure to the markets.
Rio Tinto makes immediate disclosure (unless an exemption applies allowing adelay) to the relevant listing authorities in accordance with their rules of anyinformation that a reasonable person would expect to have a material effect onits share price. All information released to the markets is posted on the Mediasection of the website.
In addition to statutory documents, Rio Tinto’s website features information oncorporate governance, and general investor information. Annual and half yearresults, as well as any major presentations, are webcast and the materials areavailable on the website. Presentation material from investor seminars is alsomade available on the website.
The annual general meetings present an opportunity to provide a summarybusiness presentation, to inform shareholders of recent developments and togive them the opportunity to ask questions. Generally, the chairs of all boardcommittees will be available to answer questions raised by shareholders and alldirectors are expected to attend where possible. In 2014 all of the directorsattended the annual general meetings. Rio Tinto’s external auditors, PwC,attend the annual general meetings and are available to answer questionsabout the conduct of the external audit and the preparation and content of theIndependent auditors’ report. Any questions received and answers providedahead of the annual general meetings are made available to shareholders, whoalso have the opportunity to meet informally with directors after the meetings.
The main channels of communication with the investment community arethrough the chairman, chief executive and chief financial officer, whohave regular meetings with the Companies’ major shareholders. Thesenior independent director has a specific responsibility to be available toshareholders who have concerns, and where contact with the chairman,chief executive or chief financial officer has failed to resolve their concerns,or for whom such contact is inappropriate. In his capacity as RemunerationCommittee chairman, the senior independent director meets shareholders todiscuss remuneration issues as described in his annual statement on pages64 to 65.
riotinto.com 61
STRATEG
ICREPO
RT
DIR
EC
TO
RS
’R
EP
OR
T:
CORPORATEGOVERNANCE
FINANCIA
LSTA
TEMEN
TSPR
ODUCTIO
N,R
ESERVES
ANDOPER
ATIO
NS
ADDITIO
NALINFO
RMATIO
N
For
per
sona
l use
onl
y

Corporate governance continued
During 2014, these meetings with the investment community focused on theissues of strategy, board succession, corporate governance, executiveremuneration, and the operational and financial performance of the Group.Regular investor seminars provide a two-way communication opportunity withinvestors and analysts. On 24 November 2014, a corporate governance forumwas hosted in Sydney to provide investors with an opportunity to engage withthe chairman and the chairs of the board committees. A similar event will beheld in London on 17 March 2015. Feedback from such engagement isroutinely communicated to the board. Surveys of major shareholders’ opinionsare presented to the board by the Group’s investor relations advisers on aregular basis.
Risk managementRio Tinto’s overriding objective is to generate attractive, sustainable returns toshareholders through a strategy of investing in long-life, low-cost, expandableoperations in the most attractive industry sectors. The directors recognise thatcreating shareholder return is the reward for taking and accepting risk.
A description of the principal risks and uncertainties that could affect Rio Tintois found on pages 14 to 17.
Risk policy and standardThe board recognises that risk is an integral component of the business andcarefully considers the level of risk it is prepared to tolerate. The Group fosters arisk-aware corporate culture in all decision-making, and is committed tomanaging all risk in a proactive and effective manner through competent riskmanagement that ensures that risks are managed within agreed thresholds. Tosupport this commitment, risk is analysed in order to inform the managementdecisions taken at all levels within the organisation. The principles of the riskanalysis are set out in the Risk policy which is on the website.
Risk approachThe Risk policy and standard is supported by an integrated framework of riskgovernance and reporting specifying how the Group organises the handling ofrisk. Together with the policy, the framework provides an ongoing process foridentifying, evaluating and managing the significant risks faced by the Group.Clear accountability for risk management is defined throughout the Group andis a key performance area of line managers.
To support risk understanding and management at all levels, the Group Riskfunction provides the necessary infrastructure, information collation for thesenior executive, and co-ordination between other risk-focused functions.Group Risk supports the Risk Management Committee in its review of risk.
Whilst the Audit Committee is responsible for oversight of the effectiveness ofthe Group’s risk management systems, the responsibility for identifying andmanaging risks rests with the chief executive and all of Rio Tinto’s managersand business leaders, who operate within a Group-wide framework thatensures that risks are managed within agreed thresholds.
Internal controlsThe directors are responsible for the Group’s system of internal controls andfor reviewing annually the effectiveness of the internal control system. Thisincludes reviewing financial, operational and compliance controls and riskmanagement procedures and their effectiveness. The directors havecompleted their annual review and assessment for 2014.
Internal control systemsTwo of the Group’s management committees, the Executive Committee andthe Disclosure Committee, regularly review reports related to the Group’scontrol framework in order to satisfy the internal control requirements of theCode, the ASX Principles, the NYSE Standards and section 404 of theSarbanes-Oxley Act 2002. The Group Audit & Assurance function performsreviews of the integrity and effectiveness of control activities and providesregular reports to the Audit Committee, Sustainability Committee and othermanagement committees.
Each year, the leaders of the Group’s businesses and functions complete arepresentation letter confirming that adequate internal controls are in place,are operating effectively and are designed to capture and evaluate failings andweaknesses, if any exist, and that action is taken promptly, as appropriate.
In 2014, information was reported by management to the Audit Committee toenable it to assess the effectiveness of the Company’s risk management andinternal control systems. In addition, as part of their role, the board and itscommittees routinely monitor the Group’s material business risks.
Due to the limitations inherent in any risk management system, the processfor identifying, evaluating and managing the material business risks isdesigned to manage, rather than eliminate, risk and to provide reasonable, butnot absolute assurance, against material misstatement or loss. Certain risks,for example natural disasters, cannot be managed to an acceptable degreeusing internal controls. Such major risks are transferred to third parties in theinternational insurance markets, to the extent considered appropriate. TheGroup has material investments in a number of jointly controlled entities andassociates. Where Rio Tinto does not have managerial control, it cannotguarantee that local management of mining and related assets will complywith Rio Tinto standards or objectives.
Auditors and internal assuranceExternal auditorsAs indicated in the report of the Audit Committee on pages 57 to 59, Rio Tintohas adopted policies designed to uphold the independence of the Group’sexternal auditors by prohibiting their engagement to provide other accountingand other professional services that might compromise their appointment asindependent auditors.
The engagement of the external auditors to provide statutory audit services,other services pursuant to legislation, taxation services, and certain otherservices is pre-approved. Any engagement of the external auditors to provideother permitted services is subject to the specific approval of the AuditCommittee or its chairman. For other services, because of their knowledge,experience and/or for reasons of confidentiality, it can be more efficient ornecessary to engage the external auditor rather than another party.
At half year and year end, the chief financial officer and the external auditorssubmit to the Audit Committee a schedule of the types of services that wereperformed during the period. The Audit Committee may impose a financiallimit on the total value of other permitted services that can be provided. Anynon-audit service provided by the external auditors, where the expected feeexceeds a pre-determined level, must be subject to the Group’s normaltender procedures.
In exceptional circumstances, the chief financial officer is authorised to engagethe external auditors to provide such services without going to tender, but ifthe fees are expected to exceed certain pre-determined limits then thechairman of the Audit Committee must give prior approval of the engagement.
Further information on audit and non-audit fees of the Group’s external auditorsis set out in note 39 to the financial statements and in the Directors’ report.
62 riotinto.com
For
per
sona
l use
onl
y

Group Audit & AssuranceGroup Audit & Assurance is an internal function which provides independentand objective assurance on the adequacy and effectiveness of the Group’ssystems for risk management, internal control and governance togetherwith recommendations to improve the effectiveness of the relevant systemsand processes. The function has an internal audit methodology which isaligned with international auditing standards set by the Institute of InternalAuditors (IIA).
The function operates independently of management, under a mandateapproved by the Audit Committee, and has full access to all functions, records,property and personnel of the Group. The head of Group Audit & Assuranceadministratively reports to the chief financial officer and has directcommunication lines with the chairs of both the Audit Committee andSustainability Committee and regularly attends their meetings.
A risk-based approach is used to focus assurance activities on high-risk areasand audit plans are presented annually to the Audit Committee andSustainability Committee for approval.
In respect of its internal audit function, Rio Tinto utilises the services ofexternal service providers. The function has a policy which addresses conflictsof interest in relation to engagements of the service provider that arerequested by management. The policy complies with the IIA’s standards onindependence. Certain services are pre-approved under the policy as theywould not be in conflict with the internal auditor’s role. There is a list ofprohibited services which may not be undertaken without approval of the headof Group Audit & Assurance, and guidance on the consideration of serviceswhich may give rise to a conflict of interest.
Financial reportingFinancial statementsThe directors are required to prepare financial statements for each financialperiod which give a true and fair view of the state of affairs of the Group as atthe end of the financial period, and the profit or loss and cash flows for thatperiod. This includes preparing financial statements in accordance with UKcompany law which give a true and fair view of the state of the company’saffairs, and preparing a Remuneration report which includes the informationrequired by Regulation 11, Schedule 8 of the Large and Medium SizedCompanies and Groups (Accounts and Reports) Regulations 2008 and theAustralian Corporations Act 2001.
In addition, the Code requires that the board provides a fair, balanced andunderstandable assessment of the company’s position and prospects in itsexternal reporting. The directors were responsible for the preparation andapproval of the Annual report for the year ended 31 December 2014. Theyconsider the Annual report, taken as a whole, to be fair, balanced andunderstandable, and provides the information necessary for shareholders toassess the company’s performance, business model and strategy.
The directors are responsible for maintaining proper accounting records, inaccordance with UK and Australian legislation. They have a generalresponsibility for taking such steps as are reasonably open to them tosafeguard the assets of the Group, and to prevent and detect fraud and otherirregularities. The directors are also responsible for ensuring that appropriatesystems are in place to maintain and preserve the integrity of the Group’swebsite. Legislation in the UK governing the preparation and dissemination offinancial statements may differ from current and future legislation in otherjurisdictions. The work carried out by the auditors does not involveconsideration of such developments and, accordingly, the external auditorsaccept no responsibility for any changes, should any be made, to the financialstatements after they are made available on the website.
The directors, senior executives, senior financial managers and othermembers of staff who are required to exercise judgment in the course of thepreparation of the financial statements are required to conduct themselveswith integrity and honesty and in accordance with the ethical standards oftheir profession and the business.
The directors consider that the 2014 Annual report presents a true and fairview and has been prepared in accordance with applicable accountingstandards, using the most appropriate accounting policies for Rio Tinto’sbusiness, and supported by reasonable judgments and estimates. Theaccounting policies have been consistently applied. The directors havereceived a written statement from the chief executive and the chief financialofficer to this effect. In accordance with the internal control requirements ofthe Code and the ASX Principles Recommendation 7.3, this writtenstatement confirms that the declarations in the statement are founded on asound system of risk management and internal controls, and that thesystem is operating effectively in all material respects in relation to financialreporting risks.
Disclosure controls and proceduresThe Group maintains disclosure controls and procedures as such term isdefined in US Exchange Act Rule 13a-15(e). Management, with theparticipation of the chief executive and chief financial officer, has evaluated theeffectiveness of the design and operation of the Group’s disclosure controlsand procedures pursuant to Exchange Act Rule 13a-15(b) as of the end of theperiod covered by this report and has concluded that these disclosure controlsand procedures were effective at a reasonable assurance level.
Management’s report on internal control over financial reportingThe management of Rio Tinto plc and Rio Tinto Limited is responsible forestablishing and maintaining adequate internal control over financialreporting. The companies’ internal control over financial reporting is a processdesigned under the supervision of their common chief executive and chieffinancial officer to provide reasonable assurance regarding the reliability offinancial reporting and the preparation and fair presentation of the Group’spublished financial statements for external reporting purposes in accordancewith International Financial Reporting Standards (IFRS).
The Group’s internal control over financial reporting includes policies andprocedures that pertain to the maintenance of records that, in reasonabledetail, accurately and fairly reflect transactions and dispositions of assets;provide reasonable assurances that transactions are recorded as necessary topermit preparation of financial statements in accordance with IFRS, and thatreceipts and expenditures are being made only in accordance withauthorisations of management and directors of each of the Companies; andprovide reasonable assurance regarding prevention or timely detection ofunauthorised acquisition, use or disposition of the Group’s assets that couldhave a material effect on our financial statements.
Due to inherent limitations, internal control over financial reporting cannotprovide absolute assurance, and may not prevent or detect all misstatementswhether caused by error or fraud, if any, within each of Rio Tinto plc andRio Tinto Limited.
Management conducted an assessment of the effectiveness of internal controlover financial reporting as of 31 December 2014, based on the Internal Control– Integrated Framework issued by the Committee of Sponsoring Organizationsof the Treadway Commission (COSO) issued in 2013, and concluded that itwas effective.
There were no changes in the internal controls over financial reporting thatoccurred during the period that have materially affected, or are reasonablylikely to materially affect, the internal controls over financial reporting of eachof Rio Tinto plc and Rio Tinto Limited.
riotinto.com 63
STRATEG
ICREPO
RT
DIR
EC
TO
RS
’R
EP
OR
T:
CORPORATEGOVERNANCE
FINANCIA
LSTA
TEMEN
TSPR
ODUCTIO
N,R
ESERVES
ANDOPER
ATIO
NS
ADDITIO
NALINFO
RMATIO
N
For
per
sona
l use
onl
y

Remuneration Report: Annual statement by the RemunerationCommittee chairmanDear shareholdersOn behalf of the board, I am pleased to introduce our 2014 directors’remuneration report (the Remuneration Report), for which we seek yoursupport at our annual general meetings (AGMs), in London in April, and inPerth in May.
The Remuneration Report is designed to demonstrate the link between ourGroup’s strategy, its performance, and the remuneration outcomes for ourexecutives, particularly the executive directors.
With a view to delivering sustainable returns to shareholders over time,Rio Tinto takes a long-term approach to its activities, and this meansconcentrating on developing long-life, low-cost, expandable operations thatare capable of providing competitive returns throughout business cycles. Ourexecutives’ performance objectives are set accordingly.
The Remuneration Report has been prepared in accordance with applicablelegislation and corporate governance guidance in the UK and Australia.Australian legislation requires disclosures in respect of “key managementpersonnel”, being those persons having authority and responsibility forplanning, directing and controlling the activities of the Group. The keymanagement personnel are, in addition to the directors, the non-directormembers of the Executive Committee. The Executive Committee comprisesthe executive directors, product group chief executive officers and Groupexecutives. Throughout this Remuneration Report, the members of theExecutive Committee are collectively referred to as “executives”. They arelisted on pages 49 and 52, which also show the positions held during the yearand dates of appointment.
Shareholders will be aware that we have to comply with UK and Australianlegislation in the remuneration arena and that the rules are different. We havestructured the voting arrangements such that all shareholders vote on allthree resolutions that we are putting to our AGMs.
This Remuneration Report is divided into two parts: the statement ofremuneration policy, which summarises our compensation policies andpractices (the Remuneration Policy); and the annual report on remuneration,which shows how the Remuneration Policy has been applied (theImplementation Report).
The Remuneration Policy is once again subject to a binding vote at our 2015AGMs for UK law purposes. The Implementation Report (including thisstatement) is subject to an advisory vote for UK law purposes. TheRemuneration Report as a whole is subject to an advisory vote at the 2015AGMs for Australian law purposes.
For the purposes of UK regulations on remuneration reporting, theRemuneration Policy will, if the resolution is passed, become effective inrespect of payments to directors from the date of the second of our AGMs(7 May 2015).
The board presented to shareholders a policy for the remuneration of itsdirectors for the first time at the 2014 AGMs. Following approval at the 2014AGMs, the Remuneration Policy, for the purposes of the UK regulations,became effective in respect of payments to directors from 8 May 2014. Whilethe board intended the Remuneration Policy put to shareholders at the 2014AGMs to apply for three years, it has taken the decision to present you with anupdated Remuneration Policy, which will be subject to a binding vote at the2015 AGMs. This is because the board has decided to seek approval for theproposed change to the contractual notice periods for the chief executive andthe chief financial officer announced, subject to shareholder consent, on23 October 2014 by way of an update to the Remuneration Policy.
Furthermore, the board has decided to update the risk management sectionof the Report to incorporate its policy relating to malus and claw back forperformance related payments. Both sections (being the only sectionscontaining material changes to the Remuneration Policy) are identified initalics in this Report. Other minor clarification and contextual changes havebeen made to reflect the revised Remuneration Policy becoming effective in2015, but these are not marked. A version that shows the comparisonsbetween our 2013 and 2014 Policy Reports is, however, available on thecompany’s website at riotinto.com.
In the absence of circumstances which may necessitate a change to theRemuneration Policy, it is our intention that the Policy will next be put beforeshareholders for a vote at our AGMs in 2018. The contextual changes referredto above are designed to avoid the need to update the Remuneration Policybefore then.
Although, as a matter of UK law, the Remuneration Policy only applies to theremuneration of our directors, it is the Committee’s intention that the broadpolicy principles will continue to inform the way in which our non-director keymanagement personnel on the Executive Committee are remunerated.
The Remuneration Policy describes among other things: our executiveremuneration structure; the details of the discretions available to theCommittee; our approach to remuneration on recruitment; the details ofexecutives’ service contracts; and how we treat leavers.
Remuneration for executives comprises fixed compensation in the form ofbase salary, participation in a pension plan, superannuation fund and/or a cashallowance to contribute to a pension fund, the receipt of certain benefits, andperformance-related remuneration. Each element is described in theRemuneration Policy.
The majority of the remuneration of executives will normally be performance-related, and is provided in the form of variable short and long-term incentives.
In relation to the short-term incentive plan (STIP), the Committee each yearsets performance criteria relative to three benchmarks: threshold, target andoutstanding. Target performance is intended to be stretching, and is typicallyequivalent to budget for the year.
I want to remind you of our policy relating to the disclosure of measures,weightings and targets. In relation to the long-term incentive plan (LTIP),these will all be disclosed in advance, at the beginning of each five-yearperformance period. In relation to the STIP, we will, when it comes todisclosure, distinguish between safety, financial and individual goals. In thearea of safety goals, we have disclosed and will continue to disclose themeasures, weightings and targets at the beginning of each year. In the area offinancial and individual goals, we have disclosed, and will continue to disclose,at the beginning of each year, the measures and weightings only, because weregard the targets as commercially sensitive. However, as we said in theRemuneration Report last year, we intended to disclose, and have in thisImplementation Report disclosed, the targets and outcomes for 2014retrospectively. In the rare instances where this may not be prudent ongrounds of commercial sensitivity, I will seek to explain why and give anindication of when they would be disclosed.
The chart on page 85 demonstrates the usual timeframe for the delivery of thecomponents of remuneration, using 2014 as an example. This emphasises thelong-term nature of our remuneration arrangements.
64 riotinto.com
For
per
sona
l use
onl
y

You will see several mechanisms in the Remuneration Report that areintended to create alignment of interest between shareholders and executives.We have, for our executives, a mandatory conversion of 50 per cent of anyannual short-term bonus payment into shares, with vesting deferred for threeyears. The performance measures under our long-term remuneration plansare structured to support and incentivise the creation of long-termshareholder value. In addition, should circumstances warrant, we havereserved to the Committee such discretions as enable it to safeguard againstthe return experience of shareholders being materially misaligned with thereward experience of executives. We want the remuneration outcomesproperly to reflect the Group’s overall performance. We also have meaningfulshare ownership requirements for our executives as described in theImplementation Report.
There are many examples in the Remuneration Policy and practice of how ourdialogue with shareholders has influenced the Committee’s decisions. In 2013,we added a new performance measure to our Performance Share Plan (PSP),namely the relative EBIT margin improvement measure. We did this becausemany of our owners had expressed a wish that our PSP should incorporatesome diversification beyond total shareholder return (TSR). We extended theperformance period of the PSP from four to five years and have materiallyreduced the pay-out for threshold performance. We have ceased using shareoptions as a mechanism for long-term reward. We adjusted our safetymeasures in our STIP targets to reflect lost time injuries and all injuryfrequency rates. Meanwhile, as you will see in the Implementation Report, ourdecisions relating to base pay changes for executive directors and executivesare now broadly guided by pay changes for the wider employee population.
2014 performance and remunerationIn terms of STIP for 2014, the Committee determined that the underlying“unflexed” earnings target set by the board had not been met. However, the“unflexed” free cash flow target and “flexed” earnings and free cash flowtargets have been exceeded. “Flexed” targets are designed to take intoaccount the impact of uncontrollable fluctuations in exchange rates, quotedmetals and other prices during the year, and as such may be higher or (as wasthe case in 2014 – a year in which many commodity prices fell sharply) lowerthan “unflexed” targets set by the board. This is reflected in the financialcomponent of the STIP awards at Group and product group level.
Disappointingly, the Group did not attain its goal of zero fatalities. However,the Group’s all injury frequency rate reduced from 0.65 in 2013 to an all-timelow of 0.59 in 2014, bettering the Group target of 0.61. This has led to a totalsafety score for the Group, excluding the impact of fatalities, of 138 per centout of a maximum of 200 per cent. Reductions have been applied as requiredfor executives with portfolios where a fatality has occurred.
The net effect of these outcomes, also taking into account the achievement ofindividual objectives, is that STIP awards for Executive Committee membershave been made in a range from at or about target to above target levels.
The Committee considered the Group’s overall performance in the context ofthe LTIP awards that were due to vest at the end of 2014. These were the 2011award under the PSP, which had an indicative vesting of 73.5 per cent of facevalue, and the 2012 grant under the Share Option Plan, which has anindicative vesting of 100 per cent of face value. The Committee concluded thatthe vesting of awards, based upon the achievement of the TSR measures, wasjustified.
As previously announced, Jacynthe Côté, chief executive of the Aluminiumgroup, left the Group on 1 September. The details of her departure terms aresummarised on page 84.
2015 decisionsThe Committee has reviewed the base salary levels for executives and, for theexecutive directors and the majority of the Executive Committee, madeadjustments in line with the base salary budgets applying to the broaderemployee population.
The base salary increases for Alan Davies and Jean-Sebastien Jacques arespecific adjustments which reflect the additional responsibilities and broaderportfolios transferred to them from the former Energy product groupannounced on 27 February 2015. Details are set out on page 82 of theImplementation Report.
The quantum of LTIP awards to be granted to executives in March 2015 isbroadly similar to those made in 2014.
Safety, cost and capital expenditure reductions, and cash flow managementwill continue to feature prominently in the individual objectives for executivesin 2015.
Further details are provided in the Implementation Report.
Governance and owners’ viewsIt has been and continues to be our intention to be alert to evolving bestpractice and to the views and guidance given to us in the conversations wehave with our owners.
We are committed to a continuing dialogue with shareholders, includinglistening to their views about this report, which are most welcome.
Yours sincerely,
John VarleyRemuneration Committee chairman
riotinto.com 65
STRATEG
ICREPO
RT
DIR
EC
TO
RS
’R
EP
OR
T:
REMUNERATIONREPORT:
LETTERFR
OMCH
AIRMAN
FINANCIA
LSTA
TEMEN
TSPR
ODUCTIO
N,R
ESERVES
ANDOPER
ATIO
NS
ADDITIO
NALINFO
RMATIO
N
For
per
sona
l use
onl
y

Remuneration Report: Remuneration Policy
Remuneration Policy introductionThis Remuneration Policy applies to our executive and non-executive directorsand to the chairman. It also sets out, in conformance with Australian law, thebroad policy principles which generally apply to the non-director members ofthe Executive Committee. The policy applying to our chairman and non-executive directors is set out at the end of the Remuneration Policy.
Shareholders should note that this Remuneration Policy is binding only in sofar as it relates to directors.
Our remuneration policies, principles and practicesOur first objective is to spend remuneration resource wisely in pursuit ofthe implementation of the Group’s strategy. We want our pay policies tobe regarded as fair by shareholders and employees alike. Although wehave remuneration structures which are fit for purpose, the Committeeretains appropriate discretions, enabling it, if it thinks fit, to overrideinappropriate mechanistic outcomes, but always within the confines of theRemuneration Policy.
Rio Tinto operates in global and local markets where it competes for a limitedpool of talented executives. High-quality people, who are capable of achievingstretching performance targets, are essential to generating superior returnsfor the Group. Our compensation strategies aim to provide this support byenabling the Group to attract and retain people whose contribution willincrease shareholder value over time.
We aim to engage our people over the long term by fostering diversity,providing challenging work and development opportunities, and encouragingstrong delivery by good performance. This people strategy is underpinned byour values of respect, integrity, teamwork and accountability and by ourcommitment to provide sustainable growth and development for bothRio Tinto and its employees.
Our policy is based on the principle of aligning remuneration outcomes with thesuccessful delivery of strategy. The remuneration strategy and the policies whichsupport it, together with a description of how we believe they will help Rio Tintoachieve its vision, are set out below and under the heading “Executiveremuneration structure – policy table”. Complementary remuneration structuresare designed for other employees, drawing on these strategies and policies.
Competitive, performance-related, remunerationWe aim to provide competitive rewards that attract, retain and motivateexecutives of the high calibre required to lead the Group, while ensuring thatrewards remain appropriate and proportionate when compared both to marketpractice and to remuneration arrangements for other employees in the Group.
– The majority of remuneration is linked to demanding performance targetsover both the short and long term to ensure that executive rewards aredirected at delivering good performance for shareholders.
– For the purposes of assessing the appropriate level of executiveremuneration, the Committee refers to the FTSE30 (excluding financialservices companies) as the initial comparator group. The FTSE30 isconsidered the most relevant comparator group as it largely comprisesorganisations broadly comparable to the Group in terms of global reach,revenue, market capitalisation and complexity. References are also madeto other relevant supplementary comparator groups, including a cross-section of comparable international industrial organisations and otherinternational mining companies.
– Typically we aim to position base salaries at the median of thesecomparator groups, while our incentive plans are designed with thepotential to deliver total remuneration outcomes across the full marketrange according to business and individual performance.
– Benchmarking is undertaken periodically, but not annually, and ourintention is to apply judgment in evaluating market data. We will takesalary increases in the broader employee population into account indetermining any change to the base pay of executives. We normally usethree-year average exchange rates, in order to mitigate the impact ofexchange rate volatility, to help determine the appropriate positioning ofexecutive remuneration against internal and external comparators.
– We regularly consult with shareholders on the design of our policies andprogrammes, most recently on the subjects of the safety measurecomponent of the STIP, the ceasing of the use of share options as amechanism for long-term reward, and the performance conditions and theperformance period for the Performance Share Plan (PSP).
– Employee share plans provide the opportunity for employees to participatein the voting on executive remuneration. Employees who are shareholders– 25 per cent of the workforce at the date of this report – are able to voteon the Remuneration Report. Employees have not been consulted on theRemuneration Policy but are free to ask any questions they wish and tooffer any opinions they have through our normal employeecommunications channels.
SafetyWe have a strong focus on safety in the STIP targets.
– As an organisation, we strive for superior long-term shareholder valuecreation in a healthy, safe and environmentally appropriate way. These areimportant elements of our licence to operate.
– Safety key performance indicators determine a significant portion of theSTIP for executives.
– Any fatality will have a material impact on the STIP score for the relevantexecutives. Further details on the approach to fatalities are provided in theImplementation Report.
66 riotinto.com
For
per
sona
l use
onl
y
Long-term focusConsistent with our strategy of investing in and operating long-life, low-cost,expandable operations in the most attractive industry sectors, we seek toprovide incentive plans that focus on longer-term performance.
– Our incentive plans are designed to promote and reward decision-makingwith a positive long-term impact while avoiding excessive risk.
– Fifty per cent of the STIP for executives is deferred into shares which vestafter three years, through the Bonus Deferral Plan (BDP).
– The performance-based options and shares awarded prior to 2013 have athree and four-year performance period, respectively. The performanceperiod for performance shares awarded under the PSP from 2013 is fiveyears. However, as a transitional measure, awards granted in 2013 willpotentially vest 50 per cent after four years and 50 per cent after five years.
– Options are no longer granted, but existing options may be exercised(subject to their vesting conditions) up to ten years after their grant.
– The Committee intends to keep the Group’s long-term incentivearrangements under review.
Shareholder alignmentOur share ownership policy requires executives to build up and maintain ameaningful shareholding as described in the Implementation Report under theheading “Share ownership policy for executives”.
We reward executives for delivering shareholder value by using relative TSR asone of the measures for our LTIP.
– For awards granted from 2013 under the PSP, a relative EBIT marginimprovement measure has complemented the existing relative TSRmeasures, and incentivises executives to deliver long-term shareholdervalue while maximising operational performance in the medium term. Thiscomprises one-third of the total value opportunity under the PSP awards.
– The reward opportunity under the remaining portion of the PSP awards isdelivered based on relative TSR performance against both the HSBCGlobal Mining Index and the broader market of large global companies asmeasured through the Morgan Stanley Capital World Index (MSCI).
– The choice of both the HSBC Global Mining Index and MSCI reflects thefact that Rio Tinto competes in a global market for investors as well aswithin the mining sector, and is consistent with rewarding executives forproviding stable returns over the long term relative to the broader marketand the mining sector.
Risk management – Malus and claw back(a)
The Committee has authority under the “malus” provisions of the PSP toreduce or cancel awards made from 2013 in the event of gross misconductwhich may have a material effect on the value or reputation of the Group, amaterially adverse error in the Group’s or a product group’s financialstatements, exceptional events that have a materially detrimental impacton the value of any Group company, or for any other reason that theCommittee decides in a particular case.
The Committee also has authority under the “claw back” provisions of thePSP to recover the value of any vested awards made from 2013 in the event ofdeliberate misconduct by a participant that may have a material impact on thevalue or reputation of a Rio Tinto Group company or for any other reason thatthe directors decide in a particular case.
Malus and claw back can be applied by the Committee in relation to the STIPand its deferral into BDP. The Committee evaluates the outcomes of the STIPfor fairness with the original targets and with shareholder experience, and maymake discretionary adjustments for executives using “malus” principles asnecessary. Any such adjustments are disclosed in the Implementation Reportfor the relevant financial period.
The Committee retains discretion with respect to the vesting of BDP awardsmade from 2013 onwards prior to their vesting dates, such that if an executiveresigns or is dismissed for misconduct, or for any other reason that theCommittee decides in the event of an executive terminating theiremployment, BDP awards may be “clawed back” and consequently lapse.
The Committee reserves rights to exercise discretions more generally asdescribed under the heading “Discretions”.
(a) Material changes to the Remuneration Policy, such as those relating to malus andclaw back below, are identified in italics in this Report.
Executive remuneration structure – policy tableThe Committee seeks to achieve a remuneration mix which best reflects thelong-term nature of the business. The total remuneration package is thereforedesigned to provide an appropriate balance between fixed and variablecomponents, with an emphasis on long-term variable pay. The remunerationstructure for executives, including the relationship between each element ofremuneration and Group performance, is summarised below. Further detailson the key performance indicators used to assess Group performance areprovided in the Strategic report under the heading “Key performanceindicators”. Shareholders should note that the following remunerationstructure is binding only in so far as it relates to directors.
Any commitment made before this Remuneration Policy takes effect or beforean executive became or becomes a director will be honoured even if it is notconsistent with this Remuneration Policy or any subsequent policy.
Remuneration arrangements – Fixed Link to Group performance and strategy
Base salary – Base salary provides the main fixed element of the remuneration package.
– Base salaries are reviewed annually, with amaximum increase of nine per cent, orinflation if higher, per annum. An increasemay be higher than this for executiveswho are not directors in the circumstances described below.
– Any increase is generally aligned with the average base salary increasesapplying to the broader employee population unless there were significantchanges to an individual’s role and/or responsibilities during the year. Anyincreases are determined with reference to underlying Group and individualperformance, global economic conditions, role responsibilities, anassessment against relevant comparator groups and internal relativities.
– An increase above the maximum noted above for executives who are notdirectors may be made in the event of internal promotion or increase inresponsibility or where the executive’s salary is significantly belowmarket positioning.
– We pay competitive salaries to hire,motivate and retain highlycompetent people.
– Benchmarking is undertaken periodically but not annually, and our intentionis to apply judgment in evaluating market data.
riotinto.com 67
STRATEG
ICREPO
RT
DIR
EC
TO
RS
’R
EP
OR
T:
REMUNERATIONREPORT:
POLICY
REPO
RT
FINANCIA
LSTA
TEMEN
TSPR
ODUCTIO
N,R
ESERVES
ANDOPER
ATIO
NS
ADDITIO
NALINFO
RMATIO
N
For
per
sona
l use
onl
y

Remuneration Report: Remuneration Policy continued
Remuneration arrangements – Fixed Link to Group performance and strategy
Pension orsuperannuation
– Employment benefits typically include participation in a pension plan,superannuation fund, or a cash allowance to contribute to a personal pension orsuperannuation fund.
– We provide locally competitive post-employment benefits in a cost-efficientmanner in order to hire and retain.
– The maximum level of Company contribution to an individual executive director’sschemes annually is 35 per cent of base salary.
Other benefits – Other benefits include private healthcare cover for the executive and theirdependants, company car or allowance, car parking, life insurance, accidentinsurance, provision of Company-provided transport/chauffeur, professional advice,participation in local flexible benefit programmes and certain other minor benefits(including modest retirement gifts in applicable circumstances, occasional spousetravel in support of the business and any Rio Tinto business expenses which aredeemed to be taxable where the Company has paid the tax on their behalf).
– We provide competitive other benefitsin a cost-efficient manner to hire andretain.
– Secondment, relocation and localisation benefits (for example, housing, taxequalisation, cost of living allowance, the payment of school fees, periodic visitshome for the executive and their family and where relevant, localisation payments)may also be made to and on behalf of executives living outside their home country.Examples of these types of payments are set out in the Implementation Report.
– Other benefits are paid at cost and, given the nature and variety of the items, thereis no formal maximum level of Company contribution.
Remuneration arrangements – Performance-related (At risk)
Short Term IncentivePlan (STIP)
– If target performance is achieved under the STIP, the bonus opportunity is up to120 per cent of base salary for executive directors and up to 100 per cent of basesalary for other executives. The award for achieving threshold performance is 50 percent of the target bonus opportunity and the maximum bonus award foroutstanding performance is 200 per cent of base salary. These percentages, withthe exception of the maximum percentage, are subject to the exercise of discretionby the Committee.
– STIP focuses participants on achievingdemanding annual performance goals,which are based on the Group’s KPIs, inpursuit of the creation of sustainableshareholder value.
– We demand that sustainable businesspractices are adhered to, particularly inthe context of safety.
– When reviewing the outcome of theawards under the STIP the Committeewill, when evaluating overall safety,financial, Group and individualperformance, consider the overallfairness against original expectations andshareholder experience.
– Any discretionary adjustments fordirectors will be disclosed in theImplementation Report for the financialperiod.
– A scorecard of key performance indicators (KPIs) is established for each executiveat the commencement of the financial year. The measures and the relativeweightings are selected by the Committee in order to drive business performancefor the current year, including the achievement of financial, safety and otherindividual business outcomes that are priorities for the financial year in question.
– The measures, weightings and targets are reviewed annually and are includedeither prospectively or retrospectively each year in the Implementation Report. TheCommittee retains flexibility to determine the measures, weightings and targets asappropriate, based on the outcomes of its annual review.
– We expect to disclose the measures, weightings and targets for safety goals at thebeginning of each year. In the area of financial and individual goals, we will, at thebeginning of each year, disclose the measures and weightings only, because weregard the targets as commercially sensitive. However, we intend to disclose targetsand outcomes retrospectively. In the rare instances where this may not be prudenton grounds of commercial sensitivity, we will seek to explain why, and give anindication of when they will be disclosed.
– Threshold, target and outstanding performance levels are established for all STIPmeasures to help drive high levels of business and individual performance.
– The central case or “base” plan delivers what the board considers to be targetperformance. Target performance is intended to be stretching. Probability factorsare then applied, based upon a range of potential operating and cost scenarios, toestablish the threshold and outstanding performance levels. These threshold(below target), target, and outstanding (above target) levels are determined by theCommittee at the beginning of each performance year.
– The Committee seeks to ensure, in making its year-end determination of STIPawards, that actual performance is directly comparable to the targets set at thebeginning of the year. This sometimes results in adjustments to the targets beingmade by the Committee (in particular to take account of events outsidemanagement’s control), to ensure a like-for-like comparison. Both upward anddownward adjustments can be made, with reference to principles agreed by theCommittee, to ensure the outcomes are fair.
– Safety KPIs comprise a significant portion of the STIP for executives, and any fatalitywill have a material impact on the STIP score for the relevant executives.
Bonus Deferral Plan(BDP)
– Fifty per cent of the STIP is delivered in deferred shares under the BDP, with theremainder delivered in cash.
– The BDP ensures ongoing alignmentbetween executives and shareholdersthrough deferral of 50 per cent of STIPawards into Rio Tinto shares.
68 riotinto.com
For
per
sona
l use
onl
y
Remuneration arrangements – Performance-related (At risk) Link to Group performance and strategy
– The BDP vests in the December of the third year after the end of performance yearto which it relates.
– The number of BDP shares which are awarded is increased by reference to thedividends paid in the deferral period before vesting.
– BDP shares vest on a change of control.
Performance SharePlan (PSP)
– A new plan was approved by shareholders at the 2013 AGMs.
– Awards under the new PSP have a maximum face value of 438 per cent of basesalary (ignoring dividend equivalents as described below).
– The awards have been calculated independently by our consultants (TowersWatson since 1 August 2013 and Deloitte LLP previously) to have an expected valueof approximately 50 per cent of face value. Expected value is face value adjusted forthe probability of the performance target being met.
– Threshold performance, as explained in the Implementation Report, would result inthe vesting of 22.5 per cent of the face value of an award.
– The maximum expected value that can be awarded under the PSP is 219 per cent ofbase salary (ie 438 per cent x 50 per cent). The threshold value is a maximum of98.6 per cent of base salary (ie 438 per cent x 22.5 per cent).
– Actual award levels may vary for each executive and are included in theImplementation Report.
– Conditional share awards vest subject to the achievement of stretchingperformance conditions, comparing Rio Tinto’s performance against:– One-third: TSR relative to the HSBC Global Mining Index;– One-third: TSR relative to the Morgan Stanley Capital World Index (MSCI); and– One-third: improvement in EBIT margin relative to the global mining
comparators which will be listed in the Implementation Report each year.
– Each component of the award will be assessed independently. Details of the TSRand EBIT margin measures (targets and vesting schedules) will be set out in theImplementation Report each year. With respect to the EBIT margin measure, inorder to ensure that outcomes are fair and that business performance has beenappropriately taken into account, the Committee will consider, on a discretionarybasis, any specific, significant, unusual, “below the line” items (eg impairments)reported by Rio Tinto or its peers during the performance period to ensure genuinecomparability when determining any level of vesting indicated by third-party data.The application of any such discretion will be disclosed.
– The outperformance required for maximum vesting under all components of theaward is considered by the Committee to be very stretching.
– If, but only if, vesting is achieved, participants in the PSP shall be entitled to receivea number of additional shares whose market value reflects the aggregate cashamount of dividends that would have been received had the shares which havevested at the end of the performance period been held throughout the performanceperiod.
– Awards and performance conditions can be adjusted to take account of variations ofcapital and other transactions. Subject to this policy, performance conditions maybe amended in other circumstances if the Committee considers that a changedperformance condition would be a fairer measure of performance.
– If there is a change of control, awards will vest to the extent performance conditionsare then satisfied. If the change of control happens during the first 36 months fromthe date of grant of the award, the number of shares that can vest will be reducedpro rata over that 36 months period. The Committee may, alternatively, withagreement of an acquiring company, replace awards with equivalent new awardsover shares in the acquiring company.
– The Committee retains the discretion, where circumstances warrant, to amend orwaive performance conditions under the Plan rules.
– As described under the malus and claw back provisions set out earlier in this PolicyReport, the Committee retains the discretion to reduce or cancel awards before theyvest (malus) or to recover the value of awards after vesting (claw back).
– The PSP incorporates a simplestructure to align executive reward withshareholder returns and businessstrategy, to help drive performanceover a long-term horizon.
– Award levels are set to incentiviseexecutives to meet the long-termstrategic goals of the Group, to provideretention for the executive team and tocontribute towards the competitivenessof the overall remuneration package.
– TSR rewards the delivery of superiorreturns to shareholders over thelong term.
– EBIT margin improvement rewardssustained operational performance ofour business and the cost-competitiveoperation of our mining assets, a corepart of our strategy.
– How performance is generated is asimportant as what level of performanceis delivered. Before vesting, theCommittee must satisfy itself thatrelative TSR and EBIT marginperformances are an appropriatereflection of the underlyingperformance of the business, and canadjust vesting accordingly.
– Awards will normally have a five-yearperformance period to provide long-term alignment with the interestsof shareholders.
– As a transitional measure, awardsgranted in 2013 will vest 50 per centafter four years and 50 per cent afterfive years.
– The Committee will seek to ensure that outcomes are fair and that they take accountof the overall performance of the Company during the performance period.
The long-term incentive awards made prior to 2013, and under which payments are still intended to be made should the relevant performance conditions besatisfied, can be paid out under this policy. The details of the awards granted prior to 2013 which have yet to vest, including the details of the performanceconditions, are provided in the Implementation Report.
riotinto.com 69
STRATEG
ICREPO
RT
DIR
EC
TO
RS
’R
EP
OR
T:
REMUNERATIONREPORT:
POLICY
REPO
RT
FINANCIA
LSTA
TEMEN
TSPR
ODUCTIO
N,R
ESERVES
ANDOPER
ATIO
NS
ADDITIO
NALINFO
RMATIO
N
For
per
sona
l use
onl
y
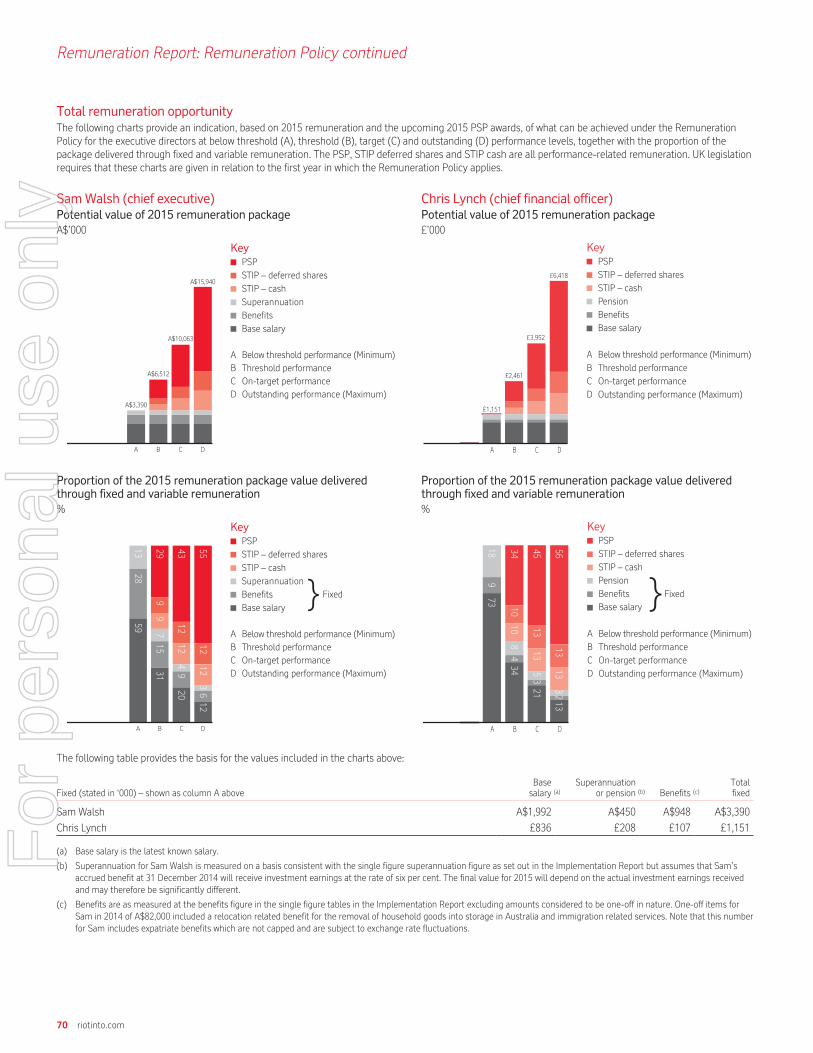
Remuneration Report: Remuneration Policy continued
Total remuneration opportunityThe following charts provide an indication, based on 2015 remuneration and the upcoming 2015 PSP awards, of what can be achieved under the RemunerationPolicy for the executive directors at below threshold (A), threshold (B), target (C) and outstanding (D) performance levels, together with the proportion of thepackage delivered through fixed and variable remuneration. The PSP, STIP deferred shares and STIP cash are all performance-related remuneration. UK legislationrequires that these charts are given in relation to the first year in which the Remuneration Policy applies.
SamWalsh (chief executive)Potential value of 2015 remuneration packageA$’000
Chris Lynch (chief financial officer)Potential value of 2015 remuneration package£’000
KeyPSP
STIP – deferred sharesA$15,940
A$10,063
A$6,512
A$3,390
STIP – cash
Superannuation
Benefits
Base salary
A Below threshold performance (Minimum)Threshold performanceOn-target performanceOutstanding performance (Maximum)
BCD
A B C D DCBA
Key PSP
STIP – deferred shares
STIP – cash
Pension
Benefits
Base salary
A Below threshold performance (Minimum)
B Threshold performance
C On-target performance
D Outstanding performance (Maximum)
1,373
2,059
£1,151
£2,461
£3,952
£6,418
Proportion of the 2015 remuneration package value deliveredthrough fixed and variable remuneration%
Proportion of the 2015 remuneration package value deliveredthrough fixed and variable remuneration%
Key
1328
59
299
3115
79
4312
1249
20
5512
123612
PSP
STIP – deferred shares
STIP – cash
SuperannuationFixed}Benefits
Base salary
A Below threshold performance (Minimum)Threshold performanceOn-target performanceOutstanding performance (Maximum)
BCD
A B C D DCBA
Key PSP
STIP – deferred shares
STIP – cash
Pension
Benefits
Base salary
A Below threshold performance (Minimum)
B Threshold performance
C On-target performance
D Outstanding performance (Maximum)
}Fixed739
18
344
810
1034
213
513
1345
132
313
1356
The following table provides the basis for the values included in the charts above:
Fixed (stated in ‘000) – shown as column A aboveBasesalary (a)
Superannuationor pension (b) Benefits (c)
Totalfixed
Sam Walsh A$1,992 A$450 A$948 A$3,390
Chris Lynch £836 £208 £107 £1,151
(a) Base salary is the latest known salary.
(b) Superannuation for Sam Walsh is measured on a basis consistent with the single figure superannuation figure as set out in the Implementation Report but assumes that Sam’saccrued benefit at 31 December 2014 will receive investment earnings at the rate of six per cent. The final value for 2015 will depend on the actual investment earnings receivedand may therefore be significantly different.
(c) Benefits are as measured at the benefits figure in the single figure tables in the Implementation Report excluding amounts considered to be one-off in nature. One-off items forSam in 2014 of A$82,000 included a relocation related benefit for the removal of household goods into storage in Australia and immigration related services. Note that this numberfor Sam includes expatriate benefits which are not capped and are subject to exchange rate fluctuations.
70 riotinto.com
For
per
sona
l use
onl
y
Performance-related (At risk)
Threshold STIP and LTIP (a)
performance – shown ascolumn B above
– A STIP award of 50% of the target STIPopportunity, ie 60% of base salary
– Threshold vesting of the PSP award at22.5% of face value, calculated as 96.8%of base salary
Target STIP and LTIPperformance – shown ascolumn C above
– A STIP award of 100% of the target STIPopportunity, ie 120% of base salary
– Expected value of the PSP award of50% of face value, calculated as 215%of base salary
Outstanding STIP and LTIPperformance (Maximum) –shown as column D above
– A maximum STIP award of 200% ofbase salary
– Full vesting of the PSP award, calculatedas 430% of base salary
(a) Long-term incentives consist of share awards only, measured at 2015 face value.This does not constitute an estimate of the value of awards that may potentiallyvest with respect to year end 31 December 2015. No assumption has been made forincrease in share price or payment of dividends.
Context for outstanding performanceDemanding performance targets are designed to ensure that the level ofremuneration is aligned with performance delivered for shareholders.Outstanding business and individual performance is required to achieve themaximum level of remuneration. This comprises:
– outstanding performance against all financial, health and safety, andindividual STIP measures;
– TSR outperformance against both the HSBC and MSCI indices by six percent per annum over five years; and
– EBIT margin improvement equal to or greater than the second rankedcompany in the comparator group over five years.
The intention of the Committee is that if these levels of reward are achieved byour executives then shareholders will benefit over time from superior shareprice performance.
DiscretionsThe Committee recognises the importance of ensuring that the outcomes ofthe Group’s executive pay arrangements described in this RemunerationPolicy properly reflect the Group’s overall performance and the experience ofits shareholders and other stakeholders over the performance period.
The Committee undertakes to owners that it will exercise discretion diligentlyand in a manner that is aligned with our strategy to create long-termshareholder value. Accordingly, when reviewing the operation of short andlong-term incentive plans and the outcome of awards made under theseplans, the Committee will, when evaluating safety, financial, Group andindividual performance, consider the overall shareholder experience during theperformance period in question.
It is the Committee’s intention that the mechanistic outcome of performanceconditions relating to awards made under such plans will routinely be subjectto review to avoid outcomes which could be seen as contrary to shareholders’expectations. To the extent provided for in the terms of any performancecondition or in accordance with any relevant amendment power under theplan rules, the Committee may adjust and/or set different performancemeasures if events occur (such as a change in strategy, a material acquisitionor divestment, a change in control or unexpected event) which cause theCommittee to determine that the measures are no longer appropriate or in thebest interests of shareholders, and that the amendment is required so that themeasures achieve their original purpose. Committee discretion should notoperate as an automatic override, and it must be exercised judiciously.
To the extent that discretion is applied in any year, the Committee undertakesthat this will be clearly explained and disclosed to shareholders in theImplementation Report.
Recruitment remunerationOur approach to recruitment remuneration for executives (both external andinternal) is set out below. Shareholders are reminded that the following principlesare binding only in so far as they relate to the recruitment of directors.
We aim to position base salary at an appropriate level, taking into consideration arange of factors including an executive’s current remuneration, experience,internal relativities, an assessment against relevant comparator groups and cost.
Other elements of remuneration will be established in line with the RemunerationPolicy set out earlier in this Policy Report in the executive remuneration structuretable. As such, annual variable remuneration for new appointees will comprise amaximum award of 200 per cent of base salary under the STIP and amaximumaward of 438 per cent of base salary under the PSP.
In the event that an internal appointment is made, existing commitments willbe honoured.
If the Committee concludes that it is necessary and appropriate to secure anappointment, relocation-related support and international mobility benefitsmay also be provided depending on the circumstances. Any relocationarrangements will be set out in the Implementation Report.
Any compensation provided to an executive recruited from outside the Groupfor the forfeiture of any award under variable remuneration arrangementsentered into with a previous employer is considered separately to theestablishment of forward looking annual remuneration arrangements. Ourpolicy with respect to such “buy-outs” is to determine a reasonable level ofaward, on a like-for-like basis, of primarily equity-based, but also potentiallycash or restricted stock, taking into consideration the quantum of forfeitedawards, their performance conditions and vesting schedules. The Committeewill obtain an independent external assessment of the value of awardsproposed to be bought out and retains discretion, subject to the above, tomake such compensation as it deems necessary and appropriate to secure therelevant executive’s employment. The Committee’s intention is that buy-outcompensation should include, where appropriate, performance-tested equity.
No form of “golden hello” will be provided upon recruitment.
Executives’ service contracts and termination(b)
The Committee will seek to honour any commitments made in respect oftermination of employment in the executive directors’ service contractspredating this Remuneration Policy which are described in this section. Thissection also sets out Rio Tinto’s policy on termination payments and noticeperiods. Shareholders are reminded that such policy is binding only in so far asit relates to directors.
For new appointments where the Company terminates by making a paymentin lieu of notice, the Committee will for executive directors (to the extentpermitted by relevant law) have regard to the executive director’s ability tomitigate his loss in assessing the payment to be made.
The executive directors may have or may be offered service contracts whichcan be terminated by either party with up to 12 months’ notice in writing, orimmediately by paying the base salary only in lieu of any unexpired notice. Aninitial notice period of up to 24 months during the first two years ofemployment, reducing to up to 12 months thereafter, may sometimes benecessary to secure an external appointment. In some circumstances, it mayalso be appropriate to use fixed-term contracts for executive directors.
On 23 October 2014, the Company announced its intention to change thecontractual notice periods for the executive directors. Subject to approval ofthis Remuneration Policy at the 2015 AGMs, both executive directors willtransfer from their current fixed term contracts to open-ended contracts withno pre-determined end date and a 12-month notice period.
Other executives can be offered service contracts which can be terminated bythe Company with up to 12 months’ notice in writing, and by the employeewith six months’ notice in writing, or immediately by the Company by payingthe base salary only in lieu of any unexpired notice.
The current contract terms of both directors and the other executives areincluded in the Implementation Report.
(b) Material changes to the Remuneration Policy, such as those relating to executiveservice contracts above, are identified in italics in this Report.
riotinto.com 71
STRATEG
ICREPO
RT
DIR
EC
TO
RS
’R
EP
OR
T:
REMUNERATIONREPORT:
POLICY
REPO
RT
FINANCIA
LSTA
TEMEN
TSPR
ODUCTIO
N,R
ESERVES
ANDOPER
ATIO
NS
ADDITIO
NALINFO
RMATIO
N
For
per
sona
l use
onl
y
Remuneration Report: Remuneration Policy continued
Executives may be required to undertake garden leave during all or part oftheir notice period and may receive their contractual salary, STIP and benefitsduring the notice period (or the cash equivalent). Where applicable, taxequalisation and other expatriate benefits will continue in accordance with theexecutive’s prevailing terms and conditions.
In the case of dismissal for cause, the Company can terminate employmentnotice. Deferred bonus shares and outstanding awards under the LTIP may beforfeited in these circumstances.
Accrued but untaken annual leave and any long service leave will be paid outon termination, in accordance with the relevant country legislation andapplicable practice applying to all employees. For eligible leavers (as definedbelow), in Australia the value of the leave is calculated on the basis of basesalary, target STIP and car allowance. No STIP is included where the executiveis not an eligible leaver.
If termination is a result of redundancy, the terms of the relevant local policymay apply in the same way as for other local employees.
On termination, the Company will pay relocation or expatriation benefits asagreed on the original expatriation and/or in accordance with its applicablepolicies on travel and relocation. For example, Sam Walsh is provided withexpatriation benefits and allowances and on termination of his employment bythe Company repatriation expenses would be paid.
On termination other than for cause, the Company may make a payment inconsideration for entry by the departing executive director into appropriaterestrictive covenants to protect Rio Tinto and its shareholders. The amount ofsuch payment will be determined by the Committee based on the content andduration of the covenant.
Following termination, executive directors may be eligible to exercise long-term incentives awards under the conditions described in the sectionsfollowing. They and their dependants may also be eligible for post-retirementbenefits such as medical and life insurance. The Company may also agree tocontinue certain other benefits for a period following termination where thearrangements are provided under term contracts or in accordance with theterms of the service contract, for example, payment for financial advice, taxadvice and preparation of tax returns for a tax year. In some cases, they mayreceive a modest retirement gift.
The Company may pay such amount as it determines is reasonable to settleany claims which in the Committee’s view are legitimate which the executivedirector may have in connection with the termination of his employment. TheCompany may also pay reasonable legal and other professional fees (includingoutplacement support) to or in respect of a director in connection with thetermination of his employment. These may include legal fees incurred by himin negotiating a settlement agreement with Rio Tinto. In assessing what isreasonable, the Company will take account of prevailing rates for such adviceand support and determine appropriate level of contribution based on thecomplexity of the issues.
Treatment of STIP and LTIP on terminationThe STIP and share plan rules govern the entitlements that executiveparticipants may have under those plans upon termination of employment.
The concept of an “eligible leaver” is defined in the relevant Plan rules. Ingeneral terms, an eligible leaver is an executive who leaves the Group byreason of ill-health, injury, disability (as determined by the executive’semployer); retirement; redundancy; transfer of the undertaking in which theexecutive works; change of control of the executive’s employing company; ordeath; and usually there is a discretion for the Remuneration Committee totreat an executive as an eligible leaver.
Short Term Incentive Plan (STIP)If an eligible leaver leaves the Group during a performance year, theCommittee may determine in its absolute discretion to award a pro rataportion of the STIP based on the amount of the year served and based onactual assessment of performance against targets. Any cash payment will bemade at the normal STIP payment date and no portion of the award will bedeferred into shares.
If an executive provides the Company notice of their resignation during theperformance year, but will not leave the Group until after the end of theperformance year, the Committee may determine in its absolute discretionto make an award under the STIP. In these circumstances, the executive willonly be eligible to receive the cash portion of the award and will forfeit thedeferred shares portion. Any cash payment will be made at the normal STIPpayment date.
No STIP award will be made where an executive who is not an eligible leaverleaves the Group, resigns or is terminated for cause prior to the end of theperformance year.
Bonus Deferral Plan (BDP) (2013 onwards)For grants made to executives from and including 2013, awards will normallybe retained and vest at the scheduled vesting date, save where the Committeedetermines otherwise. There will be no pro rata reduction of awards and anydividend equivalent shares will be calculated on the vested shares.
If the executive resigns or is dismissed for misconduct, or for any other reasonthat the Committee decides, the awards will lapse.
BDP (pre-2013)For grants made to eligible leavers before 2013, awards will normally vest atthe scheduled vesting date save where the Committee determines otherwise.There will be no pro rata reduction of awards and any dividend equivalentshares will be calculated on the vested shares.
If an executive leaves the Group for any other reason, awards will lapse.
For any BDP award, where required by law or regulation, and where theRemuneration Committee so decides, cash may be provided in lieu of shares.
PSP (2013 onwards)For grants made to executives from and including 2013, awards will normallybe retained, and vest at the scheduled vesting date. Unvested awards remainsubject to the satisfaction of the performance conditions. Any dividendequivalent shares will be calculated on the vested shares at vesting.
If the executive leaves the Group during the first 36 months from the date ofgrant of the award, the number of shares that can vest will be reduced pro rataover that 36-month period.
Awards will vest immediately on death, but if an executive dies during the first36 months from the date of grant of the award, the number of shares that canvest will be reduced pro rata over that 36-month period.
If the executive resigns or is dismissed for misconduct, or for any other reasonthat the Committee decides, the awards will lapse.
PSP (pre-2013)For grants made to eligible leavers before 2013, awards will normally beretained and vest at the scheduled vesting date, although the Committee maydetermine that awards should vest early. Unvested awards remain subject tothe satisfaction of the performance conditions.
72 riotinto.com
For
per
sona
l use
onl
y

Awards vest immediately on death. The number of shares vesting isdetermined on the assumption that performance conditions are met at medianlevel or at the level to which they are actually satisfied at the date of death, ifhigher. If an executive leaves the Group for any other reason, awards will lapse.
For any PSP award, where permitted, and where the Remuneration Committeeso decides, awards may be made in cash in lieu of shares.
Share Option Plan (SOP) (pre-2013)For grants made to eligible leavers before 2013, awards will normally beretained. If the executive is an eligible leaver, vested awards will lapse one yearfrom the date the executive leaves the Group and unvested awards will lapseone year from the vesting date or such longer period as permitted by theCommittee. At the date of this report there are no awards under the SOPwhich remain subject to the satisfaction of performance conditions.
Awards vest in full on death.
If an executive leaves the Group for any other reason, unvested awards andvested awards that have not been exercised will lapse.
Management Share Plan (MSP)Awards under the MSP are only made to executives prior to their appointmentas an Executive Committee member. All retained awards will be reduced prorata to reflect the proportion of the period between the date of grant of theaward and the normal vesting date which has not elapsed at the timeemployment ceased. Any dividend equivalent shares or cash equivalent will becalculated on the vested shares. Awards vest on death, subject to the pro ratareduction described above.
For grants made to executives from and including 2013, awards will normallybe retained, and vest, at the Committee’s discretion, at the scheduled vestingdate (although awards of US taxpayers may vest on leaving).
If the executive resigns or is dismissed for misconduct, or for any other reasonthat the Committee decides, the awards will lapse.
All MSP awards granted prior to 2013 have vested.
Chairman and non-executive directors’ remunerationChairmanIt is Rio Tinto’s policy that the chairman should be remunerated on acompetitive basis and at a level which reflects his contribution to the Group, asassessed by the board.
The Committee determines the terms of service, including remuneration, ofthe chairman. The chairman’s fees are set by the Committee. The chairmanhas no part in the setting of his fees and is not present at any discussion at theCommittee about his fees.
The chairman receives a fixed annual fee and does not receive any additionalfee or allowance either for committee membership or chairmanship, or fortravel. The chairman does not participate in the Group’s incentive plans.
The chairman is provided with a car and driver. Any use for transportbetween home and the office and other personal travel is a taxable benefitto the chairman, and the Company pays any tax arising on the chairman’sbehalf. The chairman pays a fixed annual fee to the Company for thepersonal travel element.
Other benefits provided include private healthcare cover, accident insurance(note this is neither contractual nor a taxable benefit), other minor benefits(including modest retirement gifts in applicable circumstances), occasionalspouse travel in support of the business and any Rio Tinto businessexpenses which are deemed to be taxable where the Company has paid thetax on his behalf. Rio Tinto does not pay retirement or post-employmentbenefits to the chairman.
Non-executive directorsFees paid to non-executive directors reflect their respective duties andresponsibilities and the time required to be spent by them so as to make ameaningful and effective contribution to the affairs of Rio Tinto.
The non-executive directors’ fees and other terms are set by the board uponthe recommendation of the Chairman’s Committee (which comprises thechairman, chief executive and chief financial officer).
Non-executive directors receive a fixed annual fee comprising a base fee,committee membership or committee chairmanship fee or senior independentdirector fee, as applicable, and allowances for attending meetings whichinvolve medium or long-distance air travel. They do not participate in any ofthe Group’s incentive plans.
Where the payment of statutory minimum superannuation contributionsfor Australian non-executive directors is required by Australiansuperannuation law, these contributions are deducted from the director’soverall fee entitlements.
Non-executive directors may on occasion receive reimbursement for costsincurred in relation to the provision of professional advice. These payments, ifmade, are taxable benefits to the non-executive directors and the tax arising ispaid by the Company on the director’s behalf.
Other benefits provided include accident insurance (note this is neithercontractual nor a taxable benefit), other minor benefits (including modestretirement gifts in applicable circumstances), occasional spouse travel insupport of the business and any Rio Tinto business expenses which aredeemed to be taxable where the Company has paid the tax on their behalf.Rio Tinto does not pay retirement or post-employment benefits to non-executive directors.
AppointmentThe appointment of non-executive directors (including the chairman) ishandled through the Nominations Committee and board processes. Thecurrent fee levels are set out in the Implementation Report.
Details of each element of remuneration paid to the chairman and non-executive directors are set out in the Implementation Report in table 1b onpage 94.
The chairman’s letter of appointment from the Company stipulates his dutiesas chairman of the Group. His appointment may be terminated without liabilityon the part of Rio Tinto in accordance with the Group’s constitutionaldocuments dealing with retirement, disqualification from office or othervacation from office. Otherwise, his appointment may be terminated by giving12 months’ notice. There are no provisions for compensation payable ontermination of his appointment, other than if his appointment as chairman isterminated by reason of his removal as a director pursuant to a resolution ofshareholders in general meeting in which case the Company shall be liable topay any fees accrued to the date of any such removal.
The non-executive directors’ letters of appointment from the Companystipulate their duties and responsibilities as directors. Each non-executivedirector is appointed subject to their election and annual re-election byshareholders. Non-executive directors’ appointments may be terminated bygiving three months’ notice. There are no provisions for compensationpayable on termination of their appointment. The letters of appointment areavailable for inspection at Rio Tinto plc’s registered office, and at its annualgeneral meeting.
In accordance with the provisions of the Group’s constitutional documents, themaximum aggregate fees payable to the non-executive directors (includingthe chairman) in respect of any year, including fees received by the non-executive directors for serving on any committee of the boards, and any travelallowances received by the non-executive directors for attending meetings,will not exceed £3,000,000. Non-monetary benefits are not included in thislimit.
riotinto.com 73
STRATEG
ICREPO
RT
DIR
EC
TO
RS
’R
EP
OR
T:
REMUNERATIONREPORT:
POLICY
REPO
RT
FINANCIA
LSTA
TEMEN
TSPR
ODUCTIO
N,R
ESERVES
ANDOPER
ATIO
NS
ADDITIO
NALINFO
RMATIO
N
For
per
sona
l use
onl
y
Remuneration Report: Implementation Report
Implementation Report introductionThis Implementation Report is presented to shareholders for approval at theAGMs. It outlines how our Remuneration Policy was implemented in 2014 andhow it is intended to be operated in 2015.
Remuneration for executives, set out in the single total figure of remunerationtables on pages 86 and 87, is shown gross of tax and in the relevant currencyof award or payment. The information reported for executives in table 1a onpages 92 and 93 is reported in accordance with Australian statutory disclosurerequirements and is shown gross of tax and in US dollars. Where applicable,amounts have been converted using the relevant average exchange ratesincluded in the notes to table 3 on page 92 (a).
In addition to executive remuneration, this report covers the remuneration ofthe chairman and the non-executive directors in table 1b on page 94. Allfigures are shown gross of tax and in US dollars.
Remuneration Committee responsibilitiesThe Committee’s responsibilities are set out in its terms of reference which areavailable in the corporate governance section of the Rio Tinto website. Theresponsibilities of the Committee include:
– determining the Group’s remuneration structure and policies, andassessing their cost, including pension and superannuation arrangementsfor executives;
– determining the mix and use of short and long-term incentive plansfor executives;
– overseeing the operation of the Group’s short and long-term incentiveplans as they relate to executives, including the approval of awards, thesetting of performance criteria, where applicable, and the determination ofany vesting;
– determining contractual notice periods and termination commitments andsetting any retention and termination arrangements for executives;
– determining awards under the Group’s all-employee share plans; and
– determining the terms of service upon appointment and any subsequentchanges for the chairman and executives.
The Committee considers the level of pay and conditions throughout theGroup when determining executive remuneration and ensures that thesame principles are used when designing the broader employeeremuneration policies.
The members of the Committee are John Varley (chairman), Jan du Plessis,Michael Fitzpatrick, Richard Goodmanson and Paul Tellier.
The membership and meeting attendances are detailed in the corporategovernance section on page 59. The Committee is supported by executivesand members of senior management who attend meetings to provideinformation as requested by the Committee. These included Sam Walsh (chiefexecutive), Hugo Bague (Group executive, Organisational Resources), JohnBeadle (global head, Performance and Reward) and Eleanor Evans (companysecretary). None of the attendees mentioned above was present when mattersassociated with their own remuneration were considered by the Committee.
(a) UK and Australian remuneration figures are generally not comparable due to thedifferent methodologies required to calculate various parts of the remunerationpackages, most notably LTIP arrangements and the value of pension orsuperannuation.
Independent advisersThe independent advisers engaged by the Committee during 2014 were TowersWatson. Towers Watson reports to the Committee and not to management.
To ensure that “remuneration recommendations” (being advice relating to theelements of remuneration for key management personnel, as defined underthe Australian Corporations Act) were made free from undue influence by keymanagement personnel to whom they may relate, the Committee establisheda protocol for the engagement of and interaction with remunerationconsultants and has monitored compliance with its requirements throughout2014. Declarations were given by Towers Watson to the effect that itsremuneration recommendations were made free from undue influence by keymanagement personnel to whom they related. The board has receivedassurance from the Committee and is therefore satisfied that theremuneration recommendations received from Towers Watson were madefree from undue influence.
Towers Watson is a member of the Remuneration Consultants’ Group and, assuch, voluntarily operates under the Code of Conduct (the Code) in relation toexecutive remuneration consulting in the UK. The Code is based uponprinciples of transparency, integrity, objectivity, competence, due care andconfidentiality. Towers Watson has confirmed that it adhered to the Codethroughout 2014 for all remuneration services provided to Rio Tinto. The Codeis available online at remunerationconsultantsgroup.com.
Towers Watson is the only remuneration consultant which providedremuneration recommendations to the Committee during 2014. TheCommittee is content that Towers Watson, in providing remuneration adviceto the Committee, did not have any connections with Rio Tinto that impairedits independence.
During 2014, as part of its engagement, Towers Watson providedremuneration recommendations to the Committee. Its services includedCommittee meeting attendance and advice in relation to managementproposals. Towers Watson was paid US$349,905 for these services.
Towers Watson provided general and technical executive remunerationservices. These services included the provision of benchmarking data, thegiving of advice about remuneration of employees other than keymanagement personnel across the Group, and advice in relation topreparation of the 2014 Remuneration Report. Towers Watson was paidUS$147,547 for these services.
Other services and publications were received from a range of advisers inrelation to remuneration data.
74 riotinto.com
For
per
sona
l use
onl
y

How the Committee spent its time in 2014During 2014, the Committee met nine times. It fulfilled its responsibilities asset out in its terms of reference.
In particular, its work in 2014 and in the early part of 2015 has included:
– reviewing and determining any base salary adjustments for executives;
– reviewing and determining threshold, target and outstanding performancetargets for the 2014 STIP;
– reviewing actual performance against the targets for the 2014 STIP andassessing applicable adjustments;
– reviewing and determining the outcomes for LTIP awards vesting at theend of 2014;
– reviewing and determining LTIP grants for the executives in 2015;
– reviewing the proposed change to the notice periods in the servicecontracts for the chief executive (Sam Walsh) and the chief financial officer(Chris Lynch);
– reviewing and determining the terms of appointment for the new chiefexecutive, Aluminium group (Alfredo Barrios);
– determining the terms of departure for the outgoing chief executive,Aluminium group (Jacynthe Côté);
– reviewing the annual reports on the Group’s global benefit plans;
– reviewing progress towards compliance with the Group’s shareownership requirements;
– an initial review of 2015 STIP targets; and
– preparing the Remuneration Report (including this Implementation Report).
The performance targets under the LTIP and the Company’s approach toestablishing the performance targets under the STIP are detailed in theexecutive remuneration structure table on pages 67 to 69. The Committee’sapproach to the commercial sensitivity of certain targets is discussed below.
Performance review process for executivesRio Tinto conducts an annual performance review process for all of itsexecutives. In the case of members of the Executive Committee, the chiefexecutive conducts the review. In the case of the chief executive, hisperformance is assessed by the chairman of the board.
The key objectives of the performance review process are to:
– improve organisational effectiveness by creating alignment between theexecutive’s objectives and Rio Tinto’s strategy; and
– provide a consistent, transparent and balanced approach to measure,recognise and reward executive performance.
All such reviews took place in 2014 or early 2015.
Share ownership policy for executivesThe Group recognises the importance of aligning executives’ interests withthose of shareholders and they are therefore expected to build up andmaintain a meaningful shareholding. The Committee intends that executivesshould aim to reach a share ownership (defined below) in Rio Tinto sharesequivalent in value to:
Share ownership requirement
Chief executive 4 x base salaryOther executives 3 x base salary
The Committee expects that this shareholding will be built up over a five-yearperiod by holding shares and share options that vest under the LTIPs. For newhires, longer periods may be accepted, given the five-year vesting periods forthe PSP.
Shares will be treated as “owned” if they are not subject to restriction, and assuch include shares directly held by the executive and any shares where thereis a beneficial interest. A beneficial interest includes any shares where theexecutive receives the benefit of ownership (such as a right to receivedividends) without directly owning the shares. A value for vested, butunexercised, share options is included, with a 50 per cent discount for thelikely effects of taxation, on the basis that executives with unexercised vestedoptions have a strong financial alignment with the share price and thereforewith shareholder interests.
Shareholding requirements also exist for senior management below theExecutive Committee.
Details of executives’ beneficial interests in Rio Tinto shares are set out intable 2 on page 95 and the details of awards of shares and options under long-term incentive plans are set out in table 3 on pages 96 to 100.
Executives’ external and other appointmentsExecutives may be invited to become non-executive directors of othercompanies. It is Rio Tinto’s policy that such appointments can broaden theexperience and knowledge of executives, to the benefit of the Group. Thispolicy limits each executive’s external appointment to one FTSE100 companydirectorship or equivalent. Consequently, where there is no likelihood thatsuch an appointment will give rise to a conflict of interest, the board willnormally provide consent to the appointment. The executive is typicallypermitted to retain any fees earned.
Details of all executives’ external appointments can be found on pages49 to 52.
riotinto.com 75
STRATEG
ICREPO
RT
DIR
EC
TO
RS
’R
EP
OR
T:
REMUNERATIONREPORT:
IMPLEM
ENTA
TIONREPO
RT
FINANCIA
LSTA
TEMEN
TSPR
ODUCTIO
N,R
ESERVES
ANDOPER
ATIO
NS
ADDITIO
NALINFO
RMATIO
N
For
per
sona
l use
onl
y

Remuneration Report: Implementation Report continued
Performance and impact on 2014 STIPGroup financial and safety measures are included in the STIP for executivedirectors and Group executives. The STIP measures for the product groupchief executive officers (PGCEOs) include product group financial and safetymeasures in addition to the Group financial measures.
Safety measures for all executives in 2014 were split equally between all injuryfrequency rate (AIFR) and lost time injuries (LTIs). The safety of our people iscore to everything we do. Our goal is zero harm, including, above all, theelimination of workplace fatalities. We are committed to reinforcing our strongsafety culture, and improving safety leadership.
The Committee selected the current financial measures of underlying earningsand free cash flow because they are KPIs used in managing the business.Underlying earnings is the key financial performance indicator used across theGroup. It gives insight into cost management, production growth andperformance efficiency. We are focused on aggressively reducing our costsand increasing productivity to improve earnings and deliver greater value forshareholders. Operating free cash flow is a complementary measure tounderlying earnings. It also provides insight into how we are managing costsand increasing efficiency and productivity across the business. In measuringfinancial performance against the annual plan, half is measured against theoriginal plan, and half is “flexed” to exclude the impact of uncontrollablefluctuations in exchange rates, quoted metal and other prices. Earnings andfree cash flow results are therefore compared against equally weighted“flexed” and “unflexed” targets.
The aggregate scores for Group safety and financial measures are set out inthe table below. The outcomes for the executive directors, with commentaryon key highlights on performance against individual objectives, are providedon pages 83 and 85. Additional details for other executives are provided onpage 87.
Group measuresWeight
(%)Score
(out of 200%)Weighted
score
Group safety (a) 20.0 138 27.6
Underlying earnings 12.5 81 10.0
Underlying earnings – “flexed” 12.5 133 16.5
Free cash flow 12.5 200 25.0
Free cash flow – “flexed” 12.5 200 25.0
Group financial 50.0 153 76.5
Safety and financial measures (b) 70.0 148.7 104.1
Individual measures (c) 30.0 – –
Total (c) 100.0 – –
(a) This excludes the impact of adjustments for fatalities in 2014 which varyby executive.
(b) The weighted score represents the total Group safety and financial measures score(out of a maximum of 200 per cent) weighted based on the total STIP opportunity of70 per cent allocated to the safety and financial measures. This excludes the impactof adjustments for fatalities in 2014 which vary by executive.
(c) The outcomes against individual measures and the total score (out of 200 per cent)for executives are included in the following pages.
Safety performanceRegrettably, we did not meet our goal of zero fatalities in 2014. Two peoplelost their lives while working at Rio Tinto managed operations. The fatalitieswere caused by a train derailment due to a landslide at Iron Ore Company ofCanada, and an equipment incident during maintenance activities at the Govealumina refinery in Australia.
Our commitment to safety is the foundation of how we operate, as we work toachieve our vision of everyone going home safe and healthy after eachworking day. We believe we can prevent fatalities, injuries and illness byeffectively identifying and controlling risks in our business. We have a longhistory of good safety performance and strive to improve on this year-on-year.In 2014, we updated our safety strategy to confirm our focus on injuryreduction and strengthen our emphasis on fatality elimination andcatastrophic event prevention. This helps us drive effective risk management,identify critical risks, verify that we have the necessary controls in place andprovide our people with appropriate training.
The Remuneration Committee sought guidance from the SustainabilityCommittee on safety performance for 2014, as per our normal procedures.Both committees noted the continued improvement in AIFR, with the Group’sAIFR reducing from 0.65 in 2013 to an all-time low of 0.59 in 2014. Thisbettered the Group target for 2014 of 0.61, but fell below the level of 0.51which would have represented “outstanding”.
There were 381 lost time injuries in 2014 compared to 500 in 2013. Thisbettered the Group target of 407 lost time injuries, but fell below the level of361 lost time injuries which would have represented “outstanding”.
The combined performance meant that the overall Group result for safety wasbetween target and outstanding, with differentiated levels of safetyperformance across the product groups. The total safety score for the Groupwas 138 per cent (out of a maximum of 200 per cent). Reductions have beenapplied as required for executives where a fatality has occurred.
Group financial performanceHighlights of 2014 include:
– Achieved US$1.5 billion of sustainable operating cash cost improvementsand exploration and evaluation savings in 2014, contributing to a total ofUS$4.8 billion since 2012.
– Set production records for iron ore and Hunter Valley thermal coal,and delivered a strong operational performance in bauxite, copperand aluminium.
– Reduced capital expenditure by US$4.8 billion to US$8.2 billion in2014, reflecting completion of existing major projects and continuedcapital discipline.
– Decreased net debt by US$5.6 billion in 2014 to US$12.5 billion at31 December 2014, with gearing of 19 per cent. This compares withUS$18.1 billion and 25 per cent gearing at 31 December 2013.
– Achieved underlying earnings of US$9.3 billion, nine per cent lower than2013 despite the US$4.1 billion (post-tax) impact of lower prices.
Additional details on our progress against strategy are provided on pages8 to 10.
The Group exceeded the earnings and cash flow targets set by the board, andthis is reflected in the financial component of the STIP awards both at theGroup and product group level.
76 riotinto.com
For
per
sona
l use
onl
y
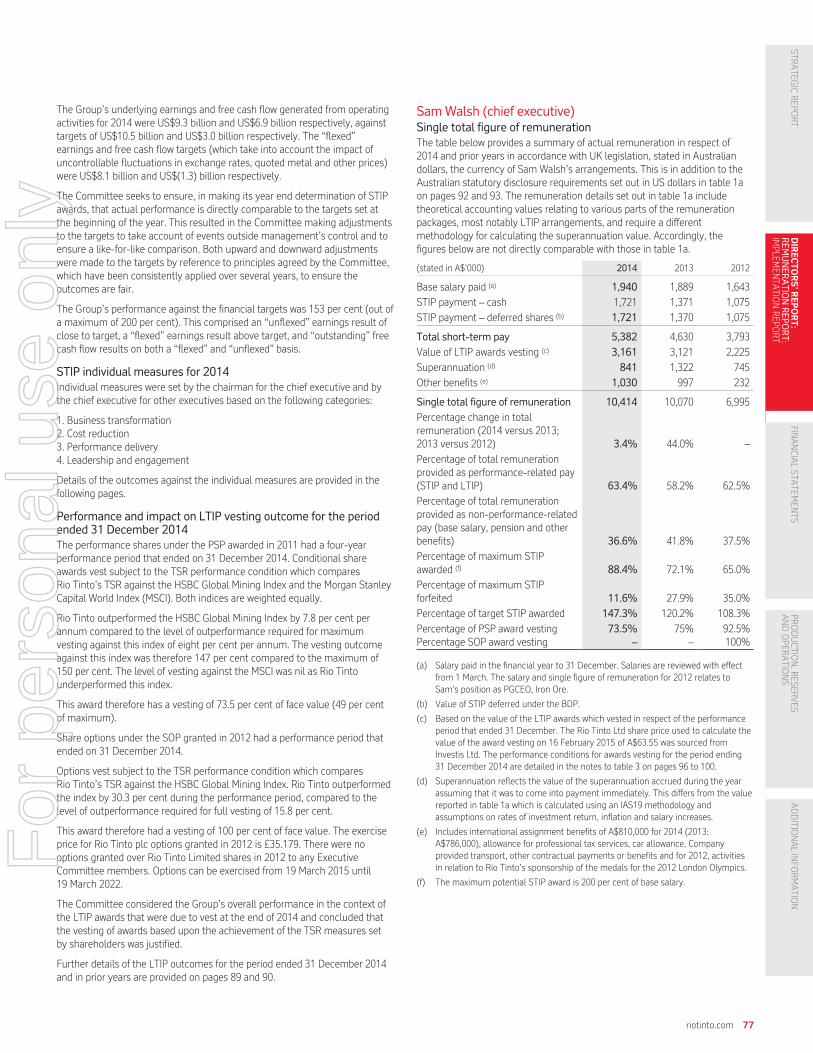
The Group’s underlying earnings and free cash flow generated from operatingactivities for 2014 were US$9.3 billion and US$6.9 billion respectively, againsttargets of US$10.5 billion and US$3.0 billion respectively. The “flexed”earnings and free cash flow targets (which take into account the impact ofuncontrollable fluctuations in exchange rates, quoted metal and other prices)were US$8.1 billion and US$(1.3) billion respectively.
The Committee seeks to ensure, in making its year end determination of STIPawards, that actual performance is directly comparable to the targets set atthe beginning of the year. This resulted in the Committee making adjustmentsto the targets to take account of events outside management’s control and toensure a like-for-like comparison. Both upward and downward adjustmentswere made to the targets by reference to principles agreed by the Committee,which have been consistently applied over several years, to ensure theoutcomes are fair.
The Group’s performance against the financial targets was 153 per cent (out ofa maximum of 200 per cent). This comprised an “unflexed” earnings result ofclose to target, a “flexed” earnings result above target, and “outstanding” freecash flow results on both a “flexed” and “unflexed” basis.
STIP individual measures for 2014Individual measures were set by the chairman for the chief executive and bythe chief executive for other executives based on the following categories:
1. Business transformation2. Cost reduction3. Performance delivery4. Leadership and engagement
Details of the outcomes against the individual measures are provided in thefollowing pages.
Performance and impact on LTIP vesting outcome for the periodended 31 December 2014The performance shares under the PSP awarded in 2011 had a four-yearperformance period that ended on 31 December 2014. Conditional shareawards vest subject to the TSR performance condition which comparesRio Tinto’s TSR against the HSBC Global Mining Index and the Morgan StanleyCapital World Index (MSCI). Both indices are weighted equally.
Rio Tinto outperformed the HSBC Global Mining Index by 7.8 per cent perannum compared to the level of outperformance required for maximumvesting against this index of eight per cent per annum. The vesting outcomeagainst this index was therefore 147 per cent compared to the maximum of150 per cent. The level of vesting against the MSCI was nil as Rio Tintounderperformed this index.
This award therefore has a vesting of 73.5 per cent of face value (49 per centof maximum).
Share options under the SOP granted in 2012 had a performance period thatended on 31 December 2014.
Options vest subject to the TSR performance condition which comparesRio Tinto’s TSR against the HSBC Global Mining Index. Rio Tinto outperformedthe index by 30.3 per cent during the performance period, compared to thelevel of outperformance required for full vesting of 15.8 per cent.
This award therefore had a vesting of 100 per cent of face value. The exerciseprice for Rio Tinto plc options granted in 2012 is £35.179. There were nooptions granted over Rio Tinto Limited shares in 2012 to any ExecutiveCommittee members. Options can be exercised from 19 March 2015 until19 March 2022.
The Committee considered the Group’s overall performance in the context ofthe LTIP awards that were due to vest at the end of 2014 and concluded thatthe vesting of awards based upon the achievement of the TSR measures setby shareholders was justified.
Further details of the LTIP outcomes for the period ended 31 December 2014and in prior years are provided on pages 89 and 90.
SamWalsh (chief executive)Single total figure of remunerationThe table below provides a summary of actual remuneration in respect of2014 and prior years in accordance with UK legislation, stated in Australiandollars, the currency of Sam Walsh’s arrangements. This is in addition to theAustralian statutory disclosure requirements set out in US dollars in table 1aon pages 92 and 93. The remuneration details set out in table 1a includetheoretical accounting values relating to various parts of the remunerationpackages, most notably LTIP arrangements, and require a differentmethodology for calculating the superannuation value. Accordingly, thefigures below are not directly comparable with those in table 1a.
(stated in A$’000) 2014 2013 2012
Base salary paid (a) 1,940 1,889 1,643
STIP payment – cash 1,721 1,371 1,075
STIP payment – deferred shares (b) 1,721 1,370 1,075
Total short-term pay 5,382 4,630 3,793
Value of LTIP awards vesting (c) 3,161 3,121 2,225
Superannuation (d) 841 1,322 745
Other benefits (e) 1,030 997 232
Single total figure of remuneration 10,414 10,070 6,995
Percentage change in totalremuneration (2014 versus 2013;2013 versus 2012) 3.4% 44.0% –
Percentage of total remunerationprovided as performance-related pay(STIP and LTIP) 63.4% 58.2% 62.5%
Percentage of total remunerationprovided as non-performance-relatedpay (base salary, pension and otherbenefits) 36.6% 41.8% 37.5%
Percentage of maximum STIPawarded (f) 88.4% 72.1% 65.0%
Percentage of maximum STIPforfeited 11.6% 27.9% 35.0%
Percentage of target STIP awarded 147.3% 120.2% 108.3%
Percentage of PSP award vesting 73.5% 75% 92.5%Percentage SOP award vesting – – 100%
(a) Salary paid in the financial year to 31 December. Salaries are reviewed with effectfrom 1 March. The salary and single figure of remuneration for 2012 relates toSam’s position as PGCEO, Iron Ore.
(b) Value of STIP deferred under the BDP.
(c) Based on the value of the LTIP awards which vested in respect of the performanceperiod that ended 31 December. The Rio Tinto Ltd share price used to calculate thevalue of the award vesting on 16 February 2015 of A$63.55 was sourced fromInvestis Ltd. The performance conditions for awards vesting for the period ending31 December 2014 are detailed in the notes to table 3 on pages 96 to 100.
(d) Superannuation reflects the value of the superannuation accrued during the yearassuming that it was to come into payment immediately. This differs from the valuereported in table 1a which is calculated using an IAS19 methodology andassumptions on rates of investment return, inflation and salary increases.
(e) Includes international assignment benefits of A$810,000 for 2014 (2013:A$786,000), allowance for professional tax services, car allowance, Companyprovided transport, other contractual payments or benefits and for 2012, activitiesin relation to Rio Tinto’s sponsorship of the medals for the 2012 London Olympics.
(f) The maximum potential STIP award is 200 per cent of base salary.
riotinto.com 77
STRATEG
ICREPO
RT
DIR
EC
TO
RS
’R
EP
OR
T:
REMUNERATIONREPORT:
IMPLEM
ENTA
TIONREPO
RT
FINANCIA
LSTA
TEMEN
TSPR
ODUCTIO
N,R
ESERVES
ANDOPER
ATIO
NS
ADDITIO
NALINFO
RMATIO
N
For
per
sona
l use
onl
y

Remuneration Report: Implementation Report continued
Base salaryThe Committee has increased Sam’s base salary by 2.3 per cent with effectfrom 1 March 2015, consistent with the salary budget for other Australiancontracted employees in the Group.
2015 2014 % change
Base salary (stated in A$’000) 1,992 1,948 2.3
STIP individual objectives for 2014Sam’s performance against his individual objectives is summarised below:
Category Performance
Businesstransformation
– Continued delivery of the transformationprogramme at multiple levels.
– Established a strong platform to engage with allleaders and employees, and drive transformationand cultural change.
– Increased discipline in capital management andprioritisation, focus on costs and continueddelivery of record production output.
– Strengthened key governance models, such as theinvestment and evaluation committees.
Capital and costreductions
– Reduced capital expenditure by US$4.8 billion toUS$8.2 billion in 2014.
– Achieved working capital improvements ofUS$1.5 billion principally from lower inventoriesand lower receivables.
– Achieved US$1.5 billion of sustainable operatingcash cost improvements and exploration andevaluation savings in 2014, contributing to a totalof US$4.8 billion since 2012.
Performancedelivery
– Delivered good results from the Aluminiumbusiness, having taken a more aggressivetransformation approach.
– Executed the curtailment of the Gove refinery inan effective and responsible manner.
– Delivered value and optionality through the Pilbaraexpansion programme.
– Finalised the Simandou investment frameworkand the Ebola outbreak has been well managed.
Leadership andengagement
– Engaged with a wide range of key stakeholders.Increased level of engagement with investorsand interactions with key government leadersat many levels.
– Continued to strengthen the Executive Committee.
The Committee, with input from the chairman of the board, assessed Sam’sperformance against his individual objectives as 190 per cent (out of 200 percent) for his individual contribution to the business during the year.
STIP outcomes for 2014The following table summarises the STIP outcomes for 2014.
MeasuresWeight
(%)
Score(out of200%)
Weightedscore
Safety (a) 20 69.0 13.8
Group financial (a) 50 153.0 76.5
Safety and financial 70 129.0 90.3
Individual 30 190.0 57.0
Total (% of target out of 200%) 100 – 147.3
(a) Refer to page 76 for further details of Group safety and financial performance. TheGroup safety score of 138 per cent has been reduced by 50 per cent to 69 per centfor the impact of fatalities in 2014.
As a result, Sam received a STIP award of 147.3 per cent of target, equivalentto 176.8 per cent of base salary, 50 per cent to be delivered in cash in March2015, and the remainder to be delivered in deferred shares, vesting inDecember 2017.
LTIP outcome for the period ended 31 December 2014Sam received 45,387 shares in Rio Tinto Limited on 16 February 2015 from thevesting of the PSP awarded in 2011. He also received a cash payment ofA$277,051 equal to the aggregate net dividends that would have been paid onthe shares that vested had he owned them during that four-year period. Nodividends were paid in respect of the shares that lapsed.
In 2012, Sam elected to receive his full LTIP award under the PSP and as aresult he has no options under the SOP that were granted in 2012 and whichhad a performance period that ended on 31 December 2014.
Further details of the awards vesting in 2015 and in prior years are provided onpage 89 and in table 3 on page 97.
LTIP award granted in 2014The details of Sam’s 2014 LTIP award are summarised in the following table.
Type ofaward Grant date
Face valueof award
(% of basesalary)
Face valueof award(A$’000) (a)
% vesting atthreshold
performance
End of theperformanceperiod overwhich the
performanceconditionshave to be
fulfilled (b)(c)
PSP17 March
2014 420% 8,180 22.5% 31 Dec 2018
(a) The face value represents the maximum value of the award and resulted in anaward of 134,026 conditional shares based on the average share price over 2013of A$61.029. The expected value of the award is 50 per cent of the face value orA$4,090,000.
(b) The 2014 PSP award may vest after five years in 2019.
(c) The full performance conditions for the award are set out in detail in table 3 onpage 100.
LTIP award for 2015Sam’s PSP award in 2015 will have a face value of 430 per cent of base salaryand an expected value of 215 per cent of base salary. The award may vestafter five years in 2020, subject to the Group’s relative TSR and relative EBITmargin performance. The performance conditions for the award areunchanged from 2014 and the full performance conditions are set out in detailon page 83. As with other participants, Sam’s award in 2015 may be subject topro-rating depending on the date of his retirement from Rio Tinto.
ShareholdingSam’s shareholding for the purposes of the share ownership policy, calculatedusing the market price of Rio Tinto shares on the latest practicable date eachyear before the date of publication of this report was:
31 December2014
31 December2013
Increase inshareholding/
value ofoptions
Holding of ordinary shares 146,993 94,444 55.6%
Value of vested butunexercised options (‘000) A$809 A$1,073 (24.6%)
Multiple of base salary 5.2 4.0 1.2
The value of vested but unexercised options is calculated based on the shareprice as at the relevant date in February each year less the exercise price andwith a 50 per cent discount for the effects of taxation.
78 riotinto.com
For
per
sona
l use
onl
y

SuperannuationSam is provided with superannuation through an employer funded plan asprovided to Australian-based employees.
In line with Australian-based employees with defined benefit provision whoremain in service beyond age 62, Sam’s benefit is calculated as the greater of:
(a) 20 per cent of base salary, averaged over three years, for each year ofservice and proportionate month with the Company to date ofretirement; or
(b) (i) his accrued benefit at age 62 of 4.05 times final base salary; plus
(ii) Company contributions required under Australian legislationsufficient to meet the maximum contribution base as detailedwithin the Superannuation Guarantee legislation, being at therate of 9.25 per cent for the period 1 January to 30 June 2014 and9.5 per cent for the period 1 July to 31 December 2014, less tax;plus
(iii) investment earnings at the rate the trustee of the superannuationfund may determine from time to time for the period from age 62to the date of retirement.
In line with typical market practice in Australia, Sam continues to receive anadditional Company contribution on a defined contribution basis of 20 per centof the lesser of:
(a) 50 per cent of the annual STIP award; or
(b) 20 per cent of base salary.
This benefit can be taken without employer or trustee consent and withoutactuarial reduction on cessation of employment on or after age 62.
The accrued lump sum benefit as at 31 December 2014 was A$9,496,489(31 December 2013: A$8,454,000). The accrued lump sum benefit as at31 December 2014 calculated by reference to Sam’s base salary as set out in(a) above was A$8,235,215 (31 December 2013: A$7,811,427). The additionalCompany contribution on a defined contribution basis for 2014 was A$75,999(2013: A$66,000). Sam elected to take the defined contribution element as acash amount less any applicable withholdings.
Fees received from external appointmentsSam received no fees from external appointments in 2014. In 2013 Samreceived A$27,282 in respect of his position as a non-executive director ofSeven West Media Limited from which he stood down in January 2013.
Service contract
Positions held and date of appointment to position
Position held during 2014 Date of appointment to position
Chief executive 17 January 2013
It is intended that Sam will transfer to a rolling contract which can beterminated by either party with 12 months’ notice in writing, or immediately bypaying the base salary only in lieu of any unexpired notice. His initial contract
was due to end on 31 December 2015 with a break clause from 31 October2014. Subject to shareholder approval of the Remuneration Policy atRio Tinto’s AGMs in 2015, the revised contract terms will come into effectimmediately thereafter.
OtherSam receives a housing allowance and other assignment benefits during hissecondment to London. His remuneration is not subject to tax equalisation orcost of living adjustments, both of which are standard provisions for otherinternational assignees in the Group. The amounts are included in note(e) under the single total figure of remuneration table on page 77.
Sam will be eligible to receive the value of unused annual leave and longservice leave at the conclusion of his employment in accordance withAustralian legislation and applicable practice applying to all employees inAustralia; the value of this leave as at 16 February 2015 was A$1,139,000 andA$1,703,000 respectively.
Chief executive’s pay and employee payThe table below compares the changes from 2013 to 2014, in salary,benefits and annual incentives paid for the chief executive and the Australianworkforce. We chose the comparison to the Australian workforce because it isthe country where approximately 40 per cent of the total workforce is based.This comparator group has been selected due to the availability ofcomparative data and to remove the impacts of year-on-year exchangerate fluctuations. The underlying elements of the chief executive’s pay arebased on the values reported in the single total figure of remuneration table.
The chief executive’s base salary was increased by 2.5 per cent with effectfrom 1 March 2014. The increase in annual incentive paid for the chiefexecutive reflects a higher base salary in 2013 resulting from his appointmentas chief executive in January 2013, and net higher overall safety, financial andindividual performance in 2013 compared to 2012.
Percentagechange insalary paid
Percentagechange in
otherbenefits paid
Percentagechange in
annualincentive
paid (b)
Chief executive 2.7% 3.3% 27.5%
Australian workforce (a) 3.3% 2.8% 10.5%
(a) The percentage change in each element of remuneration for the workforce iscalculated on a per capita basis using average employee numbers.
(b) The percentage change in annual incentive compares amounts paid in 2014 withrespect to the 2013 performance year, to amounts paid in 2013 with respect to the2012 performance year. Annual incentives for the workforce comprise a number ofdifferent short-term incentive arrangements.
riotinto.com 79
STRATEG
ICREPO
RT
DIR
EC
TO
RS
’R
EP
OR
T:
REMUNERATIONREPORT:
IMPLEM
ENTA
TIONREPO
RT
FINANCIA
LSTA
TEMEN
TSPR
ODUCTIO
N,R
ESERVES
ANDOPER
ATIO
NS
ADDITIO
NALINFO
RMATIO
N
For
per
sona
l use
onl
y
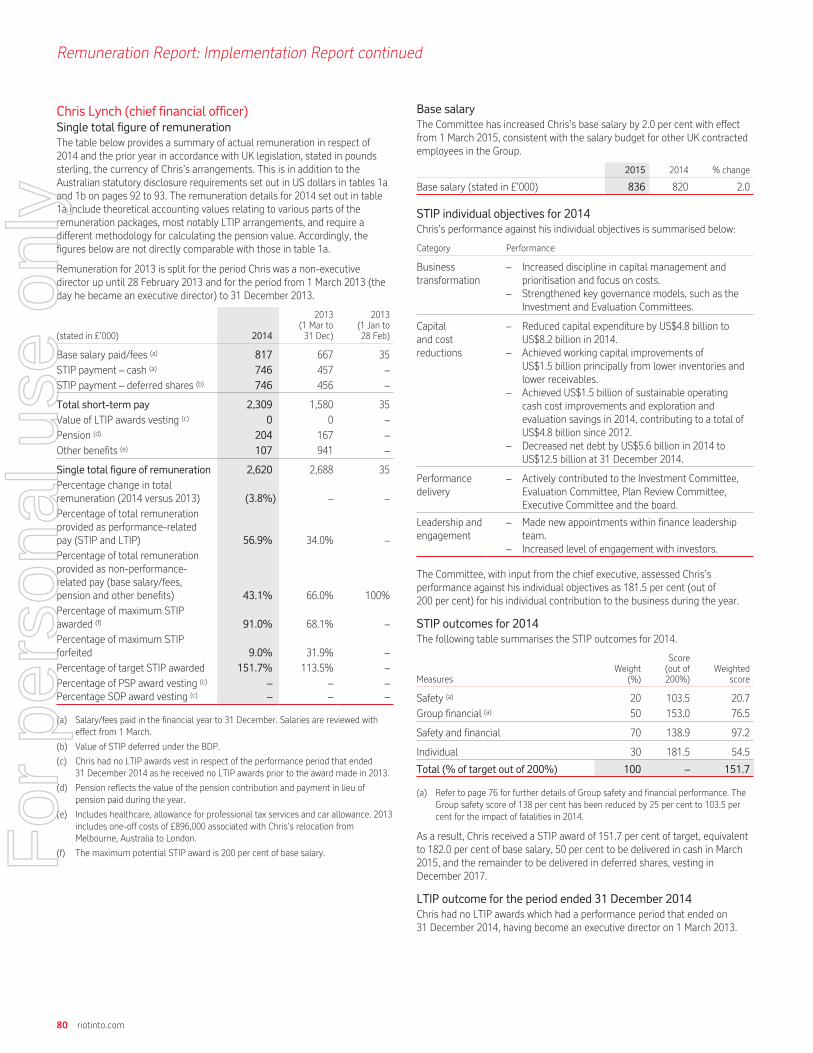
Remuneration Report: Implementation Report continued
Chris Lynch (chief financial officer)Single total figure of remunerationThe table below provides a summary of actual remuneration in respect of2014 and the prior year in accordance with UK legislation, stated in poundssterling, the currency of Chris’s arrangements. This is in addition to theAustralian statutory disclosure requirements set out in US dollars in tables 1aand 1b on pages 92 to 93. The remuneration details for 2014 set out in table1a include theoretical accounting values relating to various parts of theremuneration packages, most notably LTIP arrangements, and require adifferent methodology for calculating the pension value. Accordingly, thefigures below are not directly comparable with those in table 1a.
Remuneration for 2013 is split for the period Chris was a non-executivedirector up until 28 February 2013 and for the period from 1 March 2013 (theday he became an executive director) to 31 December 2013.
(stated in £’000) 2014
2013(1 Mar to31 Dec)
2013(1 Jan to28 Feb)
Base salary paid/fees (a) 817 667 35
STIP payment – cash (a) 746 457 –
STIP payment – deferred shares (b) 746 456 –
Total short-term pay 2,309 1,580 35
Value of LTIP awards vesting (c) 0 0 –
Pension (d) 204 167 –
Other benefits (e) 107 941 –
Single total figure of remuneration 2,620 2,688 35
Percentage change in totalremuneration (2014 versus 2013) (3.8%) – –
Percentage of total remunerationprovided as performance-relatedpay (STIP and LTIP) 56.9% 34.0% –
Percentage of total remunerationprovided as non-performance-related pay (base salary/fees,pension and other benefits) 43.1% 66.0% 100%
Percentage of maximum STIPawarded (f) 91.0% 68.1% –
Percentage of maximum STIPforfeited 9.0% 31.9% –
Percentage of target STIP awarded 151.7% 113.5% –
Percentage of PSP award vesting (c) – – –Percentage SOP award vesting (c) – – –
(a) Salary/fees paid in the financial year to 31 December. Salaries are reviewed witheffect from 1 March.
(b) Value of STIP deferred under the BDP.
(c) Chris had no LTIP awards vest in respect of the performance period that ended31 December 2014 as he received no LTIP awards prior to the award made in 2013.
(d) Pension reflects the value of the pension contribution and payment in lieu ofpension paid during the year.
(e) Includes healthcare, allowance for professional tax services and car allowance. 2013includes one-off costs of £896,000 associated with Chris’s relocation fromMelbourne, Australia to London.
(f) The maximum potential STIP award is 200 per cent of base salary.
Base salaryThe Committee has increased Chris’s base salary by 2.0 per cent with effectfrom 1 March 2015, consistent with the salary budget for other UK contractedemployees in the Group.
2015 2014 % change
Base salary (stated in £’000) 836 820 2.0
STIP individual objectives for 2014Chris’s performance against his individual objectives is summarised below:
Category Performance
Businesstransformation
– Increased discipline in capital management andprioritisation and focus on costs.
– Strengthened key governance models, such as theInvestment and Evaluation Committees.
Capitaland costreductions
– Reduced capital expenditure by US$4.8 billion toUS$8.2 billion in 2014.
– Achieved working capital improvements ofUS$1.5 billion principally from lower inventories andlower receivables.
– Achieved US$1.5 billion of sustainable operatingcash cost improvements and exploration andevaluation savings in 2014, contributing to a total ofUS$4.8 billion since 2012.
– Decreased net debt by US$5.6 billion in 2014 toUS$12.5 billion at 31 December 2014.
Performancedelivery
– Actively contributed to the Investment Committee,Evaluation Committee, Plan Review Committee,Executive Committee and the board.
Leadership andengagement
– Made new appointments within finance leadershipteam.
– Increased level of engagement with investors.
The Committee, with input from the chief executive, assessed Chris’sperformance against his individual objectives as 181.5 per cent (out of200 per cent) for his individual contribution to the business during the year.
STIP outcomes for 2014The following table summarises the STIP outcomes for 2014.
MeasuresWeight
(%)
Score(out of200%)
Weightedscore
Safety (a) 20 103.5 20.7
Group financial (a) 50 153.0 76.5
Safety and financial 70 138.9 97.2
Individual 30 181.5 54.5
Total (% of target out of 200%) 100 – 151.7
(a) Refer to page 76 for further details of Group safety and financial performance. TheGroup safety score of 138 per cent has been reduced by 25 per cent to 103.5 percent for the impact of fatalities in 2014.
As a result, Chris received a STIP award of 151.7 per cent of target, equivalentto 182.0 per cent of base salary, 50 per cent to be delivered in cash in March2015, and the remainder to be delivered in deferred shares, vesting inDecember 2017.
LTIP outcome for the period ended 31 December 2014Chris had no LTIP awards which had a performance period that ended on31 December 2014, having become an executive director on 1 March 2013.
80 riotinto.com
For
per
sona
l use
onl
y

LTIP award granted in 2014The details of Chris’s 2014 LTIP award are summarised in the following table.
Type ofaward Grant date
Face valueof award
(% of basesalary)
Facevalue
of award(£’000) (a)
% vesting atthreshold
performance
End of theperformance
period over whichthe performanceconditions haveto be fulfilled (b) (c)
PSP17 March
2014 400% 3,280 22.5% 31 Dec 2018
(a) The face value represents the maximum value of the award and resulted in anaward of 104,312 conditional shares based on the average share price over 2013 of£31.444. The expected value of the award is 50 per cent of the face value or£1,640,000.
(b) The 2014 PSP award may vest after five years in 2019.
(c) The full performance conditions for the award are set out in detail in table 3 onpage 100.
LTIP award for 2015Chris’s PSP award in 2015 will have a face value of 430 per cent of base salaryand an expected value of 215 per cent of base salary. The award may vestafter five years in 2020, subject to the Group’s relative TSR and the relativeEBIT margin performance. The performance conditions for the award areunchanged from 2014 and the full performance conditions are set out in detailon page 83.
ShareholdingChris’s shareholding for the purposes of the share ownership policy, calculatedusing the market price of Rio Tinto shares on the latest practicable date eachyear before the date of publication of this report was:
31 December2014
31 December2013
Increase inshareholding
Holding of ordinary shares 9,050 8,960 1.0%
Multiple of base salary 0.4 0.4 0
Chris holds no options over Rio Tinto shares. He has until 2018 to build up hisownership in shares to three times his salary as chief financial officer.
PensionChris is employed in the UK and is provided with pension benefits on a definedcontribution basis.
The Company paid a pension contribution to a funded UK company pensionarrangement of 25 per cent of £135,000, being the current maximum salary onwhich pension contributions are based under that arrangement. The pensioncontribution for 2014 was £33,750 (2013, pro rata for the period from 1 March2013: £28,000).
Chris also received a cash supplement equal to 25 per cent of the amount bywhich his base salary exceeded £135,000, less any applicable withholdings.The gross cash supplement for 2014 was £170,417 (2013, pro rata for theperiod from 1 March 2013: £139,000).
Service contract
Positions held and date of appointment to position
Position held during 2014 Date of appointment to positionChief financial officer 18 April 2013
It is intended that Chris will transfer to a rolling contract which can beterminated by either party with 12 months’ notice in writing, or immediately bypaying the base salary only in lieu of any unexpired notice. His initial contractwas due to end on 28 February 2017 with a break clause from 31 December2015. Subject to shareholder approval of the Remuneration Policy atRio Tinto’s AGMs in 2015, the revised contract terms will come into effectimmediately thereafter.
OtherAs a UK contracted employee, Chris is not eligible for tax equalisation on hisremuneration, cost of living or any other ongoing assignment benefits such ashousing allowance.
Past-director paymentsGuy Elliott retired on 31 December 2013. Upon his retirement, good leavertreatment and pro-rating, where applicable, were applied to outstanding LTIPawards in accordance with the plan rules.
Accordingly, Mr Elliott received 29,256 Rio Tinto plc shares on 16 February2015 resulting from the vesting of the PSP awarded in 2011. In accordancewith the Remuneration Policy, he also received a cash payment of £109,488equal to the aggregate net dividends that would have been paid on thoseshares had he owned them during the four-year performance period. Nodividends were paid in respect of the 10,549 shares which lapsed.
The market price of Rio Tinto plc shares at 16 February 2015, the latestpracticable date before the date of publication of this report, was £31.64. Thetotal value of the LTIP awards vesting with respect to the performance periodending 31 December 2014, inclusive of the cash payment for dividends on the2011 PSP, was therefore £1,034,000.
During 2014 Mr Elliott also received a payment for 23.5 days outstandingunused annual leave of £66,704.
What we paid our chairman and non-executive directors
Annual fees payableThe table below sets out the annual fees paid in 2014 and payable in 2015 tothe chairman and the non-executive directors.
2015 2014 2013
Director fees
Chairman’s fee £730,000 £730,000 £715,000Non-executive director base fee (a) £90,000 £90,000 £85,000Senior independent director £40,000 £40,000 £40,000
Committee fees
Audit Committee chairman £35,000 £35,000 £35,000Audit Committee member £20,000 £20,000 £20,000Remuneration Committee chairman £30,000 £30,000 £30,000Remuneration Committee member £15,000 £15,000 £15,000Sustainability Committee chairman £30,000 £30,000 £30,000Sustainability Committee member £15,000 £15,000 £15,000Nominations Committee member £7,500 £7,500 £7,500
Meeting allowances
Long distance(flights over 10 hours per journey) £10,000 £10,000 £10,000
Medium distance(flights of 5-10 hours per journey) £5,000 £5,000 £5,000
(a) The fees payable to non-executive directors are subject to review by the board onthe recommendation of the Chairman’s Committee. Following a review, taking intoaccount the demands on directors, market and related developments, the base feefor non-executive directors was increased to £90,000 with effect from 1 January2014. There have been no changes to other fees or allowances since 1 January2012, save that the travel allowances are now based on length of flights(unchanged) rather than whether the travel is overseas.
Details of each element of remuneration and the single total figure ofremuneration paid to the chairman and non-executive directors during2014 and 2013 are set out in US dollars in table 1b on page 94. Nopost-employment, termination payments or share-based payments weremade. Where the payment of statutory minimum superannuationcontributions for non-executive directors is required by Australiansuperannuation law, these contributions are deducted from the director’soverall fee entitlements.
The total fee and allowances payments made to the chairman and non-executive directors in 2014 are within the maximum aggregate annual amountof £3 million set out in the Group’s constitutional documents approved byshareholders at the 2009 annual general meetings.
riotinto.com 81
STRATEG
ICREPO
RT
DIR
EC
TO
RS
’R
EP
OR
T:
REMUNERATIONREPORT:
IMPLEM
ENTA
TIONREPO
RT
FINANCIA
LSTA
TEMEN
TSPR
ODUCTIO
N,R
ESERVES
ANDOPER
ATIO
NS
ADDITIO
NALINFO
RMATIO
N
For
per
sona
l use
onl
y
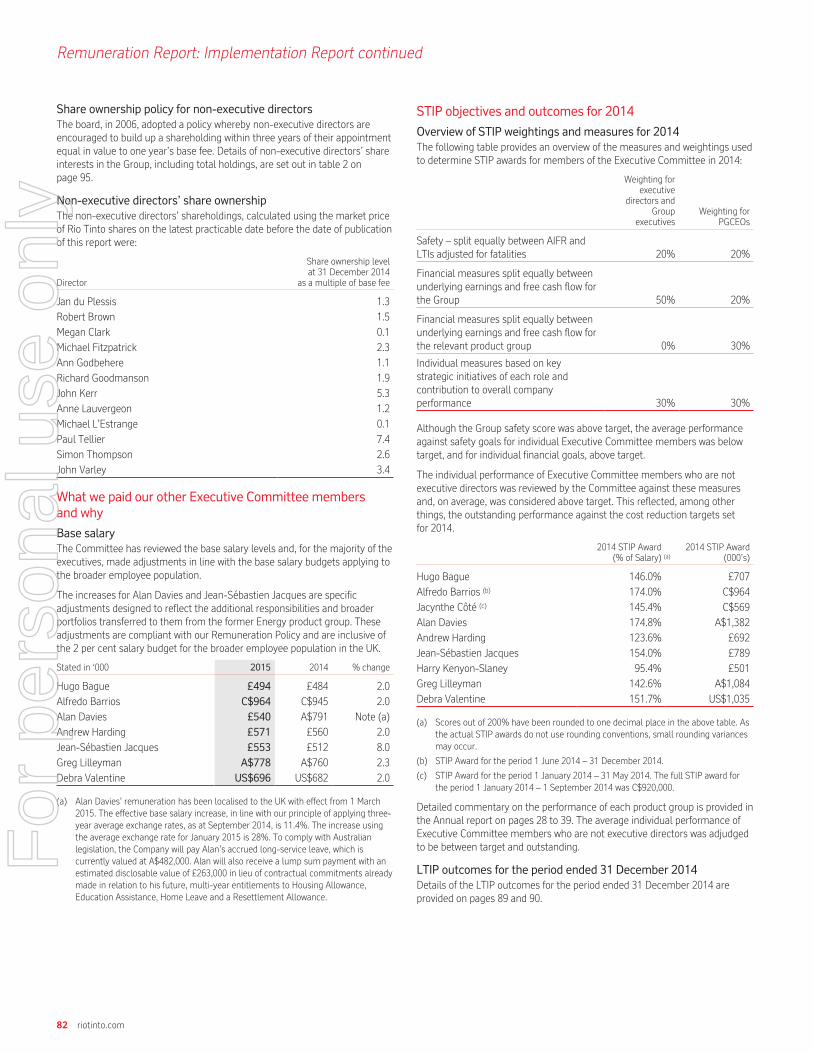
Remuneration Report: Implementation Report continued
Share ownership policy for non-executive directorsThe board, in 2006, adopted a policy whereby non-executive directors areencouraged to build up a shareholding within three years of their appointmentequal in value to one year’s base fee. Details of non-executive directors’ shareinterests in the Group, including total holdings, are set out in table 2 onpage 95.
Non-executive directors’ share ownershipThe non-executive directors’ shareholdings, calculated using the market priceof Rio Tinto shares on the latest practicable date before the date of publicationof this report were:
Director
Share ownership levelat 31 December 2014
as a multiple of base fee
Jan du Plessis 1.3
Robert Brown 1.5
Megan Clark 0.1
Michael Fitzpatrick 2.3
Ann Godbehere 1.1
Richard Goodmanson 1.9
John Kerr 5.3
Anne Lauvergeon 1.2
Michael L’Estrange 0.1
Paul Tellier 7.4
Simon Thompson 2.6
John Varley 3.4
What we paid our other Executive Committee membersand why
Base salaryThe Committee has reviewed the base salary levels and, for the majority of theexecutives, made adjustments in line with the base salary budgets applying tothe broader employee population.
The increases for Alan Davies and Jean-Sebastien Jacques are specificadjustments designed to reflect the additional responsibilities and broaderportfolios transferred to them from the former Energy product group. Theseadjustments are compliant with our Remuneration Policy and are inclusive ofthe 2 per cent salary budget for the broader employee population in the UK.
Stated in ‘000 2015 2014 % change
Hugo Bague £494 £484 2.0
Alfredo Barrios C$964 C$945 2.0
Alan Davies £540 A$791 Note (a)
Andrew Harding £571 £560 2.0
Jean-Sébastien Jacques £553 £512 8.0
Greg Lilleyman A$778 A$760 2.3
Debra Valentine US$696 US$682 2.0
(a) Alan Davies’ remuneration has been localised to the UK with effect from 1 March2015. The effective base salary increase, in line with our principle of applying three-year average exchange rates, as at September 2014, is 11.4%. The increase usingthe average exchange rate for January 2015 is 28%. To comply with Australianlegislation, the Company will pay Alan’s accrued long-service leave, which iscurrently valued at A$482,000. Alan will also receive a lump sum payment with anestimated disclosable value of £263,000 in lieu of contractual commitments alreadymade in relation to his future, multi-year entitlements to Housing Allowance,Education Assistance, Home Leave and a Resettlement Allowance.
STIP objectives and outcomes for 2014
Overview of STIP weightings and measures for 2014The following table provides an overview of the measures and weightings usedto determine STIP awards for members of the Executive Committee in 2014:
Weighting forexecutive
directors andGroup
executivesWeighting for
PGCEOs
Safety – split equally between AIFR andLTIs adjusted for fatalities 20% 20%
Financial measures split equally betweenunderlying earnings and free cash flow forthe Group 50% 20%
Financial measures split equally betweenunderlying earnings and free cash flow forthe relevant product group 0% 30%
Individual measures based on keystrategic initiatives of each role andcontribution to overall companyperformance 30% 30%
Although the Group safety score was above target, the average performanceagainst safety goals for individual Executive Committee members was belowtarget, and for individual financial goals, above target.
The individual performance of Executive Committee members who are notexecutive directors was reviewed by the Committee against these measuresand, on average, was considered above target. This reflected, among otherthings, the outstanding performance against the cost reduction targets setfor 2014.
2014 STIP Award(% of Salary) (a)
2014 STIP Award(000’s)
Hugo Bague 146.0% £707
Alfredo Barrios (b) 174.0% C$964
Jacynthe Côté (c) 145.4% C$569
Alan Davies 174.8% A$1,382
Andrew Harding 123.6% £692
Jean-Sébastien Jacques 154.0% £789
Harry Kenyon-Slaney 95.4% £501
Greg Lilleyman 142.6% A$1,084
Debra Valentine 151.7% US$1,035
(a) Scores out of 200% have been rounded to one decimal place in the above table. Asthe actual STIP awards do not use rounding conventions, small rounding variancesmay occur.
(b) STIP Award for the period 1 June 2014 – 31 December 2014.
(c) STIP Award for the period 1 January 2014 – 31 May 2014. The full STIP award forthe period 1 January 2014 – 1 September 2014 was C$920,000.
Detailed commentary on the performance of each product group is provided inthe Annual report on pages 28 to 39. The average individual performance ofExecutive Committee members who are not executive directors was adjudgedto be between target and outstanding.
LTIP outcomes for the period ended 31 December 2014Details of the LTIP outcomes for the period ended 31 December 2014 areprovided on pages 89 and 90.
82 riotinto.com
For
per
sona
l use
onl
y
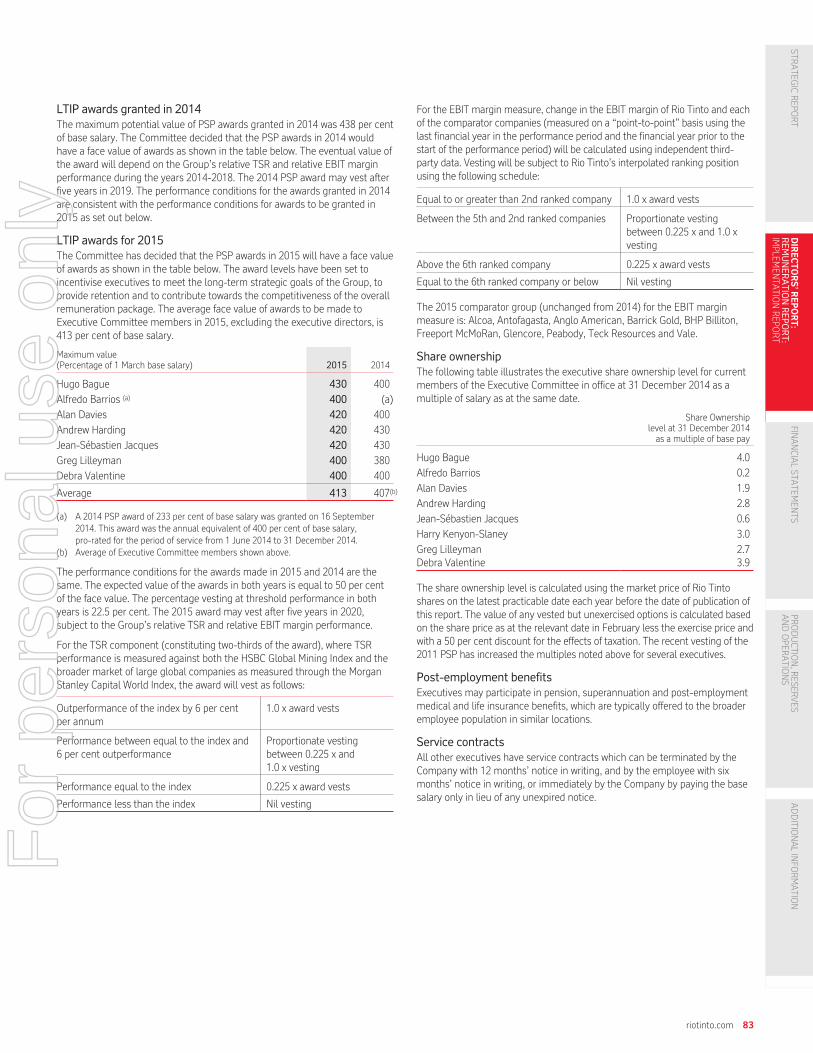
LTIP awards granted in 2014The maximum potential value of PSP awards granted in 2014 was 438 per centof base salary. The Committee decided that the PSP awards in 2014 wouldhave a face value of awards as shown in the table below. The eventual value ofthe award will depend on the Group’s relative TSR and relative EBIT marginperformance during the years 2014-2018. The 2014 PSP award may vest afterfive years in 2019. The performance conditions for the awards granted in 2014are consistent with the performance conditions for awards to be granted in2015 as set out below.
LTIP awards for 2015The Committee has decided that the PSP awards in 2015 will have a face valueof awards as shown in the table below. The award levels have been set toincentivise executives to meet the long-term strategic goals of the Group, toprovide retention and to contribute towards the competitiveness of the overallremuneration package. The average face value of awards to be made toExecutive Committee members in 2015, excluding the executive directors, is413 per cent of base salary.
Maximum value(Percentage of 1 March base salary) 2015 2014
Hugo Bague 430 400
Alfredo Barrios (a) 400 (a)
Alan Davies 420 400
Andrew Harding 420 430
Jean-Sébastien Jacques 420 430
Greg Lilleyman 400 380
Debra Valentine 400 400
Average 413 407(b)
(a) A 2014 PSP award of 233 per cent of base salary was granted on 16 September2014. This award was the annual equivalent of 400 per cent of base salary,pro-rated for the period of service from 1 June 2014 to 31 December 2014.
(b) Average of Executive Committee members shown above.
The performance conditions for the awards made in 2015 and 2014 are thesame. The expected value of the awards in both years is equal to 50 per centof the face value. The percentage vesting at threshold performance in bothyears is 22.5 per cent. The 2015 award may vest after five years in 2020,subject to the Group’s relative TSR and relative EBIT margin performance.
For the TSR component (constituting two-thirds of the award), where TSRperformance is measured against both the HSBC Global Mining Index and thebroader market of large global companies as measured through the MorganStanley Capital World Index, the award will vest as follows:
Outperformance of the index by 6 per centper annum
1.0 x award vests
Performance between equal to the index and6 per cent outperformance
Proportionate vestingbetween 0.225 x and1.0 x vesting
Performance equal to the index 0.225 x award vests
Performance less than the index Nil vesting
For the EBIT margin measure, change in the EBIT margin of Rio Tinto and eachof the comparator companies (measured on a “point-to-point” basis using thelast financial year in the performance period and the financial year prior to thestart of the performance period) will be calculated using independent third-party data. Vesting will be subject to Rio Tinto’s interpolated ranking positionusing the following schedule:
Equal to or greater than 2nd ranked company 1.0 x award vests
Between the 5th and 2nd ranked companies Proportionate vestingbetween 0.225 x and 1.0 xvesting
Above the 6th ranked company 0.225 x award vests
Equal to the 6th ranked company or below Nil vesting
The 2015 comparator group (unchanged from 2014) for the EBIT marginmeasure is: Alcoa, Antofagasta, Anglo American, Barrick Gold, BHP Billiton,Freeport McMoRan, Glencore, Peabody, Teck Resources and Vale.
Share ownershipThe following table illustrates the executive share ownership level for currentmembers of the Executive Committee in office at 31 December 2014 as amultiple of salary as at the same date.
Share Ownershiplevel at 31 December 2014as a multiple of base pay
Hugo Bague 4.0
Alfredo Barrios 0.2
Alan Davies 1.9
Andrew Harding 2.8
Jean-Sébastien Jacques 0.6
Harry Kenyon-Slaney 3.0
Greg Lilleyman 2.7Debra Valentine 3.9
The share ownership level is calculated using the market price of Rio Tintoshares on the latest practicable date each year before the date of publication ofthis report. The value of any vested but unexercised options is calculated basedon the share price as at the relevant date in February less the exercise price andwith a 50 per cent discount for the effects of taxation. The recent vesting of the2011 PSP has increased the multiples noted above for several executives.
Post-employment benefitsExecutives may participate in pension, superannuation and post-employmentmedical and life insurance benefits, which are typically offered to the broaderemployee population in similar locations.
Service contractsAll other executives have service contracts which can be terminated by theCompany with 12 months’ notice in writing, and by the employee with sixmonths’ notice in writing, or immediately by the Company by paying the basesalary only in lieu of any unexpired notice.
riotinto.com 83
STRATEG
ICREPO
RT
DIR
EC
TO
RS
’R
EP
OR
T:
REMUNERATIONREPORT:
IMPLEM
ENTA
TIONREPO
RT
FINANCIA
LSTA
TEMEN
TSPR
ODUCTIO
N,R
ESERVES
ANDOPER
ATIO
NS
ADDITIO
NALINFO
RMATIO
N
For
per
sona
l use
onl
y
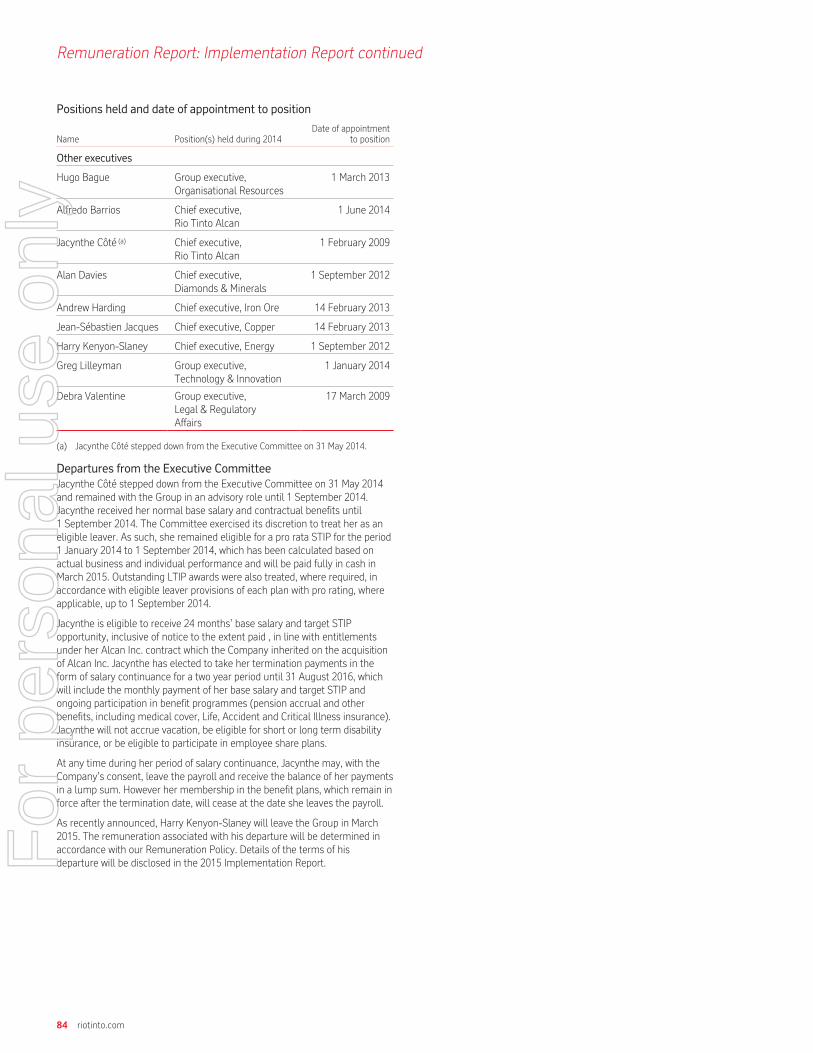
Remuneration Report: Implementation Report continued
Positions held and date of appointment to position
Name Position(s) held during 2014Date of appointment
to position
Other executives
Hugo Bague Group executive,Organisational Resources
1 March 2013
Alfredo Barrios Chief executive,Rio Tinto Alcan
1 June 2014
Jacynthe Côté (a) Chief executive,Rio Tinto Alcan
1 February 2009
Alan Davies Chief executive,Diamonds & Minerals
1 September 2012
Andrew Harding Chief executive, Iron Ore 14 February 2013
Jean-Sébastien Jacques Chief executive, Copper 14 February 2013
Harry Kenyon-Slaney Chief executive, Energy 1 September 2012
Greg Lilleyman Group executive,Technology & Innovation
1 January 2014
Debra Valentine Group executive,Legal & RegulatoryAffairs
17 March 2009
(a) Jacynthe Côté stepped down from the Executive Committee on 31 May 2014.
Departures from the Executive CommitteeJacynthe Côté stepped down from the Executive Committee on 31 May 2014and remained with the Group in an advisory role until 1 September 2014.Jacynthe received her normal base salary and contractual benefits until1 September 2014. The Committee exercised its discretion to treat her as aneligible leaver. As such, she remained eligible for a pro rata STIP for the period1 January 2014 to 1 September 2014, which has been calculated based onactual business and individual performance and will be paid fully in cash inMarch 2015. Outstanding LTIP awards were also treated, where required, inaccordance with eligible leaver provisions of each plan with pro rating, whereapplicable, up to 1 September 2014.
Jacynthe is eligible to receive 24 months’ base salary and target STIPopportunity, inclusive of notice to the extent paid , in line with entitlementsunder her Alcan Inc. contract which the Company inherited on the acquisitionof Alcan Inc. Jacynthe has elected to take her termination payments in theform of salary continuance for a two year period until 31 August 2016, whichwill include the monthly payment of her base salary and target STIP andongoing participation in benefit programmes (pension accrual and otherbenefits, including medical cover, Life, Accident and Critical Illness insurance).Jacynthe will not accrue vacation, be eligible for short or long term disabilityinsurance, or be eligible to participate in employee share plans.
At any time during her period of salary continuance, Jacynthe may, with theCompany’s consent, leave the payroll and receive the balance of her paymentsin a lump sum. However her membership in the benefit plans, which remain inforce after the termination date, will cease at the date she leaves the payroll.
As recently announced, Harry Kenyon-Slaney will leave the Group in March2015. The remuneration associated with his departure will be determined inaccordance with our Remuneration Policy. Details of the terms of hisdeparture will be disclosed in the 2015 Implementation Report.
84 riotinto.com
For
per
sona
l use
onl
y

STIP measures, weightings and targets for 2015As in 2014, the STIP measures and opportunities for executives will beweighted 50 per cent for financial, 30 per cent for individual and 20 per centfor safety measures. The financial and individual targets which have been setfor 2015 are regarded by the board to be commercially sensitive. As such, thespecific targets for these measures, and the performance against them, will bedescribed retrospectively in the 2015 Implementation Report. The Groupfinancial targets relate to earnings and free cash flow. The individual targetsinclude objectives relating to business transformation, cost reduction,performance delivery and leadership and engagement.
The safety measures, weightings and targets for 2015 are outlined opposite.
2015 safety measures, weightings and targetsFor 2015, the safety measures for all executives will continue to be splitequally between AIFR and LTIs. For the AIFR measure, target performance forthe Group has been set at an 8.5 per cent improvement compared with theactual outcome for 2014 which is the threshold number for calculationpurposes. For the LTI measure, a higher improvement rate has been setreflecting an increased focus on injury severity. The target has been set at a14 per cent improvement compared with the actual outcome for 2014 which isthe threshold number for calculation purposes. Outstanding performance forboth measures has been set at twice the target improvement.
The safety STIP score will continue to be adjusted for fatalities. Theadjustment has been modified for the chief executive, chief financial officer,Group executive, Organisational Resources, and Group executive, Legal &Regulatory Affairs to reflect the exposure of these roles to the aggregatedGroup fatalities. The adjustment for fatalities for 2015 in the event a fatalityoccurs, will be:
– For the product group chief executives and the Group executive,Technology & Innovation, the safety score is reduced by 50 per cent if afatality occurs within their respective product groups or function.
– For the chief executive and the Group executive, Organisational Resources,the safety score is reduced by 25 per cent if a fatality occurs in the Group.
– For the chief financial officer and the Group executive, Legal & RegulatoryAffairs, the safety score is reduced by 15 per cent if a fatality occurs in theGroup.
The fatality adjustment for a multiple fatality incident, or multiple incidentsresulting in fatalities, will remain at the discretion of the board in respect ofExecutive Committee members and the chief executive in respect of otheremployees.
When remuneration is deliveredThe following chart provides a timeline of when total remuneration is delivered, using 2014 as an example.
STIP and PSPperformancemeasurementcommences
New base salaryeffective; PSPawards allocated
STIP awardapproved
Jan2014
PSP
STIP
Base salary
Mar2014
Dec2014
Feb2015
Mar2015
STIP cashpaid/BDPsharesallocated
Performance measured
Performance measured Deferred shares (BDP)
5 years
3 years
riotinto.com 85
STRATEG
ICREPO
RT
DIR
EC
TO
RS
’R
EP
OR
T:
REMUNERATIONREPORT:
IMPLEM
ENTA
TIONREPO
RT
FINANCIA
LSTA
TEMEN
TSPR
ODUCTIO
N,R
ESERVES
ANDOPER
ATIO
NS
ADDITIO
NALINFO
RMATIO
N
For
per
sona
l use
onl
y
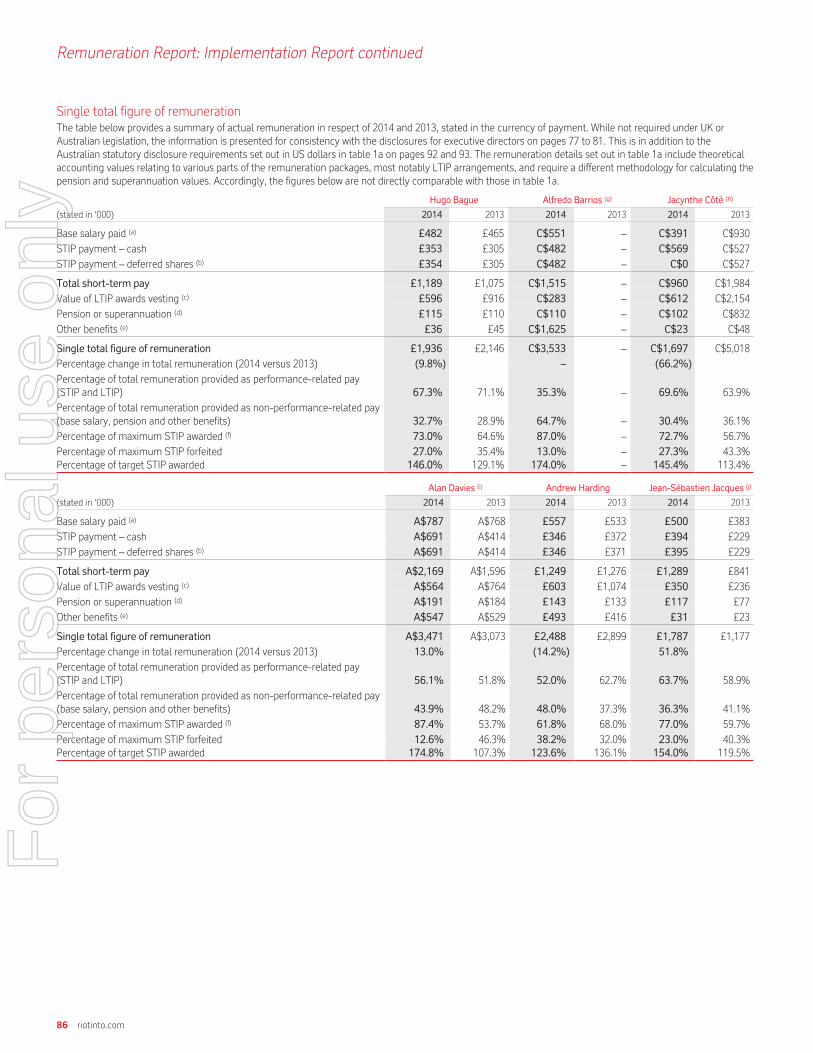
Remuneration Report: Implementation Report continued
Single total figure of remunerationThe table below provides a summary of actual remuneration in respect of 2014 and 2013, stated in the currency of payment. While not required under UK orAustralian legislation, the information is presented for consistency with the disclosures for executive directors on pages 77 to 81. This is in addition to theAustralian statutory disclosure requirements set out in US dollars in table 1a on pages 92 and 93. The remuneration details set out in table 1a include theoreticalaccounting values relating to various parts of the remuneration packages, most notably LTIP arrangements, and require a different methodology for calculating thepension and superannuation values. Accordingly, the figures below are not directly comparable with those in table 1a.
Hugo Bague Alfredo Barrios (g) Jacynthe Côté (h)
(stated in ‘000) 2014 2013 2014 2013 2014 2013
Base salary paid (a) £482 £465 C$551 – C$391 C$930
STIP payment – cash £353 £305 C$482 – C$569 C$527
STIP payment – deferred shares (b) £354 £305 C$482 – C$0 C$527
Total short-term pay £1,189 £1,075 C$1,515 – C$960 C$1,984
Value of LTIP awards vesting (c) £596 £916 C$283 – C$612 C$2,154
Pension or superannuation (d) £115 £110 C$110 – C$102 C$832
Other benefits (e) £36 £45 C$1,625 – C$23 C$48
Single total figure of remuneration £1,936 £2,146 C$3,533 – C$1,697 C$5,018
Percentage change in total remuneration (2014 versus 2013) (9.8%) – (66.2%)
Percentage of total remuneration provided as performance-related pay(STIP and LTIP) 67.3% 71.1% 35.3% – 69.6% 63.9%
Percentage of total remuneration provided as non-performance-related pay(base salary, pension and other benefits) 32.7% 28.9% 64.7% – 30.4% 36.1%
Percentage of maximum STIP awarded (f) 73.0% 64.6% 87.0% – 72.7% 56.7%
Percentage of maximum STIP forfeited 27.0% 35.4% 13.0% – 27.3% 43.3%Percentage of target STIP awarded 146.0% 129.1% 174.0% – 145.4% 113.4%
Alan Davies (i) Andrew Harding Jean-Sébastien Jacques (j)
(stated in ‘000) 2014 2013 2014 2013 2014 2013
Base salary paid (a) A$787 A$768 £557 £533 £500 £383
STIP payment – cash A$691 A$414 £346 £372 £394 £229
STIP payment – deferred shares (b) A$691 A$414 £346 £371 £395 £229
Total short-term pay A$2,169 A$1,596 £1,249 £1,276 £1,289 £841
Value of LTIP awards vesting (c) A$564 A$764 £603 £1,074 £350 £236
Pension or superannuation (d) A$191 A$184 £143 £133 £117 £77
Other benefits (e) A$547 A$529 £493 £416 £31 £23
Single total figure of remuneration A$3,471 A$3,073 £2,488 £2,899 £1,787 £1,177
Percentage change in total remuneration (2014 versus 2013) 13.0% (14.2%) 51.8%
Percentage of total remuneration provided as performance-related pay(STIP and LTIP) 56.1% 51.8% 52.0% 62.7% 63.7% 58.9%
Percentage of total remuneration provided as non-performance-related pay(base salary, pension and other benefits) 43.9% 48.2% 48.0% 37.3% 36.3% 41.1%
Percentage of maximum STIP awarded (f) 87.4% 53.7% 61.8% 68.0% 77.0% 59.7%
Percentage of maximum STIP forfeited 12.6% 46.3% 38.2% 32.0% 23.0% 40.3%Percentage of target STIP awarded 174.8% 107.3% 123.6% 136.1% 154.0% 119.5%
86 riotinto.com
For
per
sona
l use
onl
y
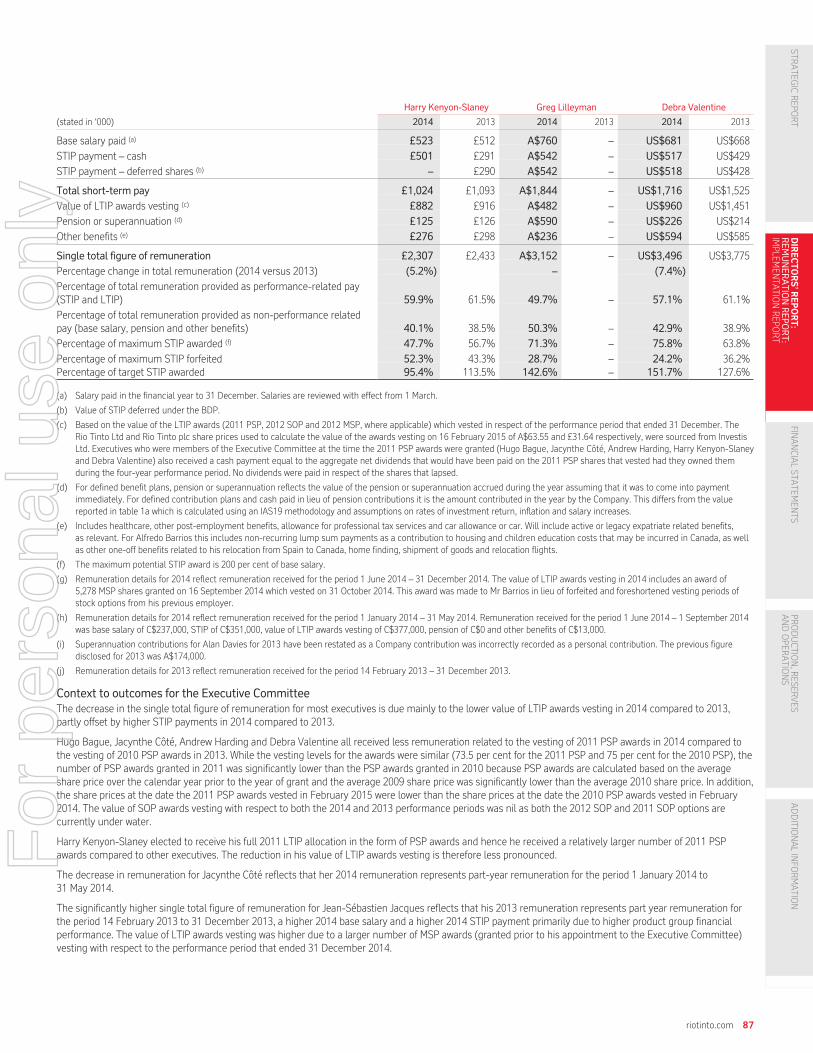
Harry Kenyon-Slaney Greg Lilleyman Debra Valentine
(stated in ‘000) 2014 2013 2014 2013 2014 2013
Base salary paid (a) £523 £512 A$760 – US$681 US$668
STIP payment – cash £501 £291 A$542 – US$517 US$429
STIP payment – deferred shares (b) – £290 A$542 – US$518 US$428
Total short-term pay £1,024 £1,093 A$1,844 – US$1,716 US$1,525
Value of LTIP awards vesting (c) £882 £916 A$482 – US$960 US$1,451
Pension or superannuation (d) £125 £126 A$590 – US$226 US$214
Other benefits (e) £276 £298 A$236 – US$594 US$585
Single total figure of remuneration £2,307 £2,433 A$3,152 – US$3,496 US$3,775
Percentage change in total remuneration (2014 versus 2013) (5.2%) – (7.4%)
Percentage of total remuneration provided as performance-related pay(STIP and LTIP) 59.9% 61.5% 49.7% – 57.1% 61.1%
Percentage of total remuneration provided as non-performance relatedpay (base salary, pension and other benefits) 40.1% 38.5% 50.3% – 42.9% 38.9%
Percentage of maximum STIP awarded (f) 47.7% 56.7% 71.3% – 75.8% 63.8%
Percentage of maximum STIP forfeited 52.3% 43.3% 28.7% – 24.2% 36.2%Percentage of target STIP awarded 95.4% 113.5% 142.6% – 151.7% 127.6%
(a) Salary paid in the financial year to 31 December. Salaries are reviewed with effect from 1 March.
(b) Value of STIP deferred under the BDP.
(c) Based on the value of the LTIP awards (2011 PSP, 2012 SOP and 2012 MSP, where applicable) which vested in respect of the performance period that ended 31 December. TheRio Tinto Ltd and Rio Tinto plc share prices used to calculate the value of the awards vesting on 16 February 2015 of A$63.55 and £31.64 respectively, were sourced from InvestisLtd. Executives who were members of the Executive Committee at the time the 2011 PSP awards were granted (Hugo Bague, Jacynthe Côté, Andrew Harding, Harry Kenyon-Slaneyand Debra Valentine) also received a cash payment equal to the aggregate net dividends that would have been paid on the 2011 PSP shares that vested had they owned themduring the four-year performance period. No dividends were paid in respect of the shares that lapsed.
(d) For defined benefit plans, pension or superannuation reflects the value of the pension or superannuation accrued during the year assuming that it was to come into paymentimmediately. For defined contribution plans and cash paid in lieu of pension contributions it is the amount contributed in the year by the Company. This differs from the valuereported in table 1a which is calculated using an IAS19 methodology and assumptions on rates of investment return, inflation and salary increases.
(e) Includes healthcare, other post-employment benefits, allowance for professional tax services and car allowance or car. Will include active or legacy expatriate related benefits,as relevant. For Alfredo Barrios this includes non-recurring lump sum payments as a contribution to housing and children education costs that may be incurred in Canada, as wellas other one-off benefits related to his relocation from Spain to Canada, home finding, shipment of goods and relocation flights.
(f) The maximum potential STIP award is 200 per cent of base salary.
(g) Remuneration details for 2014 reflect remuneration received for the period 1 June 2014 – 31 December 2014. The value of LTIP awards vesting in 2014 includes an award of5,278 MSP shares granted on 16 September 2014 which vested on 31 October 2014. This award was made to Mr Barrios in lieu of forfeited and foreshortened vesting periods ofstock options from his previous employer.
(h) Remuneration details for 2014 reflect remuneration received for the period 1 January 2014 – 31 May 2014. Remuneration received for the period 1 June 2014 – 1 September 2014was base salary of C$237,000, STIP of C$351,000, value of LTIP awards vesting of C$377,000, pension of C$0 and other benefits of C$13,000.
(i) Superannuation contributions for Alan Davies for 2013 have been restated as a Company contribution was incorrectly recorded as a personal contribution. The previous figuredisclosed for 2013 was A$174,000.
(j) Remuneration details for 2013 reflect remuneration received for the period 14 February 2013 – 31 December 2013.
Context to outcomes for the Executive CommitteeThe decrease in the single total figure of remuneration for most executives is due mainly to the lower value of LTIP awards vesting in 2014 compared to 2013,partly offset by higher STIP payments in 2014 compared to 2013.
Hugo Bague, Jacynthe Côté, Andrew Harding and Debra Valentine all received less remuneration related to the vesting of 2011 PSP awards in 2014 compared tothe vesting of 2010 PSP awards in 2013. While the vesting levels for the awards were similar (73.5 per cent for the 2011 PSP and 75 per cent for the 2010 PSP), thenumber of PSP awards granted in 2011 was significantly lower than the PSP awards granted in 2010 because PSP awards are calculated based on the averageshare price over the calendar year prior to the year of grant and the average 2009 share price was significantly lower than the average 2010 share price. In addition,the share prices at the date the 2011 PSP awards vested in February 2015 were lower than the share prices at the date the 2010 PSP awards vested in February2014. The value of SOP awards vesting with respect to both the 2014 and 2013 performance periods was nil as both the 2012 SOP and 2011 SOP options arecurrently under water.
Harry Kenyon-Slaney elected to receive his full 2011 LTIP allocation in the form of PSP awards and hence he received a relatively larger number of 2011 PSPawards compared to other executives. The reduction in his value of LTIP awards vesting is therefore less pronounced.
The decrease in remuneration for Jacynthe Côté reflects that her 2014 remuneration represents part-year remuneration for the period 1 January 2014 to31 May 2014.
The significantly higher single total figure of remuneration for Jean-Sébastien Jacques reflects that his 2013 remuneration represents part year remuneration forthe period 14 February 2013 to 31 December 2013, a higher 2014 base salary and a higher 2014 STIP payment primarily due to higher product group financialperformance. The value of LTIP awards vesting was higher due to a larger number of MSP awards (granted prior to his appointment to the Executive Committee)vesting with respect to the performance period that ended 31 December 2014.
riotinto.com 87
STRATEG
ICREPO
RT
DIR
EC
TO
RS
’R
EP
OR
T:
REMUNERATIONREPORT:
IMPLEM
ENTA
TIONREPO
RT
FINANCIA
LSTA
TEMEN
TSPR
ODUCTIO
N,R
ESERVES
ANDOPER
ATIO
NS
ADDITIO
NALINFO
RMATIO
N
For
per
sona
l use
onl
y

Remuneration Report: Implementation Report continued
Potential value of 2015 remuneration packageThe table below shows the potential minimum and maximum value of the 2015 remuneration package and the threshold, target and maximum value of the 2015STIP and LTIP awards.
Stated in ‘000 Currency Base salarySuperannuation
or pension(a) Benefits(b)
Minimumpotential
remuneration(c)
Thresholdvalue ofSTIP and
LTIP awards(d)
Targetvalue ofSTIP and
LTIP awards(e)
Maximumvalue ofSTIP and
LTIP awards(f)
Maximumpotential
remuneration
Executive directors
Sam Walsh A$ A$1,992 A$450 A$948 A$3,390 A$3,122 A$6,673 A$12,550 A$15,940
Chris Lynch £ £836 £208 £107 £1,151 £1,310 £2,801 £5,267 £6,418
Other executives
Hugo Bague £ £494 £115 £36 £645 £725 £1,556 £3,112 £3,757
Alfredo Barrios C$ C$964 C$336 C$185 C$1,485 C$1,350 C$2,892 C$5,784 C$7,269
Alan Davies £ £540 £130 £681 £1,351 £780 £1,674 £3,348 £4,699
Andrew Harding £ £571 £143 £493 £1,207 £825 £1,770 £3,540 £4,747
Jean-Sébastien Jacques £ £553 £133 £31 £717 £799 £1,714 £3,429 £4,146
Greg Lilleyman A$ A$778 A$590 A$110 A$1,478 A$1,089 A$2,334 A$4,668 A$6,146
Debra Valentine US$ US$696 US$226 US$594 US$1,516 US$974 US$2,088 US$4,176 US$5,692
(a) Superannuation or pension is measured at the superannuation or pension figure in the single figure tables on pages 86 to 87, adjusted accordingly for Alfredo Barrios where thevalue for 2014 did not represent a full year.
(b) Benefits are as measured at the benefits figure in the single figure tables on pages 86 to 87, excluding any significant one-off items where applicable. One-off items for AlfredoBarrios in 2014 included a housing allowance, an education assistance allowance and various other relocation related benefits for his relocation to Montreal. One-off items for GregLilleyman in 2014 included benefits relating to his relocation from Perth to Brisbane. Note that this number includes expatriate benefits which are not capped and are subject toexchange rate fluctuations.
(c) The sum of base salary, pension/superannuation and benefits is the minimum potential remuneration (fixed remuneration).
(d) Calculated based on threshold performance under the STIP (50 per cent of STIP target) and threshold PSP vesting (22.5 per cent of the face value of the 2015 PSP award).
(e) Calculated based on target performance under the STIP (100 per cent of STIP target) and target PSP vesting (50 per cent of the face value of the 2015 PSP award).
(f) Calculated based on outstanding performance under the STIP (200 per cent of base salary) and maximum PSP vesting (100 per cent of the face value of the 2015 PSP award).
(g) Harry Kenyon-Slaney is not listed above as he ceased to be a member of the Executive Committee on 27 February 2015.
88 riotinto.com
For
per
sona
l use
onl
y

Long-term incentives – awards made prior to 2013In 2012 and prior years, awards were made in the form of options under theShare Option Plan (SOP) and/or performance shares under the PSP.
For 2011 and 2012, executives were able to express a preference regarding themix of their long-term incentive opportunity.
– They could choose either a mix of performance shares and share options(with a maximum face value performance share award of 200 per cent ofbase salary, and a performance “kicker” leading to a vesting up to 1.5times for exceptional performance), together with a maximum shareoption award of 300 per cent of base salary.
– Or alternatively, they could choose to receive the full award inperformance shares (with a maximum face value performance share awardof 292 per cent of base salary, and a performance kicker leading to avesting up to 1.5 times for exceptional performance).
– The maximum value of award from selecting the full award in performanceshares was therefore 438 per cent of base salary (292 per centx 150 per cent).
– The total expected value of awards made under either preference was thesame, at 190 per cent of base salary.
– Both awards were based solely on relative TSR performance to rewardexecutives for increasing the share price and delivering superior TSRperformance against other companies over a long-term timeframe.
Before awards vest, the Committee must also satisfy itself that TSRperformance is an appropriate reflection of the underlying performance of thebusiness and/or the health of the Group. The Committee may therefore adjustvesting subject to the plan rules.
Long-term incentives – vesting outcomes for the period ended31 December 2014The awards with performance periods ending 31 December 2014 were the2011 PSP awards and the 2012 SOP awards.
2011 PSP awards
Performance period (4 years) 1 January 2011 – 31 December 2014Rio Tinto TSR 0.8%
Comparator index HSBC MSCI
Index TSR (34.2%) 62.5%
Outperformance per annum 7.8% (21.3%)
Vesting against index 147% 0%
% of shares vested 73.5% (49% of maximum)
% of shares forfeited 76.5% (51% of maximum)
The performance conditions for the 2011, 2012 and 2013 PSP awards areincluded in the notes to table 3 on pages 96 to 100.
The methodology used to calculate the starting share prices for TSRcomparison purposes, for Rio Tinto and the index, was the 12-month averageprior to the commencement of the performance period.
The methodology used to calculate the ending share prices for TSRcomparison purposes, for Rio Tinto and the index, was the last 12 months inthe performance period. The usual conventions were also applied to set thenumber of options awarded, based upon the prior year average share price.
riotinto.com 89
STRATEG
ICREPO
RT
DIR
EC
TO
RS
’R
EP
OR
T:
REMUNERATIONREPORT:
IMPLEM
ENTA
TIONREPO
RT
FINANCIA
LSTA
TEMEN
TSPR
ODUCTIO
N,R
ESERVES
ANDOPER
ATIO
NS
ADDITIO
NALINFO
RMATIO
N
For
per
sona
l use
onl
y

Remuneration Report: Implementation Report continued
The table below summarises the average vesting of performance shares forexecutive directors over the five-year period 2011– 2015.
Performance period Vesting year% of shares
vested% of maximumshares vested
2007 – 2010 2011 36.4 24.3
2008 – 2011 2012 0.0 0.0
2009 – 2012 2013 92.5 61.7
2010 – 2013 2014 75.0 50.0
2011 – 2014 2015 73.5 49.0
Average vesting – 55.5 37.0
2012 SOP awards
Performance period (3 years) 1 January 2012 – 31 December 2014
Rio Tinto TSR (10.9%)
HSBC Global Mining Index TSR (41.2%)
Rio Tinto outperformance 30.3%
Outperformance required forfull vesting 15.8%
% of options vested 100%% of options forfeited 0%
Options awarded under the 2012 SOP can be exercised from 19 March 2015until 19 March 2022.
The performance conditions for the 2012 SOP awards are included in thenotes to table 3 on page 100.
The methodology used to calculate the starting share prices for TSRcomparison purposes, for Rio Tinto and the index, was the 12-month averageprior to the commencement of the performance period.
The methodology used to calculate the ending share prices for TSRcomparison purposes, for Rio Tinto and the index, was the last 12 months inthe performance period. The usual conventions were also applied to set thenumber of options awarded, based upon the prior year average share price.
The table below summarises the average vesting of share options forexecutive directors over the five-year period 2011– 2015.
Performance period Vesting year% of options
vested
2008 – 2010 2011 0.0
2009 – 2011 2012 100.0
2010 – 2012 2013 100.0
2011 – 2013 2014 100.0
2012 – 2014 2015 100.0
Average vesting – 80.0
The SOP ceased operation from 2013. No awards of share options have beenmade since 2012.
MSP awardsAlthough executives are not eligible to receive awards under the MSP aftertheir appointment as executives, Alan Davies, Jean-Sébastien Jacques andGreg Lilleyman received grants prior to their appointments as PGCEOs.
Alfredo Barrios received an award of 5,278 MSP shares on 16 September 2014which vested on 31 October 2014. This award was made in lieu of forfeited andforeshortened vesting periods of stock options from his previous employer.
Plan period Plan period that ended 31 December 2014
Vesting period 19 March 2012 – 31 December 2014
% of shares vested 100
% of shares forfeited –
TSR and relevant index TSRRelative TSR is the single performance measure used to determine the vestingof awards made under the PSP and SOP prior to 2013. Rio Tinto’s TSR relativeto the relevant index over the performance period has a direct impact on thelevels of LTIP vesting.
The effect of this performance on shareholder wealth, as measured by TSRdelivered during the relevant calendar year, is detailed in the table.
Dividendspaid during
the year
Share price –Rio Tinto plc
pence
Share price –Rio TintoLimited
A$
Totalshareholder
return(TSR)
YearUS centsper share 1 Jan 31 Dec 1 Jan 31 Dec Group %
2014 204.5 3,409 3,000 68.18 58.00 (9.7)
2013 178.0 3,512 3,409 66.01 68.18 2.1
2012 163.5 3,125 3,512 60.30 66.01 14.8
2011 117.0 4,487 3,125 85.47 60.30 (31.2)2010 90.0 3,390 4,487 74.89 85.47 31.6
The graph below illustrates the TSR performance of the Group against theHSBC Global Mining Index and the MSCI over the past five years to the end of2014. These two indices are used to assess Rio Tinto’s relative TSRperformance for awards made under the PSP in 2011 and 2012. The HSBCGlobal Mining Index alone is used to determine the vesting of awards madeunder the SOP.
The graph has been prepared in accordance with the requirements ofSchedule 8 of the Large and Medium-sized Companies and Groups (Accountsand Reports) Regulations 2008 (as amended) and is not an indication of thelikely vesting of awards granted under the PSP and SOP. The executiveremuneration structure policy table on pages 67 to 69 provides further detailsof the performance conditions for the current PSP. The performanceconditions for the previous PSP and the SOP are provided in the notes to table3 on pages 99 and 100.
Total return basis Index 2008 = 100
500
400
300
200
100
0
2008
Rio Tinto DLC
HSBC Index
MSCI World Index
2009
Key2010 2011 2012 2013 2014
TSR (US$) – Rio Tinto Group vs. the HSBC Global Mining and MSCI World indices
90 riotinto.com
For
per
sona
l use
onl
y
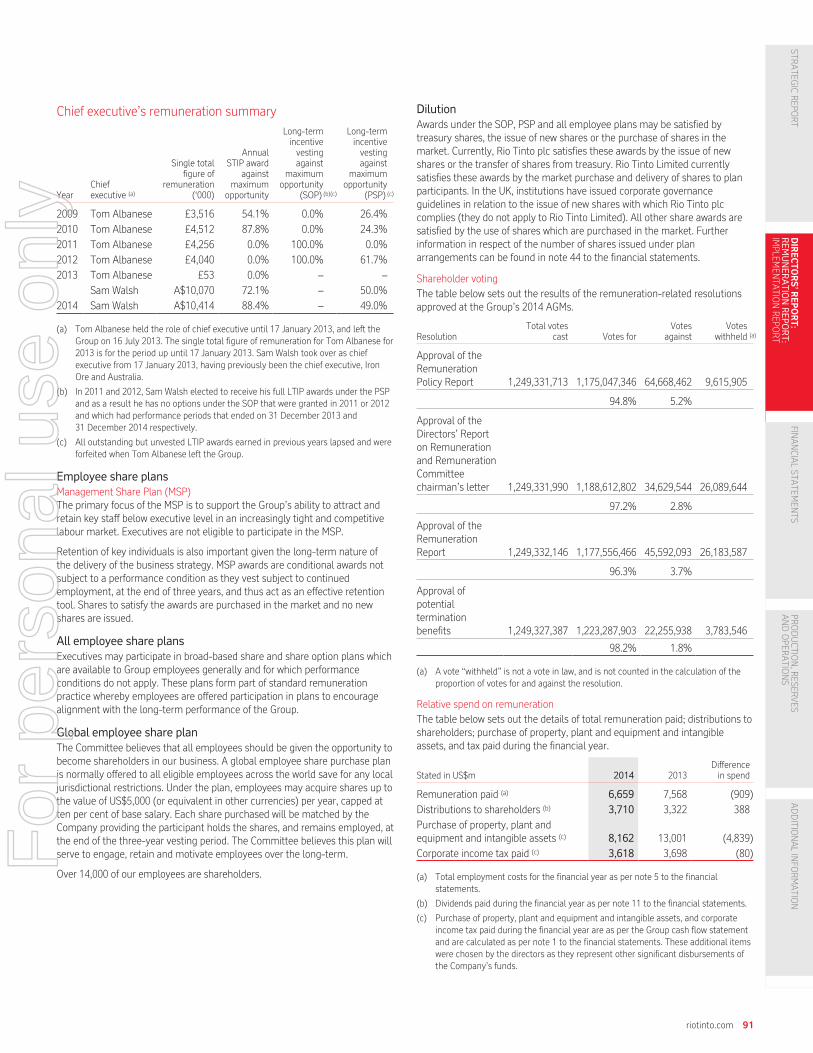
Chief executive’s remuneration summary
YearChiefexecutive (a)
Single totalfigure of
remuneration(‘000)
AnnualSTIP award
againstmaximum
opportunity
Long-termincentivevestingagainst
maximumopportunity
(SOP) (b)(c)
Long-termincentivevestingagainst
maximumopportunity
(PSP) (c)
2009 Tom Albanese £3,516 54.1% 0.0% 26.4%
2010 Tom Albanese £4,512 87.8% 0.0% 24.3%
2011 Tom Albanese £4,256 0.0% 100.0% 0.0%
2012 Tom Albanese £4,040 0.0% 100.0% 61.7%
2013 Tom Albanese £53 0.0% – –
Sam Walsh A$10,070 72.1% – 50.0%
2014 Sam Walsh A$10,414 88.4% – 49.0%
(a) Tom Albanese held the role of chief executive until 17 January 2013, and left theGroup on 16 July 2013. The single total figure of remuneration for Tom Albanese for2013 is for the period up until 17 January 2013. Sam Walsh took over as chiefexecutive from 17 January 2013, having previously been the chief executive, IronOre and Australia.
(b) In 2011 and 2012, Sam Walsh elected to receive his full LTIP awards under the PSPand as a result he has no options under the SOP that were granted in 2011 or 2012and which had performance periods that ended on 31 December 2013 and31 December 2014 respectively.
(c) All outstanding but unvested LTIP awards earned in previous years lapsed and wereforfeited when Tom Albanese left the Group.
Employee share plansManagement Share Plan (MSP)The primary focus of the MSP is to support the Group’s ability to attract andretain key staff below executive level in an increasingly tight and competitivelabour market. Executives are not eligible to participate in the MSP.
Retention of key individuals is also important given the long-term nature ofthe delivery of the business strategy. MSP awards are conditional awards notsubject to a performance condition as they vest subject to continuedemployment, at the end of three years, and thus act as an effective retentiontool. Shares to satisfy the awards are purchased in the market and no newshares are issued.
All employee share plansExecutives may participate in broad-based share and share option plans whichare available to Group employees generally and for which performanceconditions do not apply. These plans form part of standard remunerationpractice whereby employees are offered participation in plans to encouragealignment with the long-term performance of the Group.
Global employee share planThe Committee believes that all employees should be given the opportunity tobecome shareholders in our business. A global employee share purchase planis normally offered to all eligible employees across the world save for any localjurisdictional restrictions. Under the plan, employees may acquire shares up tothe value of US$5,000 (or equivalent in other currencies) per year, capped atten per cent of base salary. Each share purchased will be matched by theCompany providing the participant holds the shares, and remains employed, atthe end of the three-year vesting period. The Committee believes this plan willserve to engage, retain and motivate employees over the long-term.
Over 14,000 of our employees are shareholders.
DilutionAwards under the SOP, PSP and all employee plans may be satisfied bytreasury shares, the issue of new shares or the purchase of shares in themarket. Currently, Rio Tinto plc satisfies these awards by the issue of newshares or the transfer of shares from treasury. Rio Tinto Limited currentlysatisfies these awards by the market purchase and delivery of shares to planparticipants. In the UK, institutions have issued corporate governanceguidelines in relation to the issue of new shares with which Rio Tinto plccomplies (they do not apply to Rio Tinto Limited). All other share awards aresatisfied by the use of shares which are purchased in the market. Furtherinformation in respect of the number of shares issued under planarrangements can be found in note 44 to the financial statements.
Shareholder votingThe table below sets out the results of the remuneration-related resolutionsapproved at the Group’s 2014 AGMs.
ResolutionTotal votes
cast Votes forVotes
againstVotes
withheld (a)
Approval of theRemunerationPolicy Report 1,249,331,713 1,175,047,346 64,668,462 9,615,905
94.8% 5.2%
Approval of theDirectors’ Reporton Remunerationand RemunerationCommitteechairman’s letter 1,249,331,990 1,188,612,802 34,629,544 26,089,644
97.2% 2.8%
Approval of theRemunerationReport 1,249,332,146 1,177,556,466 45,592,093 26,183,587
96.3% 3.7%
Approval ofpotentialterminationbenefits 1,249,327,387 1,223,287,903 22,255,938 3,783,546
98.2% 1.8%
(a) A vote “withheld” is not a vote in law, and is not counted in the calculation of theproportion of votes for and against the resolution.
Relative spend on remunerationThe table below sets out the details of total remuneration paid; distributions toshareholders; purchase of property, plant and equipment and intangibleassets, and tax paid during the financial year.
Stated in US$m 2014 2013Differencein spend
Remuneration paid (a) 6,659 7,568 (909)
Distributions to shareholders (b) 3,710 3,322 388
Purchase of property, plant andequipment and intangible assets (c) 8,162 13,001 (4,839)
Corporate income tax paid (c) 3,618 3,698 (80)
(a) Total employment costs for the financial year as per note 5 to the financialstatements.
(b) Dividends paid during the financial year as per note 11 to the financial statements.
(c) Purchase of property, plant and equipment and intangible assets, and corporateincome tax paid during the financial year are as per the Group cash flow statementand are calculated as per note 1 to the financial statements. These additional itemswere chosen by the directors as they represent other significant disbursements ofthe Company’s funds.
riotinto.com 91
STRATEG
ICREPO
RT
DIR
EC
TO
RS
’R
EP
OR
T:
REMUNERATIONREPORT:
IMPLEM
ENTA
TIONREPO
RT
FINANCIA
LSTA
TEMEN
TSPR
ODUCTIO
N,R
ESERVES
ANDOPER
ATIO
NS
ADDITIO
NALINFO
RMATIO
N
For
per
sona
l use
onl
y
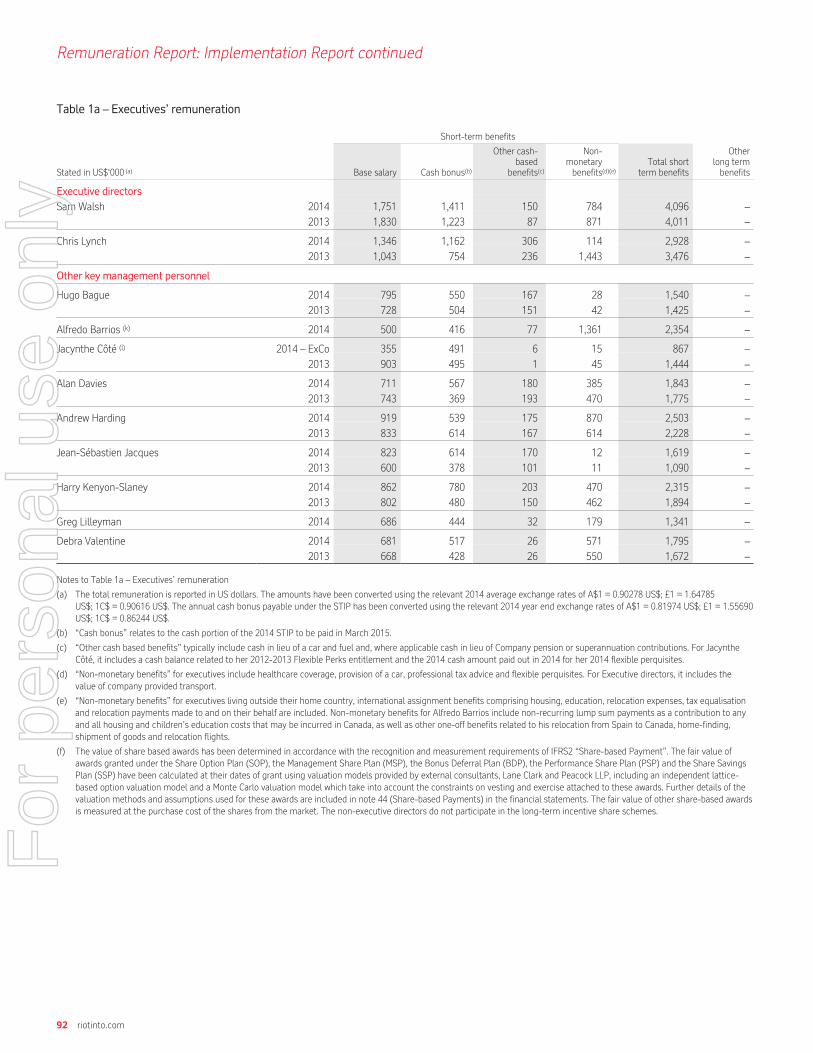
Remuneration Report: Implementation Report continued
Table 1a – Executives’ remuneration
Short-term benefits
Stated in US$‘000 (a) Base salary Cash bonus(b)
Other cash-based
benefits(c)
Non-monetarybenefits(d)(e)
Total shortterm benefits
Otherlong termbenefits
Executive directors
Sam Walsh 2014 1,751 1,411 150 784 4,096 –
2013 1,830 1,223 87 871 4,011 –
Chris Lynch 2014 1,346 1,162 306 114 2,928 –
2013 1,043 754 236 1,443 3,476 –
Other key management personnel
Hugo Bague 2014 795 550 167 28 1,540 –
2013 728 504 151 42 1,425 –
Alfredo Barrios (k) 2014 500 416 77 1,361 2,354 –
Jacynthe Côté (l) 2014 – ExCo 355 491 6 15 867 –
2013 903 495 1 45 1,444 –
Alan Davies 2014 711 567 180 385 1,843 –
2013 743 369 193 470 1,775 –
Andrew Harding 2014 919 539 175 870 2,503 –
2013 833 614 167 614 2,228 –
Jean-Sébastien Jacques 2014 823 614 170 12 1,619 –
2013 600 378 101 11 1,090 –
Harry Kenyon-Slaney 2014 862 780 203 470 2,315 –
2013 802 480 150 462 1,894 –
Greg Lilleyman 2014 686 444 32 179 1,341 –
Debra Valentine 2014 681 517 26 571 1,795 –
2013 668 428 26 550 1,672 –
Notes to Table 1a – Executives’ remuneration
(a) The total remuneration is reported in US dollars. The amounts have been converted using the relevant 2014 average exchange rates of A$1 = 0.90278 US$; £1 = 1.64785US$; 1C$ = 0.90616 US$. The annual cash bonus payable under the STIP has been converted using the relevant 2014 year end exchange rates of A$1 = 0.81974 US$; £1 = 1.55690US$; 1C$ = 0.86244 US$.
(b) “Cash bonus” relates to the cash portion of the 2014 STIP to be paid in March 2015.
(c) “Other cash based benefits” typically include cash in lieu of a car and fuel and, where applicable cash in lieu of Company pension or superannuation contributions. For JacyntheCôté, it includes a cash balance related to her 2012-2013 Flexible Perks entitlement and the 2014 cash amount paid out in 2014 for her 2014 flexible perquisites.
(d) “Non-monetary benefits” for executives include healthcare coverage, provision of a car, professional tax advice and flexible perquisites. For Executive directors, it includes thevalue of company provided transport.
(e) “Non-monetary benefits” for executives living outside their home country, international assignment benefits comprising housing, education, relocation expenses, tax equalisationand relocation payments made to and on their behalf are included. Non-monetary benefits for Alfredo Barrios include non-recurring lump sum payments as a contribution to anyand all housing and children’s education costs that may be incurred in Canada, as well as other one-off benefits related to his relocation from Spain to Canada, home-finding,shipment of goods and relocation flights.
(f) The value of share based awards has been determined in accordance with the recognition and measurement requirements of IFRS2 “Share-based Payment”. The fair value ofawards granted under the Share Option Plan (SOP), the Management Share Plan (MSP), the Bonus Deferral Plan (BDP), the Performance Share Plan (PSP) and the Share SavingsPlan (SSP) have been calculated at their dates of grant using valuation models provided by external consultants, Lane Clark and Peacock LLP, including an independent lattice-based option valuation model and a Monte Carlo valuation model which take into account the constraints on vesting and exercise attached to these awards. Further details of thevaluation methods and assumptions used for these awards are included in note 44 (Share-based Payments) in the financial statements. The fair value of other share-based awardsis measured at the purchase cost of the shares from the market. The non-executive directors do not participate in the long-term incentive share schemes.
92 riotinto.com
For
per
sona
l use
onl
y

Long-term benefitsValue of share-based awards(f) Post-employment benefits (i)
Stated in US$’000 (a) BDP (g) PSP MSP SOP Others (h)Pension and
superannuation
Other post-employment
benefitsTermination
benefitsTotal
remuneration (j)
Currencyof actualpayment
Executive directors
Sam Walsh 2014 1,002 3,645 – – 2 421 – – 9,166 A$
2013 1,189 3,386 – 160 2 453 – – 9,201 A$
Chris Lynch 2014 330 1,291 – – – 55 – – 4,604 £
2013 176 399 – – – 44 – – 4,095 £
Other key management personnel
Hugo Bague 2014 385 1,409 – 314 3 44 – – 3,695 £
2013 402 1,147 – 546 6 42 – – 3,568 £
Alfredo Barrios (k) 2014 51 135 257 – – 23 – – 2,820 C$
Jacynthe Côté (l) 2014 – ExCo 119 684 – 251 1 197 – – 2,119 C$
2013 433 1,543 – 745 1 510 – – 4,676 C$
Alan Davies 2014 286 880 92 – 2 25 – – 3,128 A$
2013 228 563 195 – 3 20 – – 2,774 A$
Andrew Harding 2014 423 1,597 – 318 5 61 – – 4,907 £
2013 455 1,390 – 566 10 56 – – 4,705 £
Jean-Sébastien Jacques 2014 216 785 154 – 1 44 – – 2,819 £
2013 115 212 310 – 4 37 – – 1,768 £
Harry Kenyon-Slaney 2014 320 1,670 – 222 9 179 – – 4,715 £
2013 422 1,336 – 287 1 157 – – 4,097 £
Greg Lilleyman 2014 152 522 154 – – 169 – – 2,338 A$
Debra Valentine 2014 363 1,320 – 305 2 226 5 – 4,016 US$2013 395 1,115 – 535 1 214 5 – 3,937 US$
(g) “BDP (Bonus Deferral Plan)” represents the deferral of the 2011 – 2014 bonus under STIP into Rio Tinto Shares.
(h) “Others” include the Global Employee Share Plan (myShare), Share Savings Plan, Share Ownership Plan and Global Employee Share Plan as described in the Remuneration reporton page 72.
(i) The costs shown for defined benefit pension plans and post-retirement medical benefits are the service costs attributable to the individual, calculated in accordance with IAS19.The cost for defined contribution plans is the amount contributed in the year by the Company. The table 1a value of Jacynthe Côté’s pension benefits between 1 June and1 September 2014 was US$118,000. For Alan Davies, we have restated the 2013 “Pension and superannuation” value as some Company contributions were incorrectly recorded asemployee contributions. The restated amount for 2013 is U$20,000 whilst the amount shown in the 2013 report was US$10,000.
(j) “Total remuneration” represents the disclosure of total emoluments and compensation required under the Australian Corporations Act 2001 and applicable accounting standards.
(k) Alfredo Barrios joined Rio Tinto and became a member of the Executive Committee on 1 June 2014. Therefore, the amounts reported for him in table 1a relate to the period from1 June 2014 to 31 December 2014. The MSP amount for Alfredo Barrios reflects the value of an award of 5,278 MSP shares which he received on 16 September 2014. This awardwas made in lieu of forfeited and foreshortened vesting periods of stock options from his previous employer. The award vested on 31 October 2014.
(l) Jacynthe Côté stepped down from the Executive Committee on 31 May 2014 and remained with the Group in an advisory role until 1 September 2014. The amounts reported intable 1a relate to the period when she was a member of the Executive Committee.
riotinto.com 93
STRATEG
ICREPO
RT
DIR
EC
TO
RS
’R
EP
OR
T:
REMUNERATIONREPORT:
IMPLEM
ENTA
TIONREPO
RT
FINANCIA
LSTA
TEMEN
TSPR
ODUCTIO
N,R
ESERVES
ANDOPER
ATIO
NS
ADDITIO
NALINFO
RMATIO
N
For
per
sona
l use
onl
y

Remuneration Report: Implementation Report continued
Table 1b – Non-executive directors’ remuneration
Stated in US$’000 (a)Fees and
allowances (b)Non-monetary
benefits (c)(d)
Single totalfigure of
remuneration (e)
Chairman
Jan du Plessis 2014 1,203 92 1,295
2013 1,119 121 1,240
Non-executive directors
Robert Brown 2014 286 50 336
2013 246 74 320
Megan Clark (f) 2014 21 – 21
Vivienne Cox (g) 2014 54 16 70
2013 184 14 198
Michael L’Estrange (h) 2014 91 – 91
Michael Fitzpatrick 2014 284 – 284
2013 294 – 294
Ann Godbehere 2014 251 23 274
2013 246 22 268
Richard Goodmanson 2014 350 20 370
2013 340 97 437
Anne Lauvergeon (i) 2014 180 11 191
Lord Kerr 2014 218 13 231
2013 222 14 236
Paul Tellier 2014 309 67 376
2013 293 71 364
Simon Thompson 2014 172 3 175
John Varley 2014 342 10 352
2013 325 18 343
Notes to Table 1b – Non-executive directors’ remuneration
(a) The remuneration is reported in US dollars. The amounts have been converted using the relevant 2014 average exchange rates of £1 = 1.64785 US$ and A$1 = 0.90278 US$ (1 Janto 31 Dec 2014) average.
(b) “Fees and allowances” comprise the total fees for the chairman and all non-executive directors and travel allowances for the non-executive directors (other than the chairman).The payment of statutory minimum superannuation contributions for Australian non-executive directors is required by Australian superannuation law. These contributions areincluded in the Fees and Allowances amount disclosed for Australian non-executive directors.
(c) “Non-monetary benefits” include, as in the previous year, amounts which are deemed by the UK tax authorities to be benefits in kind relating largely to the costs of non-executivedirectors’ expenses in attending Board meetings held at the Company’s UK registered office (including associated hotel and subsistence expenses). Given these expenses areincurred by directors in the fulfilment of their duties, the Company pays the tax on them.
(d) In 2014, the following additional amounts are included as noted for the relevant director. For Jan du Plessis, the value of company-provided transport and medical insurancepremiums. For Vivienne Cox, a gift received from Rio Tinto at retirement. For Richard Goodmanson, accountancy fees.
(e) Represents disclosure of the single total figure of remuneration under Schedule 8 of the Large and Medium-sized Companies and Groups (Accounts and Reports) Regulations2008 (as amended) and total remuneration under the Australian Corporations Act 2001 and applicable accounting standards.
(f) The amounts reported for Megan Clark reflect the period when she was a member of the board from 20 November to 31 December 2014.
(g) The amounts reported for Vivienne Cox reflect the period when she was a member of the board from 1 January to 15 April 2014.
(h) The amounts reported for Michael L’Estrange reflect the period when he was a member of the board from 1 September to 31 December 2014.
(i) The amounts reported for Anne Lauvergeon reflect the period when she was a member of the board from 15 March to 31 December 2014.
94 riotinto.com
For
per
sona
l use
onl
y

Table 2 – Directors’ and executives’ beneficial interests in Rio Tinto shares
Rio Tinto plc (a) Rio Tinto Limited Movements
1 Jan2014 (b)
31 Dec2014 (c)
16 Feb2015 (c)
1 Jan2014 (b)
31 Dec2014 (c)
16 Feb2015 (c)
Exercise ofoptions (d) Compensation (e) Other (f)
Directors
Robert Brown 4,200 4,200 4,200 – – – – – –
Megan Clark (g) – – – 165 165 1,715 – – 1,550
Vivienne Cox (g) 2,912 2,912 – – – – – – –
Jan du Plessis 30,000 30,000 30,000 – – – – – –
Michael Fitzpatrick – – – 6,252 6,252 6,252 – – –
Ann Godbehere 2,981 3,100 3,100 – – – – – 119
Richard Goodmanson 15,443 5,512 5,512 – – – – – (9,931)
Lord Kerr 15,000 15,000 15,000 – – – – – –
Anne Lauvergeon (g) – 3,350 3,350 – – – – – 3,350
Michael L’Estrange (g) – – – 303 303 303 – – –
Chris Lynch 2,070 2,160 2,160 6,890 6,890 6,890 – 89 1
Paul Tellier 18,490 21,022 21,022 – – – – – 2,532
Simon Thompson (g) 7,458 7,458 7,458 – – – – – –
John Varley 2,985 9,685 9,685 – – – – – 6,700
Sam Walsh – – – 94,444 146,993 181,003 125 107,270 (20,836)
Executives
Hugo Bague 39,708 60,964 60,990 – – – 15,714 48,352 (42,785)
Alfredo Barrios (g) – 2,585 2,610 – – – – 5,311 (2,700)
Jacynthe Côté (g) 39,899 57,967 – – – – – 34,657 (16,589)
Alan Davies – – – 15,920 23,521 23,547 323 13,617 (6,312)
Andrew Harding 4,466 8,618 8,618 24,684 36,605 36,605 – 31,177 (15,104)
Jean-Sébastien Jacques 4,528 9,565 11,402 – – – – 12,332 (5,448)
Harry Kenyon-Slaney 32,506 47,944 48,391 – – – 434 31,184 (15,733)
Greg Lilleyman (g) – – – 23,133 31,226 34,865 – 13,548 (1,816)
Debra Valentine 33,926 50,571 50,599 – – – – 31,965 (15,292)
Notes to table 2
(a) Rio Tinto plc ordinary shares or American Depositary Shares.
(b) Or date of appointment, if later.
(c) Or date of retirement or at date no longer a member of the Executive Committee, if earlier.
(d) Shares obtained through the exercise of options under the Rio Tinto Share Savings Plan or the Share Option Plan. The number of shares retained may differ from the number ofoptions exercised.
(e) Shares obtained through the Rio Tinto Share Ownership Plan and/or vesting of awards under the PSP, MSP and BDP.
(f) Share movements due to sale or purchase of shares, shares received under the Dividend Reinvestment Plan, shares purchased/sold through the Rio Tinto America Savings Plan ornon-executive directors’ Share Purchase Plan.
(g) Megan Clark, Anne Lauvergeon, Michael L’Estrange and Simon Thompson were appointed as directors on 20 November 2014, 15 March 2014, 1 September 2014 and 1 April 2014respectively. Vivienne Cox retired as a director on 15 April 2014. Greg Lilleyman was appointed on 1 January 2014, Alfredo Barrios was appointed on 1 June 2014 and JacyntheCoté resigned from the Executive Committee on 31 May 2014.
(h) Interests in outstanding awards under LTIPs and option plans are set out in table 3.
riotinto.com 95
STRATEG
ICREPO
RT
DIR
EC
TO
RS
’R
EP
OR
T:
REMUNERATIONREPORT:
IMPLEM
ENTA
TIONREPO
RT
FINANCIA
LSTA
TEMEN
TSPR
ODUCTIO
N,R
ESERVES
ANDOPER
ATIO
NS
ADDITIO
NALINFO
RMATIO
N
For
per
sona
l use
onl
y
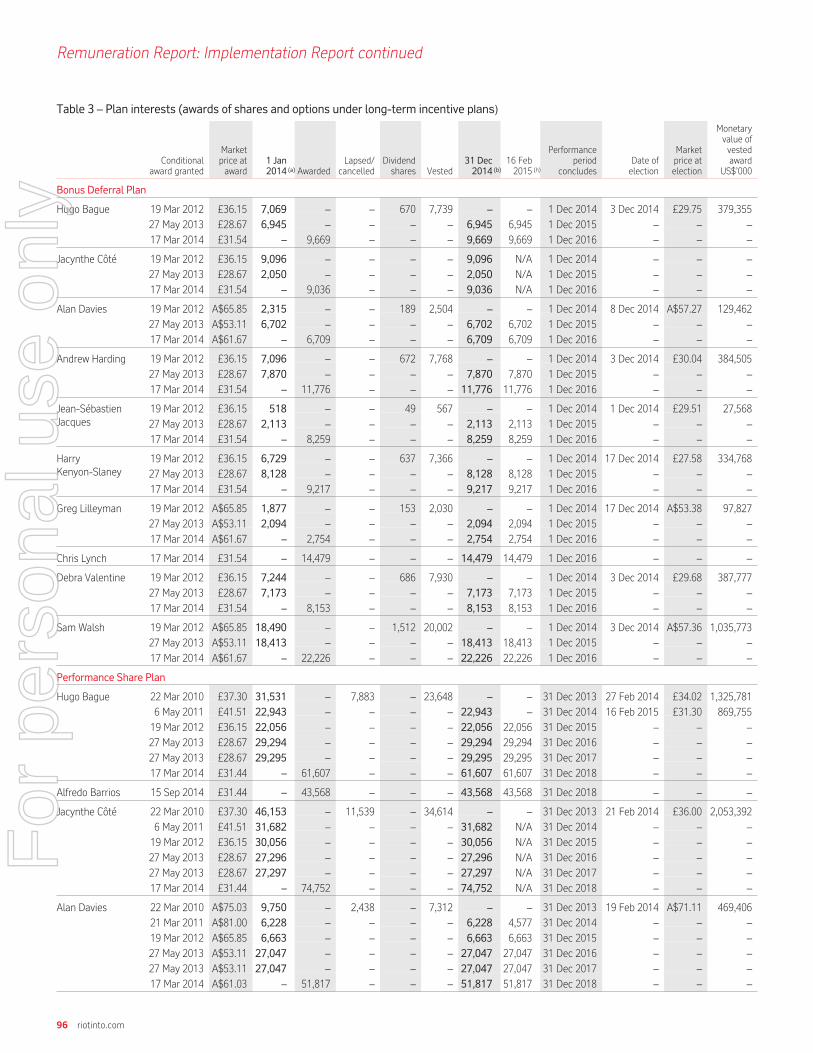
Remuneration Report: Implementation Report continued
Table 3 – Plan interests (awards of shares and options under long-term incentive plans)
Conditionalaward granted
Marketprice ataward
1 Jan2014 (a) Awarded
Lapsed/cancelled
Dividendshares Vested
31 Dec2014 (b)
16 Feb2015 (h)
Performanceperiod
concludesDate ofelection
Marketprice atelection
Monetaryvalue ofvestedaward
US$’000
Bonus Deferral Plan
Hugo Bague 19 Mar 2012 £36.15 7,069 – – 670 7,739 – – 1 Dec 2014 3 Dec 2014 £29.75 379,355
27 May 2013 £28.67 6,945 – – – – 6,945 6,945 1 Dec 2015 – – –
17 Mar 2014 £31.54 – 9,669 – – – 9,669 9,669 1 Dec 2016 – – –
Jacynthe Côté 19 Mar 2012 £36.15 9,096 – – – – 9,096 N/A 1 Dec 2014 – – –
27 May 2013 £28.67 2,050 – – – – 2,050 N/A 1 Dec 2015 – – –
17 Mar 2014 £31.54 – 9,036 – – – 9,036 N/A 1 Dec 2016 – – –
Alan Davies 19 Mar 2012 A$65.85 2,315 – – 189 2,504 – – 1 Dec 2014 8 Dec 2014 A$57.27 129,462
27 May 2013 A$53.11 6,702 – – – – 6,702 6,702 1 Dec 2015 – – –
17 Mar 2014 A$61.67 – 6,709 – – – 6,709 6,709 1 Dec 2016 – – –
Andrew Harding 19 Mar 2012 £36.15 7,096 – – 672 7,768 – – 1 Dec 2014 3 Dec 2014 £30.04 384,505
27 May 2013 £28.67 7,870 – – – – 7,870 7,870 1 Dec 2015 – – –
17 Mar 2014 £31.54 – 11,776 – – – 11,776 11,776 1 Dec 2016 – – –
Jean-SébastienJacques
19 Mar 2012 £36.15 518 – – 49 567 – – 1 Dec 2014 1 Dec 2014 £29.51 27,568
27 May 2013 £28.67 2,113 – – – – 2,113 2,113 1 Dec 2015 – – –
17 Mar 2014 £31.54 – 8,259 – – – 8,259 8,259 1 Dec 2016 – – –
HarryKenyon-Slaney
19 Mar 2012 £36.15 6,729 – – 637 7,366 – – 1 Dec 2014 17 Dec 2014 £27.58 334,768
27 May 2013 £28.67 8,128 – – – – 8,128 8,128 1 Dec 2015 – – –
17 Mar 2014 £31.54 – 9,217 – – – 9,217 9,217 1 Dec 2016 – – –
Greg Lilleyman 19 Mar 2012 A$65.85 1,877 – – 153 2,030 – – 1 Dec 2014 17 Dec 2014 A$53.38 97,827
27 May 2013 A$53.11 2,094 – – – – 2,094 2,094 1 Dec 2015 – – –
17 Mar 2014 A$61.67 – 2,754 – – – 2,754 2,754 1 Dec 2016 – – –
Chris Lynch 17 Mar 2014 £31.54 – 14,479 – – – 14,479 14,479 1 Dec 2016 – – –
Debra Valentine 19 Mar 2012 £36.15 7,244 – – 686 7,930 – – 1 Dec 2014 3 Dec 2014 £29.68 387,777
27 May 2013 £28.67 7,173 – – – – 7,173 7,173 1 Dec 2015 – – –
17 Mar 2014 £31.54 – 8,153 – – – 8,153 8,153 1 Dec 2016 – – –
Sam Walsh 19 Mar 2012 A$65.85 18,490 – – 1,512 20,002 – – 1 Dec 2014 3 Dec 2014 A$57.36 1,035,773
27 May 2013 A$53.11 18,413 – – – – 18,413 18,413 1 Dec 2015 – – –
17 Mar 2014 A$61.67 – 22,226 – – – 22,226 22,226 1 Dec 2016 – – –
Performance Share Plan
Hugo Bague 22 Mar 2010 £37.30 31,531 – 7,883 – 23,648 – – 31 Dec 2013 27 Feb 2014 £34.02 1,325,781
6 May 2011 £41.51 22,943 – – – – 22,943 – 31 Dec 2014 16 Feb 2015 £31.30 869,755
19 Mar 2012 £36.15 22,056 – – – – 22,056 22,056 31 Dec 2015 – – –
27 May 2013 £28.67 29,294 – – – – 29,294 29,294 31 Dec 2016 – – –
27 May 2013 £28.67 29,295 – – – – 29,295 29,295 31 Dec 2017 – – –
17 Mar 2014 £31.44 – 61,607 – – – 61,607 61,607 31 Dec 2018 – – –
Alfredo Barrios 15 Sep 2014 £31.44 – 43,568 – – – 43,568 43,568 31 Dec 2018 – – –
Jacynthe Côté 22 Mar 2010 £37.30 46,153 – 11,539 – 34,614 – – 31 Dec 2013 21 Feb 2014 £36.00 2,053,392
6 May 2011 £41.51 31,682 – – – – 31,682 N/A 31 Dec 2014 – – –
19 Mar 2012 £36.15 30,056 – – – – 30,056 N/A 31 Dec 2015 – – –
27 May 2013 £28.67 27,296 – – – – 27,296 N/A 31 Dec 2016 – – –
27 May 2013 £28.67 27,297 – – – – 27,297 N/A 31 Dec 2017 – – –
17 Mar 2014 £31.44 – 74,752 – – – 74,752 N/A 31 Dec 2018 – – –
Alan Davies 22 Mar 2010 A$75.03 9,750 – 2,438 – 7,312 – – 31 Dec 2013 19 Feb 2014 A$71.11 469,406
21 Mar 2011 A$81.00 6,228 – – – – 6,228 4,577 31 Dec 2014 – – –
19 Mar 2012 A$65.85 6,663 – – – – 6,663 6,663 31 Dec 2015 – – –
27 May 2013 A$53.11 27,047 – – – – 27,047 27,047 31 Dec 2016 – – –
27 May 2013 A$53.11 27,047 – – – – 27,047 27,047 31 Dec 2017 – – –
17 Mar 2014 A$61.03 – 51,817 – – – 51,817 51,817 31 Dec 2018 – – –
96 riotinto.com
For
per
sona
l use
onl
y
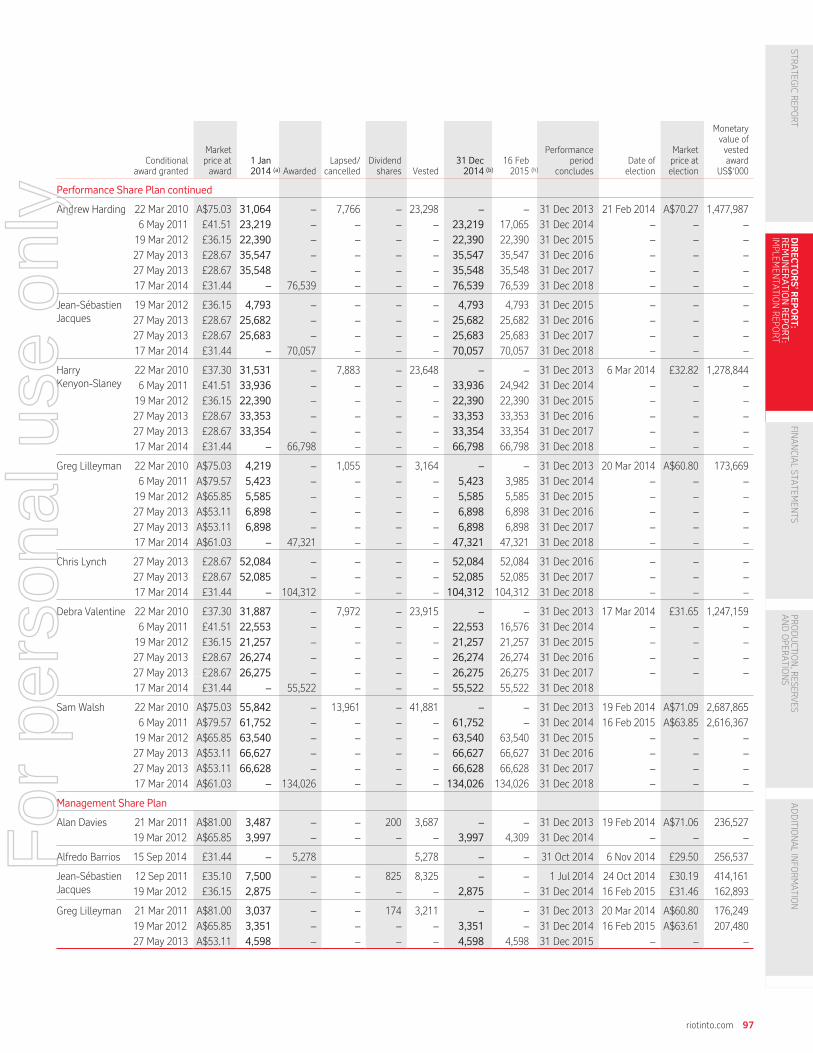
Conditionalaward granted
Marketprice ataward
1 Jan2014 (a) Awarded
Lapsed/cancelled
Dividendshares Vested
31 Dec2014 (b)
16 Feb2015 (h)
Performanceperiod
concludesDate ofelection
Marketprice atelection
Monetaryvalue ofvestedaward
US$‘000
Performance Share Plan continued
Andrew Harding 22 Mar 2010 A$75.03 31,064 – 7,766 – 23,298 – – 31 Dec 2013 21 Feb 2014 A$70.27 1,477,987
6 May 2011 £41.51 23,219 – – – – 23,219 17,065 31 Dec 2014 – – –
19 Mar 2012 £36.15 22,390 – – – – 22,390 22,390 31 Dec 2015 – – –
27 May 2013 £28.67 35,547 – – – – 35,547 35,547 31 Dec 2016 – – –
27 May 2013 £28.67 35,548 – – – – 35,548 35,548 31 Dec 2017 – – –
17 Mar 2014 £31.44 – 76,539 – – – 76,539 76,539 31 Dec 2018 – – –
Jean-SébastienJacques
19 Mar 2012 £36.15 4,793 – – – – 4,793 4,793 31 Dec 2015 – – –
27 May 2013 £28.67 25,682 – – – – 25,682 25,682 31 Dec 2016 – – –
27 May 2013 £28.67 25,683 – – – – 25,683 25,683 31 Dec 2017 – – –
17 Mar 2014 £31.44 – 70,057 – – – 70,057 70,057 31 Dec 2018 – – –
HarryKenyon-Slaney
22 Mar 2010 £37.30 31,531 – 7,883 – 23,648 – – 31 Dec 2013 6 Mar 2014 £32.82 1,278,844
6 May 2011 £41.51 33,936 – – – – 33,936 24,942 31 Dec 2014 – – –
19 Mar 2012 £36.15 22,390 – – – – 22,390 22,390 31 Dec 2015 – – –
27 May 2013 £28.67 33,353 – – – – 33,353 33,353 31 Dec 2016 – – –
27 May 2013 £28.67 33,354 – – – – 33,354 33,354 31 Dec 2017 – – –
17 Mar 2014 £31.44 – 66,798 – – – 66,798 66,798 31 Dec 2018 – – –
Greg Lilleyman 22 Mar 2010 A$75.03 4,219 – 1,055 – 3,164 – – 31 Dec 2013 20 Mar 2014 A$60.80 173,669
6 May 2011 A$79.57 5,423 – – – – 5,423 3,985 31 Dec 2014 – – –
19 Mar 2012 A$65.85 5,585 – – – – 5,585 5,585 31 Dec 2015 – – –
27 May 2013 A$53.11 6,898 – – – – 6,898 6,898 31 Dec 2016 – – –
27 May 2013 A$53.11 6,898 – – – – 6,898 6,898 31 Dec 2017 – – –
17 Mar 2014 A$61.03 – 47,321 – – – 47,321 47,321 31 Dec 2018 – – –
Chris Lynch 27 May 2013 £28.67 52,084 – – – – 52,084 52,084 31 Dec 2016 – – –
27 May 2013 £28.67 52,085 – – – – 52,085 52,085 31 Dec 2017 – – –
17 Mar 2014 £31.44 – 104,312 – – – 104,312 104,312 31 Dec 2018 – – –
Debra Valentine 22 Mar 2010 £37.30 31,887 – 7,972 – 23,915 – – 31 Dec 2013 17 Mar 2014 £31.65 1,247,159
6 May 2011 £41.51 22,553 – – – – 22,553 16,576 31 Dec 2014 – – –
19 Mar 2012 £36.15 21,257 – – – – 21,257 21,257 31 Dec 2015 – – –
27 May 2013 £28.67 26,274 – – – – 26,274 26,274 31 Dec 2016 – – –
27 May 2013 £28.67 26,275 – – – – 26,275 26,275 31 Dec 2017 – – –
17 Mar 2014 £31.44 – 55,522 – – – 55,522 55,522 31 Dec 2018
Sam Walsh 22 Mar 2010 A$75.03 55,842 – 13,961 – 41,881 – – 31 Dec 2013 19 Feb 2014 A$71.09 2,687,865
6 May 2011 A$79.57 61,752 – – – – 61,752 – 31 Dec 2014 16 Feb 2015 A$63.85 2,616,367
19 Mar 2012 A$65.85 63,540 – – – – 63,540 63,540 31 Dec 2015 – – –
27 May 2013 A$53.11 66,627 – – – – 66,627 66,627 31 Dec 2016 – – –
27 May 2013 A$53.11 66,628 – – – – 66,628 66,628 31 Dec 2017 – – –
17 Mar 2014 A$61.03 – 134,026 – – – 134,026 134,026 31 Dec 2018 – – –
Management Share Plan
Alan Davies 21 Mar 2011 A$81.00 3,487 – – 200 3,687 – – 31 Dec 2013 19 Feb 2014 A$71.06 236,527
19 Mar 2012 A$65.85 3,997 – – – – 3,997 4,309 31 Dec 2014 – – –
Alfredo Barrios 15 Sep 2014 £31.44 – 5,278 5,278 – – 31 Oct 2014 6 Nov 2014 £29.50 256,537
Jean-SébastienJacques
12 Sep 2011 £35.10 7,500 – – 825 8,325 – – 1 Jul 2014 24 Oct 2014 £30.19 414,161
19 Mar 2012 £36.15 2,875 – – – – 2,875 – 31 Dec 2014 16 Feb 2015 £31.46 162,893
Greg Lilleyman 21 Mar 2011 A$81.00 3,037 – – 174 3,211 – – 31 Dec 2013 20 Mar 2014 A$60.80 176,249
19 Mar 2012 A$65.85 3,351 – – – – 3,351 – 31 Dec 2014 16 Feb 2015 A$63.61 207,480
27 May 2013 A$53.11 4,598 – – – – 4,598 4,598 31 Dec 2015 – – –
riotinto.com 97
STRATEG
ICREPO
RT
DIR
EC
TO
RS
’R
EP
OR
T:
REMUNERATIONREPORT:
IMPLEM
ENTA
TIONREPO
RT
FINANCIA
LSTA
TEMEN
TSPR
ODUCTIO
N,R
ESERVES
ANDOPER
ATIO
NS
ADDITIO
NALINFO
RMATIO
N
For
per
sona
l use
onl
y

Remuneration Report: Implementation Report continued
Table 3 – Plan interests (awards of shares and options under long-term incentive plans) continued
Date of grant 1 Jan 2014 (a)
Vestedduring 2014 Exercised
Lapsed/cancelled
Vested andexercisable on31 Dec 2014 (b)
Share Savings Plan
Hugo Bague 4 Oct 2011 425 – – – –
Alan Davies 5 Oct 2010 323 323 323 – –
Andrew Harding 20 Oct 2009 723 – – – –
5 Oct 2010 555 – – – –
Harry Kenyon-Slaney (q) 20 Oct 2009 434 – – – –
Greg Lilleyman 5 Oct 2010 555 – – – –
Sam Walsh (q) 20 Oct 2009 125 – – – –
5 Oct 2010 457 – – – –
Share Option Plan
Hugo Bague 17 Mar 2009 15,714 – 15,714 – –
22 Mar 2010 47,297 – – – 47,297
6 May 2011 34,415 34,415 – – 34,415
19 Mar 2012 33,085 – – – –
Jacynthe Côté 17 Mar 2009 35,680 – – – 35,680
22 Mar 2010 69,230 – – – 69,230
6 May 2011 47,523 47,523 – – 47,523
19 Mar 2012 45,084 – – – –
Andrew Harding 17 Mar 2009 6,268 – – – 6,268
22 Mar 2010 46,597 – – – 46,597
6 May 2011 34,829 34,829 – – 34,829
19 Mar 2012 33,585 – – – –
Harry Kenyon-Slaney 17 Mar 2009 6,938 – – – 6,938
22 Mar 2010 47,297 – – – 47,297
19 Mar 2012 33,585 – – – –
Greg Lilleyman 22 Apr 2004 1,416 – 1,416 – –
9 Mar 2005 1,275 – – – 1,275
7 Mar 2006 2,186 – – – 2,186
17 Mar 2009 3,058 – – – 3,058
Debra Valentine 17 Mar 2009 13,558 – – – 13,558
22 Mar 2010 47,831 – – – 47,831
6 May 2011 33,830 33,830 – – 33,830
19 Mar 2012 31,886 – – – –
Sam Walsh 7 Mar 2006 48,079 – – – 48,079
17 Mar 2009 40,005 – – – 40,005
22 Mar 2010 83,763 – – – 83,763
Notes to table 3
(a) Or date of appointment, if later.
(b) Or date of retirement or at date no longer a member of the Executive Committee, if earlier.
(c) Alfredo Barrios was appointed on 1 June 2014.
(d) Jacynthe Côté stepped down from the Executive Committee on 31 May 2014.
(e) Awards denominated in pounds sterling were for Rio Tinto plc ordinary shares of 10 pence each and awards denominated in Australian dollars were for Rio Tinto Limited shares. Alloptions granted over ordinary shares. Rio Tinto plc – ordinary shares of 10 pence each stated in sterling. Rio Tinto Limited ordinary shares stated in Australian dollars. Each optionis granted over one share at no cost to participants. The exercise price represents the amount payable per share on the exercise of each option by participants.
(f) The weighted fair value per share of conditional awards granted in 2014 under the BDP was £31.38 for Rio Tinto plc and A$61.32 for Rio Tinto Limited and for PSP was £22.71 forRio Tinto plc and A$44.40 for Rio Tinto Limited.
(g) Conditional awards are awarded at no cost to the recipient and no amount remains unpaid on any shares granted.
(h) The 2011 PSP awards granted on 6 May 2011 with a performance period that concluded on 31 December 2014 vested at 73.5 per cent. This award vested on 16 February 2015 as follows:Hugo Bague, awarded 22,943, lapsed 6,080, vested 16,863, Hugo exercised his award on 16 February 2015; Alan Davies, awarded 6,228, lapsed 1,651 vested 4,577; Andrew Harding,awarded 23,219, lapsed 6,154, vested 17,065; Harry Kenyon-Slaney, awarded 33,936, lapsed 8,994, vested 24,942; Greg Lilleyman awarded 5,423, lapsed 1,438, vested 3,985; DebraValentine, awarded 22,553, lapsed 5,977, vested 16,576; SamWalsh, awarded 61,752, lapsed 16,365, vested 45,387, Sam exercised his award on 16 February 2015. The 2012 MSP awardsgranted 19 March 2012 vested on 16 February 2015 as follows: Alan Davies awarded 3,997, dividend shares 312, vested 4,309; Jean-Sébastien Jacques awarded 2,875, dividend shares 267,vested 3,142, Jean-Sébastien exercised his award on 16 February 2015; Greg Lilleyman awarded 3,351, dividend shares 262, vested 3,613, Greg exercised his award on 16 February 2015.
98 riotinto.com
For
per
sona
l use
onl
y

31 Dec 2014 (b)
Vested andexercisable on16 Feb 2015 16 Feb 2015 Exercise price
Value of optionsexercised
during 2014
Market priceon date ofexercise
Date fromwhich firstexercisable Expiry date
Share Savings Plan
Hugo Bague 425 – 425 £28.630 – – 1 Jan 2017 1 Jul 2017
Alan Davies – – – A$59.26 A$2,371 A$66.60 1 Jan 2014 1 Jul 2014
Andrew Harding 723 723 723 A$48.73 – – 1 Jan 2015 1 Jul 2015
555 – 555 £27.810 – – 1 Jan 2016 1 Jul 2016
Harry Kenyon-Slaney (q) 434 – – £21.480 – – 1 Jan 2015 1 Jul 2015
Greg Lilleyman 555 – 555 A$59.26 – – 1 Jan 2016 1 Jul 2016
Sam Walsh (q) 125 125 – A$48.73 – – 1 Jan 2015 1 Jul 2015
457 – 457 A$59.26 – – 1 Jan 2016 1 Jul 2016
Share Option Plan
Hugo Bague – – – £16.530 £285,995 £34.73 17 Mar 2012 17 Mar 2019
47,297 47,297 47,297 £37.050 – – 22 Mar 2013 22 Mar 2020
34,415 34,415 34,415 £42.450 – – 6 May 2014 6 May 2021
33,085 – 33,085 £35.179 – – 19 Mar 2015 19 Mar 2022
Jacynthe Côté 35,680 N/A N/A £16.530 – – 17 Mar 2012 1 Sep 2015
69,230 N/A N/A £37.050 – – 22 Mar 2013 1 Sep 2015
47,523 N/A N/A £42.450 – – 6 May 2014 1 Sep 2015
45,084 N/A N/A £35.179 – – 19 Mar 2015 19 Mar 2016
Andrew Harding 6,268 6,268 6,268 A$33.450 – – 17 Mar 2012 17 Mar 2019
46,597 46,597 46,597 A$76.150 – – 22 Mar 2013 22 Mar 2020
34,829 34,829 34,829 £42.450 – – 6 May 2014 5 May 2021
33,585 – 33,585 £35.179 – – 19 Mar 2015 19 Mar 2022
Harry Kenyon-Slaney 6,938 6,938 6,938 £16.530 – – 17 Mar 2012 17 Mar 2019
47,297 47,297 47,297 £37.050 – – 22 Mar 2013 22 Mar 2020
33,585 – 33,585 £35.179 – – 19 Mar 2015 19 Mar 2022
Greg Lilleyman – – – A$18.30 A$63,965 A$63.47 22 Apr 2009 22 Apr 2014
1,275 1,275 1,275 A$30.933 – – 9 Mar 2008 9 Mar 2015
2,186 2,186 2,186 A$54.951 – – 7 Mar 2009 7 Mar 2016
3,058 3,058 3,058 A$33.451 – – 17 Mar 2012 17 Mar 2019
Debra Valentine 13,558 13,558 13,558 £16.530 – – 17 Mar 2012 17 Mar 2019
47,831 47,831 47,831 £37.050 – – 22 Mar 2013 22 Mar 2020
33,830 33,830 33,830 £42.450 – – 6 May 2014 6 May 2021
31,886 – 31,886 £35.179 – – 19 Mar 2015 19 Mar 2022
Sam Walsh 48,079 48,079 48,079 A$54.950 – – 7 Mar 2009 7 Mar 2016
40,005 40,005 40,005 A$33.450 – – 17 Mar 2012 17 Mar 2019
83,763 83,763 83,763 A$76.150 – – 22 Mar 2013 22 Mar 2020
(i) The closing price of Rio Tinto plc ordinary shares at 31 December 2014 was £30.00 and of Rio Tinto Limited ordinary shares at 31 December 2014 was A$58.00. The high and lowprices during 2014 of Rio Tinto plc and Rio Tinto Limited shares were £36.27 and £26.16 and A$70.88 and A$52.65 respectively.
(j) The exercise price represents the price payable on the options.
(k) The amount in US dollars has been converted at the rate of US$0.60685 = £1 and US$1.10768 = A$1, being the average exchange rates for 2014.
(l) As of 16 February 2015, members of the Executive Committee held 1,643,138 shares awarded and not vested under long-term incentive plans and 632,082 options to acquireRio Tinto plc and Rio Tinto Limited shares.
(m) Between 31 December 2014 and 16 February 2015 no options were granted to the executives.
(n) Details of performance conditions for the BDP are provided below. Fifty per cent of the STIP is delivered in cash and 50 per cent delivered in deferred shares under the BDP. TheBDP vests in December of the third year after the end of performance year to which they relate.
(o) Details of performance conditions for the PSP are provided below.For 2011 and 2012 awards, the awards have a four-year performance period and from 2014, awards have a five-year performance period commencing on 1 January of the year ofgrant. For 2013 awards only, 50 per cent of the award granted will be measured against the performance conditions after four years (at the end of 2016) and 50 per cent of theawards granted will be measured against the performance conditions after five years (at the end of 2017).For 2011 and 2012 awards, subject to the “mix” chosen, awards have a maximum face value of 292 per cent of base salary with the potential for 1.5 times of this value, ie 438 percent of base salary, for outstanding performance. The expected value of the 2011 and 2012 awards is 190 per cent of base salary. For awards granted from 2013, awards have amaximum face value of 438 per cent of base salary and a maximum expected value of 190 per cent of base salary. The actual award levels granted from 2013 vary by executive.For 2011 and 2012 awards, conditional share awards vest subject to the achievement of a stretching TSR performance condition, comparing Rio Tinto’s TSR performance against:– 50 per cent: the HSBC Global Mining Index– 50 per cent: the Morgan Stanley Capital World Index (MSCI)
riotinto.com 99
STRATEG
ICREPO
RT
DIR
EC
TO
RS
’R
EP
OR
T:
REMUNERATIONREPORT:
IMPLEM
ENTA
TIONREPO
RT
FINANCIA
LSTA
TEMEN
TSPR
ODUCTIO
N,R
ESERVES
ANDOPER
ATIO
NS
ADDITIO
NALINFO
RMATIO
N
For
per
sona
l use
onl
y
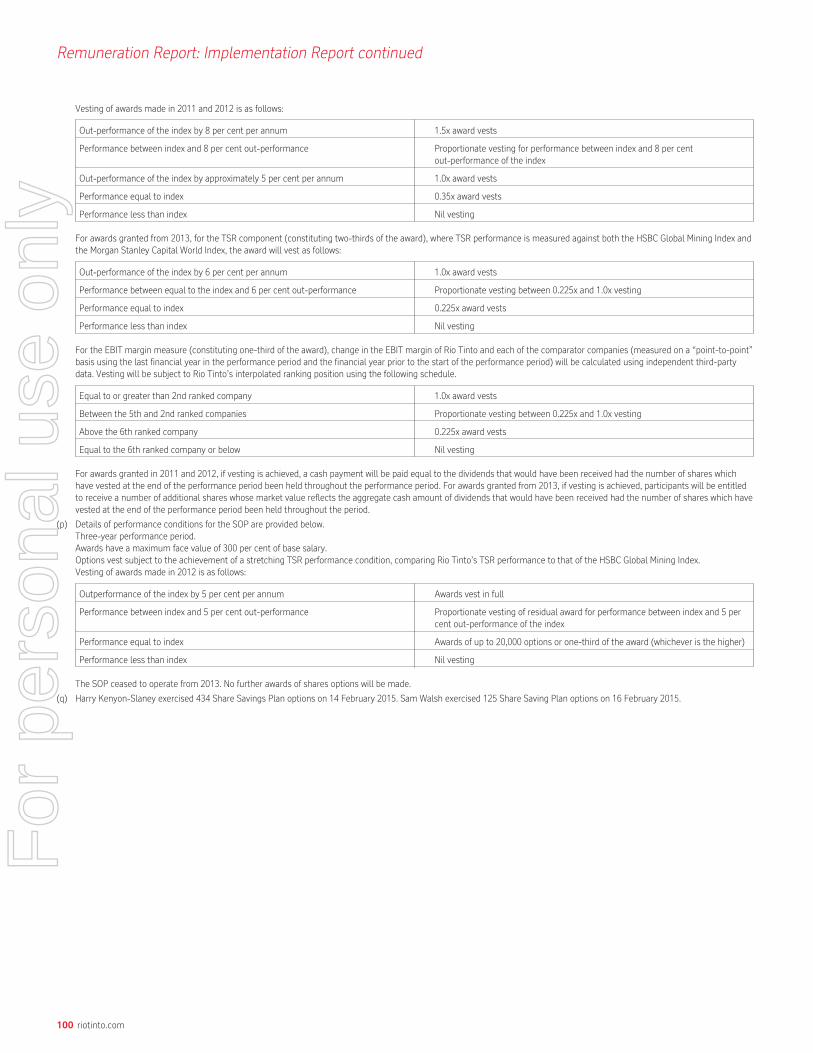
Remuneration Report: Implementation Report continued
Vesting of awards made in 2011 and 2012 is as follows:
Out-performance of the index by 8 per cent per annum 1.5x award vests
Performance between index and 8 per cent out-performance Proportionate vesting for performance between index and 8 per centout-performance of the index
Out-performance of the index by approximately 5 per cent per annum 1.0x award vests
Performance equal to index 0.35x award vests
Performance less than index Nil vesting
For awards granted from 2013, for the TSR component (constituting two-thirds of the award), where TSR performance is measured against both the HSBC Global Mining Index andthe Morgan Stanley Capital World Index, the award will vest as follows:
Out-performance of the index by 6 per cent per annum 1.0x award vests
Performance between equal to the index and 6 per cent out-performance Proportionate vesting between 0.225x and 1.0x vesting
Performance equal to index 0.225x award vests
Performance less than index Nil vesting
For the EBIT margin measure (constituting one-third of the award), change in the EBIT margin of Rio Tinto and each of the comparator companies (measured on a “point-to-point”basis using the last financial year in the performance period and the financial year prior to the start of the performance period) will be calculated using independent third-partydata. Vesting will be subject to Rio Tinto’s interpolated ranking position using the following schedule.
Equal to or greater than 2nd ranked company 1.0x award vests
Between the 5th and 2nd ranked companies Proportionate vesting between 0.225x and 1.0x vesting
Above the 6th ranked company 0.225x award vests
Equal to the 6th ranked company or below Nil vesting
For awards granted in 2011 and 2012, if vesting is achieved, a cash payment will be paid equal to the dividends that would have been received had the number of shares whichhave vested at the end of the performance period been held throughout the performance period. For awards granted from 2013, if vesting is achieved, participants will be entitledto receive a number of additional shares whose market value reflects the aggregate cash amount of dividends that would have been received had the number of shares which havevested at the end of the performance period been held throughout the period.
(p) Details of performance conditions for the SOP are provided below.Three-year performance period.Awards have a maximum face value of 300 per cent of base salary.Options vest subject to the achievement of a stretching TSR performance condition, comparing Rio Tinto’s TSR performance to that of the HSBC Global Mining Index.Vesting of awards made in 2012 is as follows:
Outperformance of the index by 5 per cent per annum Awards vest in full
Performance between index and 5 per cent out-performance Proportionate vesting of residual award for performance between index and 5 percent out-performance of the index
Performance equal to index Awards of up to 20,000 options or one-third of the award (whichever is the higher)
Performance less than index Nil vesting
The SOP ceased to operate from 2013. No further awards of shares options will be made.
(q) Harry Kenyon-Slaney exercised 434 Share Savings Plan options on 14 February 2015. Sam Walsh exercised 125 Share Saving Plan options on 16 February 2015.
100 riotinto.com
For
per
sona
l use
onl
y

Audited informationUnder Schedule 8 of the Large and Medium-sized Companies and Groups(Accounts and Reports) Regulations 2008 (as amended), the informationincluded in respect of: the single total figure of remuneration for each director;details of the directors’ total pension entitlements; details of scheme interestsawarded to the directors during the financial year; details of payments to pastdirectors; and the statement of the directors’ shareholdings and shareinterests, as set out in the Implementation Report are all auditable. TheAustralian Securities and Investments Commission issued an order dated 9January 2015 under which the Remuneration Report must be prepared andaudited in accordance with the requirements of the Corporations Act 2001applied on the basis of certain modifications set out in the order (as detailedon page 183). The information provided in the Remuneration Report has beenaudited as required by section 308(3C) of the Corporations Act.
Going concernThe directors, having made appropriate enquiries, have satisfied themselvesthat no material uncertainties that cast significant doubt about the ability ofthe Companies and the Group to continue as a going concern have beenidentified, and they have a reasonable expectation that the Group hasadequate financial resources to continue in operational existence for theforeseeable future. Therefore, these financial statements have been preparedon a going concern basis.
Annual general meetingsThe 2015 annual general meetings will be held on 16 April in London and7 May in Perth. Separate notices of the 2015 annual general meetings areproduced for the shareholders of each Company.
Directors’ approval statementThe Directors’ report is delivered in accordance with a resolution of the board.
Jan du PlessisChairman
4 March 2015
riotinto.com 101
STRATEG
ICREPO
RT
DIR
EC
TO
RS
’R
EP
OR
TFIN
ANCIA
LSTA
TEMEN
TSPR
ODUCTIO
N,R
ESERVES
ANDOPER
ATIO
NS
ADDITIO
NALINFO
RMATIO
N
For
per
sona
l use
onl
y

2014 Financial statements
Contents
Page
Primary financial statements
Group income statement 103
Group statement of comprehensive income 104
Group cash flow statement 105
Group balance sheet 106
Group statement of changes in equity 107
Reconciliation with Australian Accounting Standards 109
Outline of dual listed companies structure and basis offinancial statements 109
Notes to the 2014 financial statements
Note 1 – Principal accounting policies 110
Group income statement
Note 2 – Operating segments 123
Note 3 – Operating segments – additional information 125
Note 4 – Net operating costs 127
Note 5 – Employment costs 127
Note 6 – Impairment charges and reversals 128
Note 7 – Share of profit after tax of equity accounted units 130
Note 8 – Finance income and finance costs 130
Note 9 – Taxation 130
Note 10 – Earnings/(loss) per ordinary share 131
Note 11 – Dividends 132
Group balance sheet
Note 12 – Goodwill 133
Note 13 – Intangible assets 134
Note 14 – Property, plant and equipment 135
Note 15 – Investments in equity accounted units 136
Note 16 – Inventories 137
Note 17 – Deferred taxation 137
Note 18 – Trade and other receivables 138
Note 19 – Assets and liabilities held for sale 139
Note 20 – Other financial assets 139
Note 21 – Cash and cash equivalents 139
Note 22 – Borrowings and other financial liabilities 140
Note 23 – Capitalised finance leases 141
Note 24 – Consolidated net debt 141
Note 25 – Trade and other payables 142
Note 26 – Provisions including post retirement benefits 142
Page
Capital and reserves
Note 27 – Share capital – Rio Tinto plc 143
Note 28 – Share capital – Rio Tinto Limited 144
Note 29 – Other reserves and retained earnings 144
Additional disclosures
Note 30 – Financial instruments and risk management 146
Note 31 – Contingencies and commitments 155
Note 32 – Average number of employees 156
Note 33 – Principal subsidiaries 157
Note 34 – Principal joint operations 159
Note 35 – Principal joint ventures 160
Note 36 – Principal associates 161
Note 37 – Purchases and sales of subsidiaries, joint ventures,associates and other interests in businesses 162
Note 38 – Directors’ and key management remuneration 163
Note 39 – Auditors’ remuneration 164
Note 40 – Related party transactions 165
Note 41 – Exchange rates in US$ 165
Note 42 – Bougainville Copper Limited (BCL) 165
Note 43 – Events after the balance sheet date 165
Note 44 – Share based payments 166
Note 45 – Post retirement benefits 168
Note 46 – Rio Tinto Limited parent company disclosures 174
Rio Tinto plc company balance sheet 175
Rio Tinto financial information by business unit 178
Australian Corporations Act – summary of ASIC relief 183
Directors’ declaration 184
Auditor’s independence declaration 185
Independent auditors’ report to the members of Rio Tinto plc andRio Tinto Limited 186
Financial summary 2005-2014 192
Summary financial data 194
102 riotinto.com
For
per
sona
l use
onl
y

Group income statementYears ended 31 December
Note2014US$m
2013US$m
2012US$m
Continuing operations
Consolidated sales revenue 3 47,664 51,171 50,942
Net operating costs (excluding items shown separately) 4 (33,910) (36,104) (37,534)
Impairment charges net of reversals 6 (1,062) (7,315) (14,701)
Net (losses)/gains on consolidation and disposal of interests in businesses 2,37 (563) 787 845
Exploration and evaluation costs 13 (747) (948) (1,971)
(Loss)/profit relating to interests in undeveloped projects 13 (36) (161) 494
Operating profit/(loss) 11,346 7,430 (1,925)
Share of profit after tax of equity accounted units 7 625 698 1,056
Impairment charges net of reversals of investments in equity accounted units after tax 6 589 (216) (1,526)
Profit/(loss) before finance items and taxation 12,560 7,912 (2,395)
Finance items
Net exchange (losses)/gains on external debt and intragroup balances 24 (1,995) (3,672) 492
Net (losses)/gains on derivatives not qualifying for hedge accounting (46) 59 88
Finance income 8 64 82 116
Finance costs 8 (649) (507) (293)
Amortisation of discount (382) (369) (439)
(3,008) (4,407) (36)
Profit/(loss) before taxation 9,552 3,505 (2,431)
Taxation 9 (3,053) (2,426) (589)
Profit/(loss) from continuing operations 6,499 1,079 (3,020)
Discontinued operations
Loss after tax from discontinued operations – – (7)
Profit/(loss) after tax for the year 6,499 1,079 (3,027)
– attributable to owners of Rio Tinto (net earnings/(losses)) 6,527 3,665 (3,028)
– attributable to non-controlling interests (28) (2,586) 1
Basic earnings/(losses) per share
Profit/(loss) from continuing operations 10 353.1c 198.4c (163.4c)
Loss from discontinued operations 10 – – (0.4c)
Profit/(loss) for the year per share 10 353.1c 198.4c (163.8c)
Diluted earnings/(losses) per share
Profit/(loss) from continuing operations 10 351.2c 197.3c (163.4c)
Loss from discontinued operations 10 – – (0.4c)
Profit/(loss) for the year per share 10 351.2c 197.3c (163.8c)
The notes on pages 110 to 174 are an integral part of these consolidated financial statements.
riotinto.com 103
STRATEG
ICREPO
RT
DIRECTO
RS’R
EPORT
FIN
AN
CIA
LS
TA
TE
ME
NT
SPR
ODUCTIO
N,R
ESERVES
ANDOPER
ATIO
NS
ADDITIO
NALINFO
RMATIO
N
For
per
sona
l use
onl
y
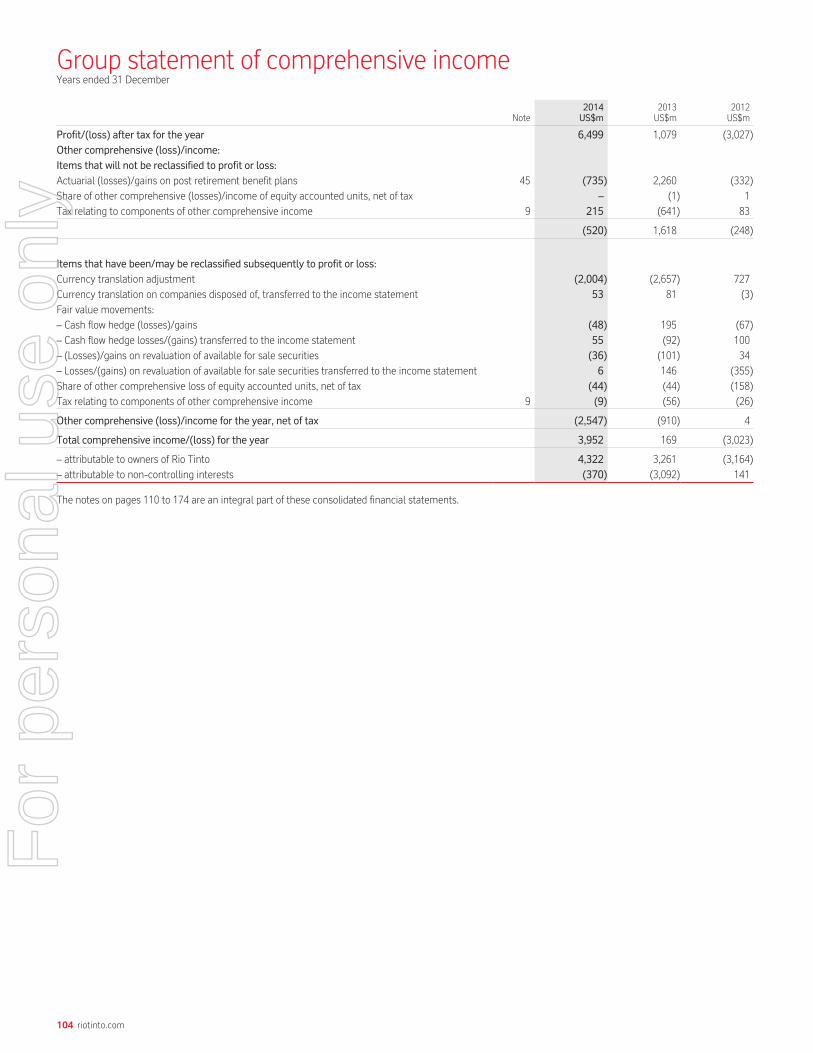
Group statement of comprehensive incomeYears ended 31 December
Note2014US$m
2013US$m
2012US$m
Profit/(loss) after tax for the year 6,499 1,079 (3,027)
Other comprehensive (loss)/income:
Items that will not be reclassified to profit or loss:
Actuarial (losses)/gains on post retirement benefit plans 45 (735) 2,260 (332)
Share of other comprehensive (losses)/income of equity accounted units, net of tax – (1) 1
Tax relating to components of other comprehensive income 9 215 (641) 83
(520) 1,618 (248)
Items that have been/may be reclassified subsequently to profit or loss:
Currency translation adjustment (2,004) (2,657) 727
Currency translation on companies disposed of, transferred to the income statement 53 81 (3)
Fair value movements:
– Cash flow hedge (losses)/gains (48) 195 (67)
– Cash flow hedge losses/(gains) transferred to the income statement 55 (92) 100
– (Losses)/gains on revaluation of available for sale securities (36) (101) 34
– Losses/(gains) on revaluation of available for sale securities transferred to the income statement 6 146 (355)
Share of other comprehensive loss of equity accounted units, net of tax (44) (44) (158)
Tax relating to components of other comprehensive income 9 (9) (56) (26)
Other comprehensive (loss)/income for the year, net of tax (2,547) (910) 4
Total comprehensive income/(loss) for the year 3,952 169 (3,023)
– attributable to owners of Rio Tinto 4,322 3,261 (3,164)
– attributable to non-controlling interests (370) (3,092) 141
The notes on pages 110 to 174 are an integral part of these consolidated financial statements.
104 riotinto.com
For
per
sona
l use
onl
y

Group cash flow statementYears ended 31 December
Note2014US$m
2013US$m
2012US$m
Cash flow from consolidated operations (a) 18,896 19,531 15,999Dividends from equity accounted units 298 600 522Cash flows from operations 19,194 20,131 16,521
Net interest paid (981) (1,164) (824)Dividends paid to holders of non-controlling interests in subsidiaries (309) (191) (422)Tax paid (3,618) (3,698) (5,845)Net cash generated from operating activities 14,286 15,078 9,430
Cash flow from investing activitiesAcquisitions of subsidiaries, joint ventures & associates 37 – 4 (1,335)Disposals of subsidiaries, joint ventures & associates 37 887 1,896 251Purchase of property, plant and equipment and intangible assets 2 (8,162) (13,001) (17,615)Sales of financial assets 172 224 692Purchases of financial assets (24) (75) (50)Other funding of equity accounted units (117) (88) (223)Other investing cash flows (b) 741 94 37
Cash used in investing activities (6,503) (10,946) (18,243)
Cash flow before financing activities 7,783 4,132 (8,813)
Cash flow from financing activitiesEquity dividends paid to owners of Rio Tinto 11 (3,710) (3,322) (3,038)Proceeds from additional borrowings 442 3,954 8,569Repayment of borrowings (3,476) (1,832) (682)Proceeds from issue of equity to non-controlling interests (c) 1,291 159 2,945Own shares purchased from owners of Rio Tinto – – (1,471)Purchase of non-controlling interests 37 – – (76)Other financing cash flows 17 107 77
Net cash flow (used in)/from financing activities (5,436) (934) 6,324
Effects of exchange rates on cash and cash equivalents (156) (261) 16
Net increase/(decrease) in cash and cash equivalents 2,191 2,937 (2,473)
Opening cash and cash equivalents less overdrafts 10,209 7,272 9,745
Closing cash and cash equivalents less overdrafts 21 12,400 10,209 7,272
(a) Cash flow from consolidated operationsProfit/(loss) from continuing operations 6,499 1,079 (3,020)Adjustments for:– Taxation 3,053 2,426 589– Finance items 3,008 4,407 36– Share of profit after tax of equity accounted units (625) (698) (1,056)– Impairment charges net of reversals of investments in equity accounted units after tax (589) 216 1,526– Net losses/(gains) on disposal and consolidation of interests in businesses 37 563 (787) (845)– Impairment charges net of reversals 6 1,062 7,315 14,701– Depreciation and amortisation 4,860 4,791 4,624– Provisions (including exchange differences on provisions) 26 712 1,449 886Utilisation of provisions 26 (973) (871) (840)Utilisation of provision for post retirement benefits 26 (296) (635) (695)Change in inventories 937 (330) (433)Change in trade and other receivables 962 84 412Change in trade and other payables (380) 803 266Other items 103 282 (152)
18,896 19,531 15,999
(b) Other investing cash flows in 2014 mainly relate to the disposal of the Group’s St James’s Square properties.
(c) Cash proceeds from the issue of equity to non-controlling interests relates mainly to Turquoise Hill Resources Ltd’s rights issue at the beginning of 2014, which increasednon-controlling interests by US$1,158 million. The balance in 2012 included US$1.8 billion from the transfer of a 47 per cent interest in Simfer Jersey Limited, a Rio Tintosubsidiary, to Chalco Iron Ore Holdings Limited, a consortium led by Chalco (and reimbursing Rio Tinto for historic project costs) plus subsequent cash calls to meet project costs,and US$0.9 billion of proceeds from subscription by non-controlling interests in a rights offering by Turquoise Hill. Refer to the Group statement of changes in equity on page 107,and to note 33.
The notes on pages 110 to 174 are an integral part of these consolidated financial statements.
riotinto.com 105
STRATEG
ICREPO
RT
DIRECTO
RS’R
EPORT
FIN
AN
CIA
LS
TA
TE
ME
NT
SPR
ODUCTIO
N,R
ESERVES
ANDOPER
ATIO
NS
ADDITIO
NALINFO
RMATIO
N
For
per
sona
l use
onl
y

Group balance sheetAt 31 December
Note2014US$m
2013US$m
Non-current assets
Goodwill 12 1,228 1,349Intangible assets 13 5,880 5,421Property, plant and equipment 14 68,693 70,827Investments in equity accounted units 15 4,868 3,957Inventories 16 397 511Deferred tax assets 17 3,540 3,555Trade and other receivables 18 1,304 2,140Other financial assets (including tax recoverable and loans to equity accounted units) 20 792 983
86,702 88,743
Current assets
Inventories 16 4,350 5,737Trade and other receivables 18 3,623 4,667Other financial assets (including tax recoverable and loans to equity accounted units) 20 417 710Cash and cash equivalents 21 12,423 10,216
20,813 21,330
Assets of disposal groups held for sale 19 312 952
Total assets 107,827 111,025
Current liabilities
Borrowings and other financial liabilities 22 (2,684) (3,926)Trade and other payables 25 (7,437) (8,400)Tax payable (800) (1,126)Provisions including post retirement benefits 26 (1,299) (1,738)
(12,220) (15,190)
Non-current liabilities
Borrowings and other financial liabilities 22 (22,535) (24,625)Trade and other payables 25 (871) (576)Tax payable (370) (468)Deferred tax liabilities 17 (3,574) (4,140)Provisions including post retirement benefits 26 (13,303) (12,343)
(40,653) (42,152)
Liabilities of disposal groups held for sale 19 (360) (181)
Total liabilities (53,233) (57,523)
Net assets 54,594 53,502
Capital and reserves
Share capital– Rio Tinto plc 27 230 230– Rio Tinto Limited 28 4,535 4,911Share premium account 4,288 4,269Other reserves 29 11,122 12,871Retained earnings 29 26,110 23,605
Equity attributable to owners of Rio Tinto 46,285 45,886Attributable to non-controlling interests 8,309 7,616
Total equity 54,594 53,502
The notes on pages 110 to 174 are an integral part of these consolidated financial statements.
The financial statements on pages 103 to 184 were approved by the directors on 4 March 2015 and signed on their behalf by
Jan du Plessis SamWalsh AO Chris Lynch
Chairman Chief executive Chief financial officer
106 riotinto.com
For
per
sona
l use
onl
y
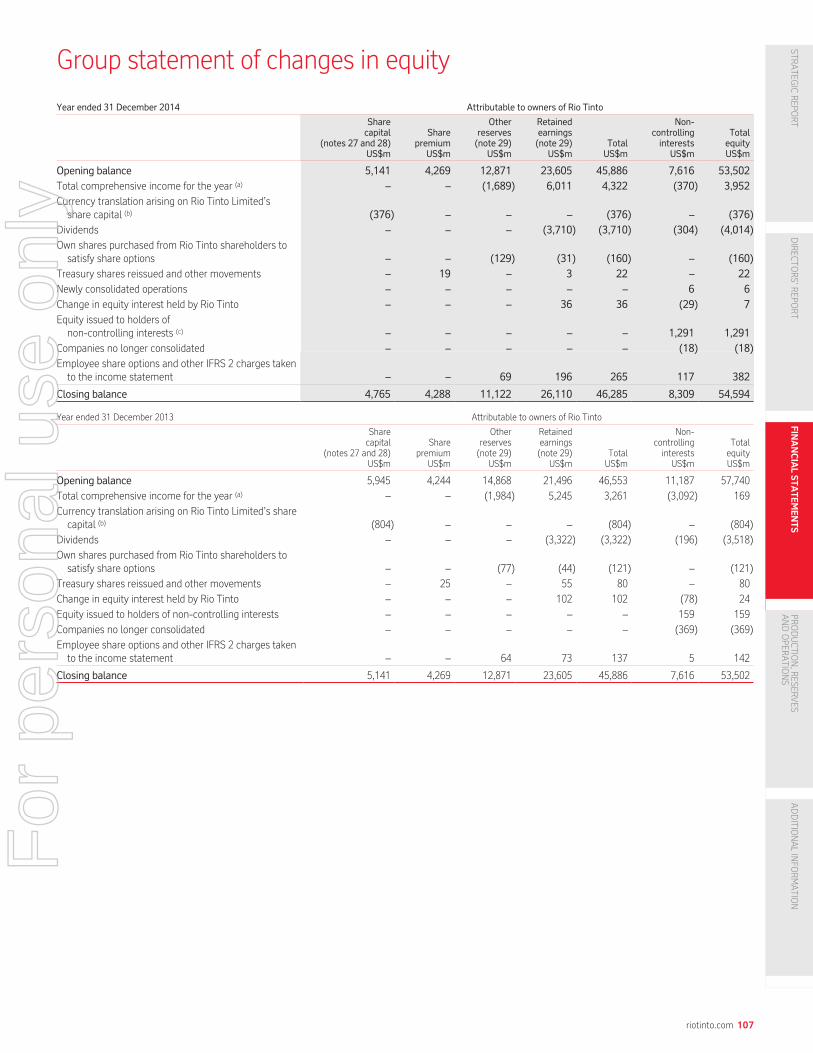
Group statement of changes in equity
Year ended 31 December 2014 Attributable to owners of Rio Tinto
Sharecapital
(notes 27 and 28)US$m
Sharepremium
US$m
Otherreserves(note 29)
US$m
Retainedearnings(note 29)
US$mTotalUS$m
Non-controllinginterests
US$m
TotalequityUS$m
Opening balance 5,141 4,269 12,871 23,605 45,886 7,616 53,502
Total comprehensive income for the year (a) – – (1,689) 6,011 4,322 (370) 3,952
Currency translation arising on Rio Tinto Limited’sshare capital (b) (376) – – – (376) – (376)
Dividends – – – (3,710) (3,710) (304) (4,014)
Own shares purchased from Rio Tinto shareholders tosatisfy share options – – (129) (31) (160) – (160)
Treasury shares reissued and other movements – 19 – 3 22 – 22
Newly consolidated operations – – – – – 6 6
Change in equity interest held by Rio Tinto – – – 36 36 (29) 7
Equity issued to holders ofnon-controlling interests (c) – – – – – 1,291 1,291
Companies no longer consolidated – – – – – (18) (18)
Employee share options and other IFRS 2 charges takento the income statement – – 69 196 265 117 382
Closing balance 4,765 4,288 11,122 26,110 46,285 8,309 54,594
Year ended 31 December 2013 Attributable to owners of Rio Tinto
Sharecapital
(notes 27 and 28)US$m
Sharepremium
US$m
Otherreserves(note 29)
US$m
Retainedearnings(note 29)
US$mTotalUS$m
Non-controllinginterests
US$m
TotalequityUS$m
Opening balance 5,945 4,244 14,868 21,496 46,553 11,187 57,740
Total comprehensive income for the year (a) – – (1,984) 5,245 3,261 (3,092) 169
Currency translation arising on Rio Tinto Limited’s sharecapital (b) (804) – – – (804) – (804)
Dividends – – – (3,322) (3,322) (196) (3,518)
Own shares purchased from Rio Tinto shareholders tosatisfy share options – – (77) (44) (121) – (121)
Treasury shares reissued and other movements – 25 – 55 80 – 80
Change in equity interest held by Rio Tinto – – – 102 102 (78) 24
Equity issued to holders of non-controlling interests – – – – – 159 159
Companies no longer consolidated – – – – – (369) (369)
Employee share options and other IFRS 2 charges takento the income statement – – 64 73 137 5 142
Closing balance 5,141 4,269 12,871 23,605 45,886 7,616 53,502
riotinto.com 107
STRATEG
ICREPO
RT
DIRECTO
RS’R
EPORT
FIN
AN
CIA
LS
TA
TE
ME
NT
SPR
ODUCTIO
N,R
ESERVES
ANDOPER
ATIO
NS
ADDITIO
NALINFO
RMATIO
N
For
per
sona
l use
onl
y

Group statement of changes in equity (continued)
Year ended 31 December 2012 Attributable to owners of Rio Tinto
Sharecapital
(notes 27 and 28)US$m
Sharepremium
US$m
Otherreserves(note 29)
US$m
Retainedearnings(note 29)
US$mTotalUS$m
Non-controllinginterests
US$m
TotalequityUS$m
Opening balance 5,816 4,208 14,745 27,430 52,199 6,685 58,884
Total comprehensive loss for the year (a) – – 103 (3,267) (3,164) 141 (3,023)
Currency translation arising on Rio Tinto Limited’s sharecapital (b) 133 – – – 133 – 133
Dividends – – – (3,038) (3,038) (422) (3,460)
Share buy-back schemes (4) – 4 (764) (764) – (764)
Own shares purchased for share options – – (62) (41) (103) – (103)
Treasury shares reissued and other movements – 36 – 3 39 – 39
Newly consolidated operations (d) (e) – – – – – 2,902 2,902
Change in equity interest held by Rio Tinto (f) – – – 1,128 1,128 166 1,294
Equity issued to holders of non-controlling interests (g) – – – – – 1,595 1,595
Employee share options and other IFRS 2 charges takento the income statement – – 78 45 123 120 243
Closing balance 5,945 4,244 14,868 21,496 46,553 11,187 57,740
(a) Refer to Group statement of comprehensive income.
(b) Refer to note 1 (d).
(c) Equity issued to holders of non-controlling interest in 2014 include US$1,158 million of proceeds from a rights issue by Turquoise Hill Resources Ltd in January 2014.
(d) Rio Tinto gained control of the non-Oyu Tolgoi LLC (OT) assets of Turquoise Hill Resources Ltd on 24 January 2012 when its share reached 51 per cent.
Within newly consolidated operations for 31 December 2012, US$2,678 million represents non-controlling interests in the non-OT assets, of which US$1,439 million is the49 per cent non-controlling interest in net loans receivable from Rio Tinto Group companies. Refer to note 37.
(e) Rio Tinto acquired a controlling interest in Richards Bay Minerals (RBM) in 2012, with consolidation effective from 3 September 2012 (the acquisition date). US$224 million withinnewly consolidated operations relates to the fair value of non-controlling interests at the acquisition date. Refer to note 37.
(f) The majority of the adjustments to equity interest held by Rio Tinto in 2012 arose from the acquisition by a consortium led by Chalco of shares in Simfer Jersey Limited, a Rio Tintosubsidiary, as set out in the Simandou Joint Development Agreement. Chalco made a payment of US$1.35 billion on 24 April 2012 in exchange for an equity interest of 47 per centin Simfer Jersey, reimbursing Rio Tinto for historic project costs. The transfer on 24 April 2012 resulted in an adjustment to retained earnings attributable to owners of Rio Tinto ofUS$1.05 billion, relating to the amount received over Rio Tinto’s carrying value of the interest transferred.
(g) Equity issued to holders of non-controlling interests in 2012 include US$0.9 billion of proceeds from a rights offering by Turquoise Hill, and cash calls of US$480 million followingthe transfer described in (f), which resulted in the Chalco consortium being issued with additional equity interest in proportion to its interest.
108 riotinto.com
For
per
sona
l use
onl
y
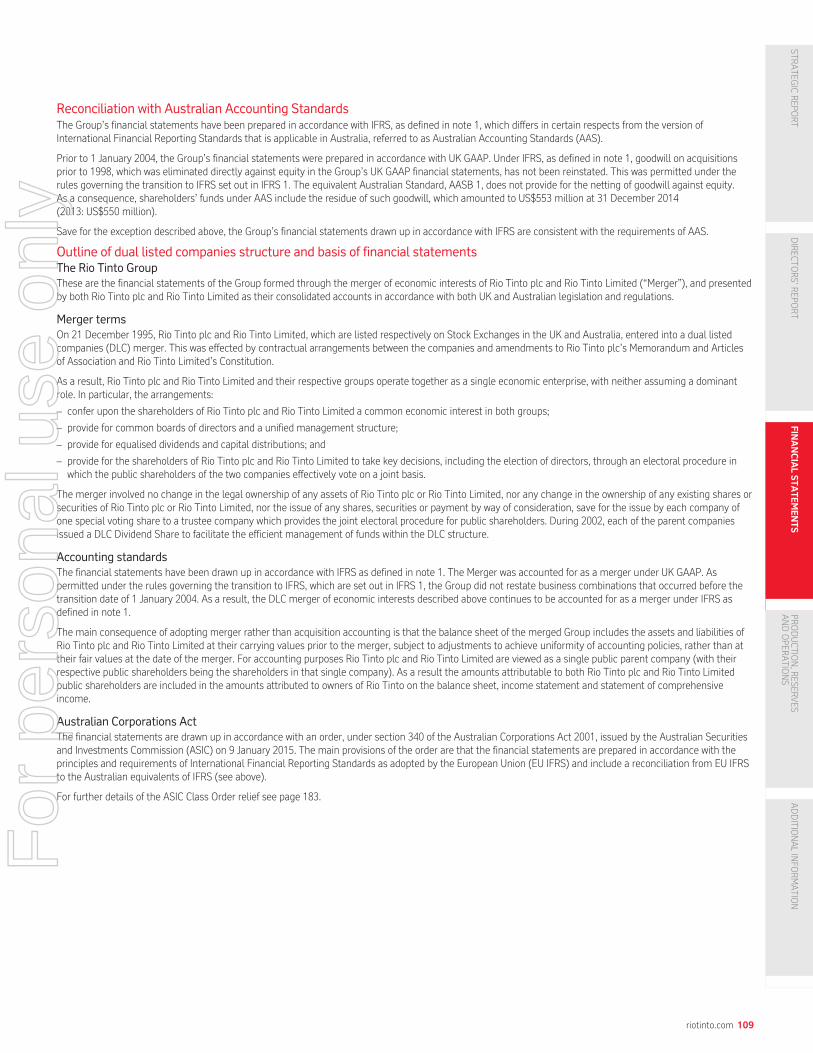
Reconciliation with Australian Accounting StandardsThe Group’s financial statements have been prepared in accordance with IFRS, as defined in note 1, which differs in certain respects from the version ofInternational Financial Reporting Standards that is applicable in Australia, referred to as Australian Accounting Standards (AAS).
Prior to 1 January 2004, the Group’s financial statements were prepared in accordance with UK GAAP. Under IFRS, as defined in note 1, goodwill on acquisitionsprior to 1998, which was eliminated directly against equity in the Group’s UK GAAP financial statements, has not been reinstated. This was permitted under therules governing the transition to IFRS set out in IFRS 1. The equivalent Australian Standard, AASB 1, does not provide for the netting of goodwill against equity.As a consequence, shareholders’ funds under AAS include the residue of such goodwill, which amounted to US$553 million at 31 December 2014(2013: US$550 million).
Save for the exception described above, the Group’s financial statements drawn up in accordance with IFRS are consistent with the requirements of AAS.
Outline of dual listed companies structure and basis of financial statementsThe Rio Tinto GroupThese are the financial statements of the Group formed through the merger of economic interests of Rio Tinto plc and Rio Tinto Limited (“Merger”), and presentedby both Rio Tinto plc and Rio Tinto Limited as their consolidated accounts in accordance with both UK and Australian legislation and regulations.
Merger termsOn 21 December 1995, Rio Tinto plc and Rio Tinto Limited, which are listed respectively on Stock Exchanges in the UK and Australia, entered into a dual listedcompanies (DLC) merger. This was effected by contractual arrangements between the companies and amendments to Rio Tinto plc’s Memorandum and Articlesof Association and Rio Tinto Limited’s Constitution.
As a result, Rio Tinto plc and Rio Tinto Limited and their respective groups operate together as a single economic enterprise, with neither assuming a dominantrole. In particular, the arrangements:
– confer upon the shareholders of Rio Tinto plc and Rio Tinto Limited a common economic interest in both groups;
– provide for common boards of directors and a unified management structure;
– provide for equalised dividends and capital distributions; and
– provide for the shareholders of Rio Tinto plc and Rio Tinto Limited to take key decisions, including the election of directors, through an electoral procedure inwhich the public shareholders of the two companies effectively vote on a joint basis.
The merger involved no change in the legal ownership of any assets of Rio Tinto plc or Rio Tinto Limited, nor any change in the ownership of any existing shares orsecurities of Rio Tinto plc or Rio Tinto Limited, nor the issue of any shares, securities or payment by way of consideration, save for the issue by each company ofone special voting share to a trustee company which provides the joint electoral procedure for public shareholders. During 2002, each of the parent companiesissued a DLC Dividend Share to facilitate the efficient management of funds within the DLC structure.
Accounting standardsThe financial statements have been drawn up in accordance with IFRS as defined in note 1. The Merger was accounted for as a merger under UK GAAP. Aspermitted under the rules governing the transition to IFRS, which are set out in IFRS 1, the Group did not restate business combinations that occurred before thetransition date of 1 January 2004. As a result, the DLC merger of economic interests described above continues to be accounted for as a merger under IFRS asdefined in note 1.
The main consequence of adopting merger rather than acquisition accounting is that the balance sheet of the merged Group includes the assets and liabilities ofRio Tinto plc and Rio Tinto Limited at their carrying values prior to the merger, subject to adjustments to achieve uniformity of accounting policies, rather than attheir fair values at the date of the merger. For accounting purposes Rio Tinto plc and Rio Tinto Limited are viewed as a single public parent company (with theirrespective public shareholders being the shareholders in that single company). As a result the amounts attributable to both Rio Tinto plc and Rio Tinto Limitedpublic shareholders are included in the amounts attributed to owners of Rio Tinto on the balance sheet, income statement and statement of comprehensiveincome.
Australian Corporations ActThe financial statements are drawn up in accordance with an order, under section 340 of the Australian Corporations Act 2001, issued by the Australian Securitiesand Investments Commission (ASIC) on 9 January 2015. The main provisions of the order are that the financial statements are prepared in accordance with theprinciples and requirements of International Financial Reporting Standards as adopted by the European Union (EU IFRS) and include a reconciliation from EU IFRSto the Australian equivalents of IFRS (see above).
For further details of the ASIC Class Order relief see page 183.
riotinto.com 109
STRATEG
ICREPO
RT
DIRECTO
RS’R
EPORT
FIN
AN
CIA
LS
TA
TE
ME
NT
SPR
ODUCTIO
N,R
ESERVES
ANDOPER
ATIO
NS
ADDITIO
NALINFO
RMATIO
N
For
per
sona
l use
onl
y

Notes to the 2014 financial statements
1 Principal accounting policiesCorporate informationRio Tinto’s business is finding, mining and processing mineral resources. Major products are aluminium, copper, diamonds, gold, industrial minerals (borates,titanium dioxide and salt), iron ore, thermal and metallurgical coal and uranium. Activities span the world and are strongly represented in Australia and NorthAmerica with significant businesses in Asia, Europe, Africa and South America.
Rio Tinto plc is incorporated in the UK and listed on the London Stock Exchange and Rio Tinto Limited is incorporated in Australia and listed on the AustralianStock Exchange. Rio Tinto plc’s registered office is at 2 Eastbourne Terrace, London W2 6LG, UK. Rio Tinto Limited’s registered office is at 120 Collins Street,Melbourne, Australia, 3000.
These financial statements consolidate the accounts of Rio Tinto plc and Rio Tinto Limited (together “the Companies”) and their respective subsidiaries (together“the Group”) and include the Group’s share of joint arrangements and associates as explained in note 1(b) below. The Group’s financial statements for the yearended 31 December 2014 were authorised for issue in accordance with a directors’ resolution on 4 March 2015.
Notes 33 to 36 provide more information on the Group’s subsidiaries, joint arrangements and associates and note 40 provides information on the Group’s otherrelated party relationships.
Basis of preparation of the financial statementsThe basis of preparation and the accounting policies used in preparing the Group’s 2014 financial statements are set out below.
The financial statements have been prepared on a going concern basis in accordance with the Companies Act 2006 applicable to companies reporting underInternational Financial Reporting Standards and in accordance with applicable UK law, applicable Australian law as amended by the Australian Securities andInvestments Commission Order dated 9 January 2015 and Article 4 of the European Union IAS regulation and with:
– International Financial Reporting Standards as issued by the International Accounting Standards Board (IASB) and interpretations issued from time to time bythe IFRS Interpretations Committee (IFRIC) both as adopted by the European Union (EU) and which are mandatory for EU reporting as at 31 December 2014;
– IFRIC 21 “Levies” which has been adopted by the EU and is mandatory as at 31 December 2015 for EU reporting and is available for early adoption; and
– International Financial Reporting Standards as issued by the IASB and interpretations issued from time to time by the IFRIC which are mandatory as at31 December 2014.
The above accounting standards and interpretations are collectively referred to as “IFRS” in this report. The Group has not early adopted any other amendments,standards or interpretations that have been issued but are not yet mandatory.
The Group’s financial statements have been prepared on the basis of accounting policies consistent with those applied in the financial statements for the yearended 31 December 2013 except for the implementation of IFRIC 21 and a number of minor amendments issued by the IASB which applied for the first time in2014. These new pronouncements do not have a significant impact on the accounting policies, methods of computation or presentation applied by the Group andtherefore prior period financial statements have not been restated for these pronouncements.
The Group has not applied the following pronouncements which are not mandatory for 2014.
Mandatory for 2015 and endorsed by the EUAmendments to IAS 19 “Defined Benefit Plans: Employee Contributions”. The objective of the amendment is to simplify the accounting for employee or third partycontributions that are independent of the number of years of employee service.
Certain Annual Improvements to IFRS 2010 to 2012 cycle
Annual Improvements to IFRS 2011 to 2013 cycle
Mandatory for 2016 and beyond (not yet endorsed by the EU)Amendment to IAS 1 “Presentation of Financial Statements – Disclosure Initiative”. The amendment provides clarification of guidance in IAS 1 on materiality andaggregation, the presentation of subtotals, the structure of financial statements and the disclosure of accounting policies.
Amendments to IAS 16 and IAS 38. The amendments provide clarification of acceptable methods of depreciation and amortisation.
Amendments to IFRS 10 and IAS 28. The amendments deal with the sale or contribution of assets between an investor and its associate or joint venture.
Amendments to IFRS 11 “Joint Arrangements”. The amendments deal with the accounting for acquisitions of interests in joint operations.
Annual improvements to IFRS 2012-2014 cycle
IFRS 15 “Revenue from contracts with customers”. The core principle of IFRS 15 is that an entity recognises revenue to depict the transfer of promised goods orservices to customers in an amount that reflects the consideration to which the entity expects to be entitled in exchange for those goods or services.
IFRS 9 “Financial Instruments”. The standard includes a single approach for the classification of financial assets, based on cash flow characteristics and the entity’sbusiness model. It introduces a new expected loss impairment model which requires expected losses to be recognised when financial instruments are firstrecognised. The standard amends the rules on hedge accounting to align the accounting treatment with the risk management practices of an entity.
The Group is currently evaluating the impact of these pronouncements which may have an impact on the Group’s earnings or shareholders’ funds in future years.
Judgments in applying accounting policies and key sources of estimation uncertaintyThe preparation of the financial statements requires management to make assumptions, judgments and estimates and to use judgment in applying accountingpolicies and in making critical accounting estimates.
These judgments, estimates and assumptions are based on management’s best knowledge of the relevant facts and circumstances, having regard to previousexperience, but actual results may differ materially from the amounts included in the financial statements. Key areas of judgment and estimation uncertainty arehighlighted below and further information is contained in the accounting policies and/or the Notes to the financial statements.
110 riotinto.com
For
per
sona
l use
onl
y

Areas of judgment that have the most significant effect on the amounts recognised in the financial statements are:
– Merger accounting for the 1995 merger of the economic interests of Rio Tinto plc and Rio Tinto Limited into the dual listed companies (DLC) structure(see Dual listed companies structure on page 109);
– Acquisitions – note 1(b) and note 37;
– Review of asset carrying values, impairment charges and reversals and the recoverability of goodwill – note 1(e) and (i), note 6, note 12 and note 13;
– Estimation of asset lives – note 1(e) and (i);
– Determination of ore reserve and mineral resource estimates – note 1(j);
– Provision for onerous contracts – note 1(i)
– Close-down, restoration and environmental obligations – note 1(k);
– Deferral of stripping costs – note 1(h);
– Uncertain tax positions – note 1(m);
– Recognition of deferred tax on mining rights recognised in acquisitions – note 1(m);
– Recoverability of potential deferred tax assets – note 17(c), (e) and (g);
– Capitalisation of exploration and evaluation costs – note 1(f);
– Identification of functional currencies – note 1(d);
– Basis of consolidation – note 1(b);
– Contingencies – note 31; and
– Post-retirement cost assumptions – note 1(n) and note 45.
Key sources of estimation uncertainty that have a significant risk of causing a material adjustment to the carrying amounts of assets and liabilities within the nextfinancial year are:
– Review of asset carrying values, impairment charges and reversals and the recoverability of goodwill – note1(e) and (i), note 6, note 12 and note 13;
– Estimation of asset lives – note 1(e) and (i);
– Determination of ore reserve and mineral resource estimates – note 1(j);
– Estimation of close-down, restoration and environmental costs and the timing of expenditure – note 1(k) and note 26;
– Estimation of obligations for post-retirement costs – note 1(n) and note 45;
– Recoverability of potential deferred tax assets – note 17 (c), (e) and (g);
– Contingencies – note 31; and
– Capitalisation of exploration and evaluation costs – note 1(f).
These areas of judgment and estimation are discussed further in critical accounting policies and estimates on page 120.
(a) Accounting conventionThe financial information included in the financial statements for the year ended 31 December 2014, and for the related comparative periods, has been preparedunder the historical cost convention, as modified by the revaluation of certain derivative contracts and financial assets, the impact of fair value hedge accountingon the hedged item and the accounting for post-retirement assets and obligations. The Group’s policy in respect of these items is set out in the notes below.
The Group’s financial statements are presented in US dollars and all values are rounded to the nearest million (US$m) unless otherwise stated.
Where applicable, comparatives have been adjusted to measure or present them on the same basis as current period figures.
(b) Basis of consolidation (notes 33 to 36)All intragroup transactions and balances have been eliminated on consolidation.
Where necessary, adjustments are made to the locally reported assets, liabilities, and results of subsidiaries, joint arrangements and associates to bring theiraccounting policies into line with those used by the Group.
Subsidiaries: Subsidiaries are entities controlled by the Companies. Control exists where the Companies have: power over the entities, ie existing rights that givethem the current ability to direct the relevant activities of the entities (those that significantly affect the Companies’ returns); exposure, or rights, to variablereturns from their involvement with the entities; and the ability to use their power to affect those returns. Subsidiaries are fully consolidated from the date onwhich control is transferred to the Group. They are deconsolidated from the date that control ceases.
Joint Arrangements: A joint arrangement is an arrangement of which two or more parties have joint control. Joint control is the contractually agreed sharing ofcontrol such that decisions about the relevant activities of the arrangement (those that significantly affect the Companies’ returns) require the unanimous consentof the parties sharing control. The Group has two types of joint arrangement:
Joint Operations (JOs): A JO is a joint arrangement in which the parties that share joint control have rights to the assets, and obligations for the liabilities, relatingto the arrangement. This includes situations where the parties benefit from the joint activity through a share of the output, rather than by receiving a share of theresults of trading. In relation to its interest in a JO, the Group recognises: its share of assets and liabilities; revenue from the sale of its share of the output and itsshare of any revenue generated from the sale of the output by the JO; and its share of expenses. These are incorporated into the Group’s financial statementsunder the appropriate headings.
Joint Ventures (JVs): A JV is a joint arrangement in which the parties that share joint control have rights to the net assets of the arrangement. JVs are accountedfor using the equity accounting method.
Associates: An associate is an entity that is neither a subsidiary nor a joint arrangement, over which the Group has significant influence. Significant influence ispresumed to exist where there is neither control nor joint control and the Group has over 20 per cent of the voting rights, unless it can be clearly demonstratedthat this is not the case. Significant influence can arise where the Group holds less than 20 per cent of the voting rights if it has the power to participate in thefinancial and operating policy decisions affecting the entity. Investments in associates are accounted for using the equity accounting method.
riotinto.com 111
STRATEG
ICREPO
RT
DIRECTO
RS’R
EPORT
FIN
AN
CIA
LS
TA
TE
ME
NT
SPR
ODUCTIO
N,R
ESERVES
ANDOPER
ATIO
NS
ADDITIO
NALINFO
RMATIO
N
For
per
sona
l use
onl
y
Notes to the 2014 financial statements continued
1 Principal accounting policies continuedThe Group uses the term “equity accounted units” (EAUs) to refer to associates and JVs collectively. For all EAUs, the carrying value will include any long-termloans to the EAUs that in substance form part of the Group’s net investment.
Under the equity accounting method the investment is recorded initially at cost to the Group, including any goodwill on acquisition. In subsequent periods thecarrying amount of the investment is adjusted to reflect the Group’s share of the EAUs’ retained post-acquisition profit or loss and other comprehensive income.
When the Group’s share of losses in an EAU equals or exceeds its interest in the EAU, including any other unsecured receivables, the Group does not recognisefurther losses, unless it has incurred legal or constructive obligations or made payments on behalf of the EAU.
Acquisitions (note 37)Under the “acquisition” method of accounting for business combinations, the purchase consideration is allocated to the identifiable assets acquired and liabilitiesand contingent liabilities assumed (the identifiable net assets) on the basis of their fair value at the date of acquisition which is the date on which control isobtained.
The consideration transferred for the acquisition of a subsidiary comprises the fair values of the assets transferred, the liabilities incurred to the former owners ofthe acquiree and any equity interests issued by the Group. Costs related to the acquisition of a subsidiary are expensed as incurred.
The excess of the consideration transferred, the amount of any non-controlling interest in the acquiree and the acquisition-date fair value of any previous equityinterest in the acquiree over the fair value of the identifiable net assets acquired is recorded as goodwill. Any shortfall is immediately recognised in the incomestatement.
Provisional fair values allocated at a reporting date are finalised within 12 months of the acquisition date.
On an acquisition-by-acquisition basis, the Group recognises any non-controlling interest in the acquiree either at the non-controlling interest’s proportionateshare of the acquiree’s identifiable net assets or at fair value. In some cases, non-controlling interests may be treated as equity options and valued on that basis.Goodwill (see note (e)) and amounts attributable to non-controlling interests will differ depending on the basis used.
Where the Group has a previously held non-controlling interest in the acquiree, this is remeasured to fair value at the date control is gained with any gain or lossrecognised in the income statement. The cash cost of the share purchase that gives rise to control is included within “Investing activities” in the cash flowstatement.
Where the Group increases its ownership interest in a subsidiary, the difference between the purchase price and the carrying value of the share of net assetsacquired is recorded in equity. The cash cost of such purchases is included within “Financing activities” in the cash flow statement.
The results of businesses acquired during the year are included in the consolidated financial statements from the date on which control, joint control or significantinfluence commences.
Disposals (note 37)Individual non-current assets or “disposal groups” (ie groups of assets and liabilities) to be disposed of, by sale or otherwise in a single transaction, are classified as“held for sale” if the following criteria are met at the period end:
– the carrying amount will be recovered principally through a sale transaction rather than through continuing use; and
– the disposal group is available for immediate sale in its present condition subject only to terms that are usual and customary for such sales; and
– the sale is highly probable.
Disposal groups held for sale are carried at the lower of their carrying amount and fair value less costs to sell. The comparative balance sheet is not restated.Disposal groups acquired with a view to resale are held at the fair value determined at the acquisition date. For these assets acquired for resale no profits or lossesare recognised between the acquisition date and the disposal date, unless there is a subsequent impairment.
On classification as held for sale, the assets are no longer depreciated.
If control is lost, any interest in the entity retained by the Group is remeasured to its fair value and the change in carrying amount is recognised in the incomestatement. The retained interest may be subsequently accounted for as a joint venture, joint operation, associate or financial asset depending on the facts. Anyamounts previously recognised in other comprehensive income in respect of the entity disposed of, or for which control, joint control or significant influence hasceased, may be recycled to the income statement in proportion to the interest disposed of. The cash proceeds of disposals are included within “Investing activities”in the cash flow statement.
Gains or losses on disposals to non-controlling interests where control is retained are recorded in equity. The cash proceeds of such disposals are included within“Financing activities” in the cash flow statement.
(c) Sales revenueSales revenue comprises sales to third parties at invoiced amounts. All shipping and handling costs incurred by the Group are recognised as operating costs.Amounts billed to customers in respect of shipping and handling are classified as sales revenue where the Group is responsible for freight. If the Group is actingsolely as an agent, amounts billed to customers are offset against the relevant costs. Revenue from services is recognised as services are rendered and acceptedby the customer.
Sales revenue excludes any applicable sales taxes. Mining royalties payable are presented as an operating cost or, where they are in substance a profit-based tax,within taxation.
Revenues from the sale of significant by-products, such as gold, are included in sales revenue. Sundry revenue, incidental to the main revenue-generatingactivities of the operations, and which is a consequence of producing and selling the main products, is treated as a credit to operating costs.
Third-party commodity swap arrangements for delivery and receipt of smelter grade alumina are offset within operating costs.
Sales of copper concentrate are stated at their invoiced amount which is net of treatment and refining charges.
Sales revenue is only recognised on individual sales when all of the following criteria are met:
– the significant risks and rewards of ownership of the product have been transferred to the buyer;
– neither continuing managerial involvement to the degree usually associated with ownership, nor effective control over the goods sold, has been retained;
112 riotinto.com
For
per
sona
l use
onl
y

– the amount of revenue can be measured reliably;
– it is probable that the economic benefits associated with the sale will flow to the Group; and
– the costs incurred or to be incurred in respect of the sale can be measured reliably.
These conditions are generally satisfied when title passes to the customer. In most instances, sales revenue is recognised when the product is delivered to thedestination specified by the customer, which is typically the vessel on which it will be shipped, the destination port or the customer’s premises.
The Group’s products are sold to customers under contracts which vary in tenure and pricing mechanisms, with some volumes sold in the spot market.
Pricing for iron ore is on a range of terms, the majority being either monthly or quarterly average pricing mechanisms, with a smaller proportion of iron orevolumes being sold on the spot market. Substantially all iron ore sales are reflected at final prices in the results for the period, based on the best availableinformation at the period end.
Sales revenue is commonly subject to adjustment based on an inspection of the product by the customer. In such cases, sales revenue is initially recognised on aprovisional basis using the Group’s best estimate of contained metal, and adjusted subsequently.
Certain products are “provisionally priced”, ie the selling price is subject to final adjustment at the end of a period normally ranging from 30 to 180 days afterdelivery to the customer. The final price is based on the market price at the relevant quotation point stipulated in the contract.
As is customary in the industry, revenue on provisionally-priced sales is recognised based on estimates of the fair value of the consideration receivable based onrelevant forward market prices. At each reporting date, provisionally priced metal is marked to market based on the forward selling price for the quotational periodstipulated in the contract. For this purpose, the selling price can be measured reliably for those products, such as copper, for which there exists an active andfreely-traded commodity market such as the London Metals Exchange and the value of product sold by the Group is directly linked to the form in which it is tradedon that market.
The marking to market of provisionally-priced sales contracts is recorded as an adjustment to sales revenue. Information on provisionally-priced sales contracts isincluded in note 30.
(d) Currency translation
The functional currency for each entity in the Group, and for joint arrangements and associates, is the currency of the primary economic environment in which thatentity operates. For many entities, this is the currency of the country in which they are located. Transactions denominated in other currencies are converted to thefunctional currency at the exchange rate ruling at the date of the transaction. Monetary assets and liabilities denominated in foreign currencies are retranslated atyear end exchange rates. The Group’s accounting policies for derivative financial instruments and hedge accounting are explained in more detail in note 1(p) (iii).
The Group’s financial statements are presented in US dollars, as that presentation currency most reliably reflects the global business performance of the Group asa whole. On consolidation, income statement items for each entity are translated from the functional currency into US dollars at average rates of exchange wherethe average is a reasonable approximation of rates prevailing on the transaction date. Balance sheet items are translated into US dollars at period-end exchangerates.
Exchange differences arising on the translation of the net assets of entities with functional currencies other than the US dollar are recognised directly in the foreigncurrency translation reserve. These translation differences are shown in the statement of comprehensive income with the exception of translation adjustmentsrelating to Rio Tinto Limited’s share capital which are shown in the statement of changes in equity.
Where an intragroup balance is, in substance, part of the Group’s net investment in an entity, exchange gains and losses on that balance are taken to the foreigncurrency translation reserve.
Except as noted above, or in note (p) below relating to derivative contracts, all other exchange differences are charged or credited to the income statement in theyear in which they arise.
(e) Goodwill and intangible assets (excluding exploration and evaluation expenditure) (notes 12 and 13)
Goodwill is not amortised; it is tested annually for impairment or more frequently if events or changes in circumstances indicate a potential impairment.Investments in EAUs including any goodwill are tested for impairment as a single asset when a trigger for impairment has been identified. The Group’s impairmentpolicy is explained in note 1(i).
Purchased intangible assets are initially recorded at cost. Finite-life intangible assets are amortised over their useful economic lives on a straight line or units ofproduction basis, as appropriate. Intangible assets that are deemed to have indefinite lives and intangible assets that are not yet ready for use are not amortised;they are reviewed annually for impairment or more frequently if events or changes in circumstances indicate a potential impairment in accordance with accountingpolicy note 1(i).
The Group considers that intangible assets have indefinite lives when, based on an analysis of all of the relevant factors, there is no foreseeable limit to the periodover which the asset is expected to generate cash flows for the Group. The factors considered in making this judgment include the existence of contractual rightsfor unlimited terms; or evidence that renewal of the contractual rights without significant incremental cost can be expected for indefinite future periods in view ofthe Group’s investment intentions. The life cycles of the products and processes that depend on the asset are also considered.
(f) Exploration and evaluation (note 13)
Exploration and evaluation expenditure comprises costs that are directly attributable to:
– researching and analysing existing exploration data;
– conducting geological studies, exploratory drilling and sampling;
– examining and testing extraction and treatment methods; and/or
– compiling pre-feasibility and feasibility studies.
Exploration expenditure relates to the initial search for deposits with economic potential. Expenditure on exploration activity is not capitalised.
riotinto.com 113
STRATEG
ICREPO
RT
DIRECTO
RS’R
EPORT
FIN
AN
CIA
LS
TA
TE
ME
NT
SPR
ODUCTIO
N,R
ESERVES
ANDOPER
ATIO
NS
ADDITIO
NALINFO
RMATIO
N
For
per
sona
l use
onl
y
Notes to the 2014 financial statements continued
1 Principal accounting policies continuedEvaluation expenditure relates to a detailed assessment of deposits or other projects that have been identified as having economic potential. Capitalisation ofevaluation expenditure commences when there is a high degree of confidence that the Group will determine that a project is commercially viable, ie the projectwill provide a satisfactory return relative to its perceived risks, and therefore it is considered probable that future economic benefits will flow to the Group.
The carrying values of capitalised evaluation expenditure are reviewed for impairment twice a year by management. In the case of undeveloped mining projects(projects for which the decision to mine has not yet been approved at the appropriate authorisation level within the Group) which have arisen through acquisition,the allocation of the purchase price consideration may result in undeveloped properties being recognised at an earlier stage of project evaluation compared withorganic projects. The impairment review is based on a status report summarising the Group’s intentions for development. Subsequent expenditure on acquiredundeveloped projects is only capitalised if it meets the high degree of confidence threshold discussed above.
In some cases, undeveloped projects are regarded as successors to orebodies, smelters or refineries currently in production. Where this is the case, it is intendedthat these will be developed and go into production when the current source of ore is exhausted or to replace the output when existing smelters and/or refineriesare closed.
(g) Property, plant and equipment (note 14)Once an undeveloped mining project has been determined as commercially viable and approval to mine has been given, expenditure other than that on land,buildings, plant, equipment and capital work in progress is capitalised under “Mining properties and leases” together with any amount transferred from“Exploration and evaluation”. Ore reserves may be declared for an undeveloped mining project before its commercial viability has been fully determined.Evaluation costs may continue to be capitalised during the period between declaration of ore reserves and approval to mine as further work is undertaken in orderto refine the development case to maximise the project’s returns.
Costs of evaluation of a smelter or refinery prior to approval to develop are capitalised under “Capital works in progress”, provided that there is a high degree ofconfidence that the project will be deemed to be commercially viable.
Costs which are necessarily incurred whilst commissioning new assets, in the period before they are capable of operating in the manner intended by management,are capitalised. Development costs incurred after the commencement of production are capitalised to the extent they are expected to give rise to a futureeconomic benefit. Interest on borrowings related to construction or development projects is capitalised, at the rate payable on project-specific debt if applicable, orat the Group’s cost of borrowing if not, until the point when substantially all the activities that are necessary to make the asset ready for its intended use arecomplete.
Property, plant and equipment is stated at cost, as defined in IAS 16, less accumulated depreciation and accumulated impairment losses. The cost of property,plant and equipment includes the estimated close-down and restoration costs associated with the asset.
(h) Deferred stripping (note 14)In open pit mining operations, overburden and other waste materials must be removed to access ore from which minerals can be extracted economically.The process of removing overburden and waste materials is referred to as stripping. During the development of a mine (or pit), before production commences,stripping costs are capitalised as part of the cost of construction of the mine (or pit) and are subsequently amortised over the life of the mine (or pit) on a units ofproduction basis.
In order for production phase stripping costs to qualify for capitalisation as a stripping activity asset, three criteria must be met:
– it must be probable that there will be an economic benefit in a future accounting period because the stripping activity has improved access to the orebody; and
– it must be possible to identify the “component” of the orebody for which access has been improved; and
– it must be possible to reliably measure the costs that relate to the stripping activity.
A “component” is a specific section of the orebody that is made more accessible by the stripping activity. It will typically be a subset of the larger orebody that isdistinguished by a separate useful economic life eg a pushback.
Production phase stripping can give rise to two benefits: the extraction of ore in the current period and improved access to ore which will be extracted in futureperiods. When the cost of stripping which has a future benefit is not distinguishable from the cost of producing current inventories, the stripping cost is allocated toeach of these activities based on a relevant production measure using a life of component strip ratio. The ratio divides the tonnage of waste mined for thecomponent for the period either by the quantity of ore mined for the component or by the quantity of minerals contained in the ore mined for the component. Insome operations, the quantity of ore is a more appropriate basis for allocating costs, particularly where there are significant by-products. Stripping costs for thecomponent are deferred to the extent that the current period ratio exceeds the life of component ratio. The stripping activity asset is depreciated on a “units ofproduction” basis based on expected production of either ore or contained minerals over the life of the component unless another method is more appropriate.
The life of component ratios are based on the ore reserves of the mine (and for some mines, other mineral resources) and the annual mine plan; they are afunction of the mine design and therefore changes to that design will generally result in changes to the ratios. Changes in other technical or economic parametersthat impact the ore reserves (and for some mines, other mineral resources) may also have an impact on the life of component ratios even if they do not affect themine design. Changes to the ratios are accounted for prospectively.
It may be the case that subsequent phases of stripping will access additional ore and that these subsequent phases are only possible after the first phase hastaken place. Where applicable, the Group considers this on a mine-by-mine basis. Generally, the only ore attributed to the stripping activity asset for the purposesof calculating a life of component ratio, and for the purposes of amortisation, is the ore to be extracted from the originally identified component.
Where a mine operates several open pits that are regarded as separate operations for the purpose of mine planning, initial stripping costs are accounted forseparately by reference to the ore from each separate pit. If, however, the pits are highly integrated for the purpose of mine planning, the second and subsequentpits are regarded as extensions of the first pit in accounting for stripping costs. In such cases, the initial stripping (ie overburden and other waste removal) of thesecond and subsequent pits is considered to be production phase stripping.
The Group’s judgment as to whether multiple pit mines are considered separate or integrated operations depends on each mine’s specific circumstances.
The following factors would point towards the initial stripping costs for the individual pits being accounted for separately:
– If mining of the second and subsequent pits is conducted consecutively with that of the first pit, rather than concurrently.
– If separate investment decisions are made to develop each pit, rather than a single investment decision being made at the outset.
114 riotinto.com
For
per
sona
l use
onl
y

– If the pits are operated as separate units in terms of mine planning and the sequencing of overburden removal and ore mining, rather than as an integrated unit.
– If expenditures for additional infrastructure to support the second and subsequent pits are relatively large.
– If the pits extract ore from separate and distinct orebodies, rather than from a single orebody.
If the designs of the second and subsequent pits are significantly influenced by opportunities to optimise output from the several pits combined, including theco-treatment or blending of the output from the pits, then this would point to treatment as an integrated operation for the purpose of accounting for initialstripping costs.
The relative importance of each of the above factors is considered in each case.
Deferred stripping costs are included in “Mining properties and leases” within “Property, plant and equipment” or within “Investments in equity accounted units”,as appropriate. Amortisation of deferred stripping costs is included in “Depreciation on property, plant and equipment” within “Net operating costs” or in “Share ofprofit after tax of equity accounted units”, as appropriate.
(i) Depreciation and impairment (notes 13 and 14)Depreciation of non-current assetsProperty, plant and equipment is depreciated over its useful life, or over the remaining life of the mine or smelter or refinery if that is shorter and there is noreasonable alternative use for the asset.
The useful lives of the major assets of a cash-generating unit are often dependent on the life of the orebody to which they relate. Where this is the case, the livesof mining properties, and their associated refineries, concentrators and other long-lived processing equipment are generally based on the expected life of theorebody. The life of the orebody, in turn, is estimated on the basis of the life-of-mine plan. Where the major assets of a cash-generating unit are not dependent onthe life of a related orebody, management applies judgment in estimating the remaining service potential of long-lived assets. Factors affecting the remainingservice potential of smelters, for example, include smelter technology and electricity purchase contracts when power is not sourced from the company’s, or insome cases a local government’s, electricity generating capacity.
The useful lives and residual values for material assets and categories of assets are reviewed annually and changes reflected prospectively.
Depreciation commences when an asset is available for use. The major categories of property, plant and equipment are depreciated on a units of productionand/or straight-line basis as follows:
Units of production basisFor mining properties and leases and certain mining equipment, consumption of the economic benefits of the asset is linked to production. Except as noted below,these assets are depreciated on a units of production basis.
In applying the units of production method, depreciation is normally calculated based on production in the period as a percentage of total expected production incurrent and future periods based on ore reserves and, for some mines, other mineral resources. Other mineral resources may be included in depreciationcalculations in limited circumstances and where there is a high degree of confidence that they can be extracted economically. This would be the case when theother mineral resources do not yet have the status of ore reserves merely because the necessary detailed evaluation work has not yet been performed and theresponsible technical personnel agree that inclusion of a proportion of measured and indicated resources is appropriate based on historic reserve conversion rates.
Other mineral resources would usually only be included in unit of production calculations where there are very large areas of contiguous mineralisation, for whichthe economic viability is not sensitive to likely variations in grade, as may be the case for certain iron ore, bauxite and industrial minerals deposits. The requiredlevel of confidence is unlikely to exist for minerals that are typically found in low-grade ore, (compared with the above) such as copper or gold. In these cases,specific areas of mineralisation have to be evaluated in considerable detail before their economic status can be predicted with confidence.
Where measured and indicated resources are used in the calculation of depreciation for infrastructure, primarily rail and port, which will benefit current and futuremines then the measured and indicated resources may relate to mines which are currently in production or to mines where there is a high degree of confidencethat they will be brought into production in the future. The quantum of mineral resources is determined taking into account future capital costs as required by theJoint Ore Reserves Committee (JORC) code. The depreciation calculation, however, does not take into account future development costs for mines which are notyet in production. Measured and indicated resources are currently incorporated into depreciation calculations in the Group’s Australian iron ore business.
Straight-line basisAssets within operations for which production is not expected to fluctuate significantly from one year to another or which have a physical life shorter than therelated mine are depreciated on a straight-line basis.
Impairment charges/reversals of non-current assetsImpairment charges and reversals are assessed at the level of cash-generating units which, in accordance with IAS 36 “Impairment of Assets”, are identified as thesmallest identifiable asset or group of assets that generate cash inflows, which are largely independent of the cash inflows from other assets. The existence of anactive market for intermediate products is also monitored and separate cash-generating units are identified even if the majority of those products are furtherprocessed internally and therefore the cash flows are not independent. Impairment of financial assets is discussed in note (p).
In some cases, individual business units consist of several operations with independent cash-generating streams, which constitute separate cash-generating units.
Goodwill acquired through business combinations is allocated to the cash-generating unit, or groups of cash-generating units if that is the lowest level within theGroup at which goodwill is monitored for internal management purposes, that are expected to benefit from the related business combination. All goodwill andintangible assets that are not yet ready for use or have an indefinite life are tested annually for impairment as at 30 September, regardless of whether there hasbeen an impairment trigger, or more frequently if events or changes in circumstances indicate a potential impairment.
Property, plant and equipment and intangible assets with finite lives are reviewed for impairment if there is an indication that the carrying amount may not berecoverable. The Group conducts an internal review of the asset values annually as at 30 September which is used as a source of information to assess forindications of impairment or reversal of previously recognised impairment losses. External factors, such as changes in expected future prices, costs and othermarket factors, are also monitored to assess for indications of impairment or reversal of previously recognised impairment losses. If any such indication exists thenan impairment review is undertaken, the recoverable amount is assessed by reference to the higher of value in use (being the net present value of expected futurecash flows of the relevant cash-generating unit in its current condition) and fair value less costs of disposal (FVLCD).
riotinto.com 115
STRATEG
ICREPO
RT
DIRECTO
RS’R
EPORT
FIN
AN
CIA
LS
TA
TE
ME
NT
SPR
ODUCTIO
N,R
ESERVES
ANDOPER
ATIO
NS
ADDITIO
NALINFO
RMATIO
N
For
per
sona
l use
onl
y

Notes to the 2014 financial statements continued
1 Principal accounting policies continuedWhen the recoverable amount of the cash-generating unit is measured by reference to FVLCD, this amount is further classified in accordance with the fair valuehierarchy for observable market data that is consistent with the unit of account for the cash-generating unit being tested. The Group considers that the bestevidence of FVLCD is the value obtained from an active market or binding sale agreement and, in this case, the recoverable amount is classified in the fair valuehierarchy as level 1. When FVLCD is based on quoted prices for equity instruments but adjusted to reflect factors such as a lack of liquidity in the market, therecoverable amount is classified as level 2 in the fair value hierarchy. No cash-generating units are currently assessed for impairment by reference to a recoverableamount based on FVLCD classified as level 2.
Where unobservable inputs are material to the measurement of the recoverable amount, FVLCD is based on the best information available to reflect the amountthe Group could receive for the cash-generating unit in an orderly transaction between market participants at the measurement date. This is often estimated usingdiscounted cash flow techniques and is classified as level 3 in the fair value hierarchy.
Where the recoverable amount is assessed using FVLCD based on discounted cash flow techniques, the resulting estimates are based on detailed “life-of-mine”and/or long term production plans. The latter may include brownfield expansions which have not yet been approved at the appropriate authorisation level in theGroup.
The cash flow forecasts for FVLCD purposes are based on management’s best estimates of expected future revenues and costs, including the future cash costs ofproduction, capital expenditure, closure, restoration and environmental costs. For the purposes of determining FVLCD from a market participant’s perspective, thecash flows incorporate management’s price and cost assumptions in the short and medium term. In the longer term, operating margins are assumed to remainconstant where appropriate; as it is considered unlikely that a market participant would prepare detailed forecasts over a longer term. The cash flow forecasts mayinclude net cash flows expected to be realised from extraction, processing and sale of material that does not currently qualify for inclusion in ore reserves. Suchnon-reserve material is only included when there is a high degree of confidence in its economic extraction. This expectation is usually based on preliminary drillingand sampling of areas of mineralisation that are contiguous with existing ore reserves. Typically, the additional evaluation required to achieve reserve status forsuch material has not yet been done because this would involve incurring evaluation costs earlier than is required for the efficient planning and operation of themine.
As noted above, cost levels incorporated in the cash flow forecasts for FVLCD purposes are based on the current life-of-mine plan or long-term production plan forthe cash-generating unit. This differs from value in use which requires future cash flows to be estimated for the asset in its current condition and therefore doesnot include future cash flows associated with improving or enhancing an asset’s performance. Anticipated enhancements to assets may be included in FVLCDcalculations and therefore generally result in a higher value.
Where the recoverable amount of a cash-generating unit is dependent on the life of its associated orebody, expected future cash flows reflect the current life ofmine or long-term production plans, which are based on detailed research, analysis and iterative modelling to optimise the level of return from investment, outputand sequence of extraction. The mine plan takes account of all relevant characteristics of the orebody, including waste-to-ore ratios, ore grades, haul distances,chemical and metallurgical properties of the ore impacting on process recoveries and capacities of processing equipment that can be used. The life-of-mine planand/or long term production plans are therefore the basis for forecasting production output and production costs in each future year.
Forecast cash flows for ore reserve estimation for JORC purposes are generally based on Rio Tinto’s commodity price forecasts, which assume short-term marketprices will revert to the Group’s assessment of the long-term price, generally over a period of three to five years. For most commodities, these forecast commodityprices are derived from a combination of analyses of the marginal costs of the producers and of the incentive price of these commodities. These assessmentsoften differ from current price levels and are updated periodically. The Group does not believe that published medium and long-term forward prices provide a goodindication of future levels because they tend to be strongly influenced by spot prices. The price forecasts used for ore reserve estimation are generally consistentwith those used for impairment testing unless management deems that in certain economic environments, a market participant would not assign Rio Tinto’s viewon prices, in which case management estimates the assumptions that a market participant would be expected to use.
Forecast future cash flows of a cash-generating unit take into account the sales prices under existing sales contracts.
The discount rates applied to the future cash flow forecasts represent an estimate of the rate the market would apply having regard to the time value of moneyand the risks specific to the asset for which the future cash flow estimates have not been adjusted. The Group’s weighted average cost of capital is used as astarting point for determining the discount rates, with appropriate adjustments for the risk profile of the countries in which the individual cash-generating unitsoperate. For final feasibility studies and ore reserve estimation, internal hurdle rates, which are generally higher than the Group’s weighted average cost of capital,are used.
For operations with a functional currency other than the US dollar, the impairment review is undertaken in the relevant functional currency. In estimating FVLCD,internal forecasts for long-term exchange rates take into account spot exchange rates, historical data and external forecasts, and are linked to price assumptions.The great majority of the Group’s sales are based on prices denominated in US dollars. To the extent that the currencies of countries in which the Group producescommodities strengthen against the US dollar without commodity price offset, cash flows and, therefore, net present values are reduced. Management considersthat over the long term, there is a tendency for movements in commodity prices to compensate to some extent for movements in the value of the US dollar,particularly against the Australian dollar and Canadian dollar, and vice versa. However, such compensating changes are not synchronised and do not fully offseteach other.
IAS 36 requires that value in use be based on exchange rates current at the time of the assessment.
Non-current assets (excluding goodwill) that have suffered impairment are reviewed whenever events or changes in circumstances indicate that the impairmentloss may no longer exist, or may have decreased. If appropriate an impairment reversal will be recognised. The carrying amount of the cash generating unit afterreversal must be the lower of (a) the recoverable amount, as calculated above, and (b) the carrying amount that would have been determined (net of amortisationor depreciation) had no impairment loss been recognised for the cash-generating unit in prior periods.
An onerous contract is defined under IAS 37 “Provisions, Contingent Liabilities and Contingent Assets” as a contract under which the unavoidable costs of meetingthe obligations under the contract exceed the economic benefits expected to be received under it. However, no provision is required provided that the relatedassets, which may be the wider cash-generating unit of which the business unit forms part, are not fully impaired.
116 riotinto.com
For
per
sona
l use
onl
y

(j) Determination of ore reserve and mineral resource estimatesThe Group estimates its ore reserves and mineral resources based on information compiled by Competent Persons as defined in accordance with the AustralasianCode for Reporting of Exploration Results, Mineral Resources and Ore Reserves of December 2012 (the “JORC code”, which is produced by the Australasian JointOre Reserves Committee).
Ore reserves and, for certain mines, other mineral resources, determined in this way are used in the calculation of depreciation, amortisation and impairmentcharges and for forecasting the timing of the payment of close-down and restoration costs and the recovery of deferred tax assets. The depreciation andimpairment policy above notes instances in which mineral resources are taken into account for accounting purposes. In addition, value may be attributed tomineral resources in purchase price allocations undertaken for the purposes of business combination accounting.
(k) Close-down, restoration and environmental obligations (note 26)The Group has provisions for close-down and restoration costs which include the dismantling and demolition of infrastructure, the removal of residual materialsand the remediation of disturbed areas for mines and certain refineries and smelters. These provisions are based on all regulatory requirements and any othercommitments made to stakeholders. Closure provisions are not made for those operations that have no known restrictions on their lives as the closure datescannot be reliably estimated. This applies primarily to certain North American smelters which have water rights or power agreements with local governments.
Close-down and restoration costs are a normal consequence of mining or production, and the majority of close-down and restoration expenditure is incurred in theyears following closure of the mine, refinery or smelter. Although the ultimate cost to be incurred is uncertain, the Group’s businesses estimate their costs usingcurrent restoration standards and techniques.
Close-down and restoration costs are provided for in the accounting period when the obligation arising from the related disturbance occurs, based on the netpresent value of the estimated future costs of restoration to be incurred during the life of the operation and post closure. Where appropriate, the provision isestimated using probability weighting of the different remediation and closure scenarios. The obligation may occur during development or during the productionphase of a facility.
Provisions for close-down and restoration costs do not include any additional obligations which are expected to arise from future disturbance. The costs areestimated on the basis of a closure plan, and are reviewed six monthly during the life of the operation to reflect known developments. The estimates are subject toformal review at regular intervals.
The initial close-down and restoration provision is capitalised within “Property, plant and equipment”. Subsequent movements in the close-down and restorationprovisions for ongoing operations, including those resulting from new disturbance related to expansions or other activities qualifying for capitalisation, updatedcost estimates, changes to the estimated lives of operations, changes to the timing of closure activities and revisions to discount rates are also capitalised within“Property, plant and equipment”. These costs are then depreciated over the lives of the assets to which they relate. Changes in closure provisions relating toclosed operations are charged/credited to ‘’Net operating costs’ in the income statement.
Where rehabilitation is conducted systematically over the life of the operation, rather than at the time of closure, provision is made for the estimated outstandingcontinuous rehabilitation work at each balance sheet date and the cost is charged to the income statement.
The amortisation or “unwinding” of the discount applied in establishing the provisions is charged to the income statement in each accounting period.The amortisation of the discount is shown within “Finance items” in the income statement.
Environmental costs result from environmental damage that was not a necessary consequence of operations, and may include remediation, compensation andpenalties. Provision is made for the estimated present value of such costs at the balance sheet date. These costs are charged to “Net operating costs”, except forthe unwinding of the discount which is shown within “Finance items”.
Remediation procedures may commence soon after the time the disturbance, remediation process and estimated remediation costs become known, but cancontinue for many years depending on the nature of the disturbance and the remediation techniques used.
(l) Inventories (note 16)Inventories are valued at the lower of cost and net realisable value, primarily on a weighted average cost basis. Average costs are calculated by reference to thecost levels experienced in the relevant month together with those in opening inventory. The cost of raw materials and consumable stores is the purchase price.The cost of partly-processed and saleable products is generally the cost of production, including:
– labour costs, materials and contractor expenses which are directly attributable to the extraction and processing of ore and the production of alumina andaluminium;
– the depreciation of mining properties and leases and of property, plant and equipment used in the extraction and processing of ore and the production ofalumina and aluminium; and
– production overheads.
Work in progress includes ore stockpiles and other partly processed material. Stockpiles represent ore that has been extracted and is available for furtherprocessing. If there is significant uncertainty as to when the stockpiled ore will be processed, the ore is expensed as mined. If the ore will not be processed withinthe 12 months after the balance sheet date, it is included within non-current assets and net realisable value is calculated on a discounted cash flow basis.Quantities of stockpiled ore are assessed primarily through surveys and assays.
(m) Taxation (note 9 and note 17)Current tax is the tax expected to be payable on the taxable income for the year calculated using rates that have been enacted or substantively enacted at thebalance sheet date. It includes adjustments for tax expected to be payable or recoverable in respect of previous periods. Where the amount of tax payable orrecoverable is uncertain, Rio Tinto establishes provisions based on the Group’s judgment of the probable amount of the liability, or recovery.
Deferred tax is calculated in accordance with IAS 12. The Group provides for deferred tax in respect of fair value adjustments on acquisitions. These adjustmentsmay relate to assets such as mining rights that, in general, are not eligible for income tax allowances. Provision for deferred tax is based on the difference betweenthe carrying value of the asset and its income tax base (which may be US$nil). Even when there is no income tax base, the existence of a tax base for capital gainstax purposes is not taken into account in determining the deferred tax provision for the assets, unless they are classified as held for sale, because it is expectedthat the carrying amount will be recovered primarily through use of the assets and not from disposal.
riotinto.com 117
STRATEG
ICREPO
RT
DIRECTO
RS’R
EPORT
FIN
AN
CIA
LS
TA
TE
ME
NT
SPR
ODUCTIO
N,R
ESERVES
ANDOPER
ATIO
NS
ADDITIO
NALINFO
RMATIO
N
For
per
sona
l use
onl
y

Notes to the 2014 financial statements continued
1 Principal accounting policies continued(n) Post-employment benefits (note 45)The Group operates a number of defined benefit plans which provide lump sums, pensions, medical benefits and life insurance to retirees. For post-retirementdefined benefit plans, the difference between the fair value of any plan assets and the present value of the plan obligations is recognised as an asset or liability inthe balance sheet.
The fair value of plan assets is the price that would be received to sell the assets in orderly transactions between market participants at the measurement date.Where appropriate, the recognition of assets may be restricted to the present value of any amounts the Group expects to recover by way of refunds from the planor reductions in future contributions.
The most significant assumptions used in accounting for pension plans are the discount rate, the inflation assumption and the mortality assumptions.The discount rate is used to determine the net present value of the obligations, the interest cost on the obligations and the interest income on plan assets.The discount rate used is the yield on high-quality corporate bonds with maturities and terms that match those of the post-retirement obligations as closely aspossible. Where there is no developed corporate bond market in a country, the rate on government bonds is used. The inflation assumption is used to projectincreases in future benefit payments for those plans that have benefits linked to inflation. The mortality assumption is used to project the future stream of benefitpayments, which is then discounted to arrive at the net present value of the obligations.
Valuations of the obligations are carried out using the projected unit method which values benefits accrued at the valuation date with allowance where appropriatefor future increases to pay and pensions. The values of the obligations are assessed in accordance with the advice of independent qualified actuaries.
The current service cost, any past service cost and the effect of any curtailment or settlements are recognised in the income statement. The interest cost lessinterest income on assets held in the plans is also charged to the income statement. All amounts charged to the income statement in respect of these plans areincluded within “Net operating costs” or in “Share of profit after tax of equity accounted units” as appropriate.
Actuarial gains and losses arising in the year are credited/charged to the statement of comprehensive income and comprise the effects of changes in actuarialassumptions and experience adjustments due to differences between the previous actuarial assumptions and what has actually occurred. In particular, thedifference between the interest income and the actual return on plan assets is recognised in the statement of comprehensive income.
The Group’s contributions to defined contribution plans are charged to the income statement in the period to which the contributions relate.
(o) Cash and cash equivalentsFor the purpose of the balance sheet, cash and cash equivalents comprise: cash on hand, deposits held on call with banks, and short-term, highly liquidinvestments that are readily convertible into known amounts of cash and which are subject to insignificant risk of changes in value. Bank overdrafts are shown ascurrent liabilities in the balance sheet.
For the purposes of the cash flow statement, cash and cash equivalents are net of bank overdrafts that are repayable on demand.
(p) Financial instruments (note 30)(i) Financial assetsClassificationThe Group classifies its financial assets in the following categories: at fair value through profit or loss, loans and receivables, available-for-sale and held to maturityinvestments. The classification depends on the purpose for which the financial assets were acquired. The Group’s policy with regard to financial risk managementis set out in note 30. Generally, the Group does not acquire financial assets for the purpose of selling in the short term. When the Group enters into derivativecontracts these transactions are designed to reduce exposures related to assets and liabilities, firm commitments or anticipated transactions.
Management determines the classification of financial assets at initial recognition.
(a) Financial assets at fair value through profit or lossDerivatives, including embedded derivatives separated from the host contracts, are included within financial assets at fair value through profit or loss unless theyare designated as effective hedging instruments. Assets in this category are classified as current assets if expected to be settled within 12 months, otherwise theyare classified as non-current.
(b) Loans and receivablesLoans and receivables comprise non-derivative financial assets with fixed or determinable payments that are not quoted in an active market. Trade receivables areincluded within this category; however, trade receivables subject to provisional pricing are valued as explained in note 1(c) Sales revenue.
(c) Held to maturityHeld-to-maturity investments are non-derivative financial assets with fixed or determinable payments and fixed maturity that the Group has the intention andability to hold to maturity and which do not qualify as loans and receivables. Assets in this category are classified as Other investments and are classified ascurrent assets or non-current assets based on their maturity.
(d) Available-for-sale financial assetsAvailable-for-sale financial assets are non-derivative financial assets that are either designated as available-for-sale or not classified in any of the other categories.They are included in non-current assets unless the Group intends to dispose of the assets within 12 months of the balance sheet date or the asset matures within12 months.
Recognition and measurementRegular purchases and sales of financial assets are recognised on the trade-date, being the date on which the Group commits to purchase or sell the asset.Financial assets are de-recognised when the rights to receive cash flows from the assets have expired or have been transferred and the Group has transferredsubstantially all risks and rewards of ownership.
Available-for-sale financial assets and financial assets at fair value through profit or loss are initially recognised at fair value with transaction costs expensed in theincome statement , and are subsequently carried at fair value. Loans and receivables and held to maturity financial assets are initially recognised at fair value plustransactions costs and are subsequently carried at amortised cost using the effective interest method.
118 riotinto.com
For
per
sona
l use
onl
y
Fair value is the price that would be received to sell an asset or paid to transfer a liability in an orderly transaction between market participants at themeasurement date. Where relevant market prices are available, these are used to determine fair values, adjusted where necessary for market liquidity, bid/offerspreads and credit considerations. In other cases, fair values are calculated using quotations from independent financial institutions, or by using valuationtechniques consistent with general market practice applicable to the instrument.
The fair values of cash, short-term borrowings and loans to joint ventures and associates approximate to their carrying values, as a result of their short maturity orbecause they carry floating rates of interest. The fair values of the various derivative instruments used for hedging purposes are disclosed in note 30. Movementson the hedging reserve are disclosed in note 29.
Offsetting financial instrumentsFinancial assets and liabilities are offset and the net amount reported in the balance sheet when there is a legally enforceable right to offset the recognisedamounts and there is an intention to settle on a net basis or realise the asset and settle the liability simultaneously.
Impairment of financial assetsThe Group assesses at each balance sheet date whether there is objective evidence that a financial asset or a group of financial assets is impaired. If impairment isidentified for a financial asset carried at amortised cost the carrying amount of the asset is reduced through the use of an allowance account and the loss isrecognised in the income statement.
In the case of equity securities classified as available-for-sale, an evaluation is made as to whether a decline in fair value is “significant” or “prolonged” based on ananalysis of indicators such as significant adverse changes in the technological, market, economic or legal environment in which the company invested in operates.If such evidence exists for available-for-sale financial assets, the cumulative loss, measured as the difference between acquisition cost and the current fair value,less any impairment loss previously recognised in the income statement, is removed from equity and recognised in the income statement.
(ii) Financial liabilitiesBorrowings and other financial liabilities (including trade payables but excluding derivative liabilities) are recognised initially at fair value, net of transaction costsincurred, and are subsequently stated at amortised cost.
Any difference between the amounts originally received for borrowings and other financial liabilities (net of transaction costs) and the redemption value isrecognised in the income statement over the period to maturity using the effective interest method.
The fair values of medium and long-term borrowings are calculated as the present value of the estimated future cash flows using quoted prices in active marketsor an appropriate market based yield curve. The carrying value of the borrowings is amortised cost.
Where an existing financial liability is replaced by another from the same lender on substantially different terms, or the terms of an existing liability aresubstantially modified, such an exchange or modification is treated as a de-recognition of the original liability and the recognition of a new liability, and thedifference in the respective carrying amounts is recognised in the income statement.
(iii) Derivative financial instruments and hedging activitiesDerivatives embedded in host contracts are treated as separate derivatives when their risks and characteristics are not closely related to their host contracts.In some cases, derivatives and embedded derivatives may be designated as hedges.
Derivatives are initially recognised at their fair value on the date the derivative contract is entered into and transaction costs are expensed in the incomestatement. They are subsequently re-measured to fair value at each balance sheet date. Gains or losses on derivatives which are not designated as hedges aretaken to the income statement. The method of recognising the resulting gain or loss for derivatives designated as hedging instruments depends on the nature ofthe item being hedged. The Group designates certain derivatives as either; hedges of the fair value of recognised assets or liabilities or of firm commitments (fairvalue hedges) or, hedges of a particular risk associated with a recognised asset or liability or of a highly probable forecast transaction (cash flow hedges).
Fair value hedges: Changes in the fair value of derivatives that are designated and qualify as fair value hedges are recorded in the income statement, togetherwith any changes in the fair value of the hedged asset or liability or firm commitment that is attributable to the hedged risk.
When a fair value interest rate hedging instrument expires or is sold, or when a fair value interest rate hedge no longer meets the criteria for hedge accounting, thefair value adjustments which have been made to the hedged item are amortised through the income statement over the remaining life of the hedged item orwritten off immediately when the hedged item is de-recognised.
Cash flow hedges: The effective portion of changes in the fair value of derivatives that are designated and qualify as cash flow hedges is recognised in othercomprehensive income. The gain or loss relating to the ineffective portion is recognised immediately in the income statement. Amounts accumulated in equity arerecycled in the income statement in the period when the hedged item affects profit or loss, for example when the forecast sale that is being hedged takes place.When the forecast transaction that is being hedged results in the recognition of a non-financial asset , for example, property, plant and equipment, the gains andlosses previously deferred in equity are transferred from equity and adjust the cost of the asset. The gains and losses are recognised subsequently in the incomestatement when the non-financial asset is amortised or sold.
When a cash flow hedging instrument expires or is sold, or when a cash flow hedge no longer meets the criteria for hedge accounting, although the forecasttransaction is still expected to occur, any cumulative gain or loss relating to the instrument which is held in equity at that time remains in equity and is recognisedin the income statement at the same time as the forecast transaction. When a forecast transaction is no longer expected to occur, the cumulative gain or loss thatis held in equity is immediately recognised in the income statement.
(q) Share-based payments (note 44)The fair value of the Group’s share plans is recognised as an expense over the expected vesting period with a corresponding entry to retained earnings for Rio Tintoplc plans and to other reserves for Rio Tinto Limited plans.
The Group uses fair values provided by independent actuaries calculated using either a lattice-based option valuation model or a Monte Carlo simulation model.The fair value of the share plans is determined at the date of grant, taking into account any market-based vesting conditions attached to the award. Non-market-based vesting conditions (eg earnings per share targets) are taken into account in estimating the number of awards likely to vest. The estimate of the number ofawards likely to vest is reviewed at each balance sheet date up to the vesting date, at which point the estimate is adjusted to reflect the actual awards issued.No adjustment is made after the vesting date even if the awards are forfeited or not exercised.
riotinto.com 119
STRATEG
ICREPO
RT
DIRECTO
RS’R
EPORT
FIN
AN
CIA
LS
TA
TE
ME
NT
SPR
ODUCTIO
N,R
ESERVES
ANDOPER
ATIO
NS
ADDITIO
NALINFO
RMATIO
N
For
per
sona
l use
onl
y
Notes to the 2014 financial statements continued
1 Principal accounting policies continuedThe terms of each plan are considered at the balance sheet date to determine whether they should be accounted for as equity or cash settled. The Group nolonger operates any plans as cash-settled. However the Performance Share Plan can, at the discretion of the directors, offer employees an equivalent amount incash. This is not standard practice. In some jurisdictions, employees are granted cash-settled awards where equity-settled awards are prohibited by local laws andregulations. The value of these awards is immaterial.
The Group’s equity-settled share plans are settled either by: the issue of shares by the relevant parent company, the purchase of shares on market, or the use ofshares previously acquired as part of a share buy-back. If the cost of shares acquired to satisfy the plans differs from the expense charged, the difference is takento retained earnings or other reserves as appropriate.
(r) Share capital (notes 27 and 28)Ordinary shares are classified as equity. Incremental costs directly attributable to the issuance of new shares are shown in equity as a deduction, net of tax, fromthe proceeds.
Where any Group company purchases the Group’s equity share capital (treasury shares), the consideration paid, including any directly attributable incrementalcosts (net of income taxes) is deducted from equity attributable to owners of Rio Tinto. Where such shares are subsequently reissued, any consideration received,net of any directly-attributable incremental transaction costs and the related income tax effects, is included in equity attributable to owners of Rio Tinto.
(s) Segment reporting (notes 2 and 3)Operating segments are reported in a manner consistent with the internal reporting provided to the chief operating decision maker (CODM). The CODM, who isresponsible for allocating resources and assessing performance of the operating segments, has been identified as Rio Tinto’s chief executive.
Critical accounting policies and estimates(i) Dual listed companies reportingAs described in the “Outline of dual listed companies structure and basis of financial statements”, the consolidated financial statements of the Rio Tinto Groupdeal with the results, assets and liabilities of both of the dual listed companies, Rio Tinto plc and Rio Tinto Limited, and their subsidiaries. Rio Tinto plc andRio Tinto Limited are viewed as a single parent company with their respective shareholders being the shareholders in that single company.
The 2014 Annual report satisfies the obligations of Rio Tinto Limited to prepare consolidated accounts under Australian company law, as amended by an orderissued by the Australian Securities and Investments Commission on 9 January 2015. The 2014 financial statements disclose the effect of the adjustments to theGroup’s consolidated profit/(loss), consolidated total comprehensive income/(loss) and consolidated shareholders’ funds as prepared under IFRS as defined onpage 110 that would be required under the version of International Financial Reporting Standards that is applicable in Australia, referred to as AustralianAccounting Standards (AAS).
The US dollar is the presentation currency used in these financial statements, as it most reliably reflects the Group’s global business performance.
(ii) Acquisitions (note 37)The determination of the fair values of net identifiable assets acquired, and of any goodwill, involves significant judgment. This is particularly the case when theacquisition involves little or no cash, for example when the Group gains control of a company in stages or by the issuance of shares. The allocation of fair valuebetween intangible assets, and the tangible assets with which they are used, is also judgmental. The Group engages third-party valuers to advise on the purchaseprice allocation for significant acquisitions.
(iii) Impairment review of asset carrying values (notes 6, 12 and 13)Events or changes in circumstances can give rise to significant impairment charges or reversals of impairment.
Estimates in respect of the timing of project expansions and the cost to complete asset construction are critical to determining the recoverable amounts forcash-generating units.
Where the recoverable amounts of the Group’s cash-generating units are assessed by analyses of discounted cash flows, the resulting valuations are also sensitiveto changes in estimates of long-term commodity prices, production timing and recovery rates, exchange rates, operating costs, reserve estimates and discountrates.
Note 6 outlines the significant judgments and assumptions made in measuring the impairments recorded and notes 12 and 13 outline judgments in relation to thetesting of cash-generating units containing goodwill and indefinite-lived intangible assets respectively.
(iv) Estimation of asset lives and determination of ore reserve and mineral resource estimatesIntangible assets are considered to have indefinite lives when, based on an analysis of all of the relevant factors, there is no foreseeable limit to the period overwhich the asset is expected to generate cash flows for the Group. The factors considered in making this judgment include the existence of contractual rights forunlimited terms; or evidence that renewal of the contractual rights without significant incremental cost can be expected for indefinite periods into the future inview of the Group’s investment intentions.
Rio Tinto estimates its ore reserves and mineral resources based on information compiled by Competent Persons as defined in the JORC code (see note 1(j)). Theamounts presented under IFRS and AAS are based on the ore reserves, and in some cases mineral resources, determined under the JORC code.
The estimation of ore reserves and mineral resources requires judgment to interpret available geological data and then to select an appropriate mining methodand establish an extraction schedule. It also requires assumptions about future commodity prices, exchange rates, production costs, recovery rates and discountrates and, in some instances, the renewal of mining licences. There are many uncertainties in the estimation process and assumptions that are valid at the time ofestimation may change significantly when new information becomes available.
New geological data, as well as changes in assumptions, may change ore reserve and mineral resource estimates and may ultimately result in their restatement.Changes in ore reserves and, in some cases, mineral resources, could have an impact on: depreciation and amortisation rates; the carrying values of intangibleassets and property, plant and equipment; deferred stripping calculations; provisions for close-down and restoration costs and the recovery of deferred tax assets.
(v) Close-down, restoration and environmental obligations (note 26)Provision is made for close-down, restoration and environmental costs when the obligation occurs, based on the net present value of estimated future costs with,where appropriate, probability weighting of the different remediation and closure scenarios. The ultimate cost of close-down and restoration is uncertain and
120 riotinto.com
For
per
sona
l use
onl
y
management uses its judgment and experience to provide for these costs over the life of the operations. Cost estimates can vary in response to many factorsincluding: changes to the relevant legal or local/national government ownership requirements and any other commitments made to stakeholders; review ofremediation and relinquishment options; the emergence of new restoration techniques; the timing of the expenditures; and the effects of inflation. Experiencegained at other mine or production sites is also a significant consideration although elements of the restoration and rehabilitation of each site are relatively uniqueto the site and, in some cases, there may be relatively limited restoration and rehabilitation activity and historical precedent against which to benchmark costestimates. Where appropriate, external experts support the cost estimation process.
Cost estimates are updated throughout the life of the operation and must comply with the Group’s Capital Project Framework once the operation is ten years fromexpected closure. The expected timing of expenditure included in cost estimates can also change, for example in response to changes to expectations relating toore reserves and mineral resources, production rates, operating licences or economic conditions. Expenditure may occur before and after closure and can continuefor an extended period of time depending on the specific site requirements. Some expenditure can continue into perpetuity.
Cash flows must be discounted if this has a material effect. The selection of appropriate sources on which to base the calculation of the risk-free discount rate usedfor such obligations requires judgment.
As a result of all of the above factors, there could be significant adjustments to the provision for close-down, restoration and environmental costs which wouldaffect future financial results. Increases and decreases in environmental obligations are charged or credited directly to the income statement. Increases anddecreases in close-down obligations for operating businesses are accounted for as indicated in note (k) above. An increase in capitalised close-down andrestoration provisions would increase the unwind of the discount and depreciation charges in the income statement in future years and increase the carrying valueof property, plant and equipment, potentially impacting any future impairment charges or reversals.
(vi) Deferral of stripping costs (note 14)Stripping of waste materials takes place throughout the production phase of a surface mine or pit. The identification of components within a mine and of life ofcomponent strip ratios is dependent on an individual mine’s design. Changes to that design may introduce new components and/or change the life of componentstrip ratios. Changes in other technical or economic parameters that impact on ore reserves may also have an impact on the life of component strip ratios even ifthey do not affect the mine’s design. Changes to the life of component strip ratios are accounted for prospectively.
The Group’s judgment as to whether multiple pit mines are considered separate or integrated operations determines whether initial stripping of a pit is deemed tobe pre-production or production phase stripping and therefore the amortisation base for those costs. The judgment depends on each mine’s specificcircumstances and the analysis requires judgment; another mining company could make a different judgment even where the fact pattern appears to be similar.
(vii) Recognition of deferred tax liabilities on mining rights recognised in acquisitionsDeferred tax is provided in respect of fair value adjustments on acquisitions. These adjustments may relate to assets such as mining rights that, in general, are noteligible for income tax allowances. Provision for deferred tax is based on the difference between the carrying value of the asset and its income tax base (which maybe US$nil). Even where there is no income tax base, the existence of a tax base for capital gains tax purposes is not taken into account in determining the deferredtax liability for the assets, unless they are classified as held for sale, because it is expected that the carrying amount will be recovered primarily through use of theassets and not from disposal. For acquisitions after 1 January 2004, such a deferred tax liability on acquisition results in a consequential increase in the amountsattributed to goodwill. For acquisitions prior to 1 January 2004, such deferred tax was recognised in equity on transition to IFRS.
(viii) Capitalisation of exploration and evaluation costs and development costs prior to the decision to mine/construct (note 13)Under the Group’s accounting policy, exploration expenditure is not capitalised. Evaluation expenditure is capitalised when there is a high degree of confidencethat the Group will determine that a project is commercially viable and therefore it is considered probable that future economic benefits will flow to the Group.
A project’s commercial viability is determined based on whether it will provide a satisfactory return relative to its perceived risks. Once commercial viability hasbeen established, the Group will decide, at the appropriate authorisation level (ie the Rio Tinto Investment Committee and the board where appropriate) whetherthe project should proceed. In determining whether to approve a mining project, the Investment Committee reviews the ore reserves estimate together withanalyses of the net present value of the project and sensitivity analyses for the key assumptions.
There are occasions when the Group concludes that the asset recognition criteria are met at an earlier stage than approval to proceed. In these cases, evaluationexpenditure is capitalised if there is a high degree of confidence that the Group will determine the project is commercially viable. The Group’s view is that a highdegree of confidence is greater than “more likely than not” (that is greater than 50 per cent certainty) and less than “virtually certain” (that is less than 90 per centcertainty). Determining whether there is a high degree of confidence that the Group will determine that an evaluation project is commercially viable requires asignificant degree of judgment and assessment of all relevant factors such as the nature and objective of the project; the project’s current stage; project timeline;current estimates of the project’s net present value including sensitivity analyses for the key assumptions; and the main risks of the project. Developmentexpenditure incurred prior to the decision to proceed is subject to the same criteria for capitalisation, being a high degree of confidence that the Group willdetermine that a project is commercially viable.
In accordance with IFRS 6 “Exploration for and Evaluation of Mineral Resources”, the criteria for the capitalisation of evaluation costs are applied consistently fromperiod to period.
Subsequent recovery of the carrying value for evaluation costs depends on successful development or sale of the undeveloped project. If a project does not proveviable, all irrecoverable costs associated with the project net of any related impairment provisions are charged to the income statement.
(ix) Identification of functional currenciesThe functional currency for each subsidiary, joint operation and equity accounted unit, is the currency of the primary economic environment in which it operates.Determination of functional currency involves significant judgment and other companies may make different judgments based on similar facts. For many ofRio Tinto’s businesses, their functional currency is the currency of the country in which they operate. The Group reconsiders the functional currency of itsbusinesses if there is a change in the underlying transactions, events and conditions which determine their primary economic environment.
The determination of functional currency affects the carrying value of non-current assets included in the balance sheet and, as a consequence, the amortisation ofthose assets included in the income statement. It also impacts exchange gains and losses included in the income statement and in equity.
riotinto.com 121
STRATEG
ICREPO
RT
DIRECTO
RS’R
EPORT
FIN
AN
CIA
LS
TA
TE
ME
NT
SPR
ODUCTIO
N,R
ESERVES
ANDOPER
ATIO
NS
ADDITIO
NALINFO
RMATIO
N
For
per
sona
l use
onl
y

Notes to the 2014 financial statements continued
1 Principal accounting policies continued(x) Estimation of obligations for post-employment costs (note 45)The value of the Group’s obligations for post-retirement benefits is dependent on the amount of benefits to be paid out and is discounted to the balance sheetdate. This amount will vary depending on the assumptions made about the future pay increases received by members of final pay plans, the level of inflation (forthose benefits that are subject to some form of inflation protection), the number of individuals and how long individuals live in retirement. Most of the Group’sdefined benefit pension plans are closed to new entrants and the majority of the obligations relate to former employees. As a consequence, the carrying value ofthe Group’s post-retirement obligations is less sensitive to assumptions about future salary increases than it is to assumptions regarding future inflation. Theassumption regarding future inflation is based on market yields on inflation-linked instruments where possible, combined with consensus views on future inflation,and is derived using the same process at each reporting date. Changes to the assumption therefore reflect changes to the market and consensus views of futureinflation.
The Group reviews the actual mortality rates of retirees in its major pension plans on a regular basis and uses these rates to set its current mortality assumptions.It also allows for future improvements in mortality having regard to standard improvement scales in each country.
The discount rate used to value post-retirement obligations is based upon the yields on high quality corporate bonds in the relevant currency and which havedurations consistent with the nature of the obligations. The discount rate will vary from one period to another in line with movements in corporate bond yields, butat any given measurement date there is relatively little estimation uncertainty. This rate is also used to calculate the interest cost on obligations and interestincome on plan assets.
Details of the key assumptions, how they have moved since the previous balance sheet date and the sensitivity of the carrying value to changes in theassumptions are set out in note 45.
For 2014, the charge against income for post-retirement benefits net of tax and non-controlling interests was US$418 million. This charge included both pensionand post-retirement healthcare benefits. The charge is net of interest income of US$475 million after tax and non-controlling interests.
The weighted average future increase in compensation levels was assumed to be 3.6 per cent in 2014 and will be 3.3 per cent for 2015. The average discount rateused was 4.4 per cent in 2014 and will be 3.5 per cent in 2015 reflecting the net impact of changes in corporate bond yields in the currencies in which the Grouphas pension obligations.
Based on the known changes in assumptions noted above and other expected circumstances, the expected impact of post-retirement costs on the Group’s netearnings in 2015 would be US$48 million more than in 2014. The actual charge may be impacted by other factors that cannot be predicted, such as the effect ofchanges in benefits, number of employees and exchange rates.
The table below sets out the potential change in the Group’s 2014 net earnings (after tax and non-controlling interests) that would result from hypotheticalchanges to post-retirement assumptions and estimates. The sensitivities are viewed for each assumption in isolation although a change in one assumption is likelyto result in some offset elsewhere. The figures in the table only show the impact on underlying and net earnings. Changing the assumptions would also have animpact on the balance sheet and this is shown in note 45.
US$ million
Sensitivity of the Group’s 2014 underlying and net earnings to changes in:
Discount rate
increase of 0.5 percentage points 47
decrease of 0.5 percentage points (43)
Inflation
increase of 0.5 percentage points (33)
decrease of 0.5 percentage points 31
Salary increases
increase of 0.5 percentage points (9)
decrease of 0.5 percentage points 8
Demographic – allowance for additional future mortality improvements
participants assumed to have the mortality rates of individuals who are one year older 18participants assumed to have the mortality rates of individuals who are one year younger (18)
(xi) Recoverability of potential deferred tax assets (note 17)The Group has tax losses, and other deductible temporary differences, mainly in UK, French, Canadian, US and Australian taxable entities that have the potential toreduce tax payments in future years. Deferred tax assets have been recognised to the extent that their recovery is probable, having regard to the projected futuretaxable income of these taxable entities and after taking account of specific risk factors that affect the recovery of these assets.
(xii) Contingencies (note 31)Disclosure is made of material contingent liabilities unless the possibility of any loss arising is considered remote.
(xiii) Basis of consolidation (notes 33 to 36)Judgment is sometimes required to determine whether the Group has control, joint control or significant influence over an entity.
122 riotinto.com
For
per
sona
l use
onl
y

2 Operating segments
Gross sales revenue (a)2014US$m
2013US$m
2012US$m
Iron Ore 23,281 25,994 24,279Aluminium 12,123 12,463 12,170Copper 6,282 5,916 6,661Energy 4,308 5,454 6,062Diamonds & Minerals 4,150 4,193 4,056Other operations 241 1,761 3,898
Reportable segments total 50,385 55,781 57,126Inter-segment transactions (344) (1,182) (1,560)
Product group total 50,041 54,599 55,566Items excluded from underlying earnings – (24) 31
Share of equity accounted units and adjustments for inter-subsidiary/equity accounted units sales (2,377) (3,404) (4,655)
Consolidated sales revenue per income statement 47,664 51,171 50,942
Depreciation and amortisation (b)
Iron Ore 1,953 1,627 1,485Aluminium 1,180 1,151 1,287Copper 1,051 962 794Energy 548 766 770Diamonds & Minerals 484 513 421Other operations 34 67 214
Reportable segments total 5,250 5,086 4,971Other items 82 106 113Less: depreciation and amortisation of equity accounted units (472) (401) (460)
Depreciation and amortisation per note 4 4,860 4,791 4,624
Underlying earnings (c)
Iron Ore 8,107 9,858 9,247Aluminium 1,248 557 54Copper 912 821 1,059Energy (210) 33 309Diamonds & Minerals 401 350 149Other operations (243) (281) (582)
Reportable segments total 10,215 11,338 10,236Inter-segment transactions – (4) (8)Other items (593) (730) (750)Exploration and evaluation not attributed to product groups (156) (145) (97)Net finance costs (161) (242) (112)
Underlying earnings 9,305 10,217 9,269Items excluded from underlying earnings (d) (2,778) (6,552) (12,297)
Net earnings/(loss) attributable to owners of Rio Tinto per income statement 6,527 3,665 (3,028)
Tax charge
Iron Ore 3,698 5,290 4,273Aluminium 303 (18) (205)Copper 170 236 (67)Energy (164) 12 8Diamonds & Minerals 224 177 84Other operations (132) (227) (235)
Reportable segments total 4,099 5,470 3,858Other items (193) (302) (266)Exploration and evaluation not attributed to product groups (34) (23) (26)Net finance costs (396) (77) (81)
3,476 5,068 3,485Tax credit excluded from underlying earnings (d) (423) (2,642) (2,896)
Tax charge per income statement 3,053 2,426 589
riotinto.com 123
STRATEG
ICREPO
RT
DIRECTO
RS’R
EPORT
FIN
AN
CIA
LS
TA
TE
ME
NT
SPR
ODUCTIO
N,R
ESERVES
ANDOPER
ATIO
NS
ADDITIO
NALINFO
RMATIO
N
For
per
sona
l use
onl
y

Notes to the 2014 financial statements continued
2 Operating segments continued
Capital expenditure2014US$m
2013US$m
2012US$m
Capital expenditure
Iron Ore 4,211 6,814 7,152
Aluminium 2,021 2,226 2,755
Copper 1,958 2,813 4,455
Energy 224 732 1,877
Diamonds & Minerals 508 1,009 1,814
Other operations (56) 278 432
Reportable segments total 8,866 13,872 18,485
Other items (416) 145 161
Less: capital expenditure of equity accounted units (1,032) (1,073) (1,071)
Capital expenditure per financial information by business units 7,418 12,944 17,575
Add: Proceeds from disposal of property, plant and equipment 744 57 40
Capital expenditure per cash flow statement 8,162 13,001 17,615
Rio Tinto’s management structure is based on the principal product groups shown above together with the global functions that support the business. The chiefexecutive of each product group reports to the chief executive of Rio Tinto. The chief executive of Rio Tinto monitors the performance of each product group basedon a number of measures including capital expenditure and operating cash flows, with underlying earnings being the key financial performance indicator. Financecosts and net debt are managed on a Group basis.
Generally, business units are allocated to product groups based on their primary product. The Energy product group includes both coal and uranium businesses.The Diamonds & Minerals product group includes businesses with products such as borates, salt and titanium dioxide feedstock together with diamond operationsand the Simandou iron ore project, which is the responsibility of the Diamonds & Minerals product group chief executive. The Copper group includes certain goldoperations in addition to copper.
The financial information by business unit provided on page 178 of these financial statements provides additional voluntary disclosure which the Groupconsiders useful to the users of the financial statements.
(a) Gross sales revenueGross sales revenue includes the sales revenue of equity accounted units (after adjusting for sales to subsidiaries) of US$2,533 million (2013: US$3,757 million,2012: US$5,067 million) which are not included in consolidated sales revenue. Consolidated sales revenue includes subsidiary sales of US$156 million (2013:US$353 million, 2012: US$412 million) to equity accounted units which are not included in gross sales revenue.
(b) Depreciation and amortisationProduct group depreciation and amortisation totals include 100 per cent of subsidiaries’ depreciation and amortisation and include Rio Tinto’s share of thedepreciation and amortisation of equity accounted units. Rio Tinto’s share of the depreciation and amortisation charge of equity accounted units is deducted toarrive at depreciation and amortisation excluding equity accounted units as shown in note 4. These figures exclude impairment charges and reversals, which areexcluded from underlying earnings.
(c) Underlying earningsUnderlying earnings is reported by Rio Tinto to provide greater understanding of the underlying business performance of its operations and to enhancecomparability of reporting periods.
The measure of underlying earnings is used by the chief executive of Rio Tinto to assess the performance of the product groups. Underlying earnings and netearnings both represent amounts net of tax attributable to owners of Rio Tinto. The following items are excluded from net earnings in arriving at underlyingearnings each period irrespective of materiality:
– Net (losses)/gains on disposal and consolidation of interests in businesses.
– Impairment charges and reversals.
– Profit/(loss) after tax from discontinued operations.
– Exchange and derivative gains and losses. This exclusion includes exchange gains/(losses) on US dollar net debt and intragroup balances, gains/(losses) oncurrency and interest rate derivatives not qualifying for hedge accounting and gains/(losses) on commodity derivatives not qualifying for hedge accounting.
In addition, there is a final judgmental category which includes, where applicable, other credits and charges that, individually or in aggregate if of a similar type, areof a nature or size to require exclusion in order to provide additional insight into underlying business performance.
Product group earnings include earnings of subsidiaries and equity accounted units stated before finance items but after the amortisation of discount.
Rio Tinto’s share of the underlying earnings of equity accounted units amount to US$626 million in 2014 (2013: US$710 million; 2012: US$1,051 million). Thisamount is attributable as follows: US$622 million profit to the Copper group and US$4 million profit to other product groups (2013: US$780 million profitattributable to the Copper product group and US$70 million loss to other product groups; 2012: US$793 million profit attributable to the Copper product group andUS$258 million profit to other product groups). These amounts are included in underlying earnings of the relevant product groups and include the underlyingearnings of the Group’s tolling entities which process alumina. Tolling entities recharge the majority of their costs and generally have minimal earnings.
The Copper product group’s underlying earnings in 2013 included US$131 million impairment after tax in relation to the group’s investment in Northern DynastyMinerals Ltd following a strategic review of this shareholding by the group.
The Energy product group’s underlying earnings in 2012 included US$258 million profit after tax in relation to the divestments of equity interest in ExtractResources and Kalahari Minerals.
124 riotinto.com
For
per
sona
l use
onl
y
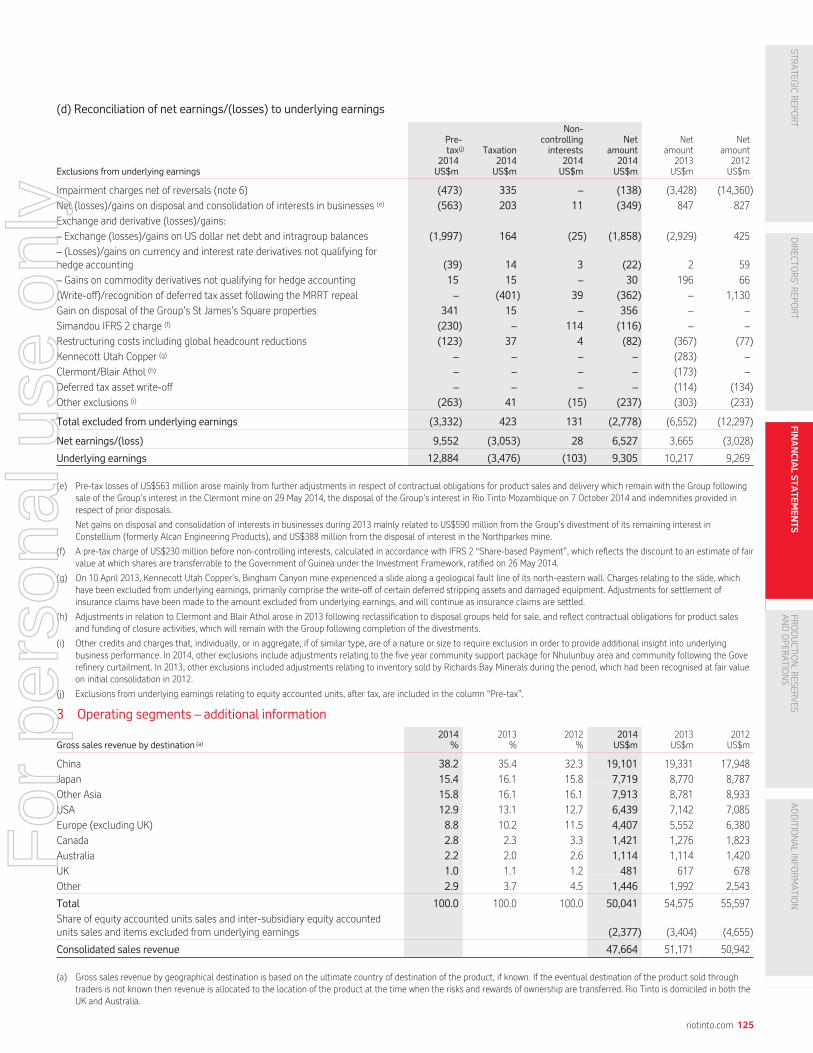
(d) Reconciliation of net earnings/(losses) to underlying earnings
Exclusions from underlying earnings
Pre-tax(j)
2014US$m
Taxation2014US$m
Non-controllinginterests
2014US$m
Netamount
2014US$m
Netamount
2013US$m
Netamount
2012US$m
Impairment charges net of reversals (note 6) (473) 335 – (138) (3,428) (14,360)
Net (losses)/gains on disposal and consolidation of interests in businesses (e) (563) 203 11 (349) 847 827
Exchange and derivative (losses)/gains:
– Exchange (losses)/gains on US dollar net debt and intragroup balances (1,997) 164 (25) (1,858) (2,929) 425
– (Losses)/gains on currency and interest rate derivatives not qualifying forhedge accounting (39) 14 3 (22) 2 59
– Gains on commodity derivatives not qualifying for hedge accounting 15 15 – 30 196 66
(Write-off)/recognition of deferred tax asset following the MRRT repeal – (401) 39 (362) – 1,130
Gain on disposal of the Group’s St James’s Square properties 341 15 – 356 – –
Simandou IFRS 2 charge (f) (230) – 114 (116) – –
Restructuring costs including global headcount reductions (123) 37 4 (82) (367) (77)
Kennecott Utah Copper (g) – – – – (283) –
Clermont/Blair Athol (h) – – – – (173) –
Deferred tax asset write-off – – – – (114) (134)
Other exclusions (i) (263) 41 (15) (237) (303) (233)
Total excluded from underlying earnings (3,332) 423 131 (2,778) (6,552) (12,297)
Net earnings/(loss) 9,552 (3,053) 28 6,527 3,665 (3,028)
Underlying earnings 12,884 (3,476) (103) 9,305 10,217 9,269
(e) Pre-tax losses of US$563 million arose mainly from further adjustments in respect of contractual obligations for product sales and delivery which remain with the Group followingsale of the Group’s interest in the Clermont mine on 29 May 2014, the disposal of the Group’s interest in Rio Tinto Mozambique on 7 October 2014 and indemnities provided inrespect of prior disposals.
Net gains on disposal and consolidation of interests in businesses during 2013 mainly related to US$590 million from the Group’s divestment of its remaining interest inConstellium (formerly Alcan Engineering Products), and US$388 million from the disposal of interest in the Northparkes mine.
(f) A pre-tax charge of US$230 million before non-controlling interests, calculated in accordance with IFRS 2 “Share-based Payment”, which reflects the discount to an estimate of fairvalue at which shares are transferrable to the Government of Guinea under the Investment Framework, ratified on 26 May 2014.
(g) On 10 April 2013, Kennecott Utah Copper’s, Bingham Canyon mine experienced a slide along a geological fault line of its north-eastern wall. Charges relating to the slide, whichhave been excluded from underlying earnings, primarily comprise the write-off of certain deferred stripping assets and damaged equipment. Adjustments for settlement ofinsurance claims have been made to the amount excluded from underlying earnings, and will continue as insurance claims are settled.
(h) Adjustments in relation to Clermont and Blair Athol arose in 2013 following reclassification to disposal groups held for sale, and reflect contractual obligations for product salesand funding of closure activities, which will remain with the Group following completion of the divestments.
(i) Other credits and charges that, individually, or in aggregate, if of similar type, are of a nature or size to require exclusion in order to provide additional insight into underlyingbusiness performance. In 2014, other exclusions include adjustments relating to the five year community support package for Nhulunbuy area and community following the Goverefinery curtailment. In 2013, other exclusions included adjustments relating to inventory sold by Richards Bay Minerals during the period, which had been recognised at fair valueon initial consolidation in 2012.
(j) Exclusions from underlying earnings relating to equity accounted units, after tax, are included in the column “Pre-tax”.
3 Operating segments – additional information
Gross sales revenue by destination (a)
2014%
2013%
2012%
2014US$m
2013US$m
2012US$m
China 38.2 35.4 32.3 19,101 19,331 17,948
Japan 15.4 16.1 15.8 7,719 8,770 8,787
Other Asia 15.8 16.1 16.1 7,913 8,781 8,933
USA 12.9 13.1 12.7 6,439 7,142 7,085
Europe (excluding UK) 8.8 10.2 11.5 4,407 5,552 6,380
Canada 2.8 2.3 3.3 1,421 1,276 1,823
Australia 2.2 2.0 2.6 1,114 1,114 1,420
UK 1.0 1.1 1.2 481 617 678
Other 2.9 3.7 4.5 1,446 1,992 2,543
Total 100.0 100.0 100.0 50,041 54,575 55,597
Share of equity accounted units sales and inter-subsidiary equity accountedunits sales and items excluded from underlying earnings (2,377) (3,404) (4,655)
Consolidated sales revenue 47,664 51,171 50,942
(a) Gross sales revenue by geographical destination is based on the ultimate country of destination of the product, if known. If the eventual destination of the product sold throughtraders is not known then revenue is allocated to the location of the product at the time when the risks and rewards of ownership are transferred. Rio Tinto is domiciled in both theUK and Australia.
riotinto.com 125
STRATEG
ICREPO
RT
DIRECTO
RS’R
EPORT
FIN
AN
CIA
LS
TA
TE
ME
NT
SPR
ODUCTIO
N,R
ESERVES
ANDOPER
ATIO
NS
ADDITIO
NALINFO
RMATIO
N
For
per
sona
l use
onl
y
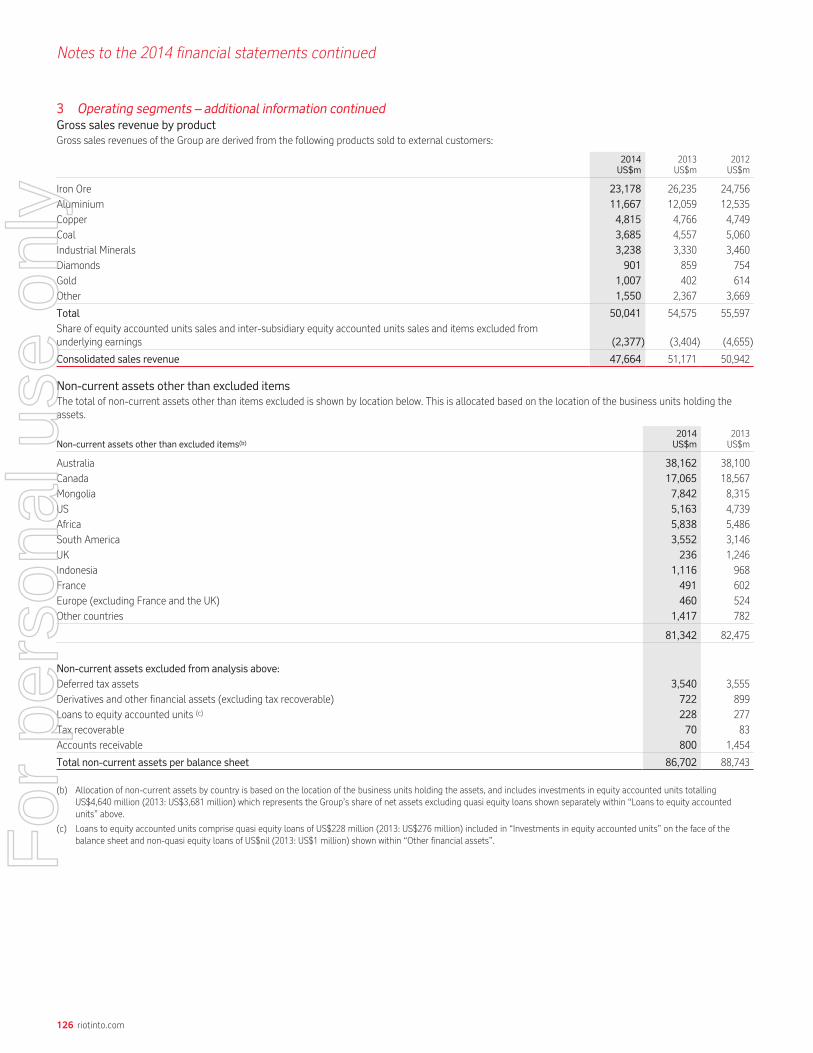
Notes to the 2014 financial statements continued
3 Operating segments – additional information continuedGross sales revenue by productGross sales revenues of the Group are derived from the following products sold to external customers:
2014US$m
2013US$m
2012US$m
Iron Ore 23,178 26,235 24,756
Aluminium 11,667 12,059 12,535
Copper 4,815 4,766 4,749
Coal 3,685 4,557 5,060
Industrial Minerals 3,238 3,330 3,460
Diamonds 901 859 754
Gold 1,007 402 614
Other 1,550 2,367 3,669
Total 50,041 54,575 55,597
Share of equity accounted units sales and inter-subsidiary equity accounted units sales and items excluded fromunderlying earnings (2,377) (3,404) (4,655)
Consolidated sales revenue 47,664 51,171 50,942
Non-current assets other than excluded itemsThe total of non-current assets other than items excluded is shown by location below. This is allocated based on the location of the business units holding theassets.
Non-current assets other than excluded items(b)2014US$m
2013US$m
Australia 38,162 38,100
Canada 17,065 18,567
Mongolia 7,842 8,315
US 5,163 4,739
Africa 5,838 5,486
South America 3,552 3,146
UK 236 1,246
Indonesia 1,116 968
France 491 602
Europe (excluding France and the UK) 460 524
Other countries 1,417 782
81,342 82,475
Non-current assets excluded from analysis above:
Deferred tax assets 3,540 3,555
Derivatives and other financial assets (excluding tax recoverable) 722 899
Loans to equity accounted units (c) 228 277
Tax recoverable 70 83
Accounts receivable 800 1,454
Total non-current assets per balance sheet 86,702 88,743
(b) Allocation of non-current assets by country is based on the location of the business units holding the assets, and includes investments in equity accounted units totallingUS$4,640 million (2013: US$3,681 million) which represents the Group’s share of net assets excluding quasi equity loans shown separately within “Loans to equity accountedunits” above.
(c) Loans to equity accounted units comprise quasi equity loans of US$228 million (2013: US$276 million) included in “Investments in equity accounted units” on the face of thebalance sheet and non-quasi equity loans of US$nil (2013: US$1 million) shown within “Other financial assets”.
126 riotinto.com
For
per
sona
l use
onl
y
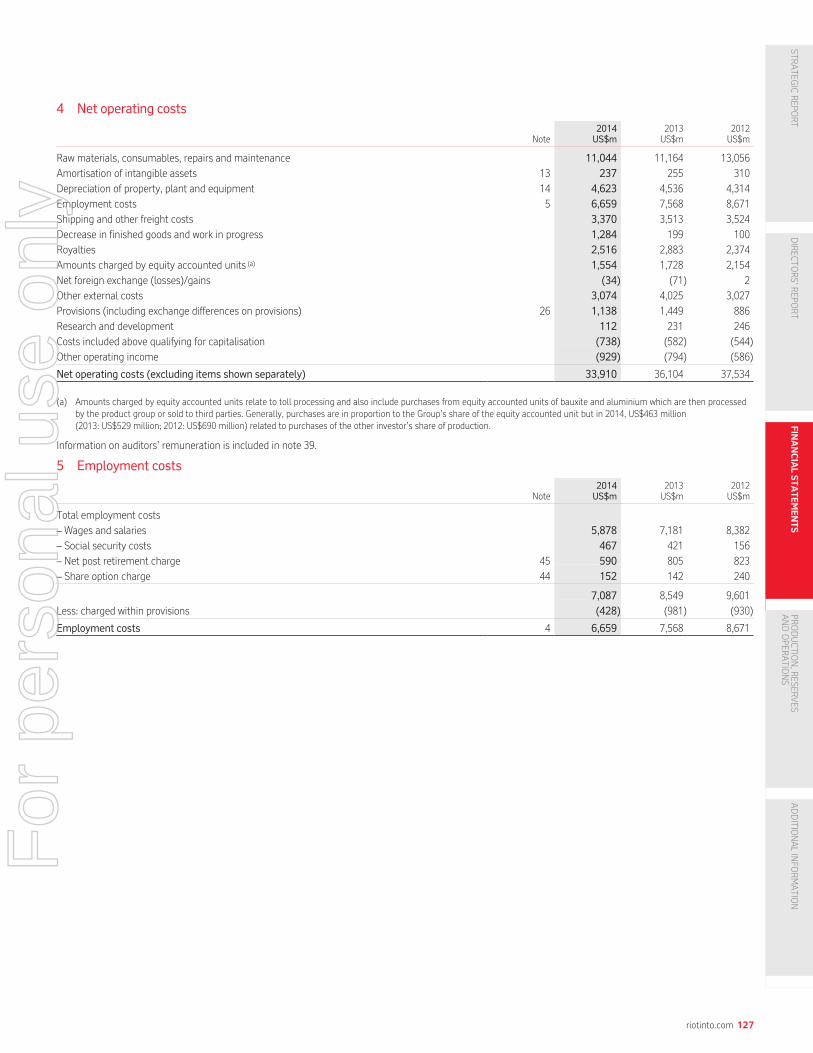
4 Net operating costs
Note2014US$m
2013US$m
2012US$m
Raw materials, consumables, repairs and maintenance 11,044 11,164 13,056
Amortisation of intangible assets 13 237 255 310
Depreciation of property, plant and equipment 14 4,623 4,536 4,314
Employment costs 5 6,659 7,568 8,671
Shipping and other freight costs 3,370 3,513 3,524
Decrease in finished goods and work in progress 1,284 199 100
Royalties 2,516 2,883 2,374
Amounts charged by equity accounted units (a) 1,554 1,728 2,154
Net foreign exchange (losses)/gains (34) (71) 2
Other external costs 3,074 4,025 3,027
Provisions (including exchange differences on provisions) 26 1,138 1,449 886
Research and development 112 231 246
Costs included above qualifying for capitalisation (738) (582) (544)
Other operating income (929) (794) (586)
Net operating costs (excluding items shown separately) 33,910 36,104 37,534
(a) Amounts charged by equity accounted units relate to toll processing and also include purchases from equity accounted units of bauxite and aluminium which are then processedby the product group or sold to third parties. Generally, purchases are in proportion to the Group’s share of the equity accounted unit but in 2014, US$463 million(2013: US$529 million; 2012: US$690 million) related to purchases of the other investor’s share of production.
Information on auditors’ remuneration is included in note 39.
5 Employment costs
Note2014US$m
2013US$m
2012US$m
Total employment costs
– Wages and salaries 5,878 7,181 8,382
– Social security costs 467 421 156
– Net post retirement charge 45 590 805 823
– Share option charge 44 152 142 240
7,087 8,549 9,601
Less: charged within provisions (428) (981) (930)
Employment costs 4 6,659 7,568 8,671
riotinto.com 127
STRATEG
ICREPO
RT
DIRECTO
RS’R
EPORT
FIN
AN
CIA
LS
TA
TE
ME
NT
SPR
ODUCTIO
N,R
ESERVES
ANDOPER
ATIO
NS
ADDITIO
NALINFO
RMATIO
N
For
per
sona
l use
onl
y

Notes to the 2014 financial statements continued
6 Impairment charges and reversals
Pre-tax2014US$m
Taxation2014US$m
Non-controllinginterests
2014US$m
Netamount
2014US$m
Pre-taxamount
2013US$m
Pre-taxamount
2012US$m
Aluminium – Kitimat (1,092) 292 – (800) (950) (613)
Aluminium – Pacific Aluminium 1,224 (175) – 1,049 – (1,382)
Aluminium – Other (46) 6 – (40) (847) (2,751)
Aluminium – Goodwill – – – – – (7,468)
Copper – Molybdenum Autoclave Process (559) 212 – (347) – –
Copper – Oyu Tolgoi – – – – (4,716) –
Copper – SouthGobi – – – – (269) –
Energy – Rio Tinto Coal Mozambique – – – – (497) (3,269)
Diamonds – – – – – (659)
Other – – – – (252) (85)
Total impairment charge net of reversals (473) 335 – (138) (7,531) (16,227)
Allocated as:
Goodwill (note 12) – (1,149) (8,009)
Intangible assets (note 13) – (1,287) (1,817)
Property, plant and equipment (note 14) (1,034) (4,882) (4,686)
Investment in equity accounted units 589 (216) (1,526)
Other assets (28) 3 (189)
Total impairment charge net of reversals (473) (7,531) (16,227)
Comprising:
Impairment charges net of reversals of consolidated balances (1,062) (7,315) (14,701)
Impairment reversals/(charges) of investments in equity accountedunits (pre-tax) 841 (230) (2,217)
Total impairment charge net of reversals in the financial information bybusiness unit (page 179) (221) (7,545) (16,918)
Taxation (including related to EAUs) 83 1,561 2,536
Non-controlling interests – 2,556 22
Total impairment net of reversals in the income statement (138) (3,428) (14,360)
AluminiumKitimat, CanadaDuring the first half of 2014, further revisions to future capital required to complete the modernisation project at Kitimat in British Columbia, and related impactson the project, led to a reduction in the recoverable value of the Kitimat cash-generating unit. Additional capital of US$1.5 billion was approved by the board inAugust 2014, taking the total approved capital cost of the project to US$4.8 billion.
The recoverable amount for the Kitimat cash-generating unit at 30 June 2014 was determined to be US$2,184 million assessed by reference to a fair value lesscost of disposal (FVLCD) model, in line with the accounting policy set out in note 1(i). The reduction in the recoverable amount resulted in a pre-tax impairmentcharge of US$1,092 million to property, plant and equipment. The recoverable amount is classified as level 3 under the fair value hierarchy. In arriving at FVLCD,post-tax cash flows expressed in real terms were estimated over the useful economic life of the modernised smelter, which is the principal asset of thecash-generating unit, and discounted using a post-tax real discount rate of 7.3 per cent (2013: 7.3 per cent).
First production from the Kitimat Modernisation Project is expected during the first half of 2015. The most critical assumption for the FVLCD calculation is theforecast cost to complete the project which is unchanged since the half year. Other key assumptions to which the calculation of FVLCD for Kitimat is sensitive are:the aluminium sales price (aluminium price plus regional and product premiums), discount rates, the Canadian dollar to US dollar exchange rate andoperating cost assumptions. The long-term aluminium price for impairment testing purposes was unchanged at 30 June 2014 in real terms from the prior year(2013: decrease of 6.5 per cent), marginally above the mid-point of the range published for 2018 by market commentators of US$1,993 and US$2,469 per tonne,with an average of US$2,246 per tonne. No subsequent impairment indicators have been identified in the second half of 2014 in relation to the KitimatModernisation Project.
In 2013, the annual impairment review of the Group’s Aluminium cash-generating units with indefinite-lived intangible assets resulted in a pre-tax impairmentcharge of US$950 million in the Kitimat cash-generating unit. The indefinite-lived intangible assets relating to water rights at Kitimat were fully impaired followingthe allocation of this impairment loss.
Pacific Aluminium, Australia and New ZealandThe annual review of asset values at 30 September 2014 of the Pacific Aluminium cash-generating unit provides evidence that the impairment losses primarilyrecorded in respect of Tomago, Bell Bay, Gladstone Power Station and Boyne Smelters in 2011 and 2012 have reversed as a result of significant costimprovements and high regional and product premiums. There has also been a regulatory change in Australia with carbon tax legislation being repealed on 17 July2014 for a period of five years with effect from 1 July 2014.
128 riotinto.com
For
per
sona
l use
onl
y
A pre-tax impairment reversal of US$635 million has been recorded against the property, plant and equipment of Tomago, Bell Bay and Gladstone Power Stationand a post-tax impairment reversal of US$589 million relating to Boyne Smelters has been recorded against investments in equity accounted units. Therecoverable amount of these assets has been determined on a FVLCD basis, classified as level 3 in the fair value hierarchy, modelled with cash flows expressed inreal terms and discounted using a post-tax real discount rate of 7.2 per cent. The recoverable amount of the assets is greater than the amount at which theseassets would have been carried, net of depreciation, had no impairment loss been recognised in prior periods and therefore the impairment reversal is based onthe latter amount.
The Tiwai Point smelter in New Zealand, also part of the Pacific Aluminium cash-generating unit, is currently profitable as a result of high regional and productpremiums and operational cost improvements; however, operational uncertainties indicate that the impairment losses previously recognised are yet to reverse.
Aluminium Other and 2012 impairmentsIn 2014, a pre-tax impairment loss of US$46 million was recorded in relation to other aluminium businesses.
In 2013, a pre-tax impairment loss of US$847 million was recorded in the Group’s Aluminium business relating to the full write-off of property, plant andequipment at the Gove alumina refinery following the decision to curtail operations and at the Shawinigan aluminium smelter following the decision to closethe plant.
In 2012 the Group’s Aluminium cash-generating units were tested for impairment in aggregate as the goodwill was allocated and monitored at the segment level.This goodwill was fully written off in 2012 and the remaining loss allocated to specific cash-generating units including Kitimat and Pacific Aluminium. The 2012impairment testing of the Group’s Aluminium business resulted in a pre-tax impairment charge of US$7,468 million to goodwill, a pre-tax impairment charge ofUS$229 million to intangible assets, a pre-tax impairment charge of US$3,944 million to property, plant and equipment, a post-tax impairment charge ofUS$379 million to investments in equity accounted units, and a pre-tax adjustment of US$194 million to other assets and liabilities.
CopperMolybdenum Autoclave Process, USA review of the investment case for the Molybdenum Autoclave Process project in Utah, US has concluded that the project, which has been on care andmaintenance since early 2013, will be terminated. The recoverable amount has been determined based on the anticipated net disposal proceeds. As a result, apre-tax impairment charge of US$559 million has been recorded against property, plant and equipment.
Oyu Tolgoi, MongoliaThe annual review of cash-generating units identified indicators that an impairment loss may have occurred at the Oyu Tolgoi cash-generating unit, primarily as aresult of delays in developing the underground mine. The recoverable amount for Oyu Tolgoi was determined by reference to a FVLCD model and exceeded theUS$8.2 billion carrying value of the cash-generating unit at 30 September 2014. No further impairment indicators were identified subsequent to the annual testingdate. As such, no impairment charge has been recognised in the income statement (2013: pre-tax impairment charge of US$4,716 million).
The recoverable amount of the Oyu Tolgoi cash-generating unit is classified as level 3 under the fair value hierarchy. In arriving at FVLCD, post-tax cash flowsexpressed in real terms have been estimated until the end of the life of mine plan and discounted using an asset specific post-tax real discount rate of 8.3 per cent(2013: 8.7 per cent).
The assumption subject to the most estimation uncertainty for the FVLCD calculation is the timing of the underground project. If this is further delayed, it wouldhave an adverse impact upon the recoverable amount at the testing date due to the delay in commencing full underground production, partially offset by delayingproject spend. To illustrate this sensitivity, the recoverable amount would be reduced by US$0.5 billion (2013: US$0.8 billion) if the timing of first drawbell ore weredelayed by 12 months compared with the forecast timing of related cash flows in Rio Tinto’s FVLCD model as of 30 September 2014. The recoverable amount inthis illustration would continue to exceed the carrying value of the cash-generating unit. The year-on-year decrease in sensitivity is primarily the result of mineplan optimisation which has been undertaken while construction of the underground has been delayed.
Other key assumptions to which the calculation of FVLCD for Oyu Tolgoi is most sensitive are: long-term copper prices, discount rates and operating costs. Otherassumptions include the long-term gold price, and Mongolian tugrik and Chinese yuan exchange rates against the US dollar. Future selling prices and operatingcosts have been estimated in line with the policy set out in note 1(i).
SouthGobi, MongoliaThe expansion and undeveloped properties in SouthGobi were recognised in accordance with the requirement in IFRS as defined in note 1, to fair value assets onfirst consolidation and were therefore recorded as an accounting uplift when Rio Tinto obtained control of Turquoise Hill Resources Ltd on 24 January 2012. Theseassets were not amortised and were fully written-off as a result of the 2013 impairment testing.
EnergyRio Tinto Coal MozambiqueAs described in note 37, the sale of Rio Tinto Coal Mozambique was completed during 2014. In previous years, the annual review of carrying values resulted inimpairment losses based on recoverable amounts assessed by reference to FVLCD models, in line with the accounting policy set out in note 1(i).
In 2013, a post-tax impairment loss of US$216 million (2012: US$1,147 million) was allocated to the Benga cash-generating unit, which was included ininvestments in equity accounted units, and a pre-tax impairment loss of US$259 million (2012: US$1,581 million) was allocated to the Zambeze cash-generatingunit intangible assets and property, plant and equipment of US$22 million (2012: no impairment charge). The impairment loss recorded in 2012 also included thefull write-off of goodwill of US$541 million which was monitored and tested at the business unit level.
riotinto.com 129
STRATEG
ICREPO
RT
DIRECTO
RS’R
EPORT
FIN
AN
CIA
LS
TA
TE
ME
NT
SPR
ODUCTIO
N,R
ESERVES
ANDOPER
ATIO
NS
ADDITIO
NALINFO
RMATIO
N
For
per
sona
l use
onl
y

Notes to the 2014 financial statements continued
7 Share of profit after tax of equity accounted units2014US$m
2013US$m
2012US$m
Sales revenue: Rio Tinto share (a) 2,852 4,113 5,498Operating costs (1,804) (2,871) (3,779)
Profit before finance items and taxation 1,048 1,242 1,719Finance items (49) (97) (68)Share of profit after tax of equity accounted units 30 31 47
Profit before taxation 1,029 1,176 1,698
Taxation (404) (478) (642)
Profit for the year (Rio Tinto share) 625 698 1,056
(a) Sales revenue of equity accounted units excludes charges by equity accounted units to Group subsidiaries.
Additional information relating to the Group’s interests in joint ventures and associates is given in notes 35 and 36.
8 Finance income and finance costs
Note2014US$m
2013US$m
2012US$m
Finance income from equity accounted units (Rio Tinto share) 10 14 14Other finance income (including bank deposits and other financial assets) 54 68 102
Total finance income 64 82 116
Interest payable and similar charges (a) (1,119) (1,234) (1,059)Amounts capitalised 14 470 727 766
Total finance costs (649) (507) (293)
(a) Interest payable and similar charges relate to interest on bank loans and other borrowings. This includes a fair value gain on interest rate swaps designated as fair value hedges ofUS$199 million (2013: US$266 million loss; 2012: US$25 million loss) and a fair value loss on bonds and notes attributable to interest rate risk of US$200 million (2013:US$257 million gain; 2012: US$13 million loss).
9 Taxation
Note2014US$m
2013US$m
2012US$m
Taxation charge
- Current 3,402 4,102 3,887- Deferred 17 (349) (1,676) (3,298)
3,053 2,426 589
Prima facie tax reconciliation Note2014US$m
2013US$m
2012US$m
Profit/(loss) before taxation 9,552 3,505 (2,431)Deduct: share of profit after tax of equity accounted units (625) (698) (1,056)(Deduct)/add: (impairment reversal)/impairment after tax of investments in equity accounted units (a) (589) 216 1,526
Parent companies’, subsidiaries’ and joint operations profit/(loss) before tax 8,338 3,023 (1,961)
Prima facie tax payable at UK rate of 21% (2013: 23%; 2012: 24%) 1,751 695 (471)Higher rate of taxation on Australian earnings 1,038 1,411 838Impact of items excluded in arriving at underlying earnings:Impairment charges net of reversals (112) 135 1,683Gains and losses on disposal and consolidation of businesses (85) (199) (185)Foreign exchange on excluded finance items 231 77 (44)Impact of tax law changes on recognition of deferred tax assets (b) 401 – (1,205)Other exclusions (35) (7) 157
Impact of changes in tax rates and laws (11) 12 (5)Other tax rates applicable outside the UK and Australia 5 (63) (74)Resource depletion and other depreciation allowances (121) (103) (121)Research, development and other investment allowances (34) (49) (57)Recognition of previously unrecognised deferred tax assets (106) – (84)Unrecognised current year operating losses 73 339 200Other items (c) 58 178 (43)
Total taxation charge (d) 3,053 2,426 589
(a) Impairment reversals/impairment of investments in equity accounted units is net of a tax charge of US$252 million for the year ended 31 December 2014 (31 December 2013: taxcredit of US$14 million; 31 December 2012: tax credit of US$691 million).
130 riotinto.com
For
per
sona
l use
onl
y

(b) The remaining Minerals Resource Rent Tax (MRRT) starting base deferred tax asset was derecognised on repeal of the tax in Australia effective 30 September 2014.
(c) Other items include various adjustments to provisions for taxation in prior periods.
(d) This tax reconciliation relates to the Group’s parent companies, subsidiaries and joint operations. The Group’s share of profit of equity accounted units is net of tax charges ofUS$404 million (31 December 2013: US$478 million; 31 December 2012: US$642 million).
2014TotalUS$m
2013TotalUS$m
2012TotalUS$m
Tax on exchange adjustments (3) (17) (1)
Fair value movements:
– Cash flow hedge fair value losses/(gains) 2 (34) 26
– Cash flow hedge gains/(losses) transferred to the income statement – 19 (50)
– Losses on revaluation of available for sale securities 1 2 6
– (Losses)/gains on revaluation of available for sale securities transferred to the income statement (1) (20) 1
Currency translation reclassified – – –
Tax credit/(charge) on actuarial losses/(gains) on post retirement benefit plans 215 (641) 83
Other (8) (6) (8)
Tax relating to components of other comprehensive loss/(income) for the year (a) 206 (697) 57
(a) This comprises deferred tax credit of US$205 million (2013: charge of US$697 million; 2012: credit of US$54 million) and current tax credit of US$1 million (2013: US$nil; 2012:credit of US$3 million), plus share of tax on other comprehensive income of equity accounted units shown separately. See note 17.
10 Earnings/(loss) per ordinary share
2014Earnings
US$m
2014Weightedaverage
number ofshares
(millions)
2014Per shareamount(cents)
2013Earnings
US$m
2013Weightedaverage
number ofshares
(millions)
2013Per shareamount(cents)
Basic earnings per share attributable to ordinary shareholders ofRio Tinto – continuing operations (a) 6,527 1,848.4 353.1 3,665 1,847.3 198.4
Diluted earnings per share attributable to ordinary shareholders of Rio Tinto– continuing operations (b) 6,527 1,858.7 351.2 3,665 1,857.7 197.3
2012Loss
US$m
2012Weightedaverage
number ofshares
(millions)
2012Per shareamount(cents)
Basic loss per share attributable to ordinary shareholders of Rio Tinto – continuing operations (3,021) 1,849.1 (163.4)
Basic loss per share attributable to ordinary shareholders of Rio Tinto – discontinued operations (7) 1,849.1 (0.4)
Total basic loss per share – profit for the year (a) (3,028) 1,849.1 (163.8)
(a) The weighted average number of shares is calculated as the average number of Rio Tinto plc shares outstanding not held as treasury shares of 1,413.0 million (2013:1,411.6 million; 2012: 1,413.4 million) plus the average number of Rio Tinto Limited shares outstanding of 435.4 million (2013: 435.7 million; 2012: 435.8 million). No Rio TintoLimited shares were held by Rio Tinto plc in any of the periods presented.
(b) For the purposes of calculating diluted earnings per share, the effect of dilutive securities of 10.3 million shares (2013: 10.4 million shares) is added to the weighted averagenumber of shares described in (a) above. This effect is calculated under the treasury stock method. The Group’s only potential dilutive ordinary shares are share options for whichterms and conditions are described in note 44.
In accordance with IAS 33 “Earnings per share”, the effects of anti-dilutive potential have not been included when calculating diluted loss per share for the yearended 31 December 2012. As a result the dilutive loss per share attributable to ordinary shareholders of Rio Tinto is the same as the basic loss per shareattributable to ordinary shareholders of Rio Tinto.
riotinto.com 131
STRATEG
ICREPO
RT
DIRECTO
RS’R
EPORT
FIN
AN
CIA
LS
TA
TE
ME
NT
SPR
ODUCTIO
N,R
ESERVES
ANDOPER
ATIO
NS
ADDITIO
NALINFO
RMATIO
N
For
per
sona
l use
onl
y
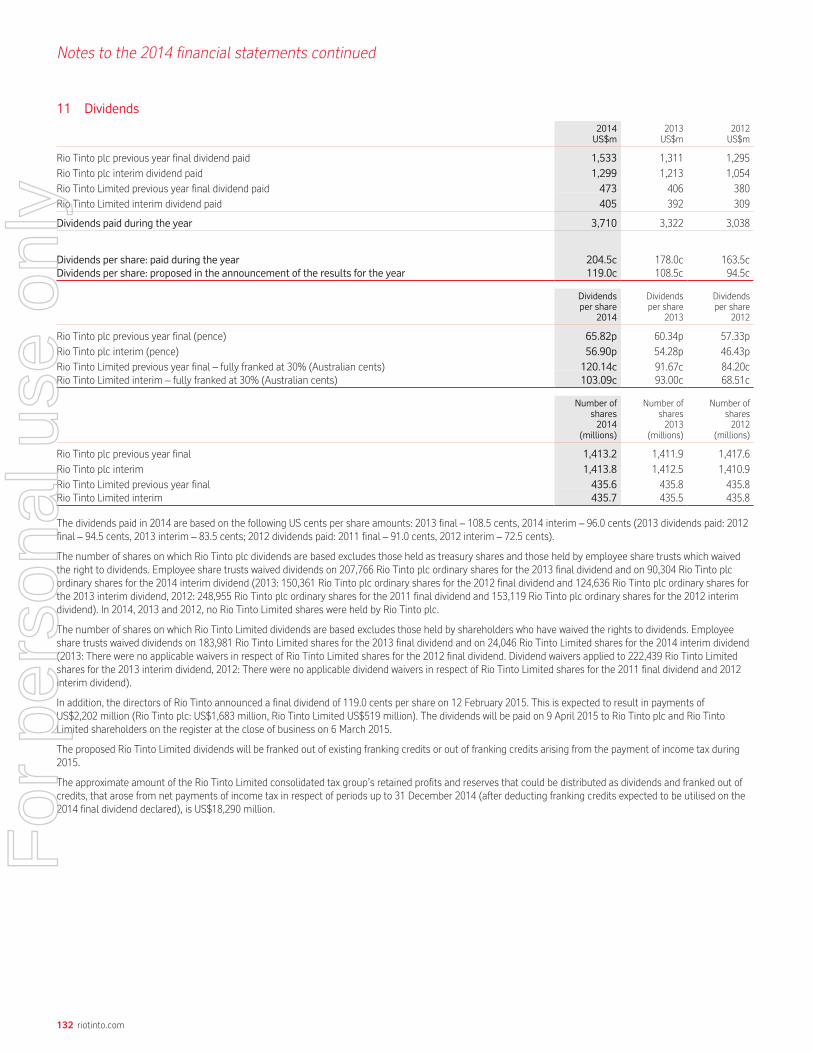
Notes to the 2014 financial statements continued
11 Dividends
2014US$m
2013US$m
2012US$m
Rio Tinto plc previous year final dividend paid 1,533 1,311 1,295
Rio Tinto plc interim dividend paid 1,299 1,213 1,054
Rio Tinto Limited previous year final dividend paid 473 406 380
Rio Tinto Limited interim dividend paid 405 392 309
Dividends paid during the year 3,710 3,322 3,038
Dividends per share: paid during the year 204.5c 178.0c 163.5cDividends per share: proposed in the announcement of the results for the year 119.0c 108.5c 94.5c
Dividendsper share
2014
Dividendsper share
2013
Dividendsper share
2012
Rio Tinto plc previous year final (pence) 65.82p 60.34p 57.33p
Rio Tinto plc interim (pence) 56.90p 54.28p 46.43p
Rio Tinto Limited previous year final – fully franked at 30% (Australian cents) 120.14c 91.67c 84.20cRio Tinto Limited interim – fully franked at 30% (Australian cents) 103.09c 93.00c 68.51c
Number ofshares2014
(millions)
Number ofshares2013
(millions)
Number ofshares2012
(millions)
Rio Tinto plc previous year final 1,413.2 1,411.9 1,417.6
Rio Tinto plc interim 1,413.8 1,412.5 1,410.9
Rio Tinto Limited previous year final 435.6 435.8 435.8Rio Tinto Limited interim 435.7 435.5 435.8
The dividends paid in 2014 are based on the following US cents per share amounts: 2013 final – 108.5 cents, 2014 interim – 96.0 cents (2013 dividends paid: 2012final – 94.5 cents, 2013 interim – 83.5 cents; 2012 dividends paid: 2011 final – 91.0 cents, 2012 interim – 72.5 cents).
The number of shares on which Rio Tinto plc dividends are based excludes those held as treasury shares and those held by employee share trusts which waivedthe right to dividends. Employee share trusts waived dividends on 207,766 Rio Tinto plc ordinary shares for the 2013 final dividend and on 90,304 Rio Tinto plcordinary shares for the 2014 interim dividend (2013: 150,361 Rio Tinto plc ordinary shares for the 2012 final dividend and 124,636 Rio Tinto plc ordinary shares forthe 2013 interim dividend, 2012: 248,955 Rio Tinto plc ordinary shares for the 2011 final dividend and 153,119 Rio Tinto plc ordinary shares for the 2012 interimdividend). In 2014, 2013 and 2012, no Rio Tinto Limited shares were held by Rio Tinto plc.
The number of shares on which Rio Tinto Limited dividends are based excludes those held by shareholders who have waived the rights to dividends. Employeeshare trusts waived dividends on 183,981 Rio Tinto Limited shares for the 2013 final dividend and on 24,046 Rio Tinto Limited shares for the 2014 interim dividend(2013: There were no applicable waivers in respect of Rio Tinto Limited shares for the 2012 final dividend. Dividend waivers applied to 222,439 Rio Tinto Limitedshares for the 2013 interim dividend, 2012: There were no applicable dividend waivers in respect of Rio Tinto Limited shares for the 2011 final dividend and 2012interim dividend).
In addition, the directors of Rio Tinto announced a final dividend of 119.0 cents per share on 12 February 2015. This is expected to result in payments ofUS$2,202 million (Rio Tinto plc: US$1,683 million, Rio Tinto Limited US$519 million). The dividends will be paid on 9 April 2015 to Rio Tinto plc and Rio TintoLimited shareholders on the register at the close of business on 6 March 2015.
The proposed Rio Tinto Limited dividends will be franked out of existing franking credits or out of franking credits arising from the payment of income tax during2015.
The approximate amount of the Rio Tinto Limited consolidated tax group’s retained profits and reserves that could be distributed as dividends and franked out ofcredits, that arose from net payments of income tax in respect of periods up to 31 December 2014 (after deducting franking credits expected to be utilised on the2014 final dividend declared), is US$18,290 million.
132 riotinto.com
For
per
sona
l use
onl
y

12 Goodwill
2014US$m
2013US$m
Net book value
At 1 January 1,349 2,774
Adjustment on currency translation (121) (253)
Company no longer consolidated – (23)
Impairment charges (a) – (1,149)
At 31 December 1,228 1,349
– cost 20,122 22,678
– accumulated impairment (18,894) (21,329)
At 1 January
– cost 22,678 24,451– accumulated impairment (21,329) (21,677)
At 31 December, goodwill has been allocated as follows:
2014US$m
2013US$m
Net book value
Richards Bay Minerals 591 656
Pilbara 409 445
Other 228 248
1,228 1,349
(a) During 2013, the goodwill impairment charge of US$1,149 million represented the full impairment of goodwill allocated to Oyu Tolgoi. Refer to note 6 for further details.
Impairment tests for goodwill
Richards Bay MineralsThe Group consolidated Richards Bay Minerals on 3 September 2012. Goodwill arose in accordance with the requirement in IFRS, as defined in note 1, to recognisea deferred tax asset or liability on the difference between the fair value of newly consolidated assets and liabilities and their tax base and is retranslated at eachperiod end for changes in the South African rand. The recognition of Richards Bay Minerals’ identifiable assets and liabilities in the balance sheet was based on fairvalues at the acquisition date determined with the assistance of an independent third party valuer.
Richards Bay Minerals’ annual impairment review resulted in no impairment charge for 2014 (2013: no impairment charge). The recoverable amount has beenassessed by reference to FVLCD, in line with the policy set out in note 1(i) and classified as level 3 under the fair value hierarchy. FVLCD was determined byestimating cash flows until the end of the life of mine plan including anticipated expansions. In arriving at FVLCD, a post-tax discount rate of 9.2 per cent (2013:7.3 per cent) has been applied to the post-tax cash flows expressed in real terms.
The key assumptions to which the calculation of FVLCD for Richards Bay Minerals is most sensitive and the corresponding decrease in FVLCD are set out below:
US$ million
5% decrease in the titanium slag price 174
1% increase in the discount rate applied to post-tax cash flows 296
10% strengthening of the South African rand 770
Other assumptions include the long-term pig iron and zircon prices and operating costs. Future selling prices and operating costs have been estimated in line withthe policy set out in note 1(i). The recoverable amount of the cash-generating unit exceeds the carrying value for each of these sensitivities applied in isolation.
PilbaraThe recoverability of goodwill arising from the acquisition of Robe River and monitored at the Pilbara CGU level has been assessed by reference to FVLCD usingdiscounted cash flows, which is in line with the policy set out in note 1(i) and is classified as level 3 under the fair value hierarchy. In arriving at FVLCD, a post-taxdiscount rate of 7.2 per cent (2013: 7.3 per cent) has been applied to the post-tax cash flows expressed in real terms. The recoverable amounts were determinedto be significantly in excess of carrying value, and there are no reasonably possible changes in key assumptions that would cause the remaining goodwill to beimpaired.
OtherThe recoverability of the Other goodwill has been assessed by reference to FVLCD using discounted cash flows, which is in line with the policy set out in note 1(i).The recoverable amounts were determined to be in excess of carrying value, and there are no reasonably possible changes in key assumptions that would causethe remaining goodwill to be impaired by a significant amount.
riotinto.com 133
STRATEG
ICREPO
RT
DIRECTO
RS’R
EPORT
FIN
AN
CIA
LS
TA
TE
ME
NT
SPR
ODUCTIO
N,R
ESERVES
ANDOPER
ATIO
NS
ADDITIO
NALINFO
RMATIO
N
For
per
sona
l use
onl
y

Notes to the 2014 financial statements continued
13 Intangible assets
Year ended 31 December 2014
Explorationand
evaluation(a)
US$m
Trademarks,patented andnon-patented
technologyUS$m
Contractbased
intangibleassets(b)
US$m
Otherintangible
assetsUS$m
TotalUS$m
Net book value
At 1 January 2014 1,854 198 2,831 538 5,421
Adjustment on currency translation (86) (21) (195) (55) (357)
Expenditure during the year 142 – – 307 449
Amortisation for the year (c) – (20) (116) (101) (237)
Disposals, transfers and other movements (d) 686 (1) (66) (15) 604
At 31 December 2014 2,596 156 2,454 674 5,880
– cost 2,770 294 4,341 1,536 8,941– accumulated amortisation and impairment (174) (138) (1,887) (862) (3,061)
Year ended 31 December 2013
Explorationand
evaluation(a)US$m
Trademarks,patented andnon-patented
technologyUS$m
Contractbased
intangibleassets(b)US$m
Otherintangible
assetsUS$m
TotalUS$m
Net book value
At 1 January 2013 2,053 212 4,120 495 6,880
Adjustment on currency translation (96) 7 (290) (47) (426)
Expenditure during the year 368 – 9 159 536
Amortisation for the year (c) – (21) (123) (111) (255)
Impairment charges (e) (379) – (908) – (1,287)
Disposals, transfers and other movements (92) – 23 42 (27)
At 31 December 2013 1,854 198 2,831 538 5,421
– cost 4,507 334 4,830 1,357 11,028– accumulated amortisation and impairment (2,653) (136) (1,999) (819) (5,607)
(a) Exploration and evaluation assets’ useful lives are not determined until transferred to property, plant and equipment. The reduction in cost and accumulated amortisation andimpairment from 2013 to 2014 mainly relates to the disposal of the fully impaired assets of Rio Tinto Coal Mozambique (RTCM) (see note 37). The impairment charge in 2013 ofUS$379 million mainly related to exploration and evaluation assets within RTCM and SouthGobi Resources Limited (see note 6).
(b) The Group benefits from certain intangible assets acquired with Alcan including power supply contracts, customer contracts and water rights. The water rights are expected tocontribute to the efficiency and cost effectiveness of operations for the foreseeable future: accordingly, these rights are considered to have indefinite lives and are not subject toamortisation but are tested annually for impairment. These water rights constitute the majority of the amounts in “Contract based intangible assets”.
(c) Finite life intangible assets are amortised over their useful economic lives on a straight line or units of production basis, as appropriate. Where amortisation is calculated on astraight line basis, the following useful lives have been determined:
Trademark, patented and non-patented technologyTrademarks: 14 to 20 yearsPatented and non-patented technology: 10 to 20 years
Contract based intangible assetsPower contracts: 2 to 39 yearsOther purchase and customer contracts: 5 to 15 years
Other intangible assetsInternally generated intangible assets and computer software: 2 to 5 yearsOther intangible assets: 2 to 20 years
(d) Disposals, transfers and other movements for exploration and evaluation include US$700 million previously classified as non-current receivables pending ratification of theSimandou project Investment Framework. The incorporation of the Investment Framework into Guinean law was completed following ratification by the Guinean NationalAssembly, Presidential promulgation and its publication in August 2014. The project partners are continuing to work towards the completion of a bankable feasibility study,completion of which has been delayed due to the Ebola outbreak, and are aiming to establish a funding consortium to build the infrastructure necessary to develop the Simandouproject.
(e) The US$908 million 2013 impairment charge to the contract based intangible asset class related to the full write-off of the water right indefinite-lived intangible assets at theKitimat cash-generating unit (see note 6).
The remaining carrying value of the water rights (US$1,981 million) as at 31 December 2014 relates wholly to the Quebec smelters cash-generating unit. The Quebec smelterscash-generating unit was tested for impairment and it was determined that its recoverable amount on a FVLCD basis exceeds the carrying amount by US$3,311 million.
The recoverable amount of the Quebec smelters is classified as level 3 under the fair value hierarchy. In arriving at FVLCD, post-tax cash flows expressed in real terms have beenestimated over the expected useful economic lives of the underlying smelting assets and discounted using a post-tax real discount rate of 7.2 per cent (2013: 7.3 per cent).
134 riotinto.com
For
per
sona
l use
onl
y
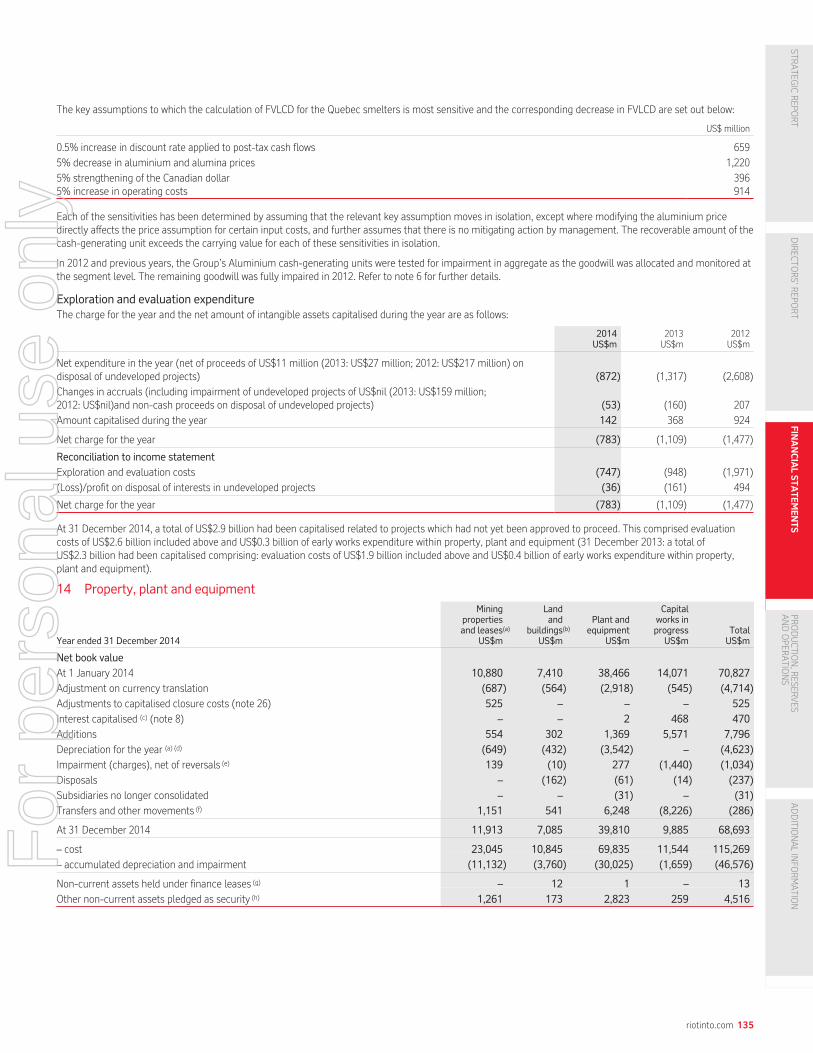
The key assumptions to which the calculation of FVLCD for the Quebec smelters is most sensitive and the corresponding decrease in FVLCD are set out below:
US$ million
0.5% increase in discount rate applied to post-tax cash flows 659
5% decrease in aluminium and alumina prices 1,220
5% strengthening of the Canadian dollar 3965% increase in operating costs 914
Each of the sensitivities has been determined by assuming that the relevant key assumption moves in isolation, except where modifying the aluminium pricedirectly affects the price assumption for certain input costs, and further assumes that there is no mitigating action by management. The recoverable amount of thecash-generating unit exceeds the carrying value for each of these sensitivities in isolation.
In 2012 and previous years, the Group’s Aluminium cash-generating units were tested for impairment in aggregate as the goodwill was allocated and monitored atthe segment level. The remaining goodwill was fully impaired in 2012. Refer to note 6 for further details.
Exploration and evaluation expenditureThe charge for the year and the net amount of intangible assets capitalised during the year are as follows:
2014US$m
2013US$m
2012US$m
Net expenditure in the year (net of proceeds of US$11 million (2013: US$27 million; 2012: US$217 million) ondisposal of undeveloped projects) (872) (1,317) (2,608)
Changes in accruals (including impairment of undeveloped projects of US$nil (2013: US$159 million;2012: US$nil)and non-cash proceeds on disposal of undeveloped projects) (53) (160) 207
Amount capitalised during the year 142 368 924
Net charge for the year (783) (1,109) (1,477)
Reconciliation to income statement
Exploration and evaluation costs (747) (948) (1,971)
(Loss)/profit on disposal of interests in undeveloped projects (36) (161) 494
Net charge for the year (783) (1,109) (1,477)
At 31 December 2014, a total of US$2.9 billion had been capitalised related to projects which had not yet been approved to proceed. This comprised evaluationcosts of US$2.6 billion included above and US$0.3 billion of early works expenditure within property, plant and equipment (31 December 2013: a total ofUS$2.3 billion had been capitalised comprising: evaluation costs of US$1.9 billion included above and US$0.4 billion of early works expenditure within property,plant and equipment).
14 Property, plant and equipment
Year ended 31 December 2014
Miningpropertiesand leases(a)
US$m
Landand
buildings(b)
US$m
Plant andequipment
US$m
Capitalworks inprogress
US$mTotalUS$m
Net book value
At 1 January 2014 10,880 7,410 38,466 14,071 70,827
Adjustment on currency translation (687) (564) (2,918) (545) (4,714)
Adjustments to capitalised closure costs (note 26) 525 – – – 525
Interest capitalised (c) (note 8) – – 2 468 470
Additions 554 302 1,369 5,571 7,796
Depreciation for the year (a) (d) (649) (432) (3,542) – (4,623)
Impairment (charges), net of reversals (e) 139 (10) 277 (1,440) (1,034)
Disposals – (162) (61) (14) (237)
Subsidiaries no longer consolidated – – (31) – (31)
Transfers and other movements (f) 1,151 541 6,248 (8,226) (286)
At 31 December 2014 11,913 7,085 39,810 9,885 68,693
– cost 23,045 10,845 69,835 11,544 115,269
– accumulated depreciation and impairment (11,132) (3,760) (30,025) (1,659) (46,576)
Non-current assets held under finance leases (g) – 12 1 – 13
Other non-current assets pledged as security (h) 1,261 173 2,823 259 4,516
riotinto.com 135
STRATEG
ICREPO
RT
DIRECTO
RS’R
EPORT
FIN
AN
CIA
LS
TA
TE
ME
NT
SPR
ODUCTIO
N,R
ESERVES
ANDOPER
ATIO
NS
ADDITIO
NALINFO
RMATIO
N
For
per
sona
l use
onl
y

Notes to the 2014 financial statements continued
14 Property, plant and equipment continued
Year ended 31 December 2013
Miningpropertiesand leases(a)
US$m
Landand
buildings(b)US$m
Plant andequipment
US$m
Capitalworks inprogress
US$mTotalUS$m
Net book value
At 1 January 2013 16,902 7,187 31,601 21,295 76,985
Adjustment on currency translation (1,303) (629) (3,670) (1,612) (7,214)
Adjustments to capitalised closure costs (note 26) 391 – – – 391
Interest capitalised (c) (note 8) – – 2 725 727
Additions 397 214 1,444 9,879 11,934
Depreciation for the year (a) (d) (816) (439) (3,281) – (4,536)
Impairment (charges), net of reversals (e) (3,976) (67) (676) (163) (4,882)
Disposals (1) (5) (89) (27) (122)
Subsidiaries no longer consolidated (401) (62) (274) (334) (1,071)
Transfers and other movements (f) (313) 1,211 13,409 (15,692) (1,385)
At 31 December 2013 10,880 7,410 38,466 14,071 70,827
– cost 21,521 11,328 68,429 14,487 115,765
– accumulated depreciation and impairment (10,641) (3,918) (29,963) (416) (44,938)
Non-current assets held under finance leases (g) – 14 9 – 23Other non-current assets pledged as security (h) 1,435 175 2,872 97 4,579
(a) At 31 December 2014, the net book value of capitalised production phase stripping costs totalled US$1.8 billion, with US$1.4 billion within Property, plant and equipment and afurther US$0.4 billion within Investments in equity accounted units (2013 total of US$1.3 billion with US$0.9 billion in Property, plant and equipment and a further US$0.4 billionwithin Investments in equity accounted units). During the period capitalisation of US$0.7 billion was partly offset by depreciation of US$0.2 billion. Amortisation of deferredstripping costs of US$84 million (2013: US$70 million; 2012: US$105 million) is included within “Depreciation for the year”.
(b) At 31 December 2014, the net book value amount for land and buildings includes freehold US$6,899 million (2013: US$6,847 million); long leasehold US$186 million(2013: US$562 million); and no short leasehold (2013: US$1 million).
(c) Interest is capitalised at a rate based on the Group’s cost of borrowing or at the rate on project specific debt, where applicable. The Group’s average borrowing rate used forcapitalisation of interest is 4.0 per cent (2013: 4.0 per cent).
(d) Assets within operations for which production is not expected to fluctuate significantly from one year to another or which have a physical life shorter than the related mine aredepreciated on a straight line basis as follows:
Land and buildingsLand: Not depreciatedBuildings: 5 to 50 years
Plant and equipmentOther plant and equipment: 3 to 50 yearsPower assets: 25 to 50 yearsCapital work in progress: Not depreciated
(e) During 2014 and 2013 impairment charges primarily related to the aluminium and copper business. In 2014, impairment charges, of US$1,669 million were offset byUS$635 million of impairment reversals.
(f) “Transfers and other movements” includes reclassifications between categories, including transfer to assets of disposal groups held for sale.
(g) The finance leases under which these assets are held are disclosed in note 23.
(h) Excludes assets held under finance leases. Non-current assets pledged as security represent amounts pledged as collateral against US$587 million (2013: US$865 million) ofloans, which are included in note 22.
15 Investments in equity accounted units
Summary balance sheet (Rio Tinto share)2014US$m
2013US$m
Rio Tinto’s share of assets
Non-current assets 6,605 5,860
Current assets 901 1,197
7,506 7,057
Rio Tinto’s share of liabilities
Current liabilities (681) (791)
Non-current liabilities (1,957) (2,309)
(2,638) (3,100)
Rio Tinto’s share of net assets (a) (b) 4,868 3,957
(a) Further details of investments in equity accounted units are set out in notes 35 and 36.
136 riotinto.com
For
per
sona
l use
onl
y

(b) The impact of impairment charges and impairment reversals on the Group’s investments in equity accounted units are summarised in note 6.
(c) At 31 December 2014 and 2013 the Group had no investments in equity accounted units with shares listed on recognised stock exchanges.
(d) At 31 December 2014, net debt of equity accounted units, excluding amounts due to Rio Tinto, was US$922 million (2013: US$991 million).
16 Inventories
2014US$m
2013US$m
Raw materials and purchased components 726 1,116
Consumable stores 1,411 1,596
Work in progress 1,490 1,721
Finished goods and goods for resale 1,120 1,815
4,747 6,248
Comprising:
Expected to be used within one year 4,350 5,737
Expected to be used after more than one year 397 511
4,747 6,248
Inventory write-downs, net of reversals, amounting to US$94 million (2013: US$201 million; 2012: US$208 million) were recognised during the year.
17 Deferred taxation
2014US$m
2013US$m
At 1 January 585 1,669
Adjustment on currency translation (36) (201)
Credited to the income statement (note 9) (349) (1,676)
(Credited)/charged to statement of comprehensive income (a) (205) 697
Newly consolidated operations (note 37) – 1
Disposals 10 –
Other movements (b) 29 95
At 31 December 34 585
Comprising:
– deferred tax liabilities (c) (d) 3,574 4,140– deferred tax assets (c) (e) (f) (g) (3,540) (3,555)
Deferred tax balances for which there is a right of offset within the same tax jurisdiction are presented net on the face of the balance sheet as permitted by IAS 12.The closing deferred tax liabilities and assets, prior to this offsetting of balances, are shown below.
Total2014US$m
Total2013US$m
Deferred tax liabilities arising from:
Capital allowances 6,018 6,391
Unremitted earnings (d) 659 637
Capitalised interest 368 348
Unrealised exchange gains 255 91
Other temporary differences 248 761
7,548 8,228
Deferred tax assets arising from:
Tax losses (e) (2,276) (2,496)
Provisions (2,096) (2,084)
Capital allowances (f) (877) (1,289)
Post retirement benefits (1,165) (1,036)
Unrealised exchange losses (658) (184)
Other temporary differences (442) (554)
(7,514) (7,643)
riotinto.com 137
STRATEG
ICREPO
RT
DIRECTO
RS’R
EPORT
FIN
AN
CIA
LS
TA
TE
ME
NT
SPR
ODUCTIO
N,R
ESERVES
ANDOPER
ATIO
NS
ADDITIO
NALINFO
RMATIO
N
For
per
sona
l use
onl
y

Notes to the 2014 financial statements continued
17 Deferred taxation continuedTotal2014US$m
Total2013US$m
Credited/(charged) to the income statement
Unrealised exchange losses (365) (566)
Tax losses 72 (563)
Provisions (122) (434)
Capital allowances 272 (44)
Tax on unremitted earnings 2 (3)
Post retirement benefits 34 68
Other temporary differences (242) (134)
(349) (1,676)
(a) The amounts credited directly to the Statement of comprehensive income include provisions for tax on exchange differences on intragroup loans qualifying for reporting as part ofthe net investment in subsidiaries, on cash flow hedges and on actuarial gains and losses on pension schemes, and on post retirement healthcare plans.
(b) “Other movements” include deferred tax relating to tax payable recognised by subsidiary holding companies on the profits of the equity accounted units to which it relates.
(c) The deferred tax liability of US$3,574 million (2013: US$4,140 million) includes US$3,555 million (2013: US$4,139 million) due in more than one year. The deferred tax asset ofUS$3,540 million (2013: US$3,555 million) includes US$3,405 million (2013: US$3,426 million) receivable in more than one year. All amounts are shown as non-current on the faceof the balance sheet as required by IAS 12.
(d) Deferred tax is not recognised on the unremitted earnings of subsidiaries and joint ventures where the Group is able to control the timing of the remittance and it is probable thatthere will be no remittance in the foreseeable future. If these earnings were remitted, tax of US$202 million (2013: US$183 million) would be payable.
(e) There is a limited time period, the shortest of which is two years, for the recovery of US$1,347 million (2013: US$1,384 million) of tax losses and other tax assets which have beenrecognised as deferred tax assets in the financial statements.
(f) As at 31 December 2013, deferred tax assets arising from capital allowances included amounts arising following the introduction of the MRRT on 1 July 2012. At 31 December2014, no deferred tax is recognised in respect of MRRT following the repeal of MRRT during 2014. Refer to note 9.
(g) Recognised and unrecognised deferred tax assets are shown in the table below and totalled US$6,885 million at 31 December 2014 (2013: US$ 17,755 million). Of this total,US$3,540 million has been recognised as deferred tax assets (2013: US$3,555 million), leaving US$3,345 million (2013: US$14,200 million) unrecognised, as recovery is notconsidered probable.
The recognised amounts do not include deferred tax assets that have been netted off against deferred tax liabilities.
Recognised Unrecognised
At 31 December2014US$m
2013US$m
2014US$m
2013US$m
UK 131 104 150 215
France (i) 377 444 1,184 1,339
Canada 491 297 371 181
US 932 560 16 16
Australia (ii) 1,324 1,880 287 11,000Other 285 270 1,337 1,449
Total (iii) 3,540 3,555 3,345 14,200
(i) US$1,184 million (2013: US$1,274 million) of the unrecognised assets relate to trading losses in France, which were acquired as part of the Alcan acquisition. The amountrecognised takes account of legislation which restricts the recovery of losses.
(ii) The recognised and unrecognised amounts for 2013 include temporary differences that are deductible for the purposes of MRRT. At 31 December 2014 the recognised andunrecognised amounts for MRRT are US$nil following the repeal of MRRT.
(iii) US$688 million (2013: US$652 million) of the unrecognised assets relate to realised or unrealised capital losses, recovery of which depends on the existence of capital gains infuture years. There is a time limit, the shortest of which is one year, for the recovery of US$353 million of the unrecognised assets (2013: US$343 million).
18 Trade and other receivables
Non-current2014US$m
Current2014US$m
Total2014US$m
Non-current2013US$m
Current2013US$m
Total2013US$m
Trade receivables (a) 5 2,483 2,488 5 2,987 2,992
Other receivables (b) 435 884 1,319 1,150 1,212 2,362
Prepayment of tolling charges to equity accounted units (c) 387 – 387 479 – 479
Pension surpluses (note 45) 353 – 353 290 – 290
Amounts due from equity accounted units – 36 36 – 136 136
Other prepayments 124 220 344 216 332 548
1,304 3,623 4,927 2,140 4,667 6,807
(a) At 31 December 2014, trade and other receivables are stated net of provisions for doubtful debts of US$39 million (2013: US$12 million). Amounts of US$35 million(2013: US$10 million) were impaired; the majority of these receivables were more than 90 days overdue.
138 riotinto.com
For
per
sona
l use
onl
y

(b) As at 31 December 2013 non-current other receivables included a capitalised prepayment on an intangible asset of the Simandou iron ore project of US$700m. This wastransferred to intangible assets (see note 13) in 2014 on the ratification of the settlement agreement.
(c) Rio Tinto Aluminium has made certain prepayments to equity accounted units for toll processing of alumina. These prepayments will be charged to Group operating costs asprocessing takes place.
There is no material element of trade and other receivables that is interest bearing.
The fair value of current trade and other receivables and the majority of amounts classified as non-current assets approximates their carrying value.
As of 31 December 2014, trade receivables of US$82 million (2013: US$178 million) were past due but not impaired. The ageing of these receivables is as follows:
2014US$m
2013US$m
less than 30 days overdue 34 57
between 30 and 60 days overdue 11 71
between 60 and 90 days overdue 30 47
more than 90 days overdue 7 3
82 178
These relate to a number of customers for whom there is no recent history of default.
With respect to trade and other receivables that are neither impaired nor past due, there are no indications as of the reporting date that the debtors will not meettheir payment obligations.
19 Assets and liabilities held for saleAt 31 December 2014 assets and liabilities held for sale comprised the Group’s 71.2 per cent interest in the Blair Athol coal project (Blair Athol) and its28.4 per cent indirect interest in SouthGobi Resources Limited, which was acquired as part of the gain of control of Turquoise Hill Resources Ltd in 2012.
At 31 December 2013 assets and liabilities held for sale comprised the Group’s 50.1 per cent interest in the Clermont Joint Venture (Clermont), its 71.2 per centinterest in Blair Athol, and Zululand Anthracite Colliery (ZAC), which was acquired with Rio Tinto Coal Mozambique in 2011. At 31 December 2014 ZAC was nolonger held for sale. On 25 October 2013, Rio Tinto announced that it had reached a binding agreement to sell its interest in Clermont to GS Coal Pty Ltd, acompany jointly owned by Glencore and Sumitomo Corporation, for US$1,015 million. The sale was completed on 29 May 2014.
20 Other financial assets (including tax recoverable and loans to equity accounted units)
Non-current2014US$m
Current2014US$m
Total2014US$m
Non-current2013US$m
Current2013US$m
Total2013US$m
Derivative financial instruments 393 43 436 403 63 466
Equity shares and quoted funds 103 96 199 157 122 279
Other investments, including loans 226 61 287 339 167 506
Loans to equity accounted units – 71 71 1 93 94
Tax recoverable 70 146 216 83 265 348
792 417 1,209 983 710 1,693
Detailed information relating to other financial assets is given in note 30.
21 Cash and cash equivalents
Note2014US$m
2013US$m
Cash at bank and in hand 1,146 1,548
Money market funds and other cash equivalents 11,277 8,668
Balance per Group balance sheet 12,423 10,216
Bank overdrafts repayable on demand (unsecured) 22 (23) (7)
Balance per Group cash flow statement 12,400 10,209
Cash and cash equivalents of US$631 million (2013: US$570 million) are held in countries where there are restrictions on remittances. Of this balanceUS$455 million (2013: US$402 million) could be used to repay subsidiaries’ third party borrowings.
There are also restrictions on a further US$404 million (2013: US$652 million) of cash and cash equivalents, the majority of which is held by partially ownedentities and is not available for use in the wider Group due to the legal and contractual restrictions currently in place. Of this balance US$24 million(2013: US$119 million) could be used to repay subsidiaries’ third party borrowings.
riotinto.com 139
STRATEG
ICREPO
RT
DIRECTO
RS’R
EPORT
FIN
AN
CIA
LS
TA
TE
ME
NT
SPR
ODUCTIO
N,R
ESERVES
ANDOPER
ATIO
NS
ADDITIO
NALINFO
RMATIO
N
For
per
sona
l use
onl
y

Notes to the 2014 financial statements continued
22 Borrowings and other financial liabilities
Borrowings at 31 December Note
Non-current2014US$m
Current2014US$m
Total2014US$m
Non-current2013US$m
Current2013US$m
Total2013US$m
USD Commercial Paper – – – – 156 156Rio Tinto Finance (USA) Limited Bonds 8.95% 2014 (a) – – – – 1,907 1,907Alcan Inc. Global Notes 5.2% due 2014 (a) – – – – 499 499Rio Tinto Finance (USA) Limited Bonds 1.875% 2015 – 500 500 500 – 500Rio Tinto Finance (USA) plc Bonds 1.125% 2015 – 500 500 499 – 499Rio Tinto Finance (USA) plc Bonds LIBOR plus 0.55% 2015 – 250 250 250 – 250Alcan Inc. Global Notes 5.0% due 2015 (a) – 496 496 499 – 499Rio Tinto Finance (USA) Limited Bonds 2.500% 2016 698 – 698 698 – 698Rio Tinto Finance (USA) Limited Bonds 2.250% 2016 498 – 498 498 – 498Rio Tinto Finance (USA) plc Bonds 1.375% 2016 998 – 998 996 – 996Rio Tinto Finance (USA) plc Bonds LIBOR plus 0.84% 2016 500 – 500 499 – 499Rio Tinto Finance (USA) plc Bonds 2.0% 2017 499 – 499 499 – 499Rio Tinto Finance (USA) plc Bonds 1.625% 2017 1,245 – 1,245 1,243 – 1,243Rio Tinto Finance (USA) Limited Bonds 6.5% 2018 (a) 1,935 – 1,935 1,979 – 1,979Rio Tinto Finance (USA) plc Bonds 2.250% 2018 1,239 – 1,239 1,238 – 1,238Rio Tinto Finance (USA) Limited Bonds 9.0% 2019 1,474 – 1,474 1,467 – 1,467Rio Tinto Finance (USA) Limited Bonds 3.5% 2020 996 – 996 995 – 995Rio Tinto Finance plc Euro Bonds 2.0% due 2020 (a) (b) 934 – 934 999 – 999Rio Tinto Finance (USA) Limited Bonds 4.125% 2021 998 – 998 996 – 996Rio Tinto Finance (USA) Limited Bonds 3.750% 2021 1,144 – 1,144 1,145 – 1,145Rio Tinto Finance (USA) plc Bonds 3.5% 2022 (a) 995 – 995 992 – 992Rio Tinto Finance (USA) plc Bonds 2.875% 2022 (a) 988 – 988 985 – 985Rio Tinto Finance plc Euro Bonds 2.875% due 2024 (a) (b) 646 – 646 639 – 639Rio Tinto Finance (USA) Limited Bonds 7.125% 2028 (a) 1,008 – 1,008 934 – 934Alcan Inc. Debentures 7.25% due 2028 106 – 106 107 – 107Rio Tinto Finance plc Sterling Bonds 4.0% due 2029 (a) (b) 774 – 774 822 – 822Alcan Inc. Debentures 7.25% due 2031 429 – 429 430 – 430Alcan Inc. Global Notes 6.125% due 2033 745 – 745 739 – 739Alcan Inc. Global Notes 5.75% due 2035 279 – 279 284 – 284Rio Tinto Finance (USA) Limited Bonds 5.2% 2040 1,145 – 1,145 1,147 – 1,147Rio Tinto Finance (USA) plc Bonds 4.75% 2042 490 – 490 490 – 490Rio Tinto Finance (USA) plc Bonds 4.125% 2042 726 – 726 725 – 725Loans from equity accounting units – 52 52 9 77 86Other secured loans 376 211 587 651 214 865Other unsecured loans 497 627 1,124 551 1,049 1,600Finance leases 23 49 5 54 39 7 46Bank overdrafts 21 – 23 23 – 7 7
Total borrowings including overdrafts (c) 22,411 2,664 25,075 24,544 3,916 28,460
(a) These borrowings are subject to the hedging arrangements summarised below.
(b) Rio Tinto has a US$10 billion (2013: US$10 billion) European Debt Issuance Programme (EDIP) against which the cumulative amount utilised was US$2.3 billion equivalent at31 December 2014 (2013: US$2.6 billion). The carrying value of these bonds after hedge accounting adjustments amounted to US$2.4 billion (2013: US$ 2.5 billion) in aggregate.
(c) The Group’s borrowings of US$25.1 billion (2013: US$28.5 billion) include some US$3.5 billion (2013: US$3.3 billion) which relates to subsidiary entity borrowings that are withoutrecourse to the Group, of which US$0.6 billion (2013: US$0.7 billion) are subject to various financial and general covenants with which the respective borrowers were in complianceas at 31 December 2014.
Other financial liabilities
Non-current2014US$m
Current2014US$m
Total2014US$m
Non-current2013US$m
Current2013US$m
Total2013US$m
Derivative financial instruments 67 14 81 31 10 41
Other financial liabilities 57 6 63 50 – 50
Total other financial liabilities 124 20 144 81 10 91
Total borrowings and other financial liabilities 22,535 2,684 25,219 24,625 3,926 28,551
Swap arrangements
At 31 December 2014, US$3.7 billion (2013: US$4.2 billion) US dollar notional of the fixed rate US dollar borrowings were swapped to floating US dollar rates andUS$1.5 billion (2013: US$1.6 billion) US dollar notional equivalent of euro borrowings were fully swapped to floating US dollar rates.
140 riotinto.com
For
per
sona
l use
onl
y
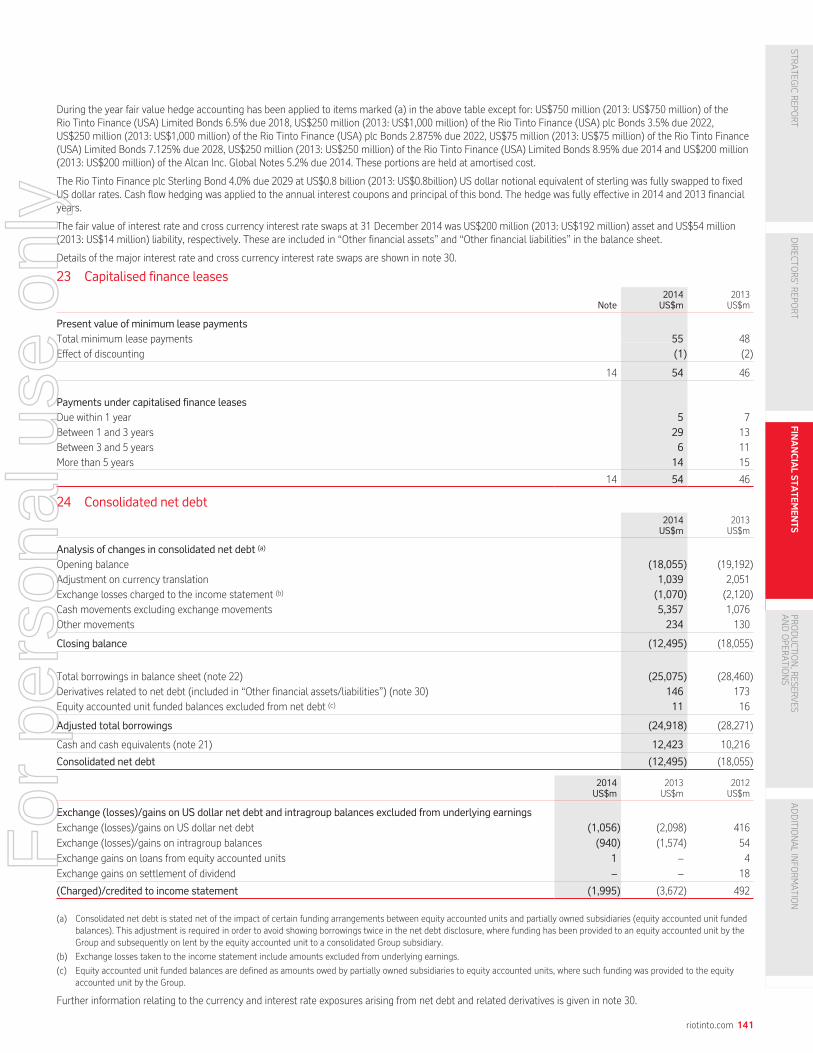
During the year fair value hedge accounting has been applied to items marked (a) in the above table except for: US$750 million (2013: US$750 million) of theRio Tinto Finance (USA) Limited Bonds 6.5% due 2018, US$250 million (2013: US$1,000 million) of the Rio Tinto Finance (USA) plc Bonds 3.5% due 2022,US$250 million (2013: US$1,000 million) of the Rio Tinto Finance (USA) plc Bonds 2.875% due 2022, US$75 million (2013: US$75 million) of the Rio Tinto Finance(USA) Limited Bonds 7.125% due 2028, US$250 million (2013: US$250 million) of the Rio Tinto Finance (USA) Limited Bonds 8.95% due 2014 and US$200 million(2013: US$200 million) of the Alcan Inc. Global Notes 5.2% due 2014. These portions are held at amortised cost.
The Rio Tinto Finance plc Sterling Bond 4.0% due 2029 at US$0.8 billion (2013: US$0.8billion) US dollar notional equivalent of sterling was fully swapped to fixedUS dollar rates. Cash flow hedging was applied to the annual interest coupons and principal of this bond. The hedge was fully effective in 2014 and 2013 financialyears.
The fair value of interest rate and cross currency interest rate swaps at 31 December 2014 was US$200 million (2013: US$192 million) asset and US$54 million(2013: US$14 million) liability, respectively. These are included in “Other financial assets” and “Other financial liabilities” in the balance sheet.
Details of the major interest rate and cross currency interest rate swaps are shown in note 30.
23 Capitalised finance leases
Note2014US$m
2013US$m
Present value of minimum lease payments
Total minimum lease payments 55 48Effect of discounting (1) (2)
14 54 46
Payments under capitalised finance leases
Due within 1 year 5 7Between 1 and 3 years 29 13Between 3 and 5 years 6 11More than 5 years 14 15
14 54 46
24 Consolidated net debt
2014US$m
2013US$m
Analysis of changes in consolidated net debt (a)
Opening balance (18,055) (19,192)Adjustment on currency translation 1,039 2,051Exchange losses charged to the income statement (b) (1,070) (2,120)Cash movements excluding exchange movements 5,357 1,076Other movements 234 130
Closing balance (12,495) (18,055)
Total borrowings in balance sheet (note 22) (25,075) (28,460)Derivatives related to net debt (included in “Other financial assets/liabilities”) (note 30) 146 173Equity accounted unit funded balances excluded from net debt (c) 11 16
Adjusted total borrowings (24,918) (28,271)
Cash and cash equivalents (note 21) 12,423 10,216
Consolidated net debt (12,495) (18,055)
2014US$m
2013US$m
2012US$m
Exchange (losses)/gains on US dollar net debt and intragroup balances excluded from underlying earnings
Exchange (losses)/gains on US dollar net debt (1,056) (2,098) 416
Exchange (losses)/gains on intragroup balances (940) (1,574) 54
Exchange gains on loans from equity accounted units 1 – 4
Exchange gains on settlement of dividend – – 18
(Charged)/credited to income statement (1,995) (3,672) 492
(a) Consolidated net debt is stated net of the impact of certain funding arrangements between equity accounted units and partially owned subsidiaries (equity accounted unit fundedbalances). This adjustment is required in order to avoid showing borrowings twice in the net debt disclosure, where funding has been provided to an equity accounted unit by theGroup and subsequently on lent by the equity accounted unit to a consolidated Group subsidiary.
(b) Exchange losses taken to the income statement include amounts excluded from underlying earnings.
(c) Equity accounted unit funded balances are defined as amounts owed by partially owned subsidiaries to equity accounted units, where such funding was provided to the equityaccounted unit by the Group.
Further information relating to the currency and interest rate exposures arising from net debt and related derivatives is given in note 30.
riotinto.com 141
STRATEG
ICREPO
RT
DIRECTO
RS’R
EPORT
FIN
AN
CIA
LS
TA
TE
ME
NT
SPR
ODUCTIO
N,R
ESERVES
ANDOPER
ATIO
NS
ADDITIO
NALINFO
RMATIO
N
For
per
sona
l use
onl
y

Notes to the 2014 financial statements continued
25 Trade and other payables
Non-current2014US$m
Current2014US$m
Total2014US$m
Non-current2013US$m
Current2013US$m
Total2013US$m
Trade payables 5 2,592 2,597 2 3,095 3,097
Accruals and deferred income 248 2,123 2,371 146 2,481 2,627
Other payables (a) 359 1,201 1,560 164 1,112 1,276
Employee entitlements – 905 905 – 861 861
Royalties and mining taxes 2 526 528 2 682 684
Amounts owed to equity accounted units 147 78 225 135 155 290
Government grants deferred 110 12 122 127 14 141
871 7,437 8,308 576 8,400 8,976
(a) “Other payables” include deferred consideration of US$29 million (2013: US$54 million) relating to acquired assets. All other accounts payable and accruals are non-interestbearing.
Due to their short term maturities, the fair value of trade and other payables approximates their carrying value.
26 Provisions (including post retirement benefits)
Pensionsand post
retirementhealthcare(a)
US$m
Otheremployee
entitlements(b)US$m
Close downand
restoration/environmental(c)(d)(e)
US$mOtherUS$m
Total2014US$m
Total2013US$m
At 1 January 3,599 941 8,582 959 14,081 16,981
Adjustment on currency translation (223) (47) (584) (109) (963) (1,081)
Adjustments to mining properties (note 14)
– changes in estimate – – 525 – 525 391
Charged/(credited) to profit:
– increases to existing provisions 236 132 125 430 923 1,171
– new provisions – 87 5 202 294 455
– unused amounts reversed 2 (31) (46) (95) (170) (169)
– exchange gains/(losses) on provisions – – 42 49 91 (8)
– amortisation of discount – 2 356 26 384 377
Utilised in year (296) (339) (368) (266) (1,269) (1,506)
Actuarial gains/(losses) recognised in equity 776 – – – 776 (2,204)
Newly consolidated operations (note 37) – 1 10 – 11 18
Subsidiaries no longer consolidated – – – 23 23 (260)
Transfers to assets held for sale (6) (1) (20) 4 (23) (104)
Transfers and other movements (2) (146) 3 64 (81) 20
At 31 December 4,086 599 8,630 1,287 14,602 14,081
Balance sheet analysis:
Current 117 430 355 397 1,299 1,738
Non-current 3,969 169 8,275 890 13,303 12,343
Total 4,086 599 8,630 1,287 14,602 14,081
(a) The main assumptions used to determine the provision for pensions and post retirement healthcare, and other information, including the expected level of future fundingpayments in respect of those arrangements, are given in note 45.
(b) The provision for other employee entitlements includes a provision for long service leave of US$354 million (2013: US$314 million), based on the relevant entitlements in certainGroup operations and includes US$113 million (2013: US$193 million) of provision for redundancy and severance payments.
(c) The Group’s policy on close-down and restoration costs is described in note 1(k) and in paragraph (v) under “Critical accounting policies and estimates” on pages 117 and 120.Close-down and restoration costs are a normal consequence of mining, and the majority of close-down and restoration expenditure is incurred in the years following closure of themine, refinery or smelter. Remaining lives of operations and infrastructure range from one to over 50 years with an average for all sites, weighted by closure provision, of around 18years (2013: 21 years). Although the ultimate cost to be incurred is uncertain, the Group’s businesses estimate their respective costs based on current restoration standards andtechniques. Provisions of US$8,630 million (2013: US$8,582 million) for close-down and restoration costs and environmental clean up obligations are based on risk adjusted cashflows. These estimates have been discounted to their present value at a real risk free rate of 2 per cent per annum, based on an estimate of the long term, risk free, pre-tax cost ofborrowing.
(d) Non-current provisions for close down and restoration/environmental expenditure include amounts relating to environmental clean-up of US$341 million (2013: US$327 million)expected to take place between one and five years from the balance sheet date, and US$798 million (2013: US$909 million) expected to take place later than five years after thebalance sheet date.
(e) Close-down and restoration/environmental liabilities at 31 December 2014 have not been adjusted for amounts of US$108 million (2013: US$142 million) relating to insurancerecoveries and other financial assets held for the purposes of meeting these obligations.
142 riotinto.com
For
per
sona
l use
onl
y

27 Share capital – Rio Tinto plc
2014Number(million)
2013Number(million)
2012Number(million)
2014US$m
2013US$m
2012US$m
Issued and fully paid up share capital of 10p each
At 1 January 1,425.377 1,425.376 1,453.400 230 230 234
Ordinary shares issued (a) (c) 0.001 0.001 – – – –
Ordinary shares purchased but uncancelled on 1 January (b) – – (1.800) – – –
Own shares purchased and cancelled (b) – – (26.224) – – (4)
At 31 December 1,425.378 1,425.377 1,425.376 230 230 230
Shares held by public
At 1 January 1,412.695 1,411.257 1,436.542
Shares reissued from treasury (a) 1.451 1.437 0.939
Shares purchased and cancelled (b) – – (26.224)
Ordinary shares issued (a) (c) 0.001 0.001 –
At 31 December 1,414.147 1,412.695 1,411.257
Shares repurchased and held in treasury 11.231 12.682 14.119
Shares held by public 1,414.147 1,412.695 1,411.257
Total share capital 1,425.378 1,425.377 1,425.376
Other share classes
Special Voting Share of 10p each (d) 1 only 1 only 1 only
DLC Dividend Share of 10p each (d) 1 only 1 only 1 onlyEqualisation Share of 10p each (d) 1 only 1 only 1 only
(a) 971 Ordinary shares were issued in 2014 under the Global Employee Share Plan. 1,450,659 Ordinary shares were reissued from treasury during the year resulting from the exerciseof options under Rio Tinto plc employee share based payment plans, with exercise prices between £10.979p and £36.275p per share (2013: 951 ordinary shares were issued, and1,436,542 Ordinary shares reissued from treasury with exercise prices between £10.43p and £35.76p per share; 2012: no new ordinary shares issued and 939,423 Ordinary sharesreissued from treasury with exercise prices between £10.43p and £39.46p per share).
(b) The authority for the Company to buy back its Ordinary shares was renewed at the 2014 annual general meeting. No shares were bought back and held in treasury in 2013 and 2014.From January to March 2012, 26,223,910 shares were bought back and cancelled and 1,800,000 shares purchased and awaiting cancellation at 31 December 2011 were cancelled.
(c) The aggregate consideration for new shares issued under the Global Employee Share Plan was US$0.05 million (2013 restated: US$0.04 million; 2012 restated: US$nil). Thedifference between the nominal value and the issue price of the shares issued was credited to the share premium account. The aggregate consideration received for treasuryshares reissued was US$22 million (2013 restated: US$32 million; 2012: US$39 million). No new shares were issued as a result of the exercise of options under Rio Tinto plcemployee share based payment plans in 2014, 2013 and 2012.
(d) The “Special Voting Share” was issued to facilitate the joint voting by shareholders of Rio Tinto plc and Rio Tinto Limited on Joint Decisions, following the DLC merger. The “DLCDividend Share” was issued to facilitate the efficient management of funds within the DLC structure. Directors have the ability to issue an Equalisation Share if that is requiredunder the terms of the DLC Merger Sharing Agreement.
During 2014, US$49.5 million of shares and ADRs (2013: US$42 million of shares and ADRs; 2012: US$41 million of shares) were purchased by employee shareownership trusts on behalf of Rio Tinto plc to satisfy future share options and awards as they vest. At 31 December 2014, 794,330 shares and 25,502 ADRs wereheld in the employee share ownership trusts on behalf of Rio Tinto plc.
Information relating to share options and other share based incentive schemes is given in note 44 on share based payments.
riotinto.com 143
STRATEG
ICREPO
RT
DIRECTO
RS’R
EPORT
FIN
AN
CIA
LS
TA
TE
ME
NT
SPR
ODUCTIO
N,R
ESERVES
ANDOPER
ATIO
NS
ADDITIO
NALINFO
RMATIO
N
For
per
sona
l use
onl
y

Notes to the 2014 financial statements continued
28 Share Capital – Rio Tinto Limited2014
Number(million)
2013Number(million)
2012Number(million)
2014US$m
2013US$m
2012US$m
Issued and fully paid up share capital
At 1 January 435.76 435.76 435.76 4,911 5,715 5,582
Adjustment on currency translation – – – (376) (804) 133
At 31 December 435.76 435.76 435.76 4,535 4,911 5,715
– Special Voting Share (a) 1 only 1 only 1 only
– DLC Dividend Share (a) 1 only 1 only 1 only
Total share capital (a) 435.76 435.76 435.76
(a) The “Special Voting Share” was issued to facilitate the joint voting by shareholders of Rio Tinto Limited and Rio Tinto plc on Joint Decisions following the DLC merger. The “DLCDividend Share” was issued to facilitate the efficient management of funds within the DLC structure. Directors have the ability to issue an Equalisation Share if that is requiredunder the terms of the DLC Merger Sharing Agreement.
Share options exercised during the year to 31 December 2014 under various Rio Tinto Limited employee share option schemes were satisfied by the on-marketpurchase of Rio Tinto Limited shares by a third party on the Group’s behalf.
Information relating to share options and other share based incentive schemes is given in note 44.
29 Other reserves and retained earnings
2014US$m
2013US$m
2012US$m
Capital redemption reserve (a)
At 1 January 28 28 24
Own shares purchased and cancelled – – 4
At 31 December 28 28 28
Hedging reserves (b)
At 1 January 3 (68) (44)
Parent and subsidiaries’ net cash flow hedge fair value (losses)/gains (48) 149 (60)
Parent and subsidiaries’ net cash flow hedge losses/(gains) transferred to the income statement 55 (69) 47
Tax on the above 2 (9) (11)
At 31 December 12 3 (68)
Available for sale revaluation reserves (c)
At 1 January (117) (179) 193
Losses on available for sale securities (19) (67) (25)
Losses/(gains) on available for sale securities transferred to the income statement 6 146 (355)
Tax on the above – (17) 8
At 31 December (130) (117) (179)
Other reserves (d)
At 1 January 11,766 11,778 11,765
Own shares purchased from Rio Tinto Limited shareholders to satisfy share options (129) (77) (62)
Employee share options: value of services 69 64 78
Deferred tax on share options (2) 1 (3)
At 31 December 11,704 11,766 11,778
Foreign currency translation reserve (e)
At 1 January 1,191 3,309 2,807
Parent and subsidiaries currency translation and exchange adjustments (1,690) (2,138) 664
Equity accounted units currency translation adjustments (43) (44) (158)
Currency translation reclassified on disposal 53 81 (3)
Tax on the above (3) (17) (1)
At 31 December (492) 1,191 3,309
Total other reserves per balance sheet 11,122 12,871 14,868
144 riotinto.com
For
per
sona
l use
onl
y

2014US$m
2013US$m
2012US$m
Retained earnings (f)
At 1 January 23,605 21,496 27,430
Parent and subsidiaries’ profit/(loss) for the year 5,243 2,796 (3,859)
Equity accounted units’ profit after tax for the year 1,284 869 831
Actuarial (losses)/gains (g) (720) 2,211 (311)
Tax relating to components of other comprehensive income 204 (631) 72
Total comprehensive income/(loss) for the year 6,011 5,245 (3,267)
Share buy-back scheme – – (764)
Dividends paid (3,710) (3,322) (3,038)
Change in equity interest held by Rio Tinto 36 102 1,128
Own shares purchased/treasury shares reissued for share options and other movements (28) 11 (38)
Employee share options: value of services and other IFRS 2 charges taken to the income statement 196 73 45
At 31 December 26,110 23,605 21,496
(a) The capital redemption reserve was set up to comply with section 733 of the Companies Act 2006 (previously section 170 of the Companies Act 1985) when shares of a companyare redeemed or purchased wholly out of the company’s profits. Balances reflect the amount by which the Company’s issued share capital is diminished in accordance with thissection.
(b) The hedging reserve records gains or losses on cash flow hedges that are recognised initially in equity, as described in note 1 (p) (iii).
(c) The available for sale revaluation reserves record fair value gains or losses relating to available for sale securities, as described in note 1 (p) (i) (d).
(d) Other reserves include the cumulative amount recognised under IFRS 2 in respect of options granted but not exercised to acquire shares in Rio Tinto Limited, less, whereapplicable, the cost of shares purchased to satisfy share options exercised. The cumulative amount recognised under IFRS 2 in respect of options granted but not exercised toacquire shares in Rio Tinto plc is recorded in retained earnings.
Other reserves also include US$11,936 million which represents the difference between the nominal value and issue price of the shares issued arising from Rio Tinto plc’s rightsissue completed in July 2009. No share premium was recorded in the Rio Tinto plc financial statements through the operation of the merger relief provisions of the Companies Act1985.
(e) Exchange differences arising on the translation of the Group’s net investment in foreign controlled companies are taken to the foreign currency translation reserve, as described innote 1(d). The cumulative differences relating to an investment are transferred to the income statement when the investment is disposed of.
(f) Retained earnings and movements in reserves of subsidiaries include those arising from the Group’s share of joint operations.
(g) In 2014, there were no actuarial losses relating to equity accounted units (2013: US$nil; 2012: US$nil).
riotinto.com 145
STRATEG
ICREPO
RT
DIRECTO
RS’R
EPORT
FIN
AN
CIA
LS
TA
TE
ME
NT
SPR
ODUCTIO
N,R
ESERVES
ANDOPER
ATIO
NS
ADDITIO
NALINFO
RMATIO
N
For
per
sona
l use
onl
y

Notes to the 2014 financial statements continued
30 Financial instruments and risk managementExcept where stated, the information given below relates to the financial instruments of the parent companies and their subsidiaries and joint operations, andexcludes those of equity accounted units. The information is grouped in the following sections:
A – Financial assets and liabilities by categories
B – Derivative financial instruments
C – Fair values
A (a) Financial assets and liabilities by categories
At 31 December 2014 NoteTotalUS$m
Loans andreceivables
US$m
Availablefor sale
securitiesUS$m
Held atfair value
US$m
Held to maturityassets/other
financialliabilities
US$m
Financial assets
Cash and cash equivalents 21 12,423 12,423 – – –
Trade and other receivables (a) 3,727 3,715 – 12 –
Equity shares and quoted funds 20 199 – 199 – –
Other investments, including loans 20 287 118 – 164 5
Currency and commodity derivatives: designated as hedges (b) 20 17 – – 17 –
Derivatives and embedded derivatives not related to net debt:
not designated as hedges (b) 20 219 – – 219 –
Derivatives related to net debt (b) 20,22,24 200 – – 200 –
Loans to equity accounted units including quasi equity loans 299 299 – – –
Total financial assets 17,371 16,555 199 612 5
Financial liabilities
Trade and other payables (c) (6,155) (24) (6,131)
Short term borrowings and bank overdrafts 22 (2,664) – (2,664)
Medium and long term borrowings 22 (22,411) – (22,411)
Derivatives related to net debt (b) 22,24 (54) (54) –
Other derivatives and embedded derivatives: not designated ashedges (b) 22 (27) (27) –
Other financial liabilities 22 (63) – (63)
Total financial liabilities (31,374) (105) (31,269)
146 riotinto.com
For
per
sona
l use
onl
y
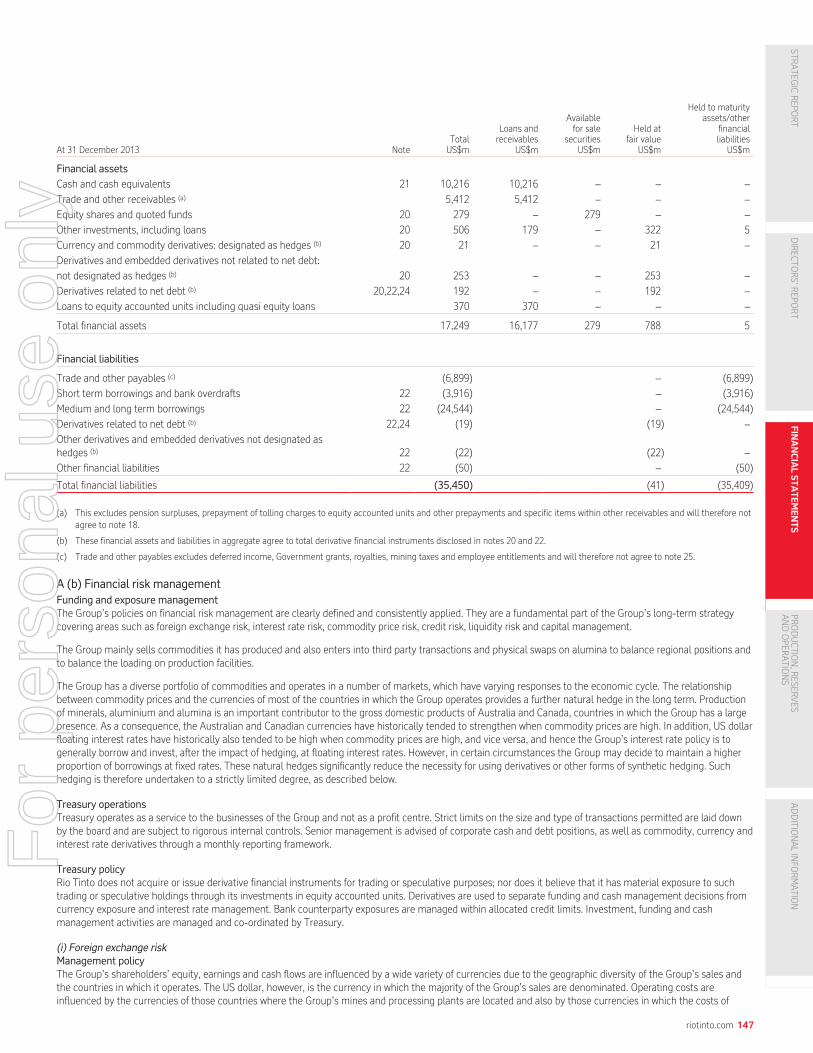
At 31 December 2013 NoteTotalUS$m
Loans andreceivables
US$m
Availablefor sale
securitiesUS$m
Held atfair value
US$m
Held to maturityassets/other
financialliabilities
US$m
Financial assets
Cash and cash equivalents 21 10,216 10,216 – – –
Trade and other receivables (a) 5,412 5,412 – – –
Equity shares and quoted funds 20 279 – 279 – –
Other investments, including loans 20 506 179 – 322 5
Currency and commodity derivatives: designated as hedges (b) 20 21 – – 21 –
Derivatives and embedded derivatives not related to net debt:
not designated as hedges (b) 20 253 – – 253 –
Derivatives related to net debt (b) 20,22,24 192 – – 192 –
Loans to equity accounted units including quasi equity loans 370 370 – – –
Total financial assets 17,249 16,177 279 788 5
Financial liabilities
Trade and other payables (c) (6,899) – (6,899)
Short term borrowings and bank overdrafts 22 (3,916) – (3,916)
Medium and long term borrowings 22 (24,544) – (24,544)
Derivatives related to net debt (b) 22,24 (19) (19) –
Other derivatives and embedded derivatives not designated ashedges (b) 22 (22) (22) –
Other financial liabilities 22 (50) – (50)
Total financial liabilities (35,450) (41) (35,409)
(a) This excludes pension surpluses, prepayment of tolling charges to equity accounted units and other prepayments and specific items within other receivables and will therefore notagree to note 18.
(b) These financial assets and liabilities in aggregate agree to total derivative financial instruments disclosed in notes 20 and 22.
(c) Trade and other payables excludes deferred income, Government grants, royalties, mining taxes and employee entitlements and will therefore not agree to note 25.
A (b) Financial risk management
Funding and exposure managementThe Group’s policies on financial risk management are clearly defined and consistently applied. They are a fundamental part of the Group’s long-term strategycovering areas such as foreign exchange risk, interest rate risk, commodity price risk, credit risk, liquidity risk and capital management.
The Group mainly sells commodities it has produced and also enters into third party transactions and physical swaps on alumina to balance regional positions andto balance the loading on production facilities.
The Group has a diverse portfolio of commodities and operates in a number of markets, which have varying responses to the economic cycle. The relationshipbetween commodity prices and the currencies of most of the countries in which the Group operates provides a further natural hedge in the long term. Productionof minerals, aluminium and alumina is an important contributor to the gross domestic products of Australia and Canada, countries in which the Group has a largepresence. As a consequence, the Australian and Canadian currencies have historically tended to strengthen when commodity prices are high. In addition, US dollarfloating interest rates have historically also tended to be high when commodity prices are high, and vice versa, and hence the Group’s interest rate policy is togenerally borrow and invest, after the impact of hedging, at floating interest rates. However, in certain circumstances the Group may decide to maintain a higherproportion of borrowings at fixed rates. These natural hedges significantly reduce the necessity for using derivatives or other forms of synthetic hedging. Suchhedging is therefore undertaken to a strictly limited degree, as described below.
Treasury operationsTreasury operates as a service to the businesses of the Group and not as a profit centre. Strict limits on the size and type of transactions permitted are laid downby the board and are subject to rigorous internal controls. Senior management is advised of corporate cash and debt positions, as well as commodity, currency andinterest rate derivatives through a monthly reporting framework.
Treasury policyRio Tinto does not acquire or issue derivative financial instruments for trading or speculative purposes; nor does it believe that it has material exposure to suchtrading or speculative holdings through its investments in equity accounted units. Derivatives are used to separate funding and cash management decisions fromcurrency exposure and interest rate management. Bank counterparty exposures are managed within allocated credit limits. Investment, funding and cashmanagement activities are managed and co-ordinated by Treasury.
(i) Foreign exchange riskManagement policyThe Group’s shareholders’ equity, earnings and cash flows are influenced by a wide variety of currencies due to the geographic diversity of the Group’s sales andthe countries in which it operates. The US dollar, however, is the currency in which the majority of the Group’s sales are denominated. Operating costs areinfluenced by the currencies of those countries where the Group’s mines and processing plants are located and also by those currencies in which the costs of
riotinto.com 147
STRATEG
ICREPO
RT
DIRECTO
RS’R
EPORT
FIN
AN
CIA
LS
TA
TE
ME
NT
SPR
ODUCTIO
N,R
ESERVES
ANDOPER
ATIO
NS
ADDITIO
NALINFO
RMATIO
N
For
per
sona
l use
onl
y

Notes to the 2014 financial statements continued
30 Financial instruments and risk management continuedimported equipment and services are determined. The Australian and Canadian dollars are the most important currencies (apart from the US dollar) influencingcosts. In any particular year, currency fluctuations may have a significant impact on Rio Tinto’s financial results. A strengthening of the US dollar against thecurrencies in which the Group’s costs are partly determined has a positive effect on Rio Tinto’s underlying earnings.
Given the dominant role of the US currency in the Group’s affairs, the US dollar is the currency in which financial results are presented both internally andexternally. It is also the most appropriate currency for financing the Group’s operations. Borrowings and cash are predominantly denominated in US dollars, eitherdirectly or through the use of derivatives.
Certain US dollar debt and other financial assets and liabilities, including intragroup balances, are not held in the functional currency of the relevant subsidiary.This results in an accounting exposure to exchange gains and losses as the financial assets and liabilities are translated into the functional currency of thesubsidiary that holds those assets and liabilities. These exchange gains and losses are recorded in the Group’s income statement except to the extent that theycan be taken to equity under the Group’s accounting policy which is explained in note 1(d). Gains and losses on US dollar net debt and on all intragroup balancesare excluded from Underlying earnings. Other exchange gains and losses are included in underlying earnings.
See section B for the details of cross currency interest rate swaps relating to borrowings.
After taking into account relevant swap instruments, almost all of the Group’s net debt is denominated in US dollars. The table below summarises, by currency, thenet debt, after taking into account relevant cross currency interest rate swaps and foreign exchange contracts:
Net funds/(debt) by currency
Cash andcash
equivalentsUS$m
Total borrowingsin note 22
US$m
Derivativesrelated to net
debtUS$m
EAU fundedbalances excluded
from net debtUS$m
Net funds/(debt)2014US$m
Net funds/(debt)2013US$m
US dollar 11,605 (23,895) 146 – (12,144) (17,359)
Australian dollar 364 (500) – 11 (125) (376)
Euro 18 (145) – – (127) (218)
South African rand 239 (324) – – (85) (201)
Canadian dollar 23 (192) – – (169) (115)
Sterling 4 – – – 4 95
Other 170 (19) – – 151 119
Total 12,423 (25,075) 146 11 (12,495) (18,055)
Hedging strategyUnder normal market conditions, the Group does not generally believe that active currency hedging of transactions would provide long-term benefits toshareholders. The Group reviews its exposure on a regular basis and reserves the right to enter into hedges to maintain financial stability. Currency protectionmeasures may be deemed appropriate in specific commercial circumstances, typically hedging of capital expenditures and other significant financial items such asacquisitions, disposals, tax and dividends, and are subject to strict limits laid down by the board. A monthly treasury report is provided to senior managementwhich summarises corporate debt exposed to currency risks after the impact of derivatives. Refer to section B for the details of currency forward, cross currencyinterest rate and option contracts used to manage the currency risk exposures of the Group at 31 December 2014.
SensitivitiesThe table below gives the estimated retranslation effect on financial assets and financial liabilities of a ten per cent strengthening in the closing exchange rate ofthe US dollar against significant currencies. The impact is expressed in terms of the effect on net earnings, underlying earnings and equity, assuming that eachexchange rate moves in isolation. The sensitivities are based on financial assets and financial liabilities held at 31 December 2014, where balances are notdenominated in the functional currency of the subsidiary or joint operation, and exclude financial assets and liabilities held by equity accounted units. Thesebalances will not remain constant throughout 2015, and therefore the following information should be used with care.
At 31 December 2014Gains/(losses) associated with ten per cent strengthening of the US dollar
Currency exposure
Closingexchange
rateUS cents
Effecton net
earningsUS$m
Of whichamount
impactingunderlyingearnings
US$m
Netimpact
on equityUS$m
Australian dollar 82 (855) 27 5
Canadian dollar 86 (1,537) 22 (1)
Euro 122 48 (16) –New Zealand dollar 78 28 – –
148 riotinto.com
For
per
sona
l use
onl
y
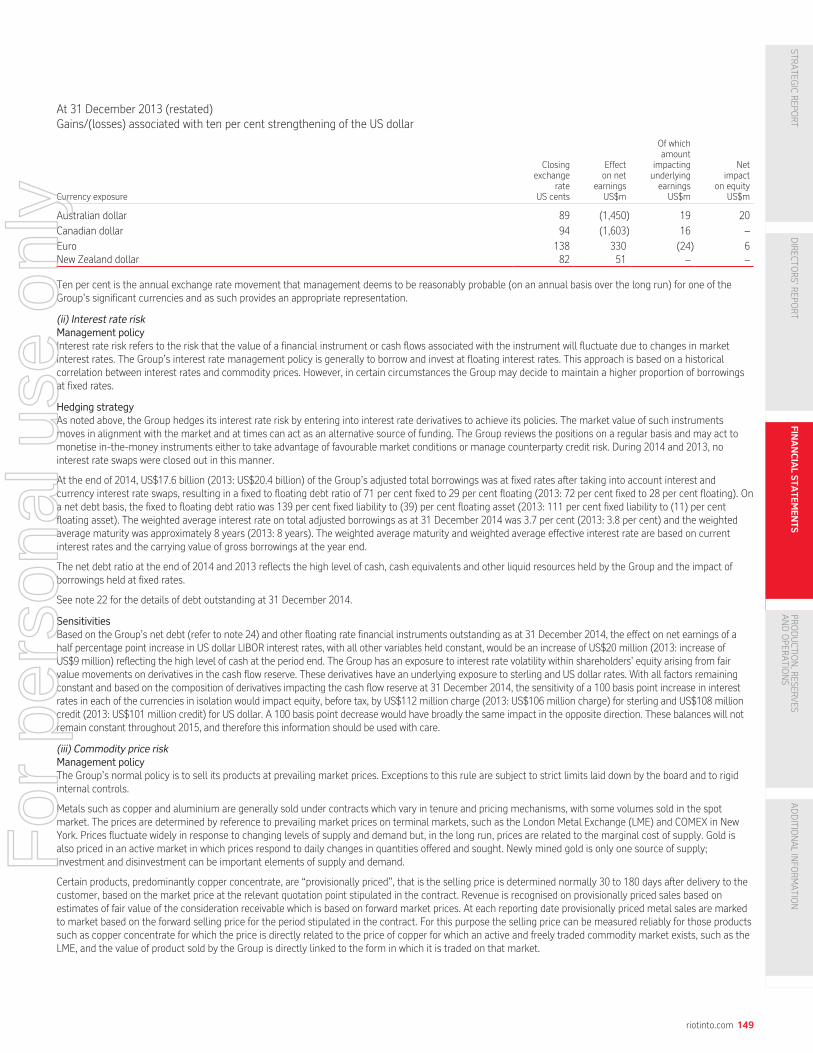
At 31 December 2013 (restated)Gains/(losses) associated with ten per cent strengthening of the US dollar
Currency exposure
Closingexchange
rateUS cents
Effecton net
earningsUS$m
Of whichamount
impactingunderlyingearnings
US$m
Netimpact
on equityUS$m
Australian dollar 89 (1,450) 19 20
Canadian dollar 94 (1,603) 16 –
Euro 138 330 (24) 6New Zealand dollar 82 51 – –
Ten per cent is the annual exchange rate movement that management deems to be reasonably probable (on an annual basis over the long run) for one of theGroup’s significant currencies and as such provides an appropriate representation.
(ii) Interest rate riskManagement policyInterest rate risk refers to the risk that the value of a financial instrument or cash flows associated with the instrument will fluctuate due to changes in marketinterest rates. The Group’s interest rate management policy is generally to borrow and invest at floating interest rates. This approach is based on a historicalcorrelation between interest rates and commodity prices. However, in certain circumstances the Group may decide to maintain a higher proportion of borrowingsat fixed rates.
Hedging strategyAs noted above, the Group hedges its interest rate risk by entering into interest rate derivatives to achieve its policies. The market value of such instrumentsmoves in alignment with the market and at times can act as an alternative source of funding. The Group reviews the positions on a regular basis and may act tomonetise in-the-money instruments either to take advantage of favourable market conditions or manage counterparty credit risk. During 2014 and 2013, nointerest rate swaps were closed out in this manner.
At the end of 2014, US$17.6 billion (2013: US$20.4 billion) of the Group’s adjusted total borrowings was at fixed rates after taking into account interest andcurrency interest rate swaps, resulting in a fixed to floating debt ratio of 71 per cent fixed to 29 per cent floating (2013: 72 per cent fixed to 28 per cent floating). Ona net debt basis, the fixed to floating debt ratio was 139 per cent fixed liability to (39) per cent floating asset (2013: 111 per cent fixed liability to (11) per centfloating asset). The weighted average interest rate on total adjusted borrowings as at 31 December 2014 was 3.7 per cent (2013: 3.8 per cent) and the weightedaverage maturity was approximately 8 years (2013: 8 years). The weighted average maturity and weighted average effective interest rate are based on currentinterest rates and the carrying value of gross borrowings at the year end.
The net debt ratio at the end of 2014 and 2013 reflects the high level of cash, cash equivalents and other liquid resources held by the Group and the impact ofborrowings held at fixed rates.
See note 22 for the details of debt outstanding at 31 December 2014.
SensitivitiesBased on the Group’s net debt (refer to note 24) and other floating rate financial instruments outstanding as at 31 December 2014, the effect on net earnings of ahalf percentage point increase in US dollar LIBOR interest rates, with all other variables held constant, would be an increase of US$20 million (2013: increase ofUS$9 million) reflecting the high level of cash at the period end. The Group has an exposure to interest rate volatility within shareholders’ equity arising from fairvalue movements on derivatives in the cash flow reserve. These derivatives have an underlying exposure to sterling and US dollar rates. With all factors remainingconstant and based on the composition of derivatives impacting the cash flow reserve at 31 December 2014, the sensitivity of a 100 basis point increase in interestrates in each of the currencies in isolation would impact equity, before tax, by US$112 million charge (2013: US$106 million charge) for sterling and US$108 millioncredit (2013: US$101 million credit) for US dollar. A 100 basis point decrease would have broadly the same impact in the opposite direction. These balances will notremain constant throughout 2015, and therefore this information should be used with care.
(iii) Commodity price riskManagement policyThe Group’s normal policy is to sell its products at prevailing market prices. Exceptions to this rule are subject to strict limits laid down by the board and to rigidinternal controls.
Metals such as copper and aluminium are generally sold under contracts which vary in tenure and pricing mechanisms, with some volumes sold in the spotmarket. The prices are determined by reference to prevailing market prices on terminal markets, such as the London Metal Exchange (LME) and COMEX in NewYork. Prices fluctuate widely in response to changing levels of supply and demand but, in the long run, prices are related to the marginal cost of supply. Gold isalso priced in an active market in which prices respond to daily changes in quantities offered and sought. Newly mined gold is only one source of supply;investment and disinvestment can be important elements of supply and demand.
Certain products, predominantly copper concentrate, are “provisionally priced”, that is the selling price is determined normally 30 to 180 days after delivery to thecustomer, based on the market price at the relevant quotation point stipulated in the contract. Revenue is recognised on provisionally priced sales based onestimates of fair value of the consideration receivable which is based on forward market prices. At each reporting date provisionally priced metal sales are markedto market based on the forward selling price for the period stipulated in the contract. For this purpose the selling price can be measured reliably for those productssuch as copper concentrate for which the price is directly related to the price of copper for which an active and freely traded commodity market exists, such as theLME, and the value of product sold by the Group is directly linked to the form in which it is traded on that market.
riotinto.com 149
STRATEG
ICREPO
RT
DIRECTO
RS’R
EPORT
FIN
AN
CIA
LS
TA
TE
ME
NT
SPR
ODUCTIO
N,R
ESERVES
ANDOPER
ATIO
NS
ADDITIO
NALINFO
RMATIO
N
For
per
sona
l use
onl
y
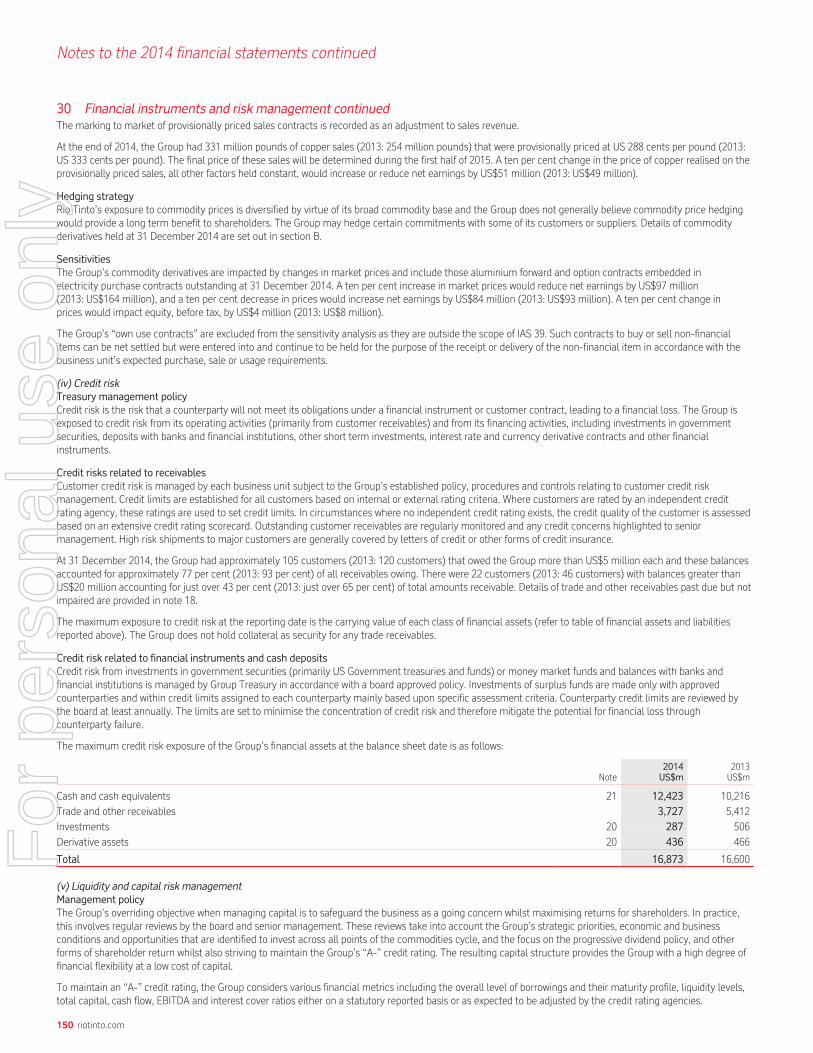
Notes to the 2014 financial statements continued
30 Financial instruments and risk management continuedThe marking to market of provisionally priced sales contracts is recorded as an adjustment to sales revenue.
At the end of 2014, the Group had 331 million pounds of copper sales (2013: 254 million pounds) that were provisionally priced at US 288 cents per pound (2013:US 333 cents per pound). The final price of these sales will be determined during the first half of 2015. A ten per cent change in the price of copper realised on theprovisionally priced sales, all other factors held constant, would increase or reduce net earnings by US$51 million (2013: US$49 million).
Hedging strategyRio Tinto’s exposure to commodity prices is diversified by virtue of its broad commodity base and the Group does not generally believe commodity price hedgingwould provide a long term benefit to shareholders. The Group may hedge certain commitments with some of its customers or suppliers. Details of commodityderivatives held at 31 December 2014 are set out in section B.
SensitivitiesThe Group’s commodity derivatives are impacted by changes in market prices and include those aluminium forward and option contracts embedded inelectricity purchase contracts outstanding at 31 December 2014. A ten per cent increase in market prices would reduce net earnings by US$97 million(2013: US$164 million), and a ten per cent decrease in prices would increase net earnings by US$84 million (2013: US$93 million). A ten per cent change inprices would impact equity, before tax, by US$4 million (2013: US$8 million).
The Group’s “own use contracts” are excluded from the sensitivity analysis as they are outside the scope of IAS 39. Such contracts to buy or sell non-financialitems can be net settled but were entered into and continue to be held for the purpose of the receipt or delivery of the non-financial item in accordance with thebusiness unit’s expected purchase, sale or usage requirements.
(iv) Credit riskTreasury management policyCredit risk is the risk that a counterparty will not meet its obligations under a financial instrument or customer contract, leading to a financial loss. The Group isexposed to credit risk from its operating activities (primarily from customer receivables) and from its financing activities, including investments in governmentsecurities, deposits with banks and financial institutions, other short term investments, interest rate and currency derivative contracts and other financialinstruments.
Credit risks related to receivablesCustomer credit risk is managed by each business unit subject to the Group’s established policy, procedures and controls relating to customer credit riskmanagement. Credit limits are established for all customers based on internal or external rating criteria. Where customers are rated by an independent creditrating agency, these ratings are used to set credit limits. In circumstances where no independent credit rating exists, the credit quality of the customer is assessedbased on an extensive credit rating scorecard. Outstanding customer receivables are regularly monitored and any credit concerns highlighted to seniormanagement. High risk shipments to major customers are generally covered by letters of credit or other forms of credit insurance.
At 31 December 2014, the Group had approximately 105 customers (2013: 120 customers) that owed the Group more than US$5 million each and these balancesaccounted for approximately 77 per cent (2013: 93 per cent) of all receivables owing. There were 22 customers (2013: 46 customers) with balances greater thanUS$20 million accounting for just over 43 per cent (2013: just over 65 per cent) of total amounts receivable. Details of trade and other receivables past due but notimpaired are provided in note 18.
The maximum exposure to credit risk at the reporting date is the carrying value of each class of financial assets (refer to table of financial assets and liabilitiesreported above). The Group does not hold collateral as security for any trade receivables.
Credit risk related to financial instruments and cash depositsCredit risk from investments in government securities (primarily US Government treasuries and funds) or money market funds and balances with banks andfinancial institutions is managed by Group Treasury in accordance with a board approved policy. Investments of surplus funds are made only with approvedcounterparties and within credit limits assigned to each counterparty mainly based upon specific assessment criteria. Counterparty credit limits are reviewed bythe board at least annually. The limits are set to minimise the concentration of credit risk and therefore mitigate the potential for financial loss throughcounterparty failure.
The maximum credit risk exposure of the Group’s financial assets at the balance sheet date is as follows:
Note2014US$m
2013US$m
Cash and cash equivalents 21 12,423 10,216
Trade and other receivables 3,727 5,412
Investments 20 287 506
Derivative assets 20 436 466
Total 16,873 16,600
(v) Liquidity and capital risk managementManagement policyThe Group’s overriding objective when managing capital is to safeguard the business as a going concern whilst maximising returns for shareholders. In practice,this involves regular reviews by the board and senior management. These reviews take into account the Group’s strategic priorities, economic and businessconditions and opportunities that are identified to invest across all points of the commodities cycle, and the focus on the progressive dividend policy, and otherforms of shareholder return whilst also striving to maintain the Group’s “A-” credit rating. The resulting capital structure provides the Group with a high degree offinancial flexibility at a low cost of capital.
To maintain an “A-” credit rating, the Group considers various financial metrics including the overall level of borrowings and their maturity profile, liquidity levels,total capital, cash flow, EBITDA and interest cover ratios either on a statutory reported basis or as expected to be adjusted by the credit rating agencies.
150 riotinto.com
For
per
sona
l use
onl
y

The Group’s total capital, which is defined as equity attributable to owners of Rio Tinto plus equity attributable to non-controlling interests plus net debt, amountedto US$67.1 billion at 31 December 2014 (2013: US$71.6 billion).
Total capital2014US$m
2013US$m
Equity attributable to owners of Rio Tinto (see Group balance sheet) 46,285 45,886
Equity attributable to non-controlling interests (see Group balance sheet) 8,309 7,616
Net debt (note 24) 12,495 18,055
Total capital 67,089 71,557
Net debt is a measure used by management and the board of directors to manage the Group’s capital structure and liquidity risks and therefore is linked to theGroup’s financial and operational excellence strategic driver. It is also used to manage the Group’s interest rate risks and foreign exchange risks on borrowings andcash. Net debt is disclosed and defined in note 24. Net debt decreased from US$18.1 billion at 31 December 2013 to US$12.5 billion at 31 December 2014 asoperating cash inflows, working capital improvements and divestment proceeds were partly offset by outflows relating to capital expenditure and the increase inthe dividend. At 31 December 2014 net debt to total capital was 19 per cent (2013: 25 per cent) and interest cover was 13 times (2013: 13 times).
The unified credit status of the Group is maintained through cross guarantees whereby contractual obligations of Rio Tinto plc and Rio Tinto Limited areautomatically guaranteed by the other. The table below summarises the credit ratings attributed to the Group as at 31 December.
2014 2013
Standard & Poor’s (S&P)
Long term rating A- A-
Short term rating A-2 A-2
Outlook (a) Stable Negative
Moody’s
Long term rating A3 A3
Short term rating P-2 P-2
Outlook Stable Stable
(a) On 27 February 2014, S&P revised its Rio Tinto outlook to ‘stable’.
The Group has access to various forms of financing including its US Shelf Programme, European Debt Issuance Programme, Commercial Paper and creditfacilities. The Group did not issue any listed debt in 2014 under the various finance programmes listed. In June 2013, under its US Shelf Programme, the Groupissued four Rio Tinto Finance (USA) Plc bonds: US$1,000 million 1.375% bond due 2016, US$1,250 million 2.250% bond due 2018, US$250 million LIBOR plus0.55% bond due 2015 and US$500 million LIBOR plus 0.840% bond due 2016.
Rio Tinto Finance plc and Rio Tinto Finance Limited entered into new facility agreements for the aggregate amount of US$7.5 billion on 15 November 2013 asborrowers with a syndicate of banks. The facilities are guaranteed by Rio Tinto plc and Rio Tinto Limited. The facilities comprise a US$1,875 million three-yearmulti-currency revolving credit facility and a US$5,625 million five-year multi-currency revolving credit facility (including a US$ denominated same day accessswing-line facility). Both facilities have been extended for one year on the first anniversary and can be extended for a further year on the second anniversary of thedate of the facility agreements by mutual agreement of the parties to the agreement. The funds made available under the facility agreements may be used for thegeneral corporate purposes of the Group. The new facilities replaced the US$6 billion multi-currency revolving credit facility dated 12 November 2010 and theUS$2 billion bilateral bank facility agreements entered in the last quarter of 2012 which were closed out on 15 November 2013.
Advances under the revolving facilities bear an interest rate per annum based on LIBOR (or EURIBOR, CDOR or BBSW) in relation to any euro, Canadian dollar orAustralian dollar loans, respectively plus a margin (which is dependent on the Group’s long-term credit rating as determined by Moody’s and Standard & Poor’sand the level of drawdown). The facility agreements contain no financial covenants. At 31 December 2014, the facilities were undrawn.
During the last quarter of 2012, the Group entered into bilateral bank facility agreements amounting to US$2 billion in aggregate. The facilities were denominatedin US dollars and had a term of one year that was extendable, at the Group’s option, by a further 364 days. Any borrowings under either facility were at prevailingLIBOR rates plus an agreed margin dependent on the amount of drawdown and the credit rating of the Group. The facilities were not subject to financial covenants.The facilities were undrawn and closed out on 15 November 2013.
In November 2010, the Group entered into a US$6 billion multi-currency committed revolving credit facility maturing in November 2015 with its relationship banks.Any borrowings under this facility were at prevailing LIBOR rates plus an agreed margin dependent on the amount of drawdown and the credit rating of the Group.The facility was not subject to any financial covenants. The overall agreement also enabled same day access to a US$ swing-line facility. The funds available underthe facility agreement could have been used for general corporate purposes of the Group. The facility was undrawn and closed out on 15 November 2013.
Further details of the Group’s credit facilities are set out in note 22.
riotinto.com 151
STRATEG
ICREPO
RT
DIRECTO
RS’R
EPORT
FIN
AN
CIA
LS
TA
TE
ME
NT
SPR
ODUCTIO
N,R
ESERVES
ANDOPER
ATIO
NS
ADDITIO
NALINFO
RMATIO
N
For
per
sona
l use
onl
y

Notes to the 2014 financial statements continued
30 Financial instruments and risk management continuedA (c) Financial liability analysisThe table below analyses the Group’s financial liabilities by relevant maturity groupings based on the remaining period from the balance sheet date to thecontractual maturity date. As the amounts disclosed in the table are the contractual undiscounted cash flows, these balances will not necessarily agree with theamounts disclosed in the balance sheet.
At 31 December 2014
(Outflows)/inflows
Within 1year or ondemandUS$m
Between1 and 2yearsUS$m
Between2 and 3yearsUS$m
Between3 and 4yearsUS$m
Between4 and 5yearsUS$m
After5 yearsUS$m
TotalUS$m
Non-derivative financial liabilities
Trade and other payables (5,640) (515) – – – – (6,155)
Borrowings before swaps (2,664) (2,868) (1,973) (3,139) (1,524) (12,535) (24,703)
Expected future interest payments (a) (927) (883) (838) (816) (608) (5,492) (9,564)
Other financial liabilities (49) (67) (3) (1) – – (120)
Derivative financial liabilities (b)
Derivatives related to net debt – gross settled (a):
gross inflows 36 36 36 36 36 1,614 1,794
gross outflows (28) (28) (28) (28) (28) (1,705) (1,845)
Derivatives not related to net debt – net settled (11) (8) – (1) – – (20)
Derivatives not related to net debt – gross settled:
gross inflows 423 – – – – – 423
gross outflows (423) – – – – – (423)
Total (9,283) (4,333) (2,806) (3,949) (2,124) (18,118) (40,613)
At 31 December 2013
(Outflows)/inflows
Within 1year or ondemandUS$m
Between1 and 2yearsUS$m
Between2 and 3yearsUS$m
Between3 and 4yearsUS$m
Between4 and 5yearsUS$m
After5 yearsUS$m
TotalUS$m
Non-derivative financial liabilities
Trade and other payables (6,585) (314) – – – – (6,899)
Borrowings before swaps (4,011) (1,926) (2,844) (1,984) (3,022) (14,684) (28,471)
Expected future interest payments (a) (1,007) (928) (889) (857) (804) (6,164) (10,649)
Other financial liabilities (39) (67) (18) – (1) (1) (126)
Derivative financial liabilities (b)
Derivatives related to net debt – net settled (a) (b) – – – – – (5) (5)
Derivatives related to net debt – gross settled (a):
gross inflows 516 20 20 20 20 797 1,393
gross outflows (510) (12) (12) (12) (12) (720) (1,278)
Total (11,636) (3,227) (3,743) (2,833) (3,819) (20,777) (46,035)
(a) Interest payments have been projected using interest rates at the end of the applicable financial year. Where debt is subject to variable interest rates, future interest payments aresubject to change in line with market rates.
(b) The maturity grouping is based on the earliest payment date.
(c) The maximum carrying value of borrowings repayable, after the impact of swaps, maturing in any financial year is US$3.3 billion (2013: US$3.2 billion).
Offsetting and enforceable master netting agreementsFinancial assets and liabilities are offset and the net amount reported in the consolidated balance sheet when there is a legally enforceable right to offset therecognised amounts and there is an intention to settle on a net basis or realise the asset and settle the liability simultaneously. There were no material amountsoffset in the balance sheet and no material enforceable master netting agreements were identified.
152 riotinto.com
For
per
sona
l use
onl
y
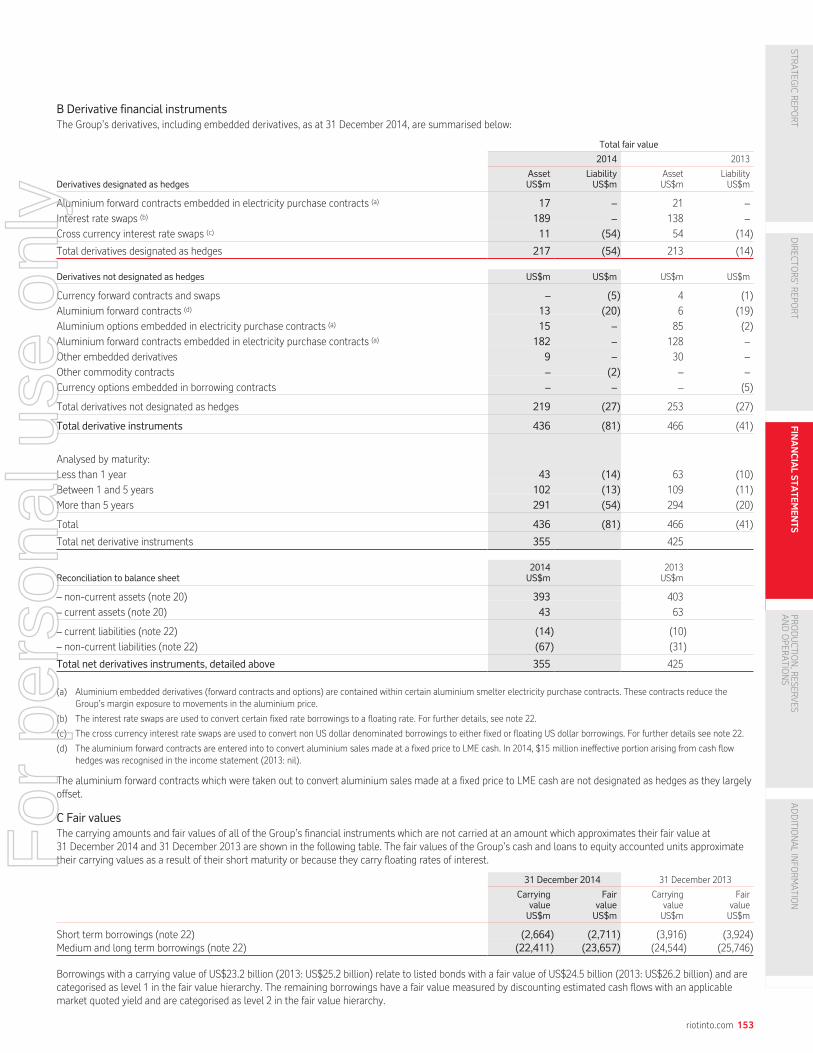
B Derivative financial instrumentsThe Group’s derivatives, including embedded derivatives, as at 31 December 2014, are summarised below:
Total fair value
2014 2013
Derivatives designated as hedgesAssetUS$m
LiabilityUS$m
AssetUS$m
LiabilityUS$m
Aluminium forward contracts embedded in electricity purchase contracts (a) 17 – 21 –
Interest rate swaps (b) 189 – 138 –
Cross currency interest rate swaps (c) 11 (54) 54 (14)
Total derivatives designated as hedges 217 (54) 213 (14)
Derivatives not designated as hedges US$m US$m US$m US$m
Currency forward contracts and swaps – (5) 4 (1)
Aluminium forward contracts (d) 13 (20) 6 (19)
Aluminium options embedded in electricity purchase contracts (a) 15 – 85 (2)
Aluminium forward contracts embedded in electricity purchase contracts (a) 182 – 128 –
Other embedded derivatives 9 – 30 –
Other commodity contracts – (2) – –
Currency options embedded in borrowing contracts – – – (5)
Total derivatives not designated as hedges 219 (27) 253 (27)
Total derivative instruments 436 (81) 466 (41)
Analysed by maturity:
Less than 1 year 43 (14) 63 (10)
Between 1 and 5 years 102 (13) 109 (11)
More than 5 years 291 (54) 294 (20)
Total 436 (81) 466 (41)
Total net derivative instruments 355 425
Reconciliation to balance sheet2014US$m
2013US$m
– non-current assets (note 20) 393 403
– current assets (note 20) 43 63
– current liabilities (note 22) (14) (10)
– non-current liabilities (note 22) (67) (31)
Total net derivatives instruments, detailed above 355 425
(a) Aluminium embedded derivatives (forward contracts and options) are contained within certain aluminium smelter electricity purchase contracts. These contracts reduce theGroup’s margin exposure to movements in the aluminium price.
(b) The interest rate swaps are used to convert certain fixed rate borrowings to a floating rate. For further details, see note 22.
(c) The cross currency interest rate swaps are used to convert non US dollar denominated borrowings to either fixed or floating US dollar borrowings. For further details see note 22.
(d) The aluminium forward contracts are entered into to convert aluminium sales made at a fixed price to LME cash. In 2014, $15 million ineffective portion arising from cash flowhedges was recognised in the income statement (2013: nil).
The aluminium forward contracts which were taken out to convert aluminium sales made at a fixed price to LME cash are not designated as hedges as they largelyoffset.
C Fair valuesThe carrying amounts and fair values of all of the Group’s financial instruments which are not carried at an amount which approximates their fair value at31 December 2014 and 31 December 2013 are shown in the following table. The fair values of the Group’s cash and loans to equity accounted units approximatetheir carrying values as a result of their short maturity or because they carry floating rates of interest.
31 December 2014 31 December 2013
CarryingvalueUS$m
FairvalueUS$m
CarryingvalueUS$m
FairvalueUS$m
Short term borrowings (note 22) (2,664) (2,711) (3,916) (3,924)Medium and long term borrowings (note 22) (22,411) (23,657) (24,544) (25,746)
Borrowings with a carrying value of US$23.2 billion (2013: US$25.2 billion) relate to listed bonds with a fair value of US$24.5 billion (2013: US$26.2 billion) and arecategorised as level 1 in the fair value hierarchy. The remaining borrowings have a fair value measured by discounting estimated cash flows with an applicablemarket quoted yield and are categorised as level 2 in the fair value hierarchy.
riotinto.com 153
STRATEG
ICREPO
RT
DIRECTO
RS’R
EPORT
FIN
AN
CIA
LS
TA
TE
ME
NT
SPR
ODUCTIO
N,R
ESERVES
ANDOPER
ATIO
NS
ADDITIO
NALINFO
RMATIO
N
For
per
sona
l use
onl
y

Notes to the 2014 financial statements continued
30 Financial instruments and risk management continuedC (a) Valuation hierarchyThe table below shows the financial instruments carried at fair value by valuation method at 31 December 2014:
Total Level 1(a) Level 2(b) Level 3(c)Not held
at fair value
Assets
Equity shares and quoted funds (note 20) 199 56 85 12 46
Other investments, including loans (d) (note 20) 287 108 – 56 123
Trade receivables (e) 2,488 12 – – 2,476
2,974 176 85 68 2,645
Derivatives (f)
Forward contracts: designated as hedges (Section B) 17 – – 17 –
Forward contracts and option contracts, not designated as hedges (Section B) 192 (2) (3) 197 –
Derivatives related to net debt (Section B) 146 – 146 – –
3,329 174 228 282 2,645
The table below shows the financial instruments carried at fair value by valuation method at 31 December 2013:
Total Level 1(a) Level 2(b) Level 3(c)Not held
at fair value
Assets
Equity shares and quoted funds (note 20) 279 139 79 15 46
Other investments, including loans (d) (note 20) 506 106 1 215 184
785 245 80 230 230
Derivatives (f)
Forward contracts: designated as hedges (Section B) 21 – – 21 –
Forward contracts and option contracts, not designated as hedges (Section B) 231 2 19 210 –
Derivatives related to net debt (Section B) 173 – 173 – –
1,210 247 272 461 230
(a) Valuation is based on unadjusted quoted prices in active markets for identical financial instruments. This category includes listed equity shares and other quoted funds.
(b) Valuation is based on inputs that are observable for the financial instruments which includes quoted prices for similar instruments or identical instruments in markets which arenot considered to be active, or inputs, either directly or indirectly based on observable market data.
(c) Valuation is based on inputs for the asset or liability that are not based on observable market data (unobservable inputs).
(d) Other investments, including loans, comprise: cash deposits in rehabilitation funds, government bonds and royalty amounts receivable. The royalty receivables are valued basedon an estimate of forward sales subject to the royalty agreement.
(e) Trade receivables includes provisionally priced receivables relating to sales contracts where selling price is determined after delivery to the customer, based on the market price atthe relevant quotation point stipulated in the contract. Revenue is recognised on provisionally priced sales based on the forward selling price for the period stipulated in thecontract. Not included within the balance above are provisionally priced trade payables of US$24 million, wherein the fair value of the expected final price has fallen below theinitial consideration received.
(f) Level 3 derivatives consist of derivatives embedded in electricity purchase contracts linked to the LME with terms expiring between 2015 and 2030 (2013: 2014 and 2040).The embedded derivatives are measured using discounted cash flows and option model valuation techniques. Long-term embedded derivatives with a fair value of US$196 millionat 31 December 2014 (2013: US$196 million) are valued using significant unobservable inputs as the term of the derivative extends beyond the forward curve for alumnium.
Aluminium prices are flatlined beyond the market forward curve and increased by projected inflation up to the date of expiry of the contract. The range of market prices areUS$2,320 per metric tonne in 2025 to US$2,578 in 2030 (2013: US$2,413 per metric tonne in 2024 to US$3,157 in 2040).
The other contracts with a fair value of US$18 million at 31 December 2014 (2013: US$35 million) are categorised as level three as the market premium assumptions usedrepresent unobservable inputs.
(g) Interest rate and currency interest rate swaps are valued using applicable market quoted swap yield curves adjusted for relevant basis and credit default spreads. Currency interestrate swap valuations also use market quoted foreign exchange rates. A discounted cash flow approach is applied to the cash flows derived from the inputs to determine fair value.
(h) There were no transfers between Level 1 and Level 2, or between Level 2 and Level 3 in the year ended 31 December 2014 or the year ended 31 December 2013.
154 riotinto.com
For
per
sona
l use
onl
y

C (b) Level 3 Financial assets and Financial liabilitiesThe table below shows the summary of changes in the fair value of the Group’s Level 3 financial assets and financial liabilities for the year ended 31 December2014 and 31 December 2013.
31 December 2014Level 3 financial assetsand financial liabilities
31 December 2013Level 3 financial assetsand financial liabilities
Opening balance 461 189
Currency translation adjustments (17) (8)
Total realised (losses) or gains included in:
– Consolidated sales revenue – (20)
– Net operating costs (8) 150
Total unrealised gains or (losses) included in:
– Consolidated sales revenue – 2
– Net operating costs 18 127
Total unrealised (losses) or gains transferred into other comprehensive income (5) 21
Additions 8 –
Disposals/maturity of financial instruments (175) –
Closing balance 282 461
Total (losses)/gains for the year included in the income statement for assets and liabilities heldat year end (11) 130
Sensitivity analysis in respect of Level 3 derivativesForward contracts and options whose carrying value are valued using unobservable inputs are calculated using appropriate discounted cashflow and option modelvaluation techniques. The most significant of these assumptions relate to long term pricing wherein internal pricing assumptions are used after the ten year LMEcurve. A ten per cent increase in long termmetal pricing assumptions would result in a US$39 million (31 December 2013: US$165 million) decrease in carryingvalue. A ten per cent decrease in long termmetal pricing assumptions would result in a US$71 million (31 December 2013: US$94 million) increase in carrying value.
31 Contingencies and commitments
2014US$m
2013US$m
Capital commitments excluding the Group’s share of Joint Venture Capital Commitments
Within 1 year 1,838 5,098
Between 1 and 3 years 96 364
Between 3 and 5 years 23 6
After 5 years 30 31
Total 1,987 5,499
Group’s share of Joint Venture Capital Commitments
Within 1 year 782 831
Between 1 and 3 years 331 789
Between 3 and 5 years – 127
After 5 years – –
Total 1,113 1,747
Unrecognised commitments to contribute funding or resources to joint venturesFor Minera Escondida Limitada and Sohar Aluminium Company L.L.C. the Group, along with the other joint venturers, has made various commitments to provideshareholder funding as required, subject to approved thresholds. In particular, Minera Escondida Limitada holds a shareholder line of credit for US$225 million(Rio Tinto share) which is currently undrawn. This line of credit was also available in 2013.
The Group has a commitment to purchase and market a portion (which may be different to the Group’s ownership interest) of the output of Sohar AluminiumCompany LLC, an aluminium smelter in which the Group is a joint venturer. The Group subsequently sells the purchased products to third parties.
Operating leasesThe aggregate amount of minimum lease payments under non-cancellable operating leases are as follows:
2014US$m
2013US$m
Within 1 year 429 439
Between 1 and 3 years 690 667
Between 3 and 5 years 460 540
After 5 years 766 832
Total 2,345 2,478
riotinto.com 155
STRATEG
ICREPO
RT
DIRECTO
RS’R
EPORT
FIN
AN
CIA
LS
TA
TE
ME
NT
SPR
ODUCTIO
N,R
ESERVES
ANDOPER
ATIO
NS
ADDITIO
NALINFO
RMATIO
N
For
per
sona
l use
onl
y

Notes to the 2014 financial statements continued
31 Contingencies and commitments continuedPurchase obligationsThe aggregate amount of future payment commitments under purchase obligations outstanding at 31 December was:
2014US$m
2013US$m
Within 1 year 2,912 3,178
Between 1 and 2 years 2,434 2,434
Between 2 and 3 years 2,026 2,202
Between 3 and 4 years 1,660 1,865
Between 4 and 5 years 1,479 1,743
After 5 years 19,572 14,359
Total 30,083 25,781
Purchase obligations are agreements to purchase goods or services that are enforceable and legally binding and specify all significant terms, including: fixed orminimum quantities to be purchased; fixed, minimum or variable price provisions; and the approximate timing of the transactions. Purchase obligations betweensubsidiaries and joint arrangements are included to the extent that they relate to other venturers.
2014US$m
2013US$m
Contingent liabilities (subsidiaries and joint operations)Indemnities and other performance guarantees (a) (b) 239 489
(a) Indemnities and other performance guarantees represent the potential outflow of funds from the Group for the satisfaction of obligations including those under contractualarrangements (for example undertakings related to supplier agreements) not provided for in the balance sheet, where the likelihood of the guarantees or indemnities being calledis assessed as possible rather than probable or remote.
(b) There were no material contingent liabilities arising in relation to the Group’s joint ventures and associates.
There are a number of legal claims currently outstanding against the Group. No material loss to the Group is expected to result from these claims.
Guarantees by parent companiesRio Tinto plc and Rio Tinto Limited have, jointly and severally, fully and unconditionally guaranteed the following securities issued by wholly owned financesubsidiaries: US$18.5 billion (31 December 2013: US$20.5 billion) Rio Tinto Finance (USA) Limited and Rio Tinto Finance (USA) plc Bonds with maturity dates up to2042; US$nil (31 December 2013: US$157 million) Rio Tinto America Inc Commercial Paper; and US$2.3 billion (31 December 2013: US$2.5 billion) on theEuropean Debt Issuance Programme. In addition, Rio Tinto Finance plc and Rio Tinto Finance Limited have entered into facility arrangements for an aggregateamount of US$7.5 billion (31 December 2013: US$7.5 billion); the facilities are guaranteed by Rio Tinto plc and Rio Tinto Limited.
Contingent assetsThe Group has various insurance claims outstanding with reinsurers including claims relating to the Manefay slide at Kennecott Utah Copper in April 2013.An interim progress payment was received on this claim in 2013. Further receipts are considered probable but the amount cannot currently be reliably estimated.
32 Average number of employees
Subsidiaries and jointoperations
Equity accounted units(Rio Tinto share)(a) Group total
2014 2013 2012 2014 2013 2012 2014 2013 2012
The principal locations of employment were:
Australia and New Zealand 23,447 24,740 25,301 711 749 808 24,158 25,489 26,109
Canada 12,187 12,830 13,688 – – – 12,187 12,830 13,688
Europe 3,499 4,210 5,760 88 2,427 3,184 3,587 6,637 8,944
Africa 5,699 6,787 7,055 1,560 1,505 2,226 7,259 8,292 9,281
United States 3,503 4,039 4,564 – 285 375 3,503 4,324 4,939
Mongolia 3,212 3,289 2,904 – – – 3,212 3,289 2,904
Indonesia 2,959 2,467 2,467 – – – 2,959 2,467 2,467
South America 356 511 235 1,509 1,409 1,307 1,865 1,920 1,542
Other countries 1,045 980 1,143 – 103 202 1,045 1,083 1,345
55,907 59,853 63,117 3,868 6,478 8,102 59,775 66,331 71,219
(a) Employee numbers, which represent the average for the year, include 100 per cent of employees of subsidiary companies. Employee numbers for joint operations and equityaccounted units are proportional to the Group’s interest under contractual agreements. Average employee numbers include a part year effect for companies acquired or disposedof during the year.
Part time employees are included on a full time equivalent basis. Temporary employees are included in employee numbers.
People employed by contractors are not included.
156 riotinto.com
For
per
sona
l use
onl
y
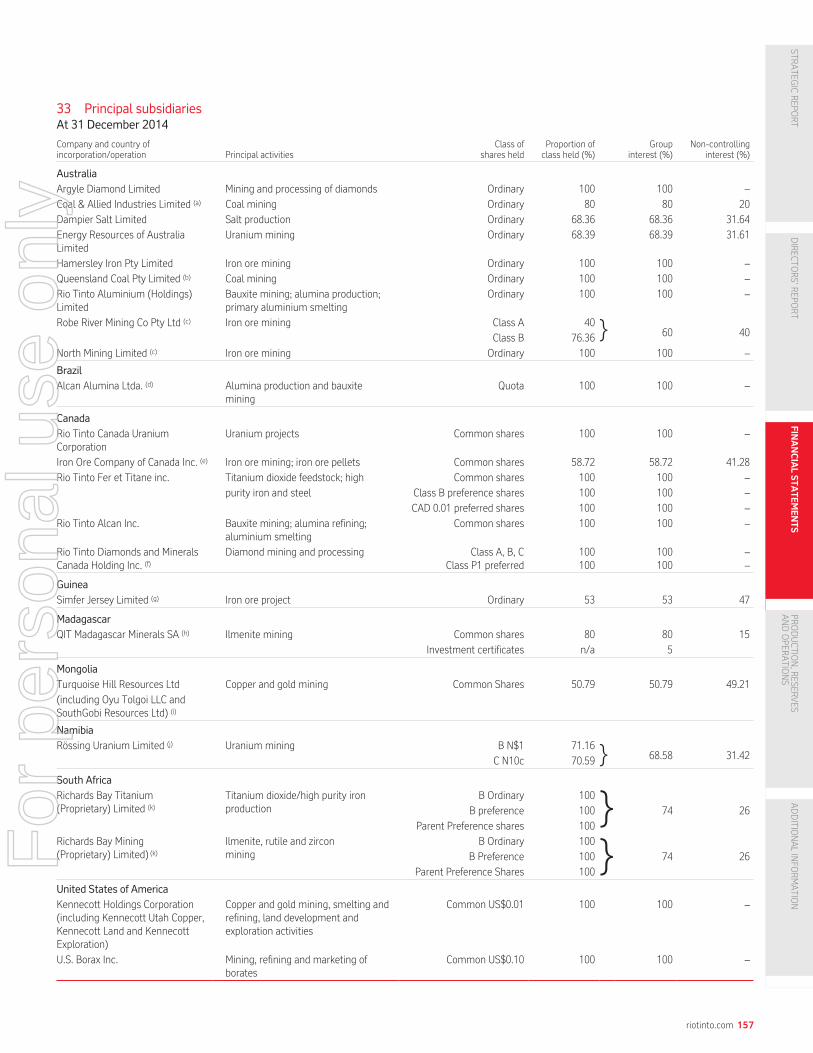
33 Principal subsidiariesAt 31 December 2014
Company and country ofincorporation/operation Principal activities
Class ofshares held
Proportion ofclass held (%)
Groupinterest (%)
Non-controllinginterest (%)
Australia
Argyle Diamond Limited Mining and processing of diamonds Ordinary 100 100 –
Coal & Allied Industries Limited (a) Coal mining Ordinary 80 80 20
Dampier Salt Limited Salt production Ordinary 68.36 68.36 31.64
Energy Resources of AustraliaLimited
Uranium mining Ordinary 68.39 68.39 31.61
Hamersley Iron Pty Limited Iron ore mining Ordinary 100 100 –
Queensland Coal Pty Limited (b) Coal mining Ordinary 100 100 –
Rio Tinto Aluminium (Holdings)Limited
Bauxite mining; alumina production;primary aluminium smelting
Ordinary 100 100 –
Robe River Mining Co Pty Ltd (c) Iron ore mining Class A 40 }Class B 76.36 60 40
North Mining Limited (c) Iron ore mining Ordinary 100 100 –
Brazil
Alcan Alumina Ltda. (d) Alumina production and bauxitemining
Quota 100 100 –
Canada
Rio Tinto Canada UraniumCorporation
Uranium projects Common shares 100 100 –
Iron Ore Company of Canada Inc. (e) Iron ore mining; iron ore pellets Common shares 58.72 58.72 41.28
Rio Tinto Fer et Titane inc. Titanium dioxide feedstock; high Common shares 100 100 –
purity iron and steel Class B preference shares 100 100 –
CAD 0.01 preferred shares 100 100 –
Rio Tinto Alcan Inc. Bauxite mining; alumina refining;aluminium smelting
Common shares 100 100 –
Rio Tinto Diamonds and MineralsCanada Holding Inc. (f)
Diamond mining and processing Class A, B, CClass P1 preferred
100100
100100
––
Guinea
Simfer Jersey Limited (g) Iron ore project Ordinary 53 53 47
Madagascar
QIT Madagascar Minerals SA (h) Ilmenite mining Common shares 80 80 15
Investment certificates n/a 5
Mongolia
Turquoise Hill Resources Ltd Copper and gold mining Common Shares 50.79 50.79 49.21
(including Oyu Tolgoi LLC andSouthGobi Resources Ltd) (i)
Namibia
Rössing Uranium Limited (j) Uranium mining B N$1 71.16 }C N10c 70.59 68.58 31.42
South Africa
Richards Bay Titanium(Proprietary) Limited (k)
Titanium dioxide/high purity ironproduction
B Ordinary 100}B preference 100 74 26
Parent Preference shares 100
Richards Bay Mining(Proprietary) Limited) (k)
Ilmenite, rutile and zirconmining
B Ordinary 100
}B Preference 100 74 26
Parent Preference Shares 100
United States of America
Kennecott Holdings Corporation(including Kennecott Utah Copper,Kennecott Land and KennecottExploration)
Copper and gold mining, smelting andrefining, land development andexploration activities
Common US$0.01 100 100 –
U.S. Borax Inc. Mining, refining and marketing ofborates
Common US$0.10 100 100 –
riotinto.com 157
STRATEG
ICREPO
RT
DIRECTO
RS’R
EPORT
FIN
AN
CIA
LS
TA
TE
ME
NT
SPR
ODUCTIO
N,R
ESERVES
ANDOPER
ATIO
NS
ADDITIO
NALINFO
RMATIO
N
For
per
sona
l use
onl
y
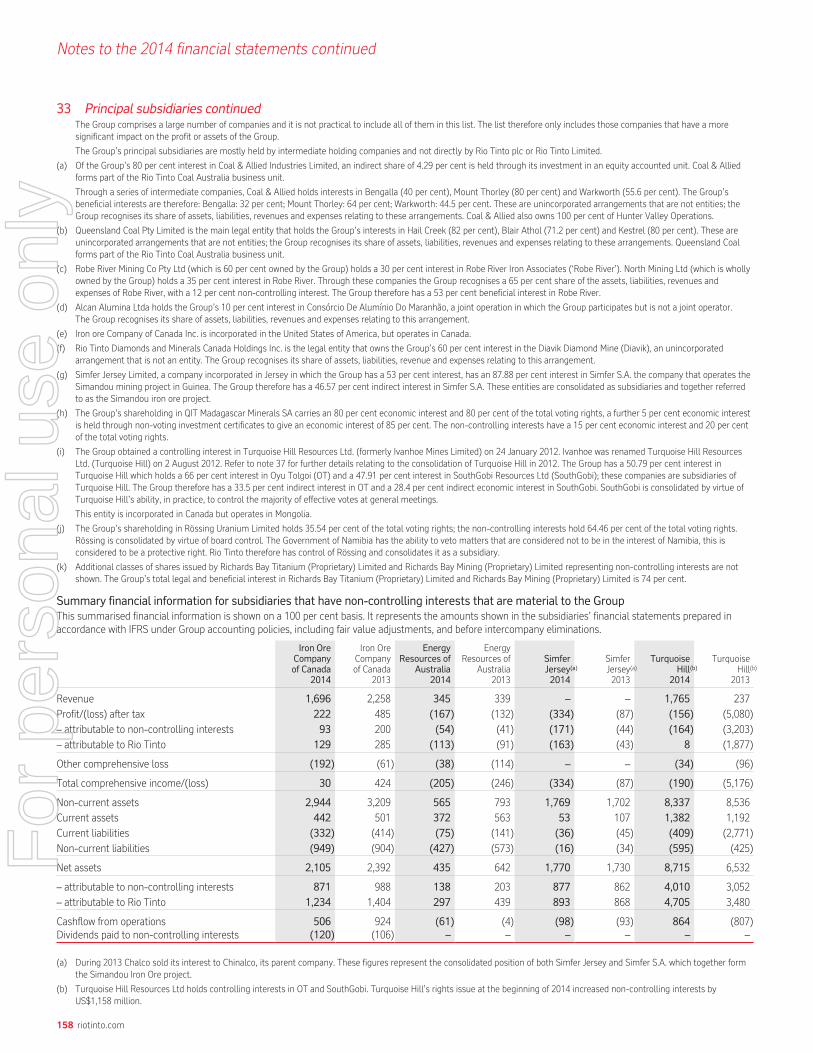
Notes to the 2014 financial statements continued
33 Principal subsidiaries continuedThe Group comprises a large number of companies and it is not practical to include all of them in this list. The list therefore only includes those companies that have a moresignificant impact on the profit or assets of the Group.
The Group’s principal subsidiaries are mostly held by intermediate holding companies and not directly by Rio Tinto plc or Rio Tinto Limited.
(a) Of the Group’s 80 per cent interest in Coal & Allied Industries Limited, an indirect share of 4.29 per cent is held through its investment in an equity accounted unit. Coal & Alliedforms part of the Rio Tinto Coal Australia business unit.
Through a series of intermediate companies, Coal & Allied holds interests in Bengalla (40 per cent), Mount Thorley (80 per cent) and Warkworth (55.6 per cent). The Group’sbeneficial interests are therefore: Bengalla: 32 per cent; Mount Thorley: 64 per cent; Warkworth: 44.5 per cent. These are unincorporated arrangements that are not entities; theGroup recognises its share of assets, liabilities, revenues and expenses relating to these arrangements. Coal & Allied also owns 100 per cent of Hunter Valley Operations.
(b) Queensland Coal Pty Limited is the main legal entity that holds the Group’s interests in Hail Creek (82 per cent), Blair Athol (71.2 per cent) and Kestrel (80 per cent). These areunincorporated arrangements that are not entities; the Group recognises its share of assets, liabilities, revenues and expenses relating to these arrangements. Queensland Coalforms part of the Rio Tinto Coal Australia business unit.
(c) Robe River Mining Co Pty Ltd (which is 60 per cent owned by the Group) holds a 30 per cent interest in Robe River Iron Associates (‘Robe River’). North Mining Ltd (which is whollyowned by the Group) holds a 35 per cent interest in Robe River. Through these companies the Group recognises a 65 per cent share of the assets, liabilities, revenues andexpenses of Robe River, with a 12 per cent non-controlling interest. The Group therefore has a 53 per cent beneficial interest in Robe River.
(d) Alcan Alumina Ltda holds the Group’s 10 per cent interest in Consórcio De Alumínio Do Maranhão, a joint operation in which the Group participates but is not a joint operator.The Group recognises its share of assets, liabilities, revenues and expenses relating to this arrangement.
(e) Iron ore Company of Canada Inc. is incorporated in the United States of America, but operates in Canada.
(f) Rio Tinto Diamonds and Minerals Canada Holdings Inc. is the legal entity that owns the Group’s 60 per cent interest in the Diavik Diamond Mine (Diavik), an unincorporatedarrangement that is not an entity. The Group recognises its share of assets, liabilities, revenue and expenses relating to this arrangement.
(g) Simfer Jersey Limited, a company incorporated in Jersey in which the Group has a 53 per cent interest, has an 87.88 per cent interest in Simfer S.A. the company that operates theSimandou mining project in Guinea. The Group therefore has a 46.57 per cent indirect interest in Simfer S.A. These entities are consolidated as subsidiaries and together referredto as the Simandou iron ore project.
(h) The Group’s shareholding in QIT Madagascar Minerals SA carries an 80 per cent economic interest and 80 per cent of the total voting rights, a further 5 per cent economic interestis held through non-voting investment certificates to give an economic interest of 85 per cent. The non-controlling interests have a 15 per cent economic interest and 20 per centof the total voting rights.
(i) The Group obtained a controlling interest in Turquoise Hill Resources Ltd. (formerly Ivanhoe Mines Limited) on 24 January 2012. Ivanhoe was renamed Turquoise Hill ResourcesLtd. (Turquoise Hill) on 2 August 2012. Refer to note 37 for further details relating to the consolidation of Turquoise Hill in 2012. The Group has a 50.79 per cent interest inTurquoise Hill which holds a 66 per cent interest in Oyu Tolgoi (OT) and a 47.91 per cent interest in SouthGobi Resources Ltd (SouthGobi); these companies are subsidiaries ofTurquoise Hill. The Group therefore has a 33.5 per cent indirect interest in OT and a 28.4 per cent indirect economic interest in SouthGobi. SouthGobi is consolidated by virtue ofTurquoise Hill’s ability, in practice, to control the majority of effective votes at general meetings.
This entity is incorporated in Canada but operates in Mongolia.
(j) The Group’s shareholding in Rössing Uranium Limited holds 35.54 per cent of the total voting rights; the non-controlling interests hold 64.46 per cent of the total voting rights.Rössing is consolidated by virtue of board control. The Government of Namibia has the ability to veto matters that are considered not to be in the interest of Namibia, this isconsidered to be a protective right. Rio Tinto therefore has control of Rössing and consolidates it as a subsidiary.
(k) Additional classes of shares issued by Richards Bay Titanium (Proprietary) Limited and Richards Bay Mining (Proprietary) Limited representing non-controlling interests are notshown. The Group’s total legal and beneficial interest in Richards Bay Titanium (Proprietary) Limited and Richards Bay Mining (Proprietary) Limited is 74 per cent.
Summary financial information for subsidiaries that have non-controlling interests that are material to the GroupThis summarised financial information is shown on a 100 per cent basis. It represents the amounts shown in the subsidiaries’ financial statements prepared inaccordance with IFRS under Group accounting policies, including fair value adjustments, and before intercompany eliminations.
Iron OreCompanyof Canada
2014
Iron OreCompanyof Canada
2013
EnergyResources of
Australia2014
EnergyResources of
Australia2013
SimferJersey(a)
2014
SimferJersey(a)2013
TurquoiseHill(b)
2014
TurquoiseHill(b)
2013
Revenue 1,696 2,258 345 339 – – 1,765 237
Profit/(loss) after tax 222 485 (167) (132) (334) (87) (156) (5,080)
– attributable to non-controlling interests 93 200 (54) (41) (171) (44) (164) (3,203)
– attributable to Rio Tinto 129 285 (113) (91) (163) (43) 8 (1,877)
Other comprehensive loss (192) (61) (38) (114) – – (34) (96)
Total comprehensive income/(loss) 30 424 (205) (246) (334) (87) (190) (5,176)
Non-current assets 2,944 3,209 565 793 1,769 1,702 8,337 8,536
Current assets 442 501 372 563 53 107 1,382 1,192
Current liabilities (332) (414) (75) (141) (36) (45) (409) (2,771)
Non-current liabilities (949) (904) (427) (573) (16) (34) (595) (425)
Net assets 2,105 2,392 435 642 1,770 1,730 8,715 6,532
– attributable to non-controlling interests 871 988 138 203 877 862 4,010 3,052
– attributable to Rio Tinto 1,234 1,404 297 439 893 868 4,705 3,480
Cashflow from operations 506 924 (61) (4) (98) (93) 864 (807)Dividends paid to non-controlling interests (120) (106) – – – – – –
(a) During 2013 Chalco sold its interest to Chinalco, its parent company. These figures represent the consolidated position of both Simfer Jersey and Simfer S.A. which together formthe Simandou Iron Ore project.
(b) Turquoise Hill Resources Ltd holds controlling interests in OT and SouthGobi. Turquoise Hill’s rights issue at the beginning of 2014 increased non-controlling interests byUS$1,158 million.
158 riotinto.com
For
per
sona
l use
onl
y

Robe RiverMining Co
Pty Ltd2014
Robe RiverMining Co
Pty Ltd2013
Othercompanies
andeliminations(c)
2014
Othercompanies
andeliminations(c)
2013Robe River
2014Robe River
2013
Revenue 1,687 2,074 1,968 2,417 3,655 4,491
Profit after tax 766 1,021 1,036 1,093 1,802 2,114
– attributable to non-controlling interests 300 398 – – 300 398
– attributable to Rio Tinto 466 623 1,036 1,093 1,502 1,716
Other comprehensive loss (364) (620) (187) (348) (551) (968)
Total comprehensive income 402 401 849 745 1,251 1,146
Non-current assets 4,444 4,545 5,296 5,329 9,740 9,874
Current assets 73 149 86 176 159 325
Current liabilities (112) (213) (271) (396) (383) (609)
Non-current liabilities (287) (314) (2,969) (2,436) (3,258) (2,750)
Net assets 4,116 4,167 2,142 2,673 6,258 6,840
– attributable to non-controlling interests 1,620 1,645 – – 1,620 1,645
– attributable to Rio Tinto 2,496 2,522 2,142 2,673 4,638 5,195
Cashflow from operations 1,438 1,570 1,578 1,801 3,016 3,371Dividends paid to non-controlling interests (181) (78) – – (181) (78)
(c) ‘Other companies and eliminations’ includes the branch of North Mining Limited, a wholly owned subsidiary of the Group, that accounts for its interest in Robe River and thegoodwill of US$409 million (2013: US$445 million) that arose on acquisition of the Group’s interest in Robe River. During 2014, US$1,354 million was transferred from the branchto the company. Cumulatively, US$2,251 million has been transferred and this amount is shown within liabilities above.
34 Principal joint operationsAt 31 December 2014
Name and country of operation Principal activitiesGroup
interest (%)
Australia
Tomago Aluminium Joint Venture Aluminium smelting 51.6
Kestrel Coal mining 80
Gladstone Power Station Power generation 42.1
Hope Downs Joint Venture Iron ore mining 50
Queensland Alumina Limited (a) (b) Alumina production 80
New Zealand
New Zealand Aluminium Smelters Limited (a) (b) Aluminium smelting 79.4
Canada
Alouette Aluminium production 40
Indonesia
Grasberg expansion (c) Copper and gold mining 40
United States of AmericaPechiney Reynolds Quebec Inc (b) (d) Aluminium smelting 50.3
The Group comprises a large number of operations, and it is not practical to include all of them in this list. The list therefore only includes those joint operationsthat have a more significant impact on the profit or operating assets of the Group.
The Group’s joint operations are held by intermediate holding companies and not directly by Rio Tinto plc or Rio Tinto Limited.
(a) Although the Group has a 79.4 per cent interest in New Zealand Aluminium Smelters Limited and an 80 per cent interest in Queensland Alumina Limited, decisions about activitiesthat significantly affect the returns that are generated require agreement of both parties to the arrangements, giving rise to joint control.
(b) Queensland Alumina Limited, New Zealand Aluminium Smelters Limited and Pechiney Reynolds Quebec Inc. are joint arrangements that are primarily designed for the provision ofoutput to the parties sharing joint control; this indicates that the parties have rights to substantially all the economic benefits of the assets. The liabilities of the arrangements arein substance satisfied by cash flows received from the parties; this dependence indicates that the parties effectively have obligations for the liabilities. It is these facts andcircumstances that give rise to the classification for these entities as Joint Operations.
(c) Under the terms of a contractual agreement, Rio Tinto is entitled to 40 per cent of additional material mined as a consequence of expansions and developments of the Grasbergfacilities since 1998.
(d) Pechiney Reynolds Quebec Inc. has a 50.1 per cent interest in the Aluminerie de Becancour aluminium smelter, which is located in Canada.
riotinto.com 159
STRATEG
ICREPO
RT
DIRECTO
RS’R
EPORT
FIN
AN
CIA
LS
TA
TE
ME
NT
SPR
ODUCTIO
N,R
ESERVES
ANDOPER
ATIO
NS
ADDITIO
NALINFO
RMATIO
N
For
per
sona
l use
onl
y
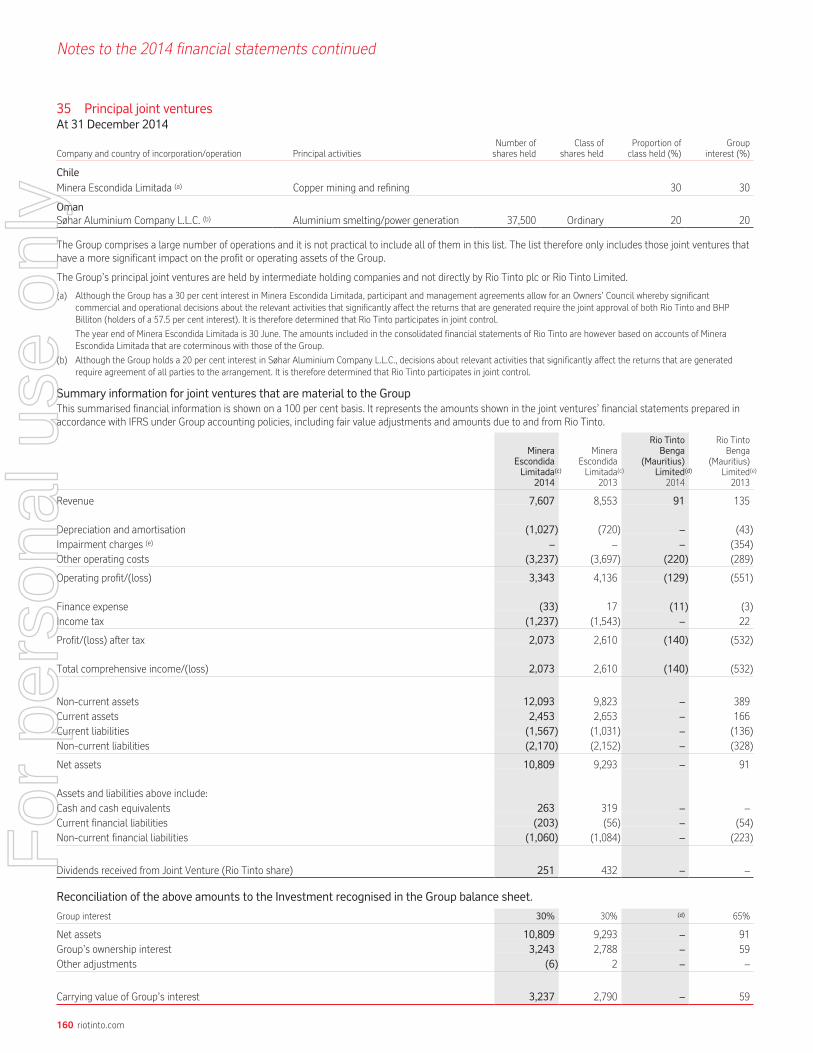
Notes to the 2014 financial statements continued
35 Principal joint venturesAt 31 December 2014
Company and country of incorporation/operation Principal activitiesNumber ofshares held
Class ofshares held
Proportion ofclass held (%)
Groupinterest (%)
Chile
Minera Escondida Limitada (a) Copper mining and refining 30 30
OmanSøhar Aluminium Company L.L.C. (b) Aluminium smelting/power generation 37,500 Ordinary 20 20
The Group comprises a large number of operations and it is not practical to include all of them in this list. The list therefore only includes those joint ventures thathave a more significant impact on the profit or operating assets of the Group.
The Group’s principal joint ventures are held by intermediate holding companies and not directly by Rio Tinto plc or Rio Tinto Limited.
(a) Although the Group has a 30 per cent interest in Minera Escondida Limitada, participant and management agreements allow for an Owners’ Council whereby significantcommercial and operational decisions about the relevant activities that significantly affect the returns that are generated require the joint approval of both Rio Tinto and BHPBilliton (holders of a 57.5 per cent interest). It is therefore determined that Rio Tinto participates in joint control.
The year end of Minera Escondida Limitada is 30 June. The amounts included in the consolidated financial statements of Rio Tinto are however based on accounts of MineraEscondida Limitada that are coterminous with those of the Group.
(b) Although the Group holds a 20 per cent interest in Søhar Aluminium Company L.L.C., decisions about relevant activities that significantly affect the returns that are generatedrequire agreement of all parties to the arrangement. It is therefore determined that Rio Tinto participates in joint control.
Summary information for joint ventures that are material to the GroupThis summarised financial information is shown on a 100 per cent basis. It represents the amounts shown in the joint ventures’ financial statements prepared inaccordance with IFRS under Group accounting policies, including fair value adjustments and amounts due to and from Rio Tinto.
MineraEscondidaLimitada(c)
2014
MineraEscondidaLimitada(c)
2013
Rio TintoBenga
(Mauritius)Limited(d)
2014
Rio TintoBenga
(Mauritius)Limited(e)2013
Revenue 7,607 8,553 91 135
Depreciation and amortisation (1,027) (720) – (43)Impairment charges (e) – – – (354)Other operating costs (3,237) (3,697) (220) (289)
Operating profit/(loss) 3,343 4,136 (129) (551)
Finance expense (33) 17 (11) (3)Income tax (1,237) (1,543) – 22
Profit/(loss) after tax 2,073 2,610 (140) (532)
Total comprehensive income/(loss) 2,073 2,610 (140) (532)
Non-current assets 12,093 9,823 – 389Current assets 2,453 2,653 – 166Current liabilities (1,567) (1,031) – (136)Non-current liabilities (2,170) (2,152) – (328)
Net assets 10,809 9,293 – 91
Assets and liabilities above include:Cash and cash equivalents 263 319 – –Current financial liabilities (203) (56) – (54)Non-current financial liabilities (1,060) (1,084) – (223)
Dividends received from Joint Venture (Rio Tinto share) 251 432 – –
Reconciliation of the above amounts to the Investment recognised in the Group balance sheet.
Group interest 30% 30% (d) 65%
Net assets 10,809 9,293 – 91Group’s ownership interest 3,243 2,788 – 59Other adjustments (6) 2 – –
Carrying value of Group’s interest 3,237 2,790 – 59
160 riotinto.com
For
per
sona
l use
onl
y
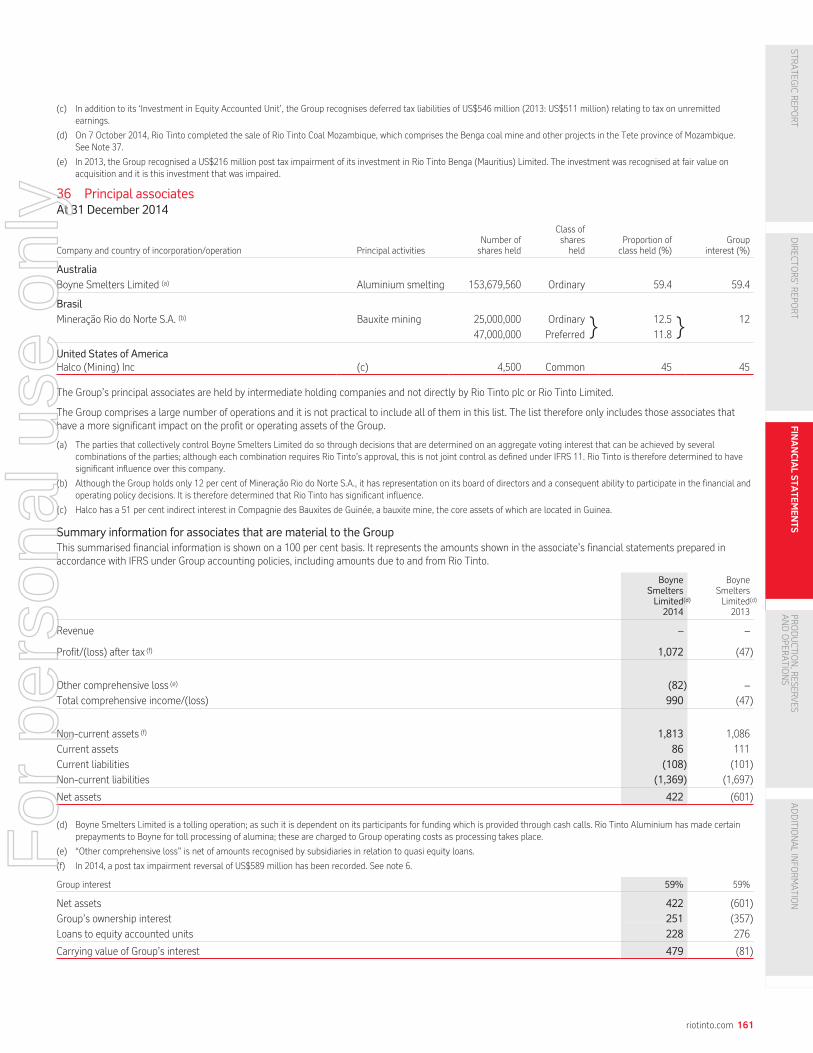
(c) In addition to its ‘Investment in Equity Accounted Unit’, the Group recognises deferred tax liabilities of US$546 million (2013: US$511 million) relating to tax on unremittedearnings.
(d) On 7 October 2014, Rio Tinto completed the sale of Rio Tinto Coal Mozambique, which comprises the Benga coal mine and other projects in the Tete province of Mozambique.See Note 37.
(e) In 2013, the Group recognised a US$216 million post tax impairment of its investment in Rio Tinto Benga (Mauritius) Limited. The investment was recognised at fair value onacquisition and it is this investment that was impaired.
36 Principal associatesAt 31 December 2014
Company and country of incorporation/operation Principal activitiesNumber ofshares held
Class ofsharesheld
Proportion ofclass held (%)
Groupinterest (%)
Australia
Boyne Smelters Limited (a) Aluminium smelting 153,679,560 Ordinary 59.4 59.4
Brasil
Mineração Rio do Norte S.A. (b) Bauxite mining 25,000,000 Ordinary } 12.5 } 12
47,000,000 Preferred 11.8
United States of AmericaHalco (Mining) Inc (c) 4,500 Common 45 45
The Group’s principal associates are held by intermediate holding companies and not directly by Rio Tinto plc or Rio Tinto Limited.
The Group comprises a large number of operations and it is not practical to include all of them in this list. The list therefore only includes those associates thathave a more significant impact on the profit or operating assets of the Group.
(a) The parties that collectively control Boyne Smelters Limited do so through decisions that are determined on an aggregate voting interest that can be achieved by severalcombinations of the parties; although each combination requires Rio Tinto’s approval, this is not joint control as defined under IFRS 11. Rio Tinto is therefore determined to havesignificant influence over this company.
(b) Although the Group holds only 12 per cent of Mineraçao Rio do Norte S.A., it has representation on its board of directors and a consequent ability to participate in the financial andoperating policy decisions. It is therefore determined that Rio Tinto has significant influence.
(c) Halco has a 51 per cent indirect interest in Compagnie des Bauxites de Guinée, a bauxite mine, the core assets of which are located in Guinea.
Summary information for associates that are material to the GroupThis summarised financial information is shown on a 100 per cent basis. It represents the amounts shown in the associate’s financial statements prepared inaccordance with IFRS under Group accounting policies, including amounts due to and from Rio Tinto.
BoyneSmeltersLimited(d)
2014
BoyneSmeltersLimited(d)2013
Revenue – –
Profit/(loss) after tax (f) 1,072 (47)
Other comprehensive loss (e) (82) –
Total comprehensive income/(loss) 990 (47)
Non-current assets (f) 1,813 1,086
Current assets 86 111
Current liabilities (108) (101)
Non-current liabilities (1,369) (1,697)
Net assets 422 (601)
(d) Boyne Smelters Limited is a tolling operation; as such it is dependent on its participants for funding which is provided through cash calls. Rio Tinto Aluminium has made certainprepayments to Boyne for toll processing of alumina; these are charged to Group operating costs as processing takes place.
(e) “Other comprehensive loss” is net of amounts recognised by subsidiaries in relation to quasi equity loans.
(f) In 2014, a post tax impairment reversal of US$589 million has been recorded. See note 6.
Group interest 59% 59%
Net assets 422 (601)
Group’s ownership interest 251 (357)
Loans to equity accounted units 228 276
Carrying value of Group’s interest 479 (81)
riotinto.com 161
STRATEG
ICREPO
RT
DIRECTO
RS’R
EPORT
FIN
AN
CIA
LS
TA
TE
ME
NT
SPR
ODUCTIO
N,R
ESERVES
ANDOPER
ATIO
NS
ADDITIO
NALINFO
RMATIO
N
For
per
sona
l use
onl
y
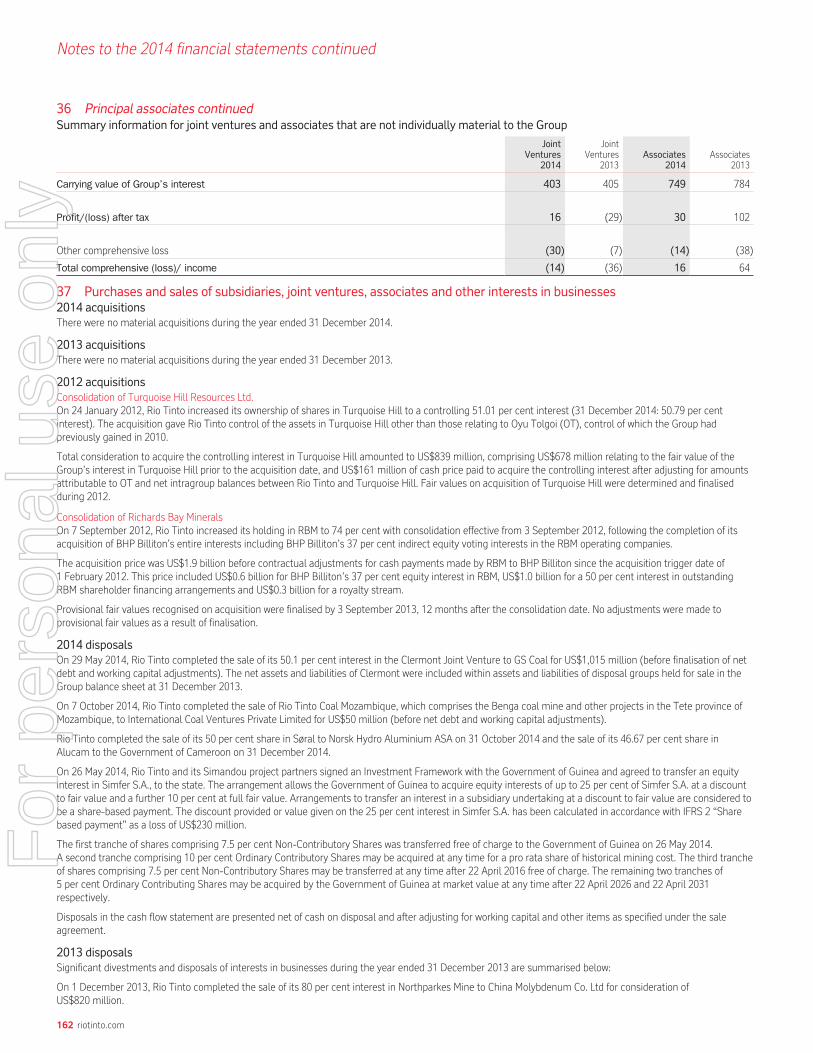
Notes to the 2014 financial statements continued
36 Principal associates continuedSummary information for joint ventures and associates that are not individually material to the Group
JointVentures
2014
JointVentures
2013Associates
2014Associates
2013
Carrying value of Group’s interest 403 405 749 784
Profit/(loss) after tax 16 (29) 30 102
Other comprehensive loss (30) (7) (14) (38)
Total comprehensive (loss)/ income (14) (36) 16 64
37 Purchases and sales of subsidiaries, joint ventures, associates and other interests in businesses2014 acquisitionsThere were no material acquisitions during the year ended 31 December 2014.
2013 acquisitionsThere were no material acquisitions during the year ended 31 December 2013.
2012 acquisitionsConsolidation of Turquoise Hill Resources Ltd.On 24 January 2012, Rio Tinto increased its ownership of shares in Turquoise Hill to a controlling 51.01 per cent interest (31 December 2014: 50.79 per centinterest). The acquisition gave Rio Tinto control of the assets in Turquoise Hill other than those relating to Oyu Tolgoi (OT), control of which the Group hadpreviously gained in 2010.
Total consideration to acquire the controlling interest in Turquoise Hill amounted to US$839 million, comprising US$678 million relating to the fair value of theGroup’s interest in Turquoise Hill prior to the acquisition date, and US$161 million of cash price paid to acquire the controlling interest after adjusting for amountsattributable to OT and net intragroup balances between Rio Tinto and Turquoise Hill. Fair values on acquisition of Turquoise Hill were determined and finalisedduring 2012.
Consolidation of Richards Bay MineralsOn 7 September 2012, Rio Tinto increased its holding in RBM to 74 per cent with consolidation effective from 3 September 2012, following the completion of itsacquisition of BHP Billiton’s entire interests including BHP Billiton’s 37 per cent indirect equity voting interests in the RBM operating companies.
The acquisition price was US$1.9 billion before contractual adjustments for cash payments made by RBM to BHP Billiton since the acquisition trigger date of1 February 2012. This price included US$0.6 billion for BHP Billiton’s 37 per cent equity interest in RBM, US$1.0 billion for a 50 per cent interest in outstandingRBM shareholder financing arrangements and US$0.3 billion for a royalty stream.
Provisional fair values recognised on acquisition were finalised by 3 September 2013, 12 months after the consolidation date. No adjustments were made toprovisional fair values as a result of finalisation.
2014 disposalsOn 29 May 2014, Rio Tinto completed the sale of its 50.1 per cent interest in the Clermont Joint Venture to GS Coal for US$1,015 million (before finalisation of netdebt and working capital adjustments). The net assets and liabilities of Clermont were included within assets and liabilities of disposal groups held for sale in theGroup balance sheet at 31 December 2013.
On 7 October 2014, Rio Tinto completed the sale of Rio Tinto Coal Mozambique, which comprises the Benga coal mine and other projects in the Tete province ofMozambique, to International Coal Ventures Private Limited for US$50 million (before net debt and working capital adjustments).
Rio Tinto completed the sale of its 50 per cent share in Søral to Norsk Hydro Aluminium ASA on 31 October 2014 and the sale of its 46.67 per cent share inAlucam to the Government of Cameroon on 31 December 2014.
On 26 May 2014, Rio Tinto and its Simandou project partners signed an Investment Framework with the Government of Guinea and agreed to transfer an equityinterest in Simfer S.A., to the state. The arrangement allows the Government of Guinea to acquire equity interests of up to 25 per cent of Simfer S.A. at a discountto fair value and a further 10 per cent at full fair value. Arrangements to transfer an interest in a subsidiary undertaking at a discount to fair value are considered tobe a share-based payment. The discount provided or value given on the 25 per cent interest in Simfer S.A. has been calculated in accordance with IFRS 2 “Sharebased payment” as a loss of US$230 million.
The first tranche of shares comprising 7.5 per cent Non-Contributory Shares was transferred free of charge to the Government of Guinea on 26 May 2014.A second tranche comprising 10 per cent Ordinary Contributory Shares may be acquired at any time for a pro rata share of historical mining cost. The third trancheof shares comprising 7.5 per cent Non-Contributory Shares may be transferred at any time after 22 April 2016 free of charge. The remaining two tranches of5 per cent Ordinary Contributing Shares may be acquired by the Government of Guinea at market value at any time after 22 April 2026 and 22 April 2031respectively.
Disposals in the cash flow statement are presented net of cash on disposal and after adjusting for working capital and other items as specified under the saleagreement.
2013 disposalsSignificant divestments and disposals of interests in businesses during the year ended 31 December 2013 are summarised below:
On 1 December 2013, Rio Tinto completed the sale of its 80 per cent interest in Northparkes Mine to China Molybdenum Co. Ltd for consideration ofUS$820 million.
162 riotinto.com
For
per
sona
l use
onl
y
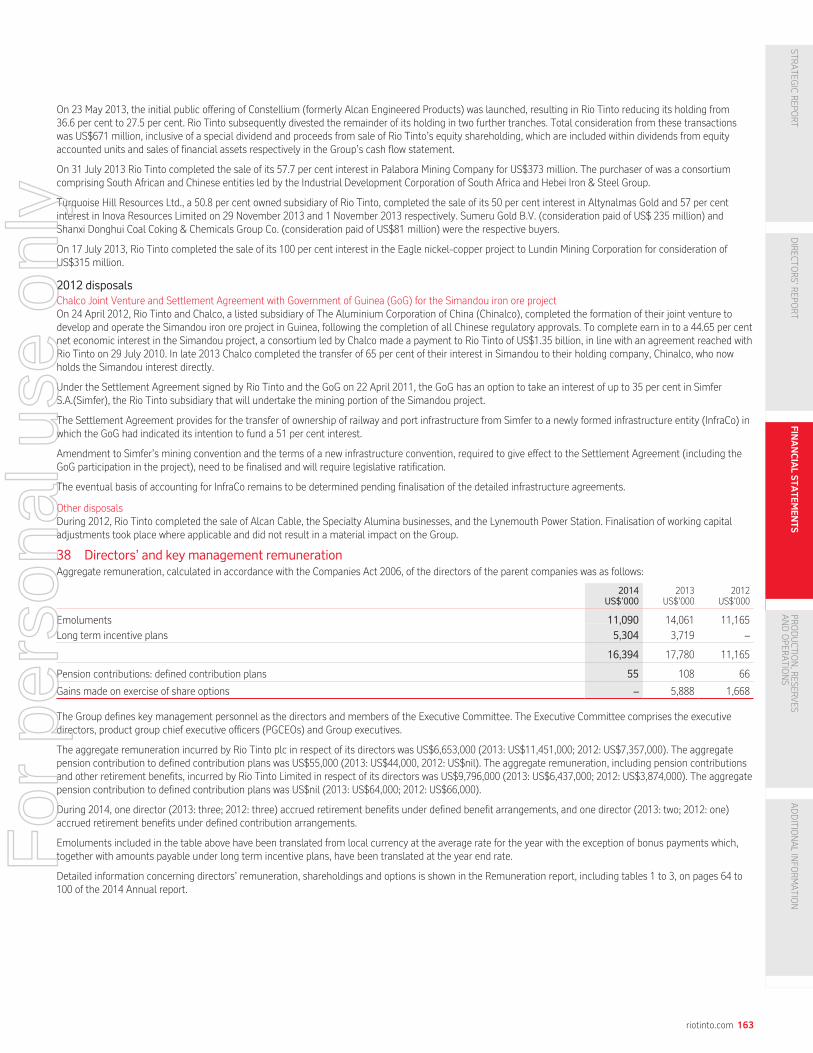
On 23 May 2013, the initial public offering of Constellium (formerly Alcan Engineered Products) was launched, resulting in Rio Tinto reducing its holding from36.6 per cent to 27.5 per cent. Rio Tinto subsequently divested the remainder of its holding in two further tranches. Total consideration from these transactionswas US$671 million, inclusive of a special dividend and proceeds from sale of Rio Tinto’s equity shareholding, which are included within dividends from equityaccounted units and sales of financial assets respectively in the Group’s cash flow statement.
On 31 July 2013 Rio Tinto completed the sale of its 57.7 per cent interest in Palabora Mining Company for US$373 million. The purchaser of was a consortiumcomprising South African and Chinese entities led by the Industrial Development Corporation of South Africa and Hebei Iron & Steel Group.
Turquoise Hill Resources Ltd., a 50.8 per cent owned subsidiary of Rio Tinto, completed the sale of its 50 per cent interest in Altynalmas Gold and 57 per centinterest in Inova Resources Limited on 29 November 2013 and 1 November 2013 respectively. Sumeru Gold B.V. (consideration paid of US$ 235 million) andShanxi Donghui Coal Coking & Chemicals Group Co. (consideration paid of US$81 million) were the respective buyers.
On 17 July 2013, Rio Tinto completed the sale of its 100 per cent interest in the Eagle nickel-copper project to Lundin Mining Corporation for consideration ofUS$315 million.
2012 disposalsChalco Joint Venture and Settlement Agreement with Government of Guinea (GoG) for the Simandou iron ore projectOn 24 April 2012, Rio Tinto and Chalco, a listed subsidiary of The Aluminium Corporation of China (Chinalco), completed the formation of their joint venture todevelop and operate the Simandou iron ore project in Guinea, following the completion of all Chinese regulatory approvals. To complete earn in to a 44.65 per centnet economic interest in the Simandou project, a consortium led by Chalco made a payment to Rio Tinto of US$1.35 billion, in line with an agreement reached withRio Tinto on 29 July 2010. In late 2013 Chalco completed the transfer of 65 per cent of their interest in Simandou to their holding company, Chinalco, who nowholds the Simandou interest directly.
Under the Settlement Agreement signed by Rio Tinto and the GoG on 22 April 2011, the GoG has an option to take an interest of up to 35 per cent in SimferS.A.(Simfer), the Rio Tinto subsidiary that will undertake the mining portion of the Simandou project.
The Settlement Agreement provides for the transfer of ownership of railway and port infrastructure from Simfer to a newly formed infrastructure entity (InfraCo) inwhich the GoG had indicated its intention to fund a 51 per cent interest.
Amendment to Simfer’s mining convention and the terms of a new infrastructure convention, required to give effect to the Settlement Agreement (including theGoG participation in the project), need to be finalised and will require legislative ratification.
The eventual basis of accounting for InfraCo remains to be determined pending finalisation of the detailed infrastructure agreements.
Other disposalsDuring 2012, Rio Tinto completed the sale of Alcan Cable, the Specialty Alumina businesses, and the Lynemouth Power Station. Finalisation of working capitaladjustments took place where applicable and did not result in a material impact on the Group.
38 Directors’ and key management remunerationAggregate remuneration, calculated in accordance with the Companies Act 2006, of the directors of the parent companies was as follows:
2014US$’000
2013US$’000
2012US$’000
Emoluments 11,090 14,061 11,165
Long term incentive plans 5,304 3,719 –
16,394 17,780 11,165
Pension contributions: defined contribution plans 55 108 66
Gains made on exercise of share options – 5,888 1,668
The Group defines key management personnel as the directors and members of the Executive Committee. The Executive Committee comprises the executivedirectors, product group chief executive officers (PGCEOs) and Group executives.
The aggregate remuneration incurred by Rio Tinto plc in respect of its directors was US$6,653,000 (2013: US$11,451,000; 2012: US$7,357,000). The aggregatepension contribution to defined contribution plans was US$55,000 (2013: US$44,000, 2012: US$nil). The aggregate remuneration, including pension contributionsand other retirement benefits, incurred by Rio Tinto Limited in respect of its directors was US$9,796,000 (2013: US$6,437,000; 2012: US$3,874,000). The aggregatepension contribution to defined contribution plans was US$nil (2013: US$64,000; 2012: US$66,000).
During 2014, one director (2013: three; 2012: three) accrued retirement benefits under defined benefit arrangements, and one director (2013: two; 2012: one)accrued retirement benefits under defined contribution arrangements.
Emoluments included in the table above have been translated from local currency at the average rate for the year with the exception of bonus payments which,together with amounts payable under long term incentive plans, have been translated at the year end rate.
Detailed information concerning directors’ remuneration, shareholdings and options is shown in the Remuneration report, including tables 1 to 3, on pages 64 to100 of the 2014 Annual report.
riotinto.com 163
STRATEG
ICREPO
RT
DIRECTO
RS’R
EPORT
FIN
AN
CIA
LS
TA
TE
ME
NT
SPR
ODUCTIO
N,R
ESERVES
ANDOPER
ATIO
NS
ADDITIO
NALINFO
RMATIO
N
For
per
sona
l use
onl
y

Notes to the 2014 financial statements continued
38 Directors’ and key management remuneration continuedAggregate compensation, representing the expense recognised under IFRS, as defined in note 1, of the Group’s key management, including directors, was asfollows:
2014US$’000
2013US$’000
2012US$’000
Short term employee benefits and costs 30,137 30,696 27,164
Post employment benefits 1,449 2,741 5,121
Share based payments 19,676 26,392 32,435
51,262 59,829 64,720
The figures shown above include employment costs which comprise social security and accident premiums in the UK and US and payroll taxes in Australia paid bythe employer as a direct additional cost of hire. In total, they amount to US$2,870,000 (2013: US$2,897,000; 2012: US$2,863,000) and although disclosed here, arenot included in table 1 of the Remuneration report.
More detailed information concerning the remuneration of key management is shown in the Remuneration report, including tables 1 to 3 on pages 64 to 100 of the2014 Annual report.
39 Auditors’ remuneration
2014US$m
2013US$m
2012US$m
Group Auditors’ remuneration (a)
Audit of the company 4.0 3.8 3.1
Audit of subsidiaries 10.7 11.5 14.1
Total audit 14.7 15.3 17.2
Audit related assurance services 1.1 1.2 1.5
Other assurance services (b) 1.0 3.0 3.8
Total assurance services 2.1 4.2 5.3
Tax compliance (c) 0.4 0.5 0.3
Tax advisory services (c) 0.5 0.4 0.4
Services related to corporate finance transactions not covered above
– services in connection with bond issues/capital raising 0.1 0.4 0.6
– services in connection with divestment programme – 0.5 0.3
Other non-audit services not covered above 0.3 0.4 0.5
Total non-audit services 1.3 2.2 2.1
18.1 21.7 24.6
Audit fees payable to other accounting firms
Audit of the accounts of the Group’s subsidiaries 2.7 3.0 2.9
Fees in respect of pension scheme audits 0.4 0.3 0.1
3.1 3.3 3.0
(a) The remuneration payable to PwC, the Group Auditors, is approved by the Audit committee. The committee sets the policy for the award of non-audit work to the auditors andapproves the nature and extent of such work, and the amount of the related fees, to ensure that independence is maintained. The fees disclosed above consolidate all paymentsmade to member firms of PwC by the Companies and their subsidiaries, together with the Group’s share of the payments made by joint operations. Non-audit services arise largelyfrom assurance and/or regulation related work.
(b) Other assurance services are mainly related to carve-out financial statements, sustainability assurance and assurance over the “Taxes paid” report.
(c) “Taxation services” includes tax compliance and advisory services. Tax compliance involves the preparation or review of returns for corporation, income, sales and excise taxes.Tax advisory services includes advice on non-recurring acquisitions and disposals, advice on transfer pricing and advice on employee global mobility.
164 riotinto.com
For
per
sona
l use
onl
y

40 Related party transactionsInformation about material related party transactions of the Rio Tinto Group is set out below:
Subsidiary companies and joint operations
Details of investments in principal subsidiary companies are disclosed in note 33. Information relating to joint operations can be found in note 34.
Equity accounted units
Transactions and balances with equity accounted units are summarised below. Purchases, trade and other receivables, and trade and other payables relate largelyto amounts charged by equity accounted units for toll processing of alumina and purchasing of bauxite and aluminium. Sales relate largely to charges for supply ofcoal to jointly controlled marketing entities for onward sale to third party customers.
Income statement items2014US$m
2013US$m
2012US$m
Purchases from equity accounted units (1,835) (1,953) (2,283)
Sales to equity accounted units 625 1,569 1,742
Cash flow statement items US$m US$m US$m
Net funding of equity accounted units (117) (88) (223)
Balance sheet items US$m US$m US$m
Investments in equity accounted units (note 15) (a) 4,868 3,957 3,941
Loans to equity accounted units 71 94 282
Loans from equity accounted units (52) (86) (116)
Trade and other receivables: amounts due from equity accounted units 423 615 722Trade and other payables: amounts due to equity accounted units (note 25) (225) (290) (357)
(a) Further information about investments in equity accounted units is set out in notes 35 and 36.
Pension funds
Information relating to pension fund arrangements is disclosed in note 45.
Directors and key management
Details of directors’ and key management remuneration are set out in note 38 and in the Remuneration report on pages 64 to 100.
41 Exchange rates in US$The principal exchange rates used in the preparation of the 2014 financial statements are:
Annual average Year end
2014 2013 2012 2014 2013 2012
Sterling 1.65 1.56 1.58 1.56 1.65 1.62
Australian dollar 0.90 0.97 1.04 0.82 0.89 1.04
Canadian dollar 0.91 0.97 1.00 0.86 0.94 1.00
South African rand 0.092 0.104 0.122 0.086 0.096 0.122Euro 1.33 1.33 1.29 1.22 1.38 1.32
42 Bougainville Copper Limited (BCL)The Group owns 53.83 per cent of the issued share capital of BCL. Mining has been suspended at the Panguna mine since 1989. Safe access by companyemployees has not been possible since that time and an accurate assessment of the condition of the assets cannot therefore be made. Considerable fundingwould be required to recommence operations to the level which applied at the time of the mine’s closure in 1989. An Order of Magnitude study completed by BCLin 2013 indicated an estimated capital requirement of US$5.2 billion to reopen the mine assuming all site infrastructure is replaced. Rio Tinto does not havecontrol over BCL under IFRS, as defined in note 1, as it does not have the current ability to direct the activities that affect its returns, being the mining and sale ofore from the Panguna mine; it is therefore not a subsidiary.
On 18 August 2014, in light of developments in Papua New Guinea, including the new mining legislation passed earlier that month by the AutonomousBougainville Government, the Group announced a strategic review of all options in relation to the 53.83 per cent stake in BCL.
43 Events after the balance sheet dateOn 12 February 2015, the Group announced a share buy-back of US$2 billion comprising a A$500 million (c US$0.4 billion) off-market share buy-back tender ofRio Tinto Limited shares and the balance of approximately US$1.6 billion as an on-market buy-back of Rio Tinto plc shares. Ordinary shares of Rio Tinto plc havebeen bought back since 18 February 2015 and announcements have been made to the relevant stock exchanges. Shares so purchased have been cancelled.
No Rio Tinto Limited shares have been purchased at the date of this report.
Other than the items above, no events were identified after the balance sheet date which could be expected to have a material impact on the consolidatedfinancial statements.
riotinto.com 165
STRATEG
ICREPO
RT
DIRECTO
RS’R
EPORT
FIN
AN
CIA
LS
TA
TE
ME
NT
SPR
ODUCTIO
N,R
ESERVES
ANDOPER
ATIO
NS
ADDITIO
NALINFO
RMATIO
N
For
per
sona
l use
onl
y

Notes to the Financial Statements continued
44 Share based payments
Rio Tinto plc and Rio Tinto Limited (the Companies) have a number of share based payment plans, which are described in detail in the Remuneration Report.These plans have been accounted for in accordance with the fair value recognition provisions of IFRS 2 Share-based Payment.
The charge that has been recognised in the income statement for Rio Tinto’s share-based compensation plans, and the related liability (for cash-settled plans), isset out in the table below.
Charge/(credit) recognised for the year Liability at the end of the year
2014US$m
2013US$m
2012US$m
2014US$m
2013US$m
Equity-settled plans 152 142 243 – –
Cash-settled plans – – (3) 1 1
Total 152 142 240 1 1
The main Rio Tinto plc and Rio Tinto Limited plans are as follows:
Share Savings Plans
Awards under these plans are settled in equity and accounted for accordingly. The fair value of each award on the day of grant was estimated using a lattice-basedoption valuation model, including allowance for the exercise price being at a discount to market price.
Awards are no longer granted under the Share Savings Plans as these plans were replaced by the Global Employee Share Plan in 2012. Charges will continue to beincurred until prior period awards have vested.
Share Option Plan
The Group has a policy of settling awards made under the Share Option Plan in equity, although the directors at their discretion can offer a cash alternative.The awards are accounted for in accordance with the requirements applying to equity-settled, share-based payment transactions. The performance conditions inrelation to Total Shareholder Return (TSR) have been incorporated in the measurement of fair value for these awards by modelling the correlation betweenRio Tinto’s TSR and that of the HSBC Global Mining Index. The relationship between Rio Tinto’s TSR and the index was simulated many thousands of times toderive a distribution which, in conjunction with the lattice-based option valuation model, was used to determine the fair value of the options.
Awards are no longer granted under the Share Option Plans as the LTIP arrangements have been simplified and awards are now only made under the PerformanceShare Plan. Charges will continue to be incurred until prior period awards have vested.
UK Share Plan (formerly the Share Ownership Plan)
The fair values of Matching and Free Shares made by Rio Tinto are taken to be the market value of the shares on the date of purchase. These awards are settled inequity.
Performance Share Plan
Participants are generally assigned shares in settlement of their awards and therefore the Plan is accounted for in accordance with the requirements applying toequity-settled share-based payment transactions.
For the awards or parts of awards with TSR performance conditions, the fair value of the awards was calculated using a Monte Carlo simulation model taking intoaccount the TSR performance conditions. One-third of the 2013 and 2014 awards must satisfy an earnings target relative to ten global mining comparators forvesting. As this is a non-market related performance condition, under IFRS 2, the fair value recognised is reviewed at each accounting date based on the directors’expectations for the proportion vesting. As at 31 December 2014 it was assumed 100 per cent of awards subject to the condition would vest. Forfeitures areassumed prior to vesting at three per cent per annum of outstanding awards.
Management Share Plan
The Management Share Plan was introduced during 2007 to provide conditional share-based awards to management. The vesting of these awards is dependent onservice conditions being met. In general, the awards will be settled in equity including the dividends accumulated from date of award to vesting. The awards areaccounted for in accordance with the requirements applying to equity-settled share-based payment transactions.
The fair value of each award on the day of grant is equal to the share price on the day of grant less a small adjustment for the timing of dividends. Forfeitures areassumed prior to vesting at seven per cent per annum of outstanding awards (2013: five per cent per annum).
Bonus Deferral Plan
The Bonus Deferral Plan was originally introduced during 2009 for the mandatory deferral of the 2008 bonuses for executive directors, product group executivesand for other executives. Additional Bonus Deferral Awards have been made each year since 2011 (made in respect of the 2010 bonus) for the mandatory deferralof 50 per cent of the bonuses for executive directors and product group executives and ten per cent of the bonuses for other executives.
The vesting of these awards is dependent only on service conditions being met. In general, the awards will be settled in equity including the dividendsaccumulated from date of award to vesting. The awards are accounted for in accordance with the requirements applying to equity-settled share-based paymenttransactions. The fair value of each award on the day of grant is equal to share price on the day of grant less a small adjustment for the timing of dividends vesting.Forfeitures are assumed prior to vesting at three per cent per annum of outstanding awards.
Global Employee Share Plan
The Global Employee Share Plan was introduced during 2012. The company provides matching shares for each share purchased. The vesting of these matchingawards is dependent on service conditions being met. These awards are settled in equity. The fair value of each matching share on the day of grant is equal toshare price on the date of purchase. Forfeitures are assumed prior to vesting at five per cent per annum of outstanding awards.
166 riotinto.com
For
per
sona
l use
onl
y

Summary of options outstandingA summary of the status of the Companies’ equity-settled share option plans at 31 December 2014 is presented below.
Options outstanding at 31 December 2014 Number
Weightedaverage
exercise priceper option
£/A$
Weightedaverage
remainingcontractual
lifeYears
Aggregateintrinsic
value 2014US$m
Rio Tinto plc Share Savings Plan (exercise price £21 – £29) 299,561 26.32 0.8 2
Rio Tinto Limited Share Savings Plan (exercise price A$48 – A$60) 609,426 53.40 1.1 2
Rio Tinto plc Share Option Plan (exercise price £15 – £43) 1,438,972 32.31 5.2 8
Rio Tinto Limited Share Option Plan (exercise price A$30 – A$77) 450,964 51.43 3.5 4
2,798,923 16
As at 31 December 2013 there were 4,216,531 options outstanding with an aggregate intrinsic value of US$57 million.
Options exercisable at 31 December 2014
Rio Tinto plc Share Option Plan (exercise price £15 – £43) 1,128,973 31.52 4.7 8
Rio Tinto Limited Share Option Plan (exercise price A$30 – A$77) 450,964 51.43 3.5 4
1,579,937 12
As at 31 December 2014 and 31 December 2013, there were no options exercisable under either the Rio Tinto plc or the Rio Tinto Limited Share Savings Plans.
The Management Share Plan, Performance Share Plan, Bonus Deferral Plan, Global Employee Share Plan and UK Share Plan together represent 93 per cent (2013:91 per cent) of the total IFRS 2 charge for Rio Tinto plc and Rio Tinto Limited plans in 2014.
Performance Share Plan
Rio Tinto plc awards Rio Tinto Ltd awards
2014Number
Weightedaverage
fair value atgrant date
2014£
2013Number
Weightedaverage
fair value atgrant date
2013£
2014Number
Weightedaverage
fair value atgrant date
2014A$
2013Number
Weightedaverage
fair value atgrant date
2013A$
Non-vested shares at1 January 3,161,952 27.91 2,705,545 30.40 2,023,519 53.29 1,541,776 60.46
Awarded 950,148 22.73 949,588 19.06 626,072 44.40 651,435 36.17
Forfeited (230,496) 20.98 (303,008) 31.20 (127,726) 40.31 (137,408) 57.40
Failed performanceconditions (233,736) 36.33 (14,070) 13.61 (124,431) 75.65 (2,423) 32.74
Vested (719,867) 36.27 (176,103) 13.91 (372,558) 75.66 (29,861) 32.74
Non-vested shares at31 December 2,928,001 24.05 3,161,952 27.91 2,024,876 45.87 2,023,519 53.29
2014Number
Weightedaverage
share price2014
£2013
Number
Weightedaverage
share price2013
£2014
Number
Weightedaverage
share price2014A$
2013Number
Weightedaverage
share price2013A$
Shares issued in respect ofvested awards during theyear 719,867 33.24 176,103 34.69 355,548 65.98 29,861 69.03
Vested awards settled incash during the year – – – – 17,010 65.98 – –
In addition to the equity-settled awards shown above, there were 1,261 Rio Tinto plc cash-settled awards outstanding at 31 December 2014. The total liability forthese awards at 31 December 2014 was less than US$1 million (2013: less than US$1 million).
riotinto.com 167
STRATEG
ICREPO
RT
DIRECTO
RS’R
EPORT
FIN
AN
CIA
LS
TA
TE
ME
NT
SPR
ODUCTIO
N,R
ESERVES
ANDOPER
ATIO
NS
ADDITIO
NALINFO
RMATIO
N
For
per
sona
l use
onl
y

Notes to the 2014 financial statements continued
44 Share based payments continuedManagement Share Plan, Bonus Deferral Plan, Global Employee Share Plan and UK Share Plan (combined)
Rio Tinto plc awards Rio Tinto Ltd awards
2014Number
Weightedaverage
fair value atgrant date
2014£
2013Number
Weightedaverage
fair value atgrant date
2013£
2014Number
Weightedaverage
fair value atgrant date
2014A$
2013Number
Weightedaverage
fair value atgrant date
2013A$
Non-vested awards at 1 January 2,277,219 32.72 2,073,129 37.21 2,058,902 61.64 1,574,153 71.73
Awarded 1,420,588 31.87 1,420,445 29.09 1,357,091 61.74 1,301,055 55.36
Forfeited (191,039) 30.67 (237,265) 34.13 (206,134) 58.86 (165,591) 62.36
Expired – – (5,172) 36.97 – – (219) 76.02
Vested (759,422) 36.70 (973,918) 36.61 (630,778) 70.93 (650,496) 73.17
Non-vested awards at31 December 2,747,346 30.89 2,277,219 32.72 2,579,081 59.83 2,058,902 61.64
Comprising of
– Management Share Plan 1,807,727 32.16 1,708,472 33.38 1,638,119 59.46 1,505,507 62.93
– Bonus Deferral Plan 202,651 33.58 206,336 32.20 199,724 58.24 205,242 59.10
– Global Employee Share Plan 693,230 26.72 353,049 29.93 741,238 61.08 348,153 57.57– UK Share Plan 43,738 31.82 9,362 29.11
2014Number
Weightedaverage
share price2014
£2013
Number
Weightedaverage
share price2013
£2014
Number
Weightedaverage
share price2014A$
2013Number
Weightedaverage
share price2013A$
Shares issued in respect ofvested awards during the year(including dividend sharesapplied on vesting)
– Management Share Plan 631,359 31.84 843,009 33.82 461,835 63.70 582,493 65.09
– Bonus Deferral Plan 144,916 29.44 106,335 32.23 128,528 58.48 65,297 64.77
– Global Employee Share Plan 42,910 31.10 12,335 30.92 32,780 60.70 10,324 60.34– UK Share Plan 4,096 32.77 35,250 29.72
In addition to the equity-settled awards shown above, there were 16,985 Rio Tinto plc cash-settled awards outstanding at 31 December 2014. The total liability forthese awards at 31 December 2014 was less than US$1 million (2013: less than US$1 million).
45 Post retirement benefitsDescription of plansThe Group operates a number of pension and post retirement healthcare plans around the world. Some of these plans are defined contribution and some aredefined benefit, with assets held in separate trusts, foundations and similar entities.
Defined benefit pension and post retirement healthcare plans expose the Group to a number of risks:
Uncertainty in benefit payments The value of the Group’s liabilities for post retirement benefits will ultimately depend on the amount of benefits paidout. This in turn will depend on the future pay increases, the level of inflation (for those benefits that are subject tosome form of inflation protection) and how long individuals live.
Volatility in asset values The Group is exposed to future movements in the values of assets held in pension plans to meet future benefitpayments.
Uncertainty in cash funding Movements in the values of the obligations or assets may result in the Group being required to provide higher levels ofcash funding, although changes in the level of cash required can often be spread over a number of years. In somecountries control over the rate of cash funding or over the investment policy for pension assets might rest to someextent with a trustee body or other body that is not under the Group’s direct control. In addition the Group is alsoexposed to adverse changes in pension regulation.
For these reasons the Group has a policy of moving away from defined benefit pension provision and towards defined contribution arrangements instead.The defined benefit pension plans for salaried employees are closed to new entrants in almost all countries. For unionised employees some plans remain open butothers are closed.
The Group does not usually participate in multiemployer plans in which the risks are shared with other companies using those plans. The Group’s participation insuch plans is immaterial and consequently no detailed disclosures are provided in this note.
168 riotinto.com
For
per
sona
l use
onl
y

Pension plansThe majority of the Group’s defined benefit pension obligations are in Canada, the UK, the US, Switzerland and the Eurozone.
In Canada the benefits for salaried staff are generally linked to final average pay and are closed to new entrants. Benefits for bargaining employees are reviewed innegotiation with unions and are typically either linked to final average pay or to a flat monetary amount per year of service. Some of these plans have been closedto new entrants but some remain open at present. The plans are subject to the regulatory requirements that apply to Canadian pension plans in the relevantprovinces and territories (predominantly Quebec). Pension Committees are responsible for ensuring that the plans operate in a manner that is compliant with therelevant regulations. The Pension Committees generally have a number of members appointed by the sponsor and a number appointed by the plan participants.In some cases there is also an independent Committee member.
The defined benefit sections of the UK arrangements are linked to final pay and are closed to new members. New employees are admitted to defined contributionsections. The plans are subject to the regulatory requirements that apply to UK pension plans. Trustees are responsible for ensuring that the plans operate in amanner that is compliant with UK regulations. Trustee boards have a number of directors appointed by the sponsor and a number appointed by the planparticipants. In some cases there is also an independent trustee director.
A number of defined benefit pension plans are sponsored by the US entities. Benefits for salaried staff are generally linked to final average pay and closed to newentrants, while benefits for bargaining employees are reviewed in negotiation with unions and are typically a flat monetary amount per year of service. A BenefitsGovernance Committee is responsible for ensuring that the plans are compliant with US regulations. Members of that Committee are appointed by the sponsor.
In Europe, there are defined benefit plans in Switzerland, the Netherlands, Germany and France. The largest single plan is in Switzerland and provides benefitslinked to final average pay. The Swiss plan is overseen by a Foundation Board which is responsible for ensuring that the plan complies with Swiss regulations.Foundation Board members are appointed by the plan sponsor, by employees and by retirees.
In Australia, the main arrangements are principally defined contribution in nature but there are sections providing defined benefits linked to final pay, typically paidin lump sum form. The defined benefit sections are closed to new entrants.
The Group also operates a number of unfunded defined benefit plans, which are included in the figures below.
Post retirement healthcare plansCertain subsidiaries of the Group, mainly in the US and Canada, provide health and life insurance benefits to retired employees and in some cases to theirbeneficiaries and covered dependants. Eligibility for cover is dependent upon certain age and service criteria. These arrangements are generally unfunded, and areincluded in the figures below.
Plan assetsThe assets of the pension plans are invested predominantly in a diversified range of equities, bonds and property. Consequently the funding level of the pensionplans is affected by movements in the level of equity markets and also by movements in interest rates. The Group monitors its exposure to changes in interestrates and equity markets and also measures its balance sheet pension risk using a Value at Risk approach. These measures are considered when deciding whethersignificant changes in investment strategy are required. Asset-liability studies are conducted on a periodic basis for the main pension plans to determine theoptimal investment mix bearing in mind the Group’s tolerance for risk, the risk tolerance of the local sponsor companies and the views of the Pension Committeesand Trustee boards who are legally responsible for the investments of the plans. In Canada, the UK and Switzerland the Group works with the trustees to ensurethat the investment policy adopted is consistent with the Group’s tolerance for risk. In the US the Group has direct control over the investment policy, subject tothe local investment regulations.
The proportions of the total fair value of assets in the pension plans for each asset class at the balance sheet date were:
2014 2013
Equities 39.1% 45.3%– Quoted 35.4% 42.1%
– Private 3.7% 3.2%
Bonds 46.9% 40.4%– Government fixed income 13.6% 10.7%
– Government inflation-linked 11.8% 10.3%
– Corporate and other publicly quoted 20.7% 18.5%
– Private 0.8% 0.9%
Property 10.1% 8.7%– Quoted property funds 6.0% 4.6%
– Unquoted property funds 4.0% 4.0%
– Directly held property 0.1% 0.1%
Qualifying Insurance Policies 0.5% 1.7%
Cash & Other 3.4% 3.9%
100.0% 100.0%
The assets of the plans are managed on a day-to-day basis by external specialist fund managers. These managers may invest in the Group’s securities subject tolimits imposed by the relevant fiduciary committees and local legislation. The approximate total holding of Group securities within the plans is US$22 million(2013: US$40 million).
The holdings of quoted equities are invested either in pooled funds or segregated accounts held in the name of the relevant pension funds. These equity portfoliosare well diversified in terms of the geographic distribution and market sectors.
The holdings of government bonds are generally invested in the debt of the country in which a pension plan is situated. Corporate and other quoted bonds areusually of investment grade. Private debt is mainly in North America.
riotinto.com 169
STRATEG
ICREPO
RT
DIRECTO
RS’R
EPORT
FIN
AN
CIA
LS
TA
TE
ME
NT
SPR
ODUCTIO
N,R
ESERVES
ANDOPER
ATIO
NS
ADDITIO
NALINFO
RMATIO
N
For
per
sona
l use
onl
y

Notes to the 2014 financial statements continued
45 Post retirement benefits continuedThe quoted property funds are invested in a diversified range of properties. The directly held property is owned by the Swiss pension fund and is predominantlyinvested in properties in and around Zurich.
The holdings of Cash and Other are predominantly cash and short-term money market instruments.
Investments in private equity, private debt, unquoted property funds and directly held property are less liquid than the other investment classes listed above andtherefore the Group’s investment in those asset classes is restricted to a level that does not endanger the liquidity of the pension plans.
The Group does not currently utilise derivatives to manage risk in its pension plans. However, fund managers may use derivatives to hedge currency movementswithin their portfolios and, in the case of bond managers, to take positions that could be taken using direct holdings of bonds but more efficiently.
Maturity of defined benefit obligationsAn approximate analysis of the maturity of the obligations is given in the table below:
Pensionbenefits
Otherbenefits
2014Total
%
2013Total
%
2012Total
%
Proportion relating to current employees 25% 22% 25% 25% 29%
Proportion relating to former employees not yet retired 11% 2% 11% 11% 11%
Proportion relating to retirees 64% 76% 64% 64% 60%
Total 100% 100% 100% 100% 100%
Average duration of obligations (years) 14.0 13.0 13.9 13.3 14.1
Geographical distribution of defined benefit obligationsAn approximate analysis of the geographic distribution of the obligations is given in the table below:
Pensionbenefits
Otherbenefits
2014Total
%
2013Total
%
2012Total
%
Canada 47% 44% 46% 45% 49%
UK 29% 2% 27% 27% 23%
US 12% 52% 15% 14% 15%
Switzerland 5% 0% 5% 6% 5%
Eurozone 4% 0% 4% 5% 5%
Australia 2% 0% 2% 2% 2%
Other 1% 2% 1% 1% 1%
Total 100% 100% 100% 100% 100%
Total expense recognised in the income statement
Pensionbenefits
Otherbenefits
2014TotalUS$m
2013TotalUS$m
2012TotalUS$m
Current employer service cost for defined benefit plans (187) (9) (196) (284) (270)
Past service income/(cost) – 66 66 1 (4)
Curtailment (losses)/gains (1) – (1) 44 59
Settlement gains 22 – 22 2 –
Net interest cost on defined benefit liability (83) (50) (133) (209) (240)
Non-investment expenses paid from the plans (19) – (19) (22) (20)
Total defined benefit expense (268) 7 (261) (468) (475)
Current employer service cost for defined contribution and industry-wide plans (328) (1) (329) (337) (348)
Total expense recognised in the income statement (596) 6 (590) (805) (823)
The above expense amounts are included as an employee cost within net operating costs. In 2014, US$2 million (pre-tax) of curtailment and settlement gainsrelating to the closure of a site have been excluded from underlying earnings (2013: US$21 million, 2012: US$34 million, both relating to divestments).
The curtailments shown in the table above relate primarily to headcount reductions at various operations and divestments during 2014 and previous years.The settlement gains in 2014 and 2013 relate mainly to an exercise in the US in which deferred vested participants were offered a one-time lump sum payment inplace of their future pension payments. The other benefits past service income during 2014 relates to design changes to US post-retirement medical plans.
Total amount recognised in other comprehensive income before tax
2014US$m
2013US$m
2012US$m
Actuarial (losses)/gains (1,853) 1,092 (1,235)
Return on assets (net of interest on assets) 1,127 1,212 903
Loss on application of asset ceiling (9) (44) –
Total (loss)/gain recognised in other comprehensive income (735) 2,260 (332)
170 riotinto.com
For
per
sona
l use
onl
y

Amounts recognised in the balance sheet
The following amounts were measured in accordance with IAS 19 at 31 December:
Pensionbenefits
Otherbenefits
2014TotalUS$m
2013TotalUS$m
Total fair value of plan assets 15,219 – 15,219 15,527
Present value of obligations – funded (16,869) – (16,869) (16,699)
Present value of obligations – unfunded (983) (1,047) (2,030) (2,093)
Present value of obligations – total (17,852) (1,047) (18,899) (18,792)
Effect of asset ceiling (53) – (53) (44)
Net deficit to be shown in the balance sheet (2,686) (1,047) (3,733) (3,309)
Comprising:
– Deficits (3,039) (1,047) (4,086) (3,599)
– Surpluses 353 – 353 290
Net deficits on pension plans (2,686) – (2,686) (2,215)Unfunded post retirement healthcare obligation – (1,047) (1,047) (1,094)
The surplus amounts shown above are included in the balance sheet as Trade and other receivables. See note 18.
Deficits are shown in the balance sheet within Provisions (including post retirement benefits). See note 26.
Funding policy and contributions to plans
The Group reviews the funding position of its major pension plans on a regular basis and considers whether to provide funding above the minimum level requiredin each country. In Canada and the US the minimum level is prescribed by legislation. In the UK and Switzerland the minimum is negotiated with the local Trusteeor Foundation in accordance with the funding guidance issued by the local regulators. In deciding whether to provide funding above the minimum level the Grouptakes into account other possible uses of cash within the Group, the tax situation of the local sponsoring entity and any strategic advantage that the Group mightobtain by accelerating contributions. The Group does not generally pre-fund post-retirement healthcare arrangements.
Pensionbenefits
Otherbenefits
2014TotalUS$m
2013TotalUS$m
2012TotalUS$m
Contributions
Contributions to defined benefit plans 291 62 353 734 727
Contributions to defined contribution plans 309 1 310 317 328
Contributions to industry-wide plans 19 – 19 20 20
Total 619 63 682 1,071 1,075
Contributions to defined benefit pension plans for 2015 are estimated to be around US$375 million. This is kept under regular review and actual contributions willbe determined in line with the Group’s wider financing strategy, taking into account relevant minimum funding requirements. As contributions to many plans arereviewed on at least an annual basis, the contributions for 2015 and subsequent years cannot be determined in advance and may be higher or lower than this.Healthcare plans are generally unfunded and contributions for future years will be equal to benefit payments net of participant contributions. The Group’scontributions are expected to be similar to the amounts paid in 2014.
Movements in the net defined benefit liability
A summary of the movement in the net defined benefit liability is shown in the first table below. The subsequent tables provide a more detailed analysis of themovements in the present value of the obligations, the fair value of assets and the effect of the asset ceiling.
The amounts shown below include, where appropriate, 100 per cent of the costs, contributions, gains and losses in respect of employees who participate in theplans and who are employed in associates and joint arrangements. Consequently, the costs, contributions, gains and losses may not correspond directly to theamounts disclosed above in respect of the Group. Defined contribution plans and industry-wide plans are excluded from the movements below.
Pensionbenefits
Otherbenefits
2014TotalUS$m
2013TotalUS$m
Change in the net defined benefit liability:
Net defined benefit liability at start of the year (2,215) (1,094) (3,309) (6,051)
Amounts recognised in Income (268) 7 (261) (468)
Amounts recognised in Other Comprehensive Income (668) (67) (735) 2,260
Employer contributions 291 62 353 734
Divestments/newly included arrangements 13 – 13 19
Currency exchange rate movements 161 45 206 197
Net defined benefit liability at end of the year (2,686) (1,047) (3,733) (3,309)
riotinto.com 171
STRATEG
ICREPO
RT
DIRECTO
RS’R
EPORT
FIN
AN
CIA
LS
TA
TE
ME
NT
SPR
ODUCTIO
N,R
ESERVES
ANDOPER
ATIO
NS
ADDITIO
NALINFO
RMATIO
N
For
per
sona
l use
onl
y

Notes to the 2014 financial statements continued
45 Post retirement benefits continued
Pensionbenefits
Otherbenefits
2014TotalUS$m
2013TotalUS$m
Change in present value of obligation:
Present value of obligation at start of the year (17,698) (1,094) (18,792) (20,722)
Current employer service cost (187) (9) (196) (284)
Past service cost – 66 66 1
Curtailments (1) – (1) 44
Settlements 326 – 326 131
Interest on obligations (733) (50) (783) (776)
Contributions by plan participants (32) (5) (37) (41)
Benefits paid 975 67 1,042 1,086
Experience gain 27 29 56 90
Changes in financial assumptions (loss)/gain (1,624) (94) (1,718) 965
Changes in demographic assumptions (loss)/gain (189) (2) (191) 37
Arrangements divested 58 – 58 94
Currency exchange rate gain 1,226 45 1,271 583
Present value of obligation at end of the year (17,852) (1,047) (18,899) (18,792)
Pensionbenefits
Otherbenefits
2014TotalUS$m
2013TotalUS$m
Change in plan assets:
Fair value of plan assets at the start of the year 15,527 – 15,527 14,671
Settlements (304) – (304) (129)
Interest on assets 655 – 655 567
Contributions by plan participants 32 5 37 41
Contributions by employer 291 62 353 734
Benefits paid (975) (67) (1,042) (1,086)
Non-investment expenses (19) – (19) (22)
Return on plan assets (net of interest on assets) 1,127 – 1,127 1,212
Arrangements divested (45) – (45) (75)
Currency exchange rate loss (1,070) – (1,070) (386)
Fair value of plan assets at the end of the year 15,219 – 15,219 15,527
Pensionbenefits
Otherbenefits
2014TotalUS$m
2013TotalUS$m
Change in the effect of the asset ceiling:
Effect of the asset ceiling at the start of the year (44) – (44) –
Interest on the effect of the asset ceiling (5) – (5) –
Movement in the effect of the asset ceiling (9) – (9) (44)
Currency exchange rate gain 5 – 5 –
Effect of the asset ceiling at the end of the year (53) – (53) (44)
In determining the extent to which the asset ceiling has an effect, the Group considers the funding legislation in each country and the rules specific to eachpension plan. The calculation takes into account any minimum funding requirements that may be applicable to the plan, whether any reduction in future Groupcontributions is available, and whether a refund of surplus may be available. Where the plan rules and legislation both permit the employer to take a refund ofsurplus the asset ceiling may have no effect, although it may be the case that a refund will only be available many years in the future.
172 riotinto.com
For
per
sona
l use
onl
y

Main assumptions (rates per annum)The main assumptions for the valuations of the plans under IAS 19 are set out below.
Canada UK US Switzerland Eurozone Australia
Other(mainlyAfrica)(a)
At 31 December 2014
Rate of increase in salaries 3.1% 3.8% 3.6% 2.3% 2.1% 4.0% 9.1%
Rate of increase in pensions 0.7% 2.6% – 0.0% 1.5% 2.1% 7.1%
Discount rate 3.9% 3.4% 3.8% 0.9% 1.8% 2.7% 9.0%
Inflation (b) 1.8% 3.0% 2.1% 1.3% 1.7% 2.1% 7.1%
At 31 December 2013
Rate of increase in salaries 3.3% 5.0% 3.8% 2.3% 2.6% 4.4% 9.0%
Rate of increase in pensions 0.8% 3.0% – 0.2% 1.5% 2.7% 7.0%
Discount rate 4.6% 4.4% 4.6% 2.2% 3.4% 4.1% 9.1%Inflation (b) 2.0% 3.4% 2.3% 1.3% 1.9% 2.7% 7.0%
(a) The assumptions vary by location for the ‘Other’ plans. Assumptions shown are for Southern Africa.
(b) The inflation assumption shown for the UK is for the Retail Price Index. The assumption for the Consumer Price Index at 31 December 2014 was 2.0 per cent (2013: 2.4 per cent).
The main financial assumptions used for the healthcare plans, which are predominantly in the US and Canada, were: discount rate: 3.9 per cent (2013:4.6 per cent), medical trend rate: 6.7 per cent reducing to 5.1 per cent by the year 2022 broadly on a straight line basis (2013: 6.8 per cent, reducing to 5.1 per centby the year 2022), claims costs based on individual company experience.
For both the pension and healthcare arrangements the post retirement mortality assumptions allow for future improvements in longevity. The mortality tablesused imply that a man aged 60 at the balance sheet date has a weighted average expected future lifetime of 26 years (2013: 25 years) and that a man aged 60 in2034 would have a weighted average expected future lifetime of 28 years (2013: 27 years).
SensitivityThe values reported for the defined benefit obligations are sensitive to the actuarial assumptions used for projecting future benefit payments and discountingthose payments. In order to estimate the sensitivity of the obligations to changes in assumptions we calculate what the obligations would be if we were tomake small changes to each of the key assumptions in isolation. The difference between this figure and the figure calculated using our stated assumptions isan indication of the sensitivity to changes in each assumption. The results of this sensitivity analysis are summarised in the table below. Note that thisapproach is valid for small changes in the assumptions but will be less accurate for larger changes in the assumptions.
2014 2013
Approximate (increase)/decrease in obligations
Approximate (increase)/decrease in obligations
Assumption Change in assumptionPensions
US$mOtherUS$m
PensionsUS$m
OtherUS$m
Discount rate increase of 0.5 percentage points 1,166 63 1,095 62
decrease of 0.5 percentage points (1,250) (68) (1,169) (66)
Inflation increase of 0.5 percentage points (653) (23) (626) (32)
decrease of 0.5 percentage points 620 20 594 29
Salary increases increase of 0.5 percentage points (100) (2) (100) (3)
decrease of 0.5 percentage points 97 2 97 2
Demographic – allowance for futureimprovements in longevity
participants assumed to have the mortality rates ofindividuals who are one year older 477 18 437 16
participants assumed to have the mortality rates ofindividuals who are one year younger (477) (18) (437) (16)
Medical cost trend rates increase of 1.0 percentage points – (41) – (59)
decrease of 1.0 percentage points – 35 – 54
Information on the sensitivity of the Group’s earnings to the main assumptions is set out in note 1 (Critical accounting policies and estimates section (x)) onpage 122.
riotinto.com 173
STRATEG
ICREPO
RT
DIRECTO
RS’R
EPORT
FIN
AN
CIA
LS
TA
TE
ME
NT
SPR
ODUCTIO
N,R
ESERVES
ANDOPER
ATIO
NS
ADDITIO
NALINFO
RMATIO
N
For
per
sona
l use
onl
y

Notes to the 2014 financial statements continued
46 Rio Tinto Limited parent company disclosures
As at 31 December2014A$m
2013A$m
Assets
Current assets 16,523 1,490
Non-current assets 11,302 11,480
Total assets 27,825 12,970
Liabilities
Current liabilities (8,230) (1,336)
Non-current liabilities (38) (329)
Total liabilities (8,268) (1,665)
Net assets 19,557 11,305
Shareholders’ equity
Share capital 4,113 4,113
Other reserves 377 272
Retained earnings 15,067 6,920
Total equity 19,557 11,305
Profit of the parent company 9,121 4,861
Total comprehensive income of the parent company 9,122 4,861
Prepared under Australian Accounting Standards (AAS). In relation to Rio Tinto Limited there are no significant measurement differences between AAS and IFRS asdefined in note 1.
Rio Tinto Limited guaranteesRio Tinto Limited provides a number of guarantees in respect of Group companies.
Rio Tinto plc and Rio Tinto Limited have jointly guaranteed the Group’s external listed debt under the US Shelf Programme, European Debt Issuance Programmeand Commercial Paper Programme which totalled A$25.4 billion at 31 December 2014 (31 December 2013: A$26.0 billion); in addition these entities also jointlyguarantee the Group’s undrawn credit facility which was A$9.1 billion at 31 December 2014 (31 December 2013: A$8.4 billion).
Rio Tinto Limited has guaranteed external debt held by Rio Tinto Group entities which totalled A$0.1billion at 31 December 2014 (31 December 2013:A$0.1 billion) and provided guarantees in respect of certain derivative contracts which were in a liability position of A$6 million at 31 December 2014(31 December 2013: A$nil).
In addition, Rio Tinto Limited has provided a guarantee of certain obligations of Rio Tinto Finance Limited, a wholly owned subsidiary.
Pursuant to the DLC merger, both Rio Tinto plc and Rio Tinto Limited issued deed poll guarantees by which each company guaranteed contractual obligationsincurred by the other or guaranteed by the other.
174 riotinto.com
For
per
sona
l use
onl
y
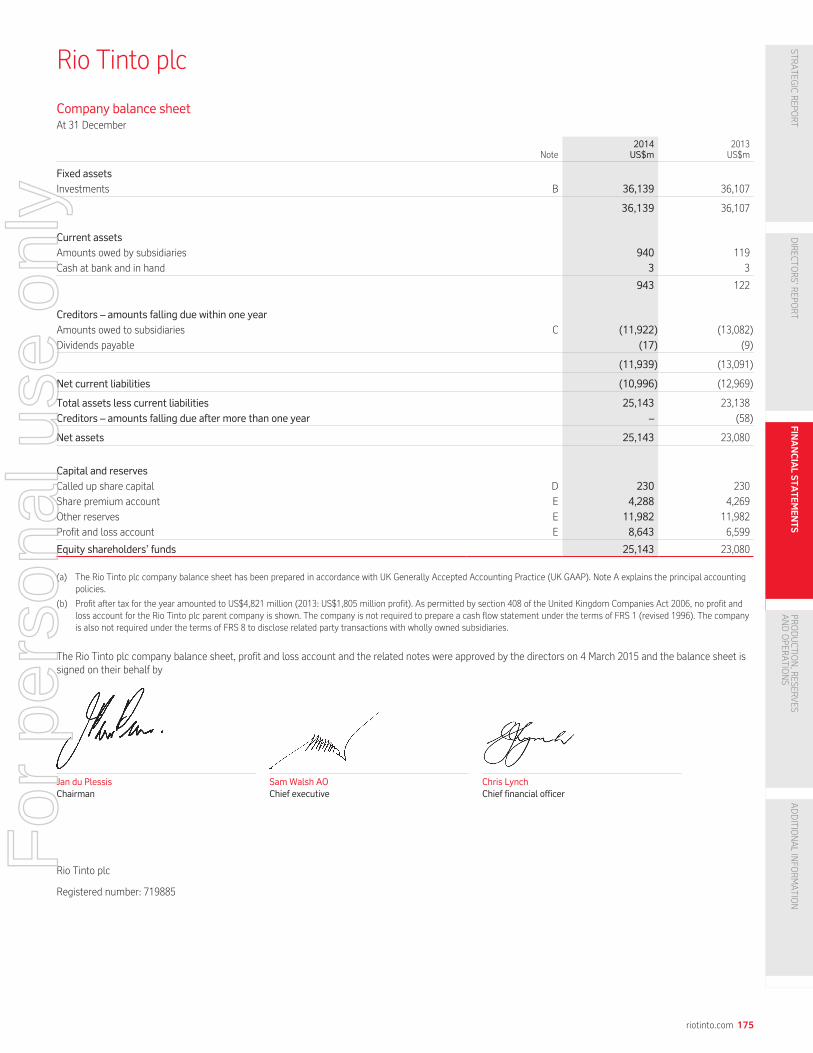
Rio Tinto plc
Company balance sheetAt 31 December
Note2014US$m
2013US$m
Fixed assets
Investments B 36,139 36,107
36,139 36,107
Current assets
Amounts owed by subsidiaries 940 119
Cash at bank and in hand 3 3
943 122
Creditors – amounts falling due within one year
Amounts owed to subsidiaries C (11,922) (13,082)
Dividends payable (17) (9)
(11,939) (13,091)
Net current liabilities (10,996) (12,969)
Total assets less current liabilities 25,143 23,138
Creditors – amounts falling due after more than one year – (58)
Net assets 25,143 23,080
Capital and reserves
Called up share capital D 230 230
Share premium account E 4,288 4,269
Other reserves E 11,982 11,982
Profit and loss account E 8,643 6,599
Equity shareholders’ funds 25,143 23,080
(a) The Rio Tinto plc company balance sheet has been prepared in accordance with UK Generally Accepted Accounting Practice (UK GAAP). Note A explains the principal accountingpolicies.
(b) Profit after tax for the year amounted to US$4,821 million (2013: US$1,805 million profit). As permitted by section 408 of the United Kingdom Companies Act 2006, no profit andloss account for the Rio Tinto plc parent company is shown. The company is not required to prepare a cash flow statement under the terms of FRS 1 (revised 1996). The companyis also not required under the terms of FRS 8 to disclose related party transactions with wholly owned subsidiaries.
The Rio Tinto plc company balance sheet, profit and loss account and the related notes were approved by the directors on 4 March 2015 and the balance sheet issigned on their behalf by
Jan du Plessis SamWalsh AO Chris Lynch
Chairman Chief executive Chief financial officer
Rio Tinto plc
Registered number: 719885
riotinto.com 175
STRATEG
ICREPO
RT
DIRECTO
RS’R
EPORT
FIN
AN
CIA
LS
TA
TE
ME
NT
SPR
ODUCTIO
N,R
ESERVES
ANDOPER
ATIO
NS
ADDITIO
NALINFO
RMATIO
N
For
per
sona
l use
onl
y

Rio Tinto plc continued
A Principal accounting policies under UK GAAPa Basis of Accounting
The Rio Tinto plc entity financial statements have been prepared under UK GAAP using the historical cost convention, except for financial guarantees which havebeen measured at fair value as set out in note (e) below, and in accordance with applicable UK accounting standards and the Companies Act 2006. The directorshave reviewed the Company’s existing accounting policies and consider that they are consistent with the requirements of Financial Reporting Standard (FRS) 18“Accounting Policies” and with last year. The financial statements have been prepared on a going concern basis.
The principal accounting policies have been applied consistently throughout the year and are set out below.
b Deferred tax
Full provision is made for deferred taxation on all timing differences that have arisen but not reversed at the balance sheet date, except that deferred tax assets areonly recognised to the extent that it is more likely than not that they will be recovered. Deferred tax is measured at the average tax rates that are expected to applyin the periods in which the timing differences are expected to reverse, based on tax rates and laws that have been enacted or substantively enacted by the balancesheet date. Deferred tax is measured on an undiscounted basis. There are no unprovided amounts relating to deferred tax.
c Currency translation
The Company’s local or ‘functional’ currency is the US dollar. Transactions denominated in other currencies, including the issue of shares, are translated at therate of exchange ruling on the date of the transaction. Monetary assets and liabilities denominated in other currencies are translated at the rate of exchange rulingat the end of the financial year. Exchange rates used are consistent with the rates used by the Group as disclosed in the consolidated financial statements (seenote 41). Exchange differences are charged or credited to the profit and loss account in the year in which they arise.
d Investments
Fixed asset investments are valued at cost less impairment provisions. Investments are reviewed for impairment if events or changes in circumstances indicatethat the carrying amount may not be recoverable. When a review for impairment is conducted, the recoverable amount is assessed by reference to the net presentvalue of expected future cash flows of the relevant income generating unit or disposal value if higher. The discount rate applied is based upon the Company’sweighted average cost of capital, with appropriate adjustment for the risks associated with the relevant unit.
e Financial guarantees
Obligations for financial guarantees issued by the Company to other Group companies are reflected as liabilities at fair value, in accordance with FRS 26 “Financialinstruments – measurement”. Such obligations result in corresponding increases in the carrying value of amounts owed by subsidiaries. Payments received are setoff against the asset recognised which is initially recorded at fair value.
f Share based payments
The fair value of the grant is recognised as an addition to the cost of the investment in the subsidiary in which the relevant employees work. The fair value isrecognised over the relevant vesting period, with a corresponding adjustment to the profit and loss account reserve. Payments received from the Company’ssubsidiaries in respect of these share based payments result in a credit to reduce the cost of the investment. The fair value of the share plans is determined at thedate of grant, taking into account any market based vesting conditions attached to the award (eg total shareholder return). When market prices are not available,the Company uses fair values provided by independent actuaries using a lattice based option valuation model.
Non-market vesting conditions (eg earnings per share targets) are taken into account in estimating the number of awards likely to vest. The estimate of thenumber of awards likely to vest is reviewed at each balance sheet date up to the vesting date, at which point the estimate is adjusted to reflect the actual awardsissued. No adjustment is made after the vesting date even if the awards are forfeited or not exercised.
g Revenue recognition
Interest is accounted for on the accruals basis. Dividend income is recognised when the right to receive payment is established.
h Dividends
Dividends payable are recognised when they meet the criteria for a present obligation (ie when they have been approved).
i Treasury shares
The consideration paid for shares repurchased by the Company and held as treasury shares is recognised as a reduction in shareholders’ funds through the profitand loss account reserve.
B Rio Tinto plc fixed assets
2014US$m
2013US$m
Fixed asset investments
Shares in Group companies:At 1 January 36,107 36,111
Additions 78 69
Other adjustments (46) (73)
At 31 December 36,139 36,107
The directors believe that the carrying value of the individual investments is supported by their underlying net assets.
176 riotinto.com
For
per
sona
l use
onl
y
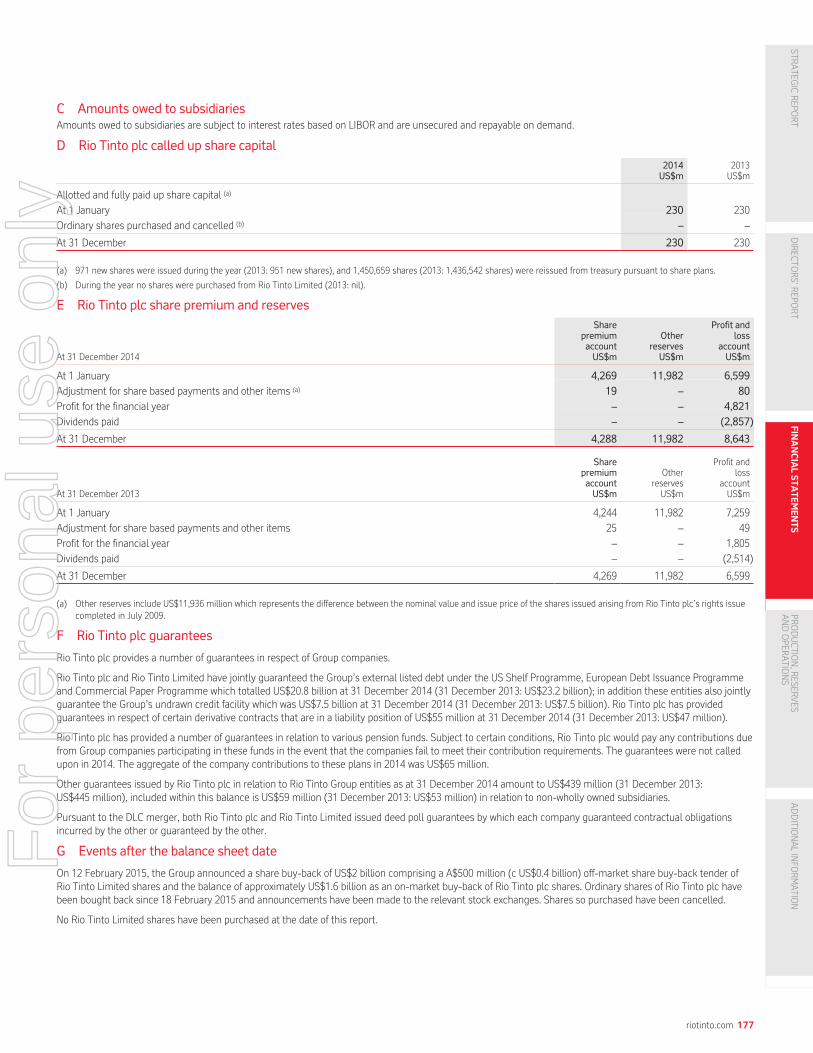
C Amounts owed to subsidiariesAmounts owed to subsidiaries are subject to interest rates based on LIBOR and are unsecured and repayable on demand.
D Rio Tinto plc called up share capital
2014US$m
2013US$m
Allotted and fully paid up share capital (a)
At 1 January 230 230
Ordinary shares purchased and cancelled (b) – –
At 31 December 230 230
(a) 971 new shares were issued during the year (2013: 951 new shares), and 1,450,659 shares (2013: 1,436,542 shares) were reissued from treasury pursuant to share plans.
(b) During the year no shares were purchased from Rio Tinto Limited (2013: nil).
E Rio Tinto plc share premium and reserves
At 31 December 2014
SharepremiumaccountUS$m
OtherreservesUS$m
Profit andloss
accountUS$m
At 1 January 4,269 11,982 6,599
Adjustment for share based payments and other items (a) 19 – 80
Profit for the financial year – – 4,821
Dividends paid – – (2,857)
At 31 December 4,288 11,982 8,643
At 31 December 2013
SharepremiumaccountUS$m
OtherreservesUS$m
Profit andloss
accountUS$m
At 1 January 4,244 11,982 7,259
Adjustment for share based payments and other items 25 – 49
Profit for the financial year – – 1,805
Dividends paid – – (2,514)
At 31 December 4,269 11,982 6,599
(a) Other reserves include US$11,936 million which represents the difference between the nominal value and issue price of the shares issued arising from Rio Tinto plc’s rights issuecompleted in July 2009.
F Rio Tinto plc guarantees
Rio Tinto plc provides a number of guarantees in respect of Group companies.
Rio Tinto plc and Rio Tinto Limited have jointly guaranteed the Group’s external listed debt under the US Shelf Programme, European Debt Issuance Programmeand Commercial Paper Programme which totalled US$20.8 billion at 31 December 2014 (31 December 2013: US$23.2 billion); in addition these entities also jointlyguarantee the Group’s undrawn credit facility which was US$7.5 billion at 31 December 2014 (31 December 2013: US$7.5 billion). Rio Tinto plc has providedguarantees in respect of certain derivative contracts that are in a liability position of US$55 million at 31 December 2014 (31 December 2013: US$47 million).
Rio Tinto plc has provided a number of guarantees in relation to various pension funds. Subject to certain conditions, Rio Tinto plc would pay any contributions duefrom Group companies participating in these funds in the event that the companies fail to meet their contribution requirements. The guarantees were not calledupon in 2014. The aggregate of the company contributions to these plans in 2014 was US$65 million.
Other guarantees issued by Rio Tinto plc in relation to Rio Tinto Group entities as at 31 December 2014 amount to US$439 million (31 December 2013:US$445 million), included within this balance is US$59 million (31 December 2013: US$53 million) in relation to non-wholly owned subsidiaries.
Pursuant to the DLC merger, both Rio Tinto plc and Rio Tinto Limited issued deed poll guarantees by which each company guaranteed contractual obligationsincurred by the other or guaranteed by the other.
G Events after the balance sheet date
On 12 February 2015, the Group announced a share buy-back of US$2 billion comprising a A$500 million (c US$0.4 billion) off-market share buy-back tender ofRio Tinto Limited shares and the balance of approximately US$1.6 billion as an on-market buy-back of Rio Tinto plc shares. Ordinary shares of Rio Tinto plc havebeen bought back since 18 February 2015 and announcements have been made to the relevant stock exchanges. Shares so purchased have been cancelled.
No Rio Tinto Limited shares have been purchased at the date of this report.
riotinto.com 177
STRATEG
ICREPO
RT
DIRECTO
RS’R
EPORT
FIN
AN
CIA
LS
TA
TE
ME
NT
SPR
ODUCTIO
N,R
ESERVES
ANDOPER
ATIO
NS
ADDITIO
NALINFO
RMATIO
N
For
per
sona
l use
onl
y

Rio Tinto financial information by business unit
Gross revenue(a)for the year ended 31 December
EBITDA(b)
for the year ended 31 DecemberNet earnings(c)
for the year ended 31 December
Rio Tintointerest
%2014US$m
2013US$m
2012US$m
2014US$m
2013US$m
2012US$m
2014US$m
2013US$m
2012US$m
Iron Ore
Pilbara (d) 21,482 23,633 22,185 13,701 16,511 15,143 7,956 9,568 9,142
Iron Ore Company of Canada 58.7 1,696 2,258 1,972 516 927 665 144 305 230
Product group operations 23,178 25,891 24,157 14,217 17,438 15,808 8,100 9,873 9,372
Evaluation projects/other 103 103 122 27 4 (129) 7 (15) (125)
23,281 25,994 24,279 14,244 17,442 15,679 8,107 9,858 9,247
Aluminium (e)
Bauxite 1,956 2,012 1,710 752 765 648 429 377 326
Alumina 2,158 2,090 2,274 (54) (226) (237) (209) (265) (343)
Intrasegment (834) (739) (687)
Bauxite & Alumina 3,280 3,363 3,297 698 539 411 220 112 (17)
Primary Metal 5,867 5,771 5,623 1,604 976 806 629 200 65
Pacific Aluminium 2,483 2,348 2,447 524 252 66 291 126 (92)
Intersegment & Other (2,087) (2,087) (2,006) (43) 8 (53) (6) 15 (18)
Integrated Operations 9,543 9,395 9,361 2,783 1,775 1,230 1,134 453 (62)
Other Product Group Items 2,373 2,866 2,650 36 32 74 26 28 52
Product group operations 11,916 12,261 12,011 2,819 1,807 1,304 1,160 481 (10)
Evaluation projects/other 207 202 159 111 87 66 88 76 64
12,123 12,463 12,170 2,930 1,894 1,370 1,248 557 54
Copper
Kennecott Utah Copper 100.0 2,186 2,194 2,412 958 840 977 523 428 511
Escondida 30.0 2,282 2,566 2,566 1,292 1,453 1,597 612 777 835
Grasberg joint venture (f) 49 39 17 6 2 2 (17) (21) (17)
Oyu Tolgoi (g) 1,736 55 – 401 (225) – (14) (90) –
Palabora (h) – 526 1,072 – 105 64 – 42 3
Northparkes (h) – 351 453 – 227 247 – 141 144
Product group operations 6,253 5,731 6,520 2,657 2,402 2,887 1,104 1,277 1,476
Evaluation projects/other 29 185 141 (321) (652) (1,040) (192) (456) (417)
6,282 5,916 6,661 2,336 1,750 1,847 912 821 1,059
Energy
Rio Tinto Coal Australia (i) 3,560 4,413 4,998 450 1,041 1,030 21 367 402
Rio Tinto Coal Mozambique (j) 59 88 10 (96) (114) (64) (93) (142) (92)
Rössing 68.6 221 309 352 10 44 3 (7) 4 (21)
Energy Resources of Australia 68.4 345 339 416 (97) 67 65 (119) (95) (131)
Product group operations 4,185 5,149 5,776 267 1,038 1,034 (198) 134 158
Evaluation projects/other 123 305 286 (16) (132) 218 (12) (101) 151
4,308 5,454 6,062 251 906 1,252 (210) 33 309
Diamonds & Minerals
Diamonds (k) 901 852 741 315 257 106 104 53 (25)
Rio Tinto Iron & Titanium (l) 2,168 2,251 2,232 689 728 793 248 264 409
Rio Tinto Minerals 675 657 656 212 205 215 121 131 140
Dampier Salt 68.4 398 404 416 67 43 23 18 7 (4)
Product group operations 4,142 4,164 4,045 1,283 1,233 1,137 491 455 520
Simandou iron ore project – – – (97) (71) (328) (55) (43) (262)
Evaluation projects/other 8 29 11 (42) (77) (129) (35) (62) (109)
4,150 4,193 4,056 1,144 1,085 680 401 350 149
Other Operations (m) 241 1,761 3,898 (291) (401) (527) (243) (281) (582)
Intersegment transactions (344) (1,182) (1,560) – (4) (10) – (4) (8)
Product Group Total 50,041 54,599 55,566 20,614 22,672 20,291 10,215 11,334 10,228
Refer to notes (a) to (p) on page 182.
178 riotinto.com
For
per
sona
l use
onl
y
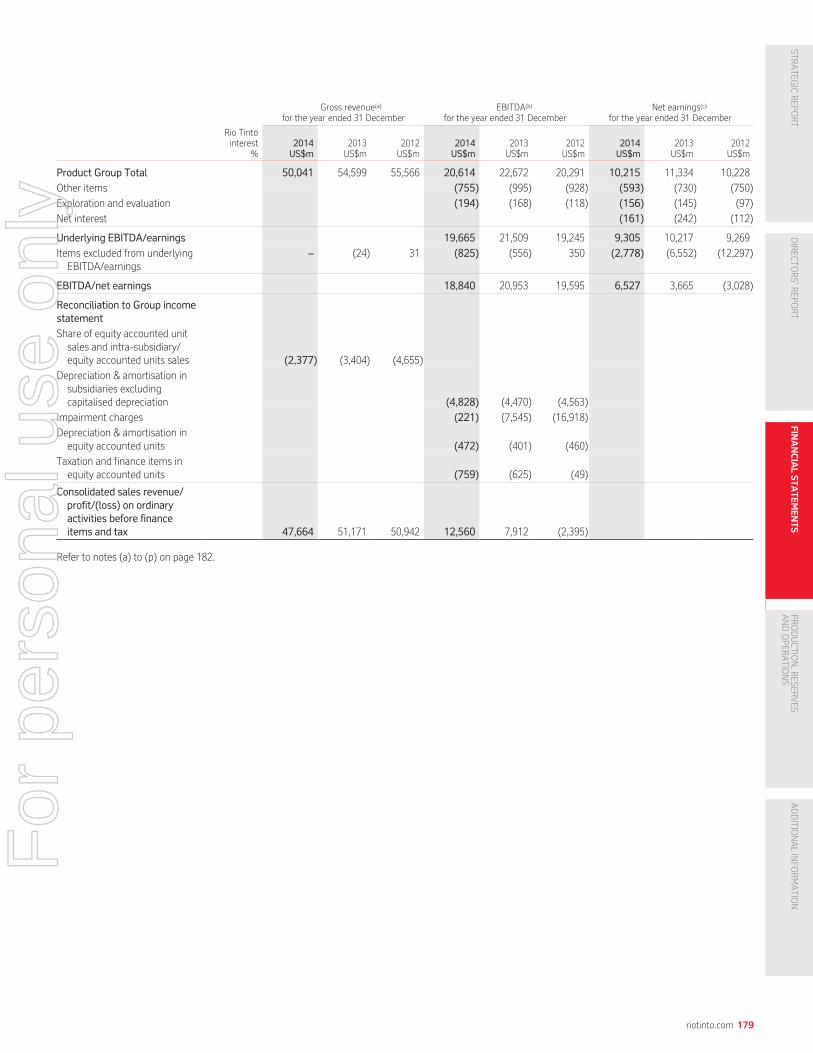
Gross revenue(a)for the year ended 31 December
EBITDA(b)
for the year ended 31 DecemberNet earnings(c)
for the year ended 31 December
Rio Tintointerest
%2014US$m
2013US$m
2012US$m
2014US$m
2013US$m
2012US$m
2014US$m
2013US$m
2012US$m
Product Group Total 50,041 54,599 55,566 20,614 22,672 20,291 10,215 11,334 10,228
Other items (755) (995) (928) (593) (730) (750)
Exploration and evaluation (194) (168) (118) (156) (145) (97)
Net interest (161) (242) (112)
Underlying EBITDA/earnings 19,665 21,509 19,245 9,305 10,217 9,269
Items excluded from underlyingEBITDA/earnings
– (24) 31 (825) (556) 350 (2,778) (6,552) (12,297)
EBITDA/net earnings 18,840 20,953 19,595 6,527 3,665 (3,028)
Reconciliation to Group incomestatement
Share of equity accounted unitsales and intra-subsidiary/equity accounted units sales (2,377) (3,404) (4,655)
Depreciation & amortisation insubsidiaries excludingcapitalised depreciation (4,828) (4,470) (4,563)
Impairment charges (221) (7,545) (16,918)
Depreciation & amortisation inequity accounted units (472) (401) (460)
Taxation and finance items inequity accounted units (759) (625) (49)
Consolidated sales revenue/profit/(loss) on ordinaryactivities before financeitems and tax 47,664 51,171 50,942 12,560 7,912 (2,395)
Refer to notes (a) to (p) on page 182.
riotinto.com 179
STRATEG
ICREPO
RT
DIRECTO
RS’R
EPORT
FIN
AN
CIA
LS
TA
TE
ME
NT
SPR
ODUCTIO
N,R
ESERVES
ANDOPER
ATIO
NS
ADDITIO
NALINFO
RMATIO
N
For
per
sona
l use
onl
y
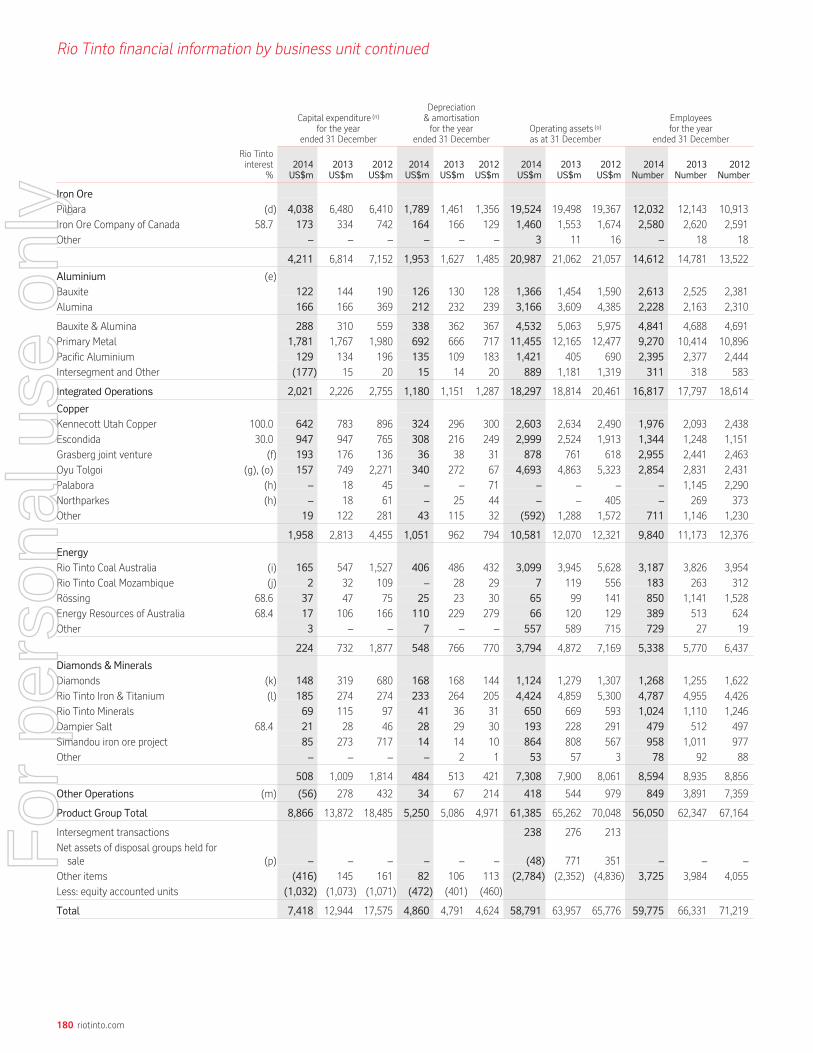
Rio Tinto financial information by business unit continued
Capital expenditure (n)
for the yearended 31 December
Depreciation& amortisationfor the year
ended 31 DecemberOperating assets (o)
as at 31 December
Employeesfor the year
ended 31 December
Rio Tintointerest
%2014US$m
2013US$m
2012US$m
2014US$m
2013US$m
2012US$m
2014US$m
2013US$m
2012US$m
2014Number
2013Number
2012Number
Iron Ore
Pilbara (d) 4,038 6,480 6,410 1,789 1,461 1,356 19,524 19,498 19,367 12,032 12,143 10,913
Iron Ore Company of Canada 58.7 173 334 742 164 166 129 1,460 1,553 1,674 2,580 2,620 2,591
Other – – – – – – 3 11 16 – 18 18
4,211 6,814 7,152 1,953 1,627 1,485 20,987 21,062 21,057 14,612 14,781 13,522
Aluminium (e)
Bauxite 122 144 190 126 130 128 1,366 1,454 1,590 2,613 2,525 2,381
Alumina 166 166 369 212 232 239 3,166 3,609 4,385 2,228 2,163 2,310
Bauxite & Alumina 288 310 559 338 362 367 4,532 5,063 5,975 4,841 4,688 4,691
Primary Metal 1,781 1,767 1,980 692 666 717 11,455 12,165 12,477 9,270 10,414 10,896
Pacific Aluminium 129 134 196 135 109 183 1,421 405 690 2,395 2,377 2,444
Intersegment and Other (177) 15 20 15 14 20 889 1,181 1,319 311 318 583
Integrated Operations 2,021 2,226 2,755 1,180 1,151 1,287 18,297 18,814 20,461 16,817 17,797 18,614
Copper
Kennecott Utah Copper 100.0 642 783 896 324 296 300 2,603 2,634 2,490 1,976 2,093 2,438
Escondida 30.0 947 947 765 308 216 249 2,999 2,524 1,913 1,344 1,248 1,151
Grasberg joint venture (f) 193 176 136 36 38 31 878 761 618 2,955 2,441 2,463
Oyu Tolgoi (g), (o) 157 749 2,271 340 272 67 4,693 4,863 5,323 2,854 2,831 2,431
Palabora (h) – 18 45 – – 71 – – – – 1,145 2,290
Northparkes (h) – 18 61 – 25 44 – – 405 – 269 373
Other 19 122 281 43 115 32 (592) 1,288 1,572 711 1,146 1,230
1,958 2,813 4,455 1,051 962 794 10,581 12,070 12,321 9,840 11,173 12,376
Energy
Rio Tinto Coal Australia (i) 165 547 1,527 406 486 432 3,099 3,945 5,628 3,187 3,826 3,954
Rio Tinto Coal Mozambique (j) 2 32 109 – 28 29 7 119 556 183 263 312
Rössing 68.6 37 47 75 25 23 30 65 99 141 850 1,141 1,528
Energy Resources of Australia 68.4 17 106 166 110 229 279 66 120 129 389 513 624
Other 3 – – 7 – – 557 589 715 729 27 19
224 732 1,877 548 766 770 3,794 4,872 7,169 5,338 5,770 6,437
Diamonds & Minerals
Diamonds (k) 148 319 680 168 168 144 1,124 1,279 1,307 1,268 1,255 1,622
Rio Tinto Iron & Titanium (l) 185 274 274 233 264 205 4,424 4,859 5,300 4,787 4,955 4,426
Rio Tinto Minerals 69 115 97 41 36 31 650 669 593 1,024 1,110 1,246
Dampier Salt 68.4 21 28 46 28 29 30 193 228 291 479 512 497
Simandou iron ore project 85 273 717 14 14 10 864 808 567 958 1,011 977
Other – – – – 2 1 53 57 3 78 92 88
508 1,009 1,814 484 513 421 7,308 7,900 8,061 8,594 8,935 8,856
Other Operations (m) (56) 278 432 34 67 214 418 544 979 849 3,891 7,359
Product Group Total 8,866 13,872 18,485 5,250 5,086 4,971 61,385 65,262 70,048 56,050 62,347 67,164
Intersegment transactions 238 276 213
Net assets of disposal groups held forsale (p) – – – – – – (48) 771 351 – – –
Other items (416) 145 161 82 106 113 (2,784) (2,352) (4,836) 3,725 3,984 4,055
Less: equity accounted units (1,032) (1,073) (1,071) (472) (401) (460)
Total 7,418 12,944 17,575 4,860 4,791 4,624 58,791 63,957 65,776 59,775 66,331 71,219
180 riotinto.com
For
per
sona
l use
onl
y

Capital expenditure(n)for the year
ended 31 December
Depreciation& amortisationfor the year
ended 31 DecemberOperating assets(o)as at 31 December
Employeesfor the year
ended 31 December
Rio Tintointerest
%2014US$m
2013US$m
2012US$m
2014US$m
2013US$m
2012US$m
2014US$m
2013US$m
2012US$m
2014Number
2013Number
2012Number
Total 7,418 12,944 17,575 58,791 63,957 65,776
Add back: Proceeds from disposal ofproperty, plant and equipment 744 57 40
Total capital expenditure per cashflow statement 8,162 13,001 17,615
Less: Net debt (12,495) (18,055) (19,192)
Less: EAU funded balances excludedfrom net debt (11) (16) (31)
Equity attributable to owners ofRio Tinto 46,285 45,886 46,553
riotinto.com 181
STRATEG
ICREPO
RT
DIRECTO
RS’R
EPORT
FIN
AN
CIA
LS
TA
TE
ME
NT
SPR
ODUCTIO
N,R
ESERVES
ANDOPER
ATIO
NS
ADDITIO
NALINFO
RMATIO
N
For
per
sona
l use
onl
y
Notes to financial information by business unit
Business units are classified according to the Group’s management structure. Where presentational revisions are made, comparative amounts are adjustedaccordingly.
(a) Includes 100 per cent of subsidiaries’ sales revenue and the Group’s share of the sales revenue of equity accounted units (after adjusting for sales tosubsidiaries).
(b) EBITDA of subsidiaries and the Group’s share of EBITDA relating to equity accounted units represents profit before: tax, net finance items, depreciationand amortisation charged to the income statement in the year. Underlying EBITDA excludes the same items that are excluded from Underlyingearnings.
(c) Represents profit after tax for the period attributable to the owners of Rio Tinto. Business unit earnings are stated before finance items but after theamortisation of discount related to provisions. Earnings attributed to business units do not include amounts that are excluded in arriving at Underlyingearnings.
(d) Pilbara represents the Group’s 100 percent holding in Hamersley and 65 per cent holding of Robe River Iron Associates. 30 per cent of Robe River IronAssociates is held through a 60 per cent owned subsidiary and therefore the Group’s net beneficial interest is 53 per cent.
(e) Presented on an integrated operations basis splitting activities between Bauxite and Alumina, Primary Metal, Pacific Aluminium and Other integratedoperations (which in total reflect the results of the integrated production of aluminium) and Other product group items which relate to othercommercial activities. Following reintegration in 2013, the four aluminium smelters and the Gove bauxite mine previously grouped within PacificAluminium in Other Operations are included within the Aluminium group. The Gove alumina refinery is reported within Other Operations.
(f) Under the terms of a contractual agreement, Rio Tinto is entitled to 40 per cent of additional material mined as a consequence of expansions anddevelopments of the Grasberg facilities since 1998.
(g) Rio Tinto’s interest in Oyu Tolgoi LLC is held indirectly through its 50.8 per cent investment in Turquoise Hill Resources Ltd. which in turn owns66 per cent of Oyu Tolgoi.
(h) Rio Tinto completed the divestment of its 57.7 per cent interest in Palabora Mining Company on 31 July 2013 and of its 80 per cent interest in theNorthparkes mine on 1 December 2013.
(i) Includes Rio Tinto’s 80 per cent interest in Coal & Allied, through which Rio Tinto holds its beneficial interests in Bengalla, Mount Thorley andWarkworth of 32 per cent, 64 per cent and 44.5 per cent respectively.
(j) On 7 October 2014, Rio Tinto disposed of its interest in Rio Tinto Coal Mozambique (RTCM), including its interests in the Benga project, a 65:35 jointventure with Tata Steel Limited. Zululand Anthracite Colliery (ZAC), which was retained, is reported within Other Energy.
(k) Includes Rio Tinto’s interests in Argyle (100 per cent), Diavik (60 per cent) and Murowa (77.8 per cent).
(l) Includes Rio Tinto’s interests in Rio Tinto Fer et Titane (100 per cent), QIT Madagascar Minerals (80 per cent) and Richards Bay Minerals (attributableinterest of 74 per cent).
(m) Other Operations include Rio Tinto’s 100 per cent interest in the Gove alumina refinery (refer to note e) and Rio Tinto Marine.
(n) Capital expenditure comprises the net cash outflow on purchases less disposals of property, plant and equipment, capitalised evaluation costs andpurchases less disposals of other intangible assets. The details provided include 100 per cent of subsidiaries’ capital expenditure and Rio Tinto’s shareof the capital expenditure of equity accounted units.
(o) Operating assets of subsidiaries comprise net assets excluding post retirement assets and liabilities, net of tax, and are before deducting net debt.Operating assets are stated after deduction of non-controlling interests, which are calculated by reference to the net assets of the relevant companies(i.e. inclusive of such companies’ debt and amounts due to or from Rio Tinto Group companies). In addition, Oyu Tolgoi’s operating assets are shownnet of Turquoise Hill’s public shareholders’ interest in intragroup receivables from Oyu Tolgoi, previously shown in Other Copper. Comparativeamounts have been adjusted accordingly.
(p) Comprising Rio Tinto’s interests in the Blair Athol thermal coal mine and assets and liabilities relating to the anticipated disposal of SouthGobiResources Limited. Net assets held for sale at 31 December 2013 comprised the Clermont and Blair Athol thermal coal mines, and ZAC which is nolonger reported as held for sale. Amounts are presented after deducting non-controlling interests, including the non-controlling interests’ share ofthird party net debt and balances owed with Rio Tinto Group subsidiaries.
182 riotinto.com
For
per
sona
l use
onl
y

Australian Corporations Act – summary of ASIC relief
Pursuant to section 340 of the Corporations Act 2001 (‘Corporations Act’), the Australian Securities and Investments Commission issued an order dated 9 January2015 that granted relief to Rio Tinto Limited from certain requirements of the Corporations Act in relation to the Company’s financial statements and associatedreports. The order essentially continues the relief that has applied to Rio Tinto Limited since the formation of the Group’s Dual Listed Companies (DLC) structure in1995. The order applies to Rio Tinto Limited’s financial reporting obligations for the financial year ended 31 December 2014.
In essence, instead of being required under the Corporations Act to prepare consolidated financial statements covering only itself and its controlled entities, theorder allows Rio Tinto Limited to prepare consolidated financial statements in which it, Rio Tinto plc and their respective controlled entities are treated as a singleeconomic entity. In addition, those consolidated financial statements are to be prepared:
– in accordance with the principles and requirements of International Financial Reporting Standards as adopted by the European Union (EU IFRS) rather than theAustralian Accounting Standards (AAS) (except for one limited instance in the case of any concise report), and in accordance with United Kingdom financialreporting obligations generally;
– on the basis that the transitional provisions of International Financial Reporting Standard 1 First-time Adoption of International Financial Reporting Standardsshould be applied using the combined financial statements previously prepared for Rio Tinto Limited, Rio Tinto plc and their respective controlled entities underGenerally Accepted Accounting Principles in the United Kingdom, under which the DLC merger between Rio Tinto Limited and Rio Tinto plc was accounted forusing ‘merger’, rather than ‘acquisition’, accounting (reflecting that neither Rio Tinto Limited nor Rio Tinto plc was acquired by, or is controlled by, the other, andmeaning that the existing carrying amounts, rather than fair values, of assets and liabilities at the time of the DLC merger were used to measure those assetsand liabilities at formation);
– on the basis that Rio Tinto Limited and Rio Tinto plc are a single company (with their respective shareholders being the shareholders in that singlecompany); and
– with a reconciliation, from EU IFRS to AAS, of the following amounts: consolidated profit for the financial year, total consolidated income for the financial yearand total consolidated equity at the end of the financial year (see page 109).
Those consolidated financial statements must also be audited in relation to their compliance with relevant Australian and United Kingdom requirements. Rio TintoLimited must also prepare a Directors’ report which satisfies the content requirements of the Corporations Act (applied on the basis that for these purposes theconsolidated entity is the Group, and the consolidated financial statements cover the Group). This includes a Remuneration report (see pages 64 to 100) preparedin accordance with the requirements of the Corporations Act.
Rio Tinto Limited is also required to comply generally with the lodgement and distribution requirements of the Corporations Act (including timing requirements) inrelation to those consolidated financial statements (including any concise financial statements), the Auditor’s report and the Directors’ report. The CorporationsAct also requires that a non-binding resolution to adopt the Remuneration report be voted on by shareholders at the Company’s annual general meeting.
Rio Tinto Limited is not required to prepare separate consolidated financial statements solely for it and its controlled entities. Rio Tinto Limited is also not requiredto prepare and lodge parent entity financial statements for itself in respect of each relevant financial year.
However, Rio Tinto Limited must in accordance with the Corporations Act include in the consolidated financial statements for the Group, as a note, various parententity information regarding Rio Tinto Limited (including in relation to assets, liabilities, shareholders’ equity, profit and loss, income, guarantees, contingentliabilities, and contractual commitments) prepared in accordance with AAS (see page 174).
riotinto.com 183
STRATEG
ICREPO
RT
DIRECTO
RS’R
EPORT
FIN
AN
CIA
LS
TA
TE
ME
NT
SPR
ODUCTIO
N,R
ESERVES
ANDOPER
ATIO
NS
ADDITIO
NALINFO
RMATIO
N
For
per
sona
l use
onl
y

Directors’ declaration
Directors’ statement of responsibilities in relation to the Group financial statements, Rio Tinto plc financial statements andRio Tinto Limited financial statementsThe directors are responsible for preparing the Annual report, the Remuneration report and the financial statements in accordance with applicable law andregulations.
UK and Australian company law requires the directors to prepare financial statements for each financial year. Under UK laws the directors have elected to preparethe Group financial statements in accordance with International Financial Reporting Standards (IFRSs) as adopted by the European Union and the Rio Tinto plcfinancial statements in accordance with United Kingdom Generally Accepted Accounting Practice (United Kingdom Accounting Standards and applicable law).Under Australian law, the directors are also required to prepare certain Rio Tinto Limited parent company financial statements in accordance with AustralianAccounting Standards (AAS). In preparing the Group financial statements, the directors have also elected to comply with IFRSs, issued by the InternationalAccounting Standards Board (IASB).
Under UK and Australian company law the directors must not approve the financial statements unless they are satisfied that they give a true and fair view of thestate of affairs of the Group and the companies as at the end of the financial year and of the profit or loss of the companies and Group for the period (asapplicable).
In preparing these financial statements, the directors are required to:
– select suitable accounting policies and then apply them consistently;– make judgments and estimates that are reasonable and prudent;– state whether IFRSs as adopted by the European Union, applicable UK Accounting Standards and AAS have been followed, subject to any material departuresdisclosed and explained in the Group and parent company financial statements respectively; and
– prepare the financial statements on the going concern basis unless it is inappropriate to presume that the Group and the companies will continue in business.
The directors are responsible for keeping adequate accounting records that are sufficient to show and explain the transactions of the companies and the Groupand disclose with reasonable accuracy at any time the financial position of the companies and the Group and enable them to ensure that:
– the Group financial statements comply with the UK Companies Act 2006, the Australian Corporations Act 2001 as amended by the Australian Securities andInvestments Commission Order dated 9 January 2015 and Article 4 of the IAS Regulation,
– the Rio Tinto plc financial statements comply with the Companies Act 2006;– the Rio Tinto Limited parent company disclosures comply with the Corporations Act as amended by the Australian Securities and Investments CommissionOrder dated 9 January 2015; and
– the Remuneration Report complies with the Companies Act 2006 and the Corporations Act 2001 as amended by the Australian Securities and InvestmentsCommission Order dated 9 January 2015.
They are also responsible for safeguarding the assets of the companies and the Group and hence for taking reasonable steps for the prevention and detection offraud and other irregularities.
The directors are responsible for the maintenance and integrity of the Group’s website. Legislation governing the preparation and dissemination of financialstatements may differ between jurisdictions in which the Group reports.
Each of the current directors, whose names and function are listed on pages 49 to 51 in the Governance section confirm that, to the best of their knowledge:
– the Rio Tinto Group financial statements and notes, which have been prepared in accordance with IFRS as adopted by the EU, the Corporations Act 2001 asamended by the Australian Securities and Investments Commission Order dated 9 January 2015, the Companies Act 2006 and Article 4 of the IAS Regulation,give a true and fair view of the assets, liabilities, financial position and loss of the Group;
– the Rio Tinto plc financial statements and notes, which have been prepared in accordance with United Kingdom Generally Accepted Accounting Practice give atrue and fair view of the assets, liabilities, financial position and profit of the company;
– the Rio Tinto Limited parent company disclosures, which have been prepared in accordance with Australian Accounting Standards (AAS) and Corporations Act2001 as amended by the Australian Securities and Investments Commission Order dated 9 January 2015 give a true and fair view of the assets, liabilities,financial position and profit of the company;
– the Overview and Performance sections of the Annual report include a fair review of the development and performance of the business and the position of theGroup, together with a description of the principal risks and uncertainties that it faces; and
– there are reasonable grounds to believe that each of the Rio Tinto Group, Rio Tinto plc and Rio Tinto Limited will be able to pay its debts as and when theybecome due and payable.
The directors have been given the declarations by the chief executive and chief financial officer required by section 295A of the Corporations Act 2001 as amendedby the Australian Securities and Investments Commission Order dated 9 January 2015.
Disclosure of information to auditorsThe directors in office at the date of this report have each confirmed that:
– so far as he or she is aware, there is no relevant audit information of which the Group’s auditors are unaware; and– he or she has taken all the steps that he or she ought to have taken as a director to make himself or herself aware of any relevant audit information and toestablish that the Group’s auditors are aware of that information.
This declaration is made in accordance with a resolution of the board.
Jan du Plessis SamWalsh AO Chris Lynch
Chairman Chief executive Chief financial officer
4 March 2015 4 March 2015 4 March 2015
184 riotinto.com
For
per
sona
l use
onl
y

Auditor’s independence declaration
As lead auditor for the audit of Rio Tinto Limited for the year ended 31 December 2014, I declare that to the best of my knowledge and belief, there have been:
(a) no contraventions of the auditor independence requirements of the Corporations Act 2001 in relation to the audit; and
(b) no contraventions of any applicable code of professional conduct in relation to the audit.
This declaration is in respect of Rio Tinto Limited and the entities it controlled during the period.
Paul BendallPartner
PricewaterhouseCoopersMelbourne4 March 2015
Liability limited by a scheme approved under Professional Standards Legislation
riotinto.com 185
STRATEG
ICREPO
RT
DIRECTO
RS’R
EPORT
FIN
AN
CIA
LS
TA
TE
ME
NT
SPR
ODUCTIO
N,R
ESERVES
ANDOPER
ATIO
NS
ADDITIO
NALINFO
RMATIO
N
For
per
sona
l use
onl
y

Independent auditors’ report of PricewaterhouseCoopers LLP tothe members of Rio Tinto plc and PricewaterhouseCoopers to themembers of Rio Tinto LimitedFor the purpose of this report, the terms “we” and “our” denote PricewaterhouseCoopers LLP in relation to UK legal, professional and regulatory responsibilitiesand reporting obligations to the members of Rio Tinto plc and PricewaterhouseCoopers in relation to Australian legal, professional and regulatory responsibilitiesand reporting obligations to the members of Rio Tinto Limited.
The relevant legislation governing the companies is the United Kingdom Companies Act 2006 for Rio Tinto plc and the Corporations Act 2001 as amended by theASIC order dated 9 January 2015 (the “ASIC Order”) for Rio Tinto Limited.
Report on the financial statementsOpinion of PricewaterhouseCoopers LLP on the financial statements to the members of Rio Tinto plcIn our opinion:
– The financial statements, defined below, give a true and fair view of the state of the Group’s and of Rio Tinto plc’s affairs as at 31 December 2014 and of theGroup’s profit and cash flows for the year then ended;
– the Group financial statements have been properly prepared in accordance with International Financial Reporting Standards (“IFRSs”) as adopted by theEuropean Union;
– the Rio Tinto plc company financial statements have been properly prepared in accordance with United Kingdom Generally Accepted Accounting Practice; and
– the financial statements have been prepared in accordance with the requirements of the Companies Act 2006 and, as regards the Group financial statements,Article 4 of the IAS Regulation.
Separate opinion of PricewaterhouseCoopers LLP in relation to IFRSs as issued by the IASBAs explained in note 1 to the financial statements, the Group, in addition to applying IFRSs as adopted by the European Union, has also applied IFRSs as issued bythe International Accounting Standards Board (IASB).
In our opinion, the Group financial statements comply with IFRSs as issued by the IASB.
Opinion of PricewaterhouseCoopers on the financial report to the members of Rio Tinto LimitedIn our opinion:
– the financial report of Rio Tinto Limited is in accordance with the Corporations Act 2001 as amended by the ASIC Order, including:
i. giving a true and fair view of the Group’s financial position as at 31 December 2014 and of its performance for the year ended on that date;
ii. complying with the Australian Accounting Standards (including the Australian Accounting Interpretations) and the Corporations Regulations 2001;and
– The Group’s financial report also complies with IFRSs as disclosed in note 1.
What we have audited
The Rio Tinto Group financial statements comprise:
– the Group balance sheet as at 31 December 2014;
– the Group income statement and statement of comprehensive income for the year then ended;
– the Group cash flow statement for the year then ended;
– the Group statement of changes in equity for the year then ended;
– notes 1 – 46 to the financial statements, which include a summary of significant accounting policies and other explanatory information;
– the outline of dual listed companies structure and basis of financial statements; and
– the Rio Tinto financial information by business unit.
The Group’s financial statements and the Rio Tinto plc company financial statements are referred to in this report as the “financial statements”.
Certain required disclosures have been presented elsewhere in the Annual Report rather than in the notes to the financial statements. These are cross-referencedfrom the financial statements and are identified as audited.
PricewaterhouseCoopers LLP has audited the Rio Tinto plc company financial statements for the year ended 31 December 2014 which comprise the Rio Tinto plccompany balance sheet and the related notes. PricewaterhouseCoopers has audited the Reconciliation with Australian Accounting Standards and the Rio TintoLimited financial report, which comprises the financial statements and the Directors’ declaration on page 184.
The financial reporting framework that has been applied in the preparation of the Group financial statements is applicable law in the United Kingdom, applicablelaw in Australia as amended by the ASIC Order (described in the Annual Report under the heading “Australian Corporations Act – Summary of ASIC relief”) andInternational Financial Reporting Standards (IFRSs) as adopted by the European Union and as issued by the IASB.
The financial reporting framework that has been applied in the preparation of the Rio Tinto plc company financial statements is applicable law and United KingdomAccounting Standards (United Kingdom Generally Accepted Accounting Practice).
186 riotinto.com
For
per
sona
l use
onl
y
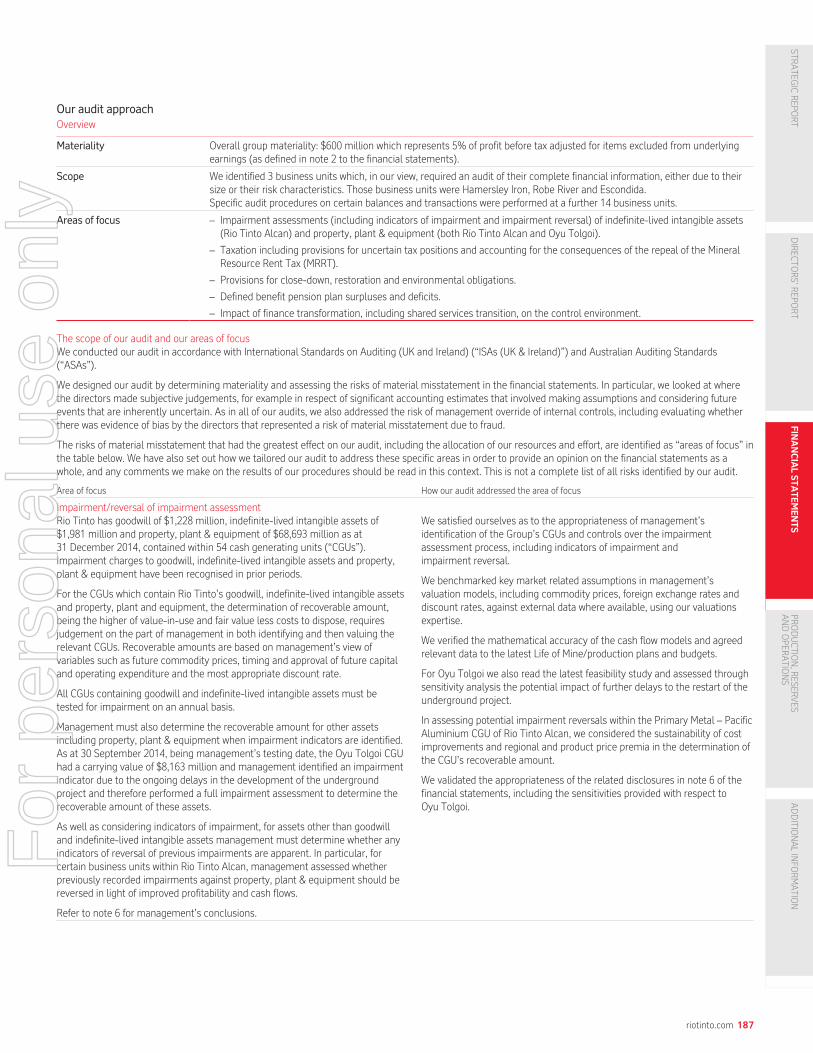
Our audit approachOverview
Materiality Overall group materiality: $600 million which represents 5% of profit before tax adjusted for items excluded from underlyingearnings (as defined in note 2 to the financial statements).
Scope We identified 3 business units which, in our view, required an audit of their complete financial information, either due to theirsize or their risk characteristics. Those business units were Hamersley Iron, Robe River and Escondida.Specific audit procedures on certain balances and transactions were performed at a further 14 business units.
Areas of focus – Impairment assessments (including indicators of impairment and impairment reversal) of indefinite-lived intangible assets(Rio Tinto Alcan) and property, plant & equipment (both Rio Tinto Alcan and Oyu Tolgoi).
– Taxation including provisions for uncertain tax positions and accounting for the consequences of the repeal of the MineralResource Rent Tax (MRRT).
– Provisions for close-down, restoration and environmental obligations.
– Defined benefit pension plan surpluses and deficits.
– Impact of finance transformation, including shared services transition, on the control environment.
The scope of our audit and our areas of focusWe conducted our audit in accordance with International Standards on Auditing (UK and Ireland) (“ISAs (UK & Ireland)”) and Australian Auditing Standards(“ASAs”).
We designed our audit by determining materiality and assessing the risks of material misstatement in the financial statements. In particular, we looked at wherethe directors made subjective judgements, for example in respect of significant accounting estimates that involved making assumptions and considering futureevents that are inherently uncertain. As in all of our audits, we also addressed the risk of management override of internal controls, including evaluating whetherthere was evidence of bias by the directors that represented a risk of material misstatement due to fraud.
The risks of material misstatement that had the greatest effect on our audit, including the allocation of our resources and effort, are identified as “areas of focus” inthe table below. We have also set out how we tailored our audit to address these specific areas in order to provide an opinion on the financial statements as awhole, and any comments we make on the results of our procedures should be read in this context. This is not a complete list of all risks identified by our audit.
Area of focus How our audit addressed the area of focus
Impairment/reversal of impairment assessmentRio Tinto has goodwill of $1,228 million, indefinite-lived intangible assets of$1,981 million and property, plant & equipment of $68,693 million as at31 December 2014, contained within 54 cash generating units (“CGUs”).Impairment charges to goodwill, indefinite-lived intangible assets and property,plant & equipment have been recognised in prior periods.
For the CGUs which contain Rio Tinto’s goodwill, indefinite-lived intangible assetsand property, plant and equipment, the determination of recoverable amount,being the higher of value-in-use and fair value less costs to dispose, requiresjudgement on the part of management in both identifying and then valuing therelevant CGUs. Recoverable amounts are based on management’s view ofvariables such as future commodity prices, timing and approval of future capitaland operating expenditure and the most appropriate discount rate.
All CGUs containing goodwill and indefinite-lived intangible assets must betested for impairment on an annual basis.
Management must also determine the recoverable amount for other assetsincluding property, plant & equipment when impairment indicators are identified.As at 30 September 2014, being management’s testing date, the Oyu Tolgoi CGUhad a carrying value of $8,163 million and management identified an impairmentindicator due to the ongoing delays in the development of the undergroundproject and therefore performed a full impairment assessment to determine therecoverable amount of these assets.
As well as considering indicators of impairment, for assets other than goodwilland indefinite-lived intangible assets management must determine whether anyindicators of reversal of previous impairments are apparent. In particular, forcertain business units within Rio Tinto Alcan, management assessed whetherpreviously recorded impairments against property, plant & equipment should bereversed in light of improved profitability and cash flows.
Refer to note 6 for management’s conclusions.
We satisfied ourselves as to the appropriateness of management’sidentification of the Group’s CGUs and controls over the impairmentassessment process, including indicators of impairment andimpairment reversal.
We benchmarked key market related assumptions in management’svaluation models, including commodity prices, foreign exchange rates anddiscount rates, against external data where available, using our valuationsexpertise.
We verified the mathematical accuracy of the cash flow models and agreedrelevant data to the latest Life of Mine/production plans and budgets.
For Oyu Tolgoi we also read the latest feasibility study and assessed throughsensitivity analysis the potential impact of further delays to the restart of theunderground project.
In assessing potential impairment reversals within the Primary Metal – PacificAluminium CGU of Rio Tinto Alcan, we considered the sustainability of costimprovements and regional and product price premia in the determination ofthe CGU’s recoverable amount.
We validated the appropriateness of the related disclosures in note 6 of thefinancial statements, including the sensitivities provided with respect toOyu Tolgoi.
riotinto.com 187
STRATEG
ICREPO
RT
DIRECTO
RS’R
EPORT
FIN
AN
CIA
LS
TA
TE
ME
NT
SPR
ODUCTIO
N,R
ESERVES
ANDOPER
ATIO
NS
ADDITIO
NALINFO
RMATIO
N
For
per
sona
l use
onl
y

Independent auditors’ report of PricewaterhouseCoopers LLP to the members of Rio Tinto plc andPricewaterhouseCoopers to the members of Rio Tinto Limited continued
Area of focus How our audit addressed the area of focus
TaxationProvisions for uncertain tax positions:
The Group operates across a large number of jurisdictions and is subject toperiodic challenges by local tax authorities on a range of tax matters during thenormal course of business including transfer pricing, indirect taxes andtransaction related tax matters. As at 31 December 2014, the Group has currentand non-current taxes payable of $1,170 million. Where the amount of taxpayable or recoverable is uncertain, Rio Tinto establishes provisions based on theGroup’s judgement of the probable amount of the liability or recovery.
Minerals Resource Rent Tax:
In 2014 the Australian government repealed the Minerals Resource Rent Tax(MRRT) with effect from 30 September 2014. The nature of MRRT and thecomplexity of the associated accounting considerations made this an area offocus.
We assessed the Group’s process for identifying uncertain tax positions andthe related accounting policy of provisioning for tax exposures.
We used our specialist tax knowledge to gain an understanding of the currentstatus of tax investigations and monitored changes in ongoing disputes byreading recent rulings and correspondence with local tax authorities, as wellas external advice received by the Group where relevant, to establish that thetax provisions had been appropriately adjusted to reflect the latest externaldevelopments.
We verified the accuracy of the utilisation of the MRRT deferred tax assetfrom 1 January 2014 to the date of repeal and the subsequent write-off of theremaining MRRT deferred tax asset at that date.
We also satisfied ourselves that the classification of the write-off of the MRRTdeferred tax asset as an exclusion from underlying earnings was consistentwith the Group’s accounting policies and appropriately disclosed in thefinancial statements.
Close-down, restoration and environmental obligationsRio Tinto has provisions for close-down, restoration and environmentalobligations of $8,630 million at 31 December 2014.
The calculation of these provisions requires management judgement inestimating these future costs, given the unique nature of each site and thepotential associated obligations, taking into account for example likely advancesin technology prior to the work commencing and determining the timing of anysuch work taking place. These calculations also require management todetermine an appropriate rate to discount these future costs back to their netpresent value.
The judgement required to estimate such costs is further compounded by thefact that the restoration and rehabilitation of each site is relatively unique andthere has been limited restoration and rehabilitation activity and historicalprecedent against which to benchmark estimates of future costs.
The Group reviews the close-down, restoration and environment obligations on asemi-annual basis, using experts to provide support in its assessment asappropriate. This review incorporates the effects of any changes in localregulations and management’s expected approach to restoration andrehabilitation.
We assessed management’s process for the review of provisions, andperformed detailed testing of the movements in the provision during the yearfor 5 business units based on the associated risk of misstatement andmateriality.
As part of our testing, we evaluated the legal and/or constructive obligationswith respect to the restoration and rehabilitation for each of these businessunits to assess the appropriateness of the intended method of restorationand rehabilitation and associated cost estimate.
We also considered the competence and objectivity of management’sexperts, whether internal or external to Rio, who produced the cost estimates.We validated the accuracy of calculations and the appropriateness of thediscount rate.
Defined benefit pension plan surpluses and deficitsThe Group has approximately 60 defined benefit pension plans. The total fairvalue of plan assets is $15,219 million, and total present value of obligations is$17,852 million, which are significant in the context of the overall balance sheetof the Group.
The valuation of the pension liabilities requires judgement in determiningappropriate assumptions, such as inflation levels, discount rates and mortalityrates. Movements in these assumptions can have a material impact on thedetermination of the liability. Management uses external actuaries to assist inassessing these assumptions.
Judgement is also involved in the measurement of the fair value of certainpension assets.
We used our actuarial expertise to satisfy ourselves that the assumptionsused in calculating the pension plan liabilities, including comparing salaryincreases and mortality rate assumptions, were consistent with relevantnational and industry benchmarks. We also verified that the discount andinflation rates used in the valuation of the pension liabilities were consistentwith our internally developed benchmarks and with other companiesreporting as at 31 December 2014.
For pension plan assets, we obtained third party confirmations of ownershipand valuations of pension assets, and re-performed a sample of thevaluations independently.
188 riotinto.com
For
per
sona
l use
onl
y

Area of focus How our audit addressed the area of focus
Finance transformation – Shared services transitionThe shared services transition element of Rio Tinto’s Finance transformationprogramme includes the centralisation and outsourcing of certain back officefinance activities (excluding key controls) to a third-party provider. Theprogramme commenced in 2014 and is expected to run during 2015 andinto 2016.
Certain of the activities being transitioned were previously undertaken inRio Tinto’s own shared services centres. A number of business unit financeprocesses have also been, or are being, transitioned.
This centralisation of processes and transfer of responsibilities creates a risk ofloss of knowledge which could adversely affect the controls during the transitionperiod. There is also a risk that controls over financial reporting, which rely onthose activities that have been, or are to be, transitioned may not be designedand/or operate effectively.
We obtained a detailed understanding of the Group’s shared servicestransition plans, including the timing of business unit transitions and extentof activities being transferred. We assessed the implementation ofmanagement’s plans through the following procedures:
– We visited the outsourced shared service centre to observe the manner inwhich the knowledge transfer was being conducted.
– We assessed the design effectiveness of internal controls over financialreporting in the processes impacted at both the Group and businessunit levels.
– We tested the operating effectiveness of key controls which operate withinRio Tinto’s retained organisation.
– In respect of the third-party outsourced service provider:
– We evaluated the ‘Statement of Works’ governing the service levelagreements with Rio Tinto and the associated key performance indicators.
– We obtained a report from an independent third party on the ServiceOrganisation Controls performed in accordance with the Statement onStandards for Attestation Engagements (SSAE) No. 16. This providedevidence about the operating effectiveness of governance and entitylevel controls operated by the outsourced service provider.
How we tailored the audit scopeWe tailored the scope of our audit to ensure that we performed enough work to be able to give an opinion on the financial statements as a whole, taking intoaccount the geographic structure of the Group, the accounting processes and controls, and the industry in which the Group operates.
The Group is organised into five product groups being Aluminium, Copper, Diamonds & Minerals, Energy, and Iron Ore, which are all supported by centralisedfunctions. Each product group is made up of a number of operating businesses which represent separate business units. The Group financial statements are aconsolidation of business units, comprising the Group’s operating businesses and centralised functions. Based on this, we determined the appropriate businessunits to perform work over based on factors such as the size of the balances, the areas of focus as noted above, known or historical accounting issues and thedesire to include some unpredictability in our audit procedures.
In establishing the overall approach to the group audit, we determined the type of work that needed to be performed at business units by us, as the Groupengagement team, or component auditors from either other PwC network firms or non-PwC firms operating under our instruction. Where the work was performedby component auditors, we determined the level of involvement we needed to have in the audit work at those business units to be able to conclude whethersufficient appropriate audit evidence had been obtained as a basis for our opinion on the Group financial statements as a whole. In 2014, we identified 3 businessunits which, in our view, required an audit of their complete financial information, either due to their size or their risk characteristics. Those business units wereHamersley Iron, Robe River and Escondida. Specific audit procedures on certain balances and transactions were performed at a further 14 business units.
We performed work centrally in the areas of IT general controls, manual journals, taxation, pensions and treasury related procedures. In 2014, we also performedprocedures on the shared services transition as noted above.
Our Group engagement team involvement included site visits, conference calls with our component audit teams, review of our component auditor work papers,attendance at component audit clearance meetings, and other forms of communication as considered necessary depending on the significance of the componentand the extent of accounting and audit issues arising.
MaterialityThe scope of our audit is influenced by our application of materiality. We set certain quantitative thresholds for materiality. These, together with qualitativeconsiderations, helped us to determine the scope of our audit and the nature, timing and extent of our audit procedures and to evaluate the effect ofmisstatements, both individually and on the financial statements as a whole.
Based on our professional judgement, we determined materiality for the financial statements as a whole as follows:
Overall group materiality $600 million (2013: $600 million).
How we determined it 5% of profit before tax adjusted for items excluded from underlying earnings (as defined in note 2 to thefinancial statements).
Rationale for benchmark applied We consider an adjusted measure to be the most relevant in assessing the recurring financial performance ofthe Group.
We agreed with the Audit Committee that we would report to themmisstatements identified during our audit above $50 million (2013: $50 million) as well asmisstatements below that amount that, in our view, warranted reporting for qualitative reasons.
Going concernUnder the Listing Rules we are required to review the directors’ statement, set out on page 101, in relation to going concern. We have nothing to report havingperformed our review.
As noted in the directors’ statement, the directors have concluded that it is appropriate to prepare the financial statements using the going concern basis ofaccounting. The going concern basis presumes that the Group and Parent Companies (in respect of Rio Tinto plc and Rio Tinto Limited) have adequate resourcesto remain in operation, and that the directors intend them to do so, for at least one year from the date the financial statements were signed. As part of our audit wehave concluded that the directors’ use of the going concern basis is appropriate.
riotinto.com 189
STRATEG
ICREPO
RT
DIRECTO
RS’R
EPORT
FIN
AN
CIA
LS
TA
TE
ME
NT
SPR
ODUCTIO
N,R
ESERVES
ANDOPER
ATIO
NS
ADDITIO
NALINFO
RMATIO
N
For
per
sona
l use
onl
y

Independent auditors’ report of PricewaterhouseCoopers LLP to the members of Rio Tinto plc andPricewaterhouseCoopers to the members of Rio Tinto Limited continued
However, because not all future events or conditions can be predicted, these statements are not a guarantee as to the Group’s and Parent Companies’ ability tocontinue as a going concern.
Other required reporting – PricewaterhouseCoopers LLPConsistency of other informationCompanies Act 2006 opinionIn our opinion, the information given in the Strategic Report and the Directors’ report for the financial year for which the financial statements are prepared isconsistent with the financial statements.
ISAs (UK & Ireland) reportingUnder ISAs (UK & Ireland) we are required to report to you if, in our opinion:
Information in the Annual Report is:
– materially inconsistent with the information in the audited financial statements; or
– apparently materially incorrect based on, or materially inconsistent with, our knowledge of the Group and Company acquired in thecourse of performing our audit; or
– otherwise misleading.
We have no exceptionsto report arising fromthis responsibility.
The statement given by the directors on page 63, in accordance with provision C.1.1 of the UK Corporate Governance Code (“the Code”),that they consider the Annual Report taken as a whole to be fair, balanced and understandable and provides the information necessary formembers to assess the Group’s and Rio Tinto plc’s performance, business model and strategy is materially inconsistent with ourknowledge of the group and company acquired in the course of performing our audit.
We have no exceptionsto report arising fromthis responsibility.
The section of the Annual Report on page 57, as required by provision C.3.8 of the Code, describing the work of the Audit Committee doesnot appropriately address matters communicated by us to the Audit Committee.
We have no exceptionsto report arising fromthis responsibility.
Adequacy of accounting records and information and explanations receivedUnder the Companies Act 2006 we are required to report to you if, in our opinion:
– we have not received all the information and explanations we require for our audit; or
– adequate accounting records have not been kept by Rio Tinto plc, or returns adequate for our audit have not been received from branches not visited by us; or
– the Rio Tinto plc financial statements and the part of the Directors’ Remuneration Report to be audited are not in agreement with the accounting records andreturns.
We have no exceptions to report arising from this responsibility.
Directors’ remunerationDirectors’ Remuneration Report – Companies Act 2006 opinionIn our opinion, the part of the Directors’ Remuneration Report to be audited has been properly prepared in accordance with the Companies Act 2006.
Other Companies Act 2006 reportingUnder the Companies Act 2006 we are required to report to you if, in our opinion, certain disclosures of directors’ remuneration specified by law are not made.We have no exceptions to report arising from this responsibility.
Corporate governance statementUnder the Listing Rules we are required to review the part of the Corporate Governance Statement relating to Rio Tinto plc’s compliance with ten provisions of theUK Corporate Governance Code. We have nothing to report having performed our review.
Other required reporting – PricewaterhouseCoopersDirectors’ remunerationDirectors’ Remuneration Report – Corporations Act 2001 opinionUnder the Corporations Act 2001 (in respect of Rio Tinto Limited) we are required to express an opinion on the Directors’ Remuneration Report, based on our auditconducted in accordance with Australian Auditing Standards. The directors of Rio Tinto Limited are responsible for the preparation and presentation of theRemuneration Report in accordance with section 300A of the Corporations Act 2001 as amended by the ASIC Order.
In our opinion, the Remuneration Report included in the accompanying Annual Report complies with the requirements of section 300A of the Corporations Act2001 as amended by the ASIC Order.
Directors’ reportConsistency of information in Directors’ report – Corporations Act 2001 opinionIn our opinion, the information given in the Directors’ report for the financial year for which the financial statements are prepared is consistent with the financialstatements.
IndependenceIn conducting our audit, we have complied with the independence requirements of the Corporations Act 2001.
Responsibilities for the financial statements and the auditOur responsibilities and those of the directorsAs explained more fully in the Directors’ responsibilities statement set out on page 184, the directors are responsible for the preparation of the financialstatements and for being satisfied that they give a true and fair view and for such internal control as the directors determine is necessary to enable the preparationof the financial report that is free from material misstatement, whether due to fraud or error.
Our responsibility is to audit and express an opinion on the financial statements in accordance with applicable law and ISAs (UK & Ireland) and Australian AuditingStandards. Those standards require us to comply with the Auditing Practices Board’s Ethical Standards for Auditors and relevant ethical requirements relating toaudit engagements in Australia.
190 riotinto.com
For
per
sona
l use
onl
y

This report, including the opinions, has been prepared for and only for the members of Rio Tinto plc and Rio Tinto Limited as a body in accordance with Chapter 3of Part 16 of the Companies Act 2006 (in respect of Rio Tinto plc) and the Corporations Act 2001 as amended by the ASIC Order (in respect of Rio Tinto Limited)and for no other purpose. We do not, in giving these opinions, accept or assume responsibility for any other purpose or to any other person to whom this report isshown or into whose hands it may come save where expressly agreed by our prior consent in writing.
What an audit of financial statements involvesAn audit involves obtaining evidence about the amounts and disclosures in the financial statements sufficient to give reasonable assurance that the financialstatements are free from material misstatement, whether caused by fraud or error. This includes an assessment of:
– whether the accounting policies are appropriate to the Group’s and the Companies’ circumstances and have been consistently applied and adequately disclosed;
– the reasonableness of significant accounting estimates made by the directors; and
– the overall presentation of the financial statements.
The procedures selected depend on the auditors’ judgement, including the assessment of the risks of material misstatement of the financial statements whetherdue to fraud or error. In making those risk assessments, the auditors consider internal control relevant to the entity’s preparation and fair presentation of thefinancial statements in order to design audit procedures that are appropriate in the circumstances, but not for the purpose of expressing an opinion on theeffectiveness of the entity’s internal control.
We primarily focus our work in these areas by assessing the directors’ judgements against available evidence, forming our own judgements, and evaluating thedisclosures in the financial statements.
We test and examine information, using sampling and other auditing techniques, to the extent we consider necessary to provide a reasonable basis for us to drawconclusions. We obtain audit evidence through testing the effectiveness of controls, substantive procedures or a combination of both.
We believe that the audit evidence we have obtained is sufficient and appropriate to provide a basis for our audit opinion.
In addition, we read all the financial and non-financial information in the Annual Report to identify material inconsistencies with the audited financial statementsand to identify any information that is apparently materially incorrect based on, or materially inconsistent with, the knowledge acquired by us in the course ofperforming the audit. If we become aware of any apparent material misstatements or inconsistencies we consider the implications for our report.
Richard Hughes (Senior Statutory Auditor)for and on behalf of PricewaterhouseCoopers LLPChartered Accountants and Statutory AuditorsLondon, United Kingdom4 March 2015
Paul Bendall, Partnerfor and on behalf of PricewaterhouseCoopersChartered Accountants and Statutory AuditorsMelbourne, Australia4 March 2015
(a) The maintenance and integrity of the Rio Tinto Group website is the responsibility of the directors; the work carried out by the auditors does not involve consideration of thesematters and, accordingly, the auditors accept no responsibility for any changes that may have occurred to the financial statements since they were initially presented on thewebsite.
(b) Legislation in the United Kingdom and Australia governing the preparation and dissemination of financial statements may differ from legislation in other jurisdictions.
riotinto.com 191
STRATEG
ICREPO
RT
DIRECTO
RS’R
EPORT
FIN
AN
CIA
LS
TA
TE
ME
NT
SPR
ODUCTIO
N,R
ESERVES
ANDOPER
ATIO
NS
ADDITIO
NALINFO
RMATIO
N
For
per
sona
l use
onl
y

Financial summary 2005-2014
US$m 2005 2006 2007 2008 2009 2010 2011 2012 2013 2014
Gross sales revenue (a) 20,742 25,440 33,518 56,905 42,734 59,008 65,298 55,597 54,575 50,041
Share of equity accountedunits’ sales revenue anditems excluded fromunderlying earnings (1,709) (2,975) (3,818) (4,044) (2,472) (3,837) (4,769) (4,655) (3,404) (2,377)
Consolidated salesrevenue 19,033 22,465 29,700 52,861 40,262 55,171 60,529 50,942 51,171 47,664
Underlying profit beforeinterest and tax (PBIT) 7,301 9,912 10,517 17,683 9,843 21,128 23,662 13,467 16,039 13,851
Finance costs (c) (207) (193) (570) (1,706) (1,058) (909) (759) (616) (794) (967)
Exchange differences andderivatives (d) (191) 83 253 (322) 528 529 2 695 (3,362) (2,021)
Other exclusions fromUnderlying earnings 409 438 (364) (6,477) (1,453) (257) (9,633) (15,977) (8,378) (1,311)
Profit/(loss) before tax(PBT) 7,312 10,240 9,836 9,178 7,860 20,491 13,272 (2,431) 3,505 9,552
Tax on Exclusions 33 (357) 60 988 (91) 42 135 2,896 2,642 423
Tax on Underlying PBT (1,847) (2,016) (2,150) (4,730) (1,985) (5,338) (6,607) (3,485) (5,068) (3,476)
Loss after tax fromdiscontinued operations – – – (827) (449) (97) (10) (7) – –
Attributable to non-controlling interests (283) (429) (434) (933) (463) (860) (955) (1) 2,586 28
Net earnings/(loss) 5,215 7,438 7,312 3,676 4,872 14,238 5,835 (3,028) 3,665 6,527
Underlying/Adjustedearnings (b) 4,955 7,338 7,443 10,303 6,298 13,987 15,572 9,269 10,217 9,305
Earnings/(loss) per share(basic) – continuingoperations (n) 312.6c 456.2c 464.9c 286.8c 301.7c 731.0c 303.9c (163.4)c 198.4c 353.1c
Underlying earnings pershare (basic) – continuingoperations (n) 297.0c 450.1c 473.2c 656.2c 357.1c 713.3c 809.7c 501.3c 553.1c 503.4c
Dividends per share:declared for year (e)
Rio Tinto shareholders(US cents) 65.46c 85.07c 111.23c 111.22c 45.00c 108.00c 145.00c 167.00c 192.00c 215.00c
Rio Tinto plc (pence) 36.91p 44.22p 56.20p 67.49p 28.84p 67.35p 90.47p 106.77p 120.10p 134.88p
Rio Tinto Limited(Aus. cents) 86.26c 110.69c 125.72c 146.22c 51.56c 111.21c 134.01c 160.18c 213.14c 256.07c
Net assets
Fixed assets (f) 20,848 25,803 75,888 67,651 72,706 83,895 91,529 90,580 81,554 80,669
Other assets less liabilities 2,587 3,026 11,609 8,469 10,078 4,394 1,632 8,478 8,224 4,596
Provisions (includingdeferred tax) (6,383) (7,007) (16,013) (14,987) (17,998) (19,706) (25,935) (22,126) (18,221) (18,176)
Net debt (1,313) (2,437) (45,191) (38,672) (18,861) (4,071) (8,342) (19,192) (18,055) (12,495)
Non-controlling interests (791) (1,153) (1,521) (1,823) (2,094) (6,265) (6,685) (11,187) (7,616) (8,309)
Equity attributable toowners of Rio Tinto 14,948 18,232 24,772 20,638 43,831 58,247 52,199 46,553 45,886 46,285
Capital expenditure (g) (2,590) (3,992) (5,000) (8,574) (5,388) (4,591) (12,573) (17,615) (13,001) (8,162)
Acquisitions (2) (303) (37,539) (9) (396) (907) (4,156) (1,335) 4 –
Disposals 323 24 13 2,572 2,424 3,800 386 251 1,896 887
Net cash generated fromoperating activities (h) 6,717 7,803 8,491 14,883 9,212 18,277 20,235 9,430 15,078 14,286
Cash flows beforefinancing activities (i) 4,460 3,714 (34,251) 8,702 5,855 16,566 3,245 (8,813) 4,132 7,783
Ratios
Operating margin (j) 37% 42% 34% 32% 24% 37% 37% 25% 30% 28%
Net debt to total capital (k) 8% 11% 63% 63% 29% 6% 12% 25% 25% 19%
Underlying earnings:owners’ equity (l) 37% 44% 35% 45% 20% 27% 28% 19% 22% 20%Interest cover (m) 59 89 20 10 9 27 27 13 13 13
192 riotinto.com
For
per
sona
l use
onl
y

(a) Gross sales revenue includes 100 per cent of subsidiaries’ sales revenue and the Group’s share of the sales revenue of equity accounts units (after adjusting for sales tosubsidiaries)
(b) Underlying earnings is an additional measure of earnings, which is reported by Rio Tinto with its IFRS (as defined in note 1) results to provide greater understanding of theunderlying business performance of its operations. It is defined in note 2 to the Financial Statement. Underlying profit before interest and tax (PBIT) is similar to underlyingearnings except that it is stated before tax and interest.
(c) Finance costs include net interest and amortisation of discount.
(d) Under IFRS, as defined in note 1, certain gains and losses on exchange and on revaluation of derivatives are included in the Group’s Net earnings. These items are excluded fromunderlying earnings.
(e) Dividends per share are the amounts declared in respect of each financial year. These usually include an Interim dividend paid in the year, and a Final dividend paid after the end ofthe year. The Special dividend of 90 US cents per share paid in 2006 is not included in the table. 2005 to 2008 ordinary dividends per share have been restated using a number ofshares which reflects the discounted price of the July 2009 rights issues (the bonus factor).
(f) Fixed assets include property, plant and equipment, intangible assets, goodwill, and investments in and long term loans to equity accounted units.
(g) Capital expenditure is presented gross, before taking into account any disposals of property, plant and equipment.
(h) Net cash generated from operating activities represents the cash generated by the Group’s consolidated operations, after payment of interest, taxes, and dividends to non-controlling interests in subsidiaries.
(i) Cash flow before financing activities is stated before deducting dividends payable to owners of Rio Tinto.
(j) Operating margin is the percentage of underlying PBIT, after excluding tax on equity accounted units, to Gross sales revenue.
(k) Total capital comprises equity attributable to owners of Rio Tinto plus net debt and non-controlling interests.
(l) Underlying earnings: owners’ equity represents underlying earnings expressed as a percentage of the mean of opening and closing equity attributable to owners of Rio Tinto.
(m) Interest cover represents the number of times interest payable less receivable (excluding the amortisation of discount but including capitalised interest) is covered by Underlyingoperating profit, less amortisation of discount, plus dividends from equity accounted units. Underlying operating profit is similar to underlying earnings but is stated before tax,interest and share of profit after tax of equity accounted units.
(n) 2009 earnings per share from continuing operations and underlying earnings per share have been calculated using a number of shares which reflects the discounted price of theJuly rights issues (the bonus factor). 2004 to 2008 comparatives have been restated accordingly.
riotinto.com 193
STRATEG
ICREPO
RT
DIRECTO
RS’R
EPORT
FIN
AN
CIA
LS
TA
TE
ME
NT
SPR
ODUCTIO
N,R
ESERVES
ANDOPER
ATIO
NS
ADDITIO
NALINFO
RMATIO
N
For
per
sona
l use
onl
y

Summary financial data in Australian dollars, Sterling andUS dollars
2014A$m
2013A$m
2014£m
2013£m
2014US$m
2013US$m
55,430 56,353 30,367 34,882 Gross sales revenue 50,041 54,575
52,797 52,838 28,925 32,706 Consolidated sales revenue 47,664 51,171
10,581 3,619 5,797 2,240 Profit before tax from continuing operations 9,552 3,505
7,199 1,114 3,944 690 Profit for the year from continuing operations 6,499 1,079
7,230 3,784 3,961 2,342 Net earnings attributable to owners of Rio Tinto 6,527 3,665
10,307 10,550 5,647 6,530 Underlying earnings (a) 9,305 10,217
391.1c 204.9c 214.3p 126.8p Basic earnings per ordinary share from continuing operations (b) 353.1c 198.4c
557.6c 571.1c 305.5p 353.5p Basic underlying earnings per ordinary share (a)(b) 503.4c 553.1c
Dividends per share to owners of Rio Tinto
223.23c 184.67c 122.72p 114.62p – paid 204.5c 178.0c
152.98c 120.14c 77.98p 65.82p – proposed final dividend 119.0c 108.5c
8,621 4,267 4,723 2,641 Cash flow before financing activities 7,783 4,132
(15,243) (20,240) (8,026) (10,929) Net debt (12,495) (18,055)56,463 51,438 29,729 27,775 Equity attributable to owners of Rio Tinto 46,285 45,886
(a) Underlying earnings exclude net impairment and other charges of US$2,778 million (2013 charges: of US$6,552 million), which are analysed on page 125.
(b) Basic earnings per ordinary share and basic underlying earnings per ordinary share do not recognise the dilution resulting from share options in issue.
The financial data above has been extracted from the financial information set out on pages 103 to 174. The Australian dollar and Sterling amounts are based on the US dollar amounts,retranslated at average or closing rates as appropriate, except for the dividends which are the actual amounts payable.
194 riotinto.com
For
per
sona
l use
onl
y

Metals and minerals production
2014 Production 2013 Production 2012 Production
Rio Tinto% share(a) Total
Rio Tintoshare Total
Rio Tintoshare Total
Rio Tintoshare
ALUMINA (‘000 tonnes)
Jonquière (Vaudreuil) (Canada) (b) 100.0 1,444 1,444 1,439 1,439 1,397 1,397
Queensland Alumina (Australia) 80.0 3,568 2,854 3,384 2,707 3,693 2,954
São Luis (Alumar) (Brazil) 10.0 3,639 364 3,425 343 3,409 341
Yarwun (Australia) 100.0 2,688 2,688 2,446 2,446 2,175 2,175
Jonquière (Vaudreuil) specialty plant (Canada) 100.0 108 108 103 103 101 101
7,458 7,037 6,968
Other Aluminium
Gove refinery (Australia) (c) 100.0 676 676 2,270 2,270 2,742 2,742
Specialty plants (France/Germany) (d) – – – – – 331 331
676 2,270 3,073
Rio Tinto total 8,134 9,307 10,041
ALUMINIUM (‘000 tonnes)
Alma (Canada) 100.0 455 455 440 440 208 208
Alouette (Sept-Îles) (Canada) 40.0 583 233 582 233 593 237
Alucam (Edéa) (Cameroon) (e) – 93 43 75 35 52 24
Arvida (Canada) 100.0 173 173 175 175 177 177
Arvida AP60 (Canada) (f) 100.0 59 59 9 9 – –
Bécancour (Canada) 25.1 446 112 435 109 429 107
Bell Bay (Australia) 100.0 188 188 187 187 185 185
Boyne Island (Australia) 59.4 553 328 561 333 569 338
Dunkerque (France) 100.0 270 270 258 258 256 256
Grande-Baie (Canada) 100.0 222 222 224 224 223 223
ISAL (Reykjavik) (Iceland) 100.0 206 206 197 197 190 190
Kitimat (Canada) 100.0 125 125 172 172 182 182
Laterrière (Canada) 100.0 244 244 239 239 233 233
Lochaber (UK) 100.0 42 42 44 44 45 45
Saint-Jean-de-Maurienne (France) (g) – – – 85 85 93 93
Shawinigan (Canada) (h) 100.0 – – 74 74 81 81
Sohar (Oman) 20.0 364 73 354 71 360 72
SØRAL (Husnes) (Norway) (i) – 76 38 89 45 92 46
Tiwai Point (New Zealand) 79.4 327 260 324 257 325 258
Tomago (Australia) 51.6 561 289 545 281 546 281
3,361 3,468 3,236
Other Aluminium
Lynemouth (UK) (j) 100.0 – – – – 15 15
Sebree (US) (k) – – – 87 87 205 205
87 220
Rio Tinto total 3,361 3,555 3,456
See notes on page 198.
riotinto.com 195
STRATEG
ICREPO
RT
DIRECTO
RS’R
EPORT
FINANCIA
LSTA
TEMEN
TSP
RO
DU
CT
ION
,R
ES
ER
VE
SA
ND
OP
ER
AT
ION
SADDITIO
NALINFO
RMATIO
N
For
per
sona
l use
onl
y

Metals and minerals production continued
2014 Production 2013 Production 2012 Production
Rio Tinto% share(a) Total
Rio Tintoshare Total
Rio Tintoshare Total
Rio Tintoshare
BAUXITE (’000 tonnes)
Gove (Australia) 100.0 6,528 6,528 8,029 8,029 7,944 7,944
Porto Trombetas (MRN) (Brazil) 12.0 16,376 1,965 15,729 1,887 15,512 1,861
Sangaredi (Guinea) 23.0(l) 15,803 7,111 15,437 6,947 14,001 6,301
Weipa (Australia) 100.0 26,266 26,266 26,341 26,341 23,257 23,257
Rio Tinto total 41,871 43,204 39,363
BORATES (’000 tonnes) (m)
Rio Tinto Minerals – Boron (US) 100.0 508 508 495 495 453 453
Rio Tinto Minerals – Tincalayu (Argentina) (n) – – – – – 9 9
Rio Tinto total 508 495 463
COAL (hard coking) (’000 tonnes)
Rio Tinto Coal Australia
Hail Creek Coal (Australia) 82.0 6,492 5,324 6,839 5,608 7,174 5,882
Kestrel Coal (Australia) 80.0 2,163 1,730 2,553 2,043 2,468 1,974
Total Australian hard coking coal 7,054 7,651 7,857
Rio Tinto Coal Mozambique
Benga (o) – 641 416 867 564 289 188
Rio Tinto total hard coking coal 7,471 8,214 8,044
COAL (semi-soft coking) (’000 tonnes)
Rio Tinto Coal Australia
Hunter Valley (Australia) 80.0 1,935 1,548 2,634 2,107 2,119 1,695
Mount Thorley (Australia) 64.0 1,952 1,250 1,846 1,182 1,584 1,014
Warkworth (Australia) 44.5 933 415 1,281 569 1,296 576
Rio Tinto total semi-soft coking coal 3,213 3,859 3,286
COAL (thermal) (’000 tonnes)
Rio Tinto Coal Australia
Bengalla (Australia) 32.0 8,558 2,739 8,232 2,634 7,026 2,248
Blair Athol (Australia) (p) 71.2 – – – – 2,587 1,843
Clermont (Australia) (q) – 4,832 2,421 11,782 5,903 8,189 4,103
Hail Creek Coal (Australia) (r) 82.0 2,304 1,890 191 157 – –
Hunter Valley (Australia) 80.0 11,924 9,539 11,002 8,802 9,836 7,869
Kestrel Coal (Australia) 80.0 564 451 463 371 350 280
Mount Thorley (Australia) 64.0 2,241 1,434 2,357 1,508 2,497 1,598
Warkworth (Australia) 44.5 6,803 3,027 6,995 3,110 5,477 2,435
Total Australian thermal coal 21,501 22,485 20,376
Rio Tinto Coal Mozambique
Benga (o) – 593 385 754 490 419 272
Rio Tinto total thermal coal 21,886 22,975 20,648
See notes on page 198.
196 riotinto.com
For
per
sona
l use
onl
y

2014 Production 2013 Production 2012 Production
Rio Tinto% share(a) Total
Rio Tintoshare Total
Rio Tintoshare Total
Rio Tintoshare
COPPER (mined) (’000 tonnes)
Bingham Canyon (US) 100.0 204.3 204.3 211.0 211.0 163.2 163.2
Escondida (Chile) 30.0 1,137.6 341.3 1,121.5 336.5 1,047.4 314.2
Grasberg – Joint Venture (Indonesia) (s) 40.0 19.2 7.7 15.7 6.3 0.0 0.0
Northparkes (Australia) (t) – – – 50.6 40.4 53.8 43.1
Oyu Tolgoi (Mongolia) (u) 33.5 148.4 49.8 76.7 25.7 – –
Palabora (South Africa) (v) – – – 22.2 11.6 49.1 28.3
Rio Tinto total 603.1 631.5 548.8
COPPER (refined) (’000 tonnes)
Escondida (Chile) 30.0 301.5 90.5 305.3 91.6 310.3 93.1
Kennecott Utah Copper (US) 100.0 204.1 204.1 193.6 193.6 162.7 162.7
Palabora (South Africa) (v) – – – 25.8 14.9 40.9 23.6
Rio Tinto total 294.6 300.1 279.4
DIAMONDS (’000 carats)
Argyle (Australia) 100.0 9,188 9,188 11,359 11,359 8,471 8,471
Diavik (Canada) 60.0 7,233 4,340 7,243 4,346 7,230 4,338
Murowa (Zimbabwe) 77.8 442 344 414 322 403 313
Rio Tinto total 13,872 16,027 13,122
GOLD (mined) (’000 ounces)
Barneys Canyon (US) 100.0 0.4 0.4 0.4 0.4 1.2 1.2
Bingham Canyon (US) 100.0 259.8 259.8 206.7 206.7 199.8 199.8
Escondida (Chile) 30.0 90.1 27.0 94.2 28.3 97.6 29.3
Grasberg – Joint Venture (Indonesia) (s) 40.0 5.6 2.3 0.0 0.0 0.0 0.0
Northparkes (Australia) (t) – – – 61.6 49.3 72.2 57.7
Oyu Tolgoi (Mongolia) (u) 33.5 588.7 197.3 157.0 52.6 – –
Palabora (South Africa) (v) – – – 5.5 3.1 10.9 6.3
Rio Tinto total 486.8 340.4 294.3
GOLD (refined) (’000 ounces)
Kennecott Utah Copper (US) 100.0 252.2 252.2 192.3 192.3 279.2 279.2
IRON ORE (’000 tonnes)
Hamersley mines (Australia) (w) 163,163 163,163 143,347 143,347 135,932 135,932
Hamersley – Channar (Australia) 60.0 10,913 6,548 11,047 6,628 10,947 6,568
Hope Downs (Australia) 50.0 42,715 21,358 33,788 16,894 30,793 15,396
Iron Ore Company of Canada (Canada) 58.7 14,775 8,676 15,368 9,024 14,079 8,267
Robe River – Pannawonica (Australia) 53.0 34,535 18,304 33,308 17,654 32,304 17,121
Robe River – West Angelas (Australia) 53.0 29,264 15,510 29,093 15,419 29,404 15,584
Rio Tinto total 233,557 208,966 198,869
MOLYBDENUM (’000 tonnes)
Bingham Canyon (US) 100.0 11.5 11.5 5.7 5.7 9.4 9.4
SALT (‘000 tonnes)
Dampier Salt (Australia) 68.4 9,938 6,793 9,841 6,728 9,996 6,833
SILVER (mined) (’000 ounces)
Bingham Canyon (US) 100.0 2,935 2,935 2,876 2,876 2,086 2,086
Escondida (Chile) 30.0 4,883 1,465 4,032 1,210 3,501 1,050
Grasberg – Joint Venture (Indonesia) (s)(x) 40.0 0 0 0 0 0 0
Oyu Tolgoi (Mongolia) (u) 33.5 893 299 489 164 – –
Others – 0 0 687 515 685 521
Rio Tinto total 4,699 4,765 3,657
See notes on page 198.
riotinto.com 197
STRATEG
ICREPO
RT
DIRECTO
RS’R
EPORT
FINANCIA
LSTA
TEMEN
TSP
RO
DU
CT
ION
,R
ES
ER
VE
SA
ND
OP
ER
AT
ION
SADDITIO
NALINFO
RMATIO
N
For
per
sona
l use
onl
y

Metals and minerals production continued
2014 Production 2013 Production 2012 Production
Rio Tinto% share(a) Total
Rio Tintoshare Total
Rio Tintoshare Total
Rio Tintoshare
SILVER (refined) (’000 ounces)
Kennecott Utah Copper (US) 100.0 2,811 2,811 2,158 2,158 2,451 2,451
TITANIUM DIOXIDE FEEDSTOCK (’000 tonnes)
Rio Tinto Iron & Titanium
(Canada/South Africa) (y)(z) 100.0 1,443 1,443 1,622 1,622 1,594 1,594
URANIUM (’000 lbs U3O8)
Energy Resources of Australia (Australia) (aa) 68.4 2,569 1,757 6,525 4,462 8,179 5,594
Rössing (Namibia) (bb) 68.6 3,401 2,333 5,312 3,643 5,951 4,082
Rio Tinto total 4,089 8,105 9,675
Production data notes:
Mine production figures for metals refer to the total quantity of metal produced inconcentrates, leach liquor or doré bullion irrespective of whether these products are thenrefined onsite, except for the data for bauxite and iron ore which can representproduction of marketable quantities of ore plus concentrates and pellets. Productionfigures are sometimes more precise than the rounded numbers shown, hence smalldifferences may result from calculation of Rio Tinto share of production.
(a) Rio Tinto percentage share, shown above, is as at the end of 2014. The footnotesbelow include all ownership changes over the three years. The Rio Tinto sharevaries at individual mines and refineries in the “others” category and thus no valueis shown.
(b) Jonquière’s (Vaudreuil’s) production shows smelter grade alumina only andexcludes hydrate produced and used for specialty alumina.
(c) The curtailment of production at the Gove refinery was completed on 28 May 2014.
(d) Rio Tinto sold its interest in these specialty alumina assets with an effective date of1 August 2012. Production data are shown up to that date.
(e) Rio Tinto sold its 46.7 per cent interest in the Alucam (Edéa) smelter with aneffective date of 31 December 2014. Production data are shown up to that date.
(f) Rio Tinto started production at the Arvida AP60 Technology Centre in the fourthquarter of 2013.
(g) Rio Tinto sold its 100 per cent interest in the Saint-Jean-de-Maurienne smelterwith an effective date of 16 December 2013. Production data are shown up to thatdate.
(h) The Shawinigan smelter ceased production on 29 November 2013.
(i) Rio Tinto sold its 50 per cent interest in the SØRAL (Husnes) smelter with aneffective date of 31 October 2014. Production data are shown up to that date.
(j) Rio Tinto closed the Lynemouth aluminium smelter on 29 March 2012.
(k) Rio Tinto sold its 100 per cent interest in the Sebree aluminium smelter with aneffective date of 1 June 2013. Production data are shown up to that date.
(l) Rio Tinto has a 22.95 per cent shareholding in the Sangaredi mine but benefitsfrom 45.0 per cent of production.
(m) Borate quantities are expressed as B2O3.
(n) Rio Tinto sold its interest in Borax Argentina with an effective date of 21 Aug 2012.Production data are included up to that date.
(o) Rio Tinto completed the sale of Rio Tinto Coal Mozambique and its 65 per centinterest in the Benga mine with an effective date of 7 October 2014. Productiondata are shown up to that date. Commercial production had commenced in thethird quarter of 2012.
(p) Blair Athol closed in the last quarter of 2012. Rio Tinto agreed to sell its 71.2 percent interest in Blair Athol in October 2013.
(q) Rio Tinto sold its 50.1 per cent interest in the Clermont mine with an effective dateof 29 May 2014. Production data are shown up to that date.
(r) Hail Creek commenced production of thermal coal from a processing plant by-product stream following completion of a successful trial in the third quarterof 2013.
(s) Through a joint venture agreement with Freeport-McMoRan (FCX), Rio Tinto isentitled to 40 per cent of additional material mined as a consequence ofexpansions and developments of the Grasberg facilities since 1998. Totalproduction reflects the quantities attributable to the joint venture.
(t) Rio Tinto sold its 80 per cent interest in Northparkes with an effective date of1 December 2013. Production data are shown up to that date.
(u) Rio Tinto owns a 33.52 per cent indirect interest in Oyu Tolgoi through its50.79 per cent interest in Turquoise Hill Resources Ltd. Production included in thetable is from 1 May 2013.
(v) The sale of Rio Tinto’s 57.7 per cent interest in Palabora Mining Companywas completed on 31 July 2013. Production data have been reported up to30 June 2013.
(w) Includes 100 per cent of production from Paraburdoo, Mt Tom Price, Marandoo,Yandicoogina, Brockman, Nammuldi and the Eastern Range mines. WhilstRio Tinto owns 54 per cent of the Eastern Range mine, under the terms of thejoint venture agreement, Hamersley Iron manages the operation and is obliged topurchase all mine production from the joint venture and therefore all of theproduction is included in Rio Tinto’s share of production.
(x) The 2014 silver production from Grasberg did not exceed the metal attributable toPT Freeport Indonesia per the joint venture agreement for the year. Accordingly,Rio Tinto’s share of joint venture silver production was zero for the year 2014.
(y) On 7 September 2012, Rio Tinto increased its stake in Richards Bay Minerals(RBM) from 37 per cent to 74 per cent through the acquisition of BHP Billiton’sinterest in RBM.
(z) Quantities comprise 100 per cent of Rio Tinto Fer et Titane and Rio Tinto’s share ofRichards Bay Minerals’ production. Ilmenite mined in Madagascar is beingprocessed in Canada.
(aa) ERA production has been restated from “produced ready for packing” to“drummed” U3O8, in line with production reported by Energy Resources ofAustralia Ltd to the Australian Stock Exchange (ASX).
(bb) Rössing production has been restated from “produced ready for packing” to“drummed” U3O8, to allow reporting of aggregated production.
198 riotinto.com
For
per
sona
l use
onl
y
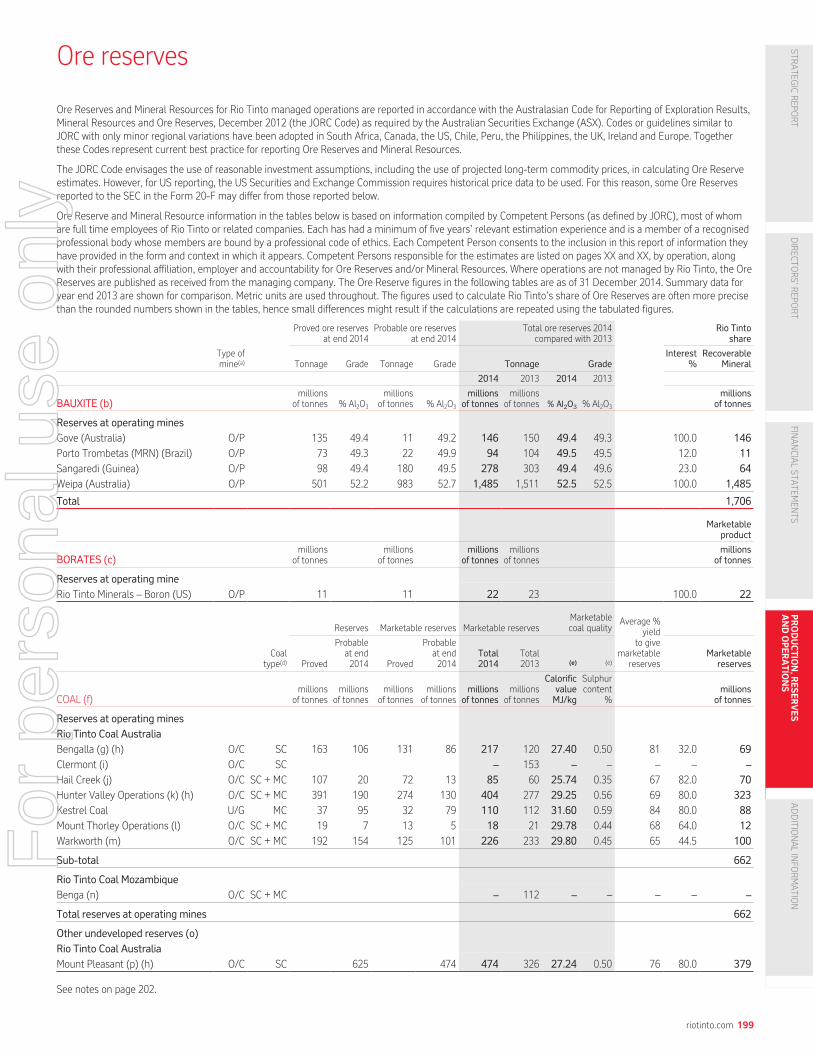
Ore reserves
Ore Reserves and Mineral Resources for Rio Tinto managed operations are reported in accordance with the Australasian Code for Reporting of Exploration Results,Mineral Resources and Ore Reserves, December 2012 (the JORC Code) as required by the Australian Securities Exchange (ASX). Codes or guidelines similar toJORC with only minor regional variations have been adopted in South Africa, Canada, the US, Chile, Peru, the Philippines, the UK, Ireland and Europe. Togetherthese Codes represent current best practice for reporting Ore Reserves and Mineral Resources.
The JORC Code envisages the use of reasonable investment assumptions, including the use of projected long-term commodity prices, in calculating Ore Reserveestimates. However, for US reporting, the US Securities and Exchange Commission requires historical price data to be used. For this reason, some Ore Reservesreported to the SEC in the Form 20-F may differ from those reported below.
Ore Reserve and Mineral Resource information in the tables below is based on information compiled by Competent Persons (as defined by JORC), most of whomare full time employees of Rio Tinto or related companies. Each has had a minimum of five years’ relevant estimation experience and is a member of a recognisedprofessional body whose members are bound by a professional code of ethics. Each Competent Person consents to the inclusion in this report of information theyhave provided in the form and context in which it appears. Competent Persons responsible for the estimates are listed on pages XX and XX, by operation, alongwith their professional affiliation, employer and accountability for Ore Reserves and/or Mineral Resources. Where operations are not managed by Rio Tinto, the OreReserves are published as received from the managing company. The Ore Reserve figures in the following tables are as of 31 December 2014. Summary data foryear end 2013 are shown for comparison. Metric units are used throughout. The figures used to calculate Rio Tinto’s share of Ore Reserves are often more precisethan the rounded numbers shown in the tables, hence small differences might result if the calculations are repeated using the tabulated figures.
Proved ore reservesat end 2014
Probable ore reservesat end 2014
Total ore reserves 2014compared with 2013
Rio Tintoshare
Type ofmine(a) Tonnage Grade Tonnage Grade Tonnage Grade
Interest%
RecoverableMineral
2014 2013 2014 2013
BAUXITE (b)millions
of tonnes % Al2O3
millionsof tonnes % Al2O3
millionsof tonnes
millionsof tonnes % Al2O3 % Al2O3
millionsof tonnes
Reserves at operating mines
Gove (Australia) O/P 135 49.4 11 49.2 146 150 49.4 49.3 100.0 146
Porto Trombetas (MRN) (Brazil) O/P 73 49.3 22 49.9 94 104 49.5 49.5 12.0 11
Sangaredi (Guinea) O/P 98 49.4 180 49.5 278 303 49.4 49.6 23.0 64
Weipa (Australia) O/P 501 52.2 983 52.7 1,485 1,511 52.5 52.5 100.0 1,485
Total 1,706
Marketableproduct
BORATES (c)millions
of tonnesmillions
of tonnesmillions
of tonnesmillions
of tonnesmillions
of tonnes
Reserves at operating mine
Rio Tinto Minerals – Boron (US) O/P 11 11 22 23 100.0 22
Reserves Marketable reserves Marketable reservesMarketablecoal quality
Average %yield
to givemarketable
reservesCoal
type(d) Proved
Probableat end2014 Proved
Probableat end2014
Total2014
Total2013 (e) (e)
Marketablereserves
COAL (f)millions
of tonnesmillions
of tonnesmillions
of tonnesmillions
of tonnesmillions
of tonnesmillions
of tonnes
CalorificvalueMJ/kg
Sulphurcontent
%millions
of tonnes
Reserves at operating mines
Rio Tinto Coal Australia
Bengalla (g) (h) O/C SC 163 106 131 86 217 120 27.40 0.50 81 32.0 69
Clermont (i) O/C SC – 153 – – – – –
Hail Creek (j) O/C SC + MC 107 20 72 13 85 60 25.74 0.35 67 82.0 70
Hunter Valley Operations (k) (h) O/C SC + MC 391 190 274 130 404 277 29.25 0.56 69 80.0 323
Kestrel Coal U/G MC 37 95 32 79 110 112 31.60 0.59 84 80.0 88
Mount Thorley Operations (l) O/C SC + MC 19 7 13 5 18 21 29.78 0.44 68 64.0 12
Warkworth (m) O/C SC + MC 192 154 125 101 226 233 29.80 0.45 65 44.5 100
Sub-total 662
Rio Tinto Coal Mozambique
Benga (n) O/C SC + MC – 112 – – – – –
Total reserves at operating mines 662
Other undeveloped reserves (o)
Rio Tinto Coal Australia
Mount Pleasant (p) (h) O/C SC 625 474 474 326 27.24 0.50 76 80.0 379
See notes on page 202.
riotinto.com 199
STRATEG
ICREPO
RT
DIRECTO
RS’R
EPORT
FINANCIA
LSTA
TEMEN
TSP
RO
DU
CT
ION
,R
ES
ER
VE
SA
ND
OP
ER
AT
ION
SADDITIO
NALINFO
RMATIO
N
For
per
sona
l use
onl
y
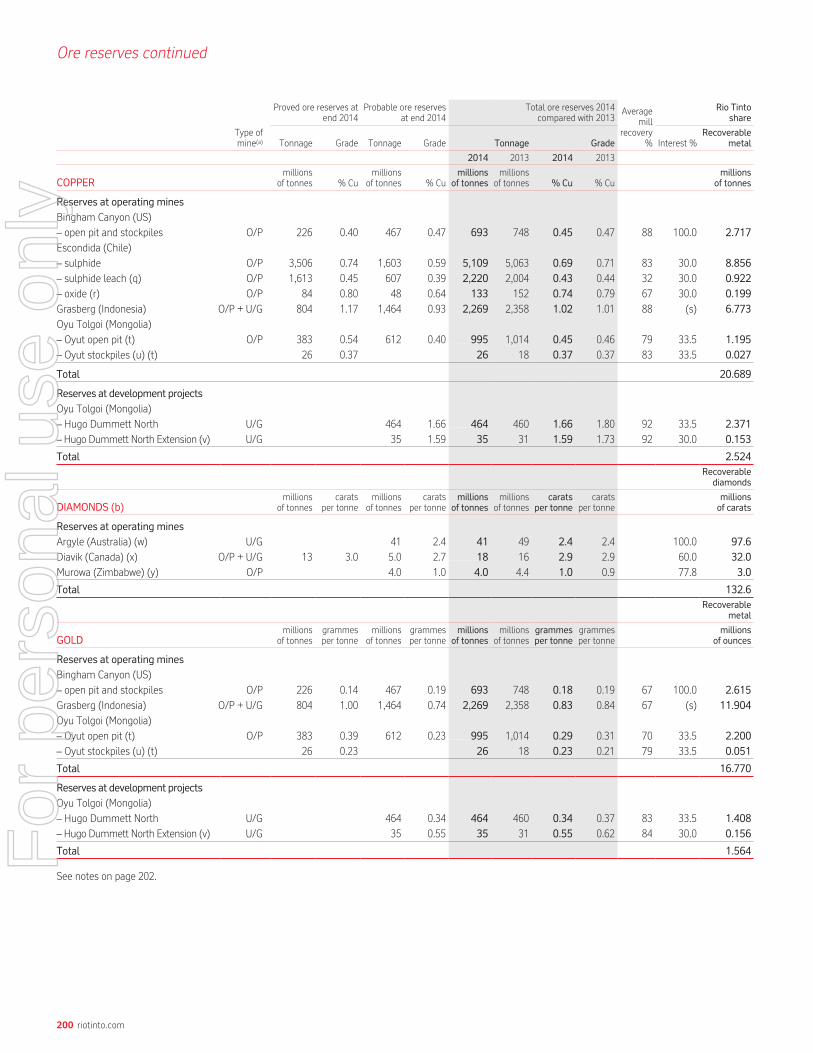
Ore reserves continued
Proved ore reserves atend 2014
Probable ore reservesat end 2014
Total ore reserves 2014compared with 2013
Averagemill
recovery%
Rio Tintoshare
Type ofmine(a) Tonnage Grade Tonnage Grade Tonnage Grade Interest %
Recoverablemetal
2014 2013 2014 2013
COPPERmillions
of tonnes % Cumillions
of tonnes % Cumillions
of tonnesmillions
of tonnes %Cu % Cumillions
of tonnes
Reserves at operating mines
Bingham Canyon (US)
– open pit and stockpiles O/P 226 0.40 467 0.47 693 748 0.45 0.47 88 100.0 2.717
Escondida (Chile)
– sulphide O/P 3,506 0.74 1,603 0.59 5,109 5,063 0.69 0.71 83 30.0 8.856
– sulphide leach (q) O/P 1,613 0.45 607 0.39 2,220 2,004 0.43 0.44 32 30.0 0.922
– oxide (r) O/P 84 0.80 48 0.64 133 152 0.74 0.79 67 30.0 0.199
Grasberg (Indonesia) O/P + U/G 804 1.17 1,464 0.93 2,269 2,358 1.02 1.01 88 (s) 6.773
Oyu Tolgoi (Mongolia)
– Oyut open pit (t) O/P 383 0.54 612 0.40 995 1,014 0.45 0.46 79 33.5 1.195
– Oyut stockpiles (u) (t) 26 0.37 26 18 0.37 0.37 83 33.5 0.027
Total 20.689
Reserves at development projects
Oyu Tolgoi (Mongolia)
– Hugo Dummett North U/G 464 1.66 464 460 1.66 1.80 92 33.5 2.371
– Hugo Dummett North Extension (v) U/G 35 1.59 35 31 1.59 1.73 92 30.0 0.153
Total 2.524
Recoverablediamonds
DIAMONDS (b)millions
of tonnescarats
per tonnemillions
of tonnescarats
per tonnemillions
of tonnesmillions
of tonnescarats
per tonnecarats
per tonnemillionsof carats
Reserves at operating mines
Argyle (Australia) (w) U/G 41 2.4 41 49 2.4 2.4 100.0 97.6
Diavik (Canada) (x) O/P + U/G 13 3.0 5.0 2.7 18 16 2.9 2.9 60.0 32.0
Murowa (Zimbabwe) (y) O/P 4.0 1.0 4.0 4.4 1.0 0.9 77.8 3.0
Total 132.6
Recoverablemetal
GOLDmillions
of tonnesgrammesper tonne
millionsof tonnes
grammesper tonne
millionsof tonnes
millionsof tonnes
grammesper tonne
grammesper tonne
millionsof ounces
Reserves at operating mines
Bingham Canyon (US)
– open pit and stockpiles O/P 226 0.14 467 0.19 693 748 0.18 0.19 67 100.0 2.615
Grasberg (Indonesia) O/P + U/G 804 1.00 1,464 0.74 2,269 2,358 0.83 0.84 67 (s) 11.904
Oyu Tolgoi (Mongolia)
– Oyut open pit (t) O/P 383 0.39 612 0.23 995 1,014 0.29 0.31 70 33.5 2.200
– Oyut stockpiles (u) (t) 26 0.23 26 18 0.23 0.21 79 33.5 0.051
Total 16.770
Reserves at development projects
Oyu Tolgoi (Mongolia)
– Hugo Dummett North U/G 464 0.34 464 460 0.34 0.37 83 33.5 1.408
– Hugo Dummett North Extension (v) U/G 35 0.55 35 31 0.55 0.62 84 30.0 0.156
Total 1.564
See notes on page 202.
200 riotinto.com
For
per
sona
l use
onl
y

Proved ore reservesat end 2014
Probable ore reservesat end 2014
Total ore reserves 2014compared with 2013
Averagemill
recovery%
Rio Tintoshare
Type ofmine(a) Tonnage Grade Tonnage Grade Tonnage Grade
Interest%
Marketableproduct
2014 2013 2014 2013
IRON ORE (b) (z)millions
of tonnes % Femillions
of tonnes % Femillions
of tonnesmillions
of tonnes % Fe % Femillions
of tonnes
Reserves at operating mines
Hamersley Iron (Australia)– Brockman 2 (Brockman ore) (aa) O/P 30 62.7 32 62.8 62 41 62.8 61.9 100.0 62
– Brockman 4 (Brockman ore) O/P 365 62.3 151 60.7 516 516 61.9 62.0 100.0 516
– Marandoo (Marra Mamba ore) O/P 170 63.6 23 61.4 193 205 63.3 63.2 100.0 193
– Mt Tom Price (Brockman ore) (bb) O/P 11 64.0 36 63.8 46 53 63.8 63.6 100.0 46
– Mt Tom Price (Marra Mamba ore) O/P 8 60.9 1 58.8 9 9 60.8 60.8 100.0 9
– Nammuldi (Marra Mamba ore) O/P 73 62.9 91 62.4 164 165 62.6 62.6 100.0 164
– Paraburdoo (Brockman ore) (cc) O/P 8 61.7 8 63.6 16 14 62.7 63.5 100.0 16
– Western Turner Syncline (Brockman ore) O/P 241 62.4 78 61.2 319 331 62.1 62.0 100.0 319
– Yandicoogina (Pisolite ore HG) (dd) O/P 246 58.7 1 59.1 247 298 58.7 58.7 100.0 247
Channar JV (Australia)– Brockman ore (ee) O/P 27 62.8 33 61.4 60 40 62.0 62.9 60.0 36
Eastern Range JV (Australia)– Brockman ore (ff) O/P 45 62.3 14 61.3 59 47 62.0 62.7 54.0 32
Hope Downs JV (Australia)– Hope Downs 1 (Marra Mamba ore) O/P 5 61.4 206 61.6 212 225 61.6 61.6 50.0 106
– Hope Downs 4 (Brockman ore) (gg) O/P 64 63.0 90 63.2 154 138 63.1 63.1 50.0 77
Robe River JV (Australia)– Pannawonica (Pisolite ore) (hh) O/P 128 57.2 88 56.3 216 260 56.8 56.9 53.0 115
– West Angelas (Marra Mamba ore) O/P 129 62.0 56 60.2 185 196 61.5 61.5 53.0 98
Iron Ore Company of Canada (Canada) (ii) O/P 276 65.0 280 65.0 556 592 65.0 65.0 58.7 326
Total 2,363
Reserves at development projects
Hamersley Iron (Australia)– Koodaideri (Brockman ore) (jj) O/P 253 62.1 213 61.5 467 418 61.8 61.8 100.0 467
– Silvergrass East (Marra Mamba ore) O/P 113 62.7 33 60.4 146 144 62.1 62.2 100.0 146
– Turee Central (Brockman ore) O/P 72 62.0 6 61.4 78 78 61.9 61.9 100.0 78
Simandou (Guinea) (kk) O/P 1,844 65.5 1,844 1,844 65.5 65.5 46.6 859
Total 1,549
Recoverablemetal
MOLYBDENUMmillions
of tonnes % Momillions
of tonnes % Momillions
of tonnesmillions
of tonnes %Mo %Momillions
of tonnes
Reserves at operating mine
Bingham Canyon (US)– open pit and stockpiles (ll) O/P 226 0.035 467 0.036 693 748 0.036 0.043 67 100.0 0.165
Total 0.165
SILVERmillions
of tonnesgrammesper tonne
millionsof tonnes
grammesper tonne
millionsof tonnes
millionsof tonnes
grammesper tonne
grammesper tonne
millionsof ounces
Reserves at operating mines
Bingham Canyon (US)– open pit and stockpiles O/P 226 1.75 467 2.19 693 748 2.04 2.08 67 100.0 30.499
Grasberg (Indonesia) O/P + U/G 804 4.58 1,464 4.18 2,269 2,358 4.32 4.26 70 (s) 77.868
Oyu Tolgoi (Mongolia) (mm)– Oyut open pit (t) O/P 383 1.41 612 1.12 995 – 1.23 – 76 33.5 10.026
– Oyut stockpiles (u) (t) 26 0.35 26 – 0.35 – 77 33.5 0.076
Total 118.469
Reserves at development projects
Oyu Tolgoi (Mongolia) (mm)– Hugo Dummett North U/G 464 3.37 464 – 3.37 – 86 33.5 14.579
– Hugo Dummett North Extension (v) U/G 35 3.72 35 – 3.72 – 86 30.0 1.079
Total 15.657
See notes on page 202.
riotinto.com 201
STRATEG
ICREPO
RT
DIRECTO
RS’R
EPORT
FINANCIA
LSTA
TEMEN
TSP
RO
DU
CT
ION
,R
ES
ER
VE
SA
ND
OP
ER
AT
ION
SADDITIO
NALINFO
RMATIO
N
For
per
sona
l use
onl
y
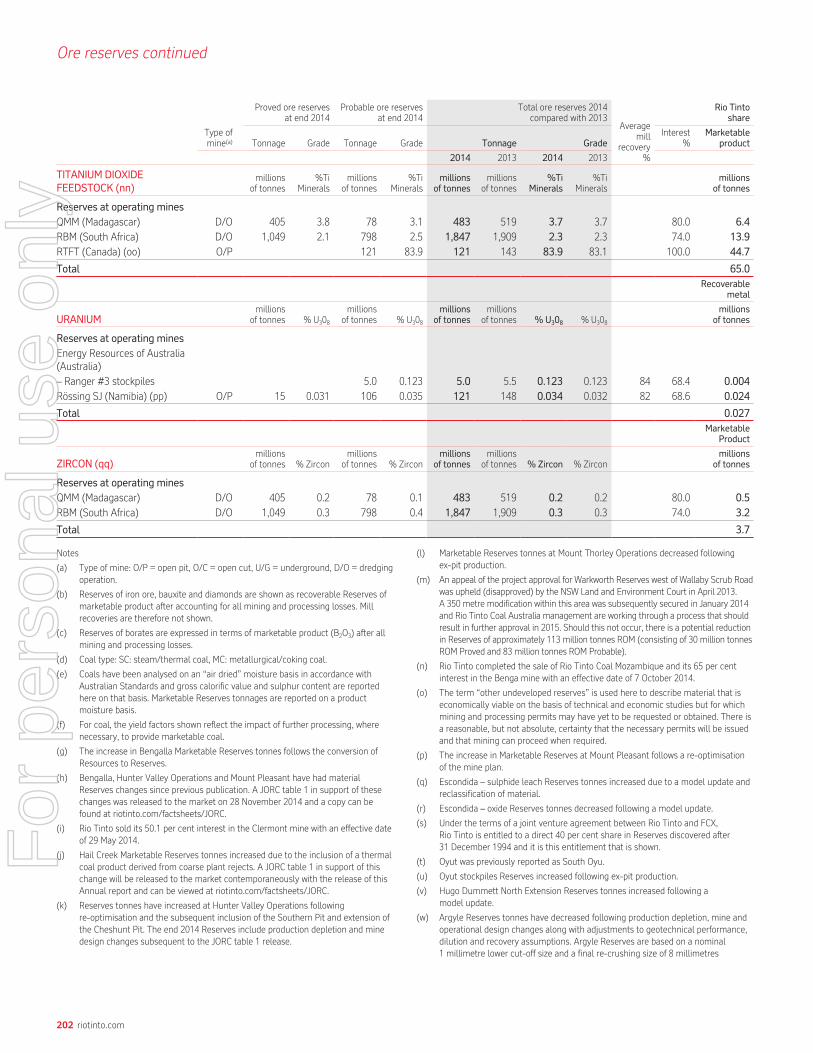
Ore reserves continued
Proved ore reservesat end 2014
Probable ore reservesat end 2014
Total ore reserves 2014compared with 2013
Averagemill
recovery%
Rio Tintoshare
Type ofmine(a) Tonnage Grade Tonnage Grade Tonnage Grade
Interest%
Marketableproduct
2014 2013 2014 2013
TITANIUM DIOXIDEFEEDSTOCK (nn)
millionsof tonnes
%TiMinerals
millionsof tonnes
%TiMinerals
millionsof tonnes
millionsof tonnes
%TiMinerals
%TiMinerals
millionsof tonnes
Reserves at operating mines
QMM (Madagascar) D/O 405 3.8 78 3.1 483 519 3.7 3.7 80.0 6.4
RBM (South Africa) D/O 1,049 2.1 798 2.5 1,847 1,909 2.3 2.3 74.0 13.9
RTFT (Canada) (oo) O/P 121 83.9 121 143 83.9 83.1 100.0 44.7
Total 65.0
Recoverablemetal
URANIUMmillions
of tonnes % U308millions
of tonnes % U308millions
of tonnesmillions
of tonnes %U308 % U308millions
of tonnes
Reserves at operating mines
Energy Resources of Australia(Australia)– Ranger #3 stockpiles 5.0 0.123 5.0 5.5 0.123 0.123 84 68.4 0.004
Rössing SJ (Namibia) (pp) O/P 15 0.031 106 0.035 121 148 0.034 0.032 82 68.6 0.024
Total 0.027
MarketableProduct
ZIRCON (qq)millions
of tonnes % Zirconmillions
of tonnes % Zirconmillions
of tonnesmillions
of tonnes %Zircon % Zirconmillions
of tonnes
Reserves at operating mines
QMM (Madagascar) D/O 405 0.2 78 0.1 483 519 0.2 0.2 80.0 0.5
RBM (South Africa) D/O 1,049 0.3 798 0.4 1,847 1,909 0.3 0.3 74.0 3.2
Total 3.7
Notes
(a) Type of mine: O/P = open pit, O/C = open cut, U/G = underground, D/O = dredgingoperation.
(b) Reserves of iron ore, bauxite and diamonds are shown as recoverable Reserves ofmarketable product after accounting for all mining and processing losses. Millrecoveries are therefore not shown.
(c) Reserves of borates are expressed in terms of marketable product (B2O3) after allmining and processing losses.
(d) Coal type: SC: steam/thermal coal, MC: metallurgical/coking coal.
(e) Coals have been analysed on an “air dried” moisture basis in accordance withAustralian Standards and gross calorific value and sulphur content are reportedhere on that basis. Marketable Reserves tonnages are reported on a productmoisture basis.
(f) For coal, the yield factors shown reflect the impact of further processing, wherenecessary, to provide marketable coal.
(g) The increase in Bengalla Marketable Reserves tonnes follows the conversion ofResources to Reserves.
(h) Bengalla, Hunter Valley Operations and Mount Pleasant have had materialReserves changes since previous publication. A JORC table 1 in support of thesechanges was released to the market on 28 November 2014 and a copy can befound at riotinto.com/factsheets/JORC.
(i) Rio Tinto sold its 50.1 per cent interest in the Clermont mine with an effective dateof 29 May 2014.
(j) Hail Creek Marketable Reserves tonnes increased due to the inclusion of a thermalcoal product derived from coarse plant rejects. A JORC table 1 in support of thischange will be released to the market contemporaneously with the release of thisAnnual report and can be viewed at riotinto.com/factsheets/JORC.
(k) Reserves tonnes have increased at Hunter Valley Operations followingre-optimisation and the subsequent inclusion of the Southern Pit and extension ofthe Cheshunt Pit. The end 2014 Reserves include production depletion and minedesign changes subsequent to the JORC table 1 release.
(l) Marketable Reserves tonnes at Mount Thorley Operations decreased followingex-pit production.
(m) An appeal of the project approval for Warkworth Reserves west of Wallaby Scrub Roadwas upheld (disapproved) by the NSW Land and Environment Court in April 2013.A 350 metre modification within this area was subsequently secured in January 2014and Rio Tinto Coal Australia management are working through a process that shouldresult in further approval in 2015. Should this not occur, there is a potential reductionin Reserves of approximately 113 million tonnes ROM (consisting of 30 million tonnesROM Proved and 83 million tonnes ROM Probable).
(n) Rio Tinto completed the sale of Rio Tinto Coal Mozambique and its 65 per centinterest in the Benga mine with an effective date of 7 October 2014.
(o) The term “other undeveloped reserves” is used here to describe material that iseconomically viable on the basis of technical and economic studies but for whichmining and processing permits may have yet to be requested or obtained. There isa reasonable, but not absolute, certainty that the necessary permits will be issuedand that mining can proceed when required.
(p) The increase in Marketable Reserves at Mount Pleasant follows a re-optimisationof the mine plan.
(q) Escondida – sulphide leach Reserves tonnes increased due to a model update andreclassification of material.
(r) Escondida – oxide Reserves tonnes decreased following a model update.
(s) Under the terms of a joint venture agreement between Rio Tinto and FCX,Rio Tinto is entitled to a direct 40 per cent share in Reserves discovered after31 December 1994 and it is this entitlement that is shown.
(t) Oyut was previously reported as South Oyu.
(u) Oyut stockpiles Reserves increased following ex-pit production.
(v) Hugo Dummett North Extension Reserves tonnes increased following amodel update.
(w) Argyle Reserves tonnes have decreased following production depletion, mine andoperational design changes along with adjustments to geotechnical performance,dilution and recovery assumptions. Argyle Reserves are based on a nominal1 millimetre lower cut-off size and a final re-crushing size of 8 millimetres
202 riotinto.com
For
per
sona
l use
onl
y

(x) Diavik Reserves tonnes increased following the conversion of A21 Pipe Resourcesto open pit Reserves which are reported for the first time. A JORC table 1 summarysupporting this Reserve increase will be released to the marketcontemporaneously with the release of this Annual report and can be viewed atriotinto.com/factsheets/JORC. Diavik Reserves are based on a nominal 1 millimetrelower cut-off size and a final re-crushing size of 5 millimetres.
(y) Murowa Reserves are based on a nominal 1 millimetre lower cut-off size and a finalre-crushing size of 19 millimetres.
(z) Australian and Guinean iron ore Reserves tonnes are reported on a dryweight basis.
(aa) The Brockman 2 (Brockman ore) Reserves tonnes increase is due to an updatedgeological model and pit design modifications.
(bb) Mt Tom Price (Brockman ore) Reserves tonnes decreased following productiondepletion and updated geological models.
(cc) Paraburdoo (Brockman ore) Reserves tonnes decreased following productiondepletion and updated geological models.
(dd) Production depletion reduced the Yandicoogina (Pisolite ore HG) Reserves tonnes.
(ee) The Channar JV – Brockman ore Reserves tonnes increase is a result of cut-offgrade changes, updated geological models and pit redesign.
(ff) The Eastern Range JV – Brockman ore Reserves tonnes increase is a result ofcut-off grade changes and updated geological models.
(gg) The Hope Downs 4 (Brockman ore) Reserves tonnes increase follows updatedpit designs.
(hh) The Reserves tonnage decrease at Pannawonica follows a geological model updateand production depletion.
(ii) Reserves at Iron Ore Company of Canada are reported as marketable product(60 per cent pellets and 40 per cent concentrate for sale) at a natural moisturecontent of two per cent using process upgrade factors derived from current IOCconcentrating and pellet operations. The marketable product is obtained frommined material comprising 686 million dry tonnes at 38.5 per cent iron (Proved)and 703 million dry tonnes at 37.9 per cent iron (Probable).
(jj) The increase in Reserves tonnes at Koodaideri follows pit design modifications andupdated geological models. A JORC table 1 in support of this change will be releasedto the market contemporaneously with the release of this Annual report and can beviewed at riotinto.com/factsheets/JORC.
(kk) With the signing of the Investment Framework in May 2014, the Republic of Guineaacquired a 7.5 per cent share in Simandou with all other joint venture partners’shares decreasing proportionally. Subsequently Rio Tinto’s interest in Simandoudecreased from 50.4 per cent to 46.6 per cent.
(ll) Bingham Canyon Reserves molybdenum grades interpolated from explorationdrilling assays have been factored based on a long reconciliation history to blasthole and mill samples. The grade factor applied in 2014 was decreased based onan update of the reconciliation between resource and production drilling and millsample assays. A further reduction in molybdenum recovery has also been appliedbased on modified processing assumptions.
(mm)Silver is reported here for the first time to align with the reporting policies of theOyu Tolgoi mine operators.
(nn) This year titanium dioxide feedstock Reserves are expressed as in situ tonnes. Themarketable product (TiO2 slag) is shown after all mining and processing losses.To improve reporting clarity and consistency, Rio Tinto now also reports Timinerals aggregated grade across these operations. The equivalent 2013 figureshave been included for comparison.
(oo) RTFT Reserve tonnes decreased following a pit redesign.
(pp) Rossing SJ Reserves tonnes have decreased following adjustments to processingand recovery assumptions.
(qq) To improve reporting clarity and consistency, Rio Tinto now reports zircon acrossthese operations. The equivalent 2013 figures have been included for comparison.
riotinto.com 203
STRATEG
ICREPO
RT
DIRECTO
RS’R
EPORT
FINANCIA
LSTA
TEMEN
TSP
RO
DU
CT
ION
,R
ES
ER
VE
SA
ND
OP
ER
AT
ION
SADDITIO
NALINFO
RMATIO
N
For
per
sona
l use
onl
y

Mineral resources
As required by the Australian Securities Exchange, the following tables contain details of other mineralisation that has a reasonable prospect of being economicallyextracted in the future but which is not yet classified as Proved or Probable Ore Reserves. This material is defined as Mineral Resources under the JORC Code.Estimates of such material are based largely on geological information with only preliminary consideration of mining, economic and other factors. While in thejudgment of the Competent Person there are realistic expectations that all or part of the Mineral Resources will eventually become Proved or Probable OreReserves, there is no guarantee that this will occur as the result depends on further technical and economic studies and prevailing economic conditions in thefuture. As in the case of Ore Reserves, managed operations’ estimates are completed using or testing against Rio Tinto, long-term pricing and market forecasts/scenarios. Mineral Resources are stated as additional to the Ore Reserves reported earlier. Where operations are not managed by Rio Tinto, the Mineral Resourcesare published as received from the managing company. Where new project Mineral Resources or Ore Reserves are footnoted as being reported for the first time,additional information about them can be viewed on the Rio Tinto website.
Likelyminingmethod(a)
Measured resourcesat end 2014
Indicated resourcesat end 2014
Inferred resourcesat end 2014
Total resources 2014compared with 2013
Rio TintoInterest
%Tonnage Grade Tonnage Grade Tonnage Grade Tonnage Grade
BAUXITEmillions
of tonnes % Al2O3
millionsof tonnes % Al2O3
millionsof tonnes % Al2O3
2014millions
of tonnes
2013millions
of tonnes
2014
% Al2O3
2013
% Al2O3
Gove (Australia) O/P 16 49.2 32 49.4 3.7 50.1 52 48 49.4 49.6 100.0
Porto Trombetas (MRN) (Brazil) O/P 293 49.6 40 48.9 134 49.9 468 440 49.6 50.0 12.0
Sangaredi (Guinea) O/P 62 45.5 4,088 47.5 1,537 46.3 5,687 5,771 47.1 46.5 23.0Weipa (Australia) O/P 95 49.4 1,320 51.4 490 52.0 1,905 1,965 51.5 51.3 100.0
BORATES (b)millions
of tonnesmillions
of tonnesmillions
of tonnesmillions
of tonnesmillions
of tonnes
Rio Tinto Minerals – Boron (US) (c) O/P – 0.1 100.0Jadar (Serbia) U/G 18 18 18 100.0
Coaltype(d)
Coal resources at end 2014 Total resources 2014 compared with 2013
Measured Indicated Inferred 2014 2013
COAL (e)millions
of tonnesmillions
of tonnesmillions
of tonnesmillions
of tonnesmillions
of tonnes
Rio Tinto Coal Australia
Bengalla (f) (g) O/C + U/G SC + MC 57 49 80 187 246 32.0
Blair Athol (h) O/C SC 10 0.2 10 10 71.2
Clermont (i) O/C SC – 15 –
Hail Creek O/C SC + MC 60 79 33 172 172 82.0
Hunter Valley Operations (j) (g) O/C + U/G SC + MC 269 379 725 1,373 904 80.0
Kestrel Coal U/G MC 3 3 3 80.0
Kestrel West U/G SC 106 33 139 139 80.0
Lake Elphinstone O/C SC + MC 120 42 162 162 82.0
Mount Pleasant O/C + U/G SC + MC 97 217 257 571 612 80.0
Mount Thorley Operations O/C + U/G SC + MC 19 94 113 113 64.0
Oaklands O/C SC 596 584 90 1,270 1,270 80.0
Valeria O/C SC 698 64 762 762 71.2
Warkworth O/C + U/G SC + MC 6 125 343 475 475 44.5
Winchester South O/C MC 17 175 192 192 75.0
Rio Tinto Coal Mozambique
Benga (k) O/C SC + MC – 360 –Zambeze (l) O/C SC + MC – 1,988 –
See notes on page 208.
204 riotinto.com
For
per
sona
l use
onl
y
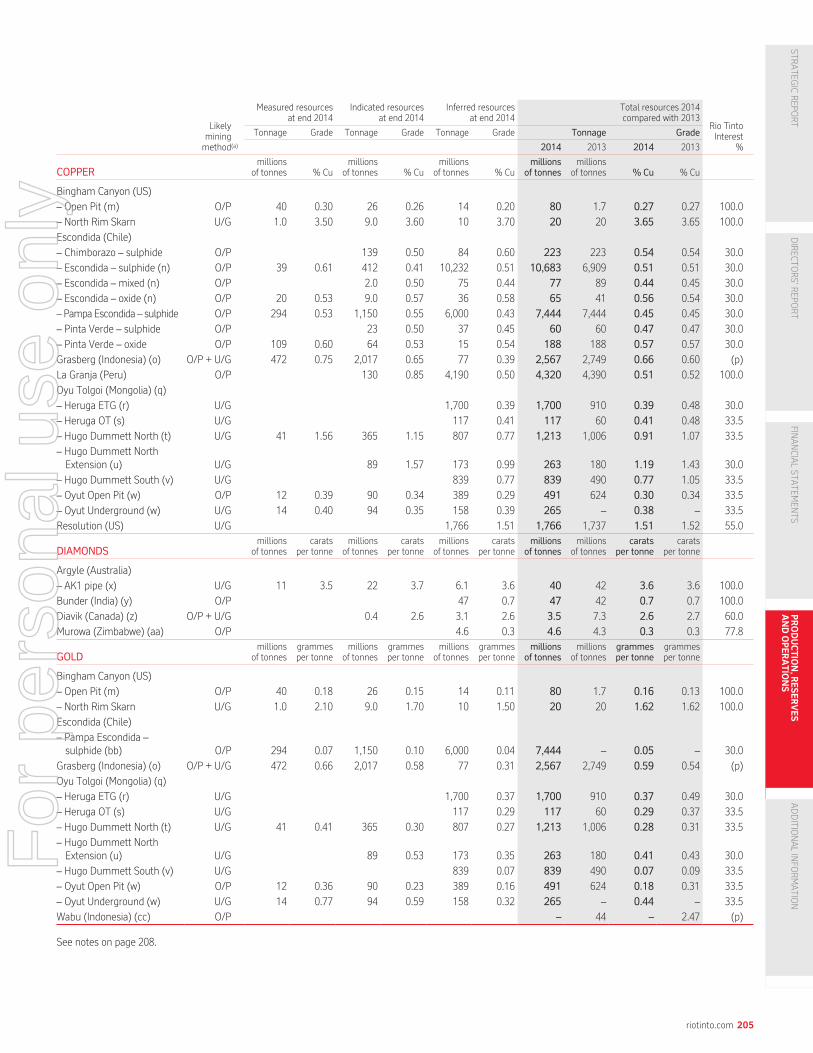
Likelyminingmethod(a)
Measured resourcesat end 2014
Indicated resourcesat end 2014
Inferred resourcesat end 2014
Total resources 2014compared with 2013
Rio TintoInterest
%
Tonnage Grade Tonnage Grade Tonnage Grade Tonnage Grade
2014 2013 2014 2013
COPPERmillions
of tonnes % Cumillions
of tonnes % Cumillions
of tonnes % Cumillions
of tonnesmillions
of tonnes %Cu % Cu
Bingham Canyon (US)
– Open Pit (m) O/P 40 0.30 26 0.26 14 0.20 80 1.7 0.27 0.27 100.0
– North Rim Skarn U/G 1.0 3.50 9.0 3.60 10 3.70 20 20 3.65 3.65 100.0
Escondida (Chile)
– Chimborazo – sulphide O/P 139 0.50 84 0.60 223 223 0.54 0.54 30.0
– Escondida – sulphide (n) O/P 39 0.61 412 0.41 10,232 0.51 10,683 6,909 0.51 0.51 30.0
– Escondida – mixed (n) O/P 2.0 0.50 75 0.44 77 89 0.44 0.45 30.0
– Escondida – oxide (n) O/P 20 0.53 9.0 0.57 36 0.58 65 41 0.56 0.54 30.0
– PampaEscondida – sulphide O/P 294 0.53 1,150 0.55 6,000 0.43 7,444 7,444 0.45 0.45 30.0
– Pinta Verde – sulphide O/P 23 0.50 37 0.45 60 60 0.47 0.47 30.0
– Pinta Verde – oxide O/P 109 0.60 64 0.53 15 0.54 188 188 0.57 0.57 30.0
Grasberg (Indonesia) (o) O/P + U/G 472 0.75 2,017 0.65 77 0.39 2,567 2,749 0.66 0.60 (p)
La Granja (Peru) O/P 130 0.85 4,190 0.50 4,320 4,390 0.51 0.52 100.0
Oyu Tolgoi (Mongolia) (q)
– Heruga ETG (r) U/G 1,700 0.39 1,700 910 0.39 0.48 30.0
– Heruga OT (s) U/G 117 0.41 117 60 0.41 0.48 33.5
– Hugo Dummett North (t) U/G 41 1.56 365 1.15 807 0.77 1,213 1,006 0.91 1.07 33.5
– Hugo Dummett NorthExtension (u) U/G 89 1.57 173 0.99 263 180 1.19 1.43 30.0
– Hugo Dummett South (v) U/G 839 0.77 839 490 0.77 1.05 33.5
– Oyut Open Pit (w) O/P 12 0.39 90 0.34 389 0.29 491 624 0.30 0.34 33.5
– Oyut Underground (w) U/G 14 0.40 94 0.35 158 0.39 265 – 0.38 – 33.5
Resolution (US) U/G 1,766 1.51 1,766 1,737 1.51 1.52 55.0
DIAMONDSmillions
of tonnescarats
per tonnemillions
of tonnescarats
per tonnemillions
of tonnescarats
per tonnemillions
of tonnesmillions
of tonnescarats
per tonnecarats
per tonne
Argyle (Australia)
– AK1 pipe (x) U/G 11 3.5 22 3.7 6.1 3.6 40 42 3.6 3.6 100.0
Bunder (India) (y) O/P 47 0.7 47 42 0.7 0.7 100.0
Diavik (Canada) (z) O/P + U/G 0.4 2.6 3.1 2.6 3.5 7.3 2.6 2.7 60.0
Murowa (Zimbabwe) (aa) O/P 4.6 0.3 4.6 4.3 0.3 0.3 77.8
GOLDmillions
of tonnesgrammesper tonne
millionsof tonnes
grammesper tonne
millionsof tonnes
grammesper tonne
millionsof tonnes
millionsof tonnes
grammesper tonne
grammesper tonne
Bingham Canyon (US)
– Open Pit (m) O/P 40 0.18 26 0.15 14 0.11 80 1.7 0.16 0.13 100.0
– North Rim Skarn U/G 1.0 2.10 9.0 1.70 10 1.50 20 20 1.62 1.62 100.0
Escondida (Chile)
– Pampa Escondida –sulphide (bb) O/P 294 0.07 1,150 0.10 6,000 0.04 7,444 – 0.05 – 30.0
Grasberg (Indonesia) (o) O/P + U/G 472 0.66 2,017 0.58 77 0.31 2,567 2,749 0.59 0.54 (p)
Oyu Tolgoi (Mongolia) (q)
– Heruga ETG (r) U/G 1,700 0.37 1,700 910 0.37 0.49 30.0
– Heruga OT (s) U/G 117 0.29 117 60 0.29 0.37 33.5
– Hugo Dummett North (t) U/G 41 0.41 365 0.30 807 0.27 1,213 1,006 0.28 0.31 33.5
– Hugo Dummett NorthExtension (u) U/G 89 0.53 173 0.35 263 180 0.41 0.43 30.0
– Hugo Dummett South (v) U/G 839 0.07 839 490 0.07 0.09 33.5
– Oyut Open Pit (w) O/P 12 0.36 90 0.23 389 0.16 491 624 0.18 0.31 33.5
– Oyut Underground (w) U/G 14 0.77 94 0.59 158 0.32 265 – 0.44 – 33.5
Wabu (Indonesia) (cc) O/P – 44 – 2.47 (p)
See notes on page 208.
riotinto.com 205
STRATEG
ICREPO
RT
DIRECTO
RS’R
EPORT
FINANCIA
LSTA
TEMEN
TSP
RO
DU
CT
ION
,R
ES
ER
VE
SA
ND
OP
ER
AT
ION
SADDITIO
NALINFO
RMATIO
N
For
per
sona
l use
onl
y

Mineral resources continued
Likelyminingmethod(a)
Measured resourcesat end 2014
Indicated resourcesat end 2014
Inferred resourcesat end 2014
Total resources 2014compared with 2013
Rio TintoInterest
%
Tonnage Grade Tonnage Grade Tonnage Grade Tonnage Grade
2014 2013 2014 2013
IRON ORE (dd)millions
of tonnes % Femillions
of tonnes % Femillions
of tonnes % Femillions
of tonnesmillions
of tonnes % Fe % Fe
Hamersley Iron (Australia)
– Brockman (ee) O/P 426 62.8 520 62.6 2,051 61.7 2,998 2,317 62.0 62.0 100.0
– Brockman Process Ore (ee) O/P 329 57.6 180 57.3 628 57.3 1,137 813 57.4 57.4 100.0
– Marra Mamba O/P 216 62.4 439 61.8 813 61.6 1,468 1,401 61.8 61.7 100.0
– Detrital (ee) O/P 3 63.4 142 61.2 497 61.2 642 560 61.2 61.2 100.0
– Channel Iron Deposit O/P 830 57.4 216 57.7 2,312 57.0 3,358 3,334 57.2 57.2 100.0
Channar JV (Australia)
– Brockman (ff) O/P 36 61.9 23 61.7 1 61.5 60 34 61.8 61.7 60.0
– Brockman Process Ore O/P 21 58.0 7 58.0 28 29 58.0 57.9 60.0
Eastern Range JV (Australia)
– Brockman (gg) O/P 15 62.2 8 61.6 8 61.7 31 28 61.9 61.7 54.0
– Brockman Process Ore (gg) O/P 20 57.3 7 57.2 3 57.9 30 41 57.3 57.2 54.0
Hope Downs JV (Australia)
– Brockman O/P 12 61.7 104 62.2 424 62.3 540 522 62.3 62.2 50.0
– Brockman Process Ore O/P 58 56.8 89 56.8 194 56.6 341 319 56.7 56.7 50.0
– Marra Mamba O/P 5 61.1 128 62.1 262 61.7 395 414 61.9 61.8 50.0
– Detrital (hh) O/P 3 59.9 50 59.3 53 47 59.4 59.1 50.0
Rhodes Ridge JV (Australia)
– Brockman O/P 565 63.9 1,476 62.5 2,041 2,043 62.9 62.9 50.0
– Brockman Process Ore O/P 176 57.6 460 56.5 636 636 56.8 56.8 50.0
– Marra Mamba O/P 404 62.4 1,912 62.0 2,316 2,339 62.1 62.1 50.0
– Detrital O/P 65 60.5 226 60.1 291 292 60.2 60.2 50.0
Robe JV (Australia)
– Brockman (ii) O/P 46 61.9 46 15 61.9 61.3 53.0
– Brockman Process Ore (ii) O/P 32 57.0 32 15 57.0 57.1 53.0
– Marra Mamba O/P 101 62.0 190 61.5 288 61.5 579 581 61.6 61.6 53.0
– Detrital (ii) O/P 3 59.7 95 60.6 98 68 60.6 60.8 53.0
– Channel Iron Deposit (jj) O/P 213 56.7 1,740 58.4 2,320 55.7 4,273 3,757 56.8 57.4 53.0
Iron Ore Company of Canada(Canada) (kk) O/P 375 38.6 1,626 37.8 705 37.3 2,706 3,193 37.8 37.6 58.7
Simandou (Guinea) (ll) O/P 5 67.1 107 64.3 723 65.1 835 796 65.0 65.1 46.6
LITHIUMmillions
of tonnes % Li2Omillions
of tonnes % Li2Omillions
of tonnes % Li2Omillions
of tonnesmillions
of tonnes % Li2O % Li2O
Jadar (Serbia) U/G 117 1.8 117 118 1.8 1.8 100.0
See notes on page 208.
206 riotinto.com
For
per
sona
l use
onl
y

Likelyminingmethod(a)
Measured resourcesat end 2014
Indicated resourcesat end 2014
Inferred resourcesat end 2014
Total resources 2014compared with 2013
Rio TintoInterest
%
Tonnage Grade Tonnage Grade Tonnage Grade Tonnage Grade
2014 2013 2014 2013
MOLYBDENUMmillions
of tonnes % Momillions
of tonnes % Momillions
of tonnes % Momillions
of tonnesmillions
of tonnes %Mo %Mo
Bingham Canyon (US)
– Open Pit (mm) (m) O/P 40 0.063 26 0.077 14 0.008 80 1.7 0.058 0.028 100.0
Oyu Tolgoi (Mongolia) (q)
– Heruga ETG (r) U/G 1,700 0.011 1,700 910 0.011 0.014 30.0
– Heruga OT (s) U/G 117 0.011 117 60 0.011 0.013 33.5
Resolution (US) U/G 1,766 0.035 1,766 1,737 0.035 0.035 55.0
NICKELmillions
of tonnes % Nimillions
of tonnes % Nimillions
of tonnes % Nimillions
of tonnesmillions
of tonnes %Ni % Ni
Sulawesi (Indonesia) (nn) O/P – 162 – 1.62 –
SILVERmillions
of tonnesgrammesper tonne
millionsof tonnes
grammesper tonne
millionsof tonnes
grammesper tonne
millionsof tonnes
millionsof tonnes
grammesper tonne
grammesper tonne
Bingham Canyon (US)
– Open Pit (m) O/P 40 1.60 26 1.50 14 1.42 80 1.7 1.54 1.53 100.0
– North Rim Skarn U/G 1.0 20.00 9.0 21.00 10 21.00 20 20 20.95 20.95 100.0
Grasberg (Indonesia) (o) O/P + U/G 472 3.80 2,017 3.56 77 1.75 2,567 2,749 3.55 3.39 (p)
Oyu Tolgoi (Mongolia) (q)
– Heruga ETG (r) U/G 1,700 1.39 1,700 – 1.39 – 30.0
– Heruga OT (s) U/G 117 1.56 117 – 1.56 – 33.5
– Hugo Dummett North (t) U/G 41 3.71 365 2.84 807 2.34 1,213 – 2.54 – 33.5
– Hugo Dummett NorthExtension (u) U/G 89 4.07 173 2.72 263 – 3.18 – 30.0
– Hugo Dummett South (v) U/G 839 1.78 839 – 1.78 – 33.5
– Oyut Open Pit (w) O/P 12 1.21 90 1.06 389 0.87 491 – 0.91 – 33.5
– Oyut Underground (w) U/G 14 1.16 94 1.19 158 0.86 265 – 0.99 – 33.5
Wabu (Indonesia) (cc) O/P – 44 – 2.33 (p)
TITANIUM DIOXIDEFEEDSTOCK (oo)
millionsof tonnes
%TiMinerals
millionsof tonnes
%TiMinerals
millionsof tonnes
%TiMinerals
millionsof tonnes
millionsof tonnes
%TiMinerals
%TiMinerals
QMM (Madagascar) D/O 56 3.6 1,109 4.2 186 3.2 1,351 1,323 4.0 4.0 80.0
RBM (South Africa) (pp) D/O + O/P 17 15.3 17 36 15.3 19.3 74.0
RTFT (Canada) O/P 11 84.9 11 11 84.9 84.9 100.0
URANIUMmillions
of tonnes % U3O8
millionsof tonnes % U3O8
millionsof tonnes % U3O8
millionsof tonnes
millionsof tonnes %U3O8 % U3O8
Energy Resources of Australia(Australia)
– Jabiluka U/G 1.2 0.887 14 0.520 10 0.545 25 25 0.547 0.547 68.4
– Ranger #3 mine (qq) U/G 2.8 0.321 6.3 0.276 3.5 0.245 13 10 0.277 0.328 68.4
– Ranger #3 stockpiles (rr) 38 0.047 38 50 0.047 0.046 68.4
Rössing (Namibia)
– Rössing SJ O/P 8.7 0.026 120 0.023 6.5 0.021 135 144 0.023 0.023 68.6
– Rössing Z20 O/P 87 0.028 115 0.026 202 202 0.027 0.027 68.6
ZIRCON (ss)millions
of tonnes % Zirconmillions
of tonnes % Zirconmillions
of tonnes % Zirconmillions
of tonnesmillions
of tonnes %Zircon % Zircon
QMM (Madagascar) D/O 56 0.2 1,109 0.3 186 0.3 1,351 1,323 0.3 0.3 80.0RBM (South Africa) (pp) D/O + O/P 17 8.5 17 36 8.5 11.3 74.0
See notes on page 208.
riotinto.com 207
STRATEG
ICREPO
RT
DIRECTO
RS’R
EPORT
FINANCIA
LSTA
TEMEN
TSP
RO
DU
CT
ION
,R
ES
ER
VE
SA
ND
OP
ER
AT
ION
SADDITIO
NALINFO
RMATIO
N
For
per
sona
l use
onl
y
Mineral resources continued
Notes
(a) Likely mining method: O/P = open pit; O/C = open cut; U/G = underground; D/O =dredging operation.
(b) Borates Resources are reported as in situ B2O3, rather than marketable product asin Reserves.
(c) The Resources at Rio Tinto Minerals – Boron have been reclassified as ProbableReserves following completion of a drilling and assaying campaign.
(d) Coal type: SC=steam/thermal coal, MC=metallurgical/coking coal.
(e) Rio Tinto reports coal Resources on an in situ moisture basis.
(f) The decrease in Bengalla Resources reflects conversion of Resources to Reserves.
(g) Bengalla and Hunter Valley Operations have had material Resources changessince previous publication. A JORC table 1 in support of these changes wasreleased to the market on 28 November 2014 and a copy can be found atriotinto.com/factsheets/JORC.
(h) Blair Athol closed in the last quarter of 2012. Rio Tinto agreed to sell its 71.2 percent interest in Blair Athol in October 2013 and completion of the sale is expectedwithin the first half of 2015.
(i) Rio Tinto sold its 50.1 per cent interest in the Clermont mine with an effective dateof 29 May 2014.
(j) Hunter Valley Operations Resources have increased following re-evaluation ofmining options resulting in the transfer of former underground Resources intoopen cut Resources.
(k) Rio Tinto completed the sale of Rio Tinto Coal Mozambique and its 65 per centinterest in the Benga mine with an effective date of 7 October 2014.
(l) Rio Tinto completed the sale of Rio Tinto Coal Mozambique and its 100 per centinterest in Zambeze with an effective date of 7 October 2014.
(m) Bingham Canyon – Open Pit Resources increased significantly with the transfer ofReserves now excluded from the mine design following a geotechnical review.
(n) The increase in Resources and improved Resources confidence at Escondidaresulted from a revised estimate that included 303,000m of additional drill holedata. This increase was published on 16 April 2014 in the BHP Billiton OperationalReview for the Nine Months Ended 31 March 2014, along with a JORC table 1, andis available to view at bhpbilliton.com.
(o) The Grasberg Resources grade increase resulted from the implementation of anew model depletion methodology for the block cave operations which returnshigher average grades.
(p) Under the terms of a joint venture agreement between Rio Tinto and FCX,Rio Tinto is entitled to a direct 40 per cent share in Resources discovered after31 December 1994.
(q) The Oyu Tolgoi project Resources were formally updated and released to themarket by Turquoise Hill Resources in October 2014 within a Canadian Instrument43-101 technical report which can be viewed at www.turquoisehill.com. Silver isreported here for the first time to align with the reporting policies of the Oyu Tolgoimine operators.
(r) Changes in Heruga ETG Resources tonnes and grade reflect a lowering of the cut-off grade following an economic re-evaluation.
(s) Heruga OT was previously reported as Heruga IVN. Changes in Heruga OTResources tonnes and grade reflect a lowering of the grade following an economicre-evaluation.
(t) Changes in Hugo Dummett North Resources tonnes and grade reflect a lowering ofthe cut-off grade following an economic re-evaluation. Measured Resources arereported for the first time based on infill drilling, a new block model andclassification method.
(u) Changes in Hugo Dummett North Extension Resources tonnes and grade reflect alowering of the cut-off grade following an economic re-evaluation.
(v) Changes in Hugo Dummett South Resources tonnes and grade reflect a loweringof the cut-off grade following an economic re-evaluation.
(w) Oyut Open Pit was previously reported as South Oyu. The open pit Resourcestonnes and grade decreased following a transfer of material to undergroundResources which are now reported for the first time at a higher cut-off grade.
(x) AK1 pipe Resources are based on a nominal 0.5 millimetre lower cut-off size and afinal re-crushing size of 6 millimetres.
(y) Bunder Resources are based on a nominal 1 millimetre lower cut-off size and afinal re-crushing size of 6 millimetres. Following a review of potential mine designsan increase in Resources tonnes is reported.
(z) Supported by technical and economic studies and additional drilling, DiavikResources decreased following transfer of the A21 Pipe Resources to open pitReserves. Diavik Resources are based on a nominal 1 millimetre lower cut-off sizeand a final re-crushing size of 5 millimetres.
(aa) Murowa Resources are based on a nominal 1 millimetre lower cut-off size and afinal re-crushing size of 19 millimetres.
(bb) Pampa Escondida is a classed as a copper deposit, however gold is declared for thefirst time as a potential by-product.
(cc) The Wabu Resource is no longer reported by Rio Tinto following advice from PTFreeport Indonesia that it has no intention to mine Wabu in the future.
(dd) Australian and Guinean iron ore Resources tonnes are reported on a dryweight basis.
(ee) Hamersley Iron – Brockman, Brockman Process Ore and Detrital Resources tonneshave increased as a result of additional drilling and updated geological models.These figures also include the first declaration of Yandi Braid deposit. A JORC table1 in support of these will be released to the market contemporaneously with therelease of this Annual report and can be viewed at riotinto.com/factsheets/JORC.
(ff) Channar JV – Brockman Resources tonnes have increased as a result of additionaldrilling, updated geological models and pit design modifications.
(gg) Eastern Range JV – Brockman Resources tonnes increased and Brockman ProcessOre tonnes decreased as a result of additional drilling, updated geological modelsand modifications to pit designs.
(hh) Hope Downs JV – Detrital Resources tonnes have increased as a result ofadditional drilling and updated geological models.
(ii) Robe JV – Brockman, Brockman Process Ore and Detrital Resources tonnes haveincreased as a result of additional drilling, updated geological models and pitdesign changes.
(jj) Robe JV – Channel Iron Deposit Resources tonnes have increased as a result ofadditional drilling, updated geological models and technical studies atJimmawurrada and other deposits. A JORC table 1 in support of these changes willbe released to the market contemporaneously with the release of this Annualreport and can be viewed at riotinto.com/factsheets/JORC.
(kk) Iron Ore Company of Canada Resources tonnes reduced following geologicalmodel updates, changes to Resource classification methodology and partialconversion of Wabush 3 Resources to Reserves. Resources are quoted on an in situdry tonnes and grades basis and would produce a marketable product (60 per centpellets and 40 per cent concentrate for sale at two per cent moisture content) of148 million tonnes at 65 per cent iron (Measured), 638 million tonnes at 65 percent iron (Indicated) and 276 million tonnes at 65 per cent iron (Inferred).
(ll) With the signing of the Investment Framework in May 2014, the Republic of Guineaacquired a 7.5 per cent share in Simandou with all other joint venture partners’shares decreasing proportionally. Subsequently Rio Tinto’s interest in Simandoudecreased from 50.4 per cent to 46.6 per cent.
(mm)Bingham Canyon Resources molybdenum grade has increased following thetransfer of higher grade Reserves to Resources after revision of the mine design.Molybdenum grades interpolated from exploration drilling assays have beenfactored based on a long reconciliation history to blast hole and mill samples.
(nn) The sale of Rio Tinto’s 38 per cent interest in Sulawesi was completed in July 2014.
(oo) This year titanium dioxide feedstock Resources are expressed as in situ tonnes. Toimprove reporting clarity and consistency, Rio Tinto now reports Ti mineralsaggregated grade across these operations. The equivalent 2013 figures have beenincluded for comparison.
(pp) RBM Resources tonnes and grade decreased following conversion of Resources toReserves and depletion due to mine production.
(qq) Ranger #3 mine underground Resources tonnes decreased and grade increasedfollowing additional drilling and a new orebody model. A JORC table 1 in support ofthese changes was released to the market by Energy Resources of AustraliaLimited on 6 February 2015 and can be viewed at www.energyres.com.au.
(rr) Ranger #3 stockpiles Resources decreased following reclassification of low gradematerial for proposed open pit mine backfill.
(ss) To improve reporting clarity and consistency, Rio Tinto now reports zircon acrossthese operations. The equivalent 2013 figures have been included for comparison.
208 riotinto.com
For
per
sona
l use
onl
y
Mineral resources and ore reserves corporate governanceRio Tinto has established a governance process supporting the generation andpublication of Mineral Resources and Ore Reserves, which includes a series ofstructures and processes independent of the operational reporting throughbusiness units and product groups.
The Audit Committee has in its remit the governance of resources andreserves. This includes an annual review of Mineral Resources and OreReserves at a Group level, as well as review of findings and progress from theGroup Resources and Reserves internal audit programme within the regularmeeting schedule.
Rio Tinto also has an Ore Reserve Steering Committee (ORSC), which meets atleast quarterly, chaired by the Group executive, Technology & Innovation, andcomprises senior representatives from technical, financial and businessgroups within the company. The ORSC role includes oversight of theappointment of Competent Persons nominated by the business units, reviewof Exploration results, Mineral Resources or Ore Reserve data prior to publicreporting and development of Group Resource and Reserves standardsand guidance.
The Resource and Reserve internal audit programme is conducted byindependent external consulting personnel in a programme managed byGroup Audit & Assurance with the assistance of the ORSC. In 2014, six internalaudits were completed. Material findings are reported outside of the productgroup reporting line to the Audit Committee, and all reports and action plansare reviewed by the ORSC for alignment to internal and externalreporting standards.
Mineral Resources and Ore Reserves from externally managed operations,where Rio Tinto holds a minority share, are reported as received from themanaging entity. Figures from Rio Tinto managed operations are theresponsibility of the managing directors of the business units and estimatesare carried out by Competent Persons as defined by JORC.
Rio Tinto has continued the development of internal systems and controls inorder to meet JORC (2012) compliance in all external reporting including thepreparation of all reported data by Competent Persons as members of TheAustralasian Institute of Mining and Metallurgy (The AusIMM), AustralianInstitute of Geoscientists (AIG) or recognised professional organisations(RPOs). JORC table 1 reports for new or materially upgraded significantdeposits are released to market by Rio Tinto and are also available on theGroup’s website. JORC table 1 and NI 43-101 technical reports generated bynon-managed units or joint venture partners are referenced within thereporting footnotes with the location and initial reporting date identified.
As well as the establishment of an enhanced governance process, there havebeen a number of process improvements and training initiatives introduced bythe ORSC over recent years, including a web-based group reporting andsign-off database, annual internal Competent Person reports and CompetentPerson development and training.
riotinto.com 209
STRATEG
ICREPO
RT
DIRECTO
RS’R
EPORT
FINANCIA
LSTA
TEMEN
TSP
RO
DU
CT
ION
,R
ES
ER
VE
SA
ND
OP
ER
AT
ION
SADDITIO
NALINFO
RMATIO
N
For
per
sona
l use
onl
y

Competent Persons
Primary commodity Name Association(a) Employer Accountability Deposits
Bauxite JPC de Melo Franco AusIMMMineração Rio do Norte
ReservesPorto Trombetas
RS Aglinskas AusIMM Resources
D Butty EuroGeol AluminPro (Associate) Resources, Reserves Sangaredi
L McAndrew AusIMMRio Tinto
ReservesGove, Weipa
J Bower AusIMM Resources
Borates R Torres AusIMMRio Tinto
ResourcesRio Tinto Minerals – Boron
B Griffiths SME Reserves
Coal G Doyle AusIMM
Rio Tinto
Reserves Rio Tinto Coal Australia – Hunter Valley Operations
G Doyle AusIMM Resources Rio Tinto Coal Australia – Blair Athol
A Prentice AusIMM Reserves Rio Tinto Coal Australia – Bengalla, Mount Pleasant
A Waltho AusIMM Resources Rio Tinto Coal Australia – Lake Elphinstone, Oaklands
R Ruddock AusIMM Resources
Rio Tinto Coal Australia – Bengalla, Hail Creek,
Hunter Valley Operations, Kestrel , Kestrel West,
Mount Pleasant, Mount Thorley Operations, Valeria,
Warkworth, Winchester South
M Hillard AusIMM Reserves Rio Tinto Coal Australia – Hail Creek
A Swiericzuk AusIMM Reserves Rio Tinto Coal Australia – Kestrel
H Bell AusIMM ReservesRio Tinto Coal Australia – Mount Thorley Operations,
Warkworth
Copper J Vickery AusIMM
Rio Tinto
Resources, Reserves
Kennecott Utah Copper (b) (c) (d)G Austin AusIMM Resources
R Hayes AusIMM Resources
M Howson IMMMMineral Resources
Professional LimitedResources
La Granja
P Salazar AusIMM Rio Tinto Resources
A Zuzunaga AusIMM
Minera Escondida Ltda.
Reserves Escondida
L Soto AusIMM ResourcesEscondida, Pampa Escondida (b), Pinta Verde
M Cortes AusIMM Resources
L Vaccia AusIMM Resources Chimborazo
G Crook AusIMM
Rio Tinto
Resources
Oyu Tolgoi (b) (c) (d)J Dudley AusIMM Reserves
B Sirait AusIMM Reserves
O Togtokhbayar AusIMM Resources
A Issel APGOFreeport-McMoRan Inc
Resources, ReservesPT Freeport – Grasberg (b) (d)
G MacDonald SME Resources, Reserves
C Hehnke AusIMM Rio Tinto Resources Resolution (c)
210 riotinto.com
For
per
sona
l use
onl
y

Primary Commodity Name Association(a) Employer Accountability Deposits
Diamonds S Brennan AusIMM
Rio Tinto
Resources, Reserves
ArgyleD Ford AIG Resources, Reserves
M Rayner AusIMM Resources, Reserves
M Rayner AusIMM Rio Tinto Resources Bunder
C Yip AusIMMRio Tinto
Resources, ReservesDiavik
K Thompson NAPEG Resources, Reserves
M Rayner AusIMM Rio Tinto ResourcesMurowa
E Harvey SAIMM Euan Harvey Consulting Reserves
Iron ore M Blake PEGNL
Rio Tinto
Resources
Iron Ore Company of CanadaR Williams PEGNL Reserves
T Leriche PEGNL Resources, Reserves
B Sommerville AusIMM
Rio Tinto
Resources Rio Tinto Iron Ore – Hamersley, Channar, Eastern
Range , Hope Downs, Robe, Rhodes RidgeP Savory AusIMM Resources
L Fouche AusIMM Reserves Rio Tinto Iron Ore – Hamersley, Channar, Eastern
Range, Hope Downs, RobeC Tabb AusIMM Reserves
R Taylor AusIMM Rio Tinto Resources, ReservesSimandou – Oueleba, Pic de Fon
M Franks AusIMM Amec Foster Wheeler Resources
Lithium J Garcia EuroGeol Rio Tinto Resources Rio Tinto Minerals – Jadar (e)
Titanium dioxide feedstock C Ware SACNASPRio Tinto
ReservesRichards Bay Minerals (f)
J Nel SACNASP Resources
J Dumouchel APEGGA Rio Tinto Resources, ReservesQMM Madagascar Minerals (f), Rio Tinto Fer et
Titane – Havre-Saint-Pierre
Y Bourque OIQ Rio Tinto Resources, Reserves Rio Tinto Fer et Titane – Havre-Saint-Pierre
Uranium G Rogers AusIMM
Rio Tinto
Resources Energy Resources of Australia – Jabiluka
S Pevely AusIMM Resources Energy Resources of Australia – Ranger 3, Jabiluka
J Murphy AusIMM Reserves Energy Resources of Australia – Ranger 3
TG Murasiki SAIMMRio Tinto
Resources Rössing – SJ, Z20
W-D Wieland SAIMM Reserves Rössing – SJ
(a) AusIMM: Australasian Institute of Mining and Metallurgy, AIG: Australasian Institute of Geoscientists, EuroGeol: European Geologist member of the European Federation ofGeologists, IMMM: Institute of Materials, Minerals and Mining, SAIMM: South African Institute of Mining and Metallurgy, SME: Society of Mining, Metallurgy and Exploration, AIPG:American Institute of Professional Geologists, NAPEG: Association of Professional Engineers, Geologists and Geophysicists of the Northwest Territories, PEGNL: ProfessionalEngineers and Geoscientists Newfoundland and Labrador, CIMM: Canadian Institute of Mining and Metallurgy, APEGGA: Association of Professional Engineers, Geologists andGeophysicists of Alberta, OIQ: Ordre des Ingénieurs du Québec, SACNASP: South African Council for Natural Scientific Professions.
(b) Includes gold
(c) Includes molybdenum
(d) Includes silver
(e) Includes borates
(f) Includes zircon
riotinto.com 211
STRATEG
ICREPO
RT
DIRECTO
RS’R
EPORT
FINANCIA
LSTA
TEMEN
TSP
RO
DU
CT
ION
,R
ES
ER
VE
SA
ND
OP
ER
AT
ION
SADDITIO
NALINFO
RMATIO
N
For
per
sona
l use
onl
y

Mines and production facilities
Groupmines as at 31 December 2014(Rio Tinto’s interest 100 per cent unless otherwise shown)
Mine Location Access Title/lease
BAUXITE
CBG Sangaredi (22.95%) Sangaredi, Guinea Road, air and port Mining concession expires in 2040.
Gove Gove, Northern Territory,Australia
Road, air and port All leases were renewed in 2011 for a further period of 42 years. The residue disposal area isleased from the Arnhem Land Aboriginal Land Trust. The Northern Territory government is thelessor of the balance of the leases; however, on expiry of the 42-year renewed term, the landsubject of the balances of the leases will all vest to the Arnhem Land Aboriginal Land Trust.
MRN Porto Trombetas (12%) Porto Trombetas,Para, Brazil
Air or port Mining concession granted under the Brazilian mining code with no expiration date.
Weipa/Ely Weipa, Queensland,Australia
Road, air and port The Queensland Government Comalco (ML7024) lease expires in 2041 with an option of a21-year extension, then two years’ notice of termination; the Ely Alcan Queensland Pty. LimitedAgreement Act 1965 (ML7031) expires in 2048 with a 21-year right of renewal with a two-yearnotice period.
COPPER
Escondida (30%) Atacama Desert, Chile Pipeline and road todeep sea port atColoso; road and rail
Rights conferred by Government under Chilean Mining Code.
Grasberg joint venture
(40% share of productionabove specified levels)
Papua, Indonesia Pipeline, road andport
Indonesian Government Contracts of Work expire in 2021 with option of two ten-yearextensions.
Kennecott Utah Copper
Bingham CanyonNear Salt Lake City,Utah, US
Pipeline, road and rail Owned
Oyu Tolgoi (51% of TurquoiseHill Resources Ltd. which owns66% of Oyu Tolgoi LLC)
Gobi Desert, Mongolia Air and road Three mining licences are held by Oyu Tolgoi LLC and two further licences are held in jointventure with Entrée Gold LLC. The licence term under the Minerals Law of Mongolia is 30 yearswith two 20-year extensions. First renewals are due in 2033 and 2039 for the Oyu Tolgoi andEntrée Gold licences respectively.
DIAMONDS &MINERALS
Diamonds
Argyle Diamonds Kimberley Ranges,Western Australia
Road and air Mining tenement held under Diamond (Argyle Diamond Mines Joint Venture) Agreement Act1981; lease extended for 21 years from 2004 with option to renew.
Diavik (60%) Northwest Territories(NWT), Canada
Air, ice road in winter Mining leases from NWT Government expiring in 2017 and 2018 with options to renew.
Murowa (77.8%) Zvishavane, Zimbabwe Road and air Mining leases under Zimbabwe Mines and Minerals Act; issued in 2001 and valid for 25 years.
Industrial minerals
Dampier Salt (68.4%) Dampier, Lake MacLeodand Port Hedland,Western Australia
Road and port State agreements (mining leases) expiring in 2034 at Dampier, 2018 at Port Hedland and 2021at Lake MacLeod with options to renew at the latter two sites.
Rio Tinto Minerals – Boron California, US Road and rail Owned
Rio Tinto Fer et Titane Lac Tio Havre-Saint-Pierre,Quebec, Canada
Rail and port(St Lawrence River)
Mining covered by two concessions granted by State in 1949 and 1951 which, subject to certainMining Act restrictions, confer rights and obligations of an owner.
212 riotinto.com
For
per
sona
l use
onl
y

History Type of mine Power source
Bauxite mining commenced in 1973. Shareholders are 51% Halco and 49% Government of Guinea. Rio Tinto has held45% of Halco since 2004. Current annual capacity is 14 million tonnes. Rio Tinto has a 45 per cent interest in themine’s production.
Open cut On-site generation (fuel oil)
Bauxite mining commenced in 1970 feeding both the Gove refinery and export market capped at two million tonnes perannum. Bauxite export ceased in 2006 with feed intended for the expanded Gove refinery. Bauxite exports recommencedin 2008 and will increase in the coming years following the curtailment of the refinery production in 2014.
Open cut On-site diesel fired powerstation
Mineral extraction commenced in April 1979. Initial production capacity 3.4 million tonnes annually. From October 2003,production capacity up to 16.3 million tonnes per year on a dry basis. Capital structure currently: Vale (40%), BHPBilliton (14.8%), Rio Tinto (12%), CBA (10%), Alcoa/Abalco (18.2%), and Norsk Hydro (5%).
Open cut On-site generation(heavy oil, diesel)
Bauxite mining commenced in 1961 at Weipa. Major upgrade completed at Weipa in 1998. Rio Tinto interest increasedfrom 72.4% to 100% in 2000. In 1997, Ely Bauxite Mining Project Agreement signed with local Aboriginal land owners.Bauxite Mining and Exchange Agreement signed in 1998 with Comalco to allow for extraction of ore at Ely. The WesternCape Communities Co-Existence Agreement, an Indigenous Land Use Agreement, was signed in 2001. In 2004 a mineexpansion was completed at Weipa that lifted annual capacity to 21.5 million tonnes. Mining commenced on the adjacentEly mining lease in 2006, in accordance with the 1998 agreement with Alcan (first ore extracted at Ely in 2007). A secondshiploader that increases the shipping capability was commissioned in 2006 at Weipa. Annual production capacity hasnow reached 26 million tonnes.
Open cut On-site generation; new powerstation commissioned in 2006
Production started in 1990 and expanded in phases to 2002 when the new concentrator was completed; production fromNorte started in 2005 and the sulphide leach produced the first cathode during 2006.
Open pit Supplied from SING grid undervarious contracts with localgenerating companies
Joint venture interest acquired 1995. Capacity expanded to over 200,000 tonnes of ore per day in 1998. Addition ofunderground production of more than 35,000 tonnes per day in 2003. Expansion to 50,000 tonnes per day in mid-2007and to 80,000 tonnes in 2010.
Open pit andunderground
Long-term contract withUS-Indonesian consortiumoperated purpose-builtcoal-fired generating station
Interest acquired in 1989. In 2012, the pushback of the south wall commenced, extending the mine life from 2018to 2030.
Open pit On-site generationsupplemented by long-termcontracts with Rocky MountainPower
Oyu Tolgoi was first discovered in 1996. Construction began in late 2009 after signing of an Investment Agreement withthe Government of Mongolia, and first concentrate was produced in December 2012. First sales of concentrate weremade to Chinese customers on 9 July 2013.
Open pit andunderground
Grid power from China andsupplementary diesel powergeneration site
Interest increased from 59.7% following purchase of Ashton Mining in 2000. Underground mine project approved in 2005to extend mine life to 2020.
Underground(previously open pit)
Long-term contract with OrdHydro Consortium and on-sitegeneration
Deposits discovered 1994-1995. Construction approved 2000. Diamond production started 2003. Second dike closed offin 2005 for mining of additional orebody. The underground mine started production in 2010, ramping up to fullproduction in 2013.
Underground(previously open pit)
On-site diesel generators;installed capacity 44MW and9.2MW of wind capacity
Discovered in 1997. Small-scale production started in 2004. Open pit Supplied by ZESA with dieselgenerator back-up
Construction of the Dampier field started in 1969; first shipment in 1972. Lake MacLeod was acquired in 1978 as anoperating field. Port Hedland was acquired in 2001 as an operating field.
Solar evaporation ofseawater (Dampier andPort Hedland) andunderground brine (LakeMacLeod); dredging ofgypsum from surface ofLake MacLeod
Dampier supply fromHamersley Iron Pty Ltd;Lake MacLeod fromWestern Power and on-sitegeneration units; Port Hedlandfrom Western Power
Deposit discovered in 1925 and acquired by Rio Tinto in 1967. Open pit On-site co-generation unitsand local power grid
Production started 1950; interest acquired in 1989. Open pit Long-term contract withHydro-Québec
riotinto.com 213
STRATEG
ICREPO
RT
DIRECTO
RS’R
EPORT
FINANCIA
LSTA
TEMEN
TSP
RO
DU
CT
ION
,R
ES
ER
VE
SA
ND
OP
ER
AT
ION
SADDITIO
NALINFO
RMATIO
N
For
per
sona
l use
onl
y

Mines and production facilities continued
214 riotinto.com
Groupmines as at 31 December 2014 continued(Rio Tinto’s interest 100 per cent unless otherwise shown)
Mine Location Access Title/lease
Industrial minerals continued
QIT Madagascar Minerals (80%) Fort-Dauphin, Madagascar Road and port Mining lease granted by central government.
Richards Bay Minerals (74%) Richards Bay, KwaZulu-Natal,South Africa
Rail, road and port Mineral rights for Reserve 4 and Reserve 10 issued by state andconverted to new order mining rights from 9 May 2012. Mining rightsrun until 8 May 2041 for both lease areas.
ENERGY
Energy Resources of Australia
(68.4%)Ranger
Northern Territory, Australia Road, rail and port Mining tenure granted by Federal Government.
Rio Tinto Coal Australia New South Wales andQueensland, Australia
Road, rail, conveyor and port Leases granted by respective state governments.
Bengalla (32%)
Hail Creek (82%)
Hunter Valley Operations (80%)
Kestrel (80%)
Mount Thorley Operations (64%)
Warkworth (44.46%)
Rössing Uranium (68.6%) Erongo Region, Namibia Rail, road and port Mining licence granted by National Government.
Zululand Anthracite Colliery (Pty) Ltd -
(74%)Mahlabatini district,KwaZulu-Natal, South Africa
Road, rail and port Okhukho Reserve no. 14376 over mineral leases 1, 2 and 6 awarded toZAC as a new order mining right no. 46/2007 on 10 April 2007, expirydate 9 April 2027. Protocol number 1461/2010, an extended miningright over the remainder of reserve no. 20, no. 15840 and portions 10,11 and 12 of Reserve 12 no. 15832, awarded 11 November 2010 andvalid through to 10 November 2030.
IRON ORE
Hamersley Iron Hamersley Ranges, WesternAustralia
Railway and port(owned by Hamersley Iron andoperated by Pilbara Iron)
Agreements for life of mine with Government of Western Australia.
Brockman 2
Brockman 4
Marandoo
Mount Tom Price
Nammuldi
Paraburdoo
Western Turner Syncline
Yandicoogina
Channar (60%)
Eastern Range (54%)
Hope Downs 1
(50% mine, 100% infrastructure)Pilbara region,Western Australia
Railway (owned by HamersleyIron and operated by PilbaraIron)
Agreements for life of mine with Government of Western Australia.
Hope Downs 4
(50% mine, 100% infrastructure)Pilbara region,Western Australia
Railway (owned by HamersleyIron and operated by PilbaraIron)
Agreements for life of mine with Government of Western Australia
Iron Ore Company of Canada (IOC)(58.7%)
Labrador City, Province ofLabrador and Newfoundland
Railway and port facilities inSept-Îles, Quebec (owned andoperated by IOC)
Sublease with the Labrador Iron Ore Royalty Corporation which haslease agreements with the Government of Newfoundland and Labradorthat are due to be renewed in 2020 and 2022.
Robe River Iron Associates
(53%)Pilbara region,Western Australia
Railway and port(owned by Robe River andoperated by Pilbara Iron)
Agreements for life of mine with Government of Western Australia.
Mesa J
Mesa AWest Angelas
For
per
sona
l use
onl
y

History Type of mine Power source
Exploration project started in 1986; construction approved 2005. Ilmenite and zirsil production started at the end of2008. QMM intends to extract ilmenite and zirsil from heavy mineral sands over an area of about 6,000 hectaresalong the coast over the next 40 years.
Mineral sand dredging On-site heavy fuel oil generators
Production started 1977; initial interest acquired 1989. Fifth mining plant commissioned in 2000. One mining plantdecommissioned in 2008. In September 2012, Rio Tinto doubled its holding in Richards Bay Minerals to 74 per centfollowing the acquisition of BHP Billiton’s entire interests.
Dune sand dredging Contract with ESKOM
Mining commenced 1981. Interest acquired through acquisition of North 2000. Open pit mining endedDecember 2012.
Stockpile On-site diesel/steampower generation
Kestrel Mine in Queensland, Rio Tinto Coal Australia’s sole underground mine, was acquired and recommissioned in1999, and Hail Creek Mine in Queensland was officially opened in 2003. Blair Athol Mine ceased operations in 2012and a conditional sale and purchase agreement for the mine was signed in October 2013.Rio Tinto completed the privatisation of Coal & Allied during 2011, wich is now owned 80/20 with MitsubishiDevelopment, and which Rio Tinto continues to manage.
Open cut and underground State-owned grid
Production began in 1976. Open pit Supplied by NamPower viagrid network
Operations commenced at Zululand Anthracite Colliery (Pty) Ltd on 13 August 1984. Rio Tinto took ownership of themine as from 8 April 2011. Zululand Anthracite Colliery became a Rio Tinto fully managed company as from1 April 2014.
Underground anthracitemine, with five active shafts
Eskom grid, with diesel generatorback-up
Mount Tom Price began operations in 1966, followed by Paraburdoo in 1974. In the 1990s, Channar, Brockman 2,Marandoo and Yandicoogina achieved first ore. Annual capacity increased to 68 million tonnes during the 1990s andhas more than doubled in the past 25 years. Since 2000, Eastern Ranges, Nammuldi, Brockman 4 and WesternTurner Syncline have joined the network of Hamersley Iron mines. The brownfield mine expansion at such sites asParaburdoo, Brockman 2, Nammuldi and Yandicoogina will enable production to meet expanded port and railcapacity in the coming years.
Open pit Supplied through the integratedHamersley and Robe powernetwork operated by Pilbara Iron
Joint venture between Rio Tinto and Hancock Prospecting. Construction of Stage 1 to 22 million tonnes per annumcommenced April 2006 and first production occurred November 2007. Stage 2 to 30 million tonnes per annumcompleted 2009.
Open pit Supplied through the integratedHamersley and Robe powernetwork operated by Pilbara Iron
Joint venture between Rio Tinto and Hancock Prospecting. Construction of wet plant processing to 15 million tonnesper annum commenced April 2011 and first production occurred April 2013.
Open pit Supplied through the integratedHamersley and Robe powernetwork operated by Pilbara Iron
Interest acquired in 2000 through North. Current operation began in 1962 and has processed over one billion tonnesof crude ore since. Annual capacity 23.3 million tonnes of concentrate of which 12.5 million tonnes can bepelletised.
Open pit Supplied by Newfoundland Hydro
First shipment in 1972 from Robe Valley. Interest acquired in 2000 through North. First ore was shipped from WestAngelas in 2002. In 2014, total production of the Robe River Iron Associates joint venture was 64 million tonnes.
Open pit Supplied through the integratedHamersley and Robe powernetwork operated by Pilbara Iron
riotinto.com 215
STRATEG
ICREPO
RT
DIRECTO
RS’R
EPORT
FINANCIA
LSTA
TEMEN
TSP
RO
DU
CT
ION
,R
ES
ER
VE
SA
ND
OP
ER
AT
ION
SADDITIO
NALINFO
RMATIO
N
For
per
sona
l use
onl
y

Mines and production facilities continued
Group smelters and refineries(Rio Tinto’s interest 100 per cent unless otherwise shown)
Smelter/refinery Location Title/lease Plant type/product
Capacity as of31 December 2014(based on 100%ownership)
ALUMINIUM
Alma Alma, Quebec, Canada 100% freehold Aluminium smelter producing aluminium rod,t-foundry, molten metal, high purity, remelt
455,000 tonnesper year aluminium
Alouette (40%) Sept-Îles, Quebec, Canada 100% freehold Aluminium smelter producing aluminium highpurity, remelt
595,000 tonnesper year aluminium
Arvida Saguenay, Quebec, Canada 100% freehold Aluminium smelter producing aluminium billet,molten metal, remelt
176,000 tonnesper year aluminium
Arvida AP60 Saguenay, Quebec, Canada 100% freehold Aluminium smelter producing aluminium highpurity, remelt
60,000 tonnesper year aluminium
Bécancour (25.1%) Bécancour, Quebec, Canada 100% freehold Aluminium smelter producing aluminium slab,billet, t-foundry, remelt, molten metal
446,000 tonnesper year aluminium
Bell Bay Bell Bay, NorthernTasmania, Australia
100% freehold Aluminium smelter producing aluminium slab,molten metal, small form and t-foundry, remelt
192,000 tonnesper year aluminium
Boyne Smelters (59.4%) Boyne Island, Queensland,Australia
100% freehold Aluminium smelter producing aluminium billet,EC grade, small form and t-foundry, remelt
571,000 tonnesper year aluminium
Dunkerque Dunkerque, France 100% freehold Aluminium smelter producing aluminium slab,small form foundry, remelt
270,000 tonnesper year aluminium
Grande-Baie Saguenay, Quebec, Canada 100% freehold Aluminium smelter producing aluminium slab,molten metal, high purity, remelt
225,000 tonnesper year aluminium
ISAL Reykjavik, Iceland 100% freehold Aluminium smelter producing aluminium slab,remelt, billet
205,000 tonnesper year aluminium
Jonquière (Vaudreuil) Jonquière, Quebec, Canada 100% freehold Refinery producing specialty alumina andsmelter grade alumina
1,555,000 tonnesper year alumina
Kitimat (a) Kitimat, British Columbia,Canada
100% freehold Aluminium smelter producing aluminium, slab,remelt
127,000 tonnesper year aluminium
Laterrière Saguenay, Quebec, Canada 100% freehold Aluminium smelter producing aluminium slab,remelt, molten metal
244,000 tonnesper year aluminium
Lochaber Fort William, Scotland, UK 100% freehold Aluminium smelter producing aluminiumslab, remelt
47,000 tonnesper year aluminium
Queensland Alumina (80%) Gladstone, Queensland,Australia
73.3% freehold; 26.7% leasehold (of whichmore than 80% expires in 2026 and after)
Refinery producing alumina 3,950,000 tonnesper year alumina
São Luis (Alumar) (10%) São Luis, Maranhão, Brazil 100% freehold Refinery producing alumina 3,639,000 tonnesper year alumina
Sohar (20%) Sohar, Oman 100% leasehold (expiring 2039) Aluminium smelter producing aluminium, highpurity, remelt
372,000 tonnesper year aluminium
Tiwai Point (New Zealand
Aluminium Smelters)
(79.4%)
Invercargill, Southland,New Zealand
19.6% freehold; 80.4% leasehold (expiringin 2029 and use of certain Crown land)
Aluminium smelter producing aluminium billet,slab, small form foundry, high purity, remelt
365,000 tonnesper year aluminium
Tomago (51.6%) Tomago, New South Wales,Australia
100% freehold Aluminium smelter producing aluminium billet,slab, remelt
561,000 tonnesper year aluminium
Yarwun Gladstone, Queensland,Australia
97% freehold. 3% leasehold(expiring 2101 and after)
Refinery producing alumina 3,400,000 tonnesper year alumina
216 riotinto.com
For
per
sona
l use
onl
y

Smelter/refinery Location Title/lease Plant type/product
Capacity as of31 December 2014(based on 100%ownership)
Other Aluminium
Gove Gove, NorthernTerritory, Australia
100% leasehold. All leases were renewed in2011 for a further period of 42 years. Theresidue disposal area is leased from theArnhem Land Aboriginal Land Trust. TheNorthern Territory government is the lessorof the balance of the leases; however, onexpiry of the 42-year renewed term, the landsubject of the balances of the leases will allvest to the Arnhem Land AboriginalLand Trust.
Refinery producing alumina 2,650,000 tonnesper year alumina.The Group curtailedproduction at Goveas of May 2014
COPPER
Kennecott Utah Copper Magna, Salt Lake City,Utah, US
100% freehold Flash smelting furnace/Flash convertor furnacecopper refinery
335,000 tonnes peryear refined copper
DIAMONDS &MINERALS
Boron California, US 100% freehold Borates refinery 576,000 tonnes peryear boric oxide
Rio Tinto Fer et Titane
Sorel Plant
Sorel-Tracy, Quebec,Canada
100% freehold Ilmenite smelter 1,300,000 tonnesper year titaniumdioxide slag,1,000,000 tonnesper year iron
Richards Bay Minerals
(74%)Richards Bay,South Africa
100% freehold Ilmenite smelter 1,050,000 tonnesper year titaniumdioxide slag,565,000 tonnes peryear iron
IRON ORE
IOC Pellet Plant
(58.7%)Labrador City,Newfoundland andLabrador, Canada
100% leaseholds (expiring in 2020, 2022and 2025 with rights of renewal for furtherterms of 30 years)
Pellet induration furnaces producing multipleiron ore pellet types
12.5 million tonnesper year pellet
Notes:
(a) Capacity as at 31 December 2014 reflects the closures of four potlines in preparation for the Kitimat modernisation project. The nameplate capacity of the Kitimat smelter remainsat 282,000 tonnes per year.
riotinto.com 217
STRATEG
ICREPO
RT
DIRECTO
RS’R
EPORT
FINANCIA
LSTA
TEMEN
TSP
RO
DU
CT
ION
,R
ES
ER
VE
SA
ND
OP
ER
AT
ION
SADDITIO
NALINFO
RMATIO
N
For
per
sona
l use
onl
y
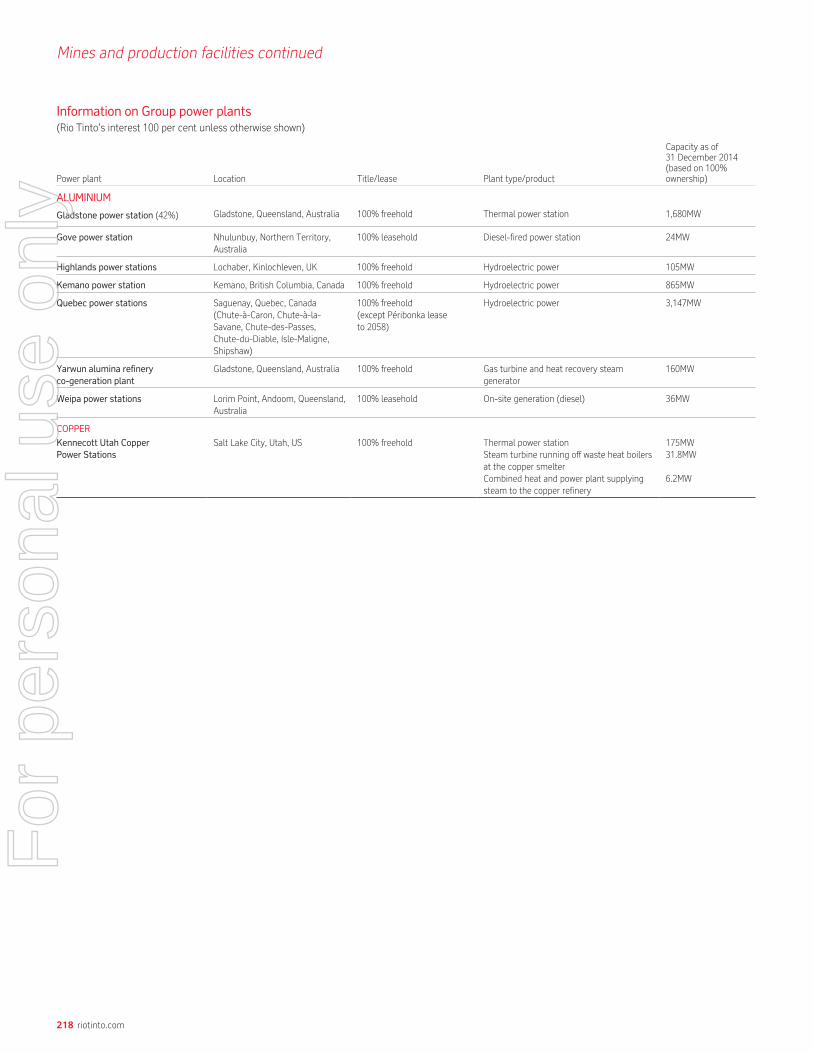
Mines and production facilities continued
Information on Group power plants(Rio Tinto’s interest 100 per cent unless otherwise shown)
Power plant Location Title/lease Plant type/product
Capacity as of31 December 2014(based on 100%ownership)
ALUMINIUM
Gladstone power station (42%) Gladstone, Queensland, Australia 100% freehold Thermal power station 1,680MW
Gove power station Nhulunbuy, Northern Territory,Australia
100% leasehold Diesel-fired power station 24MW
Highlands power stations Lochaber, Kinlochleven, UK 100% freehold Hydroelectric power 105MW
Kemano power station Kemano, British Columbia, Canada 100% freehold Hydroelectric power 865MW
Quebec power stations Saguenay, Quebec, Canada(Chute-à-Caron, Chute-à-la-Savane, Chute-des-Passes,Chute-du-Diable, Isle-Maligne,Shipshaw)
100% freehold(except Péribonka leaseto 2058)
Hydroelectric power 3,147MW
Yarwun alumina refinery
co-generation plant
Gladstone, Queensland, Australia 100% freehold Gas turbine and heat recovery steamgenerator
160MW
Weipa power stations Lorim Point, Andoom, Queensland,Australia
100% leasehold On-site generation (diesel) 36MW
COPPER
Kennecott Utah Copper
Power Stations
Salt Lake City, Utah, US 100% freehold Thermal power station 175MWSteam turbine running off waste heat boilersat the copper smelter
31.8MW
Combined heat and power plant supplyingsteam to the copper refinery
6.2MW
218 riotinto.com
For
per
sona
l use
onl
y
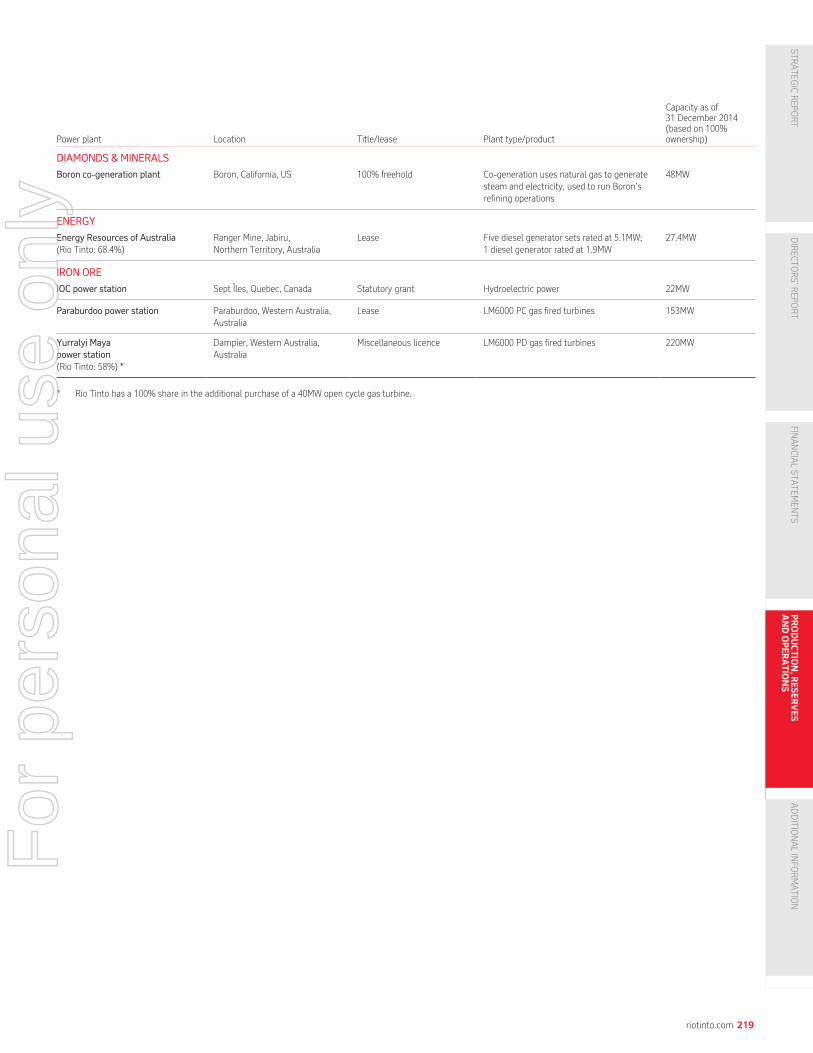
Power plant Location Title/lease Plant type/product
Capacity as of31 December 2014(based on 100%ownership)
DIAMONDS &MINERALS
Boron co-generation plant Boron, California, US 100% freehold Co-generation uses natural gas to generatesteam and electricity, used to run Boron’srefining operations
48MW
ENERGY
Energy Resources of Australia
(Rio Tinto: 68.4%)Ranger Mine, Jabiru,Northern Territory, Australia
Lease Five diesel generator sets rated at 5.1MW;1 diesel generator rated at 1.9MW
27.4MW
IRON ORE
IOC power station Sept Îles, Quebec, Canada Statutory grant Hydroelectric power 22MW
Paraburdoo power station Paraburdoo, Western Australia,Australia
Lease LM6000 PC gas fired turbines 153MW
Yurralyi Maya
power station
(Rio Tinto: 58%) *
Dampier, Western Australia,Australia
Miscellaneous licence LM6000 PD gas fired turbines 220MW
* Rio Tinto has a 100% share in the additional purchase of a 40MW open cycle gas turbine.
riotinto.com 219
STRATEG
ICREPO
RT
DIRECTO
RS’R
EPORT
FINANCIA
LSTA
TEMEN
TSP
RO
DU
CT
ION
,R
ES
ER
VE
SA
ND
OP
ER
AT
ION
SADDITIO
NALINFO
RMATIO
N
For
per
sona
l use
onl
y

Shareholder information
Organisational structureThe Rio Tinto Group consists of Rio Tinto plc, which is registered in Englandand Wales under company number 719885, and is listed on the London StockExchange, and Rio Tinto Limited, which is registered in Australia underABN 96 004 458 404, and is listed on the Australian Securities Exchange.Rio Tinto is headquartered in London and has executive offices in Melbourne.
Rio Tinto plc has a sponsored ADR facility and the underlying shares areregistered with the US Securities and Exchange Commission and are listed onthe New York Stock Exchange.
Nomenclature and financial dataRio Tinto plc and Rio Tinto Limited operate together and are referred to in thisreport as Rio Tinto, the Rio Tinto Group or, more simply, the Group. Thesecollective expressions are used for convenience only, since both Companies,and the individual companies in which they directly or indirectly owninvestments, are separate and distinct legal entities. “Limited”, “plc”, “Pty”,“Inc.”, “Limitada”, “L.L.C.”, “A.S.” or “SA” have generally been omitted fromGroup company names, except to distinguish between Rio Tinto plc andRio Tinto Limited. Financial data in US dollars (US$) is derived from, andshould be read in conjunction with, the 2014 financial statements. In general,financial data in pounds sterling (£) and Australian dollars (A$) have beentranslated from the consolidated financial statements and have been providedsolely for convenience; exceptions arise where data can be extracted directlyfrom source records. Certain key information has been provided in all threecurrencies in the 2014 financial statements.
HistoryRio Tinto plc was incorporated on 30 March 1962 (then called The Rio Tinto-Zinc Corporation Limited (RTZ)) and was formed by the merger of TheRio Tinto Company and The Consolidated Zinc Corporation. The Rio TintoCompany was incorporated in 1873 to reopen ancient copper workings inSpain. The Consolidated Zinc Corporation’s origins trace back to the Australianmining industry in the early twentieth century. Operating out of Broken Hill inNew South Wales, it came to prominence with the mining of silver, lead andzinc deposits and later expanded into lead and zinc smelting.
Rio Tinto Limited was incorporated on 17 December 1959 (then called TheRio Tinto Mining Company of Australia Limited) and in 1962 the Australianinterests of Consolidated Zinc Corporation and the Rio Tinto Company Limitedof the United Kingdom were merged to form Conzinc Riotinto of AustraliaLimited as a limited liability company under the laws of the State of Victoria,Australia. In 1980, Conzinc Riotinto of Australia Limited changed its name toCRA Limited.
Between 1962 and 1995, both RTZ and CRA discovered important mineraldeposits, developed major mining projects and also grew through acquisition.
RTZ and CRA began operating in 1995 through a dual listed companiesstructure. In 1997, the RTZ Corporation became Rio Tinto plc and CRA Limitedbecame Rio Tinto Limited, together known as the Rio Tinto Group.
In 2007, Rio Tinto completed an agreed takeover of the Canadian aluminiumproducer Alcan Inc.
Dual listed companies structureIn 1995, Rio Tinto shareholders approved the terms of the dual listedcompanies merger (the DLC structure) which was designed to place theshareholders of both Companies in substantially the same position as if theyheld shares in a single entity owning all of the assets of both Companies.
Following the approval of the DLC structure, both Companies entered into aDLC Merger Sharing Agreement (the Sharing Agreement) through which eachCompany agreed to ensure that the businesses of Rio Tinto plc and Rio TintoLimited are managed on a unified basis, to ensure that the boards of directorsof each Company are the same, and to give effect to certain arrangementsdesigned to provide shareholders of each Company with a common economicinterest in the DLC structure.
In order to achieve this third objective, the Sharing Agreement provided for theratio of dividend, voting and capital distribution rights attached to eachRio Tinto plc share and to each Rio Tinto Limited share to be fixed in anEqualisation Ratio which has remained unchanged at 1:1. The SharingAgreement has provided for this ratio to be revised in special circumstanceswhere, for example, certain modifications are made to the share capital of oneCompany, such as rights issues, bonus issues, share splits and shareconsolidations, but not to the share capital of the other. Outside thesespecified circumstances, the Equalisation Ratio can only be altered with theapproval of shareholders under the Class Rights Action approval proceduredescribed under Voting rights below. In addition, any adjustments are requiredto be confirmed by the Group’s external auditors.
Consistent with the creation of the DLC structure, directors of each Companyseek to act in the best interests of Rio Tinto as a whole. The Class RightsAction approval procedure is intended to deal with instances where there maybe a conflict of interest between the shareholders of each Company.
To ensure that the boards of both Companies are identical, resolutions toappoint or remove directors must be put to shareholders of both Companiesas a joint electorate (as Joint Decisions as described under Voting rights). It isa requirement of the constitution of each Company that a person can only be adirector of one Company if that person is also a director of the other Company.So, for example, if a person was removed as a director of Rio Tinto plc, he orshe would also cease to be a director of Rio Tinto Limited.
One consequence of the DLC merger is that Rio Tinto is subject to a widerange of laws, rules and regulatory review across multiple jurisdictions. Wherethese rules differ, Rio Tinto, as a Group, aims to comply with the strictestapplicable level.
Dividend rightsThe Sharing Agreement provides for dividends paid on Rio Tinto plc andRio Tinto Limited shares to be equalised on a net cash basis, that is withouttaking into account any associated tax credits. Dividends are determined inUS dollars and are then, except for ADR holders, translated and paid in sterlingand Australian dollars. The Companies are also required to announce and paytheir dividends and other distributions as close in time to each otheras possible.
In the unlikely event that one Company did not have sufficient distributablereserves to pay the equalised dividend or the equalised capital distribution, itwould be entitled to receive a top-up payment from the other Company. Thetop-up payment could be made as a dividend on the DLC Dividend Share, orby way of a contractual payment.
If the payment of an equalised dividend would contravene the law applicableto one of the Companies, then they may depart from the Equalisation Ratio.However, should such a departure occur, then the relevant Company will putaside reserves to be held for payment on the relevant shares at a later date.
Rio Tinto shareholders have no direct rights to enforce the dividendequalisation provisions of the Sharing Agreement.
The DLC Dividend Shares can also be utilised to provide the Group withflexibility for internal funds management by allowing dividends to be paidbetween the two parts of the Group. Such dividend payments are of noeconomic significance to the shareholders of either Company, as they willhave no effect on the Group’s overall resources.
Voting rightsIn principle, the Sharing Agreement provides for the shareholders of Rio Tintoplc and Rio Tinto Limited to vote as a joint electorate on all matters whichaffect shareholders of both Companies in similar ways. These are referred toas Joint Decisions. Such Joint Decisions include the creation of new classes ofshare capital, the appointment or removal of directors and auditors and thereceiving of the annual financial statements. All shareholder resolutionsincluding Joint Decisions are voted on a poll.
220 riotinto.com
For
per
sona
l use
onl
y
The Sharing Agreement also provides for the protection of shareholders ofeach Company by requiring their separate approval for decisions that do notaffect the shareholders of both Companies equally. Matters requiring thisapproval procedure are referred to as Class Rights Actions and are voted on apoll. For example, fundamental elements of the DLC merger cannot bechanged unless approved separately by shareholders of both Companiesunder the Class Rights Action approval procedure.
Exceptions to these principles can arise in situations such as where legislationrequires the separate approval of a decision by the appropriate majority ofshareholders in one Company, and approval of the matter by shareholders ofthe other Company is not required.
Where a matter has been expressly categorised as either a Joint Decision or aClass Rights Action, the directors do not have the power to change thatcategorisation. If a matter falls within both categories, it is treated as a ClassRights Action. In addition, the directors can determine that matters notexpressly listed in either category should be put to shareholders for theirapproval under either procedure.
To facilitate the joint voting arrangements, each Company has entered intoshareholder voting agreements. Each Company has issued a Special VotingShare to a special purpose company held in trust by a common Trustee.
Rio Tinto plc has issued its Special Voting Share (RTP Special Voting Share) toRTL Shareholder SVC and Rio Tinto Limited has issued its Special Voting Share(RTL Special Voting Share) to RTP Shareholder SVC. The total number of votescast on Joint Decisions by the shareholders of one Company are voted at theparallel meeting of the other Company. The role of these special purposecompanies in achieving this is described below.
In exceptional circumstances, certain shareholders of the Companies can beexcluded from voting at the respective Company’s general meetings becausethey have acquired shares in one Company in excess of a given thresholdwithout making an offer for all the shares in the other Company. If this shouldoccur, the votes cast by these excluded shareholders will be disregarded.
Following the Companies’ general meetings the overall results of the votingare announced to the stock exchanges, to the media in the UK and Australia,and published on the Rio Tinto website.
At a Rio Tinto plc shareholders’ meeting at which a Joint Decision isconsidered, each Rio Tinto plc share carries one vote and the holder of itsSpecial Voting Share has one vote for each vote cast by the publicshareholders of Rio Tinto Limited. The holder of the Special Voting Share isrequired to vote strictly, and only, in accordance with the votes cast by publicshareholders for and against the equivalent resolution at the parallel Rio TintoLimited shareholders’ meeting.
The holders of Rio Tinto Limited ordinary shares do not actually hold anyvoting shares in Rio Tinto plc by virtue of their holding in Rio Tinto Limited andcannot enforce the voting arrangements relating to the Special Voting Share.
At a Rio Tinto Limited shareholders’ meeting at which a Joint Decision isconsidered, each Rio Tinto Limited share carries one vote and the holder of itsSpecial Voting Share will have one vote for each vote cast by the publicshareholders of Rio Tinto plc in their parallel meeting. The holder of theSpecial Voting Share is required to vote strictly, and only, in accordance withthe votes cast for and against the equivalent resolution at the parallelRio Tinto plc shareholders’ meeting.
The holders of Rio Tinto plc ordinary shares do not actually hold any votingshares in Rio Tinto Limited by virtue of their holding in Rio Tinto plc andcannot enforce the voting arrangements relating to the Special Voting Share.
Capital distribution rightsIf either of the Companies goes into liquidation, the Sharing Agreementprovides for a valuation to be made of the surplus assets of both Companies. Ifthe surplus assets available for distribution by one Company on each of theshares held by its shareholders exceed the surplus assets available fordistribution by the other Company on each of the shares held by itsshareholders, then an equalising payment between the two Companies shallbe made, to the extent permitted by applicable law, such that the amountavailable for distribution on each share held by shareholders of each Companyconforms to the Equalisation Ratio. The objective is to ensure that theshareholders of both Companies have equivalent rights to the assets of thecombined Group on a per share basis, taking account of the Equalisation Ratio.
The Sharing Agreement does not grant any enforceable rights to theshareholders of either Company upon liquidation of a Company.
Limitations on ownership of shares and merger obligationsThe laws and regulations of the UK and Australia impose restrictions andobligations on persons who control interests in publicly listed companies inexcess of defined thresholds that, under certain circumstances, includeobligations to make a public offer for all of the outstanding issued shares ofthe relevant company. The threshold applicable to Rio Tinto plc under UK lawand regulations is 30 per cent and to Rio Tinto Limited under Australian lawand regulations is 20 per cent (on a standalone basis or, taking into accountonly Rio Tinto plc interests, on a Joint Decision basis).
As part of the DLC merger, the Articles of Association of Rio Tinto plc and theConstitution of Rio Tinto Limited were amended with the intention ofextending these laws and regulations to the combined enterprise and, inparticular, to ensure that a person cannot exercise control over one Companywithout having made offers to the public shareholders of both Companies. It isconsistent with the creation of the single economic enterprise, and the equaltreatment of the two sets of shareholders, that these laws and regulationsshould operate in this way. The Articles of Association of Rio Tinto plc and theConstitution of Rio Tinto Limited impose restrictions on any person whocontrols, directly or indirectly, 20 per cent or more of the votes on a JointDecision. If, however, such a person only has an interest in either Rio TintoLimited or Rio Tinto plc, then the restrictions will only apply if they control,directly or indirectly, 30 per cent or more of the votes at that Company’sgeneral meetings.
If one of the thresholds specified above is breached then, subject to certainlimited exceptions and notification by the relevant Company, such personsmay not attend or vote at general meetings of the relevant Company, may notreceive dividends or other distributions from the relevant Company, and maybe divested of their interest by the directors of the relevant Company. Theserestrictions continue to apply until such persons have either made a publicoffer for all of the publicly held shares of the other Company, or have reducedtheir controlling interest below the thresholds specified, or have acquiredthrough a permitted means at least 50 per cent of the publicly held shares ofeach Company.
These provisions are designed to ensure that offers for the publicly heldshares of both Companies would be required in order to avoid the restrictionsset out above, even if the interests which breach the thresholds are only heldin one of the Companies. The directors do not have the discretion to exempt aperson from the operation of these rules.
Under the Sharing Agreement, the Companies agree to co-operate toenforce the above restrictions contained in their Articles of Associationand Constitution.
riotinto.com 221
STRATEG
ICREPO
RT
DIRECTO
RS’R
EPORT
FINANCIA
LSTA
TEMEN
TSPR
ODUCTIO
N,R
ESERVES
ANDOPER
ATIO
NS
AD
DIT
ION
AL
INF
OR
MA
TIO
N
For
per
sona
l use
onl
y

Shareholder information continued
GuaranteesIn 1995, each Company entered into a Deed Poll Guarantee in favour ofcreditors of the other Company. Pursuant to the Deed Poll Guarantees, eachCompany guaranteed the contractual obligations of the other Company andthe obligations of other persons which are guaranteed by the other Company,subject to certain limited exceptions. Beneficiaries under the Deed PollGuarantees may make demands upon the guarantor thereunder without firsthaving recourse to the Company or persons whose obligations are beingguaranteed. The obligations of the guarantor under each Deed Poll Guaranteeexpire upon termination of the Sharing Agreement and under other limitedcircumstances, but only in respect of obligations arising after such terminationand, in the case of other limited circumstances, the publication and expiry ofdue notice. The shareholders of the Companies cannot enforce the provisionsof the Deed Poll Guarantees.
MarketsRio Tinto plcThe principal market for Rio Tinto plc shares is the London Stock Exchangewith the shares trading through the Stock Exchange Electronic Trading Service(SETS) system.
Rio Tinto plc American depositary receipts are listed on the New York StockExchange. Further details relating to Rio Tinto plc American depositaryreceipts are available in Rio Tinto’s Annual report on Form 20-F.
Rio Tinto LimitedRio Tinto Limited shares are listed on the Australian Securities Exchange(ASX). The ASX is the principal trading market for Rio Tinto Limited shares.The ASX is a national stock exchange with an automated trading system.
Share ownershipSubstantial shareholdersUnder the UK Disclosure and Transparency Rules and the AustralianCorporations Act, any shareholder of Rio Tinto plc with voting rights of threeper cent or more, or any person with voting power of five per cent or more inRio Tinto Limited, is required to provide the relevant companies with notice.
The shareholders who have provided such, or an equivalent, notice as of16 February 2015 are:
Rio Tinto plc Date of notice Number of shares
Percentage ofissued share
capital
AXA S.A. 29 Jan 2008 48,493,873 4.86
BlackRock Inc. 4 Dec 2009 127,744,871 8.38
Shining ProspectPte. Ltd 13 Mar 2012 182,550,329 12.7
The Capital GroupCompanies, Inc. 21 Jan 2014 57,950,440 4.10
The Capital GroupCompanies, Inc. 3 April 2014 55,307,243 3.91
Rio Tinto Limited
Shining ProspectPte. Ltd (a) 10 June 2009 – –
(a) In its substantial holding notice filed on 10 June 2009 Shining Prospect Pte. Ltd,a Singapore-based entity owned by Chinalco (Aluminium Corporation ofChina) disclosed a holding in Rio Tinto plc shares which, at that time, through theoperation of the Australian Corporations Act as modified, gave these entities andtheir associates voting power of 9.3 per cent in the Rio Tinto Group on a JointDecision matter, making them substantial shareholders of Rio Tinto Limited, as wellas of Rio Tinto plc. Shining Prospect Pte. Ltd currently holds 182,550,329 Rio Tintoplc shares, which gives these entities and their associates voting power of9.9 per cent in the Rio Tinto Group on a Joint Decision Matter.
As far as is known, Rio Tinto plc and Rio Tinto Limited are not directly orindirectly owned or controlled by another corporation or by any government ornatural person. Rio Tinto is not aware of any arrangement which may result ina change in control. No shareholder possesses voting rights that differ fromthose attaching to Rio Tinto plc’s and Rio Tinto Limited’s securities.
As of 16 February 2015, the total amount of the Group’s voting securitiesowned by the directors in Rio Tinto plc was 101,487 ordinary shares of10p each or ADRs and in Rio Tinto Limited was 196,163 ordinary shares, inaggregate representing less than one per cent of the Group’s total number ofshares in issue.
222 riotinto.com
For
per
sona
l use
onl
y

Analysis of ordinary shareholders
Rio Tinto plc Rio Tinto Limited
As at 16 February 2014No. of
accounts % Shares %No. of
accounts % Shares %
1 to 1,000 shares 33,798 76.33 10,868,329 0.76 167,764 83.87 49,999,117 11.47
1,001 to 5,000 shares 8,176 18.47 16,231,425 1.14 28,905 14.45 57,684,606 13.24
5,001 to 10,000 shares 751 1.70 5,194,677 0.36 2,262 1.13 15,682,973 3.60
10,001 to 25,000 shares 415 0.94 6,415,051 0.45 845 0.42 12,473,215 2.86
25,001 to 125,000 shares 534 1.21 31,031,572 2.18 192 0.10 8,631,735 1.98
125,001 to 250,000 shares 188 0.42 33,567,144 2.36 18 0.01 3,131,953 0.72
250,001 to 1,250,000 shares 273 0.62 160,494,512 11.26 32 0.02 17,456,643 4.01
1,250,001 to 2,500,000 shares 66 0.15 115,502,545 8.10 3 0.00 5,979,698 1.37
2,500,001 shares and over (a) 73 0.16 1,046,072,386(b) 73.39 11 0.01 264,718,780 60.75
1,425,377,641(c) 100.00 435,758,720(d) 100.00
Number of holdings less thanmarketable parcel of A$500 3,740
(a) Excludes shares held in Treasury
(b) This includes 117,166,113 shares held in the name of a nominee on the share register. The shares are listed on the NYSE in the form of American Depositary Receipts (ADRs).
(c) The total issued share capital is made up of 1,414,463,210 publicly held shares; 10,914,431 shares held in Treasury.
(d) Publicly held shares in Rio Tinto Limited.
Twenty largest registered shareholdersIn accordance with the ASX Listing Rules, below are the names of the 20 largest registered holders of Rio Tinto Limited shares and the number of shares and thepercentage of issued capital each holds as at 16 February 2015:
Rio Tinto LimitedNumber of
shares
Percentage ofissued share
capital
HSBC Custody Nominees (Australia) Limited 86,885,437 19.94
J.P. Morgan Nominees Australia Limited 73,026,709 16.76
National Nominees Limited 48,223,245 11.07
Citicorp Nominees Pty Limited 25,280,388 5.80
BNP Paribas Noms Pty Ltd (DRP) 11,123,931 2.55
Citicorp Nominees Pty Limited (Colonial First State Inv A/C) 5,377,081 1.23
Australian Foundation Investment Company Limited 3,651,753 0.84
HSBC Custody Nominees (Australia) Limited (NT – Comnwlth Super Corp A/C) 3,259,363 0.75
AMP Life Limited 2,704,072 0.62
UBS Wealth Management Australia Nominees Pty Ltd 2,676,062 0.61
Argo Investments Limited 2,510,739 0.58
UBS Nominees Pty Ltd 2,052,514 0.47
BNP Paribas Nominees Pty Ltd (Agency Lending DRP A/C) 1,993,697 0.46
RBC Investor Services Australia Nominees Pty Limited (PI Pooled A/C) 1,933,487 0.44
National Nominees Limited (DB A/C) 1,132,958 0.26
Computershare Trustee Jey Limited (RE 3000091 A/C) 1,074,855 0.25
Warbont Nominees Pty Limited (Accumulation Entrepot A/C) 1,059,570 0.24
Australian United Investment Company Limited 950,000 0.22
Computershare Trustee Jey Limited (RE 3000086 A/C) 910,949 0.21
Navigator Australia Ltd (MLC Investment Sett A/C) 908,710 0.21
Large registered shareholders are nominees who hold securities on behalf of beneficial shareholders.
riotinto.com 223
STRATEG
ICREPO
RT
DIRECTO
RS’R
EPORT
FINANCIA
LSTA
TEMEN
TSPR
ODUCTIO
N,R
ESERVES
ANDOPER
ATIO
NS
AD
DIT
ION
AL
INF
OR
MA
TIO
N
For
per
sona
l use
onl
y
Shareholder information continued
DividendsBoth Companies have paid dividends on their ordinary shares every year sinceincorporation in 1962. The rights of Rio Tinto shareholders to receive dividendsare explained under the description of the Dual listed companies structure onpage 220.
Dividend policy
The aim of our progressive dividend policy is to maintain or increase the USdollar value of ordinary dividends per share. The rate of the total dividend, inUS dollars per share, is determined taking into account the results for the pastyear and the outlook. The interim dividend is set at one half of the totaldividend for the previous year.
Dividend determination
The majority of our sales are transacted in US dollars, making this the mostappropriate measure for our global business performance. It is our mainreporting currency and consequently the natural currency for dividenddetermination. Dividends determined in US dollars are translated at exchangerates prevailing two days prior to the declaration and payable in sterling byRio Tinto plc and in Australian dollars by Rio Tinto Limited.
On request, shareholders of Rio Tinto plc can elect to receive dividends inAustralian dollars and Rio Tinto Limited shareholders can elect to receivedividends in sterling. If such an election is made, the dividend amountsreceived will be calculated by converting the declared dividend using theexchange rates applicable to sterling and Australian dollars five days prior tothe dividend payment date.
Shareholders who wish to receive their dividends in any other currenciesshould contact the Companies’ share registrars, who also offer paymentservices in other currencies, subject to a fee.
2014 dividends
The 2014 interim and final dividends were determined at 96 US cents andat 119 US cents per share respectively and the applicable conversion rates forthe interim and final dividend were US$1.6871 and US$1.52595 to the poundsterling and US$0.93125 and US$0.77790 to the Australian dollar respectively.For those Rio Tinto plc shareholders who elected to receive their interimdividend in Australian dollars the applicable conversion rate was A$1.74955and for Rio Tinto Limited shareholders who elected to receive their dividend insterling the applicable conversion rate was £0.57158.
Final dividends of 77.98 pence or 152.98 Australian cents per share will bepaid on 9 April 2015. For those Rio Tinto plc shareholders requesting the 2014final dividend be paid in Australian dollars, those holders of Rio Tinto plc ADRs(each representing one share) and those Rio Tinto Limited shareholdersrequesting the 2014 final dividend be paid in pounds sterling, the applicableconversion rates will be announced on 31 March 2015.
Dividend reinvestment plan (DRP)
Rio Tinto offers a DRP to registered shareholders, which provides theopportunity to use cash dividends to purchase Rio Tinto shares in the market.Due to local legislation the DRP cannot be extended to shareholders in the US,Canada and certain other countries.
Material contractsArticles of Association and Constitution, and DLC MergerSharing Agreement
As explained on pages 220 to 222, under the terms of the DLC structure theshareholders of Rio Tinto plc and of Rio Tinto Limited entered into certaincontractual arrangements which are designed to place the shareholders ofboth Companies in substantially the same position as if they held shares in asingle entity which owned all of the assets of both Companies. Generally, andas far as is permitted by the UK Companies Act and the AustralianCorporations Act and ASX Listing Rules, this principle is reflected in theArticles of Association of Rio Tinto plc and in the Constitution of Rio TintoLimited. The summaries below include descriptions of material rights of theshareholders of both Rio Tinto plc and Rio Tinto Limited.
ObjectsAt the 2009 annual general meetings, shareholders of Rio Tinto plc andRio Tinto Limited approved amendments to the constitutional documentswhereby the object clauses were removed to allow the Companies to have thewidest possible scope of activities.
DirectorsUnder Rio Tinto plc’s Articles of Association, a director may not vote in respectof any proposal in which he, or any other person connected with him, has anymaterial interest, other than by virtue of his interests in shares or debenturesor other securities of, or otherwise in or through, the Company, except whereresolutions:
– indemnify him or a third party in respect of obligations incurred by thedirector on behalf of, or for the benefit of, the Company, or in respect ofobligations of the Company, for which the director has assumedresponsibility under an indemnity, security or guarantee;
– relate to an offer of securities in which he may be interested as a holder ofsecurities or as an underwriter;
– concern another body corporate in which the director is beneficiallyinterested in less than one per cent of the issued shares of any class ofshares of such a body corporate;
– relate to an employee benefit in which the director will share equally withother employees; and
– relate to liability insurance that the Company is empowered to purchasefor the benefit of directors of the Company in respect of actionsundertaken as directors (or officers) of the Company.
Under Rio Tinto Limited’s Constitution, except where a director is constrainedby Australian law, a director may be present at a meeting of the board while amatter in which the director has a material personal interest is beingconsidered and may vote in respect of that matter.
The directors are empowered to exercise all the powers of the Companies toborrow money, to charge any property or business of the Companies or all, orany, of their uncalled capital and to issue debentures or give any other securityfor a debt, liability or obligation of the Companies or of any other person. Thedirectors shall restrict the borrowings of Rio Tinto plc to the limitation that theaggregate amount of all moneys borrowed by the Company and itssubsidiaries shall not exceed an amount equal to one and one half times theCompanies’ share capital plus aggregate reserves unless sanctioned by anordinary resolution of the Company.
Directors are not required to hold any shares of either Company by way ofqualification. The Remuneration Report on pages 64 and 100 providesinformation on shareholding policies relating to executive and non-executivedirectors. Please refer to the Corporate governance section on pages 53 to 63for information on the appointment of directors.
Rights attaching to sharesUnder English law, dividends on shares may only be paid out of profitsavailable for distribution, as determined in accordance with generally acceptedaccounting principles and by the relevant law. Shareholders are entitled toreceive such dividends as may be declared by the directors. The directors mayalso pay shareholders such interim dividends as appear to them to be justifiedby the financial position of the Group.
Any Rio Tinto plc dividend unclaimed after 12 years from the date the dividendwas declared, or became due for payment, will be forfeited and returned to theCompany. Any Rio Tinto Limited dividend unclaimed may be invested orotherwise used by the board for the benefit of the Company until claimed orotherwise disposed of according to Australian law.
VotingVoting at any general meeting of shareholders on a resolution on which theholder of the Special Voting Share is entitled to vote shall be decided by a poll,and any other resolution shall be decided by a show of hands unless a poll hasbeen duly demanded. On a show of hands, every shareholder who is present inperson or by proxy or other duly authorised representative and is entitled tovote has one vote regardless of the number of shares held. The holder of theSpecial Voting Share is not entitled to vote on a show of hands. On a poll, every
224 riotinto.com
For
per
sona
l use
onl
y
shareholder who is present in person or by proxy or other duly authorisedrepresentative and is entitled to vote has one vote for every ordinary share forwhich he or she is the holder and, in the case of Joint Decisions, the holder ofthe Special Voting Share has one vote for each vote cast by the shareholdersat the parallel meeting of the other Company’s shareholders.
A poll may be demanded by any of the following:
– the chairman of the meeting;
– at least five shareholders entitled to vote on the resolution;
– any shareholder or shareholders representing in the aggregate not lessthan one tenth (Rio Tinto plc) or one 20th (Rio Tinto Limited) of the totalvoting rights of all shareholders entitled to vote on the resolution;
– any shareholder or shareholders holding shares conferring a right to voteat the meeting on which there have been paid-up sums in the aggregateequal to not less than one tenth of the total sum paid up on all the sharesconferring that right (Rio Tinto plc); or
– the holder of the Special Voting Share.
A proxy form will be treated as giving the proxy the authority to demand a poll,or to join others in demanding one.
The necessary quorum for a Rio Tinto plc general meeting is three memberspresent (in person or by proxy or other duly authorised representative) andentitled to vote, and for a Rio Tinto Limited general meeting is two memberspresent (in person or by proxy or other duly authorised representative).
Matters are transacted at general meetings by the proposing and passingof resolutions as:
– ordinary resolutions, which require the affirmative vote of a majority of thevotes of those persons voting at a meeting at which there is a quorum, forexample the election of directors; and
– special resolutions, which require the affirmative vote of not less thanthree-fourths of the persons voting at a meeting at which there is aquorum, for example amending the Articles of Association of Rio Tinto plcor the Constitution of Rio Tinto Limited.
The Sharing Agreement further classifies resolutions as “Joint Decisions” and“Class Rights Actions” as explained under Voting rights on pages 220 and 221.
Annual general meetings must be convened with 21 days’ written notice forRio Tinto plc and with 28 days’ notice for Rio Tinto Limited. Other meetings ofRio Tinto plc must be convened with 21 days’ written notice for the passing ofa special resolution and with 14 days’ notice for any other resolution,depending on the nature of the business to be transacted. All meetings ofRio Tinto Limited require 28 days’ notice. In calculating the period of notice thedays of delivery or receipt of the notice and the date of the meeting are notincluded. Among other things, the notice must specify the nature of thebusiness to be transacted.
Variation of rightsIf, at any time, the share capital is divided into different classes of shares, therights attached to any class may be varied, subject to the provisions of therelevant legislation, with the consent in writing of holders of three-fourths invalue of the shares of that class or upon the adoption of an extraordinaryresolution passed at a separate meeting of the holders of the shares of thatclass. At every such separate meeting, all of the provisions of the Articles ofAssociation and Constitution relating to proceedings at a general meetingapply, except that the quorum for Rio Tinto plc should be two or more personswho hold or represent by proxy not less than one-third in nominal value of theissued shares of the class.
Rights upon a winding-upExcept as the shareholders have agreed or may otherwise agree, upon awinding-up, the balance of assets available for distribution:
– after the payment of all creditors including certain preferential creditors,whether statutorily preferred creditors or normal creditors; and
– subject to any special rights attaching to any class of shares
is to be distributed among the holders of ordinary shares according to theamounts paid-up on the shares held by them. This distribution is generally tobe made in cash. A liquidator may, however, upon the adoption of a specialresolution of the shareholders, divide among the shareholders the whole orany part of the assets in kind.
The DLC Merger Sharing Agreement further sets out the rights of ordinaryshareholders in a liquidation as explained on page 221.
Facility agreementDetails of the Group’s US$7.5 billion multi-currency committed revolvingcredit facilities are set out in note 30 to the 2014 financial statements.
Exchange controls and foreign investmentRio Tinto plcThere are no UK foreign exchange controls or other UK restrictions on theimport or export of capital or on the payment of dividends to non-residentholders of Rio Tinto plc shares or that materially affect the conduct ofRio Tinto plc’s operations. It should be noted, however, that various sanctions,laws, regulations or conventions may restrict the import or export of capital by,or the payment of dividends to, non-resident holders of Rio Tinto plc shares.There are no restrictions under Rio Tinto plc’s Articles of Association or underUK law that limit the right of non-resident owners to hold or voteRio Tinto plc shares.
Rio Tinto LimitedUnder current Australian legislation, permission is not required for themovement of funds into or out of Australia. However, there is a prohibition on,or in some cases the specific prior approval of the Department of ForeignAffairs and Trade or Minister for Foreign Affairs must be obtained for, certainpayments or other dealings connected with countries or parties identified withterrorism, or to whom United Nations or autonomous Australiansanctions apply.
Rio Tinto Limited may be required to deduct withholding tax from foreignremittances of dividends, to the extent that they are unfranked, and frompayments of interest.
Acquisitions of interests in shares, voting power or certain other equityinstruments in Australian companies by foreign interests are subject to reviewand approval by the Treasurer of the Commonwealth of Australia under theForeign Acquisitions and Takeovers Act 1975 (the Takeovers Act). TheTakeovers Act applies to acquisitions by a single foreign person (and anyassociate) of 15 per cent or more, or by several foreign persons (and anyassociates) of 40 per cent or more of the issued shares, issued shares if allrights were converted, voting power or potential voting power in an Australiancompany, and to other transactions that result in such persons controllingsuch interests. The Takeovers Act also applies to direct investments by foreigngovernment investors, including acquisitions of interests of ten per cent ormore. Persons who are proposing such acquisitions or transactions arerequired to notify the Treasurer of their intention. The Treasurer has the powerto order divestment in cases where such acquisitions or transactions havealready occurred. The Takeovers Act does not affect the rights of ownerswhose interests are held in compliance with the legislation.
Limitations on voting and shareholdingExcept for the provisions of the Takeovers Act, there are no limitationsimposed by law, Rio Tinto plc’s Articles of Association or Rio Tinto Limited’sConstitution, on the rights of non-residents or foreign persons to hold or votethe Group’s ordinary shares or ADSs that would not apply generally to allshareholders.
riotinto.com 225
STRATEG
ICREPO
RT
DIRECTO
RS’R
EPORT
FINANCIA
LSTA
TEMEN
TSPR
ODUCTIO
N,R
ESERVES
ANDOPER
ATIO
NS
AD
DIT
ION
AL
INF
OR
MA
TIO
N
For
per
sona
l use
onl
y

Shareholder information continued
UK Listing Rules cross reference tableThe following table contains cross references identifying the location of information required to be disclosed in the Annual report by the UK Listing Authority’sListing Rule 9.8.4 R.
Listing rule Description of Listing Rule Reference in Report
9.8.4 (1) A statement of any interest capitalised by the Group during the year Note 8 Finance income andfinance costs and Note 17Deferred taxation
9.8.4 (2) Any information required by Listing Rule 9.2.18 R N/A
9.8.4 (4) Details of any long-term incentive scheme as described in LR 9.4.2R (2) N/A
9.8.4 (5) Details of any arrangement under which a director has waived any emoluments N/A
9.8.4 (6) Details of any arrangement under which a director has agreed to waive future emoluments N/A
9.8.4 (7) Details of any allotments of shares by the company for cash not previously authorised by shareholders N/A
9.8.4 (8) Details of any allotments of shares for cash by a major subsidiary of the company N/A
9.8.4 (9) Details of the participation by the company in any placing made by its parent company N/A
9.8.4 (10) Details of any contract of significance with the company in which a director has a material interest; or acontract between the company and a controlling shareholder N/A
9.8.4 (11) Details of any contract for the provision of services to the company by a controlling shareholder N/A
9.8.4 (12) Details of any arrangement under which a shareholder has waived or agreed to waive any dividends Note 11 Dividends
9.8.4 (13) Details of where a shareholder has agreed to waive future dividends N/A
9.8.4 (14) Information required by LR 9.2.2AR (2)(a) N/A
226 riotinto.com
For
per
sona
l use
onl
y
Financial calendar
2015
20 January Fourth quarter 2014 operations review
12 February Announcement of results for 2014
4 March Rio Tinto Limited shares and Rio Tinto plc ADRs quoted “ex-dividend” for 2014 final dividend
5 March Rio Tinto plc shares quoted “ex-dividend” for 2014 final dividend
6 March Record date for 2014 final dividend for Rio Tinto plc and Rio Tinto Limited shares and Rio Tinto plc ADRs
6 March Publication of 2014 Annual report, 20-F and Notices of annual general meetings
17 March Plan notice date for election under the dividend reinvestment plan and date for electing dividends paid in alternate currency for the 2014final dividend
31 March Dividend currency conversion date (Rio Tinto plc holders electing to receive Australian dollars and Rio Tinto Limited holders electing toreceive pounds sterling)
9 April Payment date for 2014 final dividend to holders of ordinary shares and ADRs
16 April Annual general meeting for Rio Tinto plc, London
21 April First quarter 2015 operations review
7 May Annual general meeting for Rio Tinto Limited, Melbourne
16 July Second quarter 2015 operations review
6 August Announcement of half year results for 2015
12 August Rio Tinto Limited shares and Rio Tinto plc ADRS quoted “ex-dividend” for 2015 interim dividend
13 August Rio Tinto plc shares quoted “ex-dividend” for 2015 interim dividend
14 August Record date for 2015 interim dividend for Rio Tinto plc and Rio Tinto Limited shares and Rio Tinto plc ADRs
19 August Plan notice date for election under the dividend reinvestment plan and date for electing dividends paid in alternate currency for the 2015interim dividend for Rio Tinto plc
20 August Plan notice date for election under the dividend reinvestment plan and date for electing dividends paid in alternate currency for the 2015interim dividend for Rio Tinto Limited
3 September Dividend currency conversion date (Rio Tinto plc holders electing to receive Australian dollars and Rio Tinto Limited holders electing toreceive pounds sterling)
10 September Payment date for 2015 interim dividend to holders of ordinary shares and ADRs
16 October Third quarter 2015 operations review
2016
January Fourth quarter 2015 operations review
February Announcement of results for 2015
April Annual general meeting for Rio Tinto plc, London
April First quarter 2016 operations review
May Annual general meeting for Rio Tinto Limited, Brisbane
July Second quarter 2016 operations review
August Announcement of half year results for 2016
October Third quarter 2016 operations review
riotinto.com 227
STRATEG
ICREPO
RT
DIRECTO
RS’R
EPORT
FINANCIA
LSTA
TEMEN
TSPR
ODUCTIO
N,R
ESERVES
ANDOPER
ATIO
NS
AD
DIT
ION
AL
INF
OR
MA
TIO
N
For
per
sona
l use
onl
y

Contact details
Registered officesRio Tinto plc2 Eastbourne TerraceLondonW2 6LGRegistered in England No. 719885
Telephone: +44 (0) 20 7781 2000Fax: +44 (0) 20 7781 1800riotinto.com
Rio Tinto LimitedLevel 33120 Collins StreetMelbourneVictoria 3000ABN 96 004 458 404
Telephone: +61 (0) 3 9283 3333Fax: +61 (0) 3 9283 3707riotinto.com
Rio Tinto’s agent in the US is Cheree Finan,who may be contacted atRio Tinto Services Inc.80 State StreetAlbany, NY 12207-2543
ShareholdersPlease refer to the Investor Centre of therespective registrar if you have any queries aboutyour shareholding.
Rio Tinto plcComputershare InvestorServices PLCThe PavilionsBridgwater RoadBristolBS99 6ZY
Telephone: +44 (0) 870 703 6364Fax: +44 (0) 870 703 6119UK residents only,freephone: 0800 435021computershare.com
Holders of Rio Tinto American DepositaryReceipts (ADRs)Please contact the ADR administrator if you haveany queries about your ADRs.
ADR administratorJPMorgan Chase & CoPO Box 64504St. Paul, MN 55164-0504
Telephone: +1 (651) 453 2128US residents only, toll free general:(800) 990 1135US residents only, toll free Global invest direct:(800) 428 [email protected]
Rio Tinto LimitedComputershare Investor ServicesPty LimitedGPO Box 2975MelbourneVictoria 3001
Telephone: +61 (0) 3 9415 4030Fax: +61 (0) 3 9473 2500Australian residents only, toll free:1800 813 292New Zealand residents only, toll free:0800 450 740computershare.com
Former Alcan Inc. shareholdersComputershare InvestorServices Inc.9th Floor100 University AvenueToronto, ON M5J 2Y1Ontario
Telephone: +1 416 263 9200North American residents only,toll free: +1 (866) 624-1341computershare.com
Investor CentreInvestor Centre is Computershare’s free, secure,self service website, where shareholders canmanage their holdings online. The websiteenables shareholders to:
– View share balances
– Change address details
– View payment and tax information
– Update payment instructions
In addition, shareholders who register their emailaddress on Investor Centre can be notifiedelectronically of events such as annual generalmeetings, and can receive shareholdercommunications such as the Annual report orNotice of meeting electronically online.
Rio Tinto plc shareholdersinvestorcentre.co.uk/riotinto
Rio Tinto Limited shareholdersinvestorcentre.com/rio
228 riotinto.com
For
per
sona
l use
onl
y

Printed by Park Communicationson FSC® certified paper.
Park is EMAS certified company and itsEnvironmental Management System iscertified to ISO 14001.
100% of the inks used are vegetable oil based,95% of press chemicals are recycled forfurther use and, on average 99% of any wasteassociated with this production will be recycled.
This document is printed on Explorer Offset, apaper containing 100% virgin fibre sourcedfrom well managed, responsible, FSC® certifiedforests. The pulp used in this product isbleached using an elemental chlorine free(ECF) process.
Design and production by Black Sun Plcwww.blacksunplc.com
Typeset by RR Donnelley
For
per
sona
l use
onl
y
riotinto.com/ar2014
Get more information online
Visit riotinto.com
– Find out more about our business and performance
– View our full 2014 Annual report: riotinto.com/ar2014
– View our full 2014 Sustainable development report
For
per
sona
l use
onl
y
Related Documents