Delivering Results, Driving Transformation 2012 ANNUAL REPORT

Welcome message from author
This document is posted to help you gain knowledge. Please leave a comment to let me know what you think about it! Share it to your friends and learn new things together.
Transcript

Delivering�Results,�Driving�
Transformation
Scien
tific G
am
eS co
rporatio
n2012 A
NN
UA
L REPORT
2012 ANNUALREPORT
SCIENTIFIC GAMES CORPORATION750 Lexington AvenueNew York, NY 10022www.scientificgames.com

MANAGEMENT
A.�Lorne�Weilchief executive officer and chairman of the Board
Michael�R.�Chambrellochief executive officer — asia-pacific region
Jeffrey�S.�LipkinSenior Vice president and chief financial officer
James�C.�Kennedypresident of printed products and chief marketing officer
William�J.�Huntleyexecutive Vice president and chief executive officer, Systems
Stephen�G.�Fraterexecutive chairman — SG Gaming
Steven�M.�Saferinpresident of properties Group and chief creative officer
Steve�W.�Beasonenterprise chief technology officer
Jack�B.�SarnoVice president — Worldwide Legal affairs and corporate Secretary
Larry�A.�PottsVice president, chief compliance officer and Director of Security
Jeffrey�B.�JohnsonVice president finance, chief accounting officer andcorporate controller
Michael�P.�ConfortiSenior Vice president, international Business Development
BOARD�OF�DIRECTORS
A.�Lorne�Weil4chairman and chief executive officer of Scientific Games
Michael�R.�Chambrellochief executive officer — asia-pacific region of Scientific Games
Peter�A.�Cohen2+�4+
Vice chairman of Scientific Games and chairman and chief executive officer of cowen Group, inc.
Gerald�J.�Ford3�5+
chairman of Hilltop Holdings, inc.
David�L.�Kennedy4Vice chairman of Scientific Games, Senior executive Vicepresident of macandrews & forbes Holdings inc. and Vice chairman of revlon, inc.
Paul�M.�Meister1�2chairman and chief executive officer of inVentiv Health, inc.and chief executive officer of Liberty Lane partners, LLc
Ronald�O.�Perelman4
chairman and chief executive officer of macandrews &forbes Holdings inc.
Michael�J.�Regan1+�5
former Vice chairman and chief administrative officer ofKpmG LLp
Barry�F.�Schwartz2�3+executive Vice chairman and chief administrative officer ofmacandrews & forbes Holdings inc.
Frances�F.�Townsend1�3�5
Senior Vice president of Worldwide Government, Legal andBusiness affairs of macandrews & forbes Holdings inc.
Committees:1audit2compensation3compliance4executive and finance5nominating and corporate Governance
+ following committee Designation indicates chair of committee
NOTICE�OF�ANNUAL�MEETINGThe Annual Meeting of Shareholders will be held on June 4, 2013 at 10:30 a.m. EDT at the Company’s headquarters located at 750 Lexington Avenue, 19th Floor,New York, NY 10022
TRANSFER�AGENTAmerican Stock Transfer & Trust Company6201 15th AvenueBrooklyn, NY 11219Tel: 800-937-5449Website: www.amstock.com
STOCK�SYMBOLNASDAQ: SGMS
INDEPENDENT�ACCOUNTANTSDeloitte & Touche LLPAtlanta, Georgia
CONTACT�INFORMATIONInvestor RelationsScientific Games Corporation750 Lexington AvenueNew York, NY 10022Tel: 212-754-2233Fax: 212-754-2372Website: www.scientificgames.comE-mail: [email protected]
Corporate Information
product management, prize payout increases, lotteryprivate management and sales of higher price-pointtickets. These results support our belief that wherelotteries outsource to us and/or we have a larger role inthe business, lottery performance is notably improved.
12012 Annual report
L E t t E r tO S h A r E h O L d E r S
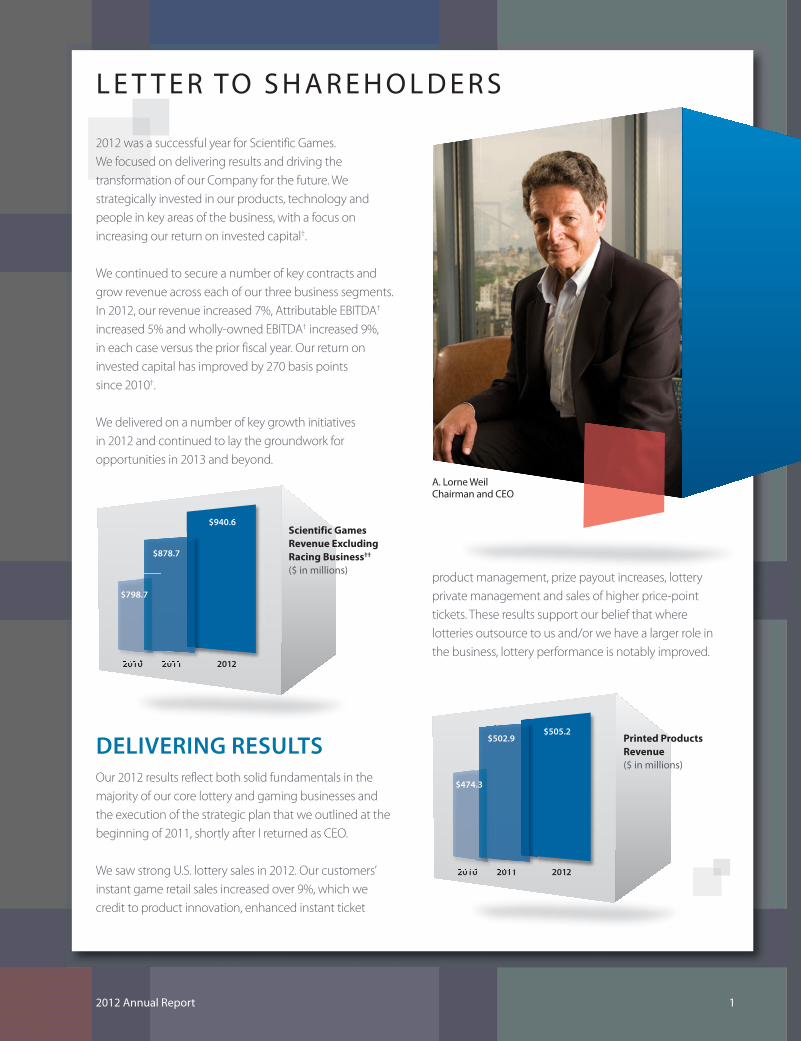
A. Lorne WeilChairman and CEO
2010 2011 2012
Printed ProductsRevenue ($ in millions)
$474.3
$505.2$502.9
2010 2011 2012
Scientific GamesRevenue ExcludingRacing Business††
($ in millions)
$798.7
$940.6
$878.7
2012 was a successful year for Scientific Games. We focused on delivering results and driving thetransformation of our Company for the future. Westrategically invested in our products, technology andpeople in key areas of the business, with a focus onincreasing our return on invested capital†.
We continued to secure a number of key contracts andgrow revenue across each of our three business segments.In 2012, our revenue increased 7%, Attributable EBITDA†
increased 5% and wholly-owned EBITDA† increased 9%, in each case versus the prior fiscal year. Our return oninvested capital has improved by 270 basis points since 2010†.
We delivered on a number of key growth initiatives in 2012 and continued to lay the groundwork foropportunities in 2013 and beyond.
DELIVERING RESULTSOur 2012 results reflect both solid fundamentals in themajority of our core lottery and gaming businesses andthe execution of the strategic plan that we outlined at thebeginning of 2011, shortly after I returned as CEO.
We saw strong U.S. lottery sales in 2012. Our customers’instant game retail sales increased over 9%, which wecredit to product innovation, enhanced instant ticket
Scientific Games Corporation2
2010 2011 2012
Lottery SystemsRevenue ($ in millions)
$236.0
$271.7
$242.3
FY 2011 FY 2012
Illinois LotteryInstant Ticket Retail Sales($ in millions)
$1,615.0
$1,275.3
2010 2011 2012
Gaming RevenueExcluding RacingBusiness††
($ in millions)
$88.3
$163.8
$133.5
Our customers’ draw game retail sales approached 10%growth in 2012, primarily driven by the two largestjackpots in U.S. history. In addition to strong retail sales,our lottery systems business benefited from increasedproduct sales, both domestically and internationally.
Our Northstar Illinois joint venture completed its first fullyear of providing private management services to theIllinois Lottery, with instant ticket retail sales increasing27% and total revenue growing nearly 18% for thelottery’s fiscal year ended June 30, 2012.
Instant ticket retail sales in Italy and China decreased in 2012. Despite this decline, we continue to believeconsumer demand for lottery products remains strong in both countries and we are focused on new initiativesfor growth.
Our Properties Plus® offering, which provides internet-based player loyalty and rewards programs to lotteries,gained further traction with the launch of the Missouri,North Carolina and Kentucky programs in 2012, with theMaryland Lottery contracted to launch Properties Plus in 2013.
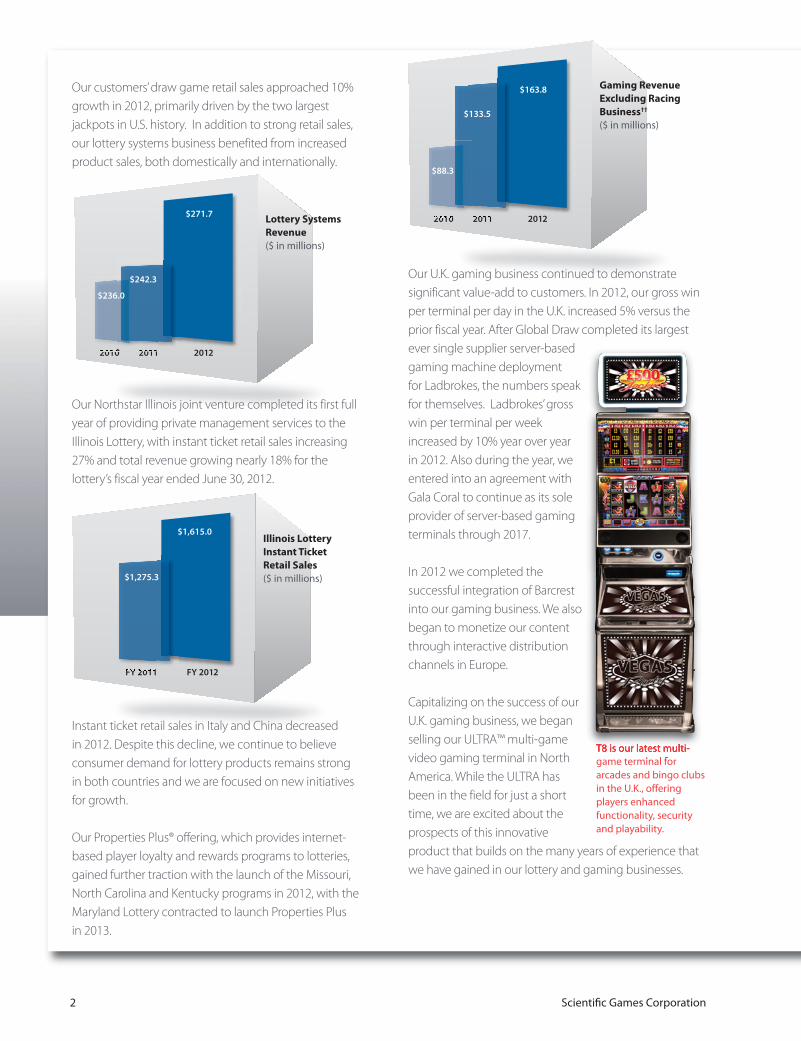
Our U.K. gaming business continued to demonstratesignificant value-add to customers. In 2012, our gross winper terminal per day in the U.K. increased 5% versus theprior fiscal year. After Global Draw completed its largestever single supplier server-basedgaming machine deployment for Ladbrokes, the numbers speakfor themselves. Ladbrokes’ grosswin per terminal per weekincreased by 10% year over yearin 2012. Also during the year, weentered into an agreement withGala Coral to continue as its soleprovider of server-based gamingterminals through 2017.
In 2012 we completed thesuccessful integration of Barcrestinto our gaming business. We alsobegan to monetize our contentthrough interactive distributionchannels in Europe.
Capitalizing on the success of ourU.K. gaming business, we beganselling our ULTRA™ multi-gamevideo gaming terminal in NorthAmerica. While the ULTRA hasbeen in the field for just a shorttime, we are excited about theprospects of this innovativeproduct that builds on the many years of experience thatwe have gained in our lottery and gaming businesses.
t8 is our latest multi-game terminal forarcades and bingo clubsin the U.K., offeringplayers enhancedfunctionality, security and playability.
thai Flower is part of ourMega-Games Packs forour ULtrA™ multi-gamemachine. ULtrA isScientific Games’ firstentry into the NorthAmerican machinebusiness andleverages our
successful U.K.-basedcontent development.
32012 Annual report
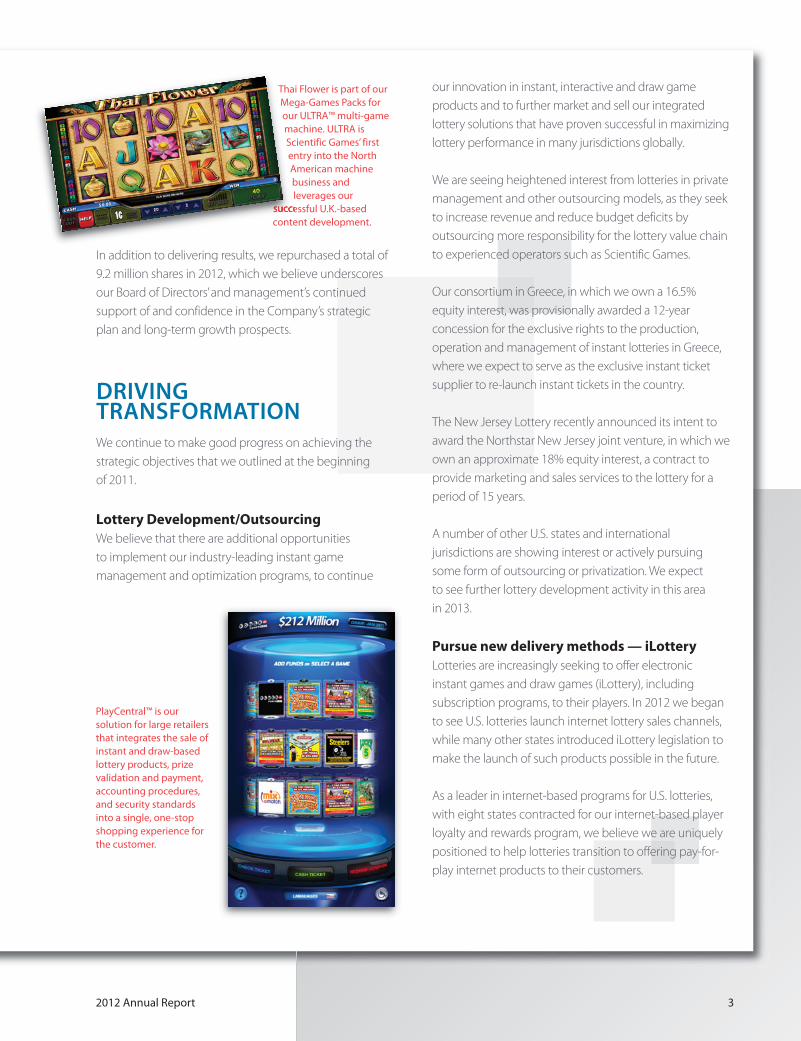
PlayCentral™ is oursolution for large retailersthat integrates the sale ofinstant and draw-basedlottery products, prizevalidation and payment,accounting procedures,and security standardsinto a single, one-stopshopping experience forthe customer.
In addition to delivering results, we repurchased a total of9.2 million shares in 2012, which we believe underscoresour Board of Directors’ and management’s continuedsupport of and confidence in the Company’s strategicplan and long-term growth prospects.
DRIVINGTRANSFORMATIONWe continue to make good progress on achieving thestrategic objectives that we outlined at the beginning of 2011.
Lottery Development/OutsourcingWe believe that there are additional opportunities to implement our industry-leading instant gamemanagement and optimization programs, to continue
our innovation in instant, interactive and draw gameproducts and to further market and sell our integratedlottery solutions that have proven successful in maximizinglottery performance in many jurisdictions globally.
We are seeing heightened interest from lotteries in privatemanagement and other outsourcing models, as they seekto increase revenue and reduce budget deficits byoutsourcing more responsibility for the lottery value chainto experienced operators such as Scientific Games.
Our consortium in Greece, in which we own a 16.5%equity interest, was provisionally awarded a 12-yearconcession for the exclusive rights to the production,operation and management of instant lotteries in Greece,where we expect to serve as the exclusive instant ticketsupplier to re-launch instant tickets in the country.
The New Jersey Lottery recently announced its intent toaward the Northstar New Jersey joint venture, in which weown an approximate 18% equity interest, a contract toprovide marketing and sales services to the lottery for aperiod of 15 years.
A number of other U.S. states and internationaljurisdictions are showing interest or actively pursuingsome form of outsourcing or privatization. We expect to see further lottery development activity in this area in 2013.
Pursue new delivery methods — iLotteryLotteries are increasingly seeking to offer electronicinstant games and draw games (iLottery), includingsubscription programs, to their players. In 2012 we beganto see U.S. lotteries launch internet lottery sales channels,while many other states introduced iLottery legislation tomake the launch of such products possible in the future.
As a leader in internet-based programs for U.S. lotteries,with eight states contracted for our internet-based playerloyalty and rewards program, we believe we are uniquelypositioned to help lotteries transition to offering pay-for-play internet products to their customers.
We are currently in activediscussions with many of ourcustomers regarding how theycan best leverage the internet todrive revenue, while continuingto support the lottery’s existing
products and successful retail networks. To us, theinternet is an important sales channel, but needs to beviewed as just one component of the overall sales andmarketing mix.
Our interactive platform is also gaining traction in Europe,where certain of our gaming content is being madeavailable through interactive delivery channels.
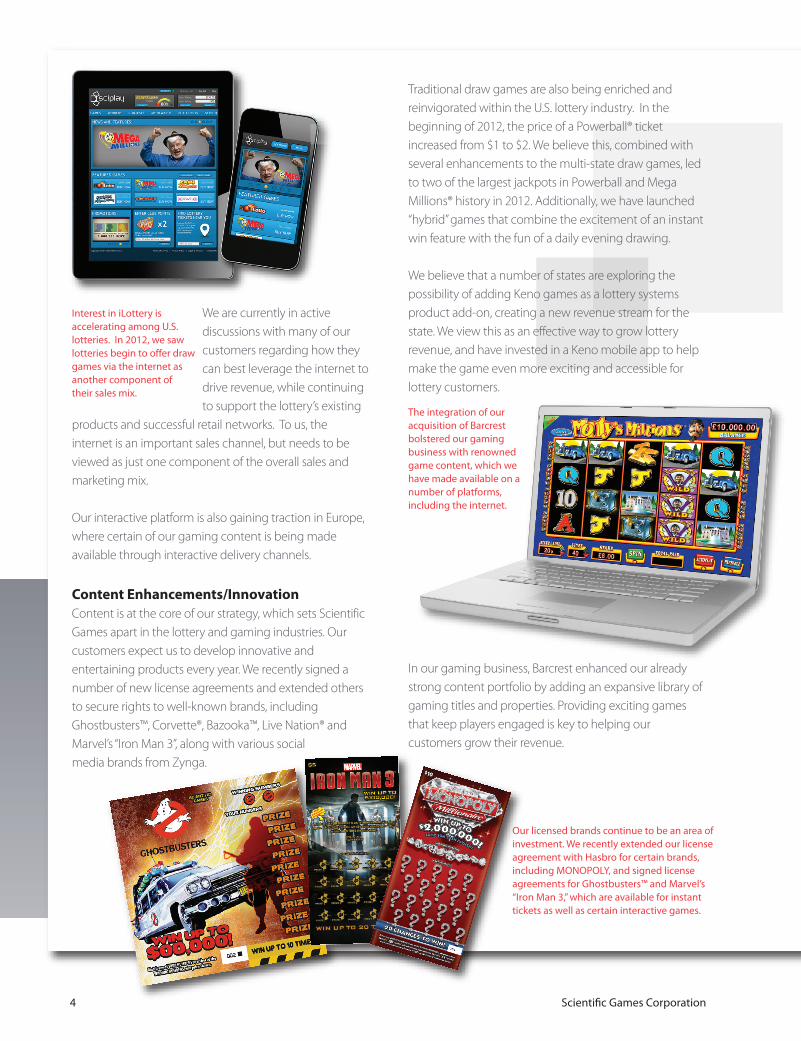
Content Enhancements/InnovationContent is at the core of our strategy, which sets ScientificGames apart in the lottery and gaming industries. Ourcustomers expect us to develop innovative andentertaining products every year. We recently signed anumber of new license agreements and extended othersto secure rights to well-known brands, includingGhostbusters™, Corvette®, Bazooka™, Live Nation® andMarvel’s “Iron Man 3”, along with various social media brands from Zynga.
Interest in iLottery isaccelerating among U.S.lotteries. In 2012, we sawlotteries begin to offer drawgames via the internet asanother component of their sales mix.
Our licensed brands continue to be an area ofinvestment. We recently extended our licenseagreement with Hasbro for certain brands,including MONOPOLY, and signed licenseagreements for Ghostbusters™ and Marvel’s“Iron Man 3,” which are available for instanttickets as well as certain interactive games.
Scientific Games Corporation4
The integration of ouracquisition of Barcrestbolstered our gamingbusiness with renownedgame content, which wehave made available on anumber of platforms,including the internet.
Traditional draw games are also being enriched andreinvigorated within the U.S. lottery industry. In thebeginning of 2012, the price of a Powerball® ticketincreased from $1 to $2. We believe this, combined withseveral enhancements to the multi-state draw games, ledto two of the largest jackpots in Powerball and MegaMillions® history in 2012. Additionally, we have launched“hybrid” games that combine the excitement of an instantwin feature with the fun of a daily evening drawing.
We believe that a number of states are exploring thepossibility of adding Keno games as a lottery systemsproduct add-on, creating a new revenue stream for thestate. We view this as an effective way to grow lotteryrevenue, and have invested in a Keno mobile app to helpmake the game even more exciting and accessible forlottery customers.
In our gaming business, Barcrest enhanced our alreadystrong content portfolio by adding an expansive library ofgaming titles and properties. Providing exciting gamesthat keep players engaged is key to helping ourcustomers grow their revenue.
Grow Revenue Outside of the U.S.We continue to believe the international marketplaceprovides a significant opportunity for our Company. As illustrated by our recent award in Greece, there are a number of countries looking to expand their revenuebase, such as by launching a new lottery, leveragingadditional distribution channels or expanding theirportfolio of products. We believe this is an importantopportunity to demonstrate how the products,technology and best practices we use around the worldcan be successfully deployed to grow our customers’lottery and gaming businesses.
Identify and pursue strategic acquisitions tocomplement existing business and expandscale and scope In line with our strategy, during 2012 we completed threestrategic acquisitions which are intended to support keygrowth initiatives.
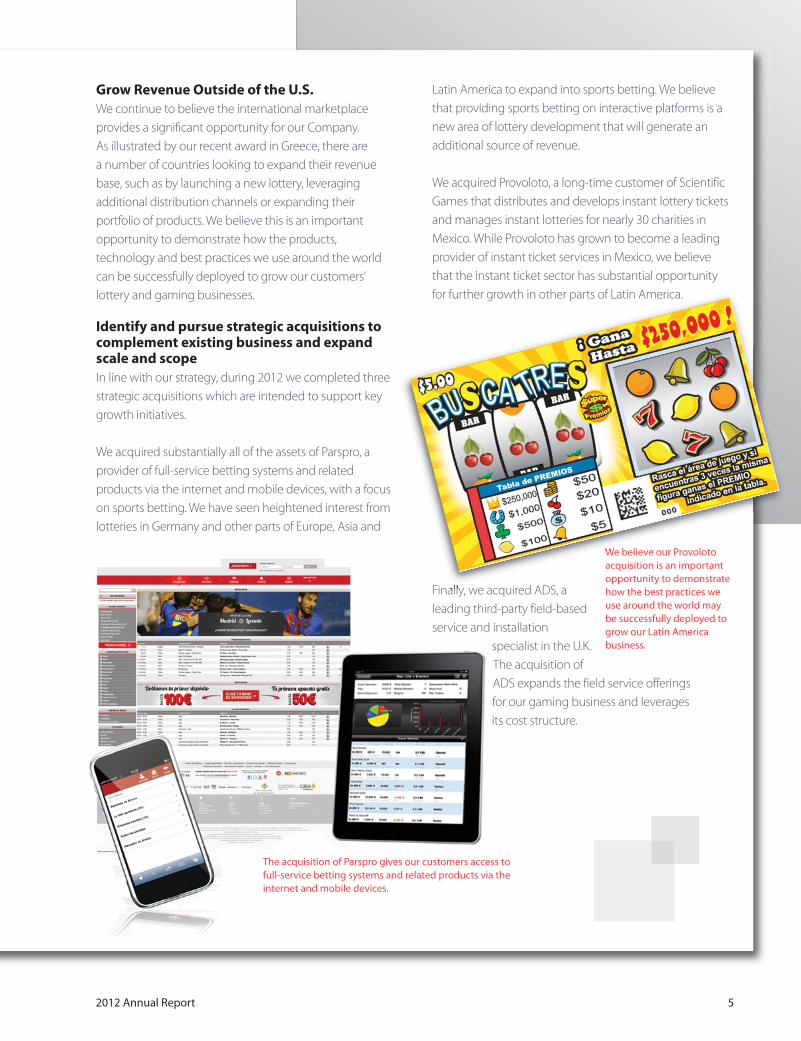
We acquired substantially all of the assets of Parspro, aprovider of full-service betting systems and relatedproducts via the internet and mobile devices, with a focuson sports betting. We have seen heightened interest fromlotteries in Germany and other parts of Europe, Asia and
Latin America to expand into sports betting. We believethat providing sports betting on interactive platforms is anew area of lottery development that will generate anadditional source of revenue.
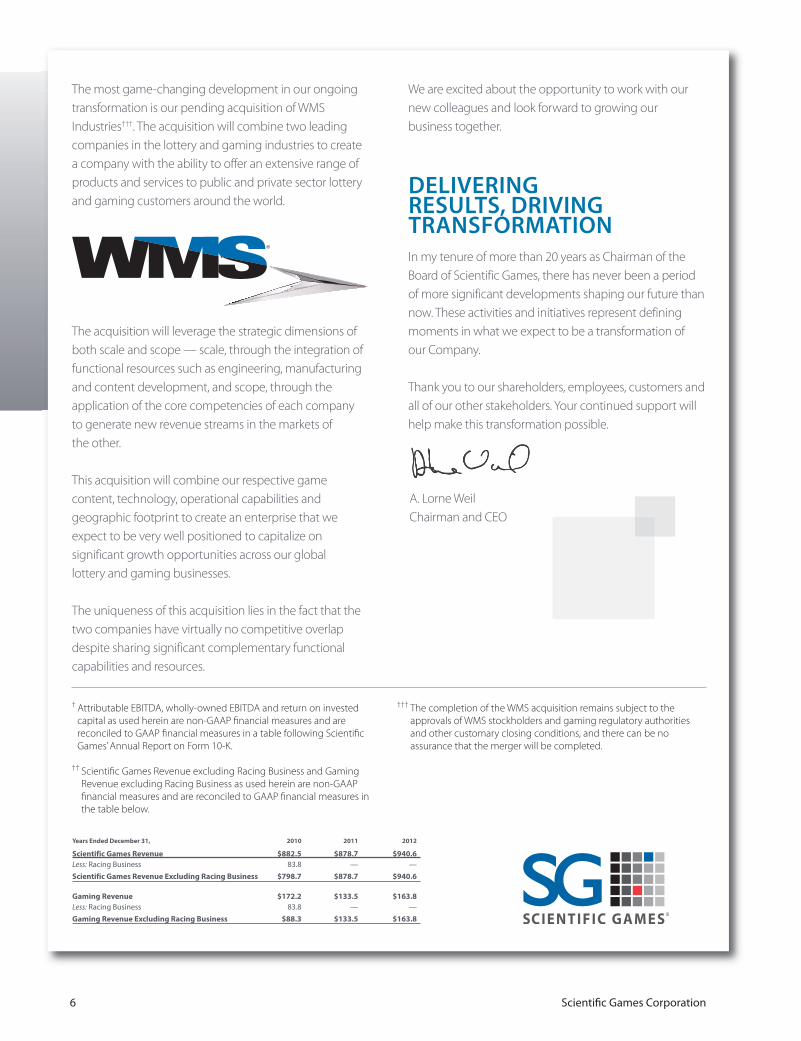
We acquired Provoloto, a long-time customer of ScientificGames that distributes and develops instant lottery ticketsand manages instant lotteries for nearly 30 charities inMexico. While Provoloto has grown to become a leadingprovider of instant ticket services in Mexico, we believethat the instant ticket sector has substantial opportunityfor further growth in other parts of Latin America.
52012 Annual report
Finally, we acquired ADS, aleading third-party field-basedservice and installation
specialist in the U.K.The acquisition ofADS expands the field service offerings for our gaming business and leverages its cost structure.
We believe our Provolotoacquisition is an importantopportunity to demonstratehow the best practices weuse around the world maybe successfully deployed togrow our Latin Americabusiness.
the acquisition of Parspro gives our customers access to full-service betting systems and related products via the internet and mobile devices.
The most game-changing development in our ongoingtransformation is our pending acquisition of WMSIndustries†††. The acquisition will combine two leadingcompanies in the lottery and gaming industries to createa company with the ability to offer an extensive range ofproducts and services to public and private sector lotteryand gaming customers around the world.
The acquisition will leverage the strategic dimensions ofboth scale and scope — scale, through the integration offunctional resources such as engineering, manufacturingand content development, and scope, through theapplication of the core competencies of each company to generate new revenue streams in the markets of the other.
This acquisition will combine our respective gamecontent, technology, operational capabilities andgeographic footprint to create an enterprise that weexpect to be very well positioned to capitalize onsignificant growth opportunities across our global lottery and gaming businesses.
The uniqueness of this acquisition lies in the fact that thetwo companies have virtually no competitive overlapdespite sharing significant complementary functionalcapabilities and resources.
We are excited about the opportunity to work with ournew colleagues and look forward to growing our business together.
DELIVERING RESULTS, DRIVINGTRANSFORMATIONIn my tenure of more than 20 years as Chairman of theBoard of Scientific Games, there has never been a periodof more significant developments shaping our future thannow. These activities and initiatives represent definingmoments in what we expect to be a transformation of our Company.
Thank you to our shareholders, employees, customers andall of our other stakeholders. Your continued support willhelp make this transformation possible.
Years Ended December 31, 2010 2011 2012
Scientific Games Revenue $882.5 $878.7 $940.6Less: Racing Business 83.8 — —Scientific Games Revenue Excluding Racing Business $798.7 $878.7 $940.6
Gaming Revenue $172.2 $133.5 $163.8Less: Racing Business 83.8 — — Gaming Revenue Excluding Racing Business $88.3 $133.5 $163.8
† Attributable EBITDA, wholly-owned EBITDA and return on investedcapital as used herein are non-GAAP financial measures and arereconciled to GAAP financial measures in a table following ScientificGames’ Annual Report on Form 10-K.
†† Scientific Games Revenue excluding Racing Business and GamingRevenue excluding Racing Business as used herein are non-GAAPfinancial measures and are reconciled to GAAP financial measures inthe table below.
††† The completion of the WMS acquisition remains subject to theapprovals of WMS stockholders and gaming regulatory authoritiesand other customary closing conditions, and there can be noassurance that the merger will be completed.
A. Lorne WeilChairman and CEO
Scientific Games Corporation6
UNITED STATES
SECURITIES AND EXCHANGE COMMISSION WASHINGTON, D.C. 20549
FORM 10-K
ANNUAL REPORT PURSUANT TO SECTION 13 OR 15(d) OF THE SECURITIES EXCHANGE ACT OF 1934
For the fiscal year ended: December 31, 2012
Or
TRANSITION REPORT PURSUANT TO SECTION 13 OR 15(d) OF THE SECURITIES EXCHANGE ACT OF 1934
For the transition period from to
Commission file number: 0-13063
SCIENTIFIC GAMES CORPORATION (Exact name of registrant as specified in its charter)
Delaware (State or other jurisdiction of incorporation or organization)
81-0422894 (I.R.S. Employer
Identification No.)
750 Lexington Avenue, 25th Floor
New York, New York 10022 (Address of principal executive offices) (Zip Code)
Registrant's telephone number, including area code: (212) 754-2233
Securities registered pursuant to Section 12(b) of the Act:
Title of each class Name of each exchange on which registered
Class A Common Stock, $.01 par value Nasdaq Global Select Market
Securities registered pursuant to Section 12(g) of the Act: None
Indicate by check mark if the registrant is a well-known seasoned issuer, as defined in Rule 405 of the Securities
Act. Yes No
Indicate by check mark if the registrant is not required to file reports pursuant to Section 13 or Section 15(d) of the
Act. Yes No
Indicate by check mark whether the registrant: (1) has filed all reports required to be filed by Section 13 or 15(d) of the
Securities Exchange Act of 1934 during the preceding 12 months (or for such shorter period that the registrant was required to
file such reports), and (2) has been subject to such filing requirements for the past 90 days. Yes No
Indicate by check mark whether the registrant has submitted electronically and posted on its corporate Web site, if any,
every Interactive Data File required to be submitted and posted pursuant to Rule 405 of Regulation S-T (§ 232.405 of this
chapter) during the preceding 12 months (or for such shorter period that the registrant was required to submit and post such
files). Yes No
2
Indicate by check mark if disclosure of delinquent filers pursuant to Item 405 of Regulation S-K is not contained herein,
and will not be contained, to the best of the registrant's knowledge, in definitive proxy or information statements incorporated
by reference in Part III of this Form 10-K or any amendment to this Form 10-K.
Indicate by check mark whether the registrant is a large accelerated filer, an accelerated filer, a non-accelerated filer, or a
smaller reporting company. See definitions of "large accelerated filer," "accelerated filer," and "smaller reporting company" in
Rule 12b-2 of the Exchange Act.
Large accelerated filer
Accelerated filer Non-accelerated filer (Do not check if
smaller reporting company)
Smaller reporting company
Indicate by check mark whether the registrant is a shell company (as defined in Rule 12b-2 of the Act). Yes No
As of June 30, 2012, the market value of voting and non-voting common equity held by non-affiliates of the registrant
was approximately $481,530,742 (1).
Common shares outstanding as of March 8, 2013 were 84,823,253.
DOCUMENTS INCORPORATED BY REFERENCE
Portions of the registrant's definitive proxy statement for the 2013 Annual Meeting of Stockholders, which is to be filed
subsequently, are incorporated by reference into Part III of the Form 10-K.
________________________________________________________________________________________________________________________________
(1) For this purpose only, "non-affiliates" excludes directors and executive officers.
EXHIBIT INDEX APPEARS ON PAGE 145
3
PART I
FORWARD-LOOKING STATEMENTS
Throughout this Annual Report on Form 10-K we make "forward-looking statements" within the meaning of the U.S.
Private Securities Litigation Reform Act of 1995. Forward-looking statements describe future expectations, plans, results or
strategies and can often be identified by the use of terminology such as "may," "will," "estimate," "intend," "continue,"
"believe," "expect," "anticipate," "should," "could," "potential," "opportunity," or similar terminology. The forward-looking
statements contained in this Annual Report on Form 10-K are generally located in the material set forth under the headings
"Business," "Risk Factors" and "Management's Discussion and Analysis of Financial Condition and Results of Operations" but
may be found in other locations as well. These statements are based upon management's current expectations, assumptions and
estimates and are not guarantees of future results or performance. Actual results may differ materially from those contemplated
in these statements due to a variety of risks and uncertainties and other factors, including, among other things: competition;
material adverse changes in economic and industry conditions; technological change; retention and renewal of existing
contracts and entry into new or revised contracts; availability and adequacy of cash flows to satisfy obligations and
indebtedness or future needs; protection of intellectual property; security and integrity of software and systems; laws and
government regulation, including those relating to gaming licenses, permits and operations; inability to identify, complete and
integrate future acquisitions; inability to benefit from, and risks associated with, strategic equity investments and relationships;
failure of Northstar to meet the net income targets or otherwise realize the anticipated benefits under its private management
agreement with the Illinois Lottery; the seasonality of our business; inability to obtain the approvals required to complete the
merger with WMS; failure to complete the merger with WMS or, if completed, failure to achieve the intended benefits of the
merger or disruption of our current plans and operations; inability to identify and capitalize on trends and changes in the lottery
and gaming industries, including the potential expansion of regulated gaming via the internet; inability to enhance and develop
successful gaming concepts; dependence on suppliers and manufacturers; liability for product defects; fluctuations in foreign
currency exchange rates and other factors associated with international operations; influence of certain stockholders;
dependence on key personnel; failure to perform on contracts; resolution of pending or future litigation; labor matters; and
stock price volatility. Additional information regarding risks and uncertainties and other factors that could cause actual results
to differ materially from those contemplated in forward-looking statements is included from time to time in our filings with the
Securities and Exchange Commission ("SEC"), including under the heading "Risk Factors" in this Annual Report on Form 10-
K. Forward-looking statements speak only as of the date they are made and, except for our ongoing obligations under the U.S.
federal securities laws, we undertake no obligation to publicly update any forward-looking statements whether as a result of
new information, future events or otherwise.
You should also note that this Annual Report on Form 10-K contains various references to industry market data and
certain industry forecasts. The industry market data and industry forecasts were obtained from publicly available information
and industry publications. Industry publications generally state that the information contained therein has been obtained from
sources believed to be reliable, but that the accuracy and completeness of that information is not guaranteed. Similarly, industry
forecasts, while we believe them to be accurate, are not independently verified by us and we do not make any representation as
to the accuracy of that information. In general, we believe there is less publicly available information concerning the
international lottery industry than the lottery industry in the U.S.
ITEM 1. BUSINESS
Unless otherwise specified or the context otherwise indicates, all references to the words "Scientific Games," "we," "us,"
"our," and the "Company" refer to Scientific Games Corporation and its consolidated entities. "SGI" refers to Scientific Games
International, Inc., a wholly owned subsidiary of Scientific Games Corporation. "U.S. jurisdictions" refer to the 50 states in the
U.S. plus the District of Columbia and Puerto Rico. "International" refers to non-U.S. jurisdictions. "Online lottery" refers to a
computerized system in which lottery terminals in retail outlets are continuously connected to a central computer system for the
activation, sale and validation of lottery tickets and related functions. "Wide area gaming" generally refers to a collection of
video lottery and/or other gaming terminals in which the terminals are distributed across a large number of venues, with
relatively few terminals per venue. "Gross win" generally refers to amounts bet less player winnings.
Scientific Games Corporation was incorporated in the state of Delaware on July 2, 1984. We are a global leader in
providing customized, end-to-end gaming solutions to lottery and gaming organizations worldwide. Our integrated products
and services include instant lottery games, lottery gaming systems, terminals and related services, and internet applications, as
well as server-based gaming machines and associated gaming control systems. We also gain access to technology and pursue
global expansion through strategic equity investments.
Pending Merger with WMS
On January 30, 2013, we entered into a merger agreement pursuant to which we agreed to acquire WMS Industries Inc.
(“WMS”), a leading supplier of gaming machines and interactive gaming systems and content, for $26.00 in cash per common
share, for a total enterprise value of approximately $1.5 billion. WMS serves the gaming industry in the U.S. and international
4
jurisdictions by designing, manufacturing and marketing games, video and mechanical reel-spinning gaming machines and
video lottery terminals, and by placing leased participation gaming machines in regulated gaming venues. WMS also develops
and markets digital gaming content, products, services and end-to-end solutions that address global online wagering and play-
for-fun social, casual and mobile gaming opportunities. Subject to the approvals of WMS stockholders and gaming regulatory
authorities and other customary closing conditions, the transaction is expected to be completed by the end of 2013. In
connection with the merger agreement, we entered into a commitment letter pursuant to which the lenders party thereto have
agreed to provide the financing necessary to complete the transaction. The merger is not conditioned on our obtaining the
proceeds of any financing, including the financing contemplated by the commitment letter. If completed, we believe the
acquisition will combine two leading companies in the lottery and gaming industries to create a company with the ability to
offer an extensive range of products and services to public and private sector lottery and gaming customers around the world.
For further information regarding this pending acquisition, please see the section entitled "Risks Relating to Our Pending
Merger with WMS" contained in "Risk Factors" in Item 1A of this Annual Report on Form 10-K, the section entitled “Business
Overview—Pending Merger with WMS” contained in "Management's Discussion and Analysis of Financial Condition and
Results of Operations" in Item 7 of this Annual Report on Form 10-K and the full text of the merger agreement, a copy of
which is filed as exhibit 2.1 to our Current Report on Form 8-K filed with the SEC on February 5, 2013.
Industry Overview
Lottery
Lotteries are operated by U.S. and international governmental authorities and their licensees in approximately 180
jurisdictions throughout the world. Currently, 45 U.S. jurisdictions have online draw lotteries and 44 U.S. jurisdictions have
instant ticket lotteries. Governments typically authorize lotteries as a means of generating revenues without imposing additional
taxes. Net lottery proceeds are frequently set aside for public purposes, such as education, aid to the elderly, conservation,
transportation and economic development. Many jurisdictions have come to rely on the proceeds from lottery ticket sales as a
significant source of funding for these programs. Although there are many types of lottery games worldwide, the two principal
categories of products offered by government authorized lotteries are instant tickets and draw games.
An instant ticket lottery is typically played by removing a scratch-off coating from a preprinted ticket to determine
whether it is a winner. Draw lottery games, such as Powerball® and Mega Millions®, are based on a random selection of a
series of numbers, and prizes are generally based on the number of winners who share the prize pool, although set prizes are
also offered. Draw lotteries are generally conducted through a computerized system in which lottery terminals in retail outlets
are continuously connected to a central computer system. Lottery systems may also be used to validate instant lottery tickets to
confirm that a ticket is a winner and prevent duplicate payments. In some jurisdictions, separate instant ticket validation
systems may be installed. Based on industry information, U.S. instant ticket lottery retail sales and U.S. draw lottery retail sales
totaled approximately $36 billion and approximately $25 billion, respectively, during the U.S. lottery industry's 2012 fiscal
year (which generally ended on June 30, 2012). Based on industry information, we estimate that worldwide instant ticket
lottery retail sales and worldwide draw lottery retail sales totaled approximately $71 billion and approximately $191 billion,
respectively, during fiscal year 2011.
During 2011, U.S. lotteries authorized certain changes to the Powerball multi-state draw lottery game, including an
increase in the ticket price to $2, which went into effect on January 15, 2012. The increase in the Powerball ticket price
potentially provides an impetus for growth in draw lottery retail sales. During the year ended December 31, 2012, the industry
experienced the largest Powerball jackpot in history ($587.5 million) and the largest Mega Millions jackpot in history ($656
million).
Lotteries may offer a range of other games. In the U.S., some lotteries offer monitor games such as keno, which is
typically played every four to five minutes in restricted social settings, such as bars, and is usually offered as an extension of
the lottery system. U.S. and international lotteries may also offer video lottery terminals ("VLTs"), which enable players to
wager on games such as poker, blackjack and slot machine-like line games, with the terminals connected to a central
monitoring and control system for security and accounting by the lottery. In the U.S., VLTs are typically offered at horse and
greyhound racetracks, bars, truck stops, nightclubs and similar establishments. Internationally, lotteries may also offer other
forms of gaming such as casino games, bingo and sports wagering.
Wide Area Gaming
Wide area gaming refers to a collection of gaming machines that are distributed across a large number of venues, with
relatively few terminals per venue. This contrasts with casino-type venues, where a large number of gaming machines are
located in a single venue. Wide area gaming may involve commercial gaming operators, such as licensed betting shops in the
U.K., or gaming operators affiliated with governments such as lotteries.
5
Wide area gaming encompasses a number of technology elements including server-based gaming terminals and other
gaming devices that are often part of a network. Server-based technologies provide for a quick and easy refresh of game
content on gaming machines in the field from a central location. In the wide area gaming industry, we offer operators an
integrated product offering comprised of server-based gaming machines, systems and content.
Operational Overview
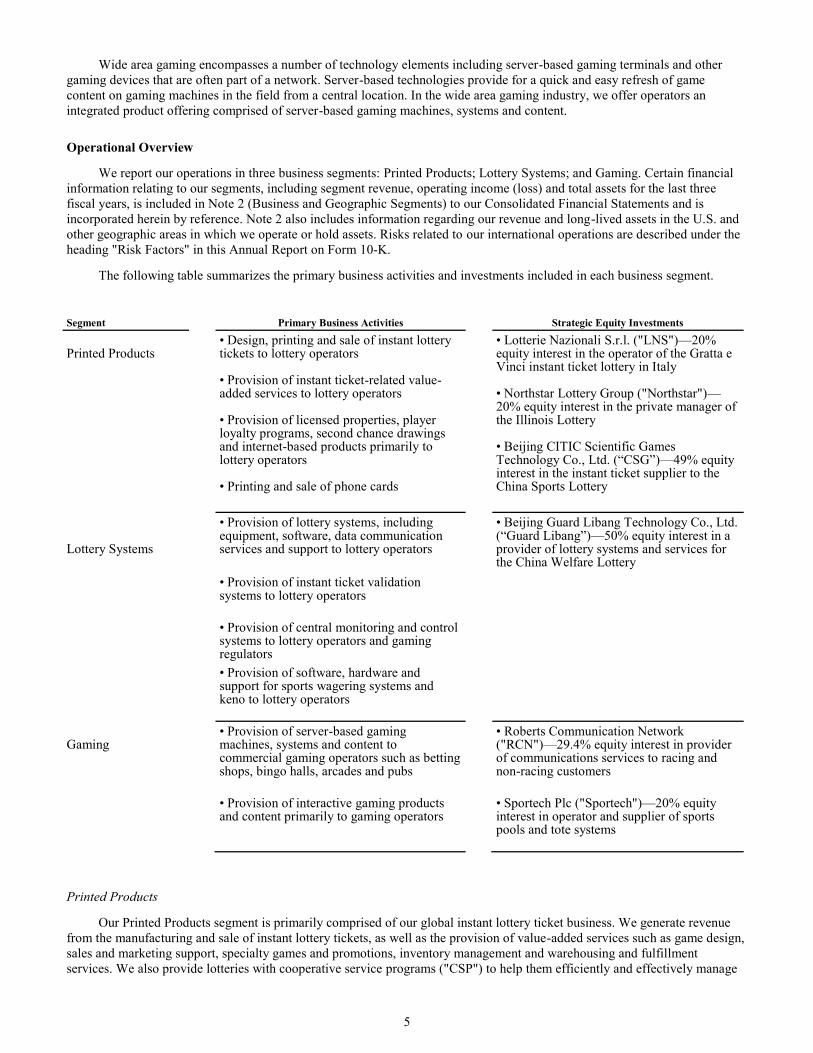
We report our operations in three business segments: Printed Products; Lottery Systems; and Gaming. Certain financial
information relating to our segments, including segment revenue, operating income (loss) and total assets for the last three
fiscal years, is included in Note 2 (Business and Geographic Segments) to our Consolidated Financial Statements and is
incorporated herein by reference. Note 2 also includes information regarding our revenue and long-lived assets in the U.S. and
other geographic areas in which we operate or hold assets. Risks related to our international operations are described under the
heading "Risk Factors" in this Annual Report on Form 10-K.
The following table summarizes the primary business activities and investments included in each business segment.
Segment Primary Business Activities Strategic Equity Investments
Printed Products
• Design, printing and sale of instant lottery tickets to lottery operators • Provision of instant ticket-related value- added services to lottery operators • Provision of licensed properties, player loyalty programs, second chance drawings and internet-based products primarily to lottery operators • Printing and sale of phone cards
• Lotterie Nazionali S.r.l. ("LNS")—20% equity interest in the operator of the Gratta e Vinci instant ticket lottery in Italy • Northstar Lottery Group ("Northstar")—20% equity interest in the private manager of the Illinois Lottery • Beijing CITIC Scientific Games Technology Co., Ltd. (“CSG”)—49% equity interest in the instant ticket supplier to the China Sports Lottery
Lottery Systems
• Provision of lottery systems, including equipment, software, data communication services and support to lottery operators
• Beijing Guard Libang Technology Co., Ltd. (“Guard Libang”)—50% equity interest in a provider of lottery systems and services for the China Welfare Lottery
• Provision of instant ticket validation systems to lottery operators
• Provision of central monitoring and control systems to lottery operators and gaming regulators
• Provision of software, hardware and support for sports wagering systems and keno to lottery operators
Gaming
• Provision of server-based gaming machines, systems and content to commercial gaming operators such as betting shops, bingo halls, arcades and pubs
• Roberts Communication Network ("RCN")—29.4% equity interest in provider of communications services to racing and non-racing customers
• Provision of interactive gaming products and content primarily to gaming operators
• Sportech Plc ("Sportech")—20% equity interest in operator and supplier of sports pools and tote systems
Printed Products
Our Printed Products segment is primarily comprised of our global instant lottery ticket business. We generate revenue
from the manufacturing and sale of instant lottery tickets, as well as the provision of value-added services such as game design,
sales and marketing support, specialty games and promotions, inventory management and warehousing and fulfillment
services. We also provide lotteries with cooperative service programs ("CSP") to help them efficiently and effectively manage
6
and support their operations to achieve higher retail sales and lower operating costs. Moreover, we provide licensed games,
promotional entertainment and internet-based services to the lottery industry.
In 1974, we introduced the first secure instant lottery game ticket. We believe we are the leading designer, manufacturer
and distributor of instant lottery tickets in the world. We market instant lottery tickets and related services to U.S. and
international lotteries and commercial (non-lottery) customers. We supply instant lottery tickets to 40 of the 44 U.S.
jurisdictions that sell instant lottery tickets. In addition, we have sold instant lottery tickets to customers in approximately 50
countries. Our U.S. instant lottery ticket contracts typically have an initial term of three to five years and frequently include
multiple renewal options for additional periods ranging from one to five years, which our customers have generally exercised in
the past. We typically sell our instant lottery tickets for a price per thousand units ("PPK") or for a fee equal to a percentage of
the retail sales of the instant lottery tickets sold ("POS"). Some international customers purchase instant lottery tickets as
needed rather than through multi-game supply contracts.
We pioneered the concept of providing lotteries with customized CSPs to provide lotteries with fully integrated instant
ticket product management in which we help manage a lottery's instant ticket program as a means to increase profits of the
lottery. Our CSP contracts bundle the design and manufacturing of instant lottery tickets, instant game management systems
and marketing services and can include the design and installation of game management software, inventory and distribution,
sales, accounting, training and advisory services, marketing and research, and retailer training and recruitment. Under our CSP
contracts, we are typically paid on a POS basis.
We operate five instant lottery ticket printing facilities across four continents (including the facility owned by our joint
venture in China, CSG) with an aggregate capacity to print approximately 44 billion 2" by 4" equivalent standard instant lottery
tickets annually. The instant lottery tickets we manufacture are typically printed on recyclable ticket stock by a series of
computer-controlled presses and ink-jet imagers, which we believe incorporate the most advanced technology and security in
the industry. Instant lottery tickets generally range in size from 2" by 3" to as large as 8" by 12". Instant lottery tickets are
normally played by removing a scratch-off coating to determine if they are winning tickets.
Technology and security requirements necessary to manufacture and service instant lottery tickets continue to separate
our business from conventional forms of printing. We believe we are generally recognized within the lottery industry as the
leader in applying computer-based technologies to the manufacturing and sale of instant lottery tickets. In order to maintain our
position as a leading innovator within the lottery industry, we intend to continue to research and develop new technologies and
their applications to instant lottery tickets and systems.
We provide lotteries with access to some of the world's most popular entertainment brands on lottery products, which we
believe helps increase our customers' instant ticket sales. Our licensed entertainment brands include Harley-Davidson®, Major
League Baseball®, Monopoly™, National Basketball Association®, The Price is Right®, Wheel-of-Fortune® and World
Poker Tour®. We also provide branded merchandise prizes, advertising, promotional support, turnkey drawing management
services and prize fulfillment programs. In addition, we offer lotteries an interactive platform called Properties Plus®, which
features players clubs, reward programs, second chance promotional websites, interactive games and, where permitted by law,
a subscription system that enables players to purchase lottery games securely over the internet.
LNS. We are a 20% equity owner in LNS, an entity comprised principally of us, Lottomatica Group S.p.A.
("Lottomatica") and Arianna 2001, a company owned by the Federation of Italian Tobacconists, that was awarded the
concession from the Italian Monopoli di Stato to be the exclusive operator of the Italian Gratta e Vinci instant ticket lottery
beginning on October 1, 2010. The concession has an initial term of nine years (subject to a performance evaluation during the
fifth year) and could be extended by the Monopoli di Stato for an additional nine years. We are the primary supplier of instant
lottery tickets for LNS and, under our supply contract with LNS, we expect to provide no less than 80% of LNS' total instant
tickets.
Northstar. We are a 20% equity owner in Northstar, an entity formed with GTECH Corporation ("GTECH"), a
subsidiary of Lottomatica, to be the private manager for the Illinois lottery. Northstar was selected as the private manager
following a competitive procurement and entered into a private management agreement with the State of Illinois on January 18,
2011 (the "PMA") for a 10-year term. Operations under the PMA commenced on July 1, 2011. As the private manager,
Northstar, subject to the oversight of the Illinois lottery, manages the day-to-day operations of the lottery including lottery
game development and portfolio management, retailer recruitment and training, supply of goods and services and overall
marketing strategy. We are the exclusive supplier of instant lottery tickets to Northstar and are responsible for instant ticket
design, development, manufacturing, warehousing and distribution.
CSG. We are a 49% equity owner in CSG, which holds a 15-year contract to supply instant lottery tickets to the China
Sports Lottery (the "CSL"). In connection with the contract, CSG established an instant ticket manufacturing facility that began
producing instant lottery tickets at the end of 2008. The facility has the capacity to print eight billion 2" by 4" equivalent
standard instant ticket units annually. We are also entitled to a royalty fee from CSG for intellectual property rights equal to 1%
of the total gross profits distributed by CSG.
7
Lottery Systems
We are a leading provider of customized computer software, software support, equipment and data communication
services to lotteries. In the U.S., we typically provide the necessary equipment, software and maintenance services pursuant to
long-term contracts that typically have an initial term of at least five years under which we are generally paid a fee equal to a
percentage of the lottery's total retail sales. Our U.S. contracts typically contain multiple renewal options that generally have
been exercised by our customers in the past. Internationally, we typically sell point-of-sale terminals and/or computer software
to lottery authorities and may provide ongoing fee-based systems and software support services.
Our lottery systems use proprietary technology that facilitates high-speed processing of wagers as well as validation of
winning draw and instant lottery tickets. Our lottery systems business includes the supply of proprietary transaction-processing
software, draw lottery games, keno, point-of-sale terminals, central site computers and communication platforms as well as
ongoing operational support and maintenance services. We have contracts to operate online lottery systems for 11 of the 45
U.S. jurisdictions that operate draw lotteries. We believe we are the second largest online lottery provider in the U.S. and a
leading provider in Europe. Internationally, we have lottery systems operating in Argentina, Australia, Canada, China, France,
Germany, Hungary, Iceland, Israel, Italy, Latvia, Mexico, Norway, the Philippines, Spain and Switzerland. We are the
exclusive instant lottery ticket validation network provider to the China Sports Lottery.
In addition, we provide video lottery central monitoring and control systems and networks primarily to lotteries and
gaming regulators. We currently have central monitoring and control systems contracts in Delaware, Illinois, Maine, New
Mexico, South Dakota and West Virginia, as well as in Australia, Canada and Iceland. We also provide software, hardware and
support for sports wagering systems.
Guard Libang. We have a 50% equity ownership interest in Guard Libang, a provider of instant ticket activation and
validation and inventory management systems and services to all of the China Welfare Lottery provincial jurisdictions.
Gaming
We are a leading provider of server-based gaming terminals and systems and other products and services to operators in
the wide area gaming industry. We are a leading supplier of server-based gaming terminals and systems and game content
primarily to bookmakers that operate licensed betting offices ("LBOs") in the U.K. and to gaming operators outside the U.K.
We also supply gaming terminals, systems and game content to pubs, bingo halls and arcades in the U.K. and continental
Europe. We provide many of our Gaming customers with a turnkey offering, which typically includes gaming terminals,
remote management of game content and management information, central computer systems, secure data communication and
field support services. We develop our own game content and supplement our offerings with content from third parties. We
also provide interactive gaming products, services and end-to-end solutions including interactive social, casual and mobile
gaming.
Our LBO contracts generally have initial terms of two to four years, with potential extensions, under which we are
typically paid a fee based on gross win (i.e., amount bet less player winnings) generated by our gaming terminals (subject to
certain adjustments as may be specified in a particular contract, including adjustments for taxes and other fees). We had an
installed base of approximately 21,200 gaming terminals in LBOs as of December 31, 2012.
On September 23, 2011, we completed the acquisition of Barcrest Group Limited ("Barcrest"), a leading supplier of
gaming content, platforms and systems to gaming operators in the U.K. and continental Europe, including pubs, LBOs, bingo
halls and arcades. The acquisition provides us with an expansive library of gaming titles and properties, as well as an existing
base of business in interactive gaming in which Barcrest's game content is made available through internet, mobile and other
interactive channels. In January 2012, following a comprehensive strategic review, we announced our exit from the Barcrest
analog amusement with prize ("AWP") machine business in order to focus our game design and other resources solely on a
digital server-based model in light of prevailing conditions in the pub sector and the declining demand for analog AWP
products. This strategic review also resulted in a decision to reorganize our pub business in an effort to more effectively
capitalize on the Barcrest acquisition. We continue to review strategic alternatives for our pub business. As of December 31,
2012, we had an installed base of approximately 4,800 gaming terminals in our U.K. pub, bingo hall and arcade business.
We continue to seek to expand our server-based gaming terminal business outside the U.K., with current deployments in
the Caribbean, Czech Republic, Mexico and Puerto Rico. As of December 31, 2012, we had an installed base of approximately
5,100 gaming terminals outside of the U.K.
In January 2013, we entered into a merger agreement to acquire WMS. If completed, we expect that the acquisition will
broaden our range of gaming products and services and expand our base of gaming customers throughout the world. For further
information regarding this transaction, see the section above entitled "—Pending Merger with WMS" as well as Note 23
(Subsequent Events) to our Consolidated Financial Statements in this Annual Report on Form 10-K.
8
Roberts Communication Network. We have a 29.4% equity interest in RCN, which provides communications services to
racing and non-racing customers in the U.S.
Sportech. We own approximately 20% of the outstanding shares of Sportech, a U.K. based company with operations
within and outside the U.K. Sportech operates sports pools and associated games through various distribution channels
including direct mail and telephone, agent-based collection and via interactive channels. Sportech also provides wagering
technology solutions to racetracks and off-track wagering networks and also operates a portfolio of internet-based casino,
poker, bingo and fixed-odds games.
Company Strategy
Our goal is to be a global leader in providing technology and games to the regulated lottery and gaming industries. We
seek to maximize our return on invested capital by capitalizing on our competitive strengths. The primary elements of our
strategy are set forth below:
• Grow our Customers' Revenue. A key component of our strategy is to help our customers grow their lottery and
gaming revenue in a responsible manner, and thereby grow our revenue. We operate a significant portion of our
business under participatory business models, where our revenue is based on a percentage of our customers' retail
sales or gross win. While not as directly linked, our revenue from our non-participatory contracts also depends to some
extent on the success of our customers. Therefore, we devote significant resources to developing products and services
to grow our customers' revenue. Because we believe we have a strong track record in assisting our customers enhance
their performance, we work with our customers wherever possible to develop these participatory business models
where their success and ours are closely aligned.
• Focus on Regulated and Government-Sponsored Wide Area Gaming. We serve government-owned and commercial
operators, with our customers operating in regulated and, in many cases, government-sponsored wide area gaming.
Lotteries operate wide area gaming businesses in that the consumer interaction occurs at hundreds or thousands of
points of sale. Similarly, our gaming machines are generally located in venues with a relatively small number of
machines, as distinct from destination gaming centers such as casinos. We believe we are able to provide the unique
blend of skills, assets and secure systems that customers in wide area lottery and gaming businesses require.
• Exploit our Strength in Providing Turnkey Operations. Many of our lottery and wide area gaming customers
expect us to provide turnkey operational services. We consider ourselves adept at managing field operations,
optimizing performance and minimizing operational costs. Our field management experience includes
technical support, field repair, spare parts management, inventory management and other capabilities that we
believe confer competitive advantages relative to other gaming companies. We believe we have a particular
strength in managing the entire supply chain of instant lottery tickets through CSP offerings, which we
pioneered.
• Position Ourselves for Internet and Mobile Gaming. Internet and mobile gaming are the ultimate extension
of wide area gaming and are areas of focus for us. We believe that internet and mobile gaming has significant
growth potential, particularly as many jurisdictions outside of the U.S. move to authorize and regulate these
businesses. We also believe that our lottery customers in the U.S. are well positioned for growth in interactive
gaming. The sale of lottery products over the internet, often referred to as iLottery products, may lead to an
expanded base of players and increased lottery revenue, and several states have begun to sell or authorize the
sale of such iLottery products. We continue to focus on the growth, development and operational execution
of our worldwide interactive gaming initiatives.
• Focus on Security and Compliance. Our government-sponsored or regulated lottery and wide area gaming
customers demand a high level of security and integrity in their gaming operations. We believe we have
extensive safeguards in our systems, business and compliance processes that maximize the security of our
lottery and gaming offerings. We believe these safeguards provide us with a competitive advantage.
• Pursue Growth Opportunities in Underpenetrated Geographies. We believe we have opportunities to expand our
business by offering our lottery and gaming products and services to customers in both new and underpenetrated
geographies. For example:
• We believe that instant lottery tickets currently comprise less than 20% of lottery sales outside of the U.S.
compared to almost 60% in the U.S. We are especially focused on increasing our instant lottery ticket
business in Asia, South/Latin America and Eastern/Central Europe. In 2012, a consortium in which we own a
16.5% equity interest was provisionally awarded a 12-year concession for the exclusive rights to the
9
production, operation and management of instant ticket lotteries in Greece, subject to various regulatory
approvals, including Greek parliamentary approval. Pursuant to our agreement with the consortium, we
expect to serve as the exclusive supplier of instant tickets over the term of the concession.
• In China, despite a recent decline in our instant ticket validation revenue and our joint venture's instant ticket
printing revenue, we continue to believe there is sustained consumer demand for lottery products, as retail
sales of the overall lottery segment grew by 18% in 2012. We remain focused on improving sales trends by
expanding the lottery retailer network and increasing our involvement in the game selection process.
• We are increasingly focused on growing our gaming business outside the U.K. and view North America,
Latin America, Europe, Asia and the Caribbean as areas of potential growth. In conjunction with this effort,
we are actively pursuing opportunities in North American jurisdictions that are seeking to expand into
licensed video gaming or replace their existing video gaming systems. In 2012, we began selling our
ULTRATM
multi-game video gaming terminal, a new, innovative product that leverages the significant
experience we have developed in our lottery and Gaming businesses, and provides us with entry into the
North American machine business.
• Further Develop our Capabilities. We continually seek to expand and invest in marketing and technology
capabilities.
• Gaming Content and Brands. We have extensive game development experience and capabilities. We
believe that we have extensive knowledge of game design and development, a strong staff and a reputation
for producing high-performing games. We seek to leverage these resources and game skills across multiple
distribution channels including physical venues and, where permitted, interactive channels.
We pioneered the branding of lottery games. We believe we have an advantage over our competitors in the
size and depth of our brand licenses for the lottery industry and that our brand strategy can be applied more
broadly to interactive gaming.
• Technology. We seek to develop leading technology in lottery and video gaming. We believe our next
generation lottery system that we have deployed in Europe is the most technologically advanced and feature-
rich lottery system in the industry. We believe that we also have interactive gaming development capabilities,
which we will seek to capitalize on as opportunities emerge. For instance, we have built several
comprehensive internet lottery systems in Europe that were among the first of their kind. We have also
developed hundreds of second chance websites, an internet lottery subscription system and over 100
interactive games for our customers.
• Pursue and Complete Strategic Acquisitions. In support of the foregoing strategies, we may engage in strategic
acquisitions to help us achieve our goals. Given our global footprint, we believe we have access to opportunities to
acquire assets or businesses and to leverage acquired products and technologies in other geographies where we have a
presence. This strategy is consistent with our belief that lottery and gaming organizations will increasingly look to
single source suppliers to provide a comprehensive offering of products and services. In connection with this strategy,
we completed the following acquisitions in 2012:
• Substantially all of the assets of Parspro.com ehf (“Parspro”), a leading supplier of sports betting solutions in
Europe. We anticipate that sports betting will increasingly become an additional revenue source for lotteries
in Europe, Asia and Latin America.
• SG Provoloto, S. de R.L. de C.V. (“Provoloto”), a company that distributes and develops instant lottery
tickets and manages instant lotteries for charities in Mexico. We believe we can expand the charity lottery
operator model to other countries in Latin America and elsewhere.
• ADS/Technology and Gaming (“ADS”), a leading third party field-based service and installation specialist in
the U.K. that services many of the betting shops, pubs, arcades and bingo clubs. The addition of ADS
expands the services and products provided by our Gaming business and leverages its cost structure.
In January 2013, we entered into a merger agreement to acquire WMS, a leading supplier of gaming machines and
interactive gaming systems and content. If completed, we believe the acquisition will combine two leading companies in the
lottery and gaming industries to create a company with the ability to offer an extensive range of products and services to public
and private sector lottery and gaming customers around the world. For more information on this pending acquisition, please see
the section entitled "Business Overview—Pending Merger with WMS" contained in "Management's Discussion and Analysis
of Financial Condition and Results of Operations" in Item 7 of this Annual Report on Form 10-K.
10
Contract Procurement
Lottery
Government authorized lotteries in the U.S. typically operate under state-mandated public procurement regulations.
See the "Government Regulation" section in Part I, Item I of this Annual Report on Form 10-K. Lotteries select an instant ticket
or online supplier by issuing a request for proposal ("RFP"), which generally outlines the products and services to be delivered
and related contractual obligations. An evaluation committee frequently comprised of key lottery staff typically evaluates
responses based on various criteria. These criteria usually include quality of product and/or technical solutions, security plan
and features, experience in the industry, quality of personnel and services to be delivered, and price. We believe that our
product functionality and game content, the quality of our personnel, our technical expertise and our demonstrated ability to
help the lotteries increase their revenues may give us an advantage relative to the competition when responding to lottery RFPs
in the U.S. However, many lotteries still award the contract to the qualified vendor offering the lowest price, regardless of these
other factors. Contract awards by lottery authorities are sometimes challenged by unsuccessful competitors, which can result in
protracted legal proceedings. Internationally, lottery authorities do not always utilize such a formal bidding process, but rather
engage in bilateral negotiations with one or more potential vendors.
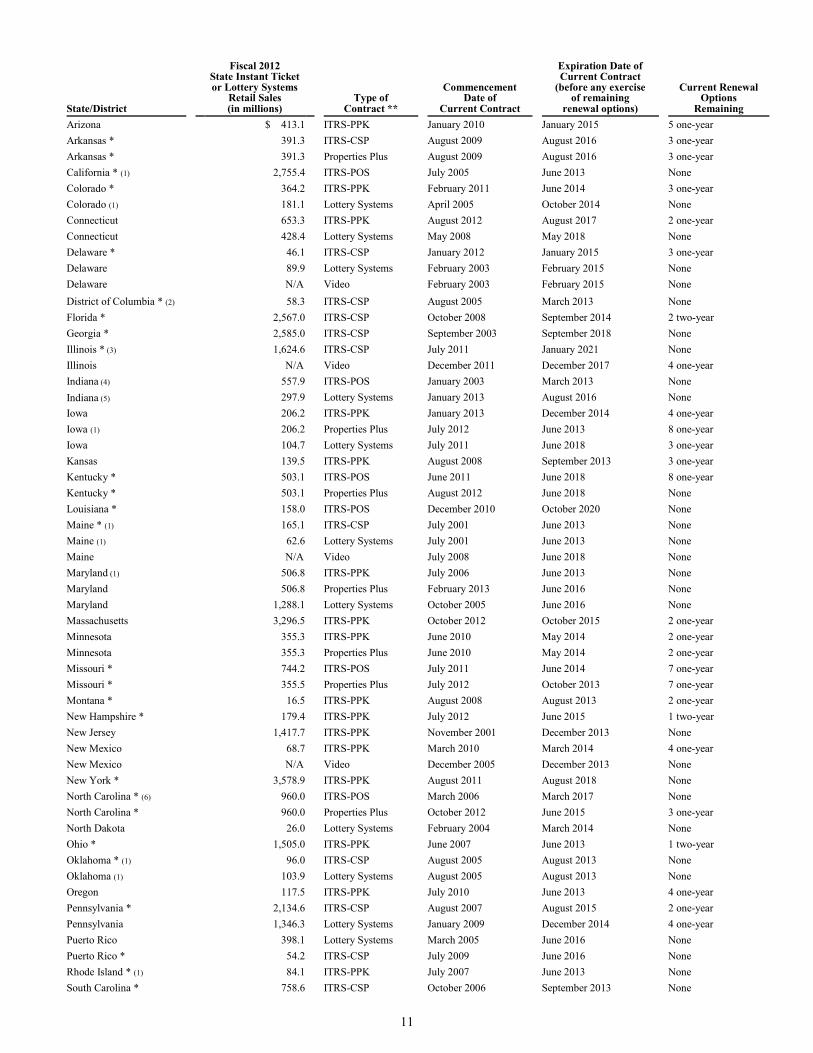
U.S. Jurisdictions
The table below lists our lottery and video-related contracts in the U.S. and certain related information as of the date of
this Annual Report on Form 10-K. The U.S. lottery industry's 2012 fiscal year generally ended on June 30, 2012. We are the
exclusive provider of systems in all lottery and video systems contracts and the primary supplier of instant lottery tickets where
noted below. The commencement date of the contract is the date we began generating revenues under such contract, which for
our lottery and video systems contracts is typically the start-up date. The table also includes instant ticket or draw game retail
sales, as applicable, for each jurisdiction.
11
State/District
Fiscal 2012 State Instant Ticket or Lottery Systems
Retail Sales (in millions)
Type of Contract **
Commencement Date of
Current Contract
Expiration Date of Current Contract
(before any exercise of remaining
renewal options)
Current Renewal Options
Remaining
Arizona $ 413.1 ITRS-PPK January 2010 January 2015 5 one-year
Arkansas * 391.3 ITRS-CSP August 2009 August 2016 3 one-year
Arkansas * 391.3 Properties Plus August 2009 August 2016 3 one-year
California * (1) 2,755.4 ITRS-POS July 2005 June 2013 None
Colorado * 364.2 ITRS-PPK February 2011 June 2014 3 one-year
Colorado (1) 181.1 Lottery Systems April 2005 October 2014 None
Connecticut 653.3 ITRS-PPK August 2012 August 2017 2 one-year
Connecticut 428.4 Lottery Systems May 2008 May 2018 None
Delaware * 46.1 ITRS-CSP January 2012 January 2015 3 one-year
Delaware 89.9 Lottery Systems February 2003 February 2015 None
Delaware N/A Video February 2003 February 2015 None
District of Columbia * (2) 58.3 ITRS-CSP August 2005 March 2013 None
Florida * 2,567.0 ITRS-CSP October 2008 September 2014 2 two-year
Georgia * 2,585.0 ITRS-CSP September 2003 September 2018 None
Illinois * (3) 1,624.6 ITRS-CSP July 2011 January 2021 None
Illinois N/A Video December 2011 December 2017 4 one-year
Indiana (4) 557.9 ITRS-POS January 2003 March 2013 None
Indiana (5) 297.9 Lottery Systems January 2013 August 2016 None
Iowa 206.2 ITRS-PPK January 2013 December 2014 4 one-year
Iowa (1) 206.2 Properties Plus July 2012 June 2013 8 one-year
Iowa 104.7 Lottery Systems July 2011 June 2018 3 one-year
Kansas 139.5 ITRS-PPK August 2008 September 2013 3 one-year
Kentucky * 503.1 ITRS-POS June 2011 June 2018 8 one-year
Kentucky * 503.1 Properties Plus August 2012 June 2018 None
Louisiana * 158.0 ITRS-POS December 2010 October 2020 None
Maine * (1) 165.1 ITRS-CSP July 2001 June 2013 None
Maine (1) 62.6 Lottery Systems July 2001 June 2013 None
Maine N/A Video July 2008 June 2018 None
Maryland (1) 506.8 ITRS-PPK July 2006 June 2013 None
Maryland 506.8 Properties Plus February 2013 June 2016 None
Maryland 1,288.1 Lottery Systems October 2005 June 2016 None
Massachusetts 3,296.5 ITRS-PPK October 2012 October 2015 2 one-year
Minnesota 355.3 ITRS-PPK June 2010 May 2014 2 one-year
Minnesota 355.3 Properties Plus June 2010 May 2014 2 one-year
Missouri * 744.2 ITRS-POS July 2011 June 2014 7 one-year
Missouri * 355.5 Properties Plus July 2012 October 2013 7 one-year
Montana * 16.5 ITRS-PPK August 2008 August 2013 2 one-year
New Hampshire * 179.4 ITRS-PPK July 2012 June 2015 1 two-year
New Jersey 1,417.7 ITRS-PPK November 2001 December 2013 None
New Mexico 68.7 ITRS-PPK March 2010 March 2014 4 one-year
New Mexico N/A Video December 2005 December 2013 None
New York * 3,578.9 ITRS-PPK August 2011 August 2018 None
North Carolina * (6) 960.0 ITRS-POS March 2006 March 2017 None
North Carolina * 960.0 Properties Plus October 2012 June 2015 3 one-year
North Dakota 26.0 Lottery Systems February 2004 March 2014 None
Ohio * 1,505.0 ITRS-PPK June 2007 June 2013 1 two-year
Oklahoma * (1) 96.0 ITRS-CSP August 2005 August 2013 None
Oklahoma (1) 103.9 Lottery Systems August 2005 August 2013 None
Oregon 117.5 ITRS-PPK July 2010 June 2013 4 one-year
Pennsylvania * 2,134.6 ITRS-CSP August 2007 August 2015 2 one-year
Pennsylvania 1,346.3 Lottery Systems January 2009 December 2014 4 one-year
Puerto Rico 398.1 Lottery Systems March 2005 June 2016 None
Puerto Rico * 54.2 ITRS-CSP July 2009 June 2016 None
Rhode Island * (1) 84.1 ITRS-PPK July 2007 June 2013 None
South Carolina * 758.6 ITRS-CSP October 2006 September 2013 None
12
South Dakota * 24.5 ITRS-PPK August 2010 August 2016 None
South Dakota N/A Video December 2009 December 2019 5 one-year
Tennessee * 1,049.6 ITRS-CSP January 2004 April 2015 None
Tennessee * 1,049.6 Properties Plus February 2012 April 2015 None
Texas 3,074.8 ITRS-PPK September 2012 August 2018 2 three-year
Vermont * 74.6 ITRS-PPK January 2010 January 2014 None
Virginia * 842.1 ITRS-CSP June 2004 June 2014 None
Washington * 318.1 ITRS-POS March 2006 March 2014 None
West Virginia N/A Video February 2006 January 2014 2 one-year
Wisconsin 322.2 ITRS-PPK November 2009 October 2013 1 one-year
_______________________
* We are the primary supplier (i.e., provide more than 50% of the instant tickets to the lottery).
** "ITRS" refers to a contract for the supply of instant tickets and related services. "Lottery Systems" refers to a lottery system (and related services) contract. "PPK" refers to an ITRS contract under which we are paid for instant tickets on a price-per-thousand-units basis. "POS" refers to an ITRS
contract under which we are paid based on a percentage of retail sales. "CSP" refers to an ITRS contract that includes CSP services under which we are
paid on a POS basis. "Properties Plus" refers to a contract under which we provide our Properties Plus platform and are paid on a POS basis. "Video" refers to a video lottery central monitoring and control systems contract.
(1) An RFP has been issued by the lottery and is pending as of the date hereof. (2) We believe we will be granted a contract extension through August 20, 2013. (3) Subcontract through Northstar. (4) We expect to enter into an instant ticket contract with GTECH, the private manager of the Indiana lottery, that is expected to commence in April
2013 following the expiration of our current instant ticket contract with Indiana. (5) An agreement with GTECH, the private manager of the Indiana lottery, that is expected to commence in April 2013. We expect that our current
lottery systems contract with Indiana will be terminated in connection with the commencement of the private management model in Indiana. (6) Subcontract through GTECH.
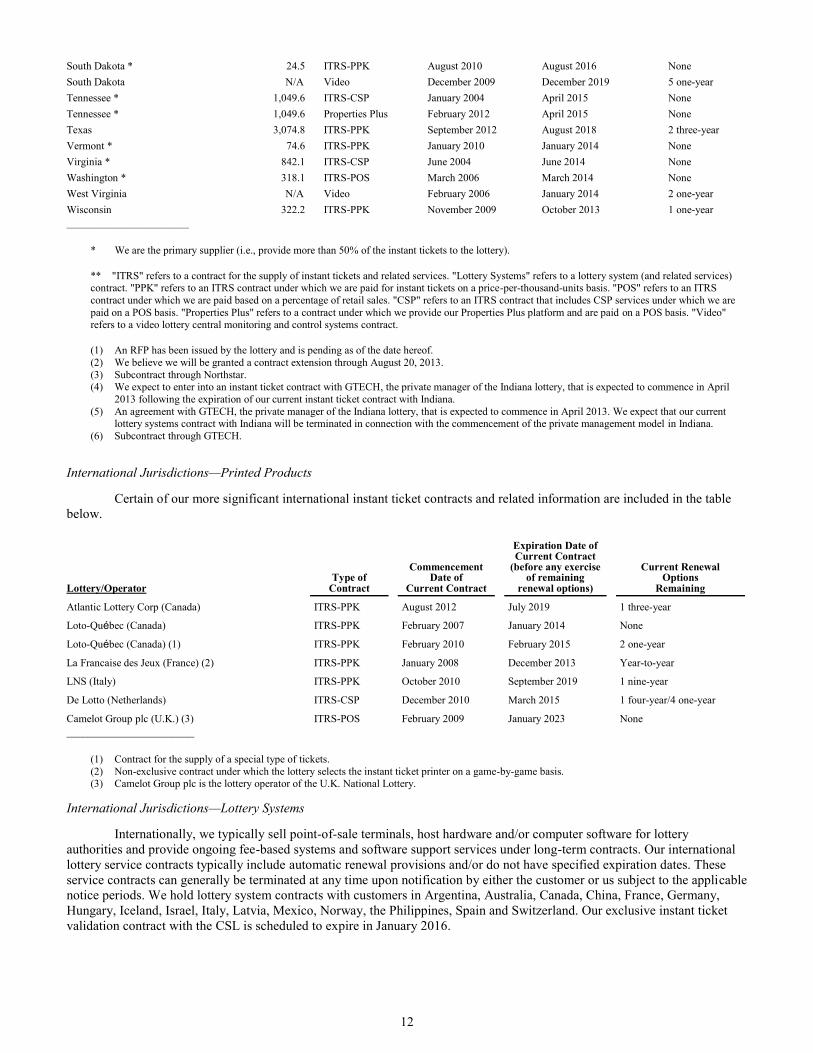
International Jurisdictions—Printed Products
Certain of our more significant international instant ticket contracts and related information are included in the table
below.
Lottery/Operator Type of
Contract
Commencement Date of
Current Contract
Expiration Date of Current Contract
(before any exercise of remaining
renewal options)
Current Renewal Options
Remaining
Atlantic Lottery Corp (Canada) ITRS-PPK August 2012 July 2019 1 three-year
Loto-Québec (Canada) ITRS-PPK February 2007 January 2014 None
Loto-Québec (Canada) (1) ITRS-PPK February 2010 February 2015 2 one-year
La Francaise des Jeux (France) (2) ITRS-PPK January 2008 December 2013 Year-to-year
LNS (Italy) ITRS-PPK October 2010 September 2019 1 nine-year
De Lotto (Netherlands) ITRS-CSP December 2010 March 2015 1 four-year/4 one-year
Camelot Group plc (U.K.) (3) ITRS-POS February 2009 January 2023 None
________________________
(1) Contract for the supply of a special type of tickets. (2) Non-exclusive contract under which the lottery selects the instant ticket printer on a game-by-game basis. (3) Camelot Group plc is the lottery operator of the U.K. National Lottery.
International Jurisdictions—Lottery Systems
Internationally, we typically sell point-of-sale terminals, host hardware and/or computer software for lottery
authorities and provide ongoing fee-based systems and software support services under long-term contracts. Our international
lottery service contracts typically include automatic renewal provisions and/or do not have specified expiration dates. These
service contracts can generally be terminated at any time upon notification by either the customer or us subject to the applicable
notice periods. We hold lottery system contracts with customers in Argentina, Australia, Canada, China, France, Germany,
Hungary, Iceland, Israel, Italy, Latvia, Mexico, Norway, the Philippines, Spain and Switzerland. Our exclusive instant ticket
validation contract with the CSL is scheduled to expire in January 2016.
13
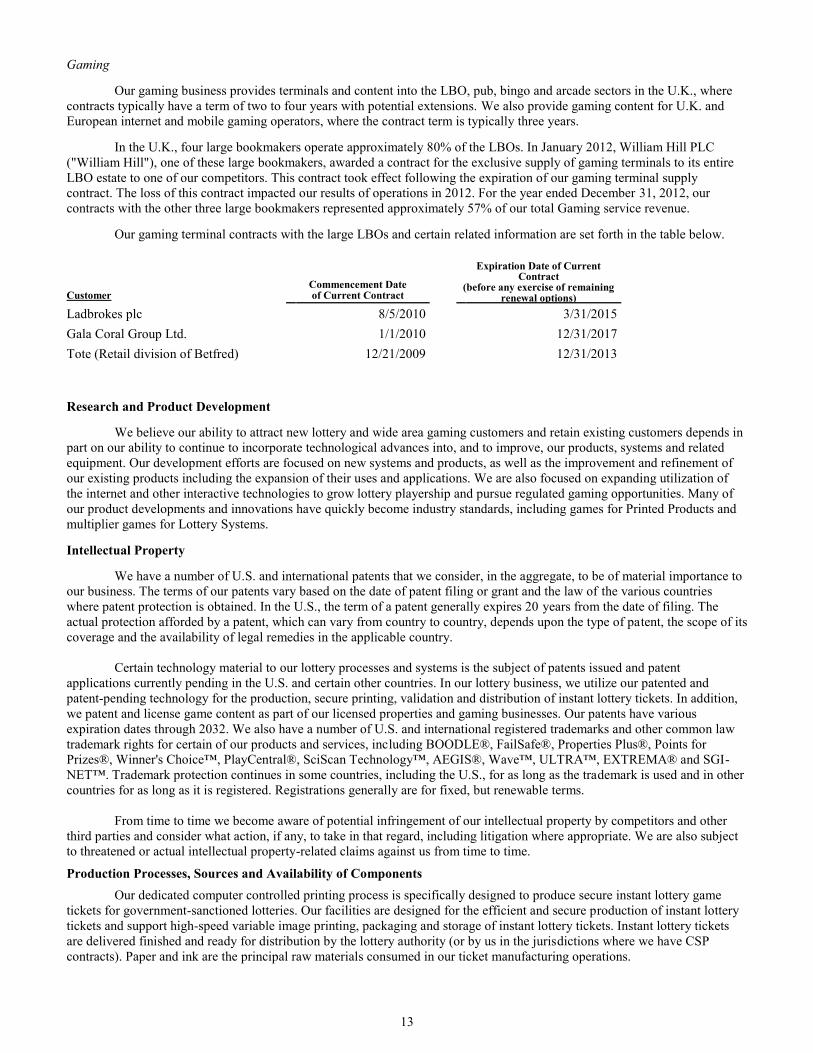
Gaming
Our gaming business provides terminals and content into the LBO, pub, bingo and arcade sectors in the U.K., where
contracts typically have a term of two to four years with potential extensions. We also provide gaming content for U.K. and
European internet and mobile gaming operators, where the contract term is typically three years.
In the U.K., four large bookmakers operate approximately 80% of the LBOs. In January 2012, William Hill PLC
("William Hill"), one of these large bookmakers, awarded a contract for the exclusive supply of gaming terminals to its entire
LBO estate to one of our competitors. This contract took effect following the expiration of our gaming terminal supply
contract. The loss of this contract impacted our results of operations in 2012. For the year ended December 31, 2012, our
contracts with the other three large bookmakers represented approximately 57% of our total Gaming service revenue.
Our gaming terminal contracts with the large LBOs and certain related information are set forth in the table below.
Customer Commencement Date of Current Contract
Expiration Date of Current Contract
(before any exercise of remaining renewal options)
Ladbrokes plc 8/5/2010 3/31/2015
Gala Coral Group Ltd. 1/1/2010 12/31/2017
Tote (Retail division of Betfred) 12/21/2009 12/31/2013
Research and Product Development
We believe our ability to attract new lottery and wide area gaming customers and retain existing customers depends in
part on our ability to continue to incorporate technological advances into, and to improve, our products, systems and related
equipment. Our development efforts are focused on new systems and products, as well as the improvement and refinement of
our existing products including the expansion of their uses and applications. We are also focused on expanding utilization of
the internet and other interactive technologies to grow lottery playership and pursue regulated gaming opportunities. Many of
our product developments and innovations have quickly become industry standards, including games for Printed Products and
multiplier games for Lottery Systems.
Intellectual Property
We have a number of U.S. and international patents that we consider, in the aggregate, to be of material importance to
our business. The terms of our patents vary based on the date of patent filing or grant and the law of the various countries
where patent protection is obtained. In the U.S., the term of a patent generally expires 20 years from the date of filing. The
actual protection afforded by a patent, which can vary from country to country, depends upon the type of patent, the scope of its
coverage and the availability of legal remedies in the applicable country.
Certain technology material to our lottery processes and systems is the subject of patents issued and patent
applications currently pending in the U.S. and certain other countries. In our lottery business, we utilize our patented and
patent-pending technology for the production, secure printing, validation and distribution of instant lottery tickets. In addition,
we patent and license game content as part of our licensed properties and gaming businesses. Our patents have various
expiration dates through 2032. We also have a number of U.S. and international registered trademarks and other common law
trademark rights for certain of our products and services, including BOODLE®, FailSafe®, Properties Plus®, Points for
Prizes®, Winner's Choice™, PlayCentral®, SciScan Technology™, AEGIS®, Wave™, ULTRA™, EXTREMA® and SGI-
NET™. Trademark protection continues in some countries, including the U.S., for as long as the trademark is used and in other
countries for as long as it is registered. Registrations generally are for fixed, but renewable terms.
From time to time we become aware of potential infringement of our intellectual property by competitors and other
third parties and consider what action, if any, to take in that regard, including litigation where appropriate. We are also subject
to threatened or actual intellectual property-related claims against us from time to time.
Production Processes, Sources and Availability of Components
Our dedicated computer controlled printing process is specifically designed to produce secure instant lottery game
tickets for government-sanctioned lotteries. Our facilities are designed for the efficient and secure production of instant lottery
tickets and support high-speed variable image printing, packaging and storage of instant lottery tickets. Instant lottery tickets
are delivered finished and ready for distribution by the lottery authority (or by us in the jurisdictions where we have CSP
contracts). Paper and ink are the principal raw materials consumed in our ticket manufacturing operations.
14
Production of our lottery terminals and gaming machines (and related component products) primarily involves the
assembly of electronic and mechanical components into more complex systems and products. Third-party vendors generally
manufacture and assemble our lottery terminals and gaming machines.
We normally have sufficient lead time between reaching an agreement and the commencement of operations so that
we are able to provide our lottery and gaming customers with a fully functioning system that is customized to meet their
requirements. In the event that current suppliers of control sub-assemblies are no longer available, we believe we would be able
to adapt our application software to run on the then-available hardware in time to meet new contractual obligations, although
the price competitiveness of our products might change. The lead time for obtaining most of the electronic components that we
use is approximately 90 days. We believe that this is consistent with our competitors' lead times and is also consistent with the
needs of our customers.
Seasonality
Our revenue can fluctuate due to seasonality in some components of our business. The summer season historically has
been the weakest part of the year for certain parts of our lottery business, particularly where our revenue is tied to a percentage
of retail sales such as under our CSP contracts. Our Gaming LBO service revenue is typically lower in the first and third
quarters of the year as there is generally a lower volume of players in the LBOs during those quarters.
Our Lottery Systems service revenue can be somewhat dependent on the size of jackpots of lottery games such as
Powerball and Mega Millions during the relevant period. Our licensed properties instant ticket revenue and our sales revenue
can fluctuate due to the non-recurring nature of these revenue streams.
Competition
Printed Products
The instant lottery ticket business is highly competitive and continues to be subject to intense price-based competition.
Our principal instant lottery ticket competitors in the U.S. are Pollard Banknote Limited ("Pollard") and GTECH. Except as
permitted by the applicable provisions of the North American Free Trade Agreement with respect to Canada, it is currently
illegal to import lottery tickets into the U.S. from a foreign country. Our business could be adversely affected should additional
international competitors in Canada export lottery products to the U.S. or should other international competitors establish
printing facilities in the U.S. or Canada to supply the U.S. Internationally, a number of lottery instant ticket vendors compete
with us including the competitors noted above as well as diversified printers in India, China and Latin America. Our principal
competitors in our provision of licensed games, promotional entertainment and loyalty or rewards programs to the lottery
industry include BI Worldwide Ltd., Alchemy3 LLC, ePrize LLC, SapientNitro, a division of Sapient Corp., GTECH, Pollard
and Intralot, S.A. ("Intralot").
Lottery Systems
The lottery and video systems businesses are highly competitive and continue to be subject to intense price-based
competition. Our principal competitors in these businesses are GTECH and Intralot. We also compete with various suppliers of
lottery system components, such as terminals and computer systems, and lottery operators themselves that chose to internally
develop their systems.
As countries liberalize gaming, lotteries may expand their scope by offering sports wagering, gaming machines,
internet gaming or other forms of gaming, which may introduce new suppliers to lotteries resulting in new forms of
competition to us. In some jurisdictions, liberalization includes privatization or the outsourcing of lottery operations to bidders.
We believe companies such as Camelot Group plc, the Tattersalls Group, Lottomatica and Intralot to be among those who may
bid on such opportunities.
Gaming
Our wide area gaming business competes with a variety of suppliers in the U.K. and internationally. Our principal
direct competitor in the U.K. LBO business is Inspired Gaming Group Limited ("Inspired"). In the U.K. AWP and skill with
prize ("SWP") machine business, we compete directly with other suppliers of gaming machines and gaming operators,
including the Bell-Fruit and Gamestec divisions of Astra Games Limited, Sceptre Leisure plc and Games Warehouse Limited, a
division of Merit Industries, Inc. In some jurisdictions, we compete with video lottery and other gaming terminal and systems
suppliers. Our competitors in these industries include International Game Technology ("IGT"), Lottomatica, Bally
Technologies, Inc., Inspired, Aristocrat Leisure Ltd, Novomatic AG, Multimedia Games, Inc., WMS and Konami Digital
Entertainment, Inc. Our primary competitors in the provision of game content include Amaya Gaming Group, Inc., IGT,
Microgaming Software Systems Ltd., Net Entertainment NE AB, NYX Gaming Group, OpenBet Technology Ltd. and Playtech
Limited ("Playtech").
15
Employees
As of December 31, 2012, we employed approximately 3,600 persons. Most of our employees are not represented by
labor unions. However, unions represent the majority of our employees at our printing facilities in Canada, Chile and the U.K.
Government Regulation
General
Lotteries and other forms of gaming are generally subject to extensive and evolving regulation that customarily
includes some form of licensing or regulatory screening of operators, suppliers, manufacturers and distributors and their
applicable parents, affiliates and subsidiaries, as well as their major shareholders, officers, directors and key employees. In
addition, certain of our gaming products and technologies must be certified or approved in certain jurisdictions where we
operate. Regulators review many facets of an applicant or holder of a license, including its financial stability, integrity and
business experience. Any failure to receive a license or the loss of a license that we currently hold could have a material
adverse effect on us or on our results of operations or financial condition.
While we believe that we are in substantial compliance with all material gaming laws and regulatory requirements
applicable to us, there can be no assurance that our activities or the activities of our customers will not become the subject of
any regulatory or law enforcement proceeding or that any such proceeding would not have a material adverse impact on us or
our operations or financial condition.
We have developed and implemented a rigorous internal compliance program in an effort to ensure that we comply
with legal requirements imposed in connection with our lottery and gaming activities, as well as legal requirements generally
applicable to all publicly traded companies. The compliance program is run on a day-to-day basis by our Chief Compliance
Officer with legal advice provided by attorneys in our legal and compliance departments and outside experts. The compliance
program is overseen by the Compliance Committee of our Board of Directors, comprised entirely of non-employee directors.
While we are firmly committed to full compliance with all applicable laws, there can be no assurance that our compliance
program will prevent the violation of one or more laws or regulations, or that a violation by us or an employee will not result in
the imposition of a monetary fine or suspension or revocation of one or more of our licenses.
In the United States, the Unlawful Internet Gambling Enforcement Act of 2006 ("UIGEA") prohibits among other
things, the transmission of any wager, at least in part, by means of the internet where such wager is prohibited by any
applicable law where initiated, received or otherwise made. UIGEA imposes potentially severe criminal and civil sanctions on
the owners and operators of such systems and on financial institutions that process wagering transactions. The law contains a
safe harbor for wagers placed within a single state (disregarding intermediate routing of the transmission) where the method of
placing the bet and receiving the bet is authorized by that state's law, provided the underlying regulations establish appropriate
age and location verification. The Federal Wire Act of 1961 ("The Wire Act") generally prohibits anyone engaged in the
business of betting or wagering from knowingly using a wire communication facility for the transmission in interstate or
foreign commerce of wagers or information assisting in the placing of wagers on any "sporting event or contest." Until
recently, there was uncertainty, in light of prior interpretations and pronouncements of representatives of the U.S. Department
of Justice ("DOJ"), as to whether the Wire Act may prohibit states from conducting in-state lottery transactions via the internet
if the transmissions over the internet during the transaction cross state lines, notwithstanding that UIGEA appears to permit out-
of-state routing of data associated with in-state lottery transactions authorized by that state's law. In late 2011, the Office of
Legal Counsel of the DOJ issued an opinion to the effect that state lottery ticket sales over the internet to in-state adults do not
violate the Wire Act since lotteries do not involve "sporting events or contests" within the meaning of the Wire Act.
In the European Union, various judgments by the Court of Justice of the European Union have addressed the ability of
member states to grant, or to maintain, monopolies for lottery and other gaming providers in the situations addressed by those
judgments. Certain of these judgments have also addressed the power of a member state to limit access by lottery and/or
gaming providers established elsewhere in the European Union.
To varying degrees, a number of the European governments have taken steps to change the regulation of internet
wagering through the implementation of new or revised licensing and taxation regimes, including the possible imposition of
sanctions on unlicensed providers.
While we believe that we have developed the proper procedures and policies to comply with the requirements of these
evolving laws and legal pronouncements, there can be no assurance that our activities or the activities of our customers will not
become the subject of law enforcement proceedings or that any such proceedings would not have a material adverse impact on
us or our business plans.
From time to time, we retain government affairs representatives in various U.S. and international jurisdictions to
advise elected and appointed officials and the public concerning our views on lottery and gaming-related legislation, to monitor
such legislation and to advise us in our relations with lottery and gaming authorities.
16
Lottery Operations
Currently, 45 U.S. jurisdictions, all the Canadian provinces, Mexico, China and many other countries outside the U.S.,
including countries in Europe, authorize lotteries. The operations of lotteries in the U.S. and internationally are subject to
extensive regulation. Although certain features of a lottery, such as the percentage of gross revenues that must be paid back to
players in prize money, are usually set by legislation, the various lottery regulatory authorities generally exercise significant
discretion, including with respect to the determination of the types of games played, the price of each wager, the manner in
which the lottery is marketed and the selection of suppliers of equipment, technology and services and retailers of lottery
products. Furthermore, laws and regulations applicable to lotteries in U.S. and international jurisdictions are subject to change,
and the effect of such changes on our ongoing and potential operations cannot be predicted with certainty.
To ensure the integrity of the contract award and lottery operations, most jurisdictions require detailed background
disclosure on a continuous basis from, and conduct background investigations of, the supplier and its officers, directors,
subsidiaries, affiliates and principal stockholders. Background investigations of the supplier's employees who will be directly
responsible for the operation of the system are also generally conducted, and most states reserve the right to require the removal
of employees who they deem to be unsuitable or whose presence they believe may adversely affect the operational security or
integrity of the lottery. Certain jurisdictions also require extensive personal and financial disclosure and background checks
from persons and entities beneficially owning a specified percentage (typically five percent or more) of a supplier's securities.
The failure of such beneficial owners of our securities to submit to background checks and provide such disclosure could result
in the imposition of penalties upon these beneficial owners and could jeopardize the award of a lottery contract to us or provide
grounds for termination of an existing lottery contract.
The award of lottery contracts and ongoing operations of lotteries in international jurisdictions are also extensively
regulated, although international regulations typically vary from those prevailing in the U.S. Restrictions are frequently
imposed on international corporations seeking to do business in such jurisdictions and, as a consequence, we have in a number
of instances allied ourselves with local companies when seeking international lottery contracts.
Gaming
The manufacture and distribution of gaming machines, games, equipment and related software and services are subject
to regulation and licensing by a variety of federal, state, international, tribal and local authorities, with the majority of the
oversight in the U.S. provided by individual state gaming control boards.
Certain of our gaming products and technologies must be certified or approved by regulatory authorities or private
testing agencies authorized by such gaming authorities in certain jurisdictions where we operate.
Companies that manufacture, sell or distribute VLTs or other gaming machines or provide the central computer
systems that monitor these devices are subject to various provincial, state, county and municipal laws and regulations. The
primary purposes of these rules are to (1) ensure the responsibility, financial stability and character of companies involved and
their officers and directors and stockholders through licensing requirements, (2) ensure the integrity and randomness of the
machines and (3) prohibit the use of machines at unauthorized locations or for the benefit of undesirable individuals or entities.
Sixteen U.S. states authorize wagering on VLTs at state regulated and licensed facilities. Although some states currently
restrict VLTs to already existing wagering facilities (e.g., racetracks), others permit these devices to be placed at venues such as
bars, restaurants, truck stops and other specifically licensed gaming facilities. In addition, all of the Canadian provinces and
various other international jurisdictions have authorized VLTs.
In the U.K., the Gambling Act of 2005 regulates, among other things, the type of licensed gaming activity that is
carried out by operators, the licensing of the various types of venues for the conduct of licensed gaming activities, the
categories and number of gaming machines allowed in each type of venue, the licensing and regulation of the supply and
operation of those machines and the issuance of technical specifications and standards and specific licensing requirements for
each category of gaming machine.
In late 2010, the U.K. government announced its intention to change the taxation of gaming machines by replacing the
currently applicable amusement machine license duty and the value-added tax with a new machine games duty, or MGD, based
on the gross win generated by a gaming machine. In a budget statement issued in March 2012, the U.K. government announced
a standard MGD rate of 20% on gross win, effective February 1, 2013. These tax changes may negatively impact our gaming
machine customers' businesses and, therefore, could impact our business in 2013.
17
Executive Officers of the Company
Certain information regarding each of our executive officers is set forth below.
Name Age Position
A. Lorne Weil 67 Chief Executive Officer and Chairman of the Board
Michael R. Chambrello 55 Chief Executive Officer — Asia-Pacific Region
Jeffrey S. Lipkin 42 Senior Vice President and Chief Financial Officer
James C. Kennedy 56 President of Printed Products and Chief Marketing Officer
William J. Huntley 63 Executive Vice President and Chief Executive Officer, Systems
Stephen Frater 60 Executive Chairman — SG Gaming
Steve W. Beason 51 Enterprise Chief Technology Officer
Jack B. Sarno 40 Vice President — Worldwide Legal Affairs and Corporate Secretary
Larry A. Potts 65 Vice President, Chief Compliance Officer and Director of Security
Jeffrey B. Johnson 48 Vice President Finance, Chief Accounting Officer and Corporate Controller
A. Lorne Weil has been Chairman of the Board of Directors since October 1991. Mr. Weil became Chief Executive
Officer in November 2010, a position he previously held from 1992 to 2008. Mr. Weil also served as President of the Company
from August 1997 to June 2005. Mr. Weil was President of Lorne Weil, Inc., a firm providing strategic planning and corporate
development services to high technology industries, from 1979 to November 1992. Previously, Mr. Weil was Vice President of
Corporate Development at General Instrument Corporation, working with wagering and cable systems. Mr. Weil is a director
of Andina Acquisition Corporation, Avantair, Inc. and Sportech Plc.
Michael R. Chambrello became Chief Executive Officer — Asia-Pacific Region in November 2010 after serving as
Chief Executive Officer since January 2010. From July 2005 to December 2009, Mr. Chambrello was President and Chief
Operating Officer. From November 2000 to June 2005, Mr. Chambrello was President and Chief Executive Officer of
Environmental Systems Products Holdings Inc. ("ESP"), which provides vehicle emissions testing systems and services to
government agencies. Prior to ESP, he was Chief Executive Officer of Transmedia Asia Pacific, Inc. and Transmedia
Europe Inc., which provide membership-based consumer and business services. Mr. Chambrello has 26 years of lottery
industry experience, having served as President of GTECH Corporation and Executive Vice President of GTECH Holdings
Corporation.
Jeffrey S. Lipkin serves as Senior Vice President and Chief Financial Officer of the Company. Mr. Lipkin joined the
Company in April 2009 as Vice President and Chief Financial Officer. Prior to joining the Company, Mr. Lipkin was a
Managing Director at Credit Suisse in the Media & Telecom group within the Investment Banking division. Mr. Lipkin joined
Credit Suisse in September 2003. Prior to Credit Suisse, Mr. Lipkin spent five years in the Investment Banking division at
Merrill Lynch & Co and spent four years in public accounting with Coopers & Lybrand LLP. Mr. Lipkin is a certified public
accountant.
James C. Kennedy became President of Printed Products in January 2013 and has served as Chief Marketing Officer
of the Company since January 2011. Mr. Kennedy is responsible for global lottery product marketing, including in China,
Europe and Latin America. In addition to his marketing responsibilities, he also manages sales, customer service and creative
service for all of the Company's North American lottery businesses. From 2005 to 2011, Mr. Kennedy served as Senior Vice
President of SGI and prior to that, Mr. Kennedy served as Vice President of U.S. Sales for SGI. Prior to joining the Company
in 1985, Mr. Kennedy was a Systems Engineer for Computer Task Group.
William J. Huntley became Executive Vice President and Chief Executive Officer, Systems in January 2013. Prior to
that, he was President of Lottery Systems since January 2011 and Senior Vice President of SGI since February 2011.
18
Mr. Huntley was previously with the Company and its predecessor company for 38 years, including serving as President of
Autotote Lottery Corporation from 1997 to 2000, President of the Systems Division of SGI from 2000 to 2006, and President
of Scientific Games Racing, LLC from 2006 to 2007. Mr. Huntley also served as Vice President of Autotote Systems, Inc.
(which became Scientific Games Racing, LLC) from 1989 to 1997 and as Vice President of Operations of the Company from
1991 to 1994. From February 2009 to December 2010, Mr. Huntley served as a consultant to the Company.
Stephen Frater has served as Executive Chairman — SG Gaming since March 2010. Mr. Frater served as Chairman
and Chief Executive Officer of The Global Draw Limited ("Global Draw") and Games Media Limited ("Games Media") from
July 2008 to March 2010. Mr. Frater joined the Company in 2006 as part of the Company's acquisition of Global Draw, serving
as Managing Director of Global Draw. Mr. Frater has worked in the bookmaking industry for over 30 years. Mr. Frater co-
founded Global Draw in 1997 and was instrumental in the establishment of its gaming business in the U.K. Prior to that,
Mr. Frater co-founded Great Mark, which operated the Admiral Betting chain in the U.K. Prior to co-founding Great Mark and
Global Draw, Mr. Frater worked for both the Mecca and William Hill groups as Head of Customer Relations.
Steve W. Beason has served as Enterprise Chief Technology Officer. He served as Chief Technology Officer from
August 2005 until January 2011 and President, Lottery Systems Group, from November 2006 to November 2010. Prior to
joining the Company, Mr. Beason was Executive Director, Information Technology, of The Hong Kong Jockey Club managing
a staff of nearly 400 information technology professionals.
Jack B. Sarno has served as Vice President — Worldwide Legal Affairs and Corporate Secretary since October 2012.
Mr. Sarno previously served as Vice President and Deputy General Counsel of the Company. Prior to joining the Company in
August 2007, Mr. Sarno was counsel at Skadden, Arps, Slate, Meagher&Flom LLP in New York.
Larry A. Potts has served as Vice President, Chief Compliance Officer and Director of Security since February 2006.
Mr. Potts joined the Company in September 2004 as Vice President, Security and Compliance. Previously, he was the Chief
Operating Officer of an international consulting and investigative company in Washington, D.C. Prior to that, he served as a
Special Agent of the Federal Bureau of Investigation for over 23 years, where he served in a number of management positions,
including Deputy Director.
Jeffrey B. Johnson joined the Company in September 2011 and serves as Vice President of Finance, Chief Accounting
Officer and Corporate Controller. Previously, Mr. Johnson was the Executive Vice President and Chief Financial Officer for
Tensar Corporation, a global engineering services and construction products manufacturing company. Prior to that, he served as
Vice President, Corporate Controller and Chief Accounting Officer for Tempur-Pedic International Inc., a publicly traded
consumer products company. Prior to 1999, Mr. Johnson was a Manager of Audit and Business Advisory Services at
Andersen LLP. Mr. Johnson is a certified public accountant and a certified management accountant.
Access to Public Filings
We file annual reports, quarterly reports, current reports, proxy statements and other documents with the SEC under
the Securities Exchange Act of 1934, as amended. The SEC maintains an internet website that contains reports, proxy and
information statements, and other information regarding issuers, including us, that file electronically with the SEC. The public
can obtain any documents that we file with the SEC at http://www.sec.gov.
We make the following information available free of charge through the Investor Information link (or, in the case of
our code of business conduct, the Corporate Governance link) on our website at www.scientificgames.com:
• our annual reports on Form 10-K, quarterly reports on Form 10-Q, current reports on Form 8-K and amendments to
those reports as soon as reasonably practicable after they are filed electronically with the SEC;
• Section 16 ownership reports filed by our executive officers, directors and 10% stockholders on Forms 3, 4 and 5 and
amendments to those reports as soon as reasonably practicable after they are filed electronically with the SEC; and
• our code of business conduct, which applies to all of our officers, directors and employees.
19
ITEM 1A. RISK FACTORS
Risks Relating to our Business and Industry
We operate in highly competitive industries and our success depends on our ability to effectively compete with numerous
domestic and foreign businesses.
We face competition from a number of domestic and foreign businesses, some of which have substantially greater
financial resources than we do, which impacts our ability to win new contracts and renew existing contracts. We continue to
operate in a period of intense price-based competition, which has affected and could continue to affect the number and the
profitability of the contracts we win.
Contract awards by lottery authorities are sometimes challenged by unsuccessful bidders, which can result in costly
and protracted legal proceedings that can result in delayed implementation or cancellation of the award. In addition, the U.S.
lottery industry has matured such that the number of states conducting lotteries is unlikely to increase materially in the near-
term.
We believe our principal competitors in the instant ticket lottery business have increased their production capacity,
which is expected to increase pricing pressures in the instant ticket business and adversely affect our ability to win or renew
instant ticket contracts or reduce the profitability of instant ticket contracts that we do win. Our U.S. instant ticket business
could also be adversely affected should additional foreign competitors in Canada export their lottery products to the U.S. or
should other foreign competitors establish printing facilities in the U.S. or Canada to supply the U.S. We also compete in the
international instant ticket lottery business with low-price, low-quality printers in a regulated environment where laws are
being reinterpreted so as to create competition from non-traditional lottery vendors and products.
We face increased price competition in our lottery systems business from our two principal competitors. Since late
2007, we have lost lottery systems contracts in South Carolina, West Virginia, South Dakota, New Hampshire and Vermont to
our competitors following the expiration of our contracts. During 2010, the lottery authority in Maine awarded a new lottery
contract to one of our competitors, which award was subsequently invalidated as a result of our protest. The competitor's
appeal of the protest ruling was denied on October 21, 2011. Our contract with Maine was extended until June 30, 2013.
As some jurisdictions seek to privatize or outsource lottery operations (including partial privatizations through private
management agreements or otherwise), we face competition from both traditional and new competitors with respect to these
opportunities. In some cases, we may find it necessary or desirable to enter into strategic relationships with third parties,
including competitors, to pursue these opportunities. The Indiana lottery recently awarded a private management agreement to
one of our competitors. We expect that our lottery systems contract with the Indiana lottery will be terminated in connection
with the commencement of the private management model in Indiana. On January 11, 2013, we entered into an agreement with
the manager of the Indiana lottery to provide existing lottery systems equipment and services through August 2016, which
agreement is expected to commence in April 2013.
Pricing pressures and privatization of some lotteries may also change the manner in which lottery system and instant
ticket contracts are awarded and the profitability of those contracts. Any future success of our lottery business will also depend,
in part, on the success of the lottery industry in attracting and retaining players in the face of increased competition for these
players' entertainment dollars, as well as our own success in developing innovative products and systems to achieve this goal.
Our failure to achieve this goal could reduce our revenue from our lottery operations. As a result of pressure on state and other
government budgets, other forms of gaming may be legalized, which could adversely impact our business.
Our gaming-related businesses face significant competition from other vendors. For example, in January 2012,
William Hill awarded a contract for the exclusive supply of gaming terminals to the bookmaker's entire LBO estate to one of
our principal competitors. This contract took effect following the expiration of our gaming terminal supply contract with
William Hill in March 2012. The loss of this contract impacted our results of operations in 2012.
We face significant competition as we seek to offer products and services for the evolving internet lottery and gaming
industries, not only from our traditional competitors in the lottery business but also from a number of other domestic and
foreign providers (or the operators themselves), some of which have substantially greater financial resources and/or experience
in this area than we do. In addition, our gaming-related businesses face competition from illegal operators.
Unfavorable U.S. and international economic conditions may adversely affect our business and financial condition.
Unfavorable general economic conditions, including relatively high rates of unemployment, have had, and may
continue to have, a negative effect on our business and results of operations.
20
We cannot fully predict the effects that unfavorable economic conditions and economic uncertainty will have on us as
it also impacts our customers, suppliers and business partners. However, we believe that the difficult economic conditions have
contributed to reductions in spending on marketing by our customers and, in certain instances, less favorable terms under our
contracts, as many of our customers face significant budget shortfalls and look to cut costs.
We believe that the lottery and wide area gaming businesses are less susceptible to reductions in consumer spending
than the destination gaming business (e.g., resort and casino venues, which are typically less accessible to consumers than
lottery and wide area gaming retail outlets) and other parts of the consumer products sector. However, we believe that declines
in consumer spending have adversely impacted our lottery and wide area gaming businesses to some extent, and further
declines would likely exacerbate these negative effects.
There are ongoing concerns regarding the debt burden of certain countries, particularly in the European Union, and
their ability to meet their future financial obligations, which have resulted in downgrades of the debt ratings for these countries.
These sovereign debt concerns, whether real or perceived, could result in a recession, prolonged economic slowdown, or
otherwise negatively impact the general health and stability of the economies in these countries or more broadly. In more
severe cases, this could result in a limitation on the availability of capital, thereby restricting our liquidity and negatively
impacting our operating results. We currently operate in, and our growth strategy may involve pursuing expansion or business
opportunities in, certain countries potentially facing real or perceived sovereign debt concerns, such as Italy and Greece.
Our business is subject to evolving technology.
The sales of all of our products and services are affected by changing technology, new legislation and evolving
industry standards. Our ability to anticipate or respond to such changes and to develop and introduce new and enhanced
products and services on a timely basis will be a significant factor in our ability to remain competitive, retain existing contracts,
and expand and attract new customers.
We can give no assurance that we will achieve the necessary technological advances or have the financial resources
needed to introduce new products or services on a timely basis or that we will otherwise have the ability to compete effectively
in the industries we serve.
We may not be able to capitalize on the expansion of internet or other forms of interactive gaming or other trends and
changes in the lottery and gaming industries.
Part of our strategy is to take advantage of the liberalization of internet and mobile gaming, both within the U.S. and
internationally. This strategy involves significant risks and uncertainties, including legal, business and financial risks.
In general, our ability to successfully pursue our interactive gaming strategy depends on the laws and regulations
relating to wagering over the internet and through interactive channels. Until recently, there was uncertainty as to whether the
Wire Act prohibits states from conducting intrastate lottery transactions via the internet if the transmissions over the internet
during the transaction cross state lines. In late 2011, the Office of Legal Counsel of the DOJ issued an opinion to the effect that
state lottery ticket sales over the internet to in-state adults do not violate the Wire Act. The opinion may provide an impetus for
states to authorize internet or other forms of interactive gaming in order to create an additional revenue stream. However, as a
general matter, we believe states will be required or otherwise deem it advisable to enact enabling legislation or new
regulations addressing the sale of lottery tickets or the offering of other forms of gaming over the internet. The enactment of
internet gaming legislation that federalizes significant aspects of the regulation of internet gaming could have an adverse
impact on our ability to pursue our interactive strategy in the U.S. For instance, at the end of 2012, the proposed language of
the “Internet Gambling Prohibition, Poker Consumer Protection, and Strengthening UIGEA Act of 2012” (commonly referred
to as the Reid-Kyl bill) was released. While not introduced to Congress in 2012, it contains language designed to significantly
limit the expansion of internet wagering in the United States, including limits on state lotteries selling lottery tickets over the
internet and a prohibition of internet gaming activities other than poker.
Internationally, laws relating to internet gaming are evolving, particularly in Europe. To varying degrees, a number of
European governments have taken steps to change the regulation of internet wagering through the implementation of new or
revised licensing and taxation regimes, including the possible imposition of sanctions on unlicensed providers. We cannot
predict the timing, scope or terms of any such state, federal or foreign laws and regulations, or the extent to which any such
legislation will facilitate or hinder our interactive strategy.
In jurisdictions that authorize internet gaming, there can be no assurance that we will be successful in selling our
technology, content and services to internet gaming operators as we expect to face intense competition from our traditional
competitors in the lottery business as well as a number of other domestic and foreign providers (or the operators themselves),
some of which have substantially greater financial resources and/or experience in this area than we do. In addition, there is a
risk that the authorization of the sale of lottery tickets or games or other forms of gaming via the internet in a particular
jurisdiction could, under certain circumstances, adversely impact our lottery product sales through traditional channels in such
jurisdiction. Any such adverse impact would be magnified to the extent we are not involved in, and generating revenue from,
21
the provision of products or services for internet gaming in such jurisdiction. Know-your-customer (KYC) and geo-location
programs and technologies supplied by third parties are an important aspect of certain internet or mobile gaming products and
services because they confirm certain information with respect to players and prospective players, such as age, identity and
location. Payment processing programs and technologies, typically provided by third parties, are also a necessary feature of
internet and mobile wagering products and services. These programs and technologies are costly and may have an adverse
impact on our internet or mobile gaming revenue. Additionally, there can be no assurance that products containing these
programs and technologies will be available to us on commercially reasonable terms, if at all, or that they will perform
accurately or otherwise in accordance with our required specifications.
Our ability to compete effectively in the internet gaming space will depend on the acceptance by our customers of the
products and services we offer. Such products and services may rely on technology that we acquire or license from third
parties.
We are in the process of internally developing internet gaming solutions for our customers. Such internal development
is costly and there can be no assurance that such development will result in commercially viable products. In addition, there
can be no assurance that our internally developed products will not infringe upon the proprietary rights of others, or that other
parties will not assert infringement claims against us.
We are heavily dependent on our ability to renew our long-term contracts with our customers and we could lose substantial
revenue and profits if we are unable to renew certain of our contracts.
Generally, our customer contracts contain initial multi-year terms, with optional renewal periods held by the customer.
Upon the expiration of a contract, including any extensions thereof, new contracts may be awarded through a competitive
bidding process.
Since late 2007, we have lost lottery systems contracts in South Carolina, West Virginia, South Dakota, New
Hampshire and Vermont to our competitors following the expiration of our contracts. During 2010, the lottery authority in
Maine awarded a new lottery contract to one of our competitors, which award was subsequently invalidated as a result of our
protest. The competitor's appeal of the protest ruling was denied in October 2011. Our contract with Maine was extended until
June 30, 2013 pending further action by the Maine lottery authority.
In our U.K. gaming business, William Hill awarded a contract for the exclusive supply of gaming terminals to its
entire LBO estate to one of our principal competitors. This contract took effect following the expiration of our gaming terminal
supply contract with William Hill in March 2012. The loss of this contract impacted our results of operations in 2012.
We are also required by certain of our lottery customers to provide surety or performance bonds in connection with
our contracts. As of December 31, 2012, we had approximately $209.8 million of outstanding surety and performance bonds.
There can be no assurance that we will continue to be able to obtain surety or performance bonds on commercially reasonable
terms or at all. Our inability to provide such bonds would materially and adversely affect our ability to renew existing, or
obtain new, lottery contracts.
There can be no assurance that our current contracts will be extended or that we will be awarded new contracts as a
result of competitive bidding processes or otherwise in the future. The termination, expiration or failure to renew one or more
of our contracts could cause us to lose substantial revenue and profits, which could have an adverse effect on our ability to win
or renew other contracts or pursue growth initiatives. For additional information regarding the potential expiration dates of
certain of our contracts, see the table in "Business—Contract Procurement" in Item 1 of this Annual Report on Form 10-K.
We may not have sufficient cash flows from operating activities, cash on hand and available borrowings under our credit
agreement to finance required capital expenditures under new contracts, service our indebtedness and meet our other cash
needs. These obligations require a significant amount of cash.
Our lottery systems and gaming terminal businesses generally require significant upfront capital expenditures for
terminal assembly, software customization and implementation, systems and equipment installation and telecommunications
configuration. In connection with a renewal or bid of a lottery systems or gaming terminal contract, a customer may seek to
obtain new equipment or impose new service requirements, which may require additional capital expenditures in order to retain
or win the contract. Historically, we have funded these upfront costs through cash flows generated from operations, available
cash on hand and borrowings under our credit agreement. Our ability to generate revenue and to continue to procure new
contracts will depend on, among other things, our then present liquidity levels or our ability to obtain additional financing on
commercially reasonable terms.
If we do not have adequate liquidity or are unable to obtain financing for these upfront costs on favorable terms or at
all, we may not be able to bid on certain contracts, which could restrict our ability to grow and have a material adverse effect
on our results of operations. Moreover, we may not realize the return on investment that we anticipate on new or renewed
contracts due to a variety of factors, including lower than anticipated retail sales, higher than anticipated capital or operating
22
expenses and unanticipated regulatory developments or litigation. We may not have adequate liquidity to pursue other aspects
of our strategy, including bringing our products and services to new customers or new or underpenetrated geographies
(including through equity investments) or pursuing strategic acquisitions.
As of December 31, 2012, we had total indebtedness of approximately $1,468.2 million, or approximately 80.1% of
our total capitalization, consisting primarily of borrowings under our senior secured term loan under our credit agreement and
senior subordinated notes. Our ability to make payments on and to refinance our indebtedness will depend on our ability to
generate cash in the future. This, to some extent, is subject to general economic, financial, competitive, legislative, regulatory
and other factors that are beyond our control. Our lenders, including the lenders participating in our revolving credit facilities,
may have suffered losses related to their lending and other financial relationships, especially because of the general weakening
of the national and global economy and increased financial instability of many borrowers. As a result, lenders may become
insolvent or tighten their lending standards, which could make it more difficult for us to borrow under our revolving credit
facilities or to obtain other financing on favorable terms or at all. Our financial condition and results of operations would be
adversely affected if we were unable to draw funds under our revolving credit facilities because of a lender default or to obtain
other cost-effective financing. Any default by a lender in its obligation to fund its commitment under our revolving credit
facilities (or its participation in letters of credit) could limit our liquidity to the extent of the defaulting lender's commitment.
If we are unable to generate sufficient cash flow from operations in the future to meet our commitments, we will be
required to adopt one or more alternatives, such as refinancing or restructuring our indebtedness, selling material assets or
operations or seeking to raise additional debt or equity capital. We cannot assure you that any of these actions could be
completed on a timely basis or on satisfactory terms or at all, or that these actions would enable us to continue to satisfy our
capital requirements. Moreover, our existing debt agreements contain, and our future debt agreements may contain, restrictive
covenants that may prohibit us from adopting these alternatives. Our failure to comply with these covenants could result in an
event of default which, if not cured or waived, could result in the acceleration of all of our debt.
In connection with the pending merger with WMS, we entered into a commitment letter pursuant to which the lenders
party thereto have agreed to provide the financing necessary to complete the transaction. The merger is not conditioned on our
obtaining the proceeds of any financing, including the financing contemplated by the commitment letter. For further details
regarding the commitment letter and the merger financing, see Note 23 (Subsequent Events) to our Consolidated Financial
Statements in this Annual Report on Form 10-K.
Our credit facilities and the indentures governing our senior subordinated notes impose certain restrictions. Failure to
comply with any of these restrictions could result in the acceleration of the maturity of our indebtedness. Were this to occur,
we would not have sufficient cash to pay our accelerated indebtedness.
The operating and financial restrictions and covenants in our debt agreements, including our credit agreement and the
indentures governing our senior subordinated notes may adversely affect our ability to finance future operations or capital
needs or to engage in new business activities. Our credit facilities and/or indentures restrict our ability to, among other things:
• declare dividends or redeem or repurchase capital stock;
• prepay, redeem or purchase other debt;
• incur liens;
• make loans, guarantees, acquisitions and investments;
• incur additional indebtedness;
• engage in sale and leaseback transactions;
• amend or otherwise alter debt and other material agreements;
• make capital expenditures;
• engage in mergers, acquisitions or asset sales;
• engage in transactions with affiliates; and
• alter the business we conduct.
In addition, our credit agreement requires us to maintain certain financial ratios. As a result of these covenants, we
will be limited in the manner in which we can conduct our business, and may be unable to engage in favorable business
activities or finance future operations or capital needs. A failure to comply with the restrictions contained in our credit
agreement or indentures, or to maintain the financial ratios required by our credit agreement, could lead to an event of default
which could result in an acceleration of our indebtedness. See Note 13 (Long-Term and Other Debt) to our Consolidated
Financial Statements in this Annual Report on Form 10-K for additional information regarding these financial ratios.
There can be no assurance that our future operating results will be sufficient to ensure compliance with the covenants
in our credit agreement, indentures or other debt instruments or to remedy any such default. In addition, in the event of
acceleration, we may not have, or be able to obtain, sufficient funds to make any accelerated payments.
23
Our business depends on the protection of our intellectual property and proprietary information and on our ability to
license intellectual property from third parties.
We believe that our success depends, in part, on protecting our intellectual property in the U.S. and in foreign
countries and our ability to license intellectual property from third parties on commercially reasonable terms. Our intellectual
property includes certain patents and trademarks relating to our instant ticket games and wagering systems, as well as
proprietary or confidential information that is not subject to patent or similar protection. Our intellectual property protects the
integrity of our games, systems, products and services, which is a core value of our business. For example, our intellectual
property is designed to ensure the security of the printing of our instant lottery tickets and provide simple and secure validation
of our lottery tickets. Competitors may independently develop similar or superior products, software, systems or business
models. In cases where our intellectual property is not protected by an enforceable patent, such independent development may
result in a significant diminution in the value of our intellectual property.
There can be no assurance that we will be able to protect our intellectual property. We enter into confidentiality or
license agreements with our employees, vendors, consultants and, to the extent legally permissible, our customers, and
generally control access to, and the distribution of, our game designs, systems and other software documentation and
proprietary information, as well as the designs, systems and other software documentation and information that we license
from others. Despite our efforts to protect these proprietary rights, unauthorized parties may try to copy our gaming products,
business models or systems, use certain of our confidential information to develop competing products, or develop
independently or otherwise obtain and use our gaming products or technology, any of which could have a material adverse
effect on our business. Policing unauthorized use of our technology is difficult and expensive, particularly because of the
global nature of our operations. The laws of other countries may not adequately protect our intellectual property.
There can be no assurance that our business activities, games, products and systems will not infringe upon the
proprietary rights of others, or that other parties will not assert infringement claims (with or without merit) against us. Any
such claim and any resulting litigation, should it occur, could subject us to significant liability for damages and could result in
invalidation of our proprietary rights, distract management, and/or require us to enter into costly and burdensome royalty and
licensing agreements. Such royalty and licensing agreements, if required, may not be available on terms acceptable to us, or
may not be available at all. In the future, we may also need to file or respond to lawsuits to defend the validity of our
intellectual property rights and trade secrets, or to determine the validity and scope of the proprietary rights of others. Such
litigation, whether successful or unsuccessful, could result in substantial costs and diversion of resources.
We rely on products and technologies that we license from third parties, including licensed properties (e.g., brands)
and game content for our lottery and gaming businesses and the back-end technology platform we license from Video B
Holdings Limited ("Video B"), a subsidiary of Playtech. There can be no assurance that these third-party licenses, or support
for such licensed products and technology, will continue to be available to us on commercially reasonable terms, if at all.
Certain of our license agreements grant the licensor rights to audit our use of their intellectual property to confirm that we have
made the required royalty payments. Disputes with licensors over royalty payment methodologies and calculations could result
in the payment of additional royalties or penalties by us, cancellation or non-renewal of the underlying license, or litigation.
Our business competes on the basis of the security and integrity of our systems and products.
We believe that our success depends, in part, on providing secure products and systems to our customers. Attempts to
penetrate security measures may come from various combinations of customers, retailers, vendors, employees and others. Our
ability to monitor and ensure the quality of our products is periodically reviewed and enhanced. Similarly, we regularly assess
the adequacy of our security systems to protect against any material loss to any of our customers and the integrity of our
products to end-users. Expanded utilization of the internet and other interactive technologies may result in increased security
concerns for us and our customers. There can be no assurance that our business will not be affected by a security breach or
lapse, which could have a material adverse impact on our results of operations, business and/or prospects.
We and our industry are subject to strict government regulations that may limit our existing operations and have an adverse
impact on our ability to grow.
In the U.S. and many other countries, lotteries and other forms of gaming are subject to extensive and evolving
regulation. Such gaming regulatory requirements vary from jurisdiction to jurisdiction. Therefore, we are subject to a wide
range of complex gaming laws and regulations in the jurisdictions in which we are licensed or operate. Most jurisdictions
require that we be licensed, that our key personnel and certain of our security holders be found suitable or be licensed, and that
our products be reviewed and approved before placement. If a license, approval or finding of suitability is required by a
regulatory authority and we fail to seek or do not receive the necessary approval, license or finding of suitability, then we may
be prohibited from providing our products or services for use in the particular jurisdiction. We will also become subject to
regulation in any other jurisdictions in which we decide to operate in the future, including due to expansion of a customer's
operations.
24
The regulatory environment in any particular jurisdiction may change in the future, including changes that limit some
or all of our existing operations in that jurisdiction, and any such change could have a material adverse effect on our results of
operations, business or prospects. Moreover, there can be no assurance that the operation of lotteries, video gaming terminals,
internet gaming or other forms of lottery or gaming will be approved by additional jurisdictions or that those jurisdictions in
which these activities are currently permitted will continue to permit such activities. Laws and regulations relating to internet
and other form of interactive gaming are evolving. For additional discussion regarding risks associated with the evolving
interactive gaming regulatory landscape, see the risk factor above captioned " —We may not be able to capitalize on the
expansion of internet or other forms of interactive gaming or other trends and changes in the lottery and gaming industries."
There can be no assurance that law enforcement or gaming regulatory authorities will not seek to restrict our business
in their jurisdictions or institute enforcement proceedings. In addition, there can be no assurance that any instituted
enforcement proceedings will be favorably resolved, or that such proceedings will not have a material adverse impact on our
ability to retain and renew existing licenses or to obtain new licenses in other jurisdictions. Moreover, in addition to the risk of
an enforcement action, our reputation may be damaged in the event of any legal or regulatory investigation whether or not we
are ultimately accused of or found to have committed any violation.
We are required to obtain and maintain licenses from various jurisdictions in order to operate certain aspects of our
business and we and certain of our affiliates, major stockholders (generally persons and entities beneficially owning a specified
percentage (typically 5% or more) of our equity securities), directors, officers and key employees are subject to extensive
background investigations and suitability standards in our business. In some jurisdictions these investigations may require
extensive personal and financial disclosure from major stockholders, directors, officers, and key employees. The failure of any
such individuals or entities to submit to such background checks and provide the required disclosure could jeopardize the
award of a contract or license to us or provide grounds for termination of an existing contract or license. We also will become
subject to regulation in any other jurisdiction in which our customers operate in the future. There can be no assurance that we
will be able to obtain new licenses or renew any of our existing licenses, or that if such licenses are obtained, that such licenses
will not be conditioned, suspended or revoked, and the loss, denial or non-renewal of any of our licenses could have a material
adverse effect on our results of operations, business or prospects. Lottery and gaming authorities generally conduct background
investigations of the winning vendor or license applicant, its parent corporation (if any) and its major stockholders, directors,
officers and key employees. Generally, regulatory authorities have broad discretion when granting, renewing or revoking these
approvals and licenses. Lottery and gaming authorities with which we do business may require the removal of any of our
directors or employees who are deemed to be unsuitable and these authorities are generally empowered to disqualify us from
receiving a lottery and gaming contract or operating a lottery or gaming system as a result of any such investigation. In
addition, certain of the games, hardware, software and other technology or products used in our gaming business must be
certified or approved in certain jurisdictions where we operate. Our failure, or the failure of any of our major stockholders,
directors, officers, key employees, products or technology, in obtaining or retaining a required license or approval in one
jurisdiction could negatively impact our ability (or the ability of any of our major stockholders, directors, officers, key
employees, products or technology) to obtain or retain required licenses and approvals in other jurisdictions. The failure to
obtain or retain a required license or approval in any jurisdiction would decrease the geographic areas where we are permitted
to operate and generate revenue, decrease our share in the lottery or gaming industry and put us at a disadvantage relative to
our competitors. Additional restrictions are often imposed on foreign entities such as us by international jurisdictions in which
we seek to market our products or services.
In light of these regulations and the potential impact on our business, our restated certificate of incorporation allows
for the restriction of stock ownership by persons or entities who fail to comply with informational or other regulatory
requirements under applicable gaming laws, who are found unsuitable to hold our stock by gaming authorities or whose stock
ownership adversely affects our ability to obtain, maintain, renew or qualify for a license, contract, franchise or other
regulatory approval from a gaming authority. The licensing procedures and background investigations of the authorities that
regulate our businesses and the restriction in our certificate of incorporation may inhibit potential investors from becoming
significant stockholders or inhibit existing stockholders from retaining or increasing their ownership.
We are subject to the provisions of the Foreign Corrupt Practices Act and other anti-corruption laws that generally
prohibit U.S. persons and companies and their intermediaries from offering, promising, authorizing or making improper
payments to foreign government officials for the purpose of obtaining or retaining business. Certain of these anti-corruption
laws also contain provisions that require accurate record keeping and further require companies to devise and maintain an
adequate system of internal accounting controls. Although we have policies and controls in place that are designed to ensure
compliance with these laws, if those controls are ineffective or an employee or intermediary fails to comply with the applicable
regulations, we may be subject to criminal and civil sanctions as well as other penalties. Any such violation could disrupt our
business and result in an adverse effect on our reputation, business, results of operations or financial condition.
We have developed and implemented an internal compliance program in an effort to ensure that we comply with legal
requirements imposed in connection with our gaming-related activities, as well as legal requirements generally applicable to all
publicly traded corporations. The compliance program is run on a day-to-day basis by our Chief Compliance Officer with legal
25
advice provided by attorneys in our legal and compliance departments and outside experts. The compliance program is
overseen by the Compliance Committee of our Board of Directors, consisting entirely of non-employee directors. There can be
no assurance that such steps will prevent the violation of one or more laws or regulations, or that a violation by us or an
employee will not result in the imposition of a monetary fine or suspension or revocation of one or more of our licenses.
Gaming opponents persist in their efforts to curtail the expansion of legalized gaming, which, if successful, could limit the
growth of our operations.
Legalized gaming is subject to opposition from gaming opponents. There can be no assurance that this opposition will
not succeed in preventing the legalization of gaming in jurisdictions where these activities are presently prohibited or
prohibiting or limiting the expansion of gaming where it is currently permitted. Any successful effort to curtail the expansion
of, or limit, legalized gambling could have an adverse effect on our business, financial condition, results of operations or
prospects.
We may not succeed in realizing the anticipated benefits of our strategic equity investments and relationships.
Under certain circumstances we pursue growth through strategic equity investments, including joint ventures, as a
means to, among other things, gain access to new and tactically important geographies, business opportunities and technical
expertise, while simultaneously offering the potential for reducing capital requirements.
These strategic equity investments currently include investments in LNS, Northstar, Sportech, RCN, as well as our
equity investments in China. We are party to strategic agreements with Video B relating to gaming terminals that contemplate
our use of, and reliance on, Video B's back-end technology platform in certain jurisdictions. In 2011, Global Draw completed
the migration of its server-based gaming terminals to this back-end technology platform in the U.K. and migrated the majority
of our server-based gaming terminals outside the U.K. to this technology during 2012.
Northstar, in which we are a 20% equity holder, was awarded the agreement to be the private manager for the Illinois
Lottery for a 10-year term following a competitive procurement process, which agreement was executed on January 18, 2011.
See "Business-Operational Overview-Printed Products-Northstar" in Item 1 of this Annual Report on Form 10-K. Operations
under the agreement commenced on July 1, 2011. Under the terms of the agreement, Northstar is entitled to receive annual
incentive compensation payments from Illinois to the extent it is successful in increasing the lottery's net income above
specified target levels of lottery net income, subject to a cap of 5% of the applicable year's net income. Northstar will be
responsible for payments to Illinois to the extent the lottery net income levels set forth in Northstar's successful bid are not
achieved, subject to a similar cap. The lottery net income targets set forth in Northstar's successful bid were $851.1 million,
$950 million, $980 million, $986 million and $1 billion for the five fiscal years ending June 30, 2012, 2013, 2014, 2015 and
2016, respectively, representing a cumulative growth rate in lottery net income over such time period of approximately 49%.
These net income targets are subject to upward or downward adjustment under certain circumstances in accordance with the
terms of the agreement. Northstar is entitled to be reimbursed on a monthly basis for most of its operating expenses under the
agreement, although certain expenses of Northstar associated with managing the lottery are not reimbursable. Earnings and
cash flows from our equity investment in Northstar may be impacted to the extent the lottery achieves, or fails to achieve, the
applicable net income targets and will be impacted to the extent Northstar incurs non-reimbursable expenses.
In December 2012, we formed Northstar New Jersey Lottery Group, a joint venture with GTECH and a subsidiary of
the administrator of the Ontario Municipal Employees Retirement System (OMERS) (“Northstar New Jersey”), to bid to be the
private manager for the New Jersey Lottery for a 15-year term. If Northstar New Jersey is selected as the private manager, we
expect to own a 17.69% equity interest in the joint venture entity that will execute the private management agreement.
In December 2012, a consortium in which we own a 16.5% equity interest was declared the provisional successful
bidder in the tender process for a 12-year concession for the exclusive rights to the production, operation and management of
instant ticket lotteries in Greece, subject to various regulatory approvals and Greek parliamentary approval. The consortium is
principally comprised of OPAP S.A., Intralot and Scientific Games. If the award is approved, the consortium will pay an
upfront fee of €190 million, of which our portion will be €31.4 million. Pursuant to our agreement with the consortium, we
expect to serve as the exclusive supplier of instant tickets over the term of the concession.
We may not realize the anticipated benefits of these strategic equity investments and other strategic relationships that
we may enter into, or may not realize them in the timeframe expected. These arrangements pose significant risks that could
have a negative effect on our operations, including: the potential diversion of our management's attention from our core
business; the potential failure to realize anticipated synergies, economies of scale or other value associated with the
arrangements; unanticipated costs and other unanticipated events or circumstances; possible adverse effects on our operating
results during any integration process; impairment charges if our strategic equity investments or relationships are not as
successful as we originally anticipate; and our potential inability to achieve the intended objectives of the arrangements.
26
Furthermore, our strategic equity investments and other strategic relationships pose risks arising from our reliance on
our partners and our lack of sole decision-making authority, which may give rise to disputes between us and our partners. For
instance, our investments in LNS and Northstar are minority investments in ventures whose largest equity holders are
Lottomatica and GTECH, respectively, and, although certain corporate actions require our prior consent, we do not control
decisions relating to the governance of LNS or Northstar. Our partners may have economic or business interests or goals that
are inconsistent with our interests and goals, take actions contrary to our objectives or policies, undergo a change of control,
experience financial and other difficulties or be unable or unwilling to fulfill their obligations under our arrangements.
The failure to avoid or mitigate the risks described above or other risks associated with such arrangements could have
a material adverse effect on our business, financial condition and results of operations.
We may be required to recognize additional impairment charges.
We assess our goodwill and other intangible assets and our long-lived assets as and when required by accounting
principles generally accepted in the U.S. ("U.S. GAAP") to determine whether they are impaired. In 2012, we recorded asset
impairment charges of $31.9 million related to the write-down of gaming terminals and software in our gaming business, $5.8
million related to the impairment of certain long-lived assets related to underperforming U.S. Lottery Systems contracts and
$4.4 million related to the write-down of certain development costs in our licensed properties business. In addition we recorded
$3.4 million of accelerated depreciation expense related to the reorganization of our Australian printing operations. We
recorded accelerated depreciation expense of $6.4 million and $8.3 million in 2011 and 2010, respectively, as a result of Global
Draw's migration to a new platform technology. In 2010, we recorded asset impairment charges of approximately $17.5 million
related to underperforming U.S. Lottery Systems contracts, $3.0 million of impairments related to obsolete equipment in
Lottery Systems and $2.5 million of impairments related to obsolete gaming terminals. Refer to the heading "Management's
Discussion and Analysis of Financial Condition and Results of Operations—Critical Accounting Policies—Valuation of long-
lived and intangible assets and goodwill" in Item 7 of this Annual Report on Form 10-K and Note 1 (Description of the
Business and Summary of Significant Accounting Policies) and Note 7 (Property and Equipment) to our Consolidated
Financial Statements in this Annual Report on Form 10-K. We cannot predict the occurrence of impairments and there can be
no assurance that we will not have to record additional impairment charges in the future.
Our inability to complete future acquisitions and integrate those businesses successfully could limit our future growth.
Part of our corporate strategy is to continue to pursue expansion and strategic acquisition opportunities. In connection
with any such acquisitions, we could face significant challenges in managing and integrating the expanded or combined
operations, including acquired assets, operations and personnel. There can be no assurance that acquisition opportunities will
be available on acceptable terms or at all or that we will be able to obtain necessary financing or regulatory approvals to
complete potential acquisitions. Our ability to succeed in implementing our strategy will depend to some degree upon the
ability of our management to identify, complete and successfully integrate commercially viable acquisitions. Acquisition
transactions may disrupt our ongoing business and distract management from other responsibilities. For additional discussion
regarding risks relating to the pending merger with WMS, see the risk factors below under the heading "—Risks Relating to
Our Pending Merger with WMS”.
Our revenue fluctuates due to seasonality and timing of equipment sales and, therefore, our periodic operating results are
not guarantees of future performance.
Our revenue can fluctuate due to seasonality in some components of our business. The summer season historically has
been the weakest part of the year for certain parts of our lottery business, particularly where our revenue is tied to a percentage
of retail sales such as under our CSP contracts. Our Gaming LBO service revenue is typically lower in the first and third
quarters of the year as there is generally a lower volume of players in the LBOs during those quarters.
Our Lottery Systems service revenue can be somewhat dependent on the size of jackpots of lottery games such as
Powerball and Mega Millions during the relevant period. Our licensed properties instant ticket revenue and our sales revenue
can fluctuate due to the non-recurring nature of these revenue streams.
Our success depends in part on our ability to develop, enhance and/or introduce successful gaming concepts and game
content.
Lottery and gaming equipment sales and software license revenue usually reflects a limited number of large
transactions, which may not recur on an annual basis. Consequently, revenue and operating margins can vary substantially
from period to period as a result of the timing and magnitude of major equipment sales and software license revenue. As a
general matter, lottery and gaming equipment sales generate lower operating margins than revenue from other aspects of our
business. In addition, instant ticket sales may vary depending on the season and timing of contract awards, changes in customer
budgets, ticket inventory levels, lottery retail sales and general economic conditions.
27
Our businesses, including our Gaming businesses, develop and source game content both internally and through third-
party suppliers. We also seek to secure third-party brands for incorporation into our game content. We believe creative and
appealing game content produces more revenue for the gaming terminal customers of our Gaming businesses and provides
them with a competitive advantage, which in turn enhances their revenue and their ability to attract new business or to retain
existing business. In our lottery business, we believe that innovative gaming concepts and game content, such as multiplier
games from our Lottery Systems segment and licensed properties game content from our Printed Products segment, can
enhance the revenue of our lottery customers and distinguish us from our competitors. There can be no assurance that we will
be able to sustain the success of our existing game content or effectively develop or obtain from third parties game content or
licensed properties that will be widely accepted both by our customers and their end users.
We are dependent on our suppliers and contract manufacturers, and any failure of these parties to meet our performance
and quality standards or requirements could cause us to incur additional costs or lose customers.
Our production of instant lottery tickets, in particular, depends upon a continuous supply of raw materials, supplies,
power and natural resources. Our operating results could be adversely affected by an interruption or cessation in the supply of
these items or a serious quality assurance lapse, including as a result of the insolvency of any of our key suppliers.
Similarly, production of our presses and lottery and gaming systems is dependent upon a regular and continuous
supply of components many of which are manufactured outside of the United States. The assembly of many of our terminals
and other hardware is performed by third parties. Any interruption or cessation in the supply of these items or services or any
material quality assurance lapse with respect thereto could materially adversely affect our ability to fulfill customer orders, our
financial condition or our results of operations.
We transmit certain wagering data utilizing satellite transponders, generally pursuant to long-term contracts. The
technical failure of any of these satellites would require us to obtain other communication services, including other satellite
access. In some cases, we employ backup systems to limit our exposure in the event of such a failure. There can be no
assurance of access to such other satellites or, if available, the ability to obtain the use of such other satellites on favorable
terms or in a timely manner. While satellite failures are infrequent, the operation of satellites is outside of our control.
In addition, our gaming businesses include a number of significant contracts where performance depends upon our
third-party suppliers delivering equipment on schedule in order to meet our contract commitments. Failure of the suppliers to
meet their delivery commitments could result in us being in breach of, and subsequently losing, those contracts, which loss
could have a material adverse effect on our results of operations.
We may be liable for product defects or other claims relating to our products.
Our products could be defective, fail to perform as designed or otherwise cause harm to our customers, their
equipment or their products. If any of our products are defective, we may be required to recall the products and/or repair or
replace them, which could result in substantial expenses and affect our profitability. Any problem with the performance of our
products, such as an instant ticket misprint, could harm our reputation, which could result in a loss of sales to customers and/or
potential customers. In addition, if our customers believe that they have suffered harm caused by our products, they could bring
claims against us that could result in significant liability. Any claims brought against us by customers may result in diversion
of management's time and attention, expenditure of large amounts of cash on legal fees and payment of damages, decreased
demand for our products or services, or injury to our reputation. Our insurance may not sufficiently cover a large judgment
against us or a large settlement payment, and is subject to customary deductibles, limits and exclusions.
In October 2012, SNAI S.p.a. ("SNAI") filed a lawsuit in Italy against Barcrest and Global Draw relating to the
erroneous printing of what appeared to be winning jackpots on certain video lottery terminals operated by SNAI and supplied
by Barcrest. For additional information regarding this litigation, see "Legal Proceedings" in Item 3 of this Annual Report on
Form 10-K.
We have foreign operations, which subjects us to foreign currency exchange rate fluctuations and other risks.
We are a global business and derive a substantial and growing portion of our revenue and profits from operations
outside the United States. In the year ended December 31, 2012, we derived approximately 53% of our revenue from sales to
customers outside of the United States.
Our consolidated financial results are significantly affected by foreign currency exchange rate fluctuations. Foreign
currency exchange rate exposures arise from current transactions and anticipated transactions denominated in currencies other
than U.S. dollars and from the translation of foreign currency balance sheet accounts into U.S. dollar-denominated balance
sheet accounts. We are exposed to currency exchange rate fluctuations because a significant portion of our revenue is
denominated in currencies other than the U.S. dollar, particularly the British Pound Sterling and the Euro. In particular,
uncertainty regarding economic conditions in Europe and the debt crisis affecting certain countries in the European Union
poses risk to the stability of the Euro. Exchange rate fluctuations have in the past adversely affected our operating results and
28
cash flows and may adversely affect our results of operations and cash flows and the value of our assets outside the U.S. in the
future.
From time to time, we enter into foreign currency forward or other hedging contracts. We are subject to the risk that a
counterparty to one or more of these contracts defaults on its performance under the contracts. During an economic downturn,
a counterparty's financial condition may deteriorate rapidly and with little notice and we may be unable to take action to protect
our exposure. In the event of a counterparty default, we could incur losses, which may harm our business and financial
condition. In the event that one or more of our counterparties becomes insolvent or files for bankruptcy, our ability to
eventually recover any losses suffered as a result of that counterparty's default may be limited by the liquidity of the
counterparty.
Our operations in foreign jurisdictions subject us to additional risks customarily associated with such operations,
including:
• the complexity of foreign laws, regulations and markets;
• the impact of foreign labor laws and disputes;
• other economic, tax and regulatory policies of local governments; and
• the ability to attract and retain key personnel in foreign jurisdictions.
Additionally, foreign taxes paid by our foreign subsidiaries and equity investees on their earnings may not be
recovered against our U.S. tax liability. At December 31, 2012, we had a deferred tax asset for our foreign tax credit ("FTC")
carry forward of approximately $18.2 million. Although we will continue to explore tax planning strategies to use all of our
FTC carry forward, at December 31, 2012, we established a valuation allowance of approximately $18.2 million against the
FTC deferred tax asset to reduce the asset to the net amount that our management estimates is "more likely than not" to be
realized.
In addition, our ability to expand successfully in foreign jurisdictions involves other risks, including difficulties in
integrating foreign operations, risks associated with entering jurisdictions in which we may have little experience and the day-
to-day management of a growing and increasingly geographically diverse company. Our investment in foreign jurisdictions
often entails entering into joint ventures or other business relationships with locally based entities, which can involve additional
risks arising from our lack of sole decision-making authority, our reliance on a partner's financial condition, inconsistency
between our business interests or goals and those of our partners and disputes between us and our partners.
Through our joint ventures and wholly owned foreign enterprises, we have lottery-related investments and business
operations in China. Our business in, and results of operations from, China are subject to a number of risks, including risks
relating to competition in China, our ability to finance or refinance our operations in China, the complex regulatory
environment, our ability to receive timely product approvals, the political climate in China, the Chinese economy and our joint
venture and other business partners in China.
We have seen a recent decline in our instant ticket validation revenue and our joint venture's instant ticket printing
revenue in China. We believe there is sustained consumer demand for lottery products generally, as retail sales of the entire
lottery segment in China grew in 2012, but that competition from other lottery products is impacting instant ticket sales. We
anticipate that the reversal of the decline in our instant ticket business in China will depend, in part, on sustained consumer
demand for lottery products, expanding the lottery retailer network and increasing our involvement in the game selection
process. There can be no assurance that lottery product demand will be sustained or that the decline in our instant ticket
business will subside or reverse, and we cannot predict the rate of retailer expansion or the success of our other growth
initiatives.
There can be no assurance that legal and regulatory requirements in China will not change or that China's central or
local governments will not impose new, stricter regulations or interpretations of existing regulations that would impose
additional costs on our operations in China or even restrict or prohibit such operations. For example, comprehensive legislation
regulating competition took effect on August 1, 2008. This law, among other things, prohibits certain types of agreements
(unless they fall within specified exemptions) and certain behavior classified as abuse of dominant market position or
intellectual property rights. Additionally, new lottery regulations providing for enhanced supervision of the lottery industry in
China became effective on July 1, 2009. We cannot predict with certainty what impact these laws and regulations or any future
laws and regulations (or implementing rules or enforcement policies relating to any of the foregoing) will have on our business
in China.
We may not realize the operating efficiencies, competitive advantages or financial results that we anticipate from our
investments in foreign jurisdictions and our failure to effectively manage the risks associated with our operations in foreign
jurisdictions could have a material adverse effect on our results of operations, business or prospects.
29
If certain of our key personnel leave us, our business will be significantly adversely affected.
We depend on the continued performance of our executive officers and key personnel, including A. Lorne Weil, our
Chairman and Chief Executive Officer. If we lose the services of any of our executive officers or key personnel and cannot find
suitable replacements for such persons in a timely manner, it could have an adverse impact on our business.
We could incur costs in the event of violations of, or liabilities under, environmental laws.
Our operations and real property are subject to U.S. and foreign environmental laws and regulations, including those
relating to air emissions, the management and disposal of hazardous substances and wastes, and the cleanup of contaminated
sites. We could incur costs, including cleanup costs, fines or penalties, and third-party claims as a result of violations of, or
liabilities under, environmental laws. Some of our operations require environmental permits and controls to prevent or reduce
environmental pollution, and these permits are subject to review, renewal and modification by issuing authorities.
Failure to perform under our lottery and gaming contracts may result in litigation, substantial monetary liquidated
damages and contract termination.
Our business subjects us to contract penalties and risks of litigation, including due to potential allegations that we
have not fully performed under our contracts or that goods or services we supply are defective in some respect. Litigation is
pending in Colombia arising out of the termination of certain Colombian lottery contracts in 1993. An agency of the
Colombian government has asserted claims against certain parties, including SGI, which owned a minority interest in Wintech
de Colombia S.A., or Wintech (now liquidated), the former operator of the Colombian national lottery. The claims are for,
among other things, contract penalties, interest and the amount of a bond issued by a Colombian surety. For additional
information regarding this litigation, see "Legal Proceedings" in Item 3 of this Annual Report on Form 10-K. There can be no
assurance that this litigation will not be finally resolved adversely to us or result in material liability.
In addition, our lottery contracts typically permit a lottery authority to terminate the contract at any time for a material
failure to perform, other specified reasons and, in many cases, for no reason at all. Lottery contracts to which we are a party
also frequently contain exacting implementation schedules and performance requirements and the failure to meet these
schedules and requirements may result in substantial monetary liquidated damages, as well as possible contract termination.
We are also required by certain of our lottery customers to provide surety or performance bonds. We have paid or incurred
liquidated damages under our lottery contracts and material amounts of liquidated damages could be imposed on us in the
future, which could, if imposed, have a material adverse effect on our results of operations, business or prospects.
Labor disputes may have an adverse effect on our operations.
Certain of our employees are represented by unions, including a majority of the employees at our printing facilities in
Canada, Chile and the United Kingdom. There can be no assurance that we will not encounter any conflicts or strikes with any
labor union that represents our employees, which could have an adverse effect on our business or results of operations, cause us
to lose customers or cause our customers' operations to be affected and could have permanent effects on our business.
Risks Relating to Our Pending Merger with WMS
We may be unable to obtain the approvals required to complete the merger with WMS or, in order to obtain such approvals,
we may have to take actions that could have an adverse effect on our operations.
On January 30, 2013, we entered into a merger agreement under which we agreed to acquire WMS. Under the terms
of the merger agreement, the closing of the merger is subject to, among other conditions, receipt of approvals from certain
governmental authorities relating to WMS' gaming operations. There can be no assurance that we will obtain all the required
gaming approvals within the timeframe necessary to consummate the merger. Under certain circumstances specified in the
merger agreement, we may be required to pay to WMS a termination fee of $80.0 million if we are unable to obtain the
required gaming approvals. In addition, as a condition to granting their approval, certain gaming authorities may require us to
agree to concessions or undertakings that could have an adverse effect on our business or that of the combined company
following the merger.
Failure to complete the merger could have a materially adverse effect on our financial condition and results and could
negatively impact our stock price.
We will incur significant transaction costs relating to the merger, including legal, accounting, financial advisory,
regulatory and other expenses. In connection with the merger, we currently expect to incur regulatory costs, professional fees
and other expenses totaling approximately $4.0 million to $6.0 million in the first quarter of 2013, with additional transaction-
related fees and expenses anticipated to be incurred throughout the balance of 2013. In general, these expenses are payable by
us whether or not the merger is completed. If the merger is not completed under specified circumstances, we may be required
to pay to WMS a termination fee of $80.0 million for the failure to obtain the required gaming approvals or $100.0 million for
the failure to obtain the required financing. The payment of such transaction costs or termination fees could have an adverse
30
effect on our financial condition, results of operations or cash flows. In addition, we could be subject to litigation in the event
the merger is not consummated, which could subject us to significant liability for damages and result in the incurrence of
substantial legal fees. The current market price of our stock may reflect an assumption that the pending merger will occur and
failure to complete the merger could result in a decline in our stock price.
Several putative class action lawsuits have been filed on behalf of WMS' stockholders relating to the pending merger
which name us and, in some cases, certain of our affiliates, as defendants. If these actions or similar actions that may be
brought are successful, the merger with WMS could be delayed or prevented. For additional information regarding pending
litigation relating to the WMS merger, see "Legal Proceedings" in Item 3 of this Annual Report on Form 10-K.
If completed, the merger with WMS may not achieve the intended benefits or may disrupt our current plans and operations.
There can be no assurance that we will be able to successfully integrate the businesses of Scientific Games and WMS
or do so within the intended timeframe or otherwise realize the expected benefits of the merger. The expected costs savings and
operating synergies of the merger may not be fully realized, which could result in increased costs and have an adverse effect on
the combined company's financial results and prospects. Our business may be negatively impacted following the merger if we
are unable to effectively manage our expanded operations. The integration will require significant time and focus from
management following the merger and may divert attention from the day-to-day operations of the combined business.
Additionally, consummation of the merger could disrupt current plans and operations, which could delay the achievement of
our strategic objectives.
Risks Relating to Our Common Stock
Certain holders of our common stock exert significant influence over the Company and may make decisions that conflict
with the interests of other stockholders.
In August 2004, MacAndrews & Forbes Holdings Inc. was issued approximately 25% of our outstanding common
stock in connection with its conversion of our then outstanding Series A Convertible Preferred Stock. According to an
amendment to Schedule 13D filed with the SEC on September 11, 2012, this holder beneficially owns 32,505,737 shares of our
common stock, or approximately 38.3% of our outstanding common stock as of March 8, 2013. Pursuant to a stockholders'
agreement with us, which we originally entered into with holders of the Series A Convertible Preferred Stock, such holder is
entitled to appoint up to four members of our Board of Directors and certain actions of the Company require the approval of
such holder. As a result, this holder has the ability to exert significant influence over our business and may make decisions with
which other stockholders may disagree, including, among other things, delaying, discouraging or preventing a change of
control of the Company or a potential merger, consolidation, tender offer, takeover or other business combination.
The price of our common stock has been volatile and may continue to be volatile
Our stock price may fluctuate in response to a number of events and factors, many of which are outside our control,
including variations in operating results, actions and pronouncements by various regulatory agencies, litigation, changes in
financial estimates and recommendations by securities analysts, rating agency reports, performance of other companies that
investors or security analysts deem comparable to us, news reports and announcements relating to our business and those of our
competitors, responses to our pending merger with WMS, general and industry-specific economic conditions, public sales of a
substantial number of shares of our common stock, and general market conditions. During the 52-week period ended March 8,
2013, our stock price fluctuated between a high of $12.29 and a low of $5.53. This significant stock price fluctuation may
make it more difficult for our stockholders to sell their common stock when they want and at prices they find attractive.
ITEM 1B. UNRESOLVED STAFF MATTERS
None.
ITEM 2. PROPERTIES
We occupy approximately 1,000,000 square feet of space throughout the United States and Puerto Rico. Our principal
facilities include approximately 355,000 square feet owned (subject to mortgage encumbrance) in Alpharetta, Georgia for
administrative offices, manufacturing and warehousing (supporting all of our segments) and approximately 23,000 square feet
of leased office space in New York, New York for our corporate offices.
Internationally, we occupy approximately 778,000 square feet of owned or leased space, including administrative
offices and manufacturing and warehouse facilities supporting the Printed Products segment in Leeds, England (approximately
150,000 square feet of which is owned), Montreal, Canada (approximately 119,000 square feet of which is owned) and
Santiago, Chile (approximately 47,000 square feet of which is owned). Additionally, we own approximately 79,000 square feet
in Germany for administrative offices, warehousing and distribution.
31
ITEM 3. LEGAL PROCEEDINGS
Although we are a party to various claims and legal actions arising in the ordinary course of business, we believe, on
the basis of information presently available to us, that the ultimate disposition of these matters will not likely have a material
adverse effect on our consolidated financial position or results of operations.
Our subsidiary, SGI, owned a minority interest in Wintech de Colombia S.A., or Wintech (now liquidated), which
formerly operated the Colombian national lottery under contract with Empresa Colombiana de Recursos para la Salud, S.A.
(together with its successor agencies, "Ecosalud"), an agency of the Colombian government. The contract provided for a
penalty against Wintech, SGI and the other shareholders of Wintech of up to $5.0 million if certain levels of lottery sales were
not achieved. In addition, SGI delivered to Ecosalud a $4.0 million surety bond as a further guarantee of performance under the
contract. Wintech started the instant lottery in Colombia, but, due to difficulties beyond its control, including, among other
factors, social and political unrest in Colombia, frequently interrupted telephone service and power outages, and competition
from another lottery being operated in a province of Colombia that we believe was in violation of Wintech's exclusive license
from Ecosalud, the projected sales level was not met for the year ended June 30, 1993.
In 1993, Ecosalud issued a resolution declaring that the contract was in default. In 1994, Ecosalud issued a liquidation
resolution asserting claims for compensation and damages against Wintech, SGI and other shareholders of Wintech for, among
other things, realization of the full amount of the penalty, plus interest, and the amount of the bond. SGI filed separate actions
opposing each resolution with the Tribunal Contencioso of Cundinamarca in Colombia (the “Tribunal”), which upheld both
resolutions. SGI appealed each decision to the Council of State. On May 25, 2012, the Council of State upheld the authority of
Ecosalud to issue the resolutions, which decision was published on August 28, 2012. As a result of such decision, the Council
of State will consider the merits of the claims set forth in the liquidation resolution in due course.
On June 4, 1999, Ecosalud filed a collection proceeding against SGI to enforce the liquidation resolution and recover
the claimed damages. In July 2002, the Tribunal denied SGI's preliminary motion to dismiss the collection proceeding and the
decision was upheld on appeal. SGI's procedural defense motion was also denied. As a result of these decisions, the collection
proceeding will be heard in due course on its merits by the Tribunal and an appeal stage will be available.
SGI believes it has various defenses on the merits against Ecosalud's claims. Although we believe these claims will
not result in a material adverse effect on our consolidated financial position or results of operations, it is not feasible to predict
the final outcome, and there can be no assurance that these claims will not ultimately be resolved adversely to us or result in
material liability.
On April 16, 2012, certain video lottery terminals operated by SNAI S.p.a. ("SNAI") in Italy and supplied by Barcrest
erroneously printed what appeared to be winning jackpot and other tickets. SNAI has stated, and system data confirms, that no
jackpots were actually won on that day. The terminals were deactivated pending a review by the Italian regulatory authority of
the cause of the incident. We understand that the Italian regulatory authority has decided to revoke the certification of the
version of the gaming system that Barcrest provided to SNAI and initiated proceedings to revoke the concession SNAI relies
upon to operate video lottery terminals in Italy. From a release issued by SNAI on March 1, 2013, we understand that the
Italian regulatory authority has issued a decision in which it fined SNAI €1.5 million but did not revoke SNAI's concession.
In October 2012, SNAI filed a lawsuit in Italy against Barcrest and Global Draw, our subsidiary which acquired
Barcrest from IGT-UK Group Limited, claiming liability based on breach of contract and tort. The lawsuit seeks to terminate
SNAI's agreement with Barcrest and damages arising from the deactivation of the terminals, including among other things, lost
profits, expenses and costs, potential awards to players who have sought to enforce what appeared to be winning jackpot and
other tickets, compensation sought by managers of the gaming locations where SNAI video lottery terminals supplied by
Barcrest were installed, damages to commercial reputation and any future damages arising from SNAI's potential loss of its
concession or inability to obtain a new concession. While we believe we have meritorious defenses and potential third party
recoveries, we are still in the process of evaluating the lawsuit and cannot currently predict the outcome of this matter.
The following complaints challenging the merger have been filed in various jurisdictions: (i) in the Delaware Court of
Chancery, Shaev v. WMS Industries Inc., Gamache, et al. (C.A. No. 8279); (ii) in the Circuit Court of Cook County, Illinois,
Chancery Division, Gardner v. WMS Industries Inc., Scientific Games Corporation, et al., No. 2013 CH 3540 (Ill. Cir., Cook
County); (iii) in the Circuit Court of the Nineteenth Judicial Circuit of Lake County, Illinois, Gil v. WMS Industries Inc.,
Scientific Games Corp., et al., No. 13 CH 0473 (Ill. Cir., Lake County); (iv) in the Delaware Court of Chancery, Hornsby v.
Gamache, et al. (C.A. No. 8295); (v) in the Circuit Court of the Nineteenth Judicial Circuit of Lake County, Illinois,
Sklodowski v. WMS Industries, Inc., Scientific Games Corp., et al. (Ill. Cir., Lake County); (vi) in the Delaware Court of
Chancery, Barresi v. WMS Industries Inc., Gamache, et al. (C.A. No. 8326); and (vii) in the Circuit Court of Cook County,
Illinois, Chancery Division, Plumbers & Pipefitters Local 152 Pension Fund and UA Local 152 Retirement Annuity Fund v.
WMS Industries Inc., Gamache, et al. (Ill. Cir., Cook County). Each of the actions is a putative class action filed on behalf of
the public stockholders of WMS and names as defendants WMS, its directors and Scientific Games Corporation. The Shaev,
32
Hornsby, Barresi and Plumbers & Pipefitters actions also name SGI and our subsidiary, SG California Merger Sub, Inc., as
defendants. The complaints generally allege that the WMS directors breached their fiduciary duties in connection with their
consideration and approval of the merger and that we aided and abetted those alleged breaches. The complaints seek, among
other relief, declaratory judgment and an injunction against the merger.
On February 25, 2013, the Delaware Court of Chancery consolidated the Delaware actions under In re WMS
Industries Inc. Stockholders Litigation (C.A. No. 8279-VCP). On March 1, 2013, the plaintiffs in the consolidated Delaware
actions filed an amended complaint adding allegations that the disclosures in WMS' preliminary proxy statement were
inadequate.
The outcome of these lawsuits cannot be predicted with any certainty. An adverse judgment for monetary damages
could have a material adverse effect on the operations and liquidity of WMS or us, as the case may be, and therefore could
adversely affect the combined business if the merger is completed. A preliminary injunction could delay or jeopardize the
completion of the merger, and an adverse judgment granting permanent injunctive relief could indefinitely enjoin completion of
the merger. We and WMS believe that the claims asserted in the lawsuits are without merit and plan to defend against them
vigorously. Additional lawsuits arising out of or relating to the merger agreement or the merger may be filed in the future.
ITEM 4. MINE SAFETY DISCLOSURES
Not applicable.
33
PART II
ITEM 5. MARKET FOR REGISTRANT'S COMMON EQUITY, RELATED STOCKHOLDER MATTERS AND
ISSUER PURCHASES OF EQUITY SECURITIES
Market for Our Common Stock
Our outstanding common stock is listed for trading on the Nasdaq Global Select Market under the symbol "SGMS".
The following table sets forth, for the periods indicated, the range of high and low sales prices of our Class A common stock.
Sales Price of Scientific Games Common Stock
High Low
Fiscal Year 2012 (January 1, 2012 - December 31, 2012)
First Quarter $ 13.08 $ 9.86
Second Quarter $ 12.29 $ 7.95
Third Quarter $ 9.01 $ 5.53
Fourth Quarter $ 8.89 $ 6.64
Fiscal Year 2011 (January 1, 2011 - December 31, 2011)
First Quarter $ 11.27 $ 8.26
Second Quarter $ 10.83 $ 8.32
Third Quarter $ 10.59 $ 6.80
Fourth Quarter $ 9.82 $ 6.50
On March 8, 2013, the last reported sale price for our common stock on the Nasdaq Global Select Market was $8.88
per share. There were approximately 969 holders of record of our common stock as of March 8, 2013.
Dividend Policy
We have never paid any cash dividends on our Class A common stock. Our Board of Directors presently intends to
retain earnings for use in the business. Any future determination as to payment of dividends will depend upon our financial
condition and results of operations and such other factors as are deemed relevant by our Board. Further, under the terms of
certain of our debt agreements, we are limited in our ability to pay cash dividends or make certain other restricted payments
(other than stock dividends) on our Class A common stock.
Stock Repurchase Program
On December 6, 2012, our Board of Directors approved an extension of our existing stock repurchase program to
December 31, 2013. The program, originally announced in May 2010, was due to expire on December 31, 2012. Under the
program, we are authorized to repurchase, from time to time through open market purchases or otherwise, shares of our
outstanding common stock in an aggregate amount up to $200 million. As of December 31, 2012, we had approximately
$105.2 million available for potential repurchases under the program. Repurchases for the fourth quarter ended December 31,
2012 are reflected in the following table:
Period
Total Number of Shares
Purchased (1)
Average Price Paid per Share
Total Number of Shares
Purchased as Part of Publicly Announced Plans or Programs
Approximate Dollar Value of Shares that May Yet Be
Purchased Under the Plans or Programs
10/1/2012 - 10/31/2012 1,693,611 $ 7.94 1,670,292 $113.0 million
11/1/2012 - 11/30/2012 1,031,949 $ 7.30 1,030,941 $105.5 million
12/1/2012 - 12/31/2012 171,839 $ 8.33 34,000 $105.2 million
Total 2,897,399 $ 7.74 2,735,233 $105.2 million _________________________
(1) In addition to shares of Class A common stock repurchased as part of our publicly announced stock repurchase
program, this column reflects 162,166 shares acquired from employees to satisfy the withholding taxes associated with
the vesting of restricted stock units during the quarter ended December 31, 2012. For the quarter ended December 31,
2012, we repurchased 2,735,233 shares as a part of our repurchase program for approximately $21.1 million.
34
Shares Authorized For Issuance Pursuant to Equity Compensation Plans (in thousands)
There are 13,500 shares of common stock authorized for awards under our 2003 Incentive Compensation Plan (the
"Plan") plus available shares from a pre-existing equity compensation plan, which plans were approved by our stockholders.
We also have outstanding stock options granted as part of inducement stock option awards that were not approved by
stockholders as permitted by applicable stock exchange rules. The table below shows information regarding our equity
compensation plans as of December 31, 2012:
Equity Compensation Plans
Shares available for future issuance (1) 814
Unrecognized cost of outstanding awards $ 44,700
Weighted average future recognition period (years) 2.0
(1) Excludes 357 shares available for future issuance under our employee stock purchase plan as of December 31, 2012. Under the share counting rules of equity compensation plans, awards may be outstanding relating to a greater number of shares than the aggregate remaining available under
the plans so long as awards will not result in delivery and vesting of shares in excess of the number then available under the plans. Shares available
for future issuance do not include shares expected to be withheld in connection with outstanding awards to satisfy tax withholding obligations, which may be deemed to be available for awards under the plans as permitted under the applicable share counting rules of the plans.
Stockholder Return Performance Graph
The following graph compares the cumulative total stockholder return over the five-year period ended December 31,
2012 of our common stock, the Nasdaq Composite Index and an index of peer group companies that operate in industries or
lines of business similar to ours.
The peer group index consists of Bally Technologies, Inc. (New York Stock Exchange ("NYSE"): BYI), IGT (NYSE:
IGT), WMS (NYSE: WMS), Multimedia Games, Inc. (Nasdaq Global Select Market: MGAM), Aristocrat Leisure Limited
(Australian Securities Exchange: ALL), Lottomatica (BorsaItaliana S.p.A.: LTO), Intralot (Athens Stock Exchange: INLOT),
Pollard (Toronto Stock Exchange: PLB.UN-TO) and Playtech Limited (AIM: PTEC).
The companies in each peer group have been weighted based on their relative market capitalization each year. The graph
assumes that $100 was invested in our common stock, the Nasdaq Composite Index and the peer group index at the beginning
of the five-year period and that all dividends were reinvested. The comparisons are not intended to be indicative of future
performance of our common stock.
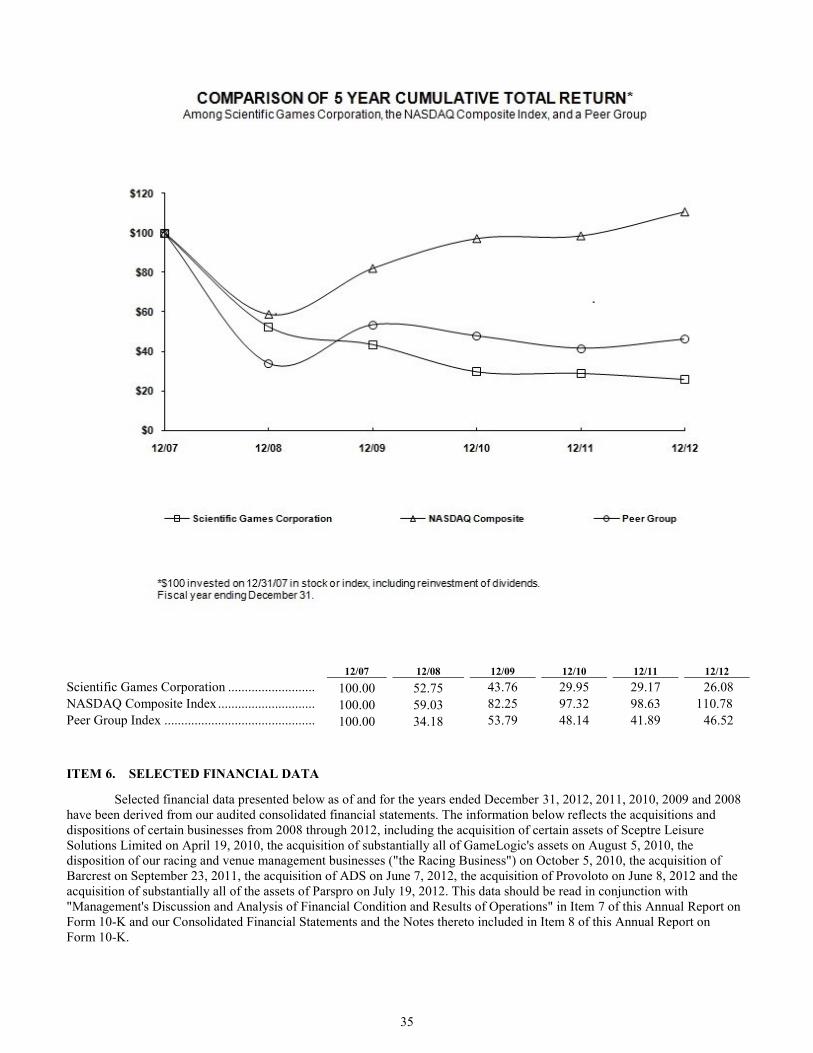
35
12/07 12/08 12/09 12/10 12/11 12/12
Scientific Games Corporation .......................... 100.00 52.75 43.76 29.95 29.17 26.08
NASDAQ Composite Index ............................. 100.00 59.03 82.25 97.32 98.63 110.78
Peer Group Index ............................................. 100.00 34.18 53.79 48.14 41.89 46.52
ITEM 6. SELECTED FINANCIAL DATA
Selected financial data presented below as of and for the years ended December 31, 2012, 2011, 2010, 2009 and 2008
have been derived from our audited consolidated financial statements. The information below reflects the acquisitions and
dispositions of certain businesses from 2008 through 2012, including the acquisition of certain assets of Sceptre Leisure
Solutions Limited on April 19, 2010, the acquisition of substantially all of GameLogic's assets on August 5, 2010, the
disposition of our racing and venue management businesses ("the Racing Business") on October 5, 2010, the acquisition of
Barcrest on September 23, 2011, the acquisition of ADS on June 7, 2012, the acquisition of Provoloto on June 8, 2012 and the
acquisition of substantially all of the assets of Parspro on July 19, 2012. This data should be read in conjunction with
"Management's Discussion and Analysis of Financial Condition and Results of Operations" in Item 7 of this Annual Report on
Form 10-K and our Consolidated Financial Statements and the Notes thereto included in Item 8 of this Annual Report on
Form 10-K.
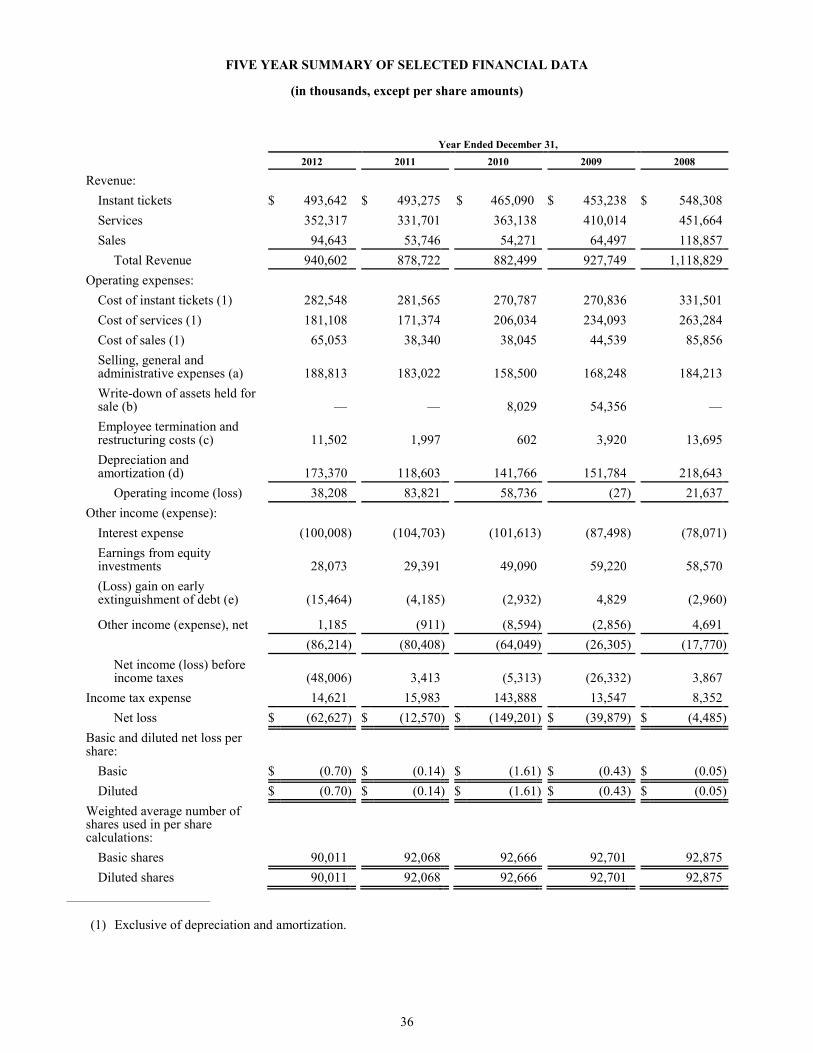
36
FIVE YEAR SUMMARY OF SELECTED FINANCIAL DATA
(in thousands, except per share amounts)
Year Ended December 31,
2012 2011 2010 2009 2008
Revenue:
Instant tickets $ 493,642 $ 493,275 $ 465,090 $ 453,238 $ 548,308
Services 352,317 331,701 363,138 410,014 451,664
Sales 94,643 53,746 54,271 64,497 118,857
Total Revenue 940,602 878,722 882,499 927,749 1,118,829
Operating expenses:
Cost of instant tickets (1) 282,548 281,565 270,787 270,836 331,501
Cost of services (1) 181,108 171,374 206,034 234,093 263,284
Cost of sales (1) 65,053 38,340 38,045 44,539 85,856
Selling, general and administrative expenses (a) 188,813 183,022 158,500 168,248 184,213
Write-down of assets held for sale (b) — — 8,029 54,356 —
Employee termination and restructuring costs (c) 11,502 1,997 602 3,920 13,695
Depreciation and amortization (d) 173,370 118,603 141,766 151,784 218,643
Operating income (loss) 38,208 83,821 58,736 (27 ) 21,637
Other income (expense):
Interest expense (100,008 ) (104,703 ) (101,613 ) (87,498 ) (78,071 )
Earnings from equity investments 28,073 29,391 49,090 59,220 58,570
(Loss) gain on early extinguishment of debt (e) (15,464 ) (4,185 ) (2,932 ) 4,829 (2,960 )
Other income (expense), net 1,185 (911 ) (8,594 ) (2,856 ) 4,691
(86,214 ) (80,408 ) (64,049 ) (26,305 ) (17,770 )
Net income (loss) before income taxes (48,006 ) 3,413 (5,313 ) (26,332 ) 3,867
Income tax expense 14,621 15,983 143,888 13,547 8,352
Net loss $ (62,627 ) $ (12,570 ) $ (149,201 ) $ (39,879 ) $ (4,485 )
Basic and diluted net loss per share:
Basic $ (0.70 ) $ (0.14 ) $ (1.61 ) $ (0.43 ) $ (0.05 )
Diluted $ (0.70 ) $ (0.14 ) $ (1.61 ) $ (0.43 ) $ (0.05 )
Weighted average number of shares used in per share calculations:
Basic shares 90,011 92,068 92,666 92,701 92,875
Diluted shares 90,011 92,068 92,666 92,701 92,875
___________________________
(1) Exclusive of depreciation and amortization.
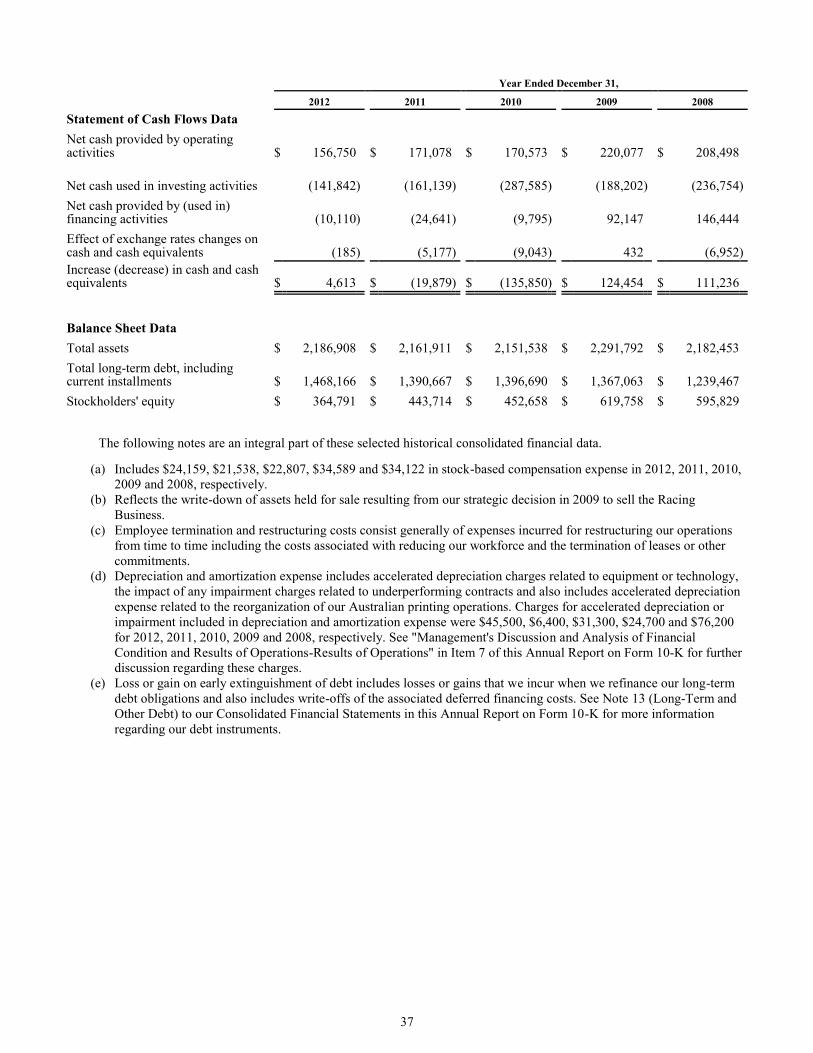
37
Year Ended December 31,
2012 2011 2010 2009 2008
Statement of Cash Flows Data
Net cash provided by operating activities $ 156,750 $ 171,078 $ 170,573 $ 220,077 $ 208,498
Net cash used in investing activities (141,842 ) (161,139 ) (287,585 ) (188,202 ) (236,754 )
Net cash provided by (used in) financing activities (10,110 ) (24,641 ) (9,795 ) 92,147 146,444
Effect of exchange rates changes on cash and cash equivalents (185 ) (5,177 ) (9,043 ) 432 (6,952 )
Increase (decrease) in cash and cash equivalents $ 4,613 $ (19,879 ) $ (135,850 ) $ 124,454 $ 111,236
Balance Sheet Data
Total assets $ 2,186,908 $ 2,161,911 $ 2,151,538 $ 2,291,792 $ 2,182,453
Total long-term debt, including current installments $ 1,468,166 $ 1,390,667 $ 1,396,690 $ 1,367,063 $ 1,239,467
Stockholders' equity $ 364,791 $ 443,714 $ 452,658 $ 619,758 $ 595,829
The following notes are an integral part of these selected historical consolidated financial data.
(a) Includes $24,159, $21,538, $22,807, $34,589 and $34,122 in stock-based compensation expense in 2012, 2011, 2010,
2009 and 2008, respectively.
(b) Reflects the write-down of assets held for sale resulting from our strategic decision in 2009 to sell the Racing
Business.
(c) Employee termination and restructuring costs consist generally of expenses incurred for restructuring our operations
from time to time including the costs associated with reducing our workforce and the termination of leases or other
commitments.
(d) Depreciation and amortization expense includes accelerated depreciation charges related to equipment or technology,
the impact of any impairment charges related to underperforming contracts and also includes accelerated depreciation
expense related to the reorganization of our Australian printing operations. Charges for accelerated depreciation or
impairment included in depreciation and amortization expense were $45,500, $6,400, $31,300, $24,700 and $76,200
for 2012, 2011, 2010, 2009 and 2008, respectively. See "Management's Discussion and Analysis of Financial
Condition and Results of Operations-Results of Operations" in Item 7 of this Annual Report on Form 10-K for further
discussion regarding these charges.
(e) Loss or gain on early extinguishment of debt includes losses or gains that we incur when we refinance our long-term
debt obligations and also includes write-offs of the associated deferred financing costs. See Note 13 (Long-Term and
Other Debt) to our Consolidated Financial Statements in this Annual Report on Form 10-K for more information
regarding our debt instruments.
38
ITEM 7. MANAGEMENT'S DISCUSSION AND ANALYSIS OF FINANCIAL CONDITION AND RESULTS OF
OPERATIONS
The following Management's Discussion and Analysis ("MD&A") is intended to enhance the reader's understanding
of our operations and current business environment. This MD&A should be read in conjunction with the description of our
business (Item 1 of this Annual Report on Form 10-K) and our Consolidated Financial Statements and Notes thereto (Item 8 of
this Annual Report on Form 10-K).
This MD&A also contains forward-looking statements and should be read in conjunction with the disclosures and
information contained under "Forward-Looking Statements" at the beginning of this Annual Report on Form 10-K and "Risk
Factors" (Item 1A of this Annual Report on Form 10-K).
As used in this MD&A, the terms "we," "us," "our" and the "Company" mean Scientific Games Corporation together
with its consolidated subsidiaries.
Business Overview
General
We are a global leader in providing customized, end-to-end gaming solutions to lottery and gaming organizations
worldwide. Our integrated array of products and services includes instant lottery games, lottery gaming systems, terminals and
services, and internet applications, as well as server-based gaming terminals and associated gaming control systems. We also
gain access to technology and pursue global expansion through strategic supply agreements, acquisitions and equity
investments.
We report our operations in three business segments: Printed Products, Lottery Systems and Gaming. Our revenue is
classified as instant tickets revenue, service revenue and sales revenue. Instant tickets revenue includes revenue related to our
instant lottery ticket fulfillment and services businesses, including our brand licensing and Properties Plus businesses. Revenue
generated from our sales of lottery systems, terminals, gaming terminals, gaming content and phone cards, which sales are
typically non-recurring in nature and not subject to multi-year supply agreements, is categorized as sales revenue. All other
revenue generated from Lottery Systems (including revenue from the validation of instant tickets and other systems
management contracts) and Gaming is classified as service revenue. Certain unallocated expenses managed at the corporate
level, comprised primarily of general and administrative costs and other income and expense are not allocated to our reportable
segments. See “Business Segment Results” below and Note 2 (Business and Geographic Segments) to the Consolidated
Financial Statements in this Annual Report on Form 10-K for additional business segment information.
The discussion below highlights certain key drivers of our business and certain known trends, demands, commitments,
events and uncertainties that have affected our recent, and may affect our future, financial and operating performance.
Pending Merger with WMS
On January 30, 2013, we entered into a merger agreement with WMS, SGI, and SG California Merger Sub, Inc., a
Delaware corporation and a wholly owned subsidiary of Scientific Games (“Merger Sub”).
The merger agreement provides for the merger of Merger Sub with and into WMS, with WMS surviving the merger as
a wholly owned subsidiary of Scientific Games. In the merger, each outstanding share of common stock, par value $0.50 per
share, of WMS, other than any dissenting shares, restricted shares, shares held by Scientific Games or Merger Sub and WMS
treasury shares, will be cancelled and converted into the right to receive $26.00 in cash, without interest (the “Merger
Consideration”).
At the effective time of the merger, each outstanding WMS stock option granted prior to January 30, 2013 will be
cancelled in exchange for the right of the holder to receive a lump sum cash payment equal to the number of shares underlying
the WMS stock option multiplied by the excess of the Merger Consideration over the exercise price, if any. In addition, each
outstanding award of WMS restricted shares, restricted stock units and phantom units will be cancelled as of the effective time,
in exchange for the right of the holder to receive a lump sum cash payment equal to the Merger Consideration multiplied by the
number of shares underlying each award, except for certain equity awards that are permitted to be granted by WMS following
January 30, 2013 (including employee stock options), which will be converted into equivalent awards of Scientific Games
using a customary exchange ratio of WMS' stock price to Scientific Games' stock price on the closing date. As of the effective
time, each outstanding award of WMS performance units will be cancelled in exchange for the right of the holder to receive a
lump sum cash payment equal to the Merger Consideration multiplied by the number of shares underlying the performance
units at the applicable payout percentage, which will be 100% unless the relevant performance targets are met or exceeded as of
the effective time, in which case the payout percentage will be determined based on actual performance.
39
The closing of the merger is subject to customary closing conditions, including approval of the merger by WMS
stockholders and approvals by various regulatory authorities. The parties have agreed that receipt of gaming approvals from
approximately 50 jurisdictions is a condition to closing of the merger, provided that receipt of gaming approvals from
approximately 30 of these jurisdictions will cease to be a condition to closing from and after October 31, 2013. We believe that
the approximately 50 jurisdictions include the material jurisdictions from which gaming approvals will be required prior to
closing. We believe that the approximately 20 jurisdictions with respect to which approvals are a condition to any closing
include the material jurisdictions where we anticipate longer lead times for obtaining approvals. Scientific Games is entitled to
a 20 consecutive business day financing marketing period if all gaming approvals are received prior to October 31, 2013.
Under the merger agreement, WMS may not initiate, solicit or knowingly encourage competing proposals or
participate in any discussions or negotiations regarding alternative business combination transactions.
The merger agreement contains certain termination rights for both Scientific Games and WMS and further provides
that, in connection with termination of the merger agreement under specified circumstances, (i) we may be required to pay to
WMS a termination fee of $100.0 million if all the conditions to closing have been met and the merger is not consummated
because of a breach by our lenders of their obligations to finance the transaction, (ii) we may be required to pay to WMS a
termination fee of $80.0 million if we are unable to obtain the gaming approvals that are conditions to closing prior to the
termination date, and (iii) WMS may be required to pay to us a termination fee of $44.3 million under specified circumstances,
including, but not limited to, a change in the WMS board's recommendation of the merger or termination of the merger
agreement by WMS to enter into a written definitive agreement for a “superior proposal” (as defined in the merger agreement).
In connection with the merger agreement, Scientific Games and SGI entered into a commitment letter with Bank of
America, N.A., Credit Suisse AG and UBS AG, Stamford Branch and certain of their respective affiliates, which was
subsequently amended and restated on February 19, 2013 to add J.P. Morgan Securities LLC, the Royal Bank of Scotland,
Deutsche Bank AG New York Branch, Goldman Sachs Bank USA and HSBC Securities (USA) Inc. and certain of their
respective affiliates as additional commitment parties. Pursuant to the commitment letter, the commitment parties have agreed
to provide the financing necessary to fund the consideration to be paid pursuant to the terms of the merger agreement (the
“Debt Commitment Financing”). The Debt Commitment Financing is anticipated to consist of a senior secured first-lien term
loan facility in a total principal amount of $2,300.0 million and a senior secured first-lien revolving credit facility in a total
principal amount of $300.0 million. The funding of the Debt Commitment Financing is contingent on the satisfaction of certain
conditions set forth in the commitment letter. The merger is not conditioned on our obtaining the proceeds of any financing,
including the financing contemplated by the commitment letter.
In connection with the merger, we currently expect to incur regulatory costs, professional fees and other expenses
totaling approximately $4.0 million to $6.0 million in the first quarter of 2013, with additional transaction-related fees and
expenses anticipated to be incurred throughout the balance of 2013.
For further information regarding this pending acquisition and the Debt Commitment Financing, please see the full
text of the merger agreement, a copy of which is filed as exhibit 2.1 to our Current Report on Form 8-K filed with the SEC on
February 5, 2013, and the full text of the commitment letter, a copy of which is filed as exhibit 10.68 to this Annual Report on
Form 10-K.
Printed Products
Retail sales of instant tickets can be a key performance indicator of our instant ticket revenue, although there may not
always be a direct correlation between retail sales and our instant ticket revenue due to the type of contract (e.g., PPK versus
POS or CSP contracts), the impact of changes in our customer contracts, the performance of our licensed properties business or
other factors. Based on third-party data, our customers' total instant ticket lottery retail sales in the U.S. increased 9.1% for the
year ended December 31, 2012 compared to 2011. Most of our U.S. customers reported year-over-year growth in retail sales of
instant lottery tickets, which we believe was driven by a variety of factors, including product innovation, better instant ticket
product management, prize payout increases, lottery private management and sales of higher price-point tickets. We believe
that, as of the date of this Annual Report on Form 10-K, U.S. instant ticket retail sales during the first quarter of 2013 appear to
be soft relative to the first quarter of 2012, when U.S. retail sales of instant tickets grew over 12%.
Our licensed game contracts are generally game-specific and therefore short-term and non-recurring. Our instant ticket
revenue may be negatively impacted to the extent we are unable to continue to win licensed game-specific or multi-state game
contracts. There has been increased interest within the lottery industry in player loyalty programs, which we believe may result
in further growth opportunities for our Properties Plus loyalty program, which features players clubs, reward programs, second
chance promotional websites and interactive games. During 2012, we commenced new Properties Plus programs for four
lotteries for a total of seven active programs as of December 31, 2012. In February 2013, the Maryland lottery signed an
agreement with us for a Properties Plus program and we are in active discussions with several other lotteries regarding these
programs, both in the U.S. and internationally.
40
We are the primary supplier of instant lottery tickets for LNS, in which we have a 20% equity investment, which was
awarded the concession to be the exclusive operator of the Italian Gratta e Vinci instant ticket lottery beginning on October 1,
2010. Over the life of the concession, we expect that we will supply no less than 80% of LNS' instant ticket production
requirements. Retail sales for LNS for the year ended December 31, 2012 declined by approximately 3.8% compared to 2011,
which we believe was due in part to a decline in consumer spending related to difficult economic conditions and tax increases
in Italy. We also faced challenging year-over-year retail sales comparisons for the year ended December 31, 2012 in light of the
strong retail sales performance of the Italian instant ticket lottery during the prior year.
Northstar, in which we have a 20% equity investment, commenced operations as the private manager of the Illinois
lottery on July 1, 2011 under the PMA with the State of Illinois. Under our CSP agreement with Northstar, we are responsible
for the design, development, manufacturing, warehousing and distribution of instant lottery tickets and are compensated based
on a percentage of retail sales. Illinois lottery instant ticket sales increased approximately 22.6% for the year ended December
31, 2012. Our POS-based instant lottery ticket revenue for the year ended December 31, 2012 reflected our CSP agreement
with Northstar which commenced on July 1, 2011.
Northstar is entitled to reimbursement on a monthly basis for most of its operating expenses under the PMA, although
certain expenses of Northstar associated with managing the lottery are not reimbursable. Northstar is also entitled to receive
annual incentive compensation payments from the State to the extent it is successful in increasing the lottery's net income (as
defined in the PMA) above specified target levels, subject to a cap of 5% of the applicable year's net income. Northstar will be
responsible for payments to the State to the extent such targets are not achieved, subject to a similar cap. The lottery net income
targets set forth in Northstar's successful bid for the PMA were $851 million, $950 million, $980 million, $986 million and
$1 billion for the five fiscal years ending June 30, 2012, 2013, 2014, 2015 and 2016, respectively, representing a cumulative
growth rate in lottery net income over such time period of approximately 49%.
These net income target levels are subject to upward or downward adjustment under certain circumstances in
accordance with the terms of the PMA. Northstar may seek downward adjustments to the net income targets in the event certain
actions of the State (or the federal government) have a material adverse effect on the lottery's net income and Northstar's ability
to receive incentive compensation payments. On November 6, 2012, an arbitrator determined that Northstar is entitled to a
$28.4 million downward adjustment to the net income target for the lottery's 2012 fiscal year and a $2.9 million downward
adjustment to the net income target for the lottery's 2013 fiscal year. We understand that the State has objected to the
arbitrator's determination. As of the date of this Annual Report on Form 10-K, it is unclear if these adjusted net income targets
are final or subject to further review or adjustment. Accordingly, as of the date of this Annual Report on Form 10-K, Northstar
is unable to estimate, and therefore has not recorded, any amounts in respect of annual incentive compensation or net income
shortfall payments for the year ended December 31, 2012.
As U.S. and international jurisdictions increasingly look towards lottery and gaming as a source to grow revenue, we
believe there will be continued interest in pursuing an outsourcing model whereby the day-to-day management of lotteries are
conducted by a third party, similar to the PMA model in Illinois. To the extent any of our lottery customers enter into a private
management agreement, such lottery customer or the private manager may terminate our existing contract(s) with the lottery
customer as part of the transition to the private management model. The Indiana lottery recently awarded a private management
agreement to one of our competitors. We expect to enter into an instant ticket lottery contract with the manager of the Indiana
lottery that is expected to commence in April 2013 following the expiration of our current instant ticket lottery contract with
the Indiana lottery.
We recently assisted the Commonwealth of Pennsylvania in its potential procurement of a private management
agreement for the Pennsylvania lottery. In light of our role in the process, we did not bid for the private management agreement
in Pennsylvania. On January 11, 2013, the Commonwealth issued a notice of award of the private management agreement to a
bidder. On February 14, 2013, the Pennsylvania Attorney General rejected the agreement as unlawful. We cannot be certain as
to the status of the private management agreement or what the ultimate resolution of this privatization effort will be at this time.
Under our current contracts with the Pennsylvania lottery, we are the exclusive provider of instant lottery tickets and lottery
systems and services in Pennsylvania through August 2015 and December 2014, respectively.
In December 2012, we formed Northstar New Jersey with GTECH and OMERS to bid to be the private manager for
the New Jersey Lottery for a 15-year term. If Northstar New Jersey is selected as the private manager, we expect to own a
17.69% equity interest in the joint venture entity that will execute the private management agreement.
Following a strategic review of our global instant lottery ticket business, we commenced a reorganization plan on
April 18, 2012 to cease all printing and finishing activities at our Australia facility, and during the second half of 2012 we
migrated printing for customers in this region to our other manufacturing facilities. We recorded approximately $5.9 million of
employee termination and other restructuring costs associated with the reorganization for the year ended December 31, 2012.
Other restructuring costs include approximately $1.3 million resulting from vacating our facility. In addition, we recorded
41
approximately $3.4 million of accelerated depreciation for equipment related to this reorganization. We do not expect to incur
additional material costs or accelerated depreciation related to this reorganization.
On June 8, 2012, we acquired 100% of the equity interests of Provoloto for approximately $9.7 million, subject to
certain adjustments, including an estimated earn-out payable to the sellers of approximately $2.0 million contingent on the
future performance of the acquired business. Provoloto develops and distributes instant lottery tickets and manages instant
ticket lotteries for Mexican charities. We expect this acquisition to strengthen our presence in Latin America and create a
platform for further expansion in the region. The operating results of Provoloto have been included in our Printed Products
segment and have been consolidated in our results of operations since the date of acquisition. The acquisition did not have a
material impact on our results of operations in 2012.
On December 12, 2012, the Hellenic Republic Asset Development Fund provisionally awarded the consortium in
which we own a 16.5% equity interest a 12-year concession for the exclusive rights to the production, operation and
management of instant ticket lotteries in Greece. The consortium is principally comprised of OPAP S.A., Scientific Games and
Intralot. The concession will cover current and future instant lotteries which are conducted using physical tickets, as well as
internet sales of physical tickets. Operations under the new concession are subject to various regulatory approvals and Greek
parliamentary approval. We will be responsible for providing instant lottery ticket marketing services to the lotteries and expect
to enter into a supply agreement for the exclusive provision of all instant ticket production and game design services to the
consortium. If the award is approved, the consortium will pay an upfront payment of €190 million, of which our portion will be
€31.4 million, and will be responsible for a monthly fee to the lotteries equal to a percentage of gross gaming revenue.
According to third-party data, in 2011, OPAP generated €4.4 billion in total lottery retail sales in Greece, representing
approximately €386 in per capita sales, making it the third largest lottery in the world in terms of per capita sales based on third
party data. The instant ticket lottery has been inactive since 2003.
Lottery Systems
Retail sales of draw games can be a key performance indicator of our lottery systems service revenue, although there
may not always be a direct correlation between retail sales and our lottery systems revenue due to the terms of contract, the
impact of changes in our customer contracts or other factors. Based on third-party data, our Lottery Systems customers' total
draw game retail sales in the U.S. increased 9.7% for the year ended December 31, 2012 compared to 2011. Our Lottery
Systems service revenue in the U.S. increased 10.1% for the year ended December 31, 2012 compared to 2011 due in part to
this improvement in U.S. retail sales. The level of jackpots of the Powerball and Mega Millions multi-state draw lottery games
have an impact on U.S. retail sales, and therefore, our service revenue in any given period. We believe that, as of the date of
this Annual Report on Form 10-K, U.S. draw game retail sales during the first quarter of 2013 appear to be soft relative to the
first quarter of 2012, when U.S. retail sales of draw games grew nearly 16%. In 2011, U.S. lottery directors authorized certain
changes to the Powerball game, including an increase in the ticket price to $2, which went into effect on January 15, 2012. The
industry experienced the largest Powerball jackpot in history ($587.5 million) and the largest Mega Millions jackpot in history
($656 million) during the year ended December 31, 2012. Our Lottery Systems service revenue is also impacted by retail sales
of instant lottery tickets where we provide instant lottery ticket validation services as part of a lottery systems contract. Our
Lottery Systems sales revenue primarily relates to one-time sales of equipment and is non-recurring in nature.
In June 2012, we executed a four-year extension of our contract to provide lottery systems and services, along with
instant tickets, to Loteria Electronica in Puerto Rico. In June 2012, we executed a one-year extension of our lottery systems
contract with the Maine lottery. In August 2012, Maine issued a lottery systems and instant lottery ticket RFP that we
responded to in October 2012. We understand the State is still evaluating the bids it received. The Indiana lottery recently
awarded a private management agreement to one of our competitors. We expect that our lottery systems contract with the
Indiana lottery will be terminated in connection with the commencement of the private management model in Indiana. On
January 11, 2013, we entered into an agreement with the new manager of the Indiana lottery to provide existing lottery systems
equipment and services through August 2016 which is expected to commence in April 2013. On February 18, 2013, we
executed a five-year extension of our lottery systems contract with the Connecticut lottery.
We are the exclusive instant ticket validation network provider to the CSL. The POS rate we receive under our China
instant ticket validation contract decreased by 0.1% in January 2012 and is scheduled to decrease by an additional 0.1% in
January 2014, in accordance with the contract.
In China, we have seen a recent decline in our instant ticket validation revenue and our joint venture's instant ticket
printing revenue as instant ticket retail sales of the CSL decreased approximately 10.0% for the year ended December 31, 2012
compared to 2011. We continue to believe there is sustained consumer demand for lottery products in China, as retail sales of
the entire lottery segment grew by 18% in 2012 compared to 2011, but that competition from other lottery products is
impacting instant ticket sales. We remain focused on improving sales trends by expanding the lottery retailer network and
increasing our involvement in the game selection process. We believe it will take some time for any such actions to take effect.
42
To the extent we are not able to successfully implement these remedial actions and offset our CSL contract rate reductions by
retail sales growth, our revenue and profitability may be adversely affected.
On April 7, 2012, we signed a five-year agreement in China to provide sales and distribution management services to
the Hubei Sports Lottery. The agreement is similar to the CSP contracts we have with many of our North American and
European customers. We expect that these services will assist the Hubei Sports Lottery in achieving higher retail sales and
lower operating costs. We expect operations under the contract to commence in 2013.
We entered into a contract, effective in December 2011, to design, implement and administer our AEGIS-Video™
Central Management and Control System (CMCS) for the Illinois Gaming Board. Under the terms of the contract, we will
provide real-time communication and control between every licensed video gaming terminal in the State of Illinois, as well as
day-to-day management of the CMCS throughout the State. The contract was awarded through a competitive procurement
process, has an initial term of six years and may be extended by mutual agreement for up to four additional years. Operations
under the contract commenced on October 9, 2012.
On July 19, 2012, we acquired substantially all of the assets of Parspro for approximately $11.8 million. Parspro is a
provider of sports betting systems and related products via point of sale terminals, the internet and mobile devices. The
acquired assets include technology that we expect to integrate into our Lottery Systems business and our interactive game
platform as part of an expanded service offering to lottery customers. The operating results of Parspro have been included in
our Lottery Systems segment and have been consolidated in our results of operations since the date of acquisition. The
acquisition did not have a material impact on our results of operations for the year ended December 31, 2012.
Gaming
In our U.K. gaming terminal business, our compensation is typically based on gross win (i.e., amount bet less player
winnings) generated by our gaming terminals (subject to certain adjustments as may be specified in a particular contract,
including adjustments for taxes and other fees). Our Gaming service revenue is therefore impacted by the size of our installed
gaming terminal base and the gross win generated by our terminals. Our Gaming sales revenue is generally non-recurring in
nature.
Our U.K. LBO contracts generally have initial terms of two to four years with potential extensions. Our gross win per
terminal per day increased approximately 5.0% for the year ended December 31, 2012 compared to 2011. We had an installed
base of approximately 21,200 and 23,100 LBO gaming terminals in the U.K. as of December 31, 2012 and 2011, respectively.
In 2011, we completed the migration of our server-based gaming terminals in the U.K. to a new back-end technology platform
and migrated the majority of our server-based gaming terminals outside the U.K. to this technology during 2012. As of June 30,
2011, we completed the installation of approximately 8,000 gaming terminals for the entire Ladbrokes Betting and Gaming
Ltd. LBO estate in accordance with the contract awarded to us in 2010. In January 2012, William Hill, a U.K. bookmaker,
awarded a contract for the exclusive supply of gaming terminals to its entire LBO estate to one of our competitors. Our contract
with William Hill expired in March 2013, resulting in a decrease in deployed gaming terminals of approximately 1,900. The
loss of this contract impacted our installed gaming terminal base and our results of operations in 2012. On October 5, 2012, we
extended an agreement to continue as the exclusive provider of gaming terminals for Gala Coral, a major U.K. bookmaker,
through December 31, 2017.
On June 7, 2012, we acquired ADS for £3.5 million, subject to certain adjustments. ADS provides maintenance and
other services for LBOs in the U.K. We have integrated the acquisition into our existing Gaming business and we expect that
the acquisition will allow us to expand the services we provide to our LBO customers. The operating results of ADS have been
included in our Gaming segment and have been consolidated in our results of operations since the date of acquisition. The
acquisition did not have a material impact on our results of operations for the year ended December 31, 2012.
On September 23, 2011, we completed the acquisition of Barcrest, a leading supplier of gaming content, platforms and
systems to gaming operators in the U.K. and continental Europe, including pubs, LBOs, bingo halls and arcades. The
acquisition provides us with an expansive library of gaming titles and properties, as well as an existing base of business in
interactive gaming in which Barcrest game content is made available through internet, mobile and other digital delivery
channels. We had an installed base of approximately 4,800 and 6,100 gaming terminals in our U.K. pub, bingo hall and arcade
business as of December 31, 2012 and 2011, respectively. The comparability of our 2012 results of operations with our 2011
results of operations is impacted by the Barcrest acquisition.
In January 2012, following a comprehensive strategic review, we announced our exit from the Barcrest analog
terminal business in order to focus our game design and other resources solely on our digital server-based supply model. We
also reorganized our pub business in an effort to more effectively capitalize on the Barcrest acquisition. In 2012, we recorded
approximately $5.7 million of employee termination and restructuring costs associated with the reorganization. Other
restructuring costs include approximately $1.4 million resulting from vacating facilities. We do not expect to incur additional
43
material costs or accelerated depreciation related to this reorganization. We continue to review strategic alternatives for our pub
business.
We continue to seek to expand our server-based gaming terminal business outside the U.K., with current deployments
in the Caribbean, Czech Republic, Mexico and Puerto Rico. We had an installed base of approximately 5,100 and 6,500
gaming terminals outside of the U.K. as of December 31, 2012 and 2011, respectively. In April 2012, approximately 1,400
video lottery terminals operated by SNAI in Italy and supplied by Barcrest were deactivated following the erroneous printing of
what appeared to be winning jackpot and other tickets. The deactivation of the terminals negatively impacted the Gaming
results of operations during 2012. See "Legal Proceedings" in Item 3 of this Annual Report on Form 10-K for further
information
In late 2010, the U.K. government announced its intention to change the taxation of gaming machines by replacing the
currently applicable amusement machine license duty and the value-added tax with a new machine games duty, or MGD, based
on the gross win generated by a gaming machine. In a budget statement issued in March 2012, the U.K. government announced
a standard MGD rate of 20% on gross win, effective February 1, 2013. These tax changes may negatively impact our gaming
machine customers' businesses and, therefore, could negatively impact our business in 2013.
Competition and Foreign Currency Risk
We believe we are likely to continue to experience a highly competitive environment for U.S. and international
customer contracts in connection with bids, re-bids, extensions and renewals, which could lead to loss of contracts, rate or
volume reductions and additional service requirements in contracts that we win or retain. See the table “Business - Contract
Procurement” in Item 1 of this Annual Report on Form 10-K for additional information regarding our customer contracts,
including when they may become subject to re-bid, extension, or renewal. Our strategy to mitigate these industry trends
includes working with our customers to grow their sales through a variety of methods including launching new products and
services, implementing innovative technologies and marketing tools, and expanding retail distribution.
We derived approximately 53% and 52% of our annual revenue from sales to customers outside of the U.S. in 2012
and 2011, respectively and are affected by fluctuations in foreign currency exchange rates, particularly the British Pound
Sterling and the Euro. The British Pound Sterling and the Euro represented, respectively, approximately $246 million, or
26.1%, and $65 million, or 6.9%, of our consolidated revenue for the year ended December 31, 2012. Historically, foreign
currency fluctuations have impacted our revenue more than our expenses, as a portion of our raw materials, such as paper, ink
and point-of-sale terminals are contracted for in U.S. dollars. We also have foreign currency exposure related to certain of our
equity investments. Our earnings from our Euro-denominated equity investment in LNS were $17.9 million for the year ended
December 31, 2012. Our foreign currency exposure from equity investments denominated in other foreign currencies was not
material in the aggregate for the year ended December 31, 2012. When we refer to the impact of foreign currency exchange rate
fluctuations, we are referring to the difference between the current period rates and the prior period rates applied to the current
period activity.
We manage our foreign currency exchange risks on a global basis by (1) securing payment from our customers in the
functional currency of the selling subsidiary when possible, (2) entering into foreign currency exchange or other contracts to
hedge the risk associated with certain firm sales commitments, net investments and certain assets and liabilities denominated in
foreign currencies and (3) netting asset and liability exposures denominated in similar foreign currencies to the extent possible.
During 2012, we entered into foreign currency forward contracts to hedge a portion of the net investment in one of our
subsidiaries that is denominated in Euros. These foreign currency forward contracts are described in Note 14 (Fair Value
Measurements) to the Consolidated Financial Statements included in this Annual Report on Form 10-K.
Recently Issued Accounting Guidance
In May 2011, the Financial Accounting Standards Board (the "FASB") issued guidance to clarify the intent of the
application of existing fair value measurement and disclosure requirements and amend certain requirements for measuring fair
value or for disclosing information about fair value measurements. The guidance limits the highest-and-best-use measure to
non-financial assets, permits certain financial assets and liabilities with offsetting positions in market or counter-party credit
risks to be measured at a net basis, and provides guidance on the applicability of premiums and discounts in fair value
measurement. Additionally, for fair value measurements categorized within Level 3 of the fair value hierarchy, the new
guidance clarifies that quantitative disclosure about unobservable inputs should be disclosed and requires a description of the
valuation processes and the sensitivity of the fair value measurements to changes in unobservable inputs and the
interrelationships between those inputs. We adopted the guidance on January 1, 2012. The adoption did not have a material
impact on our financial statements.
In June 2011, the FASB issued guidance on presentation of comprehensive income. The guidance eliminates the
option to report other comprehensive income and its components in the statement of stockholders' equity. Instead, an entity is
required to present net income and other comprehensive income either in one continuous statement or in two separate but
44
consecutive statements. We adopted the guidance on January 1, 2012, resulting in a change in the presentation of
comprehensive income for the years ended December 31, 2012, 2011 and 2010.
In February 2013, the FASB issued guidance on presentation of comprehensive income to improve the reporting of
reclassifications out of accumulated other comprehensive income. The guidance is effective prospectively for reporting periods
beginning after December 15, 2012 and early adoption is permitted. The guidance requires an entity to provide information
about the amounts reclassified out of accumulated other comprehensive income by component. In addition, an entity is required
to present, either on the face of the statement where net income is presented or in the notes, significant amounts reclassified out
of accumulated other comprehensive income by the respective line items of net income but only if the amount is required under
U.S. GAAP to be reclassified to net income in its entirety in the same reporting period. For other amounts that are not required
under U.S. GAAP to be reclassified in their entirety to net income, an entity is required to cross-reference to other disclosures
required under U.S. GAAP that provide additional detail about those amounts. We adopted the new guidance on January 1,
2013.
In September 2011, the FASB issued guidance on testing goodwill for impairment. The guidance provides an entity
with the option to first perform a qualitative assessment to determine whether it is more likely than not that the fair value of a
reporting unit is less than its carrying amount. If an entity determines that this is the case, it is required to perform the currently
prescribed two-step goodwill impairment test to identify potential goodwill impairment and measure the amount of goodwill
impairment loss to be recognized for that reporting unit (if any). If an entity determines the fair value of a reporting unit is
greater than its carrying amount, then the two-step goodwill impairment test is not required. We adopted the guidance on
January 1, 2012. The adoption did not have a material impact on our financial statements.
In July 2012, the FASB issued guidance on testing indefinite-lived intangible assets, other than goodwill, for
impairment. The guidance is effective for fiscal years beginning after September 15, 2012 and early adoption is permitted. The
guidance provides an entity with the option to first perform a qualitative assessment to determine whether it is more likely than
not that the indefinite-lived intangible asset is impaired. If, after assessing the totality of events and circumstances, an entity
concludes that it is not more likely than not that the indefinite-lived intangible asset is impaired, then the entity is not required
to take further action. However, if an entity concludes otherwise, then it is required to perform the currently prescribed
quantitative impairment test by comparing the fair value of the asset with the carrying amount. We adopted the guidance on
July 1, 2012. The adoption did not have a material impact on our financial statements.
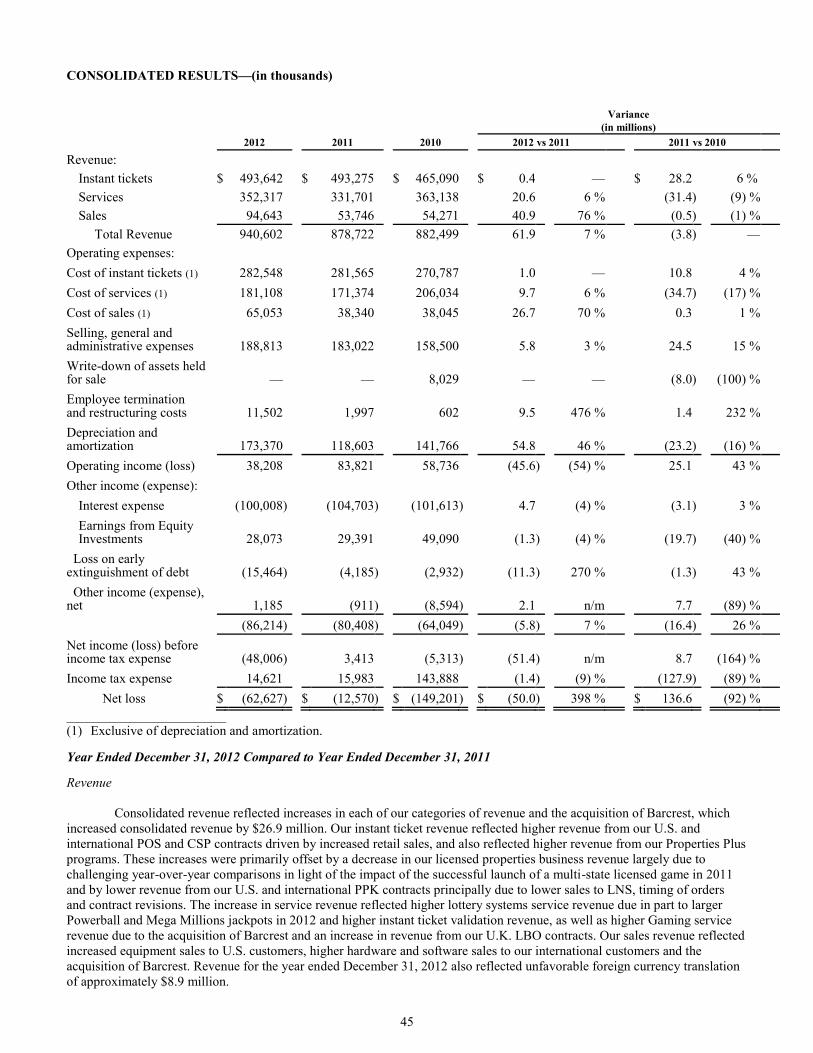
45
CONSOLIDATED RESULTS—(in thousands)
Variance
(in millions)
2012 2011 2010 2012 vs 2011 2011 vs 2010
Revenue:
Instant tickets $ 493,642 $ 493,275 $ 465,090 $ 0.4 — $ 28.2 6 %
Services 352,317 331,701 363,138 20.6 6 % (31.4 ) (9) %
Sales 94,643 53,746 54,271 40.9 76 % (0.5 ) (1) %
Total Revenue 940,602 878,722 882,499 61.9 7 % (3.8 ) —
Operating expenses:
Cost of instant tickets (1) 282,548 281,565 270,787 1.0 — 10.8 4 %
Cost of services (1) 181,108 171,374 206,034 9.7 6 % (34.7 ) (17) %
Cost of sales (1) 65,053 38,340 38,045 26.7 70 % 0.3 1 %
Selling, general and administrative expenses 188,813 183,022 158,500 5.8 3 % 24.5 15 %
Write-down of assets held for sale — — 8,029 — — (8.0 ) (100) %
Employee termination and restructuring costs 11,502 1,997 602 9.5 476 % 1.4 232 %
Depreciation and amortization 173,370 118,603 141,766 54.8 46 % (23.2 ) (16) %
Operating income (loss) 38,208 83,821 58,736 (45.6 ) (54) % 25.1 43 %
Other income (expense):
Interest expense (100,008 ) (104,703 ) (101,613 ) 4.7 (4) % (3.1 ) 3 %
Earnings from Equity Investments 28,073 29,391 49,090 (1.3 ) (4) % (19.7 ) (40) %
Loss on early extinguishment of debt (15,464 ) (4,185 ) (2,932 ) (11.3 ) 270 % (1.3 ) 43 %
Other income (expense), net 1,185 (911 ) (8,594 ) 2.1 n/m 7.7 (89) %
(86,214 ) (80,408 ) (64,049 ) (5.8 ) 7 % (16.4 ) 26 %
Net income (loss) before income tax expense (48,006 ) 3,413 (5,313 ) (51.4 ) n/m 8.7 (164) %
Income tax expense 14,621 15,983 143,888 (1.4 ) (9) % (127.9 ) (89) %
Net loss $ (62,627 ) $ (12,570 ) $ (149,201 ) $ (50.0 ) 398 % $ 136.6 (92) %
______________________________
(1) Exclusive of depreciation and amortization.
Year Ended December 31, 2012 Compared to Year Ended December 31, 2011
Revenue
Consolidated revenue reflected increases in each of our categories of revenue and the acquisition of Barcrest, which
increased consolidated revenue by $26.9 million. Our instant ticket revenue reflected higher revenue from our U.S. and
international POS and CSP contracts driven by increased retail sales, and also reflected higher revenue from our Properties Plus
programs. These increases were primarily offset by a decrease in our licensed properties business revenue largely due to
challenging year-over-year comparisons in light of the impact of the successful launch of a multi-state licensed game in 2011
and by lower revenue from our U.S. and international PPK contracts principally due to lower sales to LNS, timing of orders
and contract revisions. The increase in service revenue reflected higher lottery systems service revenue due in part to larger
Powerball and Mega Millions jackpots in 2012 and higher instant ticket validation revenue, as well as higher Gaming service
revenue due to the acquisition of Barcrest and an increase in revenue from our U.K. LBO contracts. Our sales revenue reflected
increased equipment sales to U.S. customers, higher hardware and software sales to our international customers and the
acquisition of Barcrest. Revenue for the year ended December 31, 2012 also reflected unfavorable foreign currency translation
of approximately $8.9 million.
46
Cost of Revenue
Consolidated cost of revenue increased in 2012 versus 2011 reflecting the increase in consolidated revenue for the
same period. Cost of instant tickets remained consistent with total instant ticket revenue for the same period. The increase in
cost of services and cost of sales in 2012 versus 2011 reflected the increase in service and sales revenue and an increase due to
the impact of foreign currency translation of approximately $5.3 million.
Selling, General and Administrative ("SG&A")
The increase in SG&A reflected approximately $5.4 million of incremental expense from our business acquisitions,
higher compensation expense of $5.8 million (including a $2.6 million increase in stock-based compensation expense), a $6.2
million increase in accounts receivable reserves related to certain gaming customers and higher expenses of $2.9 million related
to the expansion of our U.K. LBO business. These increases were offset by a decrease of $7.1 million in our accrual for
potential incentive compensation related to our Asia-Pacific Plan, a decrease of $5.9 million due to the impact of a customer
claim recorded during the year ended December 31, 2011 and an insurance settlement recovered in 2012 related to that claim,
and lower professional and advisory fees of $3.0 million. The overall increase in SG&A was also offset by a decrease of
approximately $1.0 million due to the impact of foreign currency translation.
Employee Termination and Restructuring
Employee termination and restructuring costs of $11.5 million related to our exit from the Barcrest analog AWP
business, the reorganization of our pub business in an effort to more effectively capitalize on the Barcrest acquisition and the
reorganization of our Australian printing operations.
Depreciation and Amortization
Depreciation and amortization increased principally due to $31.9 million of accelerated depreciation expense in our
gaming business, including $12.5 million related to the write-down of gaming terminals and software in our pub business and
$19.4 million related to a write-down of gaming terminals primarily related to customers transitioning to newer generation
terminals. Depreciation and amortization also increased due to the $5.8 million impairment of certain long-lived assets related
to underperforming contracts in our lottery systems business, $4.4 million of accelerated depreciation expense related to the
write-down of certain development costs in our licensed properties business and $6.8 million of incremental depreciation
expense from the acquisition of Barcrest. In addition, we recorded $3.4 million of accelerated depreciation expense related to
the reorganization of our Australian printing operations. These increases were partially offset by a $6.4 million decrease due to
accelerated depreciation expense recorded in 2011 related to the replacement of our Gaming business technology platform.
Other Income and Expense
Interest expense decreased primarily due to a decline in borrowing costs related to our variable interest rate debt and
the expiration of our interest rate swap in October 2011.
Earnings from equity investments decreased due to lower earnings from most of our equity method investments,
partially offset by an increase in earnings from RCN.
Loss on early extinguishment of debt increased due to the redemption of our 2016 Notes resulting in a charge of $15.5
million comprised primarily of the redemption premium and the write-off of previously deferred financing costs.
Other expense increased principally due to increases in foreign exchange transaction expenses.
Income Tax Expense
Income tax expense was $14.6 million for the year ended December 31, 2012 compared to $16.0 million for the year
ended December 31, 2011. The effective income tax rates for the year ended December 31, 2012 and 2011 were (30.5)% and
468.7%, respectively. The income tax expense in 2012 is primarily attributable to income tax expense in our foreign
jurisdictions. The effective tax rate for 2012 does not include the benefit of the current year U.S. tax loss as a result of the
valuation allowance against our U.S. deferred tax assets.
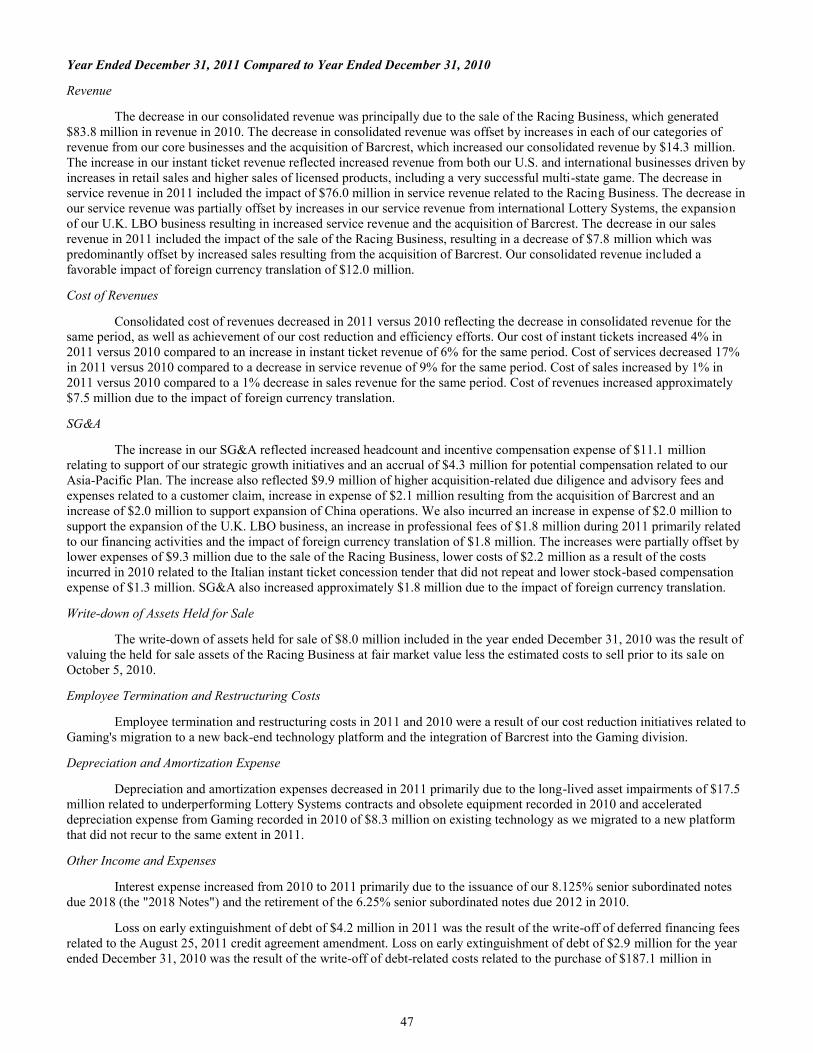
47
Year Ended December 31, 2011 Compared to Year Ended December 31, 2010
Revenue
The decrease in our consolidated revenue was principally due to the sale of the Racing Business, which generated
$83.8 million in revenue in 2010. The decrease in consolidated revenue was offset by increases in each of our categories of
revenue from our core businesses and the acquisition of Barcrest, which increased our consolidated revenue by $14.3 million.
The increase in our instant ticket revenue reflected increased revenue from both our U.S. and international businesses driven by
increases in retail sales and higher sales of licensed products, including a very successful multi-state game. The decrease in
service revenue in 2011 included the impact of $76.0 million in service revenue related to the Racing Business. The decrease in
our service revenue was partially offset by increases in our service revenue from international Lottery Systems, the expansion
of our U.K. LBO business resulting in increased service revenue and the acquisition of Barcrest. The decrease in our sales
revenue in 2011 included the impact of the sale of the Racing Business, resulting in a decrease of $7.8 million which was
predominantly offset by increased sales resulting from the acquisition of Barcrest. Our consolidated revenue included a
favorable impact of foreign currency translation of $12.0 million.
Cost of Revenues
Consolidated cost of revenues decreased in 2011 versus 2010 reflecting the decrease in consolidated revenue for the
same period, as well as achievement of our cost reduction and efficiency efforts. Our cost of instant tickets increased 4% in
2011 versus 2010 compared to an increase in instant ticket revenue of 6% for the same period. Cost of services decreased 17%
in 2011 versus 2010 compared to a decrease in service revenue of 9% for the same period. Cost of sales increased by 1% in
2011 versus 2010 compared to a 1% decrease in sales revenue for the same period. Cost of revenues increased approximately
$7.5 million due to the impact of foreign currency translation.
SG&A
The increase in our SG&A reflected increased headcount and incentive compensation expense of $11.1 million
relating to support of our strategic growth initiatives and an accrual of $4.3 million for potential compensation related to our
Asia-Pacific Plan. The increase also reflected $9.9 million of higher acquisition-related due diligence and advisory fees and
expenses related to a customer claim, increase in expense of $2.1 million resulting from the acquisition of Barcrest and an
increase of $2.0 million to support expansion of China operations. We also incurred an increase in expense of $2.0 million to
support the expansion of the U.K. LBO business, an increase in professional fees of $1.8 million during 2011 primarily related
to our financing activities and the impact of foreign currency translation of $1.8 million. The increases were partially offset by
lower expenses of $9.3 million due to the sale of the Racing Business, lower costs of $2.2 million as a result of the costs
incurred in 2010 related to the Italian instant ticket concession tender that did not repeat and lower stock-based compensation
expense of $1.3 million. SG&A also increased approximately $1.8 million due to the impact of foreign currency translation.
Write-down of Assets Held for Sale
The write-down of assets held for sale of $8.0 million included in the year ended December 31, 2010 was the result of
valuing the held for sale assets of the Racing Business at fair market value less the estimated costs to sell prior to its sale on
October 5, 2010.
Employee Termination and Restructuring Costs
Employee termination and restructuring costs in 2011 and 2010 were a result of our cost reduction initiatives related to
Gaming's migration to a new back-end technology platform and the integration of Barcrest into the Gaming division.
Depreciation and Amortization Expense
Depreciation and amortization expenses decreased in 2011 primarily due to the long-lived asset impairments of $17.5
million related to underperforming Lottery Systems contracts and obsolete equipment recorded in 2010 and accelerated
depreciation expense from Gaming recorded in 2010 of $8.3 million on existing technology as we migrated to a new platform
that did not recur to the same extent in 2011.
Other Income and Expenses
Interest expense increased from 2010 to 2011 primarily due to the issuance of our 8.125% senior subordinated notes
due 2018 (the "2018 Notes") and the retirement of the 6.25% senior subordinated notes due 2012 in 2010.
Loss on early extinguishment of debt of $4.2 million in 2011 was the result of the write-off of deferred financing fees
related to the August 25, 2011 credit agreement amendment. Loss on early extinguishment of debt of $2.9 million for the year
ended December 31, 2010 was the result of the write-off of debt-related costs related to the purchase of $187.1 million in
48
aggregate principal amount of the Company's 2012 Notes and the prepayment of a portion of the outstanding borrowings under
the term loan facilities under the Company's credit agreement.
Earnings from equity investments for 2011 decreased from 2010, which was primarily related to a decline in earnings
from our equity investment in LNS of $20.8 million. The Company's share of earnings from LNS is reported on an after-tax
basis (it was previously reported on a pre-tax basis under the prior equity investment, Consorzio Lotterie Nazionali ("CLN"))
and reflects the amortization of a portion of the upfront fees for the new concession, which together reduced our earnings from
our equity investments by approximately $34.8 million. The decrease was partially offset by an increase in earnings from our
equity investment in CSG of $4.9 million.
In 2010, we incurred a loss on foreign currency forward contracts related to the Italian instant ticket concession tender
of $12.6 million. The foreign currency forward contracts were settled in 2010.
Income Tax Expense
Income tax expense was $16.0 million for the year ended December 31, 2011 compared to $143.9 million for the year
ended December 31, 2010. The effective income tax rates for the years ended December 31, 2011 and 2010 were 468.7% and
(2,708.9)%, respectively. During the year ended December 31, 2010, we recorded a valuation allowance of $149.6 million
against our U.S. deferred tax assets. The income tax expense in 2011 was primarily attributable to income tax expense in our
foreign jurisdictions. The effective tax rate for 2011 does not include the benefit of the 2011 U.S. pre-tax loss as a result of the
valuation allowance against our U.S. deferred tax assets.
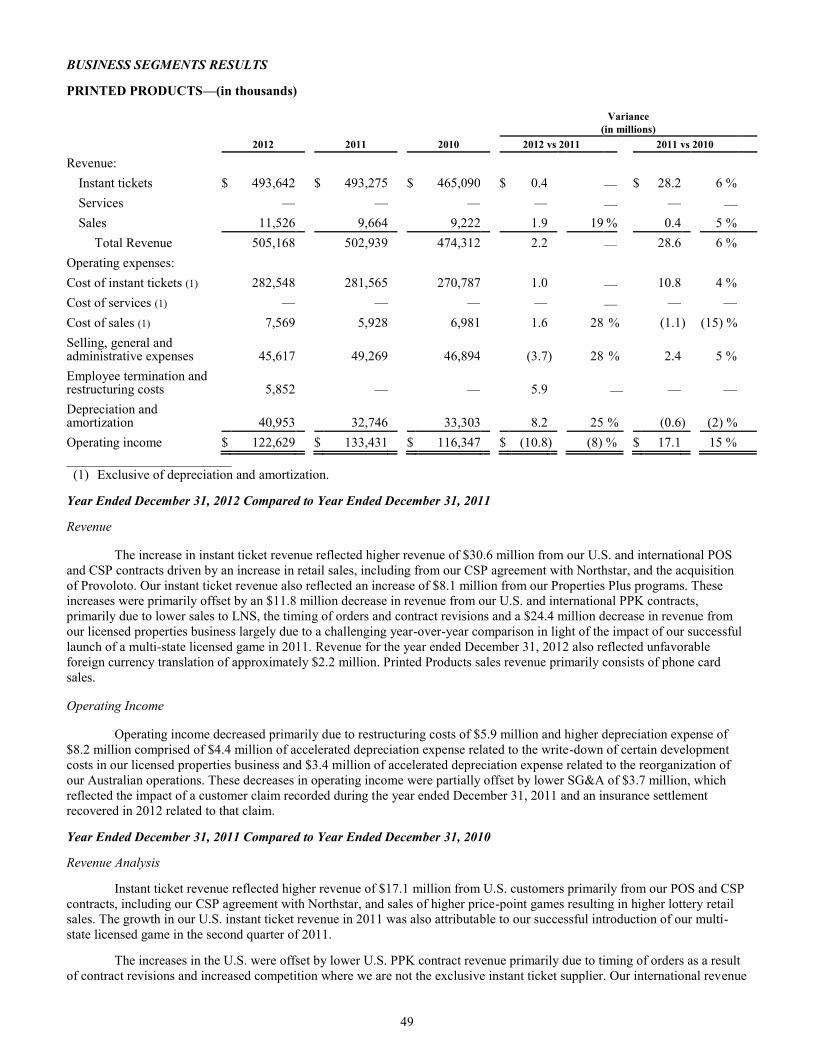
49
BUSINESS SEGMENTS RESULTS
PRINTED PRODUCTS—(in thousands)
Variance
(in millions)
2012 2011 2010 2012 vs 2011 2011 vs 2010
Revenue:
Instant tickets $ 493,642 $ 493,275 $ 465,090 $ 0.4 — $ 28.2 6 %
Services — — — — — — —
Sales 11,526 9,664 9,222 1.9 19 % 0.4 5 %
Total Revenue 505,168 502,939 474,312 2.2 — 28.6 6 %
Operating expenses:
Cost of instant tickets (1) 282,548 281,565 270,787 1.0 — 10.8 4 %
Cost of services (1) — — — — — — —
Cost of sales (1) 7,569 5,928 6,981 1.6 28 %
(1.1 ) (15) %
Selling, general and administrative expenses 45,617 49,269 46,894 (3.7 ) 28 %
2.4 5 %
Employee termination and restructuring costs 5,852 — — 5.9 — — —
Depreciation and amortization 40,953 32,746 33,303 8.2
25 %
(0.6 ) (2) %
Operating income $ 122,629 $ 133,431 $ 116,347 $ (10.8 ) (8) % $ 17.1 15 %
_______________________________
(1) Exclusive of depreciation and amortization.
Year Ended December 31, 2012 Compared to Year Ended December 31, 2011
Revenue
The increase in instant ticket revenue reflected higher revenue of $30.6 million from our U.S. and international POS
and CSP contracts driven by an increase in retail sales, including from our CSP agreement with Northstar, and the acquisition
of Provoloto. Our instant ticket revenue also reflected an increase of $8.1 million from our Properties Plus programs. These
increases were primarily offset by an $11.8 million decrease in revenue from our U.S. and international PPK contracts,
primarily due to lower sales to LNS, the timing of orders and contract revisions and a $24.4 million decrease in revenue from
our licensed properties business largely due to a challenging year-over-year comparison in light of the impact of our successful
launch of a multi-state licensed game in 2011. Revenue for the year ended December 31, 2012 also reflected unfavorable
foreign currency translation of approximately $2.2 million. Printed Products sales revenue primarily consists of phone card
sales.
Operating Income
Operating income decreased primarily due to restructuring costs of $5.9 million and higher depreciation expense of
$8.2 million comprised of $4.4 million of accelerated depreciation expense related to the write-down of certain development
costs in our licensed properties business and $3.4 million of accelerated depreciation expense related to the reorganization of
our Australian operations. These decreases in operating income were partially offset by lower SG&A of $3.7 million, which
reflected the impact of a customer claim recorded during the year ended December 31, 2011 and an insurance settlement
recovered in 2012 related to that claim.
Year Ended December 31, 2011 Compared to Year Ended December 31, 2010
Revenue Analysis
Instant ticket revenue reflected higher revenue of $17.1 million from U.S. customers primarily from our POS and CSP
contracts, including our CSP agreement with Northstar, and sales of higher price-point games resulting in higher lottery retail
sales. The growth in our U.S. instant ticket revenue in 2011 was also attributable to our successful introduction of our multi-
state licensed game in the second quarter of 2011.
The increases in the U.S. were offset by lower U.S. PPK contract revenue primarily due to timing of orders as a result
of contract revisions and increased competition where we are not the exclusive instant ticket supplier. Our international revenue
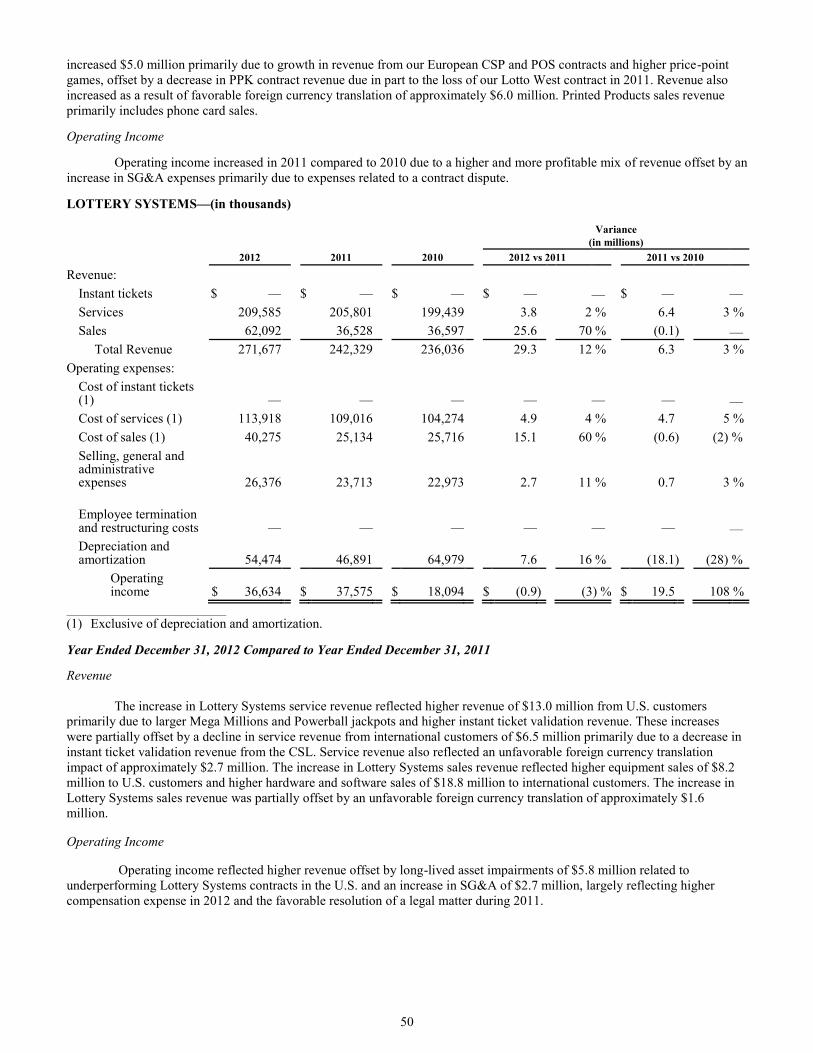
50
increased $5.0 million primarily due to growth in revenue from our European CSP and POS contracts and higher price-point
games, offset by a decrease in PPK contract revenue due in part to the loss of our Lotto West contract in 2011. Revenue also
increased as a result of favorable foreign currency translation of approximately $6.0 million. Printed Products sales revenue
primarily includes phone card sales.
Operating Income
Operating income increased in 2011 compared to 2010 due to a higher and more profitable mix of revenue offset by an
increase in SG&A expenses primarily due to expenses related to a contract dispute.
LOTTERY SYSTEMS—(in thousands)
Variance
(in millions)
2012 2011 2010 2012 vs 2011 2011 vs 2010
Revenue:
Instant tickets $ — $ — $ — $ — — $ — —
Services 209,585 205,801 199,439 3.8 2 % 6.4 3 %
Sales 62,092 36,528 36,597 25.6 70 % (0.1 ) —
Total Revenue 271,677 242,329 236,036 29.3 12 % 6.3 3 %
Operating expenses:
Cost of instant tickets (1) — — — — — — —
Cost of services (1) 113,918 109,016 104,274 4.9 4 % 4.7 5 %
Cost of sales (1) 40,275 25,134 25,716 15.1 60 % (0.6 ) (2) %
Selling, general and administrative expenses 26,376 23,713 22,973 2.7 11 % 0.7 3 %
Employee termination and restructuring costs — — — — — — —
Depreciation and amortization 54,474 46,891 64,979 7.6 16 % (18.1 ) (28) %
Operating income $ 36,634 $ 37,575 $ 18,094 $ (0.9 ) (3) % $ 19.5 108 %
______________________________
(1) Exclusive of depreciation and amortization.
Year Ended December 31, 2012 Compared to Year Ended December 31, 2011
Revenue
The increase in Lottery Systems service revenue reflected higher revenue of $13.0 million from U.S. customers
primarily due to larger Mega Millions and Powerball jackpots and higher instant ticket validation revenue. These increases
were partially offset by a decline in service revenue from international customers of $6.5 million primarily due to a decrease in
instant ticket validation revenue from the CSL. Service revenue also reflected an unfavorable foreign currency translation
impact of approximately $2.7 million. The increase in Lottery Systems sales revenue reflected higher equipment sales of $8.2
million to U.S. customers and higher hardware and software sales of $18.8 million to international customers. The increase in
Lottery Systems sales revenue was partially offset by an unfavorable foreign currency translation of approximately $1.6
million.
Operating Income
Operating income reflected higher revenue offset by long-lived asset impairments of $5.8 million related to
underperforming Lottery Systems contracts in the U.S. and an increase in SG&A of $2.7 million, largely reflecting higher
compensation expense in 2012 and the favorable resolution of a legal matter during 2011.
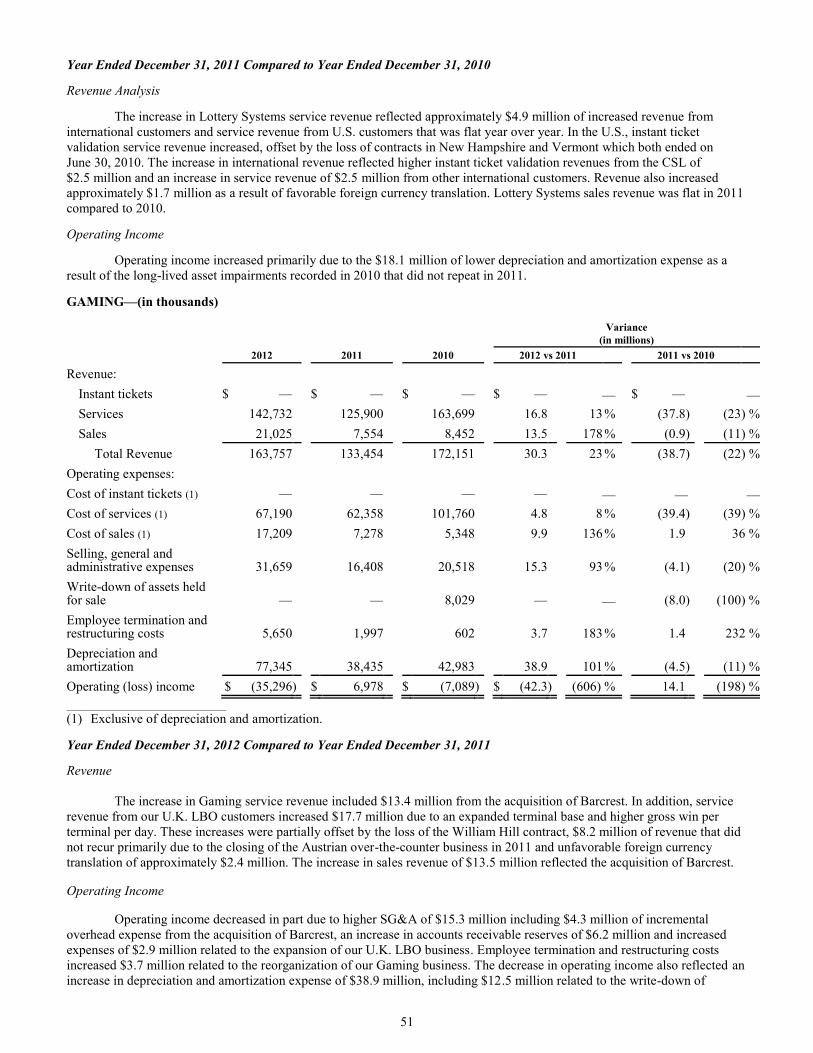
51
Year Ended December 31, 2011 Compared to Year Ended December 31, 2010
Revenue Analysis
The increase in Lottery Systems service revenue reflected approximately $4.9 million of increased revenue from
international customers and service revenue from U.S. customers that was flat year over year. In the U.S., instant ticket
validation service revenue increased, offset by the loss of contracts in New Hampshire and Vermont which both ended on
June 30, 2010. The increase in international revenue reflected higher instant ticket validation revenues from the CSL of
$2.5 million and an increase in service revenue of $2.5 million from other international customers. Revenue also increased
approximately $1.7 million as a result of favorable foreign currency translation. Lottery Systems sales revenue was flat in 2011
compared to 2010.
Operating Income
Operating income increased primarily due to the $18.1 million of lower depreciation and amortization expense as a
result of the long-lived asset impairments recorded in 2010 that did not repeat in 2011.
GAMING—(in thousands)
Variance
(in millions)
2012 2011 2010 2012 vs 2011 2011 vs 2010
Revenue:
Instant tickets $ — $ — $ — $ — — $ — —
Services 142,732 125,900 163,699 16.8 13 % (37.8 ) (23) %
Sales 21,025 7,554 8,452 13.5 178 % (0.9 ) (11) %
Total Revenue 163,757 133,454 172,151 30.3 23 % (38.7 ) (22) %
Operating expenses:
Cost of instant tickets (1) — — — — — — —
Cost of services (1) 67,190 62,358 101,760 4.8 8 % (39.4 ) (39) %
Cost of sales (1) 17,209 7,278 5,348 9.9 136 % 1.9 36 %
Selling, general and administrative expenses 31,659 16,408 20,518 15.3 93 % (4.1 ) (20) %
Write-down of assets held for sale — — 8,029 — — (8.0 ) (100) %
Employee termination and restructuring costs 5,650 1,997 602 3.7 183 % 1.4 232 %
Depreciation and amortization 77,345 38,435 42,983 38.9 101 % (4.5 ) (11) %
Operating (loss) income $ (35,296 ) $ 6,978 $ (7,089 ) $ (42.3 ) (606) % 14.1 (198) %
______________________________
(1) Exclusive of depreciation and amortization.
Year Ended December 31, 2012 Compared to Year Ended December 31, 2011
Revenue
The increase in Gaming service revenue included $13.4 million from the acquisition of Barcrest. In addition, service
revenue from our U.K. LBO customers increased $17.7 million due to an expanded terminal base and higher gross win per
terminal per day. These increases were partially offset by the loss of the William Hill contract, $8.2 million of revenue that did
not recur primarily due to the closing of the Austrian over-the-counter business in 2011 and unfavorable foreign currency
translation of approximately $2.4 million. The increase in sales revenue of $13.5 million reflected the acquisition of Barcrest.
Operating Income
Operating income decreased in part due to higher SG&A of $15.3 million including $4.3 million of incremental
overhead expense from the acquisition of Barcrest, an increase in accounts receivable reserves of $6.2 million and increased
expenses of $2.9 million related to the expansion of our U.K. LBO business. Employee termination and restructuring costs
increased $3.7 million related to the reorganization of our Gaming business. The decrease in operating income also reflected an
increase in depreciation and amortization expense of $38.9 million, including $12.5 million related to the write-down of
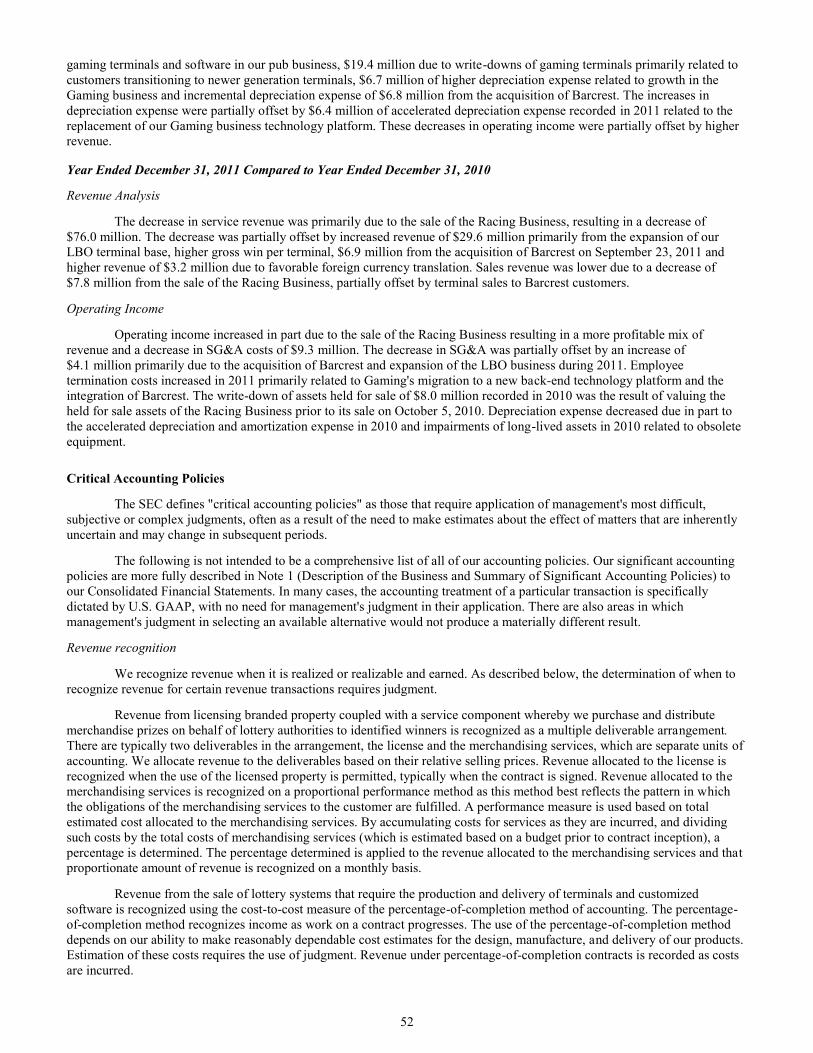
52
gaming terminals and software in our pub business, $19.4 million due to write-downs of gaming terminals primarily related to
customers transitioning to newer generation terminals, $6.7 million of higher depreciation expense related to growth in the
Gaming business and incremental depreciation expense of $6.8 million from the acquisition of Barcrest. The increases in
depreciation expense were partially offset by $6.4 million of accelerated depreciation expense recorded in 2011 related to the
replacement of our Gaming business technology platform. These decreases in operating income were partially offset by higher
revenue.
Year Ended December 31, 2011 Compared to Year Ended December 31, 2010
Revenue Analysis
The decrease in service revenue was primarily due to the sale of the Racing Business, resulting in a decrease of
$76.0 million. The decrease was partially offset by increased revenue of $29.6 million primarily from the expansion of our
LBO terminal base, higher gross win per terminal, $6.9 million from the acquisition of Barcrest on September 23, 2011 and
higher revenue of $3.2 million due to favorable foreign currency translation. Sales revenue was lower due to a decrease of
$7.8 million from the sale of the Racing Business, partially offset by terminal sales to Barcrest customers.
Operating Income
Operating income increased in part due to the sale of the Racing Business resulting in a more profitable mix of
revenue and a decrease in SG&A costs of $9.3 million. The decrease in SG&A was partially offset by an increase of
$4.1 million primarily due to the acquisition of Barcrest and expansion of the LBO business during 2011. Employee
termination costs increased in 2011 primarily related to Gaming's migration to a new back-end technology platform and the
integration of Barcrest. The write-down of assets held for sale of $8.0 million recorded in 2010 was the result of valuing the
held for sale assets of the Racing Business prior to its sale on October 5, 2010. Depreciation expense decreased due in part to
the accelerated depreciation and amortization expense in 2010 and impairments of long-lived assets in 2010 related to obsolete
equipment.
Critical Accounting Policies
The SEC defines "critical accounting policies" as those that require application of management's most difficult,
subjective or complex judgments, often as a result of the need to make estimates about the effect of matters that are inherently
uncertain and may change in subsequent periods.
The following is not intended to be a comprehensive list of all of our accounting policies. Our significant accounting
policies are more fully described in Note 1 (Description of the Business and Summary of Significant Accounting Policies) to
our Consolidated Financial Statements. In many cases, the accounting treatment of a particular transaction is specifically
dictated by U.S. GAAP, with no need for management's judgment in their application. There are also areas in which
management's judgment in selecting an available alternative would not produce a materially different result.
Revenue recognition
We recognize revenue when it is realized or realizable and earned. As described below, the determination of when to
recognize revenue for certain revenue transactions requires judgment.
Revenue from licensing branded property coupled with a service component whereby we purchase and distribute
merchandise prizes on behalf of lottery authorities to identified winners is recognized as a multiple deliverable arrangement.
There are typically two deliverables in the arrangement, the license and the merchandising services, which are separate units of
accounting. We allocate revenue to the deliverables based on their relative selling prices. Revenue allocated to the license is
recognized when the use of the licensed property is permitted, typically when the contract is signed. Revenue allocated to the
merchandising services is recognized on a proportional performance method as this method best reflects the pattern in which
the obligations of the merchandising services to the customer are fulfilled. A performance measure is used based on total
estimated cost allocated to the merchandising services. By accumulating costs for services as they are incurred, and dividing
such costs by the total costs of merchandising services (which is estimated based on a budget prior to contract inception), a
percentage is determined. The percentage determined is applied to the revenue allocated to the merchandising services and that
proportionate amount of revenue is recognized on a monthly basis.
Revenue from the sale of lottery systems that require the production and delivery of terminals and customized
software is recognized using the cost-to-cost measure of the percentage-of-completion method of accounting. The percentage-
of-completion method recognizes income as work on a contract progresses. The use of the percentage-of-completion method
depends on our ability to make reasonably dependable cost estimates for the design, manufacture, and delivery of our products.
Estimation of these costs requires the use of judgment. Revenue under percentage-of-completion contracts is recorded as costs
are incurred.
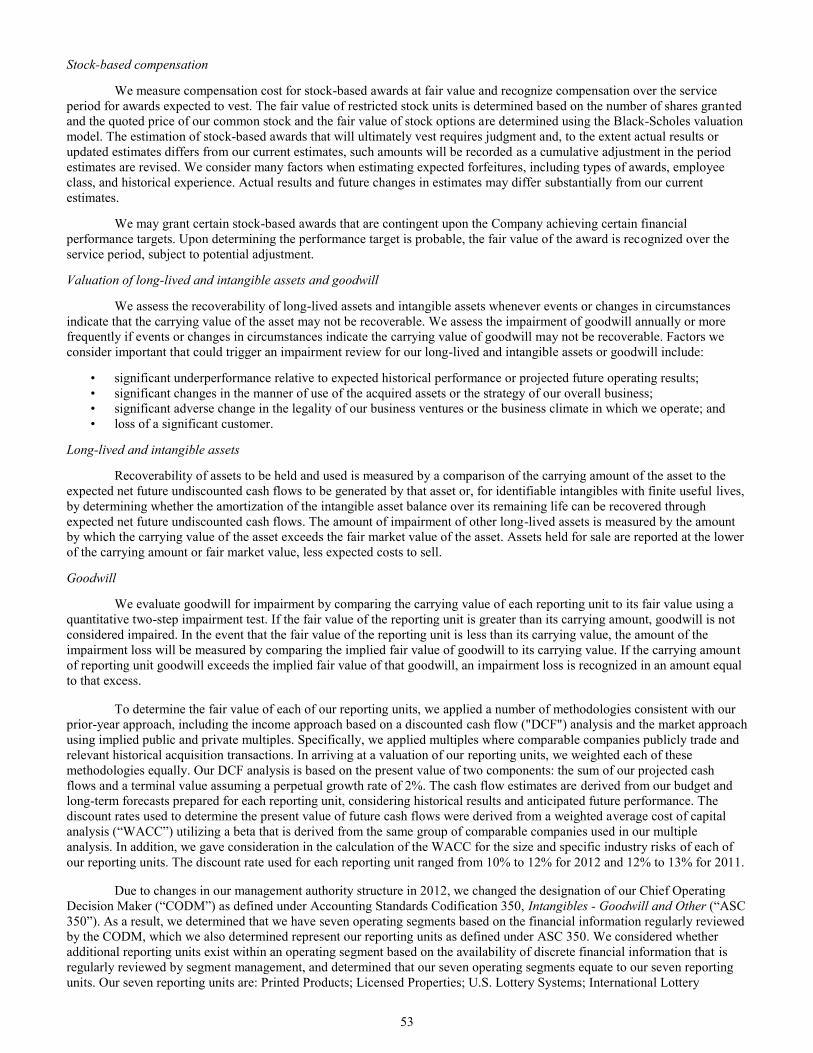
53
Stock-based compensation
We measure compensation cost for stock-based awards at fair value and recognize compensation over the service
period for awards expected to vest. The fair value of restricted stock units is determined based on the number of shares granted
and the quoted price of our common stock and the fair value of stock options are determined using the Black-Scholes valuation
model. The estimation of stock-based awards that will ultimately vest requires judgment and, to the extent actual results or
updated estimates differs from our current estimates, such amounts will be recorded as a cumulative adjustment in the period
estimates are revised. We consider many factors when estimating expected forfeitures, including types of awards, employee
class, and historical experience. Actual results and future changes in estimates may differ substantially from our current
estimates.
We may grant certain stock-based awards that are contingent upon the Company achieving certain financial
performance targets. Upon determining the performance target is probable, the fair value of the award is recognized over the
service period, subject to potential adjustment.
Valuation of long-lived and intangible assets and goodwill
We assess the recoverability of long-lived assets and intangible assets whenever events or changes in circumstances
indicate that the carrying value of the asset may not be recoverable. We assess the impairment of goodwill annually or more
frequently if events or changes in circumstances indicate the carrying value of goodwill may not be recoverable. Factors we
consider important that could trigger an impairment review for our long-lived and intangible assets or goodwill include:
• significant underperformance relative to expected historical performance or projected future operating results;
• significant changes in the manner of use of the acquired assets or the strategy of our overall business;
• significant adverse change in the legality of our business ventures or the business climate in which we operate; and
• loss of a significant customer.
Long-lived and intangible assets
Recoverability of assets to be held and used is measured by a comparison of the carrying amount of the asset to the
expected net future undiscounted cash flows to be generated by that asset or, for identifiable intangibles with finite useful lives,
by determining whether the amortization of the intangible asset balance over its remaining life can be recovered through
expected net future undiscounted cash flows. The amount of impairment of other long-lived assets is measured by the amount
by which the carrying value of the asset exceeds the fair market value of the asset. Assets held for sale are reported at the lower
of the carrying amount or fair market value, less expected costs to sell.
Goodwill
We evaluate goodwill for impairment by comparing the carrying value of each reporting unit to its fair value using a
quantitative two-step impairment test. If the fair value of the reporting unit is greater than its carrying amount, goodwill is not
considered impaired. In the event that the fair value of the reporting unit is less than its carrying value, the amount of the
impairment loss will be measured by comparing the implied fair value of goodwill to its carrying value. If the carrying amount
of reporting unit goodwill exceeds the implied fair value of that goodwill, an impairment loss is recognized in an amount equal
to that excess.
To determine the fair value of each of our reporting units, we applied a number of methodologies consistent with our
prior-year approach, including the income approach based on a discounted cash flow ("DCF") analysis and the market approach
using implied public and private multiples. Specifically, we applied multiples where comparable companies publicly trade and
relevant historical acquisition transactions. In arriving at a valuation of our reporting units, we weighted each of these
methodologies equally. Our DCF analysis is based on the present value of two components: the sum of our projected cash
flows and a terminal value assuming a perpetual growth rate of 2%. The cash flow estimates are derived from our budget and
long-term forecasts prepared for each reporting unit, considering historical results and anticipated future performance. The
discount rates used to determine the present value of future cash flows were derived from a weighted average cost of capital
analysis (“WACC”) utilizing a beta that is derived from the same group of comparable companies used in our multiple
analysis. In addition, we gave consideration in the calculation of the WACC for the size and specific industry risks of each of
our reporting units. The discount rate used for each reporting unit ranged from 10% to 12% for 2012 and 12% to 13% for 2011.
Due to changes in our management authority structure in 2012, we changed the designation of our Chief Operating
Decision Maker (“CODM”) as defined under Accounting Standards Codification 350, Intangibles - Goodwill and Other (“ASC
350”). As a result, we determined that we have seven operating segments based on the financial information regularly reviewed
by the CODM, which we also determined represent our reporting units as defined under ASC 350. We considered whether
additional reporting units exist within an operating segment based on the availability of discrete financial information that is
regularly reviewed by segment management, and determined that our seven operating segments equate to our seven reporting
units. Our seven reporting units are: Printed Products; Licensed Properties; U.S. Lottery Systems; International Lottery
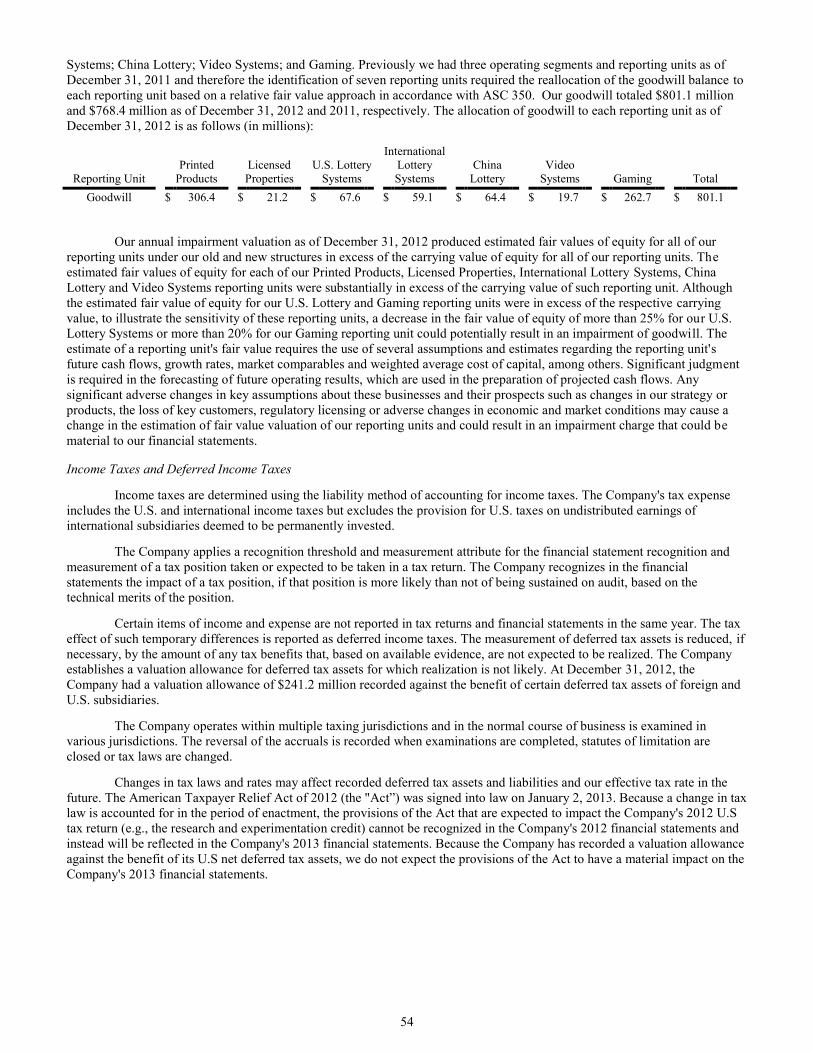
54
Systems; China Lottery; Video Systems; and Gaming. Previously we had three operating segments and reporting units as of
December 31, 2011 and therefore the identification of seven reporting units required the reallocation of the goodwill balance to
each reporting unit based on a relative fair value approach in accordance with ASC 350. Our goodwill totaled $801.1 million
and $768.4 million as of December 31, 2012 and 2011, respectively. The allocation of goodwill to each reporting unit as of
December 31, 2012 is as follows (in millions):
Reporting Unit
Printed
Products
Licensed
Properties
U.S. Lottery
Systems
International
Lottery
Systems
China
Lottery
Video
Systems Gaming Total
Goodwill $ 306.4 $ 21.2 $ 67.6 $ 59.1 $ 64.4 $ 19.7 $ 262.7 $ 801.1
Our annual impairment valuation as of December 31, 2012 produced estimated fair values of equity for all of our
reporting units under our old and new structures in excess of the carrying value of equity for all of our reporting units. The
estimated fair values of equity for each of our Printed Products, Licensed Properties, International Lottery Systems, China
Lottery and Video Systems reporting units were substantially in excess of the carrying value of such reporting unit. Although
the estimated fair value of equity for our U.S. Lottery and Gaming reporting units were in excess of the respective carrying
value, to illustrate the sensitivity of these reporting units, a decrease in the fair value of equity of more than 25% for our U.S.
Lottery Systems or more than 20% for our Gaming reporting unit could potentially result in an impairment of goodwill. The
estimate of a reporting unit's fair value requires the use of several assumptions and estimates regarding the reporting unit's
future cash flows, growth rates, market comparables and weighted average cost of capital, among others. Significant judgment
is required in the forecasting of future operating results, which are used in the preparation of projected cash flows. Any
significant adverse changes in key assumptions about these businesses and their prospects such as changes in our strategy or
products, the loss of key customers, regulatory licensing or adverse changes in economic and market conditions may cause a
change in the estimation of fair value valuation of our reporting units and could result in an impairment charge that could be
material to our financial statements.
Income Taxes and Deferred Income Taxes
Income taxes are determined using the liability method of accounting for income taxes. The Company's tax expense
includes the U.S. and international income taxes but excludes the provision for U.S. taxes on undistributed earnings of
international subsidiaries deemed to be permanently invested.
The Company applies a recognition threshold and measurement attribute for the financial statement recognition and
measurement of a tax position taken or expected to be taken in a tax return. The Company recognizes in the financial
statements the impact of a tax position, if that position is more likely than not of being sustained on audit, based on the
technical merits of the position.
Certain items of income and expense are not reported in tax returns and financial statements in the same year. The tax
effect of such temporary differences is reported as deferred income taxes. The measurement of deferred tax assets is reduced, if
necessary, by the amount of any tax benefits that, based on available evidence, are not expected to be realized. The Company
establishes a valuation allowance for deferred tax assets for which realization is not likely. At December 31, 2012, the
Company had a valuation allowance of $241.2 million recorded against the benefit of certain deferred tax assets of foreign and
U.S. subsidiaries.
The Company operates within multiple taxing jurisdictions and in the normal course of business is examined in
various jurisdictions. The reversal of the accruals is recorded when examinations are completed, statutes of limitation are
closed or tax laws are changed.
Changes in tax laws and rates may affect recorded deferred tax assets and liabilities and our effective tax rate in the
future. The American Taxpayer Relief Act of 2012 (the "Act”) was signed into law on January 2, 2013. Because a change in tax
law is accounted for in the period of enactment, the provisions of the Act that are expected to impact the Company's 2012 U.S
tax return (e.g., the research and experimentation credit) cannot be recognized in the Company's 2012 financial statements and
instead will be reflected in the Company's 2013 financial statements. Because the Company has recorded a valuation allowance
against the benefit of its U.S net deferred tax assets, we do not expect the provisions of the Act to have a material impact on the
Company's 2013 financial statements.
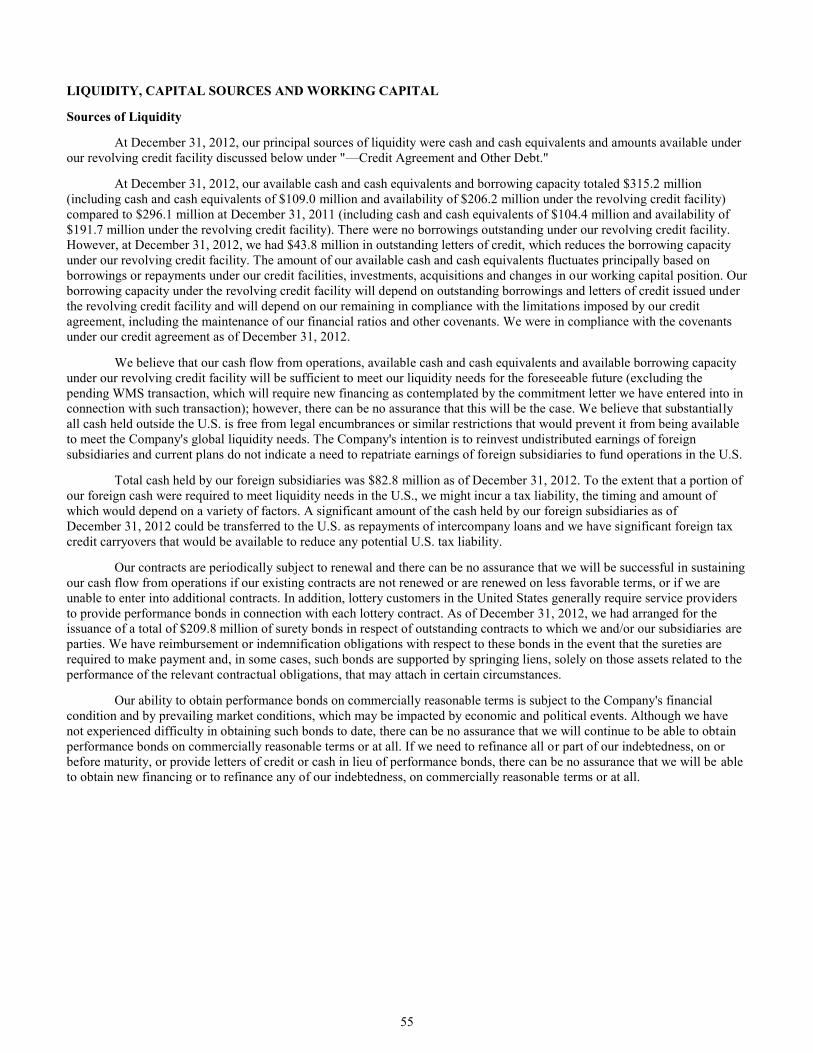
55
LIQUIDITY, CAPITAL SOURCES AND WORKING CAPITAL
Sources of Liquidity
At December 31, 2012, our principal sources of liquidity were cash and cash equivalents and amounts available under
our revolving credit facility discussed below under "—Credit Agreement and Other Debt."
At December 31, 2012, our available cash and cash equivalents and borrowing capacity totaled $315.2 million
(including cash and cash equivalents of $109.0 million and availability of $206.2 million under the revolving credit facility)
compared to $296.1 million at December 31, 2011 (including cash and cash equivalents of $104.4 million and availability of
$191.7 million under the revolving credit facility). There were no borrowings outstanding under our revolving credit facility.
However, at December 31, 2012, we had $43.8 million in outstanding letters of credit, which reduces the borrowing capacity
under our revolving credit facility. The amount of our available cash and cash equivalents fluctuates principally based on
borrowings or repayments under our credit facilities, investments, acquisitions and changes in our working capital position. Our
borrowing capacity under the revolving credit facility will depend on outstanding borrowings and letters of credit issued under
the revolving credit facility and will depend on our remaining in compliance with the limitations imposed by our credit
agreement, including the maintenance of our financial ratios and other covenants. We were in compliance with the covenants
under our credit agreement as of December 31, 2012.
We believe that our cash flow from operations, available cash and cash equivalents and available borrowing capacity
under our revolving credit facility will be sufficient to meet our liquidity needs for the foreseeable future (excluding the
pending WMS transaction, which will require new financing as contemplated by the commitment letter we have entered into in
connection with such transaction); however, there can be no assurance that this will be the case. We believe that substantially
all cash held outside the U.S. is free from legal encumbrances or similar restrictions that would prevent it from being available
to meet the Company's global liquidity needs. The Company's intention is to reinvest undistributed earnings of foreign
subsidiaries and current plans do not indicate a need to repatriate earnings of foreign subsidiaries to fund operations in the U.S.
Total cash held by our foreign subsidiaries was $82.8 million as of December 31, 2012. To the extent that a portion of
our foreign cash were required to meet liquidity needs in the U.S., we might incur a tax liability, the timing and amount of
which would depend on a variety of factors. A significant amount of the cash held by our foreign subsidiaries as of
December 31, 2012 could be transferred to the U.S. as repayments of intercompany loans and we have significant foreign tax
credit carryovers that would be available to reduce any potential U.S. tax liability.
Our contracts are periodically subject to renewal and there can be no assurance that we will be successful in sustaining
our cash flow from operations if our existing contracts are not renewed or are renewed on less favorable terms, or if we are
unable to enter into additional contracts. In addition, lottery customers in the United States generally require service providers
to provide performance bonds in connection with each lottery contract. As of December 31, 2012, we had arranged for the
issuance of a total of $209.8 million of surety bonds in respect of outstanding contracts to which we and/or our subsidiaries are
parties. We have reimbursement or indemnification obligations with respect to these bonds in the event that the sureties are
required to make payment and, in some cases, such bonds are supported by springing liens, solely on those assets related to the
performance of the relevant contractual obligations, that may attach in certain circumstances.
Our ability to obtain performance bonds on commercially reasonable terms is subject to the Company's financial
condition and by prevailing market conditions, which may be impacted by economic and political events. Although we have
not experienced difficulty in obtaining such bonds to date, there can be no assurance that we will continue to be able to obtain
performance bonds on commercially reasonable terms or at all. If we need to refinance all or part of our indebtedness, on or
before maturity, or provide letters of credit or cash in lieu of performance bonds, there can be no assurance that we will be able
to obtain new financing or to refinance any of our indebtedness, on commercially reasonable terms or at all.
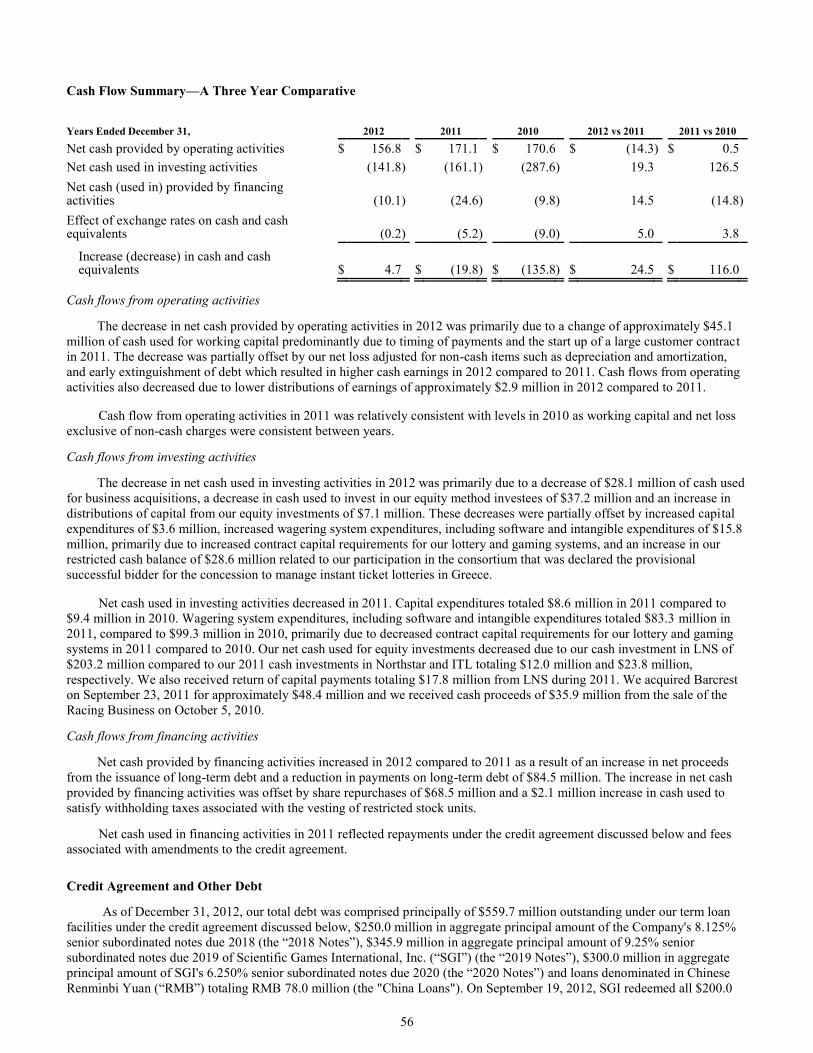
56
Cash Flow Summary—A Three Year Comparative
Years Ended December 31, 2012 2011 2010 2012 vs 2011 2011 vs 2010
Net cash provided by operating activities $ 156.8 $ 171.1 $ 170.6 $ (14.3 ) $ 0.5
Net cash used in investing activities (141.8 ) (161.1 ) (287.6 ) 19.3 126.5
Net cash (used in) provided by financing activities (10.1 ) (24.6 ) (9.8 ) 14.5 (14.8 )
Effect of exchange rates on cash and cash equivalents (0.2 ) (5.2 ) (9.0 ) 5.0 3.8
Increase (decrease) in cash and cash equivalents $ 4.7 $ (19.8 ) $ (135.8 ) $ 24.5 $ 116.0
Cash flows from operating activities
The decrease in net cash provided by operating activities in 2012 was primarily due to a change of approximately $45.1
million of cash used for working capital predominantly due to timing of payments and the start up of a large customer contract
in 2011. The decrease was partially offset by our net loss adjusted for non-cash items such as depreciation and amortization,
and early extinguishment of debt which resulted in higher cash earnings in 2012 compared to 2011. Cash flows from operating
activities also decreased due to lower distributions of earnings of approximately $2.9 million in 2012 compared to 2011.
Cash flow from operating activities in 2011 was relatively consistent with levels in 2010 as working capital and net loss
exclusive of non-cash charges were consistent between years.
Cash flows from investing activities
The decrease in net cash used in investing activities in 2012 was primarily due to a decrease of $28.1 million of cash used
for business acquisitions, a decrease in cash used to invest in our equity method investees of $37.2 million and an increase in
distributions of capital from our equity investments of $7.1 million. These decreases were partially offset by increased capital
expenditures of $3.6 million, increased wagering system expenditures, including software and intangible expenditures of $15.8
million, primarily due to increased contract capital requirements for our lottery and gaming systems, and an increase in our
restricted cash balance of $28.6 million related to our participation in the consortium that was declared the provisional
successful bidder for the concession to manage instant ticket lotteries in Greece.
Net cash used in investing activities decreased in 2011. Capital expenditures totaled $8.6 million in 2011 compared to
$9.4 million in 2010. Wagering system expenditures, including software and intangible expenditures totaled $83.3 million in
2011, compared to $99.3 million in 2010, primarily due to decreased contract capital requirements for our lottery and gaming
systems in 2011 compared to 2010. Our net cash used for equity investments decreased due to our cash investment in LNS of
$203.2 million compared to our 2011 cash investments in Northstar and ITL totaling $12.0 million and $23.8 million,
respectively. We also received return of capital payments totaling $17.8 million from LNS during 2011. We acquired Barcrest
on September 23, 2011 for approximately $48.4 million and we received cash proceeds of $35.9 million from the sale of the
Racing Business on October 5, 2010.
Cash flows from financing activities
Net cash provided by financing activities increased in 2012 compared to 2011 as a result of an increase in net proceeds
from the issuance of long-term debt and a reduction in payments on long-term debt of $84.5 million. The increase in net cash
provided by financing activities was offset by share repurchases of $68.5 million and a $2.1 million increase in cash used to
satisfy withholding taxes associated with the vesting of restricted stock units.
Net cash used in financing activities in 2011 reflected repayments under the credit agreement discussed below and fees
associated with amendments to the credit agreement.
Credit Agreement and Other Debt
As of December 31, 2012, our total debt was comprised principally of $559.7 million outstanding under our term loan
facilities under the credit agreement discussed below, $250.0 million in aggregate principal amount of the Company's 8.125%
senior subordinated notes due 2018 (the “2018 Notes”), $345.9 million in aggregate principal amount of 9.25% senior
subordinated notes due 2019 of Scientific Games International, Inc. (“SGI”) (the “2019 Notes”), $300.0 million in aggregate
principal amount of SGI's 6.250% senior subordinated notes due 2020 (the “2020 Notes”) and loans denominated in Chinese
Renminbi Yuan (“RMB”) totaling RMB 78.0 million (the "China Loans"). On September 19, 2012, SGI redeemed all $200.0
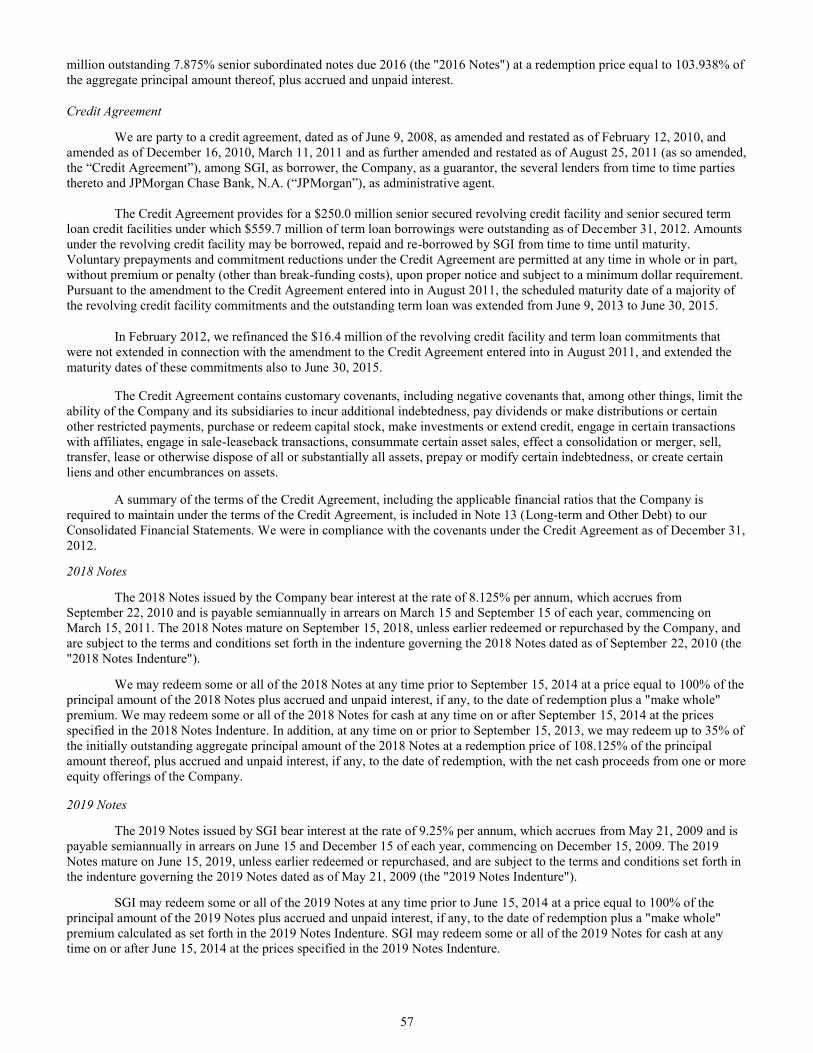
57
million outstanding 7.875% senior subordinated notes due 2016 (the "2016 Notes") at a redemption price equal to 103.938% of
the aggregate principal amount thereof, plus accrued and unpaid interest.
Credit Agreement
We are party to a credit agreement, dated as of June 9, 2008, as amended and restated as of February 12, 2010, and
amended as of December 16, 2010, March 11, 2011 and as further amended and restated as of August 25, 2011 (as so amended,
the “Credit Agreement”), among SGI, as borrower, the Company, as a guarantor, the several lenders from time to time parties
thereto and JPMorgan Chase Bank, N.A. (“JPMorgan”), as administrative agent.
The Credit Agreement provides for a $250.0 million senior secured revolving credit facility and senior secured term
loan credit facilities under which $559.7 million of term loan borrowings were outstanding as of December 31, 2012. Amounts
under the revolving credit facility may be borrowed, repaid and re-borrowed by SGI from time to time until maturity.
Voluntary prepayments and commitment reductions under the Credit Agreement are permitted at any time in whole or in part,
without premium or penalty (other than break-funding costs), upon proper notice and subject to a minimum dollar requirement.
Pursuant to the amendment to the Credit Agreement entered into in August 2011, the scheduled maturity date of a majority of
the revolving credit facility commitments and the outstanding term loan was extended from June 9, 2013 to June 30, 2015.
In February 2012, we refinanced the $16.4 million of the revolving credit facility and term loan commitments that
were not extended in connection with the amendment to the Credit Agreement entered into in August 2011, and extended the
maturity dates of these commitments also to June 30, 2015.
The Credit Agreement contains customary covenants, including negative covenants that, among other things, limit the
ability of the Company and its subsidiaries to incur additional indebtedness, pay dividends or make distributions or certain
other restricted payments, purchase or redeem capital stock, make investments or extend credit, engage in certain transactions
with affiliates, engage in sale-leaseback transactions, consummate certain asset sales, effect a consolidation or merger, sell,
transfer, lease or otherwise dispose of all or substantially all assets, prepay or modify certain indebtedness, or create certain
liens and other encumbrances on assets.
A summary of the terms of the Credit Agreement, including the applicable financial ratios that the Company is
required to maintain under the terms of the Credit Agreement, is included in Note 13 (Long-term and Other Debt) to our
Consolidated Financial Statements. We were in compliance with the covenants under the Credit Agreement as of December 31,
2012.
2018 Notes
The 2018 Notes issued by the Company bear interest at the rate of 8.125% per annum, which accrues from
September 22, 2010 and is payable semiannually in arrears on March 15 and September 15 of each year, commencing on
March 15, 2011. The 2018 Notes mature on September 15, 2018, unless earlier redeemed or repurchased by the Company, and
are subject to the terms and conditions set forth in the indenture governing the 2018 Notes dated as of September 22, 2010 (the
"2018 Notes Indenture").
We may redeem some or all of the 2018 Notes at any time prior to September 15, 2014 at a price equal to 100% of the
principal amount of the 2018 Notes plus accrued and unpaid interest, if any, to the date of redemption plus a "make whole"
premium. We may redeem some or all of the 2018 Notes for cash at any time on or after September 15, 2014 at the prices
specified in the 2018 Notes Indenture. In addition, at any time on or prior to September 15, 2013, we may redeem up to 35% of
the initially outstanding aggregate principal amount of the 2018 Notes at a redemption price of 108.125% of the principal
amount thereof, plus accrued and unpaid interest, if any, to the date of redemption, with the net cash proceeds from one or more
equity offerings of the Company.
2019 Notes
The 2019 Notes issued by SGI bear interest at the rate of 9.25% per annum, which accrues from May 21, 2009 and is
payable semiannually in arrears on June 15 and December 15 of each year, commencing on December 15, 2009. The 2019
Notes mature on June 15, 2019, unless earlier redeemed or repurchased, and are subject to the terms and conditions set forth in
the indenture governing the 2019 Notes dated as of May 21, 2009 (the "2019 Notes Indenture").
SGI may redeem some or all of the 2019 Notes at any time prior to June 15, 2014 at a price equal to 100% of the
principal amount of the 2019 Notes plus accrued and unpaid interest, if any, to the date of redemption plus a "make whole"
premium calculated as set forth in the 2019 Notes Indenture. SGI may redeem some or all of the 2019 Notes for cash at any
time on or after June 15, 2014 at the prices specified in the 2019 Notes Indenture.
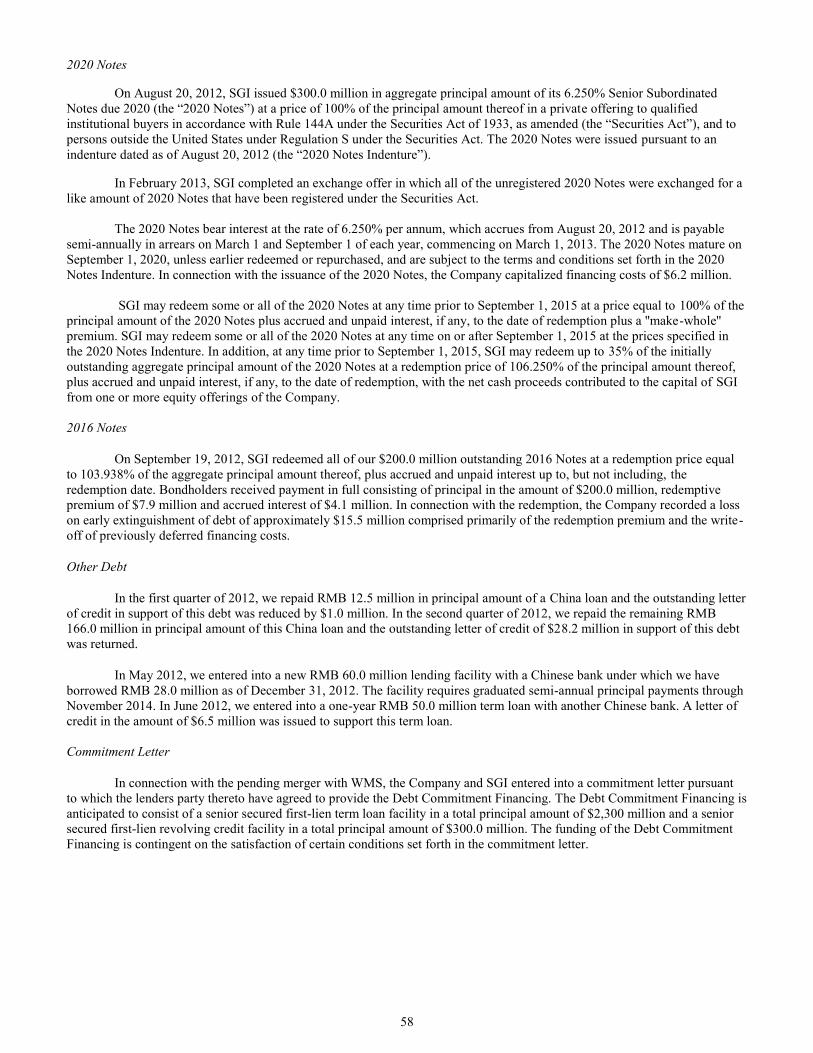
58
2020 Notes
On August 20, 2012, SGI issued $300.0 million in aggregate principal amount of its 6.250% Senior Subordinated
Notes due 2020 (the “2020 Notes”) at a price of 100% of the principal amount thereof in a private offering to qualified
institutional buyers in accordance with Rule 144A under the Securities Act of 1933, as amended (the “Securities Act”), and to
persons outside the United States under Regulation S under the Securities Act. The 2020 Notes were issued pursuant to an
indenture dated as of August 20, 2012 (the “2020 Notes Indenture”).
In February 2013, SGI completed an exchange offer in which all of the unregistered 2020 Notes were exchanged for a
like amount of 2020 Notes that have been registered under the Securities Act.
The 2020 Notes bear interest at the rate of 6.250% per annum, which accrues from August 20, 2012 and is payable
semi-annually in arrears on March 1 and September 1 of each year, commencing on March 1, 2013. The 2020 Notes mature on
September 1, 2020, unless earlier redeemed or repurchased, and are subject to the terms and conditions set forth in the 2020
Notes Indenture. In connection with the issuance of the 2020 Notes, the Company capitalized financing costs of $6.2 million.
SGI may redeem some or all of the 2020 Notes at any time prior to September 1, 2015 at a price equal to 100% of the
principal amount of the 2020 Notes plus accrued and unpaid interest, if any, to the date of redemption plus a ''make-whole''
premium. SGI may redeem some or all of the 2020 Notes at any time on or after September 1, 2015 at the prices specified in
the 2020 Notes Indenture. In addition, at any time prior to September 1, 2015, SGI may redeem up to 35% of the initially
outstanding aggregate principal amount of the 2020 Notes at a redemption price of 106.250% of the principal amount thereof,
plus accrued and unpaid interest, if any, to the date of redemption, with the net cash proceeds contributed to the capital of SGI
from one or more equity offerings of the Company.
2016 Notes
On September 19, 2012, SGI redeemed all of our $200.0 million outstanding 2016 Notes at a redemption price equal
to 103.938% of the aggregate principal amount thereof, plus accrued and unpaid interest up to, but not including, the
redemption date. Bondholders received payment in full consisting of principal in the amount of $200.0 million, redemptive
premium of $7.9 million and accrued interest of $4.1 million. In connection with the redemption, the Company recorded a loss
on early extinguishment of debt of approximately $15.5 million comprised primarily of the redemption premium and the write-
off of previously deferred financing costs.
Other Debt
In the first quarter of 2012, we repaid RMB 12.5 million in principal amount of a China loan and the outstanding letter
of credit in support of this debt was reduced by $1.0 million. In the second quarter of 2012, we repaid the remaining RMB
166.0 million in principal amount of this China loan and the outstanding letter of credit of $28.2 million in support of this debt
was returned.
In May 2012, we entered into a new RMB 60.0 million lending facility with a Chinese bank under which we have
borrowed RMB 28.0 million as of December 31, 2012. The facility requires graduated semi-annual principal payments through
November 2014. In June 2012, we entered into a one-year RMB 50.0 million term loan with another Chinese bank. A letter of
credit in the amount of $6.5 million was issued to support this term loan.
Commitment Letter
In connection with the pending merger with WMS, the Company and SGI entered into a commitment letter pursuant
to which the lenders party thereto have agreed to provide the Debt Commitment Financing. The Debt Commitment Financing is
anticipated to consist of a senior secured first-lien term loan facility in a total principal amount of $2,300 million and a senior
secured first-lien revolving credit facility in a total principal amount of $300.0 million. The funding of the Debt Commitment
Financing is contingent on the satisfaction of certain conditions set forth in the commitment letter.
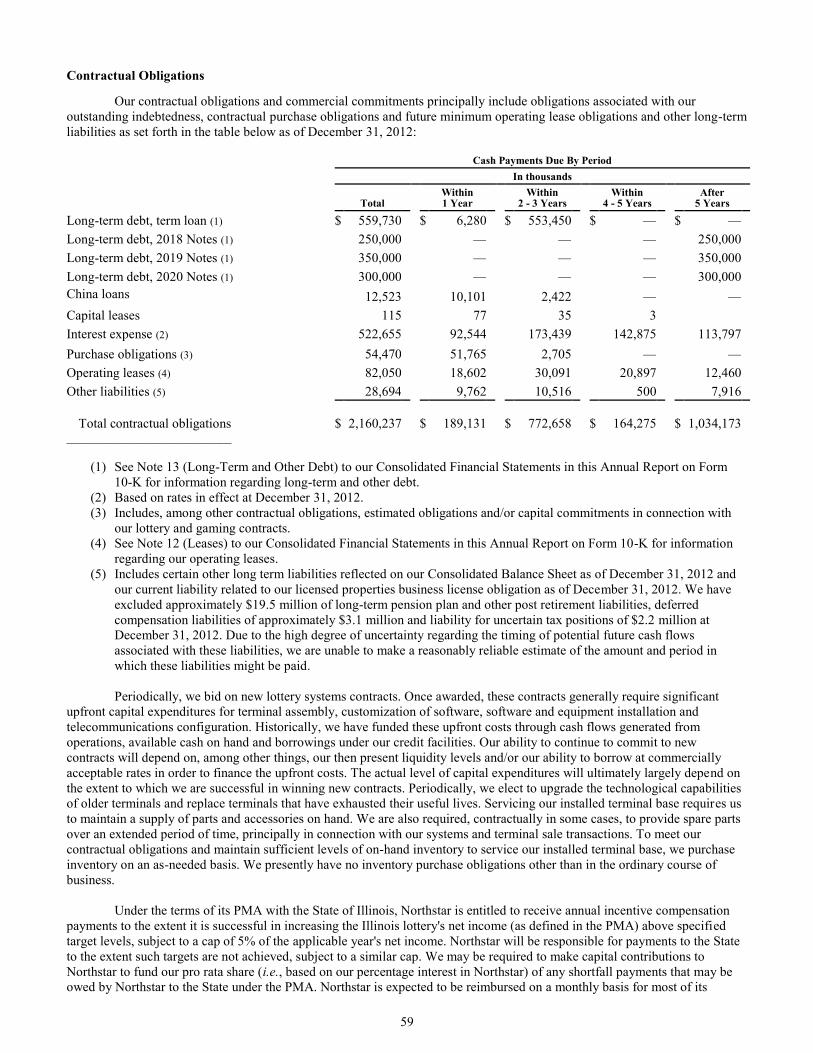
59
Contractual Obligations
Our contractual obligations and commercial commitments principally include obligations associated with our
outstanding indebtedness, contractual purchase obligations and future minimum operating lease obligations and other long-term
liabilities as set forth in the table below as of December 31, 2012:
Cash Payments Due By Period
In thousands
Total Within 1 Year
Within 2 - 3 Years
Within 4 - 5 Years
After 5 Years
Long-term debt, term loan (1) $ 559,730 $ 6,280 $ 553,450 $ — $ —
Long-term debt, 2018 Notes (1) 250,000 — — — 250,000
Long-term debt, 2019 Notes (1) 350,000 — — — 350,000
Long-term debt, 2020 Notes (1) 300,000 — — — 300,000
China loans 12,523 10,101 2,422 — —
Capital leases 115 77 35 3
Interest expense (2) 522,655 92,544 173,439 142,875 113,797
Purchase obligations (3) 54,470 51,765 2,705 — —
Operating leases (4) 82,050 18,602 30,091 20,897 12,460
Other liabilities (5) 28,694 9,762 10,516 500 7,916
Total contractual obligations $ 2,160,237 $ 189,131 $ 772,658 $ 164,275 $ 1,034,173 _______________________________
(1) See Note 13 (Long-Term and Other Debt) to our Consolidated Financial Statements in this Annual Report on Form
10-K for information regarding long-term and other debt.
(2) Based on rates in effect at December 31, 2012.
(3) Includes, among other contractual obligations, estimated obligations and/or capital commitments in connection with
our lottery and gaming contracts.
(4) See Note 12 (Leases) to our Consolidated Financial Statements in this Annual Report on Form 10-K for information
regarding our operating leases.
(5) Includes certain other long term liabilities reflected on our Consolidated Balance Sheet as of December 31, 2012 and
our current liability related to our licensed properties business license obligation as of December 31, 2012. We have
excluded approximately $19.5 million of long-term pension plan and other post retirement liabilities, deferred
compensation liabilities of approximately $3.1 million and liability for uncertain tax positions of $2.2 million at
December 31, 2012. Due to the high degree of uncertainty regarding the timing of potential future cash flows
associated with these liabilities, we are unable to make a reasonably reliable estimate of the amount and period in
which these liabilities might be paid.
Periodically, we bid on new lottery systems contracts. Once awarded, these contracts generally require significant
upfront capital expenditures for terminal assembly, customization of software, software and equipment installation and
telecommunications configuration. Historically, we have funded these upfront costs through cash flows generated from
operations, available cash on hand and borrowings under our credit facilities. Our ability to continue to commit to new
contracts will depend on, among other things, our then present liquidity levels and/or our ability to borrow at commercially
acceptable rates in order to finance the upfront costs. The actual level of capital expenditures will ultimately largely depend on
the extent to which we are successful in winning new contracts. Periodically, we elect to upgrade the technological capabilities
of older terminals and replace terminals that have exhausted their useful lives. Servicing our installed terminal base requires us
to maintain a supply of parts and accessories on hand. We are also required, contractually in some cases, to provide spare parts
over an extended period of time, principally in connection with our systems and terminal sale transactions. To meet our
contractual obligations and maintain sufficient levels of on-hand inventory to service our installed terminal base, we purchase
inventory on an as-needed basis. We presently have no inventory purchase obligations other than in the ordinary course of
business.
Under the terms of its PMA with the State of Illinois, Northstar is entitled to receive annual incentive compensation
payments to the extent it is successful in increasing the Illinois lottery's net income (as defined in the PMA) above specified
target levels, subject to a cap of 5% of the applicable year's net income. Northstar will be responsible for payments to the State
to the extent such targets are not achieved, subject to a similar cap. We may be required to make capital contributions to
Northstar to fund our pro rata share (i.e., based on our percentage interest in Northstar) of any shortfall payments that may be
owed by Northstar to the State under the PMA. Northstar is expected to be reimbursed on a monthly basis for most of its
60
operating expenses under the PMA, although certain expenses of Northstar associated with managing the lottery are not
reimbursable.
In December 2010, the Company adopted the Asia-Pacific Plan. The purpose of the Asia-Pacific Plan is to provide an
equitable and competitive compensation opportunity to certain key employees and consultants of the Company who are
involved in the Company's business in China (and potentially other jurisdictions in the Asia-Pacific region) (the "Asia-Pacific
Business") and to promote the creation of long-term value for the Company's stockholders by directly linking Asia-Pacific Plan
participants' compensation under the plan to the appreciation in value of such business. Each participant will be eligible to
receive a cash payment following the end of 2014 equal to a pre-determined share of an Asia-Pacific Business incentive
compensation pool. The incentive compensation pool will equal a certain percentage of the growth in the value of the Asia-
Pacific Business over four years, calculated in the manner provided under the Asia-Pacific Plan and subject to a cap of (1) $35
million, in the event an Asia-Pacific Business liquidity event does not occur by December 31, 2014 or (2) $50 million, in the
event an Asia-Pacific Business liquidity event occurs by December 31, 2014. An "Asia-Pacific Business liquidity event" means
an initial public offering of at least 20% of the Asia-Pacific Business or a strategic investment by a third-party to acquire at
least 20% of the Asia-Pacific Business, in each case, that is approved by the Company. Our accrual recorded in other long-term
liabilities related to the Asia-Pacific Plan was $1.9 million and $4.3 million as of December 31, 2012 and 2011, respectively.
On December 12, 2012, the Hellenic Republic Asset Development Fund provisionally awarded the consortium in
which we own a 16.5% equity interest a 12-year concession for the exclusive rights to the production, operation and
management of instant ticket lotteries in Greece. The consortium is principally comprised of OPAP S.A., Scientific Games and
Intralot. Operations under the new concession are subject to various regulatory approvals and Greek parliamentary approval.
Pursuant to our agreement with the consortium, we expect to serve as the exclusive supplier of instant tickets over the term of
the concession. If the award is approved, the consortium will pay an upfront payment of €190 million, of which our portion will
be €31.4 million, and will be responsible for a monthly fee to the lotteries based on a percentage of gross gaming revenue. As
of December 31, 2012, our restricted cash balance includes approximately $29.1 million which will be used to partially fund
our portion of the upfront payment upon completion of the approval process. We expect that we would also be responsible for
our pro rata share of the consortium's working capital and other capital that may be required in connection with our expected
instant ticket contract with the consortium.
In December 2012, we formed Northstar New Jersey with GTECH and OMERS to bid to be the private manager for
the New Jersey Lottery for a 15-year term. We have entered into an operating agreement for the formation of Northstar New
Jersey Lottery Group, LLC, the entity that we will form with GTECH and OMERS if Northstar New Jersey is selected as the
private manager and which will be obligated to pay an upfront fee of $120.0 million to the State of New Jersey upon execution
of the private management agreement. Pursuant to our agreement with GTECH and OMERS we will own a 17.69% equity
interest in Northstar New Jersey Lottery Group, LLC and will therefore be responsible for approximately $21.2 million,
17.69% of the upfront fee paid to the State. We expect that we would also be responsible for our pro rata share of working
capital and other capital requirements of Northstar New Jersey.
On January 30, 2013, we entered into a merger agreement pursuant to which we agreed to acquire WMS for
approximately $1.5 billion, plus amounts required to repay the borrowings under our and WMS' existing credit facilities at
closing (as of December 31, 2012, $559.7 million was outstanding under our senior secured term loan credit facility and $85.0
million was outstanding under WMS' revolving credit facility). The closing of the merger is subject to customary closing
conditions, including approval of the merger by WMS stockholders and other approvals by various authorities. The merger is
expected to be completed by the end of 2013.
The merger agreement also contains certain termination rights for both Scientific Games and WMS and further
provides that, in connection with termination of the merger agreement under specified circumstances, (i) we may be required to
pay to WMS a termination fee of $100 million if all the conditions to closing the merger have been met and the merger is not
consummated because of a breach by our lenders of their obligations to finance the transaction and (ii) we may be required to
pay to WMS a termination fee of $80 million if we are unable to obtain the gaming approvals that are conditions to closing the
merger prior to the termination date. For further details regarding the merger, see Note 23 (Subsequent Events) to our
Consolidated Financial Statements in this Annual Report on Form 10-K and the full text of the merger agreement, a copy of
which is filed as exhibit 2.1 to our Current Report on Form 8-K filed with the Securities and Exchange Commission on
February 5, 2013.
ITEM 7A. QUANTITATIVE AND QUALITATIVE DISCLOSURES ABOUT MARKET RISK
Our products and services are sold to a diverse group of customers throughout the world. As such, we are subject to
certain risks and uncertainties as a result of changes in general economic conditions, sources of supply, competition, foreign
exchange rates, tax reform, litigation and regulatory developments. (See "Risk Factors" in Item 1A of this Annual Report on
Form 10-K for a more complete description of these risks and uncertainties.) The diversity and breadth of our products and
geographic operations mitigate the risk that adverse changes from any single event would materially affect our financial
position.

61
Additionally, as a result of the diversity of our customer base, we do not consider ourselves exposed to a concentration
of credit risks. These risks are further minimized by setting credit limits where appropriate, ongoing monitoring of customer
account balances and assessment of the customers' financial strengths.
Inflation has not had an abnormal or unanticipated effect on our operations. Inflationary pressures would be significant
to our business if raw materials used for instant lottery ticket production or terminal manufacturing are significantly affected.
Available supply from the paper and electronics industries tends to fluctuate and prices may be affected by supply.
For fiscal year 2012, inflation was not a significant factor in our results of operations, and we were not impacted by
significant pricing changes in our costs. We are unable to forecast the prices or supply of substrate, component parts or other
raw materials in 2013, but we currently do not anticipate any substantial changes that will materially affect our operating
results.
In certain limited cases, our lottery contracts with our customers contain provisions to adjust for inflation on an annual
basis, but we cannot be assured that this adjustment would cover raw material price increases or other costs of services.
Although we have long-term and generally satisfactory relationships with most of our suppliers, we also believe alternative
sources to meet our raw material and production needs are available.
In the normal course of business, we are exposed to fluctuations in interest rates and debt and equity market risks as
we seek debt and equity capital to sustain our operations. All of our interest rate sensitive financial instruments are held for
purposes other than trading purposes. At December 31, 2012, approximately 62% of our debt was in fixed-rate instruments.
The table below provides information about our financial instruments that are sensitive to changes in interest rates.
The table presents principal cash flows and related weighted-average interest rates by expected maturity dates. See
"Management's Discussion and Analysis of Financial Condition and Results of Operations—Liquidity, Capital Resources and
Working Capital" in Item 7 of this Annual Report on Form 10-K for additional information about our financial instruments.
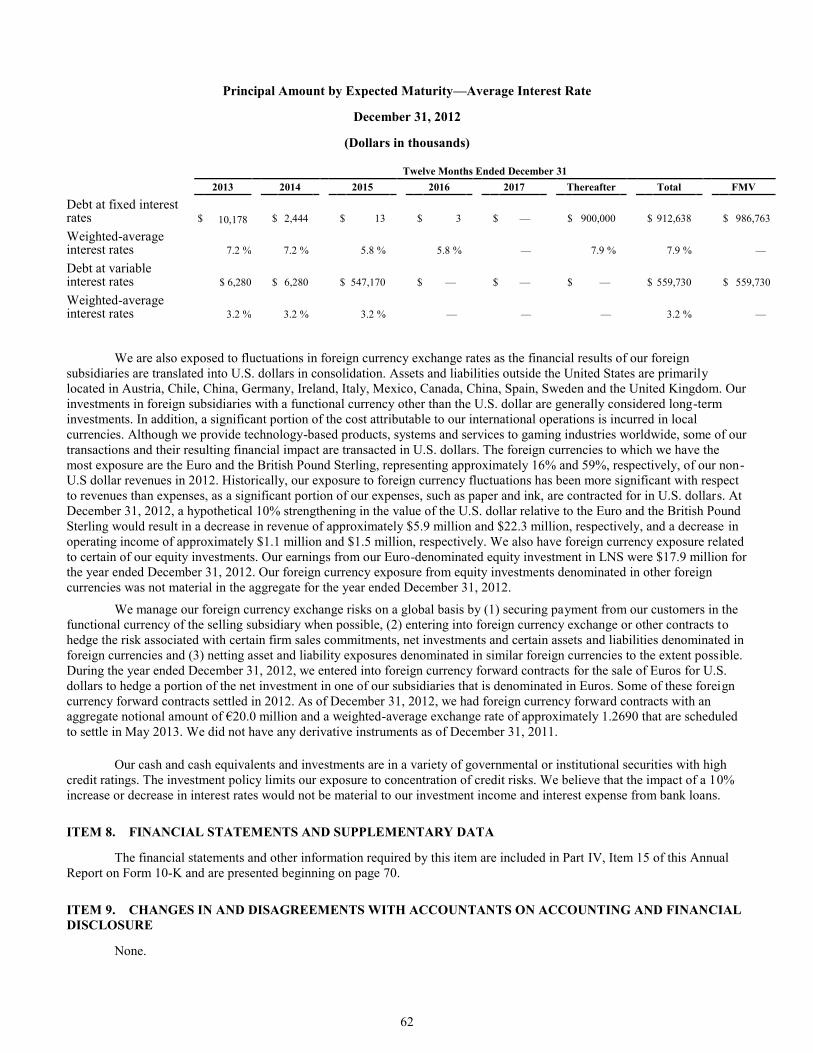
62
Principal Amount by Expected Maturity—Average Interest Rate
December 31, 2012
(Dollars in thousands)
Twelve Months Ended December 31
2013 2014 2015 2016 2017 Thereafter Total FMV
Debt at fixed interest rates $ 10,178 $ 2,444 $ 13 $ 3 $ — $ 900,000 $ 912,638 $ 986,763
Weighted-average interest rates 7.2 % 7.2 % 5.8 % 5.8 % — 7.9 % 7.9 % —
Debt at variable interest rates
$ 6,280 $ 6,280 $ 547,170 $ — $ — $ — $ 559,730 $ 559,730
Weighted-average interest rates 3.2 % 3.2 % 3.2 % — — — 3.2 % —
We are also exposed to fluctuations in foreign currency exchange rates as the financial results of our foreign
subsidiaries are translated into U.S. dollars in consolidation. Assets and liabilities outside the United States are primarily
located in Austria, Chile, China, Germany, Ireland, Italy, Mexico, Canada, China, Spain, Sweden and the United Kingdom. Our
investments in foreign subsidiaries with a functional currency other than the U.S. dollar are generally considered long-term
investments. In addition, a significant portion of the cost attributable to our international operations is incurred in local
currencies. Although we provide technology-based products, systems and services to gaming industries worldwide, some of our
transactions and their resulting financial impact are transacted in U.S. dollars. The foreign currencies to which we have the
most exposure are the Euro and the British Pound Sterling, representing approximately 16% and 59%, respectively, of our non-
U.S dollar revenues in 2012. Historically, our exposure to foreign currency fluctuations has been more significant with respect
to revenues than expenses, as a significant portion of our expenses, such as paper and ink, are contracted for in U.S. dollars. At
December 31, 2012, a hypothetical 10% strengthening in the value of the U.S. dollar relative to the Euro and the British Pound
Sterling would result in a decrease in revenue of approximately $5.9 million and $22.3 million, respectively, and a decrease in
operating income of approximately $1.1 million and $1.5 million, respectively. We also have foreign currency exposure related
to certain of our equity investments. Our earnings from our Euro-denominated equity investment in LNS were $17.9 million for
the year ended December 31, 2012. Our foreign currency exposure from equity investments denominated in other foreign
currencies was not material in the aggregate for the year ended December 31, 2012.
We manage our foreign currency exchange risks on a global basis by (1) securing payment from our customers in the
functional currency of the selling subsidiary when possible, (2) entering into foreign currency exchange or other contracts to
hedge the risk associated with certain firm sales commitments, net investments and certain assets and liabilities denominated in
foreign currencies and (3) netting asset and liability exposures denominated in similar foreign currencies to the extent possible.
During the year ended December 31, 2012, we entered into foreign currency forward contracts for the sale of Euros for U.S.
dollars to hedge a portion of the net investment in one of our subsidiaries that is denominated in Euros. Some of these foreign
currency forward contracts settled in 2012. As of December 31, 2012, we had foreign currency forward contracts with an
aggregate notional amount of €20.0 million and a weighted-average exchange rate of approximately 1.2690 that are scheduled
to settle in May 2013. We did not have any derivative instruments as of December 31, 2011.
Our cash and cash equivalents and investments are in a variety of governmental or institutional securities with high
credit ratings. The investment policy limits our exposure to concentration of credit risks. We believe that the impact of a 10%
increase or decrease in interest rates would not be material to our investment income and interest expense from bank loans.
ITEM 8. FINANCIAL STATEMENTS AND SUPPLEMENTARY DATA
The financial statements and other information required by this item are included in Part IV, Item 15 of this Annual
Report on Form 10-K and are presented beginning on page 70.
ITEM 9. CHANGES IN AND DISAGREEMENTS WITH ACCOUNTANTS ON ACCOUNTING AND FINANCIAL
DISCLOSURE
None.

63
ITEM 9A. CONTROLS AND PROCEDURES
Evaluation of Disclosure Controls and Procedures
As of the end of the period covered by this Annual Report on Form 10-K, we carried out an evaluation, under the
supervision and with the participation of our management, including our Chief Executive Officer and our Chief Financial
Officer, of the effectiveness of the design and operation of our disclosure controls and procedures (as defined in Exchange Act
Rules 13a-15(e) and 15d-15(e)). Based upon that evaluation, our Chief Executive Officer and our Chief Financial Officer
concluded that our disclosure controls and procedures were effective as of the end of the period covered by this report.
Management Report on Internal Control over Financial Reporting
Our management is responsible for establishing and maintaining adequate internal control over financial reporting.
With the participation of the Chief Executive Officer and Chief Financial Officer, our management conducted an evaluation of
the effectiveness of our internal control over financial reporting based on the framework and criteria established in Internal
Control—Integrated Framework issued by the Committee of Sponsoring Organizations of the Treadway Commission. Based on
this evaluation, our management has concluded that our internal control over financial reporting was effective as of December
31, 2012.
Changes in Internal Control over Financial Reporting
There were no changes in our internal control over financial reporting during the quarter ended December 31, 2012
that have materially affected, or are reasonably likely to materially affect, our internal control over financial reporting.
64
REPORT OF INDEPENDENT REGISTERED PUBLIC ACCOUNTING FIRM
To the Board of Directors and Stockholders of Scientific Games Corporation
We have audited the internal control over financial reporting of Scientific Games Corporation and subsidiaries (the
"Company") as of December 31, 2012, based on criteria established in Internal Control—Integrated Framework issued by the
Committee of Sponsoring Organizations of the Treadway Commission. The Company's management is responsible for
maintaining effective internal control over financial reporting and for its assessment of the effectiveness of internal control over
financial reporting, included in the accompanying Management Report on Internal Control over Financial Reporting. Our
responsibility is to express an opinion on the Company's internal control over financial reporting based on our audit.
We conducted our audit in accordance with the standards of the Public Company Accounting Oversight Board (United
States). Those standards require that we plan and perform the audit to obtain reasonable assurance about whether effective
internal control over financial reporting was maintained in all material respects. Our audit included obtaining an understanding
of internal control over financial reporting, assessing the risk that a material weakness exists, testing and evaluating the design
and operating effectiveness of internal control based on the assessed risk, and performing such other procedures as we
considered necessary in the circumstances. We believe that our audit provides a reasonable basis for our opinion.
A company's internal control over financial reporting is a process designed by, or under the supervision of, the
company's principal executive and principal financial officers, or persons performing similar functions, and effected by the
company's board of directors, management, and other personnel to provide reasonable assurance regarding the reliability of
financial reporting and the preparation of financial statements for external purposes in accordance with generally accepted
accounting principles. A company's internal control over financial reporting includes those policies and procedures that
(1) pertain to the maintenance of records that, in reasonable detail, accurately and fairly reflect the transactions and dispositions
of the assets of the company; (2) provide reasonable assurance that transactions are recorded as necessary to permit preparation
of financial statements in accordance with generally accepted accounting principles, and that receipts and expenditures of the
company are being made only in accordance with authorizations of management and directors of the company; and (3) provide
reasonable assurance regarding prevention or timely detection of unauthorized acquisition, use, or disposition of the company's
assets that could have a material effect on the financial statements.
Because of the inherent limitations of internal control over financial reporting, including the possibility of collusion or
improper management override of controls, material misstatements due to error or fraud may not be prevented or detected on a
timely basis. Also, projections of any evaluation of the effectiveness of the internal control over financial reporting to future
periods are subject to the risk that the controls may become inadequate because of changes in conditions, or that the degree of
compliance with the policies or procedures may deteriorate.
In our opinion, the Company maintained, in all material respects, effective internal control over financial reporting as
of December 31, 2012, based on the criteria established in Internal Control—Integrated Framework issued by the Committee of
Sponsoring Organizations of the Treadway Commission.
We have also audited, in accordance with the standards of the Public Company Accounting Oversight Board (United
States), the consolidated financial statements and financial statement schedule as of and for the year ended December 31, 2012
of the Company and our report dated March 12, 2013 expressed an unqualified opinion on those financial statements and
financial statement schedule based on our audit and the report of other auditors.
/s/ DELOITTE & TOUCHE LLP
Atlanta, Georgia
March 12, 2013

65
ITEM 9B. OTHER INFORMATION.
None.
66
PART III
ITEM 10. DIRECTORS, EXECUTIVE OFFICERS AND CORPORATE GOVERNANCE
We have adopted a Code of Business Conduct that applies to all of our officers, directors and employees (including
our Chief Executive Officer, Chief Financial Officer and Chief Accounting Officer) and have posted the Code on our website
at www.scientificgames.com. In the event that we have any amendments to or waivers from any provision of the Code
applicable to our Chief Executive Officer, Chief Financial Officer and Chief Accounting Officer, we intend to satisfy the
disclosure requirement under Item 5.05 of Form 8-K by posting such information on our website.
Information relating to our executive officers is included in Part I, Item 1 of this Annual Report on Form 10-K. The
other information called for by this item is incorporated by reference to our definitive proxy statement relating to our 2013
Annual Meeting of Stockholders, which will be filed with the SEC. If such proxy statement is not filed on or before April 30,
2013, the information called for by this item will be filed as part of an amendment to this Annual Report on Form 10-K on or
before such date.
ITEM 11. EXECUTIVE COMPENSATION
The information called for by this item is incorporated herein by reference to our definitive proxy statement relating to
our 2013 Annual Meeting of Stockholders, which will be filed with the SEC. If such proxy statement is not filed on or before
April 30, 2013, the information called for by this item will be filed as part of an amendment to this Annual Report on Form 10-
K on or before such date.
ITEM 12. SECURITY OWNERSHIP OF CERTAIN BENEFICIAL OWNERS AND MANAGEMENT AND
RELATED STOCKHOLDER MATTERS
The information called for by this item is incorporated herein by reference to our definitive proxy statement relating to
our 2013 Annual Meeting of Stockholders, which will be filed with the SEC. If such proxy statement is not filed on or before
April 30, 2013, the information called for by this item will be filed as part of an amendment to this Annual Report on Form 10-
K on or before such date.
ITEM 13. CERTAIN RELATIONSHIPS AND RELATED TRANSACTIONS, AND DIRECTOR INDEPENDENCE
The information called for by this item is incorporated herein by reference to our definitive proxy statement relating to
our 2013 Annual Meeting of Stockholders, which will be filed with the SEC. If such proxy statement is not filed on or before
April 30, 2013, the information called for by this item will be filed as part of an amendment to this Annual Report on Form 10-
K on or before such date.
ITEM 14. PRINCIPAL ACCOUNTANT FEES AND SERVICES
The information called for by this item is incorporated herein by reference to our definitive proxy statement relating to
our 2013 Annual Meeting of Stockholders, which will be filed with the SEC. If such proxy statement is not filed on or before
April 30, 2013, the information called for by this item will be filed as part of an amendment to this Annual Report on Form 10-
K on or before such date.
67
PART IV
ITEM 15. EXHIBITS, FINANCIAL STATEMENT SCHEDULES
(a)
1. Financial statements:
Report of Deloitte &Touche, LLP, Independent Registered Public Accounting Firm 71
Consolidated Statements of Operations and Comprehensive Income for the years ended December 31, 2012, 2011 and 2010 72
Consolidated Balance Sheets as of December 31, 2012 and 2011 73
Consolidated Statements of Stockholders' Equity for the years ended December 31, 2012, 2011 and 2010 74
Consolidated Statements of Cash Flows for the years ended December 31, 2012, 2011 and 2010 75
Notes to Consolidated Financial Statements 77
2. Financial Statement Schedule:
Schedule II. Valuation and Qualifying Accounts 144
All other schedules have been omitted because they are inapplicable, not required, or the information is included elsewhere in the consolidated financial statements or related notes.
3. Exhibits 145
The Exhibit Index attached to this report is incorporated by reference into this Item 15(a)(3) and is filed as part of this Annual Report on Form 10-K.
68
SIGNATURES
Pursuant to the requirements of Section 13 or 15(d) of the Securities Exchange Act of 1934, the registrant has duly
caused this report to be signed on its behalf by the undersigned, thereunto duly authorized.
March 12, 2013 SCIENTIFIC GAMES CORPORATION
By:
/s/ Jeffrey S. Lipkin
Jeffrey S. Lipkin,
Chief Financial Officer
By:
/s/ Jeffery B. Johnson
Jeffrey B. Johnson Chief Accounting Officer
Pursuant to the requirements of the Securities Exchange Act of 1934, this Report has been signed below by the following
persons on behalf of the Registrant and in the capacities indicated on March 12, 2013.
Signature Title
/s/ A. Lorne Weil
Chief Executive Officer and Chairman of the Board (principal executive officer)
A. Lorne Weil
/s/ Jeffrey S. Lipkin
Senior Vice President and Chief Financial Officer (principal financial officer)
Jeffrey S. Lipkin
/s/ Jeffrey B. Johnson
Vice President, Chief Accounting Officer and Corporate Controller (principal accounting officer)
Jeffrey B. Johnson
/s/ David L. Kennedy
Vice Chairman of the Board
David L. Kennedy
/s/ Michael R. Chambrello
Chief Executive Officer—Asia-Pacific Region and Director
Michael R. Chambrello
/s/ Peter A. Cohen
Vice Chairman of the Board
Peter A. Cohen
69
Signature Title
/s/ Gerald J. Ford
Director
Gerald J. Ford
/s/ Barry F. Schwartz
Director
Barry F. Schwartz
/s/ Francis F. Townsend
Director
Francis F. Townsend
/s/ Michael J. Regan
Director
Michael J. Regan
/s/ Ronald O. Perelman
Director
Ronald O. Perelman
/s/ Paul M. Meister
Director
Paul M. Meister
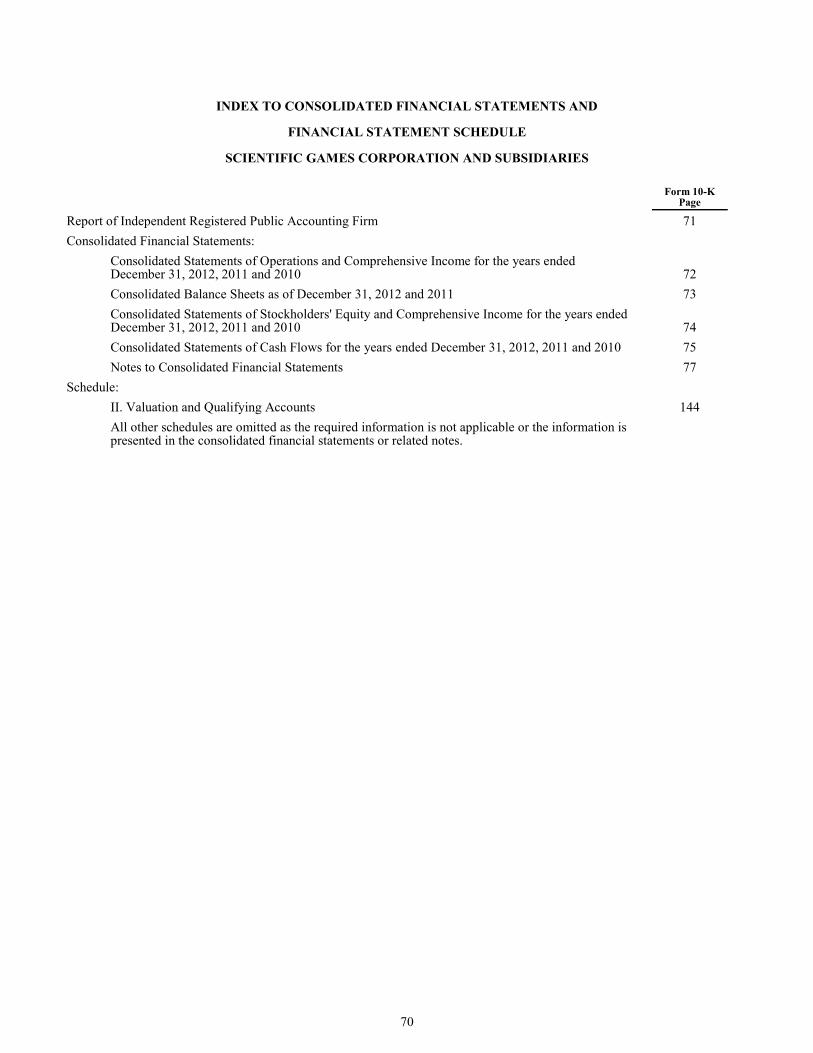
70
INDEX TO CONSOLIDATED FINANCIAL STATEMENTS AND
FINANCIAL STATEMENT SCHEDULE
SCIENTIFIC GAMES CORPORATION AND SUBSIDIARIES
Form 10-K
Page
Report of Independent Registered Public Accounting Firm 71
Consolidated Financial Statements:
Consolidated Statements of Operations and Comprehensive Income for the years ended December 31, 2012, 2011 and 2010 72
Consolidated Balance Sheets as of December 31, 2012 and 2011 73
Consolidated Statements of Stockholders' Equity and Comprehensive Income for the years ended December 31, 2012, 2011 and 2010 74
Consolidated Statements of Cash Flows for the years ended December 31, 2012, 2011 and 2010 75
Notes to Consolidated Financial Statements 77
Schedule:
II. Valuation and Qualifying Accounts 144
All other schedules are omitted as the required information is not applicable or the information is presented in the consolidated financial statements or related notes.
71
REPORT OF INDEPENDENT REGISTERED PUBLIC ACCOUNTING FIRM
To the Board of Directors and Stockholders of Scientific Games Corporation
We have audited the accompanying consolidated balance sheets of Scientific Games Corporation and subsidiaries (the
"Company") as of December 31, 2012 and 2011, and the related consolidated statements of operations and comprehensive
income, stockholders' equity, and cash flows for each of the three years in the period ended December 31, 2012. Our audits also
included the financial statement schedule listed in the Index. These financial statements and financial statement schedule are
the responsibility of the Company's management. Our responsibility is to express an opinion on the financial statements and
financial statement schedule based on our audits. We did not audit the financial statements of Lotterie Nazionali S.r.l. ("LNS"),
the Company's investment which is accounted for by use of the equity method (see note 10 to the consolidated financial
statements), as of and for the years ended December 31, 2012 and 2011. We also did not audit the financial statements of
Consorzio Lotterie Nazionali ("CLN"), the Company's investment which is accounted for by use of the equity method (see
note 10 to the consolidated financial statements), as of December 31, 2010 and for the year ended December 31, 2010. The
Company's equity in income of LNS was $17,948 and $18,623 for the years ended December 31, 2012 and December 31, 2011,
respectively. The Company's equity in income of CLN was $35,236 for the year ended December 31, 2010. Those statements
were prepared in accordance with International Financial Reporting Standards as issued by the International Accounting
Standards Board and were audited by other auditors whose report has been furnished to us, and our opinion, insofar as it relates
to the amounts included for LNS and CLN, on the basis of International Financial Reporting Standards as issued by the
International Accounting Standards Board, for the three years ended December 31, 2012, is based solely on the report of the
other auditors. We have applied auditing procedures to the adjustments to reflect equity in net income of LNS and CLN in
accordance with accounting principles generally accepted in the United States of America.
We conducted our audits in accordance with the standards of the Public Company Accounting Oversight Board
(United States). Those standards require that we plan and perform the audit to obtain reasonable assurance about whether the
financial statements are free of material misstatement. An audit includes examining, on a test basis, evidence supporting the
amounts and disclosures in the financial statements. An audit also includes assessing the accounting principles used and
significant estimates made by management, as well as evaluating the overall financial statement presentation. We believe that
our audits and the report of the other auditors provide a reasonable basis for our opinion.
In our opinion, based on our audits and the report of the other auditors, such consolidated financial statements present
fairly, in all material respects, the financial position of Scientific Games Corporation and subsidiaries as of December 31, 2012
and 2011, and the results of their operations and their cash flows for each of the three years in the period ended December 31,
2012, in conformity with accounting principles generally accepted in the United States of America. Also, in our opinion, such
financial statement schedule, when considered in relation to the basic consolidated financial statements taken as a whole,
presents fairly, in all material respects, the information set forth therein.
We have also audited, in accordance with the standards of the Public Company Accounting Oversight Board (United
States), the Company's internal control over financial reporting as of December 31, 2012, based on the criteria established in
Internal Control—Integrated Framework issued by the Committee of Sponsoring Organizations of the Treadway Commission
and our report dated March 12, 2013 expressed an unqualified opinion on the Company's internal control over financial
reporting based on our audit.
/s/ DELOITTE & TOUCHE LLP
Atlanta, Georgia
March 12, 2013
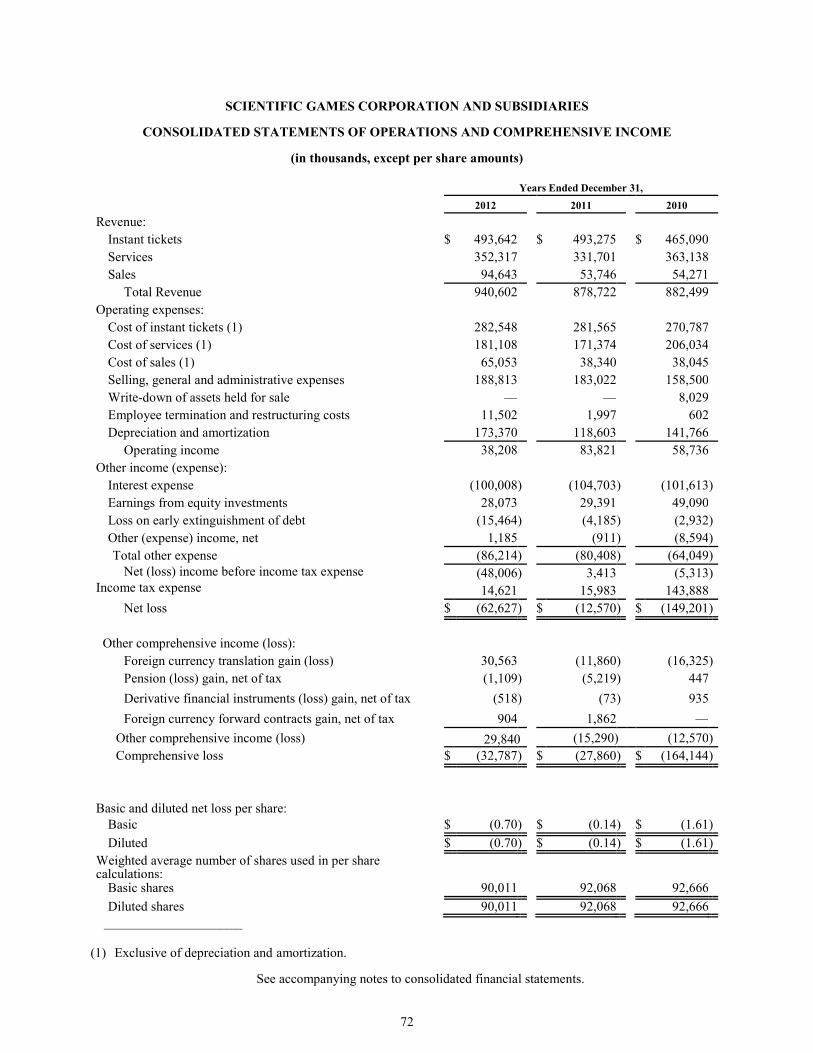
72
SCIENTIFIC GAMES CORPORATION AND SUBSIDIARIES
CONSOLIDATED STATEMENTS OF OPERATIONS AND COMPREHENSIVE INCOME
(in thousands, except per share amounts)
Years Ended December 31,
2012 2011 2010
Revenue:
Instant tickets $ 493,642 $ 493,275 $ 465,090
Services 352,317 331,701 363,138
Sales 94,643 53,746 54,271
Total Revenue 940,602 878,722 882,499
Operating expenses:
Cost of instant tickets (1) 282,548 281,565 270,787
Cost of services (1) 181,108 171,374 206,034
Cost of sales (1) 65,053 38,340 38,045
Selling, general and administrative expenses 188,813 183,022 158,500
Write-down of assets held for sale — — 8,029
Employee termination and restructuring costs 11,502 1,997 602
Depreciation and amortization 173,370 118,603 141,766
Operating income 38,208 83,821 58,736
Other income (expense):
Interest expense (100,008 ) (104,703 ) (101,613 )
Earnings from equity investments 28,073 29,391 49,090
Loss on early extinguishment of debt (15,464 ) (4,185 ) (2,932 )
Other (expense) income, net 1,185 (911 ) (8,594 )
Total other expense (86,214 ) (80,408 ) (64,049 )
Net (loss) income before income tax expense (48,006 ) 3,413 (5,313 ) Income tax expense 14,621 15,983 143,888
Net loss $ (62,627 ) $ (12,570 ) $ (149,201 )
Other comprehensive income (loss):
Foreign currency translation gain (loss) 30,563 (11,860 ) (16,325 )
Pension (loss) gain, net of tax (1,109 ) (5,219 ) 447
Derivative financial instruments (loss) gain, net of tax (518 ) (73 ) 935
Foreign currency forward contracts gain, net of tax 904 1,862 —
Other comprehensive income (loss) 29,840 (15,290) (12,570 )
Comprehensive loss $ (32,787 ) $ (27,860 ) $ (164,144 )
Basic and diluted net loss per share:
Basic $ (0.70 ) $ (0.14 ) $ (1.61 )
Diluted $ (0.70 ) $ (0.14 ) $ (1.61 )
Weighted average number of shares used in per share calculations:
Basic shares 90,011 92,068 92,666
Diluted shares 90,011 92,068 92,666
__________________________
(1) Exclusive of depreciation and amortization.
See accompanying notes to consolidated financial statements.
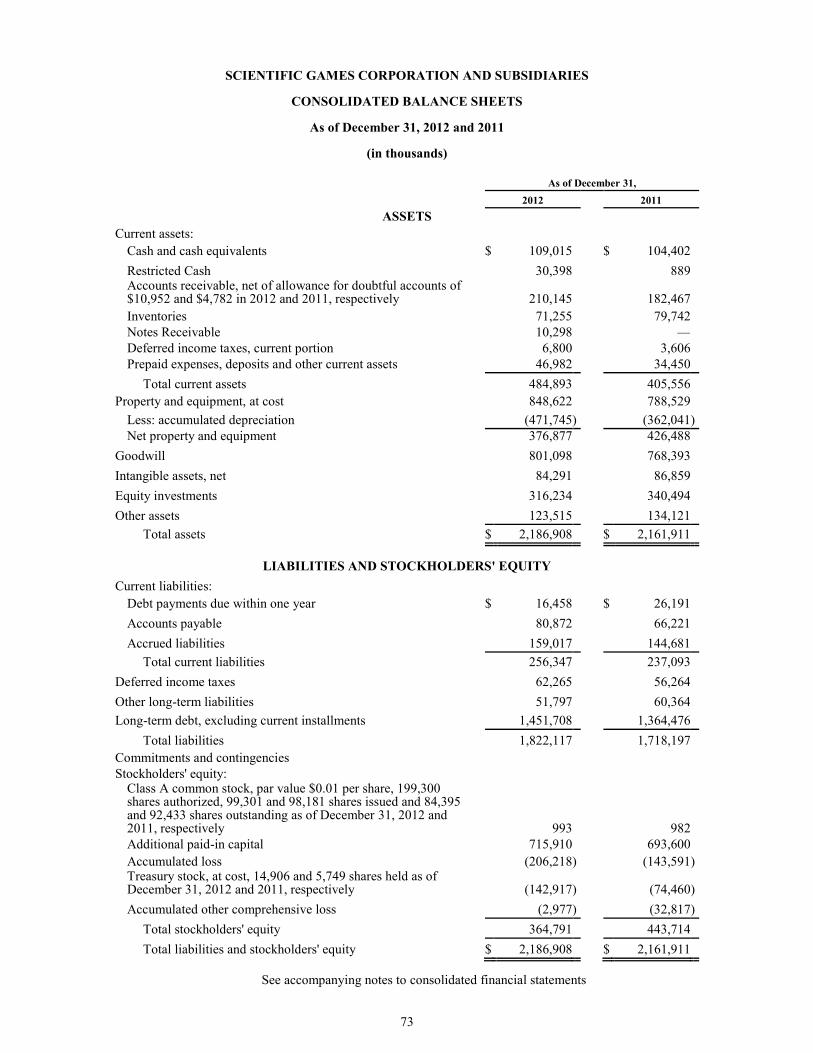
73
SCIENTIFIC GAMES CORPORATION AND SUBSIDIARIES
CONSOLIDATED BALANCE SHEETS
As of December 31, 2012 and 2011
(in thousands)
As of December 31,
2012 2011
ASSETS
Current assets:
Cash and cash equivalents $ 109,015 $ 104,402
Restricted Cash 30,398 889 Accounts receivable, net of allowance for doubtful accounts of $10,952 and $4,782 in 2012 and 2011, respectively 210,145 182,467
Inventories 71,255 79,742 Notes Receivable 10,298 — Deferred income taxes, current portion 6,800 3,606 Prepaid expenses, deposits and other current assets 46,982 34,450
Total current assets 484,893 405,556
Property and equipment, at cost 848,622 788,529
Less: accumulated depreciation (471,745 ) (362,041 )
Net property and equipment 376,877 426,488
Goodwill 801,098 768,393
Intangible assets, net 84,291 86,859
Equity investments 316,234 340,494
Other assets 123,515 134,121
Total assets $ 2,186,908 $ 2,161,911
LIABILITIES AND STOCKHOLDERS' EQUITY
Current liabilities:
Debt payments due within one year $ 16,458 $ 26,191
Accounts payable 80,872 66,221
Accrued liabilities 159,017 144,681
Total current liabilities 256,347 237,093
Deferred income taxes 62,265 56,264
Other long-term liabilities 51,797 60,364
Long-term debt, excluding current installments 1,451,708 1,364,476
Total liabilities 1,822,117 1,718,197
Commitments and contingencies Stockholders' equity:
Class A common stock, par value $0.01 per share, 199,300 shares authorized, 99,301 and 98,181 shares issued and 84,395 and 92,433 shares outstanding as of December 31, 2012 and 2011, respectively 993 982 Additional paid-in capital 715,910 693,600
Accumulated loss (206,218 ) (143,591 ) Treasury stock, at cost, 14,906 and 5,749 shares held as of December 31, 2012 and 2011, respectively (142,917 ) (74,460 )
Accumulated other comprehensive loss (2,977 ) (32,817 )
Total stockholders' equity 364,791 443,714
Total liabilities and stockholders' equity $ 2,186,908 $ 2,161,911
See accompanying notes to consolidated financial statements
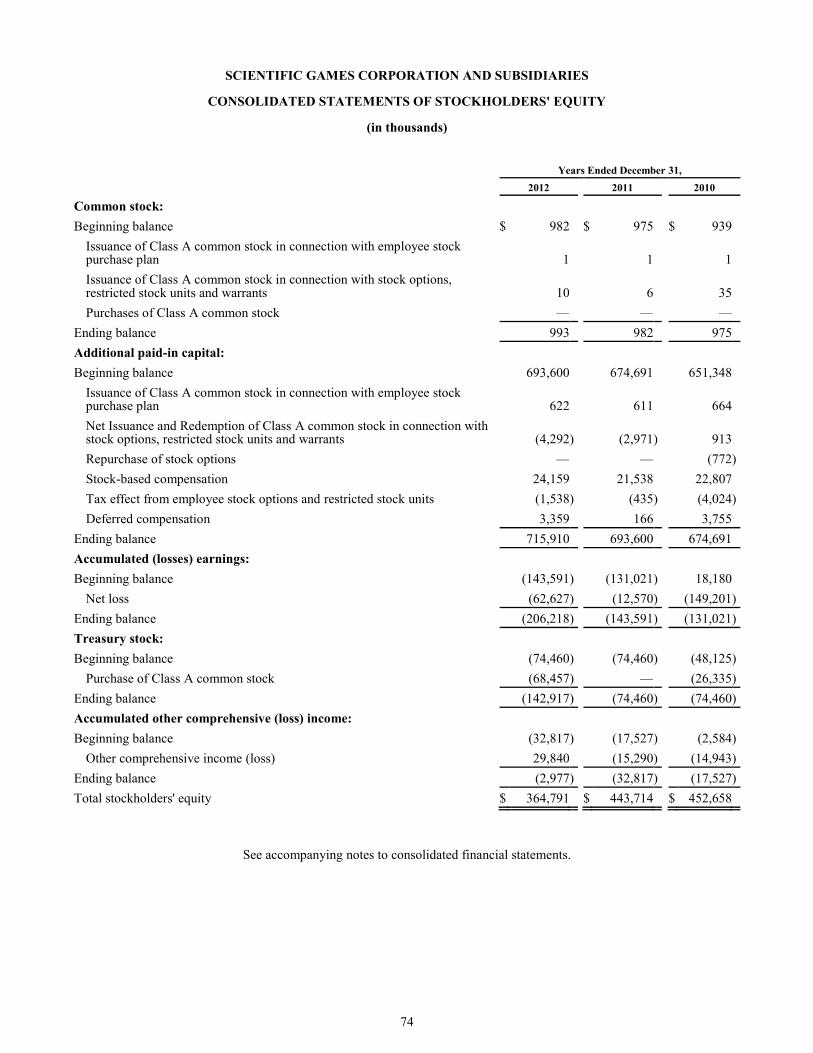
74
SCIENTIFIC GAMES CORPORATION AND SUBSIDIARIES
CONSOLIDATED STATEMENTS OF STOCKHOLDERS' EQUITY
(in thousands)
Years Ended December 31,
2012 2011 2010
Common stock:
Beginning balance $ 982 $ 975 $ 939
Issuance of Class A common stock in connection with employee stock purchase plan 1 1 1
Issuance of Class A common stock in connection with stock options, restricted stock units and warrants 10 6 35
Purchases of Class A common stock — — —
Ending balance 993 982 975
Additional paid-in capital:
Beginning balance 693,600 674,691 651,348
Issuance of Class A common stock in connection with employee stock purchase plan 622 611 664
Net Issuance and Redemption of Class A common stock in connection with stock options, restricted stock units and warrants (4,292 ) (2,971 ) 913
Repurchase of stock options — — (772 )
Stock-based compensation 24,159 21,538 22,807
Tax effect from employee stock options and restricted stock units (1,538 ) (435 ) (4,024 )
Deferred compensation 3,359 166 3,755
Ending balance 715,910 693,600 674,691
Accumulated (losses) earnings:
Beginning balance (143,591 ) (131,021 ) 18,180
Net loss (62,627 ) (12,570 ) (149,201 )
Ending balance (206,218 ) (143,591 ) (131,021 )
Treasury stock:
Beginning balance (74,460 ) (74,460 ) (48,125 )
Purchase of Class A common stock (68,457 ) — (26,335 )
Ending balance (142,917 ) (74,460 ) (74,460 )
Accumulated other comprehensive (loss) income:
Beginning balance (32,817 ) (17,527 ) (2,584 )
Other comprehensive income (loss) 29,840 (15,290 ) (14,943 )
Ending balance (2,977 ) (32,817 ) (17,527 )
Total stockholders' equity $ 364,791 $ 443,714 $ 452,658
See accompanying notes to consolidated financial statements.
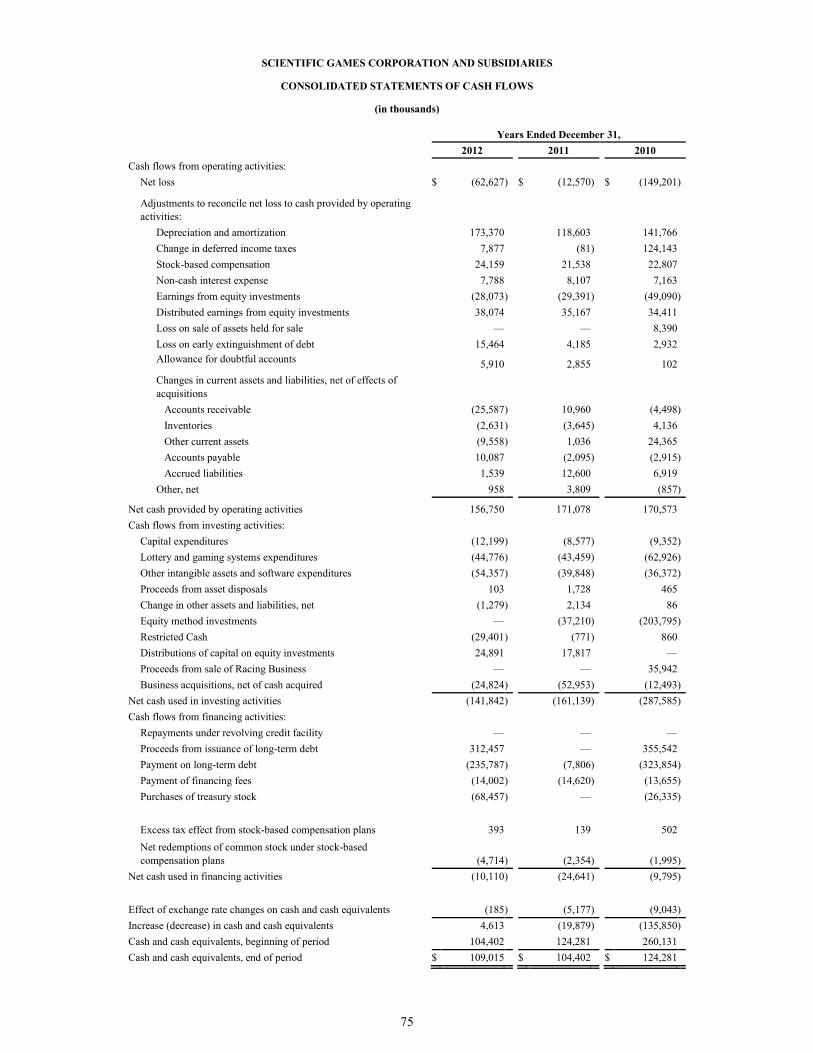
75
SCIENTIFIC GAMES CORPORATION AND SUBSIDIARIES
CONSOLIDATED STATEMENTS OF CASH FLOWS
(in thousands)
Years Ended December 31,
2012 2011 2010
Cash flows from operating activities:
Net loss $ (62,627 ) $ (12,570 ) $ (149,201 )
Adjustments to reconcile net loss to cash provided by operating
activities:
Depreciation and amortization 173,370 118,603 141,766
Change in deferred income taxes 7,877 (81 ) 124,143
Stock-based compensation 24,159 21,538 22,807
Non-cash interest expense 7,788 8,107 7,163
Earnings from equity investments (28,073 ) (29,391 ) (49,090 )
Distributed earnings from equity investments 38,074 35,167 34,411
Loss on sale of assets held for sale — — 8,390
Loss on early extinguishment of debt 15,464 4,185 2,932
Allowance for doubtful accounts
5,910 2,855 102
Changes in current assets and liabilities, net of effects of
acquisitions
Accounts receivable (25,587 ) 10,960 (4,498 )
Inventories (2,631 ) (3,645 ) 4,136
Other current assets (9,558 ) 1,036 24,365
Accounts payable 10,087 (2,095 ) (2,915 )
Accrued liabilities 1,539 12,600 6,919
Other, net 958 3,809 (857 )
Net cash provided by operating activities 156,750 171,078 170,573
Cash flows from investing activities:
Capital expenditures (12,199 ) (8,577 ) (9,352 )
Lottery and gaming systems expenditures (44,776 ) (43,459 ) (62,926 )
Other intangible assets and software expenditures (54,357 ) (39,848 ) (36,372 )
Proceeds from asset disposals 103 1,728 465
Change in other assets and liabilities, net (1,279 ) 2,134 86
Equity method investments — (37,210 ) (203,795 )
Restricted Cash (29,401 ) (771 ) 860
Distributions of capital on equity investments 24,891 17,817 —
Proceeds from sale of Racing Business — — 35,942
Business acquisitions, net of cash acquired (24,824 ) (52,953 ) (12,493 )
Net cash used in investing activities (141,842 ) (161,139 ) (287,585 )
Cash flows from financing activities:
Repayments under revolving credit facility — — —
Proceeds from issuance of long-term debt 312,457 — 355,542
Payment on long-term debt (235,787 ) (7,806 ) (323,854 )
Payment of financing fees (14,002 ) (14,620 ) (13,655 )
Purchases of treasury stock (68,457 ) — (26,335 )
Excess tax effect from stock-based compensation plans 393 139 502
Net redemptions of common stock under stock-based
compensation plans (4,714 ) (2,354 ) (1,995 )
Net cash used in financing activities (10,110 ) (24,641 ) (9,795 )
Effect of exchange rate changes on cash and cash equivalents (185 ) (5,177 ) (9,043 )
Increase (decrease) in cash and cash equivalents 4,613 (19,879 ) (135,850 )
Cash and cash equivalents, beginning of period 104,402 124,281 260,131
Cash and cash equivalents, end of period $ 109,015 $ 104,402 $ 124,281
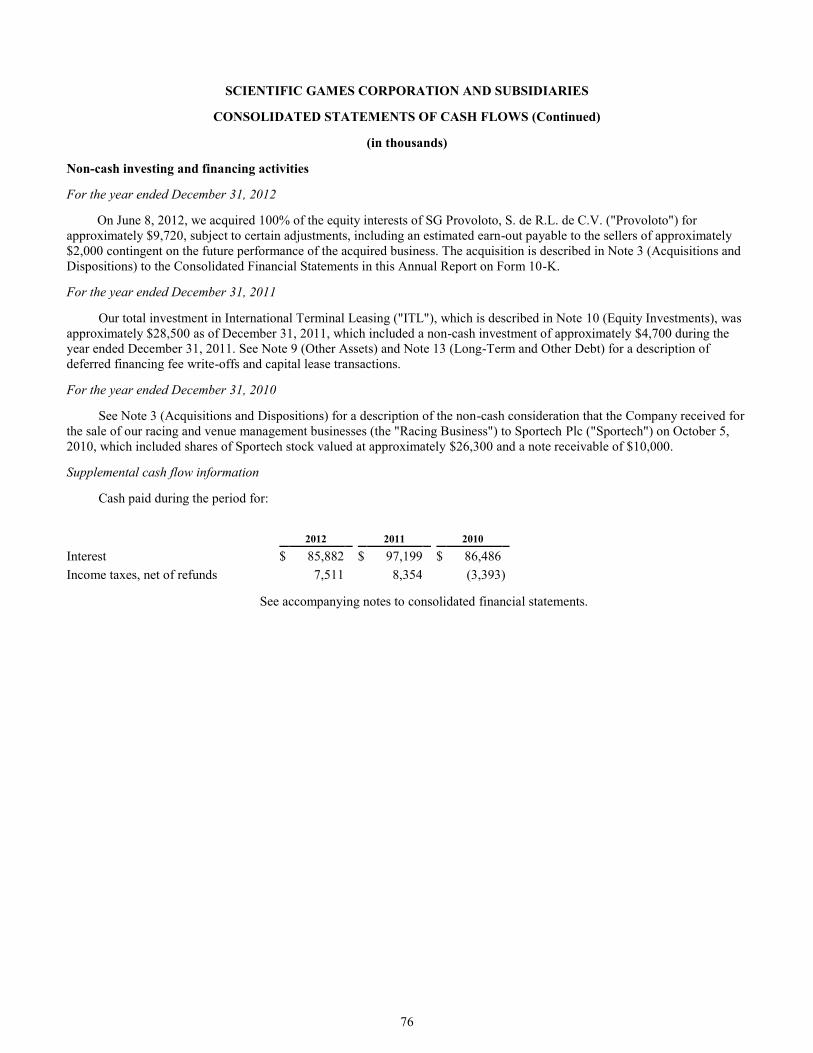
76
SCIENTIFIC GAMES CORPORATION AND SUBSIDIARIES
CONSOLIDATED STATEMENTS OF CASH FLOWS (Continued)
(in thousands)
Non-cash investing and financing activities
For the year ended December 31, 2012
On June 8, 2012, we acquired 100% of the equity interests of SG Provoloto, S. de R.L. de C.V. ("Provoloto") for
approximately $9,720, subject to certain adjustments, including an estimated earn-out payable to the sellers of approximately
$2,000 contingent on the future performance of the acquired business. The acquisition is described in Note 3 (Acquisitions and
Dispositions) to the Consolidated Financial Statements in this Annual Report on Form 10-K.
For the year ended December 31, 2011
Our total investment in International Terminal Leasing ("ITL"), which is described in Note 10 (Equity Investments), was
approximately $28,500 as of December 31, 2011, which included a non-cash investment of approximately $4,700 during the
year ended December 31, 2011. See Note 9 (Other Assets) and Note 13 (Long-Term and Other Debt) for a description of
deferred financing fee write-offs and capital lease transactions.
For the year ended December 31, 2010
See Note 3 (Acquisitions and Dispositions) for a description of the non-cash consideration that the Company received for
the sale of our racing and venue management businesses (the "Racing Business") to Sportech Plc ("Sportech") on October 5,
2010, which included shares of Sportech stock valued at approximately $26,300 and a note receivable of $10,000.
Supplemental cash flow information
Cash paid during the period for:
2012 2011 2010
Interest $ 85,882 $ 97,199 $ 86,486
Income taxes, net of refunds 7,511 8,354 (3,393 )
See accompanying notes to consolidated financial statements.
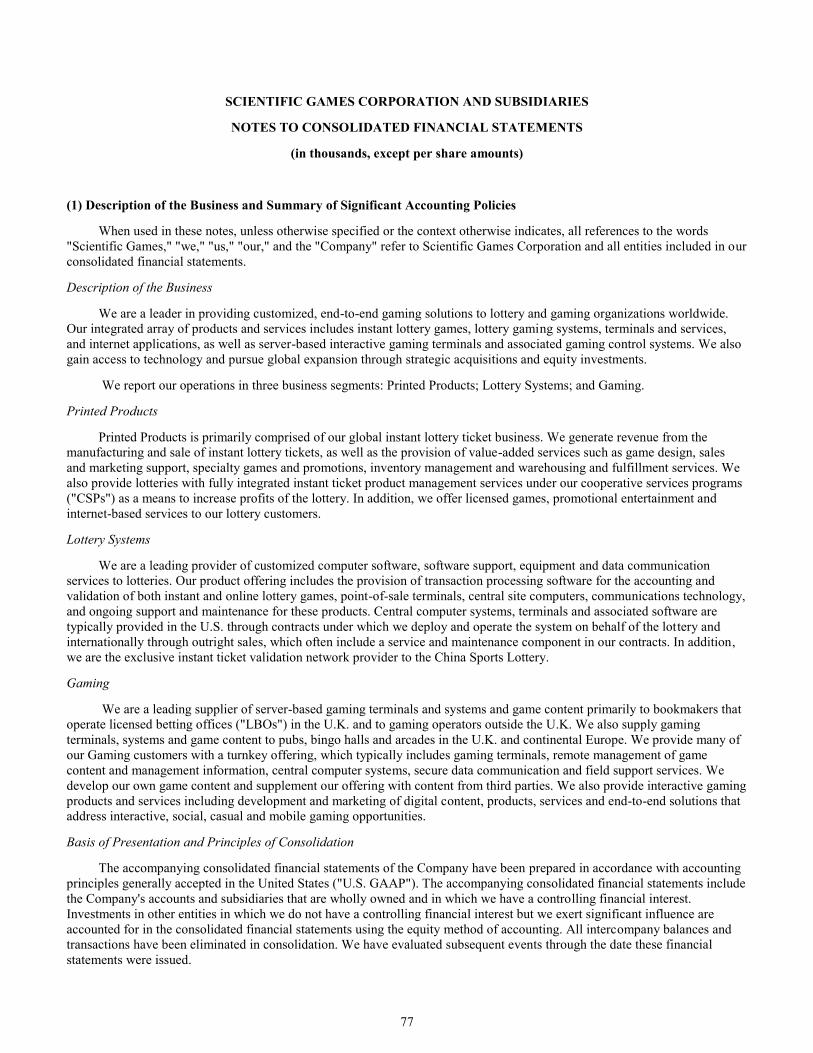
77
SCIENTIFIC GAMES CORPORATION AND SUBSIDIARIES
NOTES TO CONSOLIDATED FINANCIAL STATEMENTS
(in thousands, except per share amounts)
(1) Description of the Business and Summary of Significant Accounting Policies
When used in these notes, unless otherwise specified or the context otherwise indicates, all references to the words
"Scientific Games," "we," "us," "our," and the "Company" refer to Scientific Games Corporation and all entities included in our
consolidated financial statements.
Description of the Business
We are a leader in providing customized, end-to-end gaming solutions to lottery and gaming organizations worldwide.
Our integrated array of products and services includes instant lottery games, lottery gaming systems, terminals and services,
and internet applications, as well as server-based interactive gaming terminals and associated gaming control systems. We also
gain access to technology and pursue global expansion through strategic acquisitions and equity investments.
We report our operations in three business segments: Printed Products; Lottery Systems; and Gaming.
Printed Products
Printed Products is primarily comprised of our global instant lottery ticket business. We generate revenue from the
manufacturing and sale of instant lottery tickets, as well as the provision of value-added services such as game design, sales
and marketing support, specialty games and promotions, inventory management and warehousing and fulfillment services. We
also provide lotteries with fully integrated instant ticket product management services under our cooperative services programs
("CSPs") as a means to increase profits of the lottery. In addition, we offer licensed games, promotional entertainment and
internet-based services to our lottery customers.
Lottery Systems
We are a leading provider of customized computer software, software support, equipment and data communication
services to lotteries. Our product offering includes the provision of transaction processing software for the accounting and
validation of both instant and online lottery games, point-of-sale terminals, central site computers, communications technology,
and ongoing support and maintenance for these products. Central computer systems, terminals and associated software are
typically provided in the U.S. through contracts under which we deploy and operate the system on behalf of the lottery and
internationally through outright sales, which often include a service and maintenance component in our contracts. In addition,
we are the exclusive instant ticket validation network provider to the China Sports Lottery.
Gaming
We are a leading supplier of server-based gaming terminals and systems and game content primarily to bookmakers that
operate licensed betting offices ("LBOs") in the U.K. and to gaming operators outside the U.K. We also supply gaming
terminals, systems and game content to pubs, bingo halls and arcades in the U.K. and continental Europe. We provide many of
our Gaming customers with a turnkey offering, which typically includes gaming terminals, remote management of game
content and management information, central computer systems, secure data communication and field support services. We
develop our own game content and supplement our offering with content from third parties. We also provide interactive gaming
products and services including development and marketing of digital content, products, services and end-to-end solutions that
address interactive, social, casual and mobile gaming opportunities.
Basis of Presentation and Principles of Consolidation
The accompanying consolidated financial statements of the Company have been prepared in accordance with accounting
principles generally accepted in the United States ("U.S. GAAP"). The accompanying consolidated financial statements include
the Company's accounts and subsidiaries that are wholly owned and in which we have a controlling financial interest.
Investments in other entities in which we do not have a controlling financial interest but we exert significant influence are
accounted for in the consolidated financial statements using the equity method of accounting. All intercompany balances and
transactions have been eliminated in consolidation. We have evaluated subsequent events through the date these financial
statements were issued.
78
SCIENTIFIC GAMES CORPORATION AND SUBSIDIARIES
NOTES TO CONSOLIDATED FINANCIAL STATEMENTS (Continued)
(in thousands, except per share amounts)
(1) Description of the Business and Summary of Significant Accounting Policies (Continued)
Revenue Recognition
We derive our revenue from three sources: instant lottery tickets, services, and sales. Our instant lottery ticket business
consists of long-term contracts to supply instant lottery tickets and provide related services to our lottery customers. We offer
our customers a number of related, value-added services as part of an integrated product offering. These services include game
design, determination of prize structure, game programming, warehousing and distribution of tickets and rights to use licensed
products. We recognize revenue when it is realized or realizable and earned. We consider revenue realized or realizable and
earned when we have persuasive evidence of an arrangement, prices are fixed or determinable, services and products are
provided to the customer and collectability is probable or reasonably assured depending on the applicable revenue recognition
guidance followed.
In addition to the general policy discussed above, the following are the specific revenue recognition policies for our
reportable segments:
Printed Products
• Revenue from the sale of instant lottery tickets that are sold on a price per thousand units ("PPK") basis is recognized
when the customer accepts the product pursuant to the terms of the contract.
• Revenue from the sale of instant lottery tickets that are sold on a percentage of retail sales ("POS") basis (including
under our CSP contracts) is recognized when retail sales are generated.
• Revenue from licensing branded property coupled with a service component whereby we purchase and distribute
merchandise prizes on behalf of lottery authorities to identified winners is recognized as a multiple deliverable
arrangement. There are typically two deliverables in this arrangement, the license and the merchandising services,
which are separate units of accounting. We allocate revenue to the deliverables based on their relative selling prices.
Revenue allocated to the license is recognized when the use of the licensed property is permitted, which is typically
when the contract is signed. Revenue allocated to the merchandising services is recognized on a proportional
performance method as this method best reflects the pattern in which the obligations of the merchandising services to
the customer are fulfilled. A performance measure is used based on total estimated cost allocated to the merchandising
services. By accumulating costs for services as they are incurred, and dividing such costs by the total costs of
merchandising services which is estimated based on a budget prior to contract inception, a percentage is determined.
The percentage determined is applied to the revenue allocated to the merchandising services and that proportionate
amount of revenue is recognized on a monthly basis.
• Revenue from the licensing of branded property with no service component is recognized when the contract is signed.
• Revenue from our Properties Plus loyalty and reward programs is typically based on a percentage of a lottery's prize
payout structure calculated as a percentage of retail sales. Revenue is recognized when the amount of retail sales is
generated.
• Revenue from the sale of prepaid phone cards is recognized when the customer accepts the product pursuant to the
terms of the contract.
Lottery Systems
• Revenue from the provision of lottery system services is recognized as a percentage of the retail sales of lottery tickets
pursuant to the terms of the contract.
• Revenue from the sale of a lottery system or sub-system, which includes the customization of software, is recognized
under the percentage of completion method of accounting, based on the ratio of costs incurred to estimated costs to
complete.
• Revenue from the perpetual licensing of customized lottery software is recognized under the percentage of completion
method of accounting, based on the ratio of costs incurred to estimated costs to complete.
• Revenue derived from software maintenance on lottery software is recognized ratably over the maintenance period.
• Revenue derived from hardware maintenance on lottery terminals and central systems is recognized ratably over the
maintenance period.
79
SCIENTIFIC GAMES CORPORATION AND SUBSIDIARIES
NOTES TO CONSOLIDATED FINANCIAL STATEMENTS (Continued)
(in thousands, except per share amounts)
(1) Description of the Business and Summary of Significant Accounting Policies (Continued)
• Revenue from the sale of lottery terminals is recognized when the customer accepts the product pursuant to the terms
of the contract.
Gaming
• Revenue from the provision of gaming services is generally recognized as a percentage of revenue generated by the
gaming machines.
• Revenue from the sale of gaming machines or content that does not include a service or maintenance component is
recognized upon acceptance pursuant to the terms of the contract.
• Revenue from the sale of gaming terminals and related software that includes a service or maintenance component is
recognized ratably over the term of the contract.
• Revenue from the provision of pari-mutuel wagering services is generally recognized as a percentage of the amount
wagered by the customers' patrons at the time of the wager pursuant to the terms of the contract.
• Revenue from the sale of a pari-mutuel wagering system, which includes the customization of software, is recognized
under the percentage of completion method of accounting, based on the ratio of costs incurred to estimated costs to
complete.
• Revenue from the sale of pari-mutuel wagering terminals is recognized when the customer accepts the product
pursuant to the terms of the contract.
• Revenue from the perpetual licensing of customized pari-mutuel software is recognized under the percentage of
completion method of accounting, based on the ratio of costs incurred to estimated costs to complete.
• Revenue from wagering at Company owned or operated sites is recognized as a percentage of the amount wagered by
our customers at the time of the wager.
• Revenue from the provision of facilities management services to non-Company owned wagering sites is recognized as
a percentage of the amount wagered by the customers' patrons at the time of the wager pursuant to the terms of the
contract.
Cash and Cash Equivalents
Cash and cash equivalents include all cash balances and highly liquid investments with an initial maturity of three months
or less. We place our temporary cash investments with high credit quality financial institutions. At times, such investments may
be in excess of the Federal Deposit Insurance Corporation insurance limit.
Restricted Cash
Restricted cash of $30,398 at December 31, 2012 includes approximately $28,960 placed in escrow that will be used to
fund part of our 16.5% investment in the consortium that, subject to obtaining various regulatory approvals and Greek
parliamentary approval, will hold the 12-year concession for the exclusive right to the production, operation and management
of instant ticket lotteries in Greece.
Accounts Receivable and Allowance for Doubtful Accounts
Trade accounts receivable are recorded at the invoiced amount and do not bear interest. The allowance for doubtful
accounts is our best estimate of the amount of probable credit losses in our existing accounts receivable; however, changes in
circumstances relating to accounts receivable may result in additional allowances in the future. We determine the allowance
based on historical experience, current market trends and, for larger accounts, the ability to pay outstanding balances. We
continually review our allowance for doubtful accounts. Past due balances and other higher risk amounts are reviewed
individually for collectability.
Account balances are charged against the allowance after all collection efforts have been exhausted and the potential for
recovery is considered remote. Accounts receivable, net, consists of the following:
80
SCIENTIFIC GAMES CORPORATION AND SUBSIDIARIES
NOTES TO CONSOLIDATED FINANCIAL STATEMENTS (Continued)
(in thousands, except per share amounts)
(1) Description of the Business and Summary of Significant Accounting Policies (Continued)
As of December 31,
2012 2011
Accounts receivable $ 178,572 $ 137,084
Unbilled accounts receivable 42,525 50,165
Allowance for doubtful accounts (10,952 ) (4,782 )
$ 210,145 $ 182,467
Under certain of our contracts, contractual billings do not coincide with revenue recognized under the contract. Unbilled
accounts receivable represent revenue recorded in excess of amounts billable pursuant to contract provisions and generally
become billable at contractually specified dates or upon the attainment of contractually defined milestones.
Inventories
Inventories are stated at the lower of cost or market, including provisions for obsolescence commensurate with known or
estimated exposures. Cost is determined as follows:
Item Cost method
Parts First-in, first-out or weighted moving average. Work-in-process and finished goods
First-in, first-out or weighted moving average for direct material and labor; other fixed and variable production costs are allocated as a percentage of direct labor cost.
Property and Equipment
Property and equipment are stated at cost on acquisition date and are depreciated using the straight-line method over the
estimated useful lives of the assets as follows:
Item Estimated Life in Years
Machinery and equipment 3 - 15
Transportation equipment 3 - 8
Furniture and fixtures 5 - 10
Buildings and improvements 15 - 40
Costs incurred for equipment associated with specific lottery and gaming contracts not yet placed in service are classified
as construction in progress in property and equipment and are not depreciated. Leasehold improvements are amortized over the
term of the corresponding lease.
Deferred Installation Costs
Certain lottery and gaming contracts require us to perform installation activities. Direct installation activities, which
include costs for terminals, facilities wiring, computers, internal labor and travel, are performed at the inception of a specific
81
SCIENTIFIC GAMES CORPORATION AND SUBSIDIARIES
NOTES TO CONSOLIDATED FINANCIAL STATEMENTS (Continued)
(in thousands, except per share amounts)
(1) Description of the Business and Summary of Significant Accounting Policies (Continued)
contract with a specific customer to enable us to perform under the terms of the contract. These activities will begin after a
contract is entered into and will end when the setup activities are substantially complete. Such activities do not represent a
separate earnings process and, therefore, the costs are deferred and amortized over the expected life of the contract, which we
define as the original life of the contract plus all available extensions. Deferred installation costs, net of accumulated
depreciation, included in property and equipment were approximately $36,400 and $40,900 at December 31, 2012 and 2011,
respectively.
Goodwill and Intangible Assets
Goodwill represents the excess of the purchase price over the fair value of the net assets of acquired companies. We
follow the acquisition method of accounting for all business combinations. Goodwill and intangible assets with indefinite
useful lives are not amortized, but instead are evaluated for impairment on an annual basis or more frequently if events and
circumstances indicate that assets might be impaired. For extensions and renewals of intangible assets, we typically capitalize
licensing fees incurred in connection with our licensing agreements for our use of third-party brands and intellectual property.
Such assets are amortized over the estimated life of the asset.
Equity Investments
We account for our investments where we own a non-controlling interest, but exercise significant influence, under the
equity method of accounting. Under the equity method of accounting, our original cost of the investment is adjusted for our
share of equity in the earnings of the equity investment and reduced by distributions received. On a periodic basis, we assess
whether there are any indicators that the fair value of our equity investment may be impaired. An equity investment is impaired
only if the estimate of the fair value of the investment is less than the carrying value of the investment, and such decline in
value is deemed to be other than temporary. If an impairment were to occur, the impairment would be measured as the excess
of the carrying amount of the equity investment over the fair value of the equity investment.
Other Assets
We capitalize costs associated with internally developed and purchased software systems for use in our lottery and
gaming contracts. Capitalized costs are amortized on a straight-line basis over the expected useful life of the asset, which is
typically two to ten years. We also capitalize costs associated with long-term debt financing, marketing rights, and non-
competition agreements arising primarily from business acquisitions. An evaluation is performed to determine if any
impairment has occurred with respect to any amortized or non-amortized assets.
Derivative Financial Instruments
We record derivative instruments on the balance sheet at their respective fair values. From time to time, we utilize
interest rate swap agreements to mitigate gains or losses associated with the change in expected cash flows due to fluctuations
in interest rates on variable rate debt. We also enter into foreign currency forward contracts from time to time to mitigate the
risk associated with cash payments required to be made by the Company in non-functional currencies or to mitigate the foreign
currency translation risk of our investments. During the year ended December 31, 2012, we entered into foreign currency
forward contracts for the sale of Euros for U.S. dollars to hedge a portion of the net investment in one of our subsidiaries that is
denominated in Euros. If the derivative qualifies for hedge accounting, the effective portion of the hedge is recorded in other
comprehensive income (loss) and the ineffective portion of the hedge, if any, is recorded in our results of operations. If the
derivative does not qualify for hedge accounting, any periodic changes to the fair value are recognized in our results of
operations.
Impairment of Long-Lived Assets and Intangible Assets
We assess the recoverability of long-lived assets and identifiable intangible assets with finite useful lives whenever
events or changes in circumstances indicate that the carrying value of such an asset may not be recoverable. Recoverability of
assets to be held and used is measured by a comparison of the carrying amount of the asset to the expected net future
undiscounted cash flows to be generated by that asset or, for identifiable intangibles with finite useful lives, by determining
82
SCIENTIFIC GAMES CORPORATION AND SUBSIDIARIES
NOTES TO CONSOLIDATED FINANCIAL STATEMENTS (Continued)
(in thousands, except per share amounts)
(1) Description of the Business and Summary of Significant Accounting Policies (Continued)
whether the amortization of the intangible asset balance over its remaining life can be recovered through expected net future
undiscounted cash flows. The amount of impairment of other long-lived assets is measured by the amount by which the
carrying value of the asset exceeds the fair market value of the asset. Assets held for sale are reported at the lower of the
carrying amount or fair market value, less expected costs to sell.
Income Taxes
Income taxes are determined using the liability method of accounting for income taxes. The Company's tax expense
includes U.S. and international income taxes, but excludes the provision for U.S. taxes on undistributed earnings of
international subsidiaries deemed to be permanently invested.
The Company applies a recognition threshold and measurement attribute for the financial statement recognition and
measurement of a tax position taken or expected to be taken in a tax return. The Company recognizes in the financial
statements the impact of a tax position if that position is more likely than not to be sustained upon audit based on the technical
merits of the position.
Certain items of income and expense are not reported in tax returns and financial statements in the same year. The tax
effect of such temporary differences is reported as deferred income taxes. The measurement of deferred tax assets is reduced, if
necessary, by the amount of any tax benefits that, based on available evidence, are not expected to be realized. The Company
establishes a valuation allowance for deferred tax assets for which realization is not likely. At December 31, 2012 and 2011, the
Company had a valuation allowance of $241,156 and $236,296, respectively, recorded against the benefit of certain deferred
tax assets of foreign and U.S. subsidiaries.
The Company operates within multiple taxing jurisdictions and in the normal course of business is examined in various
jurisdictions. The reversal of accruals is recorded when examinations are completed, statutes of limitation are closed or tax
laws are changed.
Changes in tax laws and rates may affect recorded deferred tax assets and liabilities and our effective tax rate in the
future. The American Taxpayer Relief Act of 2012 (the "Act”) was signed into law on January 2, 2013. Because a change in tax
law is accounted for in the period of enactment, the provisions of the Act that are expected to impact the Company's 2012 U.S
tax return (e.g., the research and experimentation credit) cannot be recognized in the Company's 2012 financial statements and
instead will be reflected in the Company's 2013 financial statements. Because the Company has recorded a valuation allowance
against the benefit of its U.S net deferred tax assets, we do not expect the provisions of the Act to have a material impact on the
Company's 2013 financial statements.
Foreign Currency Translation
Significant operations where local currency is the functional currency include our operations in the U.K., continental
Europe and China. Assets and liabilities of foreign operations are translated at period-end rates of exchange and results of
operations are translated at the average rates of exchange for the period. Gains or losses resulting from translating the foreign
currency financial statements are accumulated as a separate component of accumulated other comprehensive income (loss) in
stockholders' equity. Gains or losses resulting from foreign currency transactions are included in other income (expense) in the
Consolidated Statements of Operations and Comprehensive Income.
Shipping and Handling Costs
Shipping and handling costs are included in cost of sales for all periods presented.
Stock-Based Compensation
We offer stock-based compensation through the use of stock options and restricted stock units ("RSUs").
83
SCIENTIFIC GAMES CORPORATION AND SUBSIDIARIES
NOTES TO CONSOLIDATED FINANCIAL STATEMENTS (Continued)
(in thousands, except per share amounts)
(1) Description of the Business and Summary of Significant Accounting Policies (Continued)
We measure compensation cost for stock awards at fair value and recognize compensation expense ratably over the
service period for awards expected to vest. The fair value of RSUs is determined based on the number of shares underlying the
units granted and the quoted market price of our common stock. The fair value of stock options is determined using the Black-
Scholes valuation model. The estimation of stock awards that will ultimately vest requires judgment and, to the extent actual
results or future estimates differ from our current estimates, such amounts will be recorded as a cumulative adjustment in the
period estimates are revised. We consider many factors when estimating expected forfeitures, including types of awards,
employee class and historical experience. Actual results and future changes in estimates may differ substantially from our
current estimates.
The Company may grant awards that are contingent upon the Company achieving certain performance targets. Upon
determining the performance target is probable, the fair value of the award is recognized over the service period. Certain equity
awards may be settled in cash or a variable number of shares. The fair value of these awards are measured each reporting
period and recorded as a liability and corresponding compensation expense. As the fair value changes each reporting period,
the corresponding liability and compensation expense are adjusted, such that the liability and cumulative compensation expense
equal the total fair value of the obligation at the reporting date.
Comprehensive Income
We include and separately classify in comprehensive income unrealized gains and losses from our foreign currency
translation adjustments, gains or losses associated with pension or other post-retirement benefits, prior service costs or credits
associated with pension or other postretirement benefits, transition assets or obligations associated with pension or other post-
retirement benefits, the effective portion of derivative financial instruments and unrealized gains and losses on investments.
Use of Estimates
The preparation of financial statements in conformity with U.S. GAAP requires management to make estimates and
assumptions that affect the reported amounts of assets and liabilities and disclosure of contingent assets and liabilities at the
date of the financial statements and the reported amounts of revenues and expenses during the reporting period. Some of the
significant estimates involve percentage of completion for contracted lottery development projects, stock-based and/or
performance-based compensation expense, capitalization of software development costs, evaluation of the recoverability of
assets, assessment of litigation and contingencies, allocation of purchase price to assets acquired and liabilities assumed in
business combinations and income and other taxes. Actual results could differ from estimates.
Our review during the three months ended June 30, 2012 indicated lower estimated useful lives for our gaming terminals
deployed at our U.K. LBO customers relative to historical estimates due to market changes that have altered the replacement
cycle of these terminals. As a result, effective April 1, 2012, we revised the estimated useful lives of our gaming terminals
currently deployed to our LBO customers. This change increased depreciation expense for the year ended December 31, 2012
but was not material to our consolidated financial position or results of operations as of and for the year ended December 31,
2012.
Recently Issued Accounting Guidance
In May 2011, the Financial Accounting Standards Board (the "FASB") issued guidance to clarify the intent of the
application of existing fair value measurement and disclosure requirements and amend certain requirements for measuring fair
value or for disclosing information about fair value measurements. The guidance limits the highest-and-best-use measure to
non-financial assets, permits certain financial assets and liabilities with offsetting positions in market or counter-party credit
risks to be measured at a net basis, and provides guidance on the applicability of premiums and discounts in fair value
measurement. Additionally, for fair value measurements categorized within Level 3 of the fair value hierarchy, the new
guidance clarifies that quantitative disclosure about unobservable inputs should be disclosed and requires a description of the
valuation processes and the sensitivity of the fair value measurements to changes in unobservable inputs and the
84
SCIENTIFIC GAMES CORPORATION AND SUBSIDIARIES
NOTES TO CONSOLIDATED FINANCIAL STATEMENTS (Continued)
(in thousands, except per share amounts)
(1) Description of the Business and Summary of Significant Accounting Policies (Continued)
interrelationships between those inputs. We adopted the guidance on January 1, 2012. The adoption did not have a material
impact on our financial statements.
In June 2011, the FASB issued guidance on presentation of comprehensive income. The guidance eliminates the option
to report other comprehensive income and its components in the statement of stockholders' equity. Instead, an entity is required
to present net income and other comprehensive income either in one continuous statement or in two separate but consecutive
statements. We adopted the guidance on January 1, 2012, resulting in a change in the presentation of comprehensive income for
the years ended December 31, 2012, 2011 and 2010.
In February 2013, the FASB issued guidance on presentation of comprehensive income to improve the reporting of
reclassifications out of accumulated other comprehensive income. The guidance is effective prospectively for reporting periods
beginning after December 15, 2012 and early adoption is permitted. The guidance requires an entity to provide information
about the amounts reclassified out of accumulated other comprehensive income by component. In addition, an entity is required
to present, either on the face of the statement where net income is presented or in the notes, significant amounts reclassified out
of accumulated other comprehensive income by the respective line items of net income but only if the amount reclassified is
required under U.S. GAAP to be reclassified to net income in its entirety in the same reporting period. For other amounts that
are not required under U.S. GAAP to be reclassified in their entirety to net income, an entity is required to cross-reference to
other disclosures required under U.S. GAAP that provide additional detail about those amounts. We adopted the new guidance
on January 1, 2013.
In September 2011, the FASB issued guidance on testing goodwill for impairment. The guidance provides an entity with
the option to first perform a qualitative assessment to determine whether it is more likely than not that the fair value of a
reporting unit is less than its carrying amount. If an entity determines that this is the case, it is required to perform the currently
prescribed two-step goodwill impairment test to identify potential goodwill impairment and measure the amount of goodwill
impairment loss to be recognized for that reporting unit (if any). If an entity determines the fair value of a reporting unit is
greater than its carrying amount, then the two-step goodwill impairment test is not required. We adopted the guidance on
January 1, 2012. The adoption did not have a material impact on our financial statements.
In July 2012, the FASB issued guidance on testing indefinite-lived intangible assets, other than goodwill, for
impairment. The guidance is effective for fiscal years beginning after September 15, 2012 and early adoption is permitted. The
guidance provides an entity with the option to first perform a qualitative assessment to determine whether it is more likely than
not that the indefinite-lived intangible asset is impaired. If, after assessing the totality of events and circumstances, an entity
concludes that it is not more likely than not that the indefinite-lived intangible asset is impaired, then the entity is not required
to take further action. However, if an entity concludes otherwise, then it is required to perform the currently prescribed
quantitative impairment test by comparing the fair value of the asset with the carrying amount. We adopted the guidance on
July 1, 2012. The adoption did not have a material impact on our financial statements.
(2) Business and Geographic Segments
We report our operations in three business segments: Printed Products; Lottery Systems; and Gaming, each of which is
managed by a separate segment President who reports to the Chief Operating Decision Maker ("CODM"). During the first
quarter of 2011, we reviewed the allocation of overhead expenses to our reportable segments as a result of the realignment of
our management structure. Based on this review, we determined to no longer allocate certain overhead expenses to our
reportable segments. This change, which was effective January 1, 2011, had no impact on the Company's consolidated balance
sheets or its statements of operations, cash flows or changes in stockholders' equity for any periods. Prior period reportable
segment information for the year ended December 31, 2010 has been adjusted to reflect the change in reportable segment
reporting. The impact of this adjustment was a decrease to reportable business segment selling, general and administrative
expenses and a corresponding increase to unallocated corporate selling, general and administrative expenses of approximately
$17,100.
The following tables set forth revenue, cost of revenue, selling, general and administrative expenses, write-down of assets
held for sale, employee termination and restructuring costs, depreciation and amortization, operating income, capital, lottery
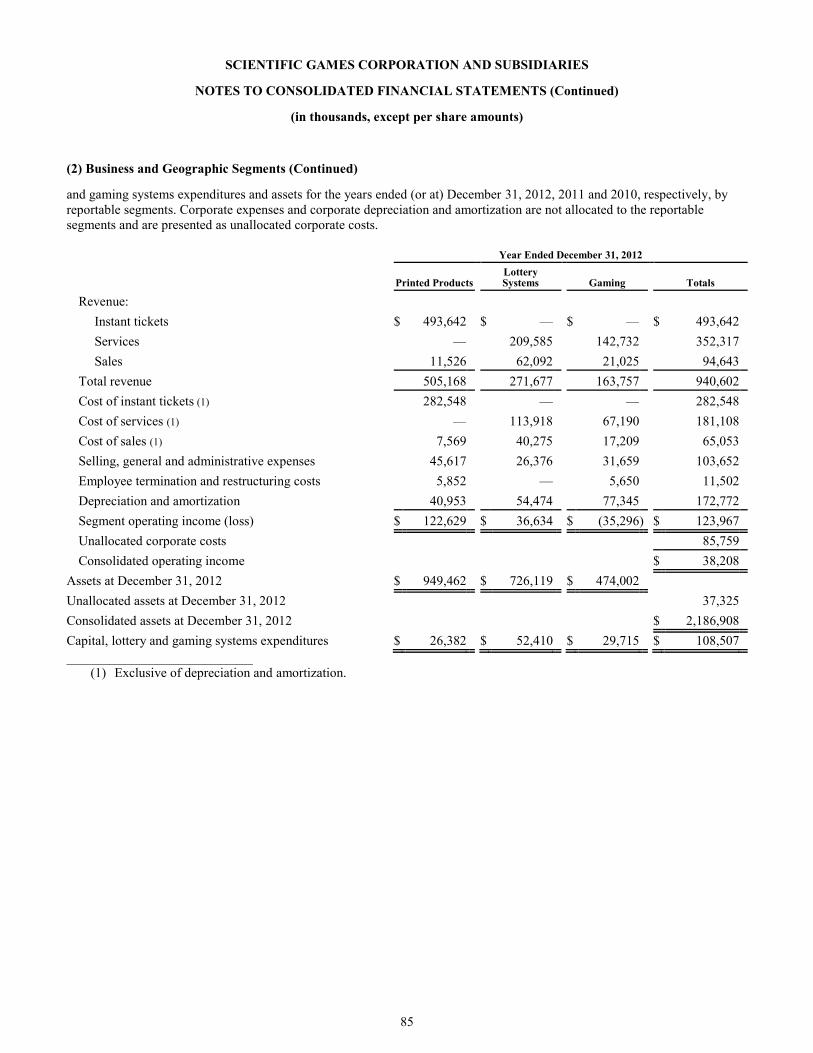
85
SCIENTIFIC GAMES CORPORATION AND SUBSIDIARIES
NOTES TO CONSOLIDATED FINANCIAL STATEMENTS (Continued)
(in thousands, except per share amounts)
(2) Business and Geographic Segments (Continued)
and gaming systems expenditures and assets for the years ended (or at) December 31, 2012, 2011 and 2010, respectively, by
reportable segments. Corporate expenses and corporate depreciation and amortization are not allocated to the reportable
segments and are presented as unallocated corporate costs.
Year Ended December 31, 2012
Printed Products Lottery Systems Gaming Totals
Revenue:
Instant tickets $ 493,642 $ — $ — $ 493,642
Services — 209,585 142,732 352,317
Sales 11,526 62,092 21,025 94,643
Total revenue 505,168 271,677 163,757 940,602
Cost of instant tickets (1) 282,548 — — 282,548
Cost of services (1) — 113,918 67,190 181,108
Cost of sales (1) 7,569 40,275 17,209 65,053
Selling, general and administrative expenses 45,617 26,376 31,659 103,652
Employee termination and restructuring costs 5,852 — 5,650 11,502
Depreciation and amortization 40,953 54,474 77,345 172,772
Segment operating income (loss) $ 122,629 $ 36,634 $ (35,296 ) $ 123,967
Unallocated corporate costs 85,759
Consolidated operating income $ 38,208
Assets at December 31, 2012 $ 949,462 $ 726,119 $ 474,002
Unallocated assets at December 31, 2012 37,325
Consolidated assets at December 31, 2012 $ 2,186,908
Capital, lottery and gaming systems expenditures $ 26,382 $ 52,410 $ 29,715 $ 108,507
___________________________________
(1) Exclusive of depreciation and amortization.
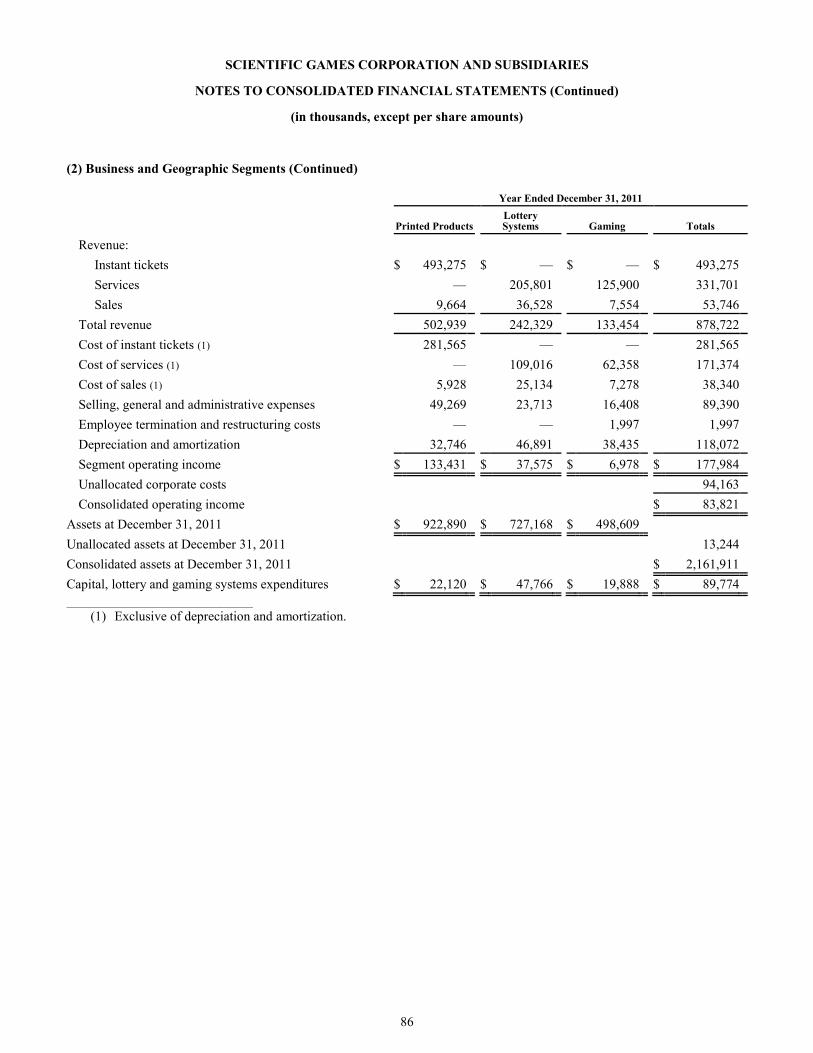
86
SCIENTIFIC GAMES CORPORATION AND SUBSIDIARIES
NOTES TO CONSOLIDATED FINANCIAL STATEMENTS (Continued)
(in thousands, except per share amounts)
(2) Business and Geographic Segments (Continued)
Year Ended December 31, 2011
Printed Products Lottery Systems Gaming Totals
Revenue:
Instant tickets $ 493,275 $ — $ — $ 493,275
Services — 205,801 125,900 331,701
Sales 9,664 36,528 7,554 53,746
Total revenue 502,939 242,329 133,454 878,722
Cost of instant tickets (1) 281,565 — — 281,565
Cost of services (1) — 109,016 62,358 171,374
Cost of sales (1) 5,928 25,134 7,278 38,340
Selling, general and administrative expenses 49,269 23,713 16,408 89,390
Employee termination and restructuring costs — — 1,997 1,997
Depreciation and amortization 32,746 46,891 38,435 118,072
Segment operating income $ 133,431 $ 37,575 $ 6,978 $ 177,984
Unallocated corporate costs 94,163
Consolidated operating income $ 83,821
Assets at December 31, 2011 $ 922,890 $ 727,168 $ 498,609
Unallocated assets at December 31, 2011 13,244
Consolidated assets at December 31, 2011 $ 2,161,911
Capital, lottery and gaming systems expenditures $ 22,120 $ 47,766 $ 19,888 $ 89,774
___________________________________
(1) Exclusive of depreciation and amortization.
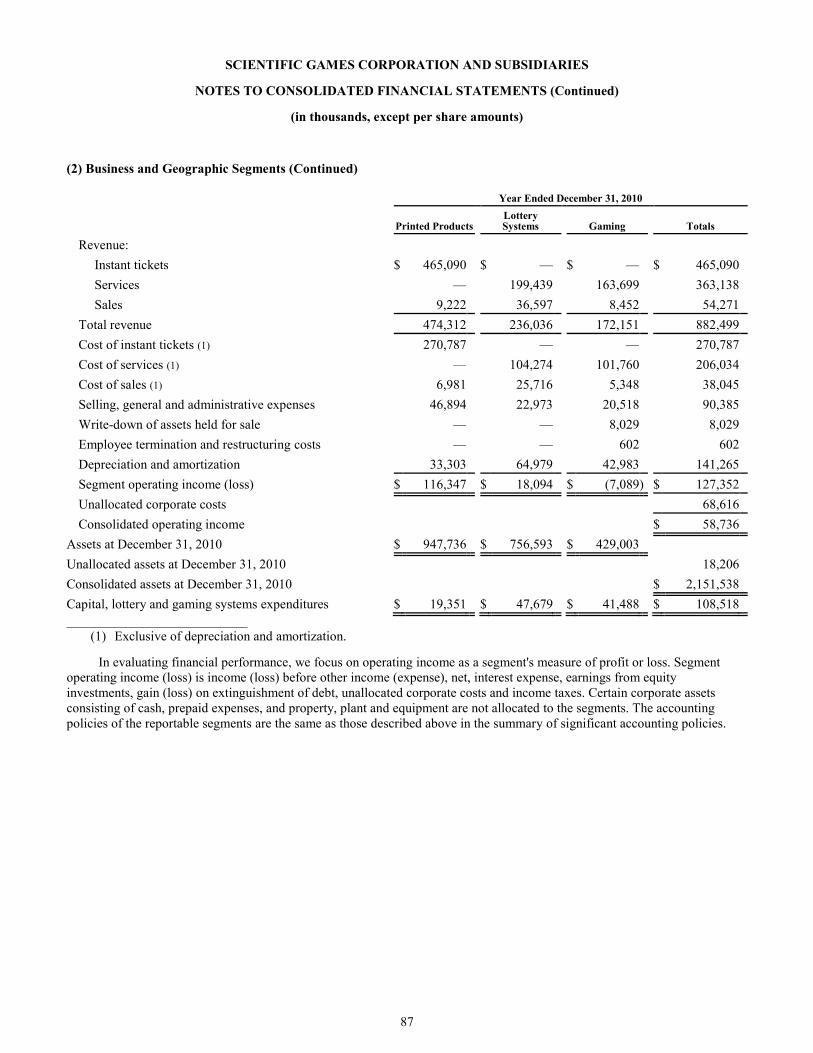
87
SCIENTIFIC GAMES CORPORATION AND SUBSIDIARIES
NOTES TO CONSOLIDATED FINANCIAL STATEMENTS (Continued)
(in thousands, except per share amounts)
(2) Business and Geographic Segments (Continued)
Year Ended December 31, 2010
Printed Products Lottery Systems Gaming Totals
Revenue:
Instant tickets $ 465,090 $ — $ — $ 465,090
Services — 199,439 163,699 363,138
Sales 9,222 36,597 8,452 54,271
Total revenue 474,312 236,036 172,151 882,499
Cost of instant tickets (1) 270,787 — — 270,787
Cost of services (1) — 104,274 101,760 206,034
Cost of sales (1) 6,981 25,716 5,348 38,045
Selling, general and administrative expenses 46,894 22,973 20,518 90,385
Write-down of assets held for sale — — 8,029 8,029
Employee termination and restructuring costs — — 602 602
Depreciation and amortization 33,303 64,979 42,983 141,265
Segment operating income (loss) $ 116,347 $ 18,094 $ (7,089 ) $ 127,352
Unallocated corporate costs 68,616
Consolidated operating income $ 58,736
Assets at December 31, 2010 $ 947,736 $ 756,593 $ 429,003
Unallocated assets at December 31, 2010 18,206
Consolidated assets at December 31, 2010 $ 2,151,538
Capital, lottery and gaming systems expenditures $ 19,351 $ 47,679 $ 41,488 $ 108,518
__________________________________
(1) Exclusive of depreciation and amortization.
In evaluating financial performance, we focus on operating income as a segment's measure of profit or loss. Segment
operating income (loss) is income (loss) before other income (expense), net, interest expense, earnings from equity
investments, gain (loss) on extinguishment of debt, unallocated corporate costs and income taxes. Certain corporate assets
consisting of cash, prepaid expenses, and property, plant and equipment are not allocated to the segments. The accounting
policies of the reportable segments are the same as those described above in the summary of significant accounting policies.
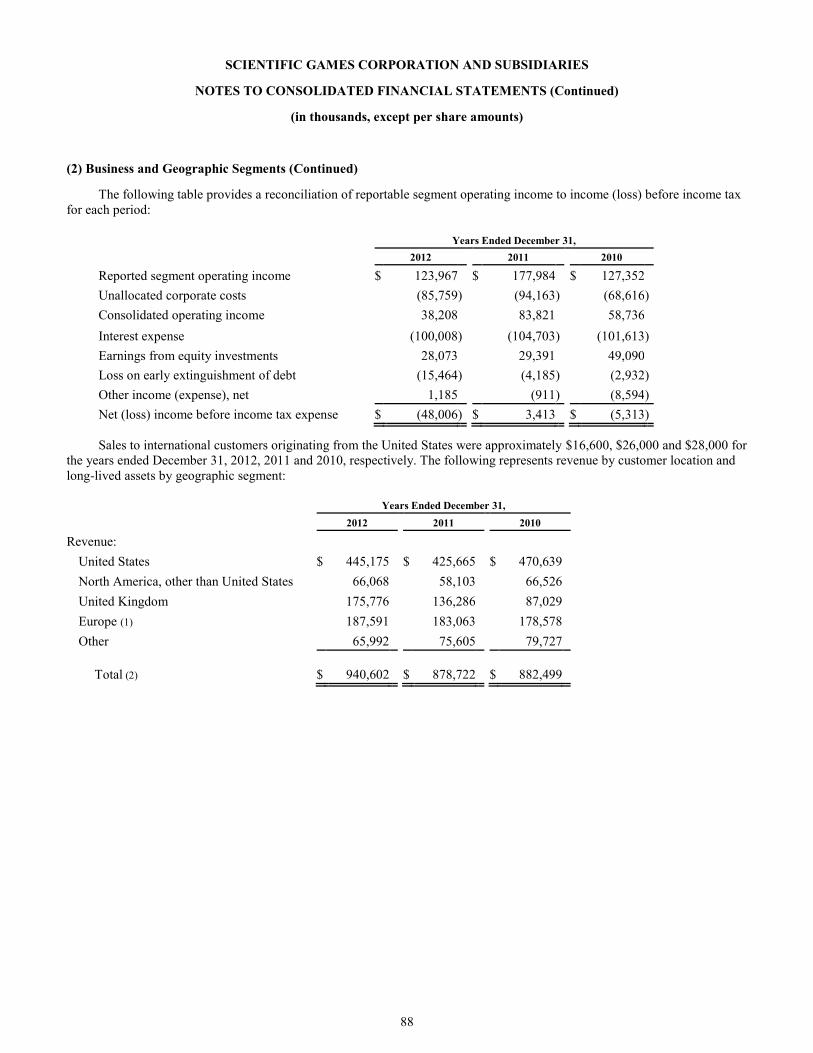
88
SCIENTIFIC GAMES CORPORATION AND SUBSIDIARIES
NOTES TO CONSOLIDATED FINANCIAL STATEMENTS (Continued)
(in thousands, except per share amounts)
(2) Business and Geographic Segments (Continued)
The following table provides a reconciliation of reportable segment operating income to income (loss) before income tax
for each period:
Years Ended December 31,
2012 2011 2010
Reported segment operating income $ 123,967 $ 177,984 $ 127,352
Unallocated corporate costs (85,759 ) (94,163 ) (68,616 )
Consolidated operating income 38,208 83,821 58,736
Interest expense (100,008 ) (104,703 ) (101,613 )
Earnings from equity investments 28,073 29,391 49,090
Loss on early extinguishment of debt (15,464 ) (4,185 ) (2,932 )
Other income (expense), net 1,185 (911 ) (8,594 )
Net (loss) income before income tax expense $ (48,006 ) $ 3,413 $ (5,313 )
Sales to international customers originating from the United States were approximately $16,600, $26,000 and $28,000 for
the years ended December 31, 2012, 2011 and 2010, respectively. The following represents revenue by customer location and
long-lived assets by geographic segment:
Years Ended December 31,
2012 2011 2010
Revenue:
United States $ 445,175 $ 425,665 $ 470,639
North America, other than United States 66,068 58,103 66,526
United Kingdom 175,776 136,286 87,029
Europe (1) 187,591 183,063 178,578
Other 65,992 75,605 79,727
Total (2) $ 940,602 $ 878,722 $ 882,499
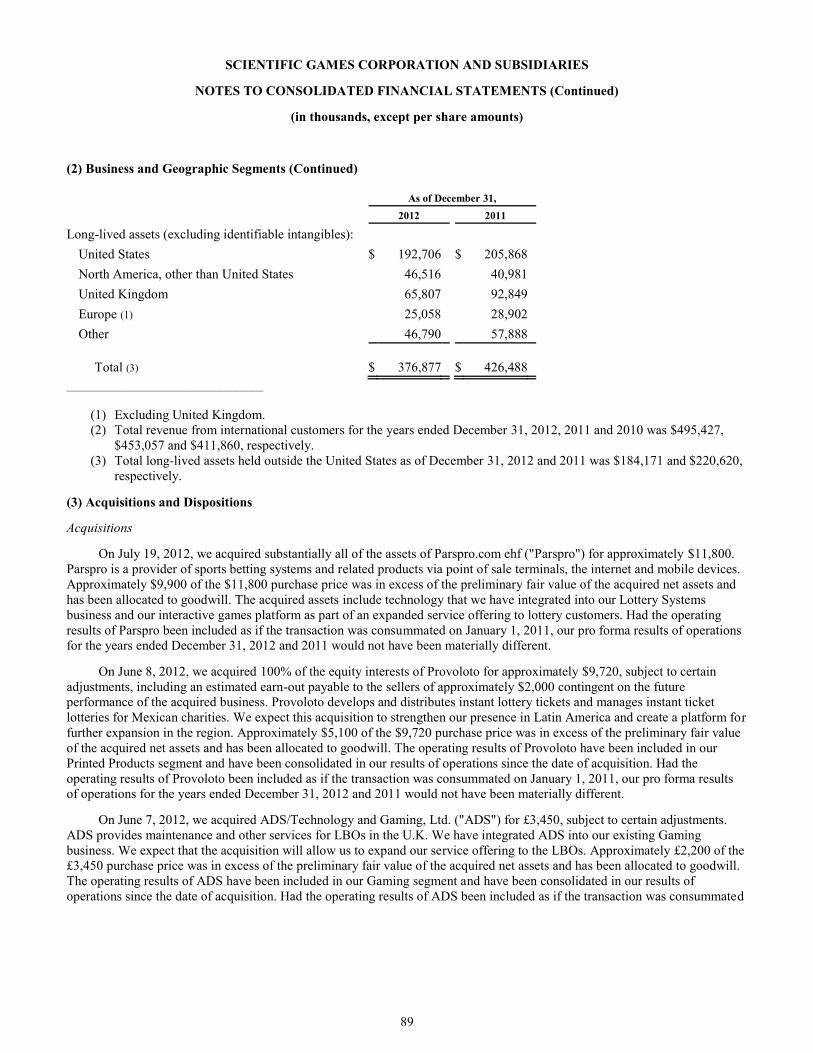
89
SCIENTIFIC GAMES CORPORATION AND SUBSIDIARIES
NOTES TO CONSOLIDATED FINANCIAL STATEMENTS (Continued)
(in thousands, except per share amounts)
(2) Business and Geographic Segments (Continued)
As of December 31,
2012 2011
Long-lived assets (excluding identifiable intangibles):
United States $ 192,706 $ 205,868
North America, other than United States 46,516 40,981
United Kingdom 65,807 92,849
Europe (1) 25,058 28,902
Other 46,790 57,888
Total (3) $ 376,877 $ 426,488
_____________________________________
(1) Excluding United Kingdom.
(2) Total revenue from international customers for the years ended December 31, 2012, 2011 and 2010 was $495,427,
$453,057 and $411,860, respectively.
(3) Total long-lived assets held outside the United States as of December 31, 2012 and 2011 was $184,171 and $220,620,
respectively.
(3) Acquisitions and Dispositions
Acquisitions
On July 19, 2012, we acquired substantially all of the assets of Parspro.com ehf ("Parspro") for approximately $11,800.
Parspro is a provider of sports betting systems and related products via point of sale terminals, the internet and mobile devices.
Approximately $9,900 of the $11,800 purchase price was in excess of the preliminary fair value of the acquired net assets and
has been allocated to goodwill. The acquired assets include technology that we have integrated into our Lottery Systems
business and our interactive games platform as part of an expanded service offering to lottery customers. Had the operating
results of Parspro been included as if the transaction was consummated on January 1, 2011, our pro forma results of operations
for the years ended December 31, 2012 and 2011 would not have been materially different.
On June 8, 2012, we acquired 100% of the equity interests of Provoloto for approximately $9,720, subject to certain
adjustments, including an estimated earn-out payable to the sellers of approximately $2,000 contingent on the future
performance of the acquired business. Provoloto develops and distributes instant lottery tickets and manages instant ticket
lotteries for Mexican charities. We expect this acquisition to strengthen our presence in Latin America and create a platform for
further expansion in the region. Approximately $5,100 of the $9,720 purchase price was in excess of the preliminary fair value
of the acquired net assets and has been allocated to goodwill. The operating results of Provoloto have been included in our
Printed Products segment and have been consolidated in our results of operations since the date of acquisition. Had the
operating results of Provoloto been included as if the transaction was consummated on January 1, 2011, our pro forma results
of operations for the years ended December 31, 2012 and 2011 would not have been materially different.
On June 7, 2012, we acquired ADS/Technology and Gaming, Ltd. ("ADS") for £3,450, subject to certain adjustments.
ADS provides maintenance and other services for LBOs in the U.K. We have integrated ADS into our existing Gaming
business. We expect that the acquisition will allow us to expand our service offering to the LBOs. Approximately £2,200 of the
£3,450 purchase price was in excess of the preliminary fair value of the acquired net assets and has been allocated to goodwill.
The operating results of ADS have been included in our Gaming segment and have been consolidated in our results of
operations since the date of acquisition. Had the operating results of ADS been included as if the transaction was consummated
90
SCIENTIFIC GAMES CORPORATION AND SUBSIDIARIES
NOTES TO CONSOLIDATED FINANCIAL STATEMENTS (Continued)
(in thousands, except per share amounts)
(3) Acquisitions and Dispositions (Continued)
on January 1, 2011, our pro forma results of operations for the years ended December 31, 2012 and 2011 would not have been
materially different.
On September 23, 2011 we acquired Barcrest Group Limited ("Barcrest"), a leading supplier of gaming content and
machines in Europe, from subsidiaries of International Game Technology for approximately £33,000 in cash (subject to certain
adjustments). Barcrest has been integrated with our existing Gaming business.
Subsequent to the filing of our 2011 Annual Report on Form 10-K, we adjusted the estimated fair values of certain of the
assets acquired as part of our acquisition of Barcrest on September 23, 2011 to reflect new information obtained about facts and
circumstances that existed as of the acquisition date that, if known, would have affected the amounts recognized as of that date.
The adjustments resulted in an increase in goodwill of approximately $2,040, an increase in other assets of approximately
$1,490, a decrease in inventory of approximately $1,970, a decrease in the current portion of deferred income taxes of
approximately $1,090 and a decrease in prepaid expenses, deposits and other current assets of approximately $470. We have
applied the adjustment retrospectively to the Consolidated Balance Sheet as of December 31, 2011.
The following table summarizes the adjusted fair values of the assets acquired and liabilities assumed at the acquisition
date based on a final purchase price allocation:
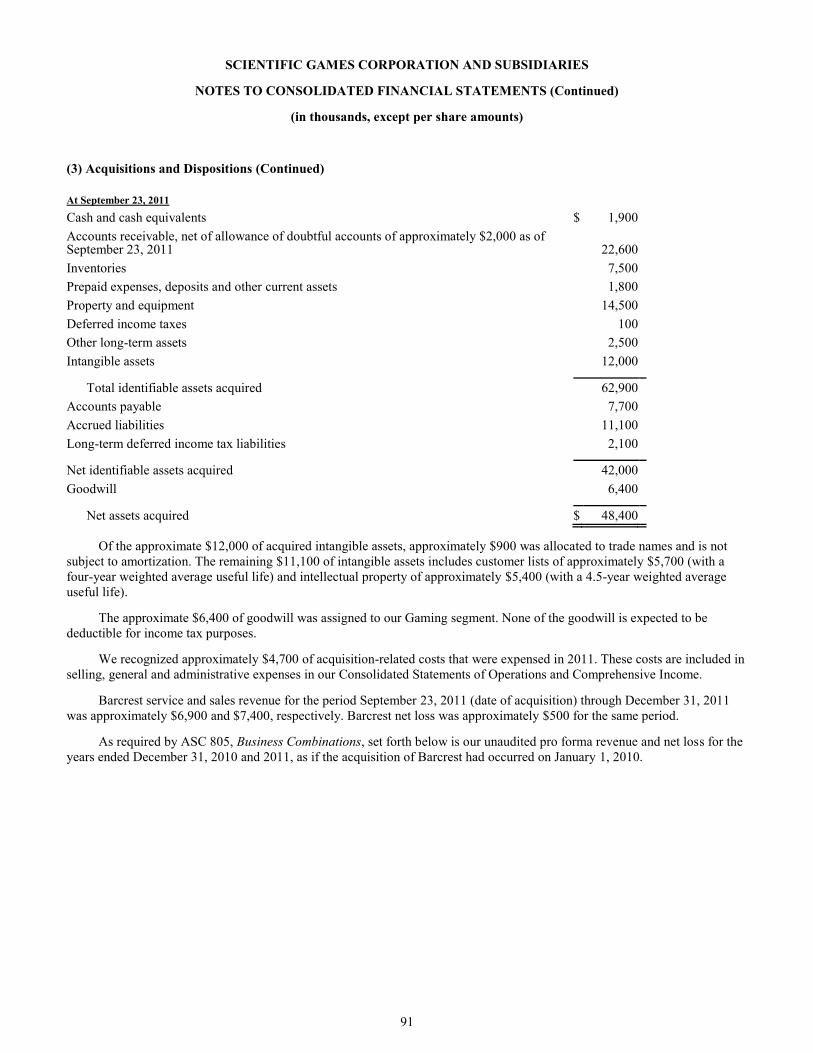
91
SCIENTIFIC GAMES CORPORATION AND SUBSIDIARIES
NOTES TO CONSOLIDATED FINANCIAL STATEMENTS (Continued)
(in thousands, except per share amounts)
(3) Acquisitions and Dispositions (Continued)
At September 23, 2011
Cash and cash equivalents $ 1,900
Accounts receivable, net of allowance of doubtful accounts of approximately $2,000 as of September 23, 2011 22,600
Inventories 7,500
Prepaid expenses, deposits and other current assets 1,800
Property and equipment 14,500
Deferred income taxes 100
Other long-term assets 2,500
Intangible assets 12,000
Total identifiable assets acquired 62,900
Accounts payable 7,700
Accrued liabilities 11,100
Long-term deferred income tax liabilities 2,100
Net identifiable assets acquired 42,000
Goodwill 6,400
Net assets acquired $ 48,400
Of the approximate $12,000 of acquired intangible assets, approximately $900 was allocated to trade names and is not
subject to amortization. The remaining $11,100 of intangible assets includes customer lists of approximately $5,700 (with a
four-year weighted average useful life) and intellectual property of approximately $5,400 (with a 4.5-year weighted average
useful life).
The approximate $6,400 of goodwill was assigned to our Gaming segment. None of the goodwill is expected to be
deductible for income tax purposes.
We recognized approximately $4,700 of acquisition-related costs that were expensed in 2011. These costs are included in
selling, general and administrative expenses in our Consolidated Statements of Operations and Comprehensive Income.
Barcrest service and sales revenue for the period September 23, 2011 (date of acquisition) through December 31, 2011
was approximately $6,900 and $7,400, respectively. Barcrest net loss was approximately $500 for the same period.
As required by ASC 805, Business Combinations, set forth below is our unaudited pro forma revenue and net loss for the
years ended December 31, 2010 and 2011, as if the acquisition of Barcrest had occurred on January 1, 2010.
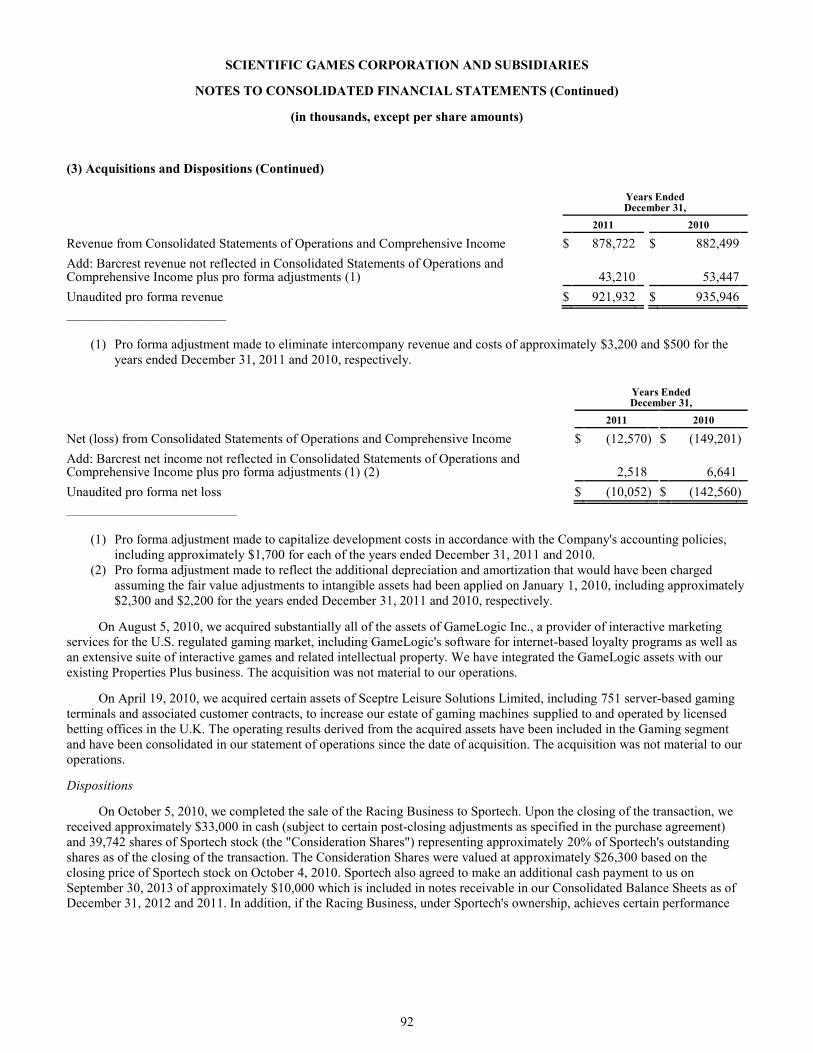
92
SCIENTIFIC GAMES CORPORATION AND SUBSIDIARIES
NOTES TO CONSOLIDATED FINANCIAL STATEMENTS (Continued)
(in thousands, except per share amounts)
(3) Acquisitions and Dispositions (Continued)
Years Ended December 31,
2011 2010
Revenue from Consolidated Statements of Operations and Comprehensive Income $ 878,722 $ 882,499
Add: Barcrest revenue not reflected in Consolidated Statements of Operations and Comprehensive Income plus pro forma adjustments (1) 43,210 53,447
Unaudited pro forma revenue $ 921,932 $ 935,946
______________________________
(1) Pro forma adjustment made to eliminate intercompany revenue and costs of approximately $3,200 and $500 for the
years ended December 31, 2011 and 2010, respectively.
Years Ended December 31,
2011 2010
Net (loss) from Consolidated Statements of Operations and Comprehensive Income $ (12,570 ) $ (149,201 )
Add: Barcrest net income not reflected in Consolidated Statements of Operations and Comprehensive Income plus pro forma adjustments (1) (2) 2,518 6,641
Unaudited pro forma net loss $ (10,052 ) $ (142,560 )
________________________________
(1) Pro forma adjustment made to capitalize development costs in accordance with the Company's accounting policies,
including approximately $1,700 for each of the years ended December 31, 2011 and 2010.
(2) Pro forma adjustment made to reflect the additional depreciation and amortization that would have been charged
assuming the fair value adjustments to intangible assets had been applied on January 1, 2010, including approximately
$2,300 and $2,200 for the years ended December 31, 2011 and 2010, respectively.
On August 5, 2010, we acquired substantially all of the assets of GameLogic Inc., a provider of interactive marketing
services for the U.S. regulated gaming market, including GameLogic's software for internet-based loyalty programs as well as
an extensive suite of interactive games and related intellectual property. We have integrated the GameLogic assets with our
existing Properties Plus business. The acquisition was not material to our operations.
On April 19, 2010, we acquired certain assets of Sceptre Leisure Solutions Limited, including 751 server-based gaming
terminals and associated customer contracts, to increase our estate of gaming machines supplied to and operated by licensed
betting offices in the U.K. The operating results derived from the acquired assets have been included in the Gaming segment
and have been consolidated in our statement of operations since the date of acquisition. The acquisition was not material to our
operations.
Dispositions
On October 5, 2010, we completed the sale of the Racing Business to Sportech. Upon the closing of the transaction, we
received approximately $33,000 in cash (subject to certain post-closing adjustments as specified in the purchase agreement)
and 39,742 shares of Sportech stock (the "Consideration Shares") representing approximately 20% of Sportech's outstanding
shares as of the closing of the transaction. The Consideration Shares were valued at approximately $26,300 based on the
closing price of Sportech stock on October 4, 2010. Sportech also agreed to make an additional cash payment to us on
September 30, 2013 of approximately $10,000 which is included in notes receivable in our Consolidated Balance Sheets as of
December 31, 2012 and 2011. In addition, if the Racing Business, under Sportech's ownership, achieves certain performance
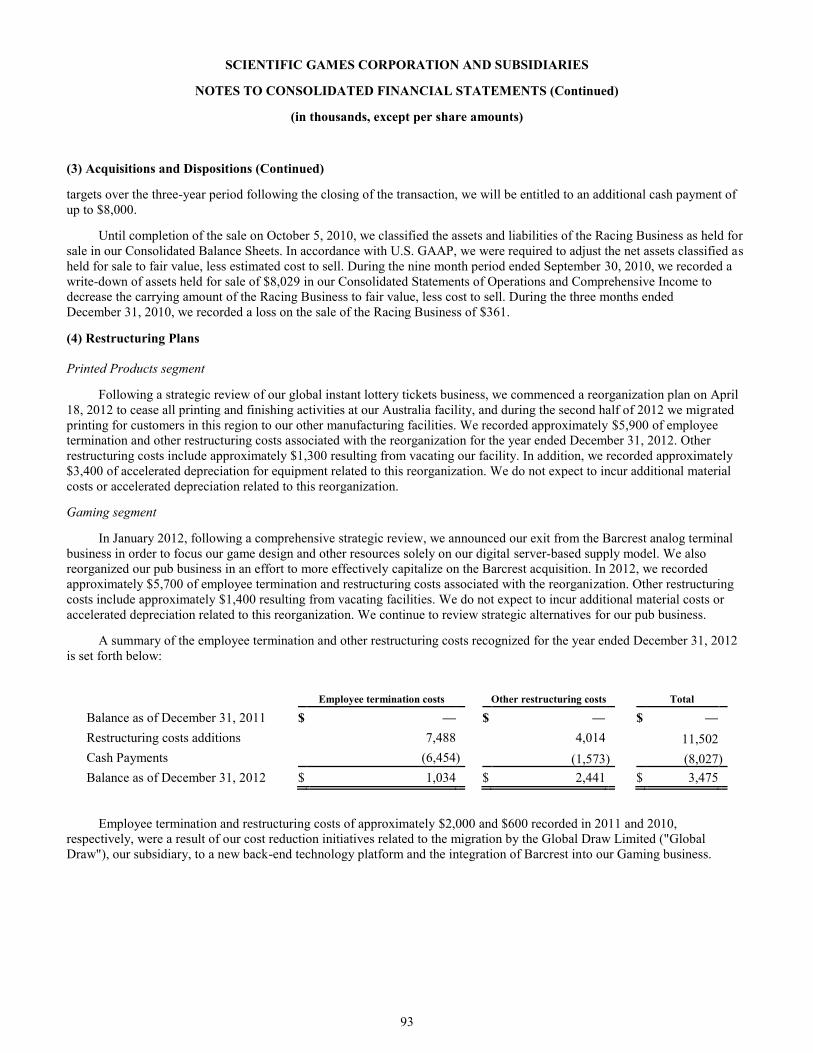
93
SCIENTIFIC GAMES CORPORATION AND SUBSIDIARIES
NOTES TO CONSOLIDATED FINANCIAL STATEMENTS (Continued)
(in thousands, except per share amounts)
(3) Acquisitions and Dispositions (Continued)
targets over the three-year period following the closing of the transaction, we will be entitled to an additional cash payment of
up to $8,000.
Until completion of the sale on October 5, 2010, we classified the assets and liabilities of the Racing Business as held for
sale in our Consolidated Balance Sheets. In accordance with U.S. GAAP, we were required to adjust the net assets classified as
held for sale to fair value, less estimated cost to sell. During the nine month period ended September 30, 2010, we recorded a
write-down of assets held for sale of $8,029 in our Consolidated Statements of Operations and Comprehensive Income to
decrease the carrying amount of the Racing Business to fair value, less cost to sell. During the three months ended
December 31, 2010, we recorded a loss on the sale of the Racing Business of $361.
(4) Restructuring Plans
Printed Products segment
Following a strategic review of our global instant lottery tickets business, we commenced a reorganization plan on April
18, 2012 to cease all printing and finishing activities at our Australia facility, and during the second half of 2012 we migrated
printing for customers in this region to our other manufacturing facilities. We recorded approximately $5,900 of employee
termination and other restructuring costs associated with the reorganization for the year ended December 31, 2012. Other
restructuring costs include approximately $1,300 resulting from vacating our facility. In addition, we recorded approximately
$3,400 of accelerated depreciation for equipment related to this reorganization. We do not expect to incur additional material
costs or accelerated depreciation related to this reorganization.
Gaming segment
In January 2012, following a comprehensive strategic review, we announced our exit from the Barcrest analog terminal
business in order to focus our game design and other resources solely on our digital server-based supply model. We also
reorganized our pub business in an effort to more effectively capitalize on the Barcrest acquisition. In 2012, we recorded
approximately $5,700 of employee termination and restructuring costs associated with the reorganization. Other restructuring
costs include approximately $1,400 resulting from vacating facilities. We do not expect to incur additional material costs or
accelerated depreciation related to this reorganization. We continue to review strategic alternatives for our pub business.
A summary of the employee termination and other restructuring costs recognized for the year ended December 31, 2012
is set forth below:
Employee termination costs Other restructuring costs Total
Balance as of December 31, 2011 $ — $ — $ —
Restructuring costs additions 7,488 4,014 11,502
Cash Payments (6,454 ) (1,573 ) (8,027 )
Balance as of December 31, 2012 $ 1,034 $ 2,441 $ 3,475
Employee termination and restructuring costs of approximately $2,000 and $600 recorded in 2011 and 2010,
respectively, were a result of our cost reduction initiatives related to the migration by the Global Draw Limited ("Global
Draw"), our subsidiary, to a new back-end technology platform and the integration of Barcrest into our Gaming business.
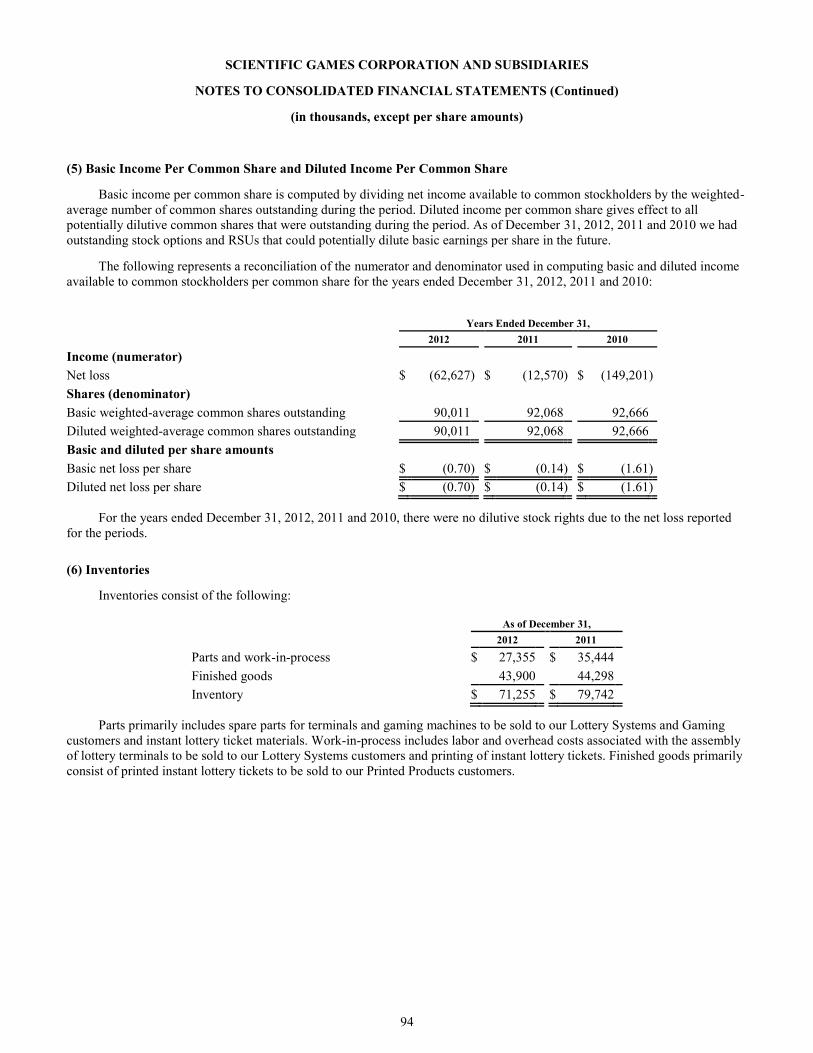
94
SCIENTIFIC GAMES CORPORATION AND SUBSIDIARIES
NOTES TO CONSOLIDATED FINANCIAL STATEMENTS (Continued)
(in thousands, except per share amounts)
(5) Basic Income Per Common Share and Diluted Income Per Common Share
Basic income per common share is computed by dividing net income available to common stockholders by the weighted-
average number of common shares outstanding during the period. Diluted income per common share gives effect to all
potentially dilutive common shares that were outstanding during the period. As of December 31, 2012, 2011 and 2010 we had
outstanding stock options and RSUs that could potentially dilute basic earnings per share in the future.
The following represents a reconciliation of the numerator and denominator used in computing basic and diluted income
available to common stockholders per common share for the years ended December 31, 2012, 2011 and 2010:
Years Ended December 31,
2012 2011 2010
Income (numerator)
Net loss $ (62,627 ) $ (12,570 ) $ (149,201 )
Shares (denominator)
Basic weighted-average common shares outstanding 90,011 92,068 92,666
Diluted weighted-average common shares outstanding 90,011 92,068 92,666
Basic and diluted per share amounts
Basic net loss per share $ (0.70 ) $ (0.14 ) $ (1.61 )
Diluted net loss per share $ (0.70 ) $ (0.14 ) $ (1.61 )
For the years ended December 31, 2012, 2011 and 2010, there were no dilutive stock rights due to the net loss reported
for the periods.
(6) Inventories
Inventories consist of the following:
As of December 31,
2012 2011
Parts and work-in-process $ 27,355 $ 35,444
Finished goods 43,900 44,298
Inventory $ 71,255 $ 79,742
Parts primarily includes spare parts for terminals and gaming machines to be sold to our Lottery Systems and Gaming
customers and instant lottery ticket materials. Work-in-process includes labor and overhead costs associated with the assembly
of lottery terminals to be sold to our Lottery Systems customers and printing of instant lottery tickets. Finished goods primarily
consist of printed instant lottery tickets to be sold to our Printed Products customers.
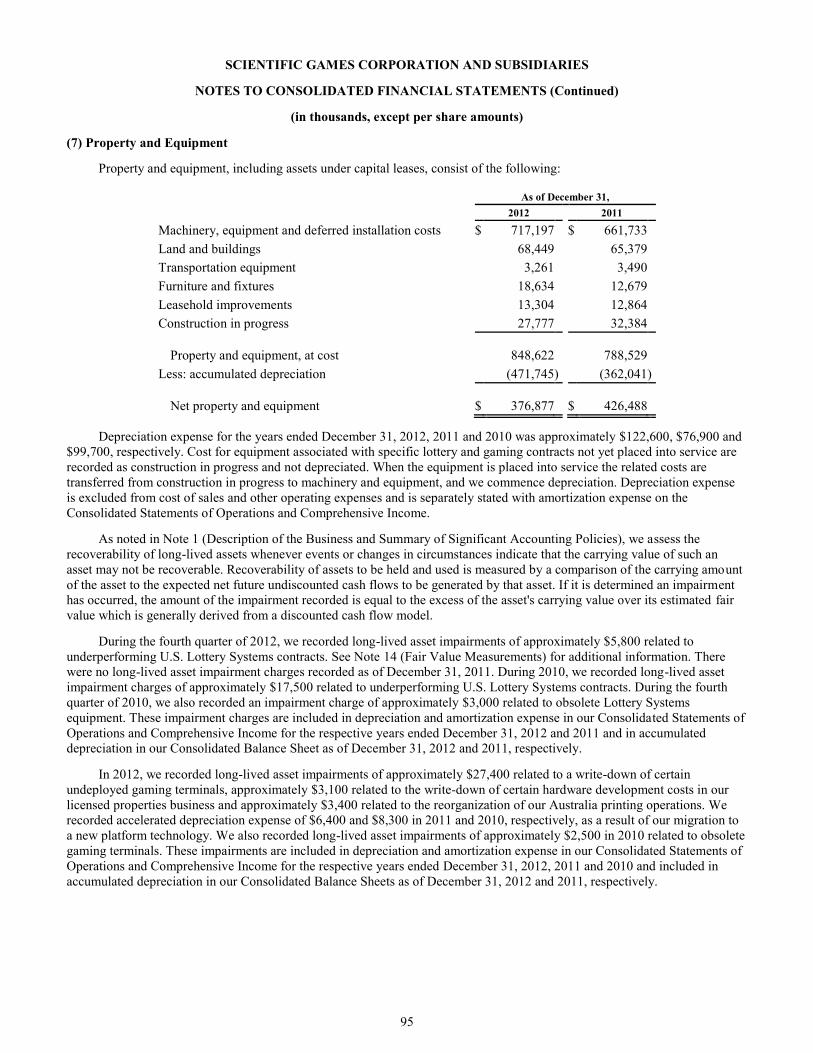
95
SCIENTIFIC GAMES CORPORATION AND SUBSIDIARIES
NOTES TO CONSOLIDATED FINANCIAL STATEMENTS (Continued)
(in thousands, except per share amounts)
(7) Property and Equipment
Property and equipment, including assets under capital leases, consist of the following:
As of December 31,
2012 2011
Machinery, equipment and deferred installation costs $ 717,197 $ 661,733
Land and buildings 68,449 65,379
Transportation equipment 3,261 3,490
Furniture and fixtures 18,634 12,679
Leasehold improvements 13,304 12,864
Construction in progress 27,777 32,384
Property and equipment, at cost 848,622 788,529
Less: accumulated depreciation (471,745 ) (362,041 )
Net property and equipment $ 376,877 $ 426,488
Depreciation expense for the years ended December 31, 2012, 2011 and 2010 was approximately $122,600, $76,900 and
$99,700, respectively. Cost for equipment associated with specific lottery and gaming contracts not yet placed into service are
recorded as construction in progress and not depreciated. When the equipment is placed into service the related costs are
transferred from construction in progress to machinery and equipment, and we commence depreciation. Depreciation expense
is excluded from cost of sales and other operating expenses and is separately stated with amortization expense on the
Consolidated Statements of Operations and Comprehensive Income.
As noted in Note 1 (Description of the Business and Summary of Significant Accounting Policies), we assess the
recoverability of long-lived assets whenever events or changes in circumstances indicate that the carrying value of such an
asset may not be recoverable. Recoverability of assets to be held and used is measured by a comparison of the carrying amount
of the asset to the expected net future undiscounted cash flows to be generated by that asset. If it is determined an impairment
has occurred, the amount of the impairment recorded is equal to the excess of the asset's carrying value over its estimated fair
value which is generally derived from a discounted cash flow model.
During the fourth quarter of 2012, we recorded long-lived asset impairments of approximately $5,800 related to
underperforming U.S. Lottery Systems contracts. See Note 14 (Fair Value Measurements) for additional information. There
were no long-lived asset impairment charges recorded as of December 31, 2011. During 2010, we recorded long-lived asset
impairment charges of approximately $17,500 related to underperforming U.S. Lottery Systems contracts. During the fourth
quarter of 2010, we also recorded an impairment charge of approximately $3,000 related to obsolete Lottery Systems
equipment. These impairment charges are included in depreciation and amortization expense in our Consolidated Statements of
Operations and Comprehensive Income for the respective years ended December 31, 2012 and 2011 and in accumulated
depreciation in our Consolidated Balance Sheet as of December 31, 2012 and 2011, respectively.
In 2012, we recorded long-lived asset impairments of approximately $27,400 related to a write-down of certain
undeployed gaming terminals, approximately $3,100 related to the write-down of certain hardware development costs in our
licensed properties business and approximately $3,400 related to the reorganization of our Australia printing operations. We
recorded accelerated depreciation expense of $6,400 and $8,300 in 2011 and 2010, respectively, as a result of our migration to
a new platform technology. We also recorded long-lived asset impairments of approximately $2,500 in 2010 related to obsolete
gaming terminals. These impairments are included in depreciation and amortization expense in our Consolidated Statements of
Operations and Comprehensive Income for the respective years ended December 31, 2012, 2011 and 2010 and included in
accumulated depreciation in our Consolidated Balance Sheets as of December 31, 2012 and 2011, respectively.
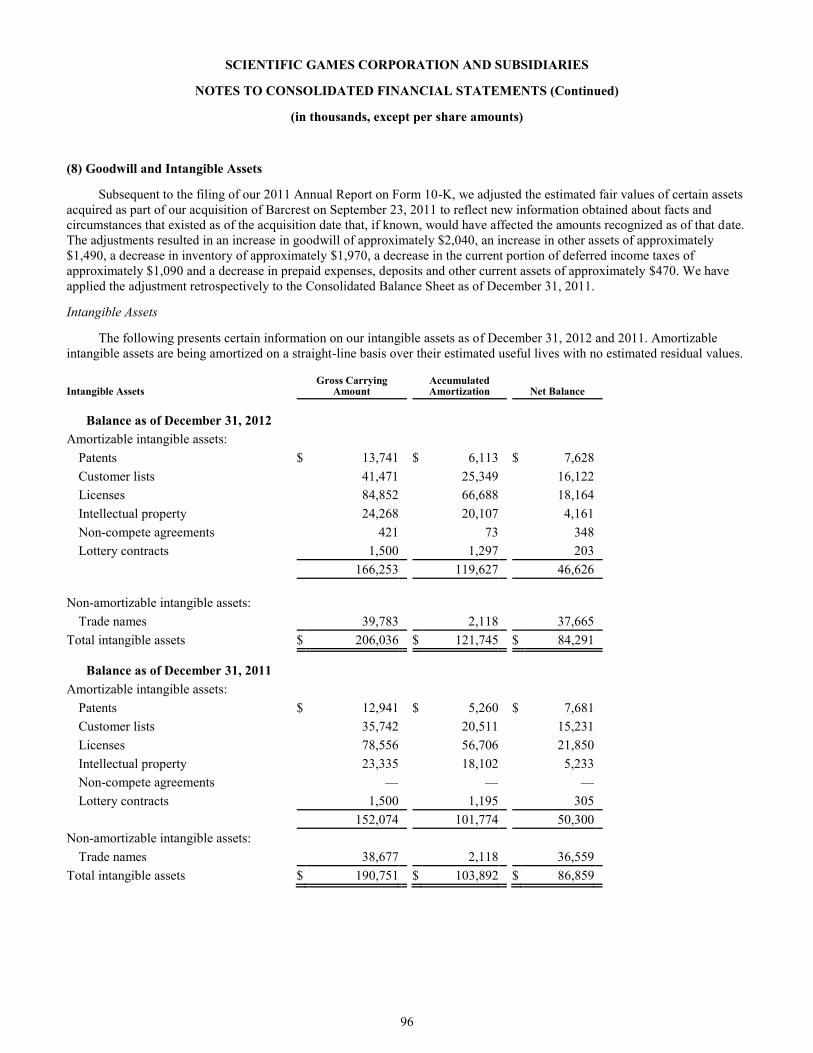
96
SCIENTIFIC GAMES CORPORATION AND SUBSIDIARIES
NOTES TO CONSOLIDATED FINANCIAL STATEMENTS (Continued)
(in thousands, except per share amounts)
(8) Goodwill and Intangible Assets
Subsequent to the filing of our 2011 Annual Report on Form 10-K, we adjusted the estimated fair values of certain assets
acquired as part of our acquisition of Barcrest on September 23, 2011 to reflect new information obtained about facts and
circumstances that existed as of the acquisition date that, if known, would have affected the amounts recognized as of that date.
The adjustments resulted in an increase in goodwill of approximately $2,040, an increase in other assets of approximately
$1,490, a decrease in inventory of approximately $1,970, a decrease in the current portion of deferred income taxes of
approximately $1,090 and a decrease in prepaid expenses, deposits and other current assets of approximately $470. We have
applied the adjustment retrospectively to the Consolidated Balance Sheet as of December 31, 2011.
Intangible Assets
The following presents certain information on our intangible assets as of December 31, 2012 and 2011. Amortizable
intangible assets are being amortized on a straight-line basis over their estimated useful lives with no estimated residual values.
Intangible Assets Gross Carrying
Amount Accumulated Amortization Net Balance
Balance as of December 31, 2012
Amortizable intangible assets:
Patents $ 13,741 $ 6,113 $ 7,628
Customer lists 41,471 25,349 16,122
Licenses 84,852 66,688 18,164
Intellectual property 24,268 20,107 4,161
Non-compete agreements 421 73 348
Lottery contracts 1,500 1,297 203
166,253 119,627 46,626
Non-amortizable intangible assets:
Trade names 39,783 2,118 37,665
Total intangible assets $ 206,036 $ 121,745 $ 84,291
Balance as of December 31, 2011
Amortizable intangible assets:
Patents $ 12,941 $ 5,260 $ 7,681
Customer lists 35,742 20,511 15,231
Licenses 78,556 56,706 21,850
Intellectual property 23,335 18,102 5,233
Non-compete agreements — — —
Lottery contracts 1,500 1,195 305
152,074 101,774 50,300
Non-amortizable intangible assets:
Trade names 38,677 2,118 36,559
Total intangible assets $ 190,751 $ 103,892 $ 86,859
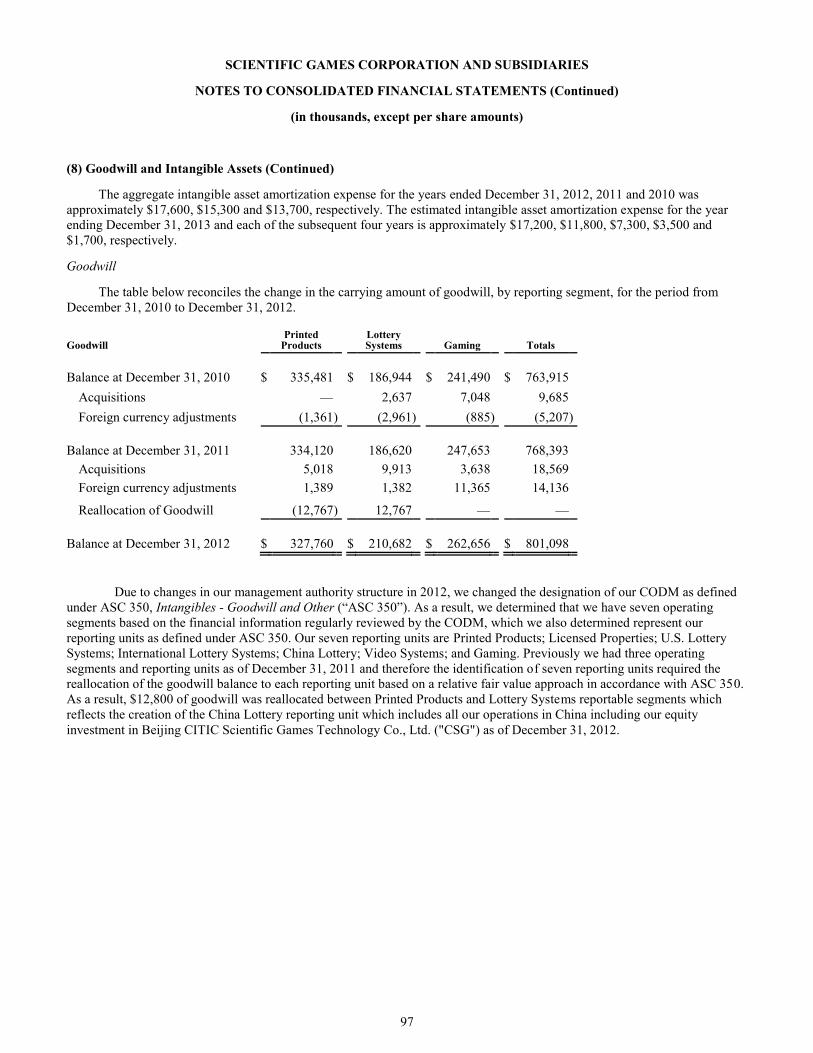
97
SCIENTIFIC GAMES CORPORATION AND SUBSIDIARIES
NOTES TO CONSOLIDATED FINANCIAL STATEMENTS (Continued)
(in thousands, except per share amounts)
(8) Goodwill and Intangible Assets (Continued)
The aggregate intangible asset amortization expense for the years ended December 31, 2012, 2011 and 2010 was
approximately $17,600, $15,300 and $13,700, respectively. The estimated intangible asset amortization expense for the year
ending December 31, 2013 and each of the subsequent four years is approximately $17,200, $11,800, $7,300, $3,500 and
$1,700, respectively.
Goodwill
The table below reconciles the change in the carrying amount of goodwill, by reporting segment, for the period from
December 31, 2010 to December 31, 2012.
Goodwill Printed
Products Lottery Systems Gaming Totals
Balance at December 31, 2010 $ 335,481 $ 186,944 $ 241,490 $ 763,915
Acquisitions — 2,637 7,048 9,685
Foreign currency adjustments (1,361 ) (2,961 ) (885 ) (5,207 )
Balance at December 31, 2011 334,120 186,620 247,653 768,393
Acquisitions 5,018 9,913 3,638 18,569
Foreign currency adjustments 1,389 1,382 11,365 14,136
Reallocation of Goodwill (12,767 ) 12,767 — —
Balance at December 31, 2012 $ 327,760 $ 210,682 $ 262,656 $ 801,098
Due to changes in our management authority structure in 2012, we changed the designation of our CODM as defined
under ASC 350, Intangibles - Goodwill and Other (“ASC 350”). As a result, we determined that we have seven operating
segments based on the financial information regularly reviewed by the CODM, which we also determined represent our
reporting units as defined under ASC 350. Our seven reporting units are Printed Products; Licensed Properties; U.S. Lottery
Systems; International Lottery Systems; China Lottery; Video Systems; and Gaming. Previously we had three operating
segments and reporting units as of December 31, 2011 and therefore the identification of seven reporting units required the
reallocation of the goodwill balance to each reporting unit based on a relative fair value approach in accordance with ASC 350.
As a result, $12,800 of goodwill was reallocated between Printed Products and Lottery Systems reportable segments which
reflects the creation of the China Lottery reporting unit which includes all our operations in China including our equity
investment in Beijing CITIC Scientific Games Technology Co., Ltd. ("CSG") as of December 31, 2012.
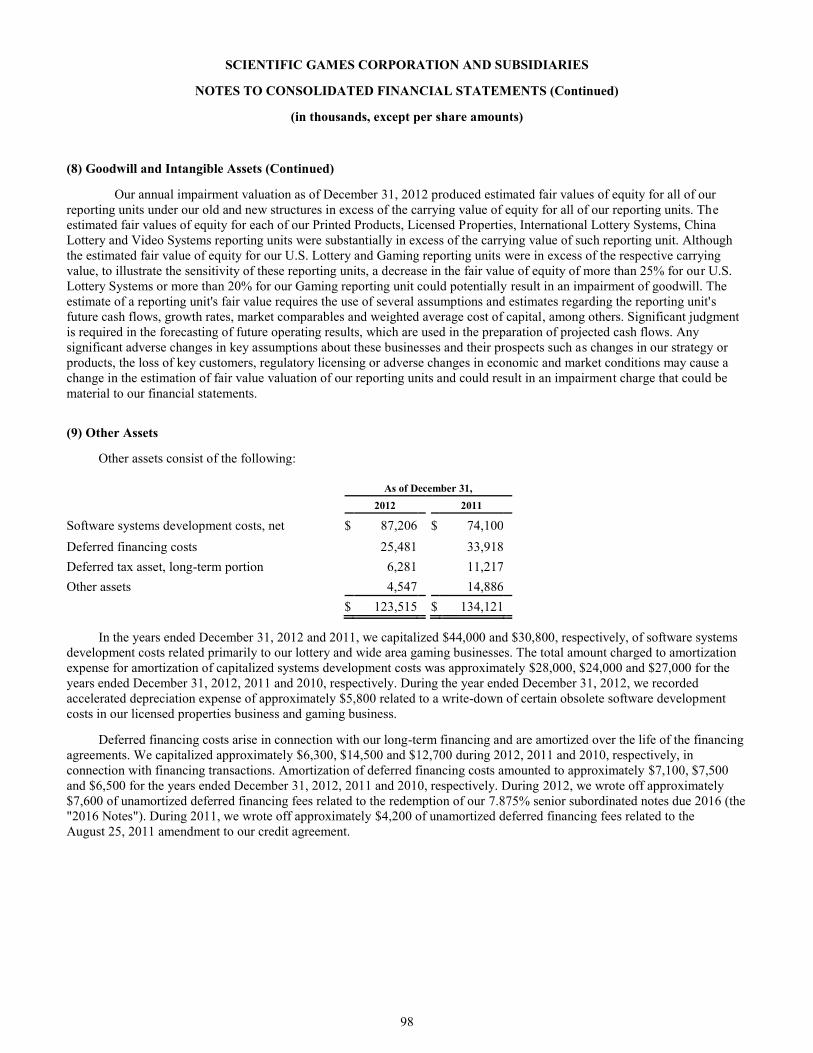
98
SCIENTIFIC GAMES CORPORATION AND SUBSIDIARIES
NOTES TO CONSOLIDATED FINANCIAL STATEMENTS (Continued)
(in thousands, except per share amounts)
(8) Goodwill and Intangible Assets (Continued)
Our annual impairment valuation as of December 31, 2012 produced estimated fair values of equity for all of our
reporting units under our old and new structures in excess of the carrying value of equity for all of our reporting units. The
estimated fair values of equity for each of our Printed Products, Licensed Properties, International Lottery Systems, China
Lottery and Video Systems reporting units were substantially in excess of the carrying value of such reporting unit. Although
the estimated fair value of equity for our U.S. Lottery and Gaming reporting units were in excess of the respective carrying
value, to illustrate the sensitivity of these reporting units, a decrease in the fair value of equity of more than 25% for our U.S.
Lottery Systems or more than 20% for our Gaming reporting unit could potentially result in an impairment of goodwill. The
estimate of a reporting unit's fair value requires the use of several assumptions and estimates regarding the reporting unit's
future cash flows, growth rates, market comparables and weighted average cost of capital, among others. Significant judgment
is required in the forecasting of future operating results, which are used in the preparation of projected cash flows. Any
significant adverse changes in key assumptions about these businesses and their prospects such as changes in our strategy or
products, the loss of key customers, regulatory licensing or adverse changes in economic and market conditions may cause a
change in the estimation of fair value valuation of our reporting units and could result in an impairment charge that could be
material to our financial statements.
(9) Other Assets
Other assets consist of the following:
As of December 31,
2012 2011
Software systems development costs, net $ 87,206 $ 74,100
Deferred financing costs 25,481 33,918
Deferred tax asset, long-term portion 6,281 11,217
Other assets 4,547 14,886
$ 123,515 $ 134,121
In the years ended December 31, 2012 and 2011, we capitalized $44,000 and $30,800, respectively, of software systems
development costs related primarily to our lottery and wide area gaming businesses. The total amount charged to amortization
expense for amortization of capitalized systems development costs was approximately $28,000, $24,000 and $27,000 for the
years ended December 31, 2012, 2011 and 2010, respectively. During the year ended December 31, 2012, we recorded
accelerated depreciation expense of approximately $5,800 related to a write-down of certain obsolete software development
costs in our licensed properties business and gaming business.
Deferred financing costs arise in connection with our long-term financing and are amortized over the life of the financing
agreements. We capitalized approximately $6,300, $14,500 and $12,700 during 2012, 2011 and 2010, respectively, in
connection with financing transactions. Amortization of deferred financing costs amounted to approximately $7,100, $7,500
and $6,500 for the years ended December 31, 2012, 2011 and 2010, respectively. During 2012, we wrote off approximately
$7,600 of unamortized deferred financing fees related to the redemption of our 7.875% senior subordinated notes due 2016 (the
"2016 Notes"). During 2011, we wrote off approximately $4,200 of unamortized deferred financing fees related to the
August 25, 2011 amendment to our credit agreement.
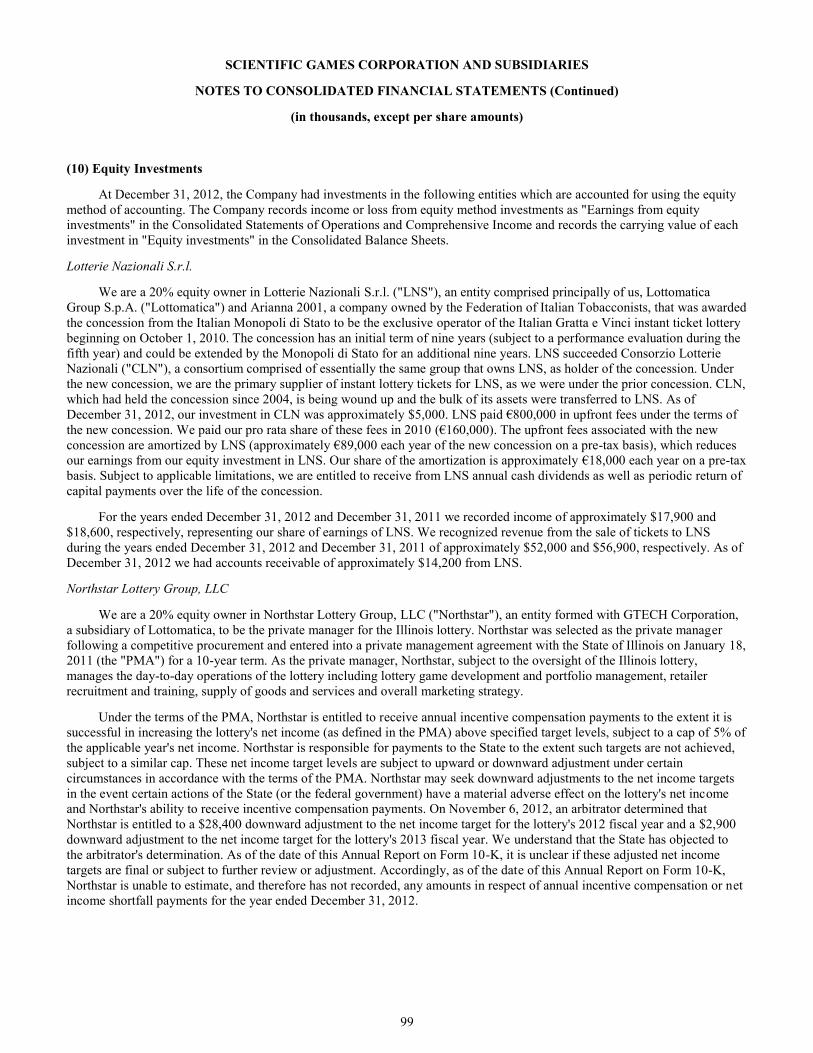
99
SCIENTIFIC GAMES CORPORATION AND SUBSIDIARIES
NOTES TO CONSOLIDATED FINANCIAL STATEMENTS (Continued)
(in thousands, except per share amounts)
(10) Equity Investments
At December 31, 2012, the Company had investments in the following entities which are accounted for using the equity
method of accounting. The Company records income or loss from equity method investments as "Earnings from equity
investments" in the Consolidated Statements of Operations and Comprehensive Income and records the carrying value of each
investment in "Equity investments" in the Consolidated Balance Sheets.
Lotterie Nazionali S.r.l.
We are a 20% equity owner in Lotterie Nazionali S.r.l. ("LNS"), an entity comprised principally of us, Lottomatica
Group S.p.A. ("Lottomatica") and Arianna 2001, a company owned by the Federation of Italian Tobacconists, that was awarded
the concession from the Italian Monopoli di Stato to be the exclusive operator of the Italian Gratta e Vinci instant ticket lottery
beginning on October 1, 2010. The concession has an initial term of nine years (subject to a performance evaluation during the
fifth year) and could be extended by the Monopoli di Stato for an additional nine years. LNS succeeded Consorzio Lotterie
Nazionali ("CLN"), a consortium comprised of essentially the same group that owns LNS, as holder of the concession. Under
the new concession, we are the primary supplier of instant lottery tickets for LNS, as we were under the prior concession. CLN,
which had held the concession since 2004, is being wound up and the bulk of its assets were transferred to LNS. As of
December 31, 2012, our investment in CLN was approximately $5,000. LNS paid €800,000 in upfront fees under the terms of
the new concession. We paid our pro rata share of these fees in 2010 (€160,000). The upfront fees associated with the new
concession are amortized by LNS (approximately €89,000 each year of the new concession on a pre-tax basis), which reduces
our earnings from our equity investment in LNS. Our share of the amortization is approximately €18,000 each year on a pre-tax
basis. Subject to applicable limitations, we are entitled to receive from LNS annual cash dividends as well as periodic return of
capital payments over the life of the concession.
For the years ended December 31, 2012 and December 31, 2011 we recorded income of approximately $17,900 and
$18,600, respectively, representing our share of earnings of LNS. We recognized revenue from the sale of tickets to LNS
during the years ended December 31, 2012 and December 31, 2011 of approximately $52,000 and $56,900, respectively. As of
December 31, 2012 we had accounts receivable of approximately $14,200 from LNS.
Northstar Lottery Group, LLC
We are a 20% equity owner in Northstar Lottery Group, LLC ("Northstar"), an entity formed with GTECH Corporation,
a subsidiary of Lottomatica, to be the private manager for the Illinois lottery. Northstar was selected as the private manager
following a competitive procurement and entered into a private management agreement with the State of Illinois on January 18,
2011 (the "PMA") for a 10-year term. As the private manager, Northstar, subject to the oversight of the Illinois lottery,
manages the day-to-day operations of the lottery including lottery game development and portfolio management, retailer
recruitment and training, supply of goods and services and overall marketing strategy.
Under the terms of the PMA, Northstar is entitled to receive annual incentive compensation payments to the extent it is
successful in increasing the lottery's net income (as defined in the PMA) above specified target levels, subject to a cap of 5% of
the applicable year's net income. Northstar is responsible for payments to the State to the extent such targets are not achieved,
subject to a similar cap. These net income target levels are subject to upward or downward adjustment under certain
circumstances in accordance with the terms of the PMA. Northstar may seek downward adjustments to the net income targets
in the event certain actions of the State (or the federal government) have a material adverse effect on the lottery's net income
and Northstar's ability to receive incentive compensation payments. On November 6, 2012, an arbitrator determined that
Northstar is entitled to a $28,400 downward adjustment to the net income target for the lottery's 2012 fiscal year and a $2,900
downward adjustment to the net income target for the lottery's 2013 fiscal year. We understand that the State has objected to
the arbitrator's determination. As of the date of this Annual Report on Form 10-K, it is unclear if these adjusted net income
targets are final or subject to further review or adjustment. Accordingly, as of the date of this Annual Report on Form 10-K,
Northstar is unable to estimate, and therefore has not recorded, any amounts in respect of annual incentive compensation or net
income shortfall payments for the year ended December 31, 2012.
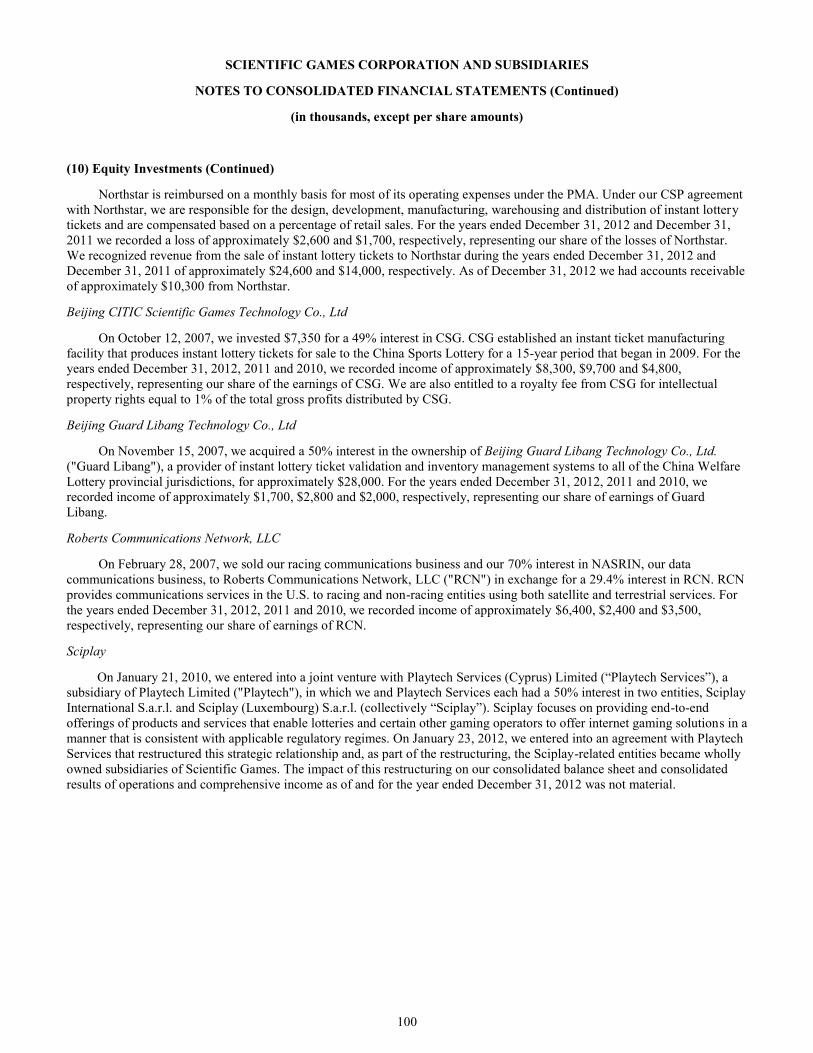
100
SCIENTIFIC GAMES CORPORATION AND SUBSIDIARIES
NOTES TO CONSOLIDATED FINANCIAL STATEMENTS (Continued)
(in thousands, except per share amounts)
(10) Equity Investments (Continued)
Northstar is reimbursed on a monthly basis for most of its operating expenses under the PMA. Under our CSP agreement
with Northstar, we are responsible for the design, development, manufacturing, warehousing and distribution of instant lottery
tickets and are compensated based on a percentage of retail sales. For the years ended December 31, 2012 and December 31,
2011 we recorded a loss of approximately $2,600 and $1,700, respectively, representing our share of the losses of Northstar.
We recognized revenue from the sale of instant lottery tickets to Northstar during the years ended December 31, 2012 and
December 31, 2011 of approximately $24,600 and $14,000, respectively. As of December 31, 2012 we had accounts receivable
of approximately $10,300 from Northstar.
Beijing CITIC Scientific Games Technology Co., Ltd
On October 12, 2007, we invested $7,350 for a 49% interest in CSG. CSG established an instant ticket manufacturing
facility that produces instant lottery tickets for sale to the China Sports Lottery for a 15-year period that began in 2009. For the
years ended December 31, 2012, 2011 and 2010, we recorded income of approximately $8,300, $9,700 and $4,800,
respectively, representing our share of the earnings of CSG. We are also entitled to a royalty fee from CSG for intellectual
property rights equal to 1% of the total gross profits distributed by CSG.
Beijing Guard Libang Technology Co., Ltd
On November 15, 2007, we acquired a 50% interest in the ownership of Beijing Guard Libang Technology Co., Ltd.
("Guard Libang"), a provider of instant lottery ticket validation and inventory management systems to all of the China Welfare
Lottery provincial jurisdictions, for approximately $28,000. For the years ended December 31, 2012, 2011 and 2010, we
recorded income of approximately $1,700, $2,800 and $2,000, respectively, representing our share of earnings of Guard
Libang.
Roberts Communications Network, LLC
On February 28, 2007, we sold our racing communications business and our 70% interest in NASRIN, our data
communications business, to Roberts Communications Network, LLC ("RCN") in exchange for a 29.4% interest in RCN. RCN
provides communications services in the U.S. to racing and non-racing entities using both satellite and terrestrial services. For
the years ended December 31, 2012, 2011 and 2010, we recorded income of approximately $6,400, $2,400 and $3,500,
respectively, representing our share of earnings of RCN.
Sciplay
On January 21, 2010, we entered into a joint venture with Playtech Services (Cyprus) Limited (“Playtech Services”), a
subsidiary of Playtech Limited ("Playtech"), in which we and Playtech Services each had a 50% interest in two entities, Sciplay
International S.a.r.l. and Sciplay (Luxembourg) S.a.r.l. (collectively “Sciplay”). Sciplay focuses on providing end-to-end
offerings of products and services that enable lotteries and certain other gaming operators to offer internet gaming solutions in a
manner that is consistent with applicable regulatory regimes. On January 23, 2012, we entered into an agreement with Playtech
Services that restructured this strategic relationship and, as part of the restructuring, the Sciplay-related entities became wholly
owned subsidiaries of Scientific Games. The impact of this restructuring on our consolidated balance sheet and consolidated
results of operations and comprehensive income as of and for the year ended December 31, 2012 was not material.
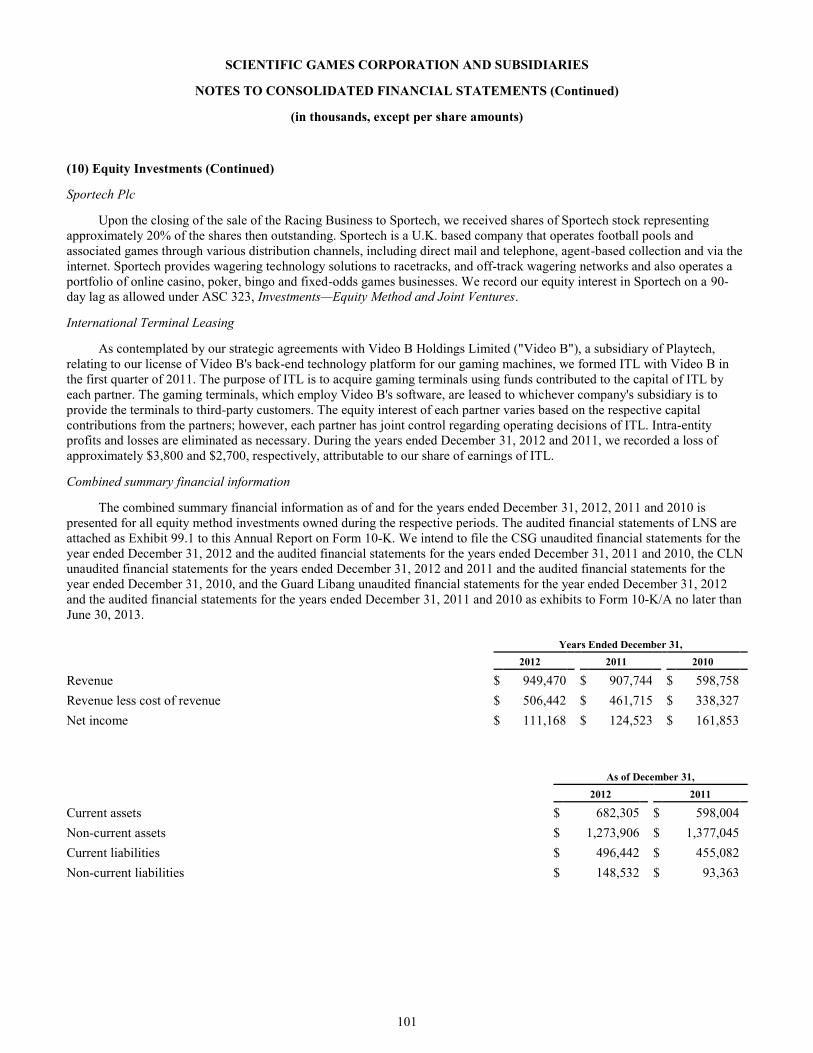
101
SCIENTIFIC GAMES CORPORATION AND SUBSIDIARIES
NOTES TO CONSOLIDATED FINANCIAL STATEMENTS (Continued)
(in thousands, except per share amounts)
(10) Equity Investments (Continued)
Sportech Plc
Upon the closing of the sale of the Racing Business to Sportech, we received shares of Sportech stock representing
approximately 20% of the shares then outstanding. Sportech is a U.K. based company that operates football pools and
associated games through various distribution channels, including direct mail and telephone, agent-based collection and via the
internet. Sportech provides wagering technology solutions to racetracks, and off-track wagering networks and also operates a
portfolio of online casino, poker, bingo and fixed-odds games businesses. We record our equity interest in Sportech on a 90-
day lag as allowed under ASC 323, Investments—Equity Method and Joint Ventures.
International Terminal Leasing
As contemplated by our strategic agreements with Video B Holdings Limited ("Video B"), a subsidiary of Playtech,
relating to our license of Video B's back-end technology platform for our gaming machines, we formed ITL with Video B in
the first quarter of 2011. The purpose of ITL is to acquire gaming terminals using funds contributed to the capital of ITL by
each partner. The gaming terminals, which employ Video B's software, are leased to whichever company's subsidiary is to
provide the terminals to third-party customers. The equity interest of each partner varies based on the respective capital
contributions from the partners; however, each partner has joint control regarding operating decisions of ITL. Intra-entity
profits and losses are eliminated as necessary. During the years ended December 31, 2012 and 2011, we recorded a loss of
approximately $3,800 and $2,700, respectively, attributable to our share of earnings of ITL.
Combined summary financial information
The combined summary financial information as of and for the years ended December 31, 2012, 2011 and 2010 is
presented for all equity method investments owned during the respective periods. The audited financial statements of LNS are
attached as Exhibit 99.1 to this Annual Report on Form 10-K. We intend to file the CSG unaudited financial statements for the
year ended December 31, 2012 and the audited financial statements for the years ended December 31, 2011 and 2010, the CLN
unaudited financial statements for the years ended December 31, 2012 and 2011 and the audited financial statements for the
year ended December 31, 2010, and the Guard Libang unaudited financial statements for the year ended December 31, 2012
and the audited financial statements for the years ended December 31, 2011 and 2010 as exhibits to Form 10-K/A no later than
June 30, 2013.
Years Ended December 31,
2012 2011 2010
Revenue $ 949,470 $ 907,744 $ 598,758
Revenue less cost of revenue $ 506,442 $ 461,715 $ 338,327
Net income $ 111,168 $ 124,523 $ 161,853
As of December 31,
2012 2011
Current assets $ 682,305 $ 598,004
Non-current assets $ 1,273,906 $ 1,377,045
Current liabilities $ 496,442 $ 455,082
Non-current liabilities $ 148,532 $ 93,363
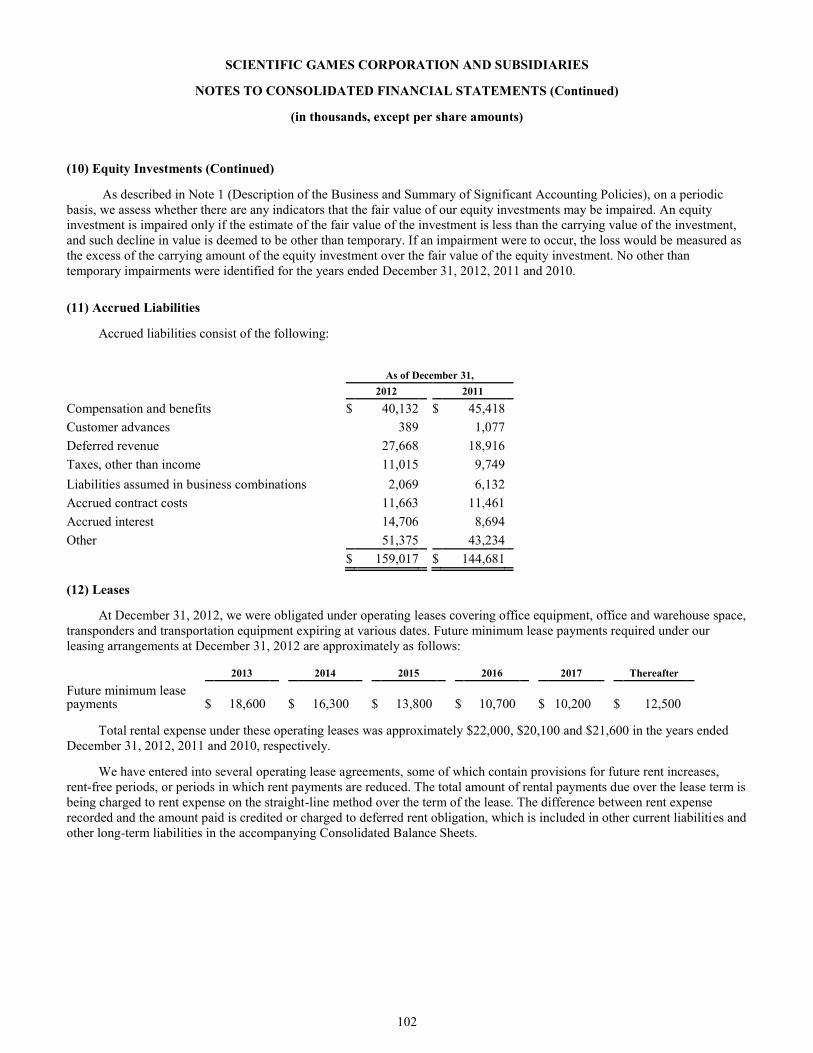
102
SCIENTIFIC GAMES CORPORATION AND SUBSIDIARIES
NOTES TO CONSOLIDATED FINANCIAL STATEMENTS (Continued)
(in thousands, except per share amounts)
(10) Equity Investments (Continued)
As described in Note 1 (Description of the Business and Summary of Significant Accounting Policies), on a periodic
basis, we assess whether there are any indicators that the fair value of our equity investments may be impaired. An equity
investment is impaired only if the estimate of the fair value of the investment is less than the carrying value of the investment,
and such decline in value is deemed to be other than temporary. If an impairment were to occur, the loss would be measured as
the excess of the carrying amount of the equity investment over the fair value of the equity investment. No other than
temporary impairments were identified for the years ended December 31, 2012, 2011 and 2010.
(11) Accrued Liabilities
Accrued liabilities consist of the following:
As of December 31,
2012 2011
Compensation and benefits $ 40,132 $ 45,418
Customer advances 389 1,077
Deferred revenue 27,668 18,916
Taxes, other than income 11,015 9,749
Liabilities assumed in business combinations 2,069 6,132
Accrued contract costs 11,663 11,461
Accrued interest 14,706 8,694
Other 51,375 43,234
$ 159,017 $ 144,681
(12) Leases
At December 31, 2012, we were obligated under operating leases covering office equipment, office and warehouse space,
transponders and transportation equipment expiring at various dates. Future minimum lease payments required under our
leasing arrangements at December 31, 2012 are approximately as follows:
2013 2014 2015 2016 2017 Thereafter
Future minimum lease payments $ 18,600 $ 16,300 $ 13,800 $ 10,700 $ 10,200 $ 12,500
Total rental expense under these operating leases was approximately $22,000, $20,100 and $21,600 in the years ended
December 31, 2012, 2011 and 2010, respectively.
We have entered into several operating lease agreements, some of which contain provisions for future rent increases,
rent-free periods, or periods in which rent payments are reduced. The total amount of rental payments due over the lease term is
being charged to rent expense on the straight-line method over the term of the lease. The difference between rent expense
recorded and the amount paid is credited or charged to deferred rent obligation, which is included in other current liabilities and
other long-term liabilities in the accompanying Consolidated Balance Sheets.
103
SCIENTIFIC GAMES CORPORATION AND SUBSIDIARIES
NOTES TO CONSOLIDATED FINANCIAL STATEMENTS (Continued)
(in thousands, except per share amounts)
(13) Long-Term and Other Debt
Outstanding Debt and Capital Leases
As of December 31, 2012, our total debt was comprised principally of $559,619 outstanding under our term loan
facilities under the credit agreement discussed below, $250,000 in aggregate principal amount of the Company's 8.125% senior
subordinated notes due 2018 (the “2018 Notes”), $345,909 in aggregate principal amount of SGI's 9.25% senior subordinated
notes due 2019 (the “2019 Notes”), $300,000 in aggregate principal amount of 6.250% senior subordinated notes due 2020 (the
“2020 Notes”) of Scientific Games International, Inc. (“SGI”) and loans denominated in Chinese Renminbi Yuan (“RMB”)
totaling RMB 78,023 (the "China Loans"). On September 19, 2012, SGI redeemed all $200,000 in aggregate principal amount
of its 2016 Notes at a redemption price equal to 103.938% of the aggregate principal amount, plus accrued and unpaid interest
up to, but not including, the redemption date.
The following reflects outstanding debt as of December 31, 2012 and 2011:
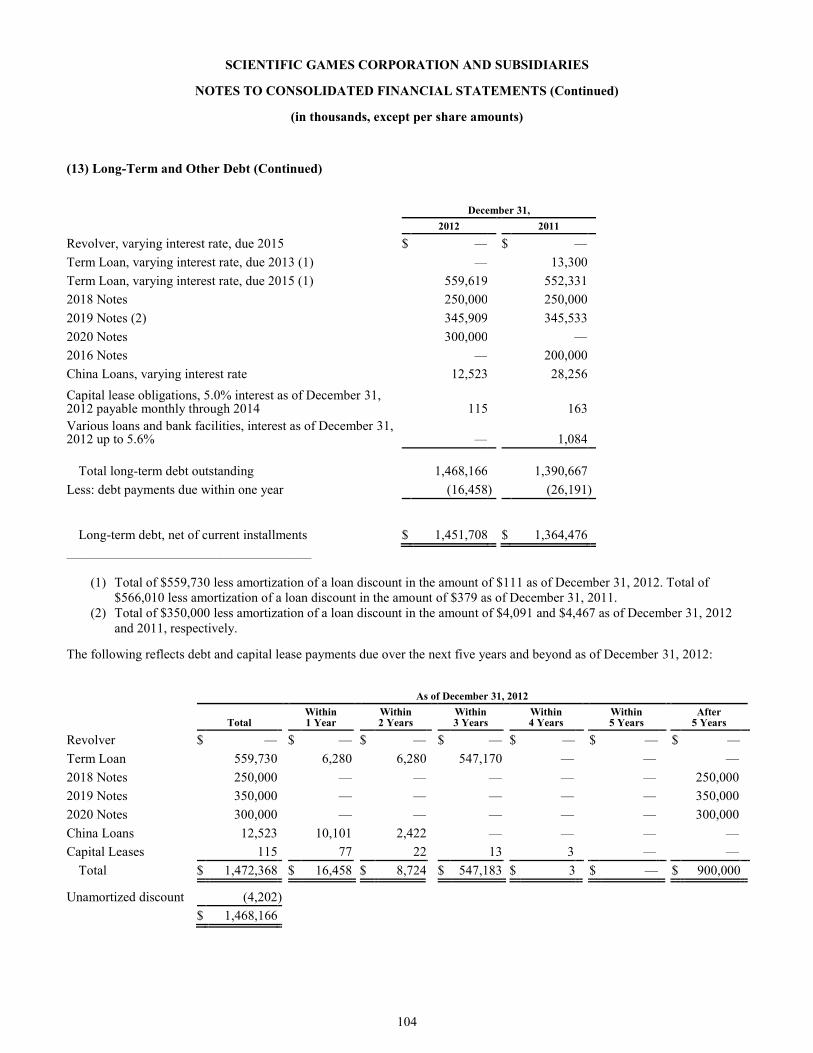
104
SCIENTIFIC GAMES CORPORATION AND SUBSIDIARIES
NOTES TO CONSOLIDATED FINANCIAL STATEMENTS (Continued)
(in thousands, except per share amounts)
(13) Long-Term and Other Debt (Continued)
December 31,
2012 2011
Revolver, varying interest rate, due 2015 $ — $ —
Term Loan, varying interest rate, due 2013 (1) — 13,300
Term Loan, varying interest rate, due 2015 (1) 559,619 552,331
2018 Notes 250,000 250,000
2019 Notes (2) 345,909 345,533
2020 Notes 300,000 —
2016 Notes — 200,000
China Loans, varying interest rate 12,523 28,256
Capital lease obligations, 5.0% interest as of December 31, 2012 payable monthly through 2014 115 163
Various loans and bank facilities, interest as of December 31, 2012 up to 5.6% — 1,084
Total long-term debt outstanding 1,468,166 1,390,667
Less: debt payments due within one year (16,458 ) (26,191 )
Long-term debt, net of current installments $ 1,451,708 $ 1,364,476
______________________________________________
(1) Total of $559,730 less amortization of a loan discount in the amount of $111 as of December 31, 2012. Total of
$566,010 less amortization of a loan discount in the amount of $379 as of December 31, 2011.
(2) Total of $350,000 less amortization of a loan discount in the amount of $4,091 and $4,467 as of December 31, 2012
and 2011, respectively.
The following reflects debt and capital lease payments due over the next five years and beyond as of December 31, 2012:
As of December 31, 2012
Total Within 1 Year
Within 2 Years
Within 3 Years
Within 4 Years
Within 5 Years
After 5 Years
Revolver $ — $ — $ — $ — $ — $ — $ —
Term Loan 559,730 6,280 6,280 547,170 — — —
2018 Notes 250,000 — — — — — 250,000
2019 Notes 350,000 — — — — — 350,000
2020 Notes 300,000 — — — — — 300,000
China Loans 12,523 10,101 2,422 — — — —
Capital Leases 115 77 22 13 3 — —
Total $ 1,472,368 $ 16,458 $ 8,724 $ 547,183 $ 3 $ — $ 900,000
Unamortized discount (4,202 )
$ 1,468,166
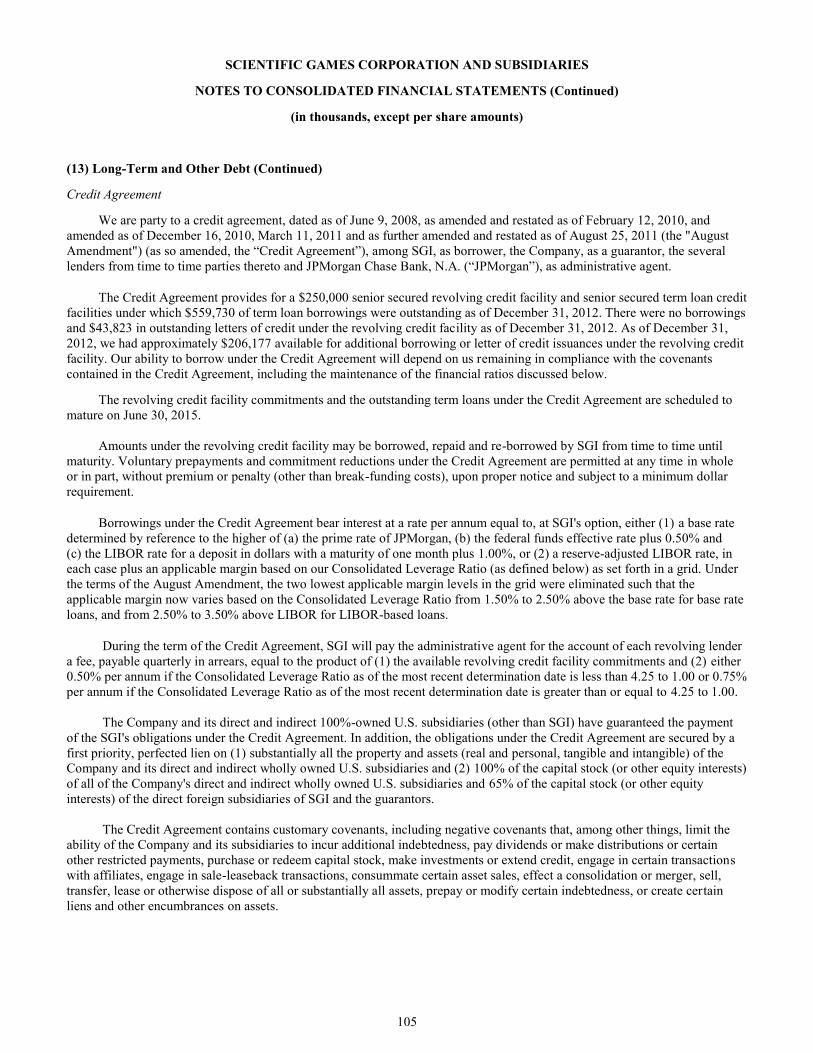
105
SCIENTIFIC GAMES CORPORATION AND SUBSIDIARIES
NOTES TO CONSOLIDATED FINANCIAL STATEMENTS (Continued)
(in thousands, except per share amounts)
(13) Long-Term and Other Debt (Continued)
Credit Agreement
We are party to a credit agreement, dated as of June 9, 2008, as amended and restated as of February 12, 2010, and
amended as of December 16, 2010, March 11, 2011 and as further amended and restated as of August 25, 2011 (the "August
Amendment") (as so amended, the “Credit Agreement”), among SGI, as borrower, the Company, as a guarantor, the several
lenders from time to time parties thereto and JPMorgan Chase Bank, N.A. (“JPMorgan”), as administrative agent.
The Credit Agreement provides for a $250,000 senior secured revolving credit facility and senior secured term loan credit
facilities under which $559,730 of term loan borrowings were outstanding as of December 31, 2012. There were no borrowings
and $43,823 in outstanding letters of credit under the revolving credit facility as of December 31, 2012. As of December 31,
2012, we had approximately $206,177 available for additional borrowing or letter of credit issuances under the revolving credit
facility. Our ability to borrow under the Credit Agreement will depend on us remaining in compliance with the covenants
contained in the Credit Agreement, including the maintenance of the financial ratios discussed below.
The revolving credit facility commitments and the outstanding term loans under the Credit Agreement are scheduled to
mature on June 30, 2015.
Amounts under the revolving credit facility may be borrowed, repaid and re-borrowed by SGI from time to time until
maturity. Voluntary prepayments and commitment reductions under the Credit Agreement are permitted at any time in whole
or in part, without premium or penalty (other than break-funding costs), upon proper notice and subject to a minimum dollar
requirement.
Borrowings under the Credit Agreement bear interest at a rate per annum equal to, at SGI's option, either (1) a base rate
determined by reference to the higher of (a) the prime rate of JPMorgan, (b) the federal funds effective rate plus 0.50% and
(c) the LIBOR rate for a deposit in dollars with a maturity of one month plus 1.00%, or (2) a reserve-adjusted LIBOR rate, in
each case plus an applicable margin based on our Consolidated Leverage Ratio (as defined below) as set forth in a grid. Under
the terms of the August Amendment, the two lowest applicable margin levels in the grid were eliminated such that the
applicable margin now varies based on the Consolidated Leverage Ratio from 1.50% to 2.50% above the base rate for base rate
loans, and from 2.50% to 3.50% above LIBOR for LIBOR-based loans.
During the term of the Credit Agreement, SGI will pay the administrative agent for the account of each revolving lender
a fee, payable quarterly in arrears, equal to the product of (1) the available revolving credit facility commitments and (2) either
0.50% per annum if the Consolidated Leverage Ratio as of the most recent determination date is less than 4.25 to 1.00 or 0.75%
per annum if the Consolidated Leverage Ratio as of the most recent determination date is greater than or equal to 4.25 to 1.00.
The Company and its direct and indirect 100%-owned U.S. subsidiaries (other than SGI) have guaranteed the payment
of the SGI's obligations under the Credit Agreement. In addition, the obligations under the Credit Agreement are secured by a
first priority, perfected lien on (1) substantially all the property and assets (real and personal, tangible and intangible) of the
Company and its direct and indirect wholly owned U.S. subsidiaries and (2) 100% of the capital stock (or other equity interests)
of all of the Company's direct and indirect wholly owned U.S. subsidiaries and 65% of the capital stock (or other equity
interests) of the direct foreign subsidiaries of SGI and the guarantors.
The Credit Agreement contains customary covenants, including negative covenants that, among other things, limit the
ability of the Company and its subsidiaries to incur additional indebtedness, pay dividends or make distributions or certain
other restricted payments, purchase or redeem capital stock, make investments or extend credit, engage in certain transactions
with affiliates, engage in sale-leaseback transactions, consummate certain asset sales, effect a consolidation or merger, sell,
transfer, lease or otherwise dispose of all or substantially all assets, prepay or modify certain indebtedness, or create certain
liens and other encumbrances on assets.
106
SCIENTIFIC GAMES CORPORATION AND SUBSIDIARIES
NOTES TO CONSOLIDATED FINANCIAL STATEMENTS (Continued)
(in thousands, except per share amounts)
(13) Long-Term and Other Debt (Continued)
The Credit Agreement generally requires mandatory prepayments of the term loan credit facilities with the net cash
proceeds from (1) the incurrence of indebtedness by us (excluding certain permitted debt) and (2) the sale of assets that yields
to us net cash proceeds in excess of $5,000 (excluding certain permitted asset sales) or any settlement of or payment in respect
of any property or casualty insurance claim or any condemnation proceeding relating to any of our assets, in each case subject
to a reinvestment option.
Under the terms of the Credit Agreement, as amended by the August Amendment, we are required to maintain the
following financial ratios:
• a Consolidated Leverage Ratio as of the last day of each fiscal quarter no more than the ratio set forth below with respect
to the period during which such fiscal quarter ends:
◦ 5.75 to 1.00 (through December 31, 2013);
◦ 5.50 to 1.00 (January 1, 2014 through December 31, 2014); and
◦ 5.25 to 1.00 (January 1, 2015 and thereafter);
"Consolidated Leverage Ratio" means, as of the last day of any period, the ratio of (1) Consolidated Total Debt
(defined generally as the aggregate principal amount of our consolidated debt required to be reflected on our balance sheet in
accordance with U.S. GAAP on such day, provided that, pursuant to the March Amendment discussed above, up to $100,000 of
our unrestricted cash and cash equivalents in excess of $15,000 will be netted against Consolidated Total Debt for purposes of
determining our Consolidated Leverage Ratio and Consolidated Senior Debt Ratio as of any date from and after December 31,
2010), to (2) Consolidated EBITDA for the period of four consecutive fiscal quarters then ended.
• a Consolidated Senior Debt Ratio as of the last day of each fiscal quarter no more than 2.75 to 1.00; and
• a Consolidated Interest Coverage Ratio not less than 2.25 to 1.00 for any period of four consecutive quarters (which ratio
was not changed by the August Amendment).
"Consolidated Senior Debt Ratio" means, as of the last day of any period, the ratio of (1) Consolidated Total Debt
(other than the 2016 Notes, the 2018 Notes and the 2019 Notes and any additional subordinated debt permitted under the Credit
Agreement) to (2) Consolidated EBITDA for the period of four consecutive fiscal quarters then ended.
"Consolidated Interest Coverage Ratio" means, for any period, the ratio of (1) Consolidated EBITDA for such period
to (2) total cash interest expense with respect to all of our outstanding debt for such period.
"Consolidated EBITDA" means, for any period, "Consolidated Net Income" (i.e., generally our consolidated net
income (or loss) excluding the income (or deficit) of our equity investments (other than LNS) except to the extent that such
income has been distributed to us) for such period plus, to the extent deducted in calculating such consolidated net income for
such period, the sum of:
• income tax expense;
• depreciation and amortization expense;
• interest expense (other than, as provided in the March Amendment, any interest expense of LNS in respect of debt for
borrowed money of LNS if such debt exceeds $25,000 in the aggregate); amortization or write-off of debt discount
and debt issuance costs and commissions, discounts and other fees and charges associated with debt;
• amortization of intangibles (including goodwill) and organization costs;
• earn-out payments with respect to certain acquisitions that we have made or any other "Permitted Acquisitions"
(generally, acquisitions of companies that are primarily engaged in the same or related line of business and that
become subsidiaries of ours, or acquisitions of all or substantially all of the assets of another company or division or
business unit of another company), including any loss or expense with respect to such earn-out payments;
• extraordinary charges or losses determined in accordance with U.S. GAAP;
• non-cash stock-based compensation expenses;
107
SCIENTIFIC GAMES CORPORATION AND SUBSIDIARIES
NOTES TO CONSOLIDATED FINANCIAL STATEMENTS (Continued)
(in thousands, except per share amounts)
(13) Long-Term and Other Debt (Continued)
• any cash compensation expense incurred but not paid in such period so long as no cash payment in respect thereof is
made or required to be made prior to the scheduled maturity of the borrowings under the credit agreement (provided
that, pursuant to the August Amendment, up to $993 of non-cash compensation expense accrued prior to August 25,
2011 may be added back notwithstanding that cash payments may be required to be made in respect thereof prior to
the scheduled maturity of the borrowings);
• up to $3,000 of expenses, charges or losses resulting from certain Peru investments;
• the non-cash portion of any non-recurring write-offs or write-downs as required in accordance with U.S. GAAP;
• advisory fees and related expenses paid to advisory firms in connection with Permitted Acquisitions;
• "Permitted Add-Backs" (i.e., (i) up to $15,000 (less the amount of certain permitted pro forma adjustments to
Consolidated EBITDA in connection with material acquisitions) of charges incurred during any 12-month period in
connection with (A) reductions in workforce, (B) contract losses, discontinued operations, shutdown expenses and
cost reduction initiatives, (C) transaction expenses incurred in connection with potential acquisitions and divestitures,
whether or not consummated, and (D) restructuring charges and transaction expenses incurred in connection with
certain transactions with Playtech, and (ii) reasonable and customary costs incurred in connection with amendments to
the Credit Agreement); provided that the foregoing items do not include write-offs or write-downs of accounts
receivable or inventory and, except with respect to Permitted Add-Backs, any write-off or write-down to the extent it
is in respect of cash payments to be made in a future period;
• to the extent treated as an expense in the period paid or incurred, certain payments, costs and obligations (up to a
specified amount) made or incurred by us in connection with any award of a concession to operate the instant ticket
lottery in Italy, including any up-front fee required under the applicable tender process;
• restructuring charges, transaction expenses and shutdown expenses incurred in connection with the disposition of all
or part of the Racing Business, together with any charges incurred in connection with discontinued operations and
cost-reduction initiatives associated with such disposition, in an aggregate amount (for all periods combined) not to
exceed $7,325;
• up to £5,250 during any four-quarter period of expenses or charges incurred in connection with the payment of license
royalties or other fees to Video B and for software services provided to Global Draw or Games Media by Video B;
minus, to the extent included in the statement of such Consolidated Net Income for such period, the sum of:
• interest income;
• extraordinary income or gains determined in accordance with U.S. GAAP; and
• income or gains with respect to earn-out payments with respect to acquisitions referred to above;
provided that the aggregate amount of Consolidated EBITDA that is attributable to our interest in LNS that would not have
otherwise been permitted to be included in Consolidated EBITDA prior to giving effect to the March Amendment will be
capped at $25,000 in any period of four consecutive fiscal quarters (or $30,000 in the case of any such period ending on or
prior to June 30, 2012).
Consolidated EBITDA is subject to certain adjustments in connection with material acquisitions and dispositions as
provided in the Credit Agreement.
The foregoing definitions of are qualified in their entirety by the full text of such definitions in the Credit Agreement,
a copy of which is attached as Exhibit 10.1 to our Current Report on Form 8-K filed with the Securities and Exchange
Commission ("SEC") on August 31, 2011.
The August Amendment provides for additional refinancing flexibility in the form of (1) permitted bank debt or debt
securities that may be unsecured or secured on a paripassu or junior basis with the collateral securing the obligations under the
Credit Agreement and (2) replacement facilities under the Credit Agreement that can be used to refinance either the term loans
or the revolving commitments under the Credit Agreement in whole. In addition, SGI will have the capability to request one or
more additional tranches of term loans, increase the existing tranche of term loans, or increase the revolving commitments in an
amount not to exceed $200,000 after the effective date of the August Amendment (the "Incremental Facility"). In lieu of
incurring additional indebtedness pursuant to the Incremental Facility, the August Amendment also provides SGI with the
108
SCIENTIFIC GAMES CORPORATION AND SUBSIDIARIES
NOTES TO CONSOLIDATED FINANCIAL STATEMENTS (Continued)
(in thousands, except per share amounts)
(13) Long-Term and Other Debt (Continued)
flexibility to incur additional incremental indebtedness in the form of one or more series of debt securities in an aggregate
principal amount not to exceed the amounts allowed to be incurred under the Incremental Facility.
In addition, the August Amendment renewed most of the negative covenant baskets as of the effective date of the
August Amendment and provides investment flexibility for SGI by allowing the borrower to move capital stock, property and
cash from non-guarantor subsidiaries to loan parties and then back to non-guarantor subsidiaries, subject to certain limitations
set forth in the Credit Agreement. The August Amendment also provides SGI the ability to use an existing restricted payment
basket comprised of $200,000 plus a permitted expenditure amount that is based in part on the cumulative consolidated net
income of the Company for investments and prepayments of certain indebtedness.
In connection with the August Amendment SGI paid an aggregate of approximately $6,300 of fees and expenses in
2011 to (or for the benefit of) the consenting and new lenders of which approximately $5,800 was capitalized as deferred
financing fees. We also recorded a loss on early extinguishment of debt of approximately $4,200 as a result of writing off
deferred financing fees related to those lenders that chose not to extend the maturity date of their loans.
On February 21, 2012, the Company and SGI entered into an agreement to refinance the approximately $16,400 of
revolving credit facility and term loan commitments that were not extended in connection with the August Amendment and
extend the maturity dates of these commitments to June 30, 2015.
We were in compliance with our covenants under the Credit Agreement as of December 31, 2012.
2018 Notes
The 2018 Notes issued by the Company bear interest at the rate of 8.125% per annum, which accrues from
September 22, 2010 and is payable semiannually in arrears on March 15 and September 15 of each year, commencing on
March 15, 2011. The 2018 Notes mature on September 15, 2018, unless earlier redeemed or repurchased by the Company, and
are subject to the terms and conditions set forth in the indenture governing the 2018 Notes dated as of September 22, 2010 (the
"2018 Notes Indenture").
The Company may redeem some or all of the 2018 Notes at any time prior to September 15, 2014 at a price equal to
100% of the principal amount of the 2018 Notes plus accrued and unpaid interest, if any, to the date of redemption plus a
"make whole" premium. The Company may redeem some or all of the 2018 Notes for cash at any time on or after
September 15, 2014 at the prices specified in the 2018 Notes Indenture. In addition, at any time on or prior to September 15,
2013, the Company may redeem up to 35% of the initially outstanding aggregate principal amount of the 2018 Notes at a
redemption price of 108.125% of the principal amount thereof, plus accrued and unpaid interest, if any, to the date of
redemption, with the net cash proceeds from one or more equity offerings of the Company.
Additionally, if a holder of 2018 Notes is required to be licensed, qualified or found suitable under any applicable
gaming laws or regulations and that holder does not become so licensed or qualified or is not found to be suitable, then the
Company will have the right, subject to certain notice provisions set forth in the 2018 Notes Indenture, (1) to require that holder
to dispose of all or a portion of those 2018 Notes or (2) to redeem the 2018 Notes of that holder at a redemption price
calculated as set forth in the 2018 Notes Indenture.
Upon the occurrence of a change of control (as defined in the 2018 Notes Indenture), the Company must make an
offer to purchase the 2018 Notes at a purchase price equal to 101% of the principal amount thereof, plus accrued and unpaid
interest, if any, to the date of repurchase. In addition, following an asset sale (as defined in the 2018 Notes Indenture) and
subject to the limitations contained in the 2018 Notes Indenture, the Company must make an offer to purchase certain amounts
of the 2018 Notes using the net cash proceeds from such asset sale to the extent such proceeds are not applied as set forth in the
2018 Notes Indenture, at a purchase price equal to 100% of the principal amount of the 2018 Notes to be repurchased, plus
accrued interest to the date of repurchase.
109
SCIENTIFIC GAMES CORPORATION AND SUBSIDIARIES
NOTES TO CONSOLIDATED FINANCIAL STATEMENTS (Continued)
(in thousands, except per share amounts)
(13) Long-Term and Other Debt (Continued)
The 2018 Notes are unsecured senior subordinated obligations of the Company and are subordinated to all of the
Company's existing and future senior debt, rank equally with all of the Company's future senior subordinated debt, and rank
senior to all of the Company's future debt that is expressly subordinated to the 2018 Notes. The 2018 Notes are guaranteed on
an unsecured senior subordinated basis by all of the Company's 100%-owned U.S. subsidiaries (including SGI). The 2018
Notes are structurally subordinated to all of the liabilities of our non-guarantor subsidiaries.
The 2018 Notes Indenture contains certain covenants that, among other things, limit the Company's ability, and the
ability of certain of its subsidiaries, to incur additional indebtedness, pay dividends or make distributions or certain other
restricted payments, purchase or redeem capital stock, make investments or extend credit, engage in certain transactions with
affiliates, engage in sale-leaseback transactions, consummate certain assets sales, effect a consolidation or merger, or sell,
transfer, lease or otherwise dispose of all or substantially all assets, or create certain liens and other encumbrances on assets.
The 2018 Notes Indenture contains events of default customary for agreements of its type (with customary grace periods, as
applicable).
2019 Notes
The 2019 Notes issued by SGI bear interest at the rate of 9.25% per annum, which accrues from May 21, 2009 and is
payable semiannually in arrears on June 15 and December 15 of each year, commencing on December 15, 2009. The 2019
Notes mature on June 15, 2019, unless earlier redeemed or repurchased, and are subject to the terms and conditions set forth in
the indenture governing the 2019 Notes dated as of May 21, 2009 (the "2019 Notes Indenture").
SGI may redeem some or all of the 2019 Notes at any time prior to June 15, 2014 at a price equal to 100% of the
principal amount of the 2019 Notes plus accrued and unpaid interest, if any, to the date of redemption plus a "make whole"
premium calculated as set forth in the 2019 Notes. SGI may redeem some or all of the 2019 Notes for cash at any time on or
after June 15, 2014 at the prices specified in the 2019 Notes Indenture.
Additionally, if a holder of the 2019 Notes is required to be licensed, qualified or found suitable under any applicable
gaming laws or regulations and that holder does not become so licensed or qualified or is not found to be suitable, then SGI
will have the right subject to certain notice provisions set forth in the 2019 Notes Indenture, (1) to require that holder to dispose
of all or a portion of those Notes or (2) to redeem the 2019 Notes of that holder at a redemption price calculated as set forth in
the 2019 Notes Indenture.
Upon the occurrence of a change of control (as defined in the 2019 Notes Indenture), SGI must make an offer to
purchase the 2019 Notes at a purchase price equal to 101% of the principal amount thereof, plus accrued and unpaid interest, if
any, to the date of repurchase. In addition, following an asset sale (as defined in the 2019 Notes Indenture) and subject to the
limitations contained in the 2019 Notes Indenture, SGI must make an offer to purchase certain amounts of the 2019 Notes using
the net cash proceeds from such asset sale to the extent such proceeds are not applied as set forth in the 2019 Notes Indenture,
at a purchase price equal to 100% of the principal amount of the 2019 Notes to be repurchased, plus accrued interest to the date
of repurchase.
The 2019 Notes are unsecured senior subordinated obligations of SGI and are subordinated to all of SGI's existing and
future senior debt, rank equally with all of SGI's existing and future senior subordinated debt and rank senior to all of SGI's
future debt that is expressly subordinated to the 2019 Notes. The 2019 Notes are guaranteed on an unsecured senior
subordinated basis by the Company and all of its 100%-owned U.S. subsidiaries (other than SGI). The 2019 Notes are
structurally subordinated to all of the liabilities of our non-guarantor subsidiaries.
The 2019 Notes Indenture contains certain covenants that, among other things, limit the Company's ability, and the
ability of certain of its subsidiaries, including SGI, to incur additional indebtedness, pay dividends or make distributions or
certain other restricted payments, purchase or redeem capital stock, make investments or extend credit, engage in certain
transactions with affiliates, engage in sale-leaseback transactions, consummate certain assets sales, effect a consolidation or
merger, or sell, transfer, lease or otherwise dispose of all or substantially all assets, or create certain liens and other
110
SCIENTIFIC GAMES CORPORATION AND SUBSIDIARIES
NOTES TO CONSOLIDATED FINANCIAL STATEMENTS (Continued)
(in thousands, except per share amounts)
(13) Long-Term and Other Debt (Continued)
encumbrances on assets. The 2019 Notes Indenture contains events of default customary for agreements of its type (with
customary grace periods, as applicable).
2020 Notes
On August 20, 2012, SGI, issued the 2020 Notes at a price of 100% of the principal amount thereof in a private
offering to qualified institutional buyers in accordance with Rule 144A under the Securities Act of 1933, as amended (the
“Securities Act”), and to persons outside the United States under Regulation S under the Securities Act. The 2020 Notes were
issued pursuant to an indenture dated as of August 20, 2012 (the “2020 Notes Indenture”). In February 2013, SGI completed an
exchange offer in which all of the unregistered 2020 Notes were exchanged for a like amount of 2020 Notes that have been
registered under the Securities Act.
The 2020 Notes bear interest at the rate of 6.250% per annum, which accrues from August 20, 2012 and is payable
semiannually in arrears on March 1 and September 1 of each year, commencing on March 1, 2013. The 2020 Notes mature on
September 1, 2020, unless earlier redeemed or repurchased, and are subject to the terms and conditions set forth in the 2020
Notes Indenture. In connection with the issuance of the 2020 Notes, the Company capitalized financing costs of $6,200.
SGI may redeem some or all of the 2020 Notes at any time prior to September 1, 2015 at a price equal to 100% of the
principal amount of the 2020 Notes plus accrued and unpaid interest, if any, to the date of redemption plus a ''make-whole''
premium. SGI may redeem some or all of the 2020 Notes at any time on or after September 1, 2015 at the prices specified in
the 2020 Notes Indenture. In addition, at any time prior to September 1, 2015, SGI may redeem up to 35% of the initially
outstanding aggregate principal amount of the 2020 Notes at a redemption price of 106.250% of the principal amount thereof,
plus accrued and unpaid interest, if any, to the date of redemption, with the net cash proceeds contributed to the capital of SGI
from one or more equity offerings of the Company.
Additionally, if a holder of the 2020 Notes is required to be licensed, qualified or found suitable under any applicable
gaming laws or regulations and that holder does not become so licensed or qualified or is not found to be suitable, then SGI
will have the right to, subject to certain notice provisions set forth in the 2020 Notes Indenture, (1) require that holder to
dispose of all or a portion of those 2020 Notes or (2) redeem the 2020 Notes of that holder at a redemption price calculated as
set forth in the 2020 Notes Indenture.
Upon the occurrence of a change of control (as defined in the 2020 Notes Indenture), SGI must make an offer to
purchase the 2020 Notes at a purchase price equal to 101% of the principal amount thereof, plus accrued and unpaid interest, if
any, to the date of repurchase. In addition, following an asset sale (as defined in the 2020 Notes Indenture) and subject to the
limitations contained in the 2020 Notes Indenture, SGI must make an offer to purchase certain amounts of the 2020 Notes using
the net cash proceeds from such asset sale to the extent such proceeds are not applied as set forth in the 2020 Notes Indenture,
at a purchase price equal to 100% of the principal amount of the 2020 Notes to be repurchased, plus accrued interest to the date
of repurchase.
The 2020 Notes are unsecured senior subordinated obligations of SGI and are subordinated to all of SGI's existing and
future senior debt, rank equally with all of SGI's existing and future senior subordinated debt and rank senior to all of SGI's
future debt that is expressly subordinated to the 2020 Notes. The 2020 Notes are guaranteed on an unsecured senior
subordinated basis by the Company and all of its 100%-owned U.S. subsidiaries (other than SGI). The 2020 Notes are
structurally subordinated to all of the liabilities of our non-guarantor subsidiaries.
The 2020 Notes Indenture contains certain covenants that, among other things, limit the Company's ability, and the
ability of certain of its subsidiaries, including SGI, to incur additional indebtedness, pay dividends or make distributions or
certain other restricted payments, purchase or redeem capital stock, make investments or extend credit, engage in certain
transactions with affiliates, engage in sale-leaseback transactions, consummate certain assets sales, effect a consolidation or
111
SCIENTIFIC GAMES CORPORATION AND SUBSIDIARIES
NOTES TO CONSOLIDATED FINANCIAL STATEMENTS (Continued)
(in thousands, except per share amounts)
(13) Long-Term and Other Debt (Continued)
merger, or sell, transfer, lease or otherwise dispose of all or substantially all assets, or create certain liens and other
encumbrances on assets. The 2020 Notes Indenture contains events of default customary for agreements of its type (with
customary grace periods, as applicable).
2016 Notes
On September 19, 2012, SGI redeemed all outstanding 2016 Notes at a redemption price equal to 103.938% of the
aggregate principal amount thereof, plus accrued and unpaid interest up to, but not including, the redemption date. Holders of
the 2016 Notes received payment in full consisting of principal in the amount of $200,000, redemption premium of $7,876 and
accrued interest of $4,113. In connection with the redemption, the Company recorded a loss on early extinguishment of debt of
approximately $15,464 comprised primarily of the redemption premium and the write-off of previously deferred financing
costs.
Other Debt
In the first quarter of 2012, we repaid RMB 12,500 in principal amount of a China loan and the outstanding letter of
credit in support of this debt was reduced by $1,000. In the second quarter of 2012, we repaid the remaining RMB 166,000 in
principal amount of this China loan and the outstanding letter of credit of $28,200 in support of this debt was returned.
In May 2012, we entered into a new RMB 60,000 lending facility with a Chinese bank under which we have
borrowed RMB 28,023 as of December 31, 2012. The facility requires graduated semi-annual principal payments through
November 2014. We made RMB 426 of principal payments under this loan in the fourth quarter of 2012. In June 2012, we
entered into a one-year RMB 50,000 term loan with another Chinese bank. A letter of credit in the amount of $6,500 was issued
to support this term loan.
Commitment Letter
In connection with the pending merger with WMS Industries Inc., a Delaware corporation (“WMS”), the Company
and SGI entered into a commitment letter pursuant to which the lenders party thereto have agreed to provide the financing
necessary to fund the consideration to be paid pursuant to the terms of the merger agreement. For further details regarding the
commitment letter and the debt financing contemplated thereby, see Note 23 (Subsequent Events).
(14) Fair Value Measurements
Fair value is defined as the exchange price that would be received for an asset or paid to transfer a liability (an exit
price) in the principal or most advantageous market for the asset and liability in an orderly transaction between market
participants at the measurement date. The Company estimates fair value of its assets and liabilities utilizing an established
three-level hierarchy. The hierarchy is based upon the transparency of inputs to the valuation of an asset or liability as of the
measurement date as follows:
Level 1. Quoted prices in active markets for identical assets or liabilities.
Level 2. Observable inputs other than Level 1 prices, such as quoted prices for similar assets or liabilities, quoted prices
in markets with insufficient volume or infrequent transactions (less active markets), or model-derived valuations in which all
significant inputs are observable or can be derived principally from or corroborated with observable market data for
substantially the full term of the assets or liabilities. Level 2 inputs also include non-binding market consensus prices that can
be corroborated with observable market data, as well as quoted prices that were adjusted for security-specific restrictions.
Level 3. Unobservable inputs to the valuation methodology that are significant to the measurement of the fair value of
assets or liabilities. Level 3 inputs also include non-binding market consensus prices or non-binding broker quotes that we were
unable to corroborate with observable market data.
112
SCIENTIFIC GAMES CORPORATION AND SUBSIDIARIES
NOTES TO CONSOLIDATED FINANCIAL STATEMENTS (Continued)
(in thousands, except per share amounts)
(14) Fair Value Measurements (Continued)
Assets and Liabilities Measured at Fair Value on a Recurring Basis
The fair value of our financial assets and liabilities is determined by reference to market data and other valuation
techniques as appropriate. We believe the fair value of our financial instruments, which are principally cash and cash
equivalents, accounts receivable, other current assets, accounts payable and accrued liabilities, approximates their recorded
values.
Interest rate swap
Effective October 17, 2008, SGI entered into a three-year interest rate swap agreement (the "2008 Hedge") with
JPMorgan, which expired on October 17, 2011. Under the 2008 Hedge, which was designated as a cash flow hedge, SGI paid
interest on a notional amount of debt at a fixed rate of and received interest on a notional amount of debt at the then prevailing
three-month LIBOR rate. The objective of the 2008 Hedge was to eliminate the variability of cash flows attributable to the
LIBOR component of interest expense paid on our variable-rate debt.
We believe we matched the critical terms of the hedged variable-rate debt with the 2008 Hedge and believe the 2008
Hedge was highly effective in offsetting changes in the expected cash flows due to fluctuation in the three-month LIBOR-based
rate over the term of the forecasted interest payments related to the notional amount of variable-rate debt. The effectiveness of
the 2008 Hedge was measured quarterly on a retrospective basis using the cumulative dollar-offset approach in which the
cumulative changes in the cash flows of the actual swap were compared to the cumulative changes in the cash flows of the
hypothetical swap. As the 2008 Hedge was determined to be effective, it was recorded in other comprehensive income (loss).
There was no ineffective portion of the 2008 Hedge recorded in the Consolidated Statements of Operations and Comprehensive
Income.
Foreign currency forward contracts
During the year ended December 31, 2012, we entered into foreign currency forward contracts for the sale of Euros for
U.S. dollars to hedge a portion of the net investment in one of our subsidiaries that is denominated in Euros. Some of these
foreign currency forward contracts settled in 2012. As of December 31, 2012, we had foreign currency forward contracts with
an aggregate notional amount of €20,000 and a weighted-average exchange rate of approximately 1.2690 that are scheduled to
settle in May 2013. We did not have any derivative instruments as of December 31, 2011.
We have designated the forward contracts as qualified hedges in accordance with Accounting Standards Codification
(“ASC”) 815, Derivatives and Hedging. Gains and losses from the foreign currency forward contracts are recorded in
accumulated other comprehensive (loss) income until the investment is liquidated. During the year ended December 31, 2012,
we recorded a gain, net of tax, associated with the forward contracts of approximately $904 in other comprehensive (loss)
income on our Consolidated Statements of Operations and Comprehensive Income. The following table provides further
information relating to the Company's foreign currency forward contracts at December 31, 2012.
Location on
Balance Sheet Notional Amount
Weighted average
exchange rate
Fair Value Asset
(Liability) Valuation Technique
Foreign currency forward contracts
Accrued Liabilities $ 20,000 1.2690 (1,013 )
Quoted prices in active markets for identical assets or
liabilities
113
SCIENTIFIC GAMES CORPORATION AND SUBSIDIARIES
NOTES TO CONSOLIDATED FINANCIAL STATEMENTS (Continued)
(in thousands, except per share amounts)
(14) Fair Value Measurements (Continued)
In accordance with ASC 323, Investments - Equity Method and Joint Ventures, we record our share of a derivative
instrument held by LNS in which we have a 20% equity investment. Changes in the fair value of the derivative instrument are
recorded by LNS within other comprehensive income on LNS' statement of comprehensive income. During the year ended
December 31, 2012, we recorded a loss, net of tax, associated with our share of this derivative instrument of $518 in other
comprehensive (loss) income on our Consolidated Statements of Operations and Comprehensive Income and in equity
investments on our Consolidated Balance Sheet.
Debt
We believe that the fair value of our fixed interest rate debt approximated $986,763 and $855,178 as of December 31,
2012 and 2011, respectively, based on quoted market prices for our securities.
Assets and Liabilities Measured at Fair Value on a Non-recurring Basis
In accordance with ASC 360, Property, Plant, and Equipment, machinery, equipment and deferred installation costs with
a carrying amount of $25,900 were written down to a fair value of $20,100, resulting in an impairment charge of $5,800, which
is included in depreciation and amortization expense in our Consolidated Statements of Operations and Comprehensive Income
for the year ended December 31, 2012.
The following are the classes of assets and liabilities measured at fair value on a non-recurring basis at December 31,
2012:
Level 1
Level 2
Level 3
Total at
December 31, 2012
Total Loss
Valuation Technique
Weighted-Average Discount
Rate
Property and Equipment $— $— $20,100 $20,100 $(5,800) Discounted Cash Flow 9%
Recoverability of assets to be held and used is measured by a comparison of the carrying amount of the asset to the
expected net future undiscounted cash flows to be generated by that asset. The amount of impairment of other long-lived assets
is measured by the amount by which the carrying value of the asset exceeds the fair market value of the asset, which is
determined using a discounted cash flow valuation. Assumptions used in our discounted cash flow valuation include weighted-
average cost of capital, long-term projected operating cash flows and long-term projected capital expenses.
There were no other assets or liabilities that were measured at fair value on a non-recurring basis as of December 31,
2012.
(15) Stockholders' Equity
Preferred Stock
As of December 31, 2012, we had a total of 2,000 shares of preferred stock, $1.00 par value per share, authorized for
issuance, including 229 authorized shares of Series A convertible preferred stock and 1 authorized share of Series B preferred
stock. No shares of preferred stock are currently outstanding.
Common Stock
We have two classes of common stock, consisting of Class A common stock and Class B non-voting common stock. All
shares of Class A common stock and Class B common stock entitle holders to the same rights and privileges except that the
Class B common stock is non-voting. Each share of Class B common stock is convertible into one share of Class A common
stock. As of December 31, 2012 and 2011, there were 700 shares of Class B common stock authorized and none outstanding.
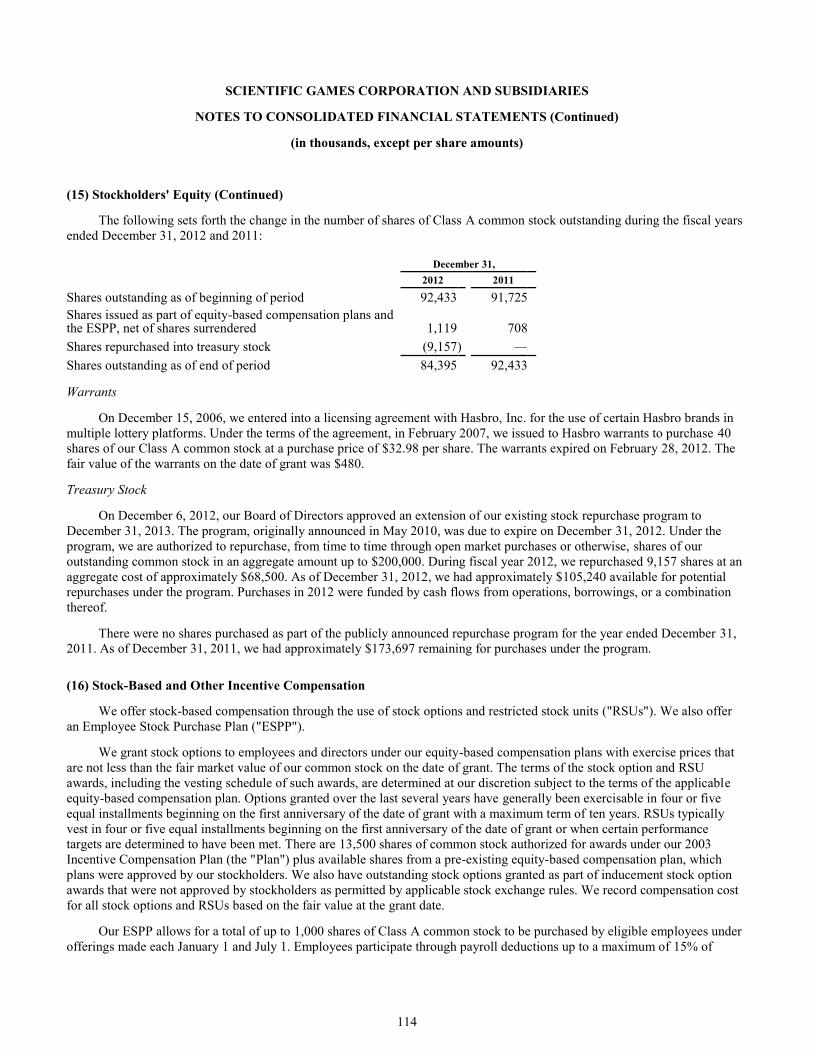
114
SCIENTIFIC GAMES CORPORATION AND SUBSIDIARIES
NOTES TO CONSOLIDATED FINANCIAL STATEMENTS (Continued)
(in thousands, except per share amounts)
(15) Stockholders' Equity (Continued)
The following sets forth the change in the number of shares of Class A common stock outstanding during the fiscal years
ended December 31, 2012 and 2011:
December 31,
2012 2011
Shares outstanding as of beginning of period 92,433 91,725
Shares issued as part of equity-based compensation plans and the ESPP, net of shares surrendered 1,119 708
Shares repurchased into treasury stock (9,157 ) —
Shares outstanding as of end of period 84,395 92,433
Warrants
On December 15, 2006, we entered into a licensing agreement with Hasbro, Inc. for the use of certain Hasbro brands in
multiple lottery platforms. Under the terms of the agreement, in February 2007, we issued to Hasbro warrants to purchase 40
shares of our Class A common stock at a purchase price of $32.98 per share. The warrants expired on February 28, 2012. The
fair value of the warrants on the date of grant was $480.
Treasury Stock
On December 6, 2012, our Board of Directors approved an extension of our existing stock repurchase program to
December 31, 2013. The program, originally announced in May 2010, was due to expire on December 31, 2012. Under the
program, we are authorized to repurchase, from time to time through open market purchases or otherwise, shares of our
outstanding common stock in an aggregate amount up to $200,000. During fiscal year 2012, we repurchased 9,157 shares at an
aggregate cost of approximately $68,500. As of December 31, 2012, we had approximately $105,240 available for potential
repurchases under the program. Purchases in 2012 were funded by cash flows from operations, borrowings, or a combination
thereof.
There were no shares purchased as part of the publicly announced repurchase program for the year ended December 31,
2011. As of December 31, 2011, we had approximately $173,697 remaining for purchases under the program.
(16) Stock-Based and Other Incentive Compensation
We offer stock-based compensation through the use of stock options and restricted stock units ("RSUs"). We also offer
an Employee Stock Purchase Plan ("ESPP").
We grant stock options to employees and directors under our equity-based compensation plans with exercise prices that
are not less than the fair market value of our common stock on the date of grant. The terms of the stock option and RSU
awards, including the vesting schedule of such awards, are determined at our discretion subject to the terms of the applicable
equity-based compensation plan. Options granted over the last several years have generally been exercisable in four or five
equal installments beginning on the first anniversary of the date of grant with a maximum term of ten years. RSUs typically
vest in four or five equal installments beginning on the first anniversary of the date of grant or when certain performance
targets are determined to have been met. There are 13,500 shares of common stock authorized for awards under our 2003
Incentive Compensation Plan (the "Plan") plus available shares from a pre-existing equity-based compensation plan, which
plans were approved by our stockholders. We also have outstanding stock options granted as part of inducement stock option
awards that were not approved by stockholders as permitted by applicable stock exchange rules. We record compensation cost
for all stock options and RSUs based on the fair value at the grant date.
Our ESPP allows for a total of up to 1,000 shares of Class A common stock to be purchased by eligible employees under
offerings made each January 1 and July 1. Employees participate through payroll deductions up to a maximum of 15% of
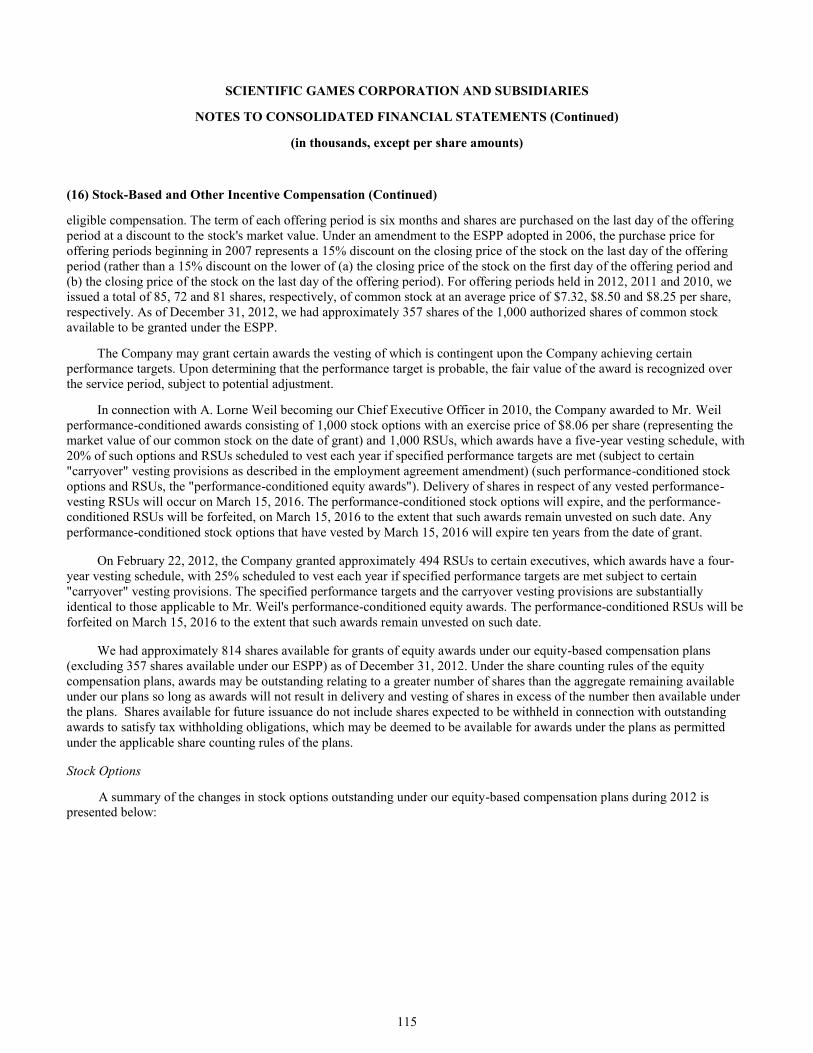
115
SCIENTIFIC GAMES CORPORATION AND SUBSIDIARIES
NOTES TO CONSOLIDATED FINANCIAL STATEMENTS (Continued)
(in thousands, except per share amounts)
(16) Stock-Based and Other Incentive Compensation (Continued)
eligible compensation. The term of each offering period is six months and shares are purchased on the last day of the offering
period at a discount to the stock's market value. Under an amendment to the ESPP adopted in 2006, the purchase price for
offering periods beginning in 2007 represents a 15% discount on the closing price of the stock on the last day of the offering
period (rather than a 15% discount on the lower of (a) the closing price of the stock on the first day of the offering period and
(b) the closing price of the stock on the last day of the offering period). For offering periods held in 2012, 2011 and 2010, we
issued a total of 85, 72 and 81 shares, respectively, of common stock at an average price of $7.32, $8.50 and $8.25 per share,
respectively. As of December 31, 2012, we had approximately 357 shares of the 1,000 authorized shares of common stock
available to be granted under the ESPP.
The Company may grant certain awards the vesting of which is contingent upon the Company achieving certain
performance targets. Upon determining that the performance target is probable, the fair value of the award is recognized over
the service period, subject to potential adjustment.
In connection with A. Lorne Weil becoming our Chief Executive Officer in 2010, the Company awarded to Mr. Weil
performance-conditioned awards consisting of 1,000 stock options with an exercise price of $8.06 per share (representing the
market value of our common stock on the date of grant) and 1,000 RSUs, which awards have a five-year vesting schedule, with
20% of such options and RSUs scheduled to vest each year if specified performance targets are met (subject to certain
"carryover" vesting provisions as described in the employment agreement amendment) (such performance-conditioned stock
options and RSUs, the "performance-conditioned equity awards"). Delivery of shares in respect of any vested performance-
vesting RSUs will occur on March 15, 2016. The performance-conditioned stock options will expire, and the performance-
conditioned RSUs will be forfeited, on March 15, 2016 to the extent that such awards remain unvested on such date. Any
performance-conditioned stock options that have vested by March 15, 2016 will expire ten years from the date of grant.
On February 22, 2012, the Company granted approximately 494 RSUs to certain executives, which awards have a four-
year vesting schedule, with 25% scheduled to vest each year if specified performance targets are met subject to certain
"carryover" vesting provisions. The specified performance targets and the carryover vesting provisions are substantially
identical to those applicable to Mr. Weil's performance-conditioned equity awards. The performance-conditioned RSUs will be
forfeited on March 15, 2016 to the extent that such awards remain unvested on such date.
We had approximately 814 shares available for grants of equity awards under our equity-based compensation plans
(excluding 357 shares available under our ESPP) as of December 31, 2012. Under the share counting rules of the equity
compensation plans, awards may be outstanding relating to a greater number of shares than the aggregate remaining available
under our plans so long as awards will not result in delivery and vesting of shares in excess of the number then available under
the plans. Shares available for future issuance do not include shares expected to be withheld in connection with outstanding
awards to satisfy tax withholding obligations, which may be deemed to be available for awards under the plans as permitted
under the applicable share counting rules of the plans.
Stock Options
A summary of the changes in stock options outstanding under our equity-based compensation plans during 2012 is
presented below:
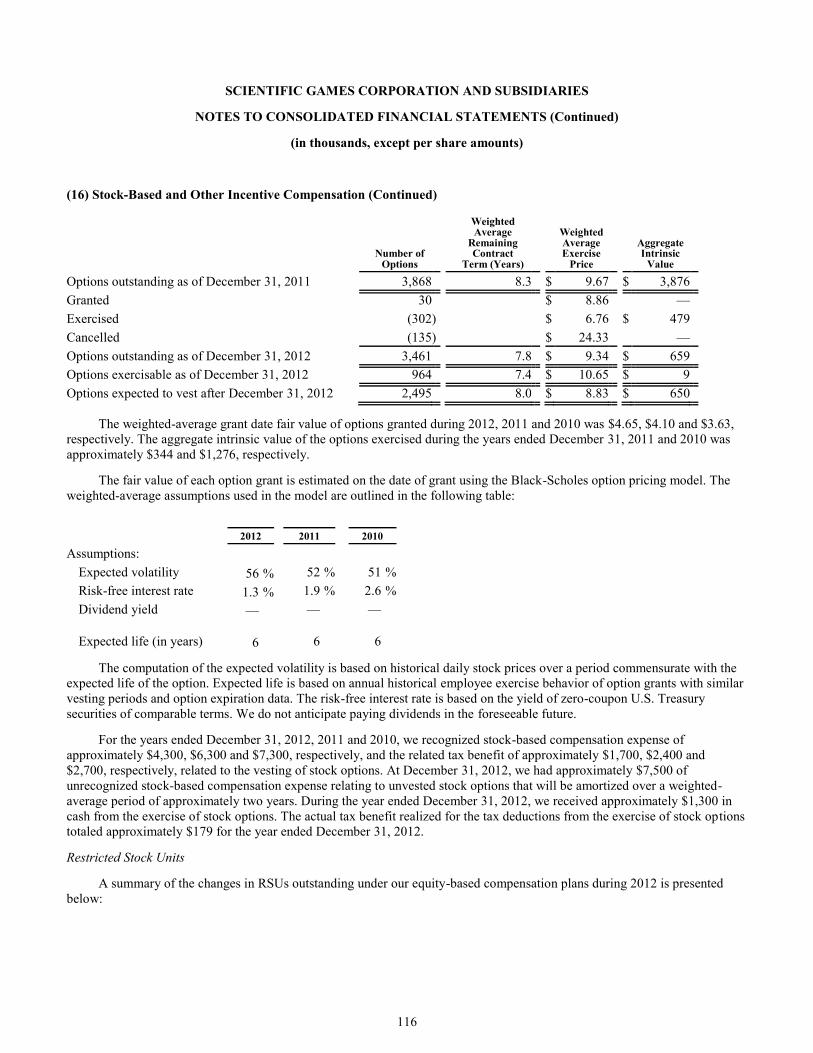
116
SCIENTIFIC GAMES CORPORATION AND SUBSIDIARIES
NOTES TO CONSOLIDATED FINANCIAL STATEMENTS (Continued)
(in thousands, except per share amounts)
(16) Stock-Based and Other Incentive Compensation (Continued)
Number of
Options
Weighted Average
Remaining Contract
Term (Years)
Weighted Average Exercise
Price
Aggregate Intrinsic
Value
Options outstanding as of December 31, 2011 3,868 8.3 $ 9.67 $ 3,876
Granted 30 $ 8.86 —
Exercised (302 ) $ 6.76 $ 479
Cancelled (135 ) $ 24.33 —
Options outstanding as of December 31, 2012 3,461 7.8 $ 9.34 $ 659
Options exercisable as of December 31, 2012 964 7.4 $ 10.65 $ 9
Options expected to vest after December 31, 2012 2,495 8.0 $ 8.83 $ 650
The weighted-average grant date fair value of options granted during 2012, 2011 and 2010 was $4.65, $4.10 and $3.63,
respectively. The aggregate intrinsic value of the options exercised during the years ended December 31, 2011 and 2010 was
approximately $344 and $1,276, respectively.
The fair value of each option grant is estimated on the date of grant using the Black-Scholes option pricing model. The
weighted-average assumptions used in the model are outlined in the following table:
2012 2011 2010
Assumptions:
Expected volatility 56 % 52 % 51 %
Risk-free interest rate 1.3 % 1.9 % 2.6 %
Dividend yield — — —
Expected life (in years) 6 6 6
The computation of the expected volatility is based on historical daily stock prices over a period commensurate with the
expected life of the option. Expected life is based on annual historical employee exercise behavior of option grants with similar
vesting periods and option expiration data. The risk-free interest rate is based on the yield of zero-coupon U.S. Treasury
securities of comparable terms. We do not anticipate paying dividends in the foreseeable future.
For the years ended December 31, 2012, 2011 and 2010, we recognized stock-based compensation expense of
approximately $4,300, $6,300 and $7,300, respectively, and the related tax benefit of approximately $1,700, $2,400 and
$2,700, respectively, related to the vesting of stock options. At December 31, 2012, we had approximately $7,500 of
unrecognized stock-based compensation expense relating to unvested stock options that will be amortized over a weighted-
average period of approximately two years. During the year ended December 31, 2012, we received approximately $1,300 in
cash from the exercise of stock options. The actual tax benefit realized for the tax deductions from the exercise of stock options
totaled approximately $179 for the year ended December 31, 2012.
Restricted Stock Units
A summary of the changes in RSUs outstanding under our equity-based compensation plans during 2012 is presented
below:
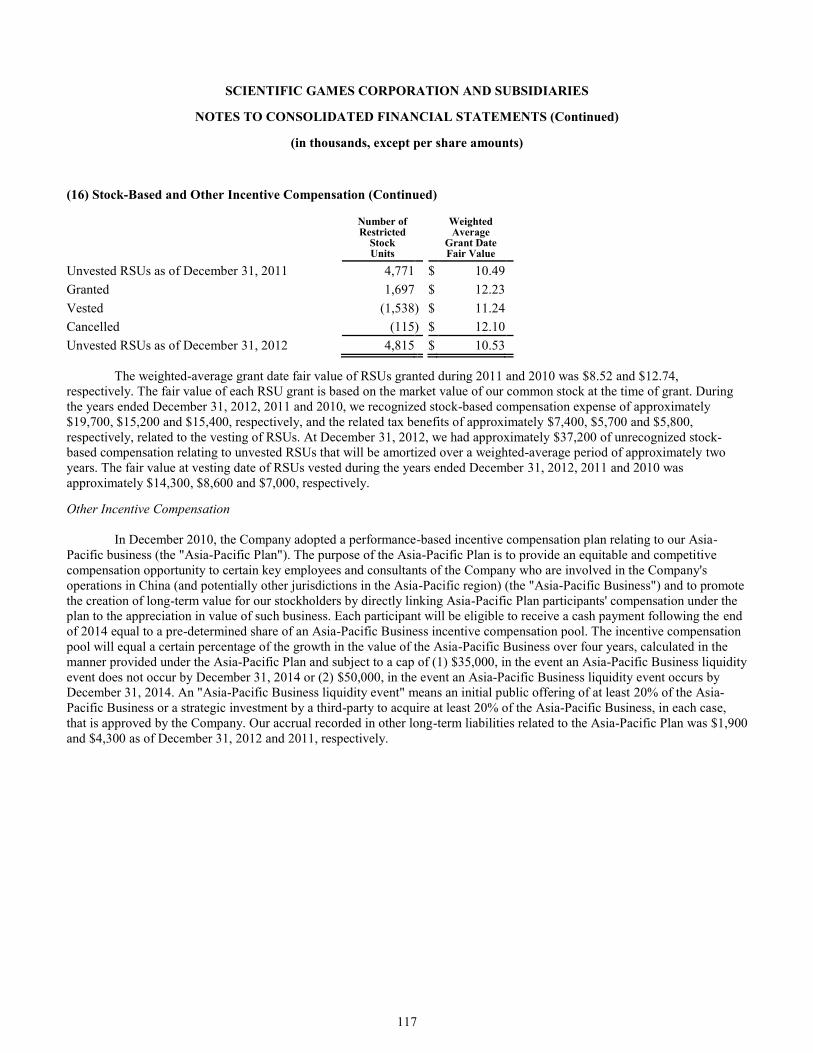
117
SCIENTIFIC GAMES CORPORATION AND SUBSIDIARIES
NOTES TO CONSOLIDATED FINANCIAL STATEMENTS (Continued)
(in thousands, except per share amounts)
(16) Stock-Based and Other Incentive Compensation (Continued)
Number of Restricted
Stock Units
Weighted Average
Grant Date Fair Value
Unvested RSUs as of December 31, 2011 4,771 $ 10.49
Granted 1,697 $ 12.23
Vested (1,538 ) $ 11.24
Cancelled (115 ) $ 12.10
Unvested RSUs as of December 31, 2012 4,815 $ 10.53
The weighted-average grant date fair value of RSUs granted during 2011 and 2010 was $8.52 and $12.74,
respectively. The fair value of each RSU grant is based on the market value of our common stock at the time of grant. During
the years ended December 31, 2012, 2011 and 2010, we recognized stock-based compensation expense of approximately
$19,700, $15,200 and $15,400, respectively, and the related tax benefits of approximately $7,400, $5,700 and $5,800,
respectively, related to the vesting of RSUs. At December 31, 2012, we had approximately $37,200 of unrecognized stock-
based compensation relating to unvested RSUs that will be amortized over a weighted-average period of approximately two
years. The fair value at vesting date of RSUs vested during the years ended December 31, 2012, 2011 and 2010 was
approximately $14,300, $8,600 and $7,000, respectively.
Other Incentive Compensation
In December 2010, the Company adopted a performance-based incentive compensation plan relating to our Asia-
Pacific business (the "Asia-Pacific Plan"). The purpose of the Asia-Pacific Plan is to provide an equitable and competitive
compensation opportunity to certain key employees and consultants of the Company who are involved in the Company's
operations in China (and potentially other jurisdictions in the Asia-Pacific region) (the "Asia-Pacific Business") and to promote
the creation of long-term value for our stockholders by directly linking Asia-Pacific Plan participants' compensation under the
plan to the appreciation in value of such business. Each participant will be eligible to receive a cash payment following the end
of 2014 equal to a pre-determined share of an Asia-Pacific Business incentive compensation pool. The incentive compensation
pool will equal a certain percentage of the growth in the value of the Asia-Pacific Business over four years, calculated in the
manner provided under the Asia-Pacific Plan and subject to a cap of (1) $35,000, in the event an Asia-Pacific Business liquidity
event does not occur by December 31, 2014 or (2) $50,000, in the event an Asia-Pacific Business liquidity event occurs by
December 31, 2014. An "Asia-Pacific Business liquidity event" means an initial public offering of at least 20% of the Asia-
Pacific Business or a strategic investment by a third-party to acquire at least 20% of the Asia-Pacific Business, in each case,
that is approved by the Company. Our accrual recorded in other long-term liabilities related to the Asia-Pacific Plan was $1,900
and $4,300 as of December 31, 2012 and 2011, respectively.
118
SCIENTIFIC GAMES CORPORATION AND SUBSIDIARIES
NOTES TO CONSOLIDATED FINANCIAL STATEMENTS (Continued)
(in thousands, except per share amounts)
(17) Pension and Other Post-Retirement Plans
We have defined benefit pension plans for our U.K.-based union employees (the "U.K. Plan") and certain Canadian-
based employees (the "Canadian Plan"). Retirement benefits under the U.K. Plan are generally based on an employee's average
compensation over the two years preceding retirement. Retirement benefits under the Canadian Plan are generally based on the
number of years of credited service. Our policy is to fund the minimum contribution permissible by the applicable authorities.
We estimate that approximately $3,892 will be contributed to the pension plans in fiscal year 2013.
Our pension benefit costs are calculated using various actuarial assumptions and methodologies. These assumptions
include discount rates, inflation, compensation increase rates, expected returns on plan assets, mortality rates and other factors.
The assumptions utilized in recording the obligations under our plans represent our best estimates, and we believe that they are
reasonable, based on information as to historical experience and performance as well as other factors that might cause future
expectations to differ from past trends. Differences in actual experience or changes in assumptions may affect our pension
obligations and future expense. The primary factors contributing to actuarial gains and losses each year are (1) changes in the
discount rate used to value pension benefit obligations as of the measurement date and (2) differences between the expected
and the actual return on plan assets.
We used to maintain an unfunded, nonqualified Supplemental Executive Retirement Plan (the "SERP"), which had been
a means of providing supplemental retirement benefits to a limited number of our senior executives. In December 2005, we
discontinued the SERP and benefit accruals under the plan were frozen in amounts based on the then present value of each
participant's aggregate benefit under an agreed-upon calculation. Although the aggregate benefit for each participant was frozen
at that time, participants were credited with interest at a rate of 4% per annum, compounded annually, from December 31, 2005
until the benefit was distributed. In November 2011, the remaining benefit of approximately $3,101 under the SERP was
distributed. The remaining distribution consisted of the cash value in a government fund account of approximately $902 and the
cash value of the remaining life insurance policies of approximately $2,199. The cash value in the government fund account as
of December 31, 2010 was approximately $902. The cash value of the remaining life insurance policies as of December 31,
2010 was approximately $2,228.
The following table sets forth the combined funded status of the pension plans and their reconciliation with the related
amounts recognized in our Consolidated Financial Statements at our December 31 measurement dates:
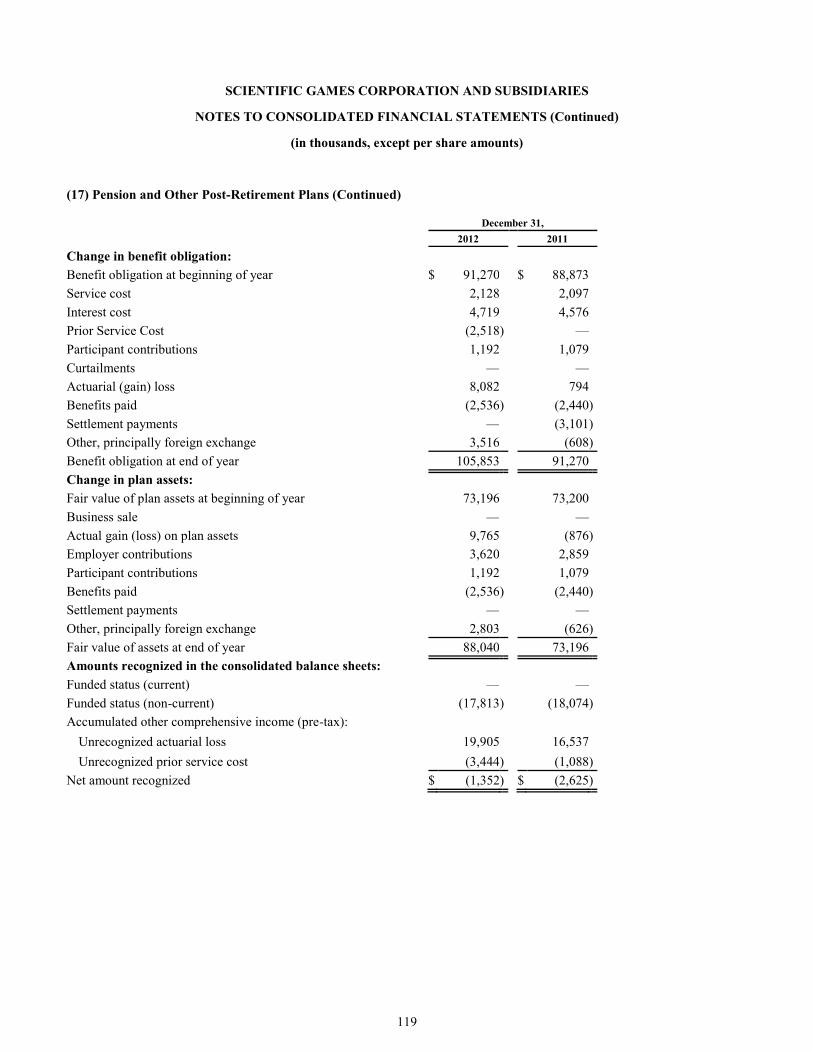
119
SCIENTIFIC GAMES CORPORATION AND SUBSIDIARIES
NOTES TO CONSOLIDATED FINANCIAL STATEMENTS (Continued)
(in thousands, except per share amounts)
(17) Pension and Other Post-Retirement Plans (Continued)
December 31,
2012 2011
Change in benefit obligation:
Benefit obligation at beginning of year $ 91,270 $ 88,873
Service cost 2,128 2,097
Interest cost 4,719 4,576
Prior Service Cost (2,518 ) —
Participant contributions 1,192 1,079
Curtailments — —
Actuarial (gain) loss 8,082 794
Benefits paid (2,536 ) (2,440 )
Settlement payments — (3,101 )
Other, principally foreign exchange 3,516 (608 )
Benefit obligation at end of year 105,853 91,270
Change in plan assets:
Fair value of plan assets at beginning of year 73,196 73,200
Business sale — —
Actual gain (loss) on plan assets 9,765 (876 )
Employer contributions 3,620 2,859
Participant contributions 1,192 1,079
Benefits paid (2,536 ) (2,440 )
Settlement payments — —
Other, principally foreign exchange 2,803 (626 )
Fair value of assets at end of year 88,040 73,196
Amounts recognized in the consolidated balance sheets:
Funded status (current) — —
Funded status (non-current) (17,813 ) (18,074 )
Accumulated other comprehensive income (pre-tax):
Unrecognized actuarial loss 19,905 16,537
Unrecognized prior service cost (3,444 ) (1,088 )
Net amount recognized $ (1,352 ) $ (2,625 )
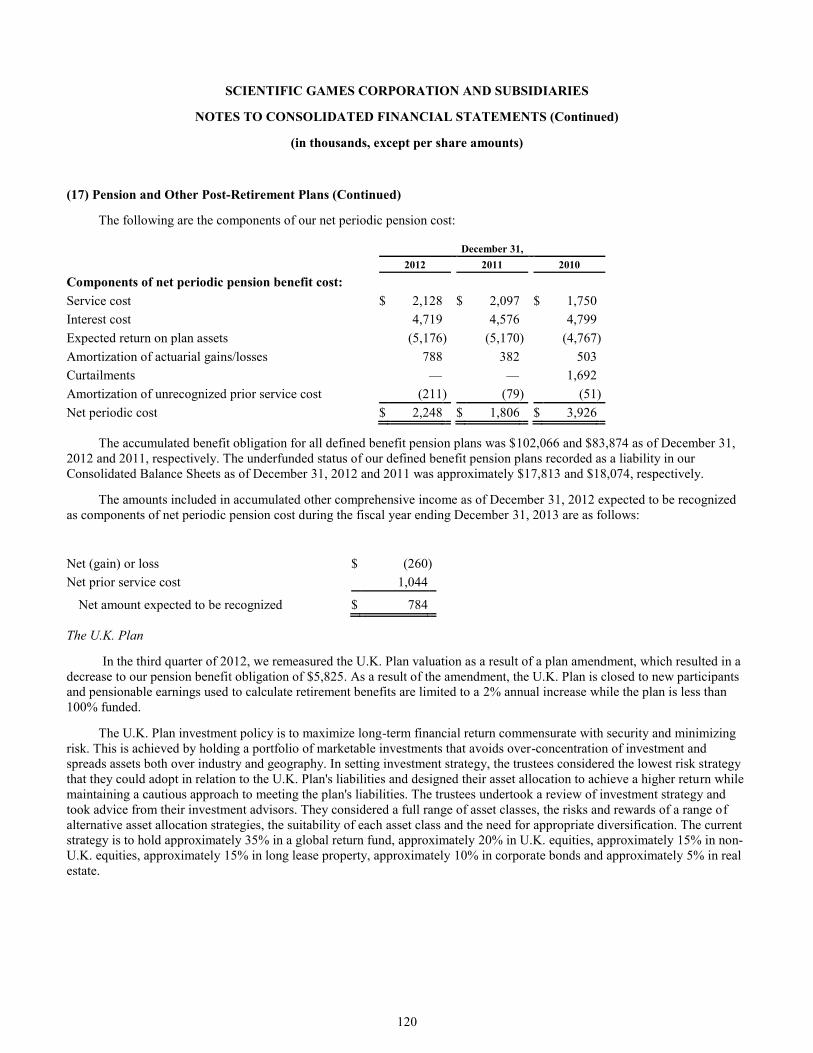
120
SCIENTIFIC GAMES CORPORATION AND SUBSIDIARIES
NOTES TO CONSOLIDATED FINANCIAL STATEMENTS (Continued)
(in thousands, except per share amounts)
(17) Pension and Other Post-Retirement Plans (Continued)
The following are the components of our net periodic pension cost:
December 31,
2012 2011 2010
Components of net periodic pension benefit cost:
Service cost $ 2,128 $ 2,097 $ 1,750
Interest cost 4,719 4,576 4,799
Expected return on plan assets (5,176 ) (5,170 ) (4,767 )
Amortization of actuarial gains/losses 788 382 503
Curtailments — — 1,692
Amortization of unrecognized prior service cost (211 ) (79 ) (51 )
Net periodic cost $ 2,248 $ 1,806 $ 3,926
The accumulated benefit obligation for all defined benefit pension plans was $102,066 and $83,874 as of December 31,
2012 and 2011, respectively. The underfunded status of our defined benefit pension plans recorded as a liability in our
Consolidated Balance Sheets as of December 31, 2012 and 2011 was approximately $17,813 and $18,074, respectively.
The amounts included in accumulated other comprehensive income as of December 31, 2012 expected to be recognized
as components of net periodic pension cost during the fiscal year ending December 31, 2013 are as follows:
Net (gain) or loss $ (260 )
Net prior service cost 1,044
Net amount expected to be recognized $ 784
The U.K. Plan
In the third quarter of 2012, we remeasured the U.K. Plan valuation as a result of a plan amendment, which resulted in a
decrease to our pension benefit obligation of $5,825. As a result of the amendment, the U.K. Plan is closed to new participants
and pensionable earnings used to calculate retirement benefits are limited to a 2% annual increase while the plan is less than
100% funded.
The U.K. Plan investment policy is to maximize long-term financial return commensurate with security and minimizing
risk. This is achieved by holding a portfolio of marketable investments that avoids over-concentration of investment and
spreads assets both over industry and geography. In setting investment strategy, the trustees considered the lowest risk strategy
that they could adopt in relation to the U.K. Plan's liabilities and designed their asset allocation to achieve a higher return while
maintaining a cautious approach to meeting the plan's liabilities. The trustees undertook a review of investment strategy and
took advice from their investment advisors. They considered a full range of asset classes, the risks and rewards of a range of
alternative asset allocation strategies, the suitability of each asset class and the need for appropriate diversification. The current
strategy is to hold approximately 35% in a global return fund, approximately 20% in U.K. equities, approximately 15% in non-
U.K. equities, approximately 15% in long lease property, approximately 10% in corporate bonds and approximately 5% in real
estate.
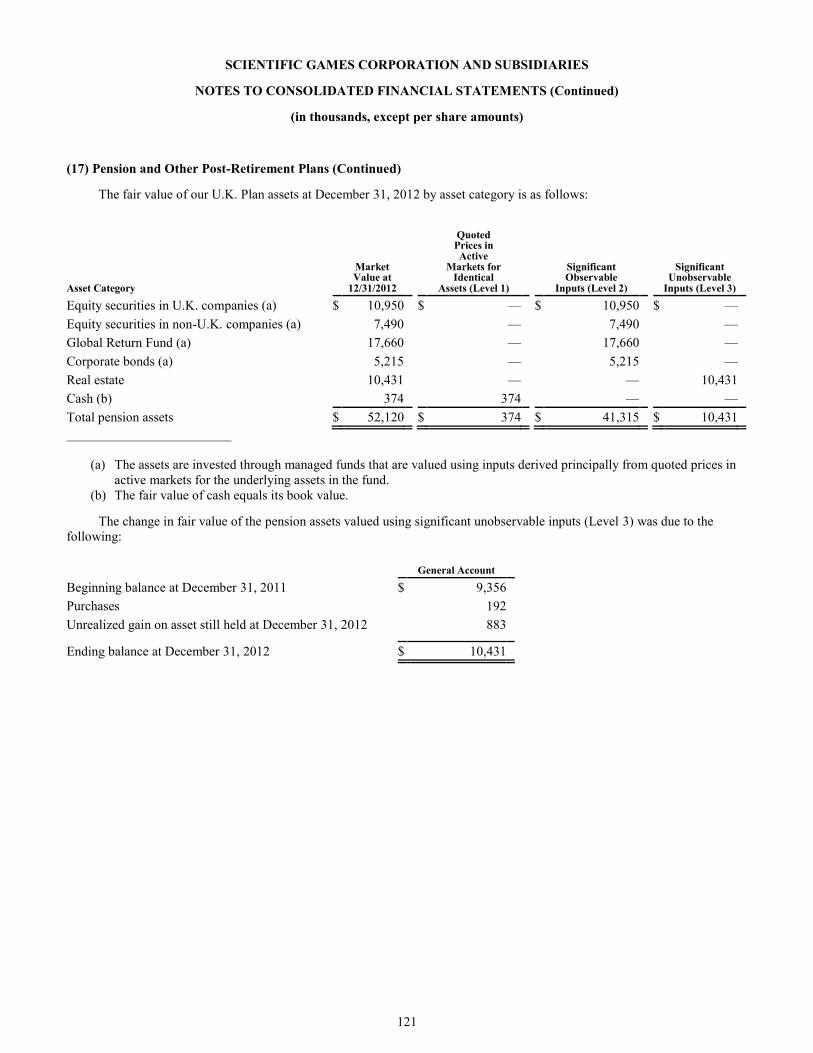
121
SCIENTIFIC GAMES CORPORATION AND SUBSIDIARIES
NOTES TO CONSOLIDATED FINANCIAL STATEMENTS (Continued)
(in thousands, except per share amounts)
(17) Pension and Other Post-Retirement Plans (Continued)
The fair value of our U.K. Plan assets at December 31, 2012 by asset category is as follows:
Asset Category
Market Value at
12/31/2012
Quoted Prices in Active
Markets for Identical
Assets (Level 1)
Significant Observable
Inputs (Level 2)
Significant Unobservable
Inputs (Level 3)
Equity securities in U.K. companies (a) $ 10,950 $ — $ 10,950 $ —
Equity securities in non-U.K. companies (a) 7,490 — 7,490 —
Global Return Fund (a) 17,660 — 17,660 —
Corporate bonds (a) 5,215 — 5,215 —
Real estate 10,431 — — 10,431
Cash (b) 374 374 — —
Total pension assets $ 52,120 $ 374 $ 41,315 $ 10,431
_______________________________
(a) The assets are invested through managed funds that are valued using inputs derived principally from quoted prices in
active markets for the underlying assets in the fund.
(b) The fair value of cash equals its book value.
The change in fair value of the pension assets valued using significant unobservable inputs (Level 3) was due to the
following:
General Account
Beginning balance at December 31, 2011 $ 9,356
Purchases 192
Unrealized gain on asset still held at December 31, 2012 883
Ending balance at December 31, 2012 $ 10,431
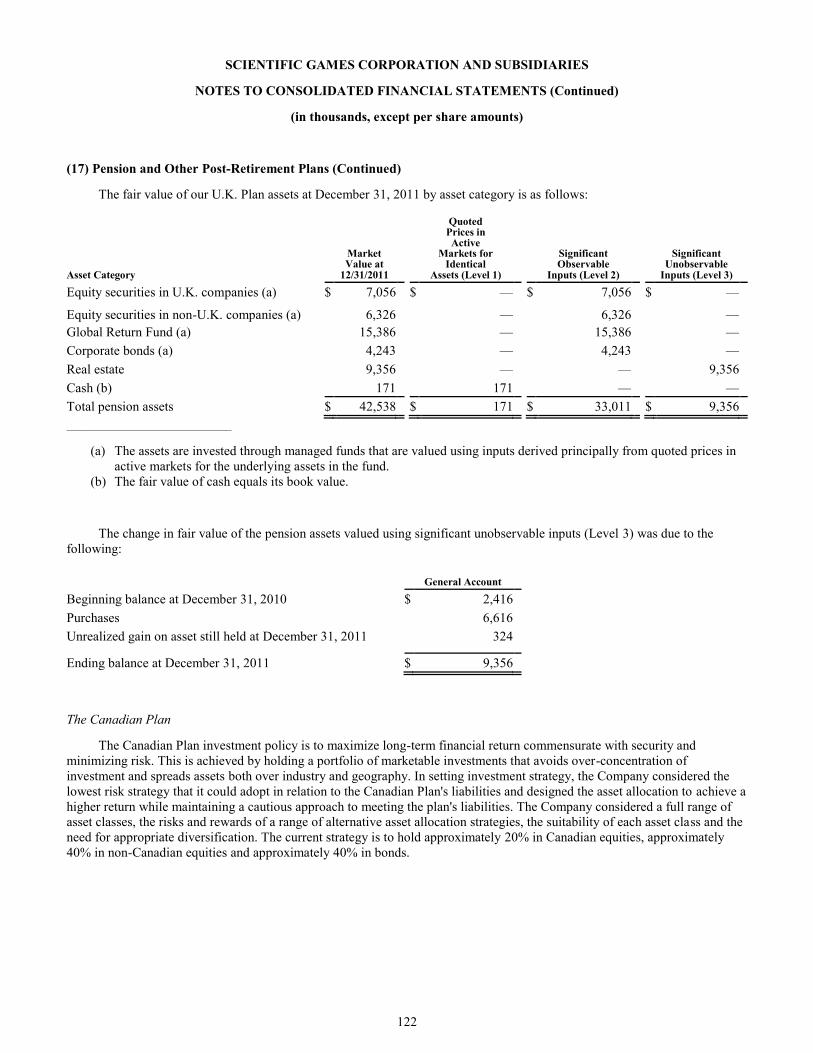
122
SCIENTIFIC GAMES CORPORATION AND SUBSIDIARIES
NOTES TO CONSOLIDATED FINANCIAL STATEMENTS (Continued)
(in thousands, except per share amounts)
(17) Pension and Other Post-Retirement Plans (Continued)
The fair value of our U.K. Plan assets at December 31, 2011 by asset category is as follows:
Asset Category
Market Value at
12/31/2011
Quoted Prices in Active
Markets for Identical
Assets (Level 1)
Significant Observable
Inputs (Level 2)
Significant Unobservable
Inputs (Level 3)
Equity securities in U.K. companies (a) $ 7,056 $ — $ 7,056 $ —
Equity securities in non-U.K. companies (a) 6,326 — 6,326 —
Global Return Fund (a) 15,386 — 15,386 —
Corporate bonds (a) 4,243 — 4,243 —
Real estate 9,356 — — 9,356
Cash (b) 171 171 — —
Total pension assets $ 42,538 $ 171 $ 33,011 $ 9,356
_______________________________
(a) The assets are invested through managed funds that are valued using inputs derived principally from quoted prices in
active markets for the underlying assets in the fund.
(b) The fair value of cash equals its book value.
The change in fair value of the pension assets valued using significant unobservable inputs (Level 3) was due to the
following:
General Account
Beginning balance at December 31, 2010 $ 2,416
Purchases 6,616
Unrealized gain on asset still held at December 31, 2011 324
Ending balance at December 31, 2011 $ 9,356
The Canadian Plan
The Canadian Plan investment policy is to maximize long-term financial return commensurate with security and
minimizing risk. This is achieved by holding a portfolio of marketable investments that avoids over-concentration of
investment and spreads assets both over industry and geography. In setting investment strategy, the Company considered the
lowest risk strategy that it could adopt in relation to the Canadian Plan's liabilities and designed the asset allocation to achieve a
higher return while maintaining a cautious approach to meeting the plan's liabilities. The Company considered a full range of
asset classes, the risks and rewards of a range of alternative asset allocation strategies, the suitability of each asset class and the
need for appropriate diversification. The current strategy is to hold approximately 20% in Canadian equities, approximately
40% in non-Canadian equities and approximately 40% in bonds.
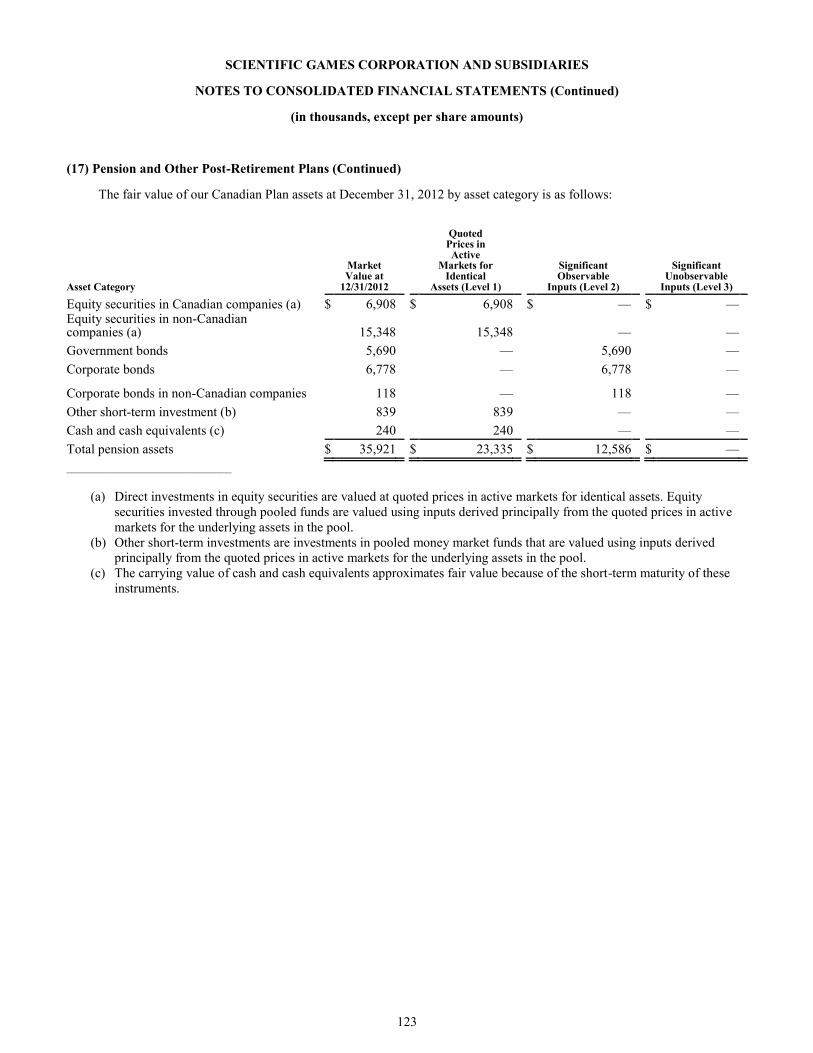
123
SCIENTIFIC GAMES CORPORATION AND SUBSIDIARIES
NOTES TO CONSOLIDATED FINANCIAL STATEMENTS (Continued)
(in thousands, except per share amounts)
(17) Pension and Other Post-Retirement Plans (Continued)
The fair value of our Canadian Plan assets at December 31, 2012 by asset category is as follows:
Asset Category
Market Value at
12/31/2012
Quoted Prices in Active
Markets for Identical
Assets (Level 1)
Significant Observable
Inputs (Level 2)
Significant Unobservable
Inputs (Level 3)
Equity securities in Canadian companies (a) $ 6,908 $ 6,908 $ — $ — Equity securities in non-Canadian companies (a) 15,348 15,348 — —
Government bonds 5,690 — 5,690 —
Corporate bonds 6,778 — 6,778 —
Corporate bonds in non-Canadian companies 118 — 118 —
Other short-term investment (b) 839 839 — —
Cash and cash equivalents (c) 240 240 — —
Total pension assets $ 35,921 $ 23,335 $ 12,586 $ —
_______________________________
(a) Direct investments in equity securities are valued at quoted prices in active markets for identical assets. Equity
securities invested through pooled funds are valued using inputs derived principally from the quoted prices in active
markets for the underlying assets in the pool.
(b) Other short-term investments are investments in pooled money market funds that are valued using inputs derived
principally from the quoted prices in active markets for the underlying assets in the pool.
(c) The carrying value of cash and cash equivalents approximates fair value because of the short-term maturity of these
instruments.
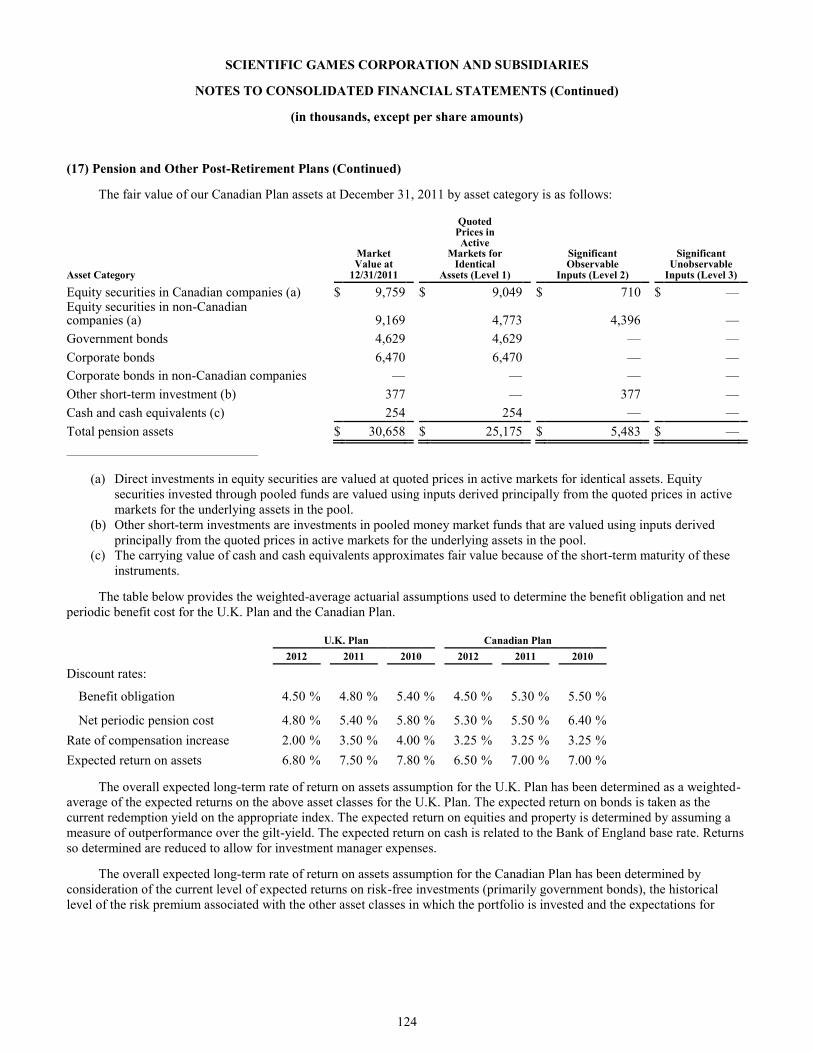
124
SCIENTIFIC GAMES CORPORATION AND SUBSIDIARIES
NOTES TO CONSOLIDATED FINANCIAL STATEMENTS (Continued)
(in thousands, except per share amounts)
(17) Pension and Other Post-Retirement Plans (Continued)
The fair value of our Canadian Plan assets at December 31, 2011 by asset category is as follows:
Asset Category
Market Value at
12/31/2011
Quoted Prices in Active
Markets for Identical
Assets (Level 1)
Significant Observable
Inputs (Level 2)
Significant Unobservable
Inputs (Level 3)
Equity securities in Canadian companies (a) $ 9,759 $ 9,049 $ 710 $ — Equity securities in non-Canadian companies (a) 9,169 4,773 4,396 —
Government bonds 4,629 4,629 — —
Corporate bonds 6,470 6,470 — —
Corporate bonds in non-Canadian companies — — — —
Other short-term investment (b) 377 — 377 —
Cash and cash equivalents (c) 254 254 — —
Total pension assets $ 30,658 $ 25,175 $ 5,483 $ —
____________________________________
(a) Direct investments in equity securities are valued at quoted prices in active markets for identical assets. Equity
securities invested through pooled funds are valued using inputs derived principally from the quoted prices in active
markets for the underlying assets in the pool.
(b) Other short-term investments are investments in pooled money market funds that are valued using inputs derived
principally from the quoted prices in active markets for the underlying assets in the pool.
(c) The carrying value of cash and cash equivalents approximates fair value because of the short-term maturity of these
instruments.
The table below provides the weighted-average actuarial assumptions used to determine the benefit obligation and net
periodic benefit cost for the U.K. Plan and the Canadian Plan.
U.K. Plan Canadian Plan
2012 2011 2010 2012 2011 2010
Discount rates:
Benefit obligation 4.50 % 4.80 % 5.40 % 4.50 % 5.30 % 5.50 %
Net periodic pension cost 4.80 % 5.40 % 5.80 % 5.30 % 5.50 % 6.40 %
Rate of compensation increase 2.00 % 3.50 % 4.00 % 3.25 % 3.25 % 3.25 %
Expected return on assets 6.80 % 7.50 % 7.80 % 6.50 % 7.00 % 7.00 %
The overall expected long-term rate of return on assets assumption for the U.K. Plan has been determined as a weighted-
average of the expected returns on the above asset classes for the U.K. Plan. The expected return on bonds is taken as the
current redemption yield on the appropriate index. The expected return on equities and property is determined by assuming a
measure of outperformance over the gilt-yield. The expected return on cash is related to the Bank of England base rate. Returns
so determined are reduced to allow for investment manager expenses.
The overall expected long-term rate of return on assets assumption for the Canadian Plan has been determined by
consideration of the current level of expected returns on risk-free investments (primarily government bonds), the historical
level of the risk premium associated with the other asset classes in which the portfolio is invested and the expectations for
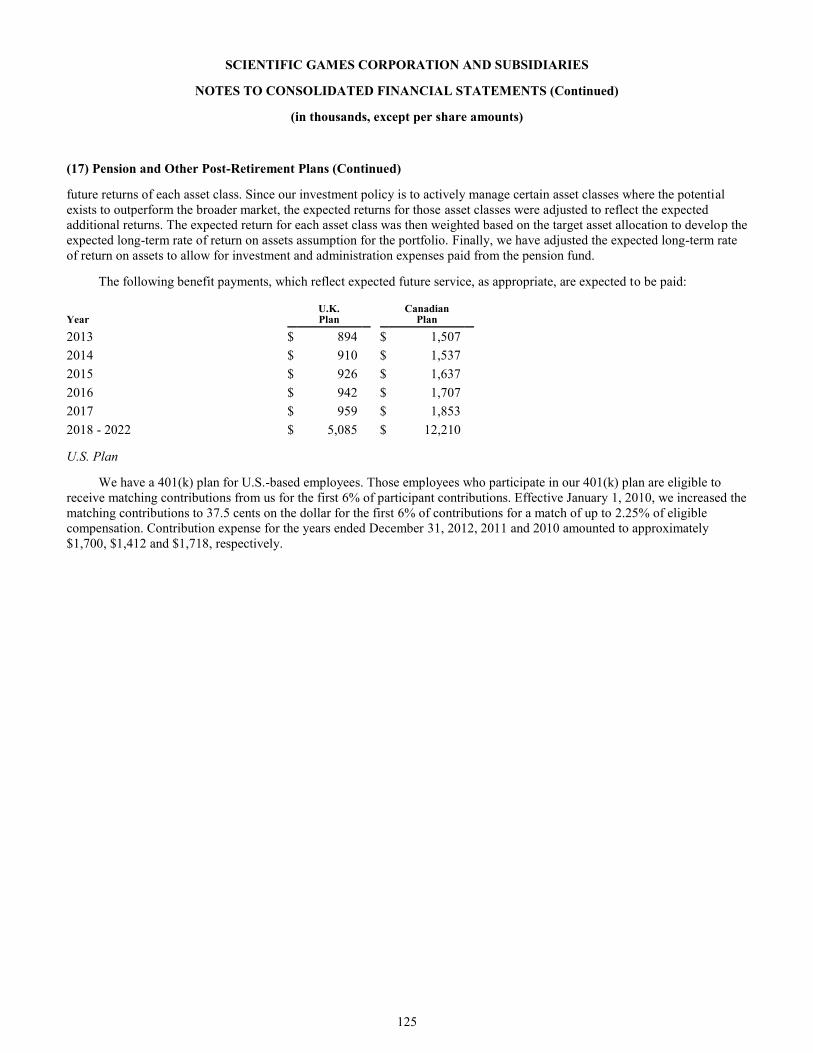
125
SCIENTIFIC GAMES CORPORATION AND SUBSIDIARIES
NOTES TO CONSOLIDATED FINANCIAL STATEMENTS (Continued)
(in thousands, except per share amounts)
(17) Pension and Other Post-Retirement Plans (Continued)
future returns of each asset class. Since our investment policy is to actively manage certain asset classes where the potential
exists to outperform the broader market, the expected returns for those asset classes were adjusted to reflect the expected
additional returns. The expected return for each asset class was then weighted based on the target asset allocation to develop the
expected long-term rate of return on assets assumption for the portfolio. Finally, we have adjusted the expected long-term rate
of return on assets to allow for investment and administration expenses paid from the pension fund.
The following benefit payments, which reflect expected future service, as appropriate, are expected to be paid:
Year U.K. Plan
Canadian Plan
2013 $ 894 $ 1,507
2014 $ 910 $ 1,537
2015 $ 926 $ 1,637
2016 $ 942 $ 1,707
2017 $ 959 $ 1,853
2018 - 2022 $ 5,085 $ 12,210
U.S. Plan
We have a 401(k) plan for U.S.-based employees. Those employees who participate in our 401(k) plan are eligible to
receive matching contributions from us for the first 6% of participant contributions. Effective January 1, 2010, we increased the
matching contributions to 37.5 cents on the dollar for the first 6% of contributions for a match of up to 2.25% of eligible
compensation. Contribution expense for the years ended December 31, 2012, 2011 and 2010 amounted to approximately
$1,700, $1,412 and $1,718, respectively.
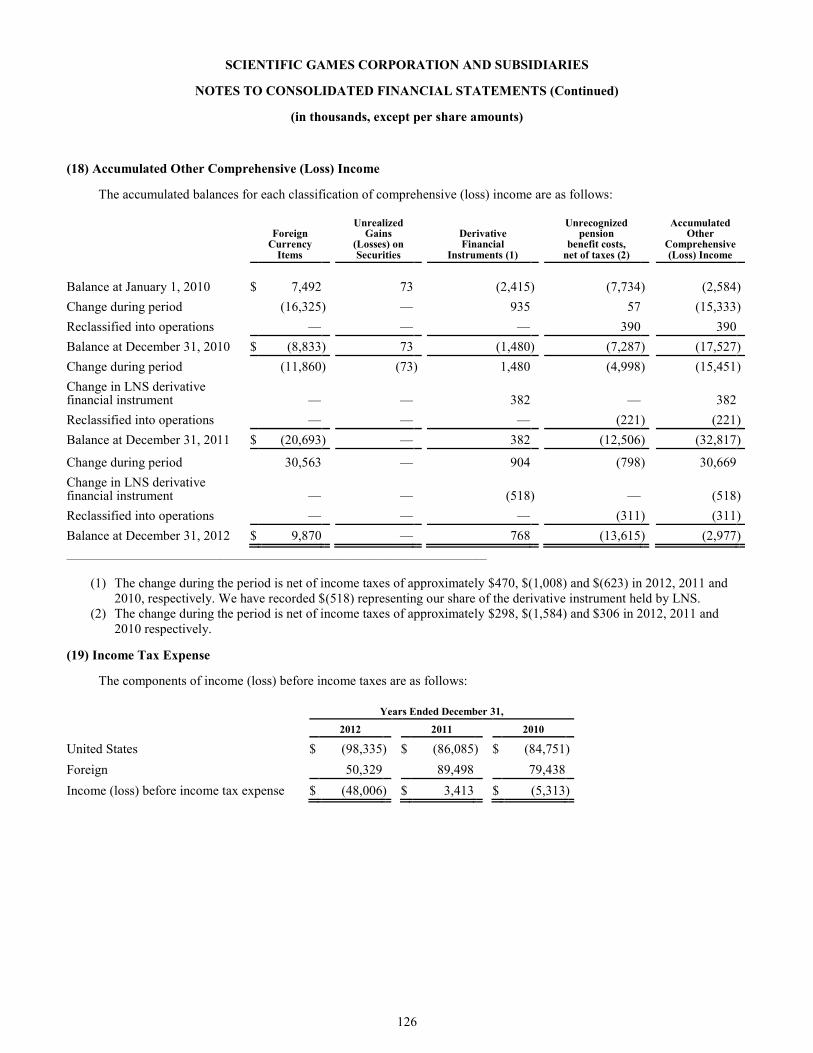
126
SCIENTIFIC GAMES CORPORATION AND SUBSIDIARIES
NOTES TO CONSOLIDATED FINANCIAL STATEMENTS (Continued)
(in thousands, except per share amounts)
(18) Accumulated Other Comprehensive (Loss) Income
The accumulated balances for each classification of comprehensive (loss) income are as follows:
Foreign Currency
Items
Unrealized Gains
(Losses) on Securities
Derivative Financial
Instruments (1)
Unrecognized pension
benefit costs, net of taxes (2)
Accumulated Other
Comprehensive (Loss) Income
Balance at January 1, 2010 $ 7,492 73 (2,415 ) (7,734 ) (2,584 )
Change during period (16,325 ) — 935 57 (15,333 )
Reclassified into operations — — — 390 390
Balance at December 31, 2010 $ (8,833 ) 73 (1,480 ) (7,287 ) (17,527 )
Change during period (11,860 ) (73 ) 1,480 (4,998 ) (15,451 )
Change in LNS derivative financial instrument — — 382 — 382
Reclassified into operations — — — (221 ) (221 )
Balance at December 31, 2011 $ (20,693 ) — 382 (12,506 ) (32,817 )
Change during period 30,563 — 904 (798 ) 30,669
Change in LNS derivative financial instrument — — (518 ) — (518 )
Reclassified into operations — — — (311 ) (311 )
Balance at December 31, 2012 $ 9,870 — 768 (13,615 ) (2,977 )
_______________________________________________________________________________
(1) The change during the period is net of income taxes of approximately $470, $(1,008) and $(623) in 2012, 2011 and
2010, respectively. We have recorded $(518) representing our share of the derivative instrument held by LNS.
(2) The change during the period is net of income taxes of approximately $298, $(1,584) and $306 in 2012, 2011 and
2010 respectively.
(19) Income Tax Expense
The components of income (loss) before income taxes are as follows:
Years Ended December 31,
2012 2011 2010
United States $ (98,335 ) $ (86,085 ) $ (84,751 )
Foreign 50,329 89,498 79,438
Income (loss) before income tax expense $ (48,006 ) $ 3,413 $ (5,313 )
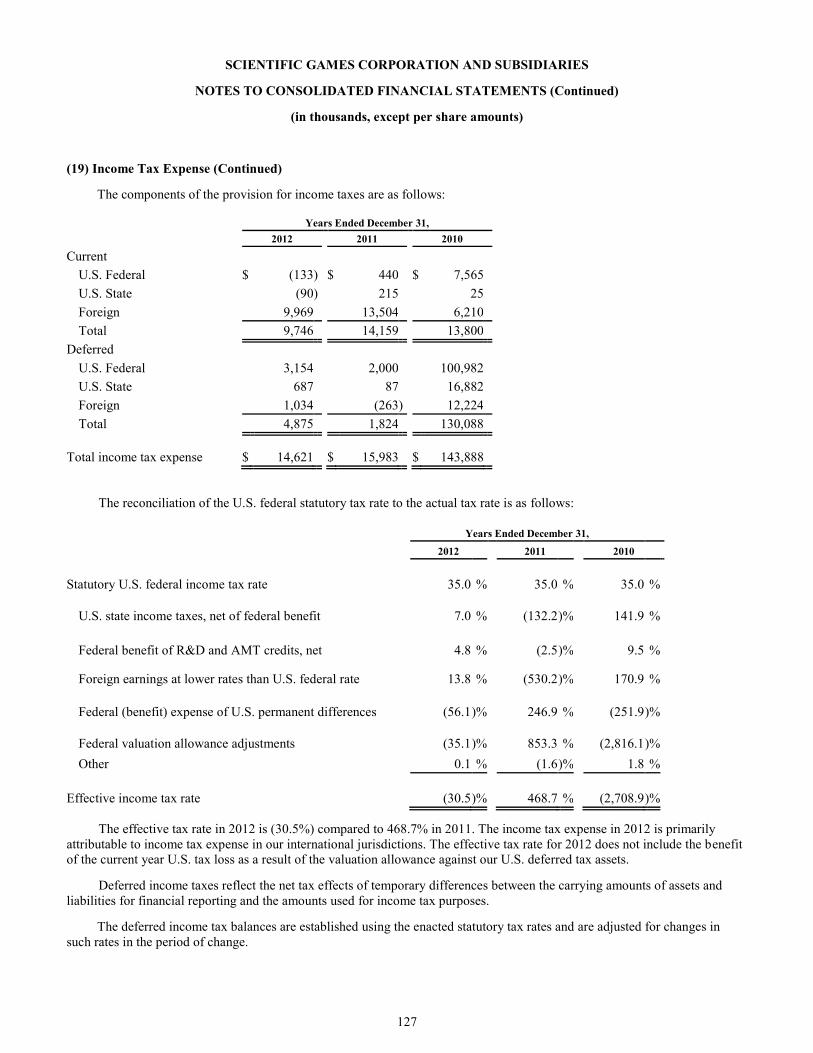
127
SCIENTIFIC GAMES CORPORATION AND SUBSIDIARIES
NOTES TO CONSOLIDATED FINANCIAL STATEMENTS (Continued)
(in thousands, except per share amounts)
(19) Income Tax Expense (Continued)
The components of the provision for income taxes are as follows:
Years Ended December 31,
2012 2011 2010
Current
U.S. Federal $ (133 ) $ 440 $ 7,565
U.S. State (90 ) 215 25
Foreign 9,969 13,504 6,210
Total 9,746 14,159 13,800
Deferred
U.S. Federal 3,154 2,000 100,982
U.S. State 687 87 16,882
Foreign 1,034 (263 ) 12,224
Total 4,875 1,824 130,088
Total income tax expense $ 14,621 $ 15,983 $ 143,888
The reconciliation of the U.S. federal statutory tax rate to the actual tax rate is as follows:
Years Ended December 31,
2012 2011 2010
Statutory U.S. federal income tax rate 35.0 % 35.0 % 35.0 %
U.S. state income taxes, net of federal benefit 7.0 % (132.2 )% 141.9 %
Federal benefit of R&D and AMT credits, net 4.8 % (2.5 )% 9.5 %
Foreign earnings at lower rates than U.S. federal rate 13.8 % (530.2 )% 170.9 %
Federal (benefit) expense of U.S. permanent differences (56.1 )% 246.9 % (251.9 )%
Federal valuation allowance adjustments (35.1 )% 853.3 % (2,816.1 )%
Other 0.1 % (1.6 )% 1.8 %
Effective income tax rate (30.5 )% 468.7 % (2,708.9 )%
The effective tax rate in 2012 is (30.5%) compared to 468.7% in 2011. The income tax expense in 2012 is primarily
attributable to income tax expense in our international jurisdictions. The effective tax rate for 2012 does not include the benefit
of the current year U.S. tax loss as a result of the valuation allowance against our U.S. deferred tax assets.
Deferred income taxes reflect the net tax effects of temporary differences between the carrying amounts of assets and
liabilities for financial reporting and the amounts used for income tax purposes.
The deferred income tax balances are established using the enacted statutory tax rates and are adjusted for changes in
such rates in the period of change.
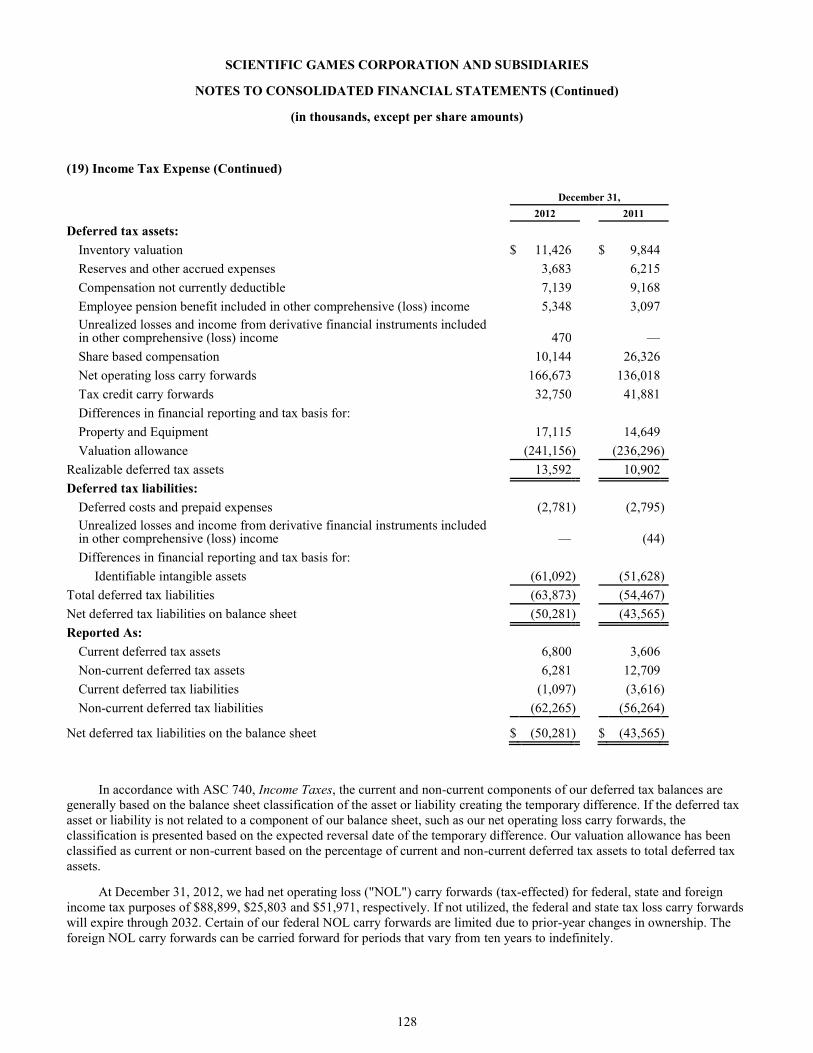
128
SCIENTIFIC GAMES CORPORATION AND SUBSIDIARIES
NOTES TO CONSOLIDATED FINANCIAL STATEMENTS (Continued)
(in thousands, except per share amounts)
(19) Income Tax Expense (Continued)
December 31,
2012 2011
Deferred tax assets:
Inventory valuation $ 11,426 $ 9,844
Reserves and other accrued expenses 3,683 6,215
Compensation not currently deductible 7,139 9,168
Employee pension benefit included in other comprehensive (loss) income 5,348 3,097
Unrealized losses and income from derivative financial instruments included in other comprehensive (loss) income 470 —
Share based compensation 10,144 26,326
Net operating loss carry forwards 166,673 136,018
Tax credit carry forwards 32,750 41,881
Differences in financial reporting and tax basis for:
Property and Equipment 17,115 14,649
Valuation allowance (241,156 ) (236,296 )
Realizable deferred tax assets 13,592 10,902
Deferred tax liabilities:
Deferred costs and prepaid expenses (2,781 ) (2,795 )
Unrealized losses and income from derivative financial instruments included in other comprehensive (loss) income — (44 )
Differences in financial reporting and tax basis for:
Identifiable intangible assets (61,092 ) (51,628 )
Total deferred tax liabilities (63,873 ) (54,467 )
Net deferred tax liabilities on balance sheet (50,281 ) (43,565 )
Reported As:
Current deferred tax assets 6,800 3,606
Non-current deferred tax assets 6,281 12,709
Current deferred tax liabilities (1,097 ) (3,616 )
Non-current deferred tax liabilities (62,265 ) (56,264 )
Net deferred tax liabilities on the balance sheet $ (50,281 ) $ (43,565 )
In accordance with ASC 740, Income Taxes, the current and non-current components of our deferred tax balances are
generally based on the balance sheet classification of the asset or liability creating the temporary difference. If the deferred tax
asset or liability is not related to a component of our balance sheet, such as our net operating loss carry forwards, the
classification is presented based on the expected reversal date of the temporary difference. Our valuation allowance has been
classified as current or non-current based on the percentage of current and non-current deferred tax assets to total deferred tax
assets.
At December 31, 2012, we had net operating loss ("NOL") carry forwards (tax-effected) for federal, state and foreign
income tax purposes of $88,899, $25,803 and $51,971, respectively. If not utilized, the federal and state tax loss carry forwards
will expire through 2032. Certain of our federal NOL carry forwards are limited due to prior-year changes in ownership. The
foreign NOL carry forwards can be carried forward for periods that vary from ten years to indefinitely.
129
SCIENTIFIC GAMES CORPORATION AND SUBSIDIARIES
NOTES TO CONSOLIDATED FINANCIAL STATEMENTS (Continued)
(in thousands, except per share amounts)
(19) Income Tax Expense (Continued)
We have foreign tax credit carry forwards of approximately $18,239 which if unutilized will expire through 2018,
research and development tax credit carry forwards of $9,550 which if unutilized will expire through 2031, alternative
minimum tax credit carry forwards of $2,107 which can be carried forward indefinitely, state tax credits of $2,094 which if
unutilized will expire through 2022, and other non-U.S. tax credits of $759 which can be carried forward indefinitely.
At December 31, 2012 and December 31, 2011, we established a valuation allowance of $241,156 and $236,296 against
the U.S. and foreign deferred tax assets that, in the judgment of management, are more likely than not to expire before they can
be utilized. In assessing the recoverability of our deferred tax assets, we analyzed all evidence, both positive and negative. We
considered, among other things, our deferred tax liabilities, our historical earnings and losses, projections of future income, and
tax-planning strategies available to us in the relevant jurisdiction.
At December 31, 2012 and December 31, 2011, we established valuation allowances of $144,264 and $146,681,
respectively, against the benefit of U.S. federal deferred tax assets and valuation allowances of $33,077 and $29,170,
respectively, against the benefit of state deferred tax assets.
At December 31, 2012 and 2011, we established valuation allowances of $18,239 and $30,067, respectively, against the
benefit of the deferred tax assets related to the U.S. foreign tax credit carry forwards. The decrease in the foreign tax credit
valuation allowance in 2012 is due to the Company's election to amend its 2008 U.S. federal income tax return and deduct
foreign taxes previously recorded as credits.
At December 31, 2012 and 2011, we established valuation allowances of $45,576 and $30,378, respectively, against the
benefit of the deferred tax assets related to foreign NOL carry forwards to measure them at their expected realizable value.
The net increase in the Company's total U.S. and foreign valuation allowances for 2012 and 2011 was $4,860 and $1,483,
respectively.
Deferred taxes have not been provided on the excess of book basis over tax basis in the shares of certain foreign
subsidiaries because these basis differences are not expected to reverse in the foreseeable future and are essentially permanent
in duration. Our intention is to continue to reinvest the earnings of our foreign subsidiaries indefinitely. The estimated
cumulative amount of earnings from foreign subsidiaries that are permanently invested outside of the U.S. is $265,474 as of
December 31, 2012.
Unrecognized Tax Benefits
The Company applies a recognition threshold and measurement attribute for the financial statement recognition and
measurement of a tax position taken or expected to be taken in a tax return. The Company recognizes the impact of a tax
position in the financial statements when the position is more likely than not of being sustained on audit based on the technical
merits of the position.
The total amount of unrecognized tax benefits as of December 31, 2012 was approximately $1,781. Of this amount,
approximately $1,272, if recognized, would be included in our statement of operations and have an impact on our effective tax
rate. The Company does not anticipate a material reduction of its liability for unrecognized tax benefits before December 31,
2013.
We recognize interest accrued for unrecognized tax benefits in interest expense and recognize penalties in income tax
expense. During the years ended December 31, 2012, 2011 and 2010, we recognized approximately $44, $67 and $102,
respectively, in interest and penalties. We had approximately $396 and $440 for the payment of interest and penalties accrued
at December 31, 2012 and 2011, respectively.
We and our subsidiaries file income tax returns in the U.S. federal jurisdiction and various states and foreign
jurisdictions. With few exceptions, we are no longer subject to U.S. federal, state and local, or non-U.S. income tax
examinations by tax authorities for years before 2009.
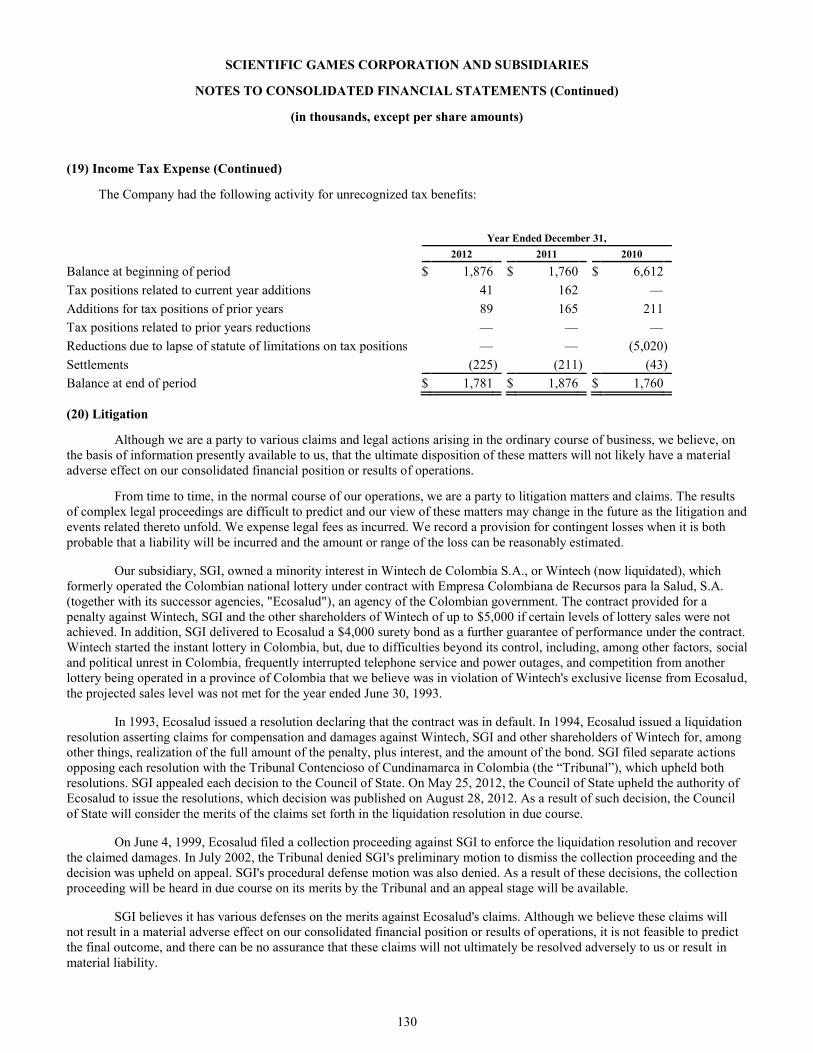
130
SCIENTIFIC GAMES CORPORATION AND SUBSIDIARIES
NOTES TO CONSOLIDATED FINANCIAL STATEMENTS (Continued)
(in thousands, except per share amounts)
(19) Income Tax Expense (Continued)
The Company had the following activity for unrecognized tax benefits:
Year Ended December 31,
2012 2011 2010
Balance at beginning of period $ 1,876 $ 1,760 $ 6,612
Tax positions related to current year additions 41 162 —
Additions for tax positions of prior years 89 165 211
Tax positions related to prior years reductions — — —
Reductions due to lapse of statute of limitations on tax positions — — (5,020 )
Settlements (225 ) (211 ) (43 )
Balance at end of period $ 1,781 $ 1,876 $ 1,760
(20) Litigation
Although we are a party to various claims and legal actions arising in the ordinary course of business, we believe, on
the basis of information presently available to us, that the ultimate disposition of these matters will not likely have a material
adverse effect on our consolidated financial position or results of operations.
From time to time, in the normal course of our operations, we are a party to litigation matters and claims. The results
of complex legal proceedings are difficult to predict and our view of these matters may change in the future as the litigation and
events related thereto unfold. We expense legal fees as incurred. We record a provision for contingent losses when it is both
probable that a liability will be incurred and the amount or range of the loss can be reasonably estimated.
Our subsidiary, SGI, owned a minority interest in Wintech de Colombia S.A., or Wintech (now liquidated), which
formerly operated the Colombian national lottery under contract with Empresa Colombiana de Recursos para la Salud, S.A.
(together with its successor agencies, "Ecosalud"), an agency of the Colombian government. The contract provided for a
penalty against Wintech, SGI and the other shareholders of Wintech of up to $5,000 if certain levels of lottery sales were not
achieved. In addition, SGI delivered to Ecosalud a $4,000 surety bond as a further guarantee of performance under the contract.
Wintech started the instant lottery in Colombia, but, due to difficulties beyond its control, including, among other factors, social
and political unrest in Colombia, frequently interrupted telephone service and power outages, and competition from another
lottery being operated in a province of Colombia that we believe was in violation of Wintech's exclusive license from Ecosalud,
the projected sales level was not met for the year ended June 30, 1993.
In 1993, Ecosalud issued a resolution declaring that the contract was in default. In 1994, Ecosalud issued a liquidation
resolution asserting claims for compensation and damages against Wintech, SGI and other shareholders of Wintech for, among
other things, realization of the full amount of the penalty, plus interest, and the amount of the bond. SGI filed separate actions
opposing each resolution with the Tribunal Contencioso of Cundinamarca in Colombia (the “Tribunal”), which upheld both
resolutions. SGI appealed each decision to the Council of State. On May 25, 2012, the Council of State upheld the authority of
Ecosalud to issue the resolutions, which decision was published on August 28, 2012. As a result of such decision, the Council
of State will consider the merits of the claims set forth in the liquidation resolution in due course.
On June 4, 1999, Ecosalud filed a collection proceeding against SGI to enforce the liquidation resolution and recover
the claimed damages. In July 2002, the Tribunal denied SGI's preliminary motion to dismiss the collection proceeding and the
decision was upheld on appeal. SGI's procedural defense motion was also denied. As a result of these decisions, the collection
proceeding will be heard in due course on its merits by the Tribunal and an appeal stage will be available.
SGI believes it has various defenses on the merits against Ecosalud's claims. Although we believe these claims will
not result in a material adverse effect on our consolidated financial position or results of operations, it is not feasible to predict
the final outcome, and there can be no assurance that these claims will not ultimately be resolved adversely to us or result in
material liability.
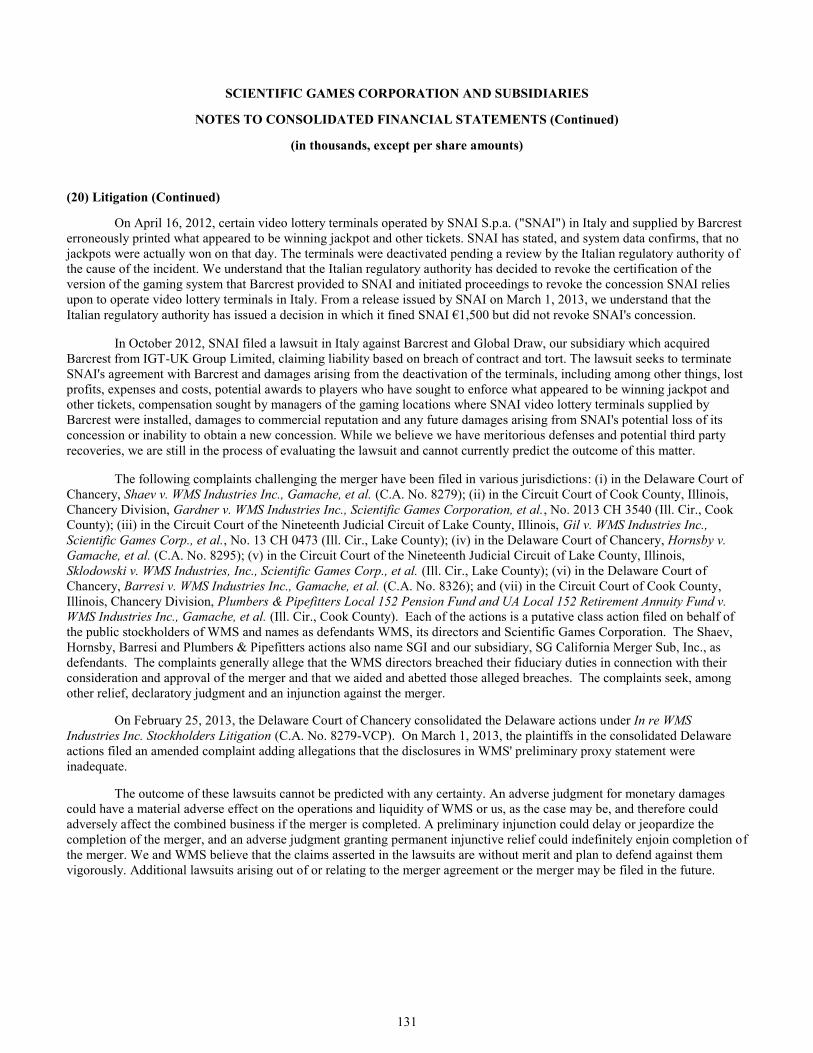
131
SCIENTIFIC GAMES CORPORATION AND SUBSIDIARIES
NOTES TO CONSOLIDATED FINANCIAL STATEMENTS (Continued)
(in thousands, except per share amounts)
(20) Litigation (Continued)
On April 16, 2012, certain video lottery terminals operated by SNAI S.p.a. ("SNAI") in Italy and supplied by Barcrest
erroneously printed what appeared to be winning jackpot and other tickets. SNAI has stated, and system data confirms, that no
jackpots were actually won on that day. The terminals were deactivated pending a review by the Italian regulatory authority of
the cause of the incident. We understand that the Italian regulatory authority has decided to revoke the certification of the
version of the gaming system that Barcrest provided to SNAI and initiated proceedings to revoke the concession SNAI relies
upon to operate video lottery terminals in Italy. From a release issued by SNAI on March 1, 2013, we understand that the
Italian regulatory authority has issued a decision in which it fined SNAI €1,500 but did not revoke SNAI's concession.
In October 2012, SNAI filed a lawsuit in Italy against Barcrest and Global Draw, our subsidiary which acquired
Barcrest from IGT-UK Group Limited, claiming liability based on breach of contract and tort. The lawsuit seeks to terminate
SNAI's agreement with Barcrest and damages arising from the deactivation of the terminals, including among other things, lost
profits, expenses and costs, potential awards to players who have sought to enforce what appeared to be winning jackpot and
other tickets, compensation sought by managers of the gaming locations where SNAI video lottery terminals supplied by
Barcrest were installed, damages to commercial reputation and any future damages arising from SNAI's potential loss of its
concession or inability to obtain a new concession. While we believe we have meritorious defenses and potential third party
recoveries, we are still in the process of evaluating the lawsuit and cannot currently predict the outcome of this matter.
The following complaints challenging the merger have been filed in various jurisdictions: (i) in the Delaware Court of
Chancery, Shaev v. WMS Industries Inc., Gamache, et al. (C.A. No. 8279); (ii) in the Circuit Court of Cook County, Illinois,
Chancery Division, Gardner v. WMS Industries Inc., Scientific Games Corporation, et al., No. 2013 CH 3540 (Ill. Cir., Cook
County); (iii) in the Circuit Court of the Nineteenth Judicial Circuit of Lake County, Illinois, Gil v. WMS Industries Inc.,
Scientific Games Corp., et al., No. 13 CH 0473 (Ill. Cir., Lake County); (iv) in the Delaware Court of Chancery, Hornsby v.
Gamache, et al. (C.A. No. 8295); (v) in the Circuit Court of the Nineteenth Judicial Circuit of Lake County, Illinois,
Sklodowski v. WMS Industries, Inc., Scientific Games Corp., et al. (Ill. Cir., Lake County); (vi) in the Delaware Court of
Chancery, Barresi v. WMS Industries Inc., Gamache, et al. (C.A. No. 8326); and (vii) in the Circuit Court of Cook County,
Illinois, Chancery Division, Plumbers & Pipefitters Local 152 Pension Fund and UA Local 152 Retirement Annuity Fund v.
WMS Industries Inc., Gamache, et al. (Ill. Cir., Cook County). Each of the actions is a putative class action filed on behalf of
the public stockholders of WMS and names as defendants WMS, its directors and Scientific Games Corporation. The Shaev,
Hornsby, Barresi and Plumbers & Pipefitters actions also name SGI and our subsidiary, SG California Merger Sub, Inc., as
defendants. The complaints generally allege that the WMS directors breached their fiduciary duties in connection with their
consideration and approval of the merger and that we aided and abetted those alleged breaches. The complaints seek, among
other relief, declaratory judgment and an injunction against the merger.
On February 25, 2013, the Delaware Court of Chancery consolidated the Delaware actions under In re WMS
Industries Inc. Stockholders Litigation (C.A. No. 8279-VCP). On March 1, 2013, the plaintiffs in the consolidated Delaware
actions filed an amended complaint adding allegations that the disclosures in WMS' preliminary proxy statement were
inadequate.
The outcome of these lawsuits cannot be predicted with any certainty. An adverse judgment for monetary damages
could have a material adverse effect on the operations and liquidity of WMS or us, as the case may be, and therefore could
adversely affect the combined business if the merger is completed. A preliminary injunction could delay or jeopardize the
completion of the merger, and an adverse judgment granting permanent injunctive relief could indefinitely enjoin completion of
the merger. We and WMS believe that the claims asserted in the lawsuits are without merit and plan to defend against them
vigorously. Additional lawsuits arising out of or relating to the merger agreement or the merger may be filed in the future.
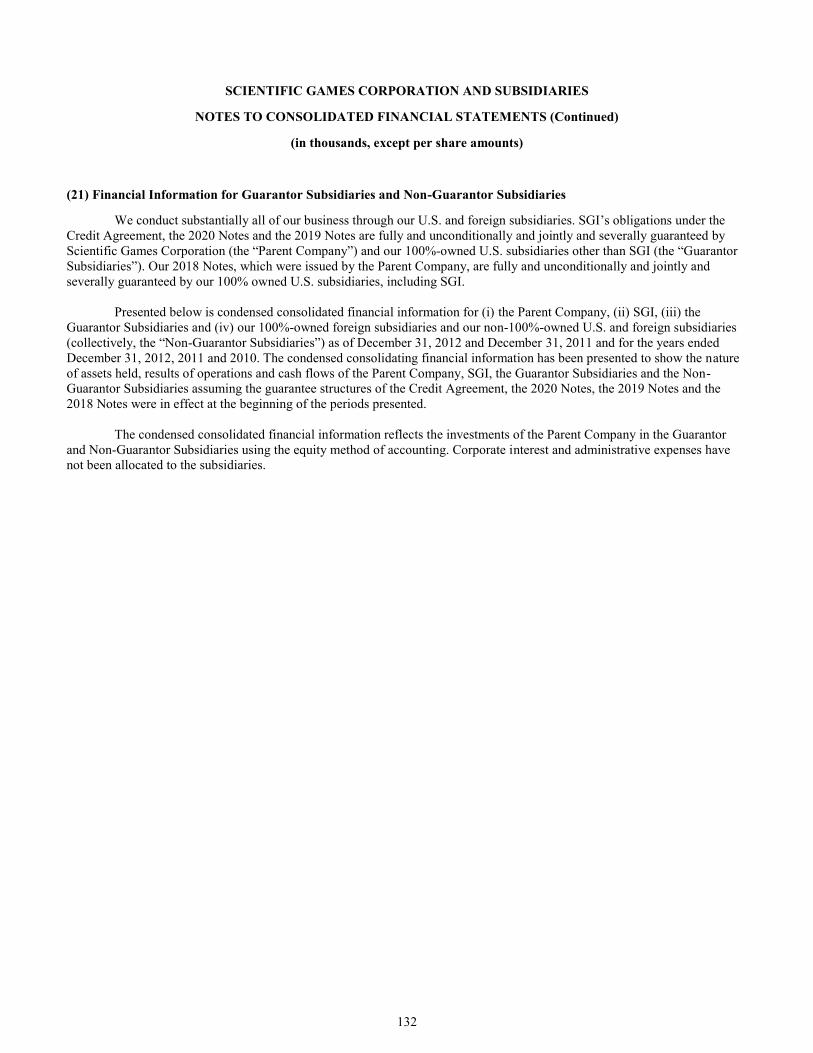
132
SCIENTIFIC GAMES CORPORATION AND SUBSIDIARIES
NOTES TO CONSOLIDATED FINANCIAL STATEMENTS (Continued)
(in thousands, except per share amounts)
(21) Financial Information for Guarantor Subsidiaries and Non-Guarantor Subsidiaries
We conduct substantially all of our business through our U.S. and foreign subsidiaries. SGI’s obligations under the
Credit Agreement, the 2020 Notes and the 2019 Notes are fully and unconditionally and jointly and severally guaranteed by
Scientific Games Corporation (the “Parent Company”) and our 100%-owned U.S. subsidiaries other than SGI (the “Guarantor
Subsidiaries”). Our 2018 Notes, which were issued by the Parent Company, are fully and unconditionally and jointly and
severally guaranteed by our 100% owned U.S. subsidiaries, including SGI.
Presented below is condensed consolidated financial information for (i) the Parent Company, (ii) SGI, (iii) the
Guarantor Subsidiaries and (iv) our 100%-owned foreign subsidiaries and our non-100%-owned U.S. and foreign subsidiaries
(collectively, the “Non-Guarantor Subsidiaries”) as of December 31, 2012 and December 31, 2011 and for the years ended
December 31, 2012, 2011 and 2010. The condensed consolidating financial information has been presented to show the nature
of assets held, results of operations and cash flows of the Parent Company, SGI, the Guarantor Subsidiaries and the Non-
Guarantor Subsidiaries assuming the guarantee structures of the Credit Agreement, the 2020 Notes, the 2019 Notes and the
2018 Notes were in effect at the beginning of the periods presented.
The condensed consolidated financial information reflects the investments of the Parent Company in the Guarantor
and Non-Guarantor Subsidiaries using the equity method of accounting. Corporate interest and administrative expenses have
not been allocated to the subsidiaries.
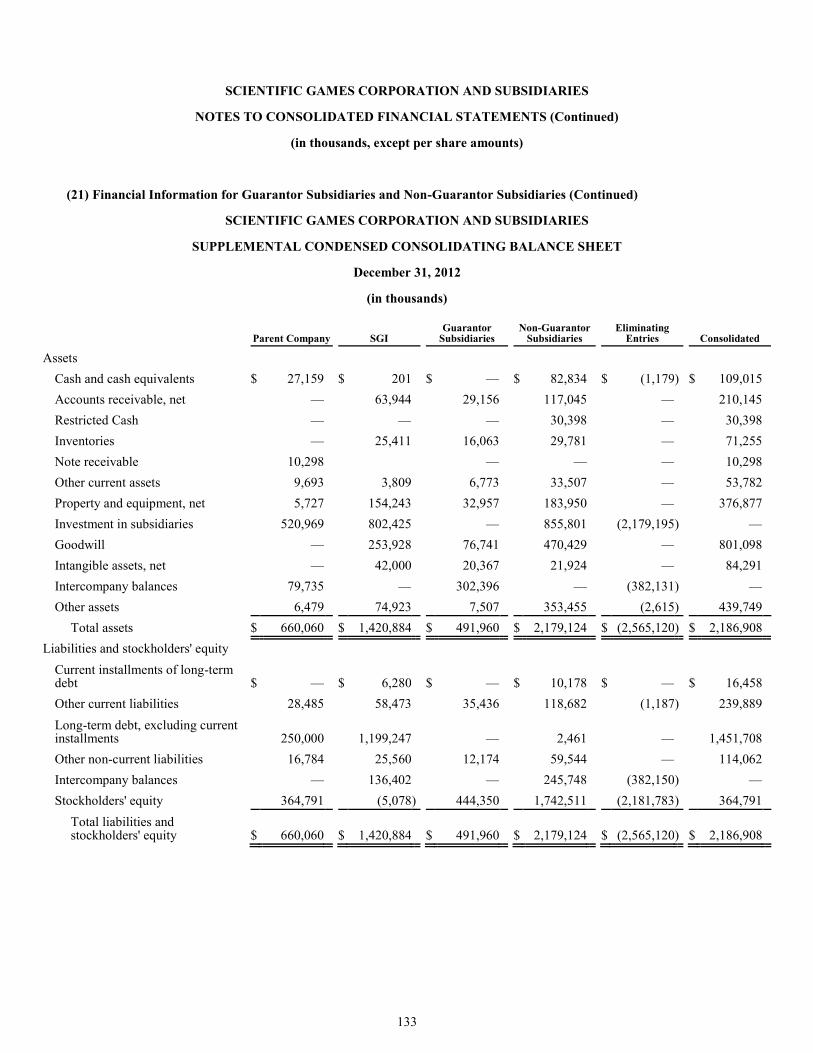
133
SCIENTIFIC GAMES CORPORATION AND SUBSIDIARIES
NOTES TO CONSOLIDATED FINANCIAL STATEMENTS (Continued)
(in thousands, except per share amounts)
(21) Financial Information for Guarantor Subsidiaries and Non-Guarantor Subsidiaries (Continued)
SCIENTIFIC GAMES CORPORATION AND SUBSIDIARIES
SUPPLEMENTAL CONDENSED CONSOLIDATING BALANCE SHEET
December 31, 2012
(in thousands)
Parent Company SGI Guarantor
Subsidiaries Non-Guarantor
Subsidiaries Eliminating
Entries Consolidated
Assets
Cash and cash equivalents $ 27,159 $ 201 $ — $ 82,834 $ (1,179 ) $ 109,015
Accounts receivable, net — 63,944 29,156 117,045 — 210,145
Restricted Cash — — — 30,398 — 30,398
Inventories — 25,411 16,063 29,781 — 71,255
Note receivable 10,298 — — — 10,298
Other current assets 9,693 3,809 6,773 33,507 — 53,782
Property and equipment, net 5,727 154,243 32,957 183,950 — 376,877
Investment in subsidiaries 520,969 802,425 — 855,801 (2,179,195 ) —
Goodwill — 253,928 76,741 470,429 — 801,098
Intangible assets, net — 42,000 20,367 21,924 — 84,291
Intercompany balances 79,735 — 302,396 — (382,131 ) —
Other assets 6,479 74,923 7,507 353,455 (2,615 ) 439,749
Total assets $ 660,060 $ 1,420,884 $ 491,960 $ 2,179,124 $ (2,565,120 ) $ 2,186,908
Liabilities and stockholders' equity
Current installments of long-term debt $ — $ 6,280 $ — $ 10,178 $ — $ 16,458
Other current liabilities 28,485 58,473 35,436 118,682 (1,187 ) 239,889
Long-term debt, excluding current installments 250,000 1,199,247 — 2,461 — 1,451,708
Other non-current liabilities 16,784 25,560 12,174 59,544 — 114,062
Intercompany balances — 136,402 — 245,748 (382,150 ) —
Stockholders' equity 364,791 (5,078 ) 444,350 1,742,511 (2,181,783 ) 364,791
Total liabilities and stockholders' equity $ 660,060 $ 1,420,884 $ 491,960 $ 2,179,124 $ (2,565,120 ) $ 2,186,908
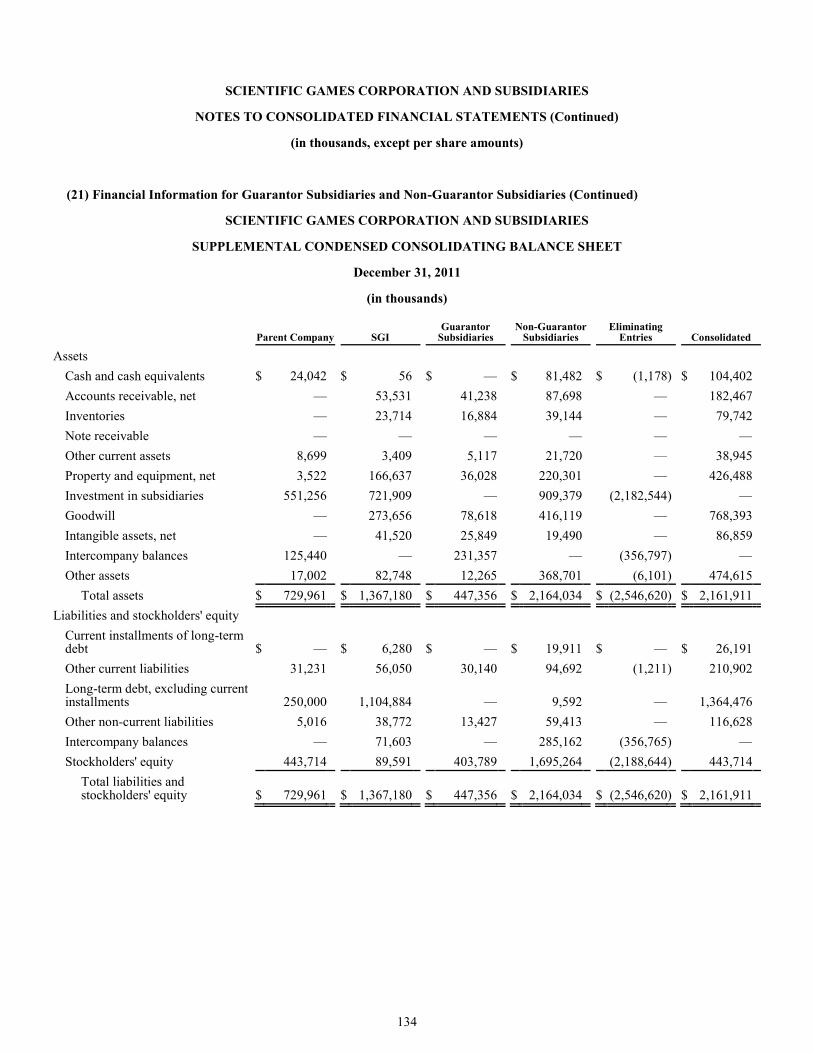
134
SCIENTIFIC GAMES CORPORATION AND SUBSIDIARIES
NOTES TO CONSOLIDATED FINANCIAL STATEMENTS (Continued)
(in thousands, except per share amounts)
(21) Financial Information for Guarantor Subsidiaries and Non-Guarantor Subsidiaries (Continued)
SCIENTIFIC GAMES CORPORATION AND SUBSIDIARIES
SUPPLEMENTAL CONDENSED CONSOLIDATING BALANCE SHEET
December 31, 2011
(in thousands)
Parent Company SGI Guarantor
Subsidiaries Non-Guarantor
Subsidiaries Eliminating
Entries Consolidated
Assets
Cash and cash equivalents $ 24,042 $ 56 $ — $ 81,482 $ (1,178 ) $ 104,402
Accounts receivable, net — 53,531 41,238 87,698 — 182,467
Inventories — 23,714 16,884 39,144 — 79,742
Note receivable — — — — — —
Other current assets 8,699 3,409 5,117 21,720 — 38,945
Property and equipment, net 3,522 166,637 36,028 220,301 — 426,488
Investment in subsidiaries 551,256 721,909 — 909,379 (2,182,544 ) —
Goodwill — 273,656 78,618 416,119 — 768,393
Intangible assets, net — 41,520 25,849 19,490 — 86,859
Intercompany balances 125,440 — 231,357 — (356,797 ) —
Other assets 17,002 82,748 12,265 368,701 (6,101 ) 474,615
Total assets $ 729,961 $ 1,367,180 $ 447,356 $ 2,164,034 $ (2,546,620 ) $ 2,161,911
Liabilities and stockholders' equity
Current installments of long-term debt $ — $ 6,280 $ — $ 19,911 $ — $ 26,191
Other current liabilities 31,231 56,050 30,140 94,692 (1,211 ) 210,902
Long-term debt, excluding current installments 250,000 1,104,884 — 9,592 — 1,364,476
Other non-current liabilities 5,016 38,772 13,427 59,413 — 116,628
Intercompany balances — 71,603 — 285,162 (356,765 ) —
Stockholders' equity 443,714 89,591 403,789 1,695,264 (2,188,644 ) 443,714
Total liabilities and stockholders' equity $ 729,961 $ 1,367,180 $ 447,356 $ 2,164,034 $ (2,546,620 ) $ 2,161,911
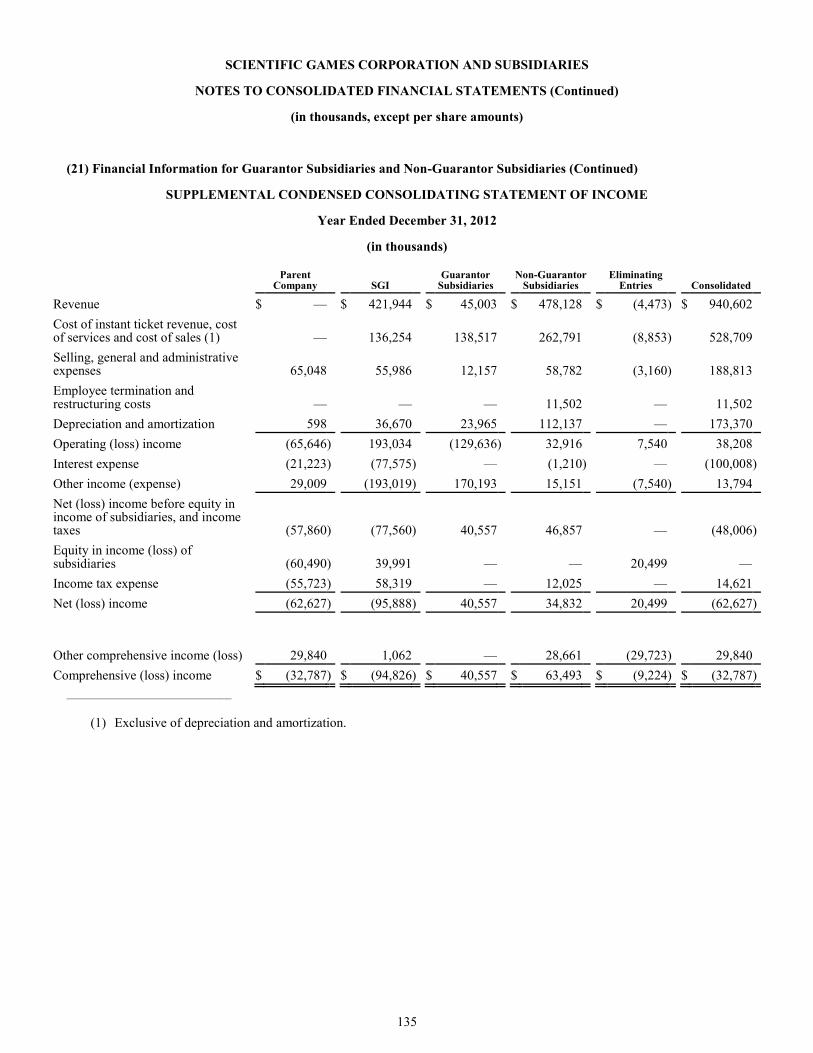
135
SCIENTIFIC GAMES CORPORATION AND SUBSIDIARIES
NOTES TO CONSOLIDATED FINANCIAL STATEMENTS (Continued)
(in thousands, except per share amounts)
(21) Financial Information for Guarantor Subsidiaries and Non-Guarantor Subsidiaries (Continued)
SUPPLEMENTAL CONDENSED CONSOLIDATING STATEMENT OF INCOME
Year Ended December 31, 2012
(in thousands)
Parent
Company SGI Guarantor
Subsidiaries Non-Guarantor
Subsidiaries Eliminating
Entries Consolidated
Revenue $ — $ 421,944 $ 45,003 $ 478,128 $ (4,473 ) $ 940,602
Cost of instant ticket revenue, cost of services and cost of sales (1) — 136,254 138,517 262,791 (8,853 ) 528,709
Selling, general and administrative expenses 65,048 55,986 12,157 58,782 (3,160 ) 188,813
Employee termination and restructuring costs — — — 11,502 — 11,502
Depreciation and amortization 598 36,670 23,965 112,137 — 173,370
Operating (loss) income (65,646 ) 193,034 (129,636 ) 32,916 7,540 38,208
Interest expense (21,223 ) (77,575 ) — (1,210 ) — (100,008 )
Other income (expense) 29,009 (193,019 ) 170,193 15,151 (7,540 ) 13,794
Net (loss) income before equity in income of subsidiaries, and income taxes (57,860 ) (77,560 ) 40,557 46,857 — (48,006 )
Equity in income (loss) of subsidiaries (60,490 ) 39,991 — — 20,499 —
Income tax expense (55,723 ) 58,319 — 12,025 — 14,621
Net (loss) income (62,627 ) (95,888 ) 40,557 34,832 20,499 (62,627 )
Other comprehensive income (loss) 29,840 1,062 — 28,661 (29,723 ) 29,840
Comprehensive (loss) income $ (32,787 ) $ (94,826 ) $ 40,557 $ 63,493 $ (9,224 ) $ (32,787 )
_______________________________
(1) Exclusive of depreciation and amortization.
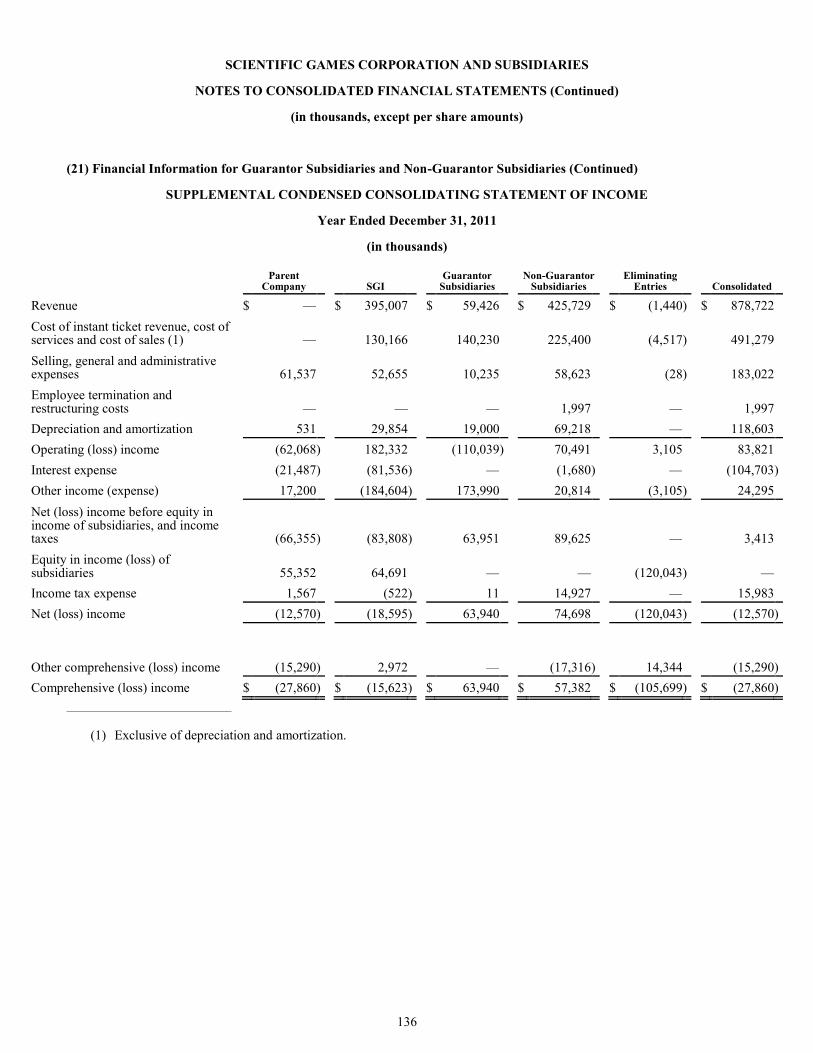
136
SCIENTIFIC GAMES CORPORATION AND SUBSIDIARIES
NOTES TO CONSOLIDATED FINANCIAL STATEMENTS (Continued)
(in thousands, except per share amounts)
(21) Financial Information for Guarantor Subsidiaries and Non-Guarantor Subsidiaries (Continued)
SUPPLEMENTAL CONDENSED CONSOLIDATING STATEMENT OF INCOME
Year Ended December 31, 2011
(in thousands)
Parent
Company SGI Guarantor
Subsidiaries Non-Guarantor
Subsidiaries Eliminating
Entries Consolidated
Revenue $ — $ 395,007 $ 59,426 $ 425,729 $ (1,440 ) $ 878,722
Cost of instant ticket revenue, cost of services and cost of sales (1) — 130,166 140,230 225,400 (4,517 ) 491,279
Selling, general and administrative expenses 61,537 52,655 10,235 58,623 (28 ) 183,022
Employee termination and restructuring costs — — — 1,997 — 1,997
Depreciation and amortization 531 29,854 19,000 69,218 — 118,603
Operating (loss) income (62,068 ) 182,332 (110,039 ) 70,491 3,105 83,821
Interest expense (21,487 ) (81,536 ) — (1,680 ) — (104,703 )
Other income (expense) 17,200 (184,604 ) 173,990 20,814 (3,105 ) 24,295
Net (loss) income before equity in income of subsidiaries, and income taxes (66,355 ) (83,808 ) 63,951 89,625 — 3,413
Equity in income (loss) of subsidiaries 55,352 64,691 — — (120,043 ) —
Income tax expense 1,567 (522 ) 11 14,927 — 15,983
Net (loss) income (12,570 ) (18,595 ) 63,940 74,698 (120,043 ) (12,570 )
Other comprehensive (loss) income (15,290 ) 2,972 — (17,316 ) 14,344 (15,290 )
Comprehensive (loss) income $ (27,860 ) $ (15,623 ) $ 63,940 $ 57,382 $ (105,699 ) $ (27,860 )
_______________________________
(1) Exclusive of depreciation and amortization.
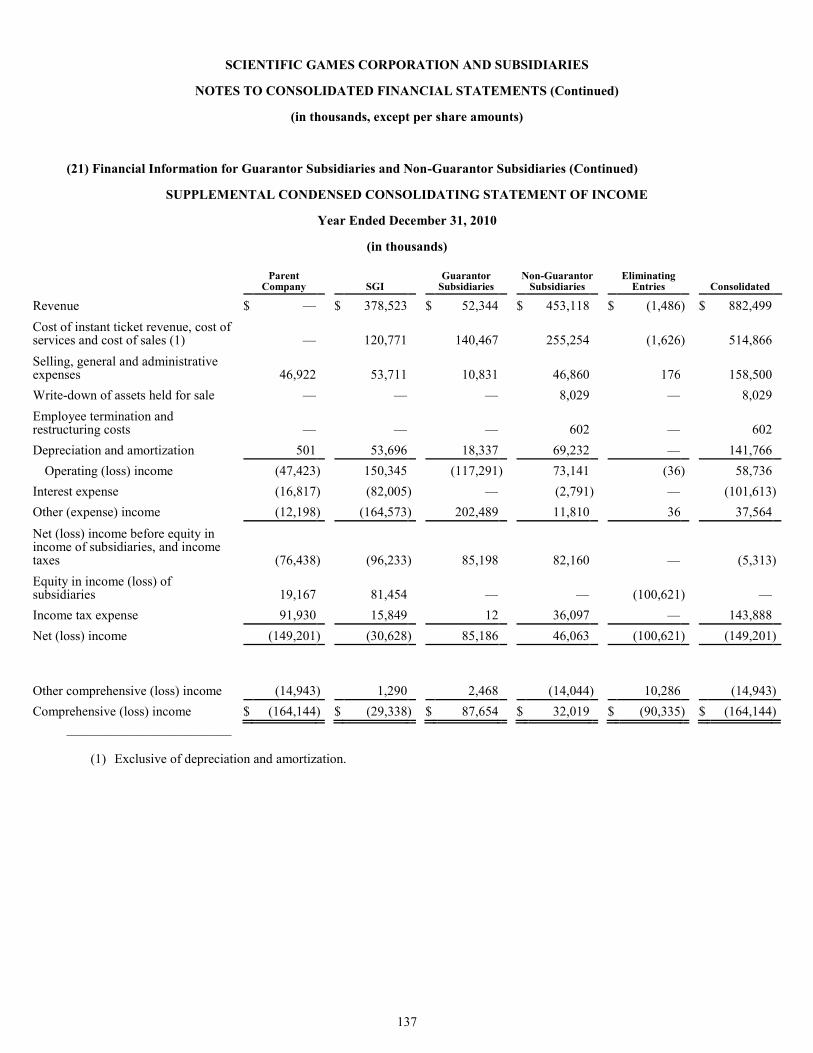
137
SCIENTIFIC GAMES CORPORATION AND SUBSIDIARIES
NOTES TO CONSOLIDATED FINANCIAL STATEMENTS (Continued)
(in thousands, except per share amounts)
(21) Financial Information for Guarantor Subsidiaries and Non-Guarantor Subsidiaries (Continued)
SUPPLEMENTAL CONDENSED CONSOLIDATING STATEMENT OF INCOME
Year Ended December 31, 2010
(in thousands)
Parent
Company SGI Guarantor
Subsidiaries Non-Guarantor
Subsidiaries Eliminating
Entries Consolidated
Revenue $ — $ 378,523 $ 52,344 $ 453,118 $ (1,486 ) $ 882,499
Cost of instant ticket revenue, cost of services and cost of sales (1) — 120,771 140,467 255,254 (1,626 ) 514,866
Selling, general and administrative expenses 46,922 53,711 10,831 46,860 176 158,500
Write-down of assets held for sale — — — 8,029 — 8,029
Employee termination and restructuring costs — — — 602 — 602
Depreciation and amortization 501 53,696 18,337 69,232 — 141,766
Operating (loss) income (47,423 ) 150,345 (117,291 ) 73,141 (36 ) 58,736
Interest expense (16,817 ) (82,005 ) — (2,791 ) — (101,613 )
Other (expense) income (12,198 ) (164,573 ) 202,489 11,810 36 37,564
Net (loss) income before equity in income of subsidiaries, and income taxes (76,438 ) (96,233 ) 85,198 82,160 — (5,313 )
Equity in income (loss) of subsidiaries 19,167 81,454 — — (100,621 ) —
Income tax expense 91,930 15,849 12 36,097 — 143,888
Net (loss) income (149,201 ) (30,628 ) 85,186 46,063 (100,621 ) (149,201 )
Other comprehensive (loss) income (14,943 ) 1,290 2,468 (14,044 ) 10,286 (14,943 )
Comprehensive (loss) income $ (164,144 ) $ (29,338 ) $ 87,654 $ 32,019 $ (90,335 ) $ (164,144 )
_______________________________
(1) Exclusive of depreciation and amortization.
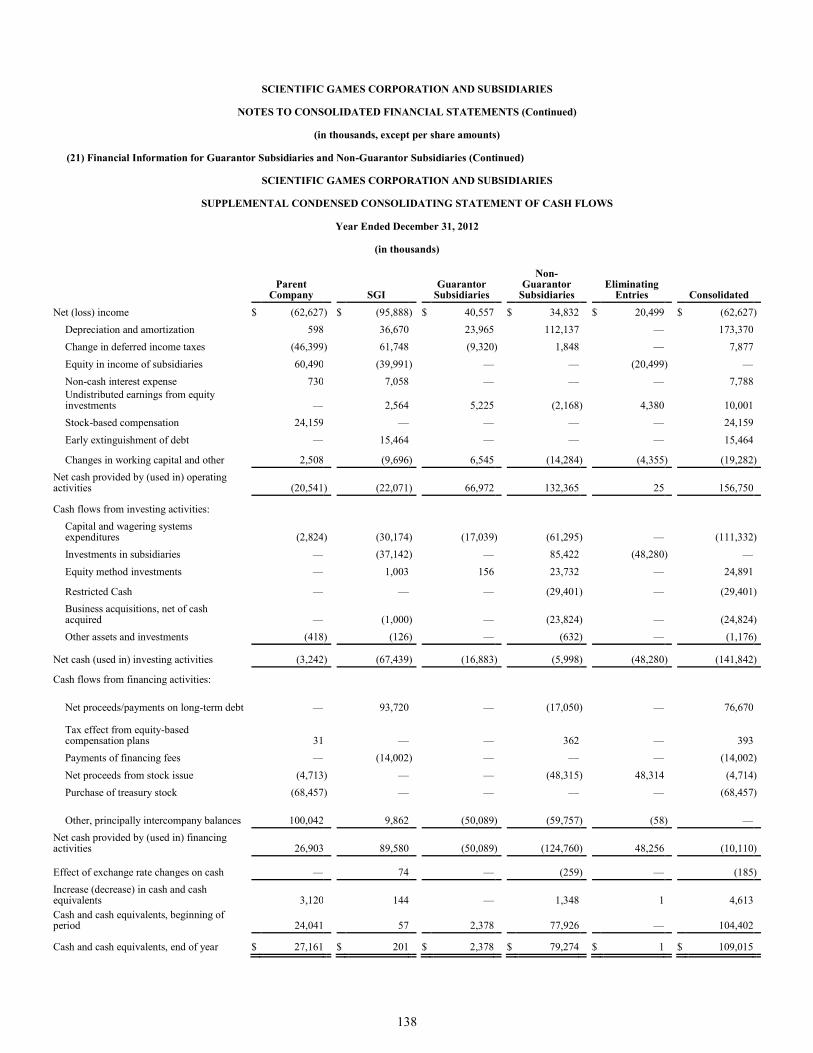
138
SCIENTIFIC GAMES CORPORATION AND SUBSIDIARIES
NOTES TO CONSOLIDATED FINANCIAL STATEMENTS (Continued)
(in thousands, except per share amounts)
(21) Financial Information for Guarantor Subsidiaries and Non-Guarantor Subsidiaries (Continued)
SCIENTIFIC GAMES CORPORATION AND SUBSIDIARIES
SUPPLEMENTAL CONDENSED CONSOLIDATING STATEMENT OF CASH FLOWS
Year Ended December 31, 2012
(in thousands)
Parent
Company SGI Guarantor
Subsidiaries
Non- Guarantor
Subsidiaries Eliminating
Entries Consolidated
Net (loss) income $ (62,627 ) $ (95,888 ) $ 40,557 $ 34,832 $ 20,499 $ (62,627 )
Depreciation and amortization 598 36,670 23,965 112,137 — 173,370
Change in deferred income taxes (46,399 ) 61,748 (9,320 ) 1,848 — 7,877
Equity in income of subsidiaries 60,490 (39,991 ) — — (20,499 ) —
Non-cash interest expense 730 7,058 — — — 7,788 Undistributed earnings from equity investments — 2,564 5,225 (2,168 ) 4,380 10,001
Stock-based compensation 24,159 — — — — 24,159
Early extinguishment of debt — 15,464 — — — 15,464
Changes in working capital and other 2,508 (9,696 ) 6,545 (14,284 ) (4,355 ) (19,282 )
Net cash provided by (used in) operating activities (20,541 ) (22,071 ) 66,972 132,365 25 156,750
Cash flows from investing activities:
Capital and wagering systems expenditures (2,824 ) (30,174 ) (17,039 ) (61,295 ) — (111,332 )
Investments in subsidiaries — (37,142 ) — 85,422 (48,280 ) —
Equity method investments — 1,003 156 23,732 — 24,891
Restricted Cash — — — (29,401 ) — (29,401 )
Business acquisitions, net of cash acquired — (1,000 ) — (23,824 ) — (24,824 )
Other assets and investments (418 ) (126 ) — (632 ) — (1,176 )
Net cash (used in) investing activities (3,242 ) (67,439 ) (16,883 ) (5,998 ) (48,280 ) (141,842 )
Cash flows from financing activities:
Net proceeds/payments on long-term debt — 93,720 — (17,050 ) — 76,670
Tax effect from equity-based compensation plans 31 — — 362 — 393
Payments of financing fees — (14,002 ) — — — (14,002 )
Net proceeds from stock issue (4,713 ) — — (48,315 ) 48,314 (4,714 )
Purchase of treasury stock (68,457 ) — — — — (68,457 )
Other, principally intercompany balances 100,042 9,862 (50,089 ) (59,757 ) (58 ) —
Net cash provided by (used in) financing activities 26,903 89,580 (50,089 ) (124,760 ) 48,256 (10,110 )
Effect of exchange rate changes on cash — 74 — (259 ) — (185 )
Increase (decrease) in cash and cash equivalents 3,120 144 — 1,348 1 4,613 Cash and cash equivalents, beginning of period 24,041 57 2,378 77,926 — 104,402
Cash and cash equivalents, end of year $ 27,161 $ 201 $ 2,378 $ 79,274 $ 1 $ 109,015
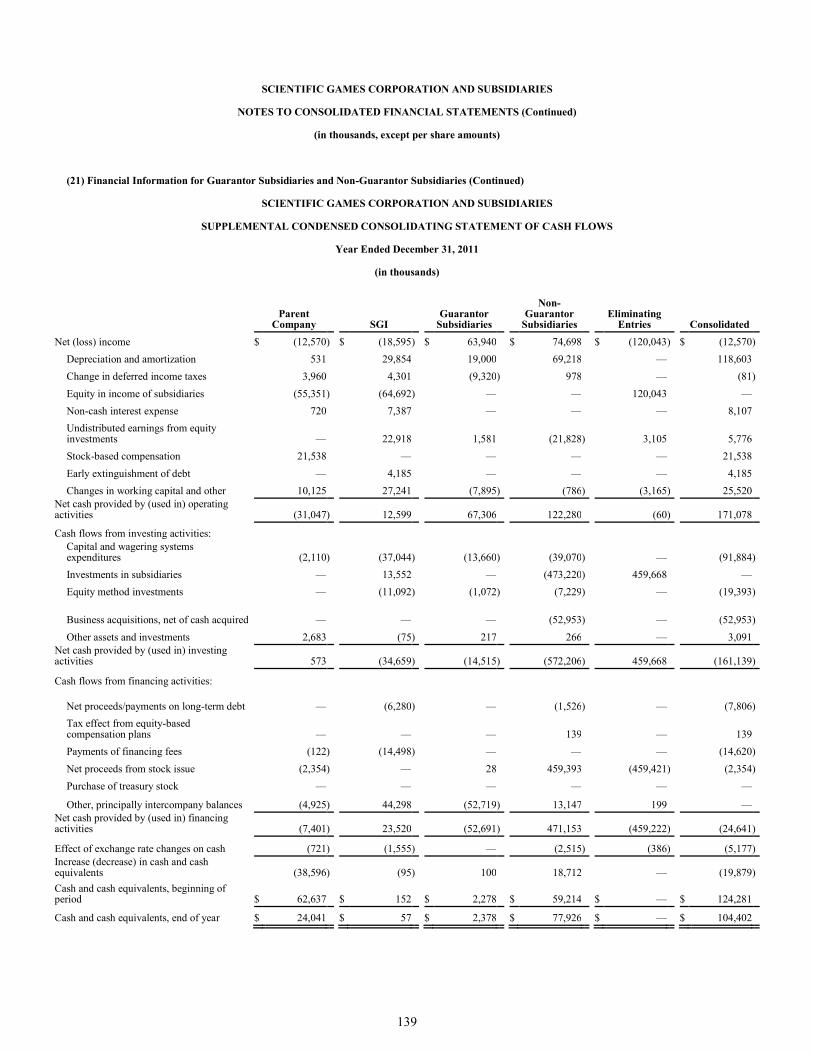
139
SCIENTIFIC GAMES CORPORATION AND SUBSIDIARIES
NOTES TO CONSOLIDATED FINANCIAL STATEMENTS (Continued)
(in thousands, except per share amounts)
(21) Financial Information for Guarantor Subsidiaries and Non-Guarantor Subsidiaries (Continued)
SCIENTIFIC GAMES CORPORATION AND SUBSIDIARIES
SUPPLEMENTAL CONDENSED CONSOLIDATING STATEMENT OF CASH FLOWS
Year Ended December 31, 2011
(in thousands)
Parent
Company SGI Guarantor
Subsidiaries
Non- Guarantor
Subsidiaries Eliminating
Entries Consolidated
Net (loss) income $ (12,570 ) $ (18,595 ) $ 63,940 $ 74,698 $ (120,043 ) $ (12,570 )
Depreciation and amortization 531 29,854 19,000 69,218 — 118,603
Change in deferred income taxes 3,960 4,301 (9,320 ) 978 — (81 )
Equity in income of subsidiaries (55,351 ) (64,692 ) — — 120,043 —
Non-cash interest expense 720 7,387 — — — 8,107
Undistributed earnings from equity investments — 22,918 1,581 (21,828 ) 3,105 5,776
Stock-based compensation 21,538 — — — — 21,538
Early extinguishment of debt — 4,185 — — — 4,185
Changes in working capital and other 10,125 27,241 (7,895 ) (786 ) (3,165 ) 25,520 Net cash provided by (used in) operating activities (31,047 ) 12,599 67,306 122,280 (60 ) 171,078
Cash flows from investing activities: Capital and wagering systems expenditures (2,110 ) (37,044 ) (13,660 ) (39,070 ) — (91,884 )
Investments in subsidiaries — 13,552 — (473,220 ) 459,668 —
Equity method investments — (11,092 ) (1,072 ) (7,229 ) — (19,393 )
Business acquisitions, net of cash acquired — — — (52,953 ) — (52,953 )
Other assets and investments 2,683 (75 ) 217 266 — 3,091 Net cash provided by (used in) investing activities 573 (34,659 ) (14,515 ) (572,206 ) 459,668 (161,139 )
Cash flows from financing activities:
Net proceeds/payments on long-term debt — (6,280 ) — (1,526 ) — (7,806 )
Tax effect from equity-based compensation plans — — — 139 — 139
Payments of financing fees (122 ) (14,498 ) — — — (14,620 )
Net proceeds from stock issue (2,354 ) — 28 459,393 (459,421 ) (2,354 )
Purchase of treasury stock — — — — — —
Other, principally intercompany balances (4,925 ) 44,298 (52,719 ) 13,147 199 — Net cash provided by (used in) financing activities (7,401 ) 23,520 (52,691 ) 471,153 (459,222 ) (24,641 )
Effect of exchange rate changes on cash (721 ) (1,555 ) — (2,515 ) (386 ) (5,177 )
Increase (decrease) in cash and cash equivalents (38,596 ) (95 ) 100 18,712 — (19,879 )
Cash and cash equivalents, beginning of period $ 62,637 $ 152 $ 2,278 $ 59,214 $ — $ 124,281
Cash and cash equivalents, end of year $ 24,041 $ 57 $ 2,378 $ 77,926 $ — $ 104,402
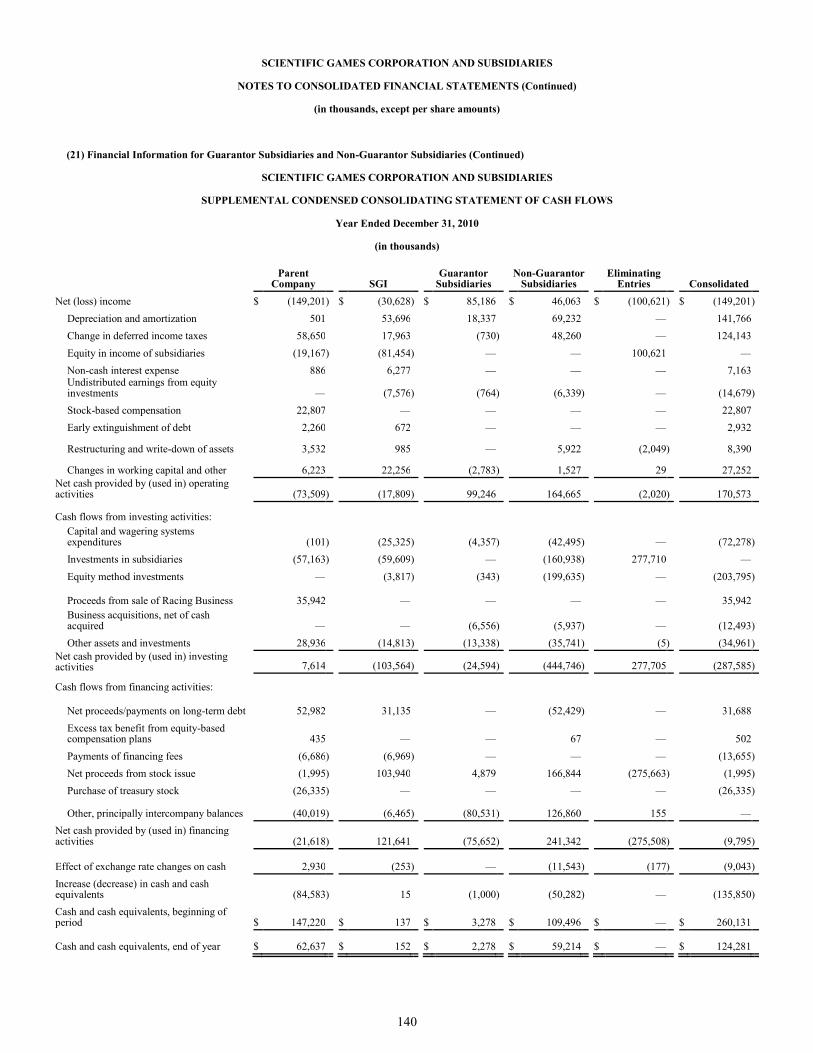
140
SCIENTIFIC GAMES CORPORATION AND SUBSIDIARIES
NOTES TO CONSOLIDATED FINANCIAL STATEMENTS (Continued)
(in thousands, except per share amounts)
(21) Financial Information for Guarantor Subsidiaries and Non-Guarantor Subsidiaries (Continued)
SCIENTIFIC GAMES CORPORATION AND SUBSIDIARIES
SUPPLEMENTAL CONDENSED CONSOLIDATING STATEMENT OF CASH FLOWS
Year Ended December 31, 2010
(in thousands)
Parent
Company SGI Guarantor
Subsidiaries Non-Guarantor
Subsidiaries Eliminating
Entries Consolidated
Net (loss) income $ (149,201 ) $ (30,628 ) $ 85,186 $ 46,063 $ (100,621 ) $ (149,201 )
Depreciation and amortization 501 53,696 18,337 69,232 — 141,766
Change in deferred income taxes 58,650 17,963 (730 ) 48,260 — 124,143
Equity in income of subsidiaries (19,167 ) (81,454 ) — — 100,621 —
Non-cash interest expense 886 6,277 — — — 7,163 Undistributed earnings from equity investments — (7,576 ) (764 ) (6,339 ) — (14,679 )
Stock-based compensation 22,807 — — — — 22,807
Early extinguishment of debt 2,260 672 — — — 2,932
Restructuring and write-down of assets 3,532 985 — 5,922 (2,049 ) 8,390
Changes in working capital and other 6,223 22,256 (2,783 ) 1,527 29 27,252 Net cash provided by (used in) operating activities (73,509 ) (17,809 ) 99,246 164,665 (2,020 ) 170,573
Cash flows from investing activities:
Capital and wagering systems expenditures (101 ) (25,325 ) (4,357 ) (42,495 ) — (72,278 )
Investments in subsidiaries (57,163 ) (59,609 ) — (160,938 ) 277,710 —
Equity method investments — (3,817 ) (343 ) (199,635 ) — (203,795 )
Proceeds from sale of Racing Business 35,942 — — — — 35,942 Business acquisitions, net of cash acquired — — (6,556 ) (5,937 ) — (12,493 )
Other assets and investments 28,936 (14,813 ) (13,338 ) (35,741 ) (5 ) (34,961 )
Net cash provided by (used in) investing activities 7,614 (103,564 ) (24,594 ) (444,746 ) 277,705 (287,585 )
Cash flows from financing activities:
Net proceeds/payments on long-term debt 52,982 31,135 — (52,429 ) — 31,688
Excess tax benefit from equity-based compensation plans 435 — — 67 — 502
Payments of financing fees (6,686 ) (6,969 ) — — — (13,655 )
Net proceeds from stock issue (1,995 ) 103,940 4,879 166,844 (275,663 ) (1,995 )
Purchase of treasury stock (26,335 ) — — — — (26,335 )
Other, principally intercompany balances (40,019 ) (6,465 ) (80,531 ) 126,860 155 —
Net cash provided by (used in) financing activities (21,618 ) 121,641 (75,652 ) 241,342 (275,508 ) (9,795 )
Effect of exchange rate changes on cash 2,930 (253 ) — (11,543 ) (177 ) (9,043 )
Increase (decrease) in cash and cash equivalents (84,583 ) 15 (1,000 ) (50,282 ) — (135,850 )
Cash and cash equivalents, beginning of period $ 147,220 $ 137 $ 3,278 $ 109,496 $ — $ 260,131
Cash and cash equivalents, end of year $ 62,637 $ 152 $ 2,278 $ 59,214 $ — $ 124,281
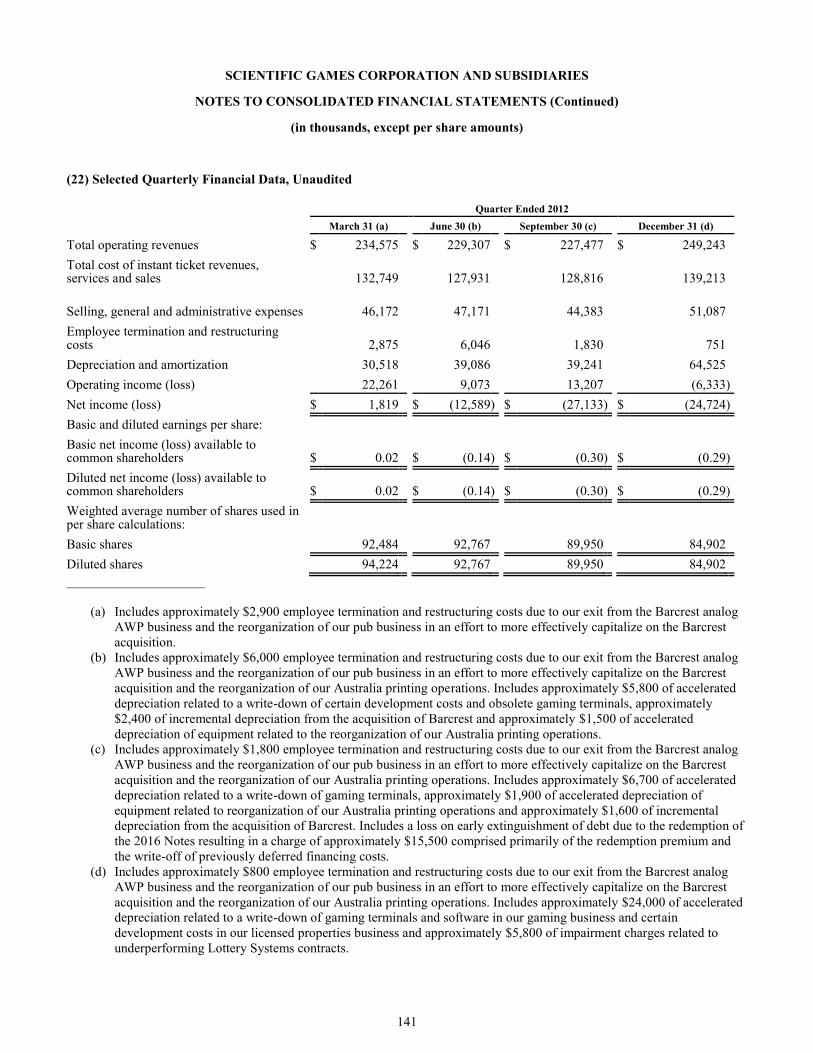
141
SCIENTIFIC GAMES CORPORATION AND SUBSIDIARIES
NOTES TO CONSOLIDATED FINANCIAL STATEMENTS (Continued)
(in thousands, except per share amounts)
(22) Selected Quarterly Financial Data, Unaudited
Quarter Ended 2012
March 31 (a) June 30 (b) September 30 (c) December 31 (d)
Total operating revenues $ 234,575 $ 229,307 $ 227,477 $ 249,243
Total cost of instant ticket revenues, services and sales 132,749 127,931 128,816 139,213
Selling, general and administrative expenses 46,172 47,171 44,383 51,087
Employee termination and restructuring costs 2,875 6,046 1,830 751
Depreciation and amortization 30,518 39,086 39,241 64,525
Operating income (loss) 22,261 9,073 13,207 (6,333 )
Net income (loss) $ 1,819 $ (12,589 ) $ (27,133 ) $ (24,724 )
Basic and diluted earnings per share:
Basic net income (loss) available to common shareholders $ 0.02 $ (0.14 ) $ (0.30 ) $ (0.29 )
Diluted net income (loss) available to common shareholders $ 0.02 $ (0.14 ) $ (0.30 ) $ (0.29 )
Weighted average number of shares used in per share calculations:
Basic shares 92,484 92,767 89,950 84,902
Diluted shares 94,224 92,767 89,950 84,902
__________________________
(a) Includes approximately $2,900 employee termination and restructuring costs due to our exit from the Barcrest analog
AWP business and the reorganization of our pub business in an effort to more effectively capitalize on the Barcrest
acquisition.
(b) Includes approximately $6,000 employee termination and restructuring costs due to our exit from the Barcrest analog
AWP business and the reorganization of our pub business in an effort to more effectively capitalize on the Barcrest
acquisition and the reorganization of our Australia printing operations. Includes approximately $5,800 of accelerated
depreciation related to a write-down of certain development costs and obsolete gaming terminals, approximately
$2,400 of incremental depreciation from the acquisition of Barcrest and approximately $1,500 of accelerated
depreciation of equipment related to the reorganization of our Australia printing operations.
(c) Includes approximately $1,800 employee termination and restructuring costs due to our exit from the Barcrest analog
AWP business and the reorganization of our pub business in an effort to more effectively capitalize on the Barcrest
acquisition and the reorganization of our Australia printing operations. Includes approximately $6,700 of accelerated
depreciation related to a write-down of gaming terminals, approximately $1,900 of accelerated depreciation of
equipment related to reorganization of our Australia printing operations and approximately $1,600 of incremental
depreciation from the acquisition of Barcrest. Includes a loss on early extinguishment of debt due to the redemption of
the 2016 Notes resulting in a charge of approximately $15,500 comprised primarily of the redemption premium and
the write-off of previously deferred financing costs.
(d) Includes approximately $800 employee termination and restructuring costs due to our exit from the Barcrest analog
AWP business and the reorganization of our pub business in an effort to more effectively capitalize on the Barcrest
acquisition and the reorganization of our Australia printing operations. Includes approximately $24,000 of accelerated
depreciation related to a write-down of gaming terminals and software in our gaming business and certain
development costs in our licensed properties business and approximately $5,800 of impairment charges related to
underperforming Lottery Systems contracts.
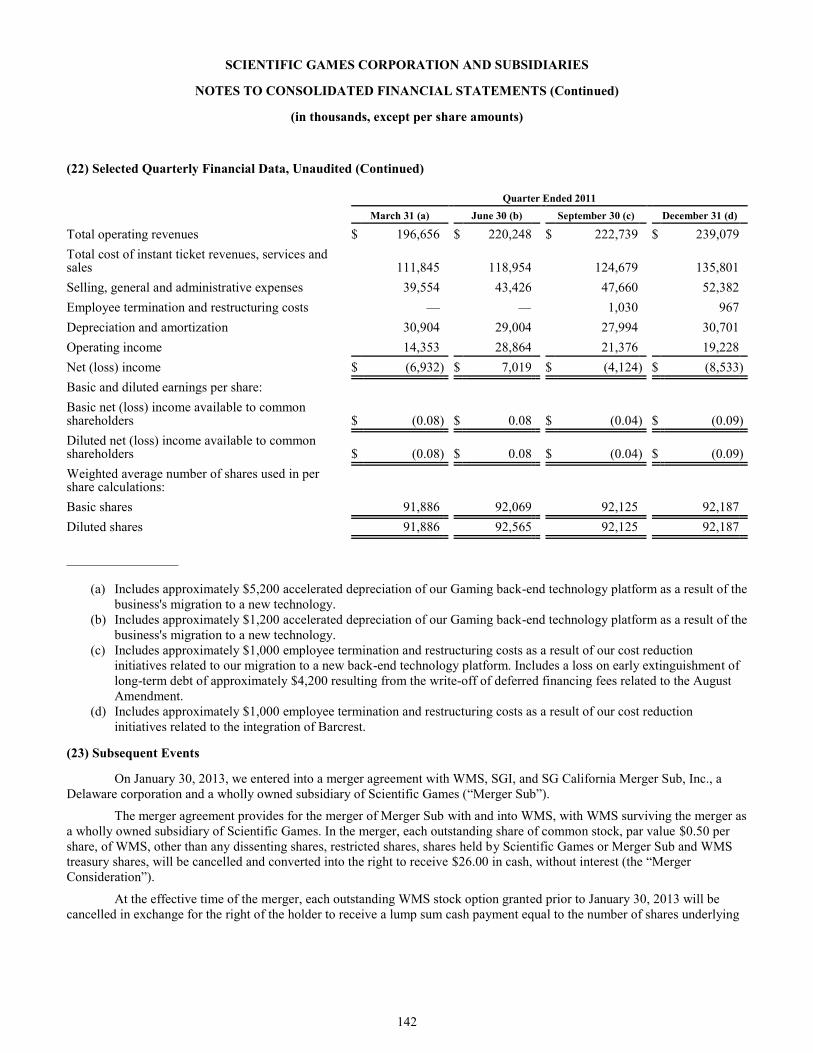
142
SCIENTIFIC GAMES CORPORATION AND SUBSIDIARIES
NOTES TO CONSOLIDATED FINANCIAL STATEMENTS (Continued)
(in thousands, except per share amounts)
(22) Selected Quarterly Financial Data, Unaudited (Continued)
Quarter Ended 2011
March 31 (a) June 30 (b) September 30 (c) December 31 (d)
Total operating revenues $ 196,656 $ 220,248 $ 222,739 $ 239,079
Total cost of instant ticket revenues, services and sales 111,845 118,954 124,679 135,801
Selling, general and administrative expenses 39,554 43,426 47,660 52,382
Employee termination and restructuring costs — — 1,030 967
Depreciation and amortization 30,904 29,004 27,994 30,701
Operating income 14,353 28,864 21,376 19,228
Net (loss) income $ (6,932 ) $ 7,019 $ (4,124 ) $ (8,533 )
Basic and diluted earnings per share:
Basic net (loss) income available to common shareholders $ (0.08 ) $ 0.08 $ (0.04 ) $ (0.09 )
Diluted net (loss) income available to common shareholders $ (0.08 ) $ 0.08 $ (0.04 ) $ (0.09 )
Weighted average number of shares used in per share calculations:
Basic shares 91,886 92,069 92,125 92,187
Diluted shares 91,886 92,565 92,125 92,187
_____________________
(a) Includes approximately $5,200 accelerated depreciation of our Gaming back-end technology platform as a result of the
business's migration to a new technology.
(b) Includes approximately $1,200 accelerated depreciation of our Gaming back-end technology platform as a result of the
business's migration to a new technology.
(c) Includes approximately $1,000 employee termination and restructuring costs as a result of our cost reduction
initiatives related to our migration to a new back-end technology platform. Includes a loss on early extinguishment of
long-term debt of approximately $4,200 resulting from the write-off of deferred financing fees related to the August
Amendment.
(d) Includes approximately $1,000 employee termination and restructuring costs as a result of our cost reduction
initiatives related to the integration of Barcrest.
(23) Subsequent Events
On January 30, 2013, we entered into a merger agreement with WMS, SGI, and SG California Merger Sub, Inc., a
Delaware corporation and a wholly owned subsidiary of Scientific Games (“Merger Sub”).
The merger agreement provides for the merger of Merger Sub with and into WMS, with WMS surviving the merger as
a wholly owned subsidiary of Scientific Games. In the merger, each outstanding share of common stock, par value $0.50 per
share, of WMS, other than any dissenting shares, restricted shares, shares held by Scientific Games or Merger Sub and WMS
treasury shares, will be cancelled and converted into the right to receive $26.00 in cash, without interest (the “Merger
Consideration”).
At the effective time of the merger, each outstanding WMS stock option granted prior to January 30, 2013 will be
cancelled in exchange for the right of the holder to receive a lump sum cash payment equal to the number of shares underlying
143
SCIENTIFIC GAMES CORPORATION AND SUBSIDIARIES
NOTES TO CONSOLIDATED FINANCIAL STATEMENTS (Continued)
(in thousands, except per share amounts)
(23) Subsequent Events (Continued)
the WMS stock option multiplied by the excess of the Merger Consideration over the exercise price, if any. In addition, each
outstanding award of WMS restricted shares, restricted stock units and phantom units will be cancelled as of the effective time,
in exchange for the right of the holder to receive a lump sum cash payment equal to the Merger Consideration multiplied by the
number of shares underlying each award, except for certain equity awards that are permitted to be granted by WMS following
January 30, 2013 (including employee stock options), which will be converted into equivalent awards of Scientific Games
using a customary exchange ratio of WMS’ stock price to Scientific Games’ stock price on the closing date. As of the effective
time, each outstanding award of WMS performance units will be cancelled in exchange for the right of the holder to receive a
lump sum cash payment equal to the Merger Consideration multiplied by the number of shares underlying the performance
units at the applicable payout percentage, which will be 100% unless the relevant performance targets are met or exceeded as of
the effective time, in which case the payout percentage will be determined based on actual performance.
The closing of the merger is subject to customary closing conditions, including approval of the merger by WMS
stockholders and other approvals by various authorities. The parties have agreed that receipt of gaming approvals from
approximately 50 jurisdictions is a condition to closing of the merger, provided that receipt of gaming approvals from
approximately 30 of these jurisdictions will cease to be a condition to closing from and after October 31, 2013. We believe that
the approximately 50 jurisdictions include the material jurisdictions from which gaming approvals will be required prior to
closing. We believe that the approximately 20 jurisdictions with respect to which approvals are a condition to any closing
include the material jurisdictions where we anticipate longer lead times for obtaining approvals. Scientific Games is entitled to
a 20 consecutive business day financing marketing period if all gaming approvals are received prior to October 31, 2013.
Under the merger agreement, WMS may not initiate, solicit or knowingly encourage competing proposals or
participate in any discussions or negotiations regarding alternative business combination transactions.
The merger agreement contains certain termination rights for both Scientific Games and WMS and further provides
that, in connection with termination of the merger agreement under specified circumstances, (i) we may be required to pay to
WMS a termination fee of $100,000 if all the conditions to closing have been met and the merger is not consummated because
of a breach by our lenders of their obligations to finance the transaction, (ii) we may be required to pay to WMS a termination
fee of $80,000 if we are unable to obtain the gaming approvals that are conditions to closing prior to the termination date, and
(iii) WMS may be required to pay to us a termination fee of $44,300 under specified circumstances, including, but not limited
to, a change in the WMS board’s recommendation of the merger or termination of the merger agreement by WMS to enter into
a written definitive agreement for a “superior proposal” (as defined in the merger agreement).
In connection with the merger agreement, Scientific Games and SGI entered into a commitment letter with Bank of
America, N.A., Credit Suisse AG and UBS AG, Stamford Branch, and certain of their respective affiliates, which was
subsequently amended and restated on February 19, 2013 to add J.P. Morgan Securities LLC, the Royal Bank of Scotland,
Deutsche Bank AG New York Branch, Goldman Sachs Bank USA and HSBC Securities (USA) Inc., and certain of their
respective affiliates, as additional commitment parties. Pursuant to the commitment letter, the commitment parties have agreed
to provide the financing necessary to fund the consideration to be paid pursuant to the terms of the merger agreement (the
“Debt Commitment Financing”). The Debt Commitment Financing is anticipated to consist of a senior secured first-lien term
loan facility in a total principal amount of $2,300,000 and a senior secured first-lien revolving credit facility in a total principal
amount of $300,000. The funding of the Debt Commitment Financing is contingent on the satisfaction of certain conditions set
forth in the commitment letter. The merger is not conditioned on our obtaining the proceeds of any financing, including the
financing contemplated by the commitment letter.
For further information regarding the pending merger and the Debt Commitment Financing, please see the full text of
the merger agreement, a copy of which is filed as exhibit 2.1 to our Current Report on Form 8-K filed with the SEC on
February 5, 2013 and the full text of the commitment letter, a copy of which is filed as exhibit 10.68 to this Annual Report on
Form 10-K.
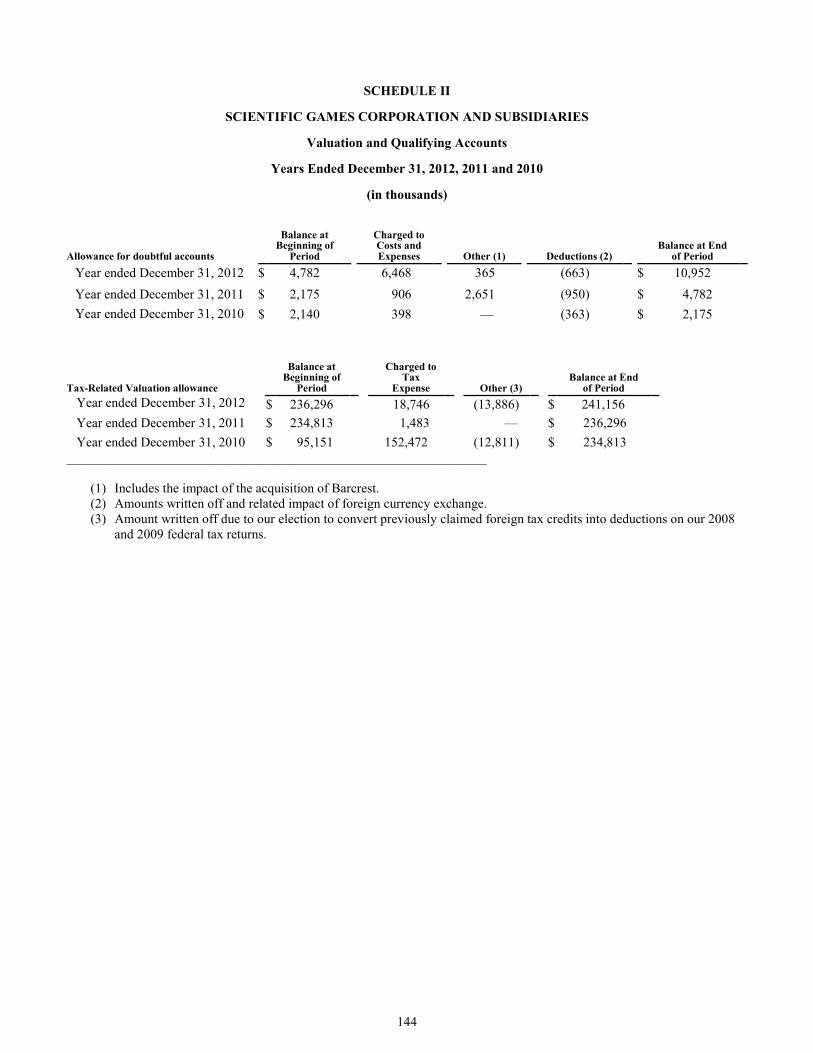
144
SCHEDULE II
SCIENTIFIC GAMES CORPORATION AND SUBSIDIARIES
Valuation and Qualifying Accounts
Years Ended December 31, 2012, 2011 and 2010
(in thousands)
Allowance for doubtful accounts
Balance at Beginning of
Period
Charged to Costs and Expenses Other (1) Deductions (2)
Balance at End of Period
Year ended December 31, 2012 $ 4,782 6,468 365 (663) $ 10,952
Year ended December 31, 2011 $ 2,175 906 2,651 (950) $ 4,782
Year ended December 31, 2010
$ 2,140 398 — (363) $ 2,175
Tax-Related Valuation allowance
Balance at Beginning of
Period
Charged to Tax
Expense Other (3) Balance at End
of Period
Year ended December 31, 2012
$ 236,296 18,746 (13,886) $ 241,156
Year ended December 31, 2011 $ 234,813 1,483 — $ 236,296
Year ended December 31, 2010 $ 95,151 152,472 (12,811) $ 234,813 _______________________________________________________________________________
(1) Includes the impact of the acquisition of Barcrest.
(2) Amounts written off and related impact of foreign currency exchange.
(3) Amount written off due to our election to convert previously claimed foreign tax credits into deductions on our 2008
and 2009 federal tax returns.
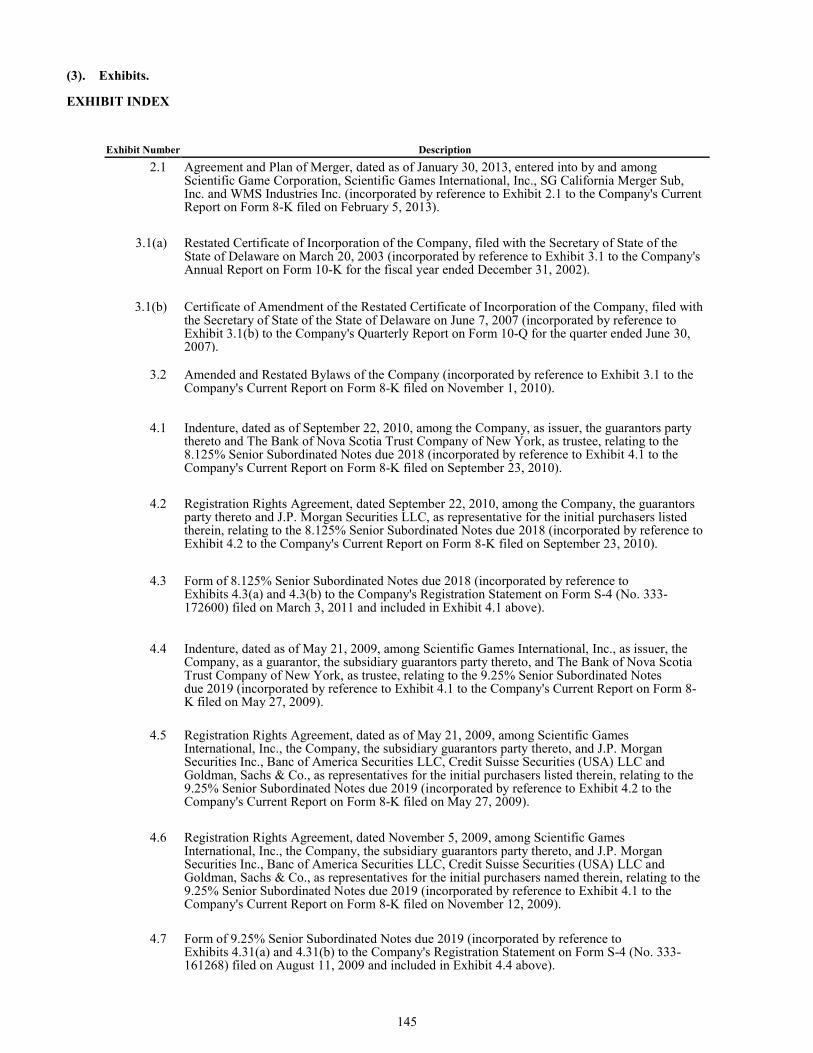
145
(3). Exhibits.
EXHIBIT INDEX
Exhibit Number Description
2.1 Agreement and Plan of Merger, dated as of January 30, 2013, entered into by and among Scientific Game Corporation, Scientific Games International, Inc., SG California Merger Sub, Inc. and WMS Industries Inc. (incorporated by reference to Exhibit 2.1 to the Company's Current Report on Form 8-K filed on February 5, 2013).
3.1(a) Restated Certificate of Incorporation of the Company, filed with the Secretary of State of the State of Delaware on March 20, 2003 (incorporated by reference to Exhibit 3.1 to the Company's Annual Report on Form 10-K for the fiscal year ended December 31, 2002).
3.1(b) Certificate of Amendment of the Restated Certificate of Incorporation of the Company, filed with the Secretary of State of the State of Delaware on June 7, 2007 (incorporated by reference to Exhibit 3.1(b) to the Company's Quarterly Report on Form 10-Q for the quarter ended June 30, 2007).
3.2 Amended and Restated Bylaws of the Company (incorporated by reference to Exhibit 3.1 to the Company's Current Report on Form 8-K filed on November 1, 2010).
4.1 Indenture, dated as of September 22, 2010, among the Company, as issuer, the guarantors party thereto and The Bank of Nova Scotia Trust Company of New York, as trustee, relating to the 8.125% Senior Subordinated Notes due 2018 (incorporated by reference to Exhibit 4.1 to the Company's Current Report on Form 8-K filed on September 23, 2010).
4.2 Registration Rights Agreement, dated September 22, 2010, among the Company, the guarantors party thereto and J.P. Morgan Securities LLC, as representative for the initial purchasers listed therein, relating to the 8.125% Senior Subordinated Notes due 2018 (incorporated by reference to Exhibit 4.2 to the Company's Current Report on Form 8-K filed on September 23, 2010).
4.3 Form of 8.125% Senior Subordinated Notes due 2018 (incorporated by reference to Exhibits 4.3(a) and 4.3(b) to the Company's Registration Statement on Form S-4 (No. 333-172600) filed on March 3, 2011 and included in Exhibit 4.1 above).
4.4 Indenture, dated as of May 21, 2009, among Scientific Games International, Inc., as issuer, the Company, as a guarantor, the subsidiary guarantors party thereto, and The Bank of Nova Scotia Trust Company of New York, as trustee, relating to the 9.25% Senior Subordinated Notes due 2019 (incorporated by reference to Exhibit 4.1 to the Company's Current Report on Form 8-K filed on May 27, 2009).
4.5 Registration Rights Agreement, dated as of May 21, 2009, among Scientific Games International, Inc., the Company, the subsidiary guarantors party thereto, and J.P. Morgan Securities Inc., Banc of America Securities LLC, Credit Suisse Securities (USA) LLC and Goldman, Sachs & Co., as representatives for the initial purchasers listed therein, relating to the 9.25% Senior Subordinated Notes due 2019 (incorporated by reference to Exhibit 4.2 to the Company's Current Report on Form 8-K filed on May 27, 2009).
4.6 Registration Rights Agreement, dated November 5, 2009, among Scientific Games International, Inc., the Company, the subsidiary guarantors party thereto, and J.P. Morgan Securities Inc., Banc of America Securities LLC, Credit Suisse Securities (USA) LLC and Goldman, Sachs & Co., as representatives for the initial purchasers named therein, relating to the 9.25% Senior Subordinated Notes due 2019 (incorporated by reference to Exhibit 4.1 to the Company's Current Report on Form 8-K filed on November 12, 2009).
4.7 Form of 9.25% Senior Subordinated Notes due 2019 (incorporated by reference to Exhibits 4.31(a) and 4.31(b) to the Company's Registration Statement on Form S-4 (No. 333-161268) filed on August 11, 2009 and included in Exhibit 4.4 above).
146
Exhibit Number Description
4.8 Indenture, dated as of June 11, 2008, among Scientific Games International, Inc., as issuer, the Company, as a guarantor, the subsidiary guarantors party thereto, and The Bank of Nova Scotia Trust Company of New York, as trustee, relating to the 7.875% Senior Subordinated Notes due 2016 (incorporated by reference to Exhibit 4.1 to the Company's Current Report on Form 8-K filed on June 13, 2008).
4.9 Supplemental Indenture, dated as of October 27, 2011, among Scientific Games International, Inc., as issuer, the Company, as a guarantor, the subsidiary guarantors party thereto and The Bank of Nova Scotia Trust Company of New York, as trustee, relating to the Indenture dated June 11, 2008, by and among Scientific Games International, Inc., as issuer, the Company, as a guarantor, the subsidiary guarantors party thereto and The Bank of Nova Scotia Trust Company of New York, as trustee (incorporated by reference to Exhibit 4.1 to the Company Current Report on Form 8-K filed on October 28, 2011).
4.10 Registration Rights Agreement, dated June 11, 2008, among Scientific Games International, Inc., the Company, the subsidiary guarantors listed therein, and J.P. Morgan Securities Inc., Banc of America Securities LLC and UBS Securities LLC, as representatives for the initial purchasers listed therein, relating to the 7.875% Senior Subordinated Notes due 2016 (incorporated by reference to Exhibit 4.2 to the Company's Current Report on Form 8-K filed on June 13, 2008).
4.11 Form of 7.875% Senior Subordinated Notes due 2016 (incorporated by reference to Exhibits 4.3(a) and 4.3(b) to the Company's Registration Statement on Form S-3ASR (No. 333-155346) filed on November 13, 2008 and included in Exhibit 4.8 above).
4.12 Indenture, dated as of August 20, 2012, among Scientific Games International, Inc., as issuer, the Company, as a guarantor, the subsidiary guarantors party thereto and The Bank of Nova Scotia Trust Company of New York, as trustee (incorporated by reference to Exhibit 4.1 to the Company's Current Report on Form 8-K filed on August 21, 2012).
4.13 Registration Rights Agreement, August 20, 2012, among Scientific Games International, Inc., as issuer, the Company, the subsidiary guarantors party thereto and Merrill Lynch, Pierce, Fenner & Smith Incorporated, as representative for the initial purchasers listed therein (incorporated by reference to Exhibit 4.2 to the Company's Current Report on Form 8-K filed on August 21, 2012).
4.14 Form of 6.250% Senior Subordinated Notes due 2020 (incorporated by reference to Exhibits 4.3(a) and 4.3(b) to the Company's Registration Statement on Form S-4 (No. 333-184835) filed on August 20, 2012 and included in Exhibit 4.12 above).
10.1 Second Amendment and Restatement Agreement, dated as of August 25, 2011, among Scientific Games International, Inc., as borrower, the Company, as guarantor, and several lenders from time to time parties thereto and JP Morgan, as administrative agent, which amended and restated the Credit Agreement, dated as of June 9, 2008 as amended and restated as of February 12, 2010 and amended as of December 16, 2010 and March 11, 2011 among such parties, as set forth in Exhibit A to such Second Amendment and Restatement Agreement (incorporated by reference to Exhibit 10.1 to the Company's Current Report on Form 8-K filed on August 31, 2011).
10.2 Guarantee and Collateral Agreement, dated as of June 9, 2008, among Scientific Games International, Inc., the Company, as a guarantor, and each other subsidiary of the Company listed on the signature pages thereto, as additional guarantors, in favor of JPMorgan Chase Bank, N.A., as administrative agent (incorporated by reference to Exhibit 10.2 to the Company's Current Report on Form 8-K filed on June 13, 2008).
10.3 Stockholders' Agreement, dated September 6, 2000, among the Company, MacAndrews & Forbes Holdings Inc. (formerly known as Mafco Holdings Inc.) ("MacAndrews") (as successor-in-interest under the agreement to Cirmatica Gaming S.A.) andRamius Securities, LLC (incorporated by reference to Exhibit 10.38 to the Company's Quarterly Report on Form 10-Q for the quarter ended July 31, 2000).
10.4 Supplemental Stockholders' Agreement, dated June 26, 2002, among the Company and MacAndrews (as successor-in-interest to Cirmatica Gaming S.A.) (incorporated by reference to Exhibit 4.2 to the Company's Quarterly Report on Form 10-Q for the quarter ended June 30, 2002).
147
Exhibit Number Description
10.5 Letter Agreement, dated as of October 10, 2003, by and between the Company and MacAndrews further supplementing the Stockholders' Agreement (incorporated by reference to Exhibit 3 to the Schedule 13D jointly filed by MacAndrews and SGMS Acquisition Corporation on November 26, 2003).
10.6 Letter Agreement dated February 15, 2007 between the Company and MacAndrews (incorporated by reference to Exhibit 10.1 to the Company's Current Report on Form 8-K filed on February 16, 2007).
10.7 Share Purchase Agreement, dated as of April 26, 2011, by and among the Company, Global Draw Limited, IGT-UK Group Limited, Cyberview International, Inc. and International Game Technology (incorporated by reference to Exhibit 10.1 to the Company's Quarterly Report on Form 10-Q for the quarter ended June 30, 2011).
10.8 Purchase Agreement, dated as of January 27, 2010, by and among the Company, Scientific Games International, Inc., SG Racing, Inc., Scientific Games Germany GmbH, Scientific Games Luxembourg Holdings SARL, Scientific Games Holdings Limited, Scientific Games Racing, LLC, Sportech Plc, Sportech Holdco 1 Limited and Sportech Holdco 2 Limited (incorporated by reference to Exhibit 10.1 to the Company's Quarterly Report on Form 10-Q for the quarter ended March 31, 2010).
10.9 Stock Purchase Agreement, dated as of May 1, 2007, among François-Charles OberthurFiduciaire, S.A., the Company and Scientific Games Holdings (Canada) Inc. (incorporated by reference to Exhibit 10.1 to the Company's Current Report on Form 8-K filed on May 7, 2007).
10.10 Agreement, dated April 20, 2006, among the Company, Scientific Games International Holdings Limited, Scientific Games BeteiligungsgesellschaftmbH, Walter Grubmueller, Stephen George Frater, The Trustees of WareroPrivatsitiftung and Jeffery Frederick Nash for the sale and purchase of the entire issued share capital of Neomi Associates, Inc. and Research and Development GmbH (incorporated by reference to Exhibit 10.1 to the Company's Current Report on Form 8-K filed on April 26, 2006).
10.11 Share Purchase and Sale Agreement, dated April 4, 2005, among Scientific Games Chile Limitada, Epicentro S.A. and Inversiones Y AesoriasIculpeLimitada (incorporated by reference to Exhibit 10.1 to the Company's Current Report on Form 8-K filed on April 8, 2005).
10.12 1992 Equity Incentive Plan, as amended and restated (incorporated by reference to Exhibit 10.33 to the Company's Annual Report on Form 10-K for the fiscal year ended October 31, 1998).*
10.13 1995 Equity Incentive Plan, as amended (incorporated by reference to Exhibit 10.14 to the Company's Annual Report on Form 10-K for the fiscal year ended October 31, 1997).*
10.14 1997 Incentive Compensation Plan, as amended and restated (incorporated by reference to Exhibit 10.14 to the Company's Annual Report on Form 10-K for the fiscal year ended December 31, 2001).*
10.15 2003 Incentive Compensation Plan, as amended and restated (incorporated by reference to Exhibit 10.1 to the Company's Current Report on Form 8-K filed on June 9, 2011).*

148
Exhibit Number Description
10.16 2002 Employee Stock Purchase Plan, as amended and restated (incorporated by reference to Exhibit 10.14 to the Company's Annual Report on Form 10-K for the fiscal year ended December 31, 2005).*
10.17 Elective Deferred Compensation Plan (Executive Deferred Compensation Plan and Non-Employee Directors Deferred Compensation Plan) (effective January 1, 2005, as amended and restated effective January 1, 2009) (incorporated by reference to Exhibit 10.14 to the Company's Annual Report on Form 10-K for the year ended December 31, 2008).*
10.18 Frozen Supplemental Executive Retirement Plan (as amended and restated effective January 1, 2009) (incorporated by reference to Exhibit 10.15 to the Company's Annual Report on Form 10-K for the year ended December 31, 2008).*
10.19 Asia-Pacific Business Incentive Compensation Program (incorporated by reference to Exhibit 10.4 to the Company's Current Report on Form 8-K filed on December 3, 2010).*
10.20 Employment Agreement dated as of January 1, 2006 by and between the Company and A. Lorne Weil (executed on August 8, 2006) (incorporated by reference to Exhibit 10.1 to the Company's Quarterly Report on Form 10-Q for the quarter ended September 30, 2006).*
10.21 Letter dated August 2, 2007 between A. Lorne Weil and the Company with respect to payment of Mr. Weil's deferred compensation upon a termination of employment under Mr. Weil's Employment Agreement dated as of January 1, 2006 (incorporated by reference to Exhibit 10.1 to the Company's Quarterly Report on Form 10-Q for the quarter ended September 30, 2007).*
10.22 Amendment to Employment Agreement dated as of May 1, 2008 by and between the Company and A. Lorne Weil (executed on May 12, 2008), which amended Mr. Weil's Employment Agreement dated as of January 1, 2006, as amended by the Letter dated August 2, 2007 (incorporated by reference to Exhibit 10.2 to the Company's Current Report on Form 8-K filed on May 14, 2008).*
10.23 Amendment to Employment Agreement dated as of December 30, 2008 by and between the Company and A. Lorne Weil, which amended Mr. Weil's Employment Agreement dated as of January 1, 2006, as amended by the Letter dated August 2, 2007 and the Amendment dated as of May 1, 2008 (incorporated by reference to Exhibit 10.20 to the Company's Annual Report on Form 10-K for the year ended December 31, 2008).*
10.24 Third Amendment to Employment Agreement dated as of May 29, 2009 between the Company and A. Lorne Weil, which amended Mr. Weil's Employment Agreement dated as of January 1, 2006, as amended by the Letter dated August 2, 2007 and the Amendments dated as of May 1, 2008 and December 30, 2008 (incorporated by reference to Exhibit 10.1 to the Company's Current Report on Form 8-K filed on June 2, 2009).*
10.25 Amendment to Employment Agreement dated as of December 2, 2010 between the Company and A. Lorne Weil, which amended Mr. Weil's Employment Agreement dated as of January 1, 2006, as amended by the Letter dated August 2, 2007 and the Amendments dated as of May 1, 2008, December 30, 2008 and May 29, 2009 (incorporated by reference to Exhibit 10.1 to the Company's Current Report on Form 8-K filed on December 3, 2010).*
10.26 Amendment to Employment Agreement, dated as of August 18, 2011, by and between A. Lorne Weil and the Company, which amended Mr. Weil's Employment Agreement dated as of January 1, 2006, as amended by the Letter dated August 2, 2007 and the Amendments dated as of May 1, 2008, December 30, 2008, May 29, 2009 and December 2, 2010 (incorporated by reference to Exhibit 10.1 to the Company's Current Report on Form 8-K filed on August 18, 2011).*
149
Exhibit Number Description
10.27 Employment Agreement dated as of July 1, 2005 between the Company and Michael R. Chambrello (executed on June 17, 2005) (incorporated by reference to Exhibit 10.1 to the Company's Quarterly Report on Form 10-Q for the quarter ended June 30, 2005).*
10.28 Employment Inducement Stock Option Grant Agreement dated July 1, 2005 between the Company and Michael R. Chambrello (incorporated by reference to Exhibit 10.2 to the Company's Quarterly Report on Form 10-Q for the quarter ended June 30, 2005).*
10.29 Letter Agreement dated as of August 2, 2006 by and between the Company and Michael R. Chambrello, which
amended Mr. Chambrello's Employment Agreement dated as of July 1, 2005 (incorporated by reference to Exhibit 10.9 to the Company's Quarterly Report on Form 10-Q for the quarter ended September 30, 2006).*
10.30 Letter Agreement dated as of May 8, 2008 by and between the Company and Michael R. Chambrello, which amended Mr. Chambrello's Employment Agreement dated as of July 1, 2005, as amended by the Letter Agreement dated as of August 2, 2006 (incorporated by reference to Exhibit 10.3 to the Company's Current Report on Form 8-K filed on May 14, 2008).*
10.31 Amendment to Employment Agreement dated as of December 30, 2008 by and between the Company and Michael R. Chambrello, which amended Mr. Chambrello's Employment Agreement dated as of July 1, 2005, as amended by the Letter Agreement dated as of August 2, 2006 and the Letter Agreement dated as of May 8, 2008 (incorporated by reference to Exhibit 10.26 to the Company's Annual Report on Form 10-K for the year ended December 31, 2008).*
10.32 Amendment to Employment Agreement dated as of November 29, 2010 by and between the Company and Michael R. Chambrello, which amended Mr. Chambrello's Employment Agreement dated as of July 1, 2005, as amended by the Letter Agreement dated as of August 2, 2006, the Letter Agreement dated as of May 8, 2008 and the Amendment dated as of December 30, 2008 (incorporated by reference to Exhibit 10.2 to the Current Report on Form 8-K filed on December 3, 2010).*
10.33 Employment Agreement dated as of January 1, 2006 by and between the Company and Robert C. Becker (executed on August 2, 2006) (incorporated by reference to Exhibit 10.2 to the Company's Quarterly Report on Form 10-Q for the quarter ended September 30, 2006).*
10.34 Letter Agreement dated as of October 7, 2008 by and between the Company and Robert C. Becker, which amended Mr. Becker's Employment Agreement dated as of January 1, 2006 (incorporated by reference to Exhibit 10.32 to the Company's Annual Report on Form 10-K for the year ended December 31, 2008).*
10.35 Amendment to Employment Agreement dated as of December 30, 2008 by and between the Company and Robert C. Becker, which amended Mr. Becker's Employment Agreement dated as of January 1, 2006, as amended by the Letter Agreement dated as of October 7, 2008 (incorporated by reference to Exhibit 10.33 to the Company's Annual Report on Form 10-K for the year ended December 31, 2008).*
10.36 Employment Agreement dated as of January 1, 2006 by and between the Company and Larry A. Potts (executed on August 2, 2006) (incorporated by reference to Exhibit 10.4 to the Company's Quarterly Report on Form 10-Q for the quarter ended September 30, 2006).*
10.37 Letter Agreement dated as of October 2, 2008 by and between the Company and Larry A. Potts, which amended Mr. Potts' Employment Agreement dated as of January 1, 2006 (incorporated by reference to Exhibit 10.36 to the Company's Annual Report on Form 10-K for the year ended December 31, 2008).*
150
Exhibit Number Description
10.38 Amendment to Employment Agreement dated as of December 30, 2008 by and between the Company and Larry A. Potts, which amended Mr. Potts' Employment Agreement dated as of January 1, 2006, as amended by the Letter Agreement dated as of October 2, 2008 (incorporated by reference to Exhibit 10.37 to the Company's Annual Report on Form 10-K for the year ended December 31, 2008).*
10.39 Letter Agreement, dated as of September 28, 2011, by and between the Company and Larry A. Potts, which amended Mr. Potts' Employment Agreement dated as of January 1, 2006, as amended by the Letter Agreement dated as of October 2, 2008 and the Amendment dated as of December 30, 2008 (incorporated by reference to Exhibit 10.2 to the Company's Current Report on Form 8-K filed on October 3, 2011).*
10.40 Employment and Severance Benefits Agreement dated December 15, 2005 between the Company and Ira H. Raphaelson (incorporated by reference to Exhibit 10.22 to the Company's Annual Report on Form 10-K for the fiscal year ended December 31, 2005). *
10.41 Letter Agreement dated as of August 2, 2006 by and between the Company and Ira H. Raphaelson, which amended Mr. Raphaelson's Employment Agreement dated December 15, 2005 (effective as of February 1, 2006) (incorporated by reference to Exhibit 10.11 to the Company's Quarterly Report on Form 10-Q for the quarter ended September 30, 2006). *
10.42 Letter Agreement dated as of October 6, 2008 by and between the Company and Ira H. Raphaelson, which amended Mr. Raphaelson's Employment and Severance Benefits Agreement dated December 15, 2005, as amended by the Letter Agreement dated as of August 2, 2006 (incorporated by reference to Exhibit 10.45 to the Company's Annual Report on Form 10-K for the year ended December 31, 2008). *
10.43 Amendment to Employment Agreement dated as of December 30, 2008 by and between the Company and Ira H. Raphaelson, which amended Mr. Raphaelson's Employment and Severance Benefits Agreement dated December 15, 2005, as amended by the Letter Agreement dated as of August 2, 2006 and the Letter Agreement dated as of October 6, 2008 (incorporated by reference to Exhibit 10.46 to the Company's Annual Report on Form 10-K for the year ended December 31, 2008). *
10.44 Separation Agreement dated as of May 12, 2011, by and between the Company and Ira H. Raphaelson (incorporated by reference to Exhibit 10.1 to the Company's Current Report on Form 8-K filed on May 13, 2011).*
10.45 Amendment to Separation Agreement, dated as of August 12, 2011, by and between Ira H. Raphaelson and the Company (incorporated by reference to Exhibit 10.2 to the Company's Current Report on Form 8-K filed on August 18, 2011).*
10.46 Employment Agreement dated as of February 11, 2009 (effective as of January 1, 2009) by and between the Company and Stephen L. Gibbs (incorporated by reference to Exhibit 10.47 to the Company's Annual Report on Form 10-K for the year ended December 31, 2008). *
10.47 Employment Agreement dated as of March 2, 2009 (effective April 1, 2009) by and between the Company and Jeff Lipkin (incorporated by reference to Exhibit 10.3 to the Company's Current Report on Form 8-K filed on April 2, 2009).*
10.48 Employment Agreement dated as of August 8, 2005 by and between the Company and Steven W. Beason (incorporated by reference to Exhibit 10.56 to the Company's Annual Report on Form 10-K for the year ended December 31, 2009).*
151
Exhibit Number Description
10.49 Employment Inducement Stock Option Grant Agreement dated August 8, 2005 between the Company and Steven W. Beason (incorporated by reference to Exhibit 10.1 to the Company's Quarterly Report on Form 10-Q for the quarter ended September 30, 2005).*
10.50 Letter Agreement dated as of August 30, 2007 by and between the Company and Steven W. Beason, which amended Mr. Beason's Employment Agreement dated August 8, 2005 (incorporated by reference to Exhibit 10.57 to the Company's Annual Report on Form 10-K for the year ended December 31, 2009).*
10.51 Letter Agreement dated as of June 17, 2008 by and between the Company and Steven W. Beason, which amended Mr. Beason's Employment Agreement dated as of August 8, 2005, as amended by the Letter Agreement dated as of August 30, 2007 (incorporated by reference to Exhibit 10.58 to the Company's Annual Report on Form 10-K for the year ended December 31, 2009).*
10.52 Amendment to Employment Agreement dated as of December 30, 2008 by and between the Company and Steven W.
Beason, which amended Mr. Beason's Employment Agreement dated as of August 8, 2005, as amended by the Letter Agreement dated as of August 30, 2007 and the Letter Agreement dated as of June 17, 2008 (incorporated by reference to Exhibit 10.59 to the Company's Annual Report on Form 10-K for the year ended December 31, 2009).*
10.53
Letter Agreement, dated as of June 29, 2011, by and between the Company and Steven W. Beason, which amended Mr. Beason's Employment Agreement dated as of August 8, 2005, as amended by the Letter Agreement dated as of August 30, 2007, the Letter Agreement dated as of June 17, 2008 and the Amendment dated as of December 30, 2008 (incorporated by reference to Exhibit 10.3 to the Company's Current Report on Form 8-K filed on October 3, 2011).*
10.54
Employment Agreement dated as of November 29, 2010 by and between the Company and David L. Kennedy (incorporated by reference to Exhibit 10.3 to the Company's Current Report on Form 8-K filed on December 3, 2010).*
10.55
Employment Agreement dated as of May 13, 2008 (effective as of July 1, 2008) by and between The Global Draw Ltd and Stephen Frater (incorporated by reference to Exhibit 10.51 to the Company's Annual Report on Form 10-K for the fiscal year ended December 31, 2010).*
10.56
Letter Agreement dated as of June 22, 2010 by and between The Global Draw Ltd and Stephen Frater, which amended Mr. Frater's Employment Agreement dated as of July 1, 2008 (incorporated by reference to Exhibit 10.52 to the Company's Annual Report on Form 10-K for the fiscal year ended December 31, 2010).*
10.57
Employment Agreement dated as of December 11, 2006 (effective as of January 1, 2007) by and between Scientific Games International, Inc. and James C. Kennedy (incorporated by reference to Exhibit 10.53 to the Company's Annual Report on Form 10-K for the fiscal year ended December 31, 2010).*
10.58
Amendment to Employment Agreement dated as of December 30, 2008 by and between Scientific Games Corporation and James C. Kennedy, which amended Mr. Kennedy's Employment Agreement dated as of January 1, 2007 (incorporated by reference to Exhibit 10.54 to the Company's Annual Report on Form 10-K for the fiscal year ended December 31, 2010).*
10.59
Letter Agreement dated as of May 7, 2009 by and between Scientific Games International, Inc. and James C. Kennedy, which amended Mr. Kennedy's Employment Agreement dated as of January 1, 2007, as amended by the Amendment dated as of December 30, 2008 (incorporated by reference to Exhibit 10.55 to the Company's Annual Report on Form 10-K for the fiscal year ended December 31, 2010).*
152
Exhibit Number Description
10.60 Employment Agreement dated as of December 22, 2010 by and between Scientific Games International, Inc. and William J. Huntley (incorporated by reference to Exhibit 10.56 to the Company's Annual Report on Form 10-K for the fiscal year ended December 31, 2010).*
10.61 Employment Agreement dated as of December 22, 2010 by and between Scientific Games International, Inc. and James B. Trask (incorporated by reference to Exhibit 10.57 to the Company's Annual Report on Form 10-K for the fiscal year ended December 31, 2010).*
10.62 Employment Agreement made as of August 1, 2011 by and between the Company and Jeffrey Johnson (incorporated by reference to Exhibit 10.1 to the Company's Current Report on Form 8-K filed on July 26, 2011).*
10.63 Employment Agreement dated as of September 29, 2011, by and between the Company and Grier C. Raclin (incorporated by reference to Exhibit 10.1 to the Company's Current Report on Form 8-K filed on October 3, 2011).*
10.64 Form of Inducement Equity Award Agreement between the Company and Grier C. Raclin (incorporated by reference to Exhibit 4.1 to the Company's Registration Statement on Form S-8 filed on October 3, 2011).*
10.65 Amended and Restated Employment Agreement dated as of April 26, 2012 by and between the Company and Jeffrey S. Lipkin (incorporated by reference to Exhibit 10.1 to the Company's Current Report on Form 8-K filed on April 26, 2012).*
10.66 Separation Agreement dated as of October 8, 2012 between the Company and Grier C. Raclin (incorporated by reference to Exhibit 10.1 to the Company's Quarterly Report on Form 10-Q for the quarter ended September 30, 2012).*
10.67 Amendment to Employment Agreement, dated as of December 20, 2012 (but effective as of January 1, 2013), by and between Scientific Games International, Inc. and William J. Huntley (incorporated by reference to Exhibit 10.1 to the Company's Current Report on Form 8-K filed on December 26, 2012).*
10.68 Amended and Restated Commitment Letter, dated as of February 19, 2013, among the Company, Scientific Games International, Inc., Bank of America, N.A., Merrill Lynch, Pierce, Fenner & Smith Incorporated, Credit Suisse AG, Credit Suisse Securities (USA) LLC, UBS AG, Stamford Branch, UBS Securities LLC, JPMorgan Chase Bank, N.A., J.P. Morgan Securities LLC, The Royal Bank of Scotland plc, RBS Securities Inc., Deutsche Bank AG New York Branch, Deutsche Bank Securities Inc., Goldman Sachs Bank USA, HSBC Bank USA, National Association and HSBC Securities (USA) Inc. (†)
12 Computation of Ratio of Earnings to Fixed Charges.(†)
21 List of Subsidiaries.(†)
153
Exhibit Number Description
23.1 Consent of Deloitte &Touche LLP, Independent Registered Public Accounting Firm.(†)
23.2 Consent of Reconta Ernst & Young S.p.A., Independent Registered Public Accounting Firm.(†)
23.3 Consent of Reconta Ernst & Young S.p.A., Independent Registered Public Accounting Firm.(†)
31.1 Certification of Chief Executive Officer pursuant to Rule 13a-14(a) under the Securities Exchange Act of 1934.(†)
31.2 Certification of Chief Financial Officer pursuant to Rule 13a-14(a) under the Securities Exchange Act of 1934.(†)
32.1 Certification of Chief Executive Officer pursuant to 18 U.S.C. Section 1350, as adopted pursuant to Section 906 of the Sarbanes-Oxley Act of 2002.(†)
32.2 Certification of Chief Financial Officer pursuant to 18 U.S.C. Section 1350, as adopted pursuant to Section 906 of the Sarbanes-Oxley Act of 2002.(†)
99.1 Report of Reconta Ernst & Young S.p.A., Independent Registered Public Accounting Firm.(†)
99.2 Financial Statements of Lotterie Nazionali S.r.l.(†)
99.3 Report of Reconta Ernst & Young S.p.A., Independent Registered Public Accounting Firm.(†)
99.4 Form of Equity Awards Notice-RSUs-Employees under the Scientific Games Corporation 2003 Incentive Compensation Plan (incorporated by reference to Exhibit 99.(d)(2) to the Company's Schedule TO filed on July 19, 2011).*
99.5 Form of Equity Awards Notice-RSUs-Non-Employee Directors under the Scientific Games Corporation 2003 Incentive Compensation Plan (incorporated by reference to Exhibit 99.(d)(3) to the Company's Schedule TO filed on July 19, 2011).*
99.6 Terms and Conditions of Equity Awards to Key Employees under the Scientific Games Corporation 2003 Incentive Compensation Plan (incorporated by reference to Exhibit 99.(d)(4) to the Company's Schedule TO filed on July 19, 2011).*
99.7 Terms and Conditions of Equity Awards to Non-Employee Directors under the Scientific Games Corporation 2003 Incentive Compensation Plan (incorporated by reference to Exhibit 99.(d)(5) to the Company's Schedule TO filed on July 19, 2011).*
99.8 Terms and Conditions of Special Performance-Conditioned Restricted Stock Units under the Scientific Games Corporation 2003 Incentive Compensation Plan.*(†)
101 Financial statements from the Annual Report on Form 10-K of the Company for the year ended
December 31, 2012, filed on March 12, 2013, formatted in Extensible Business Reporting Language (XBRL): (i) the Consolidated Statements of Operations, (ii) the Consolidated Balance Sheets, (iii) the Consolidated Statements of Cash Flows and (iv) the Notes to Consolidated Financial Statements tagged as blocks of text.(†)(**)
________________________________________________________________________________________________________________________________
* Management contracts and compensation plans and arrangements.
(**) Pursuant to Rule 406T of Regulation S-T, the XBRL related information in Exhibit 101 to this Annual Report on Form 10-K shall not be deemed "filed" for purposes of Section 18 of the Exchange Act, or otherwise subject to liability of that section and shall not be incorporated by reference into any filing or
other document pursuant to the Securities Act, except as shall be expressly set forth by specific reference in such filing or document.
(†) Filed herewith.
Non-GAAP Financial Measures The Company’s Annual Report on Form 10-K included herein contains results that are determined in accordance with accounting principles generally accepted in the United States of America (GAAP). The letter to shareholders and the reconciliation table that follows contain certain “non-GAAP financial measures,” as that term is defined by applicable SEC rules. These non-GAAP financial measures are provided as supplemental information and are discussed below.
Scientific Games (or, as the case may be, Gaming segment) revenue, excluding Racing Business, refers to the Company’s consolidated (or, as the case may be, Gaming segment’s) revenue excluding the revenue of the Racing Business, which was sold in October 2010. These non-GAAP financial measures are reconciled to revenue including the results from the Racing Business on page 6 of the letter to shareholders. Management believes that providing revenue for prior periods that excludes the revenue of the Racing Business facilitates greater comparability of these results across periods. Return on Invested Capital, excluding Racing Business (ROIC), as used in the letter to shareholders, is Attributable EBITDA, excluding Racing Business, divided by Total Capital, excluding Racing Business. ROIC for the years ended December 31, 2010, 2011 and 2012 is calculated using the four-quarter average Total Capital, excluding Racing Business, for each such year. ROIC is a measure used by management in evaluating how effectively the Company employs its capital. While the Company’s management believes that there are no GAAP measures directly comparable to ROIC, ROIC is reconciled to net income (loss) in the table below. The fact that ROIC is a ratio inherently limits its use. Attributable EBITDA is based on the definition of “consolidated EBITDA” in the Company’s credit agreement, except that Attributable EBITDA includes the Company’s share of the EBITDA of all of the Company’s equity investments (whereas “consolidated EBITDA,” for purposes of the credit agreement, generally includes the Company’s share of the EBITDA of the Company’s Italian joint venture but only includes the income of the Company’s other equity investments to the extent such income has been distributed to the Company). A summary of the definition of Attributable EBITDA is included in the Company’s Current Report on Form 8-K furnished to the SEC on March 11, 2013. Attributable EBITDA, excluding Racing Business, refers to Attributable EBITDA excluding operating loss (income), depreciation and amortization expense, write-down of assets held for sale and stock-based compensation expenses associated with the Racing Business. These non-GAAP financial measures are reconciled to net income (loss) in the table that follows. The Company’s management believes that Attributable EBITDA (and Attributable EBITDA, excluding Racing Business) are helpful in assessing the overall operating performance of the Company and its equity investments and highlighting trends in the Company’s and its equity investments’ core businesses that may not otherwise be apparent when relying solely on GAAP financial measures, because these non-GAAP financial measures eliminate from the Company’s and its equity investments’ earnings financial items that management believes have less bearing on the Company’s and its equity investments’ performance, such as income tax expense, depreciation and amortization expense and interest (income) expense. In addition, management believes that Attributable EBITDA (1) is useful to investors because a significant amount of the Company’s business is from its equity investments, (2) provides useful information regarding the Company’s liquidity and its ability to service debt and fund investments and (3) is useful to investors because the definition is derived from the definition of “consolidated EBITDA” in the Company’s credit agreement, which is used to calculate the Company’s compliance with the financial covenants contained in the credit agreement. Moreover, Attributable EBITDA is a metric used in determining performance-based bonuses (subject to certain additional adjustments in the discretion of the Compensation Committee of the Company’s Board of Directors). The Company’s management uses the foregoing non-GAAP financial measures in conjunction with GAAP financial measures to: monitor and evaluate the performance of the Company’s business operations, as well as the performance of its equity investments, which are a significant part of the Company’s business; facilitate management’s internal comparisons of the Company’s historical operating performance of its business operations; facilitate management’s external comparisons of the results of its overall business to the historical operating performance of other companies that may have different capital structures and debt levels; review and assess the operating performance of the Company’s management team; analyze and evaluate financial and strategic planning decisions regarding future operating investments; and plan for and prepare future annual operating budgets and determine appropriate levels of operating investments. Accordingly, the Company’s management believes that these non-GAAP financial measures are useful to investors because they provide investors with disclosures of the Company’s operating results on the same basis as that used by the Company’s management. These non-GAAP financial measures should not be considered in isolation of, as a substitute for, or superior to, the financial information prepared in accordance with GAAP. The non-GAAP financial measures as defined above may differ from similarly titled measures presented by other companies. The non-GAAP financial measures should be read in conjunction with the Company’s financial statements contained in the Annual Report on Form 10-K included herein.
Note: This page is not part of the Company’s Annual Report on Form 10-K.
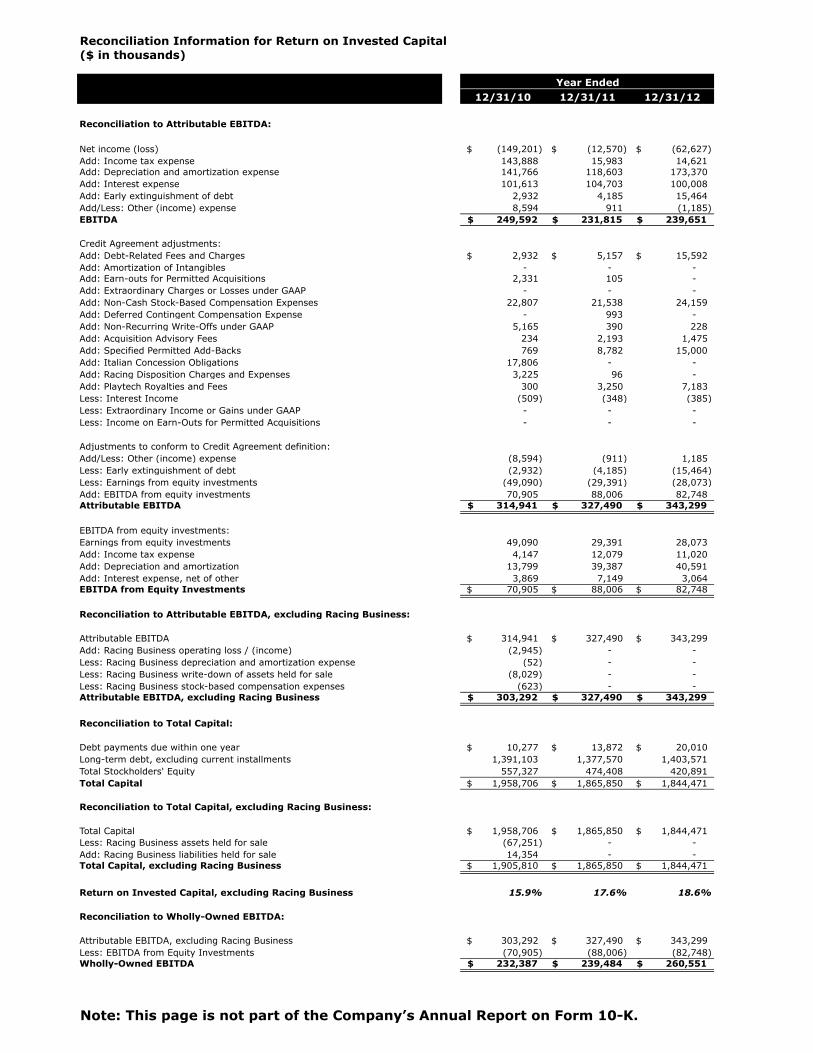
Reconciliation Information for Return on Invested Capital ($ in thousands)
Year Ended12/31/10 12/31/11 12/31/12
Reconciliation to Attributable EBITDA:
Net income (loss) (149,201)$ (12,570)$ (62,627)$ Add: Income tax expense 143,888 15,983 14,621 Add: Depreciation and amortization expense 141,766 118,603 173,370 Add: Interest expense 101,613 104,703 100,008 Add: Early extinguishment of debt 2,932 4,185 15,464 Add/Less: Other (income) expense 8,594 911 (1,185) EBITDA 249,592$ 231,815$ 239,651$
Credit Agreement adjustments:Add: Debt-Related Fees and Charges 2,932$ 5,157$ 15,592$ Add: Amortization of Intangibles - - - Add: Earn-outs for Permitted Acquisitions 2,331 105 - Add: Extraordinary Charges or Losses under GAAP - - - Add: Non-Cash Stock-Based Compensation Expenses 22,807 21,538 24,159 Add: Deferred Contingent Compensation Expense - 993 - Add: Non-Recurring Write-Offs under GAAP 5,165 390 228 Add: Acquisition Advisory Fees 234 2,193 1,475 Add: Specified Permitted Add-Backs 769 8,782 15,000 Add: Italian Concession Obligations 17,806 - - Add: Racing Disposition Charges and Expenses 3,225 96 - Add: Playtech Royalties and Fees 300 3,250 7,183 Less: Interest Income (509) (348) (385) Less: Extraordinary Income or Gains under GAAP - - - Less: Income on Earn-Outs for Permitted Acquisitions - - -
Adjustments to conform to Credit Agreement definition:Add/Less: Other (income) expense (8,594) (911) 1,185 Less: Early extinguishment of debt (2,932) (4,185) (15,464) Less: Earnings from equity investments (49,090) (29,391) (28,073) Add: EBITDA from equity investments 70,905 88,006 82,748 Attributable EBITDA 314,941$ 327,490$ 343,299$
EBITDA from equity investments:Earnings from equity investments 49,090 29,391 28,073 Add: Income tax expense 4,147 12,079 11,020 Add: Depreciation and amortization 13,799 39,387 40,591 Add: Interest expense, net of other 3,869 7,149 3,064 EBITDA from Equity Investments 70,905$ 88,006$ 82,748$
Reconciliation to Attributable EBITDA, excluding Racing Business:
Attributable EBITDA 314,941$ 327,490$ 343,299$ Add: Racing Business operating loss / (income) (2,945) - - Less: Racing Business depreciation and amortization expense (52) - - Less: Racing Business write-down of assets held for sale (8,029) - - Less: Racing Business stock-based compensation expenses (623) - - Attributable EBITDA, excluding Racing Business 303,292$ 327,490$ 343,299$
Reconciliation to Total Capital:
Debt payments due within one year 10,277$ 13,872$ 20,010$ Long-term debt, excluding current installments 1,391,103 1,377,570 1,403,571 Total Stockholders' Equity 557,327 474,408 420,891 Total Capital 1,958,706$ 1,865,850$ 1,844,471$
Reconciliation to Total Capital, excluding Racing Business:
Total Capital 1,958,706$ 1,865,850$ 1,844,471$ Less: Racing Business assets held for sale (67,251) - - Add: Racing Business liabilities held for sale 14,354 - - Total Capital, excluding Racing Business 1,905,810$ 1,865,850$ 1,844,471$
Return on Invested Capital, excluding Racing Business 15.9% 17.6% 18.6%
Reconciliation to Wholly-Owned EBITDA:
Attributable EBITDA, excluding Racing Business 303,292$ 327,490$ 343,299$ Less: EBITDA from Equity Investments (70,905) (88,006) (82,748) Wholly-Owned EBITDA 232,387$ 239,484$ 260,551$
Note: This page is not part of the Company’s Annual Report on Form 10-K.

(This page has been left blank intentionally.)
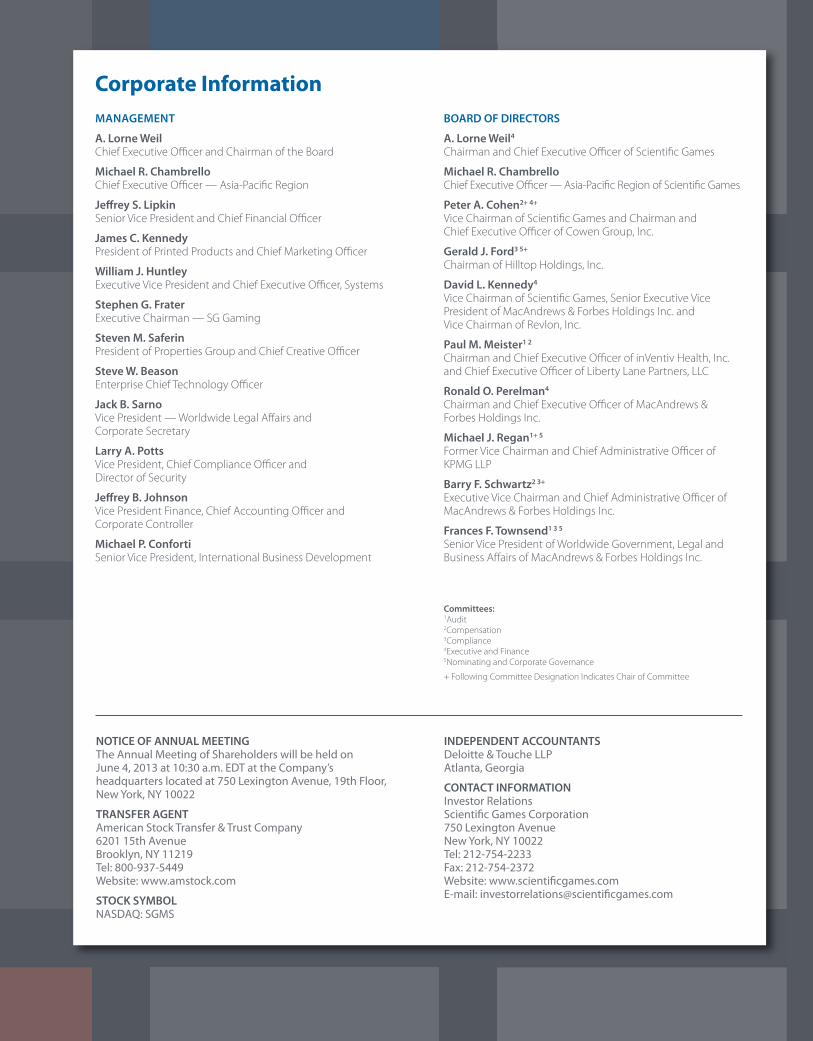
MANAGEMENT
A.�Lorne�Weilchief executive officer and chairman of the Board
Michael�R.�Chambrellochief executive officer — asia-pacific region
Jeffrey�S.�LipkinSenior Vice president and chief financial officer
James�C.�Kennedypresident of printed products and chief marketing officer
William�J.�Huntleyexecutive Vice president and chief executive officer, Systems
Stephen�G.�Fraterexecutive chairman — SG Gaming
Steven�M.�Saferinpresident of properties Group and chief creative officer
Steve�W.�Beasonenterprise chief technology officer
Jack�B.�SarnoVice president — Worldwide Legal affairs and corporate Secretary
Larry�A.�PottsVice president, chief compliance officer and Director of Security
Jeffrey�B.�JohnsonVice president finance, chief accounting officer andcorporate controller
Michael�P.�ConfortiSenior Vice president, international Business Development
BOARD�OF�DIRECTORS
A.�Lorne�Weil4chairman and chief executive officer of Scientific Games
Michael�R.�Chambrellochief executive officer — asia-pacific region of Scientific Games
Peter�A.�Cohen2+�4+
Vice chairman of Scientific Games and chairman and chief executive officer of cowen Group, inc.
Gerald�J.�Ford3�5+
chairman of Hilltop Holdings, inc.
David�L.�Kennedy4Vice chairman of Scientific Games, Senior executive Vicepresident of macandrews & forbes Holdings inc. and Vice chairman of revlon, inc.
Paul�M.�Meister1�2chairman and chief executive officer of inVentiv Health, inc.and chief executive officer of Liberty Lane partners, LLc
Ronald�O.�Perelman4
chairman and chief executive officer of macandrews &forbes Holdings inc.
Michael�J.�Regan1+�5
former Vice chairman and chief administrative officer ofKpmG LLp
Barry�F.�Schwartz2�3+executive Vice chairman and chief administrative officer ofmacandrews & forbes Holdings inc.
Frances�F.�Townsend1�3�5
Senior Vice president of Worldwide Government, Legal andBusiness affairs of macandrews & forbes Holdings inc.
Committees:1audit2compensation3compliance4executive and finance5nominating and corporate Governance
+ following committee Designation indicates chair of committee
NOTICE�OF�ANNUAL�MEETINGThe Annual Meeting of Shareholders will be held on June 4, 2013 at 10:30 a.m. EDT at the Company’s headquarters located at 750 Lexington Avenue, 19th Floor,New York, NY 10022
TRANSFER�AGENTAmerican Stock Transfer & Trust Company6201 15th AvenueBrooklyn, NY 11219Tel: 800-937-5449Website: www.amstock.com
STOCK�SYMBOLNASDAQ: SGMS
INDEPENDENT�ACCOUNTANTSDeloitte & Touche LLPAtlanta, Georgia
CONTACT�INFORMATIONInvestor RelationsScientific Games Corporation750 Lexington AvenueNew York, NY 10022Tel: 212-754-2233Fax: 212-754-2372Website: www.scientificgames.comE-mail: [email protected]
Corporate Information
Delivering�Results,�Driving�
Transformation
Scien
tific G
am
eS co
rporatio
n2012 A
NN
UA
L REPORT
2012 ANNUALREPORT
SCIENTIFIC GAMES CORPORATION750 Lexington AvenueNew York, NY 10022www.scientificgames.com
Related Documents