1 Copyright © 2015 The Nielsen Company FEATURED INSIGHTS ANTICIPATE WITH ANALYTICS: THE FUTURE OF FMCG DELIVERING CONSUMER CLARITY IDENTIFYING EARLY INDICATORS OF SLOWDOWN AND RECOVERY IN THE INDIAN FMCG MARKET • Despite a spate of economic slowdowns since 2008, India’s FMCG industry has been growing positively, though growth margins have diminished. • A predictive model capable of foreseeing an impending slowdown can help manufacturers formulate customised strategies. Globalization has given Indians infinitely more choices than we have ever had and connected us to the world, but in return, it has also left us with an Achilles heel. Increased trade and interdependence between nations has exposed the country to the effects of economic slowdowns in different parts of the world. Whether as a mere precaution or a sign of actual crisis, India has seen frequent bouts of uncertainty since the global financial meltdown in 2008. And the frequency of these slowdowns has left the market looking for a plan to both predict and prepare for economic turbulence. Consumer sentiment and business behaviour have always been indicative of industry trends. Studying such patterns, along with macro- economic indicators like gross domestic product (GDP) and index of industrial production (IIP) to develop as objective and accurate a metric as possible, can help prepare India Inc.—and particularly the country’s fast-moving consumer goods (FMCG) industry—to cross any bridge of economic uncertainty that might appear on the horizon.

Welcome message from author
This document is posted to help you gain knowledge. Please leave a comment to let me know what you think about it! Share it to your friends and learn new things together.
Transcript

1Copyright © 2015 The Nielsen Company
F E AT U R E D I N S I G H T S
A N T I C I PAT E W I T H A N A LY T I C S: T H E F U T U R E O F F M C G
DELIVERING CONSUMER CLARITY
IDENTIF YING EARLY INDICATORS OF SLOWDOWN AND RECOVERY IN THE INDIAN FMCG MARKET
• Despite a spate of economic slowdowns since 2008,India’s FMCG industry has been growing positively,thoughgrowthmarginshavediminished.
• Apredictivemodelcapableofforeseeinganimpendingslowdowncanhelpmanufacturersformulatecustomisedstrategies.
Globalization has given Indians infinitely more choices than we have
ever had and connected us to the world, but in return, it has also left
us with an Achilles heel. Increased trade and interdependence between
nations has exposed the country to the effects of economic slowdowns
in different parts of the world. Whether as a mere precaution or a sign
of actual crisis, India has seen frequent bouts of uncertainty since
the global financial meltdown in 2008. And the frequency of these
slowdowns has left the market looking for a plan to both predict and
prepare for economic turbulence.
Consumer sentiment and business behaviour have always been
indicative of industry trends. Studying such patterns, along with macro-
economic indicators like gross domestic product (GDP) and index of
industrial production (IIP) to develop as objective and accurate a metric
as possible, can help prepare India Inc.—and particularly the country’s
fast-moving consumer goods (FMCG) industry—to cross any bridge of
economic uncertainty that might appear on the horizon.
2 FEATURED INSIGHTS | ANTICIPATE WITH ANALYTICS: THE FUTURE OF FMCG
DEVELOPING A PREDICTIVE MODEL FOR ECONOMIC SLOWDOWNThe Reserve Bank of India (RBI) Technical Advisory Group lists the major
macro-economic indicators of a slowdown to be GDP, IIP, wages of factory
workers and monthly registered unemployment figures. However, the
need for accuracy demands that we narrow this list down to eliminate
those factors that are dependent on variables, like seasonal changes. For
instance, GDP comprises the three major components of agriculture,
service and manufacturing. Of these, agricultural trends are primarily
seasonal in nature and the services sector follows a fixed pattern, making
both unreliable indicators of economic activity. The manufacturing sector
is critical for India’s GDP, which has the potential to reach USD 1 trillion
by 2025 and contribute approximately 25-30% to India’s GDP from the
current contribution of 15-16%. Hence, it becomes even more imperative
to consider the manufacturing sector as a determinant (in this case, the
dependent variable in our model) for an accurate predictive model.
Apart from manufacturing, the following key measures have historically
shown a link with an impending economic slowdown. Consequently, the
following independent variables are included in the model.
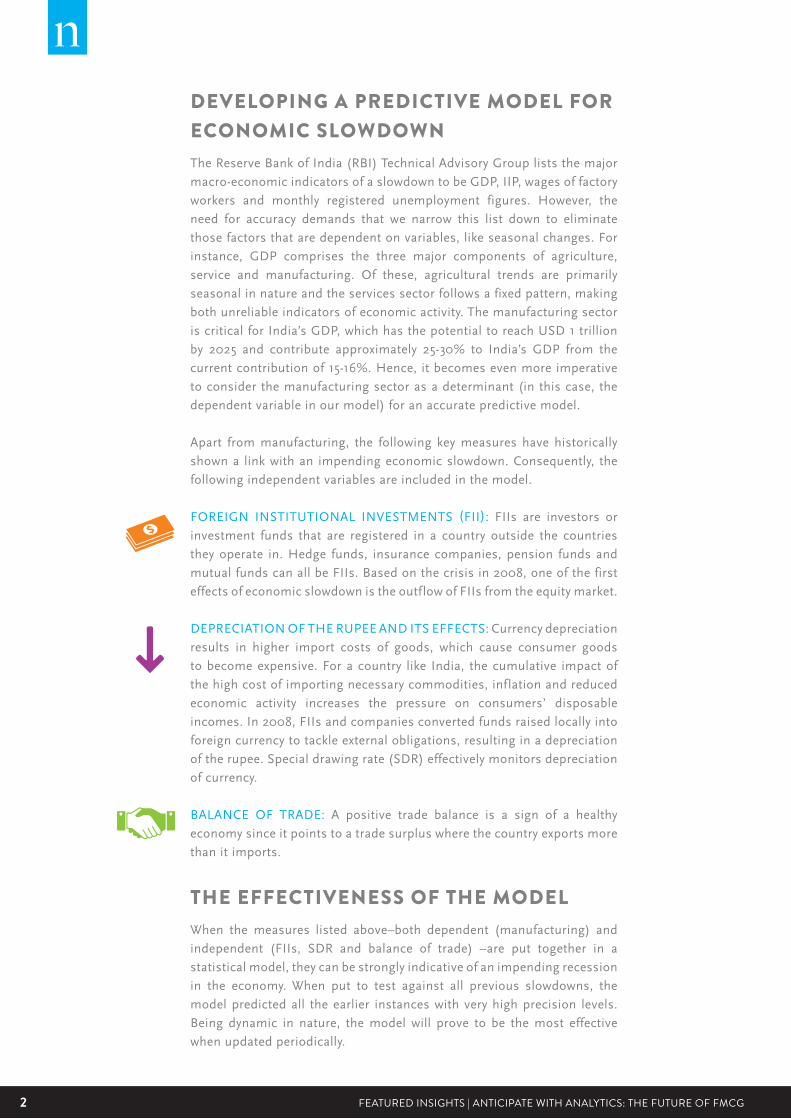
FOREIGN INSTITUTIONAL INVESTMENTS (FII): FIIs are investors or
investment funds that are registered in a country outside the countries
they operate in. Hedge funds, insurance companies, pension funds and
mutual funds can all be FIIs. Based on the crisis in 2008, one of the first
effects of economic slowdown is the outflow of FIIs from the equity market.
DEPRECIATION OF THE RUPEE AND ITS EFFECTS: Currency depreciation
results in higher import costs of goods, which cause consumer goods
to become expensive. For a country like India, the cumulative impact of
the high cost of importing necessary commodities, inflation and reduced
economic activity increases the pressure on consumers’ disposable
incomes. In 2008, FIIs and companies converted funds raised locally into
foreign currency to tackle external obligations, resulting in a depreciation
of the rupee. Special drawing rate (SDR) effectively monitors depreciation
of currency.
BALANCE OF TRADE: A positive trade balance is a sign of a healthy
economy since it points to a trade surplus where the country exports more
than it imports.
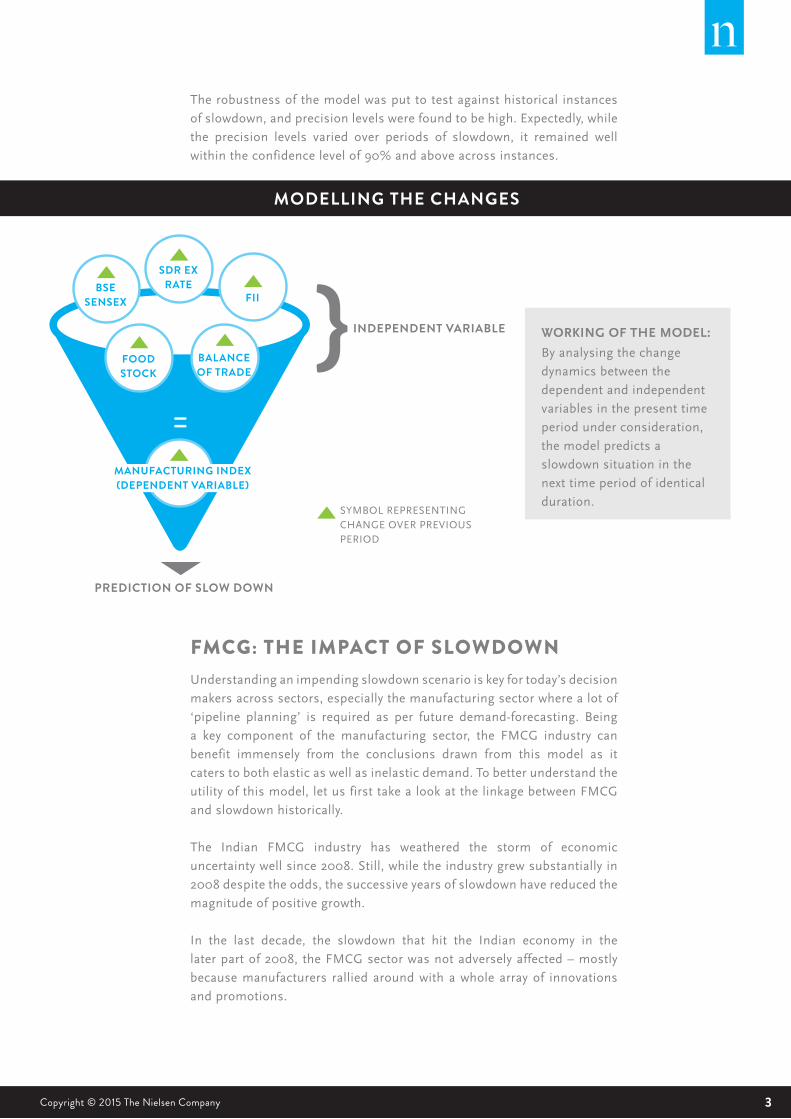
THE EFFECTIVENESS OF THE MODELWhen the measures listed above–both dependent (manufacturing) and
independent (FIIs, SDR and balance of trade) –are put together in a
statistical model, they can be strongly indicative of an impending recession
in the economy. When put to test against all previous slowdowns, the
model predicted all the earlier instances with very high precision levels.
Being dynamic in nature, the model will prove to be the most effective
when updated periodically.
PREDICTION OF SLOW DOWN
3Copyright © 2015 The Nielsen Company
The robustness of the model was put to test against historical instances
of slowdown, and precision levels were found to be high. Expectedly, while
the precision levels varied over periods of slowdown, it remained well
within the confidence level of 90% and above across instances.
FMCG: THE IMPACT OF SLOWDOWNUnderstanding an impending slowdown scenario is key for today’s decision
makers across sectors, especially the manufacturing sector where a lot of
‘pipeline planning’ is required as per future demand-forecasting. Being
a key component of the manufacturing sector, the FMCG industry can
benefit immensely from the conclusions drawn from this model as it
caters to both elastic as well as inelastic demand. To better understand the
utility of this model, let us first take a look at the linkage between FMCG
and slowdown historically.
The Indian FMCG industry has weathered the storm of economic
uncertainty well since 2008. Still, while the industry grew substantially in
2008 despite the odds, the successive years of slowdown have reduced the
magnitude of positive growth.
In the last decade, the slowdown that hit the Indian economy in the
later part of 2008, the FMCG sector was not adversely affected – mostly
because manufacturers rallied around with a whole array of innovations
and promotions.
MODELLING THE CHANGES
WORKING OF THE MODEL:
By analysing the change
dynamics between the
dependent and independent
variables in the present time
period under consideration,
the model predicts a
slowdown situation in the
next time period of identical
duration.
INDEPENDENT VARIABLE}
PREDICTION OF SLOW DOWN
SYMBOL REPRESENTING CHANGE OVER PREVIOUS PERIOD
BSE SENSEX
SDR EXRATE
FII
FOODSTOCK
BALANCEOF TRADE
=MANUFACTURING INDEX (DEPENDENT VARIABLE)
4 FEATURED INSIGHTS | ANTICIPATE WITH ANALYTICS: THE FUTURE OF FMCG
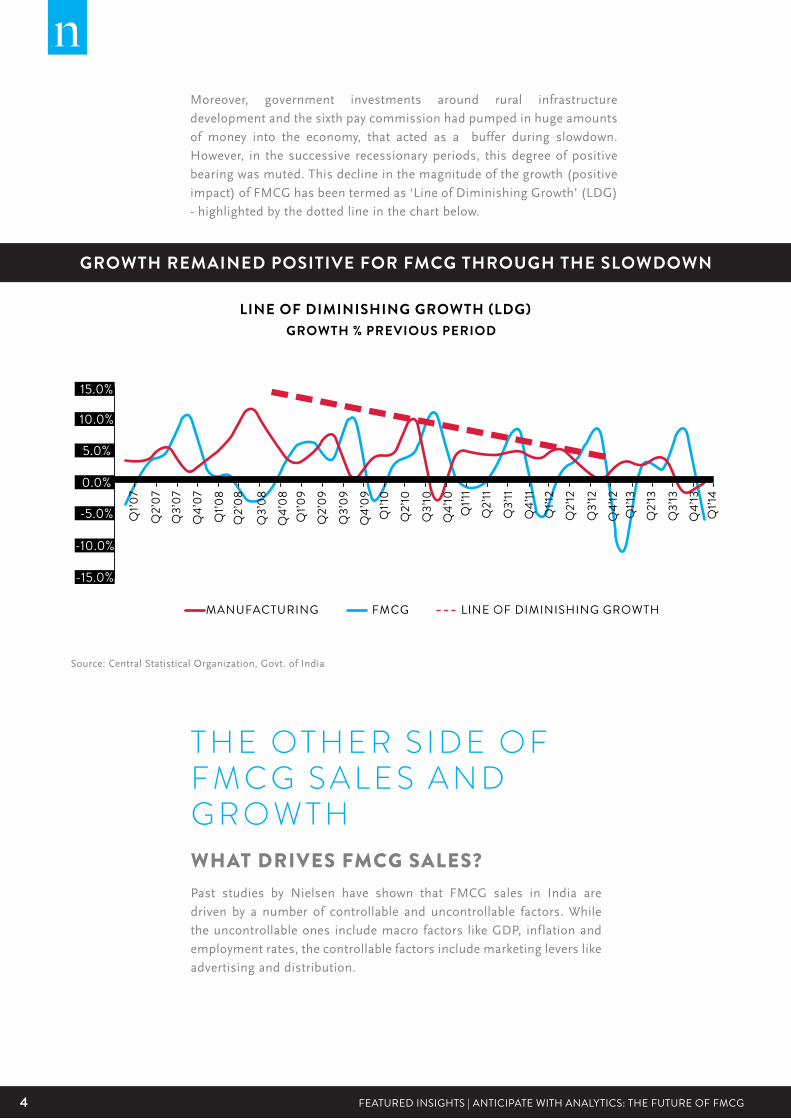
GROWTH REMAINED POSITIVE FOR FMCG THROUGH THE SLOWDOWN
LINE OF DIMINISHING GROWTH (LDG)GROWTH % PREVIOUS PERIOD
Source: Central Statistical Organization, Govt. of India
Q1’0
7
15.0%
10.0%
5.0%
-5.0%
-10.0%
-15.0%
0.0%
Q1’0
8
Q1’0
9
Q1’10
Q1’12
Q1’13
Q1’14
Q1’11
Q2’07
Q2’08
Q2’09
Q2’10
Q2’12
Q2’13
Q2’11
Q3’07
Q3’08
Q3’09
Q3’10
Q3’12
Q3’13
Q3’11
Q4’07
Q4’08
Q4’09
Q4’10
Q4’12
Q4’13
Q4’11
MANUFACTURING FMCG LINEOFDIMINISHINGGROWTH
Moreover, government investments around rural infrastructure
development and the sixth pay commission had pumped in huge amounts
of money into the economy, that acted as a buffer during slowdown.
However, in the successive recessionary periods, this degree of positive
bearing was muted. This decline in the magnitude of the growth (positive
impact) of FMCG has been termed as ‘Line of Diminishing Growth’ (LDG)
- highlighted by the dotted line in the chart below.
T H E OT H E R S I D E O F F M C G S A L E S A N D G R O W T HWHAT DRIVES FMCG SALES?Past studies by Nielsen have shown that FMCG sales in India are
driven by a number of controllable and uncontrollable factors. While
the uncontrollable ones include macro factors like GDP, inflation and
employment rates, the controllable factors include marketing levers like
advertising and distribution.
5Copyright © 2015 The Nielsen Company
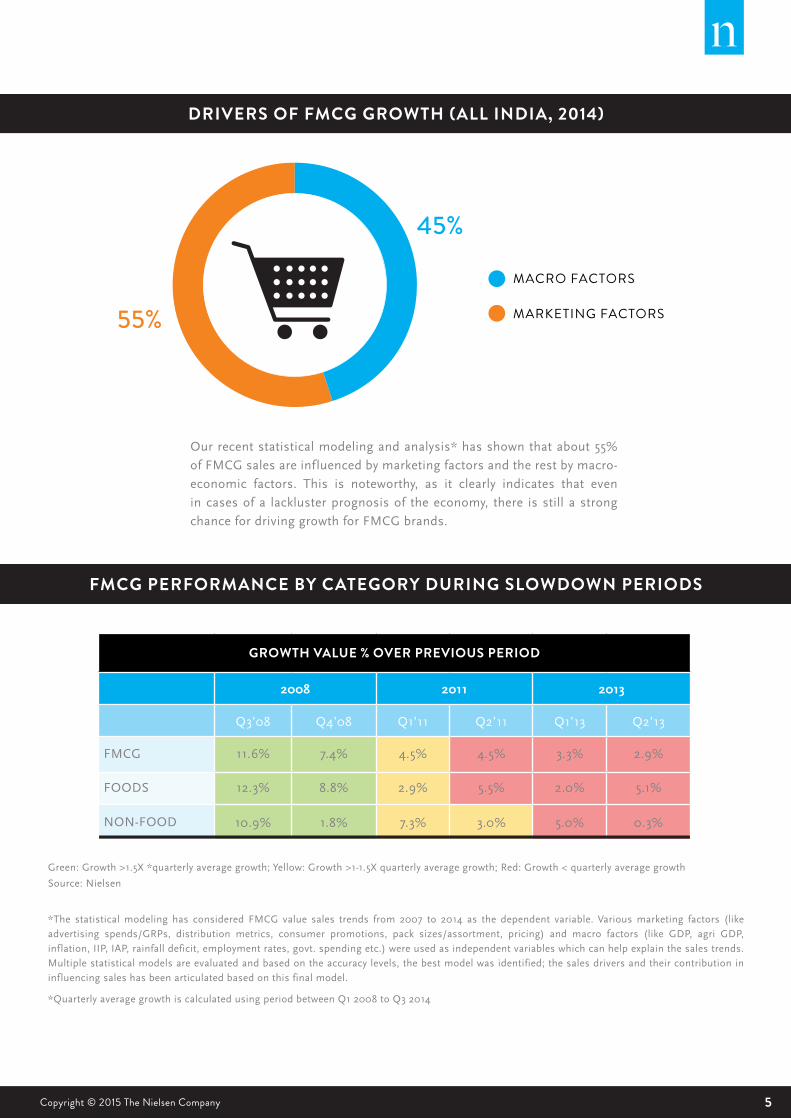
DRIVERS OF FMCG GROWTH (ALL INDIA, 2014)
Green: Growth >1.5X *quarterly average growth; Yellow: Growth >1-1.5X quarterly average growth; Red: Growth < quarterly average growth
Source: Nielsen
*The statistical modeling has considered FMCG value sales trends from 2007 to 2014 as the dependent variable. Various marketing factors (like advertising spends/GRPs, distribution metrics, consumer promotions, pack sizes/assortment, pricing) and macro factors (like GDP, agri GDP, inflation, IIP, IAP, rainfall deficit, employment rates, govt. spending etc.) were used as independent variables which can help explain the sales trends. Multiple statistical models are evaluated and based on the accuracy levels, the best model was identified; the sales drivers and their contribution in influencing sales has been articulated based on this final model.
*Quarterly average growth is calculated using period between Q1 2008 to Q3 2014
MACROFACTORS
MARKETINGFACTORS
FMCG PERFORMANCE BY CATEGORY DURING SLOWDOWN PERIODS
Our recent statistical modeling and analysis* has shown that about 55%
of FMCG sales are influenced by marketing factors and the rest by macro-
economic factors. This is noteworthy, as it clearly indicates that even
in cases of a lackluster prognosis of the economy, there is still a strong
chance for driving growth for FMCG brands.
45%
55%
GROWTH VALUE % OVER PREVIOUS PERIOD
2008 2011 2013
Q3’08 Q4’08 Q1’11 Q2’11 Q1’13 Q2’13
FMCG 11.6% 7.4% 4.5% 4.5% 3.3% 2.9%
FOODS 12.3% 8.8% 2.9% 5.5% 2.0% 5.1%
NON-FOOD 10.9% 1.8% 7.3% 3.0% 5.0% 0.3%

6 FEATURED INSIGHTS | ANTICIPATE WITH ANALYTICS: THE FUTURE OF FMCG
In FMCG sector, food categories’ growth remained stronger than
non-food during the slowdown period. However certain categories
within each segment exhibited LDG indicating a higher impact of
the slowdown. These categories could be grouped under two broad
segments - premium or evolving and discretionary.
In the phase preceding the slowdown, evolving categories like breakfast
cereals, ketchups, coffee, air fresheners, hair removers and floor
cleaners, which had the headroom to increase retail and consumer
penetration, showed high growth. However, when the economic
situation turned grim, a section of these consumers may have quickly
moved out of the categories leading to starker slowdown.
Similar slowdown impact was visible in some of the bigger but
discretionary categories like biscuits, vermicelli and noodles, MFDs
in food and insecticide repellant, fragrances and hair oils in non-food
space.
On other hand, certain categories showed a lesser impact of the
slowdown. This included necessity categories like toothpaste, toilet
soaps, washing powder, salt or those with health and wellness benefits
like sanitary napkins, analgesics, prickly heat powder and milk food.
These categories did not exhibit LDG and their growth over YA in latest
slowdown phase (Jan-Jun 2013) was higher than in previous one (Jan
– Jun 2011).
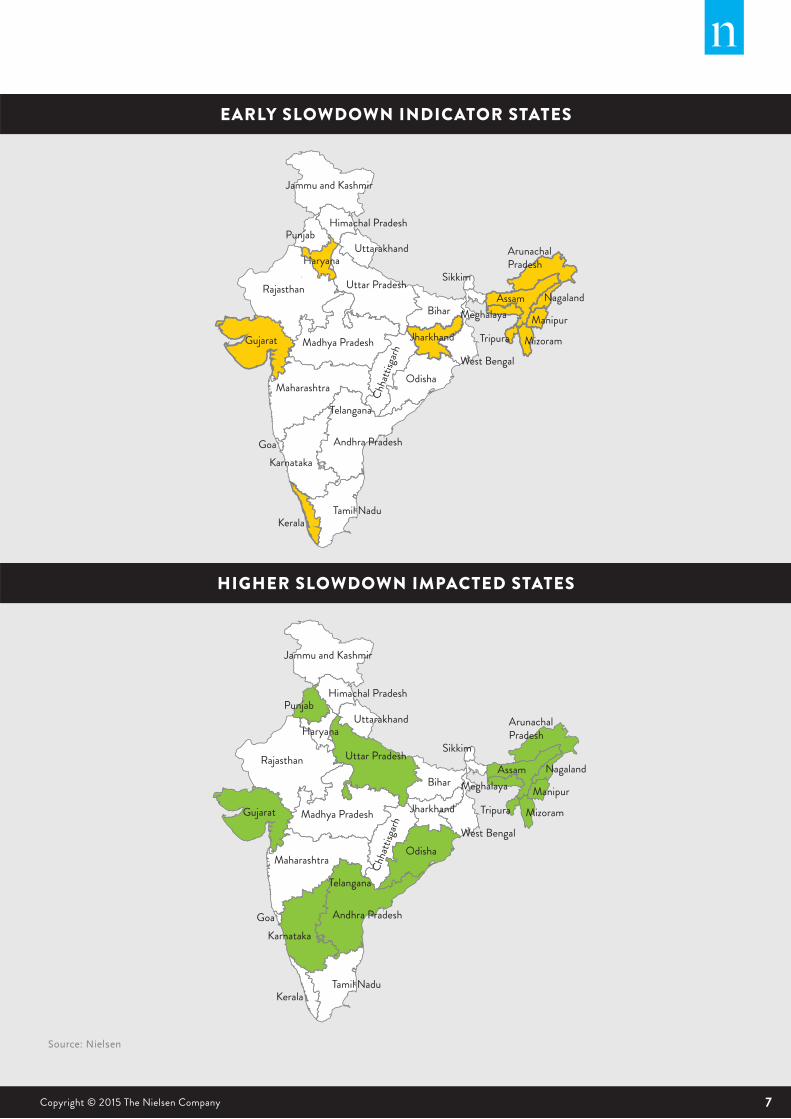
STATES REPRESENTING UPCOMING FMCG TRENDSMarkets across the country react differently to changing economic
scenarios, and tracking them in each region can be useful in spotting a
slowdown well in advance.
Our analysis found that certain states show the signs of an impending
slowdown at least a quarter before it impacts other markets and hence
should be watched out for during times of uncertainty. These include
states like Kerala and Assam, which have relatively higher exposure to
premium products along with states like Gujarat, Jharkhand which have
higher than average contribution from manufacturing sector.
Some of these states also top the list of most affected markets during a
slowdown along with few others. However our study found the south zone
performance to be the best representative of the effect of a slowdown. This
could possibly be due to higher exposure to discretionary spending given
the higher net state domestic product (SDP), high per-capita income.
7Copyright © 2015 The Nielsen Company
EARLY SLOWDOWN INDICATOR STATES
Source: Nielsen
HIGHER SLOWDOWN IMPACTED STATES
UttarPradesh

8 Copyright © 2015 The Nielsen CompanyFEATURED INSIGHTS | ANTICIPATE WITH ANALYTICS: THE FUTURE OF FMCG
HOW TO SAIL THROUGH THE SLOWDOWNBrands have tested different strategies during difficult times, resulting
in some hits as well as a few misses. The predictive model helps identify
those strategies and best practices that have worked well in the face of
a slowdown.
Studies conducted by Nielsen at different times indicate that various
strategies adopted by marketers apart from distribution like limited
price revisions, smart product innovations, effectively hand-holding
channel partners etc., help buffer the impact of a slowdown.
DISTRIBUTIONMost successful brands that outperformed during recession added
outlets even during slow phases. Within this, reaching the ‘right
store=high throughput store’ for the category is important.
PRICE CONTROLSuccessful brands kept price increases within inflationary limits
and not pass it on to the consumers
INNOVATIONInnovations in all forms became differentiators for successful
brands. This also includes pack format innovation and price point
innovations. Particularly important is the role of sachets/low unit
packs in a market like India
INCREASED AD SPENDSAwareness is an important driver of FMCG sales. Major FMCG
companies increased ad spends by approximately 20% during
slowdown to build and maintain awareness.
SERVICE EFFICIENCYSuccessful brands increased service levels with
channel partners
CO-BRANDINGBrands shared marketing expenditure
BRAND EXTENSIONSCompanies leveraged umbrella brands to create winning extensions

9Copyright © 2015 The Nielsen Company
THE NIELSEN QUALITATIVE VIEWPREDICTING A SLOWDOWN IN FMCGBY: SARBANI SEN, DIRECTOR, NIELSEN INDIA
• Despite the overarching wave of the economic slowdown, the impact on consumer buying behaviour still differs across geography.
• The task at hand for marketers is to identify and focus on these markets, adopt local strategies and implement them swiftly to gain share of wallet.
• Enticing the ‘cautious’ consumer calls for understanding what ‘value’ means to them during recessionary times so that product portfolio, SKU mix and pricing strategies can be suitably modified.
• Uncertain times harbour undercurrents of insecurity across social strata. Brand communication should focus on emotional reassurance giving consumers the much needed confidence and hope that it’s only a matter of time before things start looking up.
• With significant global and local competition chasing the same opportunities, companies that can best cater to the local consumer and channel needs, are most likely to succeed.

10 FEATURED INSIGHTS | ANTICIPATE WITH ANALYTICS: THE FUTURE OF FMCG
ABOUTTHEAUTHORS
Ayan Dasgupta, Avirup Chakraborty, Suman Sarkar and Krishna Kamal
Mishra from the Sales Effectiveness team contributed to this issue of
Featured Insights.
VIJAY UDASI
SENIOR VICE PRESIDENT
NIELSEN INDIA
SANCHALI CHAKRABORTY
DIRECTOR
NIELSEN INDIA
AJR VASU
DIRECTOR
NIELSEN INDIA
ABOUTNIELSENNielsen N.V. (NYSE: NLSN) is a global performance management
company that provides a comprehensive understanding of what
consumers Watch and Buy. Nielsen’s Watch segment provides
media and advertising clients with Total Audience measurement
services across all devices where content — video, audio and text
— is consumed. The Buy segment offers consumer packaged goods
manufacturers and retailers the industry’s only global view of retail
performance measurement. By integrating information from its Watch
and Buy segments and other data sources, Nielsen provides its clients
with both world-class measurement as well as analytics that help
improve performance. Nielsen, an S&P 500 company, has operations
in over 100 countries that cover more than 90 percent of the world’s
population.
For more information, visit www.nielsen.com.
Copyright © 2015 The Nielsen Company. All rights reserved. Nielsen
and the Nielsen logo are trademarks or registered trademarks of
CZT/ACN Trademarks, L.L.C. Other product and service names are
trademarks or registered trademarks of their respective companies.
Related Documents