Delivering and Managing Roads for Safety Using Continuous Friction Measurement Ryland Potter Director of Business Development, WDM USA Presentation prepared for the Asset Management and Road Safety session of the 2020 TAC Conference & Exhibition, Vancouver, B.C.

Welcome message from author
This document is posted to help you gain knowledge. Please leave a comment to let me know what you think about it! Share it to your friends and learn new things together.
Transcript
Delivering and Managing Roads for Safety Using
Continuous Friction Measurement
Ryland Potter
Director of Business Development, WDM USA
Presentation prepared for the Asset Management and Road Safety session of the
2020 TAC Conference & Exhibition, Vancouver, B.C.

OVERVIEW
2
• What is the relationship between friction and safety?
• How can we improve road safety through technical road maintenance and safety-focused
asset management?
• What are lessons learned for sustaining pavement friction management program benefits
while adapting to changing budgetary and industry conditions?
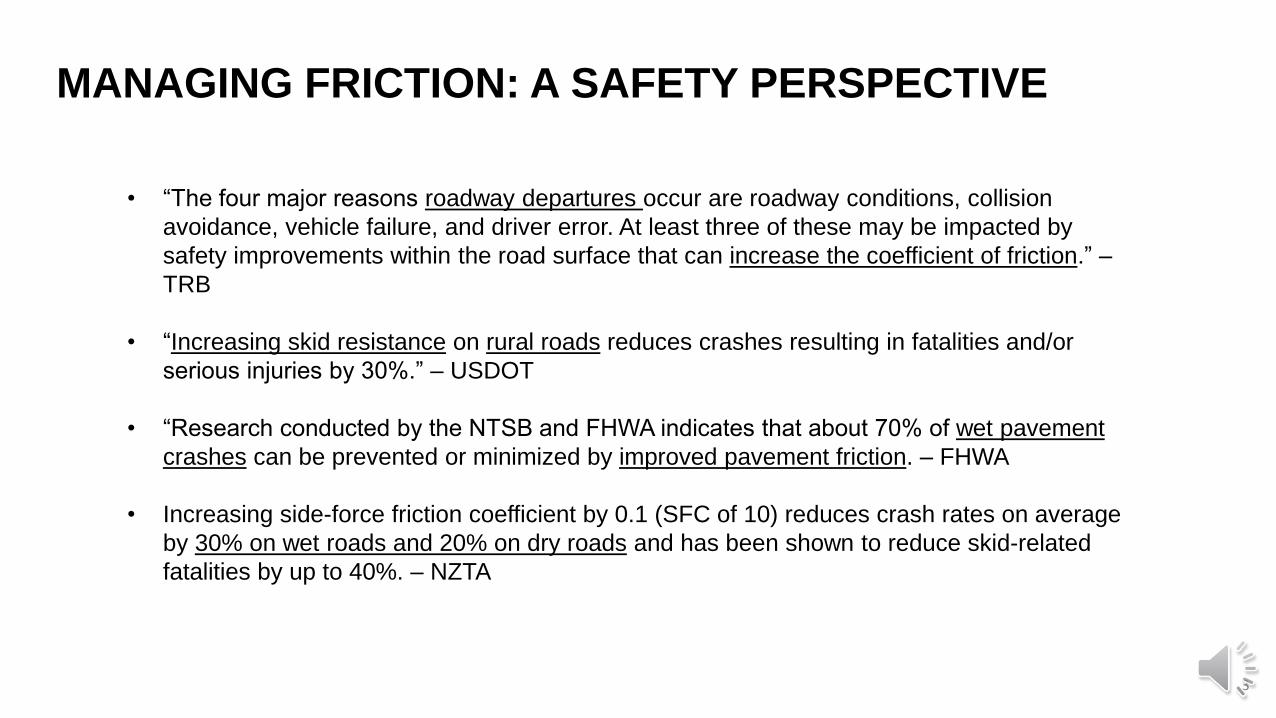
MANAGING FRICTION: A SAFETY PERSPECTIVE
3
• “The four major reasons roadway departures occur are roadway conditions, collision
avoidance, vehicle failure, and driver error. At least three of these may be impacted by
safety improvements within the road surface that can increase the coefficient of friction.” –
TRB
• “Increasing skid resistance on rural roads reduces crashes resulting in fatalities and/or
serious injuries by 30%.” – USDOT
• “Research conducted by the NTSB and FHWA indicates that about 70% of wet pavement
crashes can be prevented or minimized by improved pavement friction. – FHWA
• Increasing side-force friction coefficient by 0.1 (SFC of 10) reduces crash rates on average
by 30% on wet roads and 20% on dry roads and has been shown to reduce skid-related
fatalities by up to 40%. – NZTA
MANAGING FRICTION: AN ASSET MANAGEMENT PERSPECTIVE
4FHWA, “Pavement Friction Management.” Technical Advisory T 5040.38
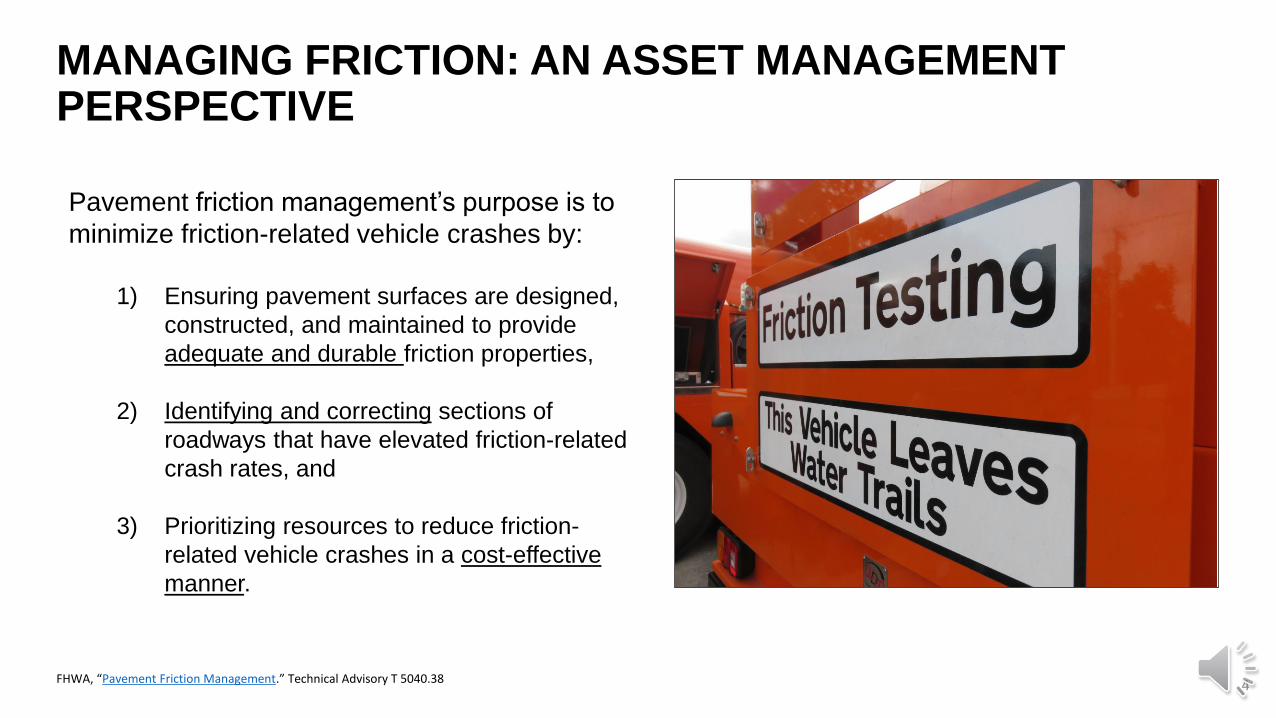
Pavement friction management’s purpose is to
minimize friction-related vehicle crashes by:
1) Ensuring pavement surfaces are designed,
constructed, and maintained to provide
adequate and durable friction properties,
2) Identifying and correcting sections of
roadways that have elevated friction-related
crash rates, and
3) Prioritizing resources to reduce friction-
related vehicle crashes in a cost-effective
manner.

HOW MUCH FRICTION IS ENOUGH?
5Dias and Choi, “Development of Safety Related Investigatory Level Guidelines: A Worked Example of Methodology.” AP-T233-13Long, “Quantitative Relationships between Crash Risks and Pavement Skid Resistance.” University of Texas
• Managing friction relies on a system of identifying appropriate/adequate skid resistance
levels for various locations, “in proportion to the ‘crash risk’ presented at those locations”
• Most transportation authorities set levels by
plotting crash risk against network-level
friction measurements to find the inflection
point where crash risk increases rapidly with
lower friction
• Some evidence that investigatory levels are
broadly similar across different networks
BUT there is no set methodology to
determine a skid resistance threshold that
will make a hazardous location ‘safe’

EFFECTIVE PAVEMENT FRICTION MANAGEMENT RELIES ON CONTINUOUS FRICTION MEASUREMENT
6
Two “knowns” of friction:
1) Friction’s ability to reduce crashes is
greatest at high-risk areas, e.g., curves,
intersections, congestion zones, work
zones, ramps and highway merges, and
grade changes.
2) Friction supply is often lowest where
friction demand is highest and is highly
variable: cross-slope, pavement design
life, aggregate selection, traffic volumes,
and texture play a role
Continuous friction facilitates:
1) Measurement through curves, ramps,
highway merges, grade changes, and at
intersections
2) Greater precision and detail of spatial
variability – data for every foot of every mile
vs. sample
3) Greater correspondence to current vehicle
operating conditions (testing in the same
critical slip range as ABS-equipped vehicles)
4) The creation of a common measure/shared
dataset from which multiple divisions can
make decisions

CONTINUOUS FRICTION USE CASES
7
1) Monitoring network skid resistance using formal pavement friction
management program
2) Inventorying horizontal curves, modeling approach and curve speeds, and
predicting curve crash risk and severity
3) Delineating impact of friction, texture, geometrics, etc. on safety performance
4) Improving countermeasure selection and countermeasure placement
5) Refining aggregate selection in design and maintenance
6) Building better asset deterioration and lifecycle cost models

EVOLUTION OF PAVEMENT FRICTION MANAGEMENT
8
1958
1st Int’l
Conference
on Skid
Resistant
Pavement 1973
LR510: A
Guide to
Skidding
Resistance
for Roads
1976
1976
1st specs for
aggregate
properties
and texture
depth
(H1/6/76)
AASHTO
Guidelines for
Skid Resistant
Pavement
Design
1987
Policies on
skid resistance
& aggregate
properties
(HD 15/87 &
HA 36/87)
1980
NTSB
concludes that
fatal accidents
occur on wet
pavements
3.9-4.5x the
rate on dry
pavements
2006
Review/updates to skid
policy and aggregate
standards (LR510 (73),
HD28/94, HD28/04,
HD36/06)
2004
State-level WARPs
report results: wet
accident rate 44%
higher for sites with
skid numbers <= 30
than for sites with skid
numbers >30
2010
FHWA
Pavement
Friction
Mgmt
Advisory
(T5040.38)
2019
UK CS 228: “The provision of
appropriate levels of skid resistance is
treated primarily as an asset
management issue rather than one of
road safety engineering”
2015
FHWA
pilots
Pavement
Friction
Mgmt
Programs in
four states
2020
FHWA announces effort to “advance
continuous pavement friction
measurement techniques and practices
for improving safety in the US”;
network-level, continuous friction-
based pavement friction management
program development and/or testing in
additional six states
United States
United Kingdom
9Transport Scotland, “Road Asset Management Plan for Scottish Trunk Roads.”McLaughlin, Paterson, and Stephenson. “Implementing the Transport Scotland skid policy through the Use of Operating Companies.”
CASE STUDY: TRANSPORT SCOTLAND
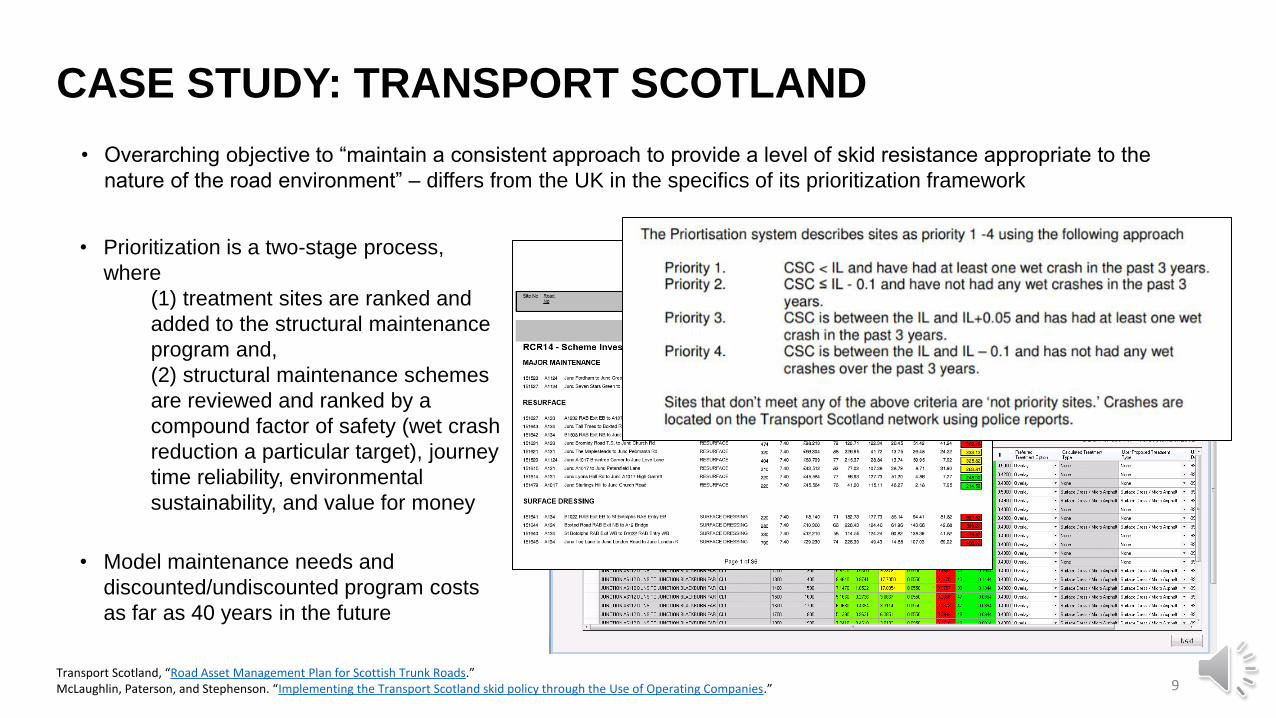
• Overarching objective to “maintain a consistent approach to provide a level of skid resistance appropriate to the
nature of the road environment” – differs from the UK in the specifics of its prioritization framework
• Prioritization is a two-stage process,
where
(1) treatment sites are ranked and
added to the structural maintenance
program and,
(2) structural maintenance schemes
are reviewed and ranked by a
compound factor of safety (wet crash
reduction a particular target), journey
time reliability, environmental
sustainability, and value for money
• Model maintenance needs and
discounted/undiscounted program costs
as far as 40 years in the future
10
CASE STUDY: NEW ZEALAND TRANSPORT AGENCY
• Pavement friction management program evolved from hotspot reduction to a proactive “safety management”
approach with an overarching objective of “equalizing crash risk while maintaining an economic balance”
• Projects scored using a “best value safety outcome” metric – sites are prioritized based on the difference
between friction demand and supply and observed crashes and treatment costs are analyzed using BCR and
calculating a “safety savings” NPV
• Treatments are selected if they achieve a BCR >20 or meet a metric of # fatalities and serious injuries saved
over 10 years per $100 million invested
• To avoid potential conflicts between asset preservation and safety when budgets are constrained, NZTA has
“ring-fenced” funding to address sites where skid resistance and safety are the only treatment drivers; NZTA
also tracks the amount of duplicate surfacing activity eliminated with timely maintenance treatments that are
selected to achieve a safety outcome
Owen, “An Overview of NZ History with Skid Resistance on the Highway Network.”

COMPARATIVE EXAMPLE: HFST SPECIFICATION
11
UK policy recommends systemic HFST use based
on friction demand and traffic
NZTA specifies naturally-occurring skid resistant
aggregates, using modeling to predict/set skid
performance targets for chipseals over a 10+ year
service life

COMPARATIVE APPROACH: BALANCING SAFETY AND ASSET MANAGEMENT
12
Transport Scotland
• Predictable schedule/cost for
investigations
• Easier to treat adjacent SCRIM sites as
part of programmed maintenance/asset
management
• Inconsistent standards triggering detailed
investigation across network (different
standards of use around crash records)
• Sites without history of crashes
deprioritized
NZTA
• Ring-fenced funding removes “engineers’
dilemma between prioritizing asset preservation
vs. safety when budgets are constrained”
• Ability to weigh proactively treating sites with
low skid resistance but no recorded crash
history
• Ring-fenced funding only covers surface-type
treatments and some concern that cost a
limiting factor if chipseal life is reduced
• Inconsistent application at local level
Both offer flexibility to adjust based on different funding scenarios,
promote systemically-effective skid treatments, and require a safety
and asset management to be brought into balance.
13
15,567
12,784
3,124
3,656
2,800
2,900
3,000
3,100
3,200
3,300
3,400
3,500
3,600
3,700
-
2,000
4,000
6,000
8,000
10,000
12,000
14,000
16,000
18,000
2006 2007 2008 2009 2010 2011 2012 2013 2014 2015 2016
Injuries and Fatalities Vehicle Registrations (000s)
vehicle registrations
(‘000s)
# injuries and fatalities
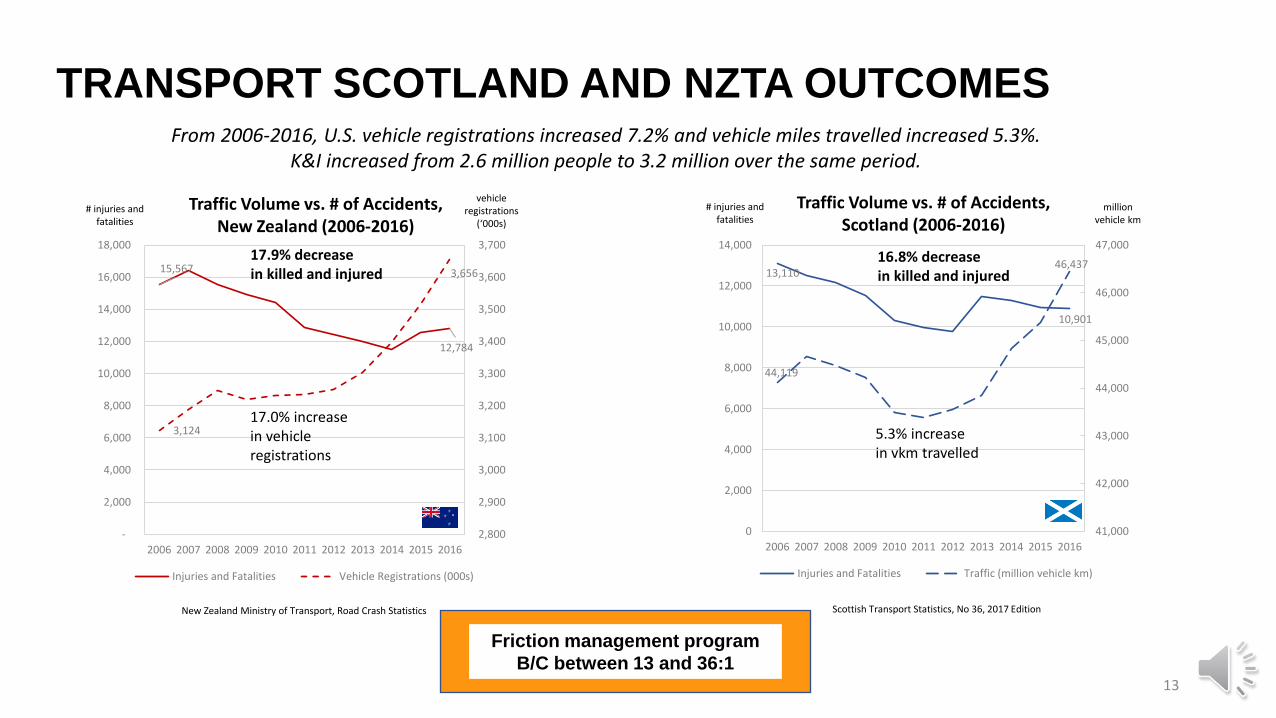
Traffic Volume vs. # of Accidents,New Zealand (2006-2016)
17.0% increasein vehicle registrations
17.9% decreasein killed and injured
Scottish Transport Statistics, No 36, 2017 Edition
13,110
10,901
44,119
46,437
41,000
42,000
43,000
44,000
45,000
46,000
47,000
0
2,000
4,000
6,000
8,000
10,000
12,000
14,000
2006 2007 2008 2009 2010 2011 2012 2013 2014 2015 2016
Injuries and Fatalities Traffic (million vehicle km)
16.8% decreasein killed and injured
5.3% increasein vkm travelled
million vehicle km
# injuries and fatalities
Traffic Volume vs. # of Accidents, Scotland (2006-2016)
New Zealand Ministry of Transport, Road Crash Statistics
From 2006-2016, U.S. vehicle registrations increased 7.2% and vehicle miles travelled increased 5.3%. K&I increased from 2.6 million people to 3.2 million over the same period.
Friction management program
B/C between 13 and 36:1
TRANSPORT SCOTLAND AND NZTA OUTCOMES
14
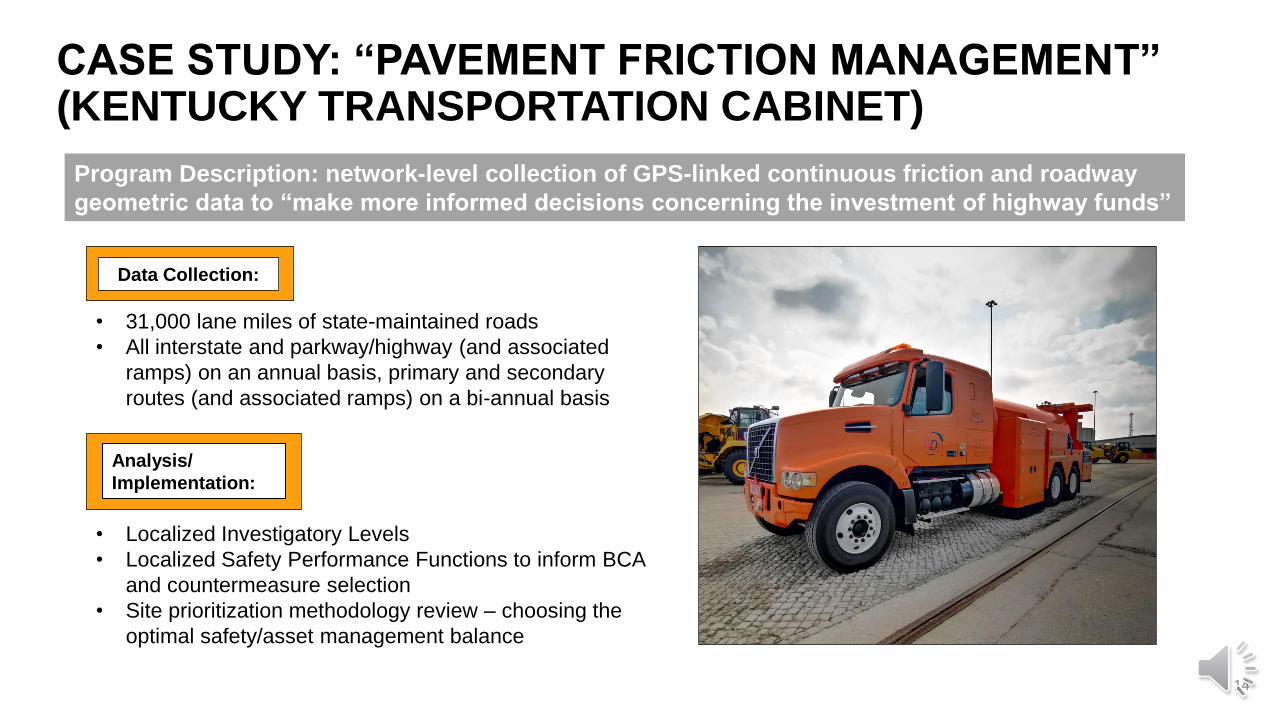
CASE STUDY: “PAVEMENT FRICTION MANAGEMENT” (KENTUCKY TRANSPORTATION CABINET)
• 31,000 lane miles of state-maintained roads
• All interstate and parkway/highway (and associated
ramps) on an annual basis, primary and secondary
routes (and associated ramps) on a bi-annual basis
Data Collection:
Analysis/
Implementation:
• Localized Investigatory Levels
• Localized Safety Performance Functions to inform BCA
and countermeasure selection
• Site prioritization methodology review – choosing the
optimal safety/asset management balance
Program Description: network-level collection of GPS-linked continuous friction and roadway
geometric data to “make more informed decisions concerning the investment of highway funds”

15
Proposed process for using SCRIM continuous friction data for investigatory work:
Three good case studies of district-level “surface safety assessments” from Virginia:
1) Treatment placement: where was precise start/end location of friction problem on a curve to better place
HFST?
2) Treatment selection: which treatment along continuum to solve a hypothesized texture problem, but actually
subtle cross-slope issue (slurry vs. HFST vs. realignment)
3) Treatment selection: which treatment along continuum to solve hypothesized friction problem, but actually a
texture issue (microsurfacing vs. mill and replace)
Central office site assessment
triggered by crash investigation protocol or at
request of district/residency
Surface condition inspection/testing
at least 0.5 mi upstream and
downstream from hotspot
Delineate impact of friction, texture, geometrics, etc.
performance
Central office offers recommendations
to resolve or mitigate with well-
established treatments
CASE STUDY: “SURFACE SAFETY ASSESSMENTS” (VIRGINIA DEPARTMENT OF TRANSPORTATION)
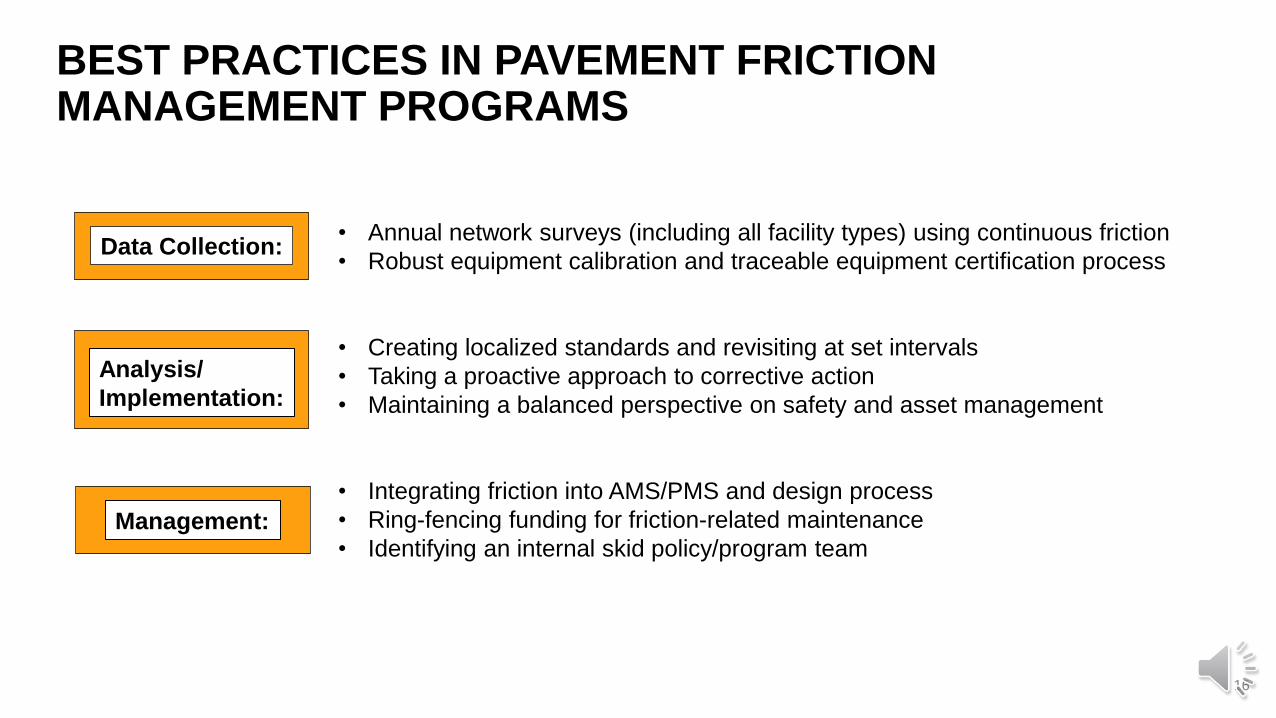
BEST PRACTICES IN PAVEMENT FRICTION MANAGEMENT PROGRAMS
16
• Annual network surveys (including all facility types) using continuous friction
• Robust equipment calibration and traceable equipment certification process
• Creating localized standards and revisiting at set intervals
• Taking a proactive approach to corrective action
• Maintaining a balanced perspective on safety and asset management
• Integrating friction into AMS/PMS and design process
• Ring-fencing funding for friction-related maintenance
• Identifying an internal skid policy/program team
Data Collection:
Analysis/
Implementation:
Management:

HOW CAN DOTs/MOTs USE CONTINUOUS FRICTION?
17
• Recognize that everyone in the organization contributes to the essential and achievable
goal of safer roads:
• What = Safety
• When and where = Maintenance
• How = Materials
• Take a proactive approach to addressing skid resistance, where friction becomes another
factor to manage (like rutting or cracking)
• Prioritize within the resources available
• Support asset management planning with better data and data quality management
systems
Continuous friction links transportation authorities’ service levels,
infrastructure condition, and lifecycle management needs to enable better
outcomes and greater value for money.

Related Documents