D3.2 Case study reports BYTE project 1 Project acronym: BYTE Project title: Big data roadmap and cross-disciplinarY community for addressing socieTal Externalities Grant number: 285593 Programme: Seventh Framework Programme for ICT Objective: ICT-2013.4.2 Scalable data analytics Contract type: Co-ordination and Support Action Start date of project: 01 March 2014 Duration: 36 months Website: www.byte-project.eu Deliverable D3.2: Case study reports on positive and negative externalities Author(s): Guillermo Vega-Gorgojo (UiO), Anna Donovan (TRI), Rachel Finn (TRI), Lorenzo Bigagli (CNR), Sebnem Rusitschka (Siemens AG), Thomas Mestl (DNV GL), Paolo Mazzetti (CNR), Roar Fjellheim (UiO), Grunde Løvoll (DNV GL), EarthObvsrge Psarros (DNV GL), Ovidiu Drugan (DNV GL), Kush Wadhwa (TRI) Dissemination level: Public Deliverable type: Final Version: 1.0 Submission date: 5 June 2015

Welcome message from author
This document is posted to help you gain knowledge. Please leave a comment to let me know what you think about it! Share it to your friends and learn new things together.
Transcript

D3.2 Case study reports BYTE project
1
Project acronym: BYTE
Project title: Big data roadmap and cross-disciplinarY community for
addressing socieTal Externalities
Grant number: 285593
Programme: Seventh Framework Programme for ICT
Objective: ICT-2013.4.2 Scalable data analytics
Contract type: Co-ordination and Support Action
Start date of project: 01 March 2014
Duration: 36 months
Website: www.byte-project.eu
Deliverable D3.2:
Case study reports on positive and negative
externalities
Author(s): Guillermo Vega-Gorgojo (UiO), Anna Donovan (TRI), Rachel
Finn (TRI), Lorenzo Bigagli (CNR), Sebnem Rusitschka (Siemens
AG), Thomas Mestl (DNV GL), Paolo Mazzetti (CNR), Roar
Fjellheim (UiO), Grunde Løvoll (DNV GL), EarthObvsrge Psarros
(DNV GL), Ovidiu Drugan (DNV GL), Kush Wadhwa (TRI)
Dissemination level: Public
Deliverable type: Final
Version: 1.0
Submission date: 5 June 2015
D3.2 Case study reports BYTE project
2
Table of contents
Executive summary ....................................................................................................................... 6
CRISIS CASE STUDY REPORT – Innovations in social media analysis, human computing
and Artificial Intelligence .............................................................................................................. 8
Summary of the case study ............................................................................................................ 8
1 Overview ................................................................................................................................. 8
1.1 Stakeholders, interviewees and other information sources .............................................. 9
1.2 Illustrative user stories ................................................................................................... 11
2 Data sources, uses, flows and challenges .............................................................................. 11
2.1 Data sources ................................................................................................................... 11
2.2 Data uses ........................................................................................................................ 12
2.3 Data flows ...................................................................................................................... 13
2.4 Main technical challenges .............................................................................................. 13
2.5 Big data assessment ........................................................................................................ 16
Summary ............................................................................................................................. 16
3 Analysis of societal externalities ........................................................................................... 17
3.1 Economical externalities ................................................................................................ 17
3.2 Social & Ethical externalities ......................................................................................... 19
3.3 Legal externalities .......................................................................................................... 22
3.4 Political externalities ...................................................................................................... 24
Summary ............................................................................................................................. 25
4 Conclusion ............................................................................................................................. 25
CULTURE CASE STUDY REPORT......................................................................................... 27
Summary of the case study .......................................................................................................... 27
1 Overview ............................................................................................................................... 27
1.1 Stakeholders, interviewees, focus group participans and other information sources ..... 28
1.2 Illustrative user stories ................................................................................................... 30
2 Data sources, uses, flows and challenges .............................................................................. 31
2.1 Data sources ................................................................................................................... 31
2.2 Data uses ........................................................................................................................ 33
2.3 Data flows ...................................................................................................................... 34
2.4 Main technical challenges .............................................................................................. 35
2.5 Big data assessment ........................................................................................................ 36
3 Analysis of societal externalities ........................................................................................... 37

D3.2 Case study reports BYTE project
3
3.1 Economical externalities ................................................................................................ 37
3.2 Social & Ethical externalities ......................................................................................... 40
3.3 Legal externalities .......................................................................................................... 41
3.4 Political externalities ...................................................................................................... 43
4 Conclusion ............................................................................................................................. 44
ENERGY CASE STUDY REPORT – Exploration and production of oil & gas in the
Norwegian Continental Shelf ...................................................................................................... 46
Summary of the case study .......................................................................................................... 46
1 Overview ............................................................................................................................... 46
1.1 Stakeholders, interviewees and other information sources ............................................ 47
1.2 Illustrative user stories ................................................................................................... 49
2 Data sources, uses, flows and challenges .............................................................................. 50
2.1 Data sources ................................................................................................................... 50
2.2 Data uses ........................................................................................................................ 51
2.3 Data flows ...................................................................................................................... 54
2.4 Main technical challenges .............................................................................................. 54
2.5 Big data assessment ........................................................................................................ 55
3 Analysis of societal externalities ........................................................................................... 57
3.1 Economical externalities ................................................................................................ 57
3.2 Social & ethical externalities .......................................................................................... 60
3.3 Legal externalities .......................................................................................................... 62
3.4 Political externalities ...................................................................................................... 63
4 Conclusion ............................................................................................................................. 64
ENVIRONMENT CASE STUDY REPORT - For sound science to shape sound policy ......... 65
Summary of the case study .......................................................................................................... 65
1 Overview ............................................................................................................................... 65
1.1 Stakeholders, interviewees and other information sources ............................................ 66
1.2 Illustrative user stories ................................................................................................... 69
2 Data sources, uses, flows and challenges .............................................................................. 70
2.1 Data sources ................................................................................................................... 70
2.2 Data uses ........................................................................................................................ 74
2.3 Data flows ...................................................................................................................... 76
2.4 Main technical challenges .............................................................................................. 79
2.5 Big data assessment ........................................................................................................ 81
3 Analysis of societal externalities ........................................................................................... 83
3.1 Economical externalities ................................................................................................ 84
3.2 Social & Ethical externalities ......................................................................................... 87
D3.2 Case study reports BYTE project
4
3.3 Legal externalities .......................................................................................................... 89
3.4 Political externalities ...................................................................................................... 91
4 Conclusion ............................................................................................................................. 92
HEALTHCARE CASE STUDY REPORT ................................................................................ 94
Summary of the case study .......................................................................................................... 94
1 Overview ............................................................................................................................... 94
1.1 Stakeholders, focus group participants and other information sources .......................... 95
1.2 Illustrative user stories ................................................................................................... 97
2 Data sources, uses, flows and challenges .............................................................................. 98
2.1 Data sources ................................................................................................................... 98
2.2 Data uses ........................................................................................................................ 99
2.3 Data flows .................................................................................................................... 100
2.4 Main technical challenges ............................................................................................ 101
2.5 Big data assessment ...................................................................................................... 102
3 Analysis of societal externalities ......................................................................................... 103
3.1 Economical externalities .............................................................................................. 104
3.2 Social & Ethical externalities ....................................................................................... 106
3.3 Legal externalities ........................................................................................................ 109
3.4 Political externalities .................................................................................................... 111
4 Conclusion ........................................................................................................................... 111
MARITIME TRANSPORTATION CASE STUDY REPORT ................................................ 113
1 Overview ............................................................................................................................. 113
1.1 Important Stakeholders in Maritime Industry .............................................................. 114
1.2 Illustrative user stories ................................................................................................. 115
2 Data sources and technical challenges ................................................................................ 116
2.1 Data Sources ................................................................................................................. 116
2.2 Data Usage ................................................................................................................... 117
2.3 Data flows .................................................................................................................... 121
2.4 Main technical challenges ............................................................................................ 121
2.5 Big data assessment ...................................................................................................... 123
3 Analysis of societal externalities ......................................................................................... 124
3.1 Identification of Externalities with help of Barriers and Enablers for data Driven
solutions ................................................................................................................................ 124
3.2 Societal externalities .................................................................................................... 125
4 Conclusion ........................................................................................................................... 128
SMART CITY CASE STUDY REPORT – Big Data in a Digitalizing City: The Promise, the
Peril, and the Value ................................................................................................................... 130

D3.2 Case study reports BYTE project
5
Summary of the case study ........................................................................................................ 130
1 Overview ............................................................................................................................. 130
1.1 Stakeholders, interviewees and other information sources .......................................... 131
1.2 Illustrative user stories ................................................................................................. 132
2 Data sources, uses, flows and challenges ............................................................................ 134
2.1 Data sources ................................................................................................................. 134
2.2 Data uses ...................................................................................................................... 136
2.3 Data flows .................................................................................................................... 137
2.4 Main technical challenges ............................................................................................ 138
2.5 Big data assessment ...................................................................................................... 141
3 Analysis of societal externalities ......................................................................................... 142
3.1 Economical externalities .............................................................................................. 143
3.2 Social & Ethical externalities ....................................................................................... 146
3.3 Legal externalities ........................................................................................................ 147
3.4 Political externalities .................................................................................................... 150
4 Conclusion ........................................................................................................................... 151
Appendix A: List of societal externalities considered .............................................................. 152
Appendix B: Program of the BYTE workshop on big data in oil & gas................................... 155
Appendix C: Program of the BYTE focus group on big data in the environment sector ......... 156
Appendix D: Program AND outcomes of the BYTE focus group on big data in the smart cities
sector ......................................................................................................................................... 157

D3.2 Case study reports BYTE project
6
EXECUTIVE SUMMARY
This deliverable presents the case study reports on positive and negative externalities in the use
of big data that we have undertaken in the BYTE project. The case studies correspond to the
domains of crisis informatics, culture, energy, environment, healthcare, maritime transportation
and smart cities. Following the methodology reported in deliverable D3.1, we have gathered
evidence from the case studies by means of semi-structured interviews, disciplinary focus
groups and literature review. Overall, we have conducted 49 interviews with data experts from
each case study discipline and we have counted with 6-12 external domain experts per focus
group.
The crisis informatics case study is focused on the use of social media – especially Twitter data
– to support humanitarian relief efforts during crisis situations. The case shows how the use of
big (and open) data can provide significant gains and benefits in terms of the provision of
humanitarian aid, including better, more targeted and more resource efficient services.
However, issues related to privacy, data protection and resource drains remain significant.
The culture case study examines a pan-European public initiative that provides open access to
digitised copies of cultural heritage works. Although there is some debate as to whether cultural
data is in fact big data, this discussion evolves as the volume, velocity and variety of data being
examined shifts. The variety challenge is especially relevant in this case, given the different
types of cultural objects and associated metadata. Moreover, the diversity of stakeholders and
their complex interrelations produce a number of positive and negative impacts for society, as
well as prominent challenges faced by such initiatives. Some of these challenges include
potential and perceived threats to intellectual property rights and the establishment of licensing
schemes to support open data for the creation of social and cultural value.
The energy case study analyses the impact of big data in exploration and production of oil &
gas in the Norwegian Continental Shelf. This is a data intensive industry that is shifting from
mere data storage to more proactive uses of data, especially in the operations area. Our
investigation reveals significant economical impacts – especially through data analytics, open
data and commercial partnerships around data – although there are concerns with existing
business models and reluctance of sharing data by oil companies. Big data can also be applied
to diminish safety and environment concerns, while personal privacy is not problematic in this
domain. However, cyber-threats are becoming a serious concern and there are trust issues with
the data. In the legal side, regulation of data needs further clarification and ownership of data
will become more contract-regulated.
The environment case study is probably the most mature in terms of big data. Stakeholders take
for granted the availability of data, especially from authoritative sources such as prominent
earth and space observation portals, and there is a growing interest in crowd-sourced data.
Europe is leading this area and there is a general perception that the technical challenges can be
easily overcome, but policy-related issues and data quality are the main barriers. Given the
myriad of applications of environment data, there are many opportunities for economic growth
and better governance of environment challenges – although there are also negative
externalities, such as the possibility of putting the private sector to a competitive advantage.
Data-intensive applications may increase awareness and participation; however, big-brother-
effect and manipulation, real or perceived, can be problematic. With respect to legal
externalities, regulation needs clarification, e.g. on IPR. Finally, political externalities include

7
the risk of depending on external sources, particularly big players, as well as
EarthObvspolitical tensions.
The healthcare case study is conducted within a health institute at a medical university in the
UK. This institute facilitates the discovery of new genes, the identification of disease and
innovation in health care utilising genetic data. The data samples used, analysed and stored can
easily reach a significant volume, especially when aggregated with other genetic samples or
with other health dataset. The sequencing of these samples is computer-intensive and requires
big data technologies and practices to aid these processes. The aggregation of health data
extends the potential reach of the externalities produced by the utilisation of health data in such
initiatives. For example, research with these samples can lead to improved diagnostic testing
and treatment of rare genetic disorders and assist in administering genetic counselling.
Utilisation of genetic data also highlights when more controversial impacts can arise, such as in
the case of ethical considerations relating to privacy and consent, and legal issues of data
protection and data security for sensitive personal data.
The maritime transportation case study analyses the use of big data in the shipping industry that
accounts more than 90% of global trade. Despite its importance, the case study strongly
indicates that major parts of the maritime transport sector are in a very early stage for adoption
of big data, since ship owners and other stakeholders do not perceive the value of data.
Moreover, a common denominator in this industry is the unwillingness to share any raw data,
and if they have to, this is only done on an aggregated level.
Finally, the smart cities case study examines the creation of value from potentially massive
amounts of urban data that emerges through the digitalized interaction of a city’s users with the
urban infrastructure of resources. The state of big data utilisation in digitalising cities can be
summarized as developing, with some cities currently building the necessary big data
structures, be it platforms or new organizational responsibilities. With respect to the societal
externalities of big data in the smart cities domain, the economies of data favour monopolistic
structures, which may pose a threat to the many SMEs in cities and the small and medium
cities. However, open source, open platforms, and open data have the potential to level the
playing field and even spur more creativity and innovation. While big data in smart cities has
many possibilities for social good, there are a number of negative externalities that need to be
addressed, such as the strong reliance on data-driven services.
8
CRISIS CASE STUDY REPORT – INNOVATIONS IN SOCIAL MEDIA ANALYSIS,
HUMAN COMPUTING AND ARTIFICIAL INTELLIGENCE
SUMMARY OF THE CASE STUDY
This case study examines the use of social media data, especially, but not exclusively to assist
in humanitarian relief efforts during crisis situations. The case study focuses on the Research
Institute for Crisis Computing and their work using Twitter data to “map” crises for
humanitarian organisations. This case study raises a number of interesting issues related to big
data uses, technological challenges and societal externalities. The analysis and conclusions
demonstrate that the use of big data in this context provides significant gains and benefits in
terms of the provision of humanitarian aid, including better, more targeted and more resource
efficient services. However, issues related to privacy, data protection and resource drains
remain significant.
1 OVERVIEW
The case study in crisis informatics examines the use of big data during crisis situations, which
is an emerging area of big data practice. Crisis informatics is an umbrella term that “includes
empirical study as well as socially and behaviourally conscious ICT development and
deployment. Both research and development of ICT for crisis situations need to work from a
united perspective of the information, disaster, and technical sciences”.1 Furthermore, while the
case study will focus primarily on political crises and natural disasters, it is important to note
that crisis informatics links with a number of activity areas including humanitarianism,
emergency management, first response and socio-economic development. Furthermore, while
this case study focuses on the use of big data in responding to crises, crisis informatics is also
implicated in relation to all three phases of crisis management: preparedness (training, baseline
information gathering, simulations, conflict prevention), response (coordination, information
gathering, provision of humanitarian relief or aid) and recovery (resource allocation, population
monitoring, development).2
This case study focuses on crisis mapping and the combination of machine intelligence and
human intelligence to mine social media and other data sources to create crisis maps. A
specialist research institute, pseudonymised as Research Institute for Crisis Computing (RICC),
sits at the centre of this case study, and has provided access to key staff members internal to the
institute and additional contacts in international humanitarian and governance organisations to
assess the impact of the systems they are developing. RICC runs two projects, both of which
focus on meeting humanitarian needs with a combination of “human computing and machine
computing” (artificial intelligence) (Director, RICC – I-RICC-D). Project 1 uses a combination
of crowd sourcing and AI to automatically classify millions of tweets and text messages per
hour during crisis situations. These tweets could be about issues related to shelter, food,
1 Palen, L., S. Vieweg, J. Sutton, S.B. Liu & A. Hughes, “Crisis Informatics: Studying Crisis in a Networked
World”, Third International Conference on e-Social Science, Ann Arbor, Michigan, October 7-9, 2007. 2 Akerkar, Rajendra, Guillermo Vega-Gorgojo, Grunde Løvoll, Stephane Grumbach, Aurelien Faravelon, Rachel
Finn, Kush Wadhwa, and Anna Donovan, Lorenzo Bigagli, Understanding and Mapping Big Data, BYTE
Deliverable 1.1, 31 March 2015. http://byte-project.eu/wp-content/uploads/2015/04/BYTE-D1.1-FINAL-
compressed.pdf
9
damage, etc., and this information is used to identify areas where response activities should be
targeted. Project 2 examines multi-media and the photos and messages in social media feeds to
identify damage to infrastructure. This is a particularly important project as the use of satellite
imagery to identify infrastructure damage is only 30-40% accurate and there is a generalised
difficulty surrounding extracting meaningful data from this source (Director, RICC). The
project uses tens of thousands of volunteers who collect imagery and use social media to
disseminate it. These activities link with high volume, high velocity data and introduce a
significant element related to veracity. Specifically, the combination of crowd sourcing and AI
are used to evaluate the veracity of user-generated content in both these projects. In each
project, human computing resources are used to score the relevance of the tweets in real time,
which is used as a basis for the machine-learning element. These volunteers are recruited from
a pool of digital humanitarian volunteers, who are part of the humanitarian community.
The projects use crisis response as an opportunity to develop free and open source computing
services. They specifically create prototypes that can be accessed and used by crisis response
organisations for their own activities. The prototypes are based on research questions or
problems communicated to the centre directly from crisis response organisations themselves.
As such, they ensure that the output is directly relevant to their needs. However, this does not
preclude other types of organisations from accessing, re-working and using the software for a
range of different purposes. The case study has enabled BYTE to examine a specific use of big
data in a developing area, and to examine positive and negative societal effects of big data
practice, including: economic externalities, social and ethical externalities, legal externalities
and political externalities.
1.1 STAKEHOLDERS, INTERVIEWEES AND OTHER INFORMATION SOURCES
In order to examine these issues effectively, the case study utilised a multi-dimensional
research methodology that included documentary analysis, interviews and focus group
discussions. The documentary analysis portion of the work included a review of grey literature,
mass media and Internet resources, as well as resources provided by the Research Institute for
Crisis Computing about their activities. It also examines specific policy documents related to
the use of data by international humanitarian organisations, such as the International Red Cross
Red Crescent Society’s updated Professional Standards for Protection Work, which includes a
section devoted to the protection of personal data.3
The Research Institute for Crisis Computing works with a number of different organisations to
use data to respond in crisis situations. As a result, this case study has conducted interviews
with four representatives from RICC and three representatives from RICC clients, including the
humanitarian office of an international governmental organisation (IGO) and an international
humanitarian organisation (IHO). Both clients have utilised RICC software and mapping
services in their crisis response work. Table 1provides information on the organisations, their
industry sector, technology adoption stage, position on the data value chain as well as the
impact of IT on crisis informatics within their organisation.
3 International Red Cross Red Crescent Society, Professional Standards for Protection Work, 2013.
https://www.icrc.org/eng/assets/files/other/icrc-002-0999.pdf

10
Table 1: Organizations examined
Organization Industry sector Technology
adoption stage
Position on data
value chain
Impact of IT in
industry
RICC Computer science Early adopter
Acquisition
Analysis
Usage
Strategic role
International
governmental
organisation
Humanitarian organisation Early majority Usage Support role
International
humanitarian
organisation
Humanitarian organisation Early majority Usage Support role
The case study interviewed high-level decision makers in each of these organisations, and in
the case of RICC, researchers also interviewed scientists and senior scientists who were directly
involved in the design and development of the systems utilised. Table 2 provides information
about each of the interview participants, using the classification system described in the BYTE
Stakeholder Taxonomy4 to indicate their knowledge about big data, their position with respect
to big data advocacy and their level of interest in using data for novel purposes.
Table 2: Profiles of interview participants
Interviewee Organization Designation Knowledge Position Interest
I-RICC-S RICC Scientist Very high
Supporter
Very high
I- RICC-SS RICC Senior scientist Very high Supporter Very high
I-RICC-D RICC Director Very high Supporter /
advocate
Very high
I-RICC-PM RICC Programme
manager
Very high
Supporter
Very high
I-IHO-HP International humanitarian
organisation
Head of project High Moderate
supporter
High
I-IHO-HU International humanitarian
organisation
Head of unit High Moderate
supporter
High
I-IGO-PO International governmental
organisation
Programme
officer
Very high Supporter /
advocate
Very high
Each of these interview participants was situated at the developed end in terms of their
knowledge about, interest in and support for the use of big data in crisis informatics. In
particular, members of the RICC consistently described themselves as “thought leaders” in this
area and the space that they are working in as “green fields”. This indicates where they see
themselves on the scale of technology deployment. Interviewees from the international
humanitarian organization were situated as slightly less knowledgeable, interested in and
supportive of big data, but this slight difference was primarily related to the fact that their work
still largely relied upon paper records and direct observations. This was particularly the case
with respect to long-term crises such as political crises, as their work was equally focused on
long-term events as well as acute events.
4 Curry, Edward, Andre Freitas, Guillermo Vega-Gorgojo) Lorenzo Bigagli, Grunde Løvoll and Rachel Finn,
Stakeholder Taxonomy, BYTE Deliverable 8.1, 2 April 2015. http://byte-project.eu/wp-
content/uploads/2015/04/D8.1_V1.2.pdf

11
In addition to the anonymised interviews, data was also collected in a focus group with crisis
informatics experts from the following organisations and stakeholder categories. Table 3 lists
the organisations and stakeholder categories to which each focus group participant belonged.
Table 3: Focus group participants
Participants Description
VU University of Amsterdam, NL Academic
Antwerp Fire Service, BE End-user
UK All Party Parliamentary Committee on Drones, UK Government
Treelogic, ES Industry
Sheffield Hallam University, UK Academic
Oxford Computer Consultants, UK Industry
Civil Protection and Emergency Number Agency, ES (Catalan Government) End-user
Big Brother Watch, UK CSO
Group on Earth Observations Secretariat, CH Data centre
University of Patras, EL Academic
Veiligheidsregio Twente, NL End-user
Ministry of Interior, EL Government
To conform to established ethical practice in the conduct of research, all of the quotes from
focus group participants are anonymised by stakeholder category.
1.2 ILLUSTRATIVE USER STORIES
So to summarise the international government organisation asked us to tell them where
infrastructure was most damaged. And so RICC, using the artificial intelligence tool, we looked
for classifiers, which is what the tool does. It searches at a big data level, does the analytics
and then spits out that piece of data into another tool, which maps the information. The
mapping is where the community collaboration comes in, to make quick small bite size
decisions like one-minute, two-minute task nothing like two-hour tasks. And then all of that
becomes aggregated and rolled up into a datasets that people can analyse and say where is the
infrastructure damage the most. And so they verify the reports and so we provided the
international government organisation with a map that showed them where the critical points
were. And while they had their own insights, having done some site visits and having been on
the ground, we were able to add a layer of data from citizen data, from the tweets to be able to
kind of inform their decisions. […] Now originally some of the reports were about how
people…you know how did it affect them in terms of food and not finding water, but the longer
term plans when people in the international government organisation take that information
they can strategically plan for which region had been most hit. And they can move their
resources in that way. We are not moving the resources of a specific area, [but] we can help
informed decision makers based on what we’ve seen and what real citizens have said.
(Programme manager, RICC – I-RICC-PM)
2 DATA SOURCES, USES, FLOWS AND CHALLENGES
2.1 DATA SOURCES
There are a range of data types that are relevant for crisis informatics, especially given the
broader focus on humanitarian relief, development and crisis response. In order to produce the
crisis maps that are useful for humanitarian, relief and response organisations, RICC primarily
uses social media data from Twitter and information from text messages (i.e., direct

12
communication to agencies). These information sources can include text as well as still and
moving images. In addition, they may also collect information from news media and they are
exploring integrating aerial imagery and satellite imagery into their data processes. The tweets
can number up to “a couple of hundred messages per minute” and “a few hundred thousand per
day” (Senior scientist, RICC – I-RICC-SS). More broadly, the international government and
humanitarian organisations work with data such as global information systems data, data on
administrative boundaries in particular countries, mapping information on roads, rivers,
elevation and other EarthObvsgraphic characteristics, public health as well as detention (of
political dissidents) and their sentences. These data records can number up to three million
records including structured and unstructured data, which can be challenging to analyse with
machines. However, although not specifically used by the case study organisation, other data
types may also be useful for crisis informatics, including sensor data from buildings, roads and
other infrastructure, GIS data, seismic data, weather data and satellite image data, image data
from drones and others.
Across these different organisations, data may be collected automatically or it may be collected
by hand using manual records. The RICC collects data automatically, by sampling directly
from Twitter and by utilising information embedded within the Tweet, specifically location
data, and increasingly visual and image data. This data is born digital, and thus it is relatively
straightforward to collect samples automatically. Furthermore, while individuals do not
necessarily know that their data is being collected and analysed by RICC, some data
characteristics are controlled by the user. For example, the inclusion of location information in
tweets is something that “you have to opt into” (Senior scientist, RICC, I-RICC-SS).
Significantly, individuals, independent of RICC, produce this social media data and RICC are
taking advantage of this existing data set. With respect to international humanitarian
organisation data, data is primarily collected “directly from individual people as well as
indirectly through information from hospitals and other organisations” (Head of unit, IHO, I-
IHO-HU). The IHO then seeks to “triangulate the information with other sources of
information. So it maybe the press, it maybe the authorities, social media whatever is available
a complete view as possible.” (Head of project, IHO) Unlike RICC, the IHO data is collected
from individuals in a targeted manner, thus it is “pulled” by the IHO rather than being “pushed”
by people themselves.
2.2 DATA USES
The RICC is committed to using this data analytics tool for crisis management, humanitarian
relief and development, all within the general field of crisis informatics, as well as other social
causes. Within the crisis mapping work, data is primarily used to “augment situational
awareness to inform decision making” for the clients (Director, RICC). Representatives from
both the IGO and the IHO concur with this assessment, adding an element of predictive
analytics as well. For example, the Programme Officer for the IGO stated that the tool “helps
kick-start things in the early days of an emergency” and allows relief workers to get an
understanding of the situation, especially in “remote locations where we can get pictures that
we haven’t heard anything about”. Speed is a key improvement here, where prior to the
mapping tool, it would have taken the IGO days to gather information. In addition, the RICC
are interested in integrating automated processing of images into their service. As the Director
notes, “We now have access to satellite imaging and so what we want to do is bring that sort of
human computing/machine computing hybrid to imagery analysis as well as pictures taken on
Smart phones.”
13
The IHO also noted the importance of having better information more quickly to assist in
decision-making. However, the IHO also noted that this information also helps them by
providing “early warnings”. This could include “trend analysis” and “predicting which
populations are vulnerable” to health risks, abuse or other additional effects (Head of Unit,
IHO). For example, having a greater understanding of population movements or population
displacement can impact future planning and risk assessment:
[There is a tool] called FlowMiner which is trying to use let us say anonymised cellular data to
track population displacement. So they were able after Haiti to show they could have predicted
[displacement] using cell data very quickly. They could know where numbers of people went
and my understanding was that it actually took several weeks for the larger [IGO] related
assessment to determine effectively the same thing. And then there are also other groups
looking at it from a predictive standpoint, where are people usually going on holidays. So in a
Christian country, where are they going for Easter or where are they going for Christmas. And
then say there's a major crisis in Port Au Prince or in Kathmandu where would people be most
likely to go and then prepare measures in those directions. (Programme Officer, IGO)
Again, while the speed of data availability is important in this example, the predictive element
and the ability to use predictive analytics to prepare for a crisis as well as respond to one
demonstrates that big data can stretch across different phases of a crisis.
Importantly, the artificial intelligence tool itself is application neutral (in the sense that the
analysis of the Twitter data can be applied to any application – e.g., brands, sports teams, etc.),
but the RICC team have committed to using it for crisis management and other social causes,
including environmental protection, health, local community improvement, youth engagement,
traffic management and election monitoring.
2.3 DATA FLOWS
While the application of the artificial intelligence tool to some of these other social causes
might result in a more local data processing, the data from the crisis management and response
applications result in an international flow of data. Specifically, data from social media are
“pushed” by those affected by crises and disasters to the Internet, which is itself international.
However, the further processing of this data also integrates a global network of analysis. First, a
network of digital volunteers, located anywhere in the world, analyzes data from specific
Tweets or sets of Tweets. The data from this first processing is then fed to the artificial
intelligence tool currently hosted by the RICC in a small developing country. The data from
this secondary processing is then fed to large, international humanitarian and relief
organizations in cities such as Geneva, London or New York as well as others, who use it to
provide aid and relief in the country where the social media information originated. Thus, the
data itself makes a global journey in order to be utilized “on the ground” in each local context.
2.4 MAIN TECHNICAL CHALLENGES
As noted in in the Stakeholder taxonomy,5 the big data value chain consists of the following
steps: Data acquisition, analysis, curation, storage and usage. In crisis informatics, technical
challenges were reported in all of these areas. However, the challenges associated with data
analytics and data curation appeared to be most immediate to stakeholders in the interviews and
the focus groups.
5 Edward Curry. “Stakeholder Taxonomy”. BYTE Project. Deliverable 8.1. 2014.

14
With respect to data acquisition, acquiring proprietary data, acquiring a full data set, and
acquiring valid data were reported as key issues. For example, an academic expert from the
focus group noted that information needs differ at different levels of an organisation. Satellite
and scientific data is more useful at higher levels of an organisation for planning and resource
allocation, but this additional information is not necessarily useful for responders. In contrast,
responders need immediate and current information to react to incidents as they occur. Twitter
has emerged as a key information resource for these immediate responders for two reasons,
first because it is up-to-date and second because it is publicly available. Thus, there is no issue
with respect to being able to access the data. In fact, the Director of RICC described Twitter
data as a “lower hanging fruit in terms of data access”. However, even with this publicly
available information, RICC still works with a sample of Twitter data, albeit a large sample.
According to one of the RICC scientists, nobody “gets access to the full stream Twitter
samples, it is just the way it is” (I-RICC-S). In fact, the RICC have had to negotiate with
Twitter to enable them to use the sheer amount of data that they process. Specifically, RICC
“have triggered a few alarms” with Twitter, who have contacted RICC to enquire about their
activities (Senior scientist, RICC – I-RICC-SS). However, according to the RICC, Twitter does
allow such usages in particular circumstances, including humanitarian purposes. Nevertheless,
working with an incomplete data set always raises risks that the data that is analysed can be
misinterpreted. As a focus group end-user noted, “you don’t know what you haven’t picked
up”.
However, the RICC and other organizations would like to be able to access information from
other social media sources as well as other sources, and accessing these closed data sets is a
challenge that must be met in order to ensure as full and representative a data set as possible. In
addition, an end user from the focus groups reported that when dealing with crises involving
private property, the owner of the private property is the owner of the data. This can make
preparatory activities difficult since the data is not accessible when there is no incident. Finally,
ensuring that data is up-to-date is also a significant technical challenge, as “outdated
information is essentially misinformation” (End user, focus group). Yet, although these
challenges were discussed, interview and focus group participants did not necessarily
prioritized these.
In contrast, challenges related to data analysis provoked significantly more discussion in
interviews and focus groups. The RICC interview participants all prioritized software
development challenges in their discussion of technical challenges, which reflects their primary
focus on software development for crisis situations. These challenges were primarily related to
fixing bugs and working with a system that was still under development. As the RICC Director
notes, “Because we are a computing research institute, I think our first responsibility is to make
sure that we evaluate the robustness of our tools, of our technologies. Is it actually performing
as it’s supposed to perform? Are there bugs? Is it crashing?” (I-RICC-D) Furthermore, the
RICC uses a software development methodology that they describe as “agile development”,
where they deploy the software during crises and emergencies in order to identify those bugs,
because “we learn more during 24 hours of a real world deployment on everything that is not
right with our platform than we do in three months when they are no disasters” (Director, RICC
– I-RICC-D). Yet, the use of an immature system requires some expectation management on
the part of the clients. The RICC ask them to certify that they understand they are working with
a system that is under development, that has not been fully tested and which may not produce
any added value. Nevertheless, according to the RICC, their clients agree to deploy the system
because they do get added value from it and they recognise the value in testing the system in an
operational environment.

15
Outside of the RICC, the IGO and focus group participants reported that standardization at the
analytic and policy level represented a challenge with respect to data analysis. An end user
from the focus group noted that during a crisis, data are being collected in different formats and
it is nearly impossible to analyse all of the data available in time-sensitive situations because of
these different formats. Yet, the Programme Officer from the IGO was more focused on
standardization at the policy level. He argued that he would welcome more standardization in
terms of hash tags on Twitter, which would significantly improve data capture and detailed
analysis. He argued that this initiative could be led by national and local governments and
responding agencies.
Data curation was a key issue for the RICC, who use a corps of digital volunteers to help
curate data coming in from Twitter. Specifically, the RICC use a combination of human
computing and machine computing, which takes the data through multiple layers of processing.
The population of tweets collected by the RICC are sampled and then distributed to a large
network of “digital volunteers” who label the Tweets and then score them for relevance. This
sampling does two things. First it enables the processing of the data to begin quickly, using up
to tens of thousands of volunteers to undertake the initial analysis. Second, it provides the
machine-learning component with a set of data to learn from, in order to automatically process
the full data set held by the RICC. As such, the sample tweets initially labelled and analysed by
humans, are then turned over to the artificial intelligence software:
The machine can then take those tweets that are all labelled with infrastructure damage and
process them and start to “learn” what that infrastructure damage tweet looks like based on
human-labelled data. The machine learns and learns and learns it is continually fed more and
more batches of one hundred…sets of one hundred tweets that are labelled with this particular
category of information. Eventually the machine gets better and better at recognising this
particular type of information in the tweet and can do it more quickly and can do it
automatically. (Scientist, RICC – I-RICC-S)
This solution to data curation may be applicable to other contexts and uses of big data;
however, the recruitment of such volunteers also raises social and ethical issues, as discussed in
more detail in Section 3.2.
RICC and focus group participants also agreed that data storage was a key technical challenge.
The RICC reported:
[W]hat we need is servers, much better bigger servers, […] we need basically some serious
access to Amazon web services to be able to scale the deployment of the platforms and to do all
the work we need. You know if we get to a point where we deploy [the tool] and we get more
than ten thousand volunteers that show up that platform would crash. And that is not a good
thing for anyone (Director, RICC)
Focus group participants also concluded that cloud solutions were a primary need and that
public-private partnerships could be forged to host crisis informatics services. While the RICC
is actively soliciting such partnerships, these also introduce their own potential challenges and
impacts, as will be discussed in more detail in Section 3.4 below.
Finally, research participants also reported challenges in the usage of data in crisis informatics,
where data usage here refers to the use of data by clients such as humanitarian organizations,
response organizations and governmental organizations. Primarily, there were reported

16
challenges around organizational culture that made it difficult to integrate these services into
existing workflows and decision-making mechanisms. The Programme Officer from the IGO
stressed the importance of using existing mechanisms to translate the new information provided
by big data:
People saw the online crisis map and they said okay that is just a bunch of red dots, it is too hard
to drill in everything. But I had people take the data and take certain parts of the data and create
the regular [IGO] info graphics.
Right, so it became something that was familiar to them.
Exactly. So this is what I keep stressing with my information management officer. Don't create
new products out of this augment what you already have (Programme Officer, IGO, I-IGO-PO)
While the Programme Officer’s activities represent an important possible solution to this issue,
it also required additional data processing work that would need to be undertaken by the RICC
(or other tool providers) or the client. In the former case, this would require access to those
existing mechanisms, and in the latter case, it would require data analytic skills. In either case,
it requires a significant amount of preparatory work and additional resources, which may not be
prioritized outside of a crisis situation.
2.5 BIG DATA ASSESSMENT
Interview and focus group participants in the crisis informatics case study were not particularly
invested in “big data” as a descriptor for the activities in which they were engaging. However,
their descriptions of their work did reference many of the crisis points reflected in the “big
data” definition, including especially volume, velocity and variety. Almost all of the interview
participants indicated a preference not to use the term “big data”, preferring instead to talk
about the challenges they were addressing. For example, the RICC senior scientist argued that
the important factor for him is whether the data “requires computers to be analysed”, similarly
the Programme Manager discussed challenges related to the number of research questions
being analysed by a particular data set, while the Director described the main challenges as
“filter failure”. However, as noted above, the RICC is dealing with hundreds of thousands of
data points, which represents a significant volume. The IHO is also working with
approximately 100,000 data points, but for them the primary challenge is around the
complexity of the data, particularly as much of the data is unstructured. Similarly, one of the
end users from the focus group argued that his primary challenges were variety and velocity.
Specifically, as already noted above, complex data coming from different systems in different
formats needs to be analysed quickly in order to be actionable by responders on the ground.
Finally, veracity also emerged as a data issue, which was a key innovation offered by RICC
through the combination of human computing to verify and score the information and
automated, machine computing to further process it and learn from these verified information
sources.
Summary
The analysis of the data being used in the crisis informatics sector, the processing activities and
the challenges give a broad overview of the relative maturity of the use of big data in this
sector. This analysis reveals that crisis informatics is in the early stages of integrating big data
into standard operations and the key improvement is that the analysis of this data improves
situational awareness more quickly after an event has occurred. However, there are significant

17
challenges around access to proprietary data sets and the ability to integrate diverse
information, especially image data. Second, the crisis informatics case sector, in general, is
primarily focused on a specific type of social media and EarthObvsgraphical data for mapping
purposes. While this is obvious given the specific case study chosen, this focus was also
reflected in the literature review and focus groups and represented a key finding upon which
focus group participants were asked to comment. Based on all the data sources, there has not
yet been much progress integrating other data types – e.g., environmental measurements,
meteorological data, etc. Third, a key innovation in this area, not yet well reflected in other
sectors is the use of human computing, primarily through digital volunteers, to curate the data
by validating it and determining how trustworthy it is. However, a key message from the data
was that while these tools represent important innovations and improvements in crisis
informatics, big data tools should not be “oversold” (Programme Officer, IGO, I-IGO-PO) and
technological tools should not replace pen and paper or gut feelings (End user, focus group).
These cautions are particularly important given that while these uses of big data enable clear
benefits (i.e., positive externalities) they also raise potential negative externalities, each with
respect to economics, social and ethical issues, legal issues and politics that are analysed in
Section 3.
3 ANALYSIS OF SOCIETAL EXTERNALITIES
The primary contribution of the BYTE project is the examination of the impacts of these uses
of big data on third-party stakeholders and society in general. As such, BYTE is examining the
economic, social and ethical, legal and political issues that are generated by these big data
practices. The purpose of this activity is to identify positive externalities, or impacts, that the
big data sector should try and augment or expand, as well as negative externalities that the
sector should try to mitigate or address. This section examines the positive and negative
externalities in each of these categories, based on the list of externalities included in Appendix
A (see Table 55).
3.1 ECONOMICAL EXTERNALITIES
The use of big data in the crisis informatics environment is associated with a number of
positive and negative economic externalities, where economic externalities also include the
potential for innovation. Once of the principal areas of positive economic externalities is
through the creation of new business models, including social considerations as well as
economic ones. This means that the business model is not only focused on financial gain, but
also on social gains that could be associated with the service. Additional positive impacts are
also associated with increasing innovation through open data and source material and by
infrastructure and technology improvements. In contrast, potential negative externalities could
be indicated by private companies gaining additional revenue from organisations that can least
afford to pay a premium for their services and the need for cash-strapped organisations to
allocate scare resources to data analytics. Each of these gains is discussed in detail below,
however Table 4 provides a summary.
Many of the positive externalities resulting from the use of big data in crisis informatics
revolve around the use of big data to provide positive impacts on the business models of
humanitarian organisations with specific reference to providing better (E-PC-BM-2) and more
targeted services (E-PC-BM-3) and to predict the needs (E-PC-TEC-1) of citizens affected by a
crisis through improved situational awareness and enabling better resource allocation for
humanitarian organisations (E-PC-BM-4). With respect to better services, the tool developed
by the RICC provides humanitarian organisations with the “capacity” to “identify all of the

18
relevant information” on social media to react appropriately (Director, RICC, I-RICC-D). In
addition, the IGO client said that a key improvement was in the efficiency of the information
gathering to enable the process of establishing “who, what and where” more quickly
(Programme Officer, IGO, I-IGO-PO) and to predict where resources will be required.
Furthermore, individuals “feeding information” to the IGO enabled them to respond
appropriately to “requests” on the ground.
Table 4: Economic externalities in crisis informatics
Code Description Relevance
E-PC-BM-2 Better services for members of the public in that the work of
humanitarian organisations can be more efficient, they can
provide relief faster and they can allocate their resources where
the need is greatest.(I-RICC-D, I-RICC-PM, I-RICC-SS, I-
IGO-PO, I-IHO-HP)
Improved
situational
awareness
E-PC-BM-3 More targeted services for citizens because the humanitarian
organisations are reacting more quickly to information
provided directly from the public. (I-RICC-D, I-RICC-PM, I-
IGO-PO)
Improved
situational
awareness
E-PC-TEC-1 Identifying trends and needs using the tool for predictive
purposes (I-IHO-HU)
Crisis preparedness
E-PC-BM-4 Better resource efficiency
organisations with technical capacity are analysing the
data, leaving the humanitarian orgs to focus on relief
humanitarian organisations are able to target their
activities to areas where there is most need or target
response to needs.
(I-IGO-PO, Focus group participants, I-RICC-D)
Better resource
allocation
E-OC-DAT-
2
Using open data to offer new services and fostering innovation
by making the code open source (I-RICC-PM, I-RICC-D)
Social media
innovation
Open source
computing
E-PC-BM-4 Need for additional resources for data experts (I-IGO-PO, I-
RICC-D)
Distraction from
core activities
E-OC-BM-8 Private companies benefiting from models by offering utilities
(End-user, Focus group)
Infrastructure needs
Such targeting of services also enables humanitarian organisations to use their resources more
efficiently. This may occur through outsourcing data analytics and focusing on their core
activities. For example, the RICC notes that their artificial intelligence tool assists organisations
with limited resources to use the full set of information coming in:
If you think about how much time it would take one person to every week go through a few
thousand text messages…if you have limited resources as it is, they want another option
especially since they want the scale. And they are not going to be able to [analyse that data to
the extent they would like]. (Director, RICC, I-RICC-D)
Automated systems also allow clients to take advantage of the analysis of a diversity of data
that “is well beyond sort our capacity and generally our budget to handle” (Programme Officer,
IGO, I-IGO-PO). This is especially important as the “core business” of humanitarian
organisations is not data analysis and “it’s very hard to convince management and say, okay I
need somebody half the time working on artificial intelligence” (ibid., I-IGO-PO). Finally,

19
leveraging a corps of digital volunteers for the human computing component of the system also
enables the RICC to capitalise on the ability of these volunteers to process information cheaply
and quickly, particularly in time-sensitive situations like crisis.
Another positive externality in evidence in the case study is the use of open data to provide new
services and providing open source material to support and foster innovation in data analytics
(E-OC-DAT-2). This is slightly different to the externality code provided in Appendix A as, in
addition to using open data provided by private companies, it also includes the provision of
open source code from the academic sector. The economic externalities associated with using
Twitter data to provide new services are discussed in detail in the section above. However,
considering material from the technical challenges section demonstrates that Twitter features so
prominently precisely because it is open, and other social media services like Facebook are
vastly more difficult to access. In addition, the RICC also provide open access to their source
code through services like GitHub to enable others to contribute to the development of their
code and to enable others to build on their innovations. However, while this remains a potential
gain, the RICC are not yet realising that benefit:
The code and the documentation is such that anybody can come in and suggest improvements in
the code and say I have got this extra module that will do that. […but] we are nowhere close to
that. […] Maybe by the end of the year, early next year we will have something that I think all
of us will be proud to call open source. (Director, RICC, I-RICC-D)
Nevertheless, this externality (E-OC-DAT-2) is heavy with potential, particularly as the use of
big data in crisis informatics develops further.
The use of big data in this sector is also associated with potential negative economic
externalities. Indeed, the positive effect of better resource efficiency (E-PC-BM-4) is
challenged: data from the RICC and the IGO suggest that the popularity of big data and its
increasing integration into crisis management activities mean that all organisations will require
an injection of resources to meet this growing demand. This is particularly important for
humanitarian organisations that may not have many resources to spare. In addition, given the
infrastructural challenges associated with data storage, many data analytic providers are turning
to large-scale corporate entities for services. According to focus group participants, this may
result in resources provided by tax payers and philanthropists to humanitarian organisations
ultimately being used to benefit large technology and other companies.
Thus, this analysis indicates that the use of big data in crisis informatics is primarily associated
with positive economic externalities such as improved service delivery and resource efficiency
for cash-strapped organisations. However, it is also associated with negative externalities such
as the need to devote resources to additional competencies outside an organisation’s core area
of focus in order to “keep up” with big data and a potential that large companies with
significant resources also benefit from these developments. Significantly, many of these
economic externalities also implicate legal issues (data access), political issues (corporate
subsidies) and social and ethical issues.
3.2 SOCIAL & ETHICAL EXTERNALITIES
The discussion above demonstrates that the use of big data in crisis informatics is associated
with a number of positive social and ethical externalities folded into the discussion of the
change in business models. For example, improved humanitarian services (E-OC-ETH-1)
demonstrate a clear social and ethical gain for society, as the Programme Manager for RICC

20
argues, “if it’s already happening at a business level, if it’s already happening at a security or
government level, why shouldn’t it happen at a humanitarian level?” (I-RICC-PM). While these
externalities will not be repeated, this analysis indicates both additional positive externalities
and a series of potential negative externalities that are raised by the use of social media data in
crisis informatics. In addition, in some cases, this discussion includes measures that are being
used to mitigate these potential negative impacts.
Table 5: Social and ethical externalities in crisis informatics
Code Description Relevance
E-OC-ETH-1 Operations that increase citizen safety and provide essential
relief (I-RICC-PM, I-RICC-SS, I-RICC-S, I-RICC-D, I-IGO-
PO, I-IHO-HU, I-IHO-HP)
Humanitarian relief
E-OC-ETH-2 Development of tools and procedures to ensure ethical data
practices (I-RICC-PM, I-RICC-SS, I-RICC-S, I-RICC-D, I-
IGO-PO, I-IHO-HU, I-IHO-HP)
Ethical data
processing
E-OC-ETH-9 Private data misuse by sharing the information without
consent or using it for purposes that social media users may
not have foreseen (I-RICC-PM, I-IHO-HU, I-IHO-HP)
Ethical data
processing
E-OC-ETH-3 Invasive use of information, especially sensitive information
(I-RICC-PM, I-RICC-SS, I-IHO-HU, I-IHO-HP)
Ethical data
processing
E-OC-ETH-13 Misinterpretation of information or incomplete data can
result in incorrect conclusions (I-IHO-HP)
Situational
awareness
E-OC-ETH-4 Potential for discrimination (Focus group) Equality
One of the potential positive externalities related to social and ethical issues is an increased
awareness around the need for socially responsible and ethical data practices, and the
development of tools to ensure ethical data practices (E-OC-ETH-2). RICC are working with
other organisations, such as the ICRC, UN OCHA and well-respected universities to develop
tools and procedures to promote and ensure ethical data practices. The Programme Manager for
the RICC is heavily involved in this work:
I worked on a project called the ethics of data conference where we brought in one hundred
people from different areas of knowledge to talk about data ethics. And to infuse our projects
and understand and build road maps. There is something called responsible data forum which is
working on templates in projects, to be able to help people incorporate those kind of personal
data. My colleague has been working on something called ethical data checklists as part of the
code of conducts for the communities that he has cofounded. So these code of conducts I have
written one for humanitarian open street map about how we manage data. (I-RICC-PM)
This collaborative work has resulted in a number of tools and procedural standards to ensure
ethical data practice. Specifically, RICC subject every project to a risk assessment that includes
a consideration of what will and will not be done with the data, what data will be stored, what
data will be published. They also abide by the following rules: “we don’t retain personal
information, we don’t share personal information” (Programme Manager, RICC, I-RICC-PM).
They also edit the data so that different stakeholders get access to a different degree of detail.
For example, for the maps provided to the media “you can only see only the colour and the map
we provide to the [client has] a table with all these fields with the text, the actual text of the
tweet” (Senior scientist, RICC, I-RICC-SS). In addition, they also screen the digital volunteers
to ensure that there is nothing in their profile that would make the human element of the
computing vulnerable to unethical practice. This includes asking them:

21
[T]o provide links to a certain number of profiles, which could then be reviewed. So your
Twitter account, your Facebook account, your LinkedIn, so essentially how you answer certain
kinds of questions. Sort of where are you from? What is your nationality? Some basic kind of
questions, your thoughts on the crisis and so on. And then, you know, LinkedIn, Twitter or
Facebook or something, individuals from the tasking teams could go and review these people
publicly and see okay what kind of things are they saying on Twitter? […] and then those
people […] would be monitored. (Director, RICC, I-RICC-D)
This process ensures that the RICC is able to identify and rectify any potential conflicts of
interest in the data analytics. Finally, the RICC also have an assessment tool to control the
organisations and circumstances in which they deploy the artificial intelligence tool. This
includes the following:
the humanitarians have to show a very clear compelling need for this data and have to articulate
very clearly how they are going to use this data and how it’s going to make a difference. That is
part of the application criteria, so in a way we rely on that demand-driven model. If they pass
the test, if they pass our criteria then we are assuming that they are not lying through their teeth
and are desperate for this data and it is actually for them. (Director, RICC, I-RICC-D)
This process is necessary to prevent the tool being used by unauthorised organisations for non-
humanitarian purposes, e.g., for brand monitoring, etc. These ethical processes are particularly
designed to prevent unethical data practices, such as those potential negative externalities
discussed below.
The RICC interview participants, their clients and the focus group participants all recognised
that the use of social media data to augment humanitarian relief services raised a number of
potential negative externalities. These included the misuse of information (E-OC-ETH-9),
misuse of sensitive information (E-OC-ETH-3), the potential misinterpretation of data and
potential for discrimination (E-OC-ETH-4). With respect to data misuse, this was related to
public authorities, the media or other organisations potentially misusing the information. Thus,
this misuse may be linked to the private sector, but this was not always the case. Specifically,
posting some information on the Internet can make individuals vulnerable. For example image
data in political crises may require filtering and protection because:
[Y]ou are not sure if the people being arrested actually want everybody, their family, their
employers and everyone to know that they were at the demonstration and they were arrested.
Especially, for example, this means that they may lose their job if their employer discovers that
they were at the demonstration or, […] somebody being arrested and appears the next day,
raises a lot of suspicion. (Head of Project, IHO, I-IHO-HP)
The IHO further warns that the posting of information on social media has significant
consequences for those who appear in visual images, but who may not have provided informed
consent for their image to be distributed. In addition, mapping activities also have to take into
account the potential sensitivity of the places and data being mapped. The IHO also notes that
in crisis or conflict situations you may have shelters for women or unaccompanied minors. You
want to publicise this information for people who are in need, but you do not want to introduce
additional vulnerabilities for these groups. As the RICC notes, this is strongly linked with
issues around informed consent, as people who Tweet about these disasters may not expect
their information to end up in the newspaper or other media (Senior scientist, RICC, I-RICC-
SS).

22
There are also potential issues around the misinterpretation of data and the potential
consequences of that (E-OC-ETH-13). Specifically, using the data without the contextual
information that was used to collect the data can result in a “data gap” where the data becomes
divorced from the context in which it was created.6 The IHO notes “because you have the data
you tend to forget how it was constructed and you tend to have results on things that don’t
mean anything” (I-IHO-HP). The IHO provides a specific example of this:
In this case we had data on attacks on medical personnel and we had an indication also on the
fact the healthcare person, whether it was a man or a woman. It has some relevance for us of
course. But you cannot do it have an analysis if gender plays a role or not because we don’t
have the baseline country by country [information] to know what are the proportion of the male
or female nurses, male or female doctors in [each] different area. And to know if there is a
discrepancy between that baseline and the victims of an incident. […]There is a risk that if you
then for example pass the set of data to someone else and someone else ask you to make an
analyse of the data without really understanding the construct of the data the limitation the bias
that might be there. (Head of Project, IHO, I-IHO-HP)
This demonstrates that there is a clear need with respect to any secondary use of data to
interrogate the use of data and ensure that any residual misinterpretations, biases and
misrepresentations are sufficiently examined and identified to prevent the sharing of
misinformation and the erroneous allocation of resources.
The final potential negative impact, potential for discrimination, was not raised in the
interviews, but was heavily discussed in the focus groups. This may be related to the fact that
the RICC team was very transparent about the gaps in the data that they provide. However,
focus group participants were looking at crisis informatics more broadly and they were
concerned about issues related to discrimination. First, with respect to data sharing on an
institutional and national level, a participant from an international data centre noted that it was
difficult to integrate countries with fewer digital skills and less developed infrastructure. This
has a clear knock-on effect in crisis informatics, if the data for specific locations is less
detailed, mature and available. Second, with respect to social media in particular, focus group
participants expressed concern that the digital divide could result in already vulnerable
populations becoming more vulnerable. Specifically, communication with individuals on the
ground would necessarily favour those with better access to digital devices, skills to use them
and often English language ability. Thus, communication cannot be equally distributed among
the population, either in terms of data collection or information distribution. There was also
concern about irresponsible governments using the data to conduct surveillance on the
population and identify those who were engaging in protest, unauthorised information sharing
and other activities.
3.3 LEGAL EXTERNALITIES
Many of the legal issues discussed by interview and focus group respondents related to issues
already discussed in previous sections, specifically privacy and data protection infringements as
well as data ownership and access to proprietary data. It is clear from this analysis that both
issues are represent both positive and negative impacts as the crisis informatics case study. For
example, privacy and data protection infringements are possible, but different organisations are
using established standards and protocols to introduce protective measures. In addition, while
6 Royal Society, Science as an open enterprise, London, June 2012.
https://royalsociety.org/~/media/royal_society_content/policy/projects/sape/2012-06-20-saoe.pdf

23
organisations have difficulty accessing proprietary data, this indicates that protections in this
area are being respected. We report in Table 6 additional externalities corresponding to the
legal category.
Table 6: Legal externalities in crisis informatics
Code Description Relevance
E-PC-LEG-
4
Privacy and data protection threats specifically related to
legislation (I-RICC-D, I-RICC-SS, I-RICC-PM)
Protection
measures are in
place, but their
adequacy has yet to
be tested
E-PC-LEG-
5
Data ownership and proprietary data sets (I-RICC-D, I-IGO-PO) Protection
measures are
functioning, but
preventing access
to additional data
As indicated in the social and ethical issues section, privacy and data protection infringements
can result in significant effects on individuals and organisations. However, that section also
noted that experts and practitioners were devising measures and protocols to mitigate this
threat. Organisations are legally required to meet privacy and data protection laws in the
countries in which they are operating, but in global data flows such as that represented by the
work undertaken by the RICC, it is difficult to know which jurisdictions are relevant. In order
to combat this difficulty, the RICC instils protection measures that are broadly applicable to a
number of different major jurisdictions and which represent agreed good practice as developed
by other major organisations in institutions. For example, as already noted, the RICC follow the
International Committee of the Red Cross’s (ICRC) data protection protocols, which include
removing Twitter handles, personal identifying information and original tweets in the public
version of the maps (Director, RICC, I-RICC-D). Instead, all that is visible in the final, public
version are the categories. According to the RICC Director, this was in response to issues round
informed consent. However, the RICC also stress that they are a “research institute” and that it
is the responsibility of their clients to decide on the data protection measures and that it would
be inappropriate for the RICC to “write the standards of data protection” (Senior scientist,
RICC, I-RICC-SS). Nevertheless, they do alert clients to these guidelines and recommend that
they are respected. According to focus group participants, this sort of practice is essential to
win public trust that the processes being undertaken are legally compliant.
With respect to access to proprietary data the use of Twitter and the lack of integration of data
from other media sources represents both a positive and negative externality. First, the RICC
situation demonstrates that it is possible to use existing legislation to effectively access and
analyse social media data. Combined with the lack of integration of other sources, this
demonstrates that existing intellectual property mechanisms are working effectively:
The challenge we face and why we often don’t end up pulling much yet from groups like
Facebook and Instagram is that we very much respect their terms of use or use of service or
whatever they call it. Where it is actually very hard for us to I don’t know if legally is the right
word, but legally access their content and turn around and use that. So we have had some early
discussions with them about trying to figure out how to, at least their public feeds to be able to
use any of that kind of content. So at the moment we simply don’t pull from them because we

24
are not allowed to. And so we are not going to try and cross that border or that barrier until they
give us approval. (Programme Officer, IGO, I-IGO-PO)
However, outside of social media particularly, focus group participants also noted that it was
difficult to access information outside of crisis situations. While data access is almost
universally granted during crises, the lack of availability outside of crises makes it difficult to
put appropriate mechanisms in place to effectively analyse that data when it is available.
However, it was clear across all of the data gathered that big data analytics in crisis informatics
would benefit from clear (and possibly new) legal frameworks in order to address externalities
such as privacy, data ownership and also enhance and formalize how to share data among
countries. While the need to clarify or develop new legal frameworks and protocols was
classified as a negative externality, concurrently the discussion of these frameworks and current
attempts to bridge them also simultaneously represents a positive development.
3.4 POLITICAL EXTERNALITIES
Finally, the international character of crisis informatics, including crisis response, humanitarian
aid and development, often necessitates a cross-national flow of data, particularly when
international humanitarian organizations are involved. However, politics in this area, and
political externalities extend beyond international politics and also include political economics
as they relate to tensions between for-profit organizations and humanitarian organizations.
These are primarily negative externalities as they introduce vulnerabilities and they prevent
effective collaboration between the private sector and the public or humanitarian sectors – they
are included in Table 7.
Table 7: Political externalities in big data in crisis informatics
Code Description Relevance
E-OC-BM-8 Difficulty of potential reliance on US based infrastructure
services (I-RICC-D)
Tensions between private companies and public sector or
humanitarian organisations (I-IGO-PO, I-RICC-SS)
Control over data
use and service
provision
Partnerships between large private companies and other organisations can be a positive
externality in that it provides a cost-effective solution to infrastructure and technology issues.
For example, the RICC is looking to solve their data storage problem by taking advantage of
cloud storage solutions offered by Google and Amazon (Director, RICC, I-RICC-D). Similarly,
such partnership can provide technological capabilities during crises that benefit the
humanitarian sector in general – Google person finder is an example of this.
However, such partnerships also introduce potential negative externalities. Specifically, BYTE
D2.1 has already indicated that the hosting of data on US soil or by US services means that the
data becomes subject to US law, which introduces a vulnerability for people whose records are
contained within those data sets.7 Second, humanitarian organisations report being placed in a
7 Donovan, Anna, Rachel Finn and Kush Wadhwa, Sertac Oruc, Claudia Werker and Scott W. Cunningham,
Guillermo vega Gorgojo, Ahmet Soylu, Dumitru Roman and Rajendra Akerkar, Jose Maria Garcia, Hans
Lammertant, Antonella Galetta and Paul De Hert, Stephane Grumbach, Aurelien Faravelon and Alejandro
Ramirez, Report on legal, economic, social, ethical and political issues, BYTE Deliverable 2.1, 30 September

25
vulnerable position vis-à-vis private companies who promise “amazing solutions” or provide
“their own huge amount of data and response to crisis” but who become unpredictable outside
of the crisis situation (Programme Manager, IGO, I-IGO-PO). Furthermore, these organisations
use their crisis activities to promote their own brand and socially responsible behaviour rather
than truly engaging with the humanitarian organisations. Yet at the same time, such
unpredictability can offer an opportunity for organisations such as the RICC. An RICC Senior
scientist explains:
Humanitarian organisations and others are very worried about creating technology dependence
one particular vendor, so they find that our platforms are open source make them more
comfortable with adopting our process and our technology because they know that we don’t
hold a leverage over their activity (I-RICC-SS).
Thus, the open source nature of the RICC project and tools make them more trustworthy in the
eyes of humanitarian organisations who are more likely to adopt their solutions.
Summary
This analysis of potential positive and negative externalities has demonstrated that much like
the general externalities examined in D2.1, the externalities associated with crisis informatics
are overlapping and interconnected. Many of the economic innovations associated with positive
changes in business models are also linked with positive social and ethical issues, including
improved services for people who are vulnerable in a crisis or better resource allocation to
enable responders to stretch their resources further. In addition, many of the potential negative
societal externalities are associated with privacy, discrimination and the protection of personal
data, which also implicate relevant legal frameworks. This has important implications for the
development of recommendations to meet these challenges across the big data ecosystem.
4 CONCLUSION
The analysis of the use of big data in crisis management has indicated a number of key
findings. First, big data practitioners in crisis informatics are relatively unconcerned about the
“big data” label, and prefer to talk about data challenges, which are augmented by the size of
the data being analysed. However, this preference may be related to the fact that crisis
informatics is heavily concerned with social media data, which is certainly high-volume and
high-velocity, but which does not integrate multiple data types. Perhaps as the sector matures
with respect to integrating multiple data sources, including especially image data which is a
high priority for the case study, the different aspects of “big” data may bring these issues to the
forefront.
Second, the use of big data in crisis management raises positive societal externalities related to
economic issues and social and ethical issues. These include especially, the better provision of
humanitarian relief services, the provision of better, more targeted and more timely social
services and better resource efficiency in providing these services. A significant facet of this is
the collection of reliable information, on the ground, much more quickly to aid the situational
awareness of the humanitarian organizations. The use of big data in crisis informatics also
represents significant innovation potential due to the commitment to open data and open source
computing, which will likely foster added innovations beyond the work of the RICC. In
2014. http://byte-project.eu/wp-content/uploads/2014/10/BYTE-D2.1_Final_Compressed.pdf

26
addition, while the use of social media certainly raises significant issues with respect to
privacy, data protection and human rights, these issues are central to the way that data is being
handled within the RICC and other organizations, and the case study makes clear that experts in
this area are committed to ensuring ethical data practices within crisis informatics.
Nevertheless, some negative societal externalities remain, which must be addressed in order to
ensure the societal acceptability of these practices. First, with respect to economic issues, the
integration of big data, or data analytics, within the humanitarian, development and crisis fields
has the potential to distract these organizations from their core focus and may represent a drain
on scarce resources. In addition, there is a tension between private companies with extensive
data analytics capabilities and humanitarian and other relief organisations. Humanitarian
organisations are increasingly frustrated with private companies arriving during crises and
leaving once the crisis has finished, without sharing or further developing the technological
tools and capabilities that they introduced. Furthermore, they are also concerned about being
dependent upon them for infrastructure, technological capabilities or other resources, as these
organisations have proven to be unreliable partners. Finally, there are also significant,
remaining privacy, legal and ethical issues around the use of data generated and shared by
people through social media. While this sector has taken significant steps in this area, much
work remains to be done in relation to the unintentional sharing of sensitive information, the
protection of vulnerable individuals and the potential for discrimination that could result from
this data processing.

27
CULTURE CASE STUDY REPORT
SUMMARY OF THE CASE STUDY
The utilisation of big cultural data is very much in its infancy. Generally, this is because data
driven initiatives are focussed on cultural data to the extent that there is open access to digitised
copies of cultural heritage works, rather than a broader focus that incorporates usage of
associated cultural data such as transaction data and sentiment data.
The BYTE case study on big data in culture examines a pan-European cultural heritage
organisation, pseudonymised as PECHO. PECHO acts as the aggregator of metadata and some
content data of European cultural heritage organisations. The big cultural data case study
provides a sector specific example of a data driven initiative that produces positive and
negative impacts for society, as well as underlining a number of prominent challenges faced by
such initiatives. Some of these challenges include potential and perceived threats to intellectual
property rights and the establishment of licensing schemes to support open data for the creation
of social and cultural value.
Although there is some debate as to whether cultural data is in fact big data, this discussion
evolves as the volume, velocity and variety of data being examined shifts. PECHO, for
example, utilises data that appears to conform to what is accepted as big data, especially when
the data refers to metadata, text, image data, audio data and other types of content data that,
once aggregated, require big data technologies and information practices for processing.
The case study also focuses on the variety of stakeholders involved and the roles they play in
driving impacts of big cultural data. The execution of such roles, in turn, produces a number of
positive and negative societal externalities.
1 OVERVIEW
The BYTE project case study for big data in culture is focused primarily on big cultural
metadata. In the context of BYTE, big cultural data refers to public and private collections of
digitised works and their associated metadata. However, a broader view of big cultural data
would also extend to include data that is generated by applying big data applications to the
cultural sector to generate transaction and sentiment data for commercial use. Thus, big cultural
data includes, but is not limited to: cultural works, including digital images, sound recordings,
texts, manuscripts, artefacts etc; metadata (including linked metadata) describing the works and
their location; and user behaviour and sentiment data. Currently, utilisation of big cultural data
is focussed on the digitisation of works and their associated metadata, and providing open
digital access to these data. However, a focus on cultural data to include commercial revenue
generating data, such as transaction data, is likely to develop both in the public and private
sectors.
PECHO primarily deals with open linked metadata to make cultural data open and accessible to
all Internet users. In turn, this initiative adds cultural and social value to the digital economy
through virtual access to millions of items from a range of Europe's leading galleries, libraries,
archives and museums. The relationship between metadata and content data at PECHO is
described as, “So in [PECHO] you find metadata and based on what you find in the metadata,

28
you get to the content.”8 This case study also illuminates the social and cultural value of
metadata, which is often overlooked, as it is not value that can be assessed in the traditional
economic sense. PECHO facilitates access to Europe’s largest body of cultural works. It does
so in accordance with the European Commission’s commitment to digitising cultural works and
supporting open access to these works in the interest of preserving works of European cultures.
The relationship between PECHO and national and local cultural heritage museums is as
follows:
[PECHO] works as the EU funded aggregator across all cultural heritage, across libraries,
archives museums. They only focus on stuff that has been digitised. So […] they don’t work with
bibliographic information at all, […] Anyway about 3 / 4 years ago […] they looked at various
issues around digitalisation in Europe. And one of the conclusions that they came up with was
that, all metadata should be completely open and as free as possible. [PECHO] took this
recommendation and they came up with their [PECHO] licensing framework which asked all
their contributors in the cultural heritage sector to supply their metadata cc zero.9 This relates to
both catalogue data and digital images and other content.10
Given the number of institutions involved and the variety of data utilised, this case study
presents a number of opportunities to assess the practical reality cultural data utilisation by a
public sector organisation. This includes gaining an insight into the technological developments
in infrastructure and tools to support the initiative, as well as the technical challenges presented
by it. It also provides insight into the issues such as funding restrictions, as well as the positive
social externalities produced by committing to providing European citizens with open linked
cultural metadata. PECHO also provides a solid example of the legal externalities related to
licensing frameworks and the call for copyright law reform. Lastly, PECHO provides an
interesting insight into political play between national and international institutions and their
perceived loss of control over their data.
1.1 STAKEHOLDERS, INTERVIEWEES, FOCUS GROUP PARTICIPANS AND OTHER
INFORMATION SOURCES
There are a number of stakeholders involved in PECHO, including local, regional and national
cultural heritage organisations and their employees, data scientists, developers, legal and policy
professionals, funding bodies and citizens. This is not an exhaustive list of big cultural data
stakeholders per se and as big cultural data use and reuse is increasingly practised, the list of
prospective stakeholders will expand. This is particularly relevant for the use of cultural data
for tourism purposes, for example, which will involve more collaborative approaches between
public sector and private sector stakeholders. PECHO-specific stakeholders were identified
during the case study and include the organizations in Table 8.
8 I2, Interview Transcript, 5 December 2014. 9 Interviewee 1, Interview transcript, 27 November 2015. 10 I2, Interview Transcript, 5 December 2015.

29
Table 8 Organizations involved in the culture case study
Organization Industry
sector
Technology
adoption stage
Position on data value
chain
Impact of IT in
industry
National
cultural
heritage
institutions,
including
libraries,
museums,
galleries, etc.
Cultural Late majority to
Laggards
Acquisition, curation,
storage,
Factory role
National data
aggregator
Cultural Late majority Acquisition, curation,
usage
Support role,
factory role,
strategic role
Pan –
European
cultural
heritage data
Cultural Early majority Acquisition, analysis,
curation, storage, usage
Support role,
factory role,
turnaround role,
strategic role
Policy makers
and legal
professionals
Government Late majority
Usage Strategic role
Citizens Citizens Early adopters,
Early majority,
Late majority and
Laggards
Usage Support, factory,
and turnaround
roles
Educational
institutions
Public sector Early majority Acquisition, curation,
usage
Support role
Open data
advocates
Society
organisation
Early adopters Usage Support and
turnaround roles
Interviews for the PECHO case study were the main source of information for this report.
These interviews were supplemented by discussions held at the BYTE Focus Group on Big
Data in Culture, held in Munich in March 2015. The interviewees and focus group participants
referenced for this report are detailed in Table 9. Desktop research into big data utilisation in
the cultural sector has also been undertaken for the BYTE project generally and more
specifically for the purpose of providing a sectorial definition of big cultural data for Work
Package 1.
Table 9 Interviewees of the culture case study
Code Organization Designation Knowledge Position Interest Date
I1 National
library
Project
officer
Very high
Supporter
High
27 November
2014
I2 Pan-European
digital cultural
heritage
organisation
Senior
operations
manager
Very high Supporter Very high 5 December 2014
I3 National
Documentatio
n Centre, EU
Member State
Cultural data
aggregation
officer
Very high Supporter Very high 9 January 2015
I4 International Officer Very high Supporter Very high 19 January 2015

30
open data
advocate
foundation
/
opponent
I5 Pan-European
digital cultural
heritage
organisation
R&D officer
–technology
and
infrastructure
Very high Supporter Very high 19 January 2015
I6 Pan-European
digital cultural
heritage
organisation
Senior R&D
and
programmes
officer
Very high Supporter Very high 30 January 2015
I7 Pan-European
digital cultural
heritage
organisation
Senior legal
and policy
advisor
Very high Supporter Very high 20 March 2015
FG8 Academia Information
processing
and internet
informatics
scientist
Very high Supporter Very high 23 March 2015
FG9 Institute of
technology
Academic Very high Supporter Very high 23 March 2015
FG10 National
library
Data
aggregation
officer
Very high Supporter Very high 23 March 2015
FG11 University Digital
director
Very high Supporter Very high 23 March 2015
FG12 National
Policy Office
Senior policy
officer
Very high Supporter Very high 23 March 2015
FG13 Private sector
cultural data
consultancy
Partner Supporter Very high 23 March 2015
1.2 ILLUSTRATIVE USER STORIES
Pan-European digital cultural heritage organisation - PECHO
PECHO is, in essence, an aggregator of aggregators with around 70 aggregators currently
working with them. These collaborations support the general running of PECHO as an
initiative, as well as working together on specific data projects. PECHO is an aggregator “that
works together with institutions to process their data in the best and meaningful way, either
from the domain perspective or […] working for them to process data.”11 Additional project
work is undertaken by PECHO in the utilisation of cultural metadata and is equally important
because “these projects can also solve issues in many areas, be it working on new tools or
finding ways to deal with Intellectual Property Rights holder issues, or making connections
with creative industries to start making data fit for a specific purpose, all these things can
happen in these projects.”12
11 I2, Interview Transcript, 5 December 2014. 12 I2, Interview Transcript, 5 December 2014.
31
Policy and legal advisor – cultural data sector
The main focus of the policy and legal department at PECHO is to support the openness of
metadata through the drafting and implementation of appropriate policies and licensing
frameworks. PECHO is currently publishing up to approximately 40 million objects and it is
essential to ensure that these items are appropriately labelled for licensing purposes. This
because the PECHO model is,
built on the fact that metadata should be open, it should be available under creative commons
public domain dedication. And all of the content that is shared should be labelled with a
statement that indicates how it can be accessed and what its copyright status is. And so those
fundamental principles when change but maybe how we implement it will responds according
to need.13
To that end, PECHO recently introduced a works directive to make sure data providers
understand how to properly label cultural works, subject to any legal requirements.
R&D – Technology and infrastructure
The PECHO data model must facilitate the exchange of data resources. Data models for
PECHO were created by looking at various models, the information that was available, and
what data needed to be exchanged. This development process is described:
we made some proposals and we started to implement the models for exchanging some
vocabularies and also build some application that will show the benefits of exchanging that
data. And what has happened in PECHO and communities some sort of drive, some sort of push
to have this sort of technology deployed widely. And to have everyone who have these and
publish them a bit more openly and easier to exploit from a technical perspective.14
The technical platform implemented to achieve this openness involves a number of players:
So a part of the PECHO network is made of experts in technical matters, so either in the cultural
institutions or in universities […] and our role is to facilitate their activities so part of it is
indeed about while making sure the R and D network is more visible than what it used to be.
And to promote well their activities and make their life easier.15
Research & Development personnel are tasked with pushing the development of this
technology and developing the accompanying best practices so that more of the domain is made
available to encourage data re-use.
2 DATA SOURCES, USES, FLOWS AND CHALLENGES
The BYTE case study focuses on the publicly funded cultural data initiative and such, the
discussion below relates the data sources, use and flows in that context.
2.1 DATA SOURCES
PECHO deals primarily with big cultural metadata (including open linked metadata) pertaining
to cultural works (digital images, sound recordings, texts and manuscripts etc.) from a large
majority of Europe’s cultural heritage organisations. This includes metadata relating to the
following works: digital images, sound recordings, texts, manuscripts, artefacts etc. This
metadata is provided by a multitude of national and local cultural heritage organisations,
13 I7, Interview Transcript, 20 March 2015. 14 I5, Interview Transcript, 19 January 2015. 15 I5, Interview Transcript, 19 January 2015.
32
usually via a national aggregator that deals directly with PECHO. However, museums, archives
and libraries are the main data sources.16 PECHO deals with up to 70 aggregators that provide
varying amounts of data subject to the volume of catalogue data held by the data partner
cultural heritage organisations. One representative of PECHO estimated the volume of data
held:
So at the moment we have in our database, […] 190 million metadata records, but they are not
all open for various different reasons. And that includes […] 165 million bolographic records
[…] and we have 25 million records, which actually point to items that have been digitised.17
PECHO however does not store the data and nor do they wish to do so because “they are so
diverse and they have lots of different peculiarities or properties that we only store the
references to them. So it’s a very high-tiered organisation […]”18 PECHO provides access to up
to 40 million items of open data, which has built up over 6 years. The figure is higher when the
metadata that does not accord with the CC019 licensing requirement is added, together with the
content data that PECHO links to. The volume of data continues to increase, although,
we are not particularly calling for new content to be delivered […] you can say it just happens.
Yes mainly it’s that […] people come and give us data, and that’s our regular partners and
growing partners. That is always growing. So we don’t go out and necessarily make open calls
for more content etc.20
Some of the metadata are created and provided by experts. For example, librarians of national
libraries provide lists of metadata relating to a particular subject matter. This constitutes a wide
and rich body of knowledge.21 However, PECHO does not accept any metadata from its data
partners that is not provided under a CC0 licence and all data partners are required to sign a
data agreement to that effect.22 This is a fundamental requirement of the PECHO Data Model
(PDM), which was developed in-house as a means of dealing with open linked metadata,
especially as these data are often provided in a number of formats and languages. The PDM
centres on the concept of open access and it has significantly contributed to the open data
movement in Europe.23 The PDM is specifically designed to aid interoperability of data sets
during the data acquisition phase. Integrating data into the PDM is an interactive process:
So cultural institutions need to connect to what we call aggregate to switch our national or
domain associations or organisations that collect data in their domain of their perspective
countries. And they connect it according to the data model that we have set and we have
provided that is called PDM, the PECHO Data Model, and this aggregation structure is like a
tiered structure in which the cultural heritage organisation of which there are about 60,000 in
Europe only alone, are being collected through about 50 or more aggregators […] that aggregate
these data to us and we deal with them. The data itself in only the metadata so there are
references to objects that are stored locally at the cultural heritage institutions.24
16 I5, “Big Data in Culture”, BYTE Focus Group, Munich, 23 March 2015. 17 I1, Interview Transcript, 27 November 2014. 18 I6, Interview transcript, 30 January 2015. 19 CC0 License is a form of public license that releases works into the public domain with as few restrictions on
use as possible. 20 I2, Interview Transcript, 5 December 2015. 21 I5, Interview Transcript, 19 January 2015. 22 I2, Interview Transcript, 5 December 2014. 23 I1, Interview transcript, 27 November 2014. 24 I6, Interview Transcript, 30 January 2015.

33
The PDM also facilitates the richness of the data used by PECHO. The PDM:
was developed over some time, and is not going to be implemented, and meanwhile a number
of data projects and aggregators are also working with PDM and giving us a data PDM which
allows them to make them more richer, which allows them to also incorporate vocabularies, so
it’s a much richer and much…it is yes…allows for more powerful than our previous scheme
model that we used.25
Looking to the future, there may be additional sources of data, although these are not yet
institutionalised in the PDM. For example, transaction data and public sentiment data can be
utilised in the future, not just by PECHO, but by other organisations as well that wish to
capture the benefits associated with that type of data in the cultural sector.26
2.2 DATA USES
The primary use of the metadata is to provide citizens, educational institutions and other
cultural heritage institutions with efficient access to cultural heritage works and their related
information. This is the primary use of big cultural data in the context of PECHO. Thus, the
value of this data utilisation lies simply in making cultural and historical works available for
use and re-use. PECHO facilitates this through the implementation of technological
infrastructure and software specifically designed for the provision of open cultural metadata for
the efficient location of content data.
Furthermore, the facilitation of open cultural metadata has lead to a number of subsequent uses
of the metadata and content data. This bolsters the value of metadata, which is observed:
metadata for us are still important they are a product and if we don’t consider them as being a
product then it becomes very difficult to raise a bar and also to make that content that are
underlining this data properly accessible.27
Metadata and content data use and reuse are the primary focuses of the PECHO initiative. For
anyone in Europe and abroad who wants to connect to cultural heritage data digitally, that use
is facilitated by the PECHO centralised data model or centralised surface (the PDM). PECHO
supports re-use of data by connecting data partners with creative industries, for example. This
means that current and prospective stakeholders within these industries are aware of access to
the catalogues, which in turn, can lead to works being re-purposed in a contemporary and
relevant way. This re-use is supported by PECHO’s commitment to open data “because we
make the stuff openly available we also hope that anyone can take it and come with whatever
application they want to make.”28 This is significant as the discourse on cultural data at present
is about reuse, now that the practise of digitising cultural works is maturing. This means that
“PECHO is thus experimenting if you like with how there can be a different infrastructure
where they can hold extra content and whether value is created both for the providers and the
aggregators and the intermediaries.”29 Furthermore, in the creative sense, PECHO provides a
number of data use opportunities, including the following example:
25 I2, Interview Transcript, 5 December 2015. 26 See Deliverable 1.3 “Sectorial Definitions of Big Data”, Big Cultural Data, 31 March 2015. 27 I2, Interview Transcript, 5 December 2014. 28 I5, interview Transcript, 19 January 2015. 29 I3, Interview Transcript, 9 January 2015.

34
we have PECHO sounds which is currently in its nascent stages, which is looking at more non-
commercial sound recordings like folklore and wildlife noises and what have you. We’re just
about to launch a portal called PECHO research, which is specifically aimed at opening up and
raising awareness of the use of data in the academic community. And we also have our PECHO
labs website which if you are on our pro website which is the pink colour one, in the right hand
corner I believe.30
Instructions for how users can reuse data are generally provided alongside the data, although
typically, the data will be under CC0 license.31 Aside from this use and re-use, the data are
otherwise technically used in a manner that involves day-to-day data processing, including
harvesting and ingesting.32
2.3 DATA FLOWS
There are a number of steps involved in making cultural metadata and content data available
through the PECHO web portal.
First, data originates from cultural heritage organisations all over Europe, as discussed above
under ‘Data sources’. For example, a national library in Europe aggregates catalogue data for
PECHO and provides it in the format prescribed by the PDM.
More generally, the data flows from the original source as it is described in the following
example:
we take metadata from a museum. They give us the metadata solely and in the metadata as part
of the metadata they give us a URL to where their digital object is restored […] On their
website, on their servers so that it can be publically accessible by PECHO. Now we don’t store
that object for that museum we just republished via the URL. So we only deal with metadata
you are quite right. However our goal is to share data so metadata and content. And it is really
important that if users find the metadata the museum provides and because they can see the
images that are retrieved via image URL they need to be able to know how to use those
images.33
Thus, all data are either channelled to PECHO via a national data aggregator or directly from
the smaller institution. A team at PECHO acts as the interface with the partners across Europe
that provide data to PECHO. They process these data internally until they get published in the
PECHO portal. The data may then also become accessible via the API and other channels.34
The data flows are facilitated by the PDM referred to above. This process is described in more
detail by a representative of PECHO who states that the PDM is a:
one of a kind model which allows the linking and enrichment of the data so you could very
much generalise data […] if you adhere to the PECHO Data Model you could link it to what
multilingual databases. So for instance look for an object in a German language you would
automatically find results that are described in English or any other European language. So it is
30 I7, Interview Transcript, 20 March 2015. 31 I7, Interview Transcript, 20 March 2015. 32 I2, Interview Transcript, 5 December 2014. 33 I7, Interview Transcript, 20 March 2015. 34 I2, Interview Transcript, 5 December 2014.

35
a lot aligned to the thesaurus model or the models that have been in place for years now. So that
is the main feature I think of the PECHO Data model.35
In terms of data processing, the open data is given priority over data with a restricted license.
Overall, the flow of cultural metadata at PECHO is ever evolving and is modified and
developed to meet technical challenges as they arise. The main technical challenges are
addressed below.
2.4 MAIN TECHNICAL CHALLENGES
The primary technological and infrastructural challenges that arise in relation to achieving the
PECHO objective of providing open linked cultural metadata generally relate to the
organisation, standardisation and alignment of the disparate data coming from a large number
of varied institutions that use differing formats and languages. The primary solution offered by
PECHO to their data partners is assisting them with their adherence to the requirements of the
PDM.
Central to making cultural data accessible to a wide audience, the technical challenge presented
by the diversity of European languages must be overcome. This is a primary issue because, “the
difficulties we have at European libraries, of course, is that we across Europe are
multilingual.”36 This challenge has been dealt with by incorporating methods of translation into
the PDM in order to bring the data into the required format for mapping the data. Another
technical challenges faced in relation to open data, is not in terms of facilitating openness, but
rather, tracking how the open metadata and data is being used. PECHO must implement
technical solutions that are capable of evolution so that the data can utilised. This challenge will
likely be addressed as the PDM evolves. Moreover, participants at the BYTE Focus Group on
big data in culture agreed that in-house development of solutions to technical challenges is
required for total control over data, and especially if, in the future, stakeholders will better
utilise transaction data and sentiment data to capture commercial benefits associated with big
cultural data. However, these processes require considerable financial resources, which is an
issue when dealing with public-sector data driven initiatives.37
The varying quality of data is also a technical challenge faced by the PECHO data processing
team. This issue arises because every user has different requirements and differing perspectives
on data qualities than the curator or data entry person that made the data in the first place. In the
context of PECHO, data quality means:
Richness is certainly part of it, like a meaningful title or a long and rich description and
contextual information use of vocabularies and all these aspects to help making data more richer
and easier to discover. But it has several also other areas, like, currently a lot of the metadata
that we get, are made for a specific purpose in a museum in an archive, in the library, for
example to by scientists for scientific purposes for example, this is why sometimes a lot of these
data are generated for purposes and now they are turned into something how does it work for
the end user. And how is it fit for even a reuse purpose, which sometimes is difficult to achieve
as the starting point with a different one. So also depending on what you want with these data,
you may get different […] definition of what quality is for you.38
35 I6, Interview Transcript, 30 January 2015. 36 I1, Interview Transcript, 27 November 2014. 37 FG10 and FG11, “Big Data in Culture”, BYTE Focus Group, Munich, 23 March 2015. 38 I2, Interview Transcript, 5 December 2014.

36
Addressing this issue was the topic of a task force last year that examined metadata quality.
Data quality remains important because PECHO needs to enforce its set of mandatory aspects
of the PDM so that every record has an appropriate rights statement attached for the data
object, as well as other mandatory fields for different object types, and text language/s. These
standards enable PECHO to “leverage the full potential of the object type that we get, and
achieve a certain level of consistency was yes basic data quality that we want to achieve.” 39
Overall, addressing technical challenges in-house and as they arise is key to the effectiveness
and efficiency of the PECHO initiative:
With incentives coming from creative with new technologies coming from cloud and from
within our own organisation, working to make processes more efficient, that also some of these
issues can be solved. These issues however are the key driver in technological innovation.
PECHO also works with its data partners to solve some of the issues that you are mentioning in
terms of infrastructure and resource. “For example data aggregator for museum would be in a
better position to make the tooling, that would make mapping easier for the individual
museums.40
2.5 BIG DATA ASSESSMENT
There is debate as to whether big cultural data exists.41 Theoretically, we can consider the
extent to which big data in the cultural sector contends with the accepted definitions of big
data, such as the Gartner 3Vs definition or an extension of that definition, such as the 5Vs, used
to assess big data across case study sectors in Work Package 1 of the BYTE project. The 5Vs
include: Volume; Variety; Velocity; Veracity; and Value. These Vs are more likely met when
cultural datasets are aggregated. Although there is some evidence of stand alone data sets being
considered big data, such as sizeable collections held by cultural heritage organisations or in
private collections. For example, the totality of cultural metadata utilised by PECHO would
likely contend with a definition of big data. The following is an assessment of whether big
cultural data exists in the context of the case study based on information gleaned during case
study interviews and supplementary discussions held at the BYTE Focus Group on Big Data in
Culture and assessed against the 5Vs of big data:
Volume can be indicated by: massive datasets from aggregating cultural metadata; or large
datasets of metadata of cultural items available at cultural heritage institutions (museums,
libraries, galleries) and organisations. PECHO holds 36 million data, which has built up over a
period of approximately 6 years.42 This volume was the product of an aggressive pursuit of
data. However, the total volume of the data used or linked to via PECHO is roughly 190 million
items and growing, and as such requires processing through the implementation of a data
specific model, the PDM.43 This likely contends with the volume element of a big data
definition. Nevertheless, debate surrounds the volume of cultural data and a data scientist
specialising in search engine technology and broadcast data who participated in the BYTE
Focus Group opined that cultural data is not, in practice, considered big data, although it
39 I2, Interview Transcript, 5 December 2014. 40 I5, Interview Transcript, 19 January 2015. 41 This topic attracted much discussion by big data practitioners in attendance at “Big Data in Culture”, BYTE
Focus Group, Munich, 23 March 2015. 42 I2, Interview Transcript, 5 December 2014. 43 I6, Interview Transcript, 30 January 2015.
37
becomes so when a number of databases are combined.44
Variety can be indicated by: quantitative data, e.g. cataloguing of metadata and indexed cultural
datasets; qualitative data, e.g. text documents, sound recordings, manuscripts, images across a
number of European and international cultures and societies in a variety of languages and
formats; and transactional data, e.g. records of use and access of cultural data items. The data
held by PECHO is made up of all of these characteristics, particularly noting that the vast array
of data items are provided in a variety of languages and formats.
Velocity can be indicated by: monitoring user behavioural and sentiment data, social media
traces, and access rates of cultural data etc. This is not a major focus of the PECHO model,
although it is becoming increasingly so.
Veracity can be indicated by: improved data quality. Data quality, richness and interoperability
are major issues that arise in relation to the data used (and linked to) via PECHO. This is
especially visible as every user has different requirements and differing perspectives on data
qualities than the curator or data entry person that made the data in the first place. In this
context, the veracity of the data used contends with that commonly accepted to indicate big
data. Nevertheless, there exists contention around the veracity of cultural data and its
richness.45
Value can be indicated by: knowledge creation from the access and potential re-use of digitised
cultural items; improved access to metadata and data, e.g. historical texts; and improving
efficiency for students, researchers and citizens wishing to access the data and reducing overall
operational of cultural institutions and organisations. Although the value of cultural data is
cannot be assessed in the traditional economic sense, does not mean that it does not generate
social and cultural value.
The data utilised by PECHO constitutes big data in a manner that is best summed up a
representative of PECHO: “we may not have really big data technically but we have
heterogeneous data and we have scientific content.”46 Nevertheless, the definition of big data
continues to change as computational models change, which makes it difficult to assess the
‘size’ of cultural data generally.47
3 ANALYSIS OF SOCIETAL EXTERNALITIES
This section examines the positive and negative externalities identified in the culture case
study, according to the list of externalities included in Appendix A (see Table 55).
3.1 ECONOMICAL EXTERNALITIES
The immaturity of big cultural data is linked to its evolution in the public sector. The
digitisation of items of cultural heritage is carried out largely by public sector institutions and
organisations. This means that these processes are subject to policy and funding restrictions,
which at times act as barriers to progress and the slow the adoption of big data information
practices across the sector. Second, and again related to the public positioning of the cultural
sector, there is a strong focus on deriving cultural and social value from the cultural data rather
44 FG11, “Big Data in Culture”, BYTE Focus Group, Munich, 23 March 2015. 45 FG10 and FG11, “Big Data in Culture”, BYTE Focus Group, Munich, 23 March 2015. 46 I3, Interview Transcript, 9 January 2015. 47 FG11, “Big Data in Culture”, BYTE Focus Group, Munich, 23 March 2015.

38
than monetising these data or applying big data applications to generate profit in a commercial
sense. This is one of the main reasons that associated data, such as transaction and sentiment
data are not yet being fully utilised. In the case of PECHO, the generation of revenue is not at
this stage a primary objective, and in any event, in this context, copyright laws restrict better
utilisation of cultural data and its traction data.48 Focus group participants also identified the
negative impacts that are produced when new business models utilising big cultural data, such
as competition and regulatory issues, or development and innovation are hindered as a result of
a ‘copyright paranoia’.49 Thus, big cultural data is predominantly understood as a publicly
funded investment in culture creation and preservation. This potentially hinders the economic
externalities that would otherwise flow from big cultural data use and re-use.
In terms of economic value being derived directly from the metadata in a traditional economic
sense, analysis shows there is no real economic value into the business of metadata directly by
exploiting the metadata.50 However, there are indirect economic benefits in that it raises the
visibility of the collections and of the providers and drives more traffic to these national and
local sites, which are the main value propositions for providers in terms of making their data
available to aggregators.51 However, the restrictive funding environment and stakeholders’
inability to exploit metadata directly can act as barriers to innovation as well. An example of
why funding plays a major role in the creation of externalities was provided by a representative
of PECHO as being linked to the expense of adequate infrastructure: “Storage is very expensive
that is what we noticed, it is not the storage itself but the management of the storage is really an
expensive thing.”52
Despite these issues, limited resources also drive innovation. Innovation is a crucial element of
economies. PECHO provides examples of innovative collaborations, such as PECHO Cloud,
which is predicted to have an impact in terms of the future of infrastructure, and aggregation
for big cultural data. Innovation is also captured in the following description of a developing
business model at PECHO:
what we propose in the business model for PECHO cloud surfaces, is that we can do it just as
expensive or just as cheap as the national aggregation services or domain aggregation services
would do. But then on a European wide scale, so there is this automatic involvement in the
infrastructure that we are proposing. Which has the advantage that anybody can access it under
the conditions that we have set.53
Thus, PECHO’s commitment to open data produces a number of economic opportunities.
Furthermore, this is possibly the major impact of PECHO as the value lies in making the
metadata open and accessible for repurposing. This means that datasets that are “glued”
together by the semantic web community are currently being used by many people to fetch data
rather than storing their own catalogue of data.54 This also potentially enables stakeholders to
create services, such as (online) guided tour models for tourism purposes, which prompt people
to travel and view the original version of what they see online.55 Other positive economic
48 FG, “Big Data in Culture”, BYTE Focus Group, Munich, 23 March 2015. 49 I6, FG8, FG9, FG11 & FG12, “Big Data in Culture”, BYTE Focus Group, Munich, 23 March 2015. 50 I3, Interview Transcript, 9 January 2015. 51 I3, Interview Transcript, 9 January 2015. 52 I6, Interview Transcript, 30 January 2015. 53 I6, Interview Transcript, 30 January 2015. 54 I5, Interview Transcript, 19 January 2015. 55 FG8, “Big Data in Culture”, BYTE Focus Group, Munich, 23 March 2015.
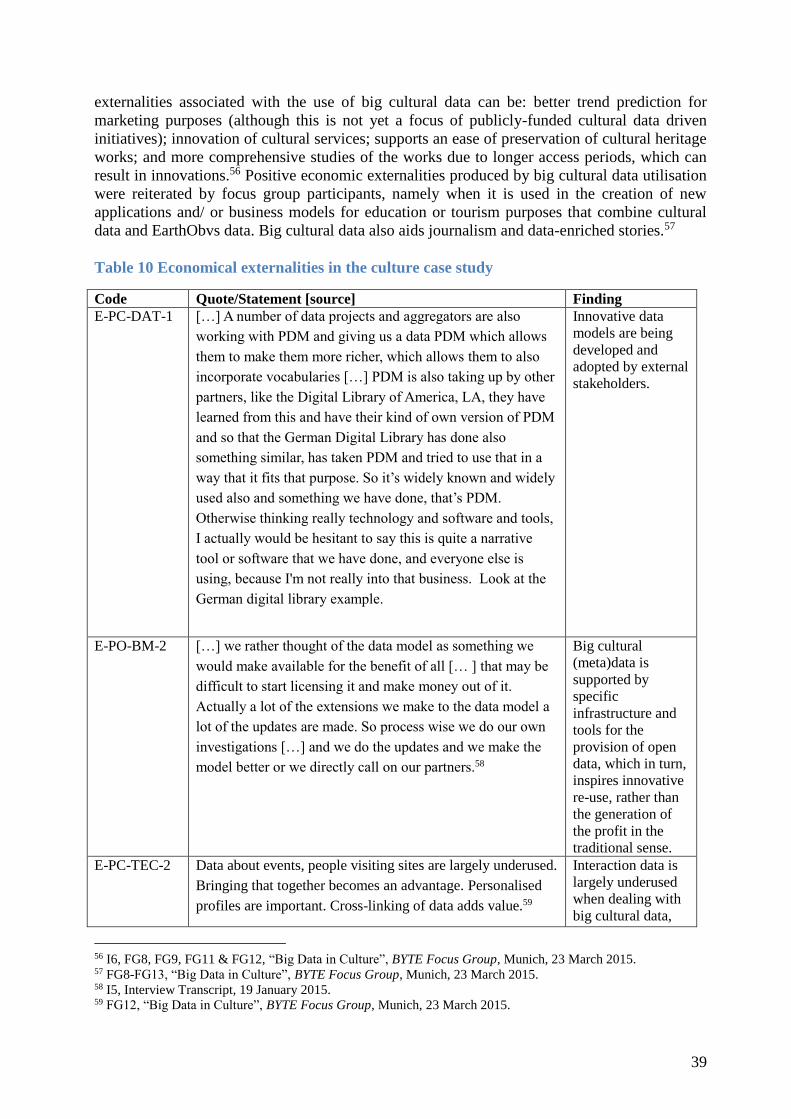
39
externalities associated with the use of big cultural data can be: better trend prediction for
marketing purposes (although this is not yet a focus of publicly-funded cultural data driven
initiatives); innovation of cultural services; supports an ease of preservation of cultural heritage
works; and more comprehensive studies of the works due to longer access periods, which can
result in innovations.56 Positive economic externalities produced by big cultural data utilisation
were reiterated by focus group participants, namely when it is used in the creation of new
applications and/ or business models for education or tourism purposes that combine cultural
data and EarthObvs data. Big cultural data also aids journalism and data-enriched stories.57
Table 10 Economical externalities in the culture case study
Code Quote/Statement [source] Finding
E-PC-DAT-1
[…] A number of data projects and aggregators are also
working with PDM and giving us a data PDM which allows
them to make them more richer, which allows them to also
incorporate vocabularies […] PDM is also taking up by other
partners, like the Digital Library of America, LA, they have
learned from this and have their kind of own version of PDM
and so that the German Digital Library has done also
something similar, has taken PDM and tried to use that in a
way that it fits that purpose. So it’s widely known and widely
used also and something we have done, that’s PDM.
Otherwise thinking really technology and software and tools,
I actually would be hesitant to say this is quite a narrative
tool or software that we have done, and everyone else is
using, because I'm not really into that business. Look at the
German digital library example.
Innovative data
models are being
developed and
adopted by external
stakeholders.
E-PO-BM-2 […] we rather thought of the data model as something we
would make available for the benefit of all [… ] that may be
difficult to start licensing it and make money out of it.
Actually a lot of the extensions we make to the data model a
lot of the updates are made. So process wise we do our own
investigations […] and we do the updates and we make the
model better or we directly call on our partners.58
Big cultural
(meta)data is
supported by
specific
infrastructure and
tools for the
provision of open
data, which in turn,
inspires innovative
re-use, rather than
the generation of
the profit in the
traditional sense.
E-PC-TEC-2 Data about events, people visiting sites are largely underused.
Bringing that together becomes an advantage. Personalised
profiles are important. Cross-linking of data adds value.59
Interaction data is
largely underused
when dealing with
big cultural data,
56 I6, FG8, FG9, FG11 & FG12, “Big Data in Culture”, BYTE Focus Group, Munich, 23 March 2015. 57 FG8-FG13, “Big Data in Culture”, BYTE Focus Group, Munich, 23 March 2015. 58 I5, Interview Transcript, 19 January 2015. 59 FG12, “Big Data in Culture”, BYTE Focus Group, Munich, 23 March 2015.

40
despite its potential
economic benefits.
3.2 SOCIAL & ETHICAL EXTERNALITIES
The overarching social externality associated with PECHO is the creation and enriching of
cultural and social value for European citizens. This achieved by facilitating readily accessible
cultural heritage data. One aspect of value creation is combination enrichment, supported by
providing searchable open cultural data and metadata. This search ability also facilitates depth
of research and study, which leads to greater insights and a more accurate presentation of
cultural and historical facts.60 However, this raises the ethics of opportunistic search engines
being able to control interaction data relating to another organisations’ efforts for their own
commercial benefit. For example, Google is free but uses the information provided by PECHO
in its own business model for targeted advertising. However, PECHO provides the service at a
cost to the taxpayer where revenue generation is not always considered an appropriate aspect of
the business model, in accordance with a public-sector ethos.61 Thus, the social value created
by open linked metadata also implicates ethical considerations of data exploitation and
inequality. Further, inequality of access between organisations entails the situation where the
publicly funded open data model provides private organisations with access to both these data,
as well as their own data, which they are under no obligation to share. Public institutions, such
as PECHO, have free access only to the data they hold and are limited in their potential use and
repurposing of that data because of this.
Further, focus group participants identified the risk of fraud resulting from open access to
cultural data when anyone with access to digital versions of cultural works may reproduce it or
misrepresent (lesser known) works as their own, via social media for example. This is also
because authenticity becomes difficult to verify when works are distributed on a mass scale.62
Lastly, the ethics of privacy were identified as a potential externality of open cultural data,
insofar as privacy of individuals or groups identified in cultural data can be invaded via the
provision of linked metadata. In the case of PECHO, any risk to privacy is addressed in the
“terms of use” policy section on the website. Practically speaking, this means that, “if people
think that something is not correct or they have problems with similar to Google, they can
inform us and then we take the material also down.”63 Whilst threats to privacy are a potential
issue, it is not a major concern in practice because it can be readily addressed and there are so
few recorded complaints.64
Table 11 Social & ethical externalities in the culture case study
Code Quote/Statement [source] Finding
E-PC-ETH-1 The content is not accessible for searching. I mean when we
have full text of course you can deploy full text search on top
of it. But for pictures of paintings or statues or even sounds
without metadata you can’t do much for searching and
accessing them. And that is often overlooked but it is true
The value of
metadata is often
overlooked.
60 FG8-FG13, “Big Data in Culture”, BYTE Focus Group, Munich, 23 March 2015. 61 FG8-FG13, “Big Data in Culture”, BYTE Focus Group, Munich, 23 March 2015. 62 I6, FG8, FG9, FG11 & FG12, “Big Data in Culture”, BYTE Focus Group, Munich, 23 March 2015. 63 I2, Interview Transcript, 5 December 2014. 64 I7, Interview Transcript, 20 March 2015.

41
that in the past year […] everyone has come to realise that
metadata is an important piece of the puzzle. And I believe
that all these stories about national security actually kind of
helped send a message. People are more aware of the benefits
and the dangers of metadata.65
E-PC-LEG-4 […] suddenly where we get issues are when kind of privacy
aspects are touched upon. Like pictures where somebody is
on the picture, either the relative or the person themselves
doesn’t want this picture to be on line, so this is also when we
get take down requests.66
In theory, the ethics
of privacy are
implicated by
open-linked
metadata.
E-PO-DAT-1 So actually when PECHO started providers where extremely
reluctant and the data model were actually instrumental in
convincing them. Because there is the idea we can produce
we can publish richer data that can benefit everyone. But that
will really happen if everyone decides to contribute because
if everyone keeps their data for themselves then not much
happens.67
Tackling inequality
between public
sector and private
sector organisations
will be
instrumental in
generating value
for all stakeholders.
3.3 LEGAL EXTERNALITIES
Reuse of cultural data is not absolute and for cultural data to be lawfully re-used it needs to be
done so in accordance with relevant legal frameworks. In fact, managing intellectual property
issues that arise in relation to the re-use of cultural data is perhaps the biggest challenge facing
big cultural data driven initiatives, such as PECHO. The effect of copyright protections, for
example, can be a limit on sharing data (that could otherwise be used for beneficial purposes)
and the enforcement of high transaction costs68, which then restricts the audience members to a
particular demographic.
Further, arranging the necessary licensing agreements to enable re-use of cultural data can be
arduous, especially as there is limited understanding and information about how rights
statements and licensing frameworks can support stakeholders in capturing the full value of the
data. This not only includes the technological challenge of making the data truly open and
accessible, but also necessitates an attitudinal shift amongst traditional rights holders, as well as
cultural heritage organisations that hold cultural data. Licensing arrangements by the BYTE
case study organisation, PECHO, are commonly tackled through applying a Creative Commons
licensing regime, namely a CC0 public licence. PECHO Creative, a PECHO project, provides a
good example of how transparent licensing arrangements can support open cultural data, which
enables re-use and the benefits that flow from that reuse. The longstanding tensions
surrounding intellectual property rights and cultural data has led to a strong call for copyright
reform in Europe on the basis that the legislation is outmoded and a barrier to sharing and open
data.69 For example, an institution that stores terabytes of tweets from Twitter has been unable
65 I5, Interview Transcript, 19 January 2015. 66 I2, Interview Transcript, 5 December 2014. 67 I5, Interview Transcript, 19 January 2015. 68 FG8-FG13, “Big Data in Culture”, BYTE Focus Group, Munich, 23 March 2015. 69 I7, Interview Transcript, 20 March 2015.

42
to utilise that data for the purpose it collated the data due to the barrier to sharing presented by
the current intellectual property framework.70
In addition, data protection was identified as a legal barrier to some models that incorporate the
use of cultural interaction data, and for also limiting the re-use of certain forms of cultural data,
such as data including references to sensitive personal material.71 As this is an area of on-going
debate, reform will continue to be pursued by stakeholders.
Table 12 Legal externalities in the culture case study
Code Quote/Statement [source] Finding
E-PO-LEG-2 One barrier that I'm not going to priorities but our rights,
that’s one thing that is always a difficult question for us.
When it comes to rights people need to apply to actually also
even know what the copyright situation is. That sometimes is
causing interesting questions and discussions with partners
on all levels.72
One of the major
issues, and
potential barriers to
re-use of cultural
data is property
rights. However,
this can arise as a
result of miss-
information or a
lack of
understanding held
by the data
partners.
E-PP-LEG-2 So this year we are looking again at rights statements and
how those can be clarified because the legal landscape is
difficult and it is difficult for users to sometimes understand
what restrictions there might be when using content. […] We
need to make sure that they are accurate but also they are
kind of harmonised across Europe because we don’t want 28
different ways to say something is in copyright. In the same
way that Creative Commons who is a licensed standard that
we use as a basis of a lot of our options. And Creative
Commons even moved away from having 28 different or…it
wasn’t even 28 it was country specific licences. So in their
recent update they moved away from country specific and
just upgraded to 4.0 and then said that actually if you want to
translate it you can but 4.0 in English it is one licence it is not
adapted to any country specific law.73
Fragmented
implementation of
European
intellectual
property
framework is
jeopardising open
data and the
opportunities
associated with the
reuse of cultural
data.
70 FG11, “Big Data in Culture”, BYTE Focus Group,Munich, 23 March 2015. 71 FG8-FG13, “Big Data in Culture”, BYTE Focus Group, Munich, 23 March 2015. 72 I2, Interview Transcript, 5 December 2015. 73 I7, Interview Transcript, 20 March 2015.

43
E-PC-LEG-5
It is an important balance to sharing the metadata the
descriptive information because you want cultural heritage to
be discoverable, which is why we believe it should be open.
We want it to be reused but there is a very important rights
holder issue here is that there’s a lot of copy right in modern
day and you know our culture and history that is up to about
140 years old. That has to be respected, you have to have
permission in some way to access it or to reuse it and that has
to be communicated. But in the same way there are also
works that are 200 years or 300 years old were no copyright
exists. So we took the decision that it is important to
communicate that there are no restrictions as well. And this is
the public domain mark, this says there are no copyright
restrictions of course respect the author by attributing their
information. But you are not bound by any copyright
restrictions when you access when you want to use this work.
And I think that the role of the right statements which are sort
of big part of the licensing framework is to help educate users
and to help communicate this information so that
people…understanding of what they can do with the content
that they discover via the metadata published on European.74
Cultural heritage
organisations needs
assistance with
understanding the
copyright
framework.
3.4 POLITICAL EXTERNALITIES
Political issues arise in relation to making the data open because it can lead to a perceived loss
of control of data held by national institutions thereby causing intra-national tensions. This
tension is also fuelled by reluctance on part of institutions to provide unrestricted access to their
metadata under a CC0 license. The immediate response to this for PECHO has been to include
a clause in the Data Agreement requiring a commitment to sharing only metadata with a CC0
licence or be excluded from the pan-European partnership, and subsequently, lose the benefits
associated with PECHO. However, this aggressive approach heightened fear of loss of data
control by some stakeholders. Such tension between data aggregators and data partners are a
direct political externality of promoting open cultural data. However, this is now being
addressed through education and information providing initiatives at PECHO that highlight the
importance of local contributions to the development of cultural data aspect of the European
digital economy.
There also exists a EarthObvs-political tension around the American dominance over
infrastructure. This has prompted a general trend towards reversing outsourcing practices, and
developing infrastructure and tools in-house, as has been the case with PECHO.75 For example,
now organisations are developing their own search engines and downloading data from cultural
heritage institutions.76 This has also been driven out of a desire to maintain control over
infrastructures and innovations, as well as retain skills and expertise in-house, and more
specifically, within Europe. This has been an important shift in the attitude towards a more
protective approach to European innovations and development.
74 I7, Interview Transcript, 20 March 2015. 75 FG8-FG13, “Big Data in Culture”, BYTE Focus Group, Munich, 23 March 2015. 76 FG11, “Big Data in Culture”, BYTE Focus Group, Munich, 23 March 2015.

44
Aside from the aforementioned political externalities, political externalities in the context of
BYTE case study otherwise arise indirectly when partisan priorities dictate the use of cultural
data in the public-sector, especially in terms of funding.
Table 13 Political externalities in the culture case study
Code Quote/Statement [source] Finding
E-PP-LEG-1
[…] for instance that in Germany there is a law, which
requires cultural heritage stored in the country itself. So if
you are building a cloud structure for cultural heritage you
need a mirror or a synchronised mirror in the country itself.
And we need to provide access copies to them and there are
also more of a political issue that many countries would like
a national cloud surface developed. Just because they would
like to have control of them and at PECHO are looking for a
centralised surface that is run by us. But it needs to
synchronise or it needs to mirror what is happening in the
national aggregation surfaces.77
There are intra-
national political
issues related to a
perceived loss of
control of a
nation’s cultural
heritage data.
E-PO-LEG-1 Call for a political framework around cultural heritage data to
protect culturally sensitive data so that it is not leaked.78
There is an
increased shift
towards
protectionism of
cultural data and
keeping
infrastructure and
technical
developments
local.
4 CONCLUSION
Big cultural data utilisation is in its infancy and as such, the full extent to which data utilisation
in this context impacts upon society is not yet realised. There is also ongoing discussion as to
whether cultural data accords with definitions of big data.
Nevertheless, the PECHO case study provides insight into how to big cultural data utilisation is
maturing and the economic, social and ethical, legal and political issues that arise in relation to
the aggregation of cultural metadata in the open data context.
PECHO has faced a number of technological challenges, but these challenges have also
prompted innovation in data models, tools and infrastructure. Despite these challenges, PECHO
produces a number of positive externalities, primarily the creation of social and cultural value.
Similarly, legal issues related to intellectual property rights have prompted the drafting of in-
house licensing agreements that can be used as models by similar data-driven initiatives. One
of the more significant externalities to be produced by PECHO is the PDM, which has been
adopted abroad and is indicative of the potential for innovation in data driven business models.
77 I6, interview Transcript, 30 January 2015. 78 I6, FG8, FG9, FG11 & FG12, “Big Data in Culture”, BYTE Focus Group, Munich, 23 March 2015.

45
Overall, the externalities produced by big cultural data utilisation have lead to a number of
overarching conclusions. First, copyright reform is necessary to enable cultural data sharing
and openness. Second, there is a real need for data scientists to grow this aspect of European
data economy and retain the skills and expertise of local talent, which in turn, will limit control
by organisations from abroad, such as those run by US-base stakeholders. Third, larger cultural
datasets require more informed data quality practices and information about data sources and
ownership. Therefore, the BYTE case study on big cultural data utilisation provides a practical
example of real challenges faced, and externalities produced (or pursued) by a publicly funded
cultural data initiative.

D3.2 Case study reports BYTE project
46
ENERGY CASE STUDY REPORT – EXPLORATION AND PRODUCTION OF
OIL & GAS IN THE NORWEGIAN CONTINENTAL SHELF
SUMMARY OF THE CASE STUDY
This case study is focused on the impact of big data in exploration and production of oil &
gas in the Norwegian Continental Shelf. We have interviewed senior data scientists and IT
engineers from 4 oil operators (oil companies), one supplier, and the Norwegian regulator.
We have also conducted a focus group with 7 oil & gas experts and attended several talks on
big data in this industry. With such input we have compiled information about the main data
sources, their uses and data flows, as well as the more noticeable challenges in oil & gas.
Overall, the industry is currently transitioning from mere data collection practices to more
proactive uses of data, especially in the operations area.
Positive economical externalities associated with the use of big data comprise data generation
and data analytics business models, commercial partnerships around data, and the
embracement of open data by the Norwegian regulator – the negative ones include concerns
with existing business models and reluctance of sharing data by oil companies. In the positive
side of social and ethical externalities, safety and environment concerns can be mitigated with
big data, personal privacy is not problematic in oil & gas, and there is a need of data scientist
jobs; in the negative side, cyber-threats are becoming a serious concern and there are trust
issues with data. With respect to legal externalities, regulation of data needs further
clarification and ownership of data will be more contract-regulated. Finally, political
externalities include the need of harmonize international laws on data and the leadership on
big data of some global suppliers.
1 OVERVIEW
The energy case study is focused on the use of big data by the oil & gas upstream industry,
i.e. exploration and production activities, in the Norwegian Continental Shelf (NCS). The
NCS is rich in hydrocarbons that were first discovered in 1969, while commercial production
started in the Ekofisk field in 1971.79
The oil & gas industry is technically challenging and economically risky,80 requiring large
projects and high investments in order to extract petroleum. In the case of the NCS, project
complexity is further increased since deposits are offshore in harsh waters and climate
conditions are challenging. As a result, petroleum activities in the NCS have prioritized long-
term R&D and tackled projects that were highly ambitious technically.81
Petroleum activities in Norway are separated into policy, regulatory and commercial
functions: Norway’s policy orientation is focused on maintaining control over the oil sector;
the Norwegian Petroleum Directorate82 (NPD) is the regulator body; while petroleum
79 Yngvild Tormodsgard (ed.). “Facts 2014 – The Norwegian petroleum sector”. The Norwegian Petroleum
Directorate. 2014. Available at:
https://www.regjeringen.no/globalassets/upload/oed/pdf_filer_2/faktaheftet/fakta2014og/facts_2014_nett_.pdf 80 Adam Farris. “How big data is changing the oil & gas industry.” Analytics Magazine, November/December
2012, pp. 20-27. 81 Mark C. Thurber and Benedicte Tangen Istad. “Norway's evolving champion: Soil and the politics of state
enterprise.” Program on Energy and Sustainable Development Working Paper #92 (2010). 82 http://npd.no/en/

47
operators compete for oil through a license system. Overall, this separation of concerns is
considered the canonical model of good bureaucratic design for a hydrocarbons sector.83
1.1 STAKEHOLDERS, INTERVIEWEES AND OTHER INFORMATION SOURCES
There are more than 20,000 companies associated with the petroleum business.84 Oil
operators are large organizations that compete internationally, but also collaborate through
joint ventures in order to share project risks. Given the complexity of this industry, there is a
multitude of vendors that sell equipment and services through the whole oil & gas value
chain: drilling, subsurface and top structure (platform) equipment, power generation and
transmission, gas processing, utilities, safety, weather forecasting, etc.
For the realization of this case study we have approached four of the most notable oil
operators in the NCS, pseudonomised as Soil, Coil, Loil and Eloin. We have also contacted
one of the main vendors in the NCS (codenamed “SUPPLIER” for confidentiality reasons),
as well as NPD, the regulator of petroleum activities in Norway. The profiles of these
organizations are included in Table 14, according to the categorization of the Stakeholder
Taxonomy.85
Table 14 Organizations involved in the oil & gas case study
Organization Industry
sector
Technology
adoption stage
Position on data
value chain
Impact of IT in
industry
Soil Oil & gas
operator
Early majority Acquisition
Analysis
Curation
Storage
Usage
Strategic role
Coil Oil & gas
operator
Early majority Acquisition
Analysis
Curation
Storage
Usage
Strategic role
Loil Oil & gas
operator
Early adopter Acquisition
Analysis
Curation
Storage
Usage
Strategic role
Eloin Oil & gas
operator
Early majority Acquisition
Analysis
Curation
Storage
Usage
Strategic role
SUPPLIER Oil & gas
supplier
Late majority Analysis
Usage
Turnaround role
Norwegian Petroleum
Directorate
Oil & gas
regulator in
Norway
Early adopter Curation
Storage
Factory role
83 Mark C. Thurber and Benedicte Tangen Istad. “Norway's evolving champion: Soil and the politics of state
enterprise.” Program on Energy and Sustainable Development Working Paper #92 (2010). 84 Adam Farris. “How big data is changing the oil & gas industry.” Analytics Magazine, November/December
2012, pp. 20-27. 85 Edward Curry. “Stakeholder Taxonomy”. BYTE Project. Deliverable 8.1. 2014.
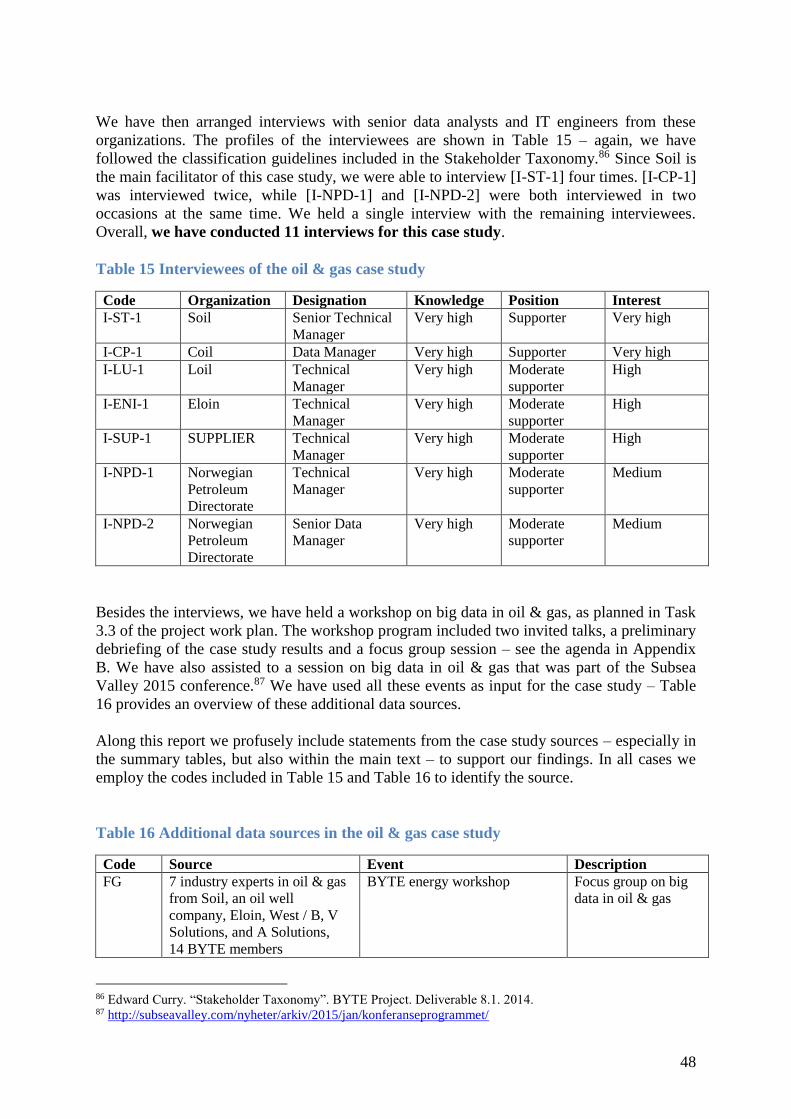
48
We have then arranged interviews with senior data analysts and IT engineers from these
organizations. The profiles of the interviewees are shown in Table 15 – again, we have
followed the classification guidelines included in the Stakeholder Taxonomy.86 Since Soil is
the main facilitator of this case study, we were able to interview [I-ST-1] four times. [I-CP-1]
was interviewed twice, while [I-NPD-1] and [I-NPD-2] were both interviewed in two
occasions at the same time. We held a single interview with the remaining interviewees.
Overall, we have conducted 11 interviews for this case study.
Table 15 Interviewees of the oil & gas case study
Code Organization Designation Knowledge Position Interest
I-ST-1 Soil Senior Technical
Manager
Very high
Supporter
Very high
I-CP-1 Coil Data Manager Very high Supporter Very high
I-LU-1 Loil Technical
Manager
Very high Moderate
supporter
High
I-ENI-1 Eloin Technical
Manager
Very high Moderate
supporter
High
I-SUP-1 SUPPLIER Technical
Manager
Very high
Moderate
supporter
High
I-NPD-1 Norwegian
Petroleum
Directorate
Technical
Manager
Very high Moderate
supporter
Medium
I-NPD-2 Norwegian
Petroleum
Directorate
Senior Data
Manager
Very high Moderate
supporter
Medium
Besides the interviews, we have held a workshop on big data in oil & gas, as planned in Task
3.3 of the project work plan. The workshop program included two invited talks, a preliminary
debriefing of the case study results and a focus group session – see the agenda in Appendix
B. We have also assisted to a session on big data in oil & gas that was part of the Subsea
Valley 2015 conference.87 We have used all these events as input for the case study – Table
16 provides an overview of these additional data sources.
Along this report we profusely include statements from the case study sources – especially in
the summary tables, but also within the main text – to support our findings. In all cases we
employ the codes included in Table 15 and Table 16 to identify the source.
Table 16 Additional data sources in the oil & gas case study
Code Source Event Description
FG 7 industry experts in oil & gas
from Soil, an oil well
company, Eloin, West / B, V
Solutions, and A Solutions,
14 BYTE members
BYTE energy workshop Focus group on big
data in oil & gas
86 Edward Curry. “Stakeholder Taxonomy”. BYTE Project. Deliverable 8.1. 2014. 87 http://subseavalley.com/nyheter/arkiv/2015/jan/konferanseprogrammet/

49
IT-ST Soil BYTE energy workshop Invited talk: “Big
data in subsea – the
operator view”
IT-NOV An oil well company BYTE energy workshop Invited talk: “Big
data in subsea – the
supplier view”
T-ST Soil Subsea Valley Conference 2015
– Parallel session on big data
Talk: “Big data in
Soil”
T-McK A consulting firm Subsea Valley Conference 2015
– Parallel session on big data
Talk: “Digital
Energy”
1.2 ILLUSTRATIVE USER STORIES
In this section we include three user stories that serve to illustrate emerging big data
initiatives in the oil & gas industry.
Permanent reservoir monitoring [IT-ST, T-ST]
Soil is deploying myriads of sensors in the sea bottom to monitor reservoirs. For a high-
resolution image the microphones need to be in the same place and for this reason they are
placed in a permanent basis in the seabed.
Seismic shootings are taken each six months, but it takes months to get the processed data.
This data can feed a simulator and the results used to decide to drill a new well, extract more
oil and gas, or inject water to keep the pressure up – if the right decisions are taken, recovery
rates of the reservoir can be significantly improved.
However, it is possible to do more with the cables and sensors in the seabed. Indeed, Soil is
collecting data every second to detect microfractions. This signal is used to decide whether to
increase or not the pressure in the reservoir, resulting in better recovery rates.
Environmentally this is also good, since Soil can use the sensors to detect oil leakages.
Automated drilling [IT-NOV]
A national oil well company (NOV) aims to automate drilling and by doing this achieve
safer, faster and better drilling. Technology-side, they have practically all the pieces in place.
With respect to rig systems, all equipment is monitored, e.g. blowout preventers (BOPs), and
it is possible to cut the drilling pipe if necessary. NOV has also developed a wired drillpipe
with lots of sensors in it that can achieve a significant improvement in drilling speed (a 40%
increase with respect to normal drillpipes in their tests). Drilling operations can then be
automated, while a human operator only has to set parameters and monitor progress.
Environment surveillance [IT-ST, T-ST]
Soil wants to know if the environment is exposed to unwanted effects when carrying out
petroleum activities. The idea of this project is to monitor the seabed before and during
operations to assess whether oil extraction activities have an environmental impact, especially
in case of nearby big fisheries or corals. With this aim, Soil is deploying mobile and fixed
equipment close to the oil & gas plants for capturing video and audio in real time. In case of
an emergency, this data can be used to see what is happening and react based on facts.

50
2 DATA SOURCES, USES, FLOWS AND CHALLENGES
2.1 DATA SOURCES
We have asked our interviewees to describe the data sources employed in exploration,
operation and production activities. With their input we have created Table 17 with the most
relevant data sources.
Table 17 Main data sources of the oil & gas case study
Data source Used in Big data dimensions Other remarks
Seismic surveys Scouting
Exploration
Production
Volume Confidential
EarthObvslogy models Exploration
Production
Volume Analytics
Confidential
Production data Production Confidential
Top-side sensor data Operations Volume
Velocity
Variety
Subsea sensor data Operations Volume
Velocity
Variety
In-well sensor data Operations Volume
Velocity
Drilling data Exploration
Drilling
Volume
Velocity
Document repositories Scouting
Exploration
Operations
Variety Lifespan
Reference datasets Scouting
Exploration
Production
Open
Seismic data is the main source for discovering petroleum deposits. Collecting such data is
expensive and typically performed by specialized companies using seismic vessels that send
sound waves deep into subsurface and a set of hydrophones to detect reflected waves [I-ST-
1]. This process produces significant volumes of data, typically ~100s GB per one raw
dataset.88 Moreover, this is a key asset of oil operators, so security measures are especially
enforced in this case.
Seismic surveys are transformed into 3D EarthObvslogy models – this is probably the most
impactful scientific breakthrough of the oil & gas industry.89 EarthObvslogists and
petrophysicists analyse these models to find potential deposits of hydrocarbons.
Transforming seismic data into 3D models is computing-intensive and results into further
amounts of data, ~1 TB per one processed dataset.90 Indeed, Soil stores around 6 PB of
seismic data (raw and processed) [I-ST-1].
88 Adam Farris. “How big data is changing the oil & gas industry.” Analytics Magazine, November/December
2012, pp. 20-27. 89 Adam Farris. “How big data is changing the oil & gas industry.” Analytics Magazine, November/December
2012, pp. 20-27. 90 Ibid.

51
Production data is very important for oil companies and receives a lot of attention. Since
this is a commercial-sensitive asset, operators such as Soil do the accounting of production
data by themselves. Oil production is measured at every stage of the flow, while the
aggregated figures are reported to the partners in the joint venture and also to the Norwegian
Government that has a reporting role.
In the last decade, the oil & gas industry has gone into a process of installing sensors in every
piece of equipment: top-side, subsea and in-well. New fields are heavily instrumented, e.g.
Edvard Grieg field has approximately 100K data tags [I-LUN-1] and Goliat field has around
80K data tags [I-ENI-1]. Sensors are very diverse and generate a lot of data. Moreover,
velocity is also a challenge, e.g. a subsea factory produces 100s of high-speed signals
(~10Kbps) and can thus easily generate 1 TB of data per day [I-SUP-1].
Drilling also generates high-volume and high-velocity data. This data is analysed in real time
for safety reasons and to monitor the drilling process, i.e. to detect if the reservoir was hit [I-
ST-1].
Document repositories are also quite relevant in the oil & gas industry and employed in
different stages. For example, post-drill reports can be analysed to obtain the rock types in a
well – this can be relevant for other analogue areas under exploration. However, document
repositories are typically unstructured and quite varied since a report could be produced
anytime since the beginning of oil operations in the NCS (1970s). Therefore, the management
of knowledge repositories is quite challenging for petroleum companies [I-ST-1].
Finally, NPD publishes some reference datasets as open data – FactPages91 and Diskos92 are
probably the most relevant ones. FactPages contain information about the activities in the
NCS, i.e. licenses, fields, wellbores, discoveries, operators and facilities. The Diskos database
includes seismic, well and production data in the NCS.
2.2 DATA USES
With such massive data assets collected in the oil & gas industry, there are a number of uses
of data in place, as reflected in Table 18. We describe them in the following paragraphs,
organized around the different stages of the upstream value chain.
Table 18 Main uses of data in the oil & gas case study
EXPLORATION & SCOUTING
Seismic processing Seismic processing is the classical big data problem in the oil & gas industry [I-
ST-1]
Seismic data is difficult to analyse, complex EarthObvs-models are employed
[I-CP-1]
Oil companies have made large investments in expensive infrastructures:
clusters and high-performance storage [I-ST-1]
91 http://factpages.npd.no/factpages/ 92 http://www.npd.no/en/about-us/collaboration-projects/diskos/

52
New techniques, methods, analytics and tools can be applied to find new
discoveries [I-LU-1]
PRODUCTION
Reservoir
monitoring
Seismic shootings are used to create 3D models of the reservoir in subsurface
[I-ST-1]
Reservoir simulations are computer intensive and employed to evaluate how
much oil should be produced in a well [I-ST-1]
A better understanding of reservoirs, e.g. water flowing, can serve to take better
decisions in reaction to events [I-CP-1]
Oil exploration There are also exploration activities in already producing fields to look for oil
pockets. This can result in more wells for drilling [I-ST-1]
Accounting of
production data
Reporting requirements to the authorities and license partners [I-ST-1, I-NPD-
1]
Not especially interesting in terms of big data by itself [I-ST-1]
Production data can be combined with other data sources, e.g. linking alarms
with production data [I-CP-1]
DRILLING & WELLS
Drilling operations Drilling data is analysed to minimize the non-productive time [I-CP-1]
Operators use drilling data to decide whether to continue drilling or not [I-ST-1]
Well integrity
monitoring
Well integrity monitoring is typically done by specialized companies [I-LU-1,
I-ST-1]
EarthObvslogical models are employed, taking into account the type of rock in
the well [I-ST-1]
OPERATIONS
Condition-based
maintenance
Equipment suppliers could make better usage of the data, e.g. to optimize
equipment performance. Indeed, there is a strong movement towards condition-
based maintenance [I-CP-1]
Focus on applying condition-based maintenance [I-SUP-1, I-ST-1, I-LU-1, I-
ENI-1, T-ST]
Equipment
improvement
We use operational data to improve the efficiency of equipment [I-SUP-1]
Data-driven new
products
Some suppliers are using big data to develop new products, e.g. Soil has
expensive equipment that can increase the pressure in a reservoir [I-ST-1]
Data-enabled
services
Vendors also sell specialized services such as vibration monitoring. For
example, SKF is a vendor with expert groups for addressing failures in rotating
equipment [I-LU-1]
We are interested in selling a service such as system uptime instead of
equipment [I-SUP-1]
Soil buys services (including data) from the whole supply chain [I-ST-1]
Integrated
monitoring centre
Soil has a monitoring centre for the equipment of each vendor supplier. We are
considering replacing them with an integrated centre. In this way, it would be
possible to get more information from the totality of vendors’ equipment [I-ST-
1]
Integrated Big data can be used for making better and faster decisions in operations by

53
operations integrating different datasets (drilling, production, etc.) [I-SUP-1]
The analytics of integrated data can be very powerful [I-CP-1]
Exploration and scouting
Seismic processing for the discovery of petroleum is the classical big data problem of the oil
& gas industry. Operators have made large investments in high-speed parallel computing and
storage infrastructures to generate 3D EarthObvslogy models out of seismic data. The
resolution of the images obtained with seismic data is low,93 and for this reason petroleum
experts (EarthObvsphysicists and petrophysicists) try to use additional data sources such as
rock types in nearby wells and images from other analogue areas [I-ST-1]. Nevertheless, the
complexity of exploration data makes the access of data to petroleum experts especially
challenging, requiring ad hoc querying capabilities. Due to this, the EU-funded Optique
project94 aims to facilitate data access through the use of the Optique platform for a series of
case studies, including oil & gas exploration in Soil.95
Production
Seismic data is also employed in production for reservoir monitoring, creating 3D models
of the reservoir in subsurface. Simulations are then carried out to evaluate how much oil
should be produced in a well. Nowadays, there is a trend to permanently deploy seismic
sensors in the seabed of a reservoir – see the user story on permanent reservoir monitoring in
Section 1.2 – allowing the detection of microseismic activity. In addition, seismic data from
production fields can be employed to discover oil pockets that can result in more wells for
drilling and thus extend the lifetime of a field. Finally, production data is carefully
accounted through all stages of the petroleum workflow. Although production data is not
especially challenging in terms of big data, it can be combined with other sources to gain
further insight, e.g. linking alarms with production data.
Drilling and wells
Drilling operations are normally contracted to specialized companies such as NOV – see
stakeholders in section 1.1. Oil operators get the raw data from drillers and then select the
target for drilling and decide whether to continue or not, sometimes relying on simulators [I-
CP-1]. These decisions are based on the analysis of drilling data, and they aim to minimize
the non-productive time of very costly drilling equipment and crews.
Given the complexity of wells, their integrity is monitored during their complete lifetime.
External companies are contracted for well integrity monitoring, employing EarthObvslogical
models and using core samples from the well.
Operations
This is possibly the most interesting area in oil & gas in terms of big data [I-ST-1]. It consists
of structured data that is very varied, ranging from 3D models to sensor data. Velocity is also
challenging due to the large number of sensors involved producing data in real time. In
addition, there are lots of technological opportunities, e.g. Internet of Things. The main
93 Adam Farris. “How big data is changing the oil & gas industry.” Analytics Magazine, November/December
2012, pp. 20-27. 94 http://optique-project.eu/ 95 Martin Giese, Ahmet Soylu, Guillermo Vega-Gorgojo, Arild Waaler et al. “Optique – Zooming in on big data
access.” IEEE Computer, March 2015, pp. 60-67.

54
drivers for applying big data here include the reduction of well downtime, improving the
lifetime of equipment and reducing the number of staff offshore [I-ST-1].
Among the different uses of data in operations, condition-based maintenance is possibly the
one that is receiving more attention. Equipment is instrumented to collect data and analytics
are then applied for early detection of potential failures before they occur. Condition-based
maintenance is thus much more efficient than traditional reactive or calendar-based
approaches. Both operators and suppliers are interested in reducing costs and improving the
lifetime of equipment; as a result, there are a number of ongoing collaborations to support
condition-based maintenance. Vendors are also analysing operational data to improve the
efficiency of equipment, e.g. using less energy to control the same piece of equipment. The
analysis of operational data can also lead to new data-driven products, e.g. Åsgard subsea
compressor system.96 Other opportunities in operations include data-enabled services such
as failure detection or vibration monitoring. Integrated operations is another application
area that aims to combine data from multiple sources, e.g. operations and production data,
and then use analytics to leverage decision-taking processes.
2.3 DATA FLOWS
In this section we analyse the flow of seismic and sensor data, the most notable data sources
in the upstream oil & gas industry (see section 2.1). Beginning with seismic data, oil
operators normally contract specialized companies such as PGS97 for conducting seismic
surveys. As explained by [I-ST-1], operators are obliged to send the seismic data to the
Norwegian government – this is incorporated to NPD’s Diskos dataset (also called
Petrobank). Seismic data is also shared among the members of a concession joint venture
through Diskos. Interestingly, raw data is shared, but not processed data, i.e. EarthObvslogy
models. Seismic data is also traded, e.g. in an auction. Other exchanges include the handoff
of seismic data to companies such as CGG98 to detect problems in a reservoir. Since seismic
data is a very valuable asset, oil companies take special security measures to conceal it.
Sensor data is captured offshore from the instrumented equipment (subsea, top-side and in-
well) and then transferred onshore to a surveillance centre where operations are monitored.
However, integrating the data and presenting in an adequate way to human operators is
actually a difficult challenge [I-ST-1, I-ENI-1]. [I-CP-1] explains that there are some
differences on how the data is captured: sometimes the operator has direct access to sensor
data, while in other cases, e.g. drilling, the vendor gets the raw data and sends it to the
operator. Oil companies also contract services such as vibration monitoring, providing access
to sensor data in these cases [I-LU-1]. Since sensor data is not particularly sensitive, there are
more data exchanges among operators and vendors, e.g. for condition-based maintenance of
equipment [I-LU-1].
2.4 MAIN TECHNICAL CHALLENGES
We have employed the big data value chain in the Stakeholder taxonomy99 to structure the
technical challenges in the oil & gas industry:
96 http://www.akersolutions.com/en/Global-menu/Media/Feature-stories/Subsea-technologies-and-
services/Asgard-subsea-gas-compression-system/ 97 http://www.pgs.com/ 98 http://www.cggveritas.com 99 Edward Curry. “Stakeholder Taxonomy”. BYTE Project. Deliverable 8.1. 2014.

55
Data acquisition: seismic surveys are expensive to take and require months to get the
results [I-ST-1, IT-ST]. In contrast, sensor data is easier to acquire and the trend is to
increase the number of sensors in equipment, getting more data and in a more
frequent basis [I-ST-1].
Data analysis: seismic processing is computing-intensive, as discussed in section 2.2.
Another concern is that the oil & gas industry normally do analytics with small
datasets [I-CP-1].
Data curation: IT infrastructures in oil & gas are very siloed, and data aggregation is
not common [I-ST-1]. In this regard, [I-CP-1] advocates data integration to do
analytics across datasets, while [T-McK] proposes to arrange industry partnerships to
aggregate data.
Data storage: the oil & gas industry is in general good at capturing and storing data
[I-CP-1]. However, [T-McK] claimed that 40% of all operations data was never stored
in an oil plant case study.
Data usage: section 2.2 extensively describes the main uses of data in exploration and
production activities, demonstrating the value of data in the oil & gas industry.
Nevertheless, there is potential to do much more, according to the majority of our data
sources. For instance, [T-McK] reported that, based on an oil plant case study, 99% of
all data is lost before it reaches operational decision makers.
2.5 BIG DATA ASSESSMENT
In our fieldwork we have collected a number of testimonials, impressions and opinions about
the adoption and challenges of big data in the oil & gas industry. With this input we have
elaborated Table 19, containing the main insights and the statements that support them.
Table 19 Assessment of big data in the oil & gas case study
Insight Statement [source]
Big data in oil & gas
is in the early-middle
stages of
development
Big data is still an emerging field and it has not yet changed the game in the
oil & gas industry. This industry is a late adopter of big data [I-CP-1]
Everybody is talking about big data, but this industry is fooling around and
doing small data [T-McK]
Big data is quite new for SUP [I-SUP-1]
This industry is good at storing data, but not so much at making use out of it
[I-CP-1]
Oil and gas is still at the first stage of big data in the sense that it is being used
externally but not to acquire knowledge for themselves. For example, lots of
data about what happens when the drill gets stuck, but they are not using that
data to predict the drill getting stuck. Structured data plus
interpretation/models are not being converted into knowledge [FG]
There are a lot of areas that can be helped by big data. How can we plan when
to have a boat coming with a new set of pipes? [FG]
Machine learning is beginning to be integrated into technical systems [FG]
More data available
in oil & gas
In exploration, more sensors are employed, and microphones for collecting
seismic data are permanently deployed at the seabed in some cases [I-ST-1]
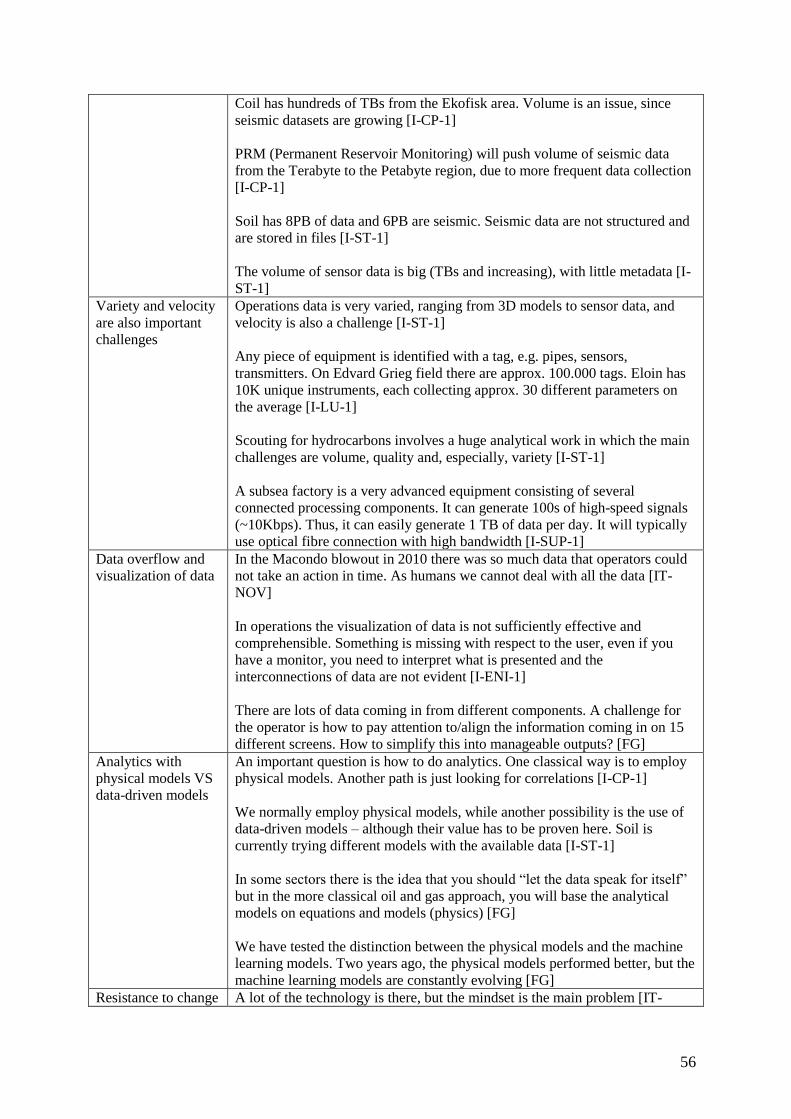
56
Coil has hundreds of TBs from the Ekofisk area. Volume is an issue, since
seismic datasets are growing [I-CP-1]
PRM (Permanent Reservoir Monitoring) will push volume of seismic data
from the Terabyte to the Petabyte region, due to more frequent data collection
[I-CP-1]
Soil has 8PB of data and 6PB are seismic. Seismic data are not structured and
are stored in files [I-ST-1]
The volume of sensor data is big (TBs and increasing), with little metadata [I-
ST-1]
Variety and velocity
are also important
challenges
Operations data is very varied, ranging from 3D models to sensor data, and
velocity is also a challenge [I-ST-1]
Any piece of equipment is identified with a tag, e.g. pipes, sensors,
transmitters. On Edvard Grieg field there are approx. 100.000 tags. Eloin has
10K unique instruments, each collecting approx. 30 different parameters on
the average [I-LU-1]
Scouting for hydrocarbons involves a huge analytical work in which the main
challenges are volume, quality and, especially, variety [I-ST-1]
A subsea factory is a very advanced equipment consisting of several
connected processing components. It can generate 100s of high-speed signals
(~10Kbps). Thus, it can easily generate 1 TB of data per day. It will typically
use optical fibre connection with high bandwidth [I-SUP-1]
Data overflow and
visualization of data
In the Macondo blowout in 2010 there was so much data that operators could
not take an action in time. As humans we cannot deal with all the data [IT-
NOV]
In operations the visualization of data is not sufficiently effective and
comprehensible. Something is missing with respect to the user, even if you
have a monitor, you need to interpret what is presented and the
interconnections of data are not evident [I-ENI-1]
There are lots of data coming in from different components. A challenge for
the operator is how to pay attention to/align the information coming in on 15
different screens. How to simplify this into manageable outputs? [FG]
Analytics with
physical models VS
data-driven models
An important question is how to do analytics. One classical way is to employ
physical models. Another path is just looking for correlations [I-CP-1]
We normally employ physical models, while another possibility is the use of
data-driven models – although their value has to be proven here. Soil is
currently trying different models with the available data [I-ST-1]
In some sectors there is the idea that you should “let the data speak for itself”
but in the more classical oil and gas approach, you will base the analytical
models on equations and models (physics) [FG]
We have tested the distinction between the physical models and the machine
learning models. Two years ago, the physical models performed better, but the
machine learning models are constantly evolving [FG]
Resistance to change A lot of the technology is there, but the mindset is the main problem [IT-
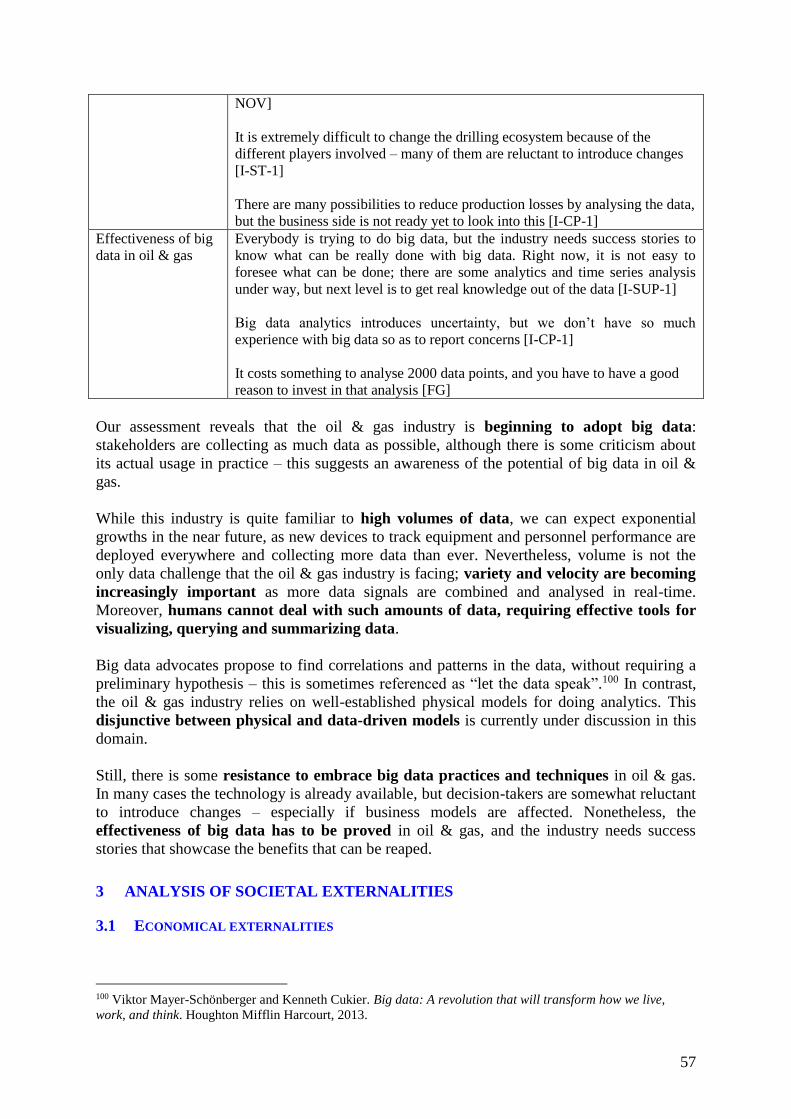
57
NOV]
It is extremely difficult to change the drilling ecosystem because of the
different players involved – many of them are reluctant to introduce changes
[I-ST-1]
There are many possibilities to reduce production losses by analysing the data,
but the business side is not ready yet to look into this [I-CP-1]
Effectiveness of big
data in oil & gas
Everybody is trying to do big data, but the industry needs success stories to
know what can be really done with big data. Right now, it is not easy to
foresee what can be done; there are some analytics and time series analysis
under way, but next level is to get real knowledge out of the data [I-SUP-1]
Big data analytics introduces uncertainty, but we don’t have so much
experience with big data so as to report concerns [I-CP-1]
It costs something to analyse 2000 data points, and you have to have a good
reason to invest in that analysis [FG]
Our assessment reveals that the oil & gas industry is beginning to adopt big data:
stakeholders are collecting as much data as possible, although there is some criticism about
its actual usage in practice – this suggests an awareness of the potential of big data in oil &
gas.
While this industry is quite familiar to high volumes of data, we can expect exponential
growths in the near future, as new devices to track equipment and personnel performance are
deployed everywhere and collecting more data than ever. Nevertheless, volume is not the
only data challenge that the oil & gas industry is facing; variety and velocity are becoming
increasingly important as more data signals are combined and analysed in real-time.
Moreover, humans cannot deal with such amounts of data, requiring effective tools for
visualizing, querying and summarizing data.
Big data advocates propose to find correlations and patterns in the data, without requiring a
preliminary hypothesis – this is sometimes referenced as “let the data speak”.100 In contrast,
the oil & gas industry relies on well-established physical models for doing analytics. This
disjunctive between physical and data-driven models is currently under discussion in this
domain.
Still, there is some resistance to embrace big data practices and techniques in oil & gas.
In many cases the technology is already available, but decision-takers are somewhat reluctant
to introduce changes – especially if business models are affected. Nonetheless, the
effectiveness of big data has to be proved in oil & gas, and the industry needs success
stories that showcase the benefits that can be reaped.
3 ANALYSIS OF SOCIETAL EXTERNALITIES
3.1 ECONOMICAL EXTERNALITIES
100 Viktor Mayer-Schönberger and Kenneth Cukier. Big data: A revolution that will transform how we live,
work, and think. Houghton Mifflin Harcourt, 2013.
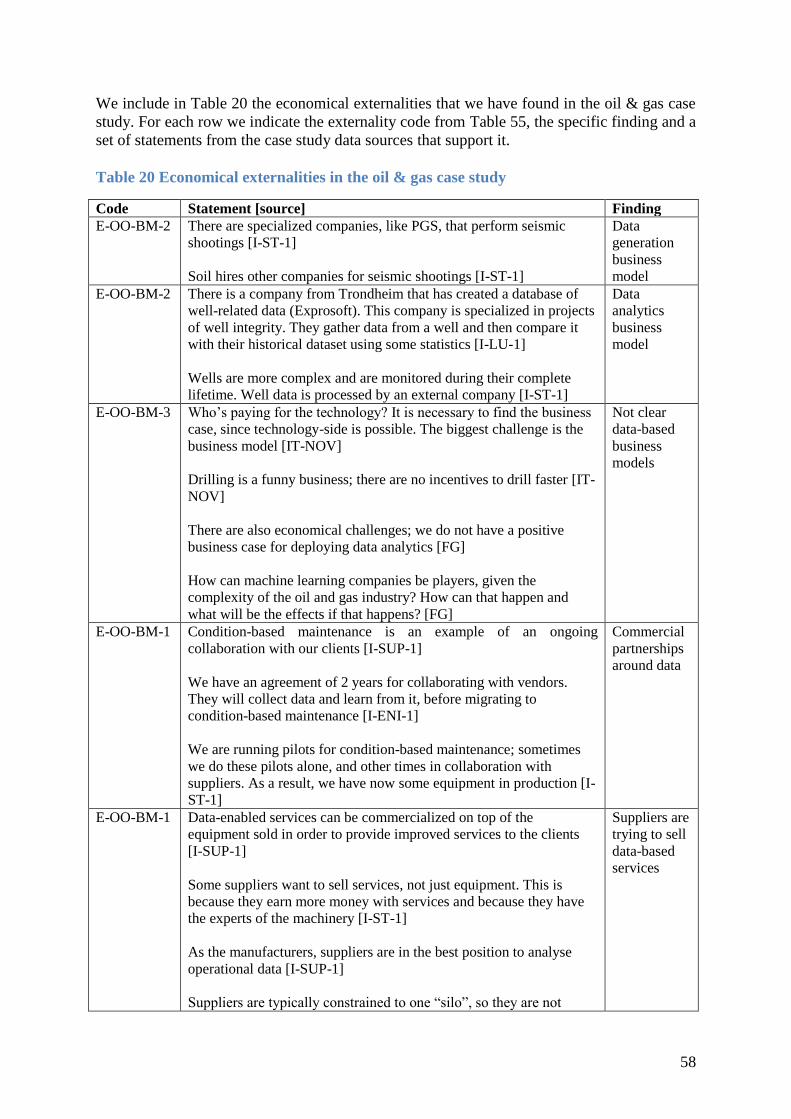
58
We include in Table 20 the economical externalities that we have found in the oil & gas case
study. For each row we indicate the externality code from Table 55, the specific finding and a
set of statements from the case study data sources that support it.
Table 20 Economical externalities in the oil & gas case study
Code Statement [source] Finding
E-OO-BM-2
There are specialized companies, like PGS, that perform seismic
shootings [I-ST-1]
Soil hires other companies for seismic shootings [I-ST-1]
Data
generation
business
model
E-OO-BM-2
There is a company from Trondheim that has created a database of
well-related data (Exprosoft). This company is specialized in projects
of well integrity. They gather data from a well and then compare it
with their historical dataset using some statistics [I-LU-1]
Wells are more complex and are monitored during their complete
lifetime. Well data is processed by an external company [I-ST-1]
Data
analytics
business
model
E-OO-BM-3
Who’s paying for the technology? It is necessary to find the business
case, since technology-side is possible. The biggest challenge is the
business model [IT-NOV]
Drilling is a funny business; there are no incentives to drill faster [IT-
NOV]
There are also economical challenges; we do not have a positive
business case for deploying data analytics [FG]
How can machine learning companies be players, given the
complexity of the oil and gas industry? How can that happen and
what will be the effects if that happens? [FG]
Not clear
data-based
business
models
E-OO-BM-1
Condition-based maintenance is an example of an ongoing
collaboration with our clients [I-SUP-1]
We have an agreement of 2 years for collaborating with vendors.
They will collect data and learn from it, before migrating to
condition-based maintenance [I-ENI-1]
We are running pilots for condition-based maintenance; sometimes
we do these pilots alone, and other times in collaboration with
suppliers. As a result, we have now some equipment in production [I-
ST-1]
Commercial
partnerships
around data
E-OO-BM-1
Data-enabled services can be commercialized on top of the
equipment sold in order to provide improved services to the clients
[I-SUP-1]
Some suppliers want to sell services, not just equipment. This is
because they earn more money with services and because they have
the experts of the machinery [I-ST-1]
As the manufacturers, suppliers are in the best position to analyse
operational data [I-SUP-1]
Suppliers are typically constrained to one “silo”, so they are not
Suppliers are
trying to sell
data-based
services

59
generally capable of working with big data. Even suppliers like
General Electrics (which are good in big data) are limited due to this
problem. In contrast, oil companies like Coil can provide a holistic
view of operations, so they are more naturally capable of doing big
data in this area [I-CP-1]
E-PO-BM-1
Norway aims to attract investors to compete in the petroleum
industry. The FactPages constitutes an easy way to assess available
opportunities in the NCS by making openly available production
figures, discoveries and licenses [I-NCS-2]
NPD began in 1998-1999 to publish open data of the NCS. This is a
fantastic way to expose their data and make it available to all
interested parties. Before that, companies directly asked NPD for
data. NPD has always promoted the openness of data and resources.
In this regard, NPD pursues to get as much as possible of the data [I-
NCS-1]
Companies are also obliged to send the seismic data to the
Government – this is incorporated to NPD’s Petrobank, i.e. the
Diskos database [I-ST-1]
Open data as
a driver for
competition
E-OO-BM-2
Soil is reluctant to share data in exploration, but we have more
incentives to share data in operations [I-ST-1]
It could be risky to have access to all the operational data. Exposing
commercial sensitive information is a concern for both petroleum
operators (in terms of fiscal measures), and for suppliers in terms of
equipment and service performance [I-SUP-1]
Some oil operators do not share any data. However, there is an
internal debate among operators about this position, and opening data
is proposed to exploit added-value services [I-SUP-1]
Operations data is not secret or confidential. We are not very
protective as a community [I-LU-1]
Since it is the operator’s interest to give access to data to vendors,
this is not an issue and access to data is granted [I-LU-1]
There is a problem with different players (driller, operator, reservoir
monitor) in the same place, but not sharing anything. How to
integrate data that drillers do not have? [IT-NOV]
Companies
are
somewhat
reluctant to
open data,
but there are
emerging
initiatives
With the advent of big data in oil & gas, new business models based on data have appeared.
One of them is based on data generation, and we can find companies like PGS that are
contracted by petroleum operators to perform seismic shootings. Moreover, datasets such as
seismic surveys are traded in all stages of the oil & gas value chain. The data analytics
business model is also getting traction: analytics are employed to improve equipment
efficiency; some companies are selling specialized services such as well integrity or vibration
monitoring; and new products based on data analytics are introduced to the market, e.g.
Åsgard compressors.
However, there are some challenges with the business models, requiring funds for
investments or other incentives in order to introduce already available new technologies – see

60
for instance the automated drilling user story in Section 1.2. In this regard, there are some
incipient commercial partnerships around data. For example, petroleum operators and
suppliers typically collaborate to apply condition-based maintenance to equipment.
Moreover, surveillance centres for monitoring equipment require collaboration among field
operators and suppliers – see integrated monitoring centre in Table 18.
Given that everybody is realizing the value of data, suppliers are trying to sell data-based
services, not just equipment. Since access to data is contract-dependent, this situation creates
some tensions. On the one hand, suppliers are in the best position to analyse operational data
since they are the manufacturers of the equipment. On the other hand, suppliers are typically
constrained to one domain (“silo”), while oil companies are in a better position to provide a
holistic view of operations.
NPD, the regulator of petroleum activities in Norway, plays a key role in facilitating the
access to oil & gas data. In this regard, NPD closely collaborates with the industry to gather
data about petroleum activities in the NCS. This way, NPD aims to promote competition
among petroleum operators, embracing open data to facilitate access. This is especially
important for small companies since collecting data is extremely difficult and expensive.
Moreover, reporting obligations benefit the petroleum industry as a whole, avoiding
companies to duplicate efforts on data collecting activities.
Companies are also considering open data as an opportunity for commercial benefit.
Specifically, operators have many incentives to share operations data since privacy concerns
are low and there are many opportunities to obtain efficiency gains in operations. However,
operators are reluctant to share data in exploration, since it is possible that other parties
discover oil deposits. With respect to suppliers, they would prefer to keep the data for
themselves, but this is not always possible since data normally belongs to the owner of the
equipment (depending on the terms and conditions of the contract). As a result, there are
ongoing open data pilots and sharing data collaborations, especially with operations data.
3.2 SOCIAL & ETHICAL EXTERNALITIES
We include in Table 21 the societal & ethical externalities that we have found in the oil & gas
case study. For each row we indicate the externality code from Table 55, the specific finding
and a set of statements from the case study data sources that support it.
Table 21 Social & ethical externalities in the oil & gas case study
Code Statement [source] Finding
E-OC-BM-3
There are changes in hiring practices, requiring employees with
the competences to use the data [FG]
There are very few data scientists at Coil. We need more [I-CP-1]
Data scientists are not getting into the oil & gas industry. Make a
business case and then hire data scientists [T-McK]
Need for data
analyst jobs
E-OC-ETH-10
We use industrial data, not Twitter [IT-ST]
With big data it could be possible to find who made a bad
decision, e.g. a human operator [I-SUP-1]
Personal
privacy is not
a big concern
E-OO-DAT-3
Opening up entails some risks. For instance, it could maybe be
possible to extract sensitive data such as the daily production of a
Cyber-attacks
and threats to

61
field [I-SUP-1]
Security/hacking is very much an issue for NPD. Oil & gas
information is very important and NPD has a great responsibility.
Indeed, companies have to keep trust on NPD. Thus, NPD takes
many protective measures such as firewalls and security routines
[I-NPD-1]
Coil has lots of attacks from outside, although we have taken
many security measures in IT. Indeed, NPD has instructed oil
companies to take measures in this respect [I-CP-1]
The O&G industry is exposed to cyber-threats. Some companies
have received serious attacks; protection measures are needed!
[IT-ST]
secret and
confidential
datasets
E-OC-ETH-1
Big data can help to reduce incidents, e.g. the detection of oil
leakages. DTS data can also improve safety when employed for
reservoir monitoring [I-CP-1]
Big data helps to give a clear picture of the field operation, and it
facilitates the detection of oil leakages or equipment damage [I-
SUP-1]
The control system has a lot of alarms and it is literally impossible
to manually analyse them all. As an alternative, we can trust the
software to automatically analyse them [I-CP-1]
I do not see changes due to big data in safety [I-LU-1]
Do we expose the environment for unwanted effects? Soil wants
to know and to show that we don’t. We use cameras and sound
recorders in the sea (close to the O&G plants), especially if there
are big fisheries or corals nearby. We want to see if something bad
is happening [IT-ST]
We are beginning to monitor the seabed before operations. With
this data, Soil can act faster if something is going wrong. We have
mobile & fixed equipment capturing video and audio in real time.
It can be employed in case of emergency and this data can be
shared with others [T-ST]
Big data can
help to
improve safety
and
environment
E-OO-DAT-4
The data ecosystem is complex, and there are many
communication exchanges between oil companies and suppliers –
I think that nobody can give a complete overview of the data
exchanges in place [I-CP-1]
It is difficult to trust information coming out of the data if you do
not have a clear relationship to the underlying reality and if it is
not generated by your organisation [FG]
Those who produce the data only give away aggregated data, and
a selection of that aggregated data to specific users. If you want to
trust the information that the system gives you, it can verify that
the system is doing what it is supposed to [FG]
Issues on
trusting data
coming from
uncontrolled
sources
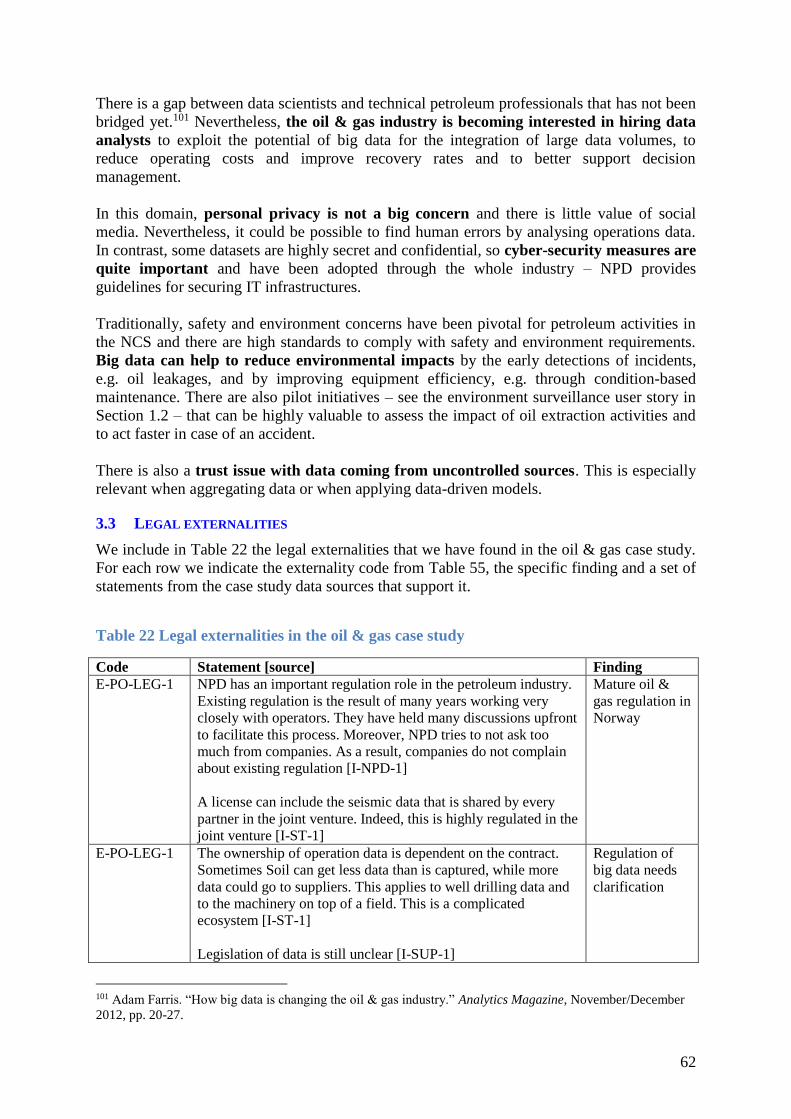
62
There is a gap between data scientists and technical petroleum professionals that has not been
bridged yet.101 Nevertheless, the oil & gas industry is becoming interested in hiring data
analysts to exploit the potential of big data for the integration of large data volumes, to
reduce operating costs and improve recovery rates and to better support decision
management.
In this domain, personal privacy is not a big concern and there is little value of social
media. Nevertheless, it could be possible to find human errors by analysing operations data.
In contrast, some datasets are highly secret and confidential, so cyber-security measures are
quite important and have been adopted through the whole industry – NPD provides
guidelines for securing IT infrastructures.
Traditionally, safety and environment concerns have been pivotal for petroleum activities in
the NCS and there are high standards to comply with safety and environment requirements.
Big data can help to reduce environmental impacts by the early detections of incidents,
e.g. oil leakages, and by improving equipment efficiency, e.g. through condition-based
maintenance. There are also pilot initiatives – see the environment surveillance user story in
Section 1.2 – that can be highly valuable to assess the impact of oil extraction activities and
to act faster in case of an accident.
There is also a trust issue with data coming from uncontrolled sources. This is especially
relevant when aggregating data or when applying data-driven models.
3.3 LEGAL EXTERNALITIES
We include in Table 22 the legal externalities that we have found in the oil & gas case study.
For each row we indicate the externality code from Table 55, the specific finding and a set of
statements from the case study data sources that support it.
Table 22 Legal externalities in the oil & gas case study
Code Statement [source] Finding
E-PO-LEG-1
NPD has an important regulation role in the petroleum industry.
Existing regulation is the result of many years working very
closely with operators. They have held many discussions upfront
to facilitate this process. Moreover, NPD tries to not ask too
much from companies. As a result, companies do not complain
about existing regulation [I-NPD-1]
A license can include the seismic data that is shared by every
partner in the joint venture. Indeed, this is highly regulated in the
joint venture [I-ST-1]
Mature oil &
gas regulation in
Norway
E-PO-LEG-1
The ownership of operation data is dependent on the contract.
Sometimes Soil can get less data than is captured, while more
data could go to suppliers. This applies to well drilling data and
to the machinery on top of a field. This is a complicated
ecosystem [I-ST-1]
Legislation of data is still unclear [I-SUP-1]
Regulation of
big data needs
clarification
101 Adam Farris. “How big data is changing the oil & gas industry.” Analytics Magazine, November/December
2012, pp. 20-27.

63
There is no clear thinking about the regulations with respect to
big data yet, and these must be clarified in order to deal with
issues around liability, etc. [FG]
Making raw data regulated is something that has to be judged on
the criticality of the risk. Ideas like black boxes could carry over
into this industry because the risks of malfunction can be so
severe [FG]
E-PO-LEG-1
Data ownership is regulated by the terms and conditions – the
owner of the equipment is commonly the owner of the data [I-
LU-1]
Data will be more contract-regulated [FG]
Data ownership is also a key issue. Those who produce the data
only give away aggregated data, and a selection of that
aggregated data to specific users [FG]
Data ownership
is key and will
be heavily
regulated
Petroleum activities in Norway rely on a mature regulation framework that enforces the
separation of policy, regulatory and commercial functions. The Petroleum Act102 provides
the general legal basis for the licensing that governs Norwegian petroleum activities. This is
the result of many years of close collaboration of NPD with field operators. These have
reporting obligations for seismic and production data, but receive support on legislation about
safety, licensing and other issues. As a result, all players have trust in NPD and accept their
obligations in the petroleum industry.
While production and seismic data are highly regulated by the authorities, other datasets, e.g.
operations data, are normally regulated by the terms and conditions of a contract. In this
regard, the owner of data is normally the owner of the equipment that produces the data.
There are some exceptions, though – for instance, drilling companies normally collect the
raw data that is then supplied to operators. Therefore, legislation of big data aspects
requires additional clarification. Indeed, industry stakeholders are becoming increasingly
aware of the value of data, so ownership of data will possibly be subject of contention.
3.4 POLITICAL EXTERNALITIES
We include in Table 23 the political externalities that we have found in the oil & gas case
study. For each row we indicate the externality code from Table 55, the specific finding and a
set of statements from the case study data sources that support it.
Table 23 Political externalities in the oil & gas case study
Code Statement [source] Finding
E-OO-DAT-2
Data availability is an issue in international projects in which
Soil does not know much about the EarthObvslogy. In these
cases, we try to buy data from other companies that have a
strong presence in the surrounding area [I-ST-1]
Data is a valuable
asset traded
internationally
E-PP-LEG-2
There is a lot of legislation to take care of. Legislation is
different for each country, but there are some commonalities.
For example, the data has to be kept at the country of origin,
Need to
harmonize
international
102 Act No. 72 of 29 November 1996 relating to petroleum activities.

64
although it is commonly allowed to copy data [I-ST-1] legislation w.r.t.
data
E-OO-BM-5
Some of the main suppliers, […], have become big data
experts [I-ST-1]
Some suppliers
are becoming
leaders in big data
Since the oil & gas industry requires high investments, operators and suppliers are normally
international organizations with businesses in many countries. Oil operators purchase data
(especially seismic) from other companies with a strong presence in the surrounding areas in
order to carry out exploration and scouting activities. Data is thus becoming a valuable
asset that is traded internationally.
International legislation is problematic for oil companies, since different laws apply to
each country. Nevertheless there are some commonalities; seismic data has to be kept at the
country of origin, although oil operators are normally allowed to make a copy of the data.
Finally, some of the main petroleum suppliers, […], have become big data experts and
are thus especially interested in selling data services, not just equipment.
4 CONCLUSION
The oil & gas domain is transitioning to a data-centric industry. There is plenty of data,
especially due to the deployment of sensors everywhere, but also many technical challenges
to undertake. Some of the most striking ones include data analytics, data integration and data
visualization. While big data still needs to prove its effectiveness in oil & gas, the industry is
beginning to realize its potential and there are many ongoing initiatives, especially in
operations. With the current oil price crisis, big data is an opportunity to reduce operational
costs, to improve the extraction rates of reservoirs – through optimized decision-taking
processes – and even to find more oil in exploration activities.
In our case study we have identified a number of economical externalities associated with the
use of big data in oil & gas: data generation and data analytics business models are beginning
to get traction, there is a number of commercial partnerships around data and the Norwegian
regulator has embraced open data in order to spur competition among oil operators. However,
companies are still reluctant to share their data, despite some emerging initiatives. Moreover,
existing business models have to be reworked in order to promote the adoption of big data.
In the positive side of social and ethical externalities, safety and environment concerns can be
mitigated with big data, personal privacy is not problematic in oil & gas and there is a need of
data scientist jobs – though operators and other types of jobs might be less demanded. On the
negative side, cyber-security is becoming a serious concern and there are trust issues with
third-party data and data-driven analytics.
The petroleum industry benefits from a mature regulation framework in Norway, although
regulation of data requires further clarification. Moreover, companies are increasingly aware
of the value of data and we can expect contention about data ownership. Many companies in
the oil business are multinationals, so there is a need to harmonize international legislation
with respect to data. Indeed, some vendors are becoming leaders in big data, and the rest
should embrace big data in order to succeed in the future.

65
ENVIRONMENT CASE STUDY REPORT - FOR SOUND SCIENCE TO SHAPE
SOUND POLICY
SUMMARY OF THE CASE STUDY
The environment case study has been conducted in the context of an earth observation data
portal (EarthObvs), a global-scale initiative for better understanding and controlling the
environment, to benefit Society through better-informed decision-making. This has given us
an excellent test bed for investigating the societal externalities of Big Data in the environment
sector.
We have interviewed six senior data scientists and IT engineers in the EarthObvs community,
as well as in the modelling and the meteorological communities. We have also conducted a
focus group with environment experts and attended a workshop targeted at EarthObvs
Science and Technology stakeholders. With such input we have compiled information about
the main data sources, their uses and data flows, as well as the more noticeable challenges in
the environment.
The authoritative EarthObvs and a Space Observation portal SPObvs) are the typical sources
of data (mainly from remote sensing), however there is a growing interest in non-
authoritative data, such as crowdsourcing, and in synthetic data from model outputs. Myriads
of applications make use of environmental data, and data flows may be virtually
unconstrained, from the producers to the consumers, passing by multiple independent
processors. Institutional arrangements and policies are the fundamental regulatory aspect of
environmental data exchange. These can range from application-specific Service Level
Agreement, to overarching policies, such as the EarthObvs Data Sharing Principles. The main
challenges reported include data access, and Open Access policies are considered effective
also to mitigate other technical issues. In general, there is a perception that technical
challenges are easy to overcome and that policy-related issues (above all, data quality) are the
real hindrance to Big Data in the environment sector.
Positive economical externalities associated with the use of big data in the environment
include economic growth and better governance of environmental challenges – the negative
ones comprise the possibility of putting the private sector (and especially big players) to a
competitive advantage. On the positive side of social and ethical externalities, data-intensive
applications may increase awareness and participation; on the negative side, big-brother-
effect and manipulation, real or perceived, can be problematic. With respect to legal
externalities, regulation needs clarification, e.g. on IPR. Finally, political externalities include
the risk of depending on external sources, particularly big players, as well as EarthObvs
political tensions.
1 OVERVIEW
The environment, including the Earth’s atmosphere, oceans and landscapes, is changing
rapidly, also due to the increasing impact of human activities. Monitoring and modelling
environmental changes is critical for enabling governments, the private sector and civil
society to take informed decisions about climate, energy, food security, and other challenges.
Decision makers must have access to the information they need, in a format they can use, and
in a timely manner. Today, the Earth is being monitored by land, sea, air and Space.

66
However, the systems used for collecting, storing, analysing and sharing the data remain
fragmented, incomplete, or redundant.
The BYTE case study in the environment sector has centred on an Earth Observation
Development Board (EODB) of a group on Earth Observation (EarthObvs). We have sought
the assistance of EarthObvs-EODB in identifying the potential externalities that will arise due
to the use of Big Data in the environment sector. To this end, we were interested in scoping
the possible implications of environmental data-intensive applications on Society.
The methodology used to conduct the case study derives from the generic BYTE case study
methodology,103 based on:
Semi-structured interviews;
Document review;
Disciplinary focus groups.
1.1 STAKEHOLDERS, INTERVIEWEES AND OTHER INFORMATION SOURCES
With over 90 members and a broadening scope, EarthObvs is not just specific to Earth
Observation, but is evolving into a global venue to support Science-informed decision-
making in nine environmental fields of interest, termed Societal Benefit Areas (SBAs), which
include Agriculture, Biodiversity, Climate, Disasters, Ecosystems, Energy, Health, Water,
and Weather. Furthermore, EarthObvs is in an important item in the EC agenda.
For a decade now, EarthObvs has been driving the interoperability of many thousands of
individual space-based, airborne and in situ Earth observations around the world. Often these
separate systems yield just snapshot assessments, leading to critical gaps in scientific
understanding.
To address such gaps, EarthObvs is coordinating the realization of a universal earth
observation system (EOSystem), a global and flexible network of content providers providing
easy, open access to an extraordinary range of data and information that enable an
increasingly integrated view of our changing Earth. From developed and developing nations
battling drought and disease, to emergency managers making evacuation decisions, farmers
making planting choices, companies evaluating energy costs, and coastal communities
concerned about sea-level rise, leaders and other decision-makers require this fuller picture as
an indispensable foundation of sound decision-making.
The first phase of EOSystem, implementation will end in 2015. A new work plan for the
second phase (2016-2025) is under definition. EOSystem already interconnects more than
thirty autonomous infrastructures, and allows discovering and accessing more than 70 million
of extremely heterogeneous environmental datasets. As such, EOSystem had and has to face
several challenges related to Big Data.
The EarthObvs-EODB is responsible for monitoring progress and providing coordination and
advice for the five Institutions and Development Tasks in the EarthObvs 2012-2015 Work
Plan. These five Tasks address “EarthObvs at work” and the community’s efforts to ensure
that EOSystem is sustainable, relevant and widely used; they focus on reinforcing data
sharing, resource mobilization, capacity development, user engagement and science and
103 Guillermo Vega-Gorgojo, Grunde Løvoll, Thomas Mestl, Anna Donovan, and Rachel Finn, Case study
methodology, BYTE Deliverable D3.1, BYTE Consortium, 30 September 2014.

67
technology integration. The Board is composed of around 20 members and includes experts
from related areas. A partial list of EarthObvs-EODB stakeholders is shown in Table 24,
according to the categorization of the BYTE Stakeholder Taxonomy.104 Note that private
sector organisations participate in EarthObvs as part of their respective national membership
[WS].
Table 24 – Organizations involved in the environment case study
Organization Industry
sector
Technology
adoption stage
Position on data
value chain
Impact of IT in
industry
EC Public Sector
(EU)
Early majority Usage Support role
EEA Public Sector
(EU)
Early majority Analysis
Curation
Usage
Factory role
EPA Public Sector
(USA)
Early majority Analysis
Curation
Usage
Factory role
EuroEarthObvsS
urveys
Public Sector
(EU)
Late Majority Acquisition
Analysis
Curation
Usage
Factory role
EUSatCen Public Sector
(EU)
Early Adopters Acquisition
Analysis
Curation
Storage
Usage
Strategic role
IEEE Professional
association
Innovators Acquisition
Analysis
Curation
Storage
Usage
Strategic role
NASA Space (USA) Innovators Acquisition
Analysis
Curation
Storage
Strategic role
SANSA Space (South
Africa)
Innovators Acquisition
Analysis
Curation
Storage
Strategic role
UNEP Public Sector Late majority Analysis
Curation
Storage
Usage
Turnaround role
We have tailored the questions of the semi-structured interview proposed in the methodology
to the EarthObvs community, and arranged interviews with the leaders of the EarthObvs-
OEDB tasks, compatibly with their availability, as well as the more general point of view of
the EarthObvs Secretariat, interviewing a senior officer (seconded by a major space agency).
We also sought to capture the viewpoints of a senior data manager from the climate/Earth
104 Edward Curry, Andre Freitas, Guillermo Vega-Gorgojo, Lorenzo Bigagli, Grunde Løvoll, Rachel Finn,
Stakeholder Taxonomy, BYTE Deliverable D8.1, BYTE Consortium, 2 April 2015.
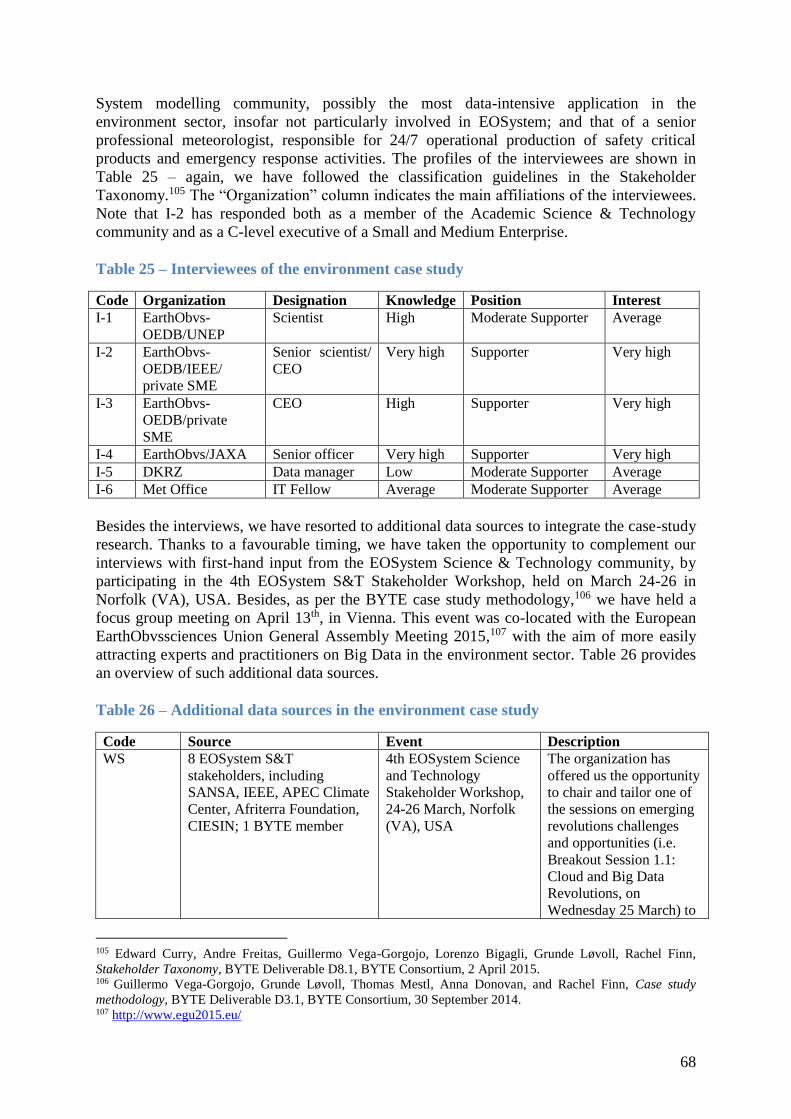
68
System modelling community, possibly the most data-intensive application in the
environment sector, insofar not particularly involved in EOSystem; and that of a senior
professional meteorologist, responsible for 24/7 operational production of safety critical
products and emergency response activities. The profiles of the interviewees are shown in
Table 25 – again, we have followed the classification guidelines in the Stakeholder
Taxonomy.105 The “Organization” column indicates the main affiliations of the interviewees.
Note that I-2 has responded both as a member of the Academic Science & Technology
community and as a C-level executive of a Small and Medium Enterprise.
Table 25 – Interviewees of the environment case study
Code Organization Designation Knowledge Position Interest
I-1 EarthObvs-
OEDB/UNEP
Scientist High Moderate Supporter Average
I-2 EarthObvs-
OEDB/IEEE/
private SME
Senior scientist/
CEO
Very high Supporter Very high
I-3 EarthObvs-
OEDB/private
SME
CEO High Supporter Very high
I-4 EarthObvs/JAXA Senior officer Very high Supporter Very high
I-5 DKRZ Data manager Low Moderate Supporter Average
I-6 Met Office IT Fellow Average Moderate Supporter Average
Besides the interviews, we have resorted to additional data sources to integrate the case-study
research. Thanks to a favourable timing, we have taken the opportunity to complement our
interviews with first-hand input from the EOSystem Science & Technology community, by
participating in the 4th EOSystem S&T Stakeholder Workshop, held on March 24-26 in
Norfolk (VA), USA. Besides, as per the BYTE case study methodology,106 we have held a
focus group meeting on April 13th, in Vienna. This event was co-located with the European
EarthObvssciences Union General Assembly Meeting 2015,107 with the aim of more easily
attracting experts and practitioners on Big Data in the environment sector. Table 26 provides
an overview of such additional data sources.
Table 26 – Additional data sources in the environment case study
Code Source Event Description
WS 8 EOSystem S&T
stakeholders, including
SANSA, IEEE, APEC Climate
Center, Afriterra Foundation,
CIESIN; 1 BYTE member
4th EOSystem Science
and Technology
Stakeholder Workshop,
24-26 March, Norfolk
(VA), USA
The organization has
offered us the opportunity
to chair and tailor one of
the sessions on emerging
revolutions challenges
and opportunities (i.e.
Breakout Session 1.1:
Cloud and Big Data
Revolutions, on
Wednesday 25 March) to
105 Edward Curry, Andre Freitas, Guillermo Vega-Gorgojo, Lorenzo Bigagli, Grunde Løvoll, Rachel Finn,
Stakeholder Taxonomy, BYTE Deliverable D8.1, BYTE Consortium, 2 April 2015. 106 Guillermo Vega-Gorgojo, Grunde Løvoll, Thomas Mestl, Anna Donovan, and Rachel Finn, Case study
methodology, BYTE Deliverable D3.1, BYTE Consortium, 30 September 2014. 107 http://www.egu2015.eu/

69
BYTE needs
FG 6 experts from academia,
research, industry in
environment and
EarthObvsspatial sector,
including GSDI, JAXA, ESA,
AIT; 5 BYTE members
BYTE Focus Group
Meeting, 13 April 2015,
Vienna (Austria)
Focus group meeting on
Big Data in the
environment sector
The 4th EOSystem S&T Stakeholder Workshop was promoted by IDIB task ID-03:
Advance EOSystem through integration of innovations in Earth observation science and
technology, also enabling the research community to fully benefit from EOSystem
accomplishments. Promote research and development (R&D) in key areas of Earth sciences
to facilitate improvements to Earth observation and information systems, and support the
transition of systems and techniques from research to operations. Engage with a wide range
of science and technology communities including individual scientists and their institutions,
both public and private.
Participants included technology developers; experts in data management, integration, and
analysis; developers of knowledge systems and concepts for the linkage between decision-
making and knowledge; and user representatives. The workshop has focused, among others,
on the rapid development in (big) data availability, not only from traditional sensors but also
from a variety of human sensors, the developing Internet of Things (IoT) and Internet of
Everything (IoE) scenarios, and the output of increasingly more advanced models. The
outcomes of the workshop include position papers on various aspects of the future
EOSystem, including the handling of the emerging “data super nova”.
The disciplinary focus group meeting had the purpose to gain greater insight into the data,
technologies, applications and potential positive and negative impacts that may result from
the use of Big Data in the environmental sector. Focus group participants have been selected
to ensure the participation of individuals with expertise in environmental data, technology,
computer science, EarthObvsspatial standardisation, the space sector, as well as privacy and
data protection, open data policies, relevant policy issues such as funding and innovation. The
focus group meeting agenda is reported in Appendix C and included a debriefing on BYTE
preliminary results and two sessions of discussion in three small groups, reporting to the
overall attendance.
Along this report we profusely include statements from the case study sources – especially in
the summary tables, but also within the main text – to support our findings. In all cases we
employ the codes included in Table 25 and Table 26 to identify the source.
1.2 ILLUSTRATIVE USER STORIES
Damage assessment in buildings [FG]
In urban environments, remote sensing allow monitoring fine displacement of buildings, due
to subsidence, shrinking, etc. High-resolution satellite data, especially when coupled with
Building Information Models help assessing potential vulnerabilities and prevent damages
before they actually happen. This is also a typical use case in emergency response situations,
such as post-earthquake damage assessment, etc.
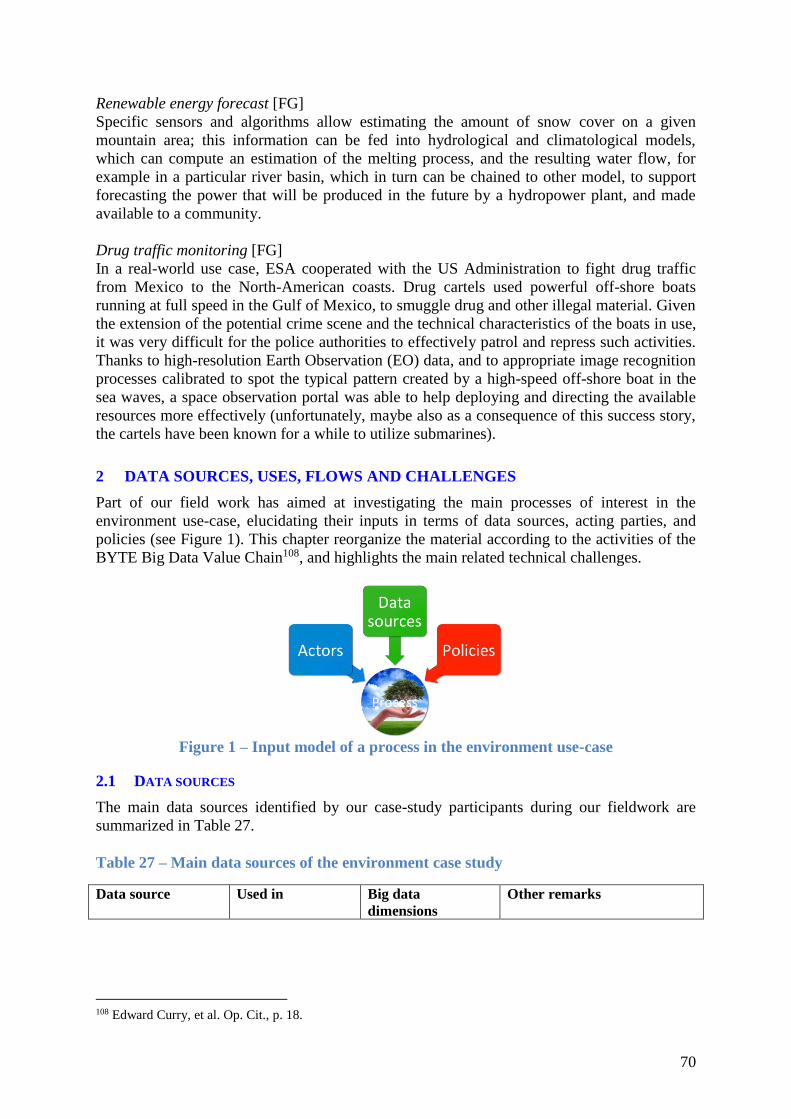
70
Renewable energy forecast [FG]
Specific sensors and algorithms allow estimating the amount of snow cover on a given
mountain area; this information can be fed into hydrological and climatological models,
which can compute an estimation of the melting process, and the resulting water flow, for
example in a particular river basin, which in turn can be chained to other model, to support
forecasting the power that will be produced in the future by a hydropower plant, and made
available to a community.
Drug traffic monitoring [FG]
In a real-world use case, ESA cooperated with the US Administration to fight drug traffic
from Mexico to the North-American coasts. Drug cartels used powerful off-shore boats
running at full speed in the Gulf of Mexico, to smuggle drug and other illegal material. Given
the extension of the potential crime scene and the technical characteristics of the boats in use,
it was very difficult for the police authorities to effectively patrol and repress such activities.
Thanks to high-resolution Earth Observation (EO) data, and to appropriate image recognition
processes calibrated to spot the typical pattern created by a high-speed off-shore boat in the
sea waves, a space observation portal was able to help deploying and directing the available
resources more effectively (unfortunately, maybe also as a consequence of this success story,
the cartels have been known for a while to utilize submarines).
2 DATA SOURCES, USES, FLOWS AND CHALLENGES
Part of our field work has aimed at investigating the main processes of interest in the
environment use-case, elucidating their inputs in terms of data sources, acting parties, and
policies (see Figure 1). This chapter reorganize the material according to the activities of the
BYTE Big Data Value Chain108, and highlights the main related technical challenges.
Figure 1 – Input model of a process in the environment use-case
2.1 DATA SOURCES
The main data sources identified by our case-study participants during our fieldwork are
summarized in Table 27.
Table 27 – Main data sources of the environment case study
Data source Used in Big data
dimensions
Other remarks
108 Edward Curry, et al. Op. Cit., p. 18.

71
Space component
(satellite data, etc.)
Modelling
Information
extraction
Analysis
Volume
Velocity
Variety
Value
Cf. Copernicus109 and the ESA
Big Data from Space
initiative110
In-situ component
(rain gauges, buoys,
etc.)
Modelling
Information
extraction
Analysis
Volume
Velocity
Variety
Value
Openness still unsolved [FG]
Service component
(models, etc.)
Modelling
Information
extraction
Analysis
Volume
Velocity
Value
Veracity
[FG]
Cadaster/Utilities
infrastructure data
(BIM)
Planning
Infrastructure
Value
Veracity
[FG]
Open Data / Public
Sector Information
(PSI)
Governance
Reporting
Value
Veracity
[FG]
Archives, historical
data (e.g. maps),
archaeological data
Planning
Culture
Variety
Veracity
[FG]
Government
agencies
Demographics
Integration policies
Value
Veracity
[FG]
Time series of EO
products (e.g. for
climate or weather
studies) and EO
mission data
Information
extraction
Analysis
Volume
Velocity
Examples in EOSystem:
AIRS/Aqua Level 3 Daily
standard physical retrieval
(2007-2014)
TOMS/Nimbus-7 Total Ozone
Aerosol Index UV-Reflectivity
UV-B Erythemal Irradiances
Daily L3 Global 1x1.25 deg
V008 (TOMSN7L3) (1978-
1993)
[FG]
Ozone hole was derived from
the long term archive data sets
by NASA and US observations
[I-4]
109 Anna Donovan, Rachel Finn, Kush Wadhwa, Lorenzo Bigagli, Guillermo Vega Gorgojo, Martin
EarthObvsrg Skjæveland, Open Access to Data, BYTE Deliverable D2.3, BYTE Consortium, 30 September
2014, p. 55. 110 Rachel Finn, Anna Donovan, Kush Wadhwa, Lorenzo Bigagli, José María García, Big data initiatives, BYTE
Deliverable D1.3, BYTE Consortium, 31 October 2014, p. 30.
72
Linked data:
observations and
indicators
Information
extraction
Analysis
Variety
Value
Veracity
Example:
European Environment Agency
(http://www.eea.europa.eu/data-
and-maps) accessible through
SPARQL interface
[FG]
Web, social media Citizen Science
Sentiment/trend
analysis
Early warning
Crisis response
Variety
Veracity
[FG]
EOSystem considering social
networking as source of data?
Examples: Twitter indications
of quake extent [WS]
Analysing the web content to
determine socio-economic and
environmental information and
knowledge needs and societal
benefits of Earth observations
[I-2]
Volunteered
EarthObvsgraphic
Information (VGI),
crowdsourcing
Citizen Science
Analysis
Velocity
Variety
Value
Veracity
[FG]
Internet of People
(e.g., health
monitoring), Internet
of Things, Internet of
Everything
Automation
Information
extraction
Analysis
Velocity
Variety
Value
Veracity
IoT and IoP — and the
“Internet of Location” — are
already becoming part of
EOSystem [WS]
There is a need for more
environmental information that
depends on the use and
integration of Big Data. This
will lead to more Big Data
solutions. The emergence of
IoT will further support this [I-
2]
The EarthObvs and a space observation portal have been recognized as primary sources of
data, obviously mainly from remote sensing [FG]. The characteristics of the data available
through these resources may differ widely: the size may range from the few KB of a vector
dataset representing administrative borders, to the GB of a raster coverage resulting from
some elaboration, to the PB typical of raw satellite swats by the space observation portal; the
timestamp of the data may range from the 70’s onward, including the future, for model
outputs. Most of the space observation portal’s Earth Observation datasets are available
online free of charge. Some data products (e.g. Synthetic Aperture Radar data) are even
generated on demand, after a specific user requests, also free of charge. The EarthObvs portal
provides access to most of the above data sources (Space component, In-situ component,

73
Open Data/PSI, Government agencies, Time series, VGI, crowdsourcing, IoT), classified.
Figure 2 summarizes the data records indexed by the EarthObvs portal catalogue. Future
expansions will conceive Linked data and the Service component (models, etc.), for the nine
EOSystem SBAs (Agriculture, Biodiversity, Climate, Disasters, Ecosystems, Energy, Health,
Water, Weather).
It was noted that all these data sources have a high commercial value [FG]. However, the
main data sources are publicly paid and are thus open and free [FG]. This is consistent with
the current investments in public-funded initiatives on Open Data / PSI.
Figure 2 – Datasets available through the EARTHOBVS portal
Our fieldwork confirmed the expectation111 that benefits could be gained by sharing and
integrating the data generated by people, and that also in-situ observatories, including
crowdsourcing-oriented platforms and mobile tools, providing a large amount of small
heterogeneous datasets, will require Big Data tools in place.
In fact, the interest for “unstructured” data sources, such as the Web, social media, VGI and
crowdsourcing listed in the table above, seems to be growing in the environment sector: there
are many ways of using social media both directly as sensors, but also as some sort of
metadata or data that you combine as relevant to the environment [I-3]. One example is the
Citizen Observatory Web (COBWEB)112 project.
111 Rajendra Akerkar, Guillermo Vega-Gorgojo, Grunde Løvoll, Stephane Grumbach, Aurelien Faravelon,
Rachel Finn, Kush Wadhwa, Anna Donovan, Lorenzo Bigagli, Understanding and mapping Big Data, BYTE
Deliverable D1.1, BYTE Consortium, 31 March 2015, p. 50. 112 https://cobwebproject.eu/

74
The modelling community, as was to be expected, seems less interested in this kind of
engagement: Citizen Science is not what we do at DKRZ. Maybe one day DKRZ will be
"require[d] to enable access and analysis of the immense amount of social and environmental
observation data stream that is collected from intelligent sensors and citizens..." into its
numerically generated climate Big Data (i.e. big volume but homogeneous), however, this is
not yet discussed (or at most in projects such at RDA or EUDAT, but not seriously envisaged
presently) [I-5].
In summary, there is a stress on the heterogeneity of environmental data, gathered from
hundreds of countries, several thousand locations, ships, aircraft, land vehicles, satellites [I-
6]. Besides, the interlinking of data (e.g. time series, as a special case linking along the time
dimension) is seen as a source of new data, providing unexpected insights, especially when
typical data sources are couple with non-authoritative, unstructured data, such as social
media. It is worth underlying that Europe seems to be leading the Big Data innovation (or
revolution) in the EarthObvs spatial sector.
2.2 DATA USES
Value chain analysis can be applied to information systems, such as EOSystem, to understand
the value-creation of data technologies. Table 28 contextualizes some of the activities of the
BYTE Big Data Value Chain113 to the environment case study, in relation to the main
stakeholders and/or use cases. For example, Environmental Agencies, as intermediate users
of environmental data, typically make use of data acquired from sensor networks. EOSystem
is mainly related to the final phase of the Value Chain, i.e. the Data Usage phase, as it
specifically targets the Society and the decision-makers, which are the end users of the Big
Data Value Chain in the environment sector.
Table 28 – Main uses of data in the environment case study
DATA ACQUISITION
Data streams National/International Space Agencies (space observation portal and to
some extent NASA) [FG]
Remote sensing industry [FG]
Sensor networks Government Agencies (Environmental Agencies) [FG]
DATA ANALYSIS
Community data
analysis
Typical business is to combine data and do some reporting for the
municipality [FG]
Statistics/reporting [FG]
Cross-sectorial data
analysis
Data integration leading to liveable design [FG]
Information extraction
Stream mining
Fisheries, mining, oil & gas [FG]
Linked data
Semantic analysis
Inventories of data and user needs [FG]
DATA CURATION
Interoperability Combining different pieces of data, e.g. near real-time data and historical
113 Edward Curry, et al. Op. Cit., p. 18.
75
data [FG]
Federation and sharing of data [FG]
Community / Crowd Local committees, citizens [FG]
Data quality
Trust /Provenance
ICSU CODATA works to improve the quality, reliability, management and
accessibility of data of importance to all fields of science and technology
[FG]
Incentivisation
Human-Data Interaction
E-infrastructure – needed to support open access, legal interoperability,
education/changing data culture [WS]
The CMIP community propagated open access even for commercial use,
with some success; the number of institutes that agree to a free Terms of
Use increase [I-5]
DATA USAGE
Prediction Crisis, impact forecasting [FG]
Insurance [FG]
Meteo forecast / nearcast [FG]
Final information would be predicted information [I-4]
Decision support Huge processing demands caused by crisis [FG]
Civil protection agencies [FG]
Disaster (flooding, thunderstorm, tsunami, earthquakes, wildfires,
hurricane, hydrology) [FG]
In-use analytics In-place processing (Container idea / object-oriented computing / on-line
processing of streaming data) [FG]
Use of internet locality, temporality, to identify uses [FG]
Domain-specific usage Farmers, tourism sector, food industry [FG]
Control Traffic, Anti-terrorism [FG]
Policy Enforcement, Global monitoring and control of international
agreements (KYOTO, NPT, UN Sustainable Development Goals) [FG]
Planning & Control [FG]
Modelling
Simulation
Comprehensive virtual representation of the planet (cf. International
Society for Digital Earth) [FG]
Ozone hole – Climate Change [FG]

76
The original scope of EOSystem is making Earth observation resources available for better-
informed decision-making, particularly in the nine SBAs: Agriculture, Biodiversity, Climate,
Disasters, Ecosystems, Energy, Health, Water, and Weather. From this perspective, the uses
of EOSystem have focussed on disaster relieve, support to humanitarian actions, and similar
initiatives, typically carried on by public bodies. Examples of the myriads of applications that
have been realized by means of EOSystem services and data include:
Forecasting meningitis outbreaks in Africa’s “meningitis belt”, to help the World
Health Organization to target its vaccination programs;
Providing images free-of-charges to farmers, resource managers and other users so
that they can monitor changes in critical environmental variables such as crop growth
conditions, crop area and production;
Integrating ground observations with satellite data to provide accurate maps of the
forest canopy and estimates of forest biomass and carbon content.
At present, there is a trend for EarthObvs to evolve into a global venue to support Science-
informed decision-making in general, with a growing attention for the industry sector, and for
the private sector in general. This may prelude to more commercially-oriented uses of
EOSystem data in the future.
Moreover, the IDIB is specifically tasked with capacity building, including human resources,
particularly in less-developed countries. This is an important use-case of EOSystem,
implemented in programs such as AfriEOSystem114.
2.3 DATA FLOWS
As a System of Systems, Eosystem is conceived to scale up and accommodate an ever-
increasing amount of environmental data and services, offered and consumed by the various
EarthObvs participants. Data flows may be virtually unconstrained, originating by one or
more data providers, flowing through as many intermediate processes as necessary, before
reaching the final user, be it a human or a machine: data is conceived more like streams being
continuously generated and collected.
To support this, EOSystem is based on a Service-Oriented Architecture (SOA) and on
resource virtualization patterns such as Infrastructure-As-A-Service, Platform-As-A-Service,
etc. This is typical of modern Spatial Data Infrastructures (SDIs), like for example the Helix
Nebula115 ecosystem for satellite data, referenced by one of the case study participants: in this
ecosystem there are data providers, research institutions providing knowledge (from the
analysis of data), EarthObvs app providers, service providers and customers that consume
information [FG], backed by a Cloud Computing Infrastructure, which ultimately provides
physical and organisational structures and assets needed for the IT-related operation of
research institutions, enterprises, governments and society.
In addition, EOSystem provides a central service framework, termed the EOSystem Common
Infrastructure (GCI), which is the primary tool where the interaction between data providers
and users are materialized. As depicted in Figure 3, the GCI provides a set of capabilities to
enable information sharing between multiple data sources and multiple data users. These
include a portal, resource registration services, and a number of mediating services, named
114 http://www.earthobservations.org/afriEarthObvsss.php 115 http://www.helix-nebula.eu/
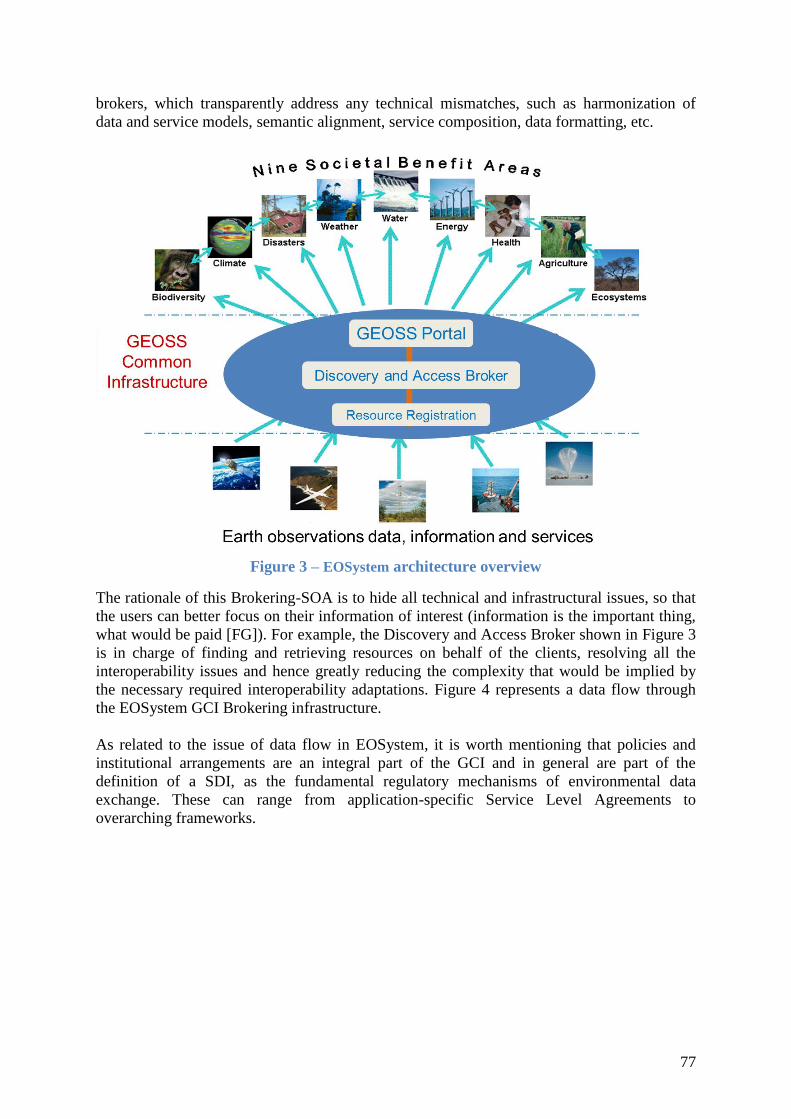
77
brokers, which transparently address any technical mismatches, such as harmonization of
data and service models, semantic alignment, service composition, data formatting, etc.
Figure 3 – EOSystem architecture overview
The rationale of this Brokering-SOA is to hide all technical and infrastructural issues, so that
the users can better focus on their information of interest (information is the important thing,
what would be paid [FG]). For example, the Discovery and Access Broker shown in Figure 3
is in charge of finding and retrieving resources on behalf of the clients, resolving all the
interoperability issues and hence greatly reducing the complexity that would be implied by
the necessary required interoperability adaptations. Figure 4 represents a data flow through
the EOSystem GCI Brokering infrastructure.
As related to the issue of data flow in EOSystem, it is worth mentioning that policies and
institutional arrangements are an integral part of the GCI and in general are part of the
definition of a SDI, as the fundamental regulatory mechanisms of environmental data
exchange. These can range from application-specific Service Level Agreements to
overarching frameworks.

78
Figure 4 – Representation of a data flow in EARTHOBVSSS
Examples of aspects where environmental policies are advocated or already effective are
[FG]:
Civil protection
Emergency use or reuse of infrastructure (e.g. UN – SPIDER for disaster response)
Green energy and infrastructure
Federated systems
Fair disclosure of property and environmental findings (e.g. the UK Passport for
properties/real estate)
Multi-lingual support
Intellectual property (e.g. to avoid overly inclusive patents)
Public-private partnerships
Resilience framework (i.e. goals for bringing infrastructure back online)
Space agency (e.g. Copernicus)
International Charter for Space and Major Disasters
EU Common Agriculture policy
Kyoto protocol (an event in Paris in December will focus on Big Data)
EEA policy on noise pollution
Data sharing (e.g. Open Access)
Data sharing policies are obviously most relevant to data flows. Our fieldwork has
highlighted the importance attributed to data sharing and the potential impact credited to open
access policies in the environment sector (disaster management [is related to] International
agreements – in an emergency situation any one government is not equipped to handle
disasters that occur across borders; also need for cooperation between local agencies, and
data openness is required [FG]; [Space agencies] do not contribute as of yet very much to
environmental studies. Some are more defence based. They also keep their own data for
themselves. Open access here is key to furthering this [FG]).
79
EOSystem explicitly acknowledges the importance of data sharing in achieving the
EOSystem vision and anticipated societal benefits: "The societal benefits of Earth
observations cannot be achieved without data sharing"116. The EOSystem Data Sharing
Principles recognize the Data Collection of Open Resources for Everyone (Data-CORE) as a
key mechanism to advocate openness in data provisioning and address non-technical
externalities. The GCI plays a critical role in efficiently and effectively support the
implementation of the Data Sharing Principles.
Other policy issues (e.g. security) will probably become more important in the near future
(EOSystem needs to facilitate new data integration and to address policies, privacy, etc.: e.g.,
anonymisation, processes to control use, legal interoperability, quality labelling/trust
processes [WS]). Moreover, as we have observed117, specific sustainability policies will be
required, at some point, to secure the long-term sustained operation of the GCI itself. Until
now, the GCI has been maintained on a voluntary basis, in accordance with the EOSystem
implementation methodology. The Action Plan calls for the EarthObvs Members and
Participating Organisations to provide resources for the sustained operation of the GCI and
the other initiatives set out. However, the governance of EOSystem beyond the time frame of
the Action Plan is not yet defined.
2.4 MAIN TECHNICAL CHALLENGES
From our case study research, the following main technical challenges can be related to the
various activities of the Big Data Value Chain118.
Table 29 – Main technical challenges in the environment case study
Value chain activity Statement [source]
Data acquisition Resolution [FG] – also affects data analysis; the choice of an
appropriate resolution is application-critical and typically a trade-off
with the frequency and range of the acquisition
There is a need for more environmental information on local to global
scales and on time scales from minutes to years [I-2]
Data analysis Tricky to find information. Requires getting an overview of the data and
getting hold of the data. There is room for improvement here [FG]
EOSystem needs to facilitate new data integration [WS]
Making a great variety of datasets on different format, temporal and
spatial resolution, etc. interoperable [I-3]
Translate data into good political and socio-economic decisions [I-1]
Not having all algorithms developed to access and analyses the data [I-
2]
116 Group on Earth Observations, “10-Year Implementation Plan Reference Document”, ESA Publications
Division, Noordwijk (The Netherlands), February 2005, p. 139, 205. 117 Anna Donovan, Rachel Finn, Kush Wadhwa, Lorenzo Bigagli, Guillermo Vega Gorgojo, Martin
EarthObvsrg Skjæveland, Open Access to Data, BYTE Deliverable D2.3, BYTE Consortium, 30 September
2014, p. 27. 118 Edward Curry, et al. Op. Cit., p. 18.

80
The really important essential variables may not be covered/identified
[I-2]
Combine real-time and low-latency sensor data with models to generate
and distribute environmental information to “customers” [I-2]
Data curation Quality of data [FG] – arguably the first and foremost aim of data
curation: data can be improved under many aspects, such as filling the
gaps, filtering out spurious values, improving the completeness and
accuracy of ancillary information, etc.
In the Eyjafjallajökull crisis, the problem at the beginning was that the
volcanic watch data was not accurate (this affects decision-making
processes) [FG]
Social media and crowd sourced data is generally not trusted. This is
especially problematic when combining data sources [FG]
Imagine a crisis situation, e.g. a flood in Beijing. The government could
not use social media to make a decision [FG] – this is reiterating the
issue of trust of non-authoritative sources, such as social media
Need to apply methods to transform data into authoritative source, e.g.,
W3C [WS]
Data storage Sustainability is an important requirement. There is a continuous access
of data – its availability has to be guaranteed [FG]
An important issue is the long-term maintenance of the infrastructure [I-
1]
It would help to increase both storage and transfer velocity [I-5]
Data parallelism [FG]
Data usage Data access is a challenge [FG]
Interpretation. There is an institutional gap between mapping authority
and the scientists [FG]
Lack of standards, industrial competitors that use standard violations to
strengthen their position [I-2]
Our fieldwork confirms the significant technical challenges raised by data-intensive
applications in the environment sector119. They encompass a wide range of applications: from
disciplinary sciences (e.g. climate, Ocean, EarthObvslogy) to the multidisciplinary study of
the Earth as a System (the so-called Earth System Science). They are based on Earth
Observation, requiring handling observations and measurements coming from in-situ and
remote-sensing data with ever growing spatial, temporal, and radiometric resolution. They
119 Rajendra Akerkar, Guillermo Vega-Gorgojo, Grunde Løvoll, Stephane Grumbach, Aurelien Faravelon,
Rachel Finn, Kush Wadhwa, Anna Donovan, Lorenzo Bigagli, Understanding and mapping Big Data, BYTE
Deliverable D1.1, BYTE Consortium, 31 March 2015, pp. 51-52.
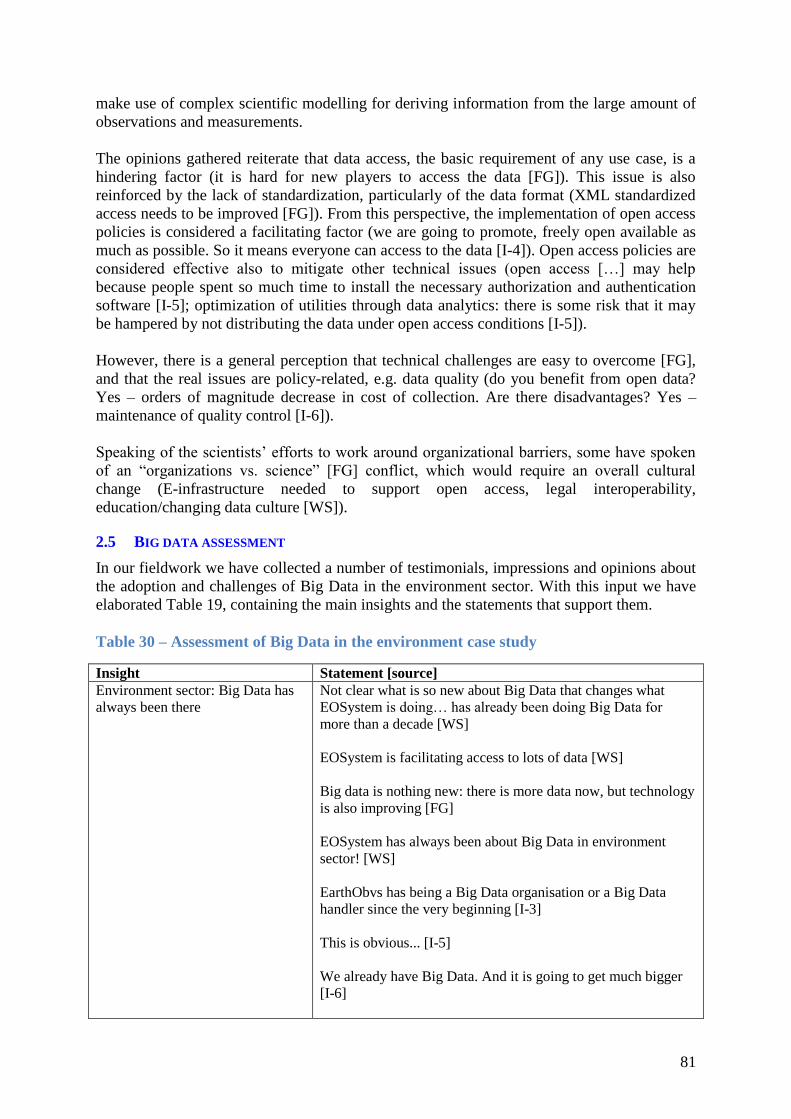
81
make use of complex scientific modelling for deriving information from the large amount of
observations and measurements.
The opinions gathered reiterate that data access, the basic requirement of any use case, is a
hindering factor (it is hard for new players to access the data [FG]). This issue is also
reinforced by the lack of standardization, particularly of the data format (XML standardized
access needs to be improved [FG]). From this perspective, the implementation of open access
policies is considered a facilitating factor (we are going to promote, freely open available as
much as possible. So it means everyone can access to the data [I-4]). Open access policies are
considered effective also to mitigate other technical issues (open access […] may help
because people spent so much time to install the necessary authorization and authentication
software [I-5]; optimization of utilities through data analytics: there is some risk that it may
be hampered by not distributing the data under open access conditions [I-5]).
However, there is a general perception that technical challenges are easy to overcome [FG],
and that the real issues are policy-related, e.g. data quality (do you benefit from open data?
Yes – orders of magnitude decrease in cost of collection. Are there disadvantages? Yes –
maintenance of quality control [I-6]).
Speaking of the scientists’ efforts to work around organizational barriers, some have spoken
of an “organizations vs. science” [FG] conflict, which would require an overall cultural
change (E-infrastructure needed to support open access, legal interoperability,
education/changing data culture [WS]).
2.5 BIG DATA ASSESSMENT
In our fieldwork we have collected a number of testimonials, impressions and opinions about
the adoption and challenges of Big Data in the environment sector. With this input we have
elaborated Table 19, containing the main insights and the statements that support them.
Table 30 – Assessment of Big Data in the environment case study
Insight Statement [source]
Environment sector: Big Data has
always been there
Not clear what is so new about Big Data that changes what
EOSystem is doing… has already been doing Big Data for
more than a decade [WS]
EOSystem is facilitating access to lots of data [WS]
Big data is nothing new: there is more data now, but technology
is also improving [FG]
EOSystem has always been about Big Data in environment
sector! [WS]
EarthObvs has being a Big Data organisation or a Big Data
handler since the very beginning [I-3]
This is obvious... [I-5]
We already have Big Data. And it is going to get much bigger
[I-6]

82
There is so much data and the philosophy of getting the data
from one place to another, has driven us to the solution that
instead of bringing the data to the processing you bring the
processing out in the cloud to the data. So that’s a new way of a
different way of thinking and very different way of doing things
[I-3]
Variety is a very big challenge, and
growing
Greater variety of data, e.g. crowdsourcing, etc. has
implications for EOSystem [WS]
Variety is an important factor in environment data – needs an
interdisciplinary mind-set to fully analyse and understand the
data [FG]
[Through EOSystem] you can put together and get more
information and different information, more efficiently than
you did before [I-3]
So the value would be integration of the variety of the datasets
into final product as predicted information [I-4]
There are no shared Veracity,
Value, and Validity criteria
Validation and verification of data is up to members, not
EarthObvs [WS]
EarthObvsGLAM (Global Agriculture Monitoring) information
for decision making; member states take responsibility for the
information development and validation [WS]
EarthObvs and EOSystem could serve as forum for airing
issues and problems (complementary to other efforts?) [WS]
EarthObvs has to be supportive and follow member policies
[WS]
DKRZ is also involved in Veracity (quality assurance), but also
in a way which is not so interesting: the data need no
protection, as they are no individual-related details, and nobody
objects to in-depth analysis - maybe for a while because of
authoring aspects, but besides everybody agrees to open data
for access [I-5]
Policy issues seem bigger than
technical/infrastructural ones
The biggest challenges lies in the complexities related to
humans and organizational issues. In particular it is a challenge
that the technology develops faster than the organisational and
human issues are being addressed and solved [I-3]
Difficulties: mostly institutional; shared vision; capacities at
human-infrastructure-institutional levels [I-1]
Internal national policy is one of the barriers [I-4]
Enable under-funded public sector to manage public resources
responsibly, without private corporation creaming excessive
profits or restrictively owning the means of production [I-6]

83
The question whether Big Data is a radical shift or an incremental change for the existing
digital infrastructures for environmental and EarthObvsspatial data120, seems to lean on the
second option (We are slowly discovering the potential and benefits of Big Data [I-1]). In
fact, Environmental Sciences have been in the forefront in many initiatives trying to realize
the e-Science vision (a “global collaboration in key areas of science, and the next generation
of infrastructure that will enable it”121) and its data-oriented underpinning. Many scientists
and technologists are advocating an entirely new approach to science based on data intensive
scientific discovery, named the Fourth Paradigm122 and supported by Big Data.
While Big Volume, big Variety, and high Velocity are typical issues of Environmental
Sciences data systems, Variety is reported as a very important challenge, and most likely to
become even more in the future, with the uptake of crowdsourcing, Internet of Things, etc.
An aspect of Variety that is worth underlining regards the heterogeneity of data resolution:
the coverage of the Earth is typically not uniform at every resolution, but instead presents
gaps that require complex interpolations to integrate the existing data at different resolution
levels. One of the strategic goals of EOSystem is a comprehensive coverage of the planet.
Noticeably, the modelling community seems to remark its specificities with regards
[...](climate model data includes just 2 Vs: volume and velocity [I-5]).
As commonly recognized in the scientific debate, quality of data is the biggest challenge.
While most would agree on how to quantify and address Volume issues, there is no shared
view on “quality criteria”, such as Value, Validity and Veracity. Addressing these aspects
seems to have been postponed until now, and delegated to other parties. Workshop
participants seemed particularly weary of taking strong positions on this, although admitting
criticism on the quality of the data available on EOSystem.
As we noted in the previous section, there is a general perception that technical challenges are
easier to overcome than policy issues, especially those arising at the intersection between the
public and the private sector. There are concerns that private actors abuse public resources (in
terms of data made openly available), without returning on the investment.
3 ANALYSIS OF SOCIETAL EXTERNALITIES
According to the case study methodology123, we have investigated the external (i.e. impacting
or caused by third parties) barriers and enablers to the identified data-intensive environmental
processes. In fact, there exists an obvious relationship between the externalities of an activity
and the consequent reactions from affected third parties. If an activity causes a negative
externality, then the affected party would oppose it, and hence appear as an (external) barrier.
Likewise, parties taking advantage of an environmental process would facilitate it, resulting
as enablers. We have restricted our interest to cases where the affected third parties have
120 Anna Donovan, Rachel Finn, Kush Wadhwa, Lorenzo Bigagli, Guillermo Vega Gorgojo, Martin
EarthObvsrg Skjæveland, Open Access to Data, BYTE Deliverable D2.3, BYTE Consortium, 30 September
2014. 121 Hey, Tony, and Anne E. Trefethen. 2002. “The UK e-Science Core Programme and the Grid.” International
Journal for e-Learning Security (IJeLS) 1 (1/2): 1017–1031. 122 Hey, T., Tansley, S., Tolle, K. (Eds.), 2009. The Fourth Paradigm: Data-intensive Scientific Discovery, p.
252. Microsoft Corporation edition. 123 Guillermo Vega-Gorgojo, Grunde Løvoll, Thomas Mestl, Anna Donovan, and Rachel Finn, Case study
methodology, BYTE Deliverable D3.1, BYTE Consortium, 30 September 2014.

84
some relevance for the Society at large, as per the scope of BYTE. Figure 5 depicts the
intuitive conceptual model we have adopted to refine our analysis.
Figure 5 – model of externalities in the environment use-case
The outcomes of the analysis are somewhat blurred, as most external factors typically have
both positive and negative aspects and can be seen as double-edged swords (the benefits also
come with risks [WS]; benefits of using data to support SBAs inevitably comes with risks of
potential misuse of data [WS]).
We have also grouped the identified externalities in four classes: economical, social &
ethical, legal, and political. This classification is also somewhat arbitrary. The participants in
our fieldwork often found it difficult to clearly assign an impact to a dimension and felt that
there were clear connections and flow between them [FG].
3.1 ECONOMICAL EXTERNALITIES
We include in Table 31 the economical externalities that we have found in the environment
case study. For each row we indicate the externality code from Table 55, the specific finding
and a set of statements from the case study data sources that support it.
Table 31 – Economical externalities in the environment case study
Code Quote/Statement [source] Finding
E-PO-BM-2 There are new, different business models [FG]
EarthObvsdata as a tool for creating a new marketplace – this
is the cloud part of the ecosystem. EarthObvsdata could be
something similar to GPS for the European economy [FG]
There are many European agencies (based on European
projects) that are inter-governmental. Some examples: EPOS,
USGS, IRIS, ESA, CEOS, CERN. Since these agencies are
leading the industry worldwide, there is potential for a
marketplace [FG]
Innovative
business models
(closer linkages
between research
and innovation)
E-PO-BM-1 Everything should be free and open. There is business value in
this, enabling people to be creative and to create value. In
addition, governments get value by these new businesses [FG]
Opportunities for
economic growth
(new products and
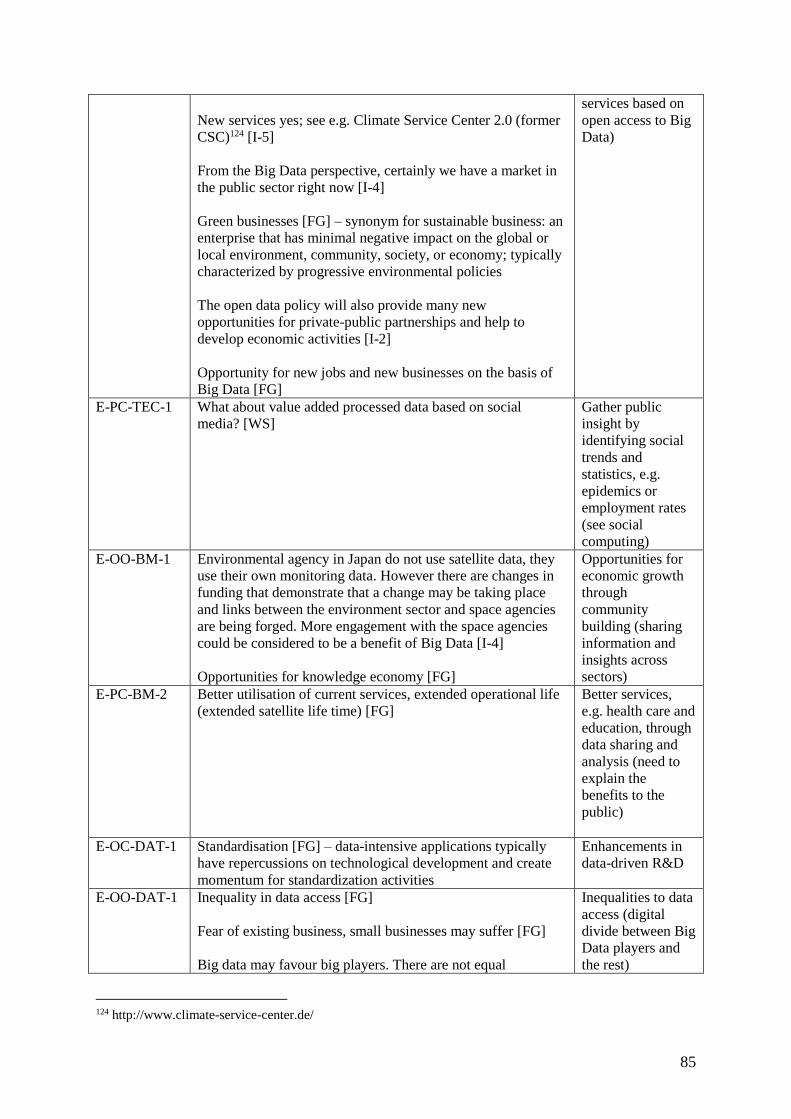
85
New services yes; see e.g. Climate Service Center 2.0 (former
CSC)124 [I-5]
From the Big Data perspective, certainly we have a market in
the public sector right now [I-4]
Green businesses [FG] – synonym for sustainable business: an
enterprise that has minimal negative impact on the global or
local environment, community, society, or economy; typically
characterized by progressive environmental policies
The open data policy will also provide many new
opportunities for private-public partnerships and help to
develop economic activities [I-2]
Opportunity for new jobs and new businesses on the basis of
Big Data [FG]
services based on
open access to Big
Data)
E-PC-TEC-1 What about value added processed data based on social
media? [WS]
Gather public
insight by
identifying social
trends and
statistics, e.g.
epidemics or
employment rates
(see social
computing)
E-OO-BM-1 Environmental agency in Japan do not use satellite data, they
use their own monitoring data. However there are changes in
funding that demonstrate that a change may be taking place
and links between the environment sector and space agencies
are being forged. More engagement with the space agencies
could be considered to be a benefit of Big Data [I-4]
Opportunities for knowledge economy [FG]
Opportunities for
economic growth
through
community
building (sharing
information and
insights across
sectors)
E-PC-BM-2 Better utilisation of current services, extended operational life
(extended satellite life time) [FG]
Better services,
e.g. health care and
education, through
data sharing and
analysis (need to
explain the
benefits to the
public)
E-OC-DAT-1 Standardisation [FG] – data-intensive applications typically
have repercussions on technological development and create
momentum for standardization activities
Enhancements in
data-driven R&D
E-OO-DAT-1 Inequality in data access [FG]
Fear of existing business, small businesses may suffer [FG]
Big data may favour big players. There are not equal
Inequalities to data
access (digital
divide between Big
Data players and
the rest)
124 http://www.climate-service-center.de/

86
opportunities for small and big players [FG]
The Big Data and the technical issues related to that will work
against many actors. Those actors able to deal with Big Data
can also decide if they want to develop services and hence
they will be competitors to those who will use the data [I-3]
Rising inequality caused by elite skills in data [FG]
Unequal opportunities for SMEs. Unequal access for users to
services and data – who owns the most money has the best
access to data [FG]
E-PO-DAT-1 I think it might be good for them [private sector] to use public
free-of-charge datasets [I-4]
There are public repositories. Storage costs are huge, although
governments and the commission will pay [FG]
We are starting to make collaboration with the private sector.
Because private datasets might be more accurate than public
datasets [I-4]
Big global private sector ‘cloud’ owners such as Google,
Amazon, etc. [might endanger the development towards the
use of Big Data] [I-6]
I don’t like to use the term competitor, but certainly the private
sector, Google, ESRI, Microsoft, they are kind of that [I-4]
We would certainly have questions, on what relationship
EarthObvs will have to the private sector, such as Google,
ESRI, and Microsoft [I-4]
Open data puts the
private sector at a
competitive
advantage (they
don't have to open
their data and have
access to public
data)
E-OC-BM-7 Matthew Effect. First mover advantage drives out competition
[FG]
IT silos appearing, whether proprietary or regional and
national solutions [I-6]
Reduced market
competition
(creation of a few
dominant market
players)
E-OO-BM-7 Current supercomputers, that generate the Big Data, need
several MW of electricity to run [I-6]
Cost of renewable energy [I-6]
Cell phone data – impact of power outages? [WS]
Inefficiencies caused by excess of pre-computed data [FG]
The mounting environmental crisis may require that more
resource are used to address the crisis instead of generating
environmental information that could help to limit the crisis or
avoid it [I-2]
Resource
allocation and
inefficiencies
associated to big
data
On the positive side, the use of big data in the environment is credited with having strong
implications on the economic growth (providing reliable environmental data has a strong
impact on economies (e.g. sea data for fishing nations and weather data for tourism) [FG]),
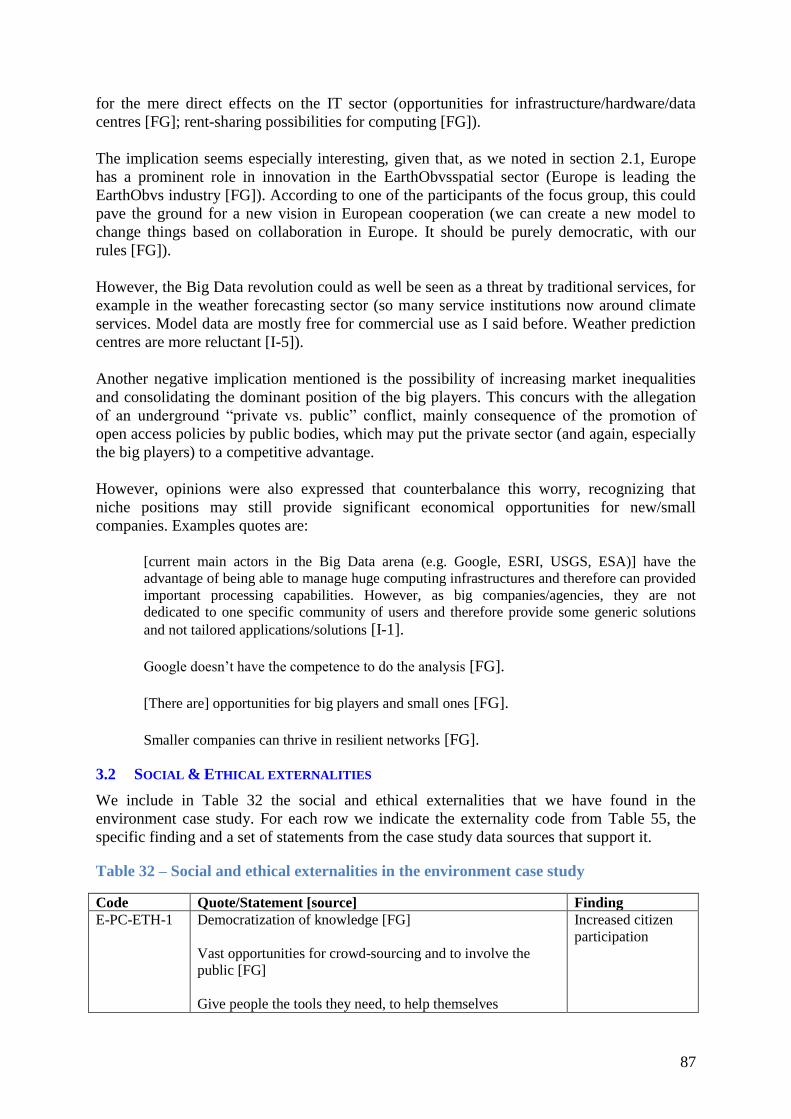
87
for the mere direct effects on the IT sector (opportunities for infrastructure/hardware/data
centres [FG]; rent-sharing possibilities for computing [FG]).
The implication seems especially interesting, given that, as we noted in section 2.1, Europe
has a prominent role in innovation in the EarthObvsspatial sector (Europe is leading the
EarthObvs industry [FG]). According to one of the participants of the focus group, this could
pave the ground for a new vision in European cooperation (we can create a new model to
change things based on collaboration in Europe. It should be purely democratic, with our
rules [FG]).
However, the Big Data revolution could as well be seen as a threat by traditional services, for
example in the weather forecasting sector (so many service institutions now around climate
services. Model data are mostly free for commercial use as I said before. Weather prediction
centres are more reluctant [I-5]).
Another negative implication mentioned is the possibility of increasing market inequalities
and consolidating the dominant position of the big players. This concurs with the allegation
of an underground “private vs. public” conflict, mainly consequence of the promotion of
open access policies by public bodies, which may put the private sector (and again, especially
the big players) to a competitive advantage.
However, opinions were also expressed that counterbalance this worry, recognizing that
niche positions may still provide significant economical opportunities for new/small
companies. Examples quotes are:
[current main actors in the Big Data arena (e.g. Google, ESRI, USGS, ESA)] have the
advantage of being able to manage huge computing infrastructures and therefore can provided
important processing capabilities. However, as big companies/agencies, they are not
dedicated to one specific community of users and therefore provide some generic solutions
and not tailored applications/solutions [I-1].
Google doesn’t have the competence to do the analysis [FG].
[There are] opportunities for big players and small ones [FG].
Smaller companies can thrive in resilient networks [FG].
3.2 SOCIAL & ETHICAL EXTERNALITIES
We include in Table 32 the social and ethical externalities that we have found in the
environment case study. For each row we indicate the externality code from Table 55, the
specific finding and a set of statements from the case study data sources that support it.
Table 32 – Social and ethical externalities in the environment case study
Code Quote/Statement [source] Finding
E-PC-ETH-1 Democratization of knowledge [FG]
Vast opportunities for crowd-sourcing and to involve the
public [FG]
Give people the tools they need, to help themselves
Increased citizen
participation

88
[FG]
Measures or tests of preparedness for communities [FG]
Outcome measures for community resilience [FG]
More realistic models of human behaviour under crisis [FG]
E-OC-ETH-1 Pervasive technology (human sensor), health will improve,
better handling of environmental causes of ill health [FG]
Liveability of urban systems enhanced [FG]
Quality of life (monitoring of air quality) [FG]
Enhanced quality of living caused by improved job
opportunities [FG]
Affordable climate resilience studies caused by enhanced
scalability [FG]
Lower price for resilience [FG]
Safe and
environment-
friendly operations
E-PC-BM-1 One of the positive externalities is improved decision making
for sustainability. We are now in the process of making
EOSystem better aligned to the needs of the big Post-2015
agendas in sustainable development and disaster risk
management, which will lead to many positive externalities,
including (hopefully) progress towards more sustainability,
more environmental safety, reduced disaster risk [I-2]
Tracking
environmental
challenges
E-OC-ETH-2 Better self-assessment profiles and templates enhancing
community awareness [FG]
Ability for individuals to be better aware of risks [FG]
Higher reliance [FG]
Increase awareness
about privacy
violations and
ethical issues of
Big Data
E-CC-ETH-1 Concerns over privacy (always being tracked) [FG]
Use of Big Data in urban settings; e.g., implications of using
cell phone data for crowd control [WS]
Continuous and
invisible
surveillance
E-OO-ETH-1
E-OC-ETH-7
Possible manipulation of visual representations of data [FG]
Need to formulate 3D and 4D ethics125 [FG]
Market
manipulation
Consumer
manipulation
E-PC-ETH-5
E-OC-ETH-11
Danger of predefined, pre-chewed questions [FG]
Less quality of data from crowdsourcing [FG]
Public reluctance to
provide
information
(especially personal
data)
E-OC-ETH-4 Leaving people behind, consequences of a digital divide [FG]
Potential pogroms caused by misuse of data [FG]
Discriminatory
practices and
targeted advertising
(as a result of
125 See also: http://3dok.info/WordPress3/gwf-2014-award-to-the-3d-ethics-charter-committee/?lang=en

89
Blame seeking behaviours, and “witch hunts” inhibiting
experiments [FG]
profiling and
tracking private
data)
E-OC-ETH-12 If you look at the social media, where it’s none authoritative
data, you have the possibility of creating false data and mess
up the total image, understanding of the situation. So you
have fraud and you have actors who deliberately want to
misinform, just for sabotaging even relating to the
environment you have political or economic interest and just
people for fun [I-3]
"Sabotaged" data
practices
On the positive side, a rather important social externality is the effectiveness of data-intensive
approaches in improving the governance of environmental challenges, supporting safe and
environment-friendly operations. This has implications on the robustness of the environment
to recover after stressing events (resilience), especially in urban context, as well as on the
actual quality of life and human health. A growing reliance on environmental data also
increases social awareness and participation, both by individuals and communities.
On the other side, big-brother-effect and manipulation, real or perceived, can be problematic.
In fact, as human society is an integral part of the environment, especially in urban context,
the fear of data abuse, privacy violation and the like, may hamper participation and
engagement and, for example, jeopardize crowdsourcing just where it could be the most
effective strategy.
More subtly, also excessive trust in data-intensive applications has been highlighted as a
possible negative implication, in that it would encourage the false believe that the dynamics
of the environment can be captured quantitatively, overlooking qualitative aspects that,
instead, remain fundamental to comprehend it, for the time being (Overconfidence in
technology [FG]; Quantified Earth (as in quantified self) may lead to a mind set whereby we
trust too much in data [FG]).
Whatever the quantity of data and metadata, and the complexity of theories and models, it
seems that a holistic approach is still necessary in the environment sector, to interpret them
(thinking too much about the data and the metadata, but not the question or knowledge which
is being sought [FG]).
3.3 LEGAL EXTERNALITIES
We include in Table 33 the legal externalities that we have found in the environment case
study. For each row we indicate the externality code from Table 55, the specific finding and a
set of statements from the case study data sources that support it.
Table 33 – Legal externalities in the environment case study
Code Quote/Statement [source] Finding
E-PO-LEG-2 Current privacy laws are hindering innovation [FG]
IPR concerns could slow down the process (no credit to data
provider), negative impacts on privacy (always tracked), Data
liability (data quality) [FG]
Some stakeholders don’t want to know because of potential
liabilities [FG]
Reduced
innovation due to
restrictive
legislation

90
There are also liabilities issues, especially for authorities.
They may take wrong decisions because of incorrect
information [FG]
Current laws are curtailing public use [FG]
Rules to regulate crowd sourcing, privacy issues [might
endanger the development] [I-2]
Open knowledge initiatives are hindered by intellectual
property rights [FG]
Better informed and precise legislation for environmental
protection, preservation (evidence-based legislation) [FG]
Potential new [legal] frameworks for novel market and
business models [FG]
E-PC-LEG-4 Inequitable loss of privacy [FG] – as data distribution is not
symmetric, some parties may be more exposed to privacy
abuse than others, e.g. e.g. individual citizens with respect to
corporations which hold information about them
Threats to data
protection and
personal privacy
E-PP-LEG-2 IPRs are a mess! This is a hindrance [FG]
How do you maintain legal compliance? With difficulty. We
employ a full time legal professional to give internal and
external advice [I-6]
Need to reconcile
different laws and
agreements, e.g.
"right to be
forgotten"
E-OC-LEG-4
E-PC-LEG-5
Legal reform is needed to preserve the commons of the data
IPR control is needed. Content creators are giving up data
authorship to Google and Facebook. A fair market needs
control in the middle [FG]
Members don’t currently “own” social media data [WS]
Threats to
intellectual
property rights
Threats to
intellectual
property rights
(including scholars'
rights and
contributions)
E-PO-LEG-1 Lack of definition about who can use the data [FG]
Lack of definition under which circumstances the data can be
used [FG]
Lack of norms for
data storage and
processing/use
The growing reliance on data in the environment sector is certainly highlighting many
shortcomings of the current legal frameworks, e.g. on IPR, privacy, authorization to use the
data. Potential problems are obviously more prominent when considering different
legislations. For example, the principle of full and open exchange of data, as promoted by the
EarthObvs Data Sharing Principles, is simply inconsistent with some of the current national
policies.126
126 Anna Donovan, Rachel Finn, Kush Wadhwa, Lorenzo Bigagli, Guillermo Vega Gorgojo, Martin
EarthObvsrg Skjæveland, Open Access to Data, BYTE Deliverable D2.3, BYTE Consortium, 30 September
2014.

91
Legal support for citizens in data-related issues is arguably going to become a public service,
in the future. Besides, incompatibilities in the legal frameworks in different countries are seen
as inhibitors that need to be adapted, in order to remove legal barriers.
Hence, as a possible positive outcome, the current trend for data-intensive applications in the
environment sector, prompting for better informed and more precise legislation, may lead to
new cross-boundaries legal frameworks, based on sound evidence.
3.4 POLITICAL EXTERNALITIES
We include in Table 34 the political externalities that we have found in the environment case
study. For each row we indicate the externality code from Table 55, the specific finding and a
set of statements from the case study data sources that support it.
Table 34 – Political externalities in the environment case study
Code Quote/Statement [source] Finding
E-PC-LEG-1 One may say that the openness of climate change data gives
the citizens the change to control whether politics react
adequately with respect to the threat [I-5]
Enhanced accountability [FG] – the managers of public good
can be held more accountable of their decisions, when they
have to base them on observations and measurements
Transparency and
accountability of
the public sector
E-CC-TEC-1 Enable many more countries and organisations to develop
sophisticated use of weather and climate data with increased
reach [I-6]
Democratization of knowledge about politics… [FG]
A strong participation of the public sector can help to make
environmental data, information and knowledge and the
services that give access into a public goods available to all [I-
2]
Benefit for planning, both rural development and urban [FG]
Effective design of infrastructure [FG]
Improved property values [FG]
Improved “surveillance” (government decisions on civil
infrastructure) [FG]
Evidence-based policy making, informed by Big Data [FG]
Support
communities and
governance
E-OO-DAT-2 Over-dependency on centralized computer services
Unintended effect will be like the emergence of Google Maps
who became a kind of standard application and this has forced
the entire community to develop applications as simple as
Google Maps. This can also capture a lot of users and what
happens if the system fails or is no more maintained? [I-1]
The guy who has control of the data has control of the whole
Dependency on
external data
sources, platforms
and services (due
to dominant
position of big
players)

92
value chain. The dangerous part is in the middle, the IT
infrastructure [FG]
E-OC-BM-8 Privatising the Commons [FG] – the increased use of data may
stimulate the private interest for assets that belong or affect the
whole of a community, such as communication infrastructures,
public knowledge bases, etc.
Privatization of
essential utilities
(e.g. Internet
access)
E-PP-LEG-1 Gravity information is not generally sensitive, but it is not
possible in Tibet (due to China). There are political issues in
China, Cyprus and Russia with EarthObvs data [FG]
EarthObvs political frictions - using environmental data to
justify sanctions against specific countries (exclusion), using
Big Data to meet specific political ends (e.g. pinpointing
natural resources of poorer countries for exploitation by richer
countries) [FG]
EarthObvspolitical
tensions due to
surveillance out of
the boundaries of
states
As a positive externality of Big Data in the environment sector, political decisions are
expected to be more transparent and accountable, since choices will have to based on
measurable and observable indicators. Policy making informed by scientific, data-grounded
evidence is also the main objective of EOSystem, summarized by the motto “for sound science
to shape sound policy”.
Negative externalities from the political viewpoint include the risk of depending on external
sources, particularly big players. Google was indicated as a specific element of concern, in
our fieldwork, for its demonstrated capacity to impose its commercial products as de facto
standards, causing an implicit vendor lock-in for their maintenance and evolution.
In addition to the technical problems mentioned in the previous sections, open access policies
are seen as possible means to mitigate these issues too (solution to political negative
externalities is to advocate for open access policies to ensure a more equal access. Or enforce
a minimum level access if not open [FG]).
The use of EarthObvsgraphical data was also indicated as a potential source of
EarthObvspolitical tensions, e.g. with regards to disputed or otherwise sensitive areas. Again,
this implication seems especially interesting, given that, as noted in section 2.1, Europe leads
the innovation in the EarthObvsspatial sector (Europe is leading the EarthObvs industry
[FG]). Hence, if appropriately leveraged, the shift to a more intensive use of data in the
environment sector may put Europe in a primary role on the EarthObvspolitical scene.
4 CONCLUSION
Big Data seems more of an incremental change than a major shift, in the environment sector.
In fact, the typical Big Data issues of Volume, Variety, and Velocity are considered inherent
to the environment sector. In particular, Variety seems to be a yet rising challenge, mainly
because of the current trends of direct citizen engagement, such as Citizen Science,
crowdsourcing, and VGI.
Solutions for the “quality” issues captured by the remaining V’s of Veracity, Value and
Validity have not gained much consensus, until now. The environment sector continues to be
highly fragmented from that regards, and even global endeavours such as EarthObvs keep a
cautious attitude towards quality.

93
In general, however, the sensation is that technicalities are not the main difficulties, but rather
issues of IPR, privacy, use, and other governance aspects that will require an overall shift of
mind set. Often surfacing in the debate on Big Data in the environment sector is the
perception that private and public interests are clashing, and that the enormous investment
already allocated (and the amount needed for the future) burdens on the community, while
being mostly reaped by the private sector.
As reported by the EOSystem Data Sharing Action Plan127, various data providers fear that
full and open exchange of data, metadata and products could be a threat to commercially
viable information. Further, many providers cannot see a clear articulation of a business
model linked to the adoption of the principle of full and open exchange. For these reasons,
many private operators are reluctant to provide open access to their data. This amplifies the
competitive advantage of the private over the public sector.
There are myriads of applications in the environmental sector. The scope of EOSystem spans
as many as nine area of societal benefits (Agriculture, Biodiversity, Climate, Disasters,
Ecosystems, Energy, Health, Water, and Weather), helping developed and developing nations
battling drought and disease, emergency managers making evacuation decisions, farmers
making planting choices, companies evaluating energy costs, and coastal communities
addressing concerns about sea-level rise.
Our fieldwork has highlighted many interrelated implications of data-intensive applications in
the environment sector, particularly as regards their impact on Society. Our analysis is
somewhat blurred and shows that most externalities have both positive and negative impacts
on Society. Our classification in economical, social & ethical, legal, and political externalities
is also somewhat arbitrary, as they often impact on multiple dimensions.
A conclusion we can reach is that Europe is leading innovation in the EarthObvsspatial sector
and should carefully leverage this leading position to play a primary role in the on-going shift
to a more intensive use of data in the environment sector.
127 Group on Earth Observations, EARTHOBVSSS Data Sharing Action Plan, EARTHOBVS-VII Plenary
document, Beijing, China, 3-4 November 2010.
https://www.earthobservations.org/documents/EarthObvs_vii/07_EARTHOBVSSS%20Data%20Sharing%20Ac
tion%20Plan%20Rev2.pdf

94
HEALTHCARE CASE STUDY REPORT
SUMMARY OF THE CASE STUDY
Big data utilisation is maturing in the public healthcare sector and reliance upon data for
improved efficiency and accuracy in the provision of preventive, curative and rehabilitative
medical services is increasing rapidly. There exists a myriad of ‘types’ of health data,
although the BYTE case study focuses on the use of genetic data as it is utilised by a public
health data driven research organisation, pseudonymised as the Genetic Research Initiative
(GRI), which is conducted within a health institute at a medical university in the UK. In the
healthcare sector, raw genetic data accounts for approximately 5% of the big data utilised.128
GRI facilitates the discovery of new genes, the identification of disease and innovation in
health care utilising genetic data. In doing so, GRI offers BYTE a unique case study of
societal externalities arising in relation to big data use, including economic, social and
ethical, legal and political externalities.
As this case study focuses on a health initiative that utilises big data for gene identification, it
involves stakeholders that are specific to the initiative, including data providers (patients,
clinicians), data users (health care professionals, including geneticists), enablers (data
engineers, data scientists and computational geneticists). Additional desktop research and
discussions at the BYTE Focus Group identified a number of additional stakeholders
involved with big data and healthcare more generally, both in the public and private sector,
including, for example, secondary stakeholders (pharmaceutical companies, policy makers).
Whilst this report does not present an exhaustive list of current and potential stakeholders
involved with big data in healthcare per se, the stakeholders identified in this report mirror
stakeholders involved in similar data initiatives within the sector and suggest prospective
stakeholders that are not yet fully integrated in big health data.
The data samples used, analysed and stored by GRI do not, in isolation, automatically
constitute big data, although there exists a number of opportunities to aggregate the data with
other similar health datasets, and/or all the genetic data samples at GRI, to form larger
datasets. However, the data samples are often combined for the purpose of data sequencing
and data analytics and require big data technologies and practices to aid these processes. The
aggregation of health data extends the potential reach of the externalities produced by the
utilisation of health data in such initiatives. For example, GRI’s research can lead to
improved diagnostic testing and treatment of rare genetic disorders and assist in
administering genetic counselling. GRI’s utilisation of genetic data also highlights when
more controversial impacts can arise, such as in the case of ethical considerations relating to
privacy and consent, and legal issues of data protection and data security for sensitive
personal data.
1 OVERVIEW
The Genetic Research Initiative (GRI) provides BYTE with an opportunity to examine the
utilisation of health data that raises a number of issues and produces a number of societal
impacts. GRI provides an important service to members of the community affected by rare
genetic disorders, as well as contributing to scientific and medical research. GRI comprises a
management team and an access committee, both of which are made up of clinicians and
128 “Big Data in Healthcare”, BYTE Focus Group, London, 10 March 2015.
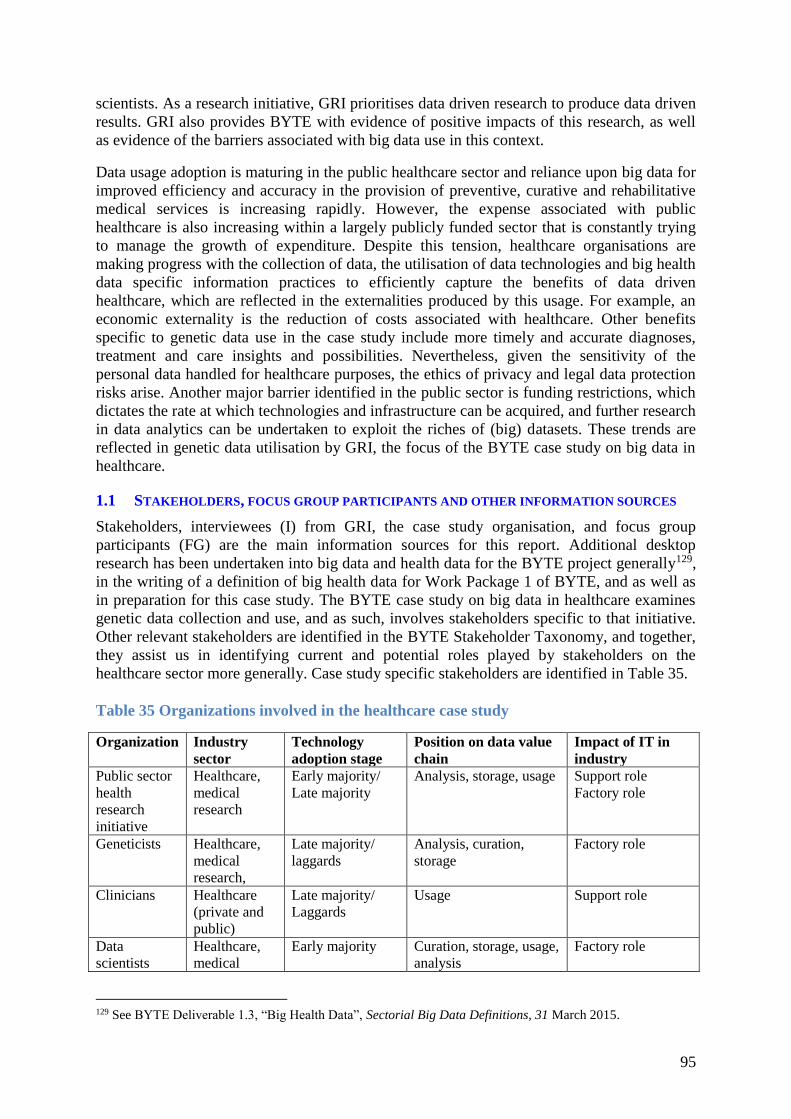
95
scientists. As a research initiative, GRI prioritises data driven research to produce data driven
results. GRI also provides BYTE with evidence of positive impacts of this research, as well
as evidence of the barriers associated with big data use in this context.
Data usage adoption is maturing in the public healthcare sector and reliance upon big data for
improved efficiency and accuracy in the provision of preventive, curative and rehabilitative
medical services is increasing rapidly. However, the expense associated with public
healthcare is also increasing within a largely publicly funded sector that is constantly trying
to manage the growth of expenditure. Despite this tension, healthcare organisations are
making progress with the collection of data, the utilisation of data technologies and big health
data specific information practices to efficiently capture the benefits of data driven
healthcare, which are reflected in the externalities produced by this usage. For example, an
economic externality is the reduction of costs associated with healthcare. Other benefits
specific to genetic data use in the case study include more timely and accurate diagnoses,
treatment and care insights and possibilities. Nevertheless, given the sensitivity of the
personal data handled for healthcare purposes, the ethics of privacy and legal data protection
risks arise. Another major barrier identified in the public sector is funding restrictions, which
dictates the rate at which technologies and infrastructure can be acquired, and further research
in data analytics can be undertaken to exploit the riches of (big) datasets. These trends are
reflected in genetic data utilisation by GRI, the focus of the BYTE case study on big data in
healthcare.
1.1 STAKEHOLDERS, FOCUS GROUP PARTICIPANTS AND OTHER INFORMATION SOURCES
Stakeholders, interviewees (I) from GRI, the case study organisation, and focus group
participants (FG) are the main information sources for this report. Additional desktop
research has been undertaken into big data and health data for the BYTE project generally129,
in the writing of a definition of big health data for Work Package 1 of BYTE, and as well as
in preparation for this case study. The BYTE case study on big data in healthcare examines
genetic data collection and use, and as such, involves stakeholders specific to that initiative.
Other relevant stakeholders are identified in the BYTE Stakeholder Taxonomy, and together,
they assist us in identifying current and potential roles played by stakeholders on the
healthcare sector more generally. Case study specific stakeholders are identified in Table 35.
Table 35 Organizations involved in the healthcare case study
Organization Industry
sector
Technology
adoption stage
Position on data value
chain
Impact of IT in
industry
Public sector
health
research
initiative
Healthcare,
medical
research
Early majority/
Late majority
Analysis, storage, usage Support role
Factory role
Geneticists Healthcare,
medical
research,
Late majority/
laggards
Analysis, curation,
storage
Factory role
Clinicians Healthcare
(private and
public)
Late majority/
Laggards
Usage Support role
Data
scientists
Healthcare,
medical
Early majority Curation, storage, usage,
analysis
Factory role
129 See BYTE Deliverable 1.3, “Big Health Data”, Sectorial Big Data Definitions, 31 March 2015.
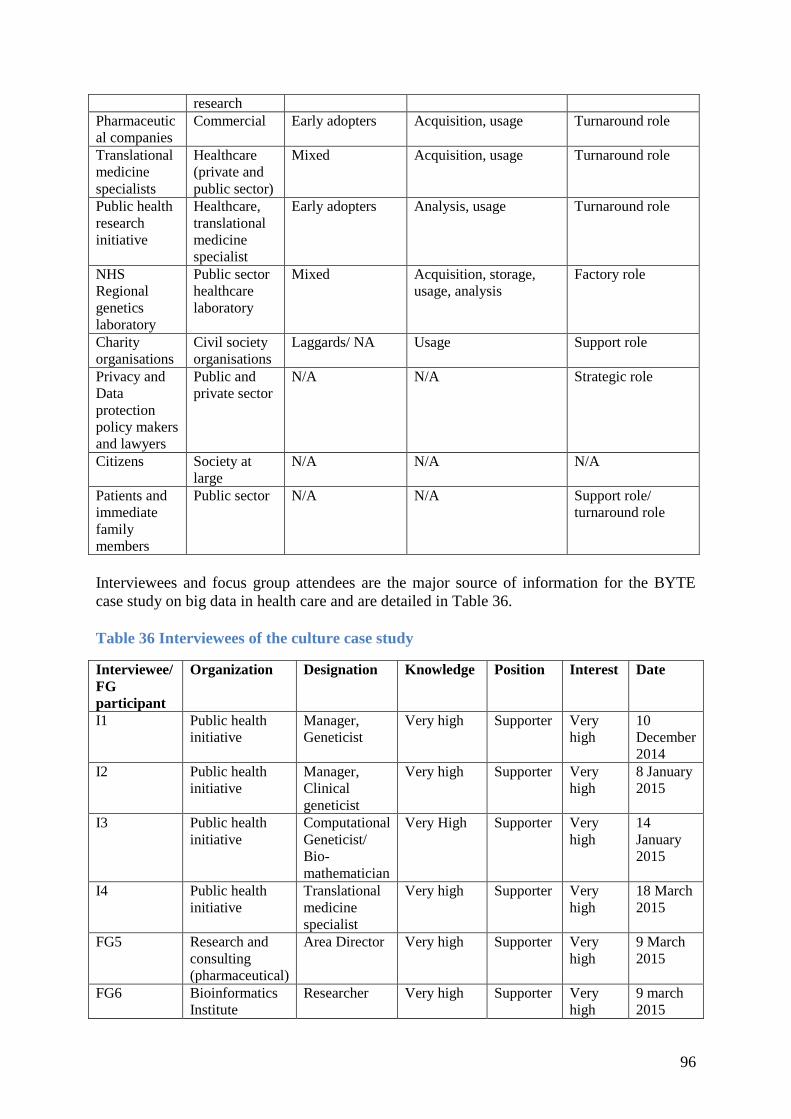
96
research
Pharmaceutic
al companies
Commercial Early adopters Acquisition, usage Turnaround role
Translational
medicine
specialists
Healthcare
(private and
public sector)
Mixed Acquisition, usage Turnaround role
Public health
research
initiative
Healthcare,
translational
medicine
specialist
Early adopters Analysis, usage Turnaround role
NHS
Regional
genetics
laboratory
Public sector
healthcare
laboratory
Mixed Acquisition, storage,
usage, analysis
Factory role
Charity
organisations
Civil society
organisations
Laggards/ NA Usage Support role
Privacy and
Data
protection
policy makers
and lawyers
Public and
private sector
N/A N/A Strategic role
Citizens Society at
large
N/A N/A N/A
Patients and
immediate
family
members
Public sector N/A N/A Support role/
turnaround role
Interviewees and focus group attendees are the major source of information for the BYTE
case study on big data in health care and are detailed in Table 36.
Table 36 Interviewees of the culture case study
Interviewee/
FG
participant
Organization Designation Knowledge Position Interest Date
I1 Public health
initiative
Manager,
Geneticist
Very high
Supporter Very
high
10
December
2014
I2 Public health
initiative
Manager,
Clinical
geneticist
Very high Supporter Very
high
8 January
2015
I3 Public health
initiative
Computational
Geneticist/
Bio-
mathematician
Very High Supporter Very
high
14
January
2015
I4 Public health
initiative
Translational
medicine
specialist
Very high Supporter Very
high
18 March
2015
FG5 Research and
consulting
(pharmaceutical)
Area Director Very high Supporter Very
high
9 March
2015
FG6 Bioinformatics
Institute
Researcher Very high Supporter Very
high
9 march
2015

97
FG7 Biological data
repositories
Company
representative
Very high Supporter Very
high
9 March
2015
FG7 University
research
institute
Researcher Very high Supporter Very
high
9 Marc
2015
FG8 Medical
University
Clinician,
Researcher
Very high Very
high
9 March
2015
FG9 University
medical research
institute
Researcher Very high 9 March
2015
The stakeholders of the BYTE case study are both drivers of the research and affected by the
results produced. We will examine their roles in the case study - the extent to which they
influence the process of data analytics in the discovery of rare genes - and the inter-
relationships between stakeholders. This analysis provides an overview of the logical chain of
evidence that supports the stakeholder analysis as GRI is reflective of how certain players in
the health data ecosystem can drive differing outcomes.130
1.2 ILLUSTRATIVE USER STORIES
The utilisation of big data driven applications in healthcare is relatively mature, although the
type of applications and the extent to which they are used vary depending upon the context in
which they are applied and the objective of their use. In the context of the BYTE case study
on big data in healthcare, the data applications employed are those that facilitate the
discovery of new genes and are specific to the process of genetic data analytics. The
following stories from the BYTE case study on big data in healthcare provide examples of
the usage, objectives and potential stakeholders involved with the health data ecosystem.
Research organisation - GRI
The research organisation acquires genetic data from clinicians who collect data samples
(DNA) directly from patients and their immediate family members. However these are
usually small in size and are aggregated to produce larger datasets once they have been
analysed. The data can potentially be combined with other similar datasets held by other
organisations and initiatives on open (or restricted) genetic or medical data repositories.
Whilst the primary focus of GRI is the identification of rare genetic diseases, there are
other varied potential uses of the data in terms of further public sector projects or by
pharmaceutical companies in the production of drug therapies. The research
organisation’s data usage initiatives can, however, be restricted by the pubic sector
funding environment. Also, all European organisations dealing with sensitive personal
data are subject to the requirements of the legal framework for data protection, which can
be a barrier to reuse of genetic data. Nevertheless, the research organisation facilitates the
use of health data in the pursuit of producing positive outcomes, not in the least
diagnosing disorders and contributing to findings in medical research.
Computational Geneticist/ Bio-mathematician
A Bio-mathematician or Computational Geneticist is responsible for carrying out the
research organisation’s data analytics by utilising genetic data specific software,
infrastructure and technology processes. A bio-mathematician performs a key role in
130 “Big Data in Healthcare”, BYTE Focus Group, London, 9 March 2015.

98
meeting the research organisation’s objective. The process of data analytics is largely
computer driven and heavily reliant on the data applications, analytics tools and specific
software. However, the specificity of the tools required means that they come at a great
expense to the organisation’s budget, leaving the bio-mathematician at the mercy of
shared resources and tools. This means that the speed at which data are analysed can be
delayed and can be one of the main challenges faced in this role. I3 elaborates on the role
of a bio-mathematician: “DNA gets sent to a company and they generate masses of
genomic data from that DNA and then I run it through on high performance computing
systems.”131 With respect to the volume of data processed, I3 adds:
I receive the data […] we would work with batches of up to about 100 samples. And each
sample generates […] about 10 GB of data per sample. So we are looking at about […] a
terabyte of data maybe, so that’s the kind of volume of data that were processing. As for
quality we have quality controls, so we can […] visualise how good the data is using
some software.132
Translational medicine specialists
Whilst the primary goal of the organisation’s initiative is to identify rare genes, there is
also a focus on translating research results into real benefits for patients foremost, and
society at large, by contributing to medical research and through the development of
treatments and/ or improved diagnostic testing, for example. In the long term, genetic data
research is also useful in the context of Pharmacogenomics, a strand of which is to
develop personalised medicine. Personalised medicine supports specific administration of
drug therapies that accord with the patient’s unique drug metabolism. This is a complex
process and is in its initial stages of adoption in the UK, where the BYTE case study is
based. I4 explains the process of utilising genetic data for this purpose:
Looking at the variants of genes that are relevant to drug metabolism for example… and
work out whether the patient is going to be responding to a particular drug or not…but
still very much working with the [GRI] data because that is the source of data […].133
2 DATA SOURCES, USES, FLOWS AND CHALLENGES
2.1 DATA SOURCES
The focus of the case study is a publicly funded research initiative with the primary objective
of identifying rare genetic diseases. As such, the primary data source is the afflicted patient,
and their immediate family members. DNA samples are collected from patients and
immediate family members by their primary clinician. This is ordinarily a straightforward
and routine process of blood collection:
when they see the family blood gets taken, and it gets stored in the regional genetics
laboratory, so this is sort of the NHS laboratory, they extract the DNA and they keep a copy
of it and it gets an ID number.134
Individual samples of genetic data acquired through a blood/ DNA test are not generally
considered big data. With reference to the volume of the data from each DNA sample: “it is
131 I3, Interview Transcript, 14 January 2015. 132 I3, Interview Transcript, 14 January 2015. 133 I4, Interview Transcript, 18 January 2015. 134 I1, Interview Transcript, 10 December 2015.

99
normally expected for each person to have around about between 15 and 20 gigabytes of data
comes back and that’s your raw data.”135 The raw data is returned in reverse format, to be
sequenced in two directions. However, individual samples are commonly aggregated with
other data samples to form what is considered big data. The total volume of data collected
and aggregated from patients and their family members is estimated to be:
we have got quite a sizable number of terabytes worth of data sitting on our server […] I
think 20 terabytes, but I don’t know if it’s […] we have got 600 files so if each file is about
works out about 40 gigabytes, and 600 times 4 […]and when we do the analysis we tend to
run some kind of programmes and look at the data quality and coverage and give us a
statistics that go about some sort of QC statistics with the actual raw data in.136
A subsequent source of data is genetic data repositories or other datasets held by related
medical institutions and/ or within the university to which GRI is linked. However, access to
these repositories would form part of additional research by analysing GRI’s newly acquired
data against data already held in these repositories to eliminate rare genes and genetic
mutations. It is only genetic data that is useful in this context as it enables the GRI clinicians
to compare their data against similar data when looking to detect genetic mutations or rare
genes that have not been identified by themselves or other related projects. Beyond the
context of GRI, big health data is increasingly held on open data repositories for use and re-
use largely for scientific research purposes, although GRI do not currently access them,
especially when a ‘trade’ of data is required. This is because GRI data use and re-use is
subject to the terms of consent agreed to at the initial point of data collection, and because the
primary focus is rare gene discovery. GRI data scientists and clinicians require specific
genetic data that they collect themselves or compare with data already collected and stored
in-house.
2.2 DATA USES
The main focus at GRI is the identification of rare genes, which is facilitated by
biomathematics pipeline. This pipeline describes the process of data analytics at GRI, from
collection to gene identification.137
The data are used for sequencing in the first instance. The data are then analysed by
comparison to previously identified genes, and then, results are produced in terms of either
finding a genetic mutation or the discovery of an unidentified gene. The results are relayed to
the primary clinician who discusses the diagnosis with the patient. Potential subsequent uses
in the context of GRI include further research into rare genetic disorders, as well as in the
context of translational medicine to produce outcomes that assist the patient. An emerging
area of research at GRI is conducting retrospective studies that determine whether clinical
decisions would have been made differently had they new information, so that they are made
differently in future.
Again, outside of GRI, there are a myriad of potential uses for big data in healthcare,
particularly in the commercial context of developing new drug therapies in collaboration with
pharmaceutical companies, or modifying or personalising insurance policies.138 GRI
however, focuses its uses in line with its primary mission of rare gene identification and the
provision of treatment and genetic counselling. Other re-uses of the data, particularly
135 I1, Interview Transcript, 10 December 2014. 136 I1, Interview Transcript, 10 December 2014. 137 I2, Interview Transcript, 8 January 2015. 138 FG5-FG9, “Big Data in Healthcare”, BYTE Focus Group, London, 9 March 2015.

100
monetising the data is not a primary goal of GRI, although it is a possibility and a focus of
other stakeholders, such as pharmaceutical companies.139
2.3 DATA FLOWS
GRI personnel undertake all the necessary work from data acquisition, QC preparation,
dispatch to whichever outsourced company is decided upon ensuring that the data is returned
and downloaded, analysed and stored securely. The flow of data in the context of the BYTE
case study on big data in health care involves a number of phases.
In the first phase, genetic data samples are collected from consenting patients who are
suspected of having a rare disease. The data are collected for this research once all other
avenues of diagnostic testing have been exhausted. Some quality control measures are
applied to the raw data are this stage of the process.
The next phase involves sequencing the data. The data samples are sent to a genetic
sequencing lab outside of Europe, in this case, Hong Kong, in accordance with patient
consent. This occurs once GRI has acquired at least 24 samples. Sequencing the genetic data
collected by GRI usually undergoes the following form:
By far the most common one at the moment is what we call XM sequencing. So that is that
you have human gene and more the DNA inside you, is basically is about 3 billion base pairs.
But only 1% of it actually codes for the proteins. And we know that in rare diseases over 80%
odd of them are caused by mutations that occur in the code sequence […] So the samples get
sent away, it normally takes about 2 months for the sequencing to be preformed, to produce
the raw data.140
Once the data are sequenced, the data, together with the results of the sequencing are returned
to the organisation for analysis. Roughly between 15 and 20 gigabytes of raw data per sample
are returned on a hard drive and put through an analysis pipeline that involves the following
steps that map the data back to the human genome to look for mutations or variants within the
dataset. I1 elaborates:
So your raw data then gets put into an analysis pipeline that we have here. And there are a
number of steps, which is mapping it back to the human genome and looking for mutations or
variants within that data set. And you produce after a number of these steps a file that is called
a Bam file […] I should say the raw data comes in a form in a reverse format […] So you
sequence in two directions, so your DNA is double stranded. So basically you take a chunk of
DNA and you start at point A and you sequence say 100 base pairs towards point B and then
you start at point B and you basically sequence 100 base pairs towards point A. And that
fragment is say, 300 base pairs long. So there is maybe 100 base pairs in […] so effectively
originally your raw data comes in the form of what fast Q files, and each one of those would
be say 10 gigabytes each, so that gives you 20 gigabytes. And then when you have done all
this transformation and recalibration and all this fancy work goes onto sort of the removal of
the artefacts, you are left with a file that’s around about again 20 gigabytes. But it’s combined
into one file. And then for the majority of the work that we use, we use a file that’s called a
VCF, which is variants file. And effectively what we are looking for, we are looking for
variants in the DNA compared, so where your DNA differs from the population norm.141
139 “Big Data in Healthcare”, BYTE Focus Group, London, 9 March 2015. 140 I1, Interview Transcript, 10 December 2015. 141 I1, Interview Transcript, 10 December 2015.

101
The data is processed by clinicians and then genome analysts who filter the data and look at
variations in the following process:
you will have the sample sequence aligned against a reference sequences and then we would
checked whether there are any differences in the patient’s sequence to the reference sequence.
So those differences points up either just normal variations that we all have but in our case we
are hopefully finding mutations that might caused the disorder that the patient has, if you see
what I mean.142
This step involves specific software and tools that increase the quality of the data.
Once the analysis has been undertaken, a rare gene is either identified or there is no such
result. As the research is not what is referred to as accredited then the GRI team then
collaborate with the NHS accredited diagnostic laboratories who will repeat the test and
validate the finding in a clinically relevant report. This last step is necessary to achieve
validation and subsequent recognition of the findings.
Findings are then referred to the treating clinicians who will then liaise directly with the
patient and provide or arrange for the provision of genetic counselling.
The data are stored on an internal and secure database. It is uncommon for the data to be
accessed for purposes other than the original purpose of collection, and/ or only in
accordance with the data subjects’ consent to the use of their data for additional research, and
in time, for aggregation with other data sets via health data (open or otherwise) repositories.
However, the latter has not been routine practice at GRI as it was initially considered outside
the scope of the research.
2.4 MAIN TECHNICAL CHALLENGES
GRI utilises roughly three main technologies.143 These technologies are designed specifically
for the analysis of genetic data and biomathematics. This means that, generally speaking, the
number of technological challenges are minimised. The challenges addressed below arise in
the context of GRI, although there are overriding challenges that were identified at the BYTE
Focus Group on big data in healthcare that may be present industry wide.144
Data acquisition
During the first phase of data collection, GRI does not experience any technology related
barriers as their data consists of DNA samples, which are acquired through traditional blood
testing techniques. However, GRI experienced an issue with capacity and storage when the
volume of data it acquired increased. This is discussed below.
Data curation, analytics and storage
Data processing at GRI is computer intensive, which raises a number of technical challenges.
With respect to data curation, analytics and storage, the main challenge faced by GRI
personnel was ensuring the data remained anonymised. GRI programmers developed a
database that supports data anonymisation, as well as data security for use by the GRI team.
142 I3, Interview Transcript, 14 January 2015. 143 I2, Interview Transcript, 8 January 2015. 144 For example, traditional approaches to recording health data do not support a search function, and health data
is often used for the sole purpose of its collection. However, technology to facilitate dual-usage is currently
being developed: “Big Data in Healthcare”, BYTE Focus Group, London, 9 March 2015.

102
In terms of data curation, GRI utilises bio-mathematicians and computer programmers to
develop additional databases to meet challenges as they arise. This is an evolving practice as
the volume of data held by GRI continues to increase. However, the challenges are minimised
somewhat by the fact that GRI deals only with genetic data, and challenges that do arise are
more commonly associated with the access to technologies that are limited in line with
resource availability. However, one challenge faced by GRI was making the data
interoperable across all its databases and some eternal databases. The current system
facilitates the dumping of the data, 5000 or 6000 exomes (part of the genome), in a single
server or multiple servers so that they may be called up at a later stage, as well hyperlinking
the data across all GRI databases. This met challenges faced by GRI with respect to
interoperability.
Other challenges faced by GRI related to identifying data samples in a systematic way. The
internal response was to develop a code for each sample that linked it to the project and the
individual from each family structure without enabling identification of the patient. This
Laboratory Information Management System (LIM System) and its relational database
provide an identifier for each sample, together wit relevant technological information, such as
the sample concentration and when the sample was sent for sequencing. GRI works with an
internal database of approximately 450 samples, but the LIM System allows clinicians and
data scientists to look on public databases for the frequency of their variants.145 The issues of
anonymisation and data security remain relevant throughout all phases of data handling.
Another challenge for the GRI team is gaining access to technologies as the data analysis is
computer intensive. However, this challenge is linked largely to a lack of resources. A GRI
biomathematician explains:
The main challenge I have is computing resources because if you imagine […] so when I said
say one sample is 10 GB, analysing it requires about 100 GB of space. And then I may have
100 samples, so we do use a lot of computing resources and we are collaborating with the
computer science department […] it is just is just hundreds and hundreds of what you think of
as computers […] all in one room and they’re all interlinked. So it makes it like a
supercomputer and so then we have access to that but a lot of people do because they share it
[…] but everyone who is using the resources get put into a queue. It is a big powerful
resource and it is the only way we could do the research. But sometimes you do get stuck in a
queue for a while, that’s my main hold up.146
Thus, this technical challenge is a result of restricted access to technologies resulting from the
limited resources.
Ultimately, the technical challenges faced by GRI have led to innovative solutions. These
solutions reflect a positive eternality of health data utilisation by this research initiative, and
are also addressed as an economic eternality below.
2.5 BIG DATA ASSESSMENT
The utilisation of big data in healthcare per se is maturing (including, structured, unstructured
and coded datasets), and the employment of big data technologies and practices are becoming
more widespread. Genetic data handled by GRI, makes up just a small percentage of health
145 I1, Interview Transcript, 10 December 2014. 146 I3, Interview Transcript, 14 January 2015.

103
data generally, in fact raw genetic data accounts for approximately 5% of the big data
utilised.147 However, there are vast amounts of health data generated, used and stored by
stakeholders in the healthcare sector per se, including the data held in human data repositories
or by health insurance companies for example.148 Despite increasing volumes of big health
data, individual samples of genetic data do not necessarily contend with the Gartner
definition of big data until they are aggregated with other samples. For example, in the first
instance, data sample sizes are in batches of up to about 100 samples, with each sample
generating about 10 GB to 20GB of data on a BAM file. However, the amount of aggregated
data is approximately one terabyte of data, which is more in line with ‘big’ data volume, and
becomes even bigger when combined with other reference datasets149. Big health data in the
context of GRI lies in combining smaller datasets to create larger datasets, and the potential
benefits that flow from this aggregation. Nevertheless, health data generally is considered to
represent big data in terms of its volume, variety and velocity.150
In terms of the velocity of the data utilised by GRI, the time is takes to process involves the
timing of two fundamental steps in the process, namely the sequencing of the data and the
data analyses. Sequencing of individual samples takes up to two months, whilst the in-house
analytics process takes 1 to 2 weeks. However, the practical reality of sharing resources
means that the analyses of the data samples can take up to 4 weeks. The time involved in this
process is subject to the availability of computing resources.151 Irrespective of the resource
constraints, the velocity of genetic data being that it is computer and time intensive indicates
that it conforms to the commonly accepted definition of big data.
The element of variety of the data was found to be negligible in the BYTE case study as GRI
focuses on one type of data, namely genetic data collected for a specific purpose. Whilst the
DNA sample potentially provides a wealth of information about each data subject, it is one
type of health data. The GRI team have it sequenced undertake data analytics for the sole
purpose of gene identification. Nevertheless, on a larger scale, the variety of health data
available across the industry is incredibly varied and in this context constitutes big data.
Overall, whilst the data utilised by the case study organisation represents just one type of
health data, the aggregation of the data samples, the time it takes to sequence and analyse it,
and the application of data specific tools and technologies provide insight into a live example
of big data utilisation in the public health sector.
3 ANALYSIS OF SOCIETAL EXTERNALITIES
Big data in healthcare produces a number of societal externalities, which in part are linked to
the inevitability of issues that arise in relation to the utilisation of big health data, which is
highly sensitive in nature. Externalities can be generally categorised as economic, social and
ethical, legal or political – see the list in Table 55. They can be positive or negative or both.
The BYTE case study on big data reflects externalities that are specific to that data driven
initiative examined. However, there arise other externalities in relation to the utilisation of
big data in healthcare generally that were identified at the BYTE Focus Group on big data in
healthcare.
147 FG5 – FG9, “Big Data in Healthcare”, BYTE Focus Group, London, 9 March 2015. 148 FG5 – FG9, “Big Data in Healthcare”, BYTE Focus Group, London, 9 March 2015. 149 However, GRI combines its data with internal reference datasets only. 150 FG5 – FG9, “Big Data in Healthcare”, BYTE Focus Group, London, 9 March 2015. 151 I3, Interview Transcript, 14 January 2015.

104
3.1 ECONOMICAL EXTERNALITIES
There are a number of economic externalities associated with the use of big data in
healthcare. One important result is cost saving for healthcare organisations that are gained
through more accurate and timely diagnoses and efficient treatments. This also means that
resources can be allocated more effectively. This is particularly important when dealing with
rare genetic disorders that may not otherwise attract the attention that disorders and health
issues affecting the wider population do. Where GRI is concerned, it can result in more time
for the patient to experiment with treatment and drug therapies who may otherwise pass
sooner.
In addition, the utilisation of big data in healthcare produces another economic externality in
that it potentially generates revenue especially through the development of marketable
treatments and therapies, and the innovation of health data technologies and tools. Data
driven innovation is constantly occurring. For example, a translational medicine specialist
suggests database development:
one of the things that we’ve been working on here is trying to develop a database of possible
deletions or duplications. And if they are of interest we would then follow up and try and
confirm whether they are real because the software and the data doesn’t allow that, if you see
what I mean […] as soon as we are confident that we have found something that would be
helpful, we would publish it and make it available definitely.152
Other innovative ways for creating commercial value (and adding social value) are also
suggested:
if you’re going to make the most of all of those data you need to be engaging industry and
creating a whole new industry actually, which has started to happen in this country. I found
that sort of an analysis company for the next generation sequence which is going to help
analyse this 100K Genomes data as they come online with some colleagues up in […]. And so
we are using exactly the same principles as we initially laid down for GRI so yeah that’s
working out well.153
Furthermore, GRI utilises a specific sequencing laboratory in Hong Kong. This specialist
laboratory is an example of a business model focused on generating profit through specialised
big data practices, in particular genomic sequencing. This business model is an example of an
economic externality produced by the utilisation of big data in healthcare. Furthermore, GRI
employ the specialist laboratory in Hong Kong because there is not an equivalent European
competitor. This indicates a gap in the European market, which can be addressed by relevant
stakeholders or indeed a public/ private sector collaboration to meet this demand. This is
linked to innovation, which is another positive economic externality produced by the
utilisation of big data in healthcare. GRI provides a number of technological innovations in
terms specifically designed tools and software to meet the technical challenges it has faced.
One such example is the development of tools to assist with reporting processes.154 Other
examples are identified above under the section on technical challenges.
152 I3, Interview Transcript, 14 January 2015. 153 I2, Interview Transcript, 8 January 2015. 154 I2, Interview Transcript, 8 January 2015.

105
Despite the positive economic impacts of big data utilisation in healthcare, research
initiatives, such as GRI that are publicly funded, are naturally subject to financial restrictions
and cost savings measures implemented by governments. This can be a hindrance to progress.
For example, GRI share the computing infrastructure with a department at UCL, and this
means that processing can be delayed from taking roughly 1.5 weeks with private equipment
to a 4 week time period when sharing computer resources.155 This represents both a technical
challenge and a negative economic externality for GRI. However, the GRI model could
potentially be funded by collaborations with private sector stakeholders, who could also
repurpose the data for commercially driven purposes. This could entail patenting new
technologies and tools for anonymised and secure genetic data analytics, as well as
collaborations for the development of drug therapies. However, as mentioned previously,
GRI’s primary focus is gene identification and commercially driven models are not yet in
place. This however remains a potential area for development within GRI. Nevertheless, GRI
contributes through potential cost savings in healthcare and by making a valuable social
contribution that cannot be measured in the traditional economic sense.
Table 37 Economical externalities in the healthcare case study
Code Quote/Statement [source] Finding
E-PC-BM-2 If you’re going to make the most of all of those data
you need to be engaging industry and creating a
whole new industry actually, which has started to
happen in this country. I found that sort of an
analysis company for the next generation sequence
which is going to help analyse this 100K Genomes
data as they come online with some colleagues up
in the Sanger Institute in Cambridge. And so we are
using exactly the same principles as we initially laid
down for GRI so yeah that’s working out well.156
There are economic
opportunities and costs savings
linked to innovative
approaches to data usage in
healthcare, especially in the
development of future
treatments, including
personalised medicine. This
will also result from
collaborations between public
sector and private sector
organisations.
E-PO-BM-2 One area for development as a potential business
opportunity is deal with the challenge of
interoperability of big health data.157
The situation beyond GRI is
that similar technology related
challenges arise and require
address. The means by which
these challenges can be
addressed are often gaps in the
market for innovative business
models and the development
of tools that achieve
commercial viability for
innovators.
155 I3, Interview Transcript, 14 January 2015. 156 I2, interview Transcript, 8 January 2015. 157 FG5 – FG9, “Big Data in Healthcare”, BYTE Focus Group, London, 9 March 2015.
106
3.2 SOCIAL & ETHICAL EXTERNALITIES
Social
There are a number of positive social externalities that are a direct result of big data in
healthcare. GRI provides examples of these. The identification of rare genetic disorders
provides treatment opportunities for the patient, as well as more effective diagnostic testing
for future patients and a greater understanding of rare genetic disorders generally. In addition,
analyses of genetic data enables treating clinicians to provide a range of other healthcare
services for family members, including genetic counselling and assisting parents of the
affected (child) with natal counselling and carrier testing, as well as assisting in identifying
genetic metabolic conditions. Without this sort of data analytics, therapeutic remedies may
not be identified and administered. For example, in the case of a patient who travels to
London to take part in GRI research, they will receive the following treatment benefits:
So we will liaise with the local regional genetics team and get them to be seen by a clinical
genetics or counsellor up there, who will then take them through the report and say look we
have made this diagnosis. This is the implication of having this disease and this is what we
think in the way of prognosis and then we also can provide things such as prenatal testing
from that, gene discovery. We can provide carrier testing for other at risk members in the
family. And in some cases, sort of sometimes metabolic conditions, you can fairly quickly
identify possible therapeutic remedies for those patients […] Then those will be the
immediate benefits I would say […].158
Beyond the initial purpose for the data collection, there is limited or no re-use of that data
currently This mainly due to the legal and ethical issues raised by that re-use and because
GRI’s primary focus is patent care through rare gene identification. Furthermore, GRI’s re-
use of the genetic data is restricted to the extent to which data subjects (patients and family
members) have consented to it. To date, re-use of genetic data held by GRI has extended to
further research of rare genes it has identified that has involved:
you can usually find someone across a very large organisation who might have an interest in
the gene that is discovered for a disease. So then you may be able to entice that particular
research group to be able to take it further or they might already have a project going forward
on that particular gene […] So what I’m saying is that it doesn’t just stop at gene
identification it goes right the way through to some kind of functional investigation, further
functional investigation with a view of being able to understand what does that gene do.159
However, data re-use may become a stronger focus in the future, which is supported by
GRI’s broadening consent policy160 for the purpose of producing additional benefits for
patients and society. There will likely be an increase in focus on research for the purpose of
developing personalised medicine treatments, which focuses on improved treatment based on
patient drug metabolism. The potential social (and economic) externality associated with this
is the development of new therapies and (cost-effective) efficient approaches developed and
implemented by clinicians, medical researchers and pharmaceutical companies that have the
potential to reach a broader patient network, and aid the health of society at large.
Nevertheless, whilst the positive social impacts of re-using data held by GRI are obvious,
ethical considerations will remain at the forefront of any policies supporting the repurposing
of genetic data, especially as it is sensitive personal data.
158 I1, Interview Transcript, 10 December 2014. 159 I2, Interview Transcript, 8 January 2015. 160 I2, Interview Transcript, 8 January 2015.

107
Beyond the context of GRI, participants at the BYTE Focus Group on big data in healthcare
identified a number of positive social externalities, including: better decision-making;
improved knowledge sharing; the identification of good medical practices; and the combining
of different health data to produce a positive social impact. Nevertheless, the utilisation of big
data in healthcare is thought to potentially produce a number of negative externalities as well,
although these were not a product of the GRI component of the case study. Potential negative
externalities linked to the utilisation of big data in healthcare include: the over-medicalization
of an otherwise healthy population; and/or discrimination based on the stratification on
genotype or in relation to health insurance policies. 161
Table 38 Social externalities in the healthcare case study
E-PC-TEC-1 […] we are collaborating with another researcher and he is
trying to build a big database based on the genomic data that
we have […] and it may help connect clinicians and improve
their understanding of inherited disorders as well.162
The sharing of big
health data assists
in understanding
rare genetic
disorders, which in
turn, provides
members of society
with an increased
understanding and
potential treatment.
E-PC-BM-2 […] it’s about really being able to understand far greater what
the functional consequences of mutation are. And then what
can we do to try and alleviate those problems. And the idea is
one, can you develop treatments to help treat that to alleviate
the symptoms to some degree. And ultimately can you then
find something…some sort of gene transfer or some kind of
technology where you can actually alleviate prevent the disease
from occurring in the very first place […] So if you can find a
diagnosis and you get it much earlier, the earlier you can get it,
the earlier you can start treatments. And hopefully by doing
that, a lot of times you can prevent a number of these diseases
from occurring.163
The social impact
of GRI’s utilisation
of big health data is
an overwhelming
externality of the
case study.
E-PC-BM-2 Big health data will lead to be better informed decision making
that will have a positive impact on citizens’ treatments and
overall health care. Being able to analyse all health data from
different sources will enable the identification of “good”
medical practices and decision-making processes that can be
adopted by other professionals.164
Big data will, in
general, have a
positive impact on
the entire health
care system.
Ethical
Ethical externalities are largely associated with issues pertaining to patient (and family
member) privacy, and the discovery of incidental findings, especially when these findings are
negative. These concerns are purportedly addressed by the terms of consent contained within
the GRI consent form. However, anonymity cannot be guaranteed because, “practically
161 FG5-9, “Big Data in Healthcare”, BYTE Focus Group, London, 9 March 2015. 162 I3, Interview Transcript, 14 January 2015. 163 I3, Interview Transcript, 14 January 2015. 164 FG5 – FG9, “Big Data in Healthcare”, BYTE Focus Group, London, 9 March 2015.

108
speaking and irrespective of the anonymisation processes involved, patients are, by the rarity
of the disease, more likely to be identifiable.”165 The extent of the terms to which consent is
required has broadened over time because potential uses of data are ever evolving in line with
technological developments. However, there remains contention surrounding the potential
breadth of the consent form insofar as the inequality of the parties consenting. It is feared that
patients and their family members are likely to consent to any terms for re-use of their data
because it is difficult for them to otherwise fund the extensive analytics or gain assistance
with their disorder.
Incidental findings are another ethical externality related to GRI research. Incidental findings
are the health issues (unrelated to the purpose of the testing) that are discovered when data is
analysed. For example, cancer genes may be discovered alongside the identification of rare
genes or other genetic mutations. Whilst this is covered in the GRI consent form, the findings
remain a source of contention between researchers and clinicians. The latter generally insist
on not relaying these incidental findings to the patient and their family members, which
represents an ethical dilemma. Incidental and non-promising findings were raised as a
negative externality on the utilisation of big data in healthcare at the BYTE Focus Group.
Participants discussed this in the context of how “non-promising” findings should be dealt
with as it presents an increasingly relevant ethical dilemma for researchers and clinicians.166
This remains a real issue for select stakeholders – patients, clinicians and researchers.
However, with the example of GRI, the work carried out by that organization is subject to
vigorous ethical controls implemented by the academic institution it is connected to. These
guidelines are specifically designed to respond to ethical questions that arise in relation to use
and re-use of sensitive personal data. Furthermore, GRI’s research is monitored by a research
ethics committee and from whom GRI requires ongoing ethical approval for gene discovery
and consent.
Table 39 Ethical externalities in the healthcare case study
Code Quote/Statement [source] Finding
E-OC-ETH-10 Data are going to be held on a database here and we may use
that data anonymously for quality control, for improving our
pipeline, our software and that sort of thing. So we get
patients to sign that obviously. We have now added in
recently another clause, which says the patients […] we may
even be working with industry on this. Because it maybe that
a commercial outfit want to develop a companion diagnostic
tool or even therapies based on the information that we get
from their genome or their external data.167
The issue of
consent broadens in
line with potential
uses opened up by
emerging
technologies.
E-OC-ETH-2 It’s a strange scenario because what you find in all the
research that tends to happen is that the patients are very
much of the thought process that it’s their data. It’s their data
so you give them back their data or you tell them about it.
And if there is something there, then they want to know […]
it’s really strange bizarre scenario because the people who
are most against it, are […] the people who actually work
with the patients […].168
Incidental findings
have been a
longstanding issue
of contention
between clinicians
because it raises
important ethical
questions.
165 I2, Interview Transcript, 8 January 2015. 166 FG5-9, “Big Data in Healthcare”, BYTE Focus Group, London, 9 March 2015. 167 I2, Interview Transcript, 8 January 2015. 168 I1, Interview Transcript, 10 December 2014.

109
E-OC-ETH-2 So in our own consent we never say that data will be fully
anonymous. We do everything in our power so that it is
deposited in a anonymous fashion and again this part of our
governance where you only have two or three at the most
designated code breakers if you like who have actually have
access to that married up information. But having said that
the patient […] when we consent we are very careful in
saying look it’s very unlikely that anyone is going to actively
identify information about you […].169
Given the rarity of
diseases and
genetic disorders
being identified, it
is impossible to
assure anonymity.
3.3 LEGAL EXTERNALITIES
Health data is by its very nature sensitive data and defined as sensitive personal data under
the European data protection framework and thereby implicating a number of related issues.
The data subjects are primarily children, which means valid and informed consent is required
from their parent/s or guardian/s. This issue can be compounded in light of the extent of
consent required. For example, consent is not only required in relation to the initial collection
of data, but is required for all subsequent use and handling, as well as foreseeable outcomes,
such as incidental findings.
A major issue that produces legal externalities is data anonymisation. Anonymisation is a
legal requirement. GRI personnel have developed an internal database to ensure
anonymisation. More generally in relation to the data protection compliance, a GRI geneticist
observes:
it’s something that becomes second place really in laboratories now […] But so we will have
an ID for the sample that gets sent away and that’s normally just the sequential list of…so we
sent out stuff to BGI, so it goes from BGI 1 to BGI 300 now. And then that has got no
relevance to the sample itself and they are all different. The data itself when it comes back is
all on hard drives which goes into a locked storage cabinet […].170
The issue of data protection and information privacy is at he forefront of the minds of those
handling sensitive personal data at GRI:
as it is patient data we are very careful with it. It is kept in a secure locked place, there is no
access to this data apart from me and from people in my office. The data itself, the names of
the files or whatever bear no relationship whatsoever with the names of the patients. Those
kinds of systems of security are in place, if you see what I mean.171
These issues call for the development of adequate protections that balance the right to
personal data protection whilst fostering innovation in the digital economy. In that regard,
participants at the BYTE Focus Group on big data in health care observed:
Big data demands the development of new legal frameworks in order to address externalities
such as discrimination, privacy and also enhance and formalise how to share data among
countries for improving research and healthcare assistance.172
169 I2, Interview Transcript, 8 January 2015. 170 I1, Interview Transcript, 10 December 2014. 171 I1, Interview Transcript, 10 December 2014. 172 FG5-9, “Big Data in Healthcare”, BYTE Focus Group, London, 9 March 2015.

110
Although the necessity of improved legal frameworks was initially viewed as a negative
externality, it can also be seen as a positive externality associated with big health data as it
illuminates the potential of data sharing in the healthcare sector.
Data security preservation is also routinely adhered by building security enhancing
mechanisms into the software and tools implemented. What this means, is that the technology
has been developed in accordance with the relevant legal requirements. Furthermore, the
genetic data held by GRI is ‘under lock and key’, which entails “passwords and encryption
and there is a physical and hard drives, external hard drives that are also under lock and key
as well.”173 Data security and anonymisation are also overseen by a departmental data
protection officer. Subsequent use of the data is also heavily monitored, even in the case of
anonymisation. For example, if GRI would want to contribute their research data to an open
data repository for further research, the GRI team would need to apply for, and be granted
approval of this. Although these measures ensure compliance with standard data protection
requirements, they can also hinder further research, which in turn, could lead to new
developments and treatments. For example, at this stage, the data held by GRI is entered onto
internal databases only to minimise any potential liability. However, this means that the data
is not available for re-use by other experts or researchers who could potentially utilise the
data for medical progress.
Lastly, threats to intellectual property rights can arise in relation to subsequent uses of big
health data, such as in relation gene patenting (and licensing) of new drug therapies, or if it
were to be included in works protected by copyright. Additional concerns that arise in
relation to big health data are data hosting and reproducing copies of the data. These are not
currently relevant to the work undertaken by GRI as they are outside the initiative’s
objectives of rare gene identification for patient care and treatment. They are however topical
in relation to big health data generally, as observed by participants at the BYTE Focus Group
on big data in healthcare.
Table 40 Legal externalities in the healthcare case study
Code Quote/Statement [source] Finding
E-PC-LEG-4 […] as it is patient data we are very careful with it. It is kept in
a secure locked place, there is no access to this data apart from
me and from people in my office. The data itself, the names of
the files or whatever bear no relationship whatsoever with the
names of the patients. Those kinds of systems of security are in
place […].174
Anonymity is at the
forefront of
researchers’ minds
and the
requirements under
data protection
framework have
been fundamental
in researchers
implementing
methods of
compliance.
E-PC-LEG-4 They’ll have a code that they’ll use that’s completely
anonymous to anyone else […] The ones that come from
actually the diagnostic laboratory come with a name and then
you need ID. And it’s something that obviously for us it’s very
important that we don’t relate the patient details to the actual
Procedures are in
place. This is not as
big of an issue as
previously
anticipated, and it
173 I3, Interview Transcript, 14 January 2015. 174 I3, Interview Transcript, 14 January 2015.

111
sequence data. So it’s something that we have being working
on for probably about a year now is, we hired a programmer
[…] all our samples now, we have just finished making it
basically have all got a unique identifier that the data that gets
sent off to the sequencer, that’s just a completely random code,
that has no information about the patients. So we always keep
the patients and the actual ID of the sample totally separate,
they are completely different files. So you couldn’t join the
two of them up, which is really important.175
is an issue at the
forefront of
research institutes
dealing with health
data.
3.4 POLITICAL EXTERNALITIES
Political externalities did not arise specifically in relation to GRI, aside from the relationship
between partisan priorities and funding that impacted upon access to technologies, as
discussed above. However, participants at the BYTE Focus Group on big data in healthcare
identified the following relevant political externalities: improved decision making and
investments in healthcare were identified as positive political externalities produced by big
data utilisation in healthcare; and conversely, the need to develop policies addressing
potential discrimination following the use of big health data was identified as a negative
externality.176
Table 41 Political externalities in the healthcare case study
Code Quote/Statement [source] Finding
E-PP-LEG-3 The availability of big amounts of data will enable politicians
to have more information about different situations in the
health sector and thus a better understanding that may lead to
improve their decision-making and increases the investments
in healthcare. 177
Healthcare is an
important political
issue.
4 CONCLUSION
The BYTE case study focuses on GRI, which reflects the maturing state of big data utilisation
in the public healthcare sector for improved efficiency and accuracy in the provision of
preventive, curative and rehabilitative medical services. There exists a myriad of ‘types’ of
health data, although the BYTE case study organisation deals with genetic data only. Data in
the form of genetic samples are collected from individual patients and immediate family
members, which are later analysed primarily for diagnostic and treatment purposes. In the
case of genetic data utilised by GRI, each individual sample is by itself not likely to be
considered big data, although the aggregation of data samples requiring big data practices and
applications for analyses represents big data as it is conventionally understood.
GRI is an example of when a public sector research initiative can produce societal
externalities as a result of big health data utilisation, despite being restricted in the volume
and variety of data it deals with. These externalities are produced indirectly to pursuing the
primary objectives of rare gene identification for improved diagnoses, patient care and
175 I1, Interview Transcript, 10 December 2014. 176 FG5-9, “Big Data in Healthcare”, BYTE Focus Group, London, 9 March 2015. 177 FG5-9, “Big Data in Healthcare”, BYTE Focus Group, London, 9 March 2015.
112
treatment. The evidence of big health data in practice provided by the GRI case study is
supplemented by discussions at the BYTE Focus Group on big data in healthcare.
GRI illuminates the roles played by a number of stakeholders that are vital to the initiative.
The case study also enables us to identify the growing list of potential stakeholders involved
in big data utilisation across the healthcare sector generally, especially where innovations and
new business models can be developed and employed to handle big health data, and where
stakeholders can collaborate to pursue other externalities such as drug development.
Overall, this case study highlights a number of positive societal externalities that flow from
genetic research and rare gene identification, which is facilitated through the utilisation of big
health data. GRI also allows us to witness the potential impacts of a data driven initiative in
terms of producing additional and specific economic, political and legal externalities. GRI’s
utilisation of genetic data also highlights when more controversial impacts can arise, such as
in the case of ethical considerations relating to privacy and consent, and legal risks associated
with data protection and data security.
Moreover, GRI provides examples of the practical reality of big health data utilisation in the
public sector, and the technical challenges that are faced by the GRI team. However, in
addition to being challenges, they present opportunities for stakeholders to innovate to
address them through the implementation of new business models or by improving tools and
technologies implemented for big health data utilisation. The effect of this innovation is
likely to be a continual increase in data utilisation across the healthcare sector. This will then
translate into real benefits for patients, as has been the case with GRI where improvements in
diagnostic testing, genetic discoveries and developments with genetic counselling have been
achieved. Beyond the context of the BYTE case study organisation, these benefits can be
transferred to society at large through increased understanding of rare genetic disorders and
tailored treatments and therapies.

113
MARITIME TRANSPORTATION CASE STUDY REPORT
Maritime transport is essential to the development of international economic activities, by
providing a backbone for the exchange of goods. Despite its importance, the maritime
industry does not attract much attention. In this case study, we have interviewed
representatives of the majority of the actors in the industry. Based on these interviews we
have identified barriers and enablers for adopting data centric services, which in turn were
used to identify societal externalities in the Maritime industry. We point out, that this task is
very subjective with respect to our background and understanding of the maritime industry.
Additionally, due to the vague (i.e., hard to quantify) nature of this task (i.e., identify societal
externalities) we could not create a clear mapping between maritime specific externalities and
the project-wide predefined externalities. According to our analysis, it seems that
externalities caused by data utilisation are very low or non-existing. In addition, the shipping
sector regards externalities as very unimportant as long as they do not affect their business.
1 OVERVIEW
The shipping business is essential to the development of economic activities as international
trade needs ships to transport cargoes from places of production to places of consumption.
Shipping in the 21st century is the safest and most environmentally benign form of
commercial transport. Commitment to this principle is assured through a unique regulatory
framework adopting the highest practicable, globally acceptable standards that have long
pervaded virtually ship construction and all deep sea shipping operations. Shipping is
concerned with the transport of cargo between seaports by ships, where it is generally
acknowledged that more than 90% of global trade is carried by sea. Despite of shipping’s
importance to international trade, the maritime industry goes usually unnoticed, due to the
following factors:
Low visibility: In most regions, people see trucks, aircraft and trains, but not ships.
Worldwide, ships are not the major transportation mode since numerous large
organizations operate fleets of trucks and trains, but few operate ships.
Less structured planning: Maritime transportation planning encompasses large
variety of operating environments that require customization of decision support
systems and makes them more expensive.
Uncertainty: Ships may be delayed due to weather conditions, mechanical problems
and strikes (both on board and on shore), and in general, due to economic reasons,
very little slack is built into their schedules.
Long tradition and high fragmentation: Ships have been around for thousands of years and
therefore the industry is characterized by a relative conservative attitude being reluctant to
new ideas. In addition, due to the low barriers to entry there are many small, family owned
shipping companies, which are not vertically integrated into other organizations within the
supply chain.
We tried to get interviews with the different stakeholders as possible, see Section 1.1. The
interviews were mainly telephone conferences typically lasting one hour. An interesting
observation is the general, rather negative, attitude of ship owners towards being interviewed
about externalities. They consider externalities originating in the use of (big) data as either
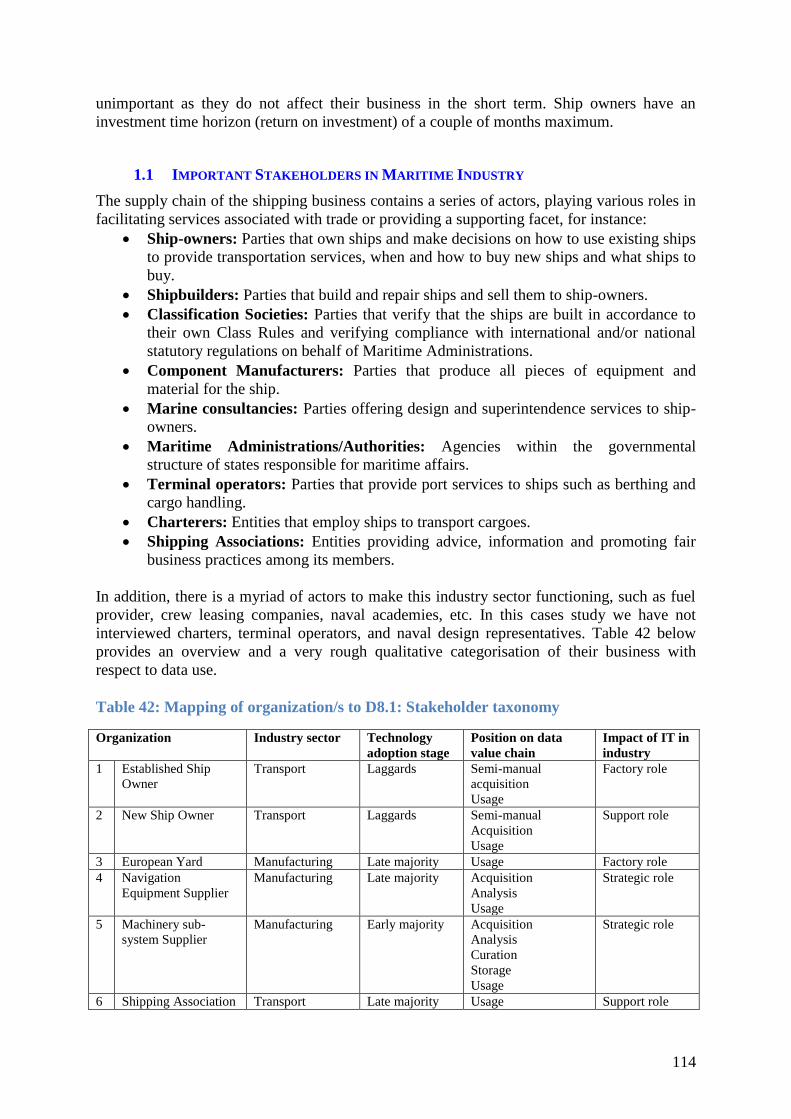
114
unimportant as they do not affect their business in the short term. Ship owners have an
investment time horizon (return on investment) of a couple of months maximum.
1.1 IMPORTANT STAKEHOLDERS IN MARITIME INDUSTRY
The supply chain of the shipping business contains a series of actors, playing various roles in
facilitating services associated with trade or providing a supporting facet, for instance:
Ship-owners: Parties that own ships and make decisions on how to use existing ships
to provide transportation services, when and how to buy new ships and what ships to
buy.
Shipbuilders: Parties that build and repair ships and sell them to ship-owners.
Classification Societies: Parties that verify that the ships are built in accordance to
their own Class Rules and verifying compliance with international and/or national
statutory regulations on behalf of Maritime Administrations.
Component Manufacturers: Parties that produce all pieces of equipment and
material for the ship.
Marine consultancies: Parties offering design and superintendence services to ship-
owners.
Maritime Administrations/Authorities: Agencies within the governmental
structure of states responsible for maritime affairs.
Terminal operators: Parties that provide port services to ships such as berthing and
cargo handling.
Charterers: Entities that employ ships to transport cargoes.
Shipping Associations: Entities providing advice, information and promoting fair
business practices among its members.
In addition, there is a myriad of actors to make this industry sector functioning, such as fuel
provider, crew leasing companies, naval academies, etc. In this cases study we have not
interviewed charters, terminal operators, and naval design representatives. Table 42 below
provides an overview and a very rough qualitative categorisation of their business with
respect to data use.
Table 42: Mapping of organization/s to D8.1: Stakeholder taxonomy
Organization Industry sector Technology
adoption stage
Position on data
value chain
Impact of IT in
industry
1 Established Ship
Owner
Transport Laggards Semi-manual
acquisition
Usage
Factory role
2 New Ship Owner Transport Laggards Semi-manual
Acquisition
Usage
Support role
3 European Yard Manufacturing Late majority Usage Factory role
4 Navigation
Equipment Supplier
Manufacturing Late majority Acquisition
Analysis
Usage
Strategic role
5 Machinery sub-
system Supplier
Manufacturing Early majority Acquisition
Analysis
Curation
Storage
Usage
Strategic role
6 Shipping Association Transport Late majority Usage Support role
115
7 Maritime Consulting
Company
Transport Early adopter Analysis
Usage
Turnaround role
8 Classification Society Transport / Legal Early majority Acquisition
Analysis
Curation
Storage
Usage
Strategic role
9 Natl. Coastal
Authority
Legal Early adopter Acquisition
Storage
Usage
Turnaround role
Table 43 provides the identification of the various actors that were interviewed and the
knowledge of the interviewee.
Table 43: Profiles of the interviewees of the case study, according to Deliverable D8.1:
Stakeholder taxonomy
Interviewee Organization Date Knowledge Position Interest
1 Established
Ship Owner
18/03/2015 Very high Senior Business
Manager
Low
2 New Ship
Owner
09/03/2015 Very high Senior Technical
Manager
Low
3 European
Yard
18/02/2015 Very high Senior Technical
Manager
Average
4 Navigation
Equipment
Supplier
17/02/2015 Very high Senior Business
Manager
Very high
5 Machinery
sub-system
Supplier
21/11/2014 Very high Senior Technical
Manager
Very high
6 Shipping
Association
05/03/2015 Very high Senior Technical
Manager
Low
7 Maritime
Consulting
Company
12/03/2015 Very high Senior Business
Manager
High
8 Class Society 15/10/2014 Very high Senior Academic Very high
9 Natl. Coastal
Authority
11/02/2015 Very high Senior Technical
Manager
Very high
10 Maritime
focus group
17/04/2015 Very high NA Very high
1.2 ILLUSTRATIVE USER STORIES
The utilisation of (big) data driven applications in shipping varies largely dependent on the
different maritime actors. The following stories are representative illustrations about
generally encountered opinions:
Ship-owners. The main interest of ship owners is to provide competitive
transportation offerings. Data they need for their daily operations is therefore on a
quite aggregated level, i.e. fuel consumption, emission reporting, arrival scheduling
etc. The ship crew is responsible for smaller maintenance tasks, optimization and
handling of the ship. The needs for data handling cannot therefore fall under ‘Big
Data’; additionally data collection is performed manually into forms, i.e., noon
reports. Few companies have established pilot cases and then only on a small fraction
of their fleet to investigate automatic collection of aggregated data.

116
Shipping Associations. They do not have big data, nor are they keen on obtaining it.
Their focus is on information sharing (on an aggregated level) and on contractual and
commercial arrangements. Their concern is also on potential misuse of that data
through industrial espionage.
Administrations/Authorities. Coastal authorities are mainly interested in aggregated
data from ships such as environmental pollution, info about cargo, and data that is
used by customs authorities. These data originate from the vessels noon reporting of
manual reporting when entering national waters. Over the last years, an automatic
ship identification transmitter (AIS) has become mandatory for all vessels above 300
GT. Data about position, speed, heading, etc., are automatically transmitted to land
depending on the ships speed, i.e. between 2 sec and 30 sec. These data are used by
the vessel traffic systems in traffic surveillance and control. AIS data is aggregated,
i.e., on a 6 min or 10 min time basis, and made available to the public.
Consultancy. Shipping contracts are used to get an indication of how
cheap/expensive a particular shipment is. Container pricing benchmarking service has
had a significant impact on the container shipping market and it makes suddenly the
pricing structure transparent and globally available. Therefore, some of the large price
fluctuation has been smoothed out.
2 DATA SOURCES AND TECHNICAL CHALLENGES
2.1 DATA SOURCES
During the interviews, we identified the following data sources and their usage:
AIS. An AIS transponder on board automatically transmits data about a) position,
course, speed, b) identity, vessel type, dimensions and c) destination, estimated time
of arrival, cargo, draught to appropriately equipped shore stations, other ships and
aircrafts178. The data exchange rate depends on the vessel’s speed and ranges between
1 message per second to 1 message per 0.5 minutes.
Emission data shall, according to MARPOL Annex VI (1997), be recorded and
reported to national authorities when within ECAs (Environmental Control Areas).
Emission data are sulphur oxides (So), nitrous oxides (NOx), ozone depleting
substances (ODS)179. Other emission could encompass information about anti-fouling,
ballast water, incineration, sewage or garbage disposal.
Operational (ship). This data are utilised in evaluating the performance of the ship
with respect to GPS position, speed, heading, engine power, fuel consumption (during
transit and at port), environmental forces including weather conditions, as well as
other voyage information and are referred to as “noon reports”.
Operational (sub-system). This data concerns parameters (i.e. propeller rpm180,
engine temperature, combustion pressure, navigational data, fuel consumption181
electricity produced, etc.) regarding the operation of any particular sub-system on-
178 http://en.wikipedia.org/wiki/Automatic_Identification_System 179 http://www.imo.org/OurWork/Environment/PollutionPrevention/AirPollution/Pages/Default.aspx 180
http://www.km.kongsberg.com/ks/web/nokbg0240.nsf/AllWeb/ECC998CE82FE3801C125758300448E97?OpenD
ocument 181 http://www.verifavia.com/bases/ressource_pdf/178/CE-Delft-Monitoring-of-bunker-fuel-consumption-1-.pdf

117
board, i.e. lubrication system, water cooling system, starting air system, ballast water
pumps/piping system, etc.
Ship design. It is a comprehensive set of information consisting of ship hull,
subsystems/product data and its blocks, sections, all structural elements, materials
used, systems and equipment installed on-board.
It should be emphasised that most of the data streams mentioned during the interviews are
proprietary, i.e. use private data formats (= not open), except for the AIS data which are an
ISO standard. The reasons for using proprietary data formats are entirely business related,
ranging from forcing customers to buy software, achieving customer lock-in, avoid that
others can use the data, hinder re-engineering, or simply to protect the data and/or data the
generating mechanism as much as possible.
Table 44 shows the main data sources mentioned in the interviews and their originally usage.
The externalities identified in this case study is based on this original usage.
Table 44: Data sources properties and the originally intended usage in the maritime
industry
Org.
ID
Data Source Data usage Acquisition Storage Access Data size at
collection point
a 7,8,
9 AIS
Mainly for navigation
aid Automatic Centrally
Public
(aggregated
only) GB/day
b 1,2,
7,9 Emission
Legal requirements on
emission reporting
(semi-)
Manual Centrally
Public
(aggregated
only) kB/day
c
1,2,
7,8,
9
Operational
(ship)
Control and operation
of ship
(semi-)
Manual Distributed
Private
(aggregated
only) kB-~GB/day
d 4,5 Operational
(sub-system)
Control and operation
of ship machinery
(semi-)
Manual /
Automated
Distributed
Private
(aggregated
only)
Raw
kB/day
MB-~GB/day
e
1,2,
3,7,
8,9 Ship design
Legal requirements,
Construction purpose
(semi-)
Manual /
Automated
Distributed
Private
(aggregated
only) MB
2.2 DATA USAGE
In the following the originally intended use of the various (groups) of data sources are
described. It should be pointed out that other uses often have evolved as a consequence of
availability of data.
a. AIS data as a navigational aid:
The original purpose of AIS (Automatic Identification System) was to assist a vessel's
watchstanding officers and allow maritime authorities to track and monitor vessel
movements. It was introduced by the UN's International Maritime Organisation (IMO) to
increase the safety of ships and the environment, and to improve traffic monitoring and

118
maritime traffic services. Ships larger than 300 tonn are required to have an AIS transponder
on board. The exchange of data happens via VHF radio communication between nearby
ships, AIS base stations, and satellites. Aggregated AIS data, i.e. down sampled to 1 message
per 5-6 minutes are commercially available. The figure below to the left shows a
Figure 6: (Left) ECDIS work station on a bridge uses AIS to detect and identify other
nearby vessels. (Right) Down sampled AIS data are increasingly available commercially
to the public, here VesselFinder182. This use was originally not intended
b. Emission data for compliance reporting:
Most of emission information are collected, aggregated and reported manually. The raw data
are either readings from meters, e.g. fuel consumption, ballast water, or are based on simple
computations, e.g. sulphur emission based on fuel consumption and fuel grade. Manual tasks
are error prone and therefore some ship owners are installing automated emission monitoring
systems. Emission information is sent regularly (usually daily) to local authorities at shore or
to HQ. Although emission raw data may constitute a large amount of data, the reported
emission information is very limited, i.e. a couple of numbers per day, and do therefore not
constitute a Big Data problem. Authorities on shore collect these emission data and aggregate
it on a national level for trending of, input to or as verification of pollution reduction
measures.
Figure 7: Example of ship emission
182 http://www.vesselfinder.com/
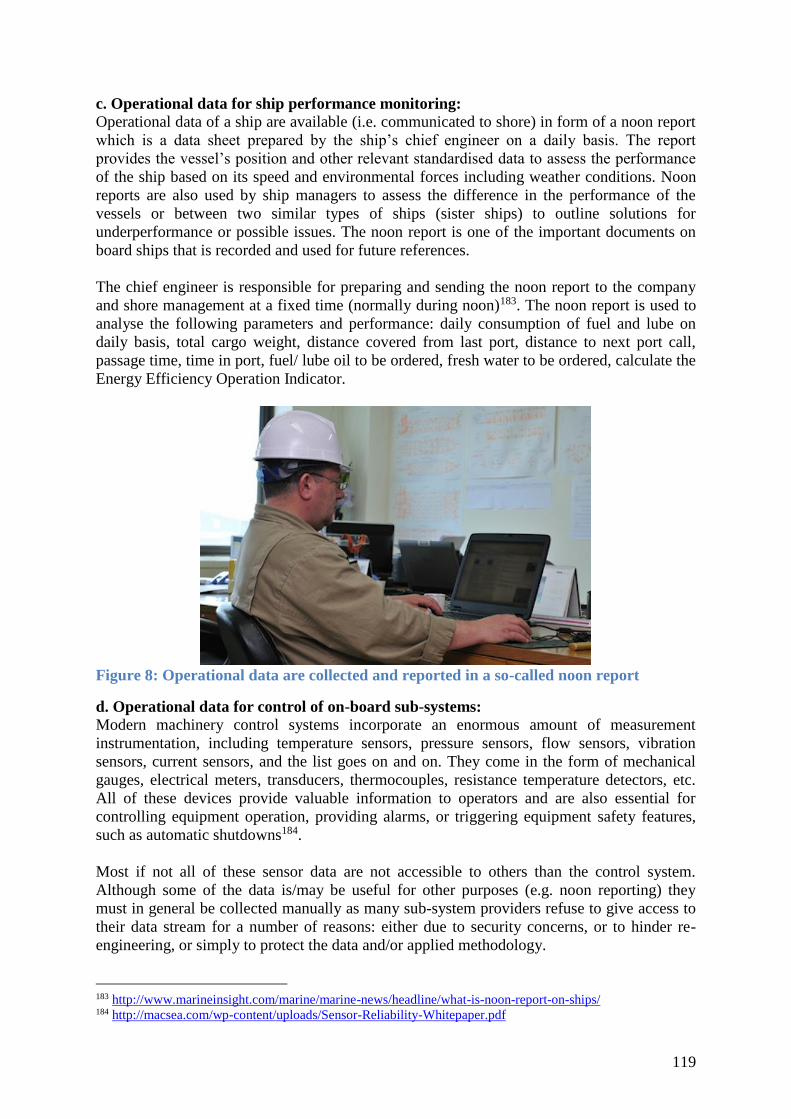
119
c. Operational data for ship performance monitoring:
Operational data of a ship are available (i.e. communicated to shore) in form of a noon report
which is a data sheet prepared by the ship’s chief engineer on a daily basis. The report
provides the vessel’s position and other relevant standardised data to assess the performance
of the ship based on its speed and environmental forces including weather conditions. Noon
reports are also used by ship managers to assess the difference in the performance of the
vessels or between two similar types of ships (sister ships) to outline solutions for
underperformance or possible issues. The noon report is one of the important documents on
board ships that is recorded and used for future references.
The chief engineer is responsible for preparing and sending the noon report to the company
and shore management at a fixed time (normally during noon)183. The noon report is used to
analyse the following parameters and performance: daily consumption of fuel and lube on
daily basis, total cargo weight, distance covered from last port, distance to next port call,
passage time, time in port, fuel/ lube oil to be ordered, fresh water to be ordered, calculate the
Energy Efficiency Operation Indicator.
Figure 8: Operational data are collected and reported in a so-called noon report
d. Operational data for control of on-board sub-systems:
Modern machinery control systems incorporate an enormous amount of measurement
instrumentation, including temperature sensors, pressure sensors, flow sensors, vibration
sensors, current sensors, and the list goes on and on. They come in the form of mechanical
gauges, electrical meters, transducers, thermocouples, resistance temperature detectors, etc.
All of these devices provide valuable information to operators and are also essential for
controlling equipment operation, providing alarms, or triggering equipment safety features,
such as automatic shutdowns184.
Most if not all of these sensor data are not accessible to others than the control system.
Although some of the data is/may be useful for other purposes (e.g. noon reporting) they
must in general be collected manually as many sub-system providers refuse to give access to
their data stream for a number of reasons: either due to security concerns, or to hinder re-
engineering, or simply to protect the data and/or applied methodology.
183 http://www.marineinsight.com/marine/marine-news/headline/what-is-noon-report-on-ships/ 184 http://macsea.com/wp-content/uploads/Sensor-Reliability-Whitepaper.pdf

120
Figure 9: (left) Typical engine room console. All the raw data from sub-systems are
processed, modified and aggregated on a level that is human understandable. (Right)
Modern ships have installed thousands of sensors especially related to engine or other
machinery control
e. Ship design data for structural and compliance verification:
Ship design data is a general term for information about the shape, hull, its blocks, sections,
all structural elements, and materials used regarding a ship. Unless otherwise specified, it
does not cover any piping, engine, electricity or any other aspects – just structure.
Figure 10:Examples of ship design data. (Left) Hull shape data for drag calculations,
(middle) mid-section data for verification of buckling strength, (right) bow section data
for strength assessment and weight calculations
Ship design data are usually in a proprietary format, again mostly due to business reasons.
The main purpose of these data is to verify them against compliance to existing rules and
regulations (as stated by the Class societies, IMO, natl. authorities). Ship yards and ship
owners often regard these data as confidential as a new ship design may provide a business
advantage to the ship owner (or yard). The amount of data is rather low - in the range of MB.

121
2.3 DATA FLOWS
Generally, the data flows between actors in the maritime industry are aggregated. The raw
data feeds are contained within the subsystems supplier or the administrator of the data feeds
such as National Costal Administration. The figure below shall visualize the data flows
between the various actors in the maritime industry. The thickness of the arrows shall give a
qualitative indication of the amount of data involved. The grey lines indicate emerging data
flows.
Figure 11: Overview of data sources and flows between the various actors in the
maritime industry. The thickness of the arrows shall give a qualitative indication of the
amount of data, thin arrows = KB (per day), thick arrows = GB/day. The grey lines
indicate highly likely new data flows
A common denominator is the unwillingness to share any raw data, and in most cases we
have observed that data is fist aggregated and then shared.
2.4 MAIN TECHNICAL CHALLENGES
Through the interviews, we have identified the following technical challenges in maritime
industry. They can be categorised in the following four main groups:
1. Acquisition: most on-board (sub-) systems (e.g., electrical or machinery control
systems) are designed as SCADA systems. Traditional SCADA systems are not
designed to offer sensor network capabilities and do not to support Big Data
technologies out of the box. These data streams are not intended for immediate human
consumption but for machine-machine communication. Even manufacturers may not
easily have access to the raw data. For any ‘big data’ application a data hosting
interface will have to be set up.
2. Curation: monitoring system calibration. This is a central aspect in all data
acquisition as a non- calibrated or a drifting sensor will provide wrong or low quality

122
data. Especially manual data input faces challenges of low data quality which is a
main driver towards automated data acquisition. ALL interviewees cited data quality
(either for raw or for aggregated data) as one of their main challenges.
3. Storage: limited storage infrastructure distributed and central. The interviews indicate
that storage seems not be a too limiting factor as raw data are usually not stored (only
aggregated data). However, for raw AIS data, storage requirement and handling falls
into the category of big data. With increased coastal coverage of AIS receiving
stations, the amount of historic AIS data will quickly grow into TB ranges. Even for
down sampled AIS data storage requirement will increase considerably as well as the
need for adequate data handling and analysis tools.
4. Others:
a. System access in real time: Disconnected systems or limited bandwidth
between the data acquisition and analysis/use. Many ships will not be within
the reach of coastal communication networks for an extended period of time.
Any application requiring real time access will have to use expensive satellite
networks having limited bandwidth. This is especially true for AIS signals and
for machinery control (sub) systems. The other by us listed data have not
require real time requirements, neither do they have large amounts of data to
transfer.
b. Security and privacy issues related to increase system monitoring. Security
was mentioned by ship owners and system providers (navigation and
machinery) as fear that with increased connectedness somebody may hack into
their systems. Privacy issues, and especially IP theft / industrial espionage and
increased competition were mentioned by all interviewees. All players
consider their data as business critical and consequently most were against
making them freely available or share with others.
It must be pointed out that the main challenges for adoption of Big Data technologies not
technical but rather related to human, organisational and financial issues, for example:
The by far largest hurdle in adopting (big) data driven solution is the short investment
time horizon of a couple of months. In shipping the dominating doctrines are:
“don’t fix what ain’t broken”, “only if it is required by law”. This was also clearly
reflected in the interviews. As any investments in Big Data technologies often leads to
large costs, not only direct cost for technology purchase, but indirect costs related to
training, reorganisations, temporary reduced efficiency, cannibalism of existing
solutions, etc. The primary focus of this industry is on earning money through
profitable transport deals and less on cutting costs.
Many ship owners do no longer directly employ their own ship crew, but they use
crewing agencies. Consequently, this leads to frequent crew shifting, which often is
not familiar with the particular data gathering and reporting schema for that vessel.
Additionally, the training costs increase drastically and results in low data quality due
to non-familiar routines and processes.
There are often tight bulkheads between the different organisational units, which
prohibit the establishment of routines or incentives to deliver high quality data. For
example, even stable crews often deliver low data quality as they do not know what
the data are used for and do not see their importance.
Any form of manual data gathering is extremely prone to low data quality. Some of
this data collection could be automated and thereby provide high quality data but this
requires investment in an automated system. Investments, especially in the maritime
industry, require a rate of return on a short time horizon in range of months. Short-

123
term profitability computations effectively stop most deployment of automated data
collection systems.
2.5 BIG DATA ASSESSMENT
The case study strongly indicate that the maritime transport sector is in general at a very early
stage when it comes to using data driven services, or any form of "Big Data" utilisation. The
case study strongly indicates that major parts of the maritime transport sector are in a very
early stage for adoption of "Big Data" solutions. The ship owner may represent one extreme
where "Big Data" is mainly business data and mandatory environmental reporting data
collected on a day basis, consisting of just a handful of numbers. There is no uniform
conception or definition of what is meant with "Big Data". Figure 2 illustrates qualitatively
the maturity of the maritime industry with respect to (big) data and the need for (big) data
driven solution. It may also be pointed out that there is a wide range within a sector, e.g. yard,
showing large variations in maturity.
Figure 12: Maturity and need for Big Data solutions in the maritime industry

124
3 ANALYSIS OF SOCIETAL EXTERNALITIES
In the BYTE D3.1 Case study methodology report, it was suggested to address barriers and
enablers to the use of “Big Data” as there exists an obvious relationship between externalities
of an activity and consequential reactions from affected third parties.
3.1 IDENTIFICATION OF EXTERNALITIES WITH HELP OF BARRIERS AND ENABLERS FOR
DATA DRIVEN SOLUTIONS
In Table 45 and 5, we present barriers and enablers that were identified for adopting data
driven solutions in the Maritime industry. The process of identifying societal externalities is
based on the following assumption: if an activity causes a negative externality then the
affected party would oppose that activity, hence appear as a barrier, respectively with
positive externalities and enablers.
Table 45: Barriers for adopting data driven solutions in the Maritime industry
Barriers Exter-
nality
ID (Table 43)
1 Growth in data volume 9
2 Limited connectivity and bandwidth / infrastructure, real time requirements 6
3 Existing tools no longer adequate for data storage +/- 9
4 Existing SW tools no longer adequate for analysis of data (in reasonable amount
of time)
+/- 9
5 Existing mathematical analysis methods may not utilize the full potential of big
data
+/- 7,8
6 Increased complexity system and comprehensibility 6
7 Total removal of human element, i.e. no last sanity check - 5
8 Data aggregation: high volume => small data/aggregation and end user
customization
5,8
9 Avoid over optimization - 7
10 Assurance of confidentiality of data, Protection of IP (re-engineering) - 3,9
11 Reluctance of sharing data 1,…6,7,8
12 Ownership of data not resolved (who owns the data, e.g. ship owner or (sub-)
system provider?)
- 3
13 Increased dependency/reliability on software 9
14 Increased dependency/reliability on sub-contractors/subsystem suppliers 8
15 Development driven by system supplier, NOT user => little collaboration due to
competition
8
16 Little trust in actors and data, analysis of data due to different agendas and
complexity
8
17 Data repository for sensitive data missing 2
18 Data quality of (semi) manually collected data 5
19 New actors challenge existing business models and role of organization 9
20 No clear idea what to use the data for 1
21 Need a holistic view on the data and processes around 9
22 Lack of “big data” strategy in company, 8
23 Division of industry in big data achievers and losers (e.g. too small company) - 6
24 Reluctance to necessary re-organisation, increased frequency of re-organisations,
tech. upgrade
3
25 Reluctance to increased personal monitoring 8
26 Increased coordination between actors + 3

125
27 Integration of existing with future tools/systems (legacy systems become barriers,
silos)
1,3,7,8
28 Big data conceived as ‘black box’ technology 8
29 Difficult access to (big data) expertise +/- 5,7
30 Loss of internal knowledge due to necessary outsourcing 9
31 Increased need for training - 2,3,5
32 Legal void, need for increased authority involvement, need definitions, guidelines - 3
33 Owner cannot provide legal requirements on documentation as system provider
refuses to disclose IPs/confidential info.
- 8
34 Too slow adoption/adjustment/blocking of existing rules and legislation in some
aspects
8
35 Too fast / frequent changes with respect to other aspects 4
36 Proprietary formats 8
37 Return on investment / profitability difficult to document/too long time horizon
needed
1,2
38 Well established industry processes and collaborations, which are difficult to
change/disturb
- 10
Table 46: Enablers for adopting data driven solutions in the Maritime industry
Enablers Ext ID
1 Better and more accurate asset management and evaluation 5,7
2 Deeper and more reliable understanding of involved risks and opportunities 5,7
3 Better optimization of business & technical processes and design, i.e. less resource use + 3,5,6
4 Better benchmarking of system or sub-system provider + 3,8
5 Capitalising on synergy effects 3
6 Better and more end user involvement + 8
7 Faster and better access to data 6
8 Can change charter market to be more environmental conscious 6
9 New service offerings /business opportunities + 2,4
10 Unintended/not designed monitoring opportunities of other aspects, can use same
monitoring system/data to extract other info
+/- 5
11 Multi-objective optimization 2
12 Learning from others 1
3.2 SOCIETAL EXTERNALITIES
According to OECD185, “externalities” refer to situations when the effect of production or
consumption of goods and/or services imposes costs or benefits on others, which are not
reflected in the prices charged for the goods and services being provided. Observe that
externalities are related to processes, i.e., production, service, or use, and not to the product
itself. That is, it is NOT the “Big Data” platform per se that causes externalities, but there are
always the processes that can lead to externalities. In addition, it may not necessarily be that
the existing processes may evoke a reaction, i.e., cause an externality, but the opportunity/risk
given by the existence of the connected data. As externalities are reciprocal, one may find a
positive externality for any negative, and vice versa. In Table 47, we present the identified
externalities based on the information about barrier and enabler presented in Table 45 and
Table 46, obtained during the conducted interviews.
Externalities are closely tied with processes, i.e. the usage of (big) data, they may be revealed
only when analysing these processes. Realize that originally there may be no unintended side
effects associated with a given data process. However, externalities can emerge when these
185 http://stats.oecd.org/glossary/detail.asp?ID=3215

126
data are used for a purpose not intended / thought of in the beginning. That is, trying to
identify all externalities in connection with a given data source, is equal to identifying ALL
potential usages of these data that may emerge in the future – which is totally impossible.
Posing the interviewees with the question about what externalities are/will most probably
arise from the future use of their data, they could not name any externalities. The only raised
issue was “privacy” concerns. However that almost all privacy concerns are about potential
future misuse of data – NOT current misuse!
The big maritime data focus group did not result in many new aspects related to externalities
caused by the use of (big) data in the maritime industry. However, Lars Arne Skår provided
the example of an unintended side effect of shipping contracts from: “Using Big Data to
change trade in sea based container transport”. Here, pricing data contained in container
shipping contracts were collected and a benchmarked against each other to get an indication
of how cheap/expensive a particular shipment was. Although the source of this example is a
start-up company, this container pricing benchmarking service has already had a significant
impact on the container shipping market as the service makes suddenly the pricing structure
transparent and globally available. Therefore, large price fluctuation has been smoothed out.
This might be considered as a positive externality for those who want to ship containers, but
negative externalities for all the shipping companies who earned god money on offering
higher prices.
Please note that the externalities presented in Table 47, could not map into the initially
defined taxonomy of externalities. Due to the vague (i.e., hard to quantify) nature of the
externalities we could not create a clear mapping between Maritime industry specific
externalities and the project-wide predefined externalities. It is beyond the scope of this
report to provide a direct taxonomy between the enablers/barriers and positive/negative
externalities. Often each of the identified externalities could refer to several of the original
taxonomy, and to avoid ambiguity we chose not to mention possible candidates.
Table 47: Identified Externalities in the maritime industry. The ID column codes for the
interviewees (see Table 42 or Table 43). Some of the externalities were identified by the
authors when aggregating the results, these instances are coded by ID = 0.
Barrier &
Enabler ID
ID Type Externality Code
B23,32
E9,10
2,4,5
+
+
-
As data may be used for something else (as originally intended),
a (sub) system provider/ data collector may:
involuntarily be assigned a new responsibility.
exploit new opportunities,
missuses the data
B23,29,3
2
E9,10
5,6,7 + Little expertise/high dependence on data (driven solutions) may
open new business opportunities for others.
B32,
E10
3,5 - Banks/Insurance/financing institutions may require/demand
access to data streams
B3,4,5,3
8
E3,4
3,5,6,7
,8,9
+ More data & better models may result in process/product
optimization and therefore using less non-renewable resources
(e.g. fuel, metal etc.)
B7,9 0,5,7 - More data & better models may result in a more optimized
solution for a specific problem, but if problem changes the
solution may be worse suited than before. That is, effectively
reducing existing safety margins (i.e. less resilience).
B26,29,3
2
3,5,7 - More advanced use of data may require that current competence
of authorities and regulating authorities are not sufficient
PC-ETH-3

127
B10,23,2
6,33,38
E4
1,2,38 + Common benchmarking may enable equal level playing field
B3,4,5,2
4,29,31
1,2,3,5
,8
+ Increased use of data (driven services) will require changes in
training/education
PC-BM-2
B32,33,3
4
3,4 - Combination of data (sources/results) will require frequent
changes in the legal framework
PO-LEG-2
4 + Because of modernisation/upgrade of data transfer
capacity/capability, other actors may piggyback this
development with their services.
B6,11,13
,14,16,28
,29
E2
8,9 + Data quality and trustworthy data /analysis results may require
3rd party trust services.
B12,10,3
3
E12
3,5,7,8
,9
- Automated collection of data will result in increased
opportunities for industrial espionage
B6,7,13,
16,28,30
5,6,8,9 - Increased system complexity/SW dependency/advanced analysis
will make the process from data generation to decision taking
less transparent.
B24,32,3
8
3,8 - Services based on (combination of) data stream and mesh-ups
will require an adaption of existing security practices and legal
requirements
PP-LEG-2
B7
E1,2,3
0,5 +/- “Big data” may remove human fail-safe role through fully
automated processes. It may also lead to data generated models
as basis for decision taking rather than human-modelled decision
processes.
B10,11,2
2,26
1,..,9 - Access to data is hampered due to a “my data are unique and
most precious” attitude. The reason seems to be a lacking/non-
up-to-date legal framework protecting the data and to a larger
extent the lack of a profit sharing business model where data
providers will get revenue share.
B21,23,2
4,29,28,2
7,30,35,3
7,
1,2 - Many small players may experience increased business pressure
from larger ones as they cannot afford to introduce expensive
data driven solutions (endangering small businesses)
OO-BM-5
B27,37 1,2,3,7
,8
- Short term financial appropriation rules / demand for high RoI
effectively stops most investments in data driven solutions. RoI
time horizon in shipping industry usually 3 months!
OO-BM-6
B32,34
E4
3,8 +/- Authorities are considered central in fostering data driven
solutions through new regulations and financial incentives,
legislation (IP), standardisation, benchmarking.
We point out, that this task is very subjective as someone with another background or
understanding of the maritime industry may conclude differently. That is, people with a
different background will most probably pose the questions differently and interpret the
answers from the interviewees differently. As stated above, additional externalities may
emerge as other future usage of the data is envisioned.
It was the main task of the authors to contemplate potential future externalities based on the
collected answers from the interviewees. A potential externality (potential because the
process using some data may be hypothetical/not yet existing) may therefore not necessarily
be assignable to a specific interview. Externalities identified by the authors are coded by ID =
0 in Table 47.

128
4 CONCLUSION
Shipping is concerned with the transport of more than 90% of global trade. The maritime
industry goes usually unnoticed, due to factors like low visibility, less planning, uncertainty,
and long tradition. Further, much of the industry is characterized by small financial margins,
small organizations, high fragmentation and consolidation. Their processes are lean and most
process changes occur only due to regulatory changes.
The central aim of this case study was to identify externalities associated with data sources in
maritime transport industry. A fundamental challenge in identifying externalities lies in the
fact that data can be used for a purpose not intended / thought of in the beginning which
could give rise to externalities. That is, trying to identify all externalities in connection with a
given data source, is equal to identifying all potential usages of these data that may emerge in
the future – which is totally impossible. In our case study, we therefore have focused on the
originally intended use of data by interviewing representatives from industry actors with
different roles. The maritime transport sector is characterised by a very wide span in their
competence, capabilities and utilisation of data. The case study strongly indicates that major
parts of the maritime transport sector are in a very early stage for adoption of "Big Data"
solutions. The ship owner may represent one extreme where "Big Data" is mainly business
data and mandatory environmental reporting data collected on a day basis, consisting of just a
handful of numbers. At the other extreme, we find the represented of the equipment supplier
who use advanced sensor technology to monitor their equipment only. The amount of data
can reach GB/day for a monitored system. In other words, there is no uniform conception or
understanding of what is meant with “Big Data”. A common denominator is the
unwillingness to share any raw data, and if they have to, this is only done on an aggregated
level. Competition is the main reason for that.
The interviews indicate that in long term, this sector will adopt solutions that are already
developed in other industries such as land logistics and offshore Oil & Gas. Indications were
also gathered that there is a high probability that new actors will enter the maritime industry
because of the onset of ‘Big Data’ (data driven solutions/services).
The interviews indicate that in the long term, this sector will be approached/invaded by new
players with extensive IT and data competence such as IBM, Google, Microsoft, and a
myriad of small IT companies. As many of these companies also provide service in other
industries, the attitude towards externalities in shipping may change. Our analysis shows that
the identified externalities are ambiguous and are not restricted to maritime industry. It seems
that externalities caused by data utilisation are very low or non-existing. In addition, the
shipping sector does not regard externalities as important as any effect of externalities on e.g.
legislation, safety, cost reduction etc. is far beyond their budgeting and investment time
horizon (usually a couple of months). Further, as long as there are not legal requirements in
place that will force the maritime industry to change any of their processes they will not
change as any change is considered as a cost.
The case studies also strongly indicate that this sector is characterised by a very slow
adoption of new data driven solutions. In general, ship owner are not the first to adopter new
technologies, they are extremely conservative and do not see immediate business advantage
given by data driven services. There is evidence that the main reason lies in the fact that the
primary focus of this industry is on earning money (i.e., not surprisingly), this is done
through profitable transport deals and less on cutting costs. Introduction of new technologies
is largely about doing things faster, better, cheaper, which is mainly about cutting cost and

129
will therefore get secondary priority. In other words, there is great resistance in voluntarily
adopting new technology. The interviews clearly point to the important role played by
authorities, as some stakeholders within the maritime industry will not react unless required
to do so by legislation. Relevantly, the authorities’ sole focus is on technologies increasing
safety and environmental protection, such as oil spills, accidents or emissions.

130
SMART CITY CASE STUDY REPORT – BIG DATA IN A DIGITALIZING CITY:
THE PROMISE, THE PERIL, AND THE VALUE
SUMMARY OF THE CASE STUDY
The smart city case study focused on the macro-view of the creation of value from potentially
massive amounts of urban data that emerges through the digitalized interaction of a city’s
users, i.e. of citizens and businesses, with the urban infrastructure of resources such as energy
and transportation, social and administrative services, etc. We have created a focus group
representing the main stakeholders from the city, representatives of the energy as well as
mobility industries of a city, multinational technology solution providers and smart city
consultants who are thought leaders and invited speakers at big data related smart city events.
In addition, we followed up on the insights of the workshop through interviews with further
senior experts from smart cities and big data analytics experts.
The resulting material is presented in the following for further analyses through the EU
BYTE working groups for cross-analysis and application of foresighting methods to compile
the necessary recommendations for the European policy and research roadmaps. The first part
of the case study creates a general overview on the current state of big data in smart cities by
examining data sources, data uses and flows, by discussing the main technological
challenges. The state of big data utilisation in digitalizing cities can be summarized as
developing. Some cities are currently building the necessary big data structures, be it
platforms or new organizational responsibilities.
The second part lists and analyses the identified positive and negative societal externalities
divided into economical, social and ethical, legal, and political externalities. The economies
of digital, especially big data, favour monopolistic structures, which may pose a threat to the
many SMEs in cities and the small and medium cities. However, open source and open
platforms, open data, and even open algorithms crystallize as a short cut and “technology-
driven form of liberalization” accompanying the big data movement in cities, which has the
potential to level the playing field and even spur more creativity and innovation. The
potential of big data to be used for social good is immense especially in the digitalizing city.
However, there is a range of pitfalls, we, as a society, need to take care of: The strong
reliance on data-driven services will need a new debate on how we can assure “enough”
equality, when there are so many different reasons why not all citizens will reap value from
data in equal amounts. We conclude that socially desirable outcomes must be formulated
first. Personalized, i.e. citizen-centric, policy-making and services with immediate feedback
become possible for the first time. Policy makers should take advantage of digitalization and
use the positive potential of big data for policymaking for the European cities.
1 OVERVIEW
The number of smart cities worldwide will quadruple between 2013 and 2025 according to a
report from IHS Technology186. In this report smart cities are described as the integration of
information, communications and technology (ICT) solutions across three or more different
functional areas of a city mobile and transport, energy and sustainability, physical
infrastructure, governance, and safety and security187. Both research and development of ICT
186 https://technology.ihs.com/507030/smart-cities-to-rise-fourfold-in-number-from-2013-to-2025 187http://press.ihs.com/press-release/design-supply-chain-media/smart-cities-rise-fourfold-number-2013-2025
131
for urban data can work from a united perspective in the deployment of useful big data
applications in the smart cities sector.
1.1 STAKEHOLDERS, INTERVIEWEES AND OTHER INFORMATION SOURCES
For this case study, the city and technology providers (multinationals, start-ups, and non-
profit organizations) were the main stakeholders under study as detailed in Table 48. At the
time of this writing citizen or consumer advice representatives are not yet visible in the new
discourse about big data in a digitalizing city.
Table 48 Main stakeholder organizations in the smart city case study
Organization Industry
sector
Technology
adoption stage
Position on data value
chain
Impact of IT in
industry
European
City
Public Sector Early majority
Acquisition
Analysis
Curation
Storage
Usage
Strategic mode
Technology
Provider
Start-up,
Energy
Early adopter
Acquisition
Analysis
Storage
Usage
Turnaround mode
Technology
Provider
Non-profit,
Mobility
Early majority
Acquisition
Analysis
Storage
Usage
Turnaround mode
Technology
Provider &
Research
Multinational,
Smart City
Early majority
Acquisition
Analysis
Storage
Usage
Strategic mode
In order to conduct the case study analysis, we created a focus group representing the main
stakeholders from the city energy as well as mobility industries of a city, multinational
technology solution providers and smart city consultants who are thought leaders and invited
speakers at big data related smart city events. The agenda and the main outcomes of the focus
group are included in Appendix D.
Table 49 codifies and summarizes the sources of focus group insights that we will be citing
and referencing throughout this document for further analyses through BYTE working
groups. FG refers to the insights from the group discussions consisting of 2 smart city
experts, 1 mobility & 1 energy services experts from the studied organizations, 2 smart cities
experts from consulting firms in smart city and clean tech cluster. FG-City refers to the
insights from the break-out session group made up of a mixed group of city representative,
smart city consultants, and researchers. FG TechPro refers to the insights from the break-out
session group made up of a mixed group of technology provider, smart city consultants, and
researchers. FG-Citizen refers to the insights of a mixed group of researchers who described
themselves “regular,” “techno-capable,” and “involved” citizen, with which we aimed to
capture some insights reflecting the most important stakeholder of the city, the citizen.
However, it must be emphasized that the citizen as stakeholders need to be more involved
into the discourse of creating value from big data, which mainly is user data. Throughout the
citations, analysis, and main conclusions, this common theme stands out.

132
Table 49 Constellation and codes of the focus group insight sources
Code Source Event Description
FG 2 smart city experts, 1 mobility & 1
energy services experts from the
studied organizations,
2 smart cities experts from
consulting firms in smart city and
clean tech cluster
BYTE smart city
focus group
workshop
Focus group on big data
in a digitalizing city,
stakeholder mapping
and consolidate
discussions after break-
out session
FG-City Mixed group of city representative,
smart city consultants, and
researchers
BYTE smart city
focus group
workshop
Break-out session
discussion
FG-
TechPro
Mixed group of technology
provider, smart city consultants,
and researchers
BYTE smart city
focus group
workshop
Break-out session
discussion
FG-Citizen Mixed group of researchers who
described themselves techno-
capable and involved citizen
BYTE smart city
focus group
workshop
Break-out session
discussion
The interviews complemented the focus group, and enabled us to clear follow-up questions or
collect alternative and/or more detailed perspectives. The interviewees were selected based
on their field of work or study and their seniority. Table 50 codifies the interviewees
according to the EU BYTE case study methodology in order to enable cross-analysis across
sectors. The codes will be used throughout this document to reference insights from the
interviewees.
Table 50 Selected interview partners and codes for the smart city case study
Code Organization Designation Knowledge Position Interest
I-MC-1 Manchester
City Council
Senior
Technical
Manager
Very high
Supporter
Very high
I-AI-1 German
Centre for
Artificial
Intelligence
Senior
Academic
Very high Supporter Very high
I-CG-1 City of Ghent Senior
Business
Manager
Very high Moderate
supporter
Very high
I-SM-1 Rotterdam
School of
Management
Senior
Academic
High Moderate
supporter
High
1.2 ILLUSTRATIVE USER STORIES
Digitalized “Physical” Infrastructure
Energy, Mobility, and Information networks make up the digitalizing physical infrastructure
of smarter cities. City nodes, e.g. private or commercial buildings, train stations, etc. Some
nodes are hubs such as central train station, airport, or industrial parks, etc. are connected by
infrastructure for transportation, energy, and information. Each infrastructure can be seen as a
multimodal resource flow network, with different modes of transportation: roads, railways
lines, or forms of energy: gas, heat, and electricity. Situational awareness on the city and

133
cross-optimization of these resource networks is a secondary trend, which is allowed by the
convergence of technological advancements and platforms. Each entity or mode in these
infrastructures can be seen as a big data application in itself: a solution that not only makes
use of big data and but also adds to the body of data.
A typical smart city project is being rolled-out here regarding city lighting. Current
light bulbs shall be replaced by LED, with the major goal being modernization
and carbon reduction through efficiency increase. For the first time computer
control will be possible to switch on/off or dim the lights, at different locations. In
the old system, only data about the location of the light bulbs was being managed.
With the digitalization of this [lighting] infrastructure the city will also manage
connectivity to control centre, which needs to be robust enough to collect real-time
data every few minutes and faster. Most of the new data will be about control –
and it will be bigger, i.e. streaming sensor and control data. If we wish this data can
be put into a pool of energy data, when analysed, the city can look at energy usage
patterns; correlate yet with other data sources etc. For the current lighting system,
however, the city only has location data about the lighting poles. So, most of the
new scenarios will be about controllability and control, which then will require
analysis of real-time usage/operations data. [I-MC-1]
Participatory Sensing188
Smart Santander project189, a public-private partnership, is placing sensors around various
European cities in order to gather data, as well as take advantage of what citizens are willing
to contribute through their smartphones and specialized software. It takes advantage of the
ability of these devices to be connected to people as well as to the core network. Data
analytics, IoT, and some aspects of social media are blended so that problems are found in
real time and conveyed back those who can fix them.
Another use that motivates the sensorisation of a city is the quantifiability of
improvement projects. Such new improvement project is the pedestrianization,
i.e. areas where only bikes, busses and taxis are allowed, which means less traffic
for that area – but the actual amount of traffic mostly remains the same and must be
redirected. Sensors installed prior to such a project on the roads can measure
current state. Assumptions and simulations can be made based on the real data to
run numbers on possible outcomes. But most importantly, the data after the
improvement project can be compared, analysed and used for future improvements.
The city becomes quantifiable. [...] There are a lot of planned investments in the
pipeline, such as the pedestrianization example, and the aim is to quantify the
improvement through sensorisation from the beginning. Such evidence-based
decision making is a sound business case for cities. [I-MC-1]
Linked City
Dubl:nked190 is an innovative new data-sharing network. The network is seeking to link data,
sectors, skills and people to generate new commercial opportunities for the Dublin Region.
Dubl:nked will also provide the Dublin Region’s first Open Data Platform which makes
public data available for research and reuse. The city is explicitly utilizing data as a resource
to invite new data-driven economy actors.191
188 http://www.ubmfuturecities.com/author.asp?section_id=459&doc_id=526800 189 http://www.smartsantander.eu/ 190 http://www.dublinked.ie/ 191 http://www.dublinked.com/?q=aboutus
134
Public Safety
Open data and cloud-based big data analytics can be used to improve the efficiency of police
and fire services by capturing and correlating the analysis of all data coming from various
systems installed in the city, including surveillance cameras, emergency vehicle GPS
tracking, and fire and smoke sensors192. Predictive policing uses historical crime data to
automatically discover trends and patterns in the data. Such patterns help in gaining insights
into crime related problems a city is facing and allow a more effective and efficient
deployment of mobile forces193 and significant decrease in crime.
2 DATA SOURCES, USES, FLOWS AND CHALLENGES
2.1 DATA SOURCES
In order to gain a macro view of the relevant big data sources, we consulted the focus group
in the workshop. The focus group consisted of stakeholders from the “city,” “mobility”
industry, “energy” industry, city “technology solution providers”, as well as EU BYTE
researchers, who considered themselves “techno-capable citizen” or “involved citizen”. The
resulting map of digital city stakeholders and their most interesting data is depicted in Figure
13.
In the analysis of the stated big data sources we concentrated on what type of data or data
source is relevant for more than one stakeholder. This question is interesting since it should
indicate the data sharing motivation and may shed some light into how to kick-start data
ecosystems and the state of data flows, as briefly touched upon in section 2.3. Same data
sources from different stakeholders are highlighted in Figure 13:
The city and general population are very much concerned about their mobility; hence,
mobility data (violet) is at the core of the city. [FG]
The involved citizen additionally cares about the resource conditions of the city, hence
environmental data (green). [FG]
Energy data (green) is at the core of the energy data start-up, whereas for smart city
technology and consulting firms EarthObvs-spatial, EarthObvs-referenced data
(orange) is equally of importance. [FG]
Smart city technology and consulting firms are additionally focused on operational
and process data from infrastructures (blue). [FG]
192http://www.accenture.com/us-en/blogs/technology-blog/archive/2015/02/11/iiot-and-big-data-analytics-help-
smart-city-development.aspx 193 http://www.predpol.com/
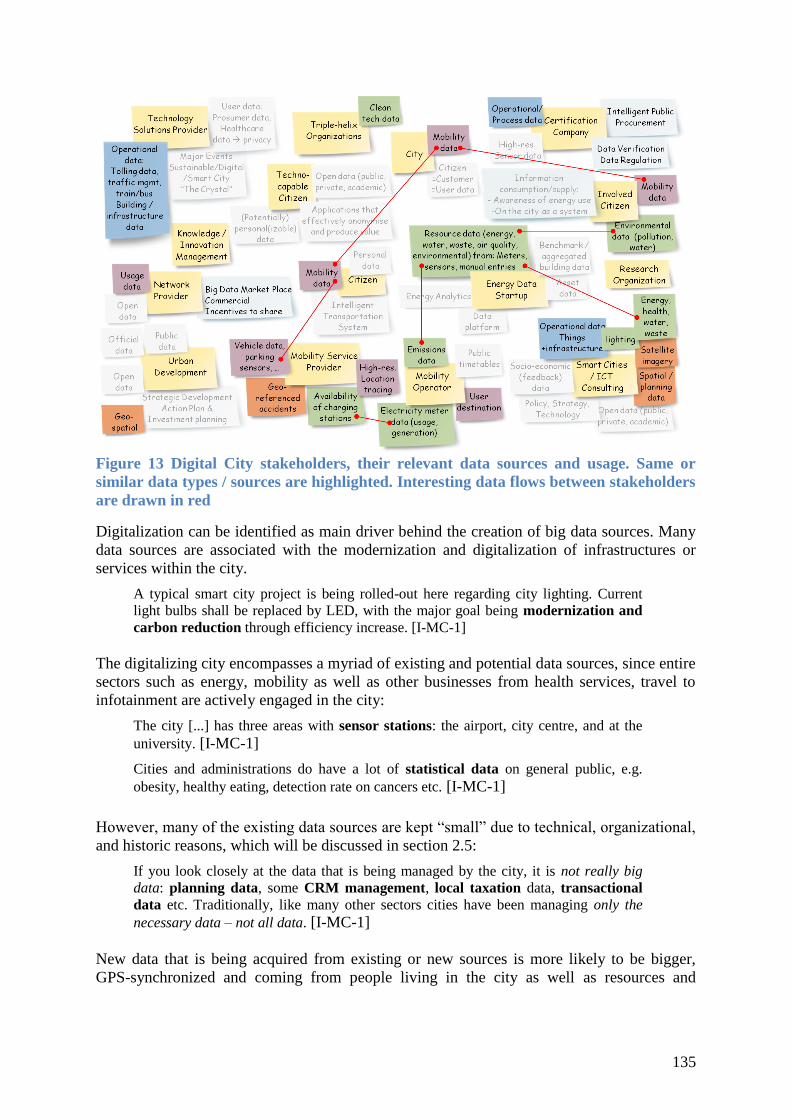
135
Figure 13 Digital City stakeholders, their relevant data sources and usage. Same or
similar data types / sources are highlighted. Interesting data flows between stakeholders
are drawn in red
Digitalization can be identified as main driver behind the creation of big data sources. Many
data sources are associated with the modernization and digitalization of infrastructures or
services within the city.
A typical smart city project is being rolled-out here regarding city lighting. Current
light bulbs shall be replaced by LED, with the major goal being modernization and
carbon reduction through efficiency increase. [I-MC-1]
The digitalizing city encompasses a myriad of existing and potential data sources, since entire
sectors such as energy, mobility as well as other businesses from health services, travel to
infotainment are actively engaged in the city:
The city [...] has three areas with sensor stations: the airport, city centre, and at the
university. [I-MC-1]
Cities and administrations do have a lot of statistical data on general public, e.g.
obesity, healthy eating, detection rate on cancers etc. [I-MC-1]
However, many of the existing data sources are kept “small” due to technical, organizational,
and historic reasons, which will be discussed in section 2.5:
If you look closely at the data that is being managed by the city, it is not really big
data: planning data, some CRM management, local taxation data, transactional
data etc. Traditionally, like many other sectors cities have been managing only the
necessary data – not all data. [I-MC-1]
New data that is being acquired from existing or new sources is more likely to be bigger,
GPS-synchronized and coming from people living in the city as well as resources and
136
infrastructure utilized in the city. Data being correlated also generated new data in form of
insights, error logs, etc.:
In the commercial domain we have millions of transactions, whereas in the public
realm we are more interested in status data at specific times and locations: e.g.
where is the bus now? When will it be here? Energy usage data, such as electricity,
heating, etc. as measured by sensors. [I-MC-1]
[...] systems that generate real-time data: lighting, busses, energy district, and
building information systems. The data is captured by real-time data generators, smart
devices [...].[I-MC-1]
[...] mobile phone data has a lot of metadata that can help in extracting new
insights, especially when correlated with other data. However, it also requires
peoples’ permission and understanding of data. [I-MC-1]
2.2 DATA USES
Data uses in the smart city context can be categorized into high level purposes, which
certainly can also be found in other domains, such as planning & reporting (of administrative
processes as well as events or the city itself), understanding, improving & optimizing:
Reporting rules & regulations, city performance benchmarking, budget planning
are typical uses of data which create the need for a 360° view of the city. Centralized
administrative data is already being used in some cities. [FG-City]
Access to and analysis of massive amounts of natural language and sensor data
enables to automatically infer semantics: Sensor data such as measurements on
movement etc. from the same surroundings, i.e. in time and space, can be used as
context data, or as data-driven semantics. At the same time these multiple data
channels can be tapped into to have a better understanding of natural language.[I-
AI-1]
Data is also used in the course of mega or micro events within the city. [FG-City]
This [statistical] data can help in understanding behaviour. Only then behaviour can
be changed. For example, children from a district may eat less fruit, because there are
no fruit shops nearby. Seeing this as evidenced by data can lead to directed, hence
faster and more effective, countermeasures. [I-MC-1]
Another use that motivates the sensorisation of a city is the quantifiability of
improvement projects. [I-MC-1]
Big data in a digital city can be used to (a) optimize the processes (b) improve the
planning. [I-AI-1]
When compared to other domains, smart city will be characterized by the ability to put
real-time data to use to determine best or optimal actions. [I-MC-1]
Increasingly more versatile and newer data sources find their ways into existing processes.
Sensors, many newly deployed, are stated as the main sources of big data in a digitalizing
city, as stated in section 2.1. Metadata, as associated with mobile phone data, as well as
natural language, the main type of data in social media, are increasingly being used in control
centres of transportation or emergency control. The new type of data we are seeing is
primarily the data of the user, citizen, who is either actively participating in the city processes
through crowdsourcing initiatives, such as “citizen reporters,” or just participating online and
sharing information about their surrounding, the city:

137
Modernizing city technology, sensor deployment etc. are needed and created new data
will also be used in city planning and design, as well as in city operations.
Examples of crowdsourcing have been tested in some cities for citizen bottom-up
reporting, or citizen request data for reporting as a Twitter app. [FG-City]
Crowdsourcing is also used by technology providers for co-ideation and tapping into
citizen-led innovation. [FG-TechPro]
Mobility management in general, but also ensuring reliable emergency response as
well as enabling resilience based on real-time data are typical uses of data by the city.
These data are used in control centres. Increasingly, anonymised and aggregated
mobile phone data, and social media monitoring find their way into usage in these
applications. [FG-City]
One differentiating area of the smart city case study can be circumscribed as “digitalizing
utilities of care:”
It is not long before we will see the creation of further utilities of care [groceries,
mail, health services], as we are used to with gas, water, electricity etc. [I-AI-1]
However, even in this very specific case, the data use relates to a very common big data
pattern: customer experience. Digitalization and creation of more utilities of care will result
in better citizen experience:
Regular commuters and the need for getting from A to B on time in general,
motivate the use of mobility data, but also combined use of travel itinerary,
calendar, and meeting management data. [FG-Citizen]
Google Now or City Apps for navigating within the city require use of mobility data.
[FG-Citizen]
Shopping needs move online to Amazon.com and parcel station near home or work
for pickup items in the physical city. [FG-Citizen]
In home-town or in foreign city there is always the need to find things, search for
things: events, hotels, babysitter etc. Web Search services, city apps, comparison web
sites or tourism platforms such as Travelocity are used for this need. [FG-Citizen]
Citizens require access to public services and health services in their city and region,
or when in a foreign city. In these cases or for personal record keeping, mobility or
personal data is of interest. [FG-Citizen]
Many of these above examples of better citizen experience through bundling and creation of
more utilities of care rely on real-time EarthObvs-spatial data, i.e. when and where an
item/person/event of interest is as to avoid waiting/queuing and better utilisation of one of
the most valued resources we have: time.
2.3 DATA FLOWS
Similar to the discussion with data sources, in the smart city case study we need to resort to
the more complex but enlightening macro view, because otherwise we are confined in
scenarios of siloed sectorial perspectives, such as solely energy-related or solely mobility-
related scenarios:
The city works with other partners, such as contractors, transport agencies, police,
highway suppliers, etc. who operate on the city’s behalf. [I-MC-1]

138
The interworking of the city with its partners in addition to the citizen and their choice of
daily solution providers is very complex. Hence, it is no surprise that in the digitalization
phase thing will get worse, before it gets better: All stakeholders currently try to handle their
own data, whilst discussing standard interfaces and protocols to exchange data. In the
meantime data remains captive in technology and organizational silos.
All of these stakeholders move towards systems that generate real-time data [that] is
captured by real-time data generators, smart devices, but are confined in closed
systems. [I-MC-1]
When compared with the solutions of big data or digital-born companies, such as Google,
Amazon, Facebook etc. it becomes clear that the city requires platforms, maybe more similar
to those of Airbnb or Uber, for the intermediation between its users, the citizen, and its
partners, the resource and infrastructure operators on behalf of the city:
So, the smart city will need to work with platforms on which data can be analysed
and shared with other sources as well. [I-MC-1]
In the focus group workshop an interesting idea was raised, which is worth following up:
When discussing the stakeholders and their relevant big data sources (see Figure 13) we
actually identified that mobility data may be the big data ecosystem nucleus that will
bring most of the smart city stakeholders together. The city and the citizens are mainly
concerned with mobility and are willing to share their mobility data with technology
providers if their service/solution can ensure reduction of unwanted traffic or reduction of
travel times. Energy usage data currently has a very small originator base, namely the
“involved citizens,” who also care about other resources being used efficiently other than
their time. When mobility becomes increasingly electrified, then energy data becomes part
of the bigger ecosystem. Only then a cross-optimization of energy and mobility in terms of
multimodal resources194 becomes a possibility. However, without modern platform
techniques, such complex and intertwined data flows as required in the digitalizing city, will
essentially be broken.
2.4 MAIN TECHNICAL CHALLENGES
Urban data is not being sufficiently sourced, i.e. collected, or shared. Limits in data
acquisition and inappropriate forms of storage limits the potential of full-fledged big data
usage:
The data is captured by real-time data generators, smart devices, but are confined in
closed systems. [I-MC-1]
Big data is seen as a commodity, although there are a lot of proprietary systems and
still Excel tables as major form of data storage and sharing! [FG-TechPro]
The data collected and reported is very large grained. What such installation cannot
account for in a city are the varying local aspects, e.g. time of peak usage is different
at different locations. [I-MC-1]
Oversupply of data is a definite need for such technology drivers [like machine
learning, big data computing]: the value creation only begins after certain richness and
abundance has been achieved. [I-AI-1]
194 S. Rusitschka et al, (2014) “Big Data meets Smart City – Optimization of Multimodal Flow Networks,” VDE
Congress 2014 - Smart Cities.

139
Whilst urban big data sources (see section 2.1) are increasingly being identified, such as
social media, or rolled-out by the city and its partners, such as sensor data for mobility or
energy efficiency, the data still remains in silos or in old storage technologies or is not
collected at high-resolution. This is mainly due to the “big data investment dilemma” in
cyber-physical systems: the one who invests in sourcing the data wants to reap value first –
but big data value mainly materializes when it is merged and analysed at large-scale with
many other sources and put to use in form of an action – maybe not even in the domain of the
investor. As stated above, for reliable machine learning oversupply of data is even a basic
requirement. The economical externality of this aspect is discussed in section 3.1. However,
currently this is mainly seen as a technological challenge, because even if the investment
dilemma was solved and the investors were willing to share the data, how the data is being
collected and stored massively influences how easily it can be shared:
Data, Services, and Systems are not or only poorly integrated, especially in inter-
city or international scenarios, such as access to health services, or travel. [FG-
Citizen]
Today, the city interworking is mainly made up by entirely different and oftentimes
independent processes, from traffic census to urban planning. However, the city is so
complex that brute force attitude to integrate all processes at once inevitably fails.
Instead, we would need a process of how everything can grow together in
evolutionary steps. This was the case with the Internet, where new platforms
emerge one after the other extending or replacing the previous. [I-AI-1]
Now, it is more important to be resilient to fast technological evolutions, i.e. if a
new and better storage technology is available, the platform and processes must enable
to swiftly replace the old storage technology. There should be no technology lock-in.
[I-MC-1]
Agility seems to be a common denominator. Even if the short-cut answer seems to be that all
one needs is a big city “data lake”195, there is not short-cut path to it. Integrating big urban
data will require evolutionary steps and accompanying platforms. Building such
platforms will need to take into consideration that in the short history of big data there have
been disruptive technology waves every three years196 changing the ways, data is being
collected, stored, analysed an used.
Maintaining the privacy and security of the data being collected is also a very important
challenge. Bottom line, it affects user acceptance – especially in the city:
Nonetheless, there is the growing unease of “we become transparent” when using
big data technology. [FG-City]
Different stakeholders need to be allowed access to different portions of the data being stored
and collected and this security must be maintained at all levels of the network. The data must
also be anonymised sufficiently so that the customers cannot be individually identified even
after the data analysis. This is very difficult as the focus group findings as well as the
following example show:
Only four spatio-temporal points, approximate places and times, are enough to uniquely
identify 95% of 1.5M people in a mobility database. The study further states that these
195 http://en.wiktionary.org/wiki/data_lake 196http://byte-project.eu/wp-content/uploads/2014/09/BYTE_D1-
4_BigDataTechnologiesInfrastructures_FINAL.compressed.pdf

140
constraints hold even when the resolution of the dataset is low, mobility datasets and metadata
circumvent anonymity.197
Anonymisation and security are a challenge considering algorithms that learn
(hidden) relationships within systems and about individuals through massive amounts
of data coming from many sources. [FG-TechPro]
Data validation is a challenge; however, benefits of solutions depend on it. [FG-
TechPro]
Current techniques in privacy and data protection, the lack of transparency also
result in side-effects of security protocols, e.g. data access deadlock in case of a
deceased person. [FG-Citizen]
Current processes create frictions when sharing data; data provenance and quality,
data privacy and security solutions are not satisfactory. [FG-City]
Nonetheless, creating user acceptance by assuring privacy and data security is essential for a
sustainably digitalizing city. Of course, there is always the technically correct argument that
when user benefits enough they will be willing to share their data no matter the privacy
consequences such as with Facebook198 or Google Maps for navigation. However, such an
argument inevitably leads to social and ethical as well as regulatory externalities, which will
be discussed in sections 3.2 and 3.3. The following is the opposing argument of “trustworthy
structures” as a technical solution to this technical challenge:
[...]We need structures, i.e. digital methods, which we trust; trustworthy structures.
[...] In some instances this may translate that companies and individuals use own
structures, instead of uploading all data to be managed by the knowledge graph of
Google. These structures will impede data misuse; they will detect unintended use.[I-
AI-1]
Smart city is a complex cyber-physical system of people, resources, and infrastructures. The
creation of value from big urban data will require smart city platforms to mimic what big data
natives are already capable of cost-effective scalability and user experience. For many
technology providers this seems to be a challenge:
Scaling algorithms and infrastructure with size and increasing demands for online and
real-time. [F-TechPro]
Creating the right user experience per stakeholder of a city platform. [F-TechPro]
An interesting implication of this technical challenge is that big data currently represents a
monopoly, as the majority of technology providers active in the smart city domain are not
capable of delivering both the scale and the user experience in such a complex setting as in
the smart city, whereas big data native players, such as Google and Facebook operate at much
greater scales also regarding the versatile stakeholders of their ecosystems, such as
advertisers or social game companies. This implication as a legal and political externality is
further discussed in sections 3.3 and 3.4.
197 de Montjoye, Yves-Alexandre, César A. Hidalgo, Michel Verleysen, Vincent D. Blondel (2013, March 25):
"Unique in the Crowd: The privacy bounds of human mobility". Nature srep. doi:10.1038/srep01376 198 http://readwrite.com/2010/01/09/facebooks_zuckerberg_says_the_age_of_privacy_is_ov

141
2.5 BIG DATA ASSESSMENT
Smart cities are complex systems of resource infrastructures such as energy, transport, and
information. The many stakeholders of a smart city ecosystem, from infrastructure to service
providers to end users, require a common understanding of these complexities and the
potential synergies. Only if synergies in resource usage across all interdependent
infrastructure are leveraged, can the complexities associated with big data in smart cities be
addressed, i.e. potentially massive amounts of data coming from intelligent infrastructures
and especially always connected end users giving way to unnecessary data storage and
potential profiling. Eventually, the city will require platforms, which act as facilitators of
digitalization and usage of data culminating in big data as seen in the digital
transformation of domains, such as content & media:
City open data platforms, or federated open data portals, also enable digitalization and
opening data of analogue sources like libraries. [FG-City]
Building platforms, data aggregation, and building applications are the main creation
and usage scenarios for technology providers. [FG-TechPro]
So, the smart city will need to work with platforms on which data can be analysed
and shared with other sources as well. [I-MC-1]
However, many cities do not yet have the organizational setup to create what is needed. Still
there seems to be a disconnect between successful data-driven smart city pilots and their
successful rollout. After the technological feasibility has been shown for a pilot use case,
three questions still remain unanswered: (1) What is the operator model? (2) What are the
business models? (3) Does it scale? These questions need new responsible city officials to
answer, such as the Chief Data Officer created in many of US cities since 2011199:
Cities are currently not concerned with Big Data and Cloud Computing as part of
their internal IT. [I-MC-1]
The City […] will have a Chief Information Officer for the first time. [I-MC-1]
Only one of the ten local authorities is driving the pooling and interoperability of data
sets. [I-MC-1]
Big Data is seen as commodity – but technologically not used as such, since
majority of existing solutions are still proprietary systems, or Excel-based, or can
only be called “somewhat open data” platforms. [FG-TechPro]
In the recent years, the discussion around smart cities has shifted from a sole technological to
a more user-oriented one. The increasing populations of the cities and how citizens are
interacting with technology in their day-to-day life is demanding cities to make use of
digitization. However, this is both a techno-economical as well as an organisational paradigm
shift for cities as it has been for other sectors: Non-digital born sectors are just not used to
“all data:”
Oftentimes potential big data turns out to be “tiny data” due to the many proprietary
and incompatible data sources, invalid data etc. [FG-TechPro]
Traditionally, like many other sectors, cities have been managing only the necessary
data – not all data. [I-MC-1]
199http://www.governing.com/blogs/bfc/col-city-chief-data-officers-performance-new-york-philadelphia.html

142
Nonetheless, cities can be seen as early majority in adopting big data technologies due to
their commitment to enabling a better life, safer environment, which requires modernization,
sensorisation and automation of non-digital infrastructures. The cross-optimization of energy
and transport becomes possible when the multimodal networks are represented as a
multilayer virtual network and combined with real-time data. This is the very definition of
big data: a scenario, in which high-volume, high-velocity and high-variety information assets
that demand cost-effective, innovative forms of information processing for enhanced insight
and decision making200.
Today temporal data is rather used through large-grained patterns. In the future these
temporal patterns will be much more fine grained to optimized also in (near) real-
time, not only in planning. [I-MC-1]
For aspects like air pollution, individual sensors only enable lose control. [FG-City]
When more fine-grained information is needed with respect to capturing temporal
and spatial aspects, big data computing is inevitable. [I-MC-1]
All one needs to look for in big data, so the argument goes, are more and more correlations
vs. what we need to look for in big data can only ever be discovered through the lens of
theory.201 However, if the analytics should also give insights about what actions need to be
undertaken, i.e., prescriptive analytics, then theory of system behaviour is absolutely
necessary. At the same time the system may be changing in different ways than initial models
can predict, hence a real-time monitoring of both data and model is necessary to capture so-
called concept drift.
Data-driven analytics is required when dealing with data-rich but theory-poor domains such
as online communities and neuroscience. The city, however, is a planned, constructed, and
engineered system, consisting of increasingly digitized physical infrastructure. Models based
on physical laws such as the flow network models use known external knowledge of the
physical processes. At the same time, in today’s complex systems and increasing dynamics
through liberalized economic transactions, end user participation with their shared resources
– e.g. cars to provide transportation, or PV installation to provide energy – numerical analysis
to solve these models becomes very hard.
With model- and data-driven analytics, more data leads to better models, and better models
lead to smarter data – enabling actionable knowledge without invading privacy or
compromising confidentiality. These are all new frontiers, which will require years of
research before producing feasible answers.
3 ANALYSIS OF SOCIETAL EXTERNALITIES
In the following we will present the societal externalities as collected and analysed after the
focus group workshop and interviews. Each subsection starts with a table of the findings
followed by a brief discussion. The statements that lead to a finding are quoted in the same
manner as described in section 1.1. Each finding related to an externality is coded as defined
in the case study methodology of EU BYTE. This will enable the cross-analysis of the
different case studies conducted in BYTE to form a sound basis for the policy and research
roadmaps for Europe. The codes can also be found in Table 55 of this deliverable.
200 http://www.gartner.com/it-glossary/big-data 201 http://archive.wired.com/science/discoveries/magazine/16-07/pb_theory

143
3.1 ECONOMICAL EXTERNALITIES
Table 51 Economical externalities of big data in a digitalizing city
Code Quote/Statement [source] Finding
E-OO-BM-2 [I-MC-1] The data is captured by real-time data generators,
smart devices, but are confined in closed systems. So, the
smart city will need to work with platforms on which data
can be analysed and shared with other sources as well.
[FG-TechPro] There are no incentives for data sharing
required at that big scale.
[I-MC-1] For example, the city [...] is currently developing a
smart card infrastructure for transportation. Although the bus
system is deregulated, becoming part of the ecosystem is
advantaEarthObvsus for the bus companies.
Need for data sharing
favours forms of
concentration like
platforms,
ecosystems.
These concentration
forms are hard to
kick-start at the scale
of a complex system
such as the city.
E-OO-BM-5 [I-MC-1] Cities are not businesses, i.e. the return on
investment will not be given by scaling. A contractor
company working with a city can do this, i.e. create a
working solution for one city and sell it to the next with
minimal or no changes.
[I-MC-1] the size of the market matters. Just one city does
not offer a big enough market to create a significant market
pull. So, in UK, six or seven, cities group together to procure
new technology. In contrast, China has such huge
infrastructure projects. And because of that scale, standards
come from there. [...] Much of the innovation happens in US,
because the market is so huge.
Given the complex
interrelations in a
city, building big
data structures for it
requires a size.
The size of the
market determines
technology standards
for the rest.
E-OO-TEC-1 [I-MC-1] Investment into data infrastructures, not only
sensorisation but also data collection and storage, will be
similar to investments into a new shopping centre. They need
an “anchor tenant,” such that people will travel to go there.
[I-MC-1] The transportation card needs a digital
infrastructure investment, free Wi-Fi in busses etc. However,
the city needs to ensure interoperability.
[I-MC-1] There is the cultural issue about how one perceives
innovation and R&D: A lot of companies are sitting on their
money, instead of looking for new ways to invest.
[I-AI-1] Oversupply of data is a definite need for such
technology drivers: the value creation only begins after
certain richness and abundance has been achieved [...] There
are opponents to this view. However, this opposition may
also originate from the lack of willingness to invest.
Investments by the
private sector need to
be secured by
reduction or
compensation of
future uncertainties.
Otherwise the current
state of lack of
investments will
remain.
E-OC-TEC-2 [FG-TechPro] There is immense efficiency increase
potential along the dimensions of time, costs, and resources.
[I-AI-1] The entire supply system in a city, from mail to
groceries is inefficient [...]: the single drives to malls, the
many stops of the same mail delivery companies sometimes
multiple times a day, etc. In our digitalizing days, we have
The final return on
investment through
efficiency gains
compared to the
current non-
digitalized utilities
and processes is

144
[...] the ability to bundle through digital controls and
intermediation.
undisputed.
E-OC-LEG-3 [FG-TechPro] Funding or monetization is challenging, even
if technology is feasible and potential benefits can be
quantified.
[I-IA-1] We have to measure by the use of data: then the data
generator, the end user, cannot receive money for the raw
data. For example, Amazon uses the transactional data of its
users to optimize and create efficiency gains, which then are
reflected in better offers. The benefit of the raw data only
materializes, when it is used and value is created, which
penetrates through to the end user. We have to measure by
the use of the data, not by its source, collection, or storage.
[I-AI-1] the type of machine learning algorithms we are using
combines and melts data to find insights, underlying
structures within data, which are useful. After such use the
raw data is not even traceable [...] to pay for the raw data
would be equally foolish.
[I-IA-1] Facts and data cannot be copyrighted; hence
environmental data captured by sensors surrounding us
should be open.
[FG-City] Data ownership by private sector
Monetization of big
data remains a
moving target.
Strong arguments
against short-term
business model of
data marketplaces.
Data ownership
seems to be a faulty
concept, on which
we build laws and
businesses.
E-PC-DAT-1
E-OC-DAT-2
[I-IA-1] It is an intricate question then why would anyone
want to invest into this data infrastructure. The answer is
more complex, but there may be two components to it: (a) it
is also part of the investment to facilitate the fast and good
usage of data (b) the owner of the data infrastructure is
allowed to reap value first but opens the data after that,
similar to scientific use of data.
[I-MC-1] If such [statistical] data were opened, also small
businesses could afford to analyse it, and answers can be
derived down on a much more focused and local level.
[I-AI-1] The investment into a data infrastructure must be
a centre piece in the city. Once the infrastructure is in place
and used by the city administration and stakeholders, maybe
co-investors, then that data should be opened: they represent
facts about the city. When opened, much more value can be
created by the masses of “urban hackers” and start-ups,
which will naturally be drawn to such cities.
[FG-City] Data-savvy cities offer economic benefits to the
new digital sector, and hence increase the city’s welfare.
[I-AI-1] The secure usage of data can ignite new business
models in the digital world, similar to secure money
transport. The machine learning algorithms used for fraud
detection with credit cards for example do give trust. Loss of
trust is loss of business.
In case of the digital
city, big data
investment dilemma
can be solved:
Investment by the
public sector into the
data infrastructure of
a city and the
subsequent opening
of this infrastructure
as a
utility/commodity
will create a win-win
for all, ignite new
business and increase
welfare.
145
E-OO-BM-3 [I-MC-1] With the current process of procurement, the
incentive is only on choosing the cheapest technology.
[I-MC-1] [...] new trends are beginning to emerge within
cities: open innovation, open procurement to free from
long period and rigid supplier contracts. In these changing
environment, cities require more flexibility and working in
ecosystem of providers. Recently, the Open and Agile Cities
initiative was launched.
[I-MC-1] Many initiatives now prefer the OpenStack
approach. It is definitely a new mindset, compared to the old
“one-supplier-vertical-integration”.
[I-MC-1] There is a vast area to mandate interoperability,
through best practice and requirements sharing, e.g. for new
sensor technologies. The European Commission basically has
[new] mechanisms for that. However, large companies rely
on old ways of procurement, and this might be a risk to
them.
Old incentives are
being overthrown,
putting large
companies relying on
these old structures
at high risk.
E-OC-BM-5 [I-AI-1] [...] benefits will outweigh the traditional business
case of not investing in such a data infrastructure, e.g. keep
counting cars at street corners by men sitting on chairs the
whole day.
Old jobs are at risk.
E-OC-BM-3 [FG-City] Cities require data capability team or sustainability
teams with analytics views in order to create more value-ass
from available data. There are already cities employing city
analytics managers.
[FG-TechPro] App developers
New skills are
required and create
new jobs.
The need for data sharing favours forms concentration like platforms and ecosystems on
through which the costs of data acquisition, curation, storage, and analyses cab be shared by
the many stakeholders. This may be true for other sectors, however, we believe that these
concentration forms are hard to kick-start at the scale of a complex system such as the city.
Although quasi-monopolistic and not preferable in the long-run, building big data structures
requires a certain size. The size of the market determines technology standards for the rest.
There is a new trend also followed by the cities that open source and open platforms might
be an answer to create the favoured forms of concentration without the monopolistic
structures. Hence, for the digital city, it seems, the big data dilemma may be easier to solve:
Investment by the public sector into the data infrastructure of a city and the subsequent
opening of this infrastructure as a utility/commodity will create a win-win for all, ignite
new business and increase welfare.
The final return on investment through efficiency gains compared to the current non-
digitalized utilities and processes is undisputed. Nonetheless, monetization of big data
remains a moving target. Investments by the private sector need to be secured by reduction or
compensation of future uncertainties, otherwise the current state of lack of investments will
remain. Short-term business models which do not take technology peculiarities into
account are risky: Data marketplaces for example, not only ignore that raw data in itself
has no value, but also with advanced machine learning algorithms to create value from
massive amounts of raw data, that it is very hard to track raw data for billing or for
146
prosecuting copy-right infringements. Regarding the reduction of uncertainties: Clearing
ambiguities of copyright202 in the era of big data and open data should also be the utmost
purpose of a new legal framework, as also briefly discussed in section 3.3. Data ownership
seems to be a faulty concept, on which we build laws and businesses.
In general, old incentives, such as through current procurement processes, are being
overthrown, putting large companies relying on these old structures at high risk. Similarly,
with the increasing potential of machines that learn203old jobs consisting of simple tasks are
also at risk. New skills are required and create new jobs, but numbers are most likely not
equal – also see discussion in the following section.
3.2 SOCIAL & ETHICAL EXTERNALITIES
Table 52 Social & Ethical Externalities in a digitalizing city
Code Quote/Statement [source] Finding
E-OC-BM-5 [I-AI-1] benefits will outweigh the traditional business case
of not investing in such a data infrastructure, e.g. keep
counting cars at street corners by men sitting on chairs the
whole day.
As a society we are
responsible to find
answer to the new
question: what will
men do when
machines learn
simple tasks?
E-PC-ETH-1 [I-AI-1] It is not long before we will see the creation of
further utilities of care [groceries, mail, health services], as
we are used to with gas, water, electricity etc.
[I-MC-1] [...] analogies, e.g. there are regulations about how
you use land, but not on how you build houses on that land –
which results in wrong type of houses being built. Instead,
here should be tighter regulation on what to build as
indicated by the need for it – and less on regulations on
how to use the land, i.e. we want social aspects to be the
driver etc.
Socially desirable
outcomes must be
formulated first.
Foster research into
big data for social
good – especially
in the digitalizing
city.
E-OC-ETH-7
E-CC-ETH-1
[FG-City] Invisible sensors in a digitalizing city raise trust
issues.
[I-AI-1] In the same way we trust the computer-assisted
mechanisms today, such as autopilot in a plane, we can trust
computing methods, which will prevent malpractice in data
collection and sharing.
[FG-Citizen] Data-driven apps are welcome when useful, but
the feeling that one “gives away too much” of themselves is
increasing through increasing use and debate of personal or
urban data.
Trust in computing
methods for big
data may be harder
to establish because
big data enables the
understanding,
optimization, and
improvement also
of individuals.
E-OC-ETH-1
E-PC-ETH-2
[FG-Citizen] Data-driven technologies that can give citizens
“heads up” make life easier, and the city more liveable. Out
of hours services save vain trips that saves time and
Big data in a
digitalizing city has
immense potential
202 “Copyright does not protect facts, data, or ideas though it does protect databases.”
http://www.lib.umich.edu/copyright/facts-and-data 203https://www.ted.com/talks/jeremy_howard_the_wonderful_and_terrifying_implications_of_computers_that_c
an_learn

147
resources.
[FG-Citizen] Data-driven apps enable informed and secure
travel, better planning, or increase the ability of
responsiveness as a user of infrastructures and services in
case of disturbances, avoidance of mass panic and decision
making under stress, which can save lives.
for creating social
good.
E-OC-ETH-4
[FG-Citizen] Low-income citizens can enjoy same or
similar offerings in a city through the comparison web sites,
and service specific sites.
[FG-Citizen] Profile-based pricing of services, and risk-
based business models have negative impact on people
right to equality.
[FG-City] Cities must also take care of the non-digital, be it
citizens or infrastructures, e.g. backup non-digital, digital
divide.
All data is created
equal, but utilizing
data-driven
services will create
new debate on
assuring “enough”
equality.
E-OO-DAT-4 [FG-Citizen] Internet-access and apps cost, which prevents
some citizens from enjoying the same offers as the rest.
[FG-Citizen] Trustworthy information, lack of efficiency
gain information, or aggressive ads can prevent from
usage of data-driven services.
There are many
different reasons
why not all citizens
will reap the value.
The potential of big data to be used for social good is immense especially in the
digitalizing city204. However, there is a range of pitfalls, we, as a society, need to take care
of: The immense reliance on data-driven services will need a new debate on how we can
assure “enough” equality, when there are so many different reasons why not all citizens
will reap value from data in equal amounts. This may be due to the digital divide we have
been aware of for a while now, or to entirely new challenges through recent technological
breakthroughs such as deep learning, which enable machines to learn and take over simple
tasks, such as counting cars or recognizing letters. As a society we are responsible to find the
answer to the new question: “what will men do when machines learn simple tasks?” Trust in
computing methods for big data may be harder to establish because big data enables the
understanding, optimization, and improvement also of individuals. Socially desirable
outcomes must be formulated first.
3.3 LEGAL EXTERNALITIES
Table 53 Legal externalities of big data in digitalizing cities
Code Quote/Statement [source] Finding
E-OO-TEC-1 [I-AI-1] It is foolish to believe raw data can and should be
protected by a data police: the type of machine learning
algorithms we are using combines and melts data to find
insights, underlying structures within data, which are useful.
After such use the data is not even traceable – if you will:
machine learning can protect privacy.
[FG-City] Algorithms define what will be found, e.g. in
For the same
reasons205 to open
crypto-algorithms,
machine learning
algorithms must be
open sourced.
204 http://www.hsph.harvard.edu/ess/bigdata.html 205 https://www.schneier.com/crypto-gram/archives/1999/0915.html

148
case of libraries being digitalized and indexed as with search
engines would mean that popular literature easier to find than
rare – which is opposing to the foundation of libraries.
E-PO-LEG-1
E-PC-LEG-4
[I-MC-1] Also with transactional data, there are not many
surprises to be found in the data. As an example from
insurance companies, who mainly collected and managed
master data, insights cannot really be gained but rather facts
can be reported about. In comparison, mobile phone data
has a lot of metadata that can help in extracting new
insights, especially when correlated with other data.
However, it also requires peoples’ permission and
understanding of data.
[I-MC-1] Regulatory frameworks [...] are changing,
breaking down.
[I-MC-1] In the past we have seen that well regulated
companies have advantages: take the car manufacturer
business in Japan versus US. The car manufacturing was a lot
about materials, safety, and supply chains. If we think of data
as a good/resource as well then regulation might help
companies to turn these resources into value in a more
sustainable way.
[I-MC-1] there is the ideological split whether there should
be more or less regulation. It depends on the level and on
who is being regulated. In all of these decisions the citizens
should be put first.
[I-MC-1] [...] regulation must also be against special
interest protectionism of incumbents and new players alike,
and instead put citizen first.
[I-AI-1] In Germany, we have the principal of data
minimization that opposes the technical need of data
abundance. Data minimization is seen as the principal to
grant privacy. Data privacy should really protect the
individual instead of sacrificing opportunities by
avoidance.
[I-AI-1] There is the other principal of informational self-
determination, which is a basic right of an individual to
determine the disclosure and use of her personal data. Again
there is the misunderstanding: each piece of data originates
through us, like leaving footprints on the beach. We have to
ask ourselves: so what? And only if there is a practical – not
a theoretic – threat to privacy invasion, only then measures
must be taken. These countermeasures, the penalties of data
misuse, must be so high that they will prevent misuse.
[I-AI-1] the cities should invest and open up, and hence
facilitate the explosion of creativity, without angst, without
data avoidance. In order to cultivate such a perspective, the
full force of the law must be brought to bear in taking action
against data misuse.
New sources of
data create new
ways that data can
be misused – our
legal framework
needs an upgrade,
with the core
principal of putting
the individual first.

149
E-PC-LEG-3 [I-AI-1] At the end all data, be it of natural language- or
sensor-origins, is usage data – hence originating from the
user. We need to step back from the definition of data and
data carrier.
[I-AI-1] Privacy threat is created by abuse of data not the
use of data. You still trust the bank with your money even
though there is potential of a robbery or other forms of abuse.
Bottom line is, we should not interfere too early: data
collection and sharing should be facilitated.
[I-AI-1] The past NSA affair showed that is utopian to think
that data misuse can be prevented. Instead we need
structures, i.e. digital methods, which we trust; trustworthy
structures. We have to stay clear from avoidance structures
[...] These structures will impede data misuse, they will
detect unintended use, and laws must be in place to
severely punish misuse.
Put the citizen first,
not her data, when
wanting to protect.
New sources of data create new ways that data can be misused. We are in need of a new legal
framework with the core principal of putting the individual first. Data ownership seems
to be a faulty concept, on which we build laws and businesses. In addition, with big data
computing, machine learning algorithms which prescribe actions as derived through that
data become a centre-piece: Businesses, critical infrastructures, and lives may rely on these
actions and as such these algorithms must become public. The same understanding of open
source and security in the cryptography domain206 should apply to machine learning
domain. Either we wait until this understanding also established in the big data domain, or the
new and digitally literate legal frameworks come with these transitive best practices already
built-in.
In turn, this argument has an economic externality, since almost any business working with
data today, mostly considers data but especially the algorithms that create value from this
data as their intellectual property and competitive advantage. It may well be that, at the end of
this big data paradigm shift, we realize that data as well as algorithms to mine the data are
required commodities to create value through user experience and services.
Another major point regarding legal externalities was made in the discussion of economic
externalities of how big data structures favour monopolistic forms of concentration (see
3.1). Here the analogy of “data as a resource” again turns out to be very suitable. Because
turning data into value requires special skills and technologies that are currently concentrated
at a few digital-native companies, these companies can be considered to expose monopolistic
structures. Whilst in other domains, the typical legal answer is liberalization – in technology-
driven domains, this does not work effectively207. On the other hand, favouring of open
source in order for other companies to be able to use same technologies, may be a very
suitable instrument in the data economy to open monopolistic structures.
206 https://www.schneier.com/crypto-gram/archives/1999/0915.html 207 Liberalization of metering business in Europe still is lagging, because the technology of smart metering still
lacks viable business cases and cost-effective technology.

150
3.4 POLITICAL EXTERNALITIES
Table 54 Political externalities of big data in digitalizing cities
Code Quote/Statement [source] Finding
E-OC-LEG-1
E-OC-LEG-2
[I-MC-1] There is a transitional relationship between
public sector, universities, and industry. [...] However,
large international companies do have local presences;
many selling web-based, digital products and services.
So, all three, the public, industry, and universities, can
be all in different nations –digitalization is in a sense
great for mobilizing the European market to become
as interesting to innovators.
[FG-TechPro] Data location determines which
legislation, since there is no unified data legislation in
Europe, this makes scaling a data-driven business very
difficult – due to the many adaptations with respect to
small national markets.
[I-MC-1] There is no big market in Europe compared to
US. But with respect to infrastructure, e.g. mobile
telecommunications market, Europe is much better
connected.
Big data business can
weaken European
economy, if big data
monopoly of companies
like Google, Amazon,
etc. remains.
Big data business can
improve European
economy, but requires a
unified European data
economy with
accordingly unified
policies.
Policymaking should
build on digitalizing
already strong European
physical infrastructures.
E-PC-ETH-1 [I-MC-1] At EC level we rather need coordination and
not restriction. And this coordination also should put
citizens first.
[FG-City] Personalized, i.e. citizen-centric, policy-
making and services with immediate feedback become
possible for the first time.
Policy makers should
take advantage of
digitalization and use
the potential of big data
for policymaking.
The “economies of digital” blur the boundaries we know from the non-digital world: a city,
national or EarthObvsgraphic boundaries. The challenge of “small markets” was also
mentioned in the economical externalities discussion in Section 3.1 followed by the evidence
that European cities are starting to leverage the “economies of digital” to their advantage.
Instead of feeling neglected by technology providers who require a substantial market pull,
they form so-called agile open cities initiatives to create market pull. Similarly policy making
for Europe needs to take the lead in creating a substantial market pull by creating a unified
European data economy with accordingly unified policies. European policymaking should
also focus on build on digitalizing already strong European physical infrastructures through
the cities.
“No infrastructure – whether it is a road, a building, a broadband network or an intelligent
energy grid – will have a transformative effect on a city unless it engages with individuals in
a way that results in a change of behaviour”208. As also concluded in the focus group
discussions: “Personalized, i.e. citizen-centric, policy-making and services with immediate
feedback become possible for the first time.” Policy makers should take advantage of
digitalization and use the positive potential of big data for policymaking.
208http://theurbantechnologist.com/2012/08/13/the-amazing-heart-of-a-smarter-city-the-innovation-boundary/

151
4 CONCLUSION
The smart city case study on the societal externalities of big urban data captured some
interesting insights through the analysis of a focus group workshop findings and interviews.
The illustrative user stories with a few examples of new smart city initiatives such as “the
linked city” or “participatory sensing” exhibit typical big data characteristics of integrating
the variety of available and new data sources, or creating higher volume, higher velocity data
through increased sensorisaton and its use for real-time optimizations. Although some
European cities can be seen as early majority to adopting big data, organizational and cultural
changes will still be required to create value from big urban data in a sustainable way.
There is the typical big data investment dilemma also in the cities, however, an investment by
the public sector into the data infrastructure of a city and the subsequent opening of this
infrastructure as a utility/commodity can create a win-win outcome for all stakeholders.
Open source and open platforms seem to be an answer to create the favoured forms of
concentration without the monopolistic structures that are characteristic of the current big
data players. The potential of big data to be used for social good is immense especially in the
digitalizing city. However, there is a range of pitfalls, we, as a society, need to take care of:
The strong reliance on data-driven services will need a new debate on how we can assure
“enough” equality, when there are so many different reasons why not all citizens will reap
value from data in equal amounts. Trust in computing methods for big data may be harder to
establish because big data enables the understanding, optimization, and improvement also of
individuals. Socially desirable outcomes must be formulated first. Personalized, i.e. citizen-
centric, policy-making and services with immediate feedback become possible for the first
time. Policy makers should take advantage of digitalization and use the positive potential of
big data for policymaking for the European cities.
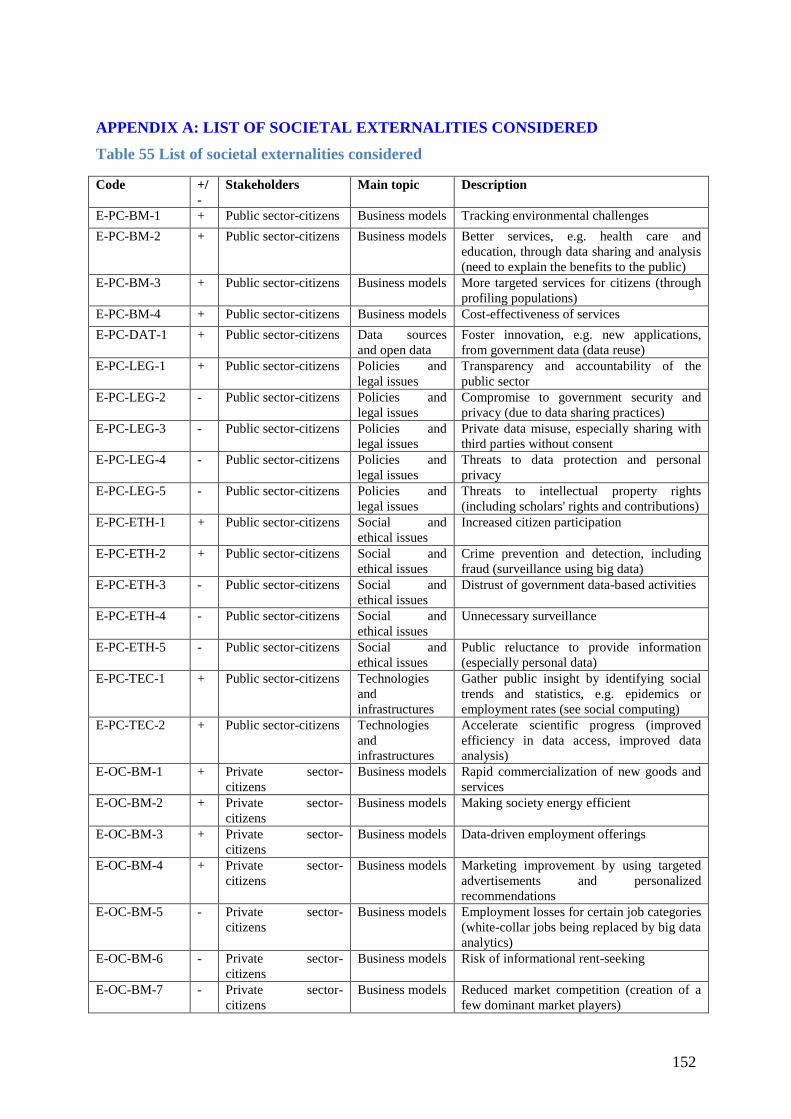
152
APPENDIX A: LIST OF SOCIETAL EXTERNALITIES CONSIDERED
Table 55 List of societal externalities considered
Code +/
- Stakeholders Main topic Description
E-PC-BM-1 + Public sector-citizens Business models Tracking environmental challenges
E-PC-BM-2 + Public sector-citizens Business models Better services, e.g. health care and
education, through data sharing and analysis
(need to explain the benefits to the public)
E-PC-BM-3 + Public sector-citizens Business models More targeted services for citizens (through
profiling populations)
E-PC-BM-4 + Public sector-citizens Business models Cost-effectiveness of services
E-PC-DAT-1 + Public sector-citizens Data sources
and open data
Foster innovation, e.g. new applications,
from government data (data reuse)
E-PC-LEG-1 + Public sector-citizens Policies and
legal issues
Transparency and accountability of the
public sector
E-PC-LEG-2 - Public sector-citizens Policies and
legal issues
Compromise to government security and
privacy (due to data sharing practices)
E-PC-LEG-3 - Public sector-citizens Policies and
legal issues
Private data misuse, especially sharing with
third parties without consent
E-PC-LEG-4 - Public sector-citizens Policies and
legal issues
Threats to data protection and personal
privacy
E-PC-LEG-5 - Public sector-citizens Policies and
legal issues
Threats to intellectual property rights
(including scholars' rights and contributions)
E-PC-ETH-1 + Public sector-citizens Social and
ethical issues
Increased citizen participation
E-PC-ETH-2 + Public sector-citizens Social and
ethical issues
Crime prevention and detection, including
fraud (surveillance using big data)
E-PC-ETH-3 - Public sector-citizens Social and
ethical issues
Distrust of government data-based activities
E-PC-ETH-4 - Public sector-citizens Social and
ethical issues
Unnecessary surveillance
E-PC-ETH-5 - Public sector-citizens Social and
ethical issues
Public reluctance to provide information
(especially personal data)
E-PC-TEC-1 + Public sector-citizens Technologies
and
infrastructures
Gather public insight by identifying social
trends and statistics, e.g. epidemics or
employment rates (see social computing)
E-PC-TEC-2 + Public sector-citizens Technologies
and
infrastructures
Accelerate scientific progress (improved
efficiency in data access, improved data
analysis)
E-OC-BM-1 + Private sector-
citizens
Business models Rapid commercialization of new goods and
services
E-OC-BM-2 + Private sector-
citizens
Business models Making society energy efficient
E-OC-BM-3 + Private sector-
citizens
Business models Data-driven employment offerings
E-OC-BM-4 + Private sector-
citizens
Business models Marketing improvement by using targeted
advertisements and personalized
recommendations
E-OC-BM-5 - Private sector-
citizens
Business models Employment losses for certain job categories
(white-collar jobs being replaced by big data
analytics)
E-OC-BM-6 - Private sector-
citizens
Business models Risk of informational rent-seeking
E-OC-BM-7 - Private sector-
citizens
Business models Reduced market competition (creation of a
few dominant market players)

153
E-OC-BM-8 - Private sector-
citizens
Business models Privatization of essential utilities (e.g.
Internet access)
E-OC-DAT-1 + Private sector-
citizens
Data sources
and open data
Enhancements in data-driven R&D
E-OC-DAT-2 + Private sector-
citizens
Data sources
and open data
Fostering innovation from opening data
E-OC-DAT-3 + Private sector-
citizens
Data sources
and open data
Time-saving in transactions if personal data
were already held
E-OC-DAT-4 - Private sector-
citizens
Data sources
and open data
Creation of data-based monopolies
(platforms and services)
E-OC-LEG-1 + Private sector-
citizens
Policies and
legal issues
Increased insight of goods (more
transparency)
E-OC-LEG-2 + Private sector-
citizens
Policies and
legal issues
Increased transparency in commercial
decision making
E-OC-LEG-3 - Private sector-
citizens
Policies and
legal issues
Private data accumulation and ownership
(losing control of their personal data)
E-OC-LEG-4 - Private sector-
citizens
Policies and
legal issues
Threats to intellectual property rights
E-OC-ETH-1 + Private sector-
citizens
Social and
ethical issues
Safe and environment-friendly operations
E-OC-ETH-2 + Private sector-
citizens
Social and
ethical issues
Increase awareness about privacy violations
and ethical issues of big data
E-OC-ETH-3 - Private sector-
citizens
Social and
ethical issues
Invasive use of information
E-OC-ETH-4 - Private sector-
citizens
Social and
ethical issues
Discriminatory practices and targeted
advertising (as a result of profiling and
tracking private data)
E-OC-ETH-5 - Private sector-
citizens
Social and
ethical issues
Distrust of commercial data-based activities
(due to lack of transparency or unintended
secondary uses of data)
E-OC-ETH-6 - Private sector-
citizens
Social and
ethical issues
Unethical exploitation of data, e.g. some
types of tracking and profiling,
encompassing concerns about discrimination
and dignity (especially relevant in sensitive
domains such as health or finance)
E-OC-ETH-7 - Private sector-
citizens
Social and
ethical issues
Consumer manipulation
E-OC-ETH-8 - Private sector-
citizens
Social and
ethical issues
Private data leakage (concern about data
protection and cyber threats, especially
bankcard fraud and identity theft)
E-OC-ETH-9 - Private sector-
citizens
Social and
ethical issues
Private data misuse, especially sharing with
third parties without consent
E-OC-ETH-10 - Private sector-
citizens
Social and
ethical issues
Privacy threats even with anonymised data
(easy to de-anonymise) and with data mining
E-OC-ETH-11 - Private sector-
citizens
Social and
ethical issues
Public reluctance to provide information
(especially personal data)
E-OC-ETH-12 - Private sector-
citizens
Social and
ethical issues
"Sabotaged" data practices
E-OC-ETH-13 - Private sector-
citizens
Social and
ethical issues
Lack of context or incomplete data can
result in incorrect interpretations
E-OC-TEC-1 + Private sector-
citizens
Technologies
and
infrastructures
Free use of services, e.g. email, social
media, search engines
E-OC-TEC-2 + Private sector-
citizens
Technologies
and
infrastructures
Optimization of utilities through data
analytics
E-CC-ETH-1 - Citizens-citizens Social and
ethical issues
Continuous and invisible surveillance
E-CC-TEC-1 + Citizens-citizens Technologies Support communities

154
and
infrastructures
E-OO-BM-1 + Private sector-private
sector
Business models Opportunities for economic growth through
community building (sharing information
and insights across sectors)
E-OO-BM-2 + Private sector-private
sector
Business models Innovative business models through
community building (sharing information
and insights across sectors)
E-OO-BM-3 - Private sector-private
sector
Business models Challenge of traditional non-digital services,
e.g. new data-driven taxi and lodgement
services
E-OO-BM-4 - Private sector-private
sector
Business models Monopoly creation through the purchase of
data-based companies
E-OO-BM-5 - Private sector-private
sector
Business models Competitive disadvantage of newer
businesses and SMEs (creation of a few
dominant market players)
E-OO-BM-6 - Private sector-private
sector
Business models Reduced growth and profit among all
business, particularly SMEs (creation of a
few dominant market players)
E-OO-DAT-1 - Private sector-private
sector
Data sources
and open data
Inequalities to data access (digital divide
between big data players and the rest)
E-OO-DAT-2 - Private sector-private
sector
Data sources
and open data
Dependency on external data sources,
platforms and services (due to dominant
position of big players)
E-OO-DAT-3 - Private sector-private
sector
Data sources
and open data
Threats to commercially valuable
information
E-OO-DAT-4 - Private sector-private
sector
Data sources
and open data
Distrust on data coming from uncontrolled
sources
E-OO-ETH-1 - Private sector-private
sector
Social and
ethical issues
Market manipulation
E-OO-TEC-1 - Private sector-private
sector
Technologies
and
infrastructures
Barriers to market entry (due to dominant
position of big players, the need for major
investment, and the complexity of big data
processing)
E-PO-BM-1 + Public sector-private
sector
Business models Opportunities for economic growth (new
products and services based on open access
to big data)
E-PO-BM-2 + Public sector-private
sector
Business models Innovative business models (closer linkages
between research and innovation)
E-PO-DAT-1 - Public sector-private
sector
Data sources
and open data
Open data puts the private sector at a
competitive advantage (they don't have to
open their data and have access to public
data)
E-PO-DAT-2 - Public sector-private
sector
Data sources
and open data
Inequalities to data access, especially in
research (those with less resources won't be
granted access to data)
E-PO-LEG-1 - Public sector-private
sector
Policies and
legal issues
Lack of norms for data storage and
processing
E-PO-LEG-2 - Public sector-private
sector
Policies and
legal issues
Reduced innovation due to restrictive
legislation
E-PO-ETH-1 - Public sector-private
sector
Social and
ethical issues
Taxation leakages (intermediation platforms,
delocalization of data-based corporations)
E-PP-LEG-1 - Public sector-public
sector
Policies and
legal issues
EarthObvspolitical tensions due to
surveillance out of the boundaries of states
E-PP-LEG-2 - Public sector-public
sector
Policies and
legal issues
Need to reconcile different laws and
agreements, e.g. "right to be forgotten"

155
APPENDIX B: PROGRAM OF THE BYTE WORKSHOP ON BIG DATA IN OIL &
GAS
Big data in oil & gas workshop
Telenor Arena (VIP/Main entrance), Meeting room A (third floor)
Widerøeveien 1, Fornebu (Oslo)
16 April, 9:00 – 13:00
Agenda
9:00 – 9:15 Welcome and introductions Roar Fjellheim, Computas AS
9:15 – 9:45 Talk I: Big data in subsea – the operator view
Knut Sebastian Tungland, Soil
9:45 – 10:30 Results of the BYTE case study in Oil & Gas
Guillermo Vega-Gorgojo, Universitetet i Oslo
10:30 – 10:45 Coffee break
10:45 – 12:00 Small group discussions: big data in oil & gas, applications,
challenges and impacts
What additional types of data might be useful for or
associated with oil & gas data? What are some of the
technological processes that underpin the analysis of these
data?
What additional applications or impact areas might result
from analysing data in oil & gas?
To what extent do the potential positive impacts described
here match with your experience or the possibilities you
envision?
To what extent do the potential challenges and negative
impacts discussed here match with your experience? How
have you and your colleagues worked to address these?
How successful has this been?
Report back to larger group
12:00 – 12:30 Talk II: Big data in subsea – the supplier view
Hege Kverneland, National Oilwell Varco
12:30 – 12:45 Closing remarks
Arild Waaler, Universitetet i Oslo
13:00 – 14:00 Lunch
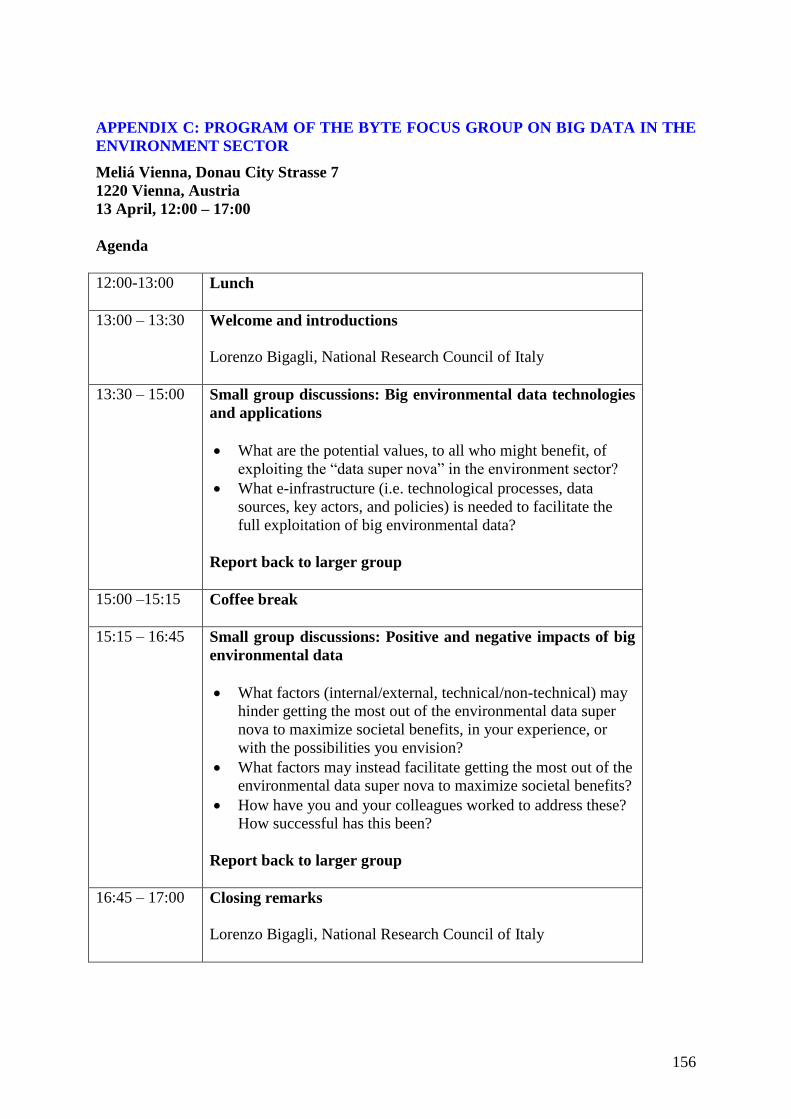
156
APPENDIX C: PROGRAM OF THE BYTE FOCUS GROUP ON BIG DATA IN THE
ENVIRONMENT SECTOR
Meliá Vienna, Donau City Strasse 7
1220 Vienna, Austria
13 April, 12:00 – 17:00
Agenda
12:00-13:00 Lunch
13:00 – 13:30 Welcome and introductions
Lorenzo Bigagli, National Research Council of Italy
13:30 – 15:00 Small group discussions: Big environmental data technologies
and applications
What are the potential values, to all who might benefit, of
exploiting the “data super nova” in the environment sector?
What e-infrastructure (i.e. technological processes, data
sources, key actors, and policies) is needed to facilitate the
full exploitation of big environmental data?
Report back to larger group
15:00 –15:15 Coffee break
15:15 – 16:45 Small group discussions: Positive and negative impacts of big
environmental data
What factors (internal/external, technical/non-technical) may
hinder getting the most out of the environmental data super
nova to maximize societal benefits, in your experience, or
with the possibilities you envision?
What factors may instead facilitate getting the most out of the
environmental data super nova to maximize societal benefits?
How have you and your colleagues worked to address these?
How successful has this been?
Report back to larger group
16:45 – 17:00 Closing remarks
Lorenzo Bigagli, National Research Council of Italy
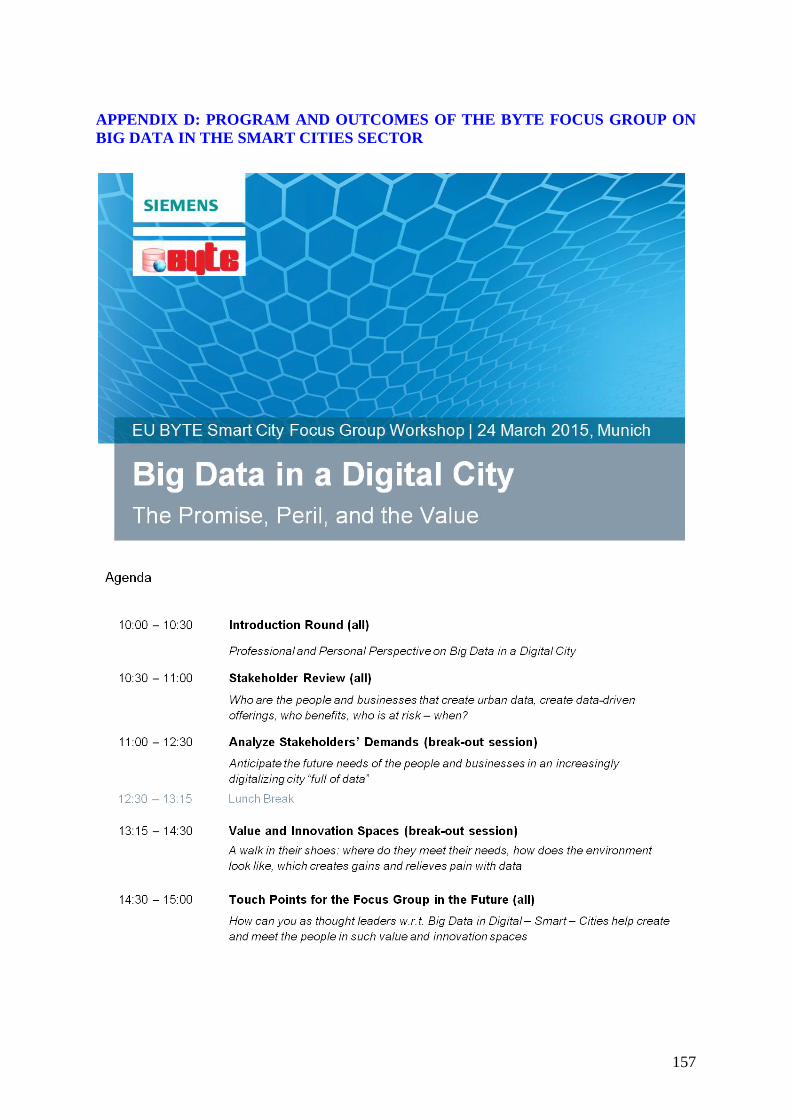
157
APPENDIX D: PROGRAM AND OUTCOMES OF THE BYTE FOCUS GROUP ON
BIG DATA IN THE SMART CITIES SECTOR
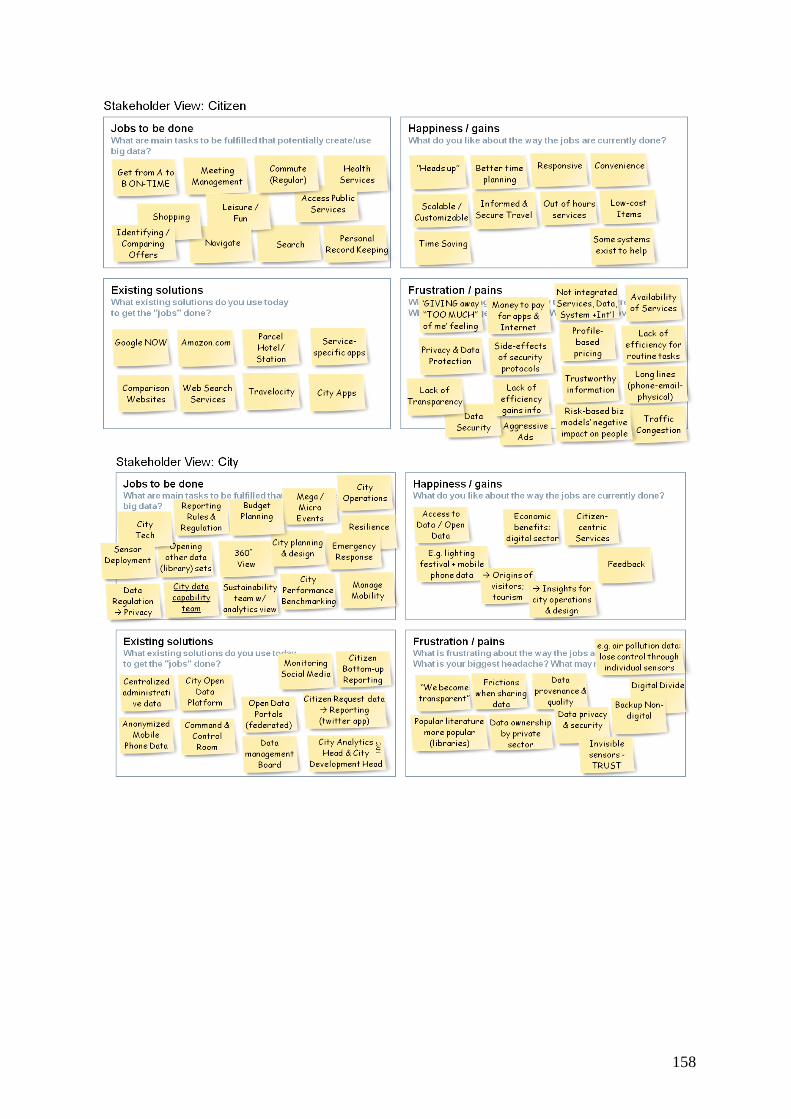
158

159
Related Documents