1 SCIENTIFIC REPORTS | (2020) 10:4108 | https://doi.org/10.1038/s41598-020-60820-x www.nature.com/scientificreports Delineation of Genotype-by- Environment interactions for identification and validation of resistant genotypes in mungbean to root-knot nematode (Meloidogyne incognita) using GGE biplot Bansa Singh 1 , Arpita Das 2* , A. K. Parihar 1 , B. Bhagawati 3 , Deepak Singh 4 , K. N. Pathak 5 , Kusum Dwivedi 6 , Niranjan Das 7 , Nishi Keshari 5 , R. L. Midha 8 , Raju Kumar 4 , Aditya Pratap 1 , Vaibhav Kumar 1 & Sanjeev Gupta 9* Susceptibility to root-knot nematodes (Meloidogyne spp.) is one of the major factors limiting mungbean production in South and South-East Asia. Host-pest-environment interaction in mungbean and root- knot nematode (M. incognita) was investigated in multi-location field evaluation using 38 promising mungbean genotypes extracted from initial evaluation of 250 genotypes under sick plots considering second stage freshly hatched juvenile as inoculants. The extent of environmental and genotype- by-environment interactions (GGE) was assessed to comprehend the dynamism of resistance and identification of durable resistant mungbean genotypes. Among environmental factors, nematode activity was highly influenced by rainfall and minimum temperature. The GGE biplot and multiple comparison tests detected a higher proportion of genotype × environment (GE) interaction followed by genotype and environment on number of nematode galls, gall index and reproduction factor. The first two principal components (PCs) explained 64.33% and 66.99% of the total variation of the environment-centered gall scoring and reproduction factor data, respectively. The high GE variation indicated the presence of non-cross over interactions which justify the necessities of multi-location testing. Detection of non-redundant testing locations would expedite optimum resource utilization in future. The GGE biplot analysis identified genotypes such as PM-10-12, IPM-410-3 and NVL-641 as the outperforming and desirable genotypes with durable resistance against M. incognita which can be exploited in mungbean breeding programmes globally. On the contrary, the highest gall scoring and reproduction factor were recorded in genotype IPM-9901-8. Computation of confidence interval (CI) at 95% level through bootstrapping increased precision of GGE biplot towards genotype recommendation. Furthermore, total phenol content, ascorbic acid, phenlylalanine ammonia lyase (PAL) and polyphenol oxidase (PPO) activities were also higher in identified resistant genotypes and this information would be useful for devising mungbean breeding strategies in future for resistance against root-knot nematodes. 1 ICAR- Indian Institute of Pulses Research, Kanpur, 208024, Uttar Pradesh, India. 2 Bidhan Chandra Krishi Viswavidyalaya, Mohanpur, Nadia, West Bengal, India. 3 Assam Agricultural University, Jorhat, Assam, India. 4 ICAR- Indian Agricultural Statistics Research Institute, New Delhi, 110 012, India. 5 Rajendra Prasad Central Agricultural University, Pusa, Samastipur, Bihar, India. 6 Chandra Shekhar Azad University of Agriculture & Technology, Kanpur, 208 002, Uttar Pradesh, India. 7 Orissa University of Agriculture & Technology, Bhubaneswar, Orissa, India. 8 Rajasthan Agricultural Research Institute, Durgapura, Jaipur, Rajasthan, India. 9 All India Coordinated Research Project (AICRP) on MULLaRP, ICAR- Indian Institute of Pulses Research, Kanpur, 208 024, Uttar Pradesh, India. *email: [email protected]; saniipr@rediffmail.com OPEN

Welcome message from author
This document is posted to help you gain knowledge. Please leave a comment to let me know what you think about it! Share it to your friends and learn new things together.
Transcript
1Scientific RepoRtS | (2020) 10:4108 | https://doi.org/10.1038/s41598-020-60820-x
www.nature.com/scientificreports
Delineation of Genotype-by-environment interactions for identification and validation of resistant genotypes in mungbean to root-knot nematode (Meloidogyne incognita) using GGe biplotBansa Singh1, Arpita Das2*, A. K. parihar1, B. Bhagawati3, Deepak Singh4, K. n. pathak5, Kusum Dwivedi6, niranjan Das7, nishi Keshari5, R. L. Midha8, Raju Kumar4, Aditya pratap1, Vaibhav Kumar1 & Sanjeev Gupta9*
Susceptibility to root-knot nematodes (Meloidogyne spp.) is one of the major factors limiting mungbean production in South and South-east Asia. Host-pest-environment interaction in mungbean and root-knot nematode (M. incognita) was investigated in multi-location field evaluation using 38 promising mungbean genotypes extracted from initial evaluation of 250 genotypes under sick plots considering second stage freshly hatched juvenile as inoculants. the extent of environmental and genotype-by-environment interactions (GGe) was assessed to comprehend the dynamism of resistance and identification of durable resistant mungbean genotypes. Among environmental factors, nematode activity was highly influenced by rainfall and minimum temperature. The GGE biplot and multiple comparison tests detected a higher proportion of genotype × environment (Ge) interaction followed by genotype and environment on number of nematode galls, gall index and reproduction factor. The first two principal components (PCs) explained 64.33% and 66.99% of the total variation of the environment-centered gall scoring and reproduction factor data, respectively. the high Ge variation indicated the presence of non-cross over interactions which justify the necessities of multi-location testing. Detection of non-redundant testing locations would expedite optimum resource utilization in future. The GGE biplot analysis identified genotypes such as PM-10-12, IPM-410-3 and NVL-641 as the outperforming and desirable genotypes with durable resistance against M. incognita which can be exploited in mungbean breeding programmes globally. on the contrary, the highest gall scoring and reproduction factor were recorded in genotype IPM-9901-8. Computation of confidence interval (CI) at 95% level through bootstrapping increased precision of GGE biplot towards genotype recommendation. furthermore, total phenol content, ascorbic acid, phenlylalanine ammonia lyase (pAL) and polyphenol oxidase (PPO) activities were also higher in identified resistant genotypes and this information would be useful for devising mungbean breeding strategies in future for resistance against root-knot nematodes.
1ICAR- Indian Institute of Pulses Research, Kanpur, 208024, Uttar Pradesh, India. 2Bidhan Chandra Krishi Viswavidyalaya, Mohanpur, Nadia, West Bengal, India. 3Assam Agricultural University, Jorhat, Assam, India. 4ICAR- Indian Agricultural Statistics Research Institute, New Delhi, 110 012, India. 5Rajendra Prasad Central Agricultural University, Pusa, Samastipur, Bihar, India. 6Chandra Shekhar Azad University of Agriculture & Technology, Kanpur, 208 002, Uttar Pradesh, India. 7Orissa University of Agriculture & Technology, Bhubaneswar, Orissa, India. 8Rajasthan Agricultural Research Institute, Durgapura, Jaipur, Rajasthan, India. 9All India Coordinated Research Project (AICRP) on MULLaRP, ICAR- Indian Institute of Pulses Research, Kanpur, 208 024, Uttar Pradesh, India. *email: [email protected]; [email protected]
open
2Scientific RepoRtS | (2020) 10:4108 | https://doi.org/10.1038/s41598-020-60820-x
www.nature.com/scientificreportswww.nature.com/scientificreports/
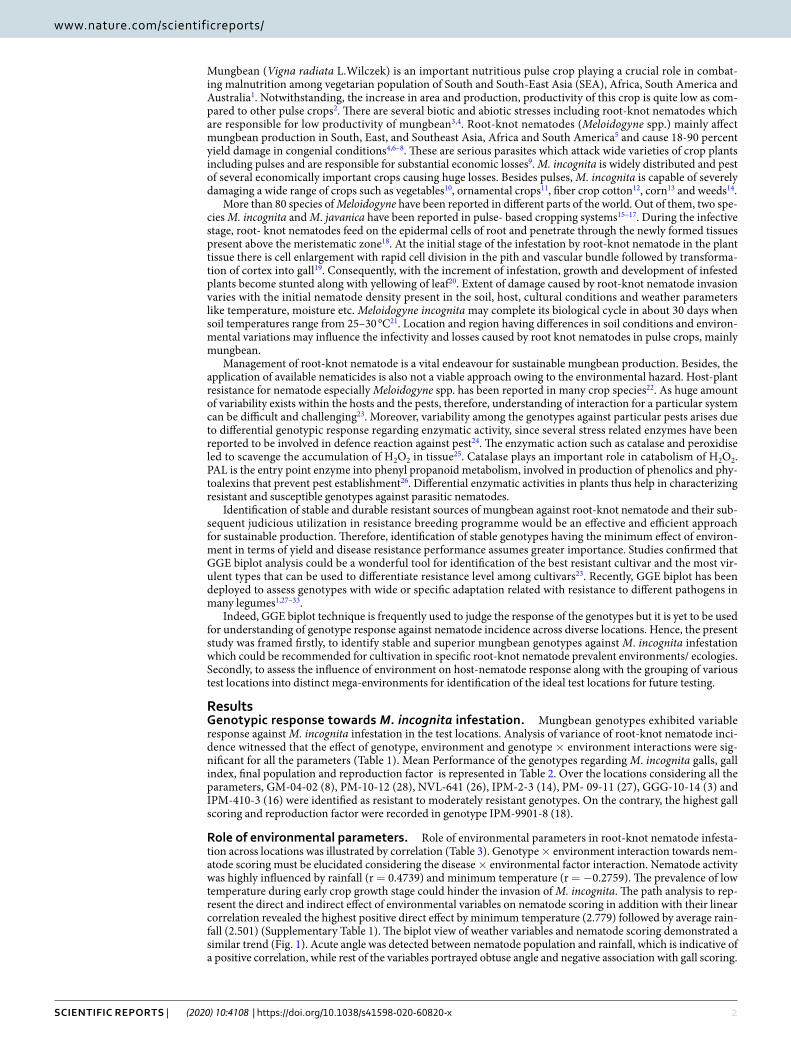
Mungbean (Vigna radiata L.Wilczek) is an important nutritious pulse crop playing a crucial role in combat-ing malnutrition among vegetarian population of South and South-East Asia (SEA), Africa, South America and Australia1. Notwithstanding, the increase in area and production, productivity of this crop is quite low as com-pared to other pulse crops2. There are several biotic and abiotic stresses including root-knot nematodes which are responsible for low productivity of mungbean3,4. Root-knot nematodes (Meloidogyne spp.) mainly affect mungbean production in South, East, and Southeast Asia, Africa and South America5 and cause 18-90 percent yield damage in congenial conditions4,6–8. These are serious parasites which attack wide varieties of crop plants including pulses and are responsible for substantial economic losses9. M. incognita is widely distributed and pest of several economically important crops causing huge losses. Besides pulses, M. incognita is capable of severely damaging a wide range of crops such as vegetables10, ornamental crops11, fiber crop cotton12, corn13 and weeds14.
More than 80 species of Meloidogyne have been reported in different parts of the world. Out of them, two spe-cies M. incognita and M. javanica have been reported in pulse- based cropping systems15–17. During the infective stage, root- knot nematodes feed on the epidermal cells of root and penetrate through the newly formed tissues present above the meristematic zone18. At the initial stage of the infestation by root-knot nematode in the plant tissue there is cell enlargement with rapid cell division in the pith and vascular bundle followed by transforma-tion of cortex into gall19. Consequently, with the increment of infestation, growth and development of infested plants become stunted along with yellowing of leaf20. Extent of damage caused by root-knot nematode invasion varies with the initial nematode density present in the soil, host, cultural conditions and weather parameters like temperature, moisture etc. Meloidogyne incognita may complete its biological cycle in about 30 days when soil temperatures range from 25–30 °C21. Location and region having differences in soil conditions and environ-mental variations may influence the infectivity and losses caused by root knot nematodes in pulse crops, mainly mungbean.
Management of root-knot nematode is a vital endeavour for sustainable mungbean production. Besides, the application of available nematicides is also not a viable approach owing to the environmental hazard. Host-plant resistance for nematode especially Meloidogyne spp. has been reported in many crop species22. As huge amount of variability exists within the hosts and the pests, therefore, understanding of interaction for a particular system can be difficult and challenging23. Moreover, variability among the genotypes against particular pests arises due to differential genotypic response regarding enzymatic activity, since several stress related enzymes have been reported to be involved in defence reaction against pest24. The enzymatic action such as catalase and peroxidise led to scavenge the accumulation of H2O2 in tissue25. Catalase plays an important role in catabolism of H2O2. PAL is the entry point enzyme into phenyl propanoid metabolism, involved in production of phenolics and phy-toalexins that prevent pest establishment26. Differential enzymatic activities in plants thus help in characterizing resistant and susceptible genotypes against parasitic nematodes.
Identification of stable and durable resistant sources of mungbean against root-knot nematode and their sub-sequent judicious utilization in resistance breeding programme would be an effective and efficient approach for sustainable production. Therefore, identification of stable genotypes having the minimum effect of environ-ment in terms of yield and disease resistance performance assumes greater importance. Studies confirmed that GGE biplot analysis could be a wonderful tool for identification of the best resistant cultivar and the most vir-ulent types that can be used to differentiate resistance level among cultivars23. Recently, GGE biplot has been deployed to assess genotypes with wide or specific adaptation related with resistance to different pathogens in many legumes1,27–33.
Indeed, GGE biplot technique is frequently used to judge the response of the genotypes but it is yet to be used for understanding of genotype response against nematode incidence across diverse locations. Hence, the present study was framed firstly, to identify stable and superior mungbean genotypes against M. incognita infestation which could be recommended for cultivation in specific root-knot nematode prevalent environments/ ecologies. Secondly, to assess the influence of environment on host-nematode response along with the grouping of various test locations into distinct mega-environments for identification of the ideal test locations for future testing.
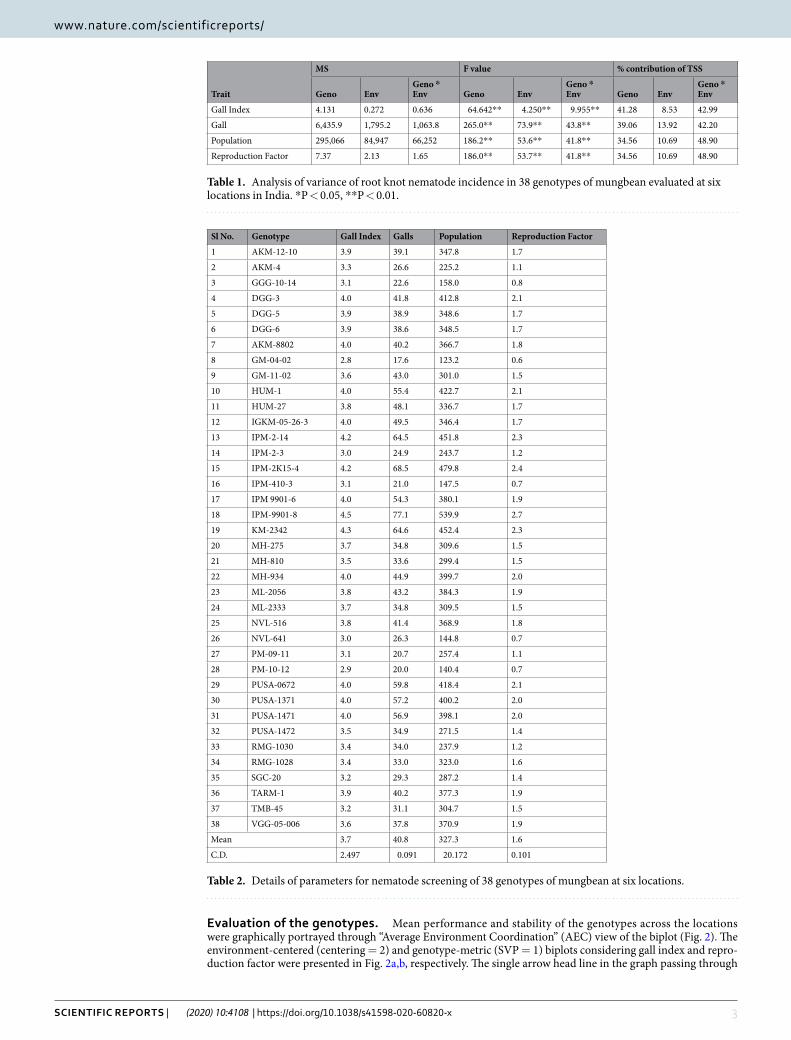
ResultsGenotypic response towards M. incognita infestation. Mungbean genotypes exhibited variable response against M. incognita infestation in the test locations. Analysis of variance of root-knot nematode inci-dence witnessed that the effect of genotype, environment and genotype × environment interactions were sig-nificant for all the parameters (Table 1). Mean Performance of the genotypes regarding M. incognita galls, gall index, final population and reproduction factor is represented in Table 2. Over the locations considering all the parameters, GM-04-02 (8), PM-10-12 (28), NVL-641 (26), IPM-2-3 (14), PM- 09-11 (27), GGG-10-14 (3) and IPM-410-3 (16) were identified as resistant to moderately resistant genotypes. On the contrary, the highest gall scoring and reproduction factor were recorded in genotype IPM-9901-8 (18).
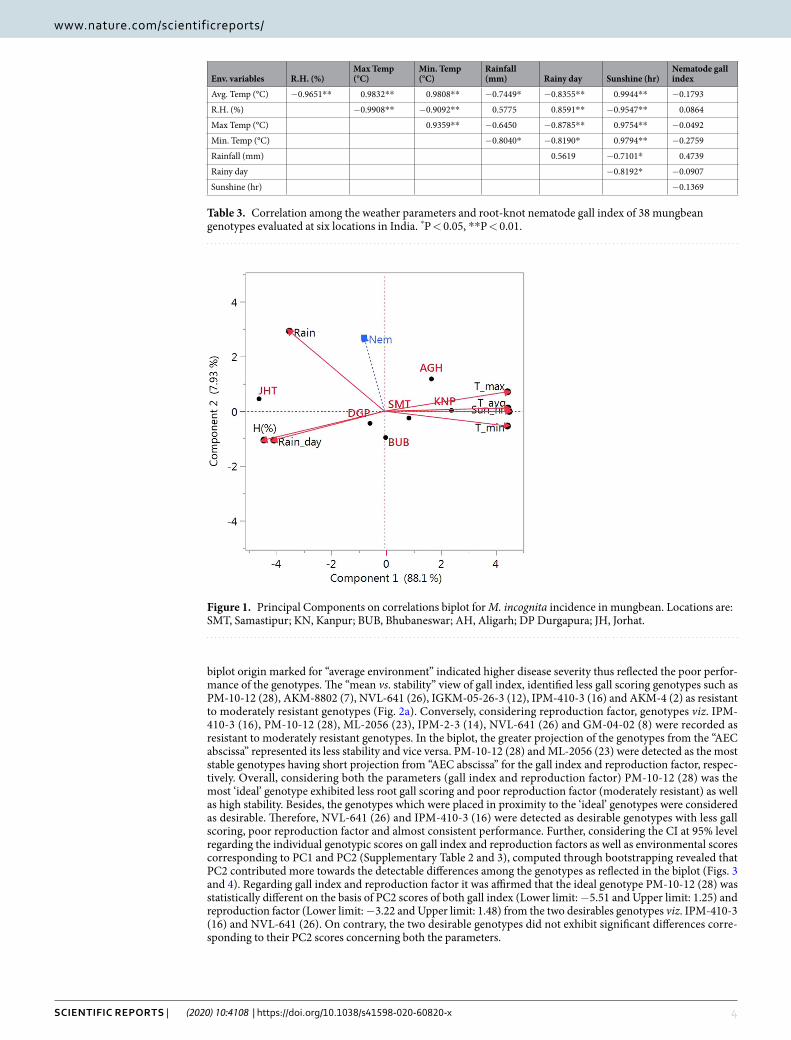
Role of environmental parameters. Role of environmental parameters in root-knot nematode infesta-tion across locations was illustrated by correlation (Table 3). Genotype × environment interaction towards nem-atode scoring must be elucidated considering the disease × environmental factor interaction. Nematode activity was highly influenced by rainfall (r = 0.4739) and minimum temperature (r = −0.2759). The prevalence of low temperature during early crop growth stage could hinder the invasion of M. incognita. The path analysis to rep-resent the direct and indirect effect of environmental variables on nematode scoring in addition with their linear correlation revealed the highest positive direct effect by minimum temperature (2.779) followed by average rain-fall (2.501) (Supplementary Table 1). The biplot view of weather variables and nematode scoring demonstrated a similar trend (Fig. 1). Acute angle was detected between nematode population and rainfall, which is indicative of a positive correlation, while rest of the variables portrayed obtuse angle and negative association with gall scoring.
3Scientific RepoRtS | (2020) 10:4108 | https://doi.org/10.1038/s41598-020-60820-x
www.nature.com/scientificreportswww.nature.com/scientificreports/
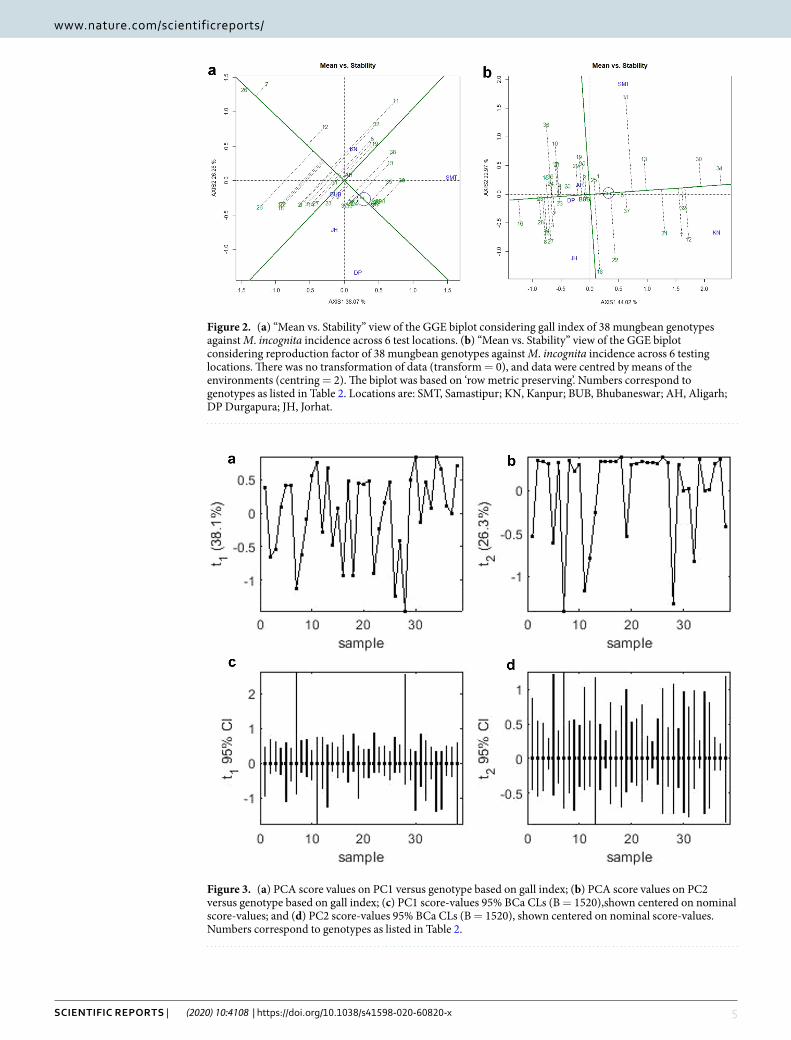
evaluation of the genotypes. Mean performance and stability of the genotypes across the locations were graphically portrayed through “Average Environment Coordination” (AEC) view of the biplot (Fig. 2). The environment-centered (centering = 2) and genotype-metric (SVP = 1) biplots considering gall index and repro-duction factor were presented in Fig. 2a,b, respectively. The single arrow head line in the graph passing through
Trait
MS F value % contribution of TSS
Geno EnvGeno * Env Geno Env
Geno * Env Geno Env
Geno * Env
Gall Index 4.131 0.272 0.636 64.642** 4.250** 9.955** 41.28 8.53 42.99
Gall 6,435.9 1,795.2 1,063.8 265.0** 73.9** 43.8** 39.06 13.92 42.20
Population 295,066 84,947 66,252 186.2** 53.6** 41.8** 34.56 10.69 48.90
Reproduction Factor 7.37 2.13 1.65 186.0** 53.7** 41.8** 34.56 10.69 48.90
Table 1. Analysis of variance of root knot nematode incidence in 38 genotypes of mungbean evaluated at six locations in India. *P < 0.05, **P < 0.01.
Sl No. Genotype Gall Index Galls Population Reproduction Factor
1 AKM-12-10 3.9 39.1 347.8 1.7
2 AKM-4 3.3 26.6 225.2 1.1
3 GGG-10-14 3.1 22.6 158.0 0.8
4 DGG-3 4.0 41.8 412.8 2.1
5 DGG-5 3.9 38.9 348.6 1.7
6 DGG-6 3.9 38.6 348.5 1.7
7 AKM-8802 4.0 40.2 366.7 1.8
8 GM-04-02 2.8 17.6 123.2 0.6
9 GM-11-02 3.6 43.0 301.0 1.5
10 HUM-1 4.0 55.4 422.7 2.1
11 HUM-27 3.8 48.1 336.7 1.7
12 IGKM-05-26-3 4.0 49.5 346.4 1.7
13 IPM-2-14 4.2 64.5 451.8 2.3
14 IPM-2-3 3.0 24.9 243.7 1.2
15 IPM-2K15-4 4.2 68.5 479.8 2.4
16 IPM-410-3 3.1 21.0 147.5 0.7
17 IPM 9901-6 4.0 54.3 380.1 1.9
18 IPM-9901-8 4.5 77.1 539.9 2.7
19 KM-2342 4.3 64.6 452.4 2.3
20 MH-275 3.7 34.8 309.6 1.5
21 MH-810 3.5 33.6 299.4 1.5
22 MH-934 4.0 44.9 399.7 2.0
23 ML-2056 3.8 43.2 384.3 1.9
24 ML-2333 3.7 34.8 309.5 1.5
25 NVL-516 3.8 41.4 368.9 1.8
26 NVL-641 3.0 26.3 144.8 0.7
27 PM-09-11 3.1 20.7 257.4 1.1
28 PM-10-12 2.9 20.0 140.4 0.7
29 PUSA-0672 4.0 59.8 418.4 2.1
30 PUSA-1371 4.0 57.2 400.2 2.0
31 PUSA-1471 4.0 56.9 398.1 2.0
32 PUSA-1472 3.5 34.9 271.5 1.4
33 RMG-1030 3.4 34.0 237.9 1.2
34 RMG-1028 3.4 33.0 323.0 1.6
35 SGC-20 3.2 29.3 287.2 1.4
36 TARM-1 3.9 40.2 377.3 1.9
37 TMB-45 3.2 31.1 304.7 1.5
38 VGG-05-006 3.6 37.8 370.9 1.9
Mean 3.7 40.8 327.3 1.6
C.D. 2.497 0.091 20.172 0.101
Table 2. Details of parameters for nematode screening of 38 genotypes of mungbean at six locations.
4Scientific RepoRtS | (2020) 10:4108 | https://doi.org/10.1038/s41598-020-60820-x
www.nature.com/scientificreportswww.nature.com/scientificreports/
biplot origin marked for “average environment” indicated higher disease severity thus reflected the poor perfor-mance of the genotypes. The “mean vs. stability” view of gall index, identified less gall scoring genotypes such as PM-10-12 (28), AKM-8802 (7), NVL-641 (26), IGKM-05-26-3 (12), IPM-410-3 (16) and AKM-4 (2) as resistant to moderately resistant genotypes (Fig. 2a). Conversely, considering reproduction factor, genotypes viz. IPM-410-3 (16), PM-10-12 (28), ML-2056 (23), IPM-2-3 (14), NVL-641 (26) and GM-04-02 (8) were recorded as resistant to moderately resistant genotypes. In the biplot, the greater projection of the genotypes from the “AEC abscissa” represented its less stability and vice versa. PM-10-12 (28) and ML-2056 (23) were detected as the most stable genotypes having short projection from “AEC abscissa” for the gall index and reproduction factor, respec-tively. Overall, considering both the parameters (gall index and reproduction factor) PM-10-12 (28) was the most ‘ideal’ genotype exhibited less root gall scoring and poor reproduction factor (moderately resistant) as well as high stability. Besides, the genotypes which were placed in proximity to the ‘ideal’ genotypes were considered as desirable. Therefore, NVL-641 (26) and IPM-410-3 (16) were detected as desirable genotypes with less gall scoring, poor reproduction factor and almost consistent performance. Further, considering the CI at 95% level regarding the individual genotypic scores on gall index and reproduction factors as well as environmental scores corresponding to PC1 and PC2 (Supplementary Table 2 and 3), computed through bootstrapping revealed that PC2 contributed more towards the detectable differences among the genotypes as reflected in the biplot (Figs. 3 and 4). Regarding gall index and reproduction factor it was affirmed that the ideal genotype PM-10-12 (28) was statistically different on the basis of PC2 scores of both gall index (Lower limit: −5.51 and Upper limit: 1.25) and reproduction factor (Lower limit: −3.22 and Upper limit: 1.48) from the two desirables genotypes viz. IPM-410-3 (16) and NVL-641 (26). On contrary, the two desirable genotypes did not exhibit significant differences corre-sponding to their PC2 scores concerning both the parameters.
Env. variables R.H. (%)Max Temp (°C)
Min. Temp (°C)
Rainfall (mm) Rainy day Sunshine (hr)
Nematode gall index
Avg. Temp (°C) −0.9651** 0.9832** 0.9808** −0.7449* −0.8355** 0.9944** −0.1793
R.H. (%) −0.9908** −0.9092** 0.5775 0.8591** −0.9547** 0.0864
Max Temp (°C) 0.9359** −0.6450 −0.8785** 0.9754** −0.0492
Min. Temp (°C) −0.8040* −0.8190* 0.9794** −0.2759
Rainfall (mm) 0.5619 −0.7101* 0.4739
Rainy day −0.8192* −0.0907
Sunshine (hr) −0.1369
Table 3. Correlation among the weather parameters and root-knot nematode gall index of 38 mungbean genotypes evaluated at six locations in India. *P < 0.05, **P < 0.01.
Figure 1. Principal Components on correlations biplot for M. incognita incidence in mungbean. Locations are: SMT, Samastipur; KN, Kanpur; BUB, Bhubaneswar; AH, Aligarh; DP Durgapura; JH, Jorhat.
5Scientific RepoRtS | (2020) 10:4108 | https://doi.org/10.1038/s41598-020-60820-x
www.nature.com/scientificreportswww.nature.com/scientificreports/
Figure 2. (a) “Mean vs. Stability” view of the GGE biplot considering gall index of 38 mungbean genotypes against M. incognita incidence across 6 test locations. (b) “Mean vs. Stability” view of the GGE biplot considering reproduction factor of 38 mungbean genotypes against M. incognita incidence across 6 testing locations. There was no transformation of data (transform = 0), and data were centred by means of the environments (centring = 2). The biplot was based on ‘row metric preserving’. Numbers correspond to genotypes as listed in Table 2. Locations are: SMT, Samastipur; KN, Kanpur; BUB, Bhubaneswar; AH, Aligarh; DP Durgapura; JH, Jorhat.
Figure 3. (a) PCA score values on PC1 versus genotype based on gall index; (b) PCA score values on PC2 versus genotype based on gall index; (c) PC1 score-values 95% BCa CLs (B = 1520),shown centered on nominal score-values; and (d) PC2 score-values 95% BCa CLs (B = 1520), shown centered on nominal score-values. Numbers correspond to genotypes as listed in Table 2.
6Scientific RepoRtS | (2020) 10:4108 | https://doi.org/10.1038/s41598-020-60820-x
www.nature.com/scientificreportswww.nature.com/scientificreports/
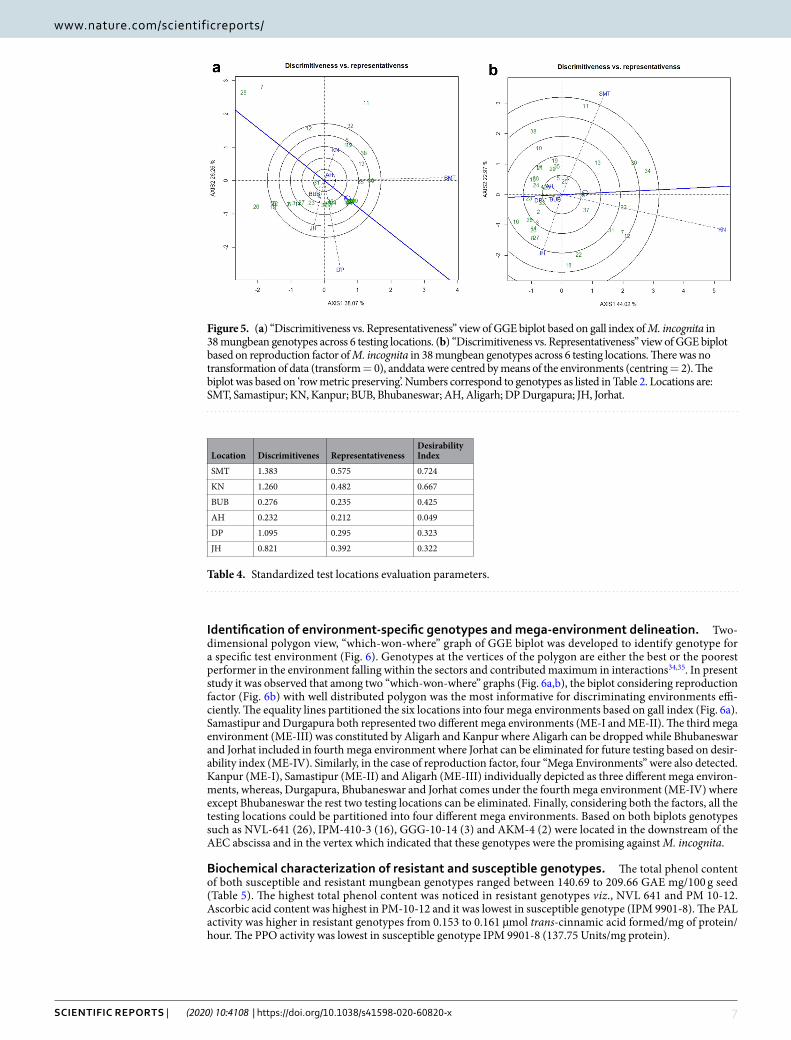
evaluation of the test locations. The relationship among the test locations and identification of ideal test location is an important attribute of GGE biplot. The first two principal components (PCs) explained 64.33% and 66.99% of the total variation of environment-centered gall scoring and reproduction factor data of M. incognita, respectively. In case of gall index, PC1 (M. incognita incidence) and PC2 (resistance stability) accounted for 38.07% and 26.26% of total variation, respectively (Fig. 5a) whereas, for reproduction factor, the PC1 (M. incog-nita incidence) and PC2 (resistance stability) accounted for 44.02% and 22.97% of total variation, respectively (Fig. 5b). All test locations were connected through environment vectors and it was depicted that in case of gall index (Fig. 5a) Kanpur and Aligarh; Aligarh and Samastipur as well as Bhubaneswar, Jorhat and Durgapura exhib-ited acute angle indicating positive correlation and close relationship with each other. On the contrary, obtuse angle was exhibited between Samastipur and Kanpur as well in between Samastipur, Kanpur with other three locations except Aligarh revealing a paradoxical relationship between these locations. However, this relationship was not consistent for reproduction factor. In case of reproduction factor, acute angle was observed between Jorhat and Bubhaneswar, between Bhubaneswar, Durgapura and Aligarh. Contrarily, Kanpur and Samastipur locations exhibited obtuse angle with all locations (Fig. 5b). Similarly, Jorhat, Aligarh and Durgapura also exhib-ited obtuse or nearly obtuse angle with each other. While, Bhubaneswar and Durgapura demonstrated almost similar positions indicating analogous genotypic response towards M. incognita, thus one of the locations could be curtailed down in the future testing program.
In GGE biplot approach, three parameters viz., ‘discrimination’ power (ability to segregate the tested gen-otypes), ‘representativeness’ (ability to represent the mega environment) and “desirability index” were usually deliberated for test locations evaluation. In the present study, it was detected that among the test locations con-sidering gall scoring Samastipur exhibited longest environmental vectors thus identified as most “discriminating location” having the power of genotypes discrimination amid other locations. Additionally, Samastipur exhibited smallest angle with “AEC abscissa”, thus identified as most ‘Representative’ test locations. On the contrary, in case of reproduction factor, Kanpur reflected longest environmental vectors as well as smallest angle with AEC abscissa” therefore, considered as discriminating as well as most representative test location. The “desirability index” of testing location is the cumulative effect of both ‘discriminativeness’ of a location and ‘representativeness’. Finally, Samastipur location with highest desirability index (Table 4) was considered as ‘ideal’ testing location for root-knot nematode screening. In addition, Kanpur could be entitled as ‘supplementary’ testing location. These two locations would be ideal for selecting genotypes with general adaptability.
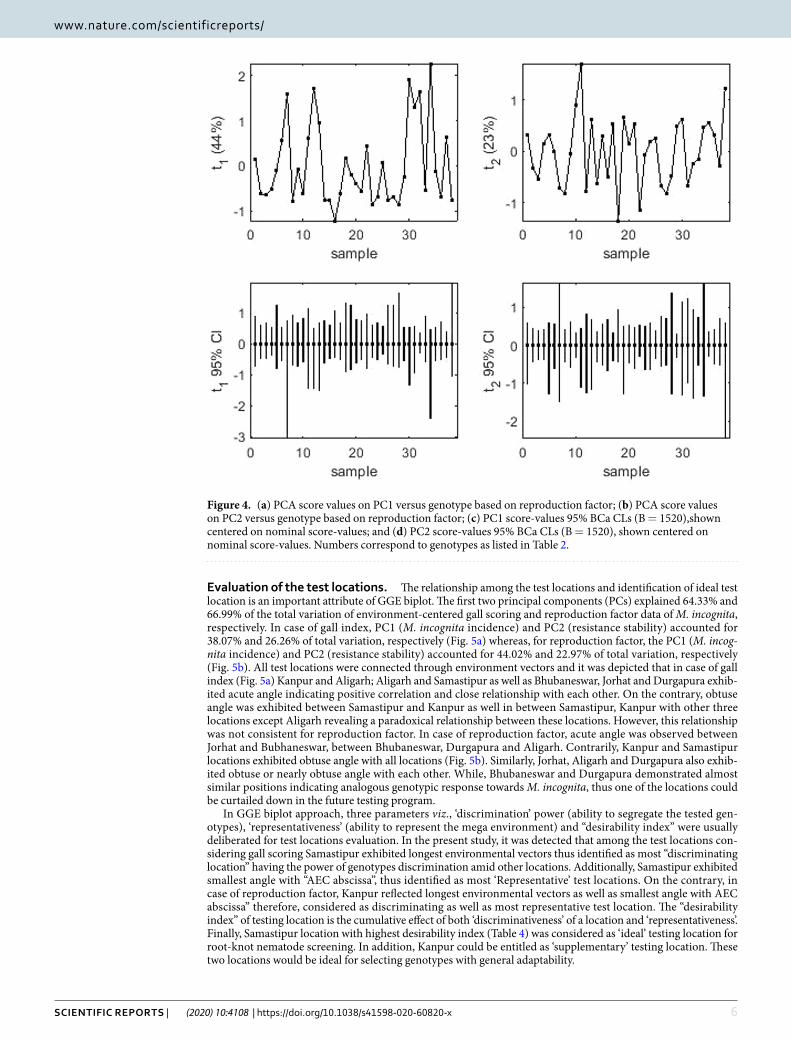
Figure 4. (a) PCA score values on PC1 versus genotype based on reproduction factor; (b) PCA score values on PC2 versus genotype based on reproduction factor; (c) PC1 score-values 95% BCa CLs (B = 1520),shown centered on nominal score-values; and (d) PC2 score-values 95% BCa CLs (B = 1520), shown centered on nominal score-values. Numbers correspond to genotypes as listed in Table 2.
7Scientific RepoRtS | (2020) 10:4108 | https://doi.org/10.1038/s41598-020-60820-x
www.nature.com/scientificreportswww.nature.com/scientificreports/
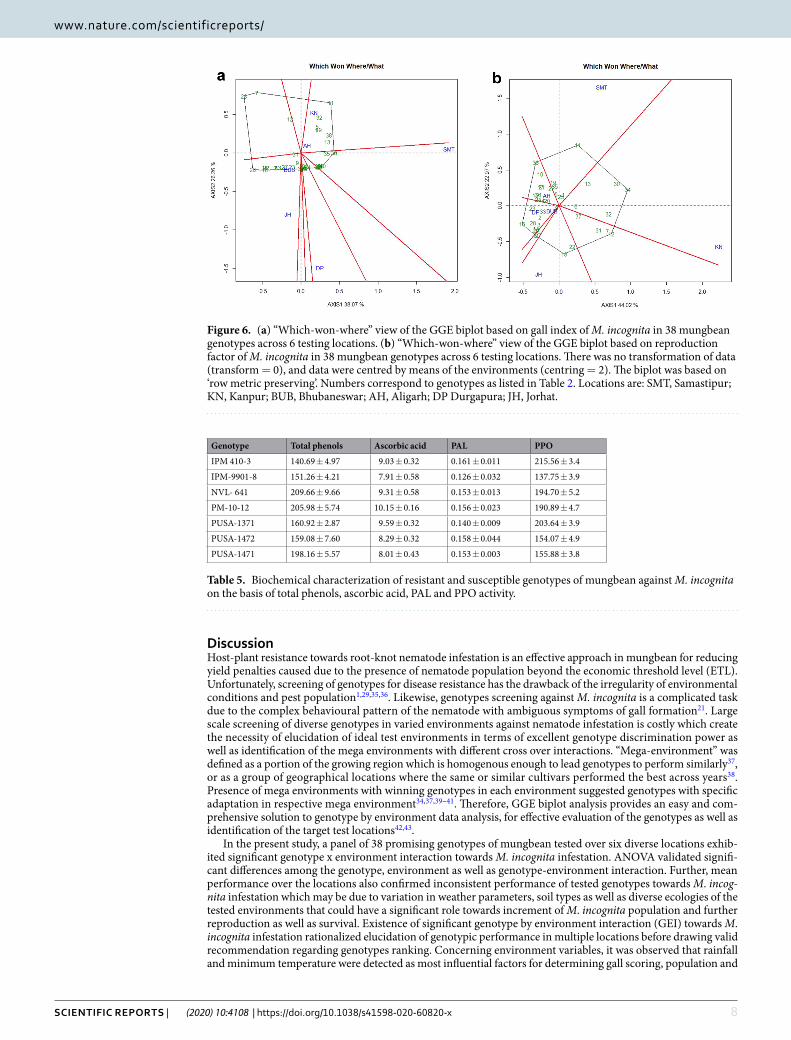
Identification of environment-specific genotypes and mega-environment delineation. Two- dimensional polygon view, “which-won-where” graph of GGE biplot was developed to identify genotype for a specific test environment (Fig. 6). Genotypes at the vertices of the polygon are either the best or the poorest performer in the environment falling within the sectors and contributed maximum in interactions34,35. In present study it was observed that among two “which-won-where” graphs (Fig. 6a,b), the biplot considering reproduction factor (Fig. 6b) with well distributed polygon was the most informative for discriminating environments effi-ciently. The equality lines partitioned the six locations into four mega environments based on gall index (Fig. 6a). Samastipur and Durgapura both represented two different mega environments (ME-I and ME-II). The third mega environment (ME-III) was constituted by Aligarh and Kanpur where Aligarh can be dropped while Bhubaneswar and Jorhat included in fourth mega environment where Jorhat can be eliminated for future testing based on desir-ability index (ME-IV). Similarly, in the case of reproduction factor, four “Mega Environments” were also detected. Kanpur (ME-I), Samastipur (ME-II) and Aligarh (ME-III) individually depicted as three different mega environ-ments, whereas, Durgapura, Bhubaneswar and Jorhat comes under the fourth mega environment (ME-IV) where except Bhubaneswar the rest two testing locations can be eliminated. Finally, considering both the factors, all the testing locations could be partitioned into four different mega environments. Based on both biplots genotypes such as NVL-641 (26), IPM-410-3 (16), GGG-10-14 (3) and AKM-4 (2) were located in the downstream of the AEC abscissa and in the vertex which indicated that these genotypes were the promising against M. incognita.
Biochemical characterization of resistant and susceptible genotypes. The total phenol content of both susceptible and resistant mungbean genotypes ranged between 140.69 to 209.66 GAE mg/100 g seed (Table 5). The highest total phenol content was noticed in resistant genotypes viz., NVL 641 and PM 10-12. Ascorbic acid content was highest in PM-10-12 and it was lowest in susceptible genotype (IPM 9901-8). The PAL activity was higher in resistant genotypes from 0.153 to 0.161 µmol trans-cinnamic acid formed/mg of protein/ hour. The PPO activity was lowest in susceptible genotype IPM 9901-8 (137.75 Units/mg protein).
Figure 5. (a) “Discrimitiveness vs. Representativeness” view of GGE biplot based on gall index of M. incognita in 38 mungbean genotypes across 6 testing locations. (b) “Discrimitiveness vs. Representativeness” view of GGE biplot based on reproduction factor of M. incognita in 38 mungbean genotypes across 6 testing locations. There was no transformation of data (transform = 0), anddata were centred by means of the environments (centring = 2). The biplot was based on ‘row metric preserving’. Numbers correspond to genotypes as listed in Table 2. Locations are: SMT, Samastipur; KN, Kanpur; BUB, Bhubaneswar; AH, Aligarh; DP Durgapura; JH, Jorhat.
Location Discrimitivenes RepresentativenessDesirability Index
SMT 1.383 0.575 0.724
KN 1.260 0.482 0.667
BUB 0.276 0.235 0.425
AH 0.232 0.212 0.049
DP 1.095 0.295 0.323
JH 0.821 0.392 0.322
Table 4. Standardized test locations evaluation parameters.
8Scientific RepoRtS | (2020) 10:4108 | https://doi.org/10.1038/s41598-020-60820-x
www.nature.com/scientificreportswww.nature.com/scientificreports/
DiscussionHost-plant resistance towards root-knot nematode infestation is an effective approach in mungbean for reducing yield penalties caused due to the presence of nematode population beyond the economic threshold level (ETL). Unfortunately, screening of genotypes for disease resistance has the drawback of the irregularity of environmental conditions and pest population1,29,35,36. Likewise, genotypes screening against M. incognita is a complicated task due to the complex behavioural pattern of the nematode with ambiguous symptoms of gall formation21. Large scale screening of diverse genotypes in varied environments against nematode infestation is costly which create the necessity of elucidation of ideal test environments in terms of excellent genotype discrimination power as well as identification of the mega environments with different cross over interactions. “Mega-environment” was defined as a portion of the growing region which is homogenous enough to lead genotypes to perform similarly37, or as a group of geographical locations where the same or similar cultivars performed the best across years38. Presence of mega environments with winning genotypes in each environment suggested genotypes with specific adaptation in respective mega environment34,37,39–41. Therefore, GGE biplot analysis provides an easy and com-prehensive solution to genotype by environment data analysis, for effective evaluation of the genotypes as well as identification of the target test locations42,43.
In the present study, a panel of 38 promising genotypes of mungbean tested over six diverse locations exhib-ited significant genotype x environment interaction towards M. incognita infestation. ANOVA validated signifi-cant differences among the genotype, environment as well as genotype-environment interaction. Further, mean performance over the locations also confirmed inconsistent performance of tested genotypes towards M. incog-nita infestation which may be due to variation in weather parameters, soil types as well as diverse ecologies of the tested environments that could have a significant role towards increment of M. incognita population and further reproduction as well as survival. Existence of significant genotype by environment interaction (GEI) towards M. incognita infestation rationalized elucidation of genotypic performance in multiple locations before drawing valid recommendation regarding genotypes ranking. Concerning environment variables, it was observed that rainfall and minimum temperature were detected as most influential factors for determining gall scoring, population and
Figure 6. (a) “Which-won-where” view of the GGE biplot based on gall index of M. incognita in 38 mungbean genotypes across 6 testing locations. (b) “Which-won-where” view of the GGE biplot based on reproduction factor of M. incognita in 38 mungbean genotypes across 6 testing locations. There was no transformation of data (transform = 0), and data were centred by means of the environments (centring = 2). The biplot was based on ‘row metric preserving’. Numbers correspond to genotypes as listed in Table 2. Locations are: SMT, Samastipur; KN, Kanpur; BUB, Bhubaneswar; AH, Aligarh; DP Durgapura; JH, Jorhat.
Genotype Total phenols Ascorbic acid PAL PPO
IPM 410-3 140.69 ± 4.97 9.03 ± 0.32 0.161 ± 0.011 215.56 ± 3.4
IPM-9901-8 151.26 ± 4.21 7.91 ± 0.58 0.126 ± 0.032 137.75 ± 3.9
NVL- 641 209.66 ± 9.66 9.31 ± 0.58 0.153 ± 0.013 194.70 ± 5.2
PM-10-12 205.98 ± 5.74 10.15 ± 0.16 0.156 ± 0.023 190.89 ± 4.7
PUSA-1371 160.92 ± 2.87 9.59 ± 0.32 0.140 ± 0.009 203.64 ± 3.9
PUSA-1472 159.08 ± 7.60 8.29 ± 0.32 0.158 ± 0.044 154.07 ± 4.9
PUSA-1471 198.16 ± 5.57 8.01 ± 0.43 0.153 ± 0.003 155.88 ± 3.8
Table 5. Biochemical characterization of resistant and susceptible genotypes of mungbean against M. incognita on the basis of total phenols, ascorbic acid, PAL and PPO activity.
9Scientific RepoRtS | (2020) 10:4108 | https://doi.org/10.1038/s41598-020-60820-x
www.nature.com/scientificreportswww.nature.com/scientificreports/
reproduction factor towards M. incognita invasion. Unpredictable weather parameters along with GE interaction are decisive factors in crop breeding44, which justify genotype evaluation in multi-environment contemplating genotypic performance and stability45,46.
In GGE biplot analysis, the complex GEI are simplified in different PCs and presented graphically against various PCs. In the present study, for both the characters i.e. gall index and reproductive factors, the first two PCs explained more than 60% of the total variation confirming adequate representation of the variability for root-knot nematode infestation. Differential responses of tested genotypes to diverse environments due to the presence of cross over interactions were depicted in the “mean vs. stability view” of the biplot for both the characters, where genotype ranking changed from one environment to another. Previous reports stated the importance of crossover interaction in breeding programme and strongly recommended the implication of breeding for specific adapta-tion34,47–49. It was observed that among the tested genotypes, though GM-04-02 (8) exhibited good performance against M. incognita, however, PM-10-12 (28) was detected as ‘ideal’ genotype with most stable performance along with the lowest projection onto “AEC ordinate” for both the parameters. Additionally, IPM-410-3 (16) and NVL-641 (26) with consistent performance and less infestation by M. incognita placed closer to the ideal geno-type and “AEC abscissa”, thus were depicted as ‘desirable’ genotypes have varying capacity to respond against pest infestation by inducing a long-lasting, broad-spectrum, systemic resistance50. Moreover, these genotypes having diverse ability and mechanism to perceive environmental signals into their developmental pathways for generat-ing wide range of adaptive capacities over time that provide varied response towards biotic stresses51. The ‘ideal’ and ‘desirable’ genotypes identified in the present study with durable resistance could be a valuable resource for mungbean resistance breeding programme against root-knot nematode infestation. This approach has been suc-cessfully deployed for identifying resistant genotypes in different crops against the different pathogen1,28,29,31,52.
An important feature of GGE biplot is to identify an optimum number of test locations to maximize the trait heritability and genetic gain in minimum trial cost53. In the present study considering both the parameters Bhubaneswar and Jorhat resembled homology regarding root-knot nematode infestation. The positive relation-ship between the test environments justified dropping of Jorhat location with similar information. Presence of a close relationship among the test locations indicated the existence of non-crossover GEI, where genotypes per-formance was consistent. Presence of both crossover and non-crossover GEI was reported earlier41,49,54. Positive correlation among the testing locations was not in accordance with their agro-ecological zones. Weather parame-ters and soil types are the two principal factors of an environment determining genotypic performance in diverse locations41. Finally, it was observed that rainfall and minimum temperature were the most influential factors and play an instrumental role in M. incognita invasion. Through GGE biplot approach, all the tested locations could be grouped into four distinct “mega-environments”, which confirmed the presence of cross-over type of GEI in the present experiment. Furthermore, GGE biplot identified Samastipur and Kanpur as the ‘ideal’ and ‘supplemen-tary’ testing sites, respectively, for screening of mungbean genotypes against root-knot nematode. Besides, among the tested genotypes, PM-10-12 (28) was recognized as ‘ideal’ genotype with most stable performance against M. incognita infestation. Further, the resistant and susceptible genotypes were characterized on the basis of enzy-matic and antioxidant activities. The total phenols, ascorbic acid, PAL and PPO activity were higher in resistant genotypes as compared with susceptible genotypes. The results were supported by the previous findings where it was reported that the stress related protective enzymes play key role in scavenging free radicles and reactive oxygen species towards triggering incompatible reaction against root-knot nematodes55–57. These biochemical markers also helped in identification of root-knot nematode resistant genotypes in mungbean. The judicious utilization of identified genotypes holds great promise in future resistance breeding programmes in mungbean.
Materials and Methodsinitial testing. In preliminary screening, field evaluation of 250 germplasm of mungbean was carried out during the year 2013 and 2014 in root-knot nematode sick micro plots of New Research Farm of Indian Institute of Pulses Research (IIPR), Kanpur, India located at 26°27′N latitude, 80°14′E longitude and 152.4 above msl. Root-knot nematode population was multiplied in the naturally infested micro plots by growing pigeonpea for two years and then blackgram during wet season followed by chickpea during winter season. Soil of the micro plots was sandy loam with 7.5 pH, from which 200 cc soil samples were drawn with the help of soil auger. M. incognita from soil sample were extracted using Cobb’s wet sieving and sedimentation technique for estimating total nematode population in the soil58. At the time of sowing, the average nematode population level was 178 juveniles per 200 cc soil. After growing host crop, the nematode population was estimated and inoculum was added to those microplots where the initial population was less. Before scoring, the nematode population of each microplot was calibrated for at least 178 juveniles/200 cc soil. The tested genotypes were sown in a single row of 2 m length. After 45 days, four plants of each genotype were removed from the soil along with their root systems. The root system was washed gently under tap water and observations were recorded for each plant on gall index (GI) based on a 1–5 scale as: 1 = no galls/egg masses: Highly resistant; 2 = 1–10 galls/egg masses: Resistant; 3 = 11–30 galls/egg masses: Moderately resistant; 4 = 31–100 galls/egg masses: Susceptible and 5 = >100 galls/egg masses: Highly Susceptible59.
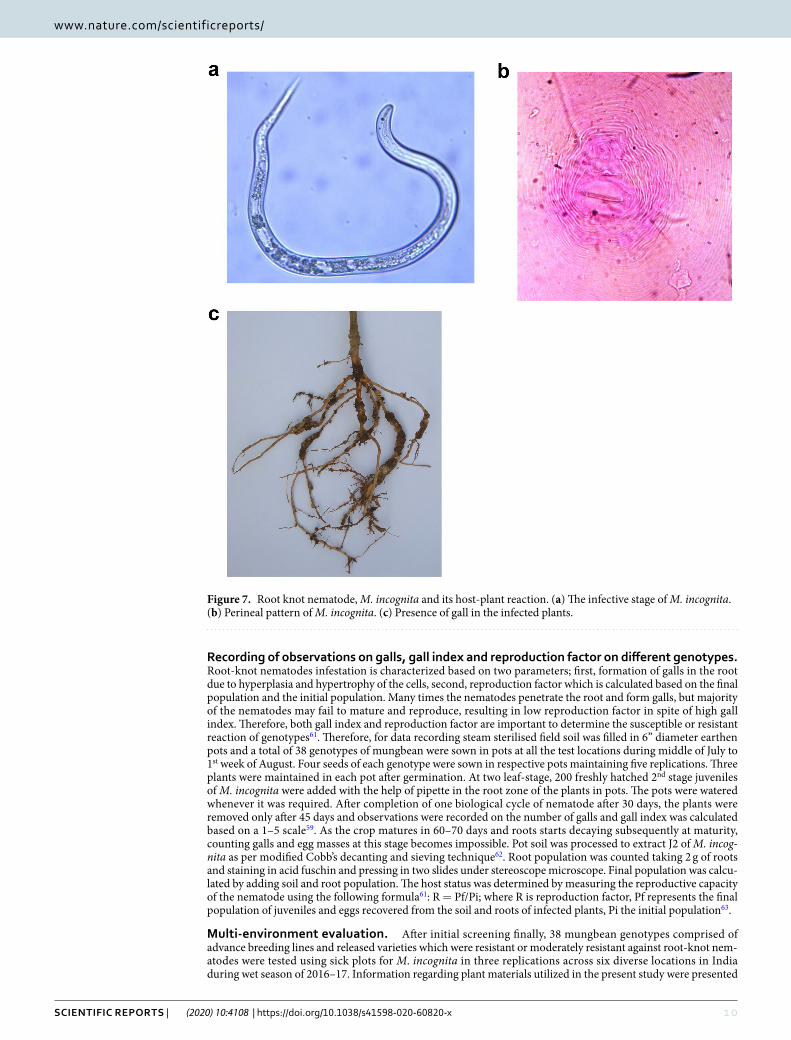
preparation of nematode inoculum for individual location. The infective stage of M. incognita (Fig. 7a) was taken from culture pots maintained at respective centres. The identity of species M. incognita was confirmed based on the perineal pattern (Fig. 7b) at all locations. M. incognita was mass cultured from a single egg mass on a susceptible cultivar maintained in greenhouse at 25 °C ± 2. The infested plants (Fig. 7c) were uprooted from the pots, washed with tap water, cut into smaller pieces, and vigorously shaken in a flask contain-ing 0.5% NaOCl for 5 min and the egg masses were collected in 51 mm diameter petri-plates and kept in incubator for hatching of 2nd stage juveniles60. These freshly hatched juveniles were used in the screening of the mungbean genotypes at different locations for validation in multi-environment evaluation.
1 0Scientific RepoRtS | (2020) 10:4108 | https://doi.org/10.1038/s41598-020-60820-x
www.nature.com/scientificreportswww.nature.com/scientificreports/
Recording of observations on galls, gall index and reproduction factor on different genotypes. Root-knot nematodes infestation is characterized based on two parameters; first, formation of galls in the root due to hyperplasia and hypertrophy of the cells, second, reproduction factor which is calculated based on the final population and the initial population. Many times the nematodes penetrate the root and form galls, but majority of the nematodes may fail to mature and reproduce, resulting in low reproduction factor in spite of high gall index. Therefore, both gall index and reproduction factor are important to determine the susceptible or resistant reaction of genotypes61. Therefore, for data recording steam sterilised field soil was filled in 6” diameter earthen pots and a total of 38 genotypes of mungbean were sown in pots at all the test locations during middle of July to 1st week of August. Four seeds of each genotype were sown in respective pots maintaining five replications. Three plants were maintained in each pot after germination. At two leaf-stage, 200 freshly hatched 2nd stage juveniles of M. incognita were added with the help of pipette in the root zone of the plants in pots. The pots were watered whenever it was required. After completion of one biological cycle of nematode after 30 days, the plants were removed only after 45 days and observations were recorded on the number of galls and gall index was calculated based on a 1–5 scale59. As the crop matures in 60–70 days and roots starts decaying subsequently at maturity, counting galls and egg masses at this stage becomes impossible. Pot soil was processed to extract J2 of M. incog-nita as per modified Cobb’s decanting and sieving technique62. Root population was counted taking 2 g of roots and staining in acid fuschin and pressing in two slides under stereoscope microscope. Final population was calcu-lated by adding soil and root population. The host status was determined by measuring the reproductive capacity of the nematode using the following formula61: R = Pf/Pi; where R is reproduction factor, Pf represents the final population of juveniles and eggs recovered from the soil and roots of infected plants, Pi the initial population63.
Multi-environment evaluation. After initial screening finally, 38 mungbean genotypes comprised of advance breeding lines and released varieties which were resistant or moderately resistant against root-knot nem-atodes were tested using sick plots for M. incognita in three replications across six diverse locations in India during wet season of 2016–17. Information regarding plant materials utilized in the present study were presented
Figure 7. Root knot nematode, M. incognita and its host-plant reaction. (a) The infective stage of M. incognita. (b) Perineal pattern of M. incognita. (c) Presence of gall in the infected plants.
1 1Scientific RepoRtS | (2020) 10:4108 | https://doi.org/10.1038/s41598-020-60820-x
www.nature.com/scientificreportswww.nature.com/scientificreports/
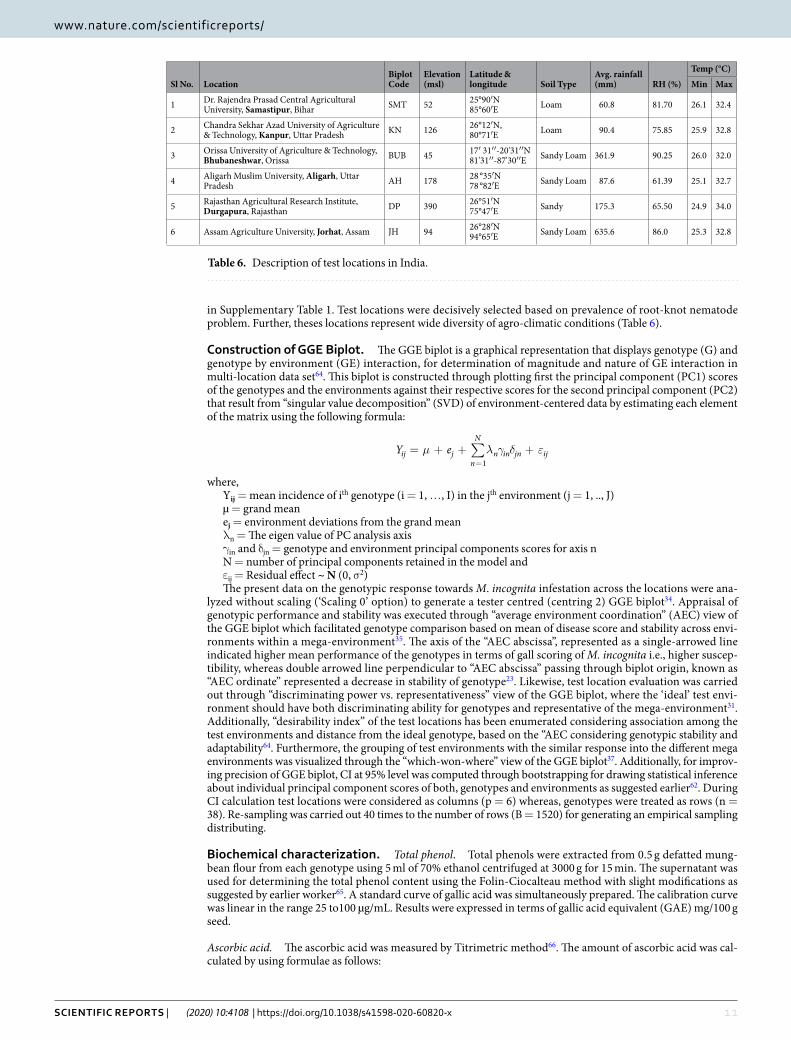
in Supplementary Table 1. Test locations were decisively selected based on prevalence of root-knot nematode problem. Further, theses locations represent wide diversity of agro-climatic conditions (Table 6).
construction of GGe Biplot. The GGE biplot is a graphical representation that displays genotype (G) and genotype by environment (GE) interaction, for determination of magnitude and nature of GE interaction in multi-location data set64. This biplot is constructed through plotting first the principal component (PC1) scores of the genotypes and the environments against their respective scores for the second principal component (PC2) that result from “singular value decomposition” (SVD) of environment-centered data by estimating each element of the matrix using the following formula:
Y eij jn
N
n in jn ij1
∑µ λ γ δ ε= + + +=
where,Yij = mean incidence of ith genotype (i = 1, …, I) in the jth environment (j = 1, .., J)µ = grand meanej = environment deviations from the grand meanλn = The eigen value of PC analysis axisγin and δjn = genotype and environment principal components scores for axis nN = number of principal components retained in the model andεij = Residual effect ~ N (0, σ2)The present data on the genotypic response towards M. incognita infestation across the locations were ana-
lyzed without scaling (‘Scaling 0’ option) to generate a tester centred (centring 2) GGE biplot34. Appraisal of genotypic performance and stability was executed through “average environment coordination” (AEC) view of the GGE biplot which facilitated genotype comparison based on mean of disease score and stability across envi-ronments within a mega-environment35. The axis of the “AEC abscissa”, represented as a single-arrowed line indicated higher mean performance of the genotypes in terms of gall scoring of M. incognita i.e., higher suscep-tibility, whereas double arrowed line perpendicular to “AEC abscissa” passing through biplot origin, known as “AEC ordinate” represented a decrease in stability of genotype23. Likewise, test location evaluation was carried out through “discriminating power vs. representativeness” view of the GGE biplot, where the ‘ideal’ test envi-ronment should have both discriminating ability for genotypes and representative of the mega-environment31. Additionally, “desirability index” of the test locations has been enumerated considering association among the test environments and distance from the ideal genotype, based on the “AEC considering genotypic stability and adaptability64. Furthermore, the grouping of test environments with the similar response into the different mega environments was visualized through the “which-won-where” view of the GGE biplot37. Additionally, for improv-ing precision of GGE biplot, CI at 95% level was computed through bootstrapping for drawing statistical inference about individual principal component scores of both, genotypes and environments as suggested earlier62. During CI calculation test locations were considered as columns (p = 6) whereas, genotypes were treated as rows (n = 38). Re-sampling was carried out 40 times to the number of rows (B = 1520) for generating an empirical sampling distributing.
Biochemical characterization. Total phenol. Total phenols were extracted from 0.5 g defatted mung-bean flour from each genotype using 5 ml of 70% ethanol centrifuged at 3000 g for 15 min. The supernatant was used for determining the total phenol content using the Folin-Ciocalteau method with slight modifications as suggested by earlier worker65. A standard curve of gallic acid was simultaneously prepared. The calibration curve was linear in the range 25 to100 µg/mL. Results were expressed in terms of gallic acid equivalent (GAE) mg/100 g seed.
Ascorbic acid. The ascorbic acid was measured by Titrimetric method66. The amount of ascorbic acid was cal-culated by using formulae as follows:
Sl No. LocationBiplot Code
Elevation (msl)
Latitude & longitude Soil Type
Avg. rainfall (mm) RH (%)
Temp (°C)
Min Max
1 Dr. Rajendra Prasad Central Agricultural University, Samastipur, Bihar SMT 52 25°90′N
85°60′E Loam 60.8 81.70 26.1 32.4
2 Chandra Sekhar Azad University of Agriculture & Technology, Kanpur, Uttar Pradesh KN 126 26°12′N,
80°71′E Loam 90.4 75.85 25.9 32.8
3 Orissa University of Agriculture & Technology, Bhubaneshwar, Orissa BUB 45 17′ 31′′-20'31′′N
81'31′′-87'30′′E Sandy Loam 361.9 90.25 26.0 32.0
4 Aligarh Muslim University, Aligarh, Uttar Pradesh AH 178 28 °35′N
78 °82′E Sandy Loam 87.6 61.39 25.1 32.7
5 Rajasthan Agricultural Research Institute, Durgapura, Rajasthan DP 390 26°51′N
75°47′E Sandy 175.3 65.50 24.9 34.0
6 Assam Agriculture University, Jorhat, Assam JH 94 26°28′N94°65′E Sandy Loam 635.6 86.0 25.3 32.8
Table 6. Description of test locations in India.
1 2Scientific RepoRtS | (2020) 10:4108 | https://doi.org/10.1038/s41598-020-60820-x
www.nature.com/scientificreportswww.nature.com/scientificreports/
=× ×
× ××Amount of Ascorbic acid mg per g V Z( 100 ) X(mg) 2
V1 Y Weight of sample (g)100
where,X = mg of standard ascorbic acid.V1 = Titre value of standard ascorbic acid against dye.V2 = Titre value of sample against dye.Y = Amount of aliquot taken (ml) for estimation.Z = Total volume made up of extracted sample.
pAL (phenylalanine ammonia lyase) activity. The PAL estimation was done as per the standard proto-col67 and expressed in terms of µmole of transcinnamic acid formed/mg protein/hr. The amount of trans-cinnamic acid formed was measured using the molar extinction coefficient of standard trans-cinnamic acid (19730) (As per Sigma aldrich protocol). The reaction rate was calculated as micromole trans-cinnamic acid formed per mg of protein per hour.
ppo (polyphenol oxidase) activity. PPO activity was assessed as per the Sigma Aldrich protocol and expressed as units/mg protein. A sample of 0.5 g of overnight soaked seeds was grinded into 5 ml of 50 mM Potassium phosphate buffer, pH 6.5 containing 5 mM mercaptoethanol followed by centrifugation @ 12000 g for 20 min. The supernatant was used as enzyme source.2.6 ml of 50 mM potassium phosphate buffer, pH 6.5 was taken in cuvette followed by addition of 100 μl of each 5 mM of L-DOPA, 2.1 mM of Ascorbic acid and 0.065 mM of EDTA. The reaction was initiated by addition of 100 μl of enzyme extract. The decrease in the absorbance was monitored at 265 nm for 3 minute at 30 second interval.
Calculations:
=−
. ×
( )Unitsmg protein mg protein
Test Blank
(0 001)
A265 nmmin
A265 nmmin
where,0.01 = the change in A265 nm/minute per unit polyphenol oxidase at pH = 6.5
Data analysis. The effects of environments, genotype and their interactions were determined by analysis of variance (ANOVA), using mixed-model analysis in GENSTAT (trial version 18; VSN International, Hemel Hempstead, UK). The ANOVA explained the partition of variation due to the effect of genotypes, environ-ment and their interaction. To identify the relationship between weather variables and M. incognita infestation, Spearman’s correlation coefficient was calculated. The GGE biplot analysis was done considering two parameters viz. gall scoring and reproduction factor, for determining the intensity of M. incognita infestation in the genotypes by using the R software (R Development Core Team, Vienna).
Received: 31 July 2019; Accepted: 4 February 2020;Published: xx xx xxxx
References 1. Parihar, A. K. et al. Assessment of mungbean genotypes for durable resistance to Yellow Mosaic Disease: Genotype× Environment
interactions. Plant Breed. 136, 94–100, https://doi.org/10.1111/pbr.12446 (2017a). 2. Chotechuen, S. Breeding of mungbean for resistance to various environmental stresses. In: Proceedings of the workshop on mungbean
germplasm. Bangkok. (1996). 3. Siddiqui, A. I., Haque, E. S. & Shaukat, S. S. Use of rhizobacteria in the control of root rot–root knot disease complex of mungbean.
J. Phytopathol. 149, 337–346 (2001). 4. Ali, S. S. & Singh, B. An overview of nematode constraints in pulses and their management. J. Food Leg. 20, 1–8 (2007). 5. Castillo, M. B., Arceo, M. B. & Litsinger, J. A. Pathological reactions and yield loss of mungbean to known populations of
Rotylenchulus reniformis and Meloidogyne acrita. Philippine Agri. 61, 12–24 (1997). 6. Patel, D. J., Patel, H. V. & Patel, S. K. Estimation of avoidable yield losses in greengram and cowpea due to root-knot nematodes.
Indian J. Nemat. 20, 213–215 (1990). 7. Gupta, D. C. & Verma, K. K. Studies on avoidable losses in mungbean (Vigna radiata) due to root-knot nematode, Meloidogyne
javanica and its control under field conditions. Indian J. Nemat. 20, 148–151 (1990). 8. Khan, M. R., Jain, R. K., Singh, R. V. & Pramanik, A. Economically important plant parasitic nematodes Distribution Atlas.
Directorate of Information and Publications. New Delhi. Pp. 10 (2010). 9. Williamson, V. M. & Hussey, R. S. Nematode pathogenesis and resistance in plants. The Plant Cell. 8, 1735–1745 (1996). 10. Sikora, R. A. & Fernandez, E. Nematode parasites of Vegetables. Plant parasitic Nematode in subtropical and Tropical agriculture
(pp. 319-392). CABI publishing, Wallingford, U. K. https://doi.org/10.1079/9780851997278.0319 (2005). 11. Walker, J. T. & Melin, J. B. Host status of herbaceous perennials to Melodogyne incognita and M. arenaria. J. Nematol. 30(4S),
607–610 (1998). 12. Lopes, C. M. L et al. Diversity of Meloidogyne incognita populations from cotton and aggressiveness to Gossypium spp. accessions.
Plant Pathology, https://doi.org/10.1111/ppa.12991 (2019). 13. Rópez-Robles, J., García-Benavides, P. & Sacristán-Pérez-Minayo, G. First Report of Meloidogyne incognita Infecting Corn in
Western Spain. Plant Dis. 97(5), 694, https://doi.org/10.1094/PDIS-07-12-0674-PDN (2013). 14. d’Errico, G., Crescenzi, A. & Landi, S. First report of the southern root-knot nematode Meloidogyne incognita on the invasive weed
Araujia sericifera in Italy. Plant Disease 98, 1593 (2014). 15. Datta, S., Trivedi, P. C. & Tiagi, B. Nematodes of guar and mung in some areas of Rajasthan. India. Intern. Nemat. Network News 4,
12–16 (1987).
13Scientific RepoRtS | (2020) 10:4108 | https://doi.org/10.1038/s41598-020-60820-x
www.nature.com/scientificreportswww.nature.com/scientificreports/
16. Khan, M. R., Jain, R. K., Ghule, T. M. & Pal, S. Root-Knot-Nematodes in India-A comprehensive Monograph. All India Coordinated Research Project on Plant Parasitic nematodes with Integrated approach for their Control, Indian Agricultural Research Institute, New Delhi (2016).
17. Suresh, P., Poornima, K., Sivakumar, M. & Subramanian, S. Current status of root-knot nematodes (Meloidogyne spp.) in Tamil Nadu. J. Entom. Zool. Studies 5, 610–615 (2017).
18. Dasgupta, D. R. & Gaur, H. S. The root-knot nematodes Meloidogyne spp. in India. In: Plant Parasitic Nematodes of India Problems and Progress (Eds. Swarup, G. and Dasgupta, D. R.). 139–171 (Indian Institute of Agricultural Research, New Delhi. Pp.
19. Taylor, A. L. & Sasser, J. N. Biology, Identification and control of root-knot nematodes (Meloidogyne spp.). North Carolina State University and United States Agency for International Development, Graphics (1978).
20. Ahmed, N., Abbasi, M. W., Shaukat, S. S. & Zaki, M. J. Physiological changes in leaves of mungbean plants infected with Meloidogyne javanica. Phytopathol. Medit. 48, 262–268 (2009).
21. Adesiyan, S. O., Caveness, F. E., Adeniji, M. O. & Fawole, B. Nematode pests of tropical crops. Heinemann Education Book (Nigeria) Limited. 114 pp (1990).
22. Sidhu, G. S. & Webster, J. M. Genetics of Plant Nematode Interaction: In Zuckerman B. M. & Rohde R. A. (Eds.), Plant Parasitic Nematodes, Vol. III pp. 61–87 (Academic Press, New York, 1981).
23. Yan, W. & Falk, D. E. Biplot analysis of host-by-pathogen data. Plant Dis. 86, 1396–1401, https://doi.org/10.1094/PDIS.2002.86.12.1396 (2002).
24. Odjakova, M. & Hadjiivanova, M. C. The complexity of pathogen defense in plants. Bulgarian J. Pl. Physiol. 27, 101–109 (2001). 25. Tripathi, R. D. Plant response to environmental stress. International Book Distributing Company (2006) 26. Mariutto, M. et al. The elicitation of a systemic resistance by Pseudomonas putida BTP1 in tomato involves the stimulation of two
lipoxygenase isoforms. BMC Plant Biol. 11, 29 (2011). 27. Rubiales, D. Identification and multi-environment validation of resistance to Ascochyta fabae in faba bean (Vicia faba). Field Crops
Res. 126, 165–170, https://doi.org/10.1016/j.fcr.2011.10.012 (2012). 28. Sharma, M., Telangre, R., Ghosh, R. & Pande, S. Multi-environment field testing to identify broad, stable resistance to sterility
mosaic disease of pigeonpea. J. General Plant Pathol. 81, 249–259, https://doi.org/10.1007/s10327-015-0585-z (2015). 29. Parihar, A. K. et al. Biplot evaluation of test environments and identification of lentil genotypes with durable resistance to fusarium
wilt in India. Crop & Pasture Sci. 68, 1024–1030, https://doi.org/10.1071/CP17258 (2017a). 30. Parihar, A. K. et al. Targeting test environments and rust-resistant genotypes in lentils (Lens culinaris) by using heritability-adjusted
biplot analysis. Crop & Pasture Sci. 69, https://doi.org/10.1071/CP18259 (2018). 31. Tekalign, A., Sibiya, J., Derera, J. & Fikre, A. Analysis of genotype environment interaction and stability for grain yield and chocolate
spot (‘Botrytis fabae’) disease resistance in faba bean (‘Vicia faba’). Australian J. Crop Sci. 11, 1228–1235, https://doi.org/10.21475/ajcs.17.11.10.pne413 (2017).
32. Das, A. et al. Deciphering genotype-by-environment interaction for targeting test environments and rust resistant genotypes in field pea (Pisum sativum L.). Frontiers in Plant Sci. 10, 825 (2019).
33. Yan, W. Singular-value partitioning in biplot analysis of multienvironment trial data. Agron. J. 94, 990–996, https://doi.org/10.2134/agronj2002.9900 (2002).
34. Yan, W. & Tinker, N. A. Biplot analysis of multi-environment trial data: Principles and applications. Canadian J. Plant Sci. 86, 623–645, https://doi.org/10.4141/P05-169 (2006).
35. Yan, W., Kang, M. S., Ma, B., Woods, S. & Cornelius, P. L. GGE biplot vs. AMMI analysis of genotype-by-environment data. Crop Sci. 47, 643–653, https://doi.org/10.2135/cropsci2006.06.0374 (2007).
36. Sharma, M. et al. Environmental influences on pigeonpea-Fusarium udum interactions and stability of genotypes to Fusarium wilt. Frontiers Plant Sci. 7, 253–263, https://doi.org/10.3389/fpls.2016.00253 (2016).
37. Gauch, H. & Zobel, R. W. Identifying mega-environments and targeting genotypes. Crop Sci. 37, 311–326 (1997). 38. Yan, W. & Rajcan, I. Biplot analysis of test sites and trait relations of soybean in Ontario. Crop Sci. 42, 11–20, https://doi.org/10.2135/
cropsci2002.1100 (2002). 39. Yan, W., Hunt, L. A., Sheng, Q. & Szlavnics, Z. Cultivar evaluation and mega-environment investigation based on the GGE biplot.
Crop Sci. 40, 597–605, https://doi.org/10.2135/cropsci2000.403597x (2000). 40. Putto, W., Patanothai, A., Jogloy, S. & Hoogenboom, G. Determination of mega-environments for peanut breeding using the CSM-
CROPGRO-peanut model. Crop Sci. 48, 973–982, https://doi.org/10.2135/cropsci2007.10.0552 (2008). 41. Rao, P. S., Reddy, P. S., Rathore, A., Reddy, B. V. & Panwar, S. Application GGE biplot and AMMI model to evaluate sweet sorghum
(Sorghum bicolor) hybrids for genotype× environment interaction and seasonal adaptation. Indian J. Agri. Sci. 81, 438–444 (2011). 42. Yan, W. GGE biplot‒A windows application for graphical analysis of multienvironment-trial data and other types of two-way data.
Agron J. 93, 1111–1118, https://doi.org/10.2134/agronj2001.9351111x (2001). 43. Yan, W., Tinker, N. A. & Falk, D. E. QTL identification, mega-environment classification, and strategy development for marker-
based selection using biplots. J. Crop Improv. 14, 299–324, https://doi.org/10.1300/J411v14n01_12 (2005). 44. Bramel-Cox, P. J. Breeding for reliability of performance across unpredictable environments. Genotype-by-Environment Interaction
309–339 (CRC Press, Boca Raton, Florida1996). 45. Lin, C. S. & Binns, M. R. A superiority measure of cultivar performance for cultivar× location data. Canadian J. Plant Sci. 68,
193–198 (1988). 46. Kang, M. Genotype–Environment Interaction: Progress and Prospects. Quantitative genetics, genomics, and plant breeding, 219
(2002). 47. Baker, R. J. Crossover genotype–environmental interaction in spring wheat. In Kang, M. S. (Eds.), Genotype-by-Environment
Interaction and Plant Breeding. 42–51 (Louisiana State University Agricultural Center, Baton Rouge, Louisiana,1990). 48. Singh, M., Ceccarelli, S. & Grando, S. Genotype × environment interaction of crossover type: detecting its presence and estimating
the crossover point. Theor. Appl. Genet. 99, 988–995 (1999). 49. Rakshit, S. et al. GGE biplot analysis to evaluate genotype, environment and their interactions in sorghum multi-location data.
Euphytica 185, 465–479, https://doi.org/10.1007/s10681-012-0648-6 (2012). 50. Ryals, J., Uknes, S. & Ward, E. Systemic acquired resistance. Plant Physiol. 104, 1109–1112 (1994). 51. Scandalios, J. G. Response of plant antioxidant defense genes to environmental stress. In Scandalios, J. G. & Wright, T. R. F. (Eds.),
Advances in Genetics, (pp. 1–41). (Academic Press, New York 1990). 52. Beyene, Y. et al. Genotype by environment interactions and yield stability of stem borer resistant maize hybrids in Kenya. African J.
Biotech. 10, 4752–4758 (2011). 53. Yan, W., Frégeau-Reid, J., Martin, R., Pageau, D. & Mitchell-Fetch, J. W. How many test locations and replications are needed in crop
variety trials in a target region? Euphytica 202, 361–372, https://doi.org/10.1007/s10681-014-1253-7 (2015). 54. Kaya, Y., Akçura, M. & Taner, S. GGE-biplot analysis of multi-environment yield trials in bread wheat. Turkish J. Agri. Forest. 30,
325–337 (2006). 55. Gao, S. et al. Effect of salt stress on growth, antioxidant enzyme phenylalanine ammonia lyase activities in Jatropha curcas seedlings.
Plant Soil Environ. 54, 374–381 (2008). 56. Afifi, A. M. R., Al-Sayed, A. A., Mahfoud, N. A. M. & Farahat, A. A. Enzymatic & non enzymatic oxidants and antioxidants involved
in defence mechanisms against root-knot, renifirm and citrus nematodes in their hosts. Egypt. J. Agronematol. 13, 172–188 (2014).
1 4Scientific RepoRtS | (2020) 10:4108 | https://doi.org/10.1038/s41598-020-60820-x
www.nature.com/scientificreportswww.nature.com/scientificreports/
57. Chawla, N., Choudhary, K., Kaur, S. & Jindal, S. Changes in Antioxidative Enzymes in Resistant and Susceptible Genotypes of Tomato Infected with Root-Knot Nematode (Meloidogyne incognita). Indian J. Nemat. 40, 178–181 (2013).
58. Doncaster, C. C. A counting dish for nematodes. Nematol. 7, 334–337 (1962). 59. Taylor, A. L. & Sasser, J. N. Biology, identification and control of root-knot nematodes (Meloidogyne species). Biology, identification
and control of root-knot nematodes (Meloidogyne species). (1978). 60. Hussey, R. S. & Barker, K. R. A comparison of methods of collecting inocula of Meloidogyne spp. including a new technique. Plant
Dis. Rep. 57, 1025–1028 (1973). 61. Sasser, J. N., Carter, C. C. & Hartman, K. M. Standardization of host suitability studies and reporting of resistance to root-knot
nematode. Techenical Bulletin pp 1–7(1984). 62. Southey, J. F. Laboratory Methods for work with Plant and Soil Nematodes. Ministry of Agriculture, Fisheries and Food, HMSO,
London (1986). 63. Zhang, F. & Schmitt, D. P. Host status of 32 plant species to Meloidogyne konaensis. Supp. J. Nematol. 26, 744–748 (1994). 64. Yan, W. & Kang, M. S. GGE biplot analysis: A graphical tool for breeders, geneticists, and agronomists. CRC Press, Boca Raton, FL
(2003). 65. Xu, B. J. & Chang, S. K. A comparative study on phenolic profiles and antioxidant activities of legumes as affected by extraction
solvents. J. Food Sci. 72, S159–166 (2007). 66. Dahuja, A. & Madaan, T. R. Off flavour development in soybeans: comparative role of some antioxidants and related enzymes. J. Sci.
Food Agric. 84, 547–550 (2004). 67. Sadasivam, S. & Manickam, A. Biochemical methods. New age International (P) limited, publishers, New Delhi, pp. 124–125 (2008).
AcknowledgementsWe acknowledge the contribution of the collaborating centres of All India Coordinated Research Project (AICRP) on Mungbean and other pulses for proper execution of these trials at respective locations and recording observations on nematode reaction meticulously.
Author contributionsB.S. and S.G. designed the overall project, A.D. wrote the manuscript under the supervision of S.G.; D.S. and R.K. analysed the data and B.B., K.N.P., K.D., N.D., N.K. and R.L.M. performed phenotyping and nematode incidence scoring; B.S., A.D., A.K.P., A.P. and S.G. edited and revised the manuscript.
competing interestsThe authors declare no competing interests.
Additional informationSupplementary information is available for this paper at https://doi.org/10.1038/s41598-020-60820-x.Correspondence and requests for materials should be addressed to A.D. or S.G.Reprints and permissions information is available at www.nature.com/reprints.Publisher’s note Springer Nature remains neutral with regard to jurisdictional claims in published maps and institutional affiliations.
Open Access This article is licensed under a Creative Commons Attribution 4.0 International License, which permits use, sharing, adaptation, distribution and reproduction in any medium or
format, as long as you give appropriate credit to the original author(s) and the source, provide a link to the Cre-ative Commons License, and indicate if changes were made. The images or other third party material in this article are included in the article’s Creative Commons License, unless indicated otherwise in a credit line to the material. If material is not included in the article’s Creative Commons License and your intended use is not per-mitted by statutory regulation or exceeds the permitted use, you will need to obtain permission directly from the copyright holder. To view a copy of this License, visit http://creativecommons.org/licenses/by/4.0/. © The Author(s) 2020
Related Documents