ASPRS 2014 Annual Conference Louisville, Kentucky ♦ March 23-28, 2014 DELINEATING DRAINAGE NETWORKS IN URBAN AREAS Tammy E. Parece, Ph.D. Candidate James B. Campbell, Professor Virginia Polytechnic Institute and State University 220 Stanger Street Major Williams Hall Blacksburg, Virginia 24060 [email protected] [email protected] ABSTRACT Urbanization alters the natural water cycle. One of urbanization’s most significant effects is increasing impervious surface cover which reduces infiltration, increases runoff volume and rate, and decreases evapotranspiration. Effective management of urban stormwater runoff and water quality issues can only be accomplished once drainage area and flow networks are accurately identified. Typically, geospatial evaluation of hydrologic impacts begins with identification of water flow and watershed boundaries, applying assessment techniques based on those designed for natural landscapes. However, urban hydrology differs from that of natural environments and thus urban watersheds require innovative evaluation techniques. This study identifies information gaps that originate from applications of standard geospatial techniques in urban hydrology. Delineation of a highly urbanized watershed in Fairfax County, Virginia was first accomplished using standard techniques. Next, using lidar data, the watershed was again delineated and both results compared. By overlaying both delineations on aerial photos and adding impervious surface and storm network layers, we identified regions redirecting the natural flow of water from the stream channel, then removed these regions from the watershed area. The results revealed a decrease in the watershed area by almost 17%, the natural watershed boundary was significantly altered, creating a much longer perimeter, and sink areas revealed. These results support the hypothesis that delineations of urban watersheds differ from those in natural settings. Anthropocentric alterations to land cover and landscape create a complex hydrology. The greatest complications are impervious surfaces and storm networks which redirect water flow. KEY WORDS: urban, drainage networks, Lidar, GIS, Fairfax County, Virginia INTRODUCTION One of the most significant land use changes is conversion of rural to urban land — losses of agricultural and forested lands, coupled with increasing impervious surface cover (Deelstra and Girardet 2000; Pickett et al. 2001). Decreasing vegetative cover and increasing impervious surface cover have direct effects on natural temperature regulation (DeBusk et al. 2010; Geiger et al. 2003; Slonecker et al. 2001), alters the hydrologic cycle (DeBusk et al. 2010; Slonecker et al. 2001; Welker et al. 2010) and destroys habitats (Burton Jr. and Pitt 2002). The most significant effect of increasing urbanization is the creation of large areas of impervious surface cover which alters the natural water cycle. Alteration of the hydrologic cycle represents the most significant water quality issue present today (Civco et al. 2002; DeBusk et al. 2010; Slonecker et al. 2001). The landscape change due to reduced vegetative cover and increased impervious surfaces has resulted in less infiltration, higher runoff volume and rate, declining groundwater tables, and decreased evapotranspiration (DeBusk et al. 2010; Welker et al. 2010). Stormwater runoff from impervious surfaces in urban regions creates water quality problems, including higher water temperatures and elevated levels of contaminants in surface waters (Davis et al. 2010; Slonecker et al. 2001; Welker et al. 2010). Stormwater runoff not only effects the water quality within a specific urban region but also vitiates downstream waterbodies (Bhaduri and Minner 2001). Water bodies experience changes from stormwater runoff with less than 10% impervious surface cover within its watershed (Center for Watershed Protection 2003). A better understanding of hydrologic impacts of urbanization is required as

Welcome message from author
This document is posted to help you gain knowledge. Please leave a comment to let me know what you think about it! Share it to your friends and learn new things together.
Transcript
ASPRS 2014 Annual Conference Louisville, Kentucky ♦ March 23-28, 2014
DELINEATING DRAINAGE NETWORKS IN URBAN AREAS
Tammy E. Parece, Ph.D. Candidate James B. Campbell, Professor
Virginia Polytechnic Institute and State University 220 Stanger Street
Major Williams Hall Blacksburg, Virginia 24060
[email protected] [email protected]
ABSTRACT Urbanization alters the natural water cycle. One of urbanization’s most significant effects is increasing impervious surface cover which reduces infiltration, increases runoff volume and rate, and decreases evapotranspiration. Effective management of urban stormwater runoff and water quality issues can only be accomplished once drainage area and flow networks are accurately identified. Typically, geospatial evaluation of hydrologic impacts begins with identification of water flow and watershed boundaries, applying assessment techniques based on those designed for natural landscapes. However, urban hydrology differs from that of natural environments and thus urban watersheds require innovative evaluation techniques. This study identifies information gaps that originate from applications of standard geospatial techniques in urban hydrology. Delineation of a highly urbanized watershed in Fairfax County, Virginia was first accomplished using standard techniques. Next, using lidar data, the watershed was again delineated and both results compared. By overlaying both delineations on aerial photos and adding impervious surface and storm network layers, we identified regions redirecting the natural flow of water from the stream channel, then removed these regions from the watershed area. The results revealed a decrease in the watershed area by almost 17%, the natural watershed boundary was significantly altered, creating a much longer perimeter, and sink areas revealed. These results support the hypothesis that delineations of urban watersheds differ from those in natural settings. Anthropocentric alterations to land cover and landscape create a complex hydrology. The greatest complications are impervious surfaces and storm networks which redirect water flow. KEY WORDS: urban, drainage networks, Lidar, GIS, Fairfax County, Virginia
INTRODUCTION
One of the most significant land use changes is conversion of rural to urban land — losses of agricultural and forested lands, coupled with increasing impervious surface cover (Deelstra and Girardet 2000; Pickett et al. 2001). Decreasing vegetative cover and increasing impervious surface cover have direct effects on natural temperature regulation (DeBusk et al. 2010; Geiger et al. 2003; Slonecker et al. 2001), alters the hydrologic cycle (DeBusk et al. 2010; Slonecker et al. 2001; Welker et al. 2010) and destroys habitats (Burton Jr. and Pitt 2002). The most significant effect of increasing urbanization is the creation of large areas of impervious surface cover which alters the natural water cycle. Alteration of the hydrologic cycle represents the most significant water quality issue present today (Civco et al. 2002; DeBusk et al. 2010; Slonecker et al. 2001). The landscape change due to reduced vegetative cover and increased impervious surfaces has resulted in less infiltration, higher runoff volume and rate, declining groundwater tables, and decreased evapotranspiration (DeBusk et al. 2010; Welker et al. 2010). Stormwater runoff from impervious surfaces in urban regions creates water quality problems, including higher water temperatures and elevated levels of contaminants in surface waters (Davis et al. 2010; Slonecker et al. 2001; Welker et al. 2010). Stormwater runoff not only effects the water quality within a specific urban region but also vitiates downstream waterbodies (Bhaduri and Minner 2001). Water bodies experience changes from stormwater runoff with less than 10% impervious surface cover within its watershed (Center for Watershed Protection 2003). A better understanding of hydrologic impacts of urbanization is required as
ASPRS 2014 Annual Conference Louisville, Kentucky ♦ March 23-28, 2014
current best management practices implemented to address urban stormwater runoff are proving to be insufficient (Burton Jr. and Pitt 2002). Effective management of urban stormwater runoff and water quality issues can only be accomplished once drainage areas and flow networks in urban settings are better identified (Burton Jr. and Pitt 2002; McPherson and Schneider 1974). On-the-ground surveys in an urban area produce a watershed boundary that is dissimilar to those of a natural watershed because they can account for grading and slope changes from impervious surfaces. However, such surveys cannot account for inflows or outflows of water due to storm network systems. In addition, in large urban areas, field surveys can be quite complex, expensive, and disruptive to daily human activities. With the advent of GIS, extensive research has been accomplished in modeling water flow (Rodriguez et al. 2008). Typically, geospatial evaluation of hydrologic impacts begins with identification of overland water flow and watershed boundary areas, and application of evaluative techniques based on similar techniques used in natural landscapes (Rodriguez et al. 2003; Sample et al. 2001). However, urban hydrologic characteristics are unique -- quite unlike those of natural environments (Debo and Reese 2003; Kaufman et al. 2001; Rodriguez et al. 2003; Sample et al. 2001). Anthropogenic changes from grading land, and building impervious surfaces, along with storm sewer systems can direct water flows from one catchment area to another (McPherson and Schneider 1974). Despite recognition by many researchers that storm networks and impervious surfaces have altered water flows in urban areas, and the need to include these and aerial photographs with raster based-delineations (Debo and Reese 2003; Kaufman et al. 2001), few researchers alter standard geospatial methods to delineate an urban watershed. We did locate methods which included storm networks into catchment identification within four articles on evaluating stormwater flow, however, each of these limited their applications (Table 1). One other researcher does advocate using Arc Hydro tools in such analyses (Johnson 2009), but “Arc Hydro describes natural water systems, not constructed” (Maidment 2002, p 8).
Table 1. Research including storm network systems in their identification of urban watershed boundaries
Author Year Method Sample et al. 2001 Gathered vector based data from an on-the-ground analysis for a 43 acre neighborhood.
Rodriguez et al. 2003 Used a land-based survey to delineate three specific catchment areas (between 18 and 180 hectares) and then added storm sewers to analyze water flow.
Lhomme et al. 2004 Established a DEM delineated flow path, overlaid the storm drainage system and calculated the change in flow path
Amaguchi et al. 2012 Vector-based urban landscape delineation and divided study area into city blocks to evaluate water flow within each block. Also split water flow into above surface and below surface, eventually all flowing into the river channel.
Our study approach addressed gaps in use of geospatial techniques in urban hydrology. We used geospatial technologies, vector and raster analysis along with aerial photos. We propose using these additional techniques for a complete evaluation in urban settings. Our final results demonstrate why using standard geospatial techniques for watershed and water flow identification used in natural areas are insufficient in urban environments. A case study for a small urban watershed in Fairfax County, Virginia illustrates the value of applying different methods to delineate the watershed and flow network, and forms the basis for comparative analysis. We included additional information, such as the storm drainage network, high-resolution aerial photos, and slopes and aspects of impervious surfaces to this analysis. Alterations of the watershed will be demonstrated and discussed. Finally, we will identify additional processes necessary to validate the inclusion of this additional information in adequately delineating an urban watershed and its flow network.
STUDY AREA
The Flatlick Branch of the Cub Run watershed in Fairfax County, Virginia is our study site. This stream and watershed are located in the extensively urbanized northern Virginia area, just outside of Washington, D.C. Specifically, the stream is in northwestern Fairfax County, very close to Washington Dulles International Airport (Figure 1). Land use in the watershed is generally single-family residential, with smaller areas of commercial land uses, a golf course, and dispersed forest patches.

ASPRS 2014 Annual Conference Louisville, Kentucky ♦ March 23-28, 2014
Figure 1. Location of Flatlick Branch of the Cub Run Stream, Fairfax County, VA
Extensive data is available for Fairfax County watersheds, as the U.S.G.S. has numerous streams gauged in this area for water quantity and quality assessments. The U.S.G.S. office in Richmond, Virginia provided the data used in this analysis:
• natural color aerial photos at ½ foot resolution, acquired in 2009; • an elevation model generated from lidar with 1x1 meter resolution, acquired in 2009; • Fairfax County field documented stream channels in a GIS shapefile, completed in 2008 (Figure 2); • U.S.G.S watershed map, digitized after hand delineation from a topo map in a GIS shapefile (Figure 2); • shapefile for the location of the U.S.G.S. Flatlick Branch stream gage, installed in 2007; and • shapefiles for all known or surveyed stormwater pipes, drains (manholes and curbside), and retention ponds
for Fairfax County, completed in 2005.

ASPRS 2014 Annual Conference Louisville, Kentucky ♦ March 23-28, 2014
Figure 2. The U.S.G.S. delineated watershed (red boundary) and field-documented stream channels (in blue)
of the Flatlick Branch, overlaid on aerial photos
METHODS
Our methods were simple and straight forward. We used the spatial analysis hydrology tools in GIS to delineate the watershed and flow accumulation network from the lidar elevation model using the U.S.G.S. station gage as the pourpoint. We wished to compare this to the U.S.G.S. watershed to determine which watershed model would be the best to use within our analysis. According to the flow accumulation network, runoff from all the land area within the watershed should ultimately flow into the original pourpoint (the U.S.G.S. stream gage location). So for the next step of our analysis, we overlaid the storm network shapefiles on the watershed, contour lines generated from the lidar elevation model, stream channel shapefile, and surface flow network to evaluate how the storm networks would influence or impact water flow within the watershed area. We were specifically looking for three situations:
1) storm networks that do not connect to surface drainageways, thus are not part of the “naturally” delineated watershed and act as isolated catchment areas;
2) storm pipes that discharge outside the watershed (de facto decrease in drainage area); and 3) storm pipes that drain into the watershed (de facto addition to drainage area).
Additionally, we overlaid the storm networks on the aerial photos to confirm the three above situations.
For the final step of our analysis, we identified the land area that was drained by the above three situations, and thus either removed land area or added land area to the watershed delineation.
RESULTS
ASPRS 2014 Annual Conference Louisville, Kentucky ♦ March 23-28, 2014
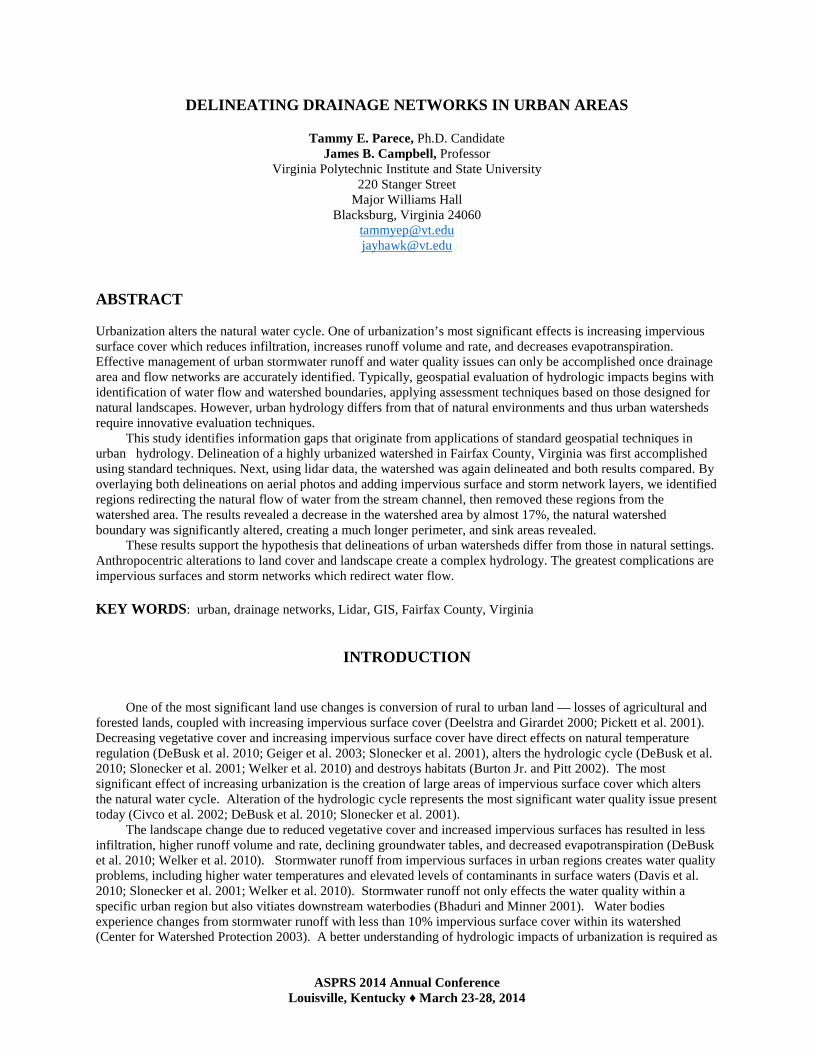
Figure 3 shows results of delineating the watershed from the lidar elevation model. Overlaying the U.S.G.S. watershed (green outline) on the lidar image reveals that the watershed shapes are very similar but also reveals the impact of roads and other impervious surfaces -- sharpening some of the edges of the lidar watershed. The area in hectares is very similar – 1089 for the U.S.G.S. and 1086.6 for the lidar elevation model. However, we felt that the lidar watershed was the most appropriate to use in the next two steps of our analysis, as it appears to include the influence of impervious surfaces in some areas of the watershed delineation.
Figure 3. U.S.G.S. Delineated watershed (green outline) overlaid on the lidar elevation model
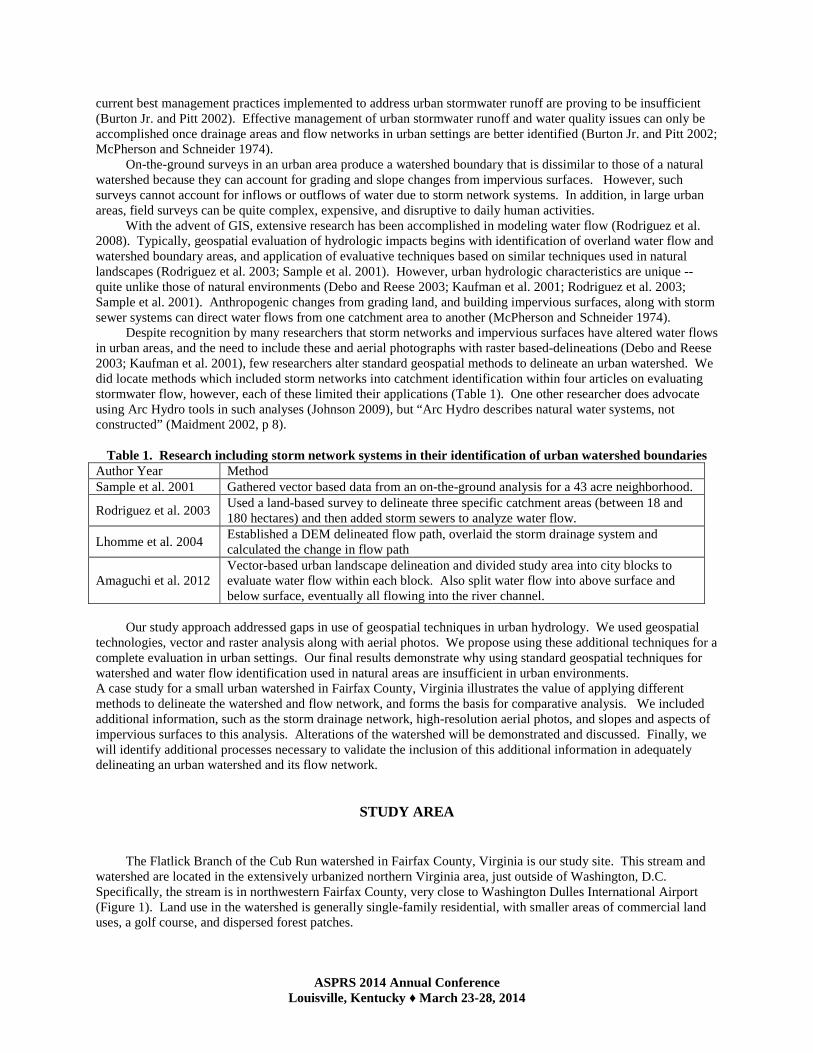
When overlaying the storm network shapefiles on the lidar elevation model, we indeed identified several areas that met each of the criteria of step two: 1) storm network facilities isolated from the stream network (Figure 4), including retention ponds either not located on water flow channels or connected only to each other by storm network pipes (Figure 5); 2) storm pipes that discharge outside the watershed; and 3) storm pipes that drain into the watershed area.
Figure 4. Storm drains and pipes designed to drain land Figure 5. Retention ponds connected to each area into a retention pond and not into the stream channel other and not to the stream channel We overlaid storm network files on the aerial photos and performed a visual examination to confirm our findings. We confirmed our discoveries, and in some instances identified storm networks designed to drain into a retention pond and not into the stream (Figure 6 – orange oval). In other cases, we discovered that the storm drain pipes actually connected two unconnected stream channels and then directed water flow into a buffer zone around

ASPRS 2014 Annual Conference Louisville, Kentucky ♦ March 23-28, 2014
the stream (Figure 6 – fuchsia rectangle). We also discovered that, for some locales where the storm pipes cross the watershed boundary, we could not determine the direction of the water flow (into or out of the watershed).
Figure 6. Isolated storm networks and retention ponds (orange oval), a stream channel and storm pipes (yellow
lines) that direct water flow into a storm retention pond. An area where storm drain pipes actually connected disconnected stream channels to the main stream channel (fuchsia rectangle).
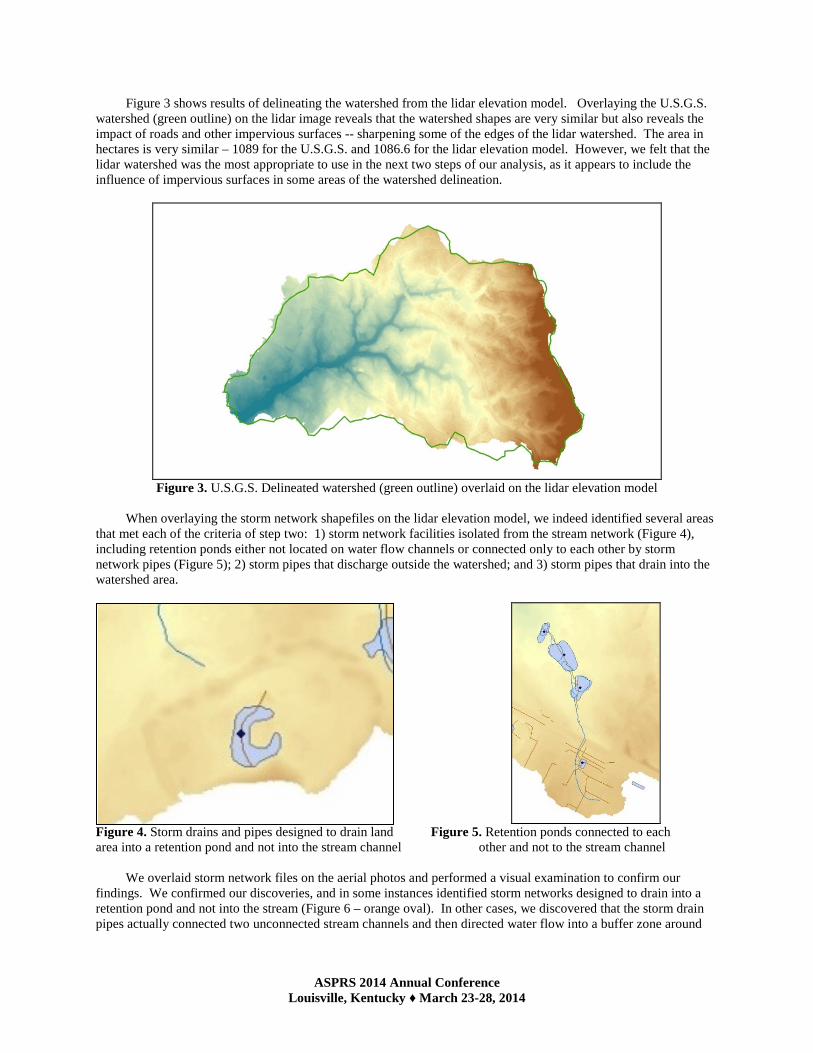
After our overlay evaluations, we were left with 24 areas of water flow disconnected from the stream channel because of the storm network facilities. Some areas were clearly visible on the lidar elevation model as separate catchment areas (please refer back to Figure 4 - darker colors represent higher elevations, thus watershed divides). As such, we designated these isolated retention ponds as “sink” areas and used these locations as pourpoints. With the watershed delineation tool, we were able identify the land area drained by these storm network facilities and thus not included in the Flatlick Branch’s “natural” watershed. In several areas identified in the last two steps, impervious surfaces or drainage pipes brought additional water flow into the retention ponds -- in some cases with storm water inlets and in other areas by the grading of impervious surfaces. So after we identified the initial land area that drained into these retention ponds, we had to add the additional land areas served by the storm water inlets (for example Figure 7). In Figure 7, the yellow polygon area is the storm network retention pond, the small yellow circles are the stormwater inlets (curbside drains and manholes), the black lines are the storm network pipes, and the orange lines represent the “natural” flow accumulation layer generated by GIS. The dark gray area is the watershed delineated for this retention pond. The stormwater inlets (yellow circles) were clearly installed at stormwater flow locations as they are placed directly on the flow accumulation. The storm network pipes tie directly into these drains to allow stormwater flow straight into the stormwater retention pond. Since we needed to pick up the additional land area covered by these flows, we used the stormwater inlets as additional pour points. The land areas in white and lighter gray represent the additional land area that drains into this retention pond.
ASPRS 2014 Annual Conference Louisville, Kentucky ♦ March 23-28, 2014
Figure 7. Storm drain pipes adding additional land area to the retention pond’s watershed
We conducted this delineation for all isolated storm network facilities within the watershed, each time
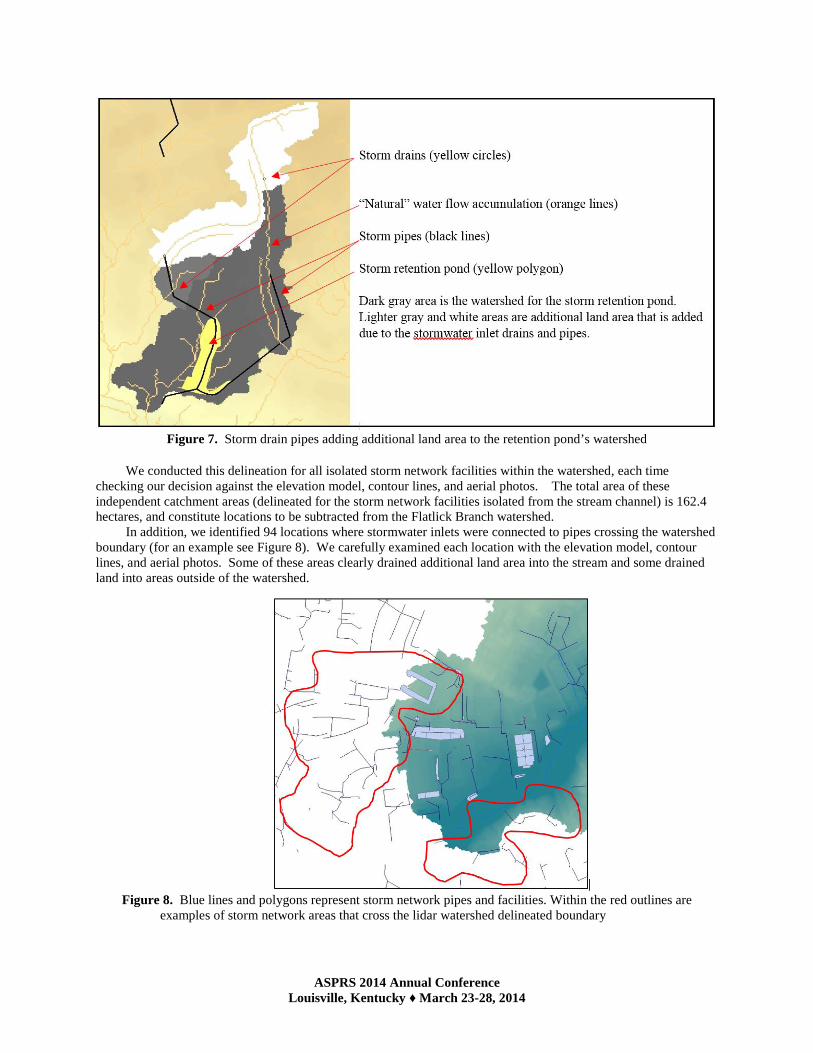
checking our decision against the elevation model, contour lines, and aerial photos. The total area of these independent catchment areas (delineated for the storm network facilities isolated from the stream channel) is 162.4 hectares, and constitute locations to be subtracted from the Flatlick Branch watershed. In addition, we identified 94 locations where stormwater inlets were connected to pipes crossing the watershed boundary (for an example see Figure 8). We carefully examined each location with the elevation model, contour lines, and aerial photos. Some of these areas clearly drained additional land area into the stream and some drained land into areas outside of the watershed.
Figure 8. Blue lines and polygons represent storm network pipes and facilities. Within the red outlines are
examples of storm network areas that cross the lidar watershed delineated boundary
ASPRS 2014 Annual Conference Louisville, Kentucky ♦ March 23-28, 2014
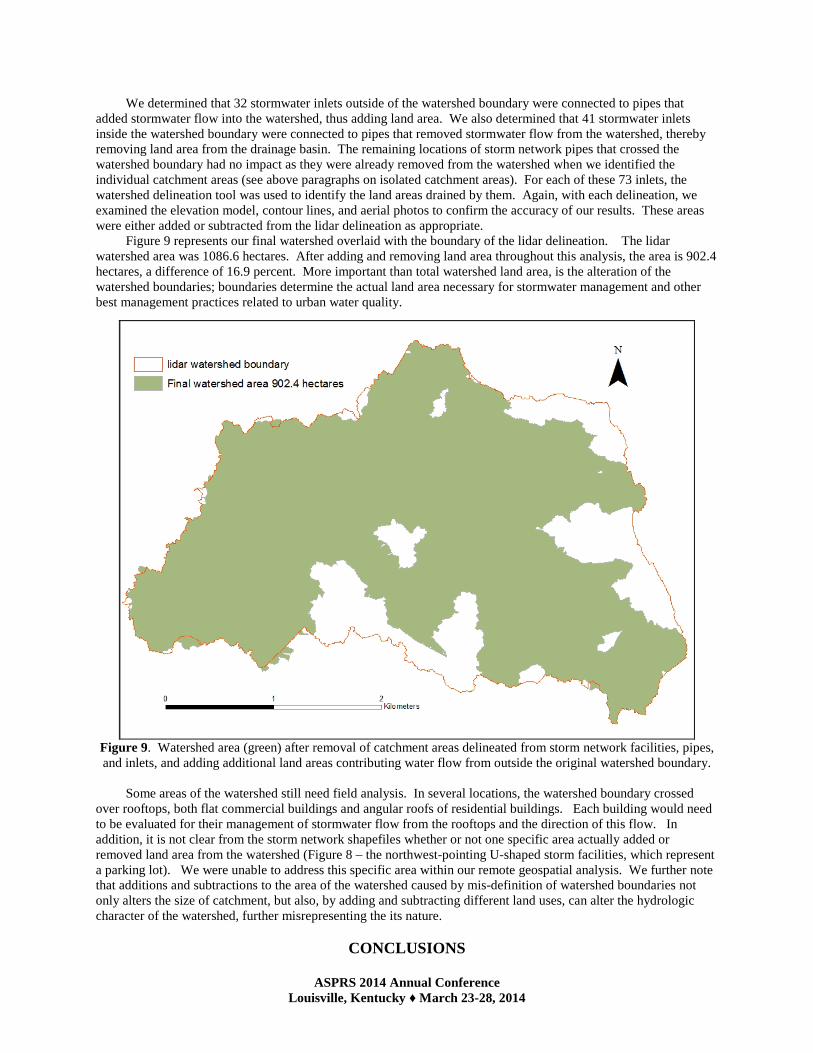
We determined that 32 stormwater inlets outside of the watershed boundary were connected to pipes that added stormwater flow into the watershed, thus adding land area. We also determined that 41 stormwater inlets inside the watershed boundary were connected to pipes that removed stormwater flow from the watershed, thereby removing land area from the drainage basin. The remaining locations of storm network pipes that crossed the watershed boundary had no impact as they were already removed from the watershed when we identified the individual catchment areas (see above paragraphs on isolated catchment areas). For each of these 73 inlets, the watershed delineation tool was used to identify the land areas drained by them. Again, with each delineation, we examined the elevation model, contour lines, and aerial photos to confirm the accuracy of our results. These areas were either added or subtracted from the lidar delineation as appropriate. Figure 9 represents our final watershed overlaid with the boundary of the lidar delineation. The lidar watershed area was 1086.6 hectares. After adding and removing land area throughout this analysis, the area is 902.4 hectares, a difference of 16.9 percent. More important than total watershed land area, is the alteration of the watershed boundaries; boundaries determine the actual land area necessary for stormwater management and other best management practices related to urban water quality.
Figure 9. Watershed area (green) after removal of catchment areas delineated from storm network facilities, pipes, and inlets, and adding additional land areas contributing water flow from outside the original watershed boundary.
Some areas of the watershed still need field analysis. In several locations, the watershed boundary crossed over rooftops, both flat commercial buildings and angular roofs of residential buildings. Each building would need to be evaluated for their management of stormwater flow from the rooftops and the direction of this flow. In addition, it is not clear from the storm network shapefiles whether or not one specific area actually added or removed land area from the watershed (Figure 8 – the northwest-pointing U-shaped storm facilities, which represent a parking lot). We were unable to address this specific area within our remote geospatial analysis. We further note that additions and subtractions to the area of the watershed caused by mis-definition of watershed boundaries not only alters the size of catchment, but also, by adding and subtracting different land uses, can alter the hydrologic character of the watershed, further misrepresenting the its nature.
CONCLUSIONS
ASPRS 2014 Annual Conference Louisville, Kentucky ♦ March 23-28, 2014
One meter resolution lidar delineation of a watershed only slightly changed the delineation based upon the U.S.G.S. manual interpretation using a topographic map. The difference in area was only 2.6 hectares. For those locales, with physical characteristic similar to the Cub Run watershed, that do not have lidar available, this result demonstrates very little difference between 10 x 10 meter and 1 x 1 meter resolution elevation models. Thus, lidar may not be a requirement for urban watershed delineation. Actual boundary differences were more pronounced and may have more influence on the actual water flow in an urban area. The lidar delineated watershed appeared to provide a better account of impervious surfaces than did the U.S.G.S. model. The lidar resolution, at only 1 x 1 meter, was based on final returns of the lidar for the surface elevation. However, neither delineation accounted for additions or subtractions from the watershed resulting from storm network inlets (curbside drains and manholes), pipes, and retention facilities. After subtracting isolated networks from the watershed, the area decreased by almost 17%. This GIS analysis has supported the original contention that using GIS to delineating watersheds in urban areas is not as simple as it is in natural settings, and that anthropocentric alterations to land cover and landscape create complex hydrologic geometries. The greatest complications are storm sewer networks and impervious surfaces, which are designed to redirect water flow. With the storm drain networks, lidar and high resolution aerial photography, GIS can include this data in delineating the watersheds. However, despite the ability to include the storm networks in GIS analysis, impervious surfaces interfere with use of the hydrology toolset and thus ground assessment may be necessary. Relationships between natural and built drainage systems also require further evaluation. Individual catchments identified are locations that would be amendable to greenspaces, such as urban agriculture, as these catchments can provide a source of water for plant life. In addition, these individual catchments, in the form of stormwater retention facilities, should assist in groundwater recharge in urban areas.
ACKNOWLEDGEMENTS We would like to thank John Jastram of the U.S. Geological Survey for providing the geospatial files used in this analysis. REFERENCES
Amaguchi, H., Kawamura, A., Olsson, J., & Takasaki, T. 2012. Development and testing of a distributed urban storm runoff event model with a vector-based catchment delineation, Journal of Hydrology, 420–421, 205-215.
Bhaduri, B., & Minner, M. 2001. Long-term hydrologic impact of urbanization: A tale of two models, Journal of Water Resources Planning & Management, 127, 13.
Burton Jr., G.A., & Pitt, R.E. 2002. Stormwater Effects Handbook: A Toolbox for Watershed Managers, Scientists and Engineers, Lewis Publishers, Washington DC.
Center for Watershed Protection. 2003. Impacts of Impervious Cover on Aquatic Systems: Watershed Protection Research Monograph, Center for Watershed Protection, Ellicott City, MD.
Civco, D.J., Hurd, J.D., Wilson, E.H., Arnold, C.L., & Prisloe Jr., M.P. 2002. Quantifying and describing urbanizing landscapes in the Northeast United States, Photogrammetric Engineering & Remote Sensing, 68, 1083-1090.
Davis, A.P., Traver, R.G., & Hunt, W.F. 2010. Improving urban stormwater quality: Applying fundamental principles, Journal of Contemporary Water Research and Education, 146, 3-10.
Debo, T.N., & Reese, A.J. 2003. Municipal Stormwater Management, 2nd Edition, CRC Press, Boca Raton, FL. DeBusk, K., Hunt, W.F., Hatch, U., & Sydorovych, O. 2010. Watershed retrofit and management evaluation for
urban stormwater management systems in North Carolina, Journal of Contemporary Water Research and Education, 146, 64-74.
Deelstra, T., & Girardet, H. 2000. Urban agriculture and sustainable cities. In N. Bakker, M. Dubbeling, S. Gündel, U. Sabel-Koschella, & H. deZeeuw (Eds.), Growing Cities, Growing Food: Urban Agriculture on the Policy Agenda, a Reader on Urban Agriculture, Deutsche Stiftung für Internationale Entwicklung, Zentralstelle für Ernährung und Landwirtschaft, Feldafing, Germany, pp. 43-66.
Geiger, R., Aron, R.H., & Todhunter, P. 2003. The Climate Near the Ground, 6th Edition, Rowman & Littlefield, Lanham, MD.
ASPRS 2014 Annual Conference Louisville, Kentucky ♦ March 23-28, 2014
Johnson, L.E. 2009. Geographic Information Systems in Water Resources Engineering, CRC Press, Boca Raton, FL. Kaufman, M.M., Rogers, D., & Murray, K.S. (2001). Urban Watersheds: Geology, Contamination, and Sustainable
Development, CRC Press, Boca Raton, FL. Lhomme, J., Bouvier, C., & Perrin, J.L. 2004. Applying a GIS-based geomorphological routing model in urban
catchments, Journal of Hydrology, 299, 203-216. Maidment, D.R. 2002. Arc Hydro: GIS for Water Resources, ESRI, Redlands, CA. McPherson, M.B., & Schneider, W.J. 1974. Problems in modeling urban watersheds, Water Resources Research,
10(3), 434-400. Pickett, S.T.A., Cadenasso, M.L., Grove, J.M., Nilon, C.H., Pouyat, R.V., Zipperer, W.C., & Costanza, R. 2001.
Urban ecological systems: Linking terrestrial ecological, physical, and socieoeconomic components of metropolitan areas, The Annual Review of Ecological Systems, 32, 127-157.
Rodriguez, F., Andrieu, H., & Creutin, J.D. 2003. Surface runoff in urban catchments: morphological identification of unit hydrographs from urban databanks, Journal of Hydrology, 283, 146-168.
Rodriguez, F., Andrieu, H., & Morena, F. 2008. A distributed hydrological model for urbanized areas – Model development and application to case studies, Journal of Hydrology, 351, 268-287.
Sample, D., Heaney, J., Wright, L., & Koustas, R. 2001. Geographic Information Systems, Decision Support Systems, and Urban Storm-Water Management, Journal of Water Resources Planning and Management, 127, 155-161.
Slonecker, E.T., Jennings, D.B., & Garofalo, D. 2001. Remote sensing of impervious surfaces: A review, Remote Sensing Reviews, 20, 227-255.
Welker, A.L., Wadzuk, B.M., & Traver, R.G. 2011. Integration of education, scholarship, and service through stormwater management, Journal of Contemporary Water Research and Education, 146, 83-91.
Related Documents