Welcome message from author
This document is posted to help you gain knowledge. Please leave a comment to let me know what you think about it! Share it to your friends and learn new things together.
Transcript
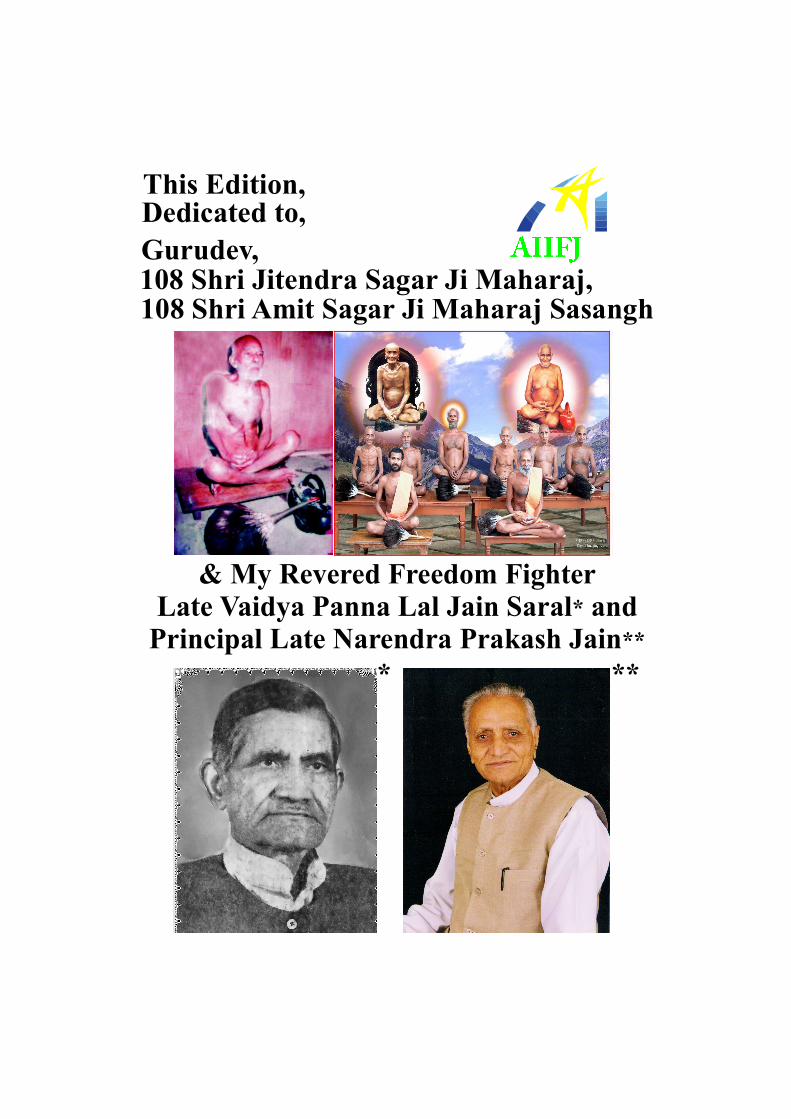
This Edition,Dedicated to,
Gurudev,108 Shri Jitendra Sagar Ji Maharaj,108 Shri Amit Sagar Ji SasanghMaharaj
& My Revered Freedom FighterLate Vaidya Panna Lal Jain Saral andPrincipal Late Narendra Prakash Jain
*
**
* **
�����
Special Thanks
Professor Ph.D
Adriana Burlea-SchiopoiuUniversity of Craiova, Romania
Dear Professor,
We the member of organization – Amit International Impact Factor Journals welcome
you in our journal ‘Deliberative Research’ and extend our heartiest thanks of gratitude to Prof.
Ph.D Adriana Burlea-Schiopoiu for her help and able guidance that she has so benevolently in
extended and circulation of the journal all over world and especially in Romania. Without help of
such a celebrity and towering persona, it could never have been possible. She has always been so
kind and considerate to us that whenever we needed her help advice and guidance. She never
disappointed us. We are quite fortunate and highly privileged that we continue to enjoy her
benevolence, blessing and inspirational company. We hope that in future too, She will keep on
showering this compassion and magnanimity on us and show us the right way through thin and
thick of life. We wish Prof. Ph.D Adriana Burlea-Schiopoiu a long, happy, prosperous and
successful life. With warm Regards.
Yours Sincerely
Dr. Amit Jain
Director
Amit International Impact Factor JournalsUttar Pradesh, India
�����
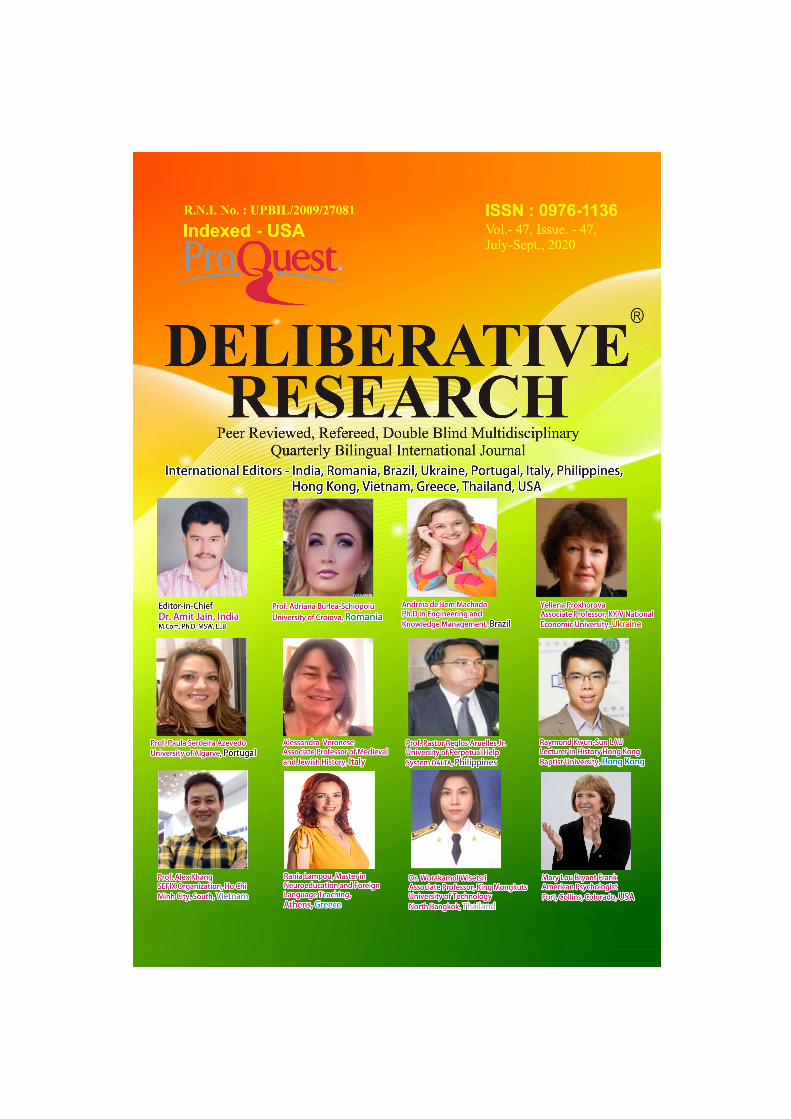
DELIBERATIVE
RESEARCH(International, Peer Reviewed, Refereed, Double Blind,
Multidisciplinary Quarterly International Journal)
R.N.I. No.: UPBIL/2009/27081 ISSN- 0976-1136
Volume – 47, Issue – 47, July-Sept., 2020
Published By
Amit International Impact FactorJournals
Correspondence Address-439, Indra Colony, Street No. 4, Repura Road,
Firozabad, Uttar Pradesh, IndiaMob- 9837208441, 9045311021
Email- [email protected] www.amitdeliberativeresearch.com
Deliberative Research an International Multi disciplinary Journal. Its special
approach for Social Sciences and Humanities and aims at providing a healthy
forum for scholarly and literary display on socio-political and other paradigms of
social relevance as reflected in contemporary Indian Society or world forum. We
will also focus on Money Matters, Policies, Strategies and Planning.
��
Editor-in-Chief
Dr. Amit JainM.com, Ph.D, MSW, LLB
Director – Amit International Impact Factor Journals
Firozabad, Uttar Pradesh, IndiaMob- 9837208441, 9045311021Email- [email protected]
International Editorial BoardProf. Adriana Burlea-Schiopoiu
University of Croiova,RomaniaEmail- [email protected]
Andreia de Bem Machado
Ph.D in Engineering and Knowledge Management, BrazilEmail- [email protected]
Yeliena Prokhorova
Associate Professor, KYIV National Economic University, UkraineEmail- [email protected]
Prof. Paula Serdeira Azevedo
University of Algarve, PortugalEmail- [email protected]
Alessandra Veronese
Associate Professor of Medieval and Jewish History, ItalyEmail- [email protected]
Prof. Pastor Reglos Aruelles Jr.
University of Perpetual Help System DALTA, PhilippinesEmail- [email protected]
Raymond LAU Kwun-Sun
Lecturer in History, Baptist University,Hong KongEmail- [email protected]
Prof. Alex Khang
SEFIXOrganization, Ho Chi Minh City, South, VietnamEmail- [email protected]
Rania Lampou
Master inNeuroeducation and Foreign Language Teaching, Athens,GreeceEmail- [email protected]
Dr. Worakamol WisetsriAssociate Professor
King Mongkuts University of TechnologyNorth Bangkok, ThailandEmail- [email protected]
Mary Lou Bryant Frank
American Psychologist Fort, Collins, Colorado, USAEmail- [email protected]
� ��
Patron
Prof. Vivek KumarHead, School of Social Science (SSS), JNU NewDelhiMob- 9871674955Email- [email protected]
Prof. Dr. Sanjeev BhardwajDirector- Pt. Deendayal Upadhayay Gramya Vikas Sansthan
BRA University, Agra, Uttar Pradesh, IndiaMob- 9410631138, Email- [email protected]
Dr. Anupam JainRegistrar- Ahilya Bai University, Indore
Mob- 9425053822Email- [email protected]
Prof. A.K. PandeyHead, Department of Social Science, BHUVaranasi
Mob- 9335669697
Dr. Vipin MehrotraDean Commerce, Dr. B.R.A. University, AgraMob- 9412160050
Indian Editorial & Advisory Board
Dr. Arun Kumar JainAssociate Professor, Department of Commerce
L.N. Hindu College, Rohtak, Haryana
Mob- 9416866091, Email- [email protected]
Prof. Jagmohan Singh VermaHead, Department of Social Science, Lucknow University, Lucknow
Mob- 9415763132
Prof. J.P. PachauriHead, Department of Social Science, Garhwal University, GarhwalMob- 9412029947
Dr. Pooran Mal YadavHead, Department of Social Science
Mohan Lal Sukhatia University, Udaipur (Rajasthan), India
Mob- 9460246593, Email- [email protected]
Prof. Rajeev GuptaHead, Department of Sociology, Rajasthan University, Rajasthan
Mob- 9414053641
Prof. Ramesh MakwanaHead, Department of Sociology, Gujrat University, Gujrat
Mob- 9265355883
Dr. Renu NandaHead, Department of Social Science, Jammu University, Jammu
Dr. B.P.S. ThaneuaHead, Department of Sociology, Dayalbagh Educational Institute, AgraMob- 9719568627
� ��
Editorial Review Board
Manisha Ashish Mehrotra (Nee Gupta)Professor, Department of Economics
Banaras Hindu University (BHU)Banaras, Uttar Pradesh, India
Mob- 9450011473, Email- [email protected]
Dr. Mridula SinghHead, Department of Education,
D.S. College, Aligarh, Uttar Pradesh, India
Mob- 9412563930, Email- [email protected]
Dr. Neha JainAssistant Professor and Head, Department of SociologyPt. DeenDayal Upadhyay Govt. Girls P.G. College
Lucknow, Uttar Pradesh, India
Mob- 9307789641, Email- [email protected]
Dr. Anumita AgarwalAssociate Professor EconomicsP.N.G. Govt. P.G. College, Nainital, Uttarakhand, India
Mob- 9149338711, Email- [email protected]
Dr. Devna Jindal SharmaDean Arts, HOD and Associate Professor
Department of Economics
D.A.V. P.G. College, Dehradun, Uttrakhand, IndiaMob- 9997127788, Email- [email protected]
Dr. Rachna DixitAssociate Professor, Department of Economics
D.A.V. P.G. College, Dehradun, Uttrakhand, India
Mob- 9897914245, Email- [email protected]
Dr. Mridula Sengar SharmaAssociate Professor and Head, Department of Sociology
D.A.V. P.G. College, Dehradun, Uttrakhand, IndiaMob- 9837271361, Email- [email protected]
Dr. Alok Kumar SharmaFaculty Member, Indira Gandhi Institute of Cooperative Management
Lucknow, Uttar Pradesh, India
Mob- 7017043451, Email- [email protected]
Dr. Jagdish Chandra MehtaHead, Department of Sociology
D.A.V. College, Chandigarh, Punjab, India
Mob- 9417913243, Email- [email protected]
Prof. Bhup Singh GaurHead, Department of Sociology, D.G.C. Guru Gram, Haryana, India
Mob- 9896036403, Email- [email protected]
Dr. Mahendra Kumar Anandrao JadhavAssociate Professor and Head, Department of SociologyNight College of Arts and Commerce, Kolhapur, Maharashtra, India
Mob- 9850954071, Email- [email protected]
Editorial
Dear Researchers of the world,
My experience and research says that knowledge, education and love are neither the
object of boasting nor hiding. Because by doing this, all three will be reduced to one place. It can
also happen that they are either destroyed, or lost. Therefore, expansion of these three is
necessary, So that it spread from one person to another across the world. Only those people canspread these three in the whole world, those who are well aware of their results. Proper
knowledge and results about these three is possible only in sufficient form with the
teacher. Therefore, only teacher in the whole world is the person who can be given theresponsibility of expansion of education, knowledge and love. But according to my research a
narrow thinking teacher is not ready to take this responsibility at all. Therefore, to pursue thisgreat work, a teacher with detailed thinking has to be selected. A teacher who knows well that it
is neither his own personal property nor the personal property of a nation. Then he will definitely
be ready to act in the interest of each person and the world.
In the present times when the world is plagued by epidemics and facing devastating war. Asa result, the world economy, education system, medical system and all other services have gone
awry. Therefore, the atmosphere of fear has spread in humanity and the youth and students are
facing the most difficulty.
In such a situation, feeling of being is paramount. We have chosen some great teachers fromthe world who have a beautiful idea of social service. All of these will represent their respective
countries in the editing of the Deliberative Research international journal as members of
Editorial Board. All these teachers will try to bring their logical, important and healthy research
among students and everyone. This joint effort of all these will definitely infuse new sensations
in the society. The students, full of new sensations, will be able to take the country towards ahappy future with the same hope and belief.
I, Dr. Amit Jain, congratulate all your editors and wish you a beautiful future. Journal
Deliberative Research is established as an open platform for all researchers and editors of theworld. If you want to share your contribution in the society or world then write or E-mail to us.
Editor-In-Chief
Dr. Amit Jain
(M.com, Ph.d, MSW, LLB)
Director
Amit International Impact Factor Journals
Uttar Pradesh, IndiaMob- +91 9837208441, 9045311021
Email- [email protected]
web- www.amitdeleberativeresearch.com�����
DELIBERATIVE RESEARCH(International, Peer Reviewed, Refereed, Double Blind,Multidisciplinary Quarterly International Journal)
INDEXS.No. Research Papers Pages
1. An Ayurvedic Formula for Human Immunity System Development 1-16and Vaccine of Covid-19Dr. Amit Jain (India)
2. Education in Pandemic Times :Covid-19 17-23Andréia de BemMachado (Brazil)
3. The Hospita lity Industry in Portugal in the Covid-19 Context 24-26Prof. Dr. Paula Serdeira Azevedo (Portugal)
4. Organizational Culture Management in Mergers and Acquisitions: 27-33University’s DepartmentCase
Yeliena Prokhorova (Ukraine)
5. CERN and STEM Education in the “Playing with Protons” Program 34-43
Rania Lampou (Athens Greece)
6. Common Errors Encountered By Novice Programmer 44-46
Pastor Arguelles Jr. (Philippines)
7. Data Envelopment Analysis and Its Application in Agricultural 47-62
Economics ResearchShreeshail Rudrapura,Worakamol Wisetsrib (India, Thailand)
8. Calling on Our Higher SelvesinMediation 63-66Dr. Mary Lou Bryant Frank (USA)
9. Premises of Developing and Implementing A Strategy for Identifying 67-70and Storing Talents in Public OrganizationsIonut Catalin NICA, Maria BUSE (Romania)
10. Particularities of Sustainable Development Management at the Agricultural 71-77
Research-Development Station from CaracalMarius Catalin BRAN (Romania)
11. The Future of Multilateralism with an Impact in World Economy Due to Covid-19 78-86Raymond Kwun-Sun LAU, Nabonita Sen (Hong Kong, India)
12. A Review of the Progression of the Accident and the Amount of the Radionuclides 87-91Released During the Chernobyl Nuclear Disaster in UkraineMehtaab Kaur (India)
13. Political Dynamics of Assam in the Post- AssamAgitation Period 92-99Binoyjyoti Das (India)
14. Situation of Street Children in Patna 100-103Manish Prasad (India)
[[1]]
ISSN : 0976-1136
An Ayurvedic Formula for Human Immunity
System Development and Vaccine of Covid-19
Dr. Amit Jain* and Reenu Jain**(M.com, Ph.D, MSW, LLB)* (M.A, LLB, B.ed)**
Director -Amit Bal Bhawan
Gandhi Park, Firozabad, Uttar Pradesh, India
Affiliation – National Bal Bhavan, New Delhi, IndiaMob- +91 9837208441, 9045311021
Email- [email protected]
web- www.amitdeleberativeresearch.com
“The Formula should be tested in the interest of the Country or World”
Abstract-
While Covid-19 (Corona Virus) has created panic in all the countries of the world, on
the other hand no vaccine has been produced so far. No medicine has yet been directed toprotect against Covid-19 (Corona Virus). But all the Scientist of the world are engaged in this
work. But this is not very necessary that every invention should have the name of a great
Scientist written on it. Some times even an ordinary person does such tasks. I also belong to
an Ayurvedic family. Therefore my research for the vaccine of Covid-19 (Corona Virus) anddevelopment of Human immunity system is based on Ayurveda.
Keywords- Covid-19 (Corona Virus), Antidote, Vaccine, Immunity System, Infection,Ayurveda
Introduction-
Some such stones are found in India. Which can be used to make an Ayurvedicantidote of scary infection, In the research of the last Six months, I learned this. The medicine
made from this, can cure a person who has become infected from own country and abroad.
Apart from this, if people use this medicine during the transition and pandemic, then their
risk of infection will be negligible because this medicine will prevent infection as well asstrengthen its immune system. The above stones have been used to make many types of
Ayurvedic medicine in India for centuries. Some other ingredients made together with them
maybe antidote of Corona virus. The sign of my formula is-
JM +KP + AB +MP + JM + SB +KGB = AKJsm7
or COVID CURE
INTERNATIONAL MULTIDISCIPLINARY PEER REFEREED JOURNAL DELIBERATIVE RESEARCH/Volume-47/Issue-47/July-Sept, 2020
[[2]]
May this formula eliminate the Corona pandemic from its roots ? So I pray toGovernment of India to permit testing of this formula in the Nation interest. Baba Ramdev's
lab is a great place to test this formula. And I also pray to all the countries of the world fortesting this formula.
Objectives of the Study-
The objective of the study presented is to state that we have prepared an Ayurvedicmedicine to increase the immunity of human beings, to avoid the infection of Covid-19
(Corona Virus). This medicine can also be taken to prevent infection. This medicine has the
ability to cure diseases like smallpox. It is ready for testing. Therefore, it should be tested in
the Nation interest.Hypothesis of the Study-
The following important research hypotheses were created for the direct studies which
are as follows –
1- We have prepared an Ayurvedic Vaccine to prevent and eliminate Covid-19 (CoronaVirus) infection. If a healthy person is given precautionary, then increase his
immunity and do not let him get infected, if given to the infected, then eliminate hisinfection.
2- We have prepared such an Ayurvedic Medicine. Which is best for increasingimmunity, it can be a great formula to avoid and eliminate the infection of Covid-19(Corona Virus). It should be tested in the interest of the country.
3- As per our research, Covid-19 does not have the full potential to infect the humanbrain. Therefore it is losing from the human brain. Perhaps the human brain is full of
immense potential. That is why human brain has succeeded in controlling Covid-19.The well- being of infected people is a sign of this. This indicates good future
prospects. Hence this Ayurvedic Antidote with give strength to all those cells andthoughts of human brains, which directly and indirectly control infection. So scientists
should pay attention to this and find that cells and thoughts in the human brain, whichis capable of doing so.
4- Considering each cause of infection in human body from Covid-19, All qualified
medicines are included in this formula. Which along with being a symbol of faith foryears are also the center point of Ayurveda.
5- This formula will give new life to infected cells and will be helpful in creating newcells in the human body and brain.
6- This formula will regulate the balance of VATA, PITTA and KAPHA in the humanbody. With the regularization of these three, The human body will be healthy.
7- Contaminated blood particles and bile will be cured and the creation of new life juicewill be possible in the human body.
8- This formula will free the vital organs of the human body from the effects of
infection. These organs are brain, lungs, intestines, dysfunction, heart, kidneys,stomach, limbs etc.
9- This will be the safeguard for nervous system and immune system. This formula willprovide coolness by relieving people from nervousness.
10- This is our final research hypothesis that this formula will increase the immunity of
human body so much that humans can remain completely safe during the transitionand pandemic period.
Problem of the Study-For the research presented, Covid-19 (Corona Virus) has been selected as the problem
topic. Which at this time spread all over the world, in the form of pandemic?
[[3]]
Symptoms of Covid-19-From the research done all over the world so far. The following symptoms of Covid-
19 have appeared. Which are as follows?1. Most Common Symptoms-
Fever, Dry cough, Tiredness,
2. Less Common Symptoms-Aches, Pains, Sore throat, Diarrhoea, Conjuctivitis, Headache, Loss of taste or Smell,
A rash on skin, Discolouration of fingers or toes.
3. Serious Symptoms-
Difficulty Breathing or Shortness of breath, Chest pain, Blood pressure, Loss of
Speech or movement.Attacking System of Covid-19 (Corona Virus) on Human Body-
The research so far on Covid-19 (Corona Virus) makes it clear that on reaching the
human body. It first attacks the human immune system.
Covid-19 Effects on Human Body-Human's immune system is based on VATA, PITTA and KAPHA. Covid-19 (Corona
Virus) infects both blood and bile (PITTA) in the human body. This causes a lack of blood
particles in the human body. The reason for this that digestive PITTA stops its work bybecoming infected. Due to which the digestive items are not properly digested, they do notproduce good juice and due to lack of good juice, good blood is also not formed. Therefore,
the formation of blood particles stops. Due to less blood particles, PITTA also becomes lessbecause these two support each other. Contamination of one of these also contaminates the
other. Its natural.
Introduction of the Ayurvedic formula for Vaccine-The presented formula is expanded under several points. Which are as follows:-
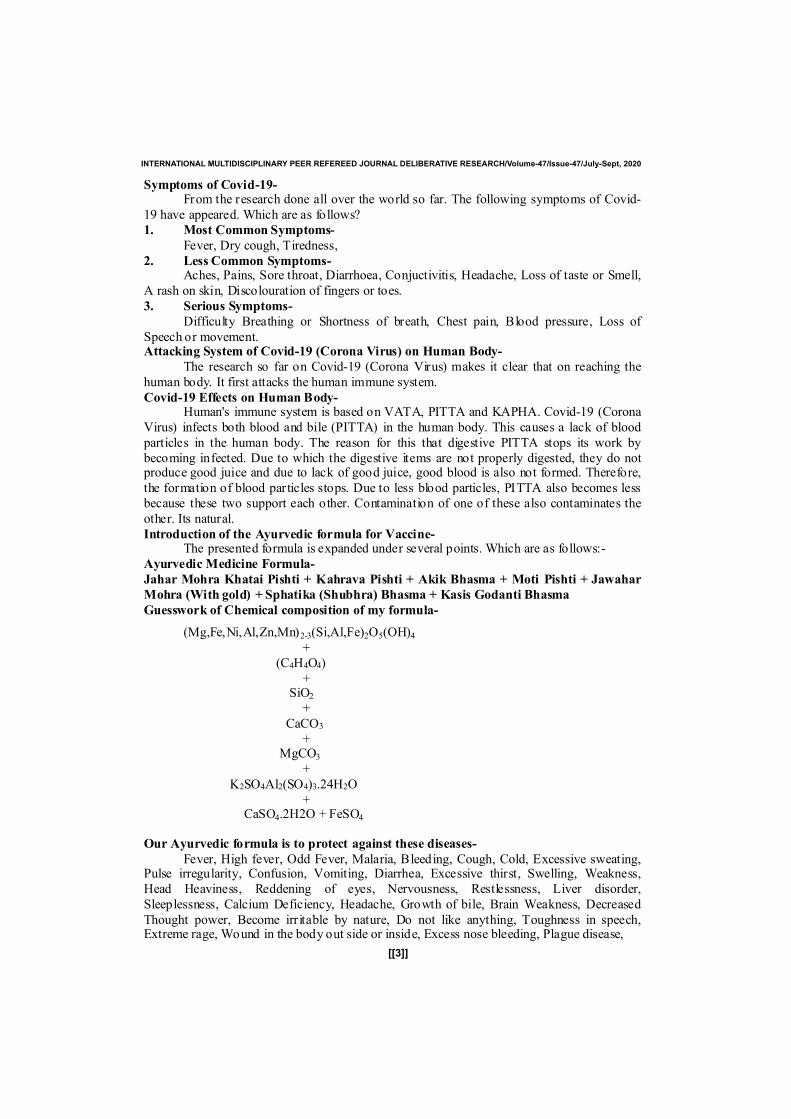
Ayurvedic Medicine Formula-
Jahar Mohra Khatai Pishti + Kahrava Pishti + Akik Bhasma + Moti Pishti + Jawahar
Mohra (With gold) + Sphatika (Shubhra) Bhasma + Kasis Godanti Bhasma
Guesswork of Chemical composition of my formula-
(Mg,Fe,Ni,Al,Zn,Mn)2-3(Si,Al,Fe)2O5(OH)4+
(C4H4O4)
+SiO2+
CaCO3+
MgCO3+
K2SO4Al2(SO4)3.24H2O+
CaSO4.2H2O + FeSO4
Our Ayurvedic formula is to protect against these diseases-
Fever, High fever, Odd Fever, Malaria, Bleeding, Cough, Cold, Excessive sweating,Pulse irregularity, Confusion, Vomiting, Diarrhea, Excessive thirst, Swelling, Weakness,Head Heaviness, Reddening of eyes, Nervousness, Restlessness, Liver disorder,
Sleeplessness, Calcium Deficiency, Headache, Growth of bile, Brain Weakness, Decreased
Thought power, Become irritable by nature, Do not like anything, Toughness in speech,Extreme rage, Wound in the body out side or inside, Excess nose bleeding, Plague disease,
INTERNATIONAL MULTIDISCIPLINARY PEER REFEREED JOURNAL DELIBERATIVE RESEARCH/Volume-47/Issue-47/July-Sept, 2020

[[4]]
Chicken Pox, Head Spinning and dizziness, Skin and nerve disease, Weak heart andincreased heartbeat, Loss of body radiance, Loss of appetite, Memory Loss, Suffering whenwalking a little and others.
The formula will work like this-
1. As precautionary medicine.2. As an immunity development medicine.3. As Antidote ofCovid-19 after testing.
Brief Description of each ingredient included in the Ayurvedic formula-
1. Jahar Mohra (Serpentine) - Magnesium Silicates-
(Mg,Fe,Ni,Al,Zn,Mn)2-3(Si,Al,Fe)2O5(OH)4
Jahar Mohra (Serpentine) is a stone. It is white in color, some are yellow and green.One which is light and smooth in weight is considered good.Ingredients (Composition)-
The main ingredient of Jahar Mohra Pishti and Jahar Mohra Bhasma is Shuddha JaharMohra (Purified Serpentine).Chemical Composition of Jahar Mohra (Serpentine)-
The mainly Jahar Mohra (Serpentine) is composed of magnesium silicates. In additionto magnesium silicates, it may also contain silicates of iron, aluminum, zinc and manganese.
General formula of Serpentine(Mg,Fe,Ni,Al,Zn,Mn)2-
3(Si,Al,Fe)2O5(OH)4
Some elements may be missing in above general formula according to the type ofserpentine.
Jahar Mohra (Serpentine) has two mainly types:
Main Types Chemical Formula
ANTIGORITE (Mg, Fe)3Si2O5(OH)4
CHRYSOTILE Mg3Si2O5(OH)4
Medicinal Properties-Jahar Mohra Pishti and Jahar Mohra Bhasma, both have similar medicinal properties. Antidote of scorpion stings
Antidote of snake bites
Anti-hypertensive
Antibacterial
Antimicrobial
Digestive Stimulant
Febrifuge
Ant diarrheal
Antiemetic
Antacid
Therapeutic Indications-Jahar Mohra Pishti and Jahar Mohra Bhasma, both are indicated in following diseases and
symptoms:
INTERNATIONAL MULTIDISCIPLINARY PEER REFEREED JOURNAL DELIBERATIVE RESEARCH/Volume-47/Issue-47/July-Sept, 2020

[[5]]
Diarrhea in children Nausea & Vomiting
Burning sensation in abdomen and heartburn
Liver disorders (rarely used)
Restlessness
Chronic Fever Cholera
High Blood Pressure
Benefits & Medicinal Uses-
Jahar Mohra Pishti and Bhasma, both have similar benefits. Jahar Mohra is beneficial in
diseases of digestive system and cardiovascular system.
2. Kaharva Pishti (Amber)- Succinic Acid C4H6O4
Amber is a type of gum. It is clean, very shiny and yellow in color. Rubbing produces
magnetic force in it. it is found in varma's mines as well as many other mines. Ambercontains three to eight percent succinic Acid. Amber is make through the fermentation
process of adding salulose. Which is stimulated by microorganisms ? This is the identity of
the best Amber that it should be stiff, clean, bright and yellow like gold. It become hot when
rubbed by hand it smells like lemon.
Ingredients-1. Kaharva (Trinkant mani) – Amber of succinite
2. Gulab Ark (Rose water) – Rosa centifolia
Amber of succinite is processed and ground with rose water and a micro fine powder isprepared. Amber (Kaharva) is a fossilized tree resin.
Chemical Composition-Amber of succinite contains 3 to 8% succinic acid. The formation of succinite acid in
the amber resin is yet unknown, but some believe it is formed through the process of
fermentation of cellulose resin of amber, which is induced by microorganisms.
Medicinal Properties-Kaharva Pishti has following healing properties.
Haemostatic (Antihemorrhagic) agents
Anthelmintic or anti-parasitic
Astringent Antacid
Anti-arrhythmic
Therapeutic Indications-
Kaharva Pishti is helpful in following health conditions.
Brain& Nerves- Worm infestation in the brain
Cysticercosis (pork tapeworm infestation)
Headache due to worm infestation in the brain
Heart & Blood- Heart Palpitation
Tachycardia
Digestive Health- Gastrointestinal bleeding
Bleeding piles
Blood in stools
Bleeding due to Ulcerative colitis or any inflammatory diseases
INTERNATIONAL MULTIDISCIPLINARY PEER REFEREED JOURNAL DELIBERATIVE RESEARCH/Volume-47/Issue-47/July-Sept, 2020
[[6]]
Women Health- Excessive uterine bleeding Heavy menstruation
Benefits &Medicinal Uses-
From the above indications, we can understand that Kaharva Pishti (amber) mainlyworks on bleeding disorders. Therefore, we can use it in any type of internal as well asexternal bleeding. It is one of the rare medicines in Ayurveda, which helps in brain worm orpork-tapeworm tissue infection. Now, we will learn how to use it in various diseases.
Worm infestation in the brain (Cysticercosis) & Headache due to it-
The common cause of brain worm is pork tapeworm infestation. It causes headache,
vertigo, low-grade fever, nosebleed, foul smell from the mouth and nose and burningsensation and anorexia. Kaharva Pishti (amber) acts as potent anthelmintic and eradicatespork tapeworms. After taking this remedy, many patients with brain worm reported the
expelling of worms from the nose. All symptoms subside thereafter.
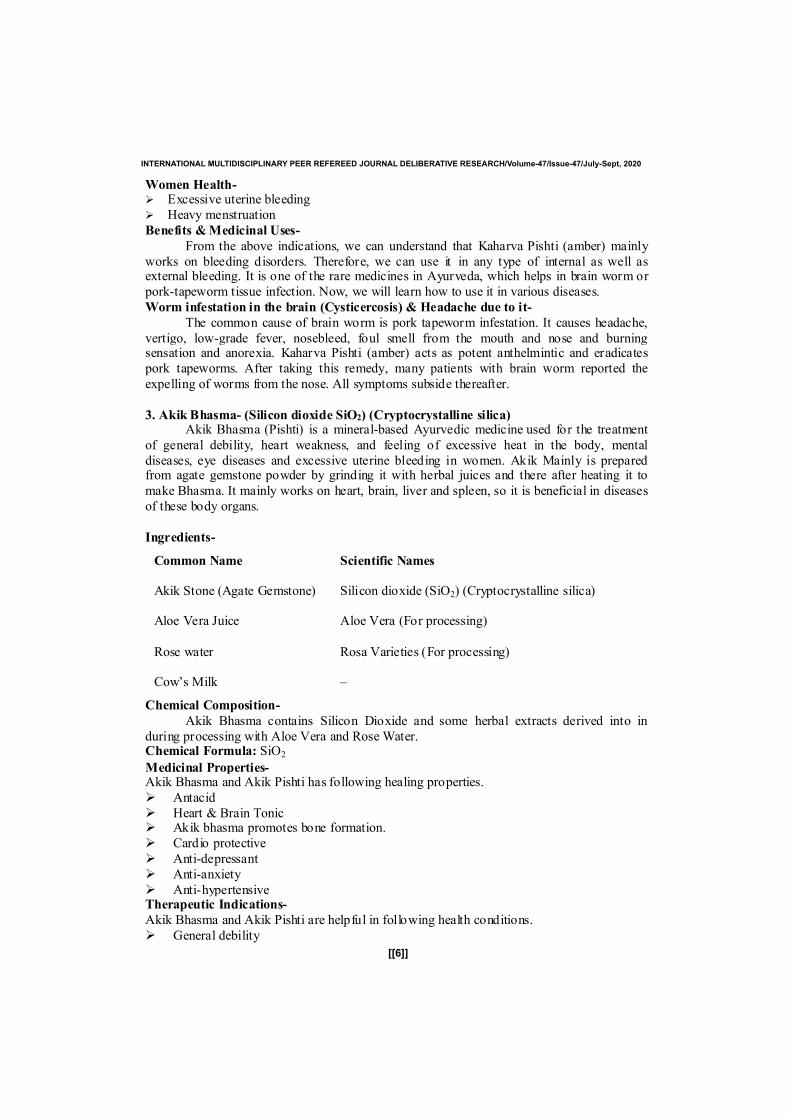
3. Akik Bhasma- (Silicon dioxide SiO2) (Cryptocrystalline silica)Akik Bhasma (Pishti) is a mineral-based Ayurvedic medicine used for the treatment
of general debility, heart weakness, and feeling of excessive heat in the body, mentaldiseases, eye diseases and excessive uterine bleeding in women. Akik Mainly is preparedfrom agate gemstone powder by grinding it with herbal juices and there after heating it to
make Bhasma. It mainly works on heart, brain, liver and spleen, so it is beneficial in diseasesof these body organs.
Ingredients-
Common Name Scientific Names
Akik Stone (Agate Gemstone) Silicon dioxide (SiO2) (Cryptocrystalline silica)
Aloe Vera Juice Aloe Vera (For processing)
Rose water Rosa Varieties (For processing)
Cow’s Milk –
Chemical Composition-
Akik Bhasma contains Silicon Dioxide and some herbal extracts derived into induring processing with Aloe Vera and Rose Water.Chemical Formula: SiO2Medicinal Properties-Akik Bhasma and Akik Pishti has following healing properties.
Antacid Heart & Brain Tonic Akik bhasma promotes bone formation. Cardio protective
Anti-depressant Anti-anxiety
Anti-hypertensiveTherapeutic Indications-
Akik Bhasma and Akik Pishti are helpful in following health conditions.
General debility
INTERNATIONAL MULTIDISCIPLINARY PEER REFEREED JOURNAL DELIBERATIVE RESEARCH/Volume-47/Issue-47/July-Sept, 2020

[[7]]
Heart weakness Feeling of excessive heat in the body Mental fatigue
Restlessness
Burning sensation in eyes Conjunctivitis Excessive uterine bleeding in women
Depression with agitation, irritation and anger
Emotional trauma inwhich patient create violence Gastritis
GERD Heartburn Ulcer
Duodenal ulcer
Ulcerative colitis Osteoporosis
Alzheimer’s disease
Hair lossMedicinal Uses & Health Benefits-
Akik Bhasma mainly affects on heart, brain, liver and spleen, so it is used in diseases
of these organ. In addition, it also has beneficial effects in bleeding disorders such asexcessive uterine bleeding in women and epistaxis.
High blood pressure-
However, Akik has a little effect on reducing blood pressure, so it cannot work alone.Akik Pishti is added in antihypertensive herbal formulations due to its effects in alleviatinghypertensive symptoms such as difficulty sleeping, nervousness, restlessness, facial flushing
and sweating.
Tachycardia with restlessness-
Akik Bhasma helps in tachycardia. It reduces associated symptoms such asrestlessness, dizziness and confusion. It also normalizes the heart rate, but for this purpose, it
is used along with Abhrak Bhasma.
Heart Tonic-Akik bhasma is also used as a heart tonic. Ayurvedic physicians believe it strengthens
heart muscles and reduces symptoms of heart diseases.
for heart weakness.
Melancholic depression-Akik Bhasma works on neurons and believes to correct and restore their natural
functions. It works well in people with symptoms such as loss of pleasure, sadness, and loss
of appetite, weight loss, agitation and guilt feeling. It is a good medicine for melancholicdepression. For better results, it is generally used with Mukta Pishti.
Excessive uterine bleeding-Akik Bhasma stops bleeding, so it is beneficial in excessive uterine bleeding.
Caution & Side Effects of Akik Bhasma-
Akik Bhasma contains very rich amount of Silicon Dioxide, which is safe wheningested through oral route. It naturally occurs in the crust of earth. It also present in waterand plants in form of silicates. The natural human diet also contains Silicates. According to
modern science, Silicon Dioxide is a biologically inert and inactive substance, so FDA hasrecognized Silicon Dioxide as Safe substance. Therefore, Indigestion of Akik bhasma is
likely safe.
INTERNATIONAL MULTIDISCIPLINARY PEER REFEREED JOURNAL DELIBERATIVE RESEARCH/Volume-47/Issue-47/July-Sept, 2020
[[8]]
However, Akik Dust when inhaled can lead to silicosis. Silicosis only occurs when a personinhales the particles of Akik, silica, quartz or slate.
The long-term use of Akik Bhasma or Silicon can result in kidney stones, but it rarely occurs.
Pregnancy & Breastfeeding-During pregnancy and breastfeeding, Akik Bhasma is likely safe when it is taken
under supervision of Ayurvedic doctor and recommended dosage only. However, the effects
of larger dosage are yet unknown. No research data is available for this.
You can stay on safer side and avoid using Akik Bhasma in larger amount in
Pregnancy and Breastfeeding.
Contraindications-Patients with tuberculosis, asthma, productive cough and wheezing should not take
Akik Bhasma.
Drug Interactions-Akik Bhasma contains Silicon Dioxide, which is an inert material, so there are lesser
chances that it can interact with other drugs. However, there are no evidences known for
supporting this statement.
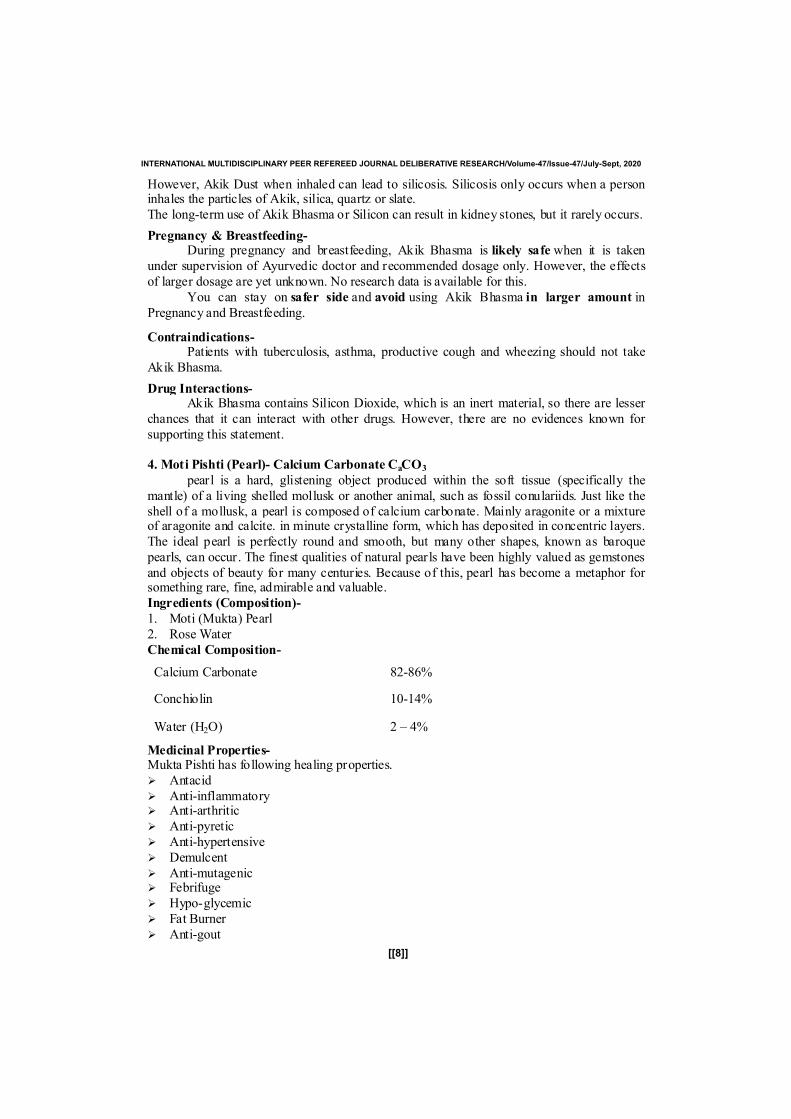
4. Moti Pishti (Pearl)- Calcium Carbonate CaCO3
pearl is a hard, glistening object produced within the soft tissue (specifically the
mantle) of a living shelled mollusk or another animal, such as fossil conulariids. Just like theshell of a mollusk, a pearl is composed of calcium carbonate. Mainly aragonite or a mixtureof aragonite and calcite. in minute crystalline form, which has deposited in concentric layers.
The ideal pearl is perfectly round and smooth, but many other shapes, known as baroque
pearls, can occur. The finest qualities of natural pearls have been highly valued as gemstones
and objects of beauty for many centuries. Because of this, pearl has become a metaphor forsomething rare, fine, admirable and valuable.
Ingredients (Composition)-
1. Moti (Mukta) Pearl
2. Rose Water
Chemical Composition-
Calcium Carbonate 82-86%
Conchiolin 10-14%
Water (H2O) 2 – 4%
Medicinal Properties-Mukta Pishti has following healing properties.
Antacid
Anti-inflammatory Anti-arthritic
Anti-pyretic
Anti-hypertensive
Demulcent
Anti-mutagenic Febrifuge
Hypo-glycemic
Fat Burner
Anti-gout
INTERNATIONAL MULTIDISCIPLINARY PEER REFEREED JOURNAL DELIBERATIVE RESEARCH/Volume-47/Issue-47/July-Sept, 2020

[[9]]
Muscle relaxant Antioxidant
Adaptogenic
Anticancer
Anti-stress
Antidepressant Anticonvulsant
Ayurvedic Properties-
Taste Sweet
Main Quality Light
Potency Cold
Resultant Sweet
Therapeutic EffectImproves eyesight, digestion, and provides
strength
Effect on Humors Pacifies PITTA &KAPHA
Effects on Organs
Stomach, Intestines, Brain, Heart, Nerves,
Kidneys, Bladder, Reproductive organs,
Endocrine Glands
Therapeutic Indications-Mukta Pishti is helpful in following health conditions.
Stress disorders
Depression
Anxiety
Somatic Symptom Disorder (SSD) Unmanageable emotional excesses (Hysteria)
Anger
Intermittent explosive disorder
Insomnia (Sleeplessness)
Cardiomyopathy High blood pressure
Non-productive cough
Cough due to irritation in the throat
Acidity or Heartburn Acute and chronic Gastritis
Duodenal ulcer and Peptic ulcer
Mouth ulcer
Ulcerative colitis Gingivitis
Tooth decay
Osteoporosis
Osteomalacia
Low bone mineral density Joint pains or osteoporosis
Gout with symptoms like tenderness and heat sensation in feet
INTERNATIONAL MULTIDISCIPLINARY PEER REFEREED JOURNAL DELIBERATIVE RESEARCH/Volume-47/Issue-47/July-Sept, 2020

[[10]]
Membranous dysmenorrhea Premenstrual syndrome (PMS)
Excessive uterine bleeding Hypoparathyroidism (decreased activity of the parathyroid gland)
Health Benefits & Medicinal Uses-
Therapeutically, Mukta Pishti helps in bleeding disorders, heartburn, acidity, gastritis,GERD, nosebleed, mental weakness, anxiety, depression, burning sensation in eyes,
headache, frequent urination, Cardiomyopathy, insomnia etc.Mukta Pishti is also practicable as natural calcium supplement. Its calcium is highly
micro fine and absorbable in the gut. It provides strength to bones, joints and muscles.
Calcium plays a vital role for optimum functioning of cells, muscle cells, nerves and bones.Therefore, Mukta Pishti provides support in important vital functions in the human body. Let
us discuss about the important health benefits and medicinal uses of Mukta Pishti (Pearl
Calcium).Stress disorders, Depression, Anxiety & Anger-
According to Ayurveda, three humors play a role in every disease. It is same for
mental disorders. Mukta Pishti works when there is PITTA aggravation. The symptoms ofPITTA aggravation are as follows.
Angry outbursts Becomes irritable even for small matters Frustration
Sleep disturbances Insomnia (sleeplessness)
Agitation Restlessness Palpitations
Aggressive behavior
Anger Cannot endure noise Sweating
Fear with sweating Suicidal thoughts
Premature graying of hair Hair Fall Feeling heat in head
Feeling burning sensation in head
5. Jawahar Mohra (with gold)-Magnesium Carbonate- MgCO3
Colic in the heart arises when there is a restriction in the hemolysis of the aorta or
aterial heart and the patient becomes very distraught. Hence the first to suppress the colic,after that, the heart becomes strong and prevents future attacks on heart.
Jawahar Mohra No. 1 has special qualities. It is made from precious and excellentquality grains like, gold, silver, amber, musk etc. This great medicine is uniquely effective instrengthening the heart and brain. The use of this great medicine provides excellent benefit in
diseases with these types symptoms like heartbeat.
Jawahar Mohra is potent cardio protective Ayurvedic Medicine used in Ayurveda. Itprovides nourishment to the heart, brain nerves, and blood vessels. It is an excellent remedyfor people with heart diseases like tachycardia, heart palpitation, heart failure, heart
enlargement Cardiomegaly and angina pectoris angina pain. It is also very helpful for peoplewith neurological and psychological disorders including depression, anxiety, insomnia,
schizophrenia, emotional trauma, restlessness etc.
INTERNATIONAL MULTIDISCIPLINARY PEER REFEREED JOURNAL DELIBERATIVE RESEARCH/Volume-47/Issue-47/July-Sept, 2020
[[11]]
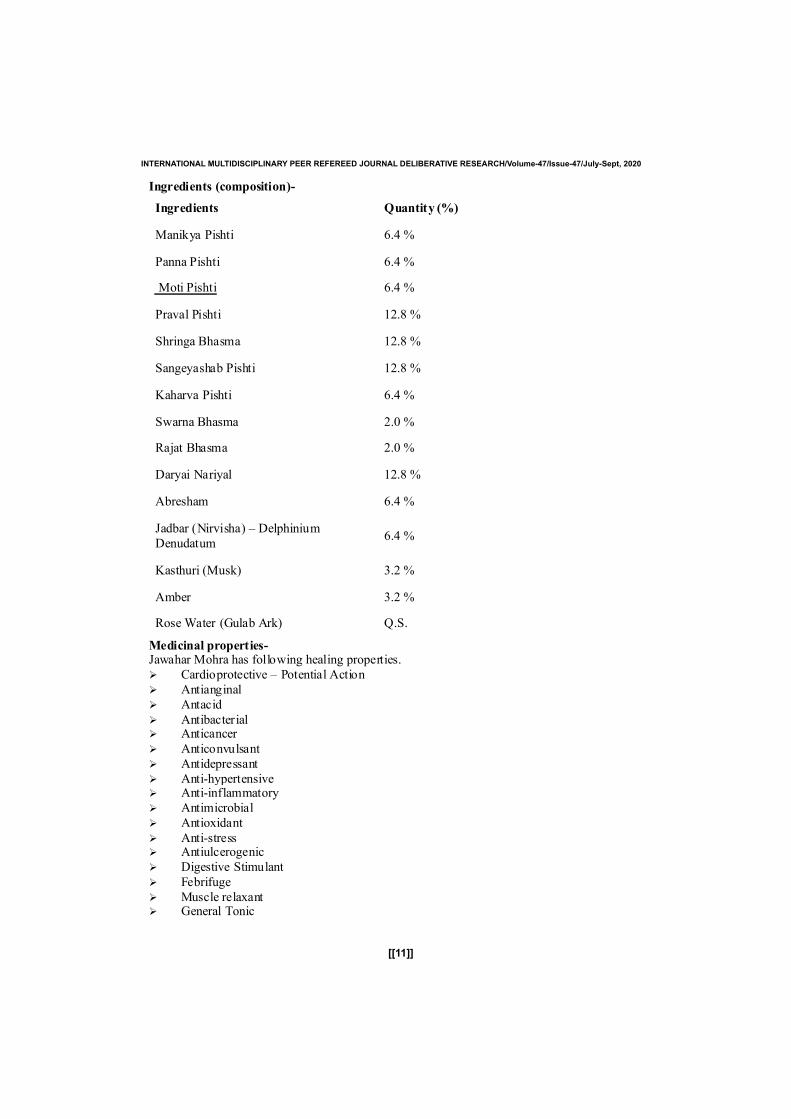
Ingredients (composition)-
Ingredients Quantity (%)
Manikya Pishti 6.4 %
Panna Pishti 6.4 %
Moti Pishti 6.4 %
Praval Pishti 12.8 %
Shringa Bhasma 12.8 %
Sangeyashab Pishti 12.8 %
Kaharva Pishti 6.4 %
Swarna Bhasma 2.0 %
Rajat Bhasma 2.0 %
Daryai Nariyal 12.8 %
Abresham 6.4 %
Jadbar (Nirvisha) – DelphiniumDenudatum
6.4 %
Kasthuri (Musk) 3.2 %
Amber 3.2 %
Rose Water (Gulab Ark) Q.S.
Medicinal properties-Jawahar Mohra has following healing properties. Cardioprotective – Potential Action Antianginal Antacid
Antibacterial Anticancer
Anticonvulsant Antidepressant Anti-hypertensive Anti-inflammatory Antimicrobial Antioxidant
Anti-stress Antiulcerogenic Digestive Stimulant
Febrifuge Muscle relaxant General Tonic
INTERNATIONAL MULTIDISCIPLINARY PEER REFEREED JOURNAL DELIBERATIVE RESEARCH/Volume-47/Issue-47/July-Sept, 2020

[[12]]
Ayurvedic properties-
Potency Cold
Therapeutic effect Nourish Heart & Brain
Effect on Humors Pacifies
Beneficial for Organs Blood, Heart, Brain & Nerves
Therapeutic indications-Jawahar Mohra is beneficial in following diseases and symptoms:
Cardiomyopathy
Heart Failure
Heart Palpitation Tachycardia
Heart Enlargement (Cardiomegaly)
Angina Pectoris (Angina Pain)
Depression Anxiety
Dementia
Memory Loss
Mental Fatigue due to over thinking or worrying
Insomnia Schizophrenia
Emotional Trauma
Restlessness
Menorrhagia
Benefits & medicinal uses-Jawahar Mohra is an excellent remedy for heart and brain disorders. It provides
strength to the heart muscles, nerves, mind, and brain. Hence, it reduces restlessness due to
heart or mental ailment. It reduces stress, aggression, irritability, anger etc. It calms the mind
and reduces mental fatigue that occurs due to over thinking or worrying.
6. Sphatika (Shubhra) Bhasma- (Alum- Fitkari)-K2SO4Al2(SO4)3.24H2O
It is blood purifier. Blood vessel gets compressed due to its use. The speed of
breathing due to its intake slow down. When chest hurts due to phlegm freezing and the lungsget worse. The alum expels this phlegm from the lungs. It destroys poison it is a good
medicine for plague and malaria.
Sphatika Bhasma (Shubhra Bhasma) is prepared from Alum (FITKARI). It is used for
the treatment of bleeding disorders, respiratory diseases, and skin diseases.
In Ayurvedic medicine, it is used for chest pain due to pneumonia, chronic cough,bronchitis, vomiting in tuberculosis, hematemesis (blood in vomiting), menorrhagia,
metrorrhagia & menometrorrhagia, chronic diarrhea, and abdominal pain due to lead toxicity.
Its external application is also beneficial for skin problems such as herpes, leucoderma, and
vitiligo.
Ingredients (Composition)-Sphatika Bhasma (Shubhra Bhasma) contains a calcined form of Alum (FITKARI).
Chemical Composition-
Sphatika Bhasma contains:
1. Aluminium Sulphate2. Potassium Sulphate
INTERNATIONAL MULTIDISCIPLINARY PEER REFEREED JOURNAL DELIBERATIVE RESEARCH/Volume-47/Issue-47/July-Sept, 2020

[[13]]
It is also called Potash Alum, which is colorless and water-soluble compound. It is commonlyused in medicine for its astringent and styptic actions.
Pharmacological Actions-Sphatika Bhasma (Shubhra Bhasma) has astringent and styptic properties for which it is
commonly used.Ayurvedic Properties-It has Kasaya (Astringent), Madhura (Sweet) and Amal (Sour) taste (Rasa).
Medicinal Properties-
Astringent
Hemostatic (styptic) – Check bleeding
Anthelmintic Mild antipyretic
Antidiarrheal
Antipruritic (as an external application) Mucolytic Antibacterial
Therapeutic Indications-
Sphatika Bhasma (Shubhra Bhasma) is helpful in following health conditions.
Internal (Oral) Use- Whooping cough (pertussis) Chest pain due to pneumonia
Bronchitis Vomiting in tuberculosis
Abdominal pain due to lead toxicity Diarrhea Hematochezia (rectal bleeding)
Bleeding piles
Hematemesis (blood in vomiting) Menorrhagia Metrorrhagia
Menometrorrhagia Intestinal parasite infestation
MalariaExternal Use- Bleeding
Wounds Eczema Pruritus
Leucorrhea Otorrhea – Ear discharge
Sphatika Bhasma Benefits & Medicinal Uses-
Sphatika Bhasma (Shubhra Bhasma) has following health benefits and medicinal uses:Whooping Cough (Pertussis)-
The internal use of Sphatika Bhasma helps to pacify recurrent cough attacks in
Pertussis. It has antibacterial activities, which also appear against Bordetella pertussis (or B.pertussis). In some patients, vomiting may also occur. It also helps to stop vomiting. A few
days course with this medicine helps to get rid ofwhooping cough.Pneumonia-
Pneumonia has four stages.
Consolidation
INTERNATIONAL MULTIDISCIPLINARY PEER REFEREED JOURNAL DELIBERATIVE RESEARCH/Volume-47/Issue-47/July-Sept, 2020

[[14]]
Red Hepatization Grey Hepatization
ResolutionSphatika Bhasma is helpful during first two stages: Consolidation and Red
Hepatization. In the first stage, pleurisy occurs and the alveolar air is replaced by cellular
exudates. In the second stage, alveoli are filled with fibrinous exudates and lungs becomehard like liver. In these both stages, Sphatika Bhasma helps to absorb mucus, and exudates
and pacifies the disease.
Abdominal Pain due to Lead Toxicity-
Lead Toxicity causes a severe abdominal pain and cramping. In ayurveda, Sphatika
Bhasma is a drug of choice for abdominal pain occurring due to lead toxicity. Generally, it isused along with Karpur (camphor) and Ahiphena. Ayurvedic purgative medicine is also given
for encouraging elimination of lead through defecation.Menorrhagia, Metrorrhagia &Menometrorrhagia-
The astringent and hemostatic actions help to check bleeding occurring duringMenorrhagia, Metrorrhagia, and Menometrorrhagia. It is commonly used along with
Bolbaddha Ras. However, this type of treatment is not an ideal treatment and it only provides
a temporary relief.
7. Kasis Godanti Bhasma - (calcium sulphate dihydrate + ferrous sulphate)
CaSO4. 2H2O + FeSO4
Kasis Godanti Bhasma is an ayurvedic mineral-based medicine used for malaria,
acute fever, chronic fever, Splenomegaly, leucorrhea and loss of appetite.The main use of Kasis Godanti Bhasma is in Malaria fever. It significantly reduces
fever and chills. It is also beneficial for Oligomenorrhea and dysmenorrheal.
Ingredients-It contains mainly two major compounds.
1. Kasis (green vitriol)
2. Godanti (Gypsum)It is processed with leaves of calotropis procera and aloe vera.
Medicinal Properties-
Kasis Godanti Bhasma has following healing properties.
Antipyretic Hematogenic Digestive stimulant
Emmenagogue
Anti-spasmodic
Anti-malarial
Therapeutic Indications-Kasis Godanti Bhasma is therapeutically used in following health conditions.
Fever
Malaria fever Leucorrhea Loss of appetite
Splenomegaly
Oligomenorrhea
Dysmenorrhea
Medicinal Uses & Benefits-Kasis Godanti Bhasma is used in fevers, especially fever in seasonal flu or malaria
fever with chills. It also has mild antibacterial or anti-viral properties. It maywork on
thermo-regulatory center of the brain and stimulate reduction of fever. For fighting against
INTERNATIONAL MULTIDISCIPLINARY PEER REFEREED JOURNAL DELIBERATIVE RESEARCH/Volume-47/Issue-47/July-Sept, 2020

[[15]]
infection, patient also requires other medications. It is a safe ayurvedic alternative toAcetaminophen for antipyretic effects.
Antipyretic – reduces fever-Kasis Godanti Bhasma has antipyretic characteristic, so it is used in all types of fevers
for reduction of body temperature. Ayurvedic physicians use it in children, pregnant women,and old and fragile people for this purpose. It is not a strong medicine and may not cause sideeffects if taken under supervision of ayurvedic doctor. In malaria, it reduces chills and fever.
It may also have anti-malarial property due to which it also reduces malarial parasiticinfection. It is given at 4 hours interval in malaria to stop rise in fever.
Splenomegaly (Enlarged spleen after malaria)-
Kasis Godanti Bhasma is helpful in reducing the size of enlarged spleen. It is given inthis case with Amritarishta.Caution& Side Effects-
Kasis Godanti Bhasma is well tolerated and LIKELY SAFE for most people. However, somepeople may have following side effects.1. Nausea (rare)2. Vomiting (very rare)
3. Vertigo (very rare)Pregnancy & Breastfeeding-
Kasis Godanti Bhasma is Possibly Safe in pregnancy and breastfeeding. Ayurvedic
doctors regularly use it in fever in pregnancy.Contraindications-
However, there are no contraindication known with Kasis Godanti Bhasma, but youshould not take it in larger dosage (more than 1500 mg per day) in liver disorders.
Solution of the Study-An Ayurvedic Vaccine of Covid-19 (Corona Virus) and development of Human
immunity system- Ayurvedic antidote is ready for testing. It should be tested in the interest ofthe country.
Recommendation-Succinic acid may have a good effect on Covid 19 infection. Which is found in 3 to 8
percent in Amber ? But is the subject area of scientist.
Conclusion-
Presenting my research on medication related to infection of Covid-19. We hope andbelieve that this Ayurvedic medicine will increase immunity for weak people. And thismedicine will not allow healthy people to get infected and free the infected people from
Covid-19 infection. With this I also want to say that ever in this formula as required thepossibility of reducing and increasing various Ayurvedic medicines has been kept open.Thanks, Jai Hind.
Note-1. I will suggest only Ayurvedic composition in our formula not chemical composition.2. Information on the proportion of mixture of drugs used in the formula is also subject to
approval.3. Under this formula. What dose will be given to a person ? This will be stated after approval
References-1. Ayurved Sar Sangrah.
2. www.ayurtimes3. Pearl wikipedia
4. Serpentine Stone Study5. Amber Study.6. Akik Study
7. Articles on Gondanti Bhasma.
INTERNATIONAL MULTIDISCIPLINARY PEER REFEREED JOURNAL DELIBERATIVE RESEARCH/Volume-47/Issue-47/July-Sept, 2020

[[16]]
8. Articles on Akik Bhasma.9. Articles on Sangeyashav Bhasma.
10. Study of Dabar India Limited website.11. Interviews of Baidya's.
12. Articles regarding Ayurveda.13. Study of Ancient hand written diaries.
14. Sudhanidhi Patrika.15. Dhanvantari Ayurved Patrika.
16. Various types of chemical Composition of Ayurvedic Medicine.17. Study of Baidynath website.
18. Study of various types of chemical composition.19. Study of various types of disorders in human body.
20. Study of human immune system.21. Study of human nervous system.
22. Covid-19 alert.
INTERNATIONAL MULTIDISCIPLINARY PEER REFEREED JOURNAL DELIBERATIVE RESEARCH/Volume-47/Issue-47/July-Sept, 2020
Education in Pandemic Times : Covid-19
Andréia de Bem Machado (Brazil)
Professora of Faculdade Municipal da PalhoçaEmail: [email protected]
Abstract
The educational scenario had to be reinvented, using technology to make itpedagogical in the school context. In times of social isolation, education used digital
technological tools to reinvent itself. Therefore, the objective of this article is: to map the
light of the integrative review of education in the time of Covid-19. To this end, an
integrative review was carr ied out based on a systematic search of the Scopus database. As a
result, it was identified that the research appears in the multidisciplinary field, crossing thediscussions with the areas of Social Sciences, Psychology, Informatics, Energy, Engineering
and Medicine.
Keyword: Covid-19, Education, remote teaching.
IntroductionThroughout history, education has undergone several modifications and many of them
intersect the advancement of technologies. Along this path, the educator went from being a
holder to a mediator of knowledge and, from there, to a professor of navigation. Knowledge
is in the cloud. They are boats moved by the wind that take us where we want to know.In this advance beyond the conceptual, there is the expansion of different educational
methodologies as new ways of teaching and learning. In this scenario, we are reinventing
ourselves in the midst of innovative technologies linked to the media. The human being lives
in a world interconnected by networks of dynamic and fluid relationships - which requires the
need for changes in educational institutions (Machado; Silva; Spanhol, 2017).In the training of professionals for the various fields of knowledge, discussions
regarding the teaching-learning process arise, through the pandemic of the new learning
process, aiming at training professionals with skills and abilities to reorganize their planning
in times of pandemic.To legitimize concerns like these, the National Education Guidelines and Bases Law
(LDB) emerges with actions aimed at knowledge and praxis in the student's context,
requiring a school focused on a specialized service to the population, establishing a reciprocal
relationship with it (Brasil, 2009). Thus, educational institutions had to undergo changes intheir pedagogical practices in an attempt to approximate the demands of social reality and
also motivating teachers and students to articulate new knowledge networks. These
knowledge networks are linked to the teaching modality developed in different times and
spaces. It is important to resume this in contexts such as the current one, in a pandemic
situation, but using new practices and didactics at a time when classroom teaching is notpossible.
[[17]]
ISSN : 0976-1136
In this context, an attempt was made to opt for the non-face-to-face modality, accordingto the guidelines of the National Education Council (CNE), which approved, on April 28,
2020, guidelines for basic education schools and higher education institutions during the new
pandemic. coronavirus (Brasil, 2020). At that time, tools and methodologies were adopted to
be used during the social isolation necessary to face the pandemic (an infectious disease,
highly contagious and affecting the whole world). It was essential to adopt the newguidelines, as they are based on the Law of Directives and Bases of National Education,
which says that “elementary education will be on-site, with distance learning being used as a
complement to learning or in emergency situations” (Brazil , 2009).
Therefore, when comparing distance education to non-classroom teaching, we realize
that we are dealing with two situations, different times and modalities. The adoption of non-face-to-face teaching was necessary so that education in Brazil did not stop, it was a
necessary, momentary and emergency re-planning, in which the teachers, from their homes,
redo lessons, re-plan and reinvent their pedagogical work to keep the progress of the school
year. Since classes and activities, which were previously carried out in person, in thispandemic moment are sent through virtual platforms and digital media.
In this scenario in which teaching flexibility is necessary, it was opted for the non-face-
to-face modality with regard to the moment of learning in the context of students' homes,
where they are mediated by information and communication technologies and thus accessknowledge , which allows teaching and learning on different digital platforms.
The non-face-to-face modality is very similar to distance education (DE), but the
difference between them is that in DE, interactions occur in different geographical
interactions, that is, in places very distant from each other. While in the non-face-to-face
modality, geographic locations are in different neighborhoods in the same city.Based on this context, objective of this article is: to map the light of the integrative review of
education in the time of Covid-19. For that, the article is organized in three sections: in the
first one explained here, entitled introduction, the research context is presented; in the second,
the development of the research is described, in which the type of non-classroom teaching
adopted at the time of the pandemic in Brazil was addressed, as well as the methodologicalpaths for the state of the art of education in pandemic times, as well as the data, results and a
bibliometric analysis of this research; in the third section, final considerations are made.
Development
In the teaching-learning process, communication starts to transport knowledge andalso to share knowledge. In this context, in times of pandemic in Brazil, there are guidelines
to guide basic education schools and higher education institutions during social isolation,
adhering to the offer of activities that you are not present in all stages of education, since or
elementary up to or comply with the mandatory non-classroom teaching hours. In addition, itis essential to develop guidelines for the sessions of non-classroom educational activities to
guide families and students, under the supervision of teachers and the management team of
educational institutions (Brazil, 2020).
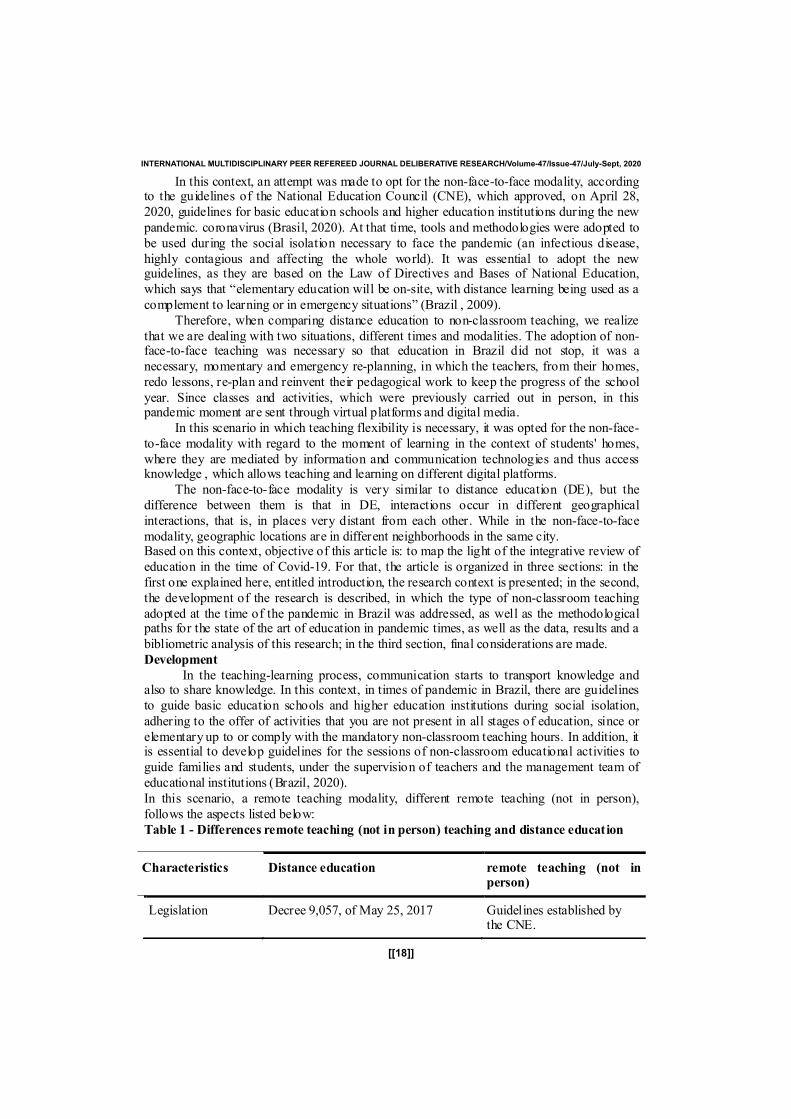
In this scenario, a remote teaching modality, different remote teaching (not in person),
follows the aspects listed below:
Table 1 - Differences remote teaching (not in person) teaching and distance education
Characteristics Distance education remote teaching (not inperson)
Legislation Decree 9,057, of May 25, 2017 Guidelines established bythe CNE.
[[18]]
INTERNATIONAL MULTIDISCIPLINARY PEER REFEREED JOURNAL DELIBERATIVE RESEARCH/Volume-47/Issue-47/July-Sept, 2020
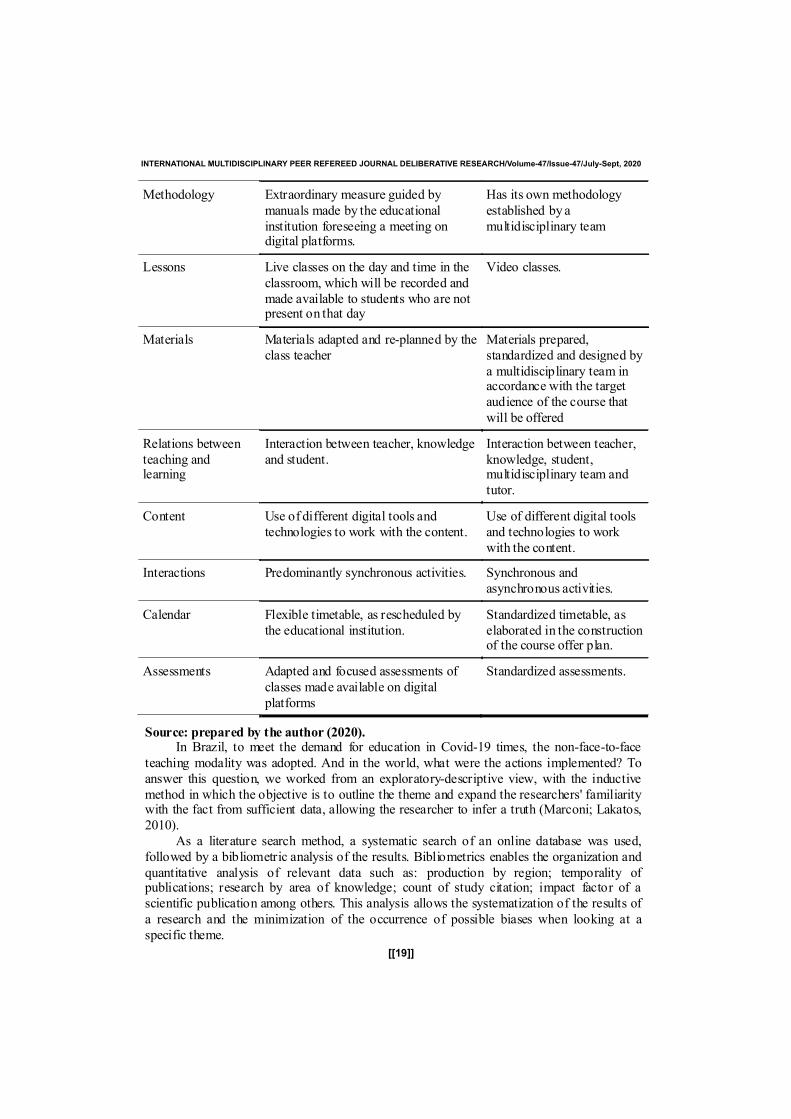
Methodology Extraordinary measure guided by
manuals made by the educational
institution foreseeing a meeting ondigital platforms.
Has its own methodology
established bya
multidisciplinary team
Lessons Live classes on the day and time in the
classroom, which will be recorded andmade available to students who are notpresent on that day
Video classes.
Materials Materials adapted and re-planned by the
class teacher
Materials prepared,
standardized and designed by
a multidisciplinary team inaccordance with the targetaudience of the course that
will be offered
Relations betweenteaching andlearning
Interaction between teacher, knowledgeand student.
Interaction between teacher,knowledge, student,multidisciplinary team andtutor.
Content Use of different digital tools andtechnologies to work with the content.
Use of different digital toolsand technologies to workwith the content.
Interactions Predominantly synchronous activities. Synchronous andasynchronous activities.
Calendar Flexible timetable, as rescheduled bythe educational institution.
Standardized timetable, aselaborated in the constructionof the course offer plan.
Assessments Adapted and focused assessments of
classes made available on digital
platforms
Standardized assessments.
Source: prepared by the author (2020).In Brazil, to meet the demand for education in Covid-19 times, the non-face-to-face
teaching modality was adopted. And in the world, what were the actions implemented? Toanswer this question, we worked from an exploratory-descriptive view, with the inductive
method in which the objective is to outline the theme and expand the researchers' familiaritywith the fact from sufficient data, allowing the researcher to infer a truth (Marconi; Lakatos,
2010).As a literature search method, a systematic search of an online database was used,
followed by a bibliometric analysis of the results. Bibliometrics enables the organization and
quantitative analysis of relevant data such as: production by region; temporality ofpublications; research by area of knowledge; count of study citation; impact factor of a
scientific publication among others. This analysis allows the systematization of the results of
a research and the minimization of the occurrence of possible biases when looking at a
specific theme.
[[19]]
INTERNATIONAL MULTIDISCIPLINARY PEER REFEREED JOURNAL DELIBERATIVE RESEARCH/Volume-47/Issue-47/July-Sept, 2020
For bibliometric analysis, the study was organized into three distinct stages: planning,collection and result. The planning started in May 2020, when the research was carried out. In
the scope of planning, the Scopus database was defined as relevant, due to its contribution to
the academic environment, its interdisciplinary character, its constant updating and also
because it is one of the largest bases of abstracts and bibliographic references of peer-
reviewed scientific literature.Considering that the research problem, the search terms were defined in the planning
phase. Namely: “Learning in schools”, “Education” and “Covid-19”. As a basic principle for
the search, it was decided to use the terms in the “title”, “abstract” and “keyword” fields,
without time, language or any other restriction that may limit the result.
In the data collection phase, a total of 18 indexed studies were recovered, with a recorddated 2020, when the pandemic is present in all countries of the world.
As a result of this data collection, it was identified that the 18 works were written by 70
authors, linked to 56 institutions. 108 keywords were used to identify and index the
publications, which are distributed in six areas of knowledge. It was identified that, of theuniverse of 18 scientific works, all are peer-reviewed articles composing the sample for a
bibliometric analysis in the area of Social Sciences, Psychology, Computer Science, Energy,
Engineering and Medicine. Which allows to weave the state of the art of the theme from the
consulted database.For the bibliometric assessment of the results, the relevant information was selected and
classified according to: temporal distribution; main authors, institutions and countries in
evidence; type of publication in the area; main keywords and most referenced works.
Initially, the temporal distribution of the works was analyzed and five articles of the
year from the Covid-19 pandemic were identified. From a systemic and directed view ofthese works, we can observe a varied list of countries that stand out in research with regard to
learning in schools, education and Covid-19. With a significant emphasis on the United
States, with six publications; secondly, Australia, with three works; and, thirdly, Vietnam,
with two published articles. The other countries that publish on this subject are: Belgium,
Canada, China, France, Indonesia, Italy, Malaysia, New Zealand, Oman, Peru and the UnitedKingdom. However, each of these has a publication with this theme.
Covid-19 Image
Table 2 - Schematic table
Author Title Abstract
Mulla, Osland-
Paton,
Rodriguez,Vazquez E
Plavsic.
New coronaviruses, new faculty
development programs: rapid
transition to eLearning during thepandemic
The article presents models for the
transition from classroom teaching to
online teaching in times of socialisolation caused by Covid-19.
[[20]]
INTERNATIONAL MULTIDISCIPLINARY PEER REFEREED JOURNAL DELIBERATIVE RESEARCH/Volume-47/Issue-47/July-Sept, 2020
Source: prepared by the author (2020).
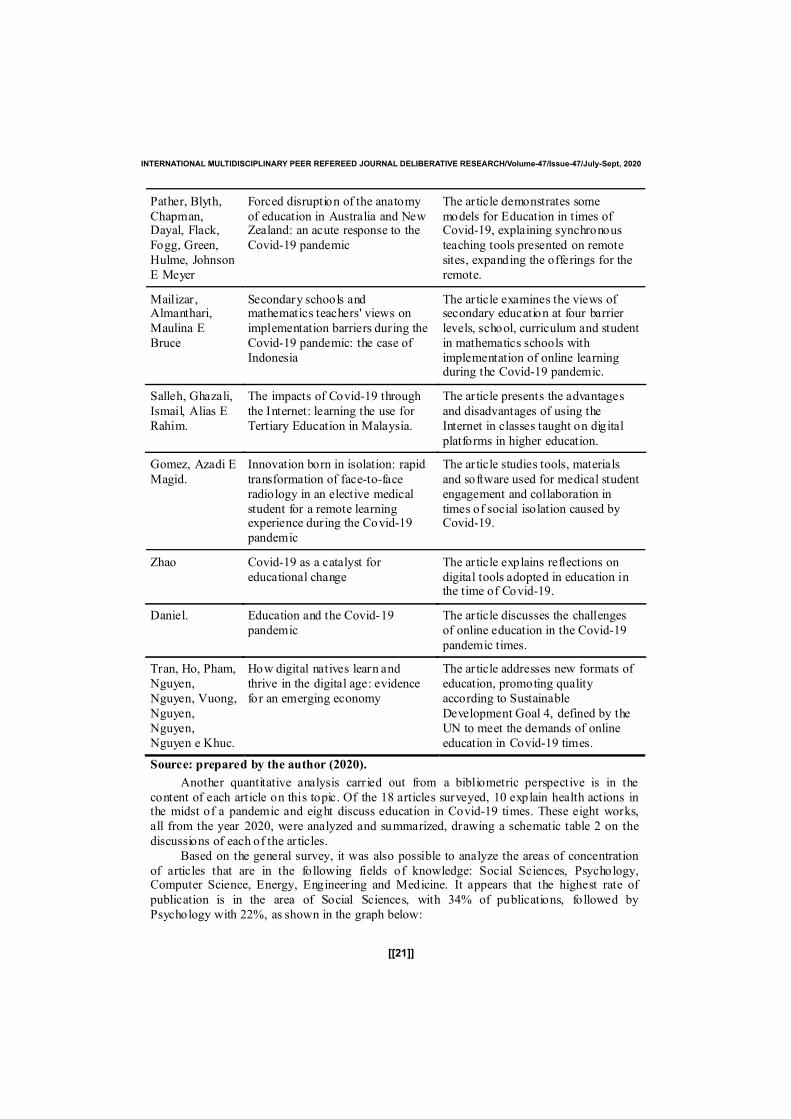
Another quantitative analysis carr ied out from a bibliometric perspective is in thecontent of each article on this topic. Of the 18 articles surveyed, 10 explain health actions inthe midst of a pandemic and eight discuss education in Covid-19 times. These eight works,all from the year 2020, were analyzed and summarized, drawing a schematic table 2 on the
discussions of each of the articles.Based on the general survey, it was also possible to analyze the areas of concentration
of articles that are in the following fields of knowledge: Social Sciences, Psychology,Computer Science, Energy, Engineering and Medicine. It appears that the highest rate of
publication is in the area of Social Sciences, with 34% of publications, followed byPsychology with 22%, as shown in the graph below:
Pather, Blyth,
Chapman,Dayal, Flack,
Fogg, Green,Hulme, JohnsonE Meyer
Forced disruption of the anatomy
of education in Australia and NewZealand: an acute response to the
Covid-19 pandemic
The article demonstrates some
models for Education in times ofCovid-19, explaining synchronous
teaching tools presented on remotesites, expanding the offerings for theremote.
Mailizar ,Almanthari,
Maulina EBruce
Secondary schools andmathematics teachers' views on
implementation barriers during theCovid-19 pandemic: the case ofIndonesia
The article examines the views ofsecondary education at four barrier
levels, school, curriculum and studentin mathematics schools withimplementation of online learningduring the Covid-19 pandemic.
Salleh, Ghazali,
Ismail, Alias ERahim.
The impacts of Covid-19 through
the Internet: learning the use forTertiary Education in Malaysia.
The article presents the advantages
and disadvantages of using theInternet in classes taught on digital
platforms in higher education.
Gomez, Azadi E
Magid.
Innovation born in isolation: rapid
transformation of face-to-faceradiology in an elective medicalstudent for a remote learningexperience during the Covid-19pandemic
The article studies tools, materials
and software used for medical studentengagement and collaboration intimes of social isolation caused byCovid-19.
Zhao Covid-19 as a catalyst foreducational change
The article explains reflections ondigital tools adopted in education inthe time of Covid-19.
Daniel. Education and the Covid-19pandemic
The article discusses the challengesof online education in the Covid-19
pandemic times.
Tran, Ho, Pham,Nguyen,Nguyen, Vuong,
Nguyen,Nguyen,Nguyen e Khuc.
How digital natives learn andthrive in the digital age: evidencefor an emerging economy
The article addresses new formats ofeducation, promoting qualityaccording to Sustainable
Development Goal 4, defined by theUN to meet the demands of onlineeducation in Covid-19 times.
[[21]]
INTERNATIONAL MULTIDISCIPLINARY PEER REFEREED JOURNAL DELIBERATIVE RESEARCH/Volume-47/Issue-47/July-Sept, 2020
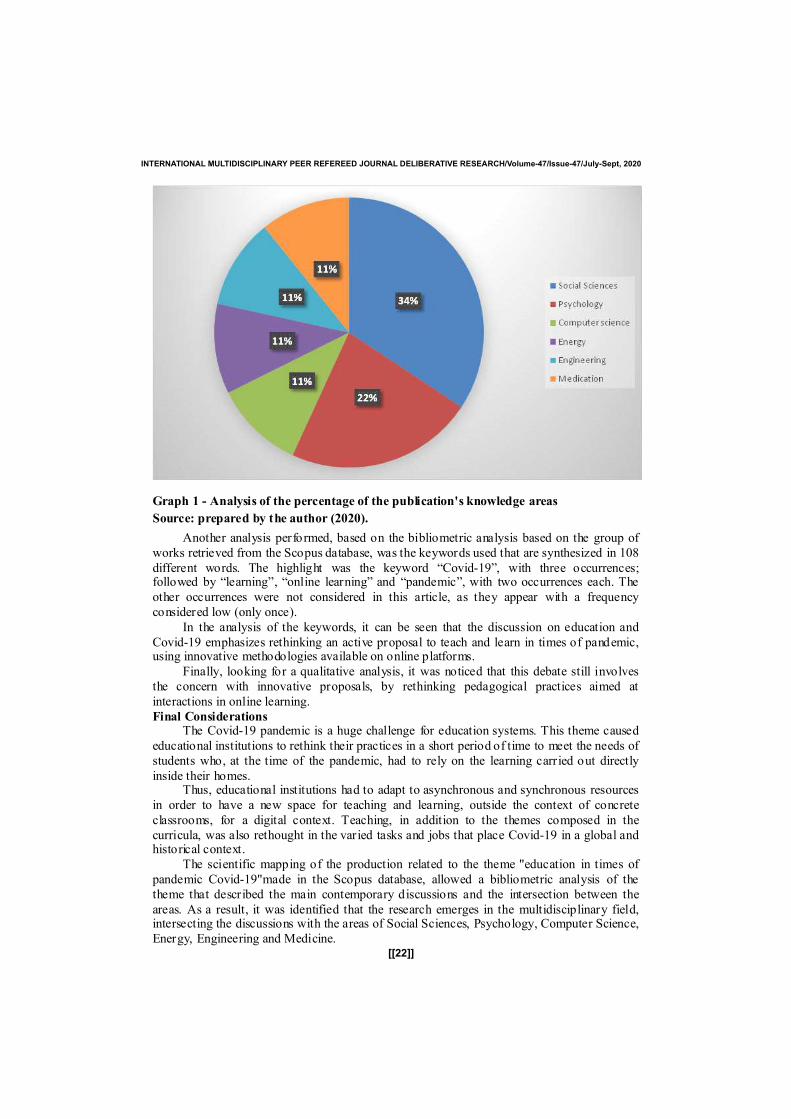
Graph 1 - Analysis of the percentage of the publication's knowledge areas
Source: prepared by the author (2020).
Another analysis performed, based on the bibliometric analysis based on the group ofworks retrieved from the Scopus database, was the keywords used that are synthesized in 108
different words. The highlight was the keyword “Covid-19”, with three occurrences;followed by “learning”, “online learning” and “pandemic”, with two occurrences each. The
other occurrences were not considered in this article, as they appear with a frequencyconsidered low (only once).
In the analysis of the keywords, it can be seen that the discussion on education and
Covid-19 emphasizes rethinking an active proposal to teach and learn in times of pandemic,using innovative methodologies available on online platforms.
Finally, looking for a qualitative analysis, it was noticed that this debate still involvesthe concern with innovative proposals, by rethinking pedagogical practices aimed at
interactions in online learning.Final Considerations
The Covid-19 pandemic is a huge challenge for education systems. This theme caused
educational institutions to rethink their practices in a short period of time to meet the needs ofstudents who, at the time of the pandemic, had to rely on the learning carried out directly
inside their homes.Thus, educational institutions had to adapt to asynchronous and synchronous resources
in order to have a new space for teaching and learning, outside the context of concrete
classrooms, for a digital context. Teaching, in addition to the themes composed in thecurricula, was also rethought in the varied tasks and jobs that place Covid-19 in a global andhistorical context.
The scientific mapping of the production related to the theme "education in times of
pandemic Covid-19"made in the Scopus database, allowed a bibliometric analysis of thetheme that described the main contemporary discussions and the intersection between the
areas. As a result, it was identified that the research emerges in the multidisciplinary field,intersecting the discussions with the areas of Social Sciences, Psychology, Computer Science,Energy, Engineering and Medicine.
[[22]]
INTERNATIONAL MULTIDISCIPLINARY PEER REFEREED JOURNAL DELIBERATIVE RESEARCH/Volume-47/Issue-47/July-Sept, 2020
It is proposed that studies in different areas be analyzed by an integrated look at newways of applying active methodologies in terms of teaching and learning in times of
pandemic. The theme lacks research that addresses new practices of teaching and learning in
times of pandemic, as it is very new.
ReferencesBrasil. Lei Nº 9.394, De 20 De Dezembro De 1996. Estabelece As Diretrizes E Bases Da
Educação Nacional. Disponível Em:
Http://Www.Planalto.Gov.Br/Ccivil_03/Leis/L9394.Htm. Acesso Em: 30 Jun. 2020.
Brasil. Ministério Da Educação. Cne Aprova Diretrizes Para Escolas Durante A Pandemia. 28 Abr.
2020. Disponível Em: Http://Portal.Mec.Gov.Br/Busca-Geral/12-Noticias/Acoes-Programas-E-Projetos-637152388/89051-Cne-Aprova-Diretrizes-Para-Escolas-Durante-A-Pandemia. Acesso Em:
30 Jun. 2020.
Daniel, S. J. (2020) Education And The Covid-19 Pandemic. Prospects, [S. L.], P. 205-230,Springer Science And Business Media Llc. Disponível Em: Http://Dx.Doi.Org/10.1007/S11125-
020-09464-3. Acesso Em: 7 Jul. 2020.
Gomez, E.; Azadi, J.; Magid, D. (2020). Innovation Born In Isolation: Rapid Transformation Of An In-Person Medical Student Radiology Elective To A Remote Learning Experience During The Covid-19
Pandemic. Academic Radiology, [S. L.], P.
327-345. Elsevier Bv. Disponível Em: Http://Dx.Doi.Org/10.1016/J.Acra.2020.06.001.
Acesso Em: 7 Jul. 2020.
Pather, N.; Blyth, P.; Chapman, J. A.; Dayal, M.R.; Flack, Natasha A. M. S.; Fogg, Quentin A.;
Green, R. A.; Hulme, Anneliese K.; Johnson, Ian P.; Meyer, Amanda J(2020).. Forced DisruptionOf Anatomy Education In Australia And New Zealand: An Acute Response To The Covid-19
Pandemic. Anatomical Sciences Education, [S. L.], V. 13, N. 3, P. 284-300. Wiley. Disponível Em:Http://Dx.Doi.Org/10.1002/Ase.1968. Acesso Em: 7 Jul. 2020.
Machado, A. B.; Silva, A. R. L. Da; Spanhol,(2017). F. J.. Intersecções Da Educação A Distância ETecnologias Assistivas: Um NovoModo De Inclusão Social. Tics & Ead Em Foco, V. 3, P. 1-20.
Mailizar, M.; Almanthari, A.; Maulina, Suci; B. (2020). Secondary School Mathematics Teachers’
Views On E-Learning Implementation Barriers During The Covid-19 Pandemic: The Case OfIndonesia. Eurasia Journal Of Mathematics, Science And Technology Education, [S. L.], V. 16, N.
7, P. 1860.. Modestum Limited. Disponível Em: Http://Dx.Doi.Org/10.29333/Ejmste/8240. AcessoEm: 7 Jul. 2020.
Marconi, M. De A.; Lakatos, E. M. (2010) Fundamentos De Metodologia Científica. São Paulo:
Atlas.
Mulla, Zuber D.; Osland-Paton, Valerie; Rodriguez, Marco A.; Vazquez, Eduardo; Plavsic, Sanja
Kupesic. (2020). Novel Coronavirus, Novel Faculty Development Programs: Rapid Transition ToElearning During The Pandemic. Journal Of Perinatal Medicine, [S. L.], V. 48, N. 5, P. 446-449,
25.Walter De Gruyter Gmbh. Disponível Em: Http://Dx.Doi.Org/10.1515/Jpm-2020-0197. AcessoEm: 7 Jul. 2020.
Salleh, Farah Idayu Mohd; Ghazali, Jamilahtun Md; Ismail, Wan Nor Hana; Alias, Maizura; Rahim,Nur Syafiqah (2020).. The Impacts Of Covid-19 Through Online Learning Usage For Tertiary
Education In Malaysia. Journal Of Critical Reviews, [S. L.], V. 7, N. 08, P. 293-300. SynthesishubAdvance Scientific Research. Disponível Em: Http://Dx.Doi.Org/10.31838/Jcr.07.08.30. Acesso
Em: 7 Jul. 2020.
Tran, Trung; Ho, Manh-Toan; Pham, Thanh-Hang; Nguyen, Minh-Hoang; Nguyen, Khanh-Linh P.;
Vuong, Thu-Trang; Nguyen, Thanh-Huyen T.; Nguyen, Thanh-Dung;
Nguyen, Thi-Linh; Khuc, Quy(2020). How Digital Natives Learn And Thrive In The Digital Age:Evidence From An Emerging Economy. Sustainability, [S. L.], V. 12, N. 9, P. 3819. Mdpi Ag.
Disponível Em: Http://Dx.Doi.Org/10.3390/Su12093819. Acesso Em: 7 Jul. 2020.
Zhao, Yong. (2020). Covid-19 As A Catalyst For Educational Change. Prospects, [S. L.], P. 317-327.. Springer Science And Business Media Llc. Disponível Em:
Http://Dx.Doi.Org/10.1007/S11125-020-09477-Y. Acesso Em: 7 Jul.
[[23]]
INTERNATIONAL MULTIDISCIPLINARY PEER REFEREED JOURNAL DELIBERATIVE RESEARCH/Volume-47/Issue-47/July-Sept, 2020
The Hospitality Industry in Portugal in the
Covid-19 Context
Prof. Dr. Paula Serdeira AzevedoAssociate Professor
ESGHT – University of Algarve, Faro, Portugal
Introduction: the pre-covid19 eraTourism is the largest industry in the world and is one of the most dynamic and
vibrant sectors of the world economy (Costa et al., 2014; Devaraja and Deepak, 2014). The
World Travel & Tourism Council’s (WTTC, 2019) research reveals that the sector accounted
for 10.4% of global GDP and 319 million jobs, or 10% of total employment in 2018. TheWorld Tourism Organization (UNWTO, 2019) referred that the international touristic arrivals
in the first quarter of 2019 increase in 4% compared to the same period of 2018. According
with the UNWTO index (UNTWO, 2019) the confidence in global tourism performance grew
up after slowing down at the end of 2018. The total exports earnings from the internationalreaches the 1,7 trillion US dollars in 2018 (UNTWO, 2019). At the same time, tourism
industry faces a wide range of major challenges globally, such as fluctuations in the
economy, seasonality, labour shortages and retention of quality personnel, increasing
technological demand, providing and maintaining excellent guest care standards, providingpersonal exceptional experiences, sustainability, growing competition, difficulties in energy
and resource management, cyber security and data privacy, and so on (Nain, 2018). Different
from other sectors, the hospitality industry is unique in nature because it is service-oriented
and has a strong emphasis on human exchange in the service delivery processes
(Mmutle&Shonhe, 2017). According to Veiga et al (2017) the increase in tourist flow and thediversity of destinations has been driven by changes in consumption patterns as a way to
respond to new motivations and new lifestyles.
According to the 13th edition of the Hotel Atlas of Deloitte, in 2018 Portugal set a
new record in the tourism sector. Overnight stays exceeded 57 million, room revenue reached
two and a half million euros and the average occupancy rate reached 64%. The mainconclusions of the study are the following:
At the end of 2018, Portugal had more 1,993 tourist facilities and 143,089 new
accommodation units, 48 and 3,350 more, respectively, than in the previous year.
In 2019, 49 new hotels opened, mostly four and five stars units.
North and Algarve have the largest number of tourist resorts in the country (22% each)
Madeira and Algarve have the highest average stay (5.2 and 4.6 days, respectively)
Hotels are the most representative type of tourist resort in Portugal (73%)
Lisbon recorded the second highest occupancy rate in Europe (80.5%)
The tourism slogan of Portugal is 'Europe's west coast ',a tag line that relates to Portugal,an expression that tries to make a parallel with US west coast, known for sunny skies and
[[24]]
ISSN : 0976-1136
golden beaches. According to the Travel and competitiveness report of world economicforum published in 2019, Portugal got the top score in Tourist service infrastructure globally,due to the measures taken by the country to achieve this, either public or private (airlinecompanies, rent a car, local accommodation, travel agencies, government agencies andhotels).
There was a mass investment in new trends of tourism, like new experiences, walkingtours, gastronomy, museums, as well as large investments in the major cities of Lisbon andPorto.Participation in important industrial exhibitions, fairs, presence in media as well aspresence on social media were also important initiatives.Employment
Tourism is important for young people to have temporary jobs and prepare them forothers.
There are several schools that specialized in teaching all aspects of hospitality and tourism.University education regarding tourism allied disciplines is of outmost importance, a countrycannot have a sound tourism offer if their professionals are not well prepared.The pandemic era
The hospitalityindustry has been massively affected by the pandemic covid19 all overthe world, and Portugal is no exception.
It hit hardly.Numbers from around 80% decrease in hotel accommodation and 90%decrease in tourist arrivals. These numbers however appear to be recovering during summer
(mostly July and August), but still very different from recent years.Tourism will take longer to recover than other industries. Most people have chosen
and will continue to choose destinations in their own countries instead of going abroad.Things are expected to get better next year but a full recovery will not be attained at least in 2years’ time.
For instance, tourism events and festivals are the major attractions in Europe whichcould draw worldwideattention, but most of them were cancelled and postponed for nextyear, the same happened inPortugal.
The few that “survived” were imposed by authorities a strict social distance, masks,sanitation, fever control and above all a much more limited number of people allowed in eachof them. And that is a thread that appears to have no end in sight.
Tourist guides have an important role as they are considered as the smiling
ambassadors of a country. This pandemic has affected their lives, like many otherprofessionals, these ones were also very much affected, most of them having temporary jobs.
It is a sad view to walk around Lisbon, our capital, without tourists and the associatedmerry image of the guides.The post-covid19 in the near future.
One of the effects will be on the public transport system on account of restrictionregarding limited number of travellers.
We will witness major efforts from authorities to call for people good behaviour,along with increasing offer of public transportation, new methods of automatic sanitation, asmajor airlines have already done. A new layout in aircrafts and trains will try to overcomepeople’s fear of travelling.
Masks,gloves, and sanitizers will continue to be mandatory physical components ofpost-covid19 tourism, at least until a vaccine is available. The whole hospitality industry willhave to re-think the way they do business, and thus considering new business models.
Companies will merge, many will bankrupt, unemployment will rise.The industry will have to shrink according to a decreasingdemand.But no matter how things will change in the pandemic aftermath, some major pillars will
continue to be true, like:[[25]]
INTERNATIONAL MULTIDISCIPLINARY PEER REFEREED JOURNAL DELIBERATIVE RESEARCH/Volume-47/Issue-47/July-Sept, 2020
Type of service - In the hospitality industry, production and consumption areinseparable, so customers consume a mix of products and services.
Communication - For service excellence to be achieved in the hospitality industry,two-way communication is a critical factor that requires the involvement andparticipation of customers and service staff in the service delivery process.Loyalty - The hospitality industry relies heavily on repeat customers. Building long-term customer relationships can be crucial to the survival of the organizations.
Diversity in culture - People involved in the hospitality industry experience diversityin culture through interaction with others. Employees interact with clients fromdifferent regions, beliefs, religious values and some conflicts and misunderstandingscan always occur.
Labour-intensive - The hospitality industry is service-oriented in nature and requires ahuge supply of work to create a memorable customer experience.
The traditional tourist goes to a hotel and stays by the pool or lays on the beach. But nowother people travel because they want to see a certain museum, watch a typical eventsomewhere, hike up and down a mountain, eat a certain special and different kind of food.All these, and more, are reasons to travel abroad, and that makes a lot of difference from the
past.Responsible tourism
Responsible tourism plays a key role in Portugal as we have witness important actionstowards that, like appealing to the behaviour of people when lodging, camping or hikingsomeplace (and preventing them from damaging), protecting the environment, as well as thelocal population, the ecosystems and biodiversity.Final Considerations
The covid-19 pandemic is a different kind of big event for all of us, it is a masstraumatic event on a global community scale. It is ongoing, and although there are positivesigns and the isolation is beginning to be less extensive, and social interactions is starting tobecame the “new-old normal”, there currently is no certainty about its end point.
The fact we had to combat the coronavirus by distancing ourselves from one another
physically adds a new psychological challenge.
We all should be aware of how the pandemic is making peoplechange their behaviourand act accordingly, either on our personal or professional life, either as a teacher or astudent, whatever business we are involved, but the hospitality industry is all about travel,knowing places, meeting people and so it deserves special care from all of us.
ReferencesCosta et al.,Tourism Review,ISSN: 1660-5373, December 2019
Devaraja and Deepak, “Assessment of Marketing Strategies of Tourism”, Global Journal for ResearchAnalysis, 2014; 03,8,76-82.
The World Travel & Tourism Council’s (WTTC, 2019)
World Tourism Organization (UNWTO, 2019)
Nain,”A Study on Major Challenges Faced by Hotel Industry Globally.” February2018
Mmutle&Shonhe, “Customers' perception of Service Quality and its impact on reputation in theHospitality Industry”, African Journal of Hospitality Tourism and Leisure, May 2017
Veiga et al, “Are millennials transforming global tourism? Challenges for destinations and
companies”, Worldwide Hospitality and Tourism Themes, October 2017
Hotel Atlas of Deloitte, 13th edition,2018
Turismo de Portugal, http://www.turismodeportugal.pt
Creative Tourism, http://www.creativetourismnetwork.org/
World Health Organization,http://www.euro.who.int/en/health-topics
CDC (Centre for Disease Control and Prevention), May 2020https://www.cdc.gov/coronavirus
[[26]]
INTERNATIONAL MULTIDISCIPLINARY PEER REFEREED JOURNAL DELIBERATIVE RESEARCH/Volume-47/Issue-47/July-Sept, 2020
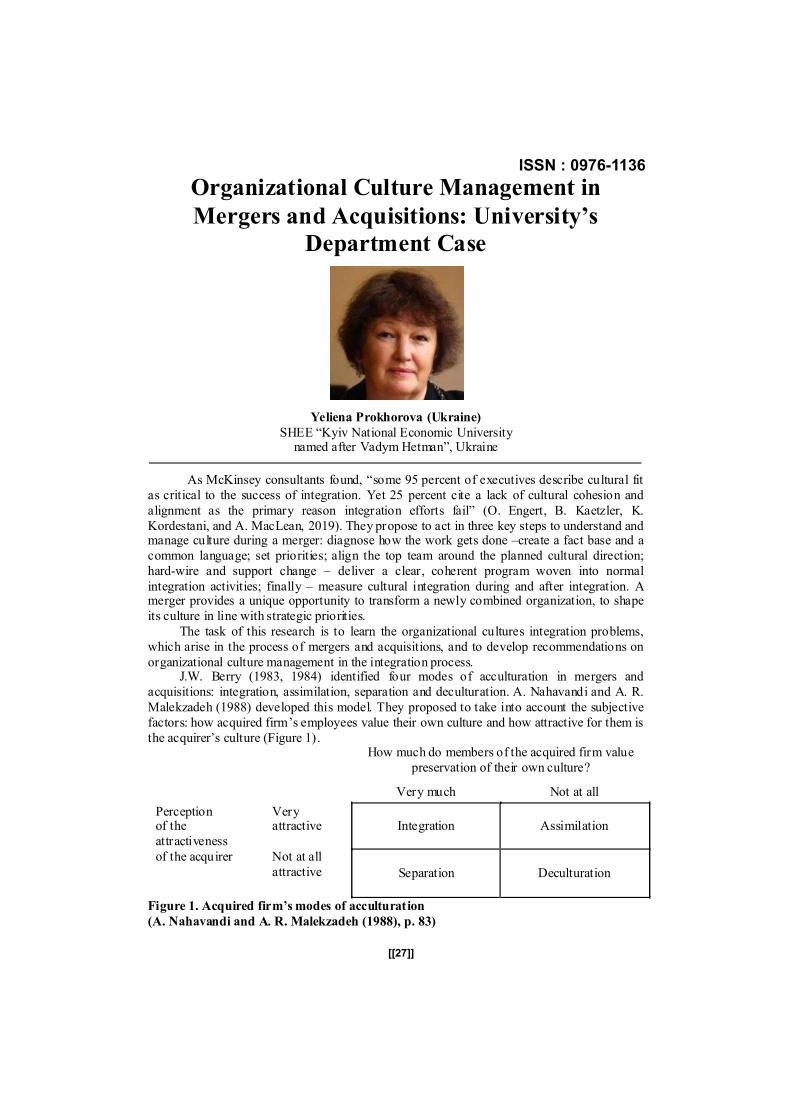
[[27]]
Organizational Culture Management in
Mergers and Acquisitions: University’s
Department Case
Yeliena Prokhorova (Ukraine)
SHEE “Kyiv National Economic Universitynamed after Vadym Hetman”, Ukraine
As McKinsey consultants found, “some 95 percent of executives describe cultural fitas critical to the success of integration. Yet 25 percent cite a lack of cultural cohesion and
alignment as the primary reason integration efforts fail” (O. Engert, B. Kaetzler, K.Kordestani, and A. MacLean, 2019). They propose to act in three key steps to understand andmanage culture during a merger: diagnose how the work gets done –create a fact base and acommon language; set priorities; align the top team around the planned cultural direction;hard-wire and support change – deliver a clear, coherent program woven into normal
integration activities; finally – measure cultural integration during and after integration. Amerger provides a unique opportunity to transform a newly combined organization, to shapeits culture in line with strategic priorities.
The task of this research is to learn the organizational cultures integration problems,which arise in the process of mergers and acquisitions, and to develop recommendations on
organizational culture management in the integration process.J.W. Berry (1983, 1984) identified four modes of acculturation in mergers and
acquisitions: integration, assimilation, separation and deculturation. A. Nahavandi and A. R.
Malekzadeh (1988) developed this model. They proposed to take into account the subjectivefactors: how acquired firm’s employees value their own culture and how attractive for them isthe acquirer’s culture (Figure 1).
How much do members of the acquired firm valuepreservation of their own culture?
Very much Not at all
Perceptionof theattractiveness
of the acquirer
Veryattractive Integration Assimilation
Not at allattractive Separation Deculturation
Figure 1. Acquired firm’s modes of acculturation
(A. Nahavandi and A. R. Malekzadeh (1988), p. 83)
ISSN : 0976-1136
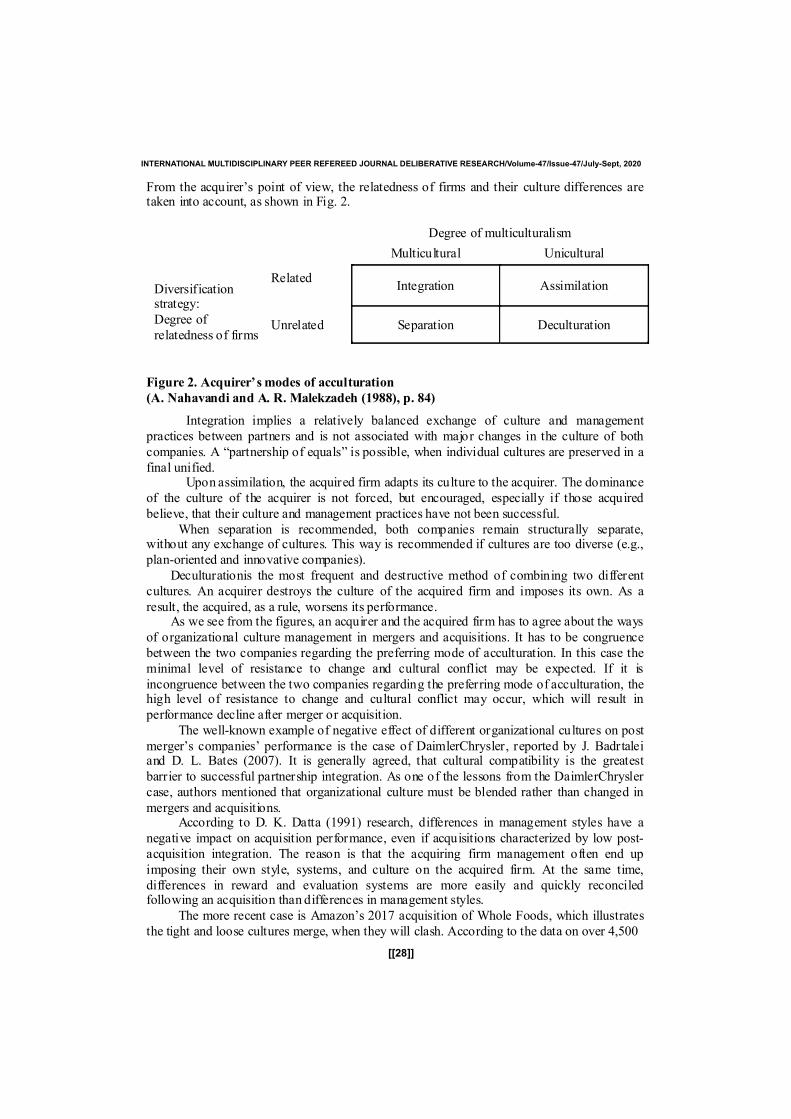
[[28]]
From the acquirer’s point of view, the relatedness of firms and their culture differences aretaken into account, as shown in Fig. 2.
Degree of multiculturalism
Multicultural Unicultural
Diversificationstrategy:
Degree of
relatedness of firms
RelatedIntegration Assimilation
Unrelated Separation Deculturation
Figure 2. Acquirer’smodes of acculturation
(A. Nahavandi and A. R. Malekzadeh (1988), p. 84)
Integration implies a relatively balanced exchange of culture and management
practices between partners and is not associated with major changes in the culture of both
companies. A “partnership of equals” is possible, when individual cultures are preserved in a
final unified.Upon assimilation, the acquired firm adapts its culture to the acquirer. The dominance
of the culture of the acquirer is not forced, but encouraged, especially if those acquired
believe, that their culture and management practices have not been successful.
When separation is recommended, both companies remain structurally separate,without any exchange of cultures. This way is recommended if cultures are too diverse (e.g.,
plan-oriented and innovative companies).
Deculturationis the most frequent and destructive method of combining two different
cultures. An acquirer destroys the culture of the acquired firm and imposes its own. As a
result, the acquired, as a rule, worsens its performance.As we see from the figures, an acquirer and the acquired firm has to agree about the ways
of organizational culture management in mergers and acquisitions. It has to be congruence
between the two companies regarding the preferring mode of acculturation. In this case the
minimal level of resistance to change and cultural conflict may be expected. If it is
incongruence between the two companies regarding the preferring mode of acculturation, thehigh level of resistance to change and cultural conflict may occur, which will result in
performance decline after merger or acquisition.
The well-known example of negative effect of different organizational cultures on post
merger’s companies’ performance is the case of DaimlerChrysler, reported by J. Badrtaleiand D. L. Bates (2007). It is generally agreed, that cultural compatibility is the greatest
barrier to successful partnership integration. As one of the lessons from the DaimlerChrysler
case, authors mentioned that organizational culture must be blended rather than changed in
mergers and acquisitions.According to D. K. Datta (1991) research, differences in management styles have a
negative impact on acquisition performance, even if acquisitions characterized by low post-
acquisition integration. The reason is that the acquiring firm management often end up
imposing their own style, systems, and culture on the acquired firm. At the same time,
differences in reward and evaluation systems are more easily and quickly reconciledfollowing an acquisition than differences in management styles.
The more recent case is Amazon’s 2017 acquisition of Whole Foods, which illustrates
the tight and loose cultures merge, when they will clash. According to the data on over 4,500
INTERNATIONAL MULTIDISCIPLINARY PEER REFEREED JOURNAL DELIBERATIVE RESEARCH/Volume-47/Issue-47/July-Sept, 2020
[[29]]
international mergers from 32 different countries between 1989 and 2013, on average, theacquiring companies in mergers with tight-loose differences saw their return on assets
decrease by 0.6 percentage points three years after the merger, or $200 million in net incomeper year (M. Gelfand, S. Gordon, C. Li, V. Choi and P. Prokopowicz, 2018). In order toachieve cultural harmony in the tight and loose cultures merge, authors propose to act in thenext way: negotiate culture to achieve a compromise and create flexible tightness andstructured looseness; develop a cultural integration plan; explain, what changes and why haveto be implemented; be ready to change the cultural integration plan.
M. Schraeder and D. R. Self (2003) recommended to use such instruments to manageorganizational culture in mergers and acquisitions: assess cultural compatibility; anticipateemployee reactions; develop flexible integration plan, which includes the communication andnegotiation with employees; share information about the integrating process; involveemployees in the process; establish relationships and build trust; train, support and socializeemployees.
R. A. Weber and C. F. Camerer (2003) used laboratory experiments to explore mergerfailure due to conflicting organizational cultures. Their results show, that mergedexperimental groups do considerably worse on average than the two separate premergergroups were doing immediately before the merger. Comparing the task completion timesbefore and after the merger reveals, that both employees are performing worse after themerger. Therefore, if to concern only with employee productivity, the merger clearlynegatively affects performance. The reason is the different organizational cultures conflict,when employees from two companies do not understand each other and have differentapproaches to problem solving and collaboration.
G. K. Stahl and A. Voigt (2008) suggested, that cultural differences in mergers andacquisitions could be not only the potential source of cultural conflict, but also the source of
synergy in integrated company. The managerial task in this case is to manage organizationalculture after mergers and acquisitions.
A. Kumar and R. Kumar Braskar (2005) suggested, that vitally important is to definethe organizational culture in the new combined post-acquisition organization; tocommunicate preferable face-to-face with all involved parties during the integration process;
to integrate as quick as possible to avoid or minimize resistance to change; to decide, whatdegree of organizational cultures’ integration is needed, trying to save the best features ofboth organizational cultures in the new entity.
C. Lakshman (2011) proposed knowledge management based model of post-acquisitionintegration, which includes knowledge leadership (in the form of cause–effect beliefs ofintegration leaders; motivation for cultural integration; integration leader resolving conflicts;reducing causal ambiguity); cultural knowledge-sharing mechanisms (socio cognitive meansof cultural knowledge sharing; target involvement in the integration process; early targetinvolvement in integration process design), that have to lead to more effective integrationafter acquisition due to trust, commitment, low turnover and longevity.
A. S. Ivanova (2010) developed the model of organizational culture management inmergers and acquisitions in six steps: organizational cultures’ analysis before the integration;education of employees; changes implementation; new motivation system development;evaluation and control; organizational culture improvement. Mitrofanova E.A. andKonovalova V.G. (2017) proposed to manage organizational culture in mergers andacquisitions as part of the change management process and create special Corporate CultureTransformationManagement Committee at the new organization.
Generalizing the different authors’ approaches to the process of organizational culturemanagement in mergers and acquisitions, we could identify the main elements of this process(table 1).
INTERNATIONAL MULTIDISCIPLINARY PEER REFEREED JOURNAL DELIBERATIVE RESEARCH/Volume-47/Issue-47/July-Sept, 2020
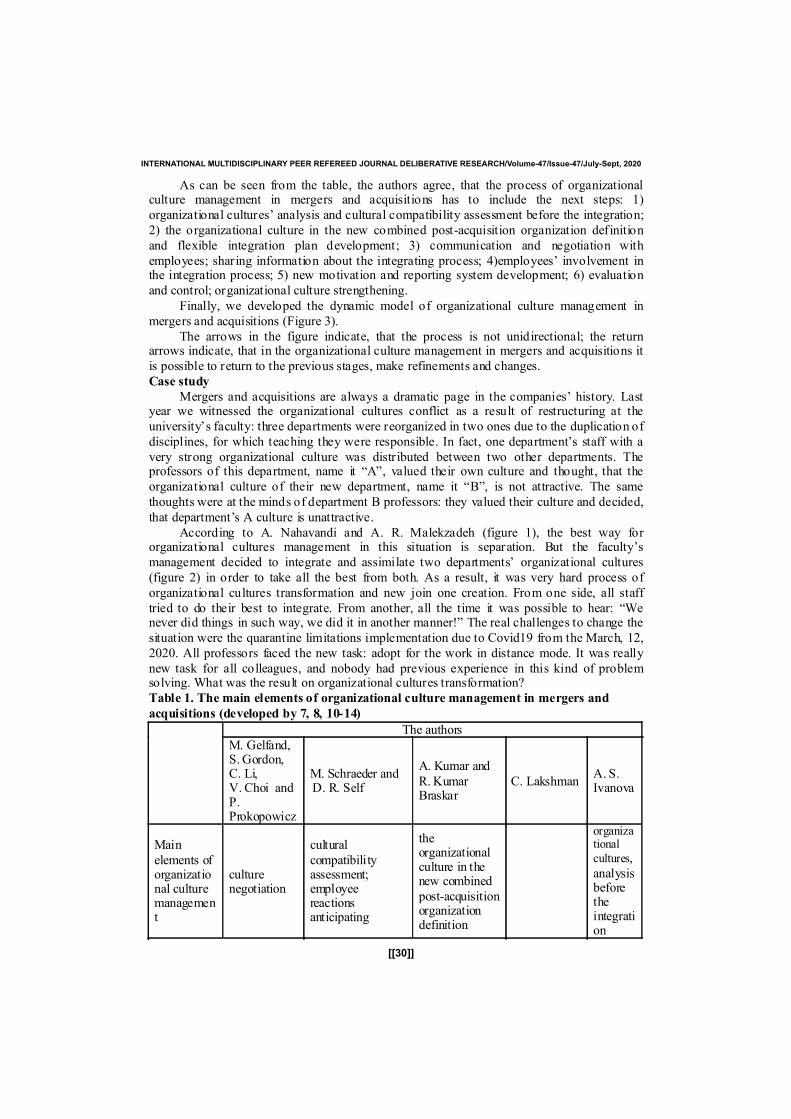
[[30]]
As can be seen from the table, the authors agree, that the process of organizationalculture management in mergers and acquisitions has to include the next steps: 1)
organizational cultures’ analysis and cultural compatibility assessment before the integration;
2) the organizational culture in the new combined post-acquisition organization definition
and flexible integration plan development; 3) communication and negotiation with
employees; sharing information about the integrating process; 4)employees’ involvement inthe integration process; 5) new motivation and reporting system development; 6) evaluation
and control; organizational culture strengthening.
Finally, we developed the dynamic model of organizational culture management in
mergers and acquisitions (Figure 3).
The arrows in the figure indicate, that the process is not unidirectional; the returnarrows indicate, that in the organizational culture management in mergers and acquisitions it
is possible to return to the previous stages, make refinements and changes.
Case study
Mergers and acquisitions are always a dramatic page in the companies’ history. Lastyear we witnessed the organizational cultures conflict as a result of restructuring at the
university’s faculty: three departments were reorganized in two ones due to the duplication of
disciplines, for which teaching they were responsible. In fact, one department’s staff with a
very strong organizational culture was distributed between two other departments. Theprofessors of this department, name it “A”, valued their own culture and thought, that the
organizational culture of their new department, name it “B”, is not attractive. The same
thoughts were at the minds of department B professors: they valued their culture and decided,
that department’s A culture is unattractive.
According to A. Nahavandi and A. R. Malekzadeh (figure 1), the best way fororganizational cultures management in this situation is separation. But the faculty’s
management decided to integrate and assimilate two departments’ organizational cultures
(figure 2) in order to take all the best from both. As a result, it was very hard process of
organizational cultures transformation and new join one creation. From one side, all staff
tried to do their best to integrate. From another, all the time it was possible to hear: “Wenever did things in such way, we did it in another manner!” The real challenges to change the
situation were the quarantine limitations implementation due to Covid19 from the March, 12,
2020. All professors faced the new task: adopt for the work in distance mode. It was really
new task for all colleagues, and nobody had previous experience in this kind of problemsolving. What was the result on organizational cultures transformation?
Table 1. The main elements of organizational culture management in mergers and
acquisitions (developed by 7, 8, 10-14)
The authors
M. Gelfand,S.Gordon,C. Li,V. Choi andP.Prokopowicz
M. Schraeder andD. R. Self
A. Kumar and
R.KumarBraskar
C. LakshmanA. S.Ivanova
Main
elements oforganizational culturemanagement
culturenegotiation
cultural
compatibilityassessment;employeereactionsanticipating
theorganizationalculture in thenew combined
post-acquisitionorganizationdefinition
organizational
cultures,
analysisbeforetheintegration
INTERNATIONAL MULTIDISCIPLINARY PEER REFEREED JOURNAL DELIBERATIVE RESEARCH/Volume-47/Issue-47/July-Sept, 2020
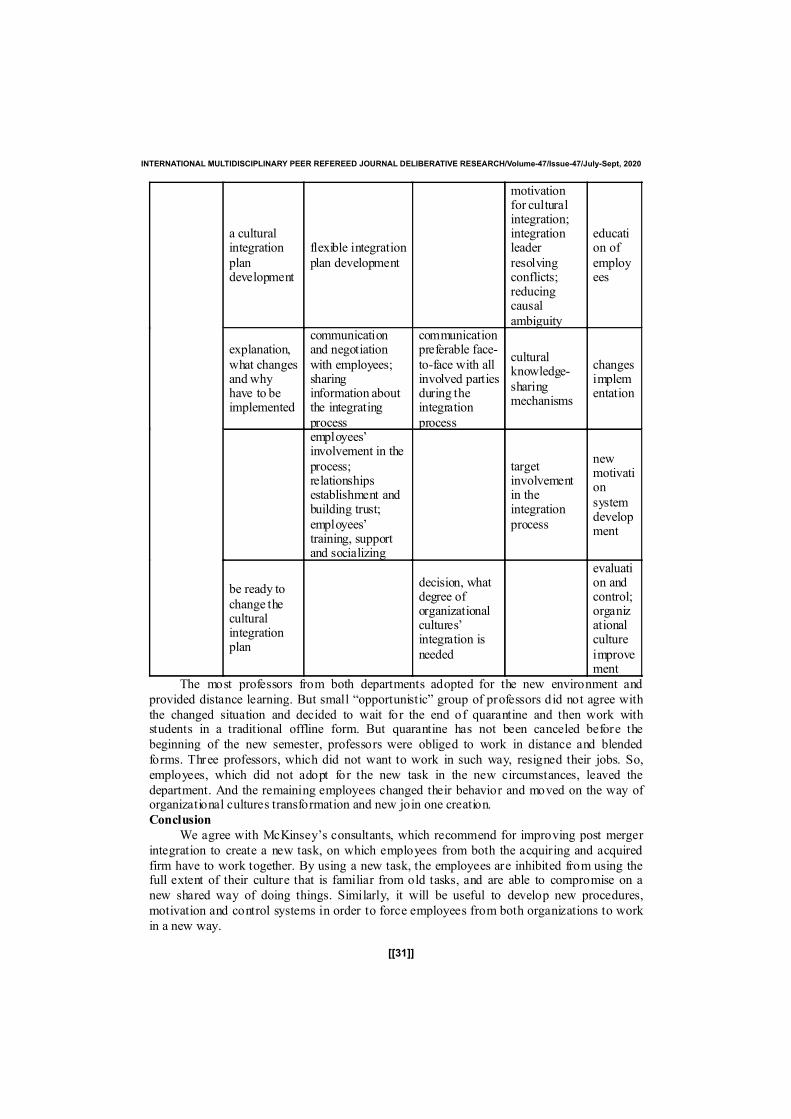
[[31]]
a culturalintegration
plandevelopment
flexible integration
plan development
motivationfor culturalintegration;integrationleader
resolvingconflicts;reducingcausal
ambiguity
education of
employees
explanation,
what changesandwhyhave to beimplemented
communicationand negotiation
with employees;sharinginformation aboutthe integrating
process
communicationpreferable face-
to-face with allinvolved partiesduring theintegration
process
culturalknowledge-
sharingmechanisms
changesimplementation
employees’involvement in the
process;relationshipsestablishment andbuilding trust;
employees’training, supportand socializing
targetinvolvementin theintegration
process
newmotivation
systemdevelopment
be ready to
change theculturalintegrationplan
decision, whatdegree oforganizationalcultures’integration is
needed
evaluation andcontrol;organizationalculture
improvement
The most professors from both departments adopted for the new environment and
provided distance learning. But small “opportunistic” group of professors did not agree with
the changed situation and decided to wait for the end of quarantine and then work withstudents in a traditional offline form. But quarantine has not been canceled before the
beginning of the new semester, professors were obliged to work in distance and blended
forms. Three professors, which did not want to work in such way, resigned their jobs. So,
employees, which did not adopt for the new task in the new circumstances, leaved the
department. And the remaining employees changed their behavior and moved on the way oforganizational cultures transformation and new join one creation.
Conclusion
We agree with McKinsey’s consultants, which recommend for improving post merger
integration to create a new task, on which employees from both the acquiring and acquired
firm have to work together. By using a new task, the employees are inhibited from using thefull extent of their culture that is familiar from old tasks, and are able to compromise on a
new shared way of doing things. Similarly, it will be useful to develop new procedures,
motivation and control systems in order to force employees from both organizations to work
in a new way.
INTERNATIONAL MULTIDISCIPLINARY PEER REFEREED JOURNAL DELIBERATIVE RESEARCH/Volume-47/Issue-47/July-Sept, 2020
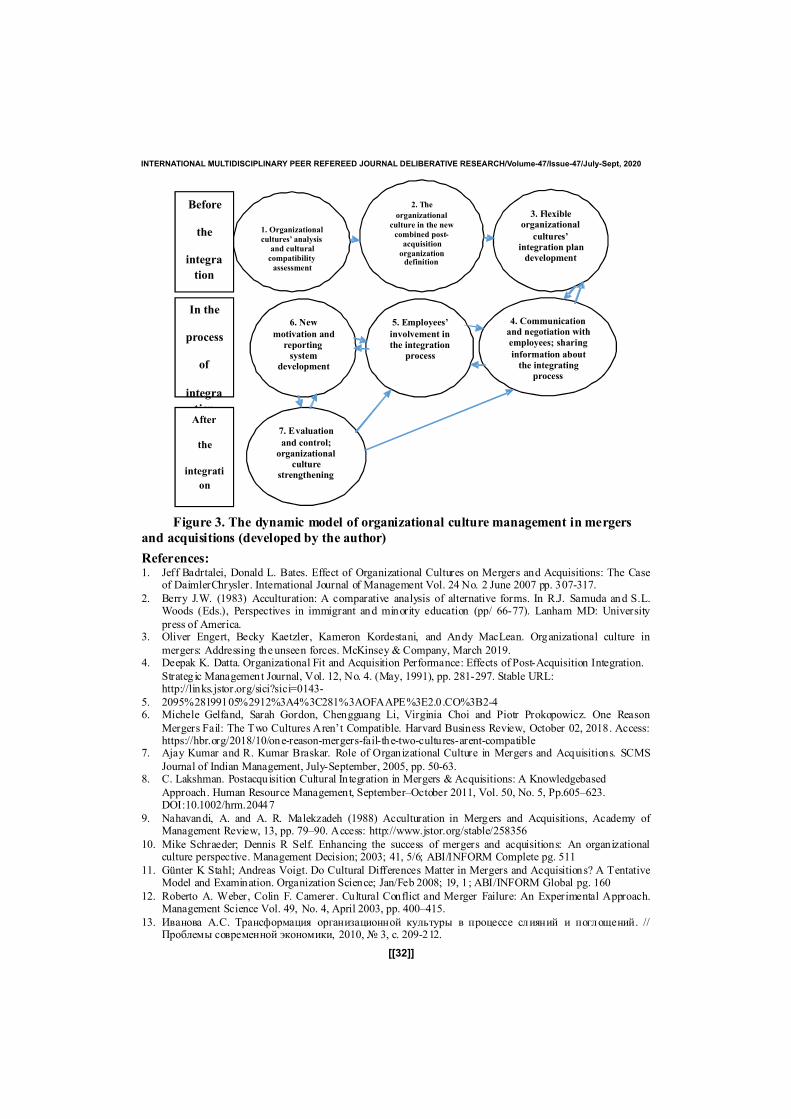
[[32]]
Figure 3. The dynamic model of organizational culture management in mergers
and acquisitions (developed by the author)
References:1. Jeff Badrtalei, Donald L. Bates. Effect of Organizational Cultures on Mergers and Acquisitions: The Case
of DaimlerChrysler. International Journal of Management Vol. 24 No. 2 June 2007 pp. 307-317.
2. Berry J.W. (1983) Acculturation: A comparative analysis of alternative forms. In R.J. Samuda and S.L.Woods (Eds.), Perspectives in immigrant and minority education (pp/ 66-77). Lanham MD: University
press of America.3. Oliver Engert, Becky Kaetzler, Kameron Kordestani, and Andy MacLean. Organizational culture in
mergers: Addressing the unseen forces. McKinsey & Company, March 2019.4. Deepak K. Datta. Organizational Fit and Acquisition Performance: Effects of Post-Acquisition Integration.
Strateg ic Management Journal, Vol. 12, No. 4. (May, 1991), pp. 281-297. Stable URL:http://links.jstor.org/sici?sici=0143-
5. 2095%28199105%2912%3A4%3C281%3AOFAAPE%3E2.0.CO%3B2-46. Michele Gelfand, Sarah Gordon, Chengguang Li, Virginia Choi and Piotr Prokopowicz. One Reason
Mergers Fail: The Two Cultures Aren’t Compatible. Harvard Business Review, October 02, 2018. Access:https://hbr.org/2018/10/one-reason-mergers-fail-the-two-cultures-arent-compatible
7. Ajay Kumar and R. Kumar Braskar. Role of Organizational Culture in Mergers and Acquisitions. SCMS
Journal of Indian Management, July-September, 2005, pp. 50-63.8. C. Lakshman. Postacquisition Cultural Integration in Mergers & Acquisitions: A Knowledgebased
Approach. Human Resource Management, September–October 2011, Vol. 50, No. 5, Pp.605–623.DOI:10.1002/hrm.20447
9. Nahavandi, A. and A. R. Malekzadeh (1988) Acculturation in Mergers and Acquisitions, Academy ofManagement Review, 13, pp. 79–90. Access: http://www.jstor.org/stable/258356
10. Mike Schraeder; Dennis R Self. Enhancing the success of mergers and acquisitions: An organizationalculture perspective. Management Decision; 2003; 41, 5/6; ABI/INFORM Complete pg. 511
11. Günter K Stahl; Andreas Voigt. Do Cultural Differences Matter in Mergers and Acquisitions? A TentativeModel and Examination. Organization Science; Jan/Feb 2008; 19, 1; ABI/INFORM Global pg. 160
12. Roberto A. Weber, Colin F. Camerer. Cultural Conflict and Merger Failure: An Experimental Approach.Management Science Vol. 49, No. 4, April 2003, pp. 400–415.
13. Иванова А.С. Трансформация организационной культуры в процессе слияний и поглощений. //Проблемы современной экономики, 2010, № 3, с. 209-212.
2. The
organizational
culture in the new
combined post-
acquisition
organizationdefinition
1. Organizational
cultures’ analysis
and cultural
compatibility
assessment
3. Flexibleorganizational
cultures’integration plandevelopment
4. Communicationand negotiation with
employees; sharing
information about
the integratingprocess
5. Employees’
involvement in
the integrationprocess
6. New
motivation and
reportingsystem
development
7. Evaluation
and control;
organizationalculture
strengthening
Before
the
integra
tion
In the
process
of
integra
After
the
integrati
on
INTERNATIONAL MULTIDISCIPLINARY PEER REFEREED JOURNAL DELIBERATIVE RESEARCH/Volume-47/Issue-47/July-Sept, 2020

[[33]]
14. Митрофанова Е. А., Коновалова В. Г. Управление корпоративной культуройпри слиянии компаний:интеграция и трансформация. Международный научно-исследовательский журнал, № 10 (64), 2017.
Часть 2, Октябрь, с. 103-112. DOI: https://doi.org/10.23670/IRJ.2017.64.010
INTERNATIONAL MULTIDISCIPLINARY PEER REFEREED JOURNAL DELIBERATIVE RESEARCH/Volume-47/Issue-47/July-Sept, 2020
[[34]]
CERN and STEM Education in the ?Playing
with Protons? Program
Rania Lampou (Athens Greece)STEM Instructor, ICT ΤeacherΤrainer,
Neuroeducation Researcher
AbstractNowadays, it is widely accepted that children get more motivated for learning when
they choose a subject at school. Thus, the teacher’s role is to present knowledge in an
attractive and interesting way. Inspiring students is crucial for the learning process. This is a
difficult problem for STEM education because many primary school teachers do notnecessarily have good knowledge of science. Teachers cannot inspire their students when
they do not feel enthusiastic about a teaching subject. A new CERN pioneering program,
"Playing with protons" was created to solve this problem.
Keywords. CERN, creativity, LHC, physics education, STEM, STEAM.
IntroductionThe trend of combinational teaching of Science, Technology, Engineering and
Mathematics, the so-called STEM has appeared in the last decades. STEM education is a
holistic approach to learning and it is closely related to everyday life and practical issues.
(Dierking, Falk, 2016). By implementing STEM through projects in education, studentsacquire critical thinking skills, they are involved in the process of solving authentic problems
and learn to collaborate in teamwork (Froschauer, 2016). In addition, decision-making, and
communication skills should be among the main goals of STEM education (Foundations for
Young Australians, 2015; Hajkowicz et al., 2016).
1. STE(A)M EducationFalk et al. (2016) identify six principles for improving STEM learning. The six
principles are the following: learning should be a life-long process, STEM is worth learning,
learning should include everyday experiences, educators and students should be involved in
research, new technologies should determine the content and practices of STEM, broadersocio-cultural and political factors should be considered (Falk et al., 2016). It is also
important for students to deal responsibly with technology (Fernández-Manzanal et al.,
2007).
This provides students with confidence and competence to function effectively asinformed citizens (Ryder, 2001) that can participate to democratic civic decision-making.
These skills are necessary inthe 21st century, in order for people to deal with modern life
ISSN : 0976-1136
[[35]]
complex situations. These capabilities need to be developed in people from an early age. Thisis the most effective way of developing complex skills (Falk and Needham, 2013).
Another important issue is the education of teachers in STEM practices. A research
was conducted in Australia among pre-service primary school teachers by a Chief Scientist of
Australia (Prinsley, Johnston, 2015). The research investigated beliefs regarding STEM in
terms of importance, innovation, skills in future, and high-quality specialist teachers to teachin primary schools and there were also questions on understanding concerning attracting high
achievers to teaching, including STEM in teacher preparation, professional development, and
leadership in primary schools. The questionnaire included questions about intentions to teachSTEM focused on the interest connected to daily life, the ability to apply mathematics, the
need for primary teachers to be supported by a specialist STEM teacher, the needs forseparate subject on STEM in the university for pre-service teachers’ university programs, and
the teachers’ ability in STEM to transform creativity and innovation among children.Future teachers who answered the questionnaires placed emphasis on the fact that
their knowledge of science and technology was minimal. However, they had positiveintentions to teach STEM since they believed that STEM-related subjects are important forlife.
Among the conclusions of the study are the following:
Pre-service teachers should have experiences in STEM in order to apply theirknowledge, their skills and the principles of STEM efficiently.
Science knowledge and sound pedagogical practices should be integrated in order for
teachers to practice STEM teaching in an optimal manner.
Ongoing professional training in STEM education is necessary for all teachers.
STEM should include school and non-school experiences in STEM-related activities.
(Kurup, Li, Powell, Brown, 2019).
Teachers’ platform of knowledge, confidence, and efficacy for teaching STEMinfluences students’ learning and classroom practices (Nadelson et al., 2013). Teachers’
ability in integrating background knowledge of technological pedagogical content knowledge
to a STEM curriculum seems a challenge to pre-service and in-service teachers (Hofer,Grandgenett, 2012).
It is also essential for teachers to have a professional development education in STEM
that would enable them to integrate disciplines and will provide them an understanding of
teaching approaches that combine hands-on activities with the effort to develop twenty-firstcentury competencies. Furthermore, there is a need for policies of STEM that are based on
the four-dimensional framework: knowledge, skills, character, meta-learning. (Bybee, 2013).Very recently, arts have also been incorporated into STEM teaching, making these
projects even more creative and interesting. As a result, the STEM acronym is now becomingSTEAM (Land, 2013). STEAM is an educational and interdisciplinary approach that aims to
promote research spirit, logical thinking and social skills. Emphasis is placed on empirical
and exploratory-discovery learning, autonomy and active participation of students, throughtrial and errors, in a series of interactive projects that incorporate the five fields of STEAM
(Maslyk, 2016). The acquisition of basic skills through STEAM projects, prepares young
people for the future, as STEAM learning is framed in the daily life of young people outside
the classroom (Daugherty, 2013).2. ?Playing with Protons? program and its goals
In most countr ies, physics is taught in high-schools, in ways that don’t motivate
students and as a result they make them think that the subject is boring and useless for them.One of the reasons that in most cases science is taught only in high-schools is that there arenot specialized science teachers in primary school and since modern physics can be a difficult
subject, primary school teachers may lack the confidence and knowledge to perform well in
INTERNATIONAL MULTIDISCIPLINARY PEER REFEREED JOURNAL DELIBERATIVE RESEARCH/Volume-47/Issue-47/July-Sept, 2020
[[36]]
the classroom (Wilkins, 2010). In this manner, they are excluded from the creative world ofthe modern scientific approaches that extend the boundaries of science in a way that physics
can meet philosophy and imagination (Etkina, 2015).
However, according to several studies, the public wants science to be taught early inprimary education. The majority of participants in the above-mentioned studies believe that
science in primary school will help students to perform well in high-school. (Belden, Lien,Nelson-Dusek, 2010)
Eshach and Fried (Eshach, Fried, 2005) posited that even very young children should beexposed to the world of science. Their assertions are as follows:
1. Children normally find pleasure in observing and contemplating nature.
2. The exposure of young students to science results in the development and adoption of apositive attitude towards it.
3. Early exposure to scientific phenomena prompts to better comprehension of the
scientific terms studied formally later.
4. The utilization of scientifically informed language at an early age affects the eventualdevelopment of scientific concepts in a very positive way.
5. Children can understand scientific concepts and reason scientifically.
6. Science is an efficient means for developing scientific thinking.
"Playing with Protons" is a CERN project that is addressed to primary school students.This idea that the concepts of modern physics and science in general should be taught at an
early age represents the added value of the program. This course was initially supported by
the CMS and subsequently by the ATLAS experiments at the Large Hadron Collider (LHC)within the framework of the CREATIONS EU project (CREATIONS EU project website)
and now it is supported by the REINFORCE (REINFORCE EU project website) andFRONTIERS (FRONTIERS EU project website) European projects. In CREATIONS, 16
partners from 11 European countries develop creative approaches based on art for anengaging science classroom in order to improve the skills of young people in STEM, raise
student’s interest and encourage science teachers to innovate. Combining science and art,
partners are planning a variety of cultural events in which young people can experience anactive and playful role within science and research. ?Art@CMS?, ?Learning Science throughTheater? and ?Global Science Opera? are three of the programmes within the framework of
the CREATIONS project. (CREATIONS EU project website).
?Playing with Protons? is the brainchild of Tina Nantsou, a physics teacher at HillMemorial School in Athens, Greece. The project focuses on experiments conducted by the
students themselves with everyday materials and objects and it results in the students
becoming familiar with complicated scientific concepts as well as the latest developments in
the field of particle physics research. Naturally, knowledge of modern physics should beexplained to young students in a conceptual way rather than a mathematical way and a lot of
hands-on activities should be utilized to provide a solid foundation to young students for a
deeper understanding of scientific concepts (Playing with Protons website).
The project is combined with primary teacher teaching training taking place at CERN.(Trimoulla, 2016). 10 teachers from Greece and UK are selected in order to participate in thetraining program that takes place at CERN’s facilities. They experiment with simply
materials and when they return to their countries they diffuse the knowledge they acquire totheir colleagues and to their students (Ioannidis, 2016). The main goals of the program are to
enable primary school teachers to:
Invent innovative scenarios and lesson plans to motivate their students and enrich the
curriculum at the same time.
Experience technology, science and innovation at CERN which is the largest particlephysics laboratory in the world.
INTERNATIONAL MULTIDISCIPLINARY PEER REFEREED JOURNAL DELIBERATIVE RESEARCH/Volume-47/Issue-47/July-Sept, 2020
[[37]]
Get acquainted with new teaching approaches based on hands-on activities andexperiments.
Diffuse the knowledge they acquired at CERN to their colleagues, peers and local
communities.
Feel confident when teaching science."Playing with Protons" enables primary teachers to improve their knowledge and
teaching practice with creative methods that can attract the attention and get students engaged
with science and technology ideas. The visit to CERN enables teachers to transmit first-hand
knowledge to students. Experiential learning for teachers ensures experiential learning forstudents. This is one of the most effective ways to attract the attention of students and to
stimulate them. Furthermore, teachers become part of the scientific community and in this
way they can transmit the values of collaboration towards common goals that further the
progress of human civilization. All the above ensure that students will have a high-qualityeducation experience when they participate in a CERN project.
?Playing with Protons? includes continuing professional development (CPD) courses
for primary school teachers, the development of learning resources and communities of
interest, and continuous support for schools especially those in remote locations and schools
with students who are members of relatively underprivileged communities.The program allows primary school teachers, specialists in science education and
researchers working at CERN to cooperate in order to create new and original approaches
that would increase the level of engagement in natural sciences, experimentation and
innovation in primary school students. In particular, Primary school teachers visit CERN
experimental facilities to witness the one of a kind culture of the latest scientific discoveries,state of the art technology and innovation at the largest particle physics laboratory on the
planet. They draw inspiration and they become very eager to share the knowledge they have
just discovered with peers, students, parents and the larger community. They experiment with
new teaching activities focusing on hands-on activities using simple materials to increasetheir engagement level. Furthermore, they use innovative methods for the development of
new educational scenarios and lesson plans that will make the teaching and learning process
of physics more engaging and effective. (Playing with Protons website).
As a Flexible zone teacher in three Primary schools of Artemida, Athens, I had theopportunity to participate in the program ?Playing with Protons?. Considering that the main
challenge of the program is to cultivate science, motivation and creativity in primary school
students, throughout the program, students in nearly all Primary school grades were involved
in various creative activities. In particular, students performed artistic activities, constructionsand general explorations of objects. They simulated physics experiments; they created
collages and digital presentations for natural scientists. In addition, they depicted the CMS
detector in multiple ways, using a variety of materials and techniques, including wood,
collages, Lego, three-dimensional printing, and organizing an art exhibition at CMS, etc.
2.1. Domain specific objectivesThe primary area of study is the field of particle physics, but the fields of astrophysics and
cosmology are also touched upon. Furthermore, the students learn about and become familiar
with fundamental concepts from the fields of engineering, technology and history of science.
To be more precise, once the program is completed, the students should be able to
comprehend that:
•All matter consists of the same elementary particles which in turn form larger particles,
such as protons, neutrons and eventually atoms.
• There are four natural fundamental forces or interactions (i.e. gravity, electromagnetism,weak nuclear forcesand strong nuclear forces) that affect matter.
INTERNATIONAL MULTIDISCIPLINARY PEER REFEREED JOURNAL DELIBERATIVE RESEARCH/Volume-47/Issue-47/July-Sept, 2020
[[38]]
• Elementary particles are invis ible to the naked eye and can’t be viewed through ordinarymicroscopes, however, throughout the last century, particle physicists have devisedincreasingly advanced methods for their detection.
• The LHC for short is essentially the most powerful microscope on the planet. It wasdeveloped and built at CERN and it allows scientists to perform experiments involving
particle collisions with the aim of getting a deeper understanding of matter’s inner structureand the discovery of new particles.
• The dark matter and dark energy with which the universe is filled are currentlyessentially unknown qualities to scientists.
• The study of particles has a long history character ized by creativity and innovation on thepart of scientists, collaborations on an international level and technological advancements.• The study of particles has beneficially affected many aspects of our daily life because
many of the scientific discoveries and technological advancements that resulted from this
study have been applied and implemented in fields such as medicine, communications andtransport.2.2. General skills objectives
Collaboration Problem-solving
Creativity Dealing with mistakes
Communication and presentation2.3. Thematic sessions-Scientific model
The program proposes a series of five thematic sessions: cosmology, elementaryparticles, an introduction to CERN: past, present and future, accelerators and detectors atCERN and their technological applications, creativity zone.Furthermore, the scientific model described in the program is the following:
?Phase 1. Question: students investigate a scientifically oriented question.Phase 2. Evidence: students give priority to evidence.
Phase 3. Analyse: students analyse evidence.Phase 4. Explain: students formulate an explanation based on evidence.
Phase 5 Connect: students connect explanations to scientific knowledge.Phase 6. Communicate: students communicate and justify explanation ?
(Playing with Protons, CREATIONS-Demonstrator, CERN website)3. Application of the ?Playing with Protons? program in three primary schools ofArtemida
The ?Playing with Protons? program was applied in three Primary schools of
Artemida- the 2nd and 6th, as well as the 4th Primary School of Artemida- . The instructionaldesign of the applied program was based on a mixed model that integrates elements from
various learning theories and methodological approaches. In particular, the principles of theInquiry teaching model, of constructivism and cooperative learning along with four leadingapproaches- Project Based Learning, Problem-Based Learning, Inquiry-based learning and
Challenge-Based Learning–and the 5E Model of Instruction- engage, explore, explain,elaborate, evaluate- were utilized.
At the same time, the principles of neuro education, differential teaching as well asHoward Gardner's multiple intelligence theory are also applied. Moreover, linguistic and
logical-mathematical skills are entwined with imagination, intuition, originality and artisticskills (Gardner, 1999, Sousa, Pilecki, 2013). The teaching practices of the program encouragethe understanding and use of scientific language, mathematical understanding, the use ofvisual symbols, the use of the senses, artistic and manual work, body sensations and
movement, the understanding of each other's position and cooperation, self-knowledge and
INTERNATIONAL MULTIDISCIPLINARY PEER REFEREED JOURNAL DELIBERATIVE RESEARCH/Volume-47/Issue-47/July-Sept, 2020
[[39]]
self-regulation, interaction with the natural environment, the use of musical shapes, thephilosophical and moral dimension of existence.
Νew technologies have made a significant contribution to the implementation of the
projects. High technology machines, such as 3D printers, were used. It is noteworthy that the
teaching proposal for CERN’s 3D printing has won an Educational Innovation Award at the
European Contest ?Ultimaker Education Challenge 2016?. Also, during the projects, studentshave used a variety of digital tools that have transformed teaching into an attractive and
dynamic process.
Cross-thematic integration and interdisciplinary are diffused in almost all proposed
activities. The thematic sections of the program are holistically approached through the
involvement of a variety of disciplines and cognitive subjects such as natural sciences(astronomy, physics, chemistry), mathematics, mythology, history, philosophy, literature,
foreign languages (English, French) and predominantly through art (theater, music, painting).
Cross-curricular teaching aims to unify knowledge and thus promotes the connection with
everyday experience, higher cognitive functions such as analysis and synthesis,metacognitive skills, increased motivation, in-depth understanding, d ifferentiated
instruction.The role of the teacher is multifaceted: he is a facilitator, a role-model and a guide
(Rowley, Cooper, 2009).
4. Selected lesson plan
Session 1 (power point presentation & videos): Learn about CERN underground
facilities) .Engineering challenge: Create and build models and maquettes of CERN premises.
Session 2 (power point presentation & videos): Learn about the CMS experiment and
the science behind the experiment.Engineering challenge: Simulation of the CMS experiment.
Session3 (power point presentation & videos): The ATLAS and CMS detectors (learn
the physics and engineering of the detectors).
Engineering challenge: Construct models of a particle detector (ATLAS and CMS) (use of
everyday materials).4.2. Scientific model
Phase 1: QUESTION: students investigate a scientifically oriented question
Balance and navigation through dialogue aids teachers and students in creatively navigating
educational tensions.Ethics and trusteeship is an important consideration in experimental design and collaborative
work, as well as in the initial choice of question.
Phase 2: EVIDENCE: students give priority to evidence
Risk, immersion and play is crucial in empowering pupils to generate, question and discuss.
Phase 3: ANALYSE: students analyze evidenceStudents analyze evidence, using dialogue with each other and the teacher to support their
developing understanding.
Phase 4: EXPLAIN: students formulate an explanation based on evidence
Students use evidence they have generated and analyzed to consider possibilities forexplanations that are original to them. They use argumentation and dialogue.
Phase 5: CONNECT: students connect explanations to scientific knowledge
Students connect their explanations with scientific knowledge, using different ways of
thinking and knowing ("knowing that", "knowing how", and "knowing this").
Phase 6: COMMUNICATE: students communicate and justify explanationCommunication of possibilities, ideas and justifications through dialogue with other
students.
Phase 7: REFLECT: students reflect on the inquiry process and their learning
INTERNATIONAL MULTIDISCIPLINARY PEER REFEREED JOURNAL DELIBERATIVE RESEARCH/Volume-47/Issue-47/July-Sept, 2020
[[40]]
Individual, collaborative and community-based reflective activity consolidates learning andenables students and teachers.
4.3 SessionsSchool: 4
thPrimary School of Artemida, Greece, Athens
Grades: 1st-6thgrades of Primary education
SESSION 1
The Marquette of CERN’s installations (construction, artistic representation)Duration: 4 lessons X 45’: 3h
Objectives
-Learn about CERN underground facilities.
-Engineering challenge: Create and build models and maquettes of CERN premises.SESSION 2
Simulation of the CMS experiment with Led Flash Circuit and Led Chaser Circuit
Duration: 4 lessons x 45: 3h
Objectives-Learn about the CMS experiment and the science behind the experiment.
-Engineering challenge: Simulation of the CMS experiment.
SESSIONS 3
Models of a particle detector (CMS and CMS)
Duration: 13h30 approximately
Objectives-The detectors CMS and ATLAS (learn the physics and engineering of the detectors)
-Construct models of a particle detector (CMS and ATLAS), [use of everyday materials].
SESSION 1The maquette of CERN’s installations (constructions, artistic representations)
SESSION 2
Simulation of the CMS experiment with Led Flash Circuit and Led Chaser Circuit
SESSION 3
1. Miniatures of the CMS detector using Lego2. Wooden representations of the CMS detector
3. a) Paintings about the CMS Detector and Art @CMS Exhibition
b) art@CMS. A virtual Gallery-A collection of the best paintings at the art@CMS (CERN) of
Michael Hoch, Lindsay Olson, Paco Falco, Chris Henschke, Xavier Cortada, Alison Gillmade with the digital tool artsteps.
c. The CMS detector was represented in collages (materials such as jewelry, drinking straws,
pills, toothpicks, bottle caps and pasta were used).
d. Collage of the particle detector CMS using the app Hp Reveal of the Augmented Realityon mobile and tablet.
4. 3D printing models of CERN (the process of printing and assembling the CMS detector
lasted 100 hours. Additionally, 100 hours were required for printing the Globe of science and
innovation and 2 hours for printing and assembling of little models of Higgs bosons).
5. The particle detector CMS dessert (a dessert consisting of butter, chocolate and sugar andweighing three kilograms).
6. "Playing with Particles", Applications for web and portable devices (cross-platform,
Android - IOS)
"Detecting particles" (CMS, CERN) (30minutes)
Level 1Level 2
It’s a partof a complete course (26 applications) on particle physics using Flashcards
and Games created with the CramWeb application. In particular, the theory is presented in 6
INTERNATIONAL MULTIDISCIPLINARY PEER REFEREED JOURNAL DELIBERATIVE RESEARCH/Volume-47/Issue-47/July-Sept, 2020
[[41]]
thematic units (13 applications) followed by exercises in the form of quizzes, created with theQuizglobal tool, that test and enhance the understanding of the theory (13 applications).
7. Models and Artistic representations of the particle detector ATLAS (CERN) with arts and
crafts and using the technique ''shadow and light' ' .
8. Models of the Particle Detector CMS (CERN) created by the students made with the digital
tool Powtoon.9. Article on Wikipedia about the CMS exper iment.
10. Poems about CERN set to music and visualized (inspired by astrophysics and particle
physics). The Freinet technique was used for the creation of small books.
For more details and photos please visit the links:
1. CMS, LHC2. CERN
3. ATLAS DETECTOR
4. POEMS
5. Challenges-DifficultiesThe main challenge I had to face was related to the Greek curr iculum which does not
include modern physics. I had to redesign the syllabus and be innovative and creative. I used
mater ials that motivated my students’ creativity, such as Lego, clay, cardboards, etc. My
teaching style is creative and innovative. This is the reason why I promoted STEAM literacyin primary students by encouraging them to become ?out-of-the-box? thinkers and creators.
Another challenge was that I should teach particle physics to very young children
therefore I had to come up with activities suitable for their age and interests. New
technologies, such as 3D printers, made a significant contribution. Children were very
enthusiastic about science. A great outcome of the above-mentioned activities is theproduction of original audio-visual and digital material in the form of educational resources
about physics and, in particular, particle physics, in collaboration with my students. I think
this is a valuable material for a wide range of people. In addition, the context in which I teach
is a public primary school in an eastern suburb of Athens. The building and the infrastructure
are in terrible condition, which make my efforts even more difficult. In addition, I have todeal with underpr ivileged children of low socio-economic and educational status.
6. Evaluation of the program
The follow-up evaluation showed that teachers experienced higher science teaching
confidence, higher interest in physics and science in general and increased creativity. A greatmajority of teachers agreed that they implemented their knowledge and shared it with their
peers. (Alexopoulos et al 2018).The quantitative and qualitative data of tools including
questionnaires and student interviews verify the positive acceptance of the program by both
the students and the teachers who participated in it as well as by the parents. The contributionof the program to the connection of school knowledge with the needs, age, level and interests
of students as well as real social situations was considered to be particularly valuable.
Moreover, in this context, the creation of better relationships with all students and especially
those with particular learning, cultural and linguistic needs was promoted. In addition, the
‘Playing with Protons’ gave students the opportunity to develop general skills includingcollaboration, communication, creativity, problem-solving and presentation. Cross-curricular
and creative activities broke cultural stereotypes associated with science and scientists and
demonstrated the value of learning modern physics and science at an early age.
In addition, teachers and students developed initiative actions, cultivated critical and
creative thinking through methodologies related to a holistic and interdiscip linary approach toknowledge and the implementation of activities and projects at individual and group level
which increased students’ aspirations for science-related careers. The educational climate of
the schools that implemented the program was positively influenced and this contributed to
INTERNATIONAL MULTIDISCIPLINARY PEER REFEREED JOURNAL DELIBERATIVE RESEARCH/Volume-47/Issue-47/July-Sept, 2020
[[42]]
the promotion of creative cooperation between all involved in the educational process.Students were open and responsive to new and diverse perspectives, they demonstrated
originality and inventiveness in work, high order thinking and problem-solving skills and
they elaborated original ideas to improve and maximize creative efforts.It is noteworthy to mention that these projects have so far received 18 International
awards and for these projects I was selected among the best 50 teachers in the world with theGlobal Teacher Prize 2019. (Global Teacher Prize Finalists 2019)
Conclusions
The teaching implementations of the innovative "Playing with protons" program
described above have provided students with a variety of opportunities to unravel their latentcapabilities and broaden the perspectives through which they perceive the world and science.Designed teaching practices have mainly contributed to the students experimenting,
identifying and discovering their strong and weak intelligences, inclinations and talents.At the same time, the use of appropriate digital tools has created the prerequisites for
more efficient performance by students during the learning process, since the teaching worktailored to their individual profiles has led to the creative production of works along with the
acquisition of self-regulating learning and autonomy skills as well as cooperation andcommunication.
In conclusion, the implementation of the ?Playing with Protons? program in PrimaryEducation could be considered as contributing to the reforming of the teaching approach of
various cognitive subjects, to the creation of a multipurpose, experiential learning
environment, to the design of rich, polymorphic and multimodal courses and activities and tothe selection of flexible techniques and strategies. Through the philosophy on which this
innovative program is based, the students become more open towards science and society andthe role of the teacher is upgraded, which is the most important factor for the success of any
improvement in the education system.References
Alexopoulos et al. "Playing with Protons": a training course for primary school teachers at CERN,
Physics Education. 54, 2018
Alexopoulos, A. Nantsou, T. Playing with Protons, CREATIONS-Demonstrator; 2017,
http://cds.cern.ch/record/2258255/files/
Belden, N., Lien, C. and Nelson-Dusek, S. A Priority for California’s Future: Science for Students,Santa Cruz, CA: The Center for the Future of Teaching and Learning, 2010.
Bybee, R. W. The case for STEM education: challenges and opportunities. Arlington, VA: NSTAPress, 2013
CREATIONS EU project website http://creations-project.eu/
Daugherty, M. TheProspect of an “A” in STEM Education. University of Arkansas. Journal of STEMEducation Volume 14, Issue 2 April-June, 2013. Retrieved from: http://www.uastem.com/wp-content/uploads/2012/08/The-Prospect-of-an-A-in-STEM-Education.pdf
Dierking, L. D., & Falk, J. H. 2020 vision: envisioning a new generation of STEM learning research.Cultural Studies of Science Education, 11(1), 1–10, 2016.
Eshach, H., Fried, M. Should science be taught in early childhood? Journal of Science Education and
Technology. 14(3):315–336, 2005
Retrieved from https://link.springer.com/article/10.1007%2Fs10956-005-7198-9
Etkina, M. Millikan award lecture: students of physics—listeners, observers, or collaborative
participants in physics scientific practices? Am. J. Phys. 83 669–79, 2015
Falk, J. H., & Needham, M. D. Factors contributing to adult knowledge of science and technology.Journal of Research in Science Teaching, 50(4), 431–452, 2013
Falk, J. H., Dierking, L. D., Staus, N. L., Wyld, J. N., Bailey, D. L., &Penuel, W. R. The synergies
research–practice partnership project: a 2020 vision case study. Cultural Studies of Science Education,11(1), 195–212, 2016
Fernández-Manzanal, R., Rodríguez-Barreiro, L., &Carrasquer, J. Evaluation of environmentalattitudes: analysis and results of a scale applied to university students. Science Education, 91(6), 988–
1009, 2007
INTERNATIONAL MULTIDISCIPLINARY PEER REFEREED JOURNAL DELIBERATIVE RESEARCH/Volume-47/Issue-47/July-Sept, 2020

[[43]]
Foundation for Young Australians. The new work smarts: thriving in the new work order. Sydney:Foundation for Young Australians, 2017. Retrieved from. www.fya.org.au
Ryder, J. Identifying science understanding for functional scientific literacy, Studies in Science
Education, 36, 1–44, 2001
FRONTIERS EU project website http://www.frontiers-project.eu/team-member/ea/
Froschauer, L., Bringing STEM to the elementary classroom. Arlington.VA: NSTAPress; 2016.
Gardner, H. Intelligence reframed, Multiple Intelligences for the 21st century. New York: Basic Books;
1999
Global Teacher Prize Finalists 2019, Varkey Foundation.https://www.globalteacherprize.org/person?id=7484
Hajkowicz, S., Reeson, A., Rudd, L., Bratanova, A., Hodgers, L., Mason, C., &Boughen, N.,Tomorrow’s digitally enabled workforce: megatrends and scenarios for jobs and employment in
Australia over the coming years. Brisbane: CSIRO, 2016
Hofer, M., &Grandgenett, N. TPACK development in teacher education: a longitudinal study ofpreservice teachers in a secondaryM.A.Ed. program. Journal of Research on Technology in Education,
45(1), 83–106, 2012
Ioannidis S 2016 Greek teachers learn ABCs of particle physics at CERN.Kathimerini Newspaper(www.ekathimerini.com/212323) (Accessed: 25 September 2020)
CERN website, https://home.cern/about
Kurup, P. M., Li X., Powell G., Brown M., Building future primary teachers' capacityin STEM: basedon a platform of beliefs, understandings and intentions, International Journal of STEM Education.
6:10, 2019
Land, M. Full STEAM Ahead: The Benefits of Integrating the Arts Into STEM. Procedia Computer
Science 20, 547 – 552, 2013
http://www.sciencedirect.com/science/article/pii/S1877050913011174
Maslyk, J. STEAM makers: fostering creativity and innovation in the elementary classroom. ThousandOaks, CA: Corwin; 2016
Nadelson, L. S., Callahan, J., Pyke, P., Hay, A., Dance, M., &Pfi ester, J. Teacher STEM perceptionand preparation: Inquiry-based STEM professional development for elementary teachers. Journal ofEducational Research, 106(2), 157–168.Playing with protons; 2013. Playing with protons website
https://playprotons.web.cern.ch/
Prinsley, R., & Johnston, E. Transforming STEM teaching in Australianprimary schools: everybody’s
business. Canberra, Australia: AustralianGovernment.Office of the Chief Scientist, 2015
Retrieved fromhttps://stemeducationjournal.springeropen.com/articles/10.1186/s40594-019-0164-5
REINFORCE EU project website https://www.reinforceeu.eu/
Rowley, C., Cooper H. Cross-curricular Approaches to Teaching and Learning. SAGE Publications;
2009
Sousa, D., Pilecki T. From STEM to STEAM: using brain-compatible strategies to integrate the arts.Thousand Oaks, CA: Corwin; 2013
Trimoulla, A. Training course for eighteen teachers at CERN CERN Document Server, 2016http://cds.cern.ch/record/2131716 (Accessed: 25 September 2020),
Wilkins, J L M. Elementary school teachers’ attitudes toward different subjects Teach. Educ. 45 23–36,
2010
Note on the Contributor
Rania Lampou is an educator and a neuroeducation researcher currently working at
the Ministry of Education. She has a Postgraduate Degree on Language Teaching related to
cognitive neurosciences. She is also a STEM instructor and an ICT teacher trainer in Greece.She has been awarded 20 International prizes and she is a Global Teacher Prize finalist 2019
as well as a Varkey Foundation Teacher Ambassador. She is the founder of four international
projects that focus on the United Nations’ Sustainable Development Goals described in the
2030 Agenda.
INTERNATIONAL MULTIDISCIPLINARY PEER REFEREED JOURNAL DELIBERATIVE RESEARCH/Volume-47/Issue-47/July-Sept, 2020
[[44]]
Common Errors Encountered By Novice
Programmer
Pastor Arguelles Jr.Dean, College of Computer Studies
University Of Perpetual Help System DaltaPhilippines
Abstract
Writing correct codes may help Java programming students to become effective,efficient, and competent in writing codes in order to produce quality programs. This may also
be a helpful assessment of the current teaching and learning methods being used toeffectively educate students with the essential programming skills. This study looks and intothe level finding of common errors encountered by Java programming students which is thebasis for enhancement of a computer programming syllabus in College of Computer Studiesof Far Eastern University, Diliman. In this study, 425 students were selected from whichcame the total number of 206 respondents. The research made use of the descriptive methodto look into and assess the common errors encountered by Java programming students. Two-
way ANOVA and Slovin formula were used to determine significant difference betweenselected variables.
The following findings and conclusions were drawn: The most common and familiarprogramming languages among Java programming students were C/C++ and Visual BasicLanguages. On the other hand, the least familiar programming languages among Javaprogramming students are ASP.Net, PHP and C#.
Three definite categories of common errors that Java programming studentsencountered during debugging using Java programming with minimum or “average”
interference level as revealed by an overall mean value are arive here the errors.There are no significant differences were exhibited by respondents as regards to frequency oferrors and their age. But there are very significant differences in the errors encountered by
Java programming students when grouped by course and gender. These are revealed by thecomputed analysis of F-ratio.
Statement of the Problem
The study primarily focused on describing the experiences of students in learning Javaprogramming. Specifically, this study sought to answer the following questions:1. How familiar are the Java programming students with other programming languages?2. What are the common errors that the Java programming students encounter in Java
programming in syntax, identifier, computation, return statement, runtime errors and programexecution?
ISSN : 0976-1136
[[45]]
3. Is there a significant difference in the errors encountered by Java programmingstudents and the course, gender and age?4. What recommendations do faculty members teaching Java programming give to the
novice Java programming students?
Conceptual Framework
This study was conducted with the concept that after analyzing the syllabus used byfaculty members in JAVA programming and identifying the common errors encountered by
students, differences in errors encountered were tested to determine if they are significant or
not. After this, the syllabus used was enhanced in such a way that the errors encountered will
be lessened and JAVA programming skills of students will be strengthened.
INPUT ? PROCESS ? OUTPUT
Syllabusused in JAVA
Programming
Common errors
encountered by Javaprogrammers:1. syntax
2. identifier
3. computation4. return statement
5. runtime errors
6. program execution
Significant differences inthe errors encountered by
Java programming students
between:1. course2. gender
3. age
Enhanced syllabus inJAVA
programming
Enhanced
programming skills in Javaprogramming.
Research Design
The descriptive survey method of gathering data was used in this study. Good andScates (1954) defined descriptive investigation as a method to be used in research study,which includes all those that present facts concerning the nature and status of anything, a
group of persons, a number of objects, a set of conditions, a class of events, a system of
thought or any other kind of phenomena which one may wish to study. The term is
sometimes referred to as “status studies”. The descriptive method is a design that describesthe nature of a situation as it exists at the time of the study and to explore the course of the
phenomena. This method is used to discover facts on which professional judgment could be
based.
The data needed to draw conclusions relevant to the specific problems as cited inChapter I are systematically gathered using the questionnaire.Population Frame and Sampling Scheme
The initial step was to determine the total number of students enrolled under the
College of Computer Studies of Far Eastern University, Diliman and this amounted to 425.The next step was to determine the total number of respondents for this study whichcomprised of two hundred six (206) or 48.47% of the total.
Formula
Slovin's formula was used to calculate the sample size (n) given the population size (N) and a
margin of error (e). It is computed as n =N / (1+Ne2). Slovin's formula is written as:n = N / (1 + Ne^2)
n = Number of samples N = Total population
e = Error tolerance
INTERNATIONAL MULTIDISCIPLINARY PEER REFEREED JOURNAL DELIBERATIVE RESEARCH/Volume-47/Issue-47/July-Sept, 2020
[[46]]
425 x 48.47% = 205.99 or 206, rounded for convenience. The names of the studentsunder the College of Computer Studies of Far Eastern University, Diliman were written in a
piece of paper, mixed thoroughly in a regular box container ready for convenience to servethe purpose. There were two hundred six (206) individuals drawn by chance. Those
individuals whose names were on the piece of paper were considered the sample of this study.
Description of RespondentsThe respondents are distributed as follows: 87 from the Bachelor of Science in
Computer Science and 338 from the Bachelor of Science in Information Technology.
The following data describe the profile of the respondents.
Table 1 presents the distribution of the respondents by course its frequency and percentage.
Table 1. Distribution of Respondents by Course
Course
Total Population
Sample Percentage Rank
BSCS 87 32 15.53 2
BSIT 338 174 84.47 1
Total 425 206 100.00
The following important recommendations were given by the faculty to lessen problems
encountered by Java programming students:Rank 1. Additional supplementary hands on activities (8 or 100%)
Rank 2 Course syllabus enhancements (7 or 87.5%)
Rank 3 Development of testing and debugging tool (6 or 75%)
Rank 4 Insertion of related activities in the syllabus (5 or 62.5%)Rank 5 Assessment of the skills in structured programming (4 or 50%)
Rank 6 Improvement of the analysis of the errors made (3 or 37.5%)
Rank 7 Development of problem solving skills and cognitive foundations (2 or 25%)
Rank 8 Extension the chances in recognizing the right coding convention (1 or 12.5%)
References:Herbert Schildt, JAVA: ABeginner’s Guide, 4th Ed., MC Graw-Hill Professional, 2015
Piotr Nienaltowski, BertrandMeyer, Jonathan S. Ostroff. Contracts for concurrency. Formal ASP
Computer, 2009
Jakob Nielsen, Usability Engineering. Bell Communications Research, 1994
James Gosling, Bill Joy, Guy Steele, Gilad Bracha. Java Language Specification: Addison WesleyProfessional, June 14, 2015
Elliotte Rusty Harold. Java I/OO’Really, May 2006
Ken Arnold, James Gosling, David Holmes. The Java Programming Language Addison WesleyProfessional, August 17, 2015
http://antiquity.ac.uk/projgall/kuhne http://velorum.ballarat.edu.au/~kturville/kyliePeggHonours.pdfhttp://www.cl.cam.ac.uk/teaching/1011/R201/ppig-book/ch3-2.pdf http://wwww.citeseerx.ist.psu.edu
http://www.krepublishers.com/02-Journals/JSS/JSS-27-0-000-11-Web/JSS-27- 1-000-11-Abst-
PDF/JSS-27-1-007-11-1147-Wadesango-N/JSS-27-1-007-11-
1147-Wadesango-N-Tt.pdf
INTERNATIONAL MULTIDISCIPLINARY PEER REFEREED JOURNAL DELIBERATIVE RESEARCH/Volume-47/Issue-47/July-Sept, 2020
[[47]]
Data Envelopment Analysis and Its Application
in Agricultural Economics Research* **
*Shreeshail Rudrapuraand **Worakamol Wisetsri
b
a Assistant Professor, Dept. of Agricultural Economics, COA, NAU, Waghai (Dangs),
Gujarat 394730, India
b Associate Professor, Dept. of Social Sciences, Applied Arts, King Mongkut’s University of
TechnologyNorth Bangkok-1518, Pracharat 1 Road, Wongsawang, Bangsue, Bangkok10800, Thailand.
Introduction:Technical efficiency of a farm can be defined as the ability of the farm to obtain the
maximum possible output with a specified endowment of inputs given the technology and
environmental conditions surrounding the farm. The production frontier is defined as thefunction that describes the greatest possible (frontier) output from a given combination of
inputs. Therefore, failure to operate on the production frontier is Technical inefficiency. The
Cobb-Douglas (C-D) functional form was generally preferred because of its known
advantages. In principle Cobb-Douglas production function does not distinguish between the
technical efficiency and allocative efficiency. It ignores the problem of technical efficiencyby assuming the same technique of production for the entire sample farms and as such each
sample farmer achieves perfect technical efficiency.
The estimation of production frontiers has proceeded on two general paths-
deterministic and stochastic. In deterministic production frontier model, output is assumed to
be bound from above by a deterministic production function so that all deviations from thefrontier are attributed to inefficiency; the one sided error component which is assumed to be
under the control of the farm. In a stochastic production frontier model, output is assumed to
be bound by a stochastic frontier where disturbance term consists of two components – one
component representing one sided, which captures random effects outside the control of thedecision maker.
Farell (1957) made the earlier pioneering contribution under deterministic approach.
He proposed that the efficiency of a firm could consist of two components: Technical
efficiency, which reflects the ability of a firm to produce maximum output from a given set ofinputs, and allocative efficiency, which reflects the ability of a firm to use the inputs in
optimal proportions, given their respective prices and production technology. When a firm is
technically efficient, the maximum output is generated from a combination of inputs.
An allocatively efficient firm should produce output using the lowest cost
combination of inputs. Therefore, technical efficiency illustrates a comparison of actualoutput and the maximum output, while allocative efficiency deals with relation between the
ISSN : 0976-1136
[[48]]
minimum cost and actual cost and helps to identify the extent to which the cost to be reducedfor production of the same quantity of output. These two measures are then combined to
produce a measure of total economic efficiency (also termed as Overall Efficiency) (Coelli,
Rao and Battese, 1998).
Following Farell (1957), Aigner and Chu (1968) and Timmer (1971) extended this
deterministic frontier approach. According to Timmer, the technical efficiency of the farm isthe ratio of actual output (Y) to the frontier output (Y*), given the input use level. Later
Aigner, Meeusen and Broek (1977) independently developed the stochastic frontier approach
to measure technical efficiency.
Despite the extension and development of stochastic frontier approach, the
deterministic frontier approach, was later generalized to multiple outputs and reformulated asa mathematical programming problems by Charnes, Cooper and Rhodes (CCR),(1978, 1979,
1981) thus initiating the mathematical programming approach to efficiency measurement,
known as Data Envelopment Analysis (DEA). The CCR model which uses constant returns
to scale, however the assumption of constant returns to scale is that the firm is operating at itsoptimal size. In practice this may not be the case and Banker, Charnes and Cooper (1984),
proposed a variable returns to scale (VRS) specification (for an input – orientation), known as
the BCC model. It is imposed a ‘convexity constraint’ onto the CCR model. (Gupta et al,
2006).
Data Envelopment AnalysisThe deterministic, nonparametric approach that developed out of mathematical
programming to measure efficiency is known as data envelopment analysis (DEA), while the
parametric approach which uses a stochastic production, cost, or profit function to estimate
efficiency is called the stochastic frontier approach (SFA).Data Envelopment Analysis (DEA) is a Linear Programming methodology to measure
the efficiency of multiple Decision Making Units (DMUs) when the production process
presents a structure of multiple inputs and outputs. DEA is commonly used to evaluate the
efficiency of a number of producers.
A typical statistical approach is characterized as a central tendency approach and itevaluates producers relative to an average producer. In contrast, DEA is an extreme point
method and compares each producer with only the "best" producers. By the way, in the DEA
literature, a producer is usually referred to as a decision making unit or DMU. Extreme point
methods are not always the right tool for a problem but are appropriate in certain cases.The concept of efficiency as it applies to Decision Making Units (DMUs), solutions,
alternatives plays an important role both in Data Envelopment Analysis (DEA) and Multiple
Objective Linear Programming (MOLP). Despite this and other apparent similarities, DEA
and MOLP research has developed separately. We show that structurally the DEAformulation to identify efficient units is quite similar to the MOLP model based on the
reference point or the reference direction approach to generate efficient solutions. DEA and
MOLP should not be seen as substitutes, but rather as complements. We show that they
cross-fertilize each other. MOLP provides interesting extensions to DEA and DEA provides
new areas of application to MOLP.DEA is a non parametric Linear programming approach to measure the efficiency of
number of producers where as the Frontier production approach is a parametric approach.
Since DEA is a deterministic approach it does not include the error component while Frontier
analysis can be a stochastic approach and includes the random error term.
AssumptionA fundamental assumption behind an extreme point method is that if a given
producer, A, is capable of producing Y (A) units of output with X (A) inputs, then other
producers should also be able to do the same if they were to operate efficiently. Similarly, if
INTERNATIONAL MULTIDISCIPLINARY PEER REFEREED JOURNAL DELIBERATIVE RESEARCH/Volume-47/Issue-47/July-Sept, 2020
[[49]]
producer B is capable of producing Y (B) units of output with X (B) inputs, then otherproducers should also be capable of the same production schedule. Producers A, B and otherscan then be combined to form a composite producer with composite inputs and compositeoutputs. Since this composite producer does not necessarily exist, it is sometimes called avirtual producer.
The heart of the analysis lies in finding the "best" virtual producer for each realproducer. If the virtual producer is better than the original producer by either making more
output with the same input or making the same output with less input then the originalproducer is inefficient.Applications
DEA has been applied in many situations such as: Agricultural Production Economics health care (hospitals, doctors)
education (schools, universities) banks manufacturing benchmarking management evaluation fast food restaurants and Retail stores.
Issues Measurement of efficiency levels. identification of best practice identification of poor practice target setting resource allocation monitoring efficiency changes over time
Advantages of DEA
DEA can handle multiple input and multiple output models. It doesn't require an assumption of a functional form relating inputs to outputs. DMUs are directly compared against a peer or combination of peers. Inputs and outputs can have very different units.
Disadvantages of DEAThe same characteristics that make DEA a powerful tool can also create problems. An
analyst should keep these limitations in mind when choosing whether or not to use DEA. Since DEA is an extreme point technique, noise (even symmetrical noise with zeromean) such as measurement error can cause significant problems. DEA is good at estimating "relative" efficiency of a DMU but it converges veryslowly to "absolute" efficiency. In other words, it can tell you how well you are doingcompared to your peers but not compared to a "theoretical maximum."
Since DEA is a nonparametric technique, statistical hypothesis tests are difficult andare the focus of ongoing research. Since a standard formulation of DEA creates a separate linear program for eachDMU, large problems can be computationally intensive.(www.etm.pdx.edu/dea/homedea.html)
Dea Formulation
DEA can be formulated in different ways depending on what problem one is focusingon. To measure Technical Efficiency we have two forms of DEA: Output Oriented and Input
oriented. To measure the Cost (Economic) efficiency a cost minimization form of DEA isavailable.
INTERNATIONAL MULTIDISCIPLINARY PEER REFEREED JOURNAL DELIBERATIVE RESEARCH/Volume-47/Issue-47/July-Sept, 2020
[[50]]
In the input-oriented case, the DEA method defines the frontier by seeking themaximum possible proportional reduction in input usage, with output levels held constant, for
each DMU. While, in the output oriented case, the DEA method seeks the maximum
proportional increase in output production, with input levels held fixed. The two measuresprovide the same technical efficiency scores when constant returns to scale (CRS) technology
is applied, but are unequal when variable returns to scale (VRS) is assumed. The procedurefor finding the best virtual producer can be formulated as linear program. Analyzing the
efficiency of ‘n’ producers is then a set of ‘n’ linear programming problems.
DEA Input-Oriented Primal Formulation
0,
0
.,
0
0
XX
YYst
Min
Where,
Y0 is a Mx1 vector ofM output quantities for the i-th producerX0 is a Kx1 vector of K input quantities for the i-th producer
Y is a MxN matrix ofM output quantities for all N producers
X is a KxN matrix of K input quantities for all N producers
is a Nx1 vector of weights; and is a scalar
is a vector describing the percentages of other producers used to construct thevirtual producer. X and Y and are the input and output vectors for the analyzed producer.
Therefore X and Y describe the virtual inputs and outputs respectively. The value of is the
producer's technical efficiency.
Sample Applications
DEA is commonly applied in the electric utilities sector. For instance a government
authority can choose Data Envelope Analysis as their measuring tool to design anindividualized regulatory rate for each firm based on their comparative efficiency. The input
components would include man-hours, losses, capital (lines and transformers only), and
goods and services. The output variables would include number of customers, energy
delivered, length of lines, and degree of coastal exposure. (Berg 2010) DEA is also regularlyused to assess the efficiency of public and not-for-profit organizations, e.g. hospitals (Kuntz,
Scholtes & Vera 2007; Kuntz & Vera 2007; Vera & Kuntz 2007) or police forces
(Thanassoulis 1995; Sun 2002; Aristovnik et al. 2012).
ExampleIn the DEA methodology, formally developed by Charnes, Cooper and Rhodes
(1978), efficiency is defined as a ratio of weighted sum of outputs to a weighted sum of
inputs, where the weights structure is calculated by means of mathematical programming and
constant returns to scale (CRS) are assumed. In 1984, Banker, Charnes and Cooper developed
a model with variable returns to scale (VRS).Assume that we have the following data:
Unit 1 produces 100 pieces of items per day, and the inputs are 10 dollars of materials
and 2 labour-hours
Unit 2 produces 80 pieces of items per day, and the inputs are 8 dollars of materials
and 4 labour-hoursUnit 3 produces 120 pieces of items per day, and the inputs are 12 dollars of materials
and 1.5 labour-hours
To calculate the efficiency of unit 1, we define the objective function as
maximize efficiency = (u1 × 100) / (v1 × 10 + v2 × 2)which is subject to all efficiency of other units (efficiency cannot be larger than 1):
INTERNATIONAL MULTIDISCIPLINARY PEER REFEREED JOURNAL DELIBERATIVE RESEARCH/Volume-47/Issue-47/July-Sept, 2020

[[51]]
subject to the efficiency of unit 1: (u1 × 100) / (v1 × 10 + v2 × 2) = 1subject to the efficiency of unit 2: (u2 * 80) / (v1 * 8 + v2 * 4) = 1
subject to the efficiency of unit 3: (u3 * 120) / (v1 * 12 + v2 * 1.5) = 1
and non-negativity:
all u and v = 0.
But since linear programming cannot handle fraction, we need to transform the formulation,such that we limit the denominator of the objective function and only allow the linearprogramming to maximize the numerator.
So the new formulation would be:
maximize Efficiency = u1 * 100
subject to the efficiency of unit 1: (u1 * 100) - (v1 * 10 + v2 * 2) = 0subject to the efficiency of unit 2: (u2 * 80) - (v1 * 8 + v2 * 4) = 0
subject to the efficiency of unit 3: (u3 * 120) - (v1 * 12 + v2 * 1.5) = 0
subject to v1 * 10 + v2 * 2 = 1
all u and v = 0.It should be emphasized that an LP of this form must be solved for each of the DMUs.
There are other ways to formulate this problem such as the ratio approach or the dual
problem. The first constraint forces the virtual DMU to produce at least as many outputs as
the studied DMU. The second constraint finds out how much less input the virtual DMU
would need. Hence, it is called input-oriented. The factor used to scale back the inputs is
and this value is the efficiency of the DMU.
An output – oriented DEAmodel
0,
0
0.,
Xx
Yyst
Max
i
i
Where,
yi is a Mx1 vector of M output quantities for the i-th producer
xi is a Kx1 vector of K input quantities for the i-th producer
Y is a MxN matrix ofM output quantities for all N producersX is a KxN matrix of K input quantities for all N producers
is a Nx1 vector of weights; and
is a scalar
One should observe that will take a value greater than or equal to one.1defines a
technical efficiency (TE) score which varies between 0 and 1. The above LP is solved N
times- once for each producer in the sample. Each LP produces a and a vector. The -
parameter provides information on the TE score for the ith – producer and the vectorprovides information on the peers of the (inefficient) ith – producer. The peers of the ith –
producer are those efficient producers that define the facet of the frontier against which the
(inefficient) ith – producer is projected.
DEAusing Linear Programming
Data Envelopment Analysis is a linear programming procedure for a frontier analysis ofinputs and outputs. DEA assigns a score of 1 to a unit only when comparisons with other
relevant units do not provide evidence of inefficiency in the use of any input or output. DEA
assigns an efficiency score less than one to (relatively) inefficient units from the sample could
produce the same vector of outputs using a smaller vector of inputs. The score reflects the
radial distance from the estimated production frontier to the DMU under consideration. DEA
INTERNATIONAL MULTIDISCIPLINARY PEER REFEREED JOURNAL DELIBERATIVE RESEARCH/Volume-47/Issue-47/July-Sept, 2020
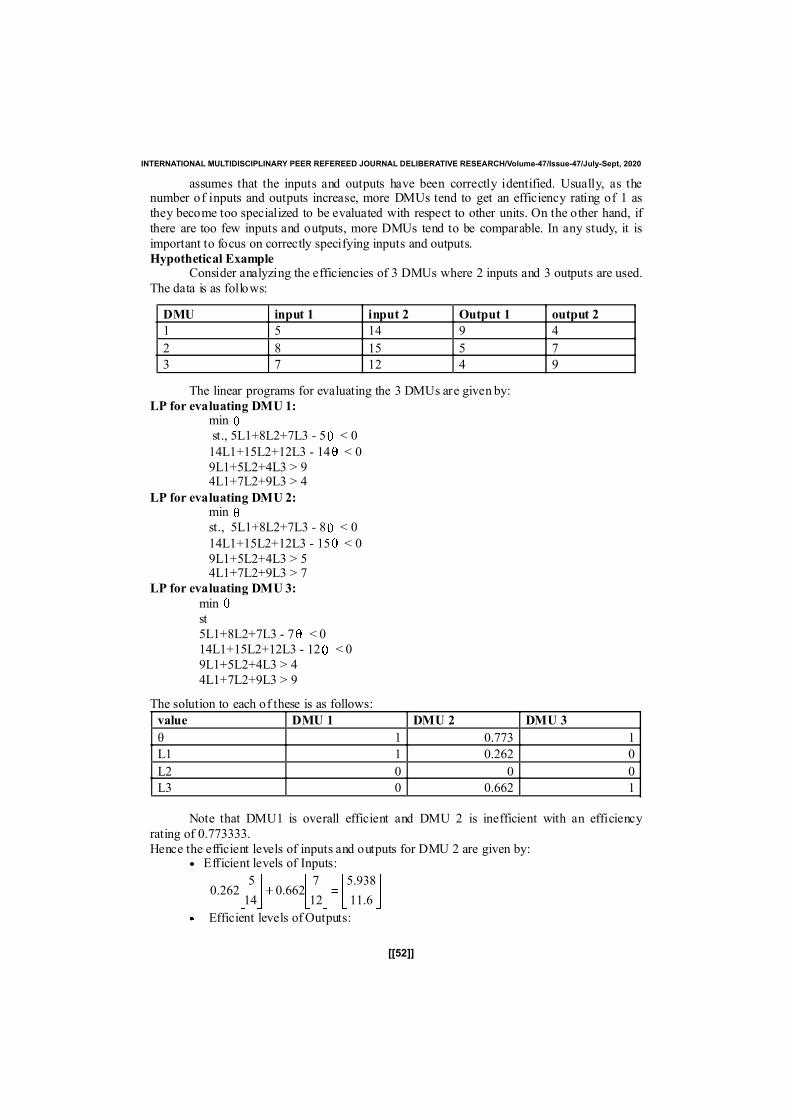
[[52]]
assumes that the inputs and outputs have been correctly identified. Usually, as thenumber of inputs and outputs increase, more DMUs tend to get an efficiency rating of 1 asthey become too specialized to be evaluated with respect to other units. On the other hand, if
there are too few inputs and outputs, more DMUs tend to be comparable. In any study, it is
important to focus on correctly specifying inputs and outputs.Hypothetical Example
Consider analyzing the efficiencies of 3 DMUs where 2 inputs and 3 outputs are used.
The data is as follows:
DMU input 1 input 2 Output 1 output 2
1 5 14 9 4
2 8 15 5 7
3 7 12 4 9
The linear programs for evaluating the 3 DMUs are given by:
LP for evaluating DMU 1:min
st., 5L1+8L2+7L3 - 5 < 0
14L1+15L2+12L3 - 14 < 0
9L1+5L2+4L3 > 94L1+7L2+9L3 > 4
LP for evaluating DMU 2:min
st., 5L1+8L2+7L3 - 8 < 0
14L1+15L2+12L3 - 15 < 0
9L1+5L2+4L3 > 54L1+7L2+9L3 > 7
LP for evaluating DMU 3:
min
st
5L1+8L2+7L3 - 7 < 014L1+15L2+12L3 - 12 < 0
9L1+5L2+4L3 > 4
4L1+7L2+9L3 > 9
The solution to each of these is as follows:
value DMU 1 DMU 2 DMU 3
θ 1 0.773 1
L1 1 0.262 0
L2 0 0 0
L3 0 0.662 1
Note that DMU1 is overall efficient and DMU 2 is inefficient with an efficiency
rating of 0.773333.Hence the efficient levels of inputs and outputs for DMU 2 are given by:
Efficient levels of Inputs:
6.11
938.5
12
7662.0
14
5262.0
Efficient levels of Outputs:
INTERNATIONAL MULTIDISCIPLINARY PEER REFEREED JOURNAL DELIBERATIVE RESEARCH/Volume-47/Issue-47/July-Sept, 2020
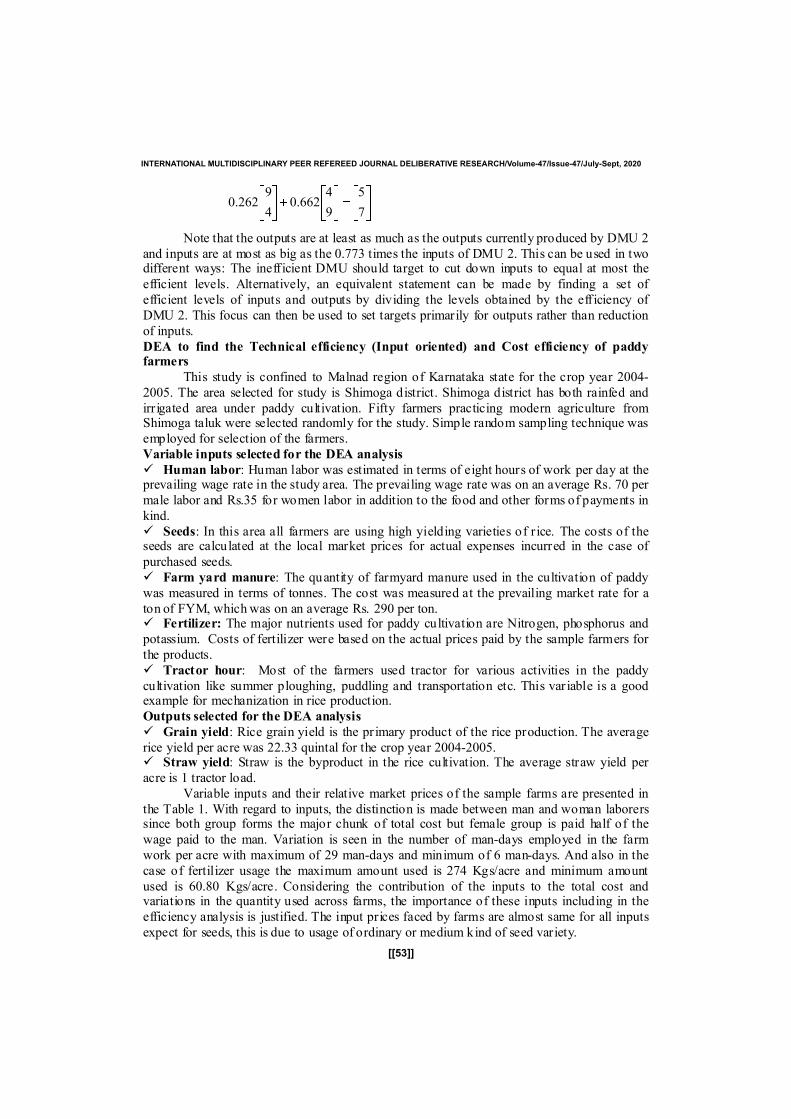
[[53]]
Note that the outputs are at least as much as the outputs currently produced by DMU 2
and inputs are at most as big as the 0.773 times the inputs of DMU 2. This can be used in twodifferent ways: The inefficient DMU should target to cut down inputs to equal at most the
efficient levels. Alternatively, an equivalent statement can be made by finding a set of
efficient levels of inputs and outputs by dividing the levels obtained by the efficiency of
DMU 2. This focus can then be used to set targets primarily for outputs rather than reduction
of inputs.
DEA to find the Technical efficiency (Input oriented) and Cost efficiency of paddyfarmers
This study is confined to Malnad region of Karnataka state for the crop year 2004-
2005. The area selected for study is Shimoga district. Shimoga district has both rainfed and
irrigated area under paddy cultivation. Fifty farmers practicing modern agriculture fromShimoga taluk were selected randomly for the study. Simple random sampling technique was
employed for selection of the farmers.
Variable inputs selected for the DEA analysis
Human labor: Human labor was estimated in terms of eight hours of work per day at theprevailing wage rate in the study area. The prevailing wage rate was on an average Rs. 70 per
male labor and Rs.35 for women labor in addition to the food and other forms of payments in
kind.
Seeds: In this area all farmers are using high yielding varieties of rice. The costs of theseeds are calculated at the local market prices for actual expenses incurred in the case of
purchased seeds.
Farm yard manure: The quantity of farmyard manure used in the cultivation of paddy
was measured in terms of tonnes. The cost was measured at the prevailing market rate for a
ton of FYM, whichwas on an average Rs. 290 per ton. Fertilizer: The major nutrients used for paddy cultivation are Nitrogen, phosphorus and
potassium. Costs of fertilizer were based on the actual prices paid by the sample farmers for
the products.
Tractor hour: Most of the farmers used tractor for various activities in the paddy
cultivation like summer ploughing, puddling and transportation etc. This variable is a goodexample for mechanization in rice production.
Outputs selected for the DEA analysis
Grain yield: Rice grain yield is the primary product of the rice production. The average
rice yield per acre was 22.33 quintal for the crop year 2004-2005. Straw yield: Straw is the byproduct in the rice cultivation. The average straw yield per
acre is 1 tractor load.
Variable inputs and their relative market prices of the sample farms are presented in
the Table 1. With regard to inputs, the distinction is made between man and woman laborerssince both group forms the major chunk of total cost but female group is paid half of the
wage paid to the man. Variation is seen in the number of man-days employed in the farm
work per acre with maximum of 29 man-days and minimum of 6 man-days. And also in the
case of fertilizer usage the maximum amount used is 274 Kgs/acre and minimum amount
used is 60.80 Kgs/acre. Considering the contribution of the inputs to the total cost andvariations in the quantity used across farms, the importance of these inputs including in the
efficiency analysis is justified. The input prices faced by farms are almost same for all inputs
expect for seeds, this is due to usage of ordinary or medium kind of seed variety.
7
5
9
4662.0
4
9262.0
INTERNATIONAL MULTIDISCIPLINARY PEER REFEREED JOURNAL DELIBERATIVE RESEARCH/Volume-47/Issue-47/July-Sept, 2020
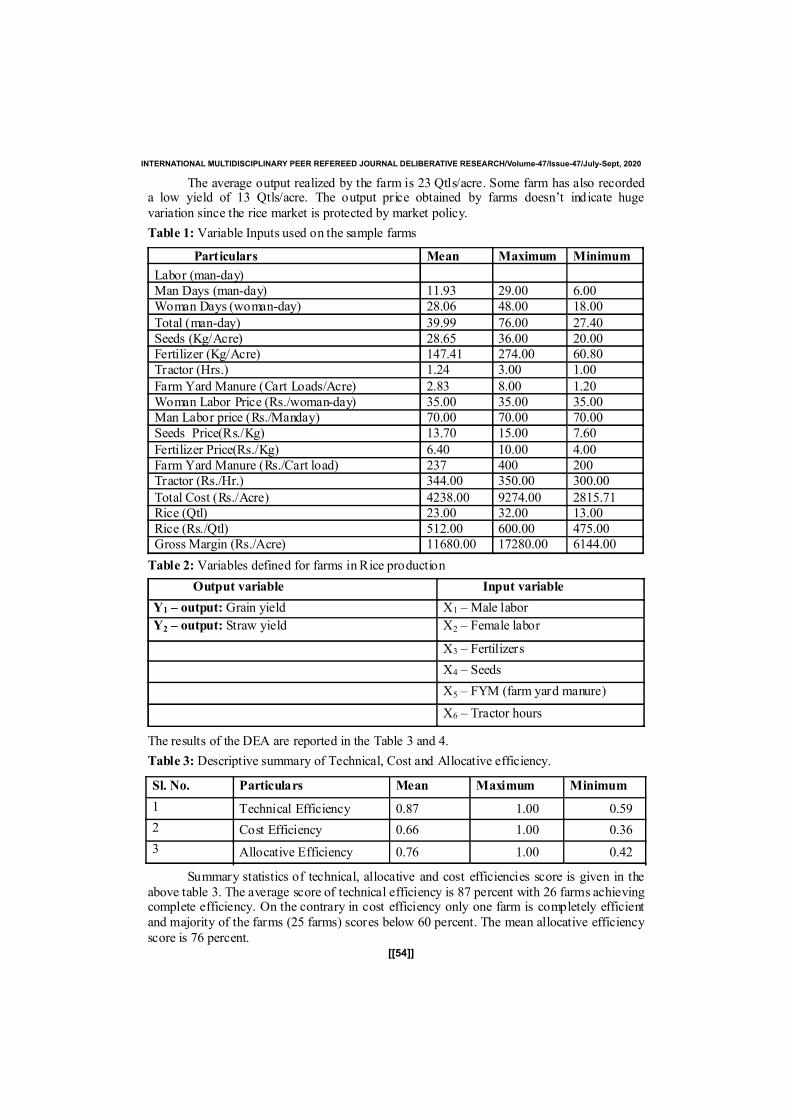
[[54]]
The average output realized by the farm is 23 Qtls/acre. Some farm has also recordeda low yield of 13 Qtls/acre. The output price obtained by farms doesn’t indicate huge
variation since the rice market is protected by market policy.
Table 1: Variable Inputs used on the sample farms
Particulars Mean Maximum Minimum
Labor (man-day)Man Days (man-day) 11.93 29.00 6.00
Woman Days (woman-day) 28.06 48.00 18.00
Total (man-day) 39.99 76.00 27.40
Seeds (Kg/Acre) 28.65 36.00 20.00Fertilizer (Kg/Acre) 147.41 274.00 60.80
Tractor (Hrs.) 1.24 3.00 1.00
Farm Yard Manure (Cart Loads/Acre) 2.83 8.00 1.20
Woman Labor Price (Rs./woman-day) 35.00 35.00 35.00Man Labor price (Rs./Manday) 70.00 70.00 70.00
Seeds Price(Rs./Kg) 13.70 15.00 7.60
Fertilizer Price(Rs./Kg) 6.40 10.00 4.00
Farm Yard Manure (Rs./Cart load) 237 400 200Tractor (Rs./Hr.) 344.00 350.00 300.00
Total Cost (Rs./Acre) 4238.00 9274.00 2815.71Rice (Qtl) 23.00 32.00 13.00
Rice (Rs./Qtl) 512.00 600.00 475.00Gross Margin (Rs./Acre) 11680.00 17280.00 6144.00
Table 2: Variables defined for farms inRice production
Output variable Input variable
Y1 – output: Grain yield X1 – Male labor
Y2 – output: Straw yield X2 – Female labor
X3 – Fertilizers
X4 – Seeds
X5 – FYM (farm yard manure)
X6 – Tractor hours
The results of the DEA are reported in the Table 3 and 4.
Table 3: Descriptive summary of Technical, Cost and Allocative efficiency.
Sl. No. Particulars Mean Maximum Minimum
1 Technical Efficiency 0.87 1.00 0.59
2 Cost Efficiency 0.66 1.00 0.36
3 Allocative Efficiency 0.76 1.00 0.42
Summary statistics of technical, allocative and cost efficiencies score is given in theabove table 3. The average score of technical efficiency is 87 percent with 26 farms achievingcomplete efficiency. On the contrary in cost efficiency only one farm is completely efficientand majority of the farms (25 farms) scores below 60 percent. The mean allocative efficiency
score is 76 percent.
INTERNATIONAL MULTIDISCIPLINARY PEER REFEREED JOURNAL DELIBERATIVE RESEARCH/Volume-47/Issue-47/July-Sept, 2020
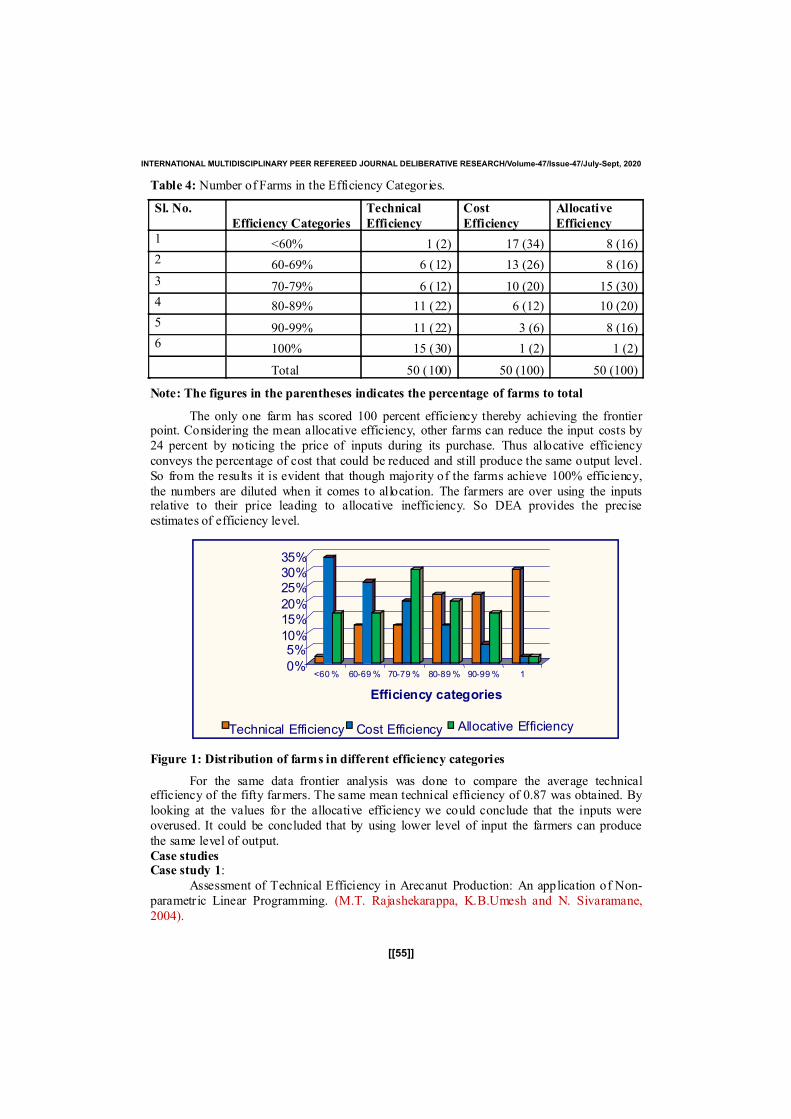
[[55]]
Table 4: Number of Farms in the Efficiency Categories.
Sl. No.
Efficiency Categories
Technical
Efficiency
Cost
Efficiency
Allocative
Efficiency
1 <60% 1 (2) 17 (34) 8 (16)
2 60-69% 6 (12) 13 (26) 8 (16)
3 70-79% 6 (12) 10 (20) 15 (30)
4 80-89% 11 (22) 6 (12) 10 (20)
5 90-99% 11 (22) 3 (6) 8 (16)6 100% 15 (30) 1 (2) 1 (2)
Total 50 (100) 50 (100) 50 (100)
Note: The figures in the parentheses indicates the percentage of farms to total
The only one farm has scored 100 percent efficiency thereby achieving the frontierpoint. Considering the mean allocative efficiency, other farms can reduce the input costs by24 percent by noticing the price of inputs during its purchase. Thus allocative efficiency
conveys the percentage of cost that could be reduced and still produce the same output level.So from the results it is evident that though majority of the farms achieve 100% efficiency,
the numbers are diluted when it comes to allocation. The farmers are over using the inputsrelative to their price leading to allocative inefficiency. So DEA provides the preciseestimates of efficiency level.
Figure 1: Distribution of farms in different efficiency categories
For the same data frontier analysis was done to compare the average technicalefficiency of the fifty farmers. The same mean technical efficiency of 0.87 was obtained. By
looking at the values for the allocative efficiency we could conclude that the inputs wereoverused. It could be concluded that by using lower level of input the farmers can produce
the same level of output.Case studiesCase study 1:
Assessment of Technical Efficiency in Arecanut Production: An application of Non-parametr ic Linear Programming. (M.T. Rajashekarappa, K.B.Umesh and N. Sivaramane,
2004).
0%
5%10%
15%20%
25%30%35%
<60% 60-69% 70-79% 80-89% 90-99% 1
Efficiency categories
Technical Efficiency Cost Efficiency Allocative Efficiency
INTERNATIONAL MULTIDISCIPLINARY PEER REFEREED JOURNAL DELIBERATIVE RESEARCH/Volume-47/Issue-47/July-Sept, 2020
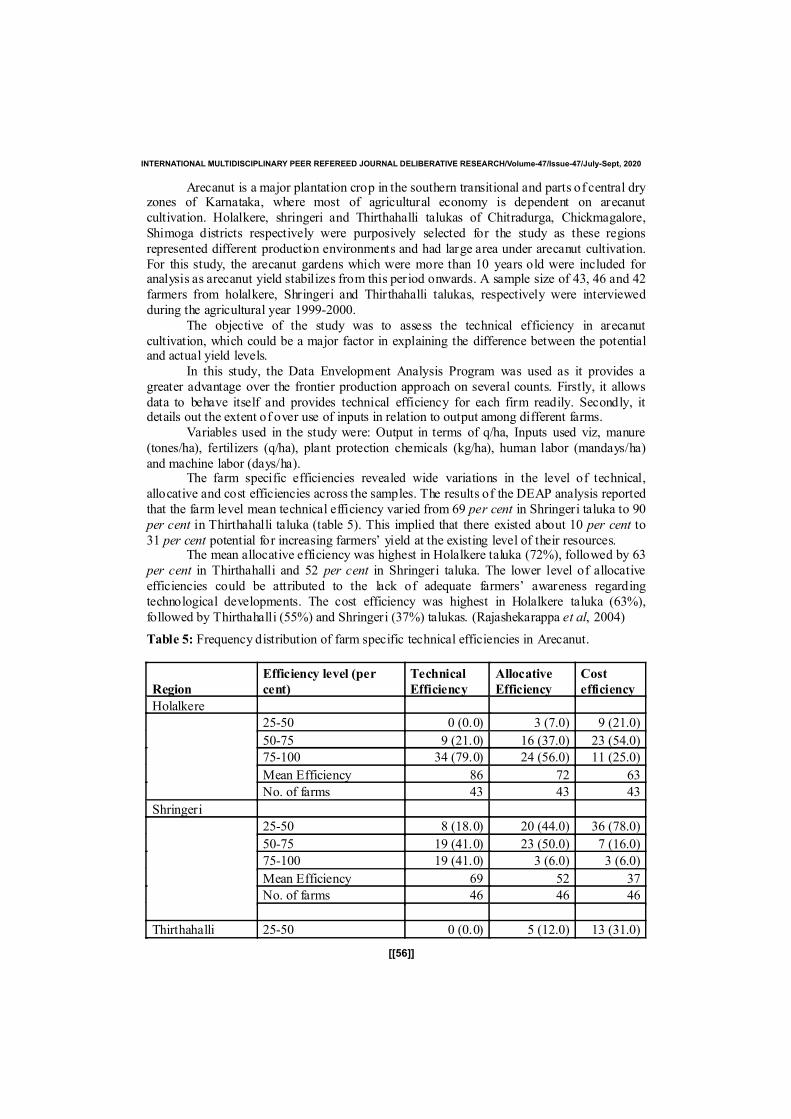
[[56]]
Arecanut is a major plantation crop in the southern transitional and parts of central dryzones of Karnataka, where most of agricultural economy is dependent on arecanutcultivation. Holalkere, shringeri and Thirthahalli talukas of Chitradurga, Chickmagalore,
Shimoga districts respectively were purposively selected for the study as these regions
represented different production environments and had large area under arecanut cultivation.For this study, the arecanut gardens which were more than 10 years old were included foranalysis as arecanut yield stabilizes from this period onwards. A sample size of 43, 46 and 42
farmers from holalkere, Shringeri and Thirthahalli talukas, respectively were interviewedduring the agricultural year 1999-2000.
The objective of the study was to assess the technical efficiency in arecanutcultivation, which could be a major factor in explaining the difference between the potentialand actual yield levels.
In this study, the Data Envelopment Analysis Program was used as it provides agreater advantage over the frontier production approach on several counts. Firstly, it allows
data to behave itself and provides technical efficiency for each firm readily. Secondly, itdetails out the extent of over use of inputs in relation to output among different farms.
Variables used in the study were: Output in terms of q/ha, Inputs used viz, manure
(tones/ha), fertilizers (q/ha), plant protection chemicals (kg/ha), human labor (mandays/ha)
and machine labor (days/ha).The farm specific efficiencies revealed wide variations in the level of technical,
allocative and cost efficiencies across the samples. The results of the DEAP analysis reportedthat the farm level mean technical efficiency varied from 69 per cent in Shringeri taluka to 90
per cent in Thirthahalli taluka (table 5). This implied that there existed about 10 per cent to
31 per cent potential for increasing farmers’ yield at the existing level of their resources.The mean allocative efficiency was highest in Holalkere taluka (72%), followed by 63
per cent in Thirthahalli and 52 per cent in Shringeri taluka. The lower level of allocative
efficiencies could be attributed to the lack of adequate farmers’ awareness regardingtechnological developments. The cost efficiency was highest in Holalkere taluka (63%),
followed by Thirthahalli (55%) and Shringeri (37%) talukas. (Rajashekarappa et al, 2004)
Table 5: Frequency distribution of farm specific technical efficiencies in Arecanut.
Region
Efficiency level (per
cent)
Technical
Efficiency
Allocative
Efficiency
Cost
efficiency
Holalkere
25-50 0 (0.0) 3 (7.0) 9 (21.0)
50-75 9 (21.0) 16 (37.0) 23 (54.0)
75-100 34 (79.0) 24 (56.0) 11 (25.0)
Mean Efficiency 86 72 63
No. of farms 43 43 43
Shringeri
25-50 8 (18.0) 20 (44.0) 36 (78.0)
50-75 19 (41.0) 23 (50.0) 7 (16.0)
75-100 19 (41.0) 3 (6.0) 3 (6.0)
Mean Efficiency 69 52 37
No. of farms 46 46 46
Thirthahalli 25-50 0 (0.0) 5 (12.0) 13 (31.0)
INTERNATIONAL MULTIDISCIPLINARY PEER REFEREED JOURNAL DELIBERATIVE RESEARCH/Volume-47/Issue-47/July-Sept, 2020
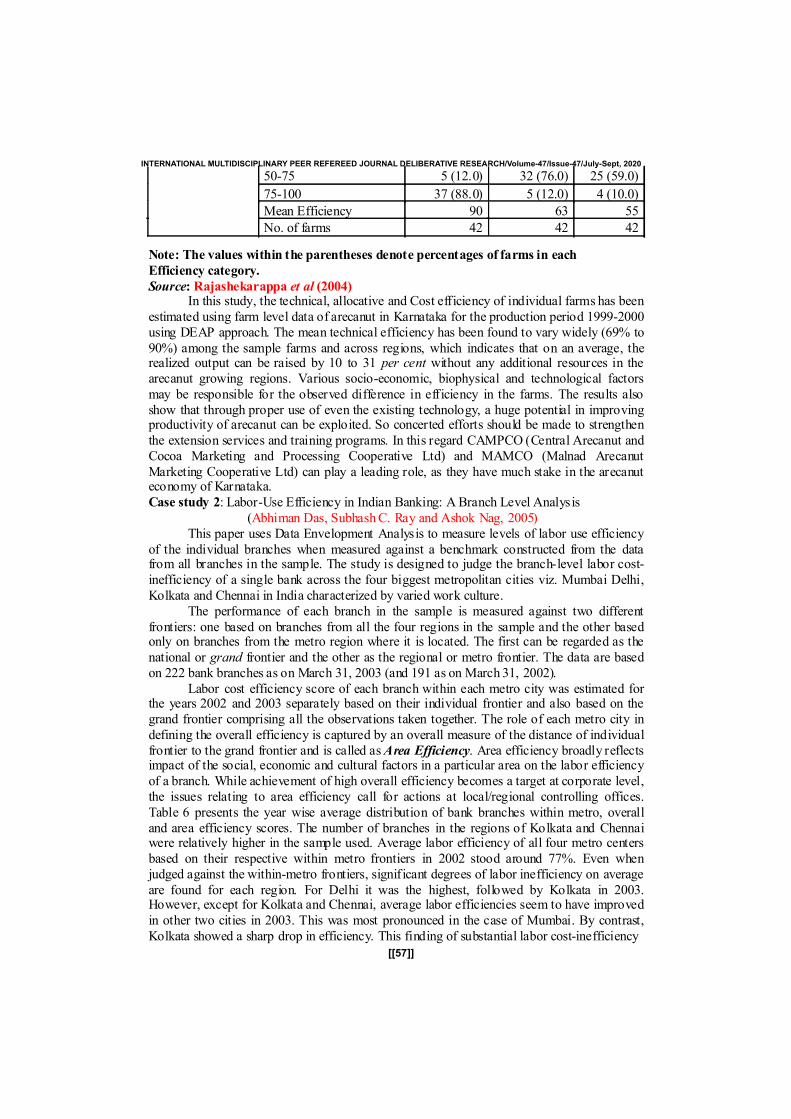
[[57]]
50-75 5 (12.0) 32 (76.0) 25 (59.0)
75-100 37 (88.0) 5 (12.0) 4 (10.0)
Mean Efficiency 90 63 55
No. of farms 42 42 42
Note: The values within the parentheses denote percentages of farms in each
Efficiency category.
Source: Rajashekarappa et al (2004)In this study, the technical, allocative and Cost efficiency of individual farms has been
estimated using farm level data of arecanut in Karnataka for the production period 1999-2000using DEAP approach. The mean technical efficiency has been found to vary widely (69% to90%) among the sample farms and across regions, which indicates that on an average, therealized output can be raised by 10 to 31 per cent without any additional resources in thearecanut growing regions. Various socio-economic, biophysical and technological factors
may be responsible for the observed difference in efficiency in the farms. The results alsoshow that through proper use of even the existing technology, a huge potential in improvingproductivity of arecanut can be exploited. So concerted efforts should be made to strengthenthe extension services and training programs. In this regard CAMPCO (Central Arecanut andCocoa Marketing and Processing Cooperative Ltd) and MAMCO (Malnad ArecanutMarketing Cooperative Ltd) can play a leading role, as they have much stake in the arecanuteconomy of Karnataka.Case study 2: Labor-Use Efficiency in Indian Banking: ABranch Level Analysis
(Abhiman Das, SubhashC. Ray and Ashok Nag, 2005)This paper uses Data Envelopment Analysis to measure levels of labor use efficiency
of the individual branches when measured against a benchmark constructed from the datafrom all branches in the sample. The study is designed to judge the branch-level labor cost-inefficiency of a single bank across the four biggest metropolitan cities viz. Mumbai Delhi,Kolkata and Chennai in India characterized by varied work culture.
The performance of each branch in the sample is measured against two differentfrontiers: one based on branches from all the four regions in the sample and the other basedonly on branches from the metro region where it is located. The first can be regarded as thenational or grand frontier and the other as the regional or metro frontier. The data are basedon 222 bank branches as on March 31, 2003 (and 191 as on March 31, 2002).
Labor cost efficiency score of each branch within each metro city was estimated forthe years 2002 and 2003 separately based on their individual frontier and also based on thegrand frontier comprising all the observations taken together. The role of each metro city indefining the overall efficiency is captured by an overall measure of the distance of individualfrontier to the grand frontier and is called asArea Efficiency. Area efficiency broadly reflectsimpact of the social, economic and cultural factors in a particular area on the labor efficiencyof a branch. While achievement of high overall efficiency becomes a target at corporate level,the issues relating to area efficiency call for actions at local/regional controlling offices.Table 6 presents the year wise average distribution of bank branches within metro, overalland area efficiency scores. The number of branches in the regions of Kolkata and Chennaiwere relatively higher in the sample used. Average labor efficiency of all four metro centersbased on their respective within metro frontiers in 2002 stood around 77%. Even whenjudged against the within-metro frontiers, significant degrees of labor inefficiency on averageare found for each region. For Delhi it was the highest, followed by Kolkata in 2003.However, except for Kolkata and Chennai, average labor efficiencies seem to have improvedin other two cities in 2003. This was most pronounced in the case of Mumbai. By contrast,Kolkata showed a sharp drop in efficiency. This finding of substantial labor cost-inefficiency
INTERNATIONAL MULTIDISCIPLINARY PEER REFEREED JOURNAL DELIBERATIVE RESEARCH/Volume-47/Issue-47/July-Sept, 2020
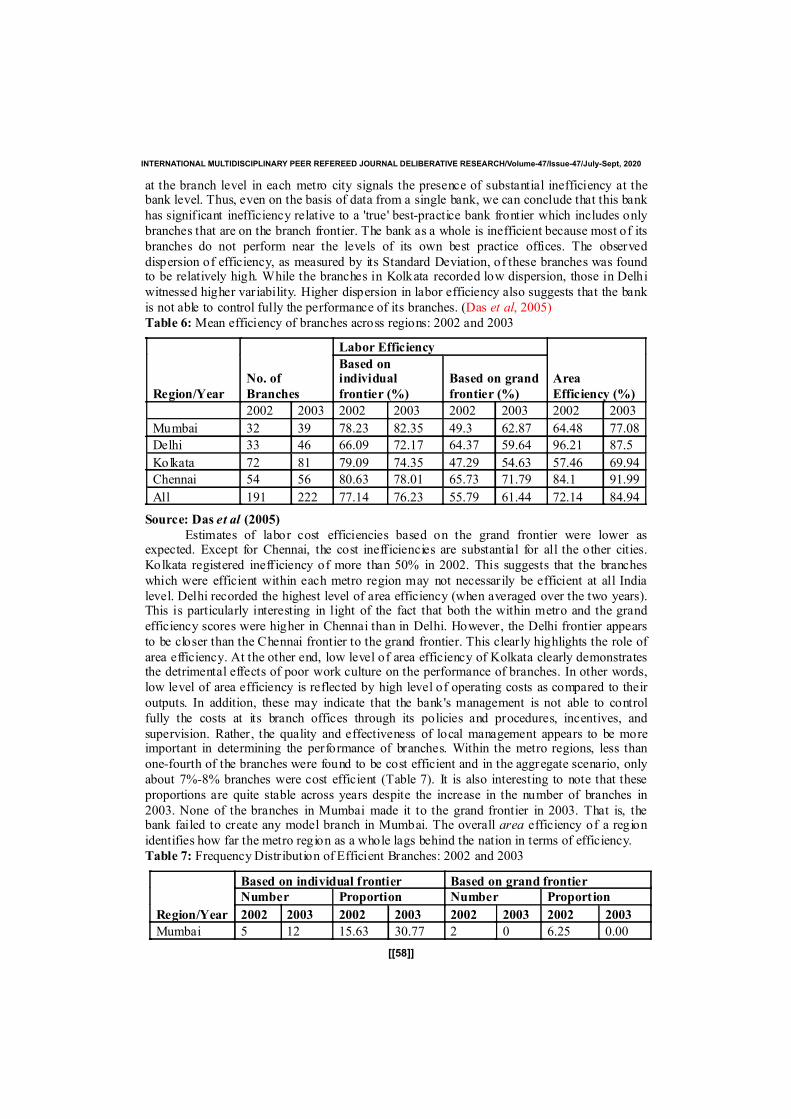
[[58]]
at the branch level in each metro city signals the presence of substantial inefficiency at thebank level. Thus, even on the basis of data from a single bank, we can conclude that this bank
has significant inefficiency relative to a 'true' best-practice bank frontier which includes only
branches that are on the branch frontier. The bank as a whole is inefficient because most of its
branches do not perform near the levels of its own best practice offices. The observed
dispersion of efficiency, as measured by its Standard Deviation, of these branches was foundto be relatively high. While the branches in Kolkata recorded low dispersion, those in Delhi
witnessed higher variability. Higher dispersion in labor efficiency also suggests that the bank
is not able to control fully the performance of its branches. (Das et al, 2005)
Table 6:Mean efficiency of branches across regions: 2002 and 2003
Region/Year
No. of
Branches
Labor Efficiency
Area
Efficiency (%)
Based onindividual
frontier (%)
Based on grand
frontier (%)
2002 2003 2002 2003 2002 2003 2002 2003
Mumbai 32 39 78.23 82.35 49.3 62.87 64.48 77.08
Delhi 33 46 66.09 72.17 64.37 59.64 96.21 87.5
Kolkata 72 81 79.09 74.35 47.29 54.63 57.46 69.94
Chennai 54 56 80.63 78.01 65.73 71.79 84.1 91.99
All 191 222 77.14 76.23 55.79 61.44 72.14 84.94
Source: Das et al (2005)
Estimates of labor cost efficiencies based on the grand frontier were lower asexpected. Except for Chennai, the cost inefficiencies are substantial for all the other cities.
Kolkata registered inefficiency of more than 50% in 2002. This suggests that the branches
which were efficient within each metro region may not necessarily be efficient at all India
level. Delhi recorded the highest level of area efficiency (when averaged over the two years).This is particularly interesting in light of the fact that both the within metro and the grand
efficiency scores were higher in Chennai than in Delhi. However, the Delhi frontier appears
to be closer than the Chennai frontier to the grand frontier. This clearly highlights the role of
area efficiency. At the other end, low level of area efficiency of Kolkata clearly demonstratesthe detrimental effects of poor work culture on the performance of branches. In other words,
low level of area efficiency is reflected by high level of operating costs as compared to their
outputs. In addition, these may indicate that the bank's management is not able to control
fully the costs at its branch offices through its policies and procedures, incentives, and
supervision. Rather, the quality and effectiveness of local management appears to be moreimportant in determining the performance of branches. Within the metro regions, less than
one-fourth of the branches were found to be cost efficient and in the aggregate scenario, only
about 7%-8% branches were cost efficient (Table 7). It is also interesting to note that these
proportions are quite stable across years despite the increase in the number of branches in
2003. None of the branches in Mumbai made it to the grand frontier in 2003. That is, thebank failed to create any model branch in Mumbai. The overall area efficiency of a region
identifies how far the metro region as a whole lags behind the nation in terms of efficiency.
Table 7: FrequencyDistr ibution of Efficient Branches: 2002 and 2003
Region/Year
Based on individual frontier Based on grand frontier
Number Proportion Number Proportion
2002 2003 2002 2003 2002 2003 2002 2003
Mumbai 5 12 15.63 30.77 2 0 6.25 0.00
INTERNATIONAL MULTIDISCIPLINARY PEER REFEREED JOURNAL DELIBERATIVE RESEARCH/Volume-47/Issue-47/July-Sept, 2020
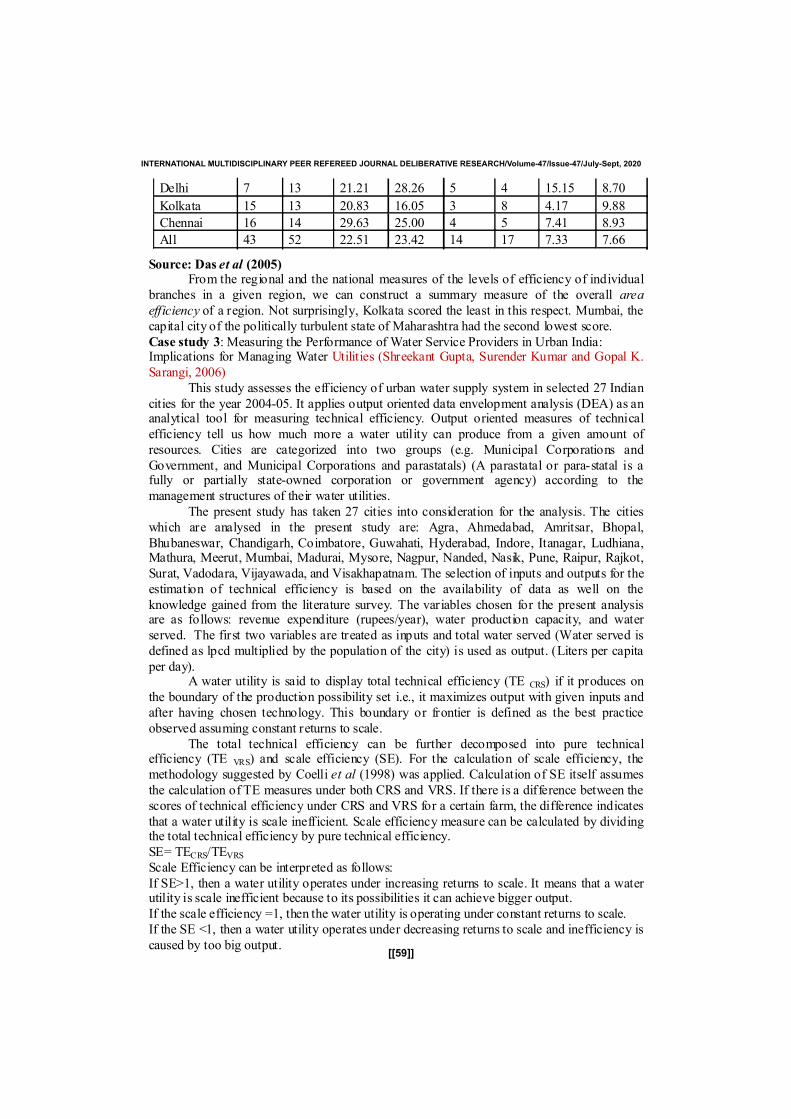
[[59]]
Delhi 7 13 21.21 28.26 5 4 15.15 8.70
Kolkata 15 13 20.83 16.05 3 8 4.17 9.88
Chennai 16 14 29.63 25.00 4 5 7.41 8.93
All 43 52 22.51 23.42 14 17 7.33 7.66
Source: Das et al (2005)From the regional and the national measures of the levels of efficiency of individual
branches in a given region, we can construct a summary measure of the overall area
efficiency of a region. Not surprisingly, Kolkata scored the least in this respect. Mumbai, the
capital city of the politically turbulent state of Maharashtra had the second lowest score.
Case study 3: Measuring the Performance of Water Service Providers in Urban India:Implications for Managing Water Utilities (Shreekant Gupta, Surender Kumar and Gopal K.
Sarangi, 2006)
This study assesses the efficiency of urban water supply system in selected 27 Indian
cities for the year 2004-05. It applies output oriented data envelopment analysis (DEA) as ananalytical tool for measuring technical efficiency. Output oriented measures of technical
efficiency tell us how much more a water utility can produce from a given amount of
resources. Cities are categorized into two groups (e.g. Municipal Corporations and
Government, and Municipal Corporations and parastatals) (A parastatal or para-statal is afully or partially state-owned corporation or government agency) according to the
management structures of their water utilities.
The present study has taken 27 cities into consideration for the analysis. The cities
which are analysed in the present study are: Agra, Ahmedabad, Amritsar, Bhopal,
Bhubaneswar, Chandigarh, Coimbatore, Guwahati, Hyderabad, Indore, Itanagar, Ludhiana,Mathura, Meerut, Mumbai, Madurai, Mysore, Nagpur, Nanded, Nasik, Pune, Raipur, Rajkot,
Surat, Vadodara, Vijayawada, and Visakhapatnam. The selection of inputs and outputs for the
estimation of technical efficiency is based on the availability of data as well on the
knowledge gained from the literature survey. The variables chosen for the present analysisare as follows: revenue expenditure (rupees/year), water production capacity, and water
served. The first two variables are treated as inputs and total water served (Water served is
defined as lpcd multiplied by the population of the city) is used as output. (Liters per capita
per day).A water utility is said to display total technical efficiency (TE CRS) if it produces on
the boundary of the production possibility set i.e., it maximizes output with given inputs and
after having chosen technology. This boundary or frontier is defined as the best practice
observed assuming constant returns to scale.
The total technical efficiency can be further decomposed into pure technicalefficiency (TE VRS) and scale efficiency (SE). For the calculation of scale efficiency, the
methodology suggested by Coelli et al (1998) was applied. Calculation of SE itself assumes
the calculation of TE measures under both CRS and VRS. If there is a difference between the
scores of technical efficiency under CRS and VRS for a certain farm, the difference indicates
that a water utility is scale inefficient. Scale efficiency measure can be calculated by dividingthe total technical efficiency by pure technical efficiency.
SE= TECRS/TEVRSScale Efficiency can be interpreted as follows:
If SE>1, then a water utility operates under increasing returns to scale. It means that a waterutility is scale inefficient because to its possibilities it can achieve bigger output.
If the scale efficiency =1, then the water utility is operating under constant returns to scale.
If the SE <1, then a water utility operates under decreasing returns to scale and inefficiency is
caused by too big output.
INTERNATIONAL MULTIDISCIPLINARY PEER REFEREED JOURNAL DELIBERATIVE RESEARCH/Volume-47/Issue-47/July-Sept, 2020
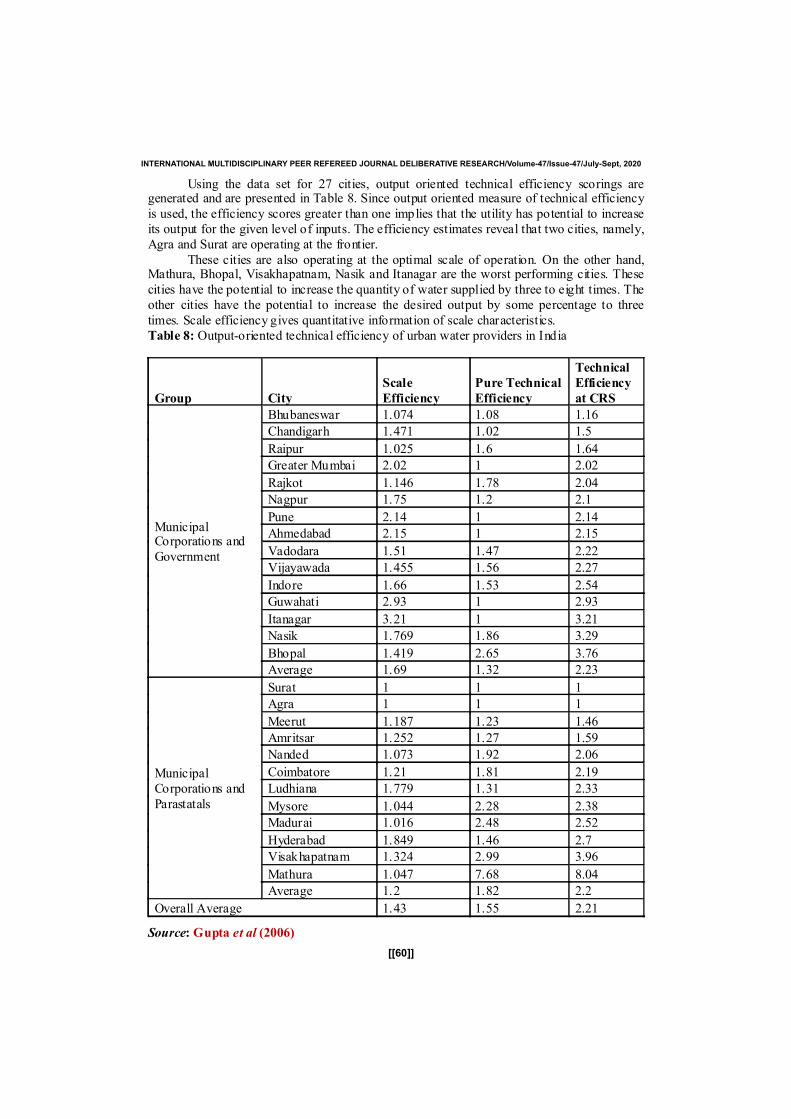
[[60]]
Using the data set for 27 cities, output oriented technical efficiency scorings aregenerated and are presented in Table 8. Since output oriented measure of technical efficiency
is used, the efficiency scores greater than one implies that the utility has potential to increaseits output for the given level of inputs. The efficiency estimates reveal that two cities, namely,Agra and Surat are operating at the frontier.
These cities are also operating at the optimal scale of operation. On the other hand,Mathura, Bhopal, Visakhapatnam, Nasik and Itanagar are the worst performing cities. These
cities have the potential to increase the quantity of water supplied by three to eight times. Theother cities have the potential to increase the desired output by some percentage to three
times. Scale efficiency gives quantitative information of scale characteristics.Table 8: Output-oriented technical efficiency of urban water providers in India
Group City
Scale
Efficiency
Pure Technical
Efficiency
Technical
Efficiency
at CRS
MunicipalCorporations and
Government
Bhubaneswar 1.074 1.08 1.16
Chandigarh 1.471 1.02 1.5
Raipur 1.025 1.6 1.64
Greater Mumbai 2.02 1 2.02
Rajkot 1.146 1.78 2.04
Nagpur 1.75 1.2 2.1
Pune 2.14 1 2.14
Ahmedabad 2.15 1 2.15
Vadodara 1.51 1.47 2.22
Vijayawada 1.455 1.56 2.27
Indore 1.66 1.53 2.54
Guwahati 2.93 1 2.93
Itanagar 3.21 1 3.21
Nasik 1.769 1.86 3.29
Bhopal 1.419 2.65 3.76
Average 1.69 1.32 2.23
MunicipalCorporations and
Parastatals
Surat 1 1 1
Agra 1 1 1
Meerut 1.187 1.23 1.46
Amritsar 1.252 1.27 1.59
Nanded 1.073 1.92 2.06
Coimbatore 1.21 1.81 2.19
Ludhiana 1.779 1.31 2.33
Mysore 1.044 2.28 2.38
Madurai 1.016 2.48 2.52
Hyderabad 1.849 1.46 2.7
Visakhapatnam 1.324 2.99 3.96
Mathura 1.047 7.68 8.04
Average 1.2 1.82 2.2
Overall Average 1.43 1.55 2.21
Source: Gupta et al (2006)
INTERNATIONAL MULTIDISCIPLINARY PEER REFEREED JOURNAL DELIBERATIVE RESEARCH/Volume-47/Issue-47/July-Sept, 2020
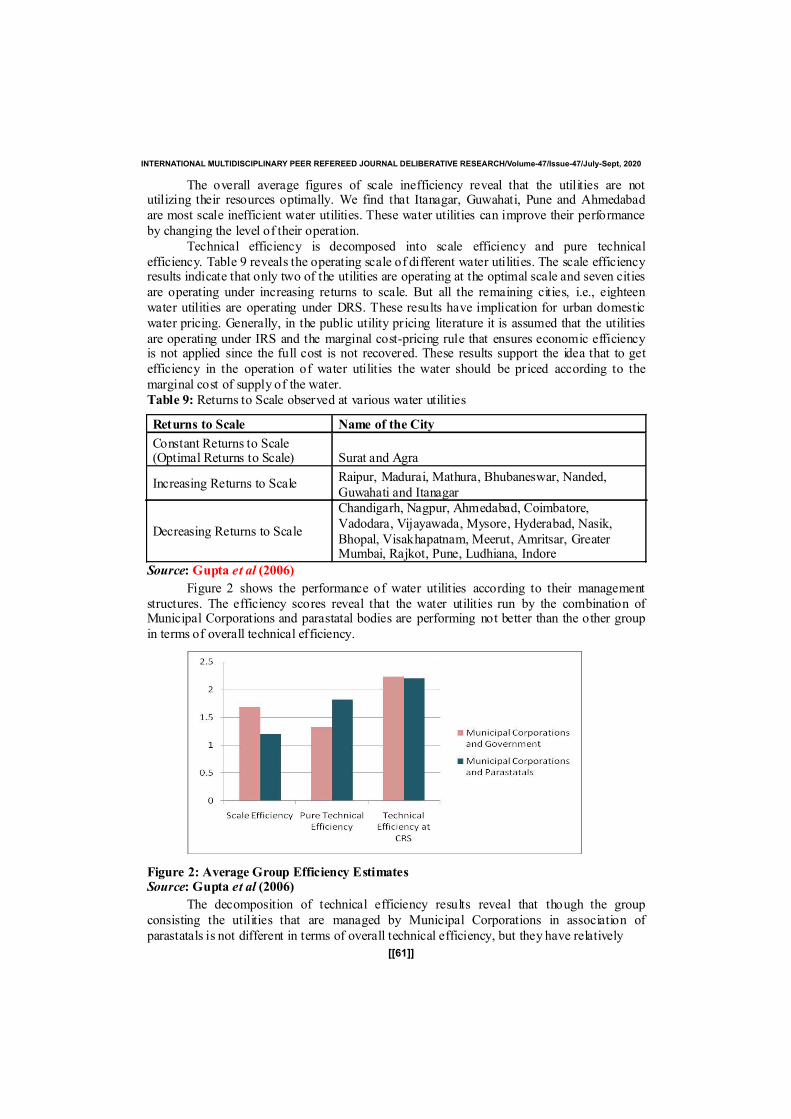
The overall average figures of scale inefficiency reveal that the utilities are notutilizing their resources optimally. We find that Itanagar, Guwahati, Pune and Ahmedabadare most scale inefficient water utilities. These water utilities can improve their performance
by changing the level of their operation.
Technical efficiency is decomposed into scale efficiency and pure technicalefficiency. Table 9 reveals the operating scale of different water utilities. The scale efficiencyresults indicate that only two of the utilities are operating at the optimal scale and seven cities
are operating under increasing returns to scale. But all the remaining cities, i.e., eighteenwater utilities are operating under DRS. These results have implication for urban domestic
water pricing. Generally, in the public utility pricing literature it is assumed that the utilities
are operating under IRS and the marginal cost-pricing rule that ensures economic efficiencyis not applied since the full cost is not recovered. These results support the idea that to get
efficiency in the operation of water utilities the water should be priced according to the
marginal cost of supply of the water.Table 9: Returns to Scale observed at various water utilities
Returns to Scale Name of the City
Constant Returns to Scale(Optimal Returns to Scale) Surat and Agra
Increasing Returns to ScaleRaipur, Madurai, Mathura, Bhubaneswar, Nanded,
Guwahati and Itanagar
Decreasing Returns to Scale
Chandigarh, Nagpur, Ahmedabad, Coimbatore,
Vadodara, Vijayawada, Mysore, Hyderabad, Nasik,
Bhopal, Visakhapatnam, Meerut, Amritsar, GreaterMumbai, Rajkot, Pune, Ludhiana, Indore
Source: Gupta et al (2006)
Figure 2 shows the performance of water utilities according to their managementstructures. The efficiency scores reveal that the water utilities run by the combination ofMunicipal Corporations and parastatal bodies are performing not better than the other group
in terms of overall technical efficiency.
Figure 2: Average Group Efficiency EstimatesSource: Gupta et al (2006)
The decomposition of technical efficiency results reveal that though the group
consisting the utilities that are managed by Municipal Corporations in association of
parastatals is not different in terms of overall technical efficiency, but they have relatively
[[61]]
INTERNATIONAL MULTIDISCIPLINARY PEER REFEREED JOURNAL DELIBERATIVE RESEARCH/Volume-47/Issue-47/July-Sept, 2020
better performance in terms of scale efficiency to the other group (Figure 7). Theresults presented in tables 8 and 9 also indicate that the scale efficiency is clearly linked tothe management of the utility although in both the groups utilities are operating under DRSand IRS. In the group consisting of Municipal Corporations and Government there are four
utilities and in the other group there are three utilities that are operating under IRS. Per se,the utilities operating under IRS are small cities in comparison to other cities, and thevariation in efficiency scores warrants more analysis.
The results indicate that the utilities, which are run by Municipal Corporations andparastatals, perform relatively better in comparison to the group combined by MunicipalCorporations and Government. Taking the variable of total water served as an indicator of the
operating performance, we find that the utilities run by Municipal Corporations andparastatals are relatively scale efficient in comparison to the group combined by Municipal
Corporations and Government. The offshoot of analysis suggests that as most of cities (e.g.eighteen out of twenty seven) are operating under decreasing returns to scale, marginal costpricing principles can be followed. This is in contrast to the common pricing practice ofutilities having the character of natural monopoly.Conclusions
The DEA is easy to calculate and interpret. The Efficiency analysis identifiesinefficiency and suggests the best practices. The inefficient farms can follow therebyreleasing the overused inputs into other economic activities. Benchmarking using the efficientfarms would be helpful to find the lacunae in the practices of inefficient farm. The efficientfarms can enhance their current practices by sharing the information with other frontierfarms. The DEA is extremely useful in promoting the best agricultural practices through
benchmarking. With information about other farm characteristics like age, education,technology adoption level, infrastructure availability, risk aversion etc., the inefficiency of
the farms could be well justified by estimating the relationship between efficiency parameters(Technical efficiency, cost efficiency and allocative efficiency) and farm characteristics.Respective agricultural development programs could be framed to improve the efficiency of
the farm.References
BANKER, R.D., CHARNES, A. AND COOPER, W.W., 1984, Some Models for Estimating Technical and ScaleInefficiencies in DataEnvelopment Analysis. Management Science, 30 (9): 1078-1092.
CHARNES, A., COOPER, W. AND RHODES, E., 1978, Measuring the Efficiencies of Decision Making Units.European Journal Of Operation Research, 2:429-444.
COELLI, TIM., A Data Envelopment Analysis (computer) Program. Centre for Efficiency and Productivity
Analysis, Australia. CEPAWorking Paper 96/08.
COELLI,T., RAO PRASADA, D.S. AND BATTESE, G.E., 1998, An Introduction to Efficiency and ProductivityAnalysis. Kluwer Academic Publishers, Boston.
DAS, ABHIMAN., RAY, SUBHASH C. AND NAG, ASHOK., 2005, Labor-Use Efficiency in Indian Banking: ABranch Level Analysis. University ofConnecticut, Working paper 2005-04.
FARELL, M.J., 1957, The Measurement of Productive Efficiency. Journal of Royal
Statistical Society (Series A): 253-290.
GUPTA, SHREEKANT., KUMAR, SURENDER. AND SARANGI, GOPAL K., 2006,Measuring the Performance ofWater Service Providers in Urban India: Implications for Managing Water Utilities. National Institute
of Urban Affairs, Working paper 06-08.
RAJASHEKARAPPA, M.T., UMESH, K.B. ANDSIVARAMANE, N., 2004, Assessment of Technical Efficiency inArecanut Production: An Application of Nonparametric Linear Programming. Agricultural Economics
Research Review, 17 (1): 121-129.
www.etm.pdx.edu/dea/homedea.html
[[62]]
INTERNATIONAL MULTIDISCIPLINARY PEER REFEREED JOURNAL DELIBERATIVE RESEARCH/Volume-47/Issue-47/July-Sept, 2020
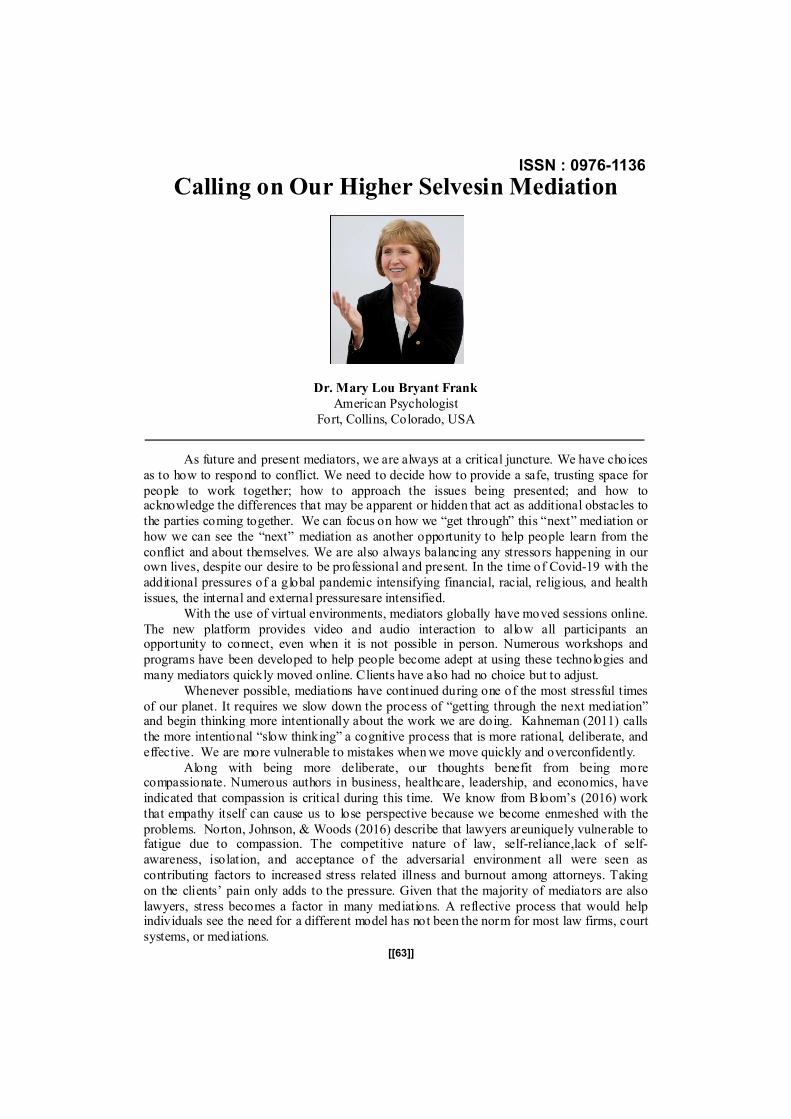
Calling on Our Higher Selvesin Mediation
Dr. Mary Lou Bryant Frank
American Psychologist
Fort, Collins, Colorado, USA
As future and present mediators, we are always at a critical juncture. We have choices
as to how to respond to conflict. We need to decide how to provide a safe, trusting space for
people to work together; how to approach the issues being presented; and how toacknowledge the differences that may be apparent or hidden that act as additional obstacles to
the parties coming together. We can focus on how we “get through” this “next” mediation or
how we can see the “next” mediation as another opportunity to help people learn from the
conflict and about themselves. We are also always balancing any stressors happening in ourown lives, despite our desire to be professional and present. In the time of Covid-19 with the
additional pressures of a global pandemic intensifying financial, racial, religious, and health
issues, the internal and external pressuresare intensified.
With the use of virtual environments, mediators globally have moved sessions online.
The new platform provides video and audio interaction to allow all participants anopportunity to connect, even when it is not possible in person. Numerous workshops and
programs have been developed to help people become adept at using these technologies and
many mediators quickly moved online. Clients have also had no choice but to adjust.
Whenever possible, mediations have continued during one of the most stressful times
of our planet. It requires we slow down the process of “getting through the next mediation”and begin thinking more intentionally about the work we are doing. Kahneman (2011) calls
the more intentional “slow thinking” a cognitive process that is more rational, deliberate, and
effective. We are more vulnerable to mistakes whenwe move quickly and overconfidently.
Along with being more deliberate, our thoughts benefit from being morecompassionate. Numerous authors in business, healthcare, leadership, and economics, have
indicated that compassion is critical during this time. We know from Bloom’s (2016) work
that empathy itself can cause us to lose perspective because we become enmeshed with the
problems. Norton, Johnson, & Woods (2016) describe that lawyers areuniquely vulnerable tofatigue due to compassion. The competitive nature of law, self-reliance,lack of self-
awareness, isolation, and acceptance of the adversarial environment all were seen as
contributing factors to increased stress related illness and burnout among attorneys. Taking
on the clients’ pain only adds to the pressure. Given that the majority of mediators are also
lawyers, stress becomes a factor in many mediations. A reflective process that would helpindividuals see the need for a different model has not been the norm for most law firms, court
systems, or mediations.
[[63]]
ISSN : 0976-1136
Bloom (2016) suggests that if we show “radical compassion” instead of “empathy,”we can become sensitive, respective, and more helpful. Rather than producing burnout,
radical compassion causes individuals to feel more energized, engaged, and willing to help
more. Just as a physician is able to move from patient to patient, a mediator can avoid
burnout and continue to attend to issues when dealing with multiple conflicting situations by
using compassion not empathy. Bloom (2016) continued that compassion enabled individualsto see the suffering, show concern, exhibit kindness, and help. The helping process became
rewarding instead of being draining. Jackson (2020) echoes this thought that compassion
might emerge as a most important element in how we approach ourselves and our work,
especially during the pandemic. It holds promise for lawyers, who are predisposed to being
stressed and taking on the issues of clients.From neuroscience, Singer and Klimecki (2016) validated that stressful situations had
different effects on us depending on how we approached the conflicts. Empathy was stressful
in and of itself. It was associated with “self-related emotion, stress, poor health, burnout,
withdrawal and non-social behavior” (p. 875). Compassion did not produce the sameoutcome. Compassionate responses created “other-related emotion, positive feelings (e.g.,
love), good health, approach and prosocial motivation” (Singer & Klimecki, 2016, p. 875).They summarized that the research had implications for individuals helping other people in
stressful situations. It clearly had ramifications for those in mediation and law.Lawyers have not been at the forefront of discussing how to integrate compassion into
practice. During the covid-19 crisis, this has not changed. However, we know from Detrani
(2020), that “there is a sense of interconnectedness that brings comfort to those of us whotend to overthink things (read: every lawyer ever). An acknowledgment that we are in this
together –- whatever “this” turns out to be when it’s all said and done.” The demandingenvironment combined with individuals prone to stress, makes compassion a necessity. The
mediation setting is an excellent place for the less adversarial environment to happen.
Helping the mediator to not take responsibility for the outcome, emotional ownership for the
pain that has happened, the onus to find a quick remedy. Especially during times of crisis andstress, it is important to respect, to listen, and to focus on what can be done together. Itprovides an environment that helps everyone.
We know that especially for mediators, a compassionate approach has value.
Compassion has always been an important cornerstone for helping people change. The
intersection between caring and understanding brought together the elements that also had themost influence on positive therapy outcomes (Bayne & Hays, 2017). Compassion also has a
positive impact on conflict resolution. In a study of the impact compassion has on conflict,
Klimecki (2019) cites “growing evidence that empathy and compassion are associated with
more prosocial behavior in interpersonal relations. Furthermore, empathy and compassionhave been associated with more favorable attitudes and higher readiness for reconciliationacross a range of intergroup settings.” While mediators may not always see compassion as a
power-full approach when entering into a conflicted situation, it is effective.
Compassion towards self also needs to be included. In a study by Yarnell and Neff
(2011), they looked at how individuals balance their personal needs with the needs of otherpeople when in conflict. “Across contexts,higher levels of self-compassion were related to
greater likelihood to compromise and lesser likelihood to self-subordinate needs, as well asgreater authenticity, lower levels of emotional turmoil, and higher levels of relational well-
being” (p. 146). The application of self-compassion toward has legitimacy and value,
especially for mediators. Knowing that all conflict is layered and intensified, taking time torespect and honor the struggle in each other and ourselves is important.
Christian (2017) described “compassionate curiosity” to explain approaching conflictwith respect and staying present with the conflict. It was an active approach to taking
[[64]]
INTERNATIONAL MULTIDISCIPLINARY PEER REFEREED JOURNAL DELIBERATIVE RESEARCH/Volume-47/Issue-47/July-Sept, 2020
compassionate understanding into mediation. Compassion was not a static experience, butone that facilitated movement in mediation. At the heart of the process, what made a
difference, was the mediator having an approach that respectfully embodied a caring attitude.Rosler, Cohen-Chen, and Halperin (2017) showed how compassion was important during the
beginning of conflict. Helping individuals show compassion was critical in the importantphase of conflict when it is easy for the process to escalate. Their research studies alsopointed out that hope was important as the conflict “deescalated” and the process becamemore conciliatory. The value of respecting, understanding, and honoring the discomfort and
anger people were experiencing and understanding how it was part of a process culminatingin peaceful resolution of differences was anchored in psychological research. It has also been
shown to be beneficial in mediation.We gained an integrated perspective of the importance of systemic compassion from
Rothbart & Allen (2019) in their study looking to promote peace. Their review showed howinducing compassion through mediation training, individuals in conflict felt more connectedand haddeeper positive feelings toward the other person or group. Drawing from brainresearch, they validated that the positive changes in perception were evident at theneurological level. A compassionate approach to resolving conflicts impacts not only the
resolution of the issues, but creates a more positive, respectful environment. In the time ofCovid-19, a compassionate approach may help conflicted parties not only find resolution totheir concerns but become more understanding of other people.
Integrating compassion into our lives and our work takes effort. In an environment
that is competitive, ego-driven, and layered with complex contextual pressures, it is evenmore challenging. Despite compassion having many intrinsic and extrinsic benefits, it takes
time to master. “As with many habits that are useful, developing compassion takesconsciousness, effort, and practice. We each have an innate capacity for compassion but must
develop it like any other skill” (Noll, 2005). It is important to remember that it is a process.Becoming compassionate may be intertwined with emotions that we feel about our own
abilities and worth, just as we learn to honor the value of others.Approaching mediations with compassion means we need to be open to seeing clients,
others, and ourselveswith more consideration. It means we need to focus on the courage ourclients have shown in taking their issues to a third-partymediator, the vulnerability involvedin that process as well as respecting we are all experiencing a most stressful environment. It
means as mediators, we do not need to make their pain our own when we want to be helpful.It means we all remember that underneath the anger is hurt and embarrassment. The
vulnerability seldom shows itself in mediation, but it is always there. If we want to be moreeffective, we need to become more open to listening beyond the harsh words and seek to
show compassion and understanding of the broader interests as well as the common humanityuniting them…and all of us.
For mediators who are lawyers, the message is even more pressing. In the midst of aglobal pandemic that has unsettled every area of our lives and threatens our existence, we
must be more aware of the important lessons compassion offers us. As Detrani (2020)indicates, “the silver lining might just be that the legal world is a little bit kinder, a shade lesscut-throat, a better place to find your way not just as a professional but also a person — ateam in which we all root for each other.” We all have much to gain by moving away fromlooking at “wins” and “losses” and the commonly practiced expedient approach in focusing
on quickly resolving the “next” conflicted situation.We are at another juncture. As mediators, we need to once again move beyond taking
on the pain of those in conflict and allowing our schedules to push us into automaticresponses to resolutions. We need to remember we are peacemakers. We need to see the
potential inherent in realizing each conflict is an opportunity to help people see hope even
[[65]]
INTERNATIONAL MULTIDISCIPLINARY PEER REFEREED JOURNAL DELIBERATIVE RESEARCH/Volume-47/Issue-47/July-Sept, 2020

when feeling hopelessness, to see that the “other” person in the conflict is more like themthan someone who is different. We can be more compassionate and gentler with ourselves.
We can begin realizing that we can take any conflict, be it between corporations,organizations, or individuals, and see it as a way to improve skills in listening as well asrespecting the lessons learned from being vulnerable, and maybe even, healing relationships.
To be the most effective during this time we can use this opportunity to call on our higherselves and make peace.References
Bayne, H., & Hays, D. (2017). Examining conditions for empathy in counseling: An exploratorymodel. Journa l of Humanistic Counseling, 56, 32–52.
Bloom, P. (2016). Against Empathy: The Case for Rational Compassion. New York, New York:Harper Collins.
Christian, K. (2017). Finding confidence in conflict [Video file]. Retrieved from https://
americannegotiationinstitute.com/about/
Detrani, J. (April 2, 2020). Practicing Law-And Compassion-In a COVID-19 World. Above the Law.Retrieved from: https://abovethelaw.com/2020/04/practicing-law-and-compassion-in-a-covid-19-
world/ .
Jackson, J. (May 20, 2020). Compassion in the Time of COVID-19. Forbes.
Kahneman, Daniel. (2011) Thinking, fast and slow. New York, New York: Farrar, Straus and Giroux,
Noll, D. (2005). Compassion. Mediate.com. Retrieved from:
https://www.mediate.com/articles/noll17.cfm
Norton, L., Johnson, J., Woods, G.. UMKC Law Review ,(2016), 84 (4), p. 977-1002. Kansas City,
Missouri: University of Missouri-Kansas City, School of Law.
Rosler, N., Cohen-Chen, S., & Halperin, E. (2017). The distinctive effects of empathy and hope inintractable conflicts. Journal of Conflict Resolution, 61(1), 114–139.
Rothbart, D. & Allen, S. H. (2019). Building peace th rough systemic compassion. Conflict Resolution
Quarterly, 1–14.
Singer, T., & Klimecki, O. M. (2014). Empathy and compassion. Current Biology, 24, 875–878.
Taylor, S. T. (June 2020)Of Counsel, 39 (6), p. 24-23.
Yarnell, L.& Neff, K. (2013) Self-compassion, Interpersonal Conflict Resolutions, andWell-being, Self
and Identity,12 (2), p. 146-59.
[[66]]
INTERNATIONAL MULTIDISCIPLINARY PEER REFEREED JOURNAL DELIBERATIVE RESEARCH/Volume-47/Issue-47/July-Sept, 2020
Premises of Developing and Implementing A
Strategy for Identifying and Storing Talents in
Public Organizations* **
*PhD Student Ionut Catalin NICAUniversity of Craiova
**PhDMaria BUSE
University of [email protected]
Abstract
Our research starts from the premise that talent has its roots in the specific knowledge,skills and experience of employees with superior potential. The critical analysis of the
specialty literature will follow the way of developing a strategy for identifying and retaining
talents in the organization based on the statement that employees are unique in skills,
behavior, thinking and so we can say that identifying talent in the process of recruitment and
selection, as well as in the process of carrying out the activity of the organization is not aneasy activity because, by definition, talented are those employees who constantly provide
positive results and achieve superior performance, have expertise in sensitive areas of
activity.
Keywords: talent management, public organisations, strategy, dimensions of talent.
IntroductionThe year 2020 began with many challenges for both employees and organizations,
and one of these challenges was the crisis generated by the COVID-19 virus, a crisis that led
to isolation, social distancing, all with negative effects on human behavior, as well as on the
development in good conditions of the activity of the public organizations (Idowu et al.,2017).
In this context we will critically analyze, from a theoretical point of view, following
to substantiate them also from a practical point of view in the third scientific research report,
the premises for developing and implementing an effective strategy for identifying,motivating and retaining talents in organizations, with particularization on public
organizations.
In our research we will seek to find answers to a series of questions such as:
Why are talents important for public organizations?What are the methods for identifying talents in public organizations?
What motivates talented employees to stay in the organization?
Which strategies are more effective in retaining talents in public organizations?
[[67]]
ISSN : 0976-1136
In our research we start from the premise that talent has its roots in the specificknowledge, skills and experience of employees with superior potential.
The development of a strategy for identifying and retaining talents in the organizationThe literature abounds with definitions of talent and we presented some of them in the
first scientific research report. Therefore, in this chapter we will refer to some of the
characteristic elements of talent and talent management that support the argument for theneed to develop a strategy for identifying and retaining talents in organizations.
People are unique in their skills, behavior, way of thinking and so we can say that
identifying talents both in the recruitment and selection process and in the process of carryingon the activity of the organization is not an easy activity because, by definition, talented are
those employees which constantly provide positive results and achieve superior performance,have expertise in sensitive areas of activity.
The literature positions the concept of talent according to certain key dimensions,such as the object-subject dimension (Bolander et. al., 2017). Talent as an object or the
approach to talent as an attribute is a set of characteristics and attributes of individuals andnot of a single person. Talent as a subject or approach to talent as a person, talent isassociated with people or with certain people.
Robert E. Lewis and Robert J. Heckman (2006) consider that there are three
approaches to talent management.A first approach is the one through which the concept of talent management is
considered as a label of human resources management and recruitment and selection
practices, personal development, leadership and career planning.Strategic talent management differs from strategic human resource management in
that strategic talent management focuses on those employees who have and are identified astalents, while strategic human resource management focuses on all employees in the
organization.The second approach considers talent management as a set of processes that ensure
an efficient succession of employees in the organization. Therefore, it is considered that
talent management focuses on an analysis of employee needs and their promotion.Akram Al Ariss, Wayne F. Cascio, Jaap Paauwe (2014) consider that the third
approach actually refers to the talents and the management of employees in the organization.
David G. Collings and Kamel Mellahi (2009) move to the fourth approach to talentmanagement and establish a relationship between identifying strategic positions in theorganization and developing a group of talents who have the necessary skills to occupy these
relationships.Wayne F. Cascio and John W. Boudreau (2016) consider talent management as a
process that identifies with strategic roles or key positions in the organization. Any talentmanagement system consists of a consolidated process of differentiating roles within
organizations, with a greater emphasis on strategic jobs than those that are not of strategicimportance or, more importantly, between those organizational roles that have a higher
impact on the performance of the organization, compared to those roles that can provide an
above average impact.The specialty literature in the field of talent management focuses on the dimensions of
talent management or, as Cappelli and Keller (2014) call them, the tensions of talent
management.The dimensions of talent management are classified into exclusive dimensions,
whereby talent is considered the attribute of the organization's elites (Schuler et al., 2011) andinclusive dimensions that consider talent to be an attribute of the individual and therefore anyemployee has a certain talent, thus becoming a strategic resource (Burlea-Schiopoiu, 2008;
Collings and Mellahi, 2009).[[60]][[68]]
INTERNATIONAL MULTIDISCIPLINARY PEER REFEREED JOURNAL DELIBERATIVE RESEARCH/Volume-47/Issue-47/July-Sept, 2020
The organization's responses to tensions are classified, by Anne E. Bardoel (2016),into five categories involving lack of recognition, opposition, spatial separation, temporal
separation, and synthesis. Lack of recognition is not among the talent management strategies
and can lead to contradictions between employees in unexpected and unproductive situations.
Opposition is a strategic approach because it involves the explicit recognition of
tensions and a strategic decision can lead to the explicit resolution of a tension. Spatialseparation involves the strategic application of different policies in different locations of the
organization, depending on the context or the local separation of the organization's policies.
Temporal separation involves taking into account the time that is very valuable in the
strategic process of identifying and retaining talents in the organization. The synthesis refers
to the development of new terms or concepts for resolving tensions through the involvementof leaders and the efficient use of the communication process.
The implementation of a strategy for identifying and retaining talents in the
organization
The elaboration of a strategy for identifying and retaining talents in the organizationdoes not mean that the organization will have talents and will carry out its activity through
their optimal capitalization, but on the contrary the process of implementing the strategy is
the one that ensures the success of the strategy. Most research on how to implement talent
strategies has been conducted in the United States, which is considered by David G. Collings,Hugh Scullion and Vlad Vaiman (2011) as a limitation of talent management research.
Cecile Dejoux and Maurice Thévenet (2010, 2016) identified talent with competence,
expertise and potential, considering them important for employees. The difference between
competence and qualification is that the individual, in terms of competence, is unique and can
be proven by any employee, regardless of seniority in the organization, while qualification isa collective attribute. On the other hand, competence consists in taking initiative and taking
responsibility in critical professional contexts, as well as practical intelligence with
applicability in difficult professional situations, being a set of skills that can be used in order
to solve a problem in a given situation (Burlea-Schiopoiu and Burdescu, 2016).
The difference between competence and expertise lies in the fact that expertisecorresponds to a higher level of mastery obtained by extensive experience in a well-defined
field, being generated by long-term experience and effort, while competence corresponds to
the ability to master specific work situations by talented employees.
The success of implementing a talent management strategy lies in the efficiency ofprograms and processes designed to identify and develop leaders meant to support the
development of the organization (Burlea-Schiopoiu and Remme, 2017). Therefore, leadership
development is a very important process within organizations that can help retain and
develop talents within the organization. Talent management incentive programs are designedto support organizations to assess employee leadership qualities in order to develop
mentoring programs for these employees.
Public organizations can implement the talent management strategy either by focusing
on the qualities of leaders or on what leaders undertake. Thus, the competitive business
environment and workforce that have different levels of skills and abilities, imposecontextual or relevant leadership styles that are based on situational variables and objectives
set to provide superior performance.
Talent management practices must focus on developing leadership capacity within
organizations with a considerable degree of flexibility, implementing a situational leadership
approach. The situational approach or approach to leadership effectiveness considers theever-increasing role of leadership in the process of improving the innovative skills of the
organization.The implementation of a talent management strategy consists of a set of
activities and processes that involve the systematic identification of key positions that
[[69]]
INTERNATIONAL MULTIDISCIPLINARY PEER REFEREED JOURNAL DELIBERATIVE RESEARCH/Volume-47/Issue-47/July-Sept, 2020
contribute, in a differentiated way, to achieving a competitive and sustainable advantage ofan organization, but also to the development of talents with potential and performance in
order to fulfill these roles and the development of a differentiated human resource
architecture.
Conclusions
Our research aimed to identify those elements that contribute to the identification andretention of talent in organizations, mainly in public organizations. Considering that talent
identification is a difficult task for organizations, especially in the context in which, although
due to the crisis caused by COVID-19, the global unemployment rate has risen, yet most
sectors face a deficit of qualified staff, which makes finding and retaining talents a
continuous challenge for organizations. Therefore, one of the conclusions we have reached isthat organizations need to adopt an effective strategy to retain talent and that this strategy
should be based on well-founded internal talent identification and retention programs.
Talent management is a process that identifies with strategic roles or key positions in
the organization and any talent management system consists of a consolidated process ofdifferentiating roles within organizations, with a greater emphasis on strategic jobs compared
to those that are not of strategic importance or, moreover, between those organizational roles
that have a higher impact on the performance of the organization, compared to those roles
that can provide an above average impact.Strategic talent management differs from strategic human resource management in
that strategic talent management focuses on those employees who have and are identified as
talents, while strategic human resource management focuses on all employees in the
organization.
References1. Al Ariss, A., Cascio, W.F., Paauwe, J. 2014. Talent management: Current theories and future research
directions. Journal of World Business, 49(2), pp. 173–179.
2. Bardoel, E.A. 2016. Work-life management tensions in multinational enterprises (MNEs). InternationalJournal of Human Resource Management, 27, pp. 1681–1709.
3. Bolander, P., Werr, A., Asplund, K., 2017. The practice of talent management: A framework and typology.Personnel Review, 46, pp. 1523–1551.
4. Burlea-Schiopoiu, A., Remme J., 2017, The Dangers of Dispersal of Responsibilities. Amfiteatru
Economic, 19(45), pp. 464-476. file:///C:/Users/FEAA/Downloads/Article_2630.pdf5. Burlea-Schiopoiu, A., Burdescu D.D., 2016, An Integrative Approach of E-Learning: From Consumer to
Prosumer, in Smart Education and e-learning 2016, Smart Innovation, Systems and Technology, SpringerInternational Publishing Switzerland, Vol. 59, pp. 269-279. DOI 10.1007/978-3-319-39690-3
6. Burlea-Schiopoiu, A. 2008. Managementul resurselor umane, Universitaria.7. Cappelli, P., Keller, J.R. 2014. Talent management: Conceptual approaches and practical challenges.
Annual Review of Organizational Psychology and Organizational Behavior, 1, pp. 305–331.8. Cascio, W.F., Boudreau, J.W. 2016. The search for global competence: From international HR to talent
management. Journal of World Business, 51, pp. 103–114.9. Collings, D.G., Mellahi, K. 2009. Strategic talent management: A review and research agenda. Human
Resource Management Review, 1, pp. 304–313.10. Collings, D.G., Scullion, H., Vaiman. V. 2011. European perspectives on talent management. European
Journal of International Management, Vol. 5, no. 5, pp. 453–462.11. Dejoux, C., Thévenet, M. 2010. La gestion des talents, la GRH d’après-crise. Dunod, Paris.
12. Dejoux, C., Thévenet, M. 2016. La gestion des talents. 2e édition, Dunod, Paris.13. Idowu, S., Vertigas, St., Burlea-Schiopoiu, A., (editors), 2017, Corporate Social Responsibility in Times of
Crisis: A Summary, Springer14. Lewis, R.E., Heckman, R.J. 2006. Talent management: A critical review. Human Resource Management
Review, 16(2), pp. 139–154.15. Schuler, R.S., Jackson, S.E., Tarique, I. 2011, Global talent management and global talent challenges:
Strategic opportunities for IHRM. Journal of World Business, 46, pp. 506–516.
[[70]]
INTERNATIONAL MULTIDISCIPLINARY PEER REFEREED JOURNAL DELIBERATIVE RESEARCH/Volume-47/Issue-47/July-Sept, 2020
Particularities of Sustainable Development
Management at the Agricultural Research-
Development Station from Caracal
PhD Student Marius Catalin BRAN
University of Craiova
Abstract
The paper aims at the integrative approach of sustainable development management at
the Agricultural Research-Development Station in Caracal (SCDA). Our current research
aims to have, as a finality, the evaluation of sustainable development management in terms ofimplementing a strategy at SCDA Caracal.
Keywords: Sustainable development management, Agricultural Research-Development
Station in Caracal.
IntroductionSustainable development is a concept that has emerged because of ethical issues, and
one of the ethical norms on which this concept is based is that of the principle of fairness or
justice. The premise of sustainable development is the responsibility, whether it is the
responsibility for the environment, or the responsibility for the community in which it
operates, or the responsibility for the organization itself as a viable entity, it is an integrationof the economic mission into the core mission represented by the social mission (Burlea-
Schiopoiu and Mihai, 2019).
The explanation behind this articleis represented by the challenges posed by economic
crises in recent years and, this year, the crisis caused by the COVID-19 pandemic, which
emphasizes the importance of implementing sustainable development strategies andpromoting responsible management in organizations, regardless of their size or field of
activity.
The Agricultural Research-Development Station from Caracal (SCDA), on the
background of these crises, noticed the growing urgency to address the issue of sustainabledevelopment, which consists of correlating all the resort's systems with the environment in
terms of environmental ethics. SCDA Caracal's responsibility for sustainable development
refers, on one hand, to ensuring economic performance and, on the other hand, to ensuring
the viability of the environment through protection measures and the implementation offeasible research projects.
In addition to respecting environmental protection, SCDA Caracal considers that
social legitimacy is an important criterion for implementing sustainable management,
because responsibility for the community in which the resort operates has present and futureimplications for all stakeholders. Thus, an ethical challenge for organizations and individuals
[[71]]
ISSN : 0976-1136
is to develop an ethical attitude that considers freedom as an integrated responsibility of theindividual with the organization, the society and the environment. For the development of
such an ethical position, it is necessary to have a clear awareness of the ethical values and
norms that must be learned through social processes that contribute to the development of
ethical capacities.
Theoretical elements of sustainable development managementSustainable development management is based on a series of research work on how
social and environmental issues can be overcome. These problems of humanity manifestedthemselves long before sustainable development emerged as a concept and thus became a
concern for governments and organizations.
In the seventh and eighth decades of the XX century, the environmental managementbegan to be widely promoted. This concern was generated by the oil crisis and was
summarized in the Club Report of Rome and as a result, we are witnessing an alternative
approach to business, with the launching of the concept of social entrepreneurship or the
concept of entrepreneurship of sustainable development, that led to the emergence of a newtype of organization based on the social side of the business and not on obtaining andmaximizing profit.
These organizations focus their efforts on combining social, environmental and
market principles, and under these conditions, social entrepreneurs join forces with businessentrepreneurs in order to develop the well-being of the community in which they operate
(Burlea-Schiopoiu, 2008).
In the current context, generated by the COVID-19 pandemic, sustainable
development management could generate additional jobs and income, especially in theagriculture area. Moreover, production conditions must be in line with the new regulationsimposed by COVID-19. Thus, current production and consumption patterns must adapt to the
new rules and avoid causing irreversible damage to the environment. These impacts of
economic activity are recognized today and are manifested as key concerns regarding the
management of sustainable development (Idowu et al., 2017).
Research in the field of sustainable management refers to major threats to the viabilityand integrity of organizations and consists of addressing sustainable development issues both
by describing and analysing the complexity, dynamics and cause-effect relationships througha methodology characterized by thinking and modelling systems, this being applicable to
past, current and future sustainable development issues (De Vries, 2013), as well as bydeveloping evidence-based solutions, solutions that produce changes in the lives of
organizations that depend on actions taken by other stakeholders (Wiek et al., 2015). Thus,
knowledge is supported by actionable evidence and, if implemented, can bring lasting change
into the lives of organizations (Burlea-Schiopoiu, 2013a, 2013b).Nina Kahma and Kaisa Matschoss (2017) agree that in the process of promoting
innovation, especially in the case of energy markets that are constantly changing; theembracement of innovation is often conceptualized in terms of technology diffusion. Success
or failure of new technologies depend on how they are able to move from one market
segment to another, suggesting that non-use of technologies produces far more benefits thandelayed embracement, as this non-use can manifest itself as an active resistance or barrier to
change, and the abandonment of a high-performance and innovative technology has an
important role in explaining its non-use.
Kristen Jenkins (2018) considers that normative approaches to the sustainabledevelopment of organizations have a positive impact on the environment and at the same timecontribute to the promotion of social justice and poverty reduction, in order to take into
account the dynamics, complexity, uncertainty and objectives based on the value of
sustainable development.
[[72]]
INTERNATIONAL MULTIDISCIPLINARY PEER REFEREED JOURNAL DELIBERATIVE RESEARCH/Volume-47/Issue-47/July-Sept, 2020
Some researchers considered sustainable development as an exogenousenvironmental challenge to be solved by specific technological systems, while others
considered it as a contingent manifestation of a complex, multidimensional phenomenon,
while Raven and colleagues (2017) consider sustainable development a dynamic normative
phenomenon that changes depending on the particularities of the environment in which it is
implemented. All these elements of conceptual nature have an important impact on othernotions such as the notions of transition and experimentation for which the technological
implications acquire a defining meaning.
After a literature analysis, we were able noticed that solutions and decisions, in case
of sustainable development management, are not simple technical elements or control
procedures. Contrariwise, they are complex and require long-term processes that take place inthe life of organizations, which implies not only a decision process of collective learning, but
also a continuous adaptation of the management style to the particularities of the
organization. The integration of different dimensions of social development in the concept of
sustainable development is done according to their relative importance. Thus, Konrad Ott(2009) considers that all three dimensions (economic-social-environmental / ecological) are
equally important without arguing based on this consideration of equality.
Factors that motivate the Agricultural Research-Development Station from Caracal to
focus on sustainable development managementOne of the main objectives of the management of SCDA Caracal is to increase
economic efficiency. Therefore, the challenge of a sustainable development management
focuses on the increase of ecological efficiency through a responsible management of the
agricultural lands of the resort and implicitly of the environment.
In the case of SCDA Caracal, sustainable development management can lead to areduction in the negative impact of fertilizers used on the environment.
The economic efficiency of the station must be intertwined with social efficiency, as
the latter reflects the way in which the station evolves in terms of social and cultural
requirements, as well as the legitimacy of its activities. All these elements of efficiency are
correlated with reputation indicators, financial reporting, and the way in which the resortadapts and meets the requirements of society.
The economic challenge to which SCDA Caracal is subjected consists of maximizing
the financial profit in relation to the financial resources, such as the invested capital.
Therefore, there is another challenge that of implementing a sustainable developmentmanagement, which consists of maximizing the performance of the environment and social
ones according to economic indicators, being measured by what, is called eco-efficiency and
socio-efficiency. Taking into account the object of activity of SCDA Caracal, we can also
think about ecological efficiency.SCDACaracal has two main sectors of activity, and namely:
• Research Sector
• Development Sector
The research sector operates on an area of 219 ha, having the following objectives:
The research itself;
Extension to farmers from the area of the obtained results and promotion of new
creations in the field of cereals and industrial plants;
Seed production from higher biological categories.In recent years, averages of 50 research contracts have been concluded per year with
institutes, research stations, national and multinational companies, such as:
INCDA Fundulea, Bayer, Biocrop, Caussade, Euralis, Limagrain, Pioneer,
DonauSaat, KWS, Syngenta, Adama, SumitAgro, Maisadour, Rapool, Saaten Union,Monsanto, RAGT, Naturevo, etc.
[[73]]
INTERNATIONAL MULTIDISCIPLINARY PEER REFEREED JOURNAL DELIBERATIVE RESEARCH/Volume-47/Issue-47/July-Sept, 2020
The research topic addressed in the research contracts is the following:• establishing sets of hybrids and varieties of cereals, industrial plants, legumes and fodder,
adapted to the conditions of climatic stress specific to the area of influence of SCDA
Caracal;
• elaboration of technologies and improvement of technological sequences for the cultivation
of cereals, industrial plants and legumes;• improving forecasting methods and herbage control in field crops;
The extension activity consists of the popularization of the new genotypes of cereals,
legumes, industrial plants and fodder, as well as the presentation in demonstration fields of
the new technologies and technological sequences.
Demonstration lots are set up for wheat, barley, triticale, sunflower, corn, sorghumand rapeseed. The multitude of genotypes presented in these demonstration lots allows the
farmer to choose the most productive variety or hybrid.
The results are presented in scientific events, national symposia and days dedicated to
the cultivation of straw cereals and industrial plants.The development sector operates on an area of 2242 ha, within two vegetal farms.
The main crops are the following: wheat, rape, barley, triticale, peas, corn and sunflower.
The main purpose of activity is the production of seed from higher biological
categories, in order to serve farmers in the country with certified seed material, from localvarieties.
In order to increase institutional performance and develop a competitive
infrastructure, in recent years (2015-2019) investments of 7,096,674 lei, VAT not included,
have been made in machinery and equipment, meaning approximately 1.5 million Euros.
SCDA Caracal provides farmers all around the country with significant quantities ofcertified seed from higher biological categories, which is highlighted by the increase in sales
from year to year.
If in 2016, the unit managed to sell 800 tons of grain, in 2019 the quantities increased,
reaching 2500 tons.
The factors that influence the management of this sector are multiple and, in turn, areinfluenced by the particularities of the sector in which SCDA Caracal operates, namely, the
education system (Burlea-Schiopoiu, 2011; Burlea-Schiopoiu et al., 2014).
Customers' preference for organic products is one of the factors behind the way in
which the resort combines the principles of sustainable development with economic andfinancial aspects, such as making a profit.
Further on this matter, the station is involved, as a partner (The National Institute for
Agricultural Research and Development - INCDA Fundulea being the coordinator), in two
major projects of Agriculture and Rural Development (ADER), axis 111 (Improving thestructure of winter wheat varieties in the south and east of the country by creating
corresponding to market requirements) and axis 212 (Creation and promotion of new barley
and two-row barley genotypes characterized by superior adaptability to different
environmental conditions) - national scope, which runs from 2019 to 2022.
The axis 111 project aims to improve the economic results of farms, by increasing theusage efficiency of natural resources and technological inputs, for sustainable agriculture in
the context of climate change, especially under conditions of drought and extreme
temperatures. The establishment of this objective started from the reality that the South and
East region of Romania is the largest wheat cultivator in the country (areas generally
exceeding 1 million hectares), but it is also the most vulnerable in terms of climate changegenerated by rising temperatures and large fluctuations in the rainfall regime (2020 was a
year marked by drought which led to significant losses for farmers who did not have
irrigation systems). Together with SCDACaracal, other partners are also involved in the
[[74]]
INTERNATIONAL MULTIDISCIPLINARY PEER REFEREED JOURNAL DELIBERATIVE RESEARCH/Volume-47/Issue-47/July-Sept, 2020
project, such as the following: Secuieni Agricultural Development Research Station,Teleorman Agricultural Development Research Station, and ValulLuiTraian Agricultural
Development Research Station. Thomas et al. (2014) affirm that by 2050, due to climatechange, 15-37%of a sample of 1,103 industrial plants and animals will disappear.
The project on axis 212 aims to improve the economic results of farms, by increasing
the usage efficiency of natural resources and technological inputs, for a sustainableagriculture, in the context of climate change. Among partners, in addition to the project
coordinator, there are the following: Turda Agricultural Research and Development Centre,Secuieni Agricultural Development Research Station, Brăila Agricultural Development
Research Station, ValulLuiTraian Agricultural Development Research Station and Teleorman
Agricultural Development Research Station.In addition to the scientific research projects, SCDA Caracal has multiple
collaborations with the business environment (agricultural companies).
Thus, in order to identify, as correctly as possible, the factors that influence themanagement of sustainable development, it is necessary to determine what are the mainchallenges that the resort faces and will face from a three-dimensional point of view:
economic-social-ecological. From the analysis of the daily activity corroborated with thescientific research activity carried out based on the projects, we identified some of the
challenges to which the resort must find an answer.One of the challenging factors and perhaps among the most important are innovation
in order to achieve competitive differentiation between SCDA Caracal and other research-
development stations around the country.In line with the innovation process, we need to focus on reducing the costs of
agricultural production and increasing economic and social efficiency.We innovate, we reduce costs, we increase economic and social efficiency, but we
must not neglect human resources, namely to attract, retain and motivate employees to turn
them into strategic human resources of the resort(Burlea-SchipoiuandRemme, 2017).
Not all the above factors can be capitalized if we do not attract and retain customers.Therefore, another important factor refers to the way the resort operates and adapts to
the changes that occur in the internal and external environment, so that it responds andadapts effectively to the new business model generated by the restrictions imposed by
competitors and by the COVID-19 pandemic.
In achieving the most competitive management, we must focus on innovation and theefficiency of the business model because it is the premise for achieving sustainable profits, as
innovation puts into practice the opportunities offered by the market and reduces the
pressures coming from the competitive business environment. These kind of pressures createa systemic imperative and represent an opportunity to develop sustainable development goals,and the need for cooperative solutions leads to managing issues related to the
institutionalization of sustainable development management, so that environmental and socialgoals become an integral part of the organization's management (BalanandBurlea-Schiopoiu,
2017; Burlea-SchiopoiuandBalan, 2018).Heiko Spitzeck and Eric G. Hansen (2010) consider that various ways of
institutionalizing sustainable development expertise in management demonstrate that there is
no single answer to the question of how sustainable development management should beorganized, because for this type of management, sustainable development can become an
isolated and poorly funded function, and at best, there may be organizational structures that
define key indicators of social and environmental performance that are related to intrinsicmotivation.
For implementing a sustainable development management, it is required support and
commitment from top managers, who provide resources to ensure that sustainable
[[75]]
INTERNATIONAL MULTIDISCIPLINARY PEER REFEREED JOURNAL DELIBERATIVE RESEARCH/Volume-47/Issue-47/July-Sept, 2020
development management practices are integrated across the organization and into the corebusiness model and processes. The involvement of external stakeholders allows the
development of holistic solutions to sustainable development problems.Among the factors that influence sustainable development in organizations, the relevant ones
are related to sustainable economic development, environmental issues, social responsibility
issues, health and protection of employees and customers, the development of a long-termperspective.
Some factors related to sustainable development trends that are considered critical for
the organization are the following: water deficit, climate change, waste management, food
security.
It is important for the organization to effectively communicate its sustainabledevelopment efforts and commitments, either through a series of reports (integrated year
report, social responsibility report, sustainable development report), on social networks,
conferences and round tables.
ConclusionsOver time at SCDA Caracal there were many factors that led to the change of the
business model (the elements that were changed in the business model are the following:
product offer, value chain processes, cost model, organizational structure), as the resort
faced a shortage of human and sometimes even financial resources, customers began to turnto organic products, exerting some legislative and political pressure, involving competition in
the development of organic products.
In the process of implementing a sustainable management, SCDA Caracal has facedproblems related to reducing costs that are not related to production, internal recycling of
waste, changes in pricing strategy, financial risk management, internal communication.The profit obtained from sustainable development activities is an innovative
advantage through the early identification of efficient solutions and an important market
share due to its ecological position, but it can also help reduce profits if some higher
operational costs are put into practice or if the granted economic and financial incentives areinsufficient.Acknowledgement
This work was supported by the grant POCU/380/6/13/123990, co-financed by the
European Social Fund with in the Sectorial Operational Program Human Capital 2014 –2020.
References1. Balan D.A., Burlea-Schiopoiu, A., 2017, The development of a corporatereputation metric: A customer
perspective, în Pînzaru , F., Zbuchea, A., Brătianu, C., Vătămănescu, E.M., Mitan. A.,Major challengesof today’seconomy (pp. 595-606), Bucharest: Tritonic.
2. Burlea-Schiopoiu, A., 2013a, An Aristotelian approachtosustainable management, in Encyclopedia ofCorporate Social Responsibility, EditorsSamuel O. Idowu, Nicholas Capaldi, LiangrongZu, Ananda
das Gupta, Springer-Verlag Berlin Heidelberg ,pp. 92-100. Doi: 10.1007/978-3-642-28036-8_6573. Burlea-Schiopoiu, A., 2013b, Global Environmental Management Initiative, in Encyclopedia of
Corporate Social Responsibility, Samuel O. Idowu, Nicholas Capaldi, LiangrongZu, Ananda das Gupta(eds.), Springer-Verlag Berlin Heidelberg,pp. 1241-1248. Doi: 10.1007/978-3-642-28036-8_390
4. Burlea-Schiopoiu, A., 2011. The Relationship between the European Social Fund and KnowledgeManagement in Romanian Organizations, ECKM 2011, 1-2 September Passau, Germany, pp. 148-158.
5. Burlea-Schiopoiu, A. 2008. Managementul resurselor umane, Universitaria.6. Burlea-Schiopoiu, A., Balan, D.A. 2018. The short memory life span of consumer: a premise for
corporate socially irresponsible behavior? Innovation Management and Education Excellence throughVision 2020, Vols. I-XI, pp. 1274-1286, Milan, Italy.
7. Burlea-Schiopoiu, A., Mihai, L.S. 2019. An Integrated Framework on the Sustainability of SMEs.Sustainability, 11(21), 6026; https://doi.org/10.3390/su11216026
8. Burlea-Schiopoiu, A., Remme J., 2017, The Dangers of Dispersal of Responsibilities. Amfiteatru
Economic, 19(45), pp. 464-476. file:///C:/Users/FEAA/Downloads/Article_2630.pdf
[[76]]
INTERNATIONAL MULTIDISCIPLINARY PEER REFEREED JOURNAL DELIBERATIVE RESEARCH/Volume-47/Issue-47/July-Sept, 2020
9. Burlea-Schiopoiu, A., Tudor S., Dragulin I., Ileana D., 2014, The Challenges of the European SocialFund for CorporateGovernance in Romania, Proceedings of The 10th European Conference on
Management Leadership andGovernance ECMLG 2014, VERN' University of AppliedSciences,Zagreb, Republic of Croatia 13- 14 November 2014, pp. 9-17, Academic Conferences and Publishing
International Limited.10. De Vries, B. 2013. Sustainabilityscience. Cambridge University Press, NewYork.
11. Idowu, S., Vertigas, St., Burlea-Schiopoiu, A., (editors), 2017, Corporate Social Responsibility inTimes of Crisis: A Summary, Springer.
12. Jenkins, K., 2018. Energy justice, energydemocracyandsustainability. Normative approaches to theconsumer ownership of renewables. In: Lowitzsch, J. (Ed.), Energy Transition. Financing Consumer
Ownership in Renewables. PalgraveMacmillan.13. Kahma, N., Matschoss, K. 2017. The rejection of innovations? Rethinkingtechnologydiffusionandthe
non-use of smartenergyservices in Finland. Energy Research& Social Science, 34, pp. 27–36.https://doi.org/10.1016/J.ERSS.2017.05.024
14. Ott, K. 2009. On substantiatingtheconception of strongsustainability. In: Döring R (ed) Sustainability,natural capita l andnatureconservation. Metropolis, Marburg, pp 49–72.
15. Raven, R., Ghosh, B., Wieczorek, A., Stirling, A., Ghosh, D., Jolly, S., Karjangtimapron, E.,Prabudhanitisarn, S., Roy, J., Sangawongse, S., Sengers, F. 2017.Unpacking sustainabilities in diversetransition contexts: solar photovoltaicandurban mobility experiments in India and Thailand.
Sustainability Science, 12 (4), pp. 579-596.16. Spitzeck, H., Hansen, E.G. 2010 Stake holder governance – how do stake holder sinfluence corporate
decision-making? Corporporate Governance International Journal of Business Society, 10(4), pp.378–391.
17. Thomas, CD, Cameron, A., Green, RE, Bakkenes, M., Beaumont, LJ, Collingham, YC, Erasmus,BFN, de Siqueira, MF, Grainger, A., Hannah, L., Hughes, L., Huntley, B., van Jaarsveld, AS,
Midgley, GF, Miles, L., Ortega-Huerta, MA, Peterson, AT, Phillips, OL, Williams, SE, 2004.Extinctionriskfrom climate change. Nature 427 (6970): 145-148. doi: 10.1038 / nature02121
18. Wiek, A., Harlow, J., Melnick, R., van derLeeuw, S., Fukushi, K., Takeuchi, K., Farioli, F., Yamba,F., Blake, A., Geiger, C., Kutter, R. 2015. Sustainabilityscience in action – a review of the state of
thefieldthrough case studies on disasterrecovery, bioenergy, andprecautionarypurchasing.SustainabilityScience, 10, pp. 17–31.
[[77]]
INTERNATIONAL MULTIDISCIPLINARY PEER REFEREED JOURNAL DELIBERATIVE RESEARCH/Volume-47/Issue-47/July-Sept, 2020
The Future of Multilateralism with an Impact
inWorld Economy Due to Covid-19*
Recommended ByRaymond Kwun-Sun LAU
Lecturer in History Hong Kong
Baptist University, Hong Kong
Author
Nabonita Sen*Research Assistant (CSIRD)
Center for Studies in International Relations
and Development, KolkataEmail:- [email protected]
Mobile: - 8967088098
AbstractCovering and encompassing across the globe, multilateralism seems to be in an
emergency crisis conciseness. Skepticism or cynicism welfare of the multilateral order
grounded in cardinal or fundamental liberal principles revealing and displaying throughout
the Western world, inside the European nations, Brexit and, discordance over the European
Union’s (EU) the future is under a shell that’s causing damage to the EU as a regionalmultilateral pillar, bordering the supranational bloc’s capacity as a global actor as well.
Nonetheless, to say at the same time, a more forceful, and decisive rather confidently China
and Russia are looking for the outlook, to reshape multilateralism, challenging the primitive
liberal principles that have guided the post-Cold War multilateral order, to which the world
has become habituated. The multilateral order has witnessed tremendous prosperity in thepost cold war era having multilateral cooperation in presence. Yet to say, multilateralism can
only operate in the geopolitical context within which it exists. The woeful return of great-
power competition, so noticeably diminishing during the heralding decades, is dissolving the
very key foundations on which the multilateralism of the post-Cold War era stood. Deepcascades and vulnerabilities have been created between democratic and authoritarian states.
As states continue to cannon those channels, the United States and other democratic countries
have moved toward a conception of multilateralism that defends democratic interests within
existing, and even the new ones.The prospects of multilateralism at regional and global levels will also inspect and
scrutinize ways in reforming the existing international organizations so they are better placed
to get to grips with new global issues. The prospects of multilateralism as well as the adverse
affects of COVID 19 will cover the area of discussion leading to democratic populism,
[[78]]
ISSN : 0976-1136
economic slowdowns, stagnation of supply chains, unemployment, change in people’sbehavior, and how with effective, efficient and innovative strategies that we can expect for
better running global governance.
Keywords:- Future of Multilateralism, Transformation of Multilateral system, New actors,
Multilateralism 2.0, Multi-polarity, World Economic Forum, shrinking of Economies,
Unemployment, Power Politics, COVID 19, Uniting OfNations.
IntroductionPromotion, encouragement, facilitation and cooperation among countries has
supervised and delivered concerted responses to development provocations with having
multilateral organizations like IMF, UN and World Bank on a conventional ground. 65 years
ago these organization, following Second World War marked an international plat forcollective development assistance worldwide. The expeditiously changing landscape in which
development takes place summons the prospects of multilateral development cooperation
query. Expansion, growth are today in a state of variability. The international abode which
continues to be defined by pecuniary (financial) and food crisis, undersupply of resourcesparticularly land and water and the provocation of climate change bespeak the pivotal
importance of multilateral agencies as apparatus and plat for associating with global problems
that demands for collective efforts by nations. As of the new and re-emerging actors, such as
the BRICS (Brazil, Russia, India, China, and South Africa), the private sector, continue toadapt, adjust and amend the international landscape, new provocations and opportunities for
multilateral developmental cooperation that have begun to appear, including the need to
streamline the international abet framework and reduce dismemberment and splitting, explore
new models for diversification, augmentation and improve exemplary multilateral
amplification of agencies for better reflection in new geopolitical realities. The kinds ofmultilateralism that would be required to pursue some of the alternative projects of society,
namely those which concur with some of the indispensable normative allegiance of the
MUNS(Multilateralism and United Nation System) programs that is, non-violent means for
dealing with conflict, social equity, protection of the biosphere, and diffusion of power
among social groups and societies. The art of war identified herein are both 'hierarchic' (i.e.relying on traditional international organizations) and 'flipped' (i.e. involving a new
multilateralism to construct in civil society). (Michael Schechter (Ed) 1999: 2)The transformation of multilateral system with two major and vast developments
happening at the same place as, multilateralism is being currently transformed. Multi-polaritytrend as expressed by the rising number of state that acts as key players stands first. Several
states are becoming dominant players as global or regional actors that are what the today’s
reality pictures are. The voting behavior of BRICS countries in the UN and their presence
further elucidate the trend. The new type of actors that are changing the nature and form ofplaying in the multilateral arena stands as second development. The statehood properties are
increasingly present in the area if IR region since 1974. Apparently to say, it was on 3rdMay
2011 the UNGA aggrandized the EU’S status by giving its speaking right (Right to speak
among the representatives of major groups) this decree opened the doors for other regional
organizations to plea the same speaking right, which indisputably will happen in the nearfuture.
The rule of ‘one state one vote’ within the UN could in a way create imbalance and
would bring about new latitudes with these two developments together as a whole,
multilateralism is no longer the only player between states, but various regions as well as
other actors are existing and are enormously and immensely changing the multilateral racket.Evidently to say, multilateralism is still based upon equilibrium and equivalence of state,
these states are regarded as the constitutive element of the multilateral system as well as to
determine the form of multilateralism it is their inter-dependence that defines.
[[79]]
INTERNATIONAL MULTIDISCIPLINARY PEER REFEREED JOURNAL DELIBERATIVE RESEARCH/Volume-47/Issue-47/July-Sept, 2020
Some truly globalized problems such as climatic change, proliferation of weapon ofmass destruction and many more has led to an emergency of addressing it that has led to
increasing paradox of governance. (Gill 1997: 1-2) The ‘state’ which is the building blocks ofmultilateralism seems less and less capable of analyzing the provocations of globalization,
unilaterally to confront and get to grips with multilateral development is to use the allegory of
multilateralism 2.0. It stresses on the emergence of network thinking and practices inInternational Relation. Secondly, it even transforms multilateralism from a close to an open
and wide system. It was the primacy of sovereignty during multilateralism phase 1.0 that
served the ultimate and most important principle in International Relation. But in
juxtaposition to 2.0, there are players other than sovereign new state who to an extent
provocations the conception of sovereignty where, regions now play a ro le of one such typeof actors. The efforts of Para-diplomacy of the multilateral ambitions have as well increases
the sub-national regions, resulting IR to become much more than just inter-state relation that
boast major consequence for how International Relation gets to develop and becomes
regularize as well as for how far International Relation is sought to be studied with its widergrowing arena. The supra and sub-national government entities are both dependent agencies
(whose degrees of freedom would go as far as states allow them to go) that is built largely by
the state which pre se is a fascinating phenomenon, what was once an exclusive playground
for state has now become room that state have to share with others. Irrespective of thedifferences in provincial size, citizenry, military and incomparable remunerative strength, thepossibility of state-centered multilateralism comes only when states are equally looked on.
The Westphalia principle of sovereignty which says working with the principle of
‘one vote one state’ though it is universally acknowledged, in reality its practice stands
perplexing and finical. In multilateralism 2.0 these could be balanced and materialize thougha more flexible system that compares actors in terms of certain dimensions and parameters
such as economic powers.
In the present multilateral system the United Nations occupies a major position. With
emerging ‘mode of multilateralism 2.0’ it needs to open up to regions, but as UN is a global
organization with sovereign state, as members, this can be a problem. The institutional reformthat aims in reinforcing multilateralism as the indispensable issue, in how to create balance of
power and stability among UN members and as well ‘balance of responsibilities and
representation’ for the people of our planet. A radically rethinking is fervent and vehemently
needed which identifies that, next to states, world regions are based upon integrationprocesses between states that plays a role in establishing an effective multilateralism.
In today’s reality, ‘world regions’ are becoming increasingly important tool of globalgovernance in overall developments. This particularly needs to be a lot more creative,
innovative and effective, thinking based upon careful analysis of regional dimension ofongoing conflicts and chaos of existing cooperation between UN and regional organization.
(Gill 1997:171-173)
The emerging new world order is a complex functioning order that gives challenges to
any proposal to rethink multilateralism in a way that it incorporates regionalism and where it
needs to be more flexible. Not only UN, but the regional organization themselves needs toadjust with the reality of multilateralism2.0.
As 2020 began, it cogitated about the situation on where we stand and where we are
heading, ecologically if we talk, by 2040 the average atmospheric temperature will increase
by 3% which will destroy rather ruin numbers of ecosystems that are surpassing on tipping
points.No agreement as such has reached where the situation of ‘more likely’ has changed to
‘most desirable’ scenario. Nonetheless, to say all have agreed on the broad idea of working
towards the global common good. Multilateralism at the present scenario is still facing
[[80]]
INTERNATIONAL MULTIDISCIPLINARY PEER REFEREED JOURNAL DELIBERATIVE RESEARCH/Volume-47/Issue-47/July-Sept, 2020
unprecedented crisis with old and new world powers challenging its values, aims, processesand institutions.
As UN at its center, multilateralism, for the developing countries is considered an
indispensable pillar of the global systems as it provides for an world order not determined by
‘might’ but by a set of rules that applies to all. Multilateralism’s current retreat necessitates a
proactive strategy from developing countries to be a co-shaper of a new system.The concept and foremost agenda for the upcoming year 2030 for the goal of
sustainable development have marked and paved its way for a typically novel kind of
multilateralism. Starting from the sectors like ‘economic growth’ to the level of
environmental protection, the issues have covered the foremost intention of Sustainable
Development Goals (SDG) which requires a greater level of collaboration, coordination andcommitment hence forth. The global goals are also known as the sustainable development
goals. In 2015, all united nation member states has adopted these as a ‘universal call to
action’ in eliminating poverty, safeguard the planet and to make sure that peace and
prosperity is both appreciated by people, by the year 2030. The amalgamation of 17 SDGshas recognized that action in one area will affect the outcomes in others and so the
development must balance social, economic and environmental sustainability. As the pledge
of ‘No one leaves behind’ which the countries have committed, so as to accelerate progress
for those furthest behind first. In a way, SDGs are designed to bring the world to severalcathartic life-changing ‘Zeros’ including rock bottom poverty, hunger, discrimination against
women and girls. In the process of achieving these SDGs technology and importantly
financial resources from all society are necessary from every context. In order to tackle a
global and local challenge that appears to grow in scale and complexity, a postulated rather
effective multilateral system comes out as a unique platform. The 2030 agenda comes outwith the share responsibility of the member states and the UN development system (UNDS)
which should effectively practice and make the agenda financially stable.
The goal or the target of achieving sustainable development leading to the future of
multilateralism comes with the funding of both the member states and other funding partners.
But while encouraging the contribution there’s a worrying trend as member states prefersfunding projects and activities of their interest so-called the ‘EARMARK’. The proportion of
earmark contributions was about 54%in 2016. The most flexible source of funding by the
member states and UNDP have been stagnated and declined in some cases, which is, a way,
has reached as low as 12% by the end of 2017.The stagnation not only limits the strategic and flexibility of fund usage in a way
invites competition and mandate drift, as agencies compete or rather fights in a way to secure
funds. The secretary general of UNDS has proposed funding in a way to unlock its full
potentiality by putting forward a set of commitment focusing on the increase level of quantityfunding, core, pooled and thematic on member states. This will enhance transparency,
visibility, efficiency, evaluation and, reporting on consolidated results. Evidently, this has in
a way stands as an incredible opportunity for the UNDS and the international community to
increase effectiveness and impact.
The funding compact not only aims to improve the quantity and quality of budgetaryresources for UN development operation, seeks to enhance the UNDS’s visibility, normative
responsibility, and accountability. It further encourages greater collaboration and innovative
partnerships among UN organizations and private sectors of civil society.
However without a sturdy and broad-based political support the compact will lead to
significant change. The decision-makers and the influencers here play a pivotal role as boththe member states and the UNDS need to communicate the compact value.
Adequate, flexible, and predictable funding contribution to the UN development
makes it possible to:[[81]]
INTERNATIONAL MULTIDISCIPLINARY PEER REFEREED JOURNAL DELIBERATIVE RESEARCH/Volume-47/Issue-47/July-Sept, 2020
To plan and to ensure as strategically as possible, no one is to be left behind.To find and play the part of coordinated, organized, and integrated solution as much as
possible.
Importantly to act spontaneously and decisively when natural or human caused disasterhits the way.
To add up asmuch to the additional leverage development and climate finance.
Those of the US in the UN development have to ensure the fact that the member statesand the other donors continue to trust and believe. As the trust-building process continues, itshould always try to demonstrate that the effectiveness, reliability and efficiency of the
partner on the road to a continuation of the coming year to 2030.If we successfully try and proceed with this process, there will be no such reason as to
why the UN development system should not receive quality funding as that of the othermultilateral institutions do receive.
Refining the funding mechanism for development, the UNDS can effectivelyreinforce multilateralism and reaffirm trusts between member states and the UN. Evidently,
to mention, a group of researchers and practitioners have identified some of the major key
drivers that affect the direction of the future of multilateralism for the next 20 years.Climate change
Power shift
TechnologyInequality
Apart from these key drivers, factors such as demographic growth and change will
have a substantial impact where it is assumed that Africa itself would have 2 billion peoplewith 9 billion people in the world.
Firstly, the climatic change stands as the most potent driver, what we get to see
climate today as this world look massively different, the coastline will reshape, with countries
like Laos. Bangladesh being below sea level, the entire region would turn extremely hot forhuman settlement. Such inundation would result in massive migration in and across Asianand African countries, also affecting Europe and North America.
Due to changing rainfall patterns and extreme weather across the globe, foodproduction will be affected.
In the ‘best case’, the effects of CLIMATE CHANGE would increase the challenges
to the degree that leaders and societies would understand the need to cooperate in a structuredway to intercept the problems together moving to govern resources justly and sustainably.This diverse climatic change will result in an “every man for him” scenario, were states, close
borders will meet the necessity of joint defense, rather than shaping a global common good
proactively, with a view to solidarity and an understanding of common future.Secondly, the key driving factor is the POWER SHIFT that will change the
international dynamics drastically. Alongside China being a major power or the large power
countries like the US, India and the EU will further establish itself as a ‘Major’ by 2040,
cutting off the single hegemonic rule that would invest multilateral cooperation and guaranteeits attractiveness. This, in a way, would make the world more volatile or flexible. Changes
between forums are more likely, as powers will seek to circumvent institutions that block
their immediate interests. Interestingly, the scenario speaks more for the proliferation ofsmaller coalitions of interest, particularly in settings like the G20, BRICS or G7. Some great
powers even rediscovered the UN, which might allow for its strengthening and reformmultilateralism, which is more about diffuse gains and not immediate counterstroke politics.
TECHNOLOGY, which itself gives us a notion of NEW OPPORTUNITY, a newworld with an increment of lots of interactions ACTS AS GAME-CHANGER. Technology
increases interactions in a vast new level and at points; it does even turns as the game
[[82]]
INTERNATIONAL MULTIDISCIPLINARY PEER REFEREED JOURNAL DELIBERATIVE RESEARCH/Volume-47/Issue-47/July-Sept, 2020
changer. Compiling and mining a large portion of quality data (Including through the internetof things) will be an indispensible element for the ultimate success, both for states and private
actors. Technology can often change the increment of productivity and it might mean a more
humane work environment if the shrinking demand for the human workforce is evenly
translated into gains in leisure time. Alternatively, it can even lead to as of more extensive
parts of the population without work. The technology could also allow for more targetedactions, thus even potentially supporting the sustainable use of resources, or new form of
citizen participation, innovation can provide new solutions, which we might now see yet. The
proliferation of advanced military and information technologies increase the risk of
cybercrimes and weapon that the control of governments may or may not be on artif icial
intelligence. The most valuable resource “data” becomes the property of giant privatecompanies creating tensions in societies that demand action from their (weakened) states.
Rising Inequality
Polarization and unrest can be the most robust outcomes which might lead to
inequalities within states. This could force states to become more inward-looking anddefensive, if not seeking advantages beyond their border aggressively. This could further lead
to a decrease of government’s ability to act faced with global problems. Yet there lives a
possibility that in a scenario of global cooperation states would jo intly regulate non state
actors and include them in solutions for the global common good. In a club scenario,countries would at least work together, least far pushed by a likely next financial crisis.
Over the last about 75 years passed by, multilateralism has been a strong driver and
pillar of global integration, peace, and prosperity. It has also been a crucial and played pivotal
role over the former ly accomplishments of the G20, in addressing the pecuniary crisis and
upgrading financial (pecuniary) stability.Recently, however, with globalization, current forms of global governance has
emerged, threatening the very edifice of the rule-based multilateral order, because of its
competing economic model that have opened up partly , issues of fairness and the distribution
of cost and benefit of maintaining the prevailing multilateral system. (Alan S Alexandroff,
Andrew Fenton Cooper, 2010) The political restlessness with multilateralism notably in theUS with insufficiency of the post bretton wood system has to address slow growth, rising
inequality, rising migration, social fragmentation, and job insecurity associated with
technological change, off shoring and automation. Most of the world’s biggest provocations
are not a result of disagreement but a profound loss of direction about cooperation taking inthe first place. A sense of multilateralism creeping beyond the boundar ies as set by the
principle of subsidiary that has created a backlash of democratic populism, protectionism and,
nationalism. For the past couple of years, the proportion of voices and demands has grown
louder and clear which ameliorate the current multilateral system as to reflect the unavoidableturnover in the economic, demographic and political weight of advanced and emerging
economies which have undergone thorough changes. Governmental r igidities in the
multilateral organizations such as IMF, World Bank, UN, WTO and others have adequately
prevented reform from being achieved in the very first p lace. At the same time,
‘disillusionment with multilateralism’ led to contemplation of various alternatives such asrep lacement of multilateral agreement by bilateral deals or replacement of multilateral rules
by geographically proximate countries. None of these alternatives, by far has substituted for
true multilateralism, however, since the world is facing an inherently global provocations that
require concerted global actions.
While in practice this may entail much thinner globalization, an inclusive andsustainable multilateralism is preferable as to no multilateralism at all. The provocation to set
a legalized and authorized general princip le to usher and impel global ru le making that every
nation agrees on and no one is left behind. The current economic globalization is designed to
[[83]]
INTERNATIONAL MULTIDISCIPLINARY PEER REFEREED JOURNAL DELIBERATIVE RESEARCH/Volume-47/Issue-47/July-Sept, 2020
maximize effective efficiency, minimize transaction costs, and reap the benefits of scale. Notsurprisingly, corona pandemic and the resulting world economic slowdown are only
aggravating the existing social inequalities within and among countries. In the middle of
corona virus pandemic , several countries across the globe fell back in to lockdowns to
“compact or iron the curve” of the infection. These lockdowns meant confining and
quarantining millions of citizens to their homes, shutting down businesses, and halting almostall remunerative activities. As per International Monetary Fund (IMF), international
remuneration is expected to decline or drop off by over 3 percent in 2020. Ever since the
precipitous slowdown since the Great Depression of the 1930s.
Now with time, as some countries uplifted restrictions and gradually resuming their
economies, here’s a look at how the pandemic has affected and how they have coped.The pandemic has driven the global economy into a recession, which means the
economy will start shrinking, and growth would stop.
In US, Covid-19-related disruptions and chaotic environment have led to millions of
filing for unemployment benefits. As per a Reuters report, since March, more than 36 millionhas registered for unemployment gain, which reports for nearly a lenity of the work-age
citizenry.
Additionally, an inception analysis by IMF also divulge the manufacturing output in
most countries that has gone down, which gave back a descent fall in external demand and, agrowing expectations as a drop down in domestic demand. It is affecting the inventive
dimensions of countries as the containment measure implies working with less people
creating disruptions in supply chains. It is affecting demand vehemently, as fewer jobs and
less income mean less spending of capital locally and globally. Countries are also affected by
the screwing up of global financial conditions and some are even hit by capital outrush.
COVID-19 and global Rise (impact)The global economy is growing by 3% in 2020 which is an upshot far worse than the
global financial crisis of 2008 as estimated by IMF. Economies of the countries like the US,
Japan, UK, Germany, France, Italy, Spain. This is expected to contract this year by 5.9, 5.2,
6.5, 7, 7.2, 9.1 and 8% respectively. Advanced economies have smacked down and inconjunction they are expected to rise by 6% in 2020. Developing and emerging market will
decline or drop off by 1%. The growth rate for 2020is expected to be 2.2% if china is
excluded from the cache of countries. In the first quarter of 2020, china’s GDP has
deteriorated by 36%, while 5.5% of output has been cut down in South Korea, as the countrydid not impose the strategy of lockdown followed by aggressive testing, contact tracing,
confining or quarantining.
The GDP of France, Spain, and Italy has cut down by 21.3%, 19.2% and 17.2%
respectively in the European continent.Drop off in travel industries and tourism has affected the global industrial activity in
an enormous way. As in transportation section, the fall in oil price, which accounts for 60%
of the oil demand was hit due to several countries imposing lockdowns. Reduce in food
prices by 2.6% in 2020 caused by supply chain disruption and disturbance, border delays,
food security concerns in regions affected by COVID 19 and export restrictions almost theglobe, presented in a project by IMF. Assessment made by world economic forum (WEF)
underpins SMEs (small and medium sized enterprises) and large businesses that are crucial
for maintaining employment and financial stability overall.
In India ,as announced by her finance minister Nirmala Sitharaman the package of
aatmanirbhar bharat which is entitled to provide relief packages to medium, small, microenterprises(MSMEs) in the form of increment in credit assurances and guarantees. Many of
the advanced economies of the world have uprising rolled out a support packages while if we
see in India its economic stimulus package is 10% of its GDP followed by US (13%),
[[84]]
INTERNATIONAL MULTIDISCIPLINARY PEER REFEREED JOURNAL DELIBERATIVE RESEARCH/Volume-47/Issue-47/July-Sept, 2020
Sweden (12%), Germany (10.7%) and so on. However, the WEF notes, “…there is concern
that the size of packages may prove insufficient for the duration of the crisis; that
disbursement may be slower than is needed; that not all firms in need would betargeted; and that such programes may be overly reliant on debt financing.”
Nonetheless to say, the standing out of South Korea is hats offing, as their business
and economic activities were not completely paused, and therefore, their economy was notseverely and adversely affected.
China has not long ago elevated its lockdown and has since then been gingerly
reopening its economy without a truculent and bellicose second wave of infections so far so
found.
Further, even as the economic activity recommence gingerly, the situation will taketime to anneal, as consumer behaviors has changed, as a result, of continued social
distancing and unreliability, about how the pandemic will evolve or emit.
For instance, in the report of World Economic Outlook for 2020, the IMF mentions
that firms can start hiring more people and expanding payroll ‘only slowly’, as it may not beclear about the demand for their output.
A comprehensible and effective communication, broad monetary and fiscal stimuli
will be required to get more coordinated on a global scale for maximum influence, and, that
would be most effective to augment or magnify in spending during the rehabilitation period.
ConclusionThe globe is tending in becoming more and more multi-polar, a multi-polarity of
weak stanchion. But as processing forward, a more bigoted or biased pillar will prioritize its
own recuperation. (Gill 1997: 171-173) Apart from transpire of demographic challenge, china
will have a rapid decline or drop off in workforce (in near decades) which will need tostimulate and facilitate the equilibrium of its remuneration so that it is export-led as its
indispensable trading partners re-assess its supply chain. Other powers like Europe, Germany
is also presuming to embrace a less export-led model, the EU will be more bigoted, focusing
on protecting strategic construction of which it will apparently, give an expanded definition.
Power is more uniformly scattered but the skyline of every country has diminished ordropped. In reality when the test of multilateralism happens, the major powers shall then
realize, that like those patients who have suffered a drastic stretch of COVID19, and are all
thoroughly weakened by its adverse affects, it is then, that the very, COVID19 crisis has not
made any defeater, but dead losses.The tendency of major power to move for more safeguarding and domestically-
engrossed national posture, they select for what could be described as the weak political
power, or unconventionally acknowledge that a more cooperative posture will benefit them in
the middling term.Multilateralism would be indubitably weakened with weak power politics keeping
their beguilement too. Chintzy power politics also stands probable here, rather than making
one’s own strength, the weak power political game use the potential of opponent’s
weaknesses .The UN is likely to dwindle away, in this scenario, as UN cannot transform itself
without its member states and also without a strong robust push. Differences lie, rather thanactive hostility or active antagonism. Without an active support it is enough to get weaken
gradually, that is difficult to sort out. The restriction in its structure as shown a dealing with
emerging transnational issues for which it did not come up, whether it is incendiary, decaying
of states or the impact of new mechanizations.( Mario Telò 2012:159-161)
According to UN mission peace and security would remain as its core, always. Theresponsibility to protect lies with the shared interest among power in stopping the expansion
of ungoverned spaces which in near future can become a port in storm for incendiary.
Without fully endorsing democratization the agenda of the member state nurtures several
[[85]]
INTERNATIONAL MULTIDISCIPLINARY PEER REFEREED JOURNAL DELIBERATIVE RESEARCH/Volume-47/Issue-47/July-Sept, 2020
peace keeping operations in the early 2000s, which might agree to provide comprehensivesupport during the brink of collapse of states.
The worldwide crisis created due to COVID 19 has shown how the world is
connected and how most challenges cannot find solutions purely depending upon its nations.
Climate, pandemic, cyber, AI are global challenges that requires global coordination and
cooperation with responsible responses. In this context, the need for the specialized agenciesshould be modernized and strengthened. Lastly, the crisis of COVID 19 demonstrate that in
any major world crisis and effective, efficient, supportive and close response that must
integrate technical, economic, pecuniary and political dimensions.
ReferencesAlan S Alexandroff, Andrew Fenton Cooper – Centre for International Governance Innovation, Woodrow
Wilson School of Public &International Affairs, Project on the Future Multilateralism, 2010. Rising State,Rising Institutions: Challenges for Global Governance.
Michael Schechter, (Ed), Palgrave Macmillan, 1999. Future Multilateralism: The Political and SocialFramework, p.1-2, 136
Mario Telò, Springer Netherlands, 2012. State, Globalization and Multilateralism: The Challenges of
Institutionalizing Regionalism.
Stephen Gill, Palgrave MacMillan, 1997. Globalization, Democratization and Multilateralism. p. 2, 171-173.
German development institute, Silke weinlich, Sven Grimm: The future of Multilateralism, 8 January
2020.https://blogs.die-gdi.de/2020/01/08/multilateralism-without-future-or-the-future-of-multilateralism/
Italian Institute for Political Studies; Elizabeth Sidiropoulos, SAIIA: Future ofMultilateralism: Towards the
Italian G20, 7 October 2019.https://www.ispionline.it/en/pubblicazione/future-multilateralism-toward-italian-g20-24079
Luk Van Langenhove; Multilateralism 2.0: The transformation of International Relations, 31st May
2011.https://unu.edu/publications/articles/multilateralism-2-0-the-transformation-of-international-relations.html
Julia Pomares, Blair Sheppard, Ngaire Woods; World policy Forum: What can G20 do to reinvigorate
multilateral cooperation in a new global order?.https://www.global-solutions-initiative.org/summit/summit-2020-themes/the-future-of-multilateralism-and-global-governance/
G20 Insights, The Future of Multilateralism& global governance.https://www.g20-insights.org/policy_area/governance-international-institutions/
The Indian Express, By; Explained desk, Explained: How has covid19 affected the global
economy.https://indianexpress.com/article/explained/explained-how-has-covid-19-affected-the-global-economy-6410494/
The Economic Times; Covid-19 pandemic worse than 2008-09 financial crisis: IMF, April2020.https://economictimes.indiatimes.com/news/international/world-news/covid-19-pandemic-worse-than-2008-09-financial-crisis-imf/articleshow/75161296.cms?from=md
Hany Besada and Sebastian Kindornay, Introduction: Multilateralism in an era ofchange.https://link.springer.com/chapter/10.1057/9781137297761_1
Homi Kharas, co-authored by; Sebastian Strauss, World Economic Forum: The Future https://www.global-
solutions-initiative.org/press-news/the-future-of-multilateralism/https://www.undp.org/content/undp/en/home/sustainable-development-goals.html
[[86]]
INTERNATIONAL MULTIDISCIPLINARY PEER REFEREED JOURNAL DELIBERATIVE RESEARCH/Volume-47/Issue-47/July-Sept, 2020
A Review of the Progression of the Accident
and the Amount of the Radionuclides Released
During the Chernobyl Nuclear Disaster in
Ukraine
MehtaabKaurDr. S SBhatnagar University Institute of Chemical Engineering and Technology
Panjab University, Chandigarh
This paper reviews the Chernobyl Nuclear Disaster. Vast areas of Belarus, the
Russian Federation and Ukraine were contaminated and trace deposition of released
radionuclides was measurable in all countries of the northern hemisphere. The above
mentioned nuclear accident of 26April 1986 occurred at the Chernobyl Nuclear power plant,located in Ukraine about 20 km south of the border with Belarus. An estimation of
radionuclide amounts released has been given provided here. A crude analysis of air samples,
taken at 400-600m above the ground in the vicinity of the Chernobyl power plant on 27
April1986, indicated that large radioactive particles, varying in size from several to tens of
micrometers, were found together with an abundance of smaller particles. From theradiological point of view, 131I and 137Cs, are the most important radionuclides to consider,
because they were responsible for most of the radiation exposure received by the general
population. The environmental behavior of deposited radio-nuclides depends on the physical
and chemical characteristics of the radionuclide considered, on the type of fallout (i.e. dry orwet), and on the characteristics of the environment .Special attention has been devoted to131I,137Csand90Sr. Deposition occurred both on the ground and on water surfaces.
The accident at ChernobylThe accident at the Chernobyl nuclear power station occurred when a low-power
engineering test of the Unit 4 reactor was being conducted .The Chernobyl reactor was of the
type RBMK, which is an abbreviation of Russian terms meaning reactor of high output, multi
channel type. It is a pressurized water reactor which uses light water as a coolant and graphite
as a moderator. The events leading to the accident at the Chernobyl Unit4 reactor at
about1.24 a.m. on 26April1986 resulted from efforts to conduct a test on an electric controlsystem, which allows power to be provided in the event of a station blackout [1]. Actions
taken during this exercise resulted in a significant variation in the temperature and flow rate
of the inlet water to the reactor core (beginning at about1.03a.m.).The unstable state of the
reactor before the accident is due to two factors:1. basic engineering deficiencies (such asgraphite-tipped control rods, instability at low power levels and large positive coefficient of
reactivity under certain conditions) 2. faulty actions of the operators (e.g., switching off the
emergency safety systems of the reactor)[1].The relatively fast temperature changes resulting
from the operators’ actions weakened the lower transition joints that link the zirconium fuel
ISSN : 0976-1136
[[87]]
channels in the core to the steel pipes that carry the inlet cooling water[2].Other actionsresulted in a rapid increase in the power level of the reactor [3], which caused fuel
fragmentation and the rapid transfer of heat from these fuel fragments to the coolant (between
1.23:43 and 1.23:49a.m.) . This caused the generation of a shockwave in the cooling water,which led to the failure of most of the lower transition joints. As a result of the failure of
these transition joints, the pressurized cooling water in the primary system was released, andit immediately flashed into steam. The steam explosion occurred at1.23:49. It is believed that
the reactor core might have been lifted up by the explosion [2], during which time all waterleft the reactor core. This resulted in an extremely rapid increase in reactivity, which led to
vaporization of part of the fuel at the centre of some fuel assemblies and which was
terminated by a large explosion attributable to rapid expansion of the fuel vapourdisassembling the core. This explosion, which occurred at about 1.24a.m., blew the core apart
and destroyed most of the building. Fuel, core components, and other structural items wereblown from the reactor hall onto the roof of adjacent buildings and the ground around the
reactor building. A major release of radioactive materials into the environment also occurredas a result of this explosion. The core debris dispersed by the explosion started multiple
(more than 30) fires on the roofs of the reactor building and the machine hall, which werecovered with highly flammable tar. Some of those fires spread to the machine hall and,
through cable tubes, to the vicinity of the Unit3 reactor. A first group of 14 firemen arrivedon the scene of the accident at1.28a.m. Reinforcements were brought in until about 4a.m.,
when 250 firemen were available and 69 firemen participated in fire control activities. Theseactivities were carried out at upto 70m above the ground under harsh conditions of high
radiation levels and dense smoke.By2.10 a.m., the largest fires on the roof of the machine hall
had been put out, while by 2.30a.m.the largest fires on the roof of the reactor hall were undercontrol .By about 4.50a.m., most of the fires had been extinguished. These actions caused thedeaths of five fire fighters. It is unclear whether fires were originating from the reactor cavity
during the first20 h after the explosion. However, there was considerable steam and water
because of the actions of both the fire fighters and the reactor plant personnel. Approximately
20h after the explosion, at9.41 p.m., a large fire started as the material in the reactor becamehot enough to ignite combustible gases released from the disrupted core, e.g. hydrogen fromzirconium-water reactions and carbon monoxide from the reaction of hot graphite with steam.
The fire made noise when it started (some witnesses called it an explosion) and burned with a
large flame that initially reached at least 50m above the top of the destroyed reactorhall[2].The first measures taken to control the fire and the radionuclide releases consisted ofdumping neutron-absorbing compounds and fire-control materials into the crater formed by
the destruction of the reactor. The total amount of materials dumped on the reactor was
approximately 5,000t , including about 40 t of boron compounds, 2,400 t of lead, 1,800 t ofsand and clay, and 600 t of dolomite, as well as sodium phosphate and polymer liquids.About 150t of materials were dumped on 27 April, followed by 300 t on 28 April, 750 ton29
April, 1,500 t on 30 April, 1,900 t on1 May, and 400 t on 2 May.About1, 800 helicopter
flights were carried out to dump materials onto the reactor. During the first flights, the
helicopters remained stationary over the reactor while dumping the materials .However, asthe dose rates received by the helicopter pilots during this procedure were judged to be toohigh, it was decided that the materials should be dumped while the helicopters travelled over
the reactor. This procedure, which had a poor accuracy, caused additional destruction of the
standingstructures and spread the contamination. The radionuclide releases from the damaged
reactor occurred mainly over a10-day period, but with varying release rates. An initial highrelease rate on the first day was caused by mechanical discharge as a result of the explosions
in the reactor. There followed a five-day period of declining releases associated with the hot
air and fumes from the burning graphite core material. In the next few days, the release rate
INTERNATIONAL MULTIDISCIPLINARY PEER REFEREED JOURNAL DELIBERATIVE RESEARCH/Volume-47/Issue-47/July-Sept, 2020
[[88]]
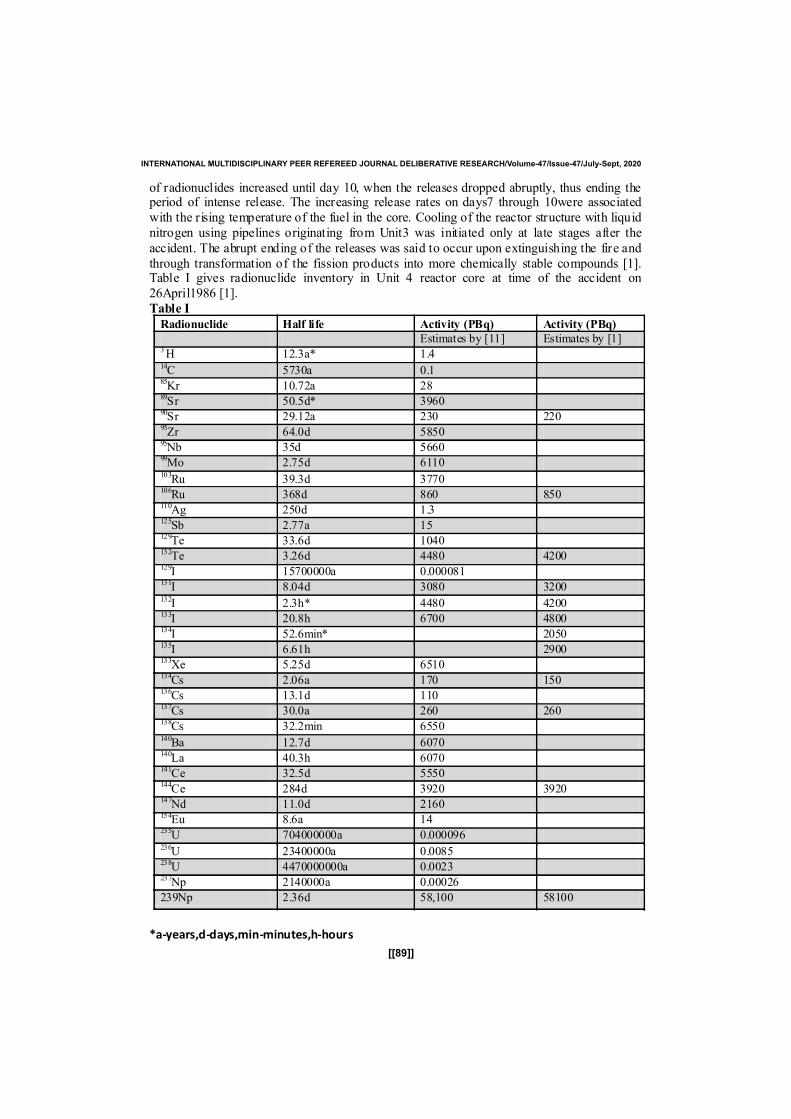
of radionuclides increased until day 10, when the releases dropped abruptly, thus ending theperiod of intense release. The increasing release rates on days7 through 10were associatedwith the rising temperature of the fuel in the core. Cooling of the reactor structure with liquidnitrogen using pipelines originating from Unit3 was initiated only at late stages after the
accident. The abrupt ending of the releases was said to occur upon extinguishing the fire andthrough transformation of the fission products into more chemically stable compounds [1].Table I gives radionuclide inventory in Unit 4 reactor core at time of the accident on26April1986 [1].Table I
Radionuclide Half life Activity (PBq) Activity (PBq)
Estimates by [11] Estimates by [1]3H 12.3a* 1.414C 5730a 0.185Kr 10.72a 2889Sr 50.5d* 396090Sr 29.12a 230 22095Zr 64.0d 585095Nb 35d 566099Mo 2.75d 6110103Ru 39.3d 3770106Ru 368d 860 850110Ag 250d 1.3125Sb 2.77a 15129Te 33.6d 1040132Te 3.26d 4480 4200129I 15700000a 0.000081131I 8.04d 3080 3200132I 2.3h* 4480 4200133I 20.8h 6700 4800134I 52.6min* 2050135I 6.61h 2900133Xe 5.25d 6510134Cs 2.06a 170 150136Cs 13.1d 110137Cs 30.0a 260 260138Cs 32.2min 6550140Ba 12.7d 6070140La 40.3h 6070141Ce 32.5d 5550144Ce 284d 3920 3920147Nd 11.0d 2160154Eu 8.6a 14235U 704000000a 0.000096236U 23400000a 0.0085238U 4470000000a 0.0023237Np 2140000a 0.00026
239Np 2.36d 58,100 58100
*a-years,d-days,min-minutes,h-hours
INTERNATIONAL MULTIDISCIPLINARY PEER REFEREED JOURNAL DELIBERATIVE RESEARCH/Volume-47/Issue-47/July-Sept, 2020
[[89]]
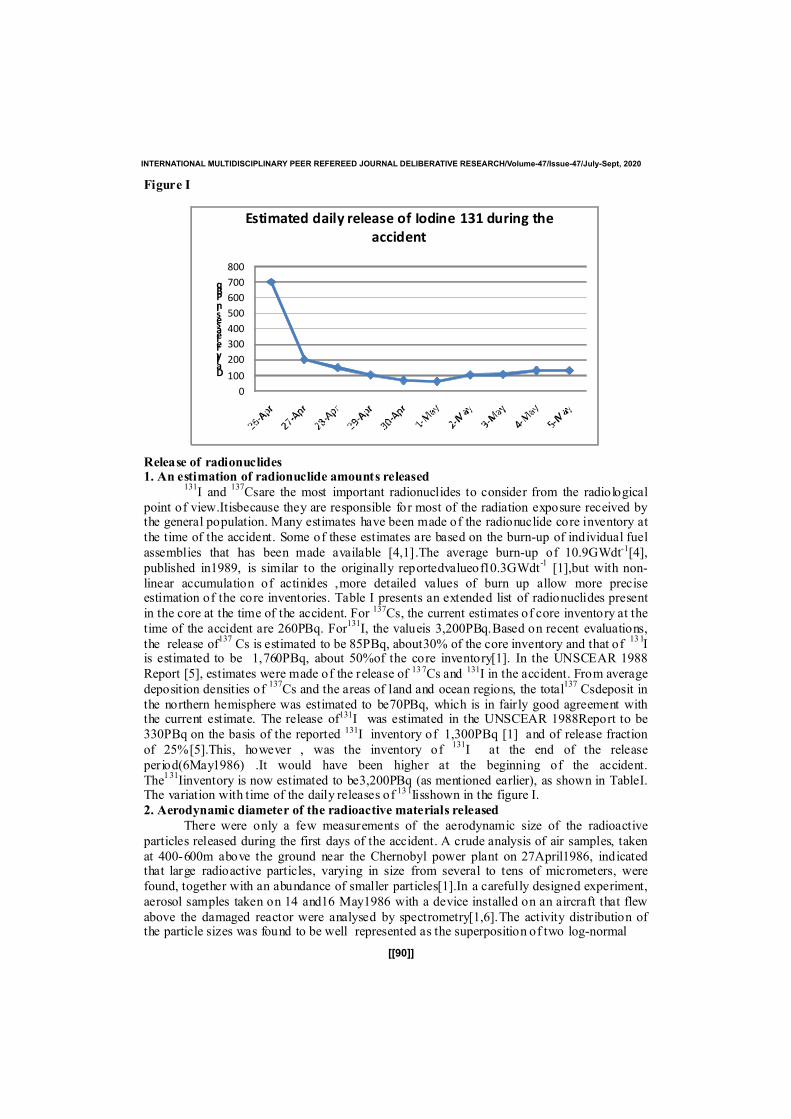
Figure I
Release of radionuclides1. An estimation of radionuclide amounts released
131I and
137Csare the most important radionuclides to consider from the radiological
point of view.Itisbecause they are responsible for most of the radiation exposure received bythe general population. Many estimates have been made of the radionuclide core inventory atthe time of the accident. Some of these estimates are based on the burn-up of individual fuel
assemblies that has been made available [4,1].The average burn-up of 10.9GWdt-1[4],
published in1989, is similar to the originally reportedvalueof10.3GWdt-1[1],but with non-
linear accumulation of actinides ,more detailed values of burn up allow more preciseestimation of the core inventories. Table I presents an extended list of radionuclides present
in the core at the time of the accident. For 137Cs, the current estimates of core inventory at thetime of the accident are 260PBq. For
131I, the valueis 3,200PBq.Based on recent evaluations,
the release of137Cs is estimated to be 85PBq, about30% of the core inventory and that of
131I
is estimated to be 1,760PBq, about 50%of the core inventory[1]. In the UNSCEAR 1988
Report [5], estimates were made of the release of 137Cs and 131I in the accident. From average
deposition densities of137Cs and the areas of land and ocean regions, the total
137Csdeposit in
the northern hemisphere was estimated to be70PBq, which is in fairly good agreement withthe current estimate. The release of131I was estimated in the UNSCEAR 1988Report to be330PBq on the basis of the reported 131I inventory of 1,300PBq [1] and of release fraction
of 25%[5].This, however , was the inventory of131I at the end of the release
period(6May1986) .It would have been higher at the beginning of the accident.The
131Iinventory is now estimated to be3,200PBq (as mentioned earlier), as shown in TableI.
The variation with time of the daily releases of 131Iisshown in the figure I.2. Aerodynamic diameter of the radioactive materials released
There were only a few measurements of the aerodynamic size of the radioactive
particles released during the first days of the accident. A crude analysis of air samples, takenat 400-600m above the ground near the Chernobyl power plant on 27April1986, indicatedthat large radioactive particles, varying in size from several to tens of micrometers, werefound, together with an abundance of smaller particles[1].In a carefully designed experiment,
aerosol samples taken on 14 and16 May1986 with a device installed on an aircraft that flew
above the damaged reactor were analysed by spectrometry[1,6].The activity distribution ofthe particle sizes was found to be well represented as the superposition of two log-normal
0
100
200
300
400
500
600
700
800
DailyreleasesinPBq
Estimated daily release of Iodine 131 during the
accident
INTERNATIONAL MULTIDISCIPLINARY PEER REFEREED JOURNAL DELIBERATIVE RESEARCH/Volume-47/Issue-47/July-Sept, 2020
[[90]]
functions: one with an activity median aerodynamic diameter(AMAD) ranging from0.3to1.5µm and a geometric standard deviation (GSD)of1.6-1.8, and another with an AMAD
of more than10µm. The larger particles contained about 80%-90% of the activity of non-volatile radionuclides such as
95Zr,
95Nb,
140La,
141Ce,
144Ce and transuranium radionuclides
embedded in the uranium matrix of the fuel[7].Conclusion
The Chernobyl accident was the result of a lack of "safety culture". The reactor designwas poor from the point of view of safety and unforgiving for the operators, both of which
brought about a dangerous operating state. The operators were not aware of this and also didnot know that the test performed could have brought the reactor into an explosive condition.
In addition, they did not comply with established operational procedures. The combination ofthese factors resulted in a very severe nuclear accident in which the reactor was totally
destroyed within a few seconds. The duration of the radio nuclide release was very long,lasting more than a week with two periods of intense release. Another significant feature was
the emission (about 4%) of fuel material which also contained embedded radionuclides oflow volatility such as cerium, zirconium and the actinides. The composition and
characteristics of the radioactive material in the plume changed during its passage due to wetand dry deposition, decay, chemical trans-formations and alterations in particle size. The area
affected was particularly large due to the high altitude and long duration of the release as wellas changes in wind direction. However, the pattern of deposition was very irregular , andsignificant deposition of radionuclides occurred where the passage of the plume coincided
with rainfall. The releases of131I and
137Cs are estimated to have been1,760 and 85PBq,
respectively.
References[1] United Nations. Exposures and effects of the Chernobyl Accident,Annex J to Volume II of the UnitedNations Scientific Committee on the Effects of Atomic Radiation , 2000 Report to the General Assembly
(2000).[2] Purvis, E.E. III . The Chernobyl 4 accident sequence: update -April1995. Report of the Ukrainian Academy
of Sciences, Intersectorial Scientific and Technical Center (ISTC) "UKRYTIE". Kiev (1995).[3] International Atomic Energy Agency .The Chernobyl accident: updating of INSAG-1 .Safety Series No.75-INSAG-7.IAEA, Vienna (1992).
[4]Begichev, S.N.,A.A.Borovoi, E.V.Burlakovetal. Radioactive releases due to the Chernobyl accident.Presentation at International Seminar on Fission Product Transport Processes in Reactor Accidents , Dubrovnik
,May1989.[5] United Nations . Sources, Effects and Risks of Ionizing Radiation. United Nations Scientific Committee on
the Effects of Atomic Radiation, 1988 Report to the General Assembly, with annexes .United Nations salespublication E.88.IX.7. United Nations, NewYork, 1988.
[6]Gaziev, Ya.I., L. E. Nazarov, A. V. Lachikhin et al. Investigation of physical and chemical characteristics ofthe materials in gaseous and aerosol forms released as a result of the Chernobyl accident and assessment of the
intensity of their releases .in: Proceedings of the First All-Union Conference “Radiation Aspects of theChernobyl Accident”, Obninsk 1988. Volume1.Hydro meteoizdat Publish ing House, Saint Petersburg, 1993.
[7]Kutkov, V.A., Z.S.Arefieva, Yu.B.Muravev et al .Unique form of airborne radioactivity: nuclear fuel “hotparticles” released during the Chernobyl accident .p.625-630in: Environmental Impact of Radioactive Releases.
Proceedings of a Symposium, Vienna ,8-12 May1995.
INTERNATIONAL MULTIDISCIPLINARY PEER REFEREED JOURNAL DELIBERATIVE RESEARCH/Volume-47/Issue-47/July-Sept, 2020
[[91]]
Political Dynamics of Assam in the Post-
Assam Agitation Period
Binoyjyoti DasPhD research scholar, CSSS/SSS/JNU
Abstract
This article is a comparative study of Assam assembly election results in the post 1979period which brought a major political shift from its previous structure. Identity crises have
been dominating issue for Assam and its indigenous people since the time of partition in itspolitical atmosphere. Change in the demographic composition as shown by the census data
and anomalies in voter list lead to event like Assam Agitation that came into end with signingof Assam Accord. Such events and process brought changes to the political dynamics in thestate. This paper is an attempt to present an analysis about the transition of political dynamicsof the state from 1979 to contemporary years. The state which politics was once known for its
cultural identity politics is witnessing transition to communal politics alike mainland India incontemporary times due to latencies that came with Assamese subnationalism and Assammovement.
Key words: Assam, Politics, Identity, Ethnicity, Nationalism, Subnationalism
Identity issues of Assam was never been taken seriously by the central government aswe do not see any concrete steps which was alerted by M.C. Mullan about two decades prior
to India’s independence. Unlike western border that shared with Pakistan, eastern bordershared with India added born Bangladesh is never being taken with utmost security concern.Unabated infiltration has been an unattended issue of eastern border since the time ofpartition, only difference with the western border here was that this separatism tendency has
not been very strong and religion is not the cause for separatist tendencies wherever it wassurfaced.
Assam movement is a political movement as it aims to restore its unique identity from the
passive aggression of outsiders. India being a union of states with strong Centre, most importantaspects of governance are under it such as citizenship, defence, foreign affairs etc. The issue of
foreigners could only be dealt by union government and therefore coordination between state and
union government have been utmost important. After independence, the greater Assam’s (with fournorth-eastern states with present days’ Assam) political environment was dominated by Indian
National Congress (INC) till 1962, although there were as many twelve other political parties
including independent candidates been participated in the Assembly elections. With many otherattributes, hangover of independent movement, illiteracy and lack of electoral experiences can be
attributing to the one-party domination in the political scenario. But, in spite of same party
government in both Centre and State, issues of illegal migration not been attended and also easternborder was not been under vigilance and security as compared to western border that shared with
West Pakistan.
ISSN : 0976-1136
[[92]]
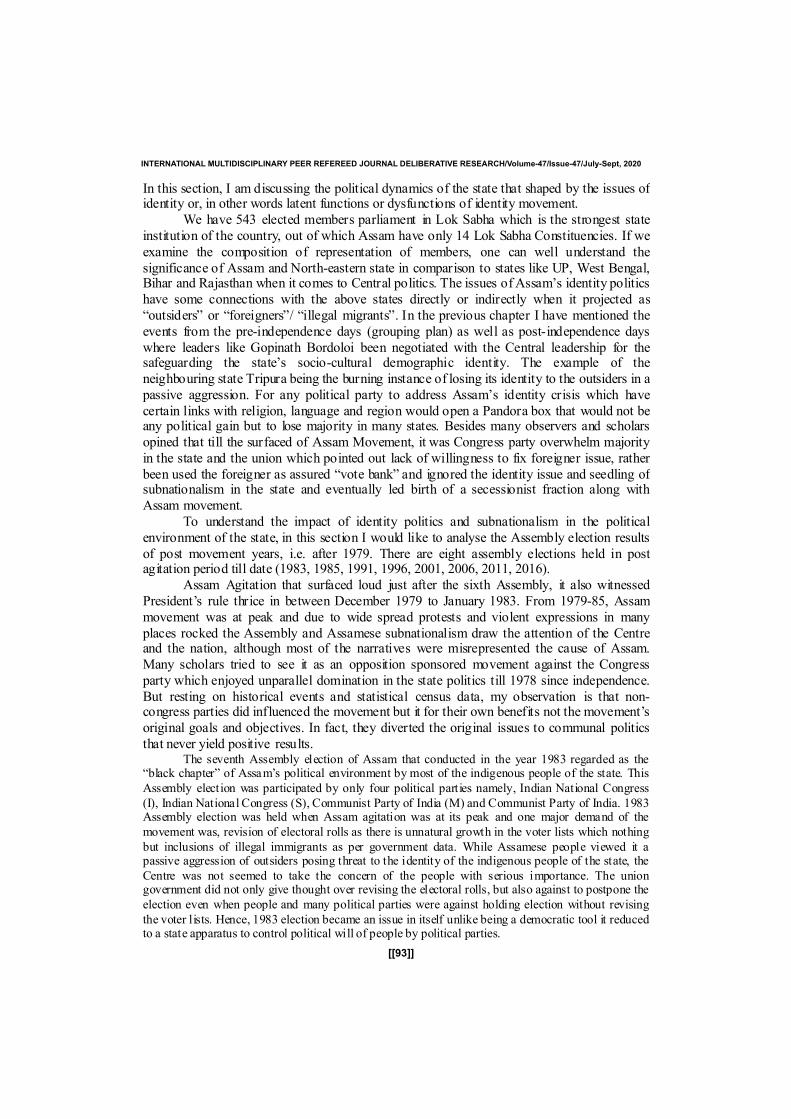
In this section, I am discussing the political dynamics of the state that shaped by the issues ofidentity or, in other words latent functions or dysfunctions of identity movement.
We have 543 elected members parliament in Lok Sabha which is the strongest stateinstitution of the country, out of which Assam have only 14 Lok Sabha Constituencies. If we
examine the composition of representation of members, one can well understand thesignificance of Assam and North-eastern state in comparison to states like UP, West Bengal,Bihar and Rajasthan when it comes to Central politics. The issues ofAssam’s identity politicshave some connections with the above states directly or indirectly when it projected as“outsiders” or “foreigners”/ “illegal migrants”. In the previous chapter I have mentioned theevents from the pre-independence days (grouping plan) as well as post-independence dayswhere leaders like Gopinath Bordoloi been negotiated with the Central leadership for thesafeguarding the state’s socio-cultural demographic identity. The example of theneighbouring state Tripura being the burning instance of losing its identity to the outsiders in apassive aggression. For any political party to address Assam’s identity crisis which havecertain links with religion, language and region would open a Pandora box that would not beany political gain but to lose majority in many states. Besides many observers and scholarsopined that till the surfaced of Assam Movement, it was Congress party overwhelm majorityin the state and the union which pointed out lack of willingness to fix foreigner issue, ratherbeen used the foreigner as assured “vote bank” and ignored the identity issue and seedling ofsubnationalism in the state and eventually led birth of a secessionist fraction along withAssam movement.
To understand the impact of identity politics and subnationalism in the politicalenvironment of the state, in this section I would like to analyse the Assembly election resultsof post movement years, i.e. after 1979. There are eight assembly elections held in postagitation period till date (1983, 1985, 1991, 1996, 2001, 2006, 2011, 2016).
Assam Agitation that surfaced loud just after the sixth Assembly, it also witnessedPresident’s rule thrice in between December 1979 to January 1983. From 1979-85, Assammovement was at peak and due to wide spread protests and violent expressions in manyplaces rocked the Assembly and Assamese subnationalism draw the attention of the Centreand the nation, although most of the narratives were misrepresented the cause of Assam.Many scholars tried to see it as an opposition sponsored movement against the Congressparty which enjoyed unparallel domination in the state politics till 1978 since independence.But resting on historical events and statistical census data, my observation is that non-congress parties did influenced the movement but it for their own benefits not the movement’soriginal goals and objectives. In fact, they diverted the original issues to communal politicsthat never yield positive results.
The seventh Assembly election of Assam that conducted in the year 1983 regarded as the“black chapter” of Assam’s political environment by most of the indigenous people of the state. This
Assembly election was participated by only four political parties namely, Indian National Congress
(I), Indian National Congress (S), Communist Party of India (M) and Communist Party of India. 1983Assembly election was held when Assam agitation was at its peak and one major demand of the
movement was, revision of electoral rolls as there is unnatural growth in the voter lists which nothing
but inclusions of illegal immigrants as per government data. While Assamese people viewed it apassive aggression of outsiders posing threat to the identity of the indigenous people of the state, the
Centre was not seemed to take the concern of the people with serious importance. The uniongovernment did not only give thought over revising the electoral rolls, but also against to postpone the
election even when people and many political parties were against holding election without revising
the voter lists. Hence, 1983 election became an issue in itself unlike being a democratic tool it reducedto a state apparatus to control political will of people by political parties.
INTERNATIONAL MULTIDISCIPLINARY PEER REFEREED JOURNAL DELIBERATIVE RESEARCH/Volume-47/Issue-47/July-Sept, 2020
[[93]]
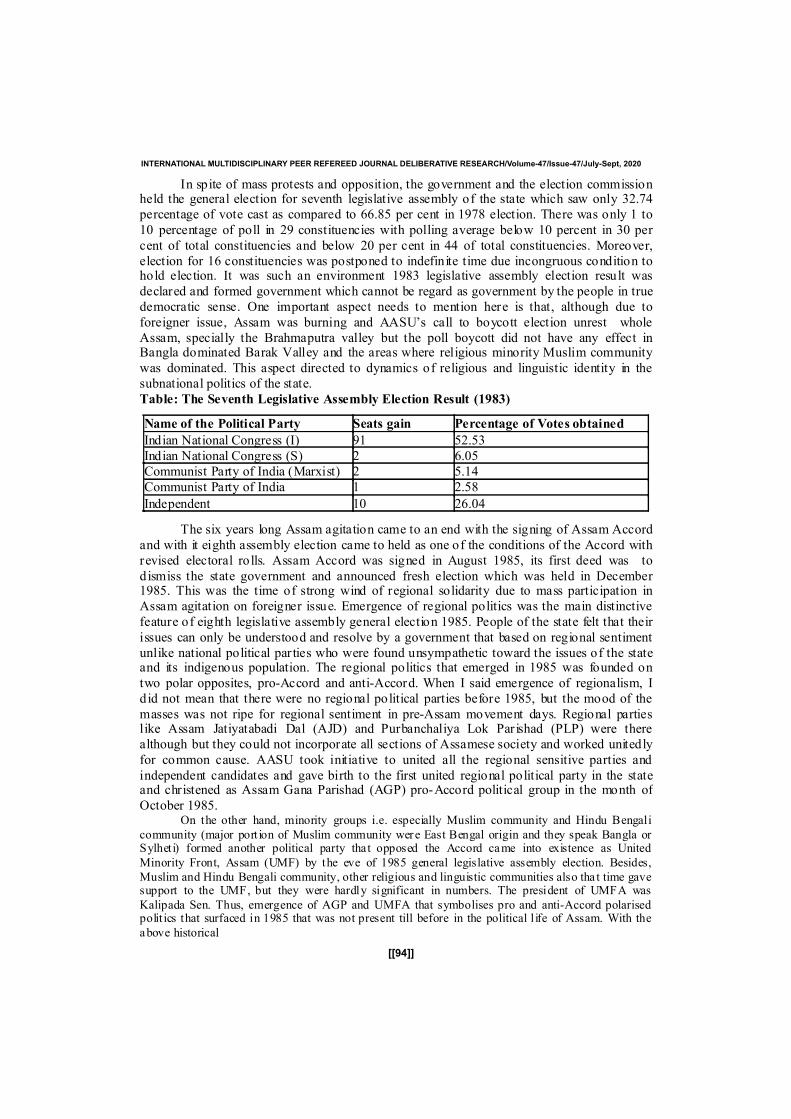
In spite of mass protests and opposition, the government and the election commissionheld the general election for seventh legislative assembly of the state which saw only 32.74percentage of vote cast as compared to 66.85 per cent in 1978 election. There was only 1 to
10 percentage of poll in 29 constituencies with polling average below 10 percent in 30 per
cent of total constituencies and below 20 per cent in 44 of total constituencies. Moreover,election for 16 constituencies was postponed to indefinite time due incongruous condition tohold election. It was such an environment 1983 legislative assembly election result was
declared and formed government which cannot be regard as government by the people in truedemocratic sense. One important aspect needs to mention here is that, although due to
foreigner issue, Assam was burning and AASU’s call to boycott election unrest wholeAssam, specially the Brahmaputra valley but the poll boycott did not have any effect inBangla dominated Barak Valley and the areas where religious minority Muslim community
was dominated. This aspect directed to dynamics of religious and linguistic identity in thesubnational politics of the state.
Table: The Seventh Legislative Assembly Election Result (1983)
Name of the Political Party Seats gain Percentage of Votes obtained
Indian National Congress (I) 91 52.53
Indian National Congress (S) 2 6.05Communist Party of India (Marxist) 2 5.14
Communist Party of India 1 2.58
Independent 10 26.04
The six years long Assam agitation came to an end with the signing of Assam Accord
and with it eighth assembly election came to held as one of the conditions of the Accord withrevised electoral rolls. Assam Accord was signed in August 1985, its first deed was to
dismiss the state government and announced fresh election which was held in December1985. This was the time of strong wind of regional solidarity due to mass participation inAssam agitation on foreigner issue. Emergence of regional politics was the main distinctive
feature of eighth legislative assembly general election 1985. People of the state felt that their
issues can only be understood and resolve by a government that based on regional sentimentunlike national political parties who were found unsympathetic toward the issues of the stateand its indigenous population. The regional politics that emerged in 1985 was founded on
two polar opposites, pro-Accord and anti-Accord. When I said emergence of regionalism, Idid not mean that there were no regional political parties before 1985, but the mood of the
masses was not ripe for regional sentiment in pre-Assam movement days. Regional partieslike Assam Jatiyatabadi Dal (AJD) and Purbanchaliya Lok Parishad (PLP) were therealthough but they could not incorporate all sections of Assamese society and worked unitedly
for common cause. AASU took initiative to united all the regional sensitive parties and
independent candidates and gave birth to the first united regional political party in the stateand christened as Assam Gana Parishad (AGP) pro-Accord political group in the month of
October 1985.On the other hand, minority groups i.e. especially Muslim community and Hindu Bengali
community (major port ion of Muslim community were East Bengal origin and they speak Bangla orSylheti) formed another political party that opposed the Accord came into existence as United
Minority Front, Assam (UMF) by the eve of 1985 general legislative assembly election. Besides,
Muslim and Hindu Bengali community, other religious and linguistic communities also tha t time gavesupport to the UMF, but they were hardly significant in numbers. The president of UMFA was
Kalipada Sen. Thus, emergence of AGP and UMFA that symbolises pro and anti-Accord polarisedpolit ics that surfaced in 1985 that was not present till before in the political l ife of Assam. With the
above historical
INTERNATIONAL MULTIDISCIPLINARY PEER REFEREED JOURNAL DELIBERATIVE RESEARCH/Volume-47/Issue-47/July-Sept, 2020
[[94]]
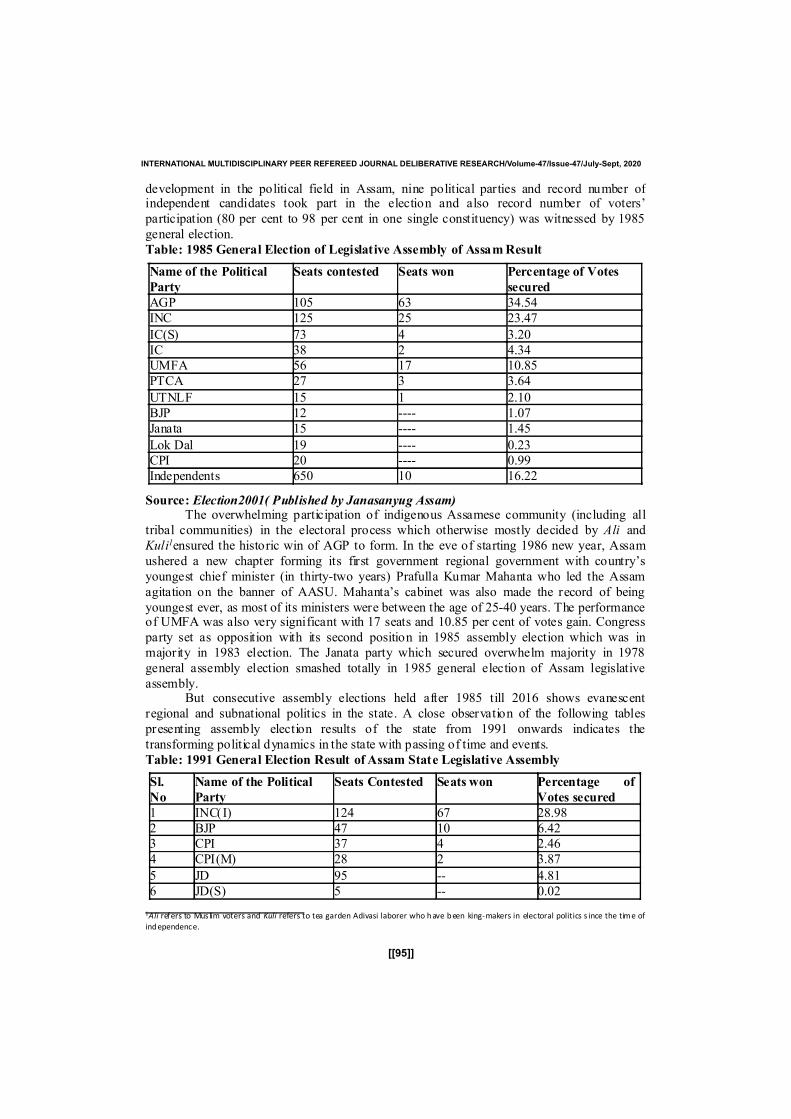
development in the political field in Assam, nine political parties and record number ofindependent candidates took part in the election and also record number of voters’
participation (80 per cent to 98 per cent in one single constituency) was witnessed by 1985
general election.
Table: 1985 General Election of Legislative Assembly of AssamResult
Name of the Political
Party
Seats contested Seats won Percentage of Votes
secured
AGP 105 63 34.54
INC 125 25 23.47
IC(S) 73 4 3.20
IC 38 2 4.34UMFA 56 17 10.85
PTCA 27 3 3.64
UTNLF 15 1 2.10
BJP 12 ---- 1.07
Janata 15 ---- 1.45
Lok Dal 19 ---- 0.23CPI 20 ---- 0.99
Independents 650 10 16.22
Source: Election2001( Published by Janasanyug Assam)The overwhelming participation of indigenous Assamese community (including all
tribal communities) in the electoral process which otherwise mostly decided by Ali and
Kuli1ensured the historic win of AGP to form. In the eve of starting 1986 new year, Assam
ushered a new chapter forming its first government regional government with country’s
youngest chief minister (in thirty-two years) Prafulla Kumar Mahanta who led the Assam
agitation on the banner of AASU. Mahanta’s cabinet was also made the record of being
youngest ever, as most of its ministers were between the age of 25-40 years. The performanceof UMFA was also very significant with 17 seats and 10.85 per cent of votes gain. Congress
party set as opposition with its second position in 1985 assembly election which was inmajority in 1983 election. The Janata party which secured overwhelm majority in 1978
general assembly election smashed totally in 1985 general election of Assam legislative
assembly.But consecutive assembly elections held after 1985 till 2016 shows evanescent
regional and subnational politics in the state. A close observation of the following tables
presenting assembly election results of the state from 1991 onwards indicates the
transforming political dynamics in the state with passing of time and events.
Table: 1991 General Election Result of Assam State Legislative Assembly
Sl.
No
Name of the Political
Party
Seats Contested Seats won Percentage of
Votes secured
1 INC(I) 124 67 28.98
2 BJP 47 10 6.423 CPI 37 4 2.46
4 CPI(M) 28 2 3.87
5 JD 95 -- 4.81
6 JD(S) 5 -- 0.02
1Ali refers to Mus lim voters and Kuli refers to tea garden Adivasi laborer who have been king-makers in electoral politics s ince the time of
independence.
INTERNATIONAL MULTIDISCIPLINARY PEER REFEREED JOURNAL DELIBERATIVE RESEARCH/Volume-47/Issue-47/July-Sept, 2020
[[95]]
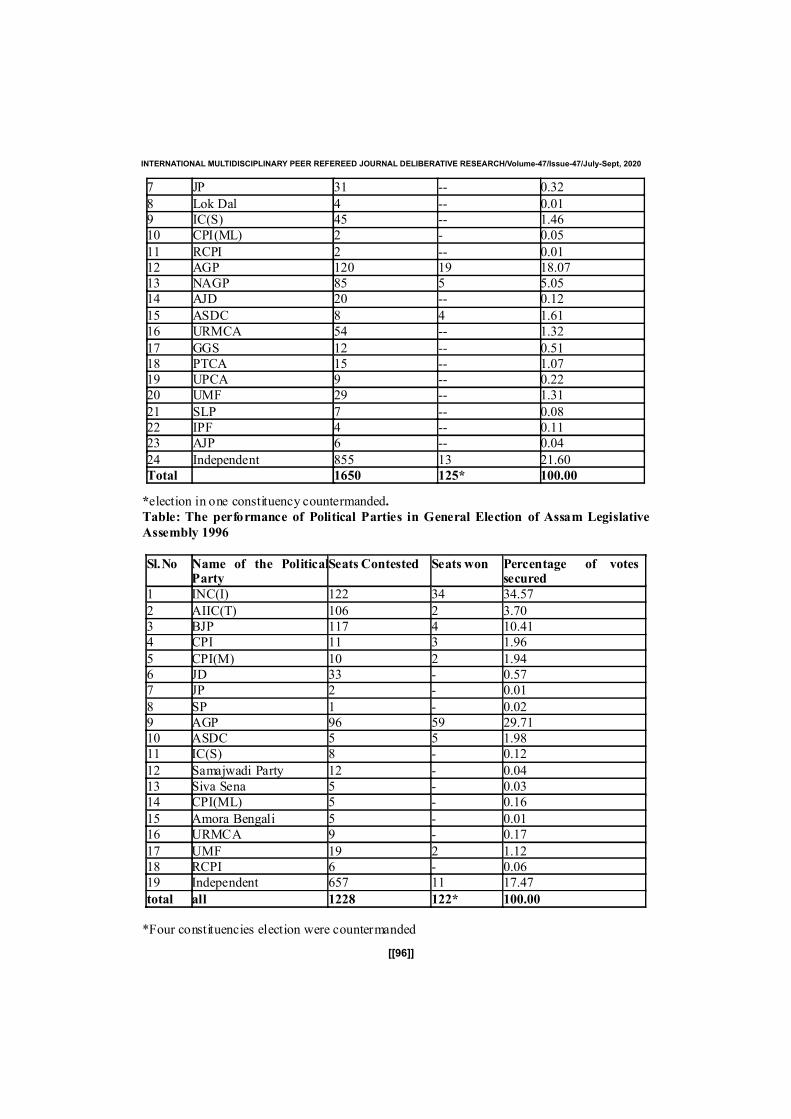
7 JP 31 -- 0.32
8 Lok Dal 4 -- 0.01
9 IC(S) 45 -- 1.46
10 CPI(ML) 2 - 0.05
11 RCPI 2 -- 0.01
12 AGP 120 19 18.07
13 NAGP 85 5 5.05
14 AJD 20 -- 0.12
15 ASDC 8 4 1.61
16 URMCA 54 -- 1.32
17 GGS 12 -- 0.51
18 PTCA 15 -- 1.07
19 UPCA 9 -- 0.22
20 UMF 29 -- 1.31
21 SLP 7 -- 0.08
22 IPF 4 -- 0.11
23 AJP 6 -- 0.04
24 Independent 855 13 21.60
Total 1650 125* 100.00
*election in one constituency countermanded.
Table: The performance of Political Parties in General Election of Assam Legislative
Assembly 1996
Sl.No Name of the PoliticalParty
Seats Contested Seats won Percentage of votessecured
1 INC(I) 122 34 34.57
2 AIIC(T) 106 2 3.70
3 BJP 117 4 10.41
4 CPI 11 3 1.96
5 CPI(M) 10 2 1.94
6 JD 33 - 0.57
7 JP 2 - 0.01
8 SP 1 - 0.02
9 AGP 96 59 29.71
10 ASDC 5 5 1.98
11 IC(S) 8 - 0.12
12 Samajwadi Party 12 - 0.04
13 Siva Sena 5 - 0.03
14 CPI(ML) 5 - 0.16
15 Amora Bengali 5 - 0.01
16 URMCA 9 - 0.17
17 UMF 19 2 1.12
18 RCPI 6 - 0.06
19 Independent 657 11 17.47
total all 1228 122* 100.00
*Four constituencies election were countermanded
INTERNATIONAL MULTIDISCIPLINARY PEER REFEREED JOURNAL DELIBERATIVE RESEARCH/Volume-47/Issue-47/July-Sept, 2020
[[96]]
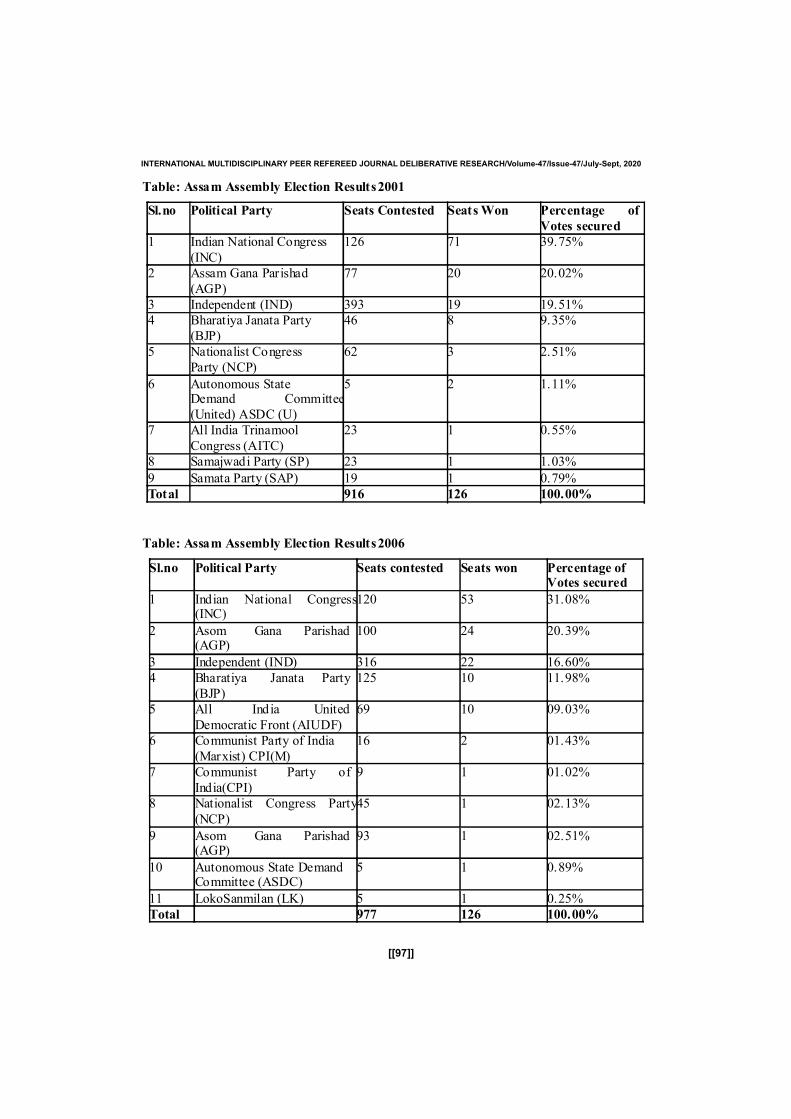
Table: Assam Assembly Election Results2001
Sl.no Political Party Seats Contested SeatsWon Percentage of
Votes secured
1 Indian National Congress
(INC)
126 71 39.75%
2 Assam Gana Parishad
(AGP)
77 20 20.02%
3 Independent (IND) 393 19 19.51%
4 Bharatiya Janata Party
(BJP)
46 8 9.35%
5 Nationalist Congress
Party (NCP)
62 3 2.51%
6 Autonomous StateDemand Committee
(United) ASDC (U)
5 2 1.11%
7 All India Trinamool
Congress (AITC)
23 1 0.55%
8 Samajwadi Party (SP) 23 1 1.03%
9 Samata Party (SAP) 19 1 0.79%
Total 916 126 100.00%
Table: Assam Assembly Election Results2006
Sl.no Political Party Seats contested Seats won Percentage ofVotes secured
1 Indian National Congress(INC)
120 53 31.08%
2 Asom Gana Parishad(AGP)
100 24 20.39%
3 Independent (IND) 316 22 16.60%
4 Bharatiya Janata Party
(BJP)
125 10 11.98%
5 All India United
Democratic Front (AIUDF)
69 10 09.03%
6 Communist Party of India
(Marxist) CPI(M)
16 2 01.43%
7 Communist Party of
India(CPI)
9 1 01.02%
8 Nationalist Congress Party
(NCP)
45 1 02.13%
9 Asom Gana Parishad(AGP)
93 1 02.51%
10 Autonomous State DemandCommittee (ASDC)
5 1 0.89%
11 LokoSanmilan (LK) 5 1 0.25%
Total 977 126 100.00%
INTERNATIONAL MULTIDISCIPLINARY PEER REFEREED JOURNAL DELIBERATIVE RESEARCH/Volume-47/Issue-47/July-Sept, 2020
[[97]]
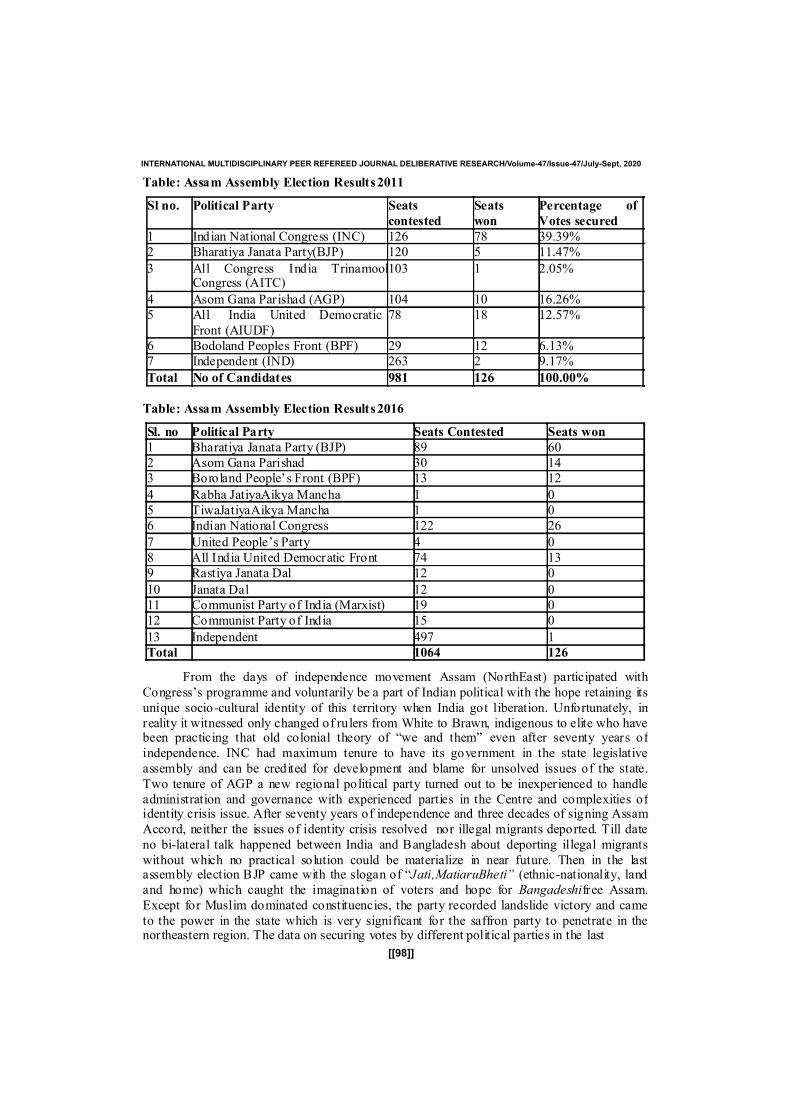
Table: Assam Assembly Election Results2011
Sl no. Political Party Seats
contested
Seats
won
Percentage of
Votes secured
1 Indian National Congress (INC) 126 78 39.39%
2 Bharatiya Janata Party(BJP) 120 5 11.47%
3 All Congress India TrinamoolCongress (AITC)
103 1 2.05%
4 Asom Gana Parishad (AGP) 104 10 16.26%
5 All India United Democratic
Front (AIUDF)
78 18 12.57%
6 Bodoland Peoples Front (BPF) 29 12 6.13%7 Independent (IND) 263 2 9.17%
Total No of Candidates 981 126 100.00%
Table: Assam Assembly Election Results2016
Sl. no Political Party Seats Contested Seats won
1 Bharatiya Janata Party (BJP) 89 60
2 Asom Gana Parishad 30 143 Boroland People’s Front (BPF) 13 12
4 Rabha JatiyaAikya Mancha 1 0
5 TiwaJatiyaAikya Mancha 1 0
6 Indian National Congress 122 26
7 United People’s Party 4 0
8 All India United Democratic Front 74 13
9 Rastiya Janata Dal 12 0
10 Janata Dal 12 011 Communist Party of India (Marxist) 19 0
12 Communist Party of India 15 0
13 Independent 497 1
Total 1064 126
From the days of independence movement Assam (NorthEast) participated with
Congress’s programme and voluntarily be a part of Indian political with the hope retaining its
unique socio-cultural identity of this territory when India got liberation. Unfortunately, inreality it witnessed only changed of rulers from White to Brawn, indigenous to elite who havebeen practicing that old colonial theory of “we and them” even after seventy years of
independence. INC had maximum tenure to have its government in the state legislative
assembly and can be credited for development and blame for unsolved issues of the state.
Two tenure of AGP a new regional political party turned out to be inexperienced to handleadministration and governance with experienced parties in the Centre and complexities ofidentity crisis issue. After seventy years of independence and three decades of signing Assam
Accord, neither the issues of identity crisis resolved nor illegal migrants deported. Till date
no bi-lateral talk happened between India and Bangladesh about deporting illegal migrants
without which no practical solution could be materialize in near future. Then in the lastassembly election BJP came with the slogan of “Jati,MatiaruBheti” (ethnic-nationality, landand home) which caught the imagination of voters and hope for Bangadeshifree Assam.
Except for Muslim dominated constituencies, the party recorded landslide victory and came
to the power in the state which is very significant for the saffron party to penetrate in thenortheastern region. The data on securing votes by different political parties in the last
INTERNATIONAL MULTIDISCIPLINARY PEER REFEREED JOURNAL DELIBERATIVE RESEARCH/Volume-47/Issue-47/July-Sept, 2020
[[98]]
assembly election (2016) showed that previous votes of INC and AGP have gone to BJP ,although AGP got 14 seats (69 in 1985 and 14 in 2016) as it alliance with BJP and INC lost 53
seats compared to the previous election and won only 26 seats in 2016 assembly election.
However, as latent development of Assam Movement and Assamese subnationalism,
minority solidarity registered constant growth which is the third powerful political party in
the state at present. With this, the political dynamics of Assam is transforming from culturalsecular ideological form to communal ideological form and ethnic subnationalism being
overlapped by Hindu nationalism in the face of transforming religious linguistic composition
of the state. This shift of Identity politics lies in the very nature of concept “identity” which is
fluidic. Presence of various cleavages within identities in our country turns out to be
blessings in disguise time to time when subnationalism confronted with national identity. Dueto fluidic nature of identity in the presence of multiple identities in the globalized world any
social movement that based on identity less likely to get desired results.
References Madhab, Jayanta,’ North-East: Crisis of Identity, Security and Underdevelopment’, Economic and Political
Weekly, Vol. 34, No. 6 (Feb. 6-12, 1999), pp. 320-322
Manor, J.,’ 'Ethnicity' and Politics in India’, International Affairs, Vol. 72, No. 3, Ethnicity and InternationalRelations (Jul., 1996), pp. 459-475
Mishra, Udayon, North-East India: Quest for Identity, Omsons, NewDelhi, 1988. Mishra, Udayon,’Immigration and Transformations of Assamese Identity’, Economic and Political Weekly,
May22, 1999. Mishra, Udayon,2013, The Periphery Strikes Back: Challenges to the Nation-State in Assam and Nagaland,
Indian Institute of Advanced Study RashtrapatiNivas, Shimla. Misra, Udayon, 2001. The Transformation of Assamese Identity: A Historical Survey, H. K. Barpujari
Endowment Lecture (4), Shillong: The North East India History Association .
Omvedt, Gail,’ Assamese People's Agitation’, Economic and Political Weekly, Vol. 15, No. 12 (Mar. 22,1980), p. 580.
Pecora, Vincent P.(ed.), Nations and Identities: Classic Readings, Blackwell Publishers Inc, 350 MainStreet, Malden,Massachusetts, USA, 2001.
Phadnis, Urmila, 1990, Ethnicity and Nation-building in South Asia, Sage Publications, NewDelhi Phukan, Girin, Politics of Identity and Nation building in India, New Delhi: South Asian Publishers, 1997. Phukan, Girin, Political dynamics of North East India, NewDelhi, South Asian Publishers, 2000.
Ray,Nalini Ranjan.2007, Koch Rajbanshi and Kamtapuri:The Truth Unveiled, Centre for Koch RajbanshiStudies and Development (CKRSD) publication, Guwahati
Sharma, M. 1990. Social and Economic Change in Assam: Middle Class Hegemony. Delhi: Ajanta. Sheth, D.L.,’State, Nations and Ethnicity: Experience of Third World Counties’, Economic and Political
Weekly, vol.24, 1989, 624-5. Singh, B.P.,’ North-East India: Demography, Culture and Identity Crisis’,Modern Asian Studies, Vol. 21,
No. 2 (1987), pp. 257-282 Published by: Cambridge University Press Spencer, S., Race and Ethnicity: Culture, identity and Representation, Routledge, Taylor&Francis Group,
London, NewYork, 2006, 31-113. Srikanth, H.,’ Militancy and Identity Politics in Assam’, Economic and Political Weekly, Vol. 35, No. 47
(Nov. 18-24, 2000), pp. 4117-4119+4121- 4124 Smith D, Anthony, 1988, Nationalism and Modernism : A critical survey of recent theories of nations and
nationalism, Routledge, London and New York Stephen, I.G., Nationalism and Ethnic Conflicts: Threats to European Security, Oxford University Press,
London, 1993. Tamuly, Laxi Nath, 1988, BharatarSwadhinataSangramatAsamarAwadan: Sanghat Aru SahajogitarItihas,
Bhabani Print & Publication, Guwahati-781026 Vasudevan Ravi, S., Making Meaning in Indian Cinema, Oxford University Press, NewDelhi, 2000.
Watson, Seton, 1977, Nation and States, An Enquiry into the Origins of Nation and Politics ofNationalism. London: Methuen.
Weber, M. (1948), From Max Weber: Essays in Sociology, London: Routledge and Kegan Paul. Weiner, M., Sons of the Soil: Migration and Ethnic Conflict in India, Oxford University Press, Delhi, 1978.
Weiner, M. “The Political Demography of Assam's Anti-Immigrant Movement”, Population andDevelopment Review, Vol. 9, No. 2 (Jun., 1983), pp. 279-292
INTERNATIONAL MULTIDISCIPLINARY PEER REFEREED JOURNAL DELIBERATIVE RESEARCH/Volume-47/Issue-47/July-Sept, 2020
[[99]]
Situation of Street Children in Patna
Manish PrasadPh.D, Research Scholar
Jaipur National University
Highlights
To analyse the lifestyle and life skills, examine the nature and extent of the
problems, explore the gender wise, region wise and category wise variation in problems
faced of by Street Children in selected pockets of Patna and to suggest survival andcoping mechanism for street children in response to their problems.
In this twenty first century, it is well known that the street children are facing a lot of
physical, mental and socio-economic problems throughout the world. The historicalbackground of street children is linked with the development of industrialization andurbanization in developed and middle income countries. Currently, the problem of street
children is more prevalent at middle and low income cities across India. However,
compulsion to leave their home, means of surviving, health, physical and mental status,
impact of substances use, poor working and living condition are found to be major issuesfaced by street children. In addition to the above, other reasons such as the adverse impact of
poverty, physical and verbal violence, sexual abuse, unemployment, separation or death of
parents, lack of infrastructure and industrialization and urbanization, have also beenidentified in other scholarly work.
According to the UNICEF and the World Health Organization (WHO), the steadily
growing numbers of street children worldwide could be 100 to 150 million. India has the
highest concentration as per the estimations byUNICEF with 11 million children living in the
streets of India, while other groups put the numbers as high as 20 million. Two in three is a
male. Moreover, while the majority of street children are between 11 to 15 years, a largepercentage belongs to the 6-10 age groups. A large proportion of these children are laboringas porters at bus stands or railway stations; as mechanics in informal auto repair shops; as
vendors of food, tea or handmade articles; as street tailors; or as rag pickers, picking things
from garbage and selling usable materials to local buyers. A study in 2007 in India found
the following: 65.9% of the street children lived with their families on the streets. Outof these children, 51.84% slept on the footpath, 17.49% slept in night shelters, 30.67%
slept under fly over & bridges, railway platforms, bus stops, parks and market places.
The overall incidence of physical abuse among street children, either by family
members or by others or both, was 66.8% across the states, out of these, 54.62% were
boys and 45.38% were girls.Patna is the capital of the Indian state of Bihar and one of the oldest continuously
inhabitated places in the world. Ancient Patna, known as Patliputra, was the capital of theMagadha Empire under the Haryanka, Nanda, Mauryan, Sunga, Gupta, Pala and Suri
dynasties. The modern city of Patna is situated on the southern bank of the Ganga River. The
city also straddles the river Sone, Gandak and Pun Pun. The city is approximately 25 km long
ISSN : 0976-1136
[[100]]
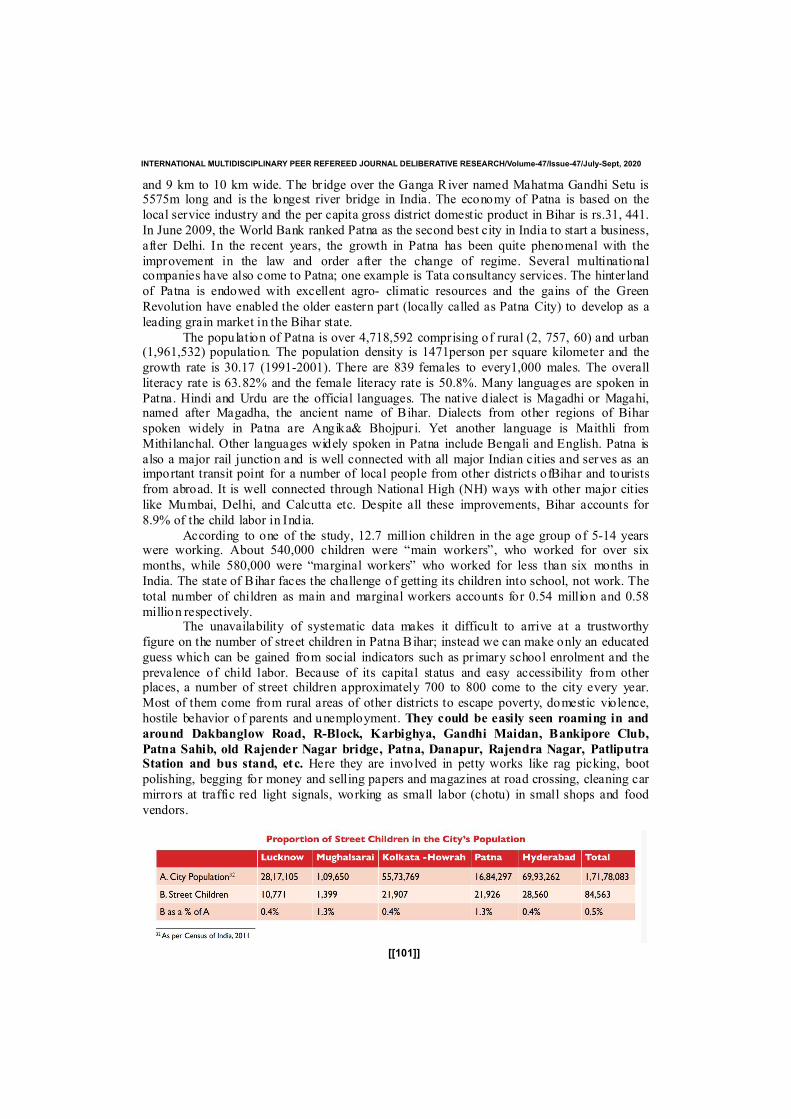
and 9 km to 10 km wide. The bridge over the Ganga River named Mahatma Gandhi Setu is5575m long and is the longest river bridge in India. The economy of Patna is based on the
local service industry and the per capita gross district domestic product in Bihar is rs.31, 441.
In June 2009, the World Bank ranked Patna as the second best city in India to start a business,
after Delhi. In the recent years, the growth in Patna has been quite phenomenal with the
improvement in the law and order after the change of regime. Several multinationalcompanies have also come to Patna; one example is Tata consultancy services. The hinter land
of Patna is endowed with excellent agro- climatic resources and the gains of the Green
Revolution have enabled the older eastern part (locally called as Patna City) to develop as a
leading grain market in the Bihar state.
The population of Patna is over 4,718,592 comprising of rural (2, 757, 60) and urban(1,961,532) population. The population density is 1471person per square kilometer and the
growth rate is 30.17 (1991-2001). There are 839 females to every1,000 males. The overall
literacy rate is 63.82% and the female literacy rate is 50.8%. Many languages are spoken in
Patna. Hindi and Urdu are the official languages. The native dialect is Magadhi or Magahi,named after Magadha, the ancient name of Bihar. Dialects from other regions of Bihar
spoken widely in Patna are Angika& Bhojpur i. Yet another language is Maithli from
Mithilanchal. Other languages widely spoken in Patna include Bengali and English. Patna is
also a major rail junction and is well connected with all major Indian cities and serves as animportant transit point for a number of local people from other districts ofBihar and tourists
from abroad. It is well connected through National High (NH) ways with other major cities
like Mumbai, Delhi, and Calcutta etc. Despite all these improvements, Bihar accounts for
8.9% of the child labor in India.
According to one of the study, 12.7 million children in the age group of 5-14 yearswere working. About 540,000 children were “main workers”, who worked for over six
months, while 580,000 were “marginal workers” who worked for less than six months in
India. The state of Bihar faces the challenge of getting its children into school, not work. The
total number of children as main and marginal workers accounts for 0.54 million and 0.58
million respectively.The unavailability of systematic data makes it difficult to arrive at a trustworthy
figure on the number of street children in Patna Bihar; instead we can make only an educated
guess which can be gained from social indicators such as pr imary school enrolment and the
prevalence of child labor. Because of its capital status and easy accessibility from otherplaces, a number of street children approximately 700 to 800 come to the city every year.
Most of them come from rural areas of other districts to escape poverty, domestic violence,
hostile behavior of parents and unemployment. They could be easily seen roaming in and
around Dakbanglow Road, R-Block, Karbighya, Gandhi Maidan, Bankipore Club,
Patna Sahib, old Rajender Nagar bridge, Patna, Danapur, Rajendra Nagar, PatliputraStation and bus stand, etc. Here they are involved in petty works like rag picking, boot
polishing, begging for money and selling papers and magazines at road crossing, cleaning car
mirrors at traffic red light signals, working as small labor (chotu) in small shops and food
vendors.
INTERNATIONAL MULTIDISCIPLINARY PEER REFEREED JOURNAL DELIBERATIVE RESEARCH/Volume-47/Issue-47/July-Sept, 2020
[[101]]

Over the past century here has been an increasing challenge of several problems of the
street children throughout the world. The study identified some of the pertinent issues of
street children: status of street children across in regional pockets of Patna, alternative means
of livelihood strategies of street children and social intervention in addressing the problemsof street children.
Khwairakpam and Sukhminder (2013)
Association for Development, Delhi (2002)
Mewar Institute of Management (2016)
Save The Children-SOP Bihar(2001)
Child Hope, Asia –Patna (1997)
CCHT, Bihar ( Unicef and Cartitas) (2018)
INTERNATIONAL MULTIDISCIPLINARY PEER REFEREED JOURNAL DELIBERATIVE RESEARCH/Volume-47/Issue-47/July-Sept, 2020
[[102]]
Reports1. Elena volpi – 2002, street children: Promising Practices and Approaches, The world bank.
2. Consortium of street children.
3. United Nation Development Program, cited in human rights watch, “police abuse and
killings of street children in India”, 1996.
4. I. sure, “A research about street children and the possibilities for setting up children’sunion and defense their rights; 2000.
5. Asian Centre for Human rights, Report 2003.
6. www.bihar.nic.in
7. UNICEF, United Nation Convention on the rights of the child, (NewDelhi, UNICEF 1989).
8. Juvenile Justice system & Rights of child 2003.9. P.M Bakshi, constitution of India, Universal Law Publication Private Limited 2009.
10. http//www.ilo.org/public/English/standards/ipes/themes/domestic/index.htm
References and Articles1. Abdul, H. (2014). Problems Faced By The Street Children: A Study On Some Selected Places In DhakaCity, Bangladesh. International Journal of Scientific & Technology Research, 3(10), 45-56.
2. Abhay, M. G., Quazi, S. Z., Lalit, W., Sunita, S., Sanjay, Z., &Sudhakar, R. J. (2008). Substance abuseamong street children in Mumbai. Vulnerable Children and Youth Studies, 3(1), 42-51. doi:
10.1080/174501207018431663. Action Aid India (2013).Making Street Children Matter: A Census Study in Mumbai City. Consortium for
Street Children, Resource Centre. Retrieved from https://www.streetchildrenresources.org/ resources/ making-street-children-matter-a-census-study-in-mumbai/
4. Adams, D. C., Gurevitch, J., & Rosenberg, M. S. (1997). Re-sampling Tests for Meta-Analysis ofEcological Data. Ecology, 78(4), 1277-1283.
5. Ahmed S. M., Hossain S., Khan A. M., Islam Q.S., Kamruzzaman (2011). Lives and Livelihoods on theStreets of Dhaka City: Findings from a Population-based Exploratory Survey. Retrieved from
http://research.brac.net/workingpapers/red_wp19_new.pdf6. Ahmed, K. S., Uddin, M. M., Islam, S., Huq, M. N., Nehar, S., & Nessa, Z. (2003). A baseline survey of
street children in Bangladesh. The Bangladesh Bureau of Statistics, National Child-Labor Survey. Retrievedfrom file:///C:/Users/Admin/Downloads/2003_streetchildren_bangladesh.pdf
7. Aitchison, J., &Silvey, S. (1957). The Generalization of Probit Analysis to the Case of Multiple Responses.Biometrika, 44(1-2), 131-140.8. Alinovi, L., D’Errico, M., Mane, E., & Romano, D. (2010). Livelihoods Strategies and Household
Resilience to Food Insecurity: An Empirical Analysis to Kenya. Retrieved from9. Arnett, J.J., 2014. Adolescence and emerging adulthood. Boston, MA: Pearson.
10. Bal, B., Mitra, R., Mallick, A.H., Chakraborti, S. and Sarkar, K., 2010. Nontobacco substance use, sexualabuse, HIV, and sexually transmitted infection among street children in Kolkata, India. Substance use &
misuse, 45(10), pp.1668-1682.11. Britto, P.R., Engle, P.L. and Super, C.M. eds., 2013. Handbook of early childhood development research
and its impact on global policy. Oxford University Press.12. Campbell, C., 2014. Community mobilisation in the 21st century: Updating our theory of social
change?. Journal of Health Psychology, 19(1), pp.46-59.13. Cleghorn, A. and Prochner, L.W., 2010. Shades of globalization in three early childhood settings: Views
from India, South Africa, and Canada. Rotterdam: Sense Publishers.14. Darder, A., 2018. The Student Guide to Freire’s’ Pedagogy of the Oppressed’. Bloomsbury Publishing.
15. deBenítez, S.T., 2007. State of the world’s street children: violence. London: Consortium for streetchildren.
16. Embleton, L., Mwangi, A., Vreeman, R., Ayuku, D. and Braitstein, P., 2013. The epidemiology ofsubstance use among street children in resource- constrained settings: a systematic review and
metaanalysis. Addiction, 108(10), pp.1722-1733.17. Gaidhane, A.M., Syed Zahiruddin, Q., Waghmare, L., Shanbhag, S., Zodpey, S. and Joharapurkar, S.R.,
2008. Substance abuse among street children in Mumbai. Vulnerable Children and Youth Studies, 3(1), pp.42-51.18. Hart, R.A., 2013. Children’s participation: The theory and practice of involving young citizens in
community development and environmental care. Routledge.19. Hedges, H. and Cullen, J., 2005. Subject knowledge in early childhood curriculum and pedagogy: Beliefsand practices. Contemporary issues in early childhood, 6(1), pp.66-79.
20. https://pdfs.semanticscholar.org/b664/b77a2a206668c0245edcdf283189f5e81390.pdf
INTERNATIONAL MULTIDISCIPLINARY PEER REFEREED JOURNAL DELIBERATIVE RESEARCH/Volume-47/Issue-47/July-Sept, 2020
[[103]]
Related Documents