Delay Information in Virtual Queues: A Large-Scale Field Experiment Qiuping Yu [email protected] (Joint work with: Yiming Zhang and Yong-Pin Zhou) 1 COER Conference 2020

Welcome message from author
This document is posted to help you gain knowledge. Please leave a comment to let me know what you think about it! Share it to your friends and learn new things together.
Transcript

Delay Information in Virtual Queues: A Large-Scale Field Experiment
Qiuping Yu
(Joint work with: Yiming Zhang and Yong-Pin Zhou)
1
COER Conference 2020

2
American spend roughly 37 billion hours each year waiting in line (NYT 2012).
Covid-19 makes waiting worse: limited capacity & social distancing & health risk.

3
By BBC, Jun 2020

4
By Katie Deighton, WSJ, Jul 2020

5
By Katie Deighton, WSJ, Jul 2020
• Virtual queues offer customers flexibility in how and where they wait for their turns.
• Customers cannot infer their waiting time and progress based on visual cues.
• Important to provide wait time information: • “You waiting time is about 4 mins.”
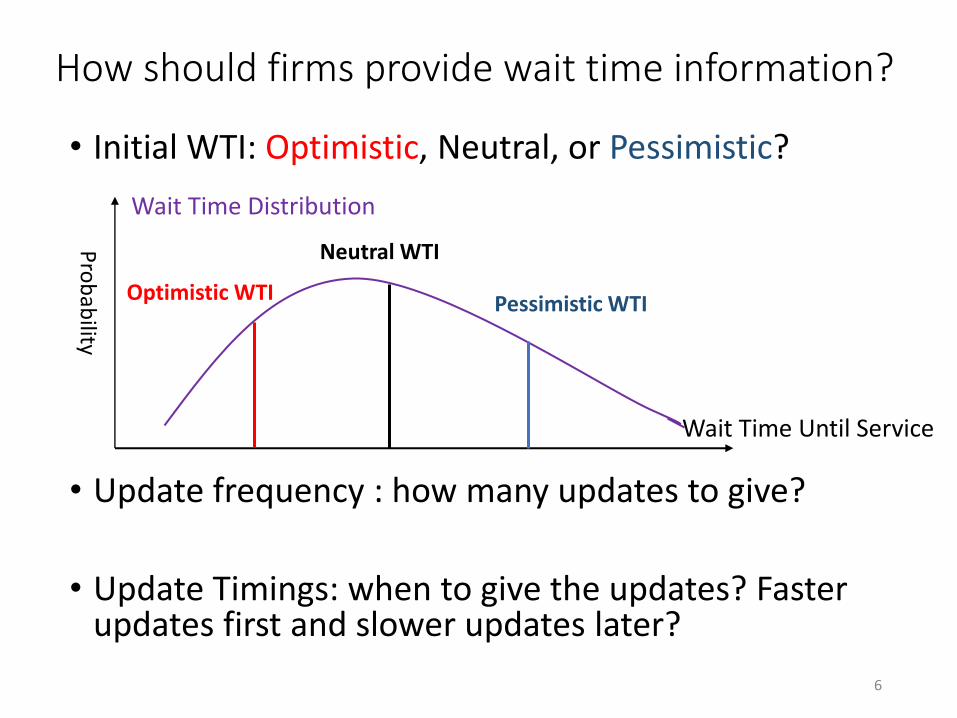
How should firms provide wait time information?
• Initial WTI: Optimistic, Neutral, or Pessimistic?
• Update frequency : how many updates to give?
• Update Timings: when to give the updates? Faster updates first and slower updates later?
6
Wait Time Until Service
Pro
bab
ility
Wait Time Distribution
Optimistic WTI Pessimistic WTI
Neutral WTI

Theory & Hypothesis
7
Pessimistic initial WTI
Belief of longer wait time(Magnitude Effect)
More downward updates(Update-frequency Effect)
Abandon
Abandon
5 min 4 min 2 min 1 min
3 min 2 min
Served
Served
Pessimistic Initial WTI
Neutral Initial WTI
3 min
1 min

Research Question
• How does wait time information (WTI) impact abandonment?• Initial WTI: Magnitude effect
• Update frequency: Update-frequency effect
• How should firms use WTI to improve customer wait experience and system performance?
8

Research Setting: A Major Ride-sharing platform
9
Wait in Queue
Ride-sharing market was valued at 73 billion in 2019.
Our partner platform removed surge pricing due to poor customer reception in 2017.• Adopted Virtual Queue System.• Use WTI to manage customer
expectation.
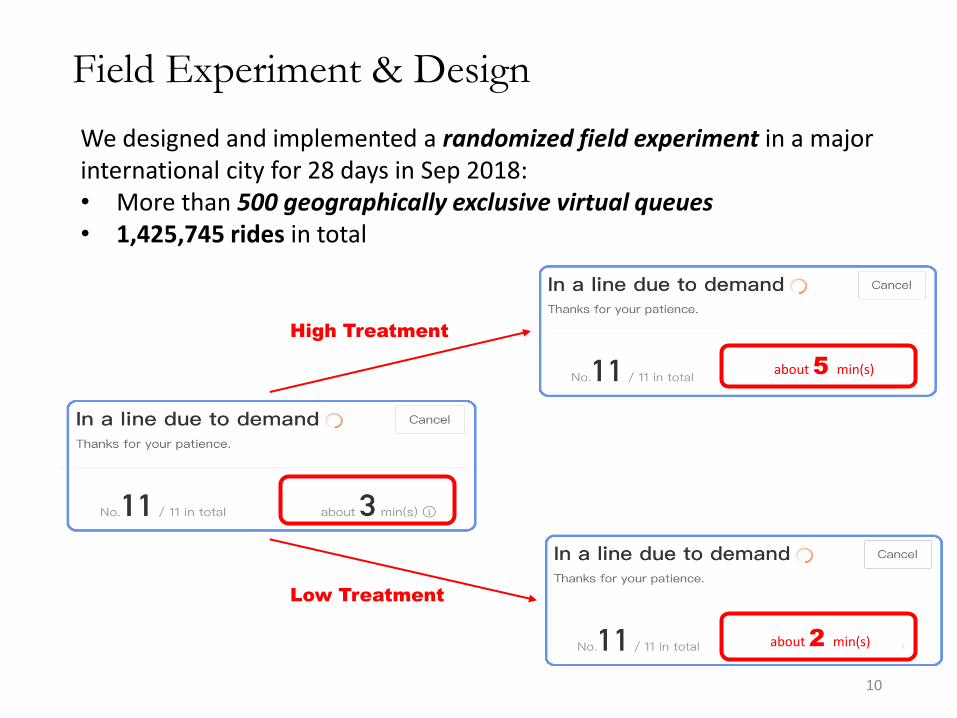
Field Experiment & Design
10
about 5 min(s)
High Treatment
about 2 min(s)
Low Treatment
We designed and implemented a randomized field experiment in a major international city for 28 days in Sep 2018: • More than 500 geographically exclusive virtual queues• 1,425,745 rides in total

11
5 min 4 min 2 min 1 min
3 min 2 min
Served
Served
Pessimistic Initial WTI(High Treatment)
Neutral Initial WTI(Control)
3 min
1 min
Optimistic Initial WTI(Low Treatment)
Served
2 min 1 min
• Low Treatment: lower initial WTI, fewer updates.
• High Treatment: higher initial WTI, more updates.
WTI updates : Integer & Non-increasing

12
Customers assigned to the 3 treatments are similar in pre-treatment variables: • Trip distance• Quoted price• Initial queue length

Data
• Ride-level data: 1,425,745 rides from more than 500 geographically exclusive virtual queues in a major city.
• Time stamps, pick up location, trip distance, quoted price, all the EWTs and WTIs, outcome (abandoned or not).
13
Avg Total EWT (min)

14
Base hazard rate Independent variables Customer Heterogeneity
Independent variables:• Treatment:
• Low*I (Avg Total EWT=n), n=1,…, 10• High*I (Avg Total EWT=n), n=1,…,10
• Control variables:• I (Avg Total EWT=n), n=1, …,10• Trip origin, trip distance, quoted price• Hour of day, Day of week
Model: Proportional Hazard Rate Model
Hazard rate for customer 𝑖 :

15
Adjusting initial WTI by 1 min: magnitude effect = update-frequency effect• No overall impact on customer abandonment
Adjusting initial WTI by 2 or more mins: magnitude effect > update-frequency effect• Increasing initial WTI from 2 to 4, 3 to 5, 5 to 8 mins, customer likelihood to
abandon increases by 6.2%, 14.1% and 19.6%, respectively.

Take Away: Firm Strategy on WTI
• Optimistic WTI may not reduce abandonment but hurts customer experience (by extending unnecessary wait).
• Slightly pessimistic WTI (1 min longer) improves customer experience (by reducing unnecessary wait) without increasing abandonment.
• Providing a significantly pessimistic WTI (2 or more mins longer) may be beneficial when the congestion level is high.
16
Questions for practitioners:• Have your firms used virtual queues to manage customer flow? • If so, what are the challenges when using virtual queue systems? • Do you provide WTI and updates to customers, and how? • What’s your insights about managing customers’ expectation about
their waiting time?

17
Initial WTI_Control = Avg Total Estimated Wait Time (Avg Total EWT)
Initial WTI_Low = max (20% Quantile of Total EWT, Avg Total EWT – Std of Total EWT )
Initial WTI_High = min (80% Quantile of Total EWT, Avg Total EWT + Std of Total EWT)
High
Control
Low

18
% rides served within initial WTI % rides abandoned within initial WTI(among served customers) (among abandoned customers)
Avg Total EWT (min)
Low Control High Low Control High
1 75% 75% 88% 68% 68% 90%2 35% 60% 86% 56% 80% 95%3 38% 56% 81% 73% 85% 95%4 40% 55% 76% 79% 88% 96%5 29% 53% 80% 77% 90% 97%6 32% 54% 78% 82% 92% 98%7 34% 54% 83% 86% 92% 98%8 38% 54% 82% 88% 94% 98%9 32% 56% 82% 87% 94% 98%
10 38% 59% 86% 89% 95% 98%
Additional Summary Statistics
Related Documents