Statewide Review of Educational Opportunities Delaware State Board of Education and Delaware Department of Education November 17, 2015

Welcome message from author
This document is posted to help you gain knowledge. Please leave a comment to let me know what you think about it! Share it to your friends and learn new things together.
Transcript

Statewide Review of Educational Opportunities
Delaware State Board of Education and
Delaware Department of Education
November 17, 2015

www.pcgeducation.com | DE Statewide Review of Educational Opportunities 2
Agenda
• Project Scope
• Project Timeline
• Survey Overview
• Report Overview
• Preliminary Analysis
• Report Content
• Geographical Map

Project Scope
• Identify the current specialized educational opportunities available in:
• Traditional district schools
• Vocational technical schools
• Magnet schools
• Charter schools
• Produce a report on statewide educational opportunities with supporting data and analysis
• Develop an interactive statewide geographical map detailing school data and information
www.pcgeducation.com | DE Statewide Review of Educational Opportunities 3

Project Timeline
www.pcgeducation.com | DE Statewide Review of Educational Opportunities 4
September October November December
• Data request
submitted to
DDOE
• Survey
developed
• DDOE data,
SBE research
and UD
enrollment
projection data
collected
• Survey
responses
collected
• Data analysis
• Draft map to
SBE/DDOE
(11/25)
• Draft report to
SBE/DDOE
(11/25)
• Final report to
SBE/DDOE
• State Board
meeting
presentation
(12/17)

State Supplied Data
The following data was (or is currently being) collected through the DDOE database, SBE research intern, and UD enrollment projections and demographics study:
• Student enrollment information
• District and school of attendance
• Home district and home school
• Grade
• Race
• Special education status
• English language learner
• Charter school enrollment by school and by grade
• Enrollment summary (2005-2015)
• Authorized enrollment numbers (2016-2020)
• Statewide enrollment and projections
• By school type (district, charter and vocational schools)
• By choice students attending other districts
• Projections by age band and demographics for future enrollment
• Course enrollment data
• AP/IB course enrollment by school and course
• CTE pathway enrollment by school and pathway
• World language course enrollment by school and by language
www.pcgeducation.com | DE Statewide Review of Educational Opportunities 5

SREO Data Survey to Districts and Charter Schools
• Enrollment Data
• Number of school choice applicants (Applied, Accepted, Enrolled)
• School waitlist
• School capacity
• Specialized Educational Program Data
• Types of Specialized Educational Programs offered by school
• Current program enrollment (15-16 SY)
• CTE pathways offered by school
• Current CTE pathway enrollment (15-16 SY)
• Requested But Not Universally Available Data
• Number of school choice applicants
• School waitlist
• Demographics of school choice applicants
• Number of school choice applicants for prior years
• Home districts of school choice applicants
• Historical specialized educational program enrollment (beyond AP/IB and CTE)
• Number on Specialized Education Program waitlists
• Number of Specialized Education Program applicants
www.pcgeducation.com | DE Statewide Review of Educational Opportunities 6

Report OverviewTable of Contents
www.pcgeducation.com | DE Statewide Review of Educational Opportunities 7
Choice Student
Demographics
• Demographics of school choice students by school type • Student migration patterns into schools• Trends in school choice participation
Delaware’s
Educational
Landscape
• Specialized Educational Programs available by category• Specialized Educational Programs available by school and
geographic area
Gap Analysis:
Programs and
Enrollment
• Projections of enrollment by geographic region and demographics
• Analysis of enrollment vs. capacity by geographic area
Recommendations
• Are there programs/schools that should be reviewed further to maximize impact of educational opportunities?
• Are there types of programs/schools that should be expanded/replicated?
• How can Delaware improve access to specialized educational programs for students?
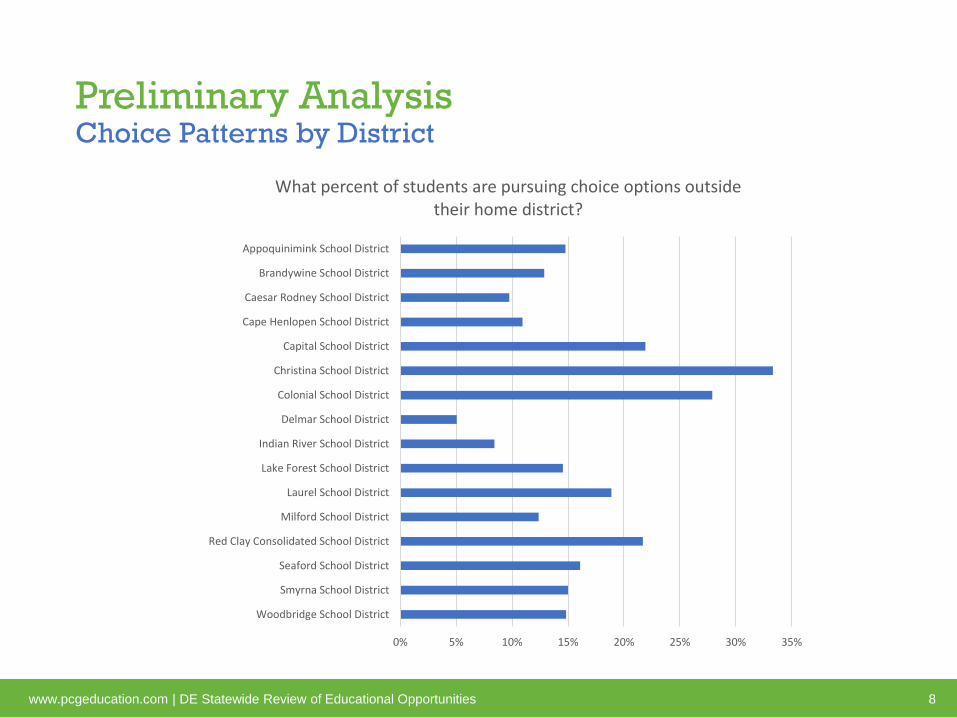
Preliminary AnalysisChoice Patterns by District
www.pcgeducation.com | DE Statewide Review of Educational Opportunities 8
0% 5% 10% 15% 20% 25% 30% 35%
Woodbridge School District
Smyrna School District
Seaford School District
Red Clay Consolidated School District
Milford School District
Laurel School District
Lake Forest School District
Indian River School District
Delmar School District
Colonial School District
Christina School District
Capital School District
Cape Henlopen School District
Caesar Rodney School District
Brandywine School District
Appoquinimink School District
What percent of students are pursuing choice options outside their home district?
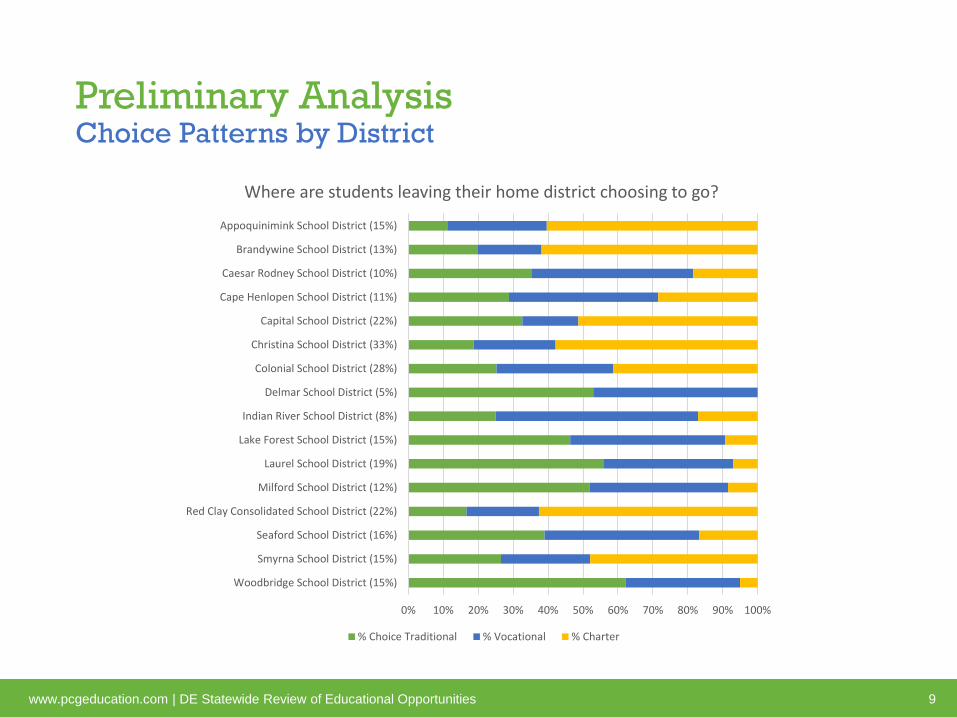
Preliminary AnalysisChoice Patterns by District
www.pcgeducation.com | DE Statewide Review of Educational Opportunities 9
0% 10% 20% 30% 40% 50% 60% 70% 80% 90% 100%
Woodbridge School District (15%)
Smyrna School District (15%)
Seaford School District (16%)
Red Clay Consolidated School District (22%)
Milford School District (12%)
Laurel School District (19%)
Lake Forest School District (15%)
Indian River School District (8%)
Delmar School District (5%)
Colonial School District (28%)
Christina School District (33%)
Capital School District (22%)
Cape Henlopen School District (11%)
Caesar Rodney School District (10%)
Brandywine School District (13%)
Appoquinimink School District (15%)
Where are students leaving their home district choosing to go?
% Choice Traditional % Vocational % Charter

Preliminary Analysis Choice Patterns by Low Income Status
www.pcgeducation.com | DE Statewide Review of Educational Opportunities 10
0% 10% 20% 30% 40% 50% 60%
Woodbridge School District
Smyrna School District
Seaford School District
Red Clay Consolidated School District
Milford School District
Laurel School District
Lake Forest School District
Indian River School District
Delmar School District
Colonial School District
Christina School District
Capital School District
Cape Henlopen School District
Caesar Rodney School District
Brandywine School District
Appoquinimink School District
Low IncomeHow does the population of choice students compare to the overall
district population?
Low Income Choicing In Low Income Total

Report ContentSpecialized Educational Program Availability
Survey Data
• Continuum of specialized educational programs offered
• CTE pathways offered
• AP/IB courses offered
• Course and program enrollment*
Characteristics Assessed
• Program Location
• Analysis of program concentration by geographic area
• Displayed on interactive map
• Program Enrollment
• Approximate number of students enrolled by school and location
*Enrollment data will be included where available
www.pcgeducation.com | DE Statewide Review of Educational Opportunities 11

Geographical Map Preview
www.pcgeducation.com | DE Statewide Review of Educational Opportunities 12
• Hover over functionality displays specialized educational programs at schools
• Filtering available by county, grades served, and school type
**Image only represents a sample of schools

Next Steps
• Data analysis and report finalized in November
• Interactive mapping tool continue to be developed and finalized
new data collected from state and local sources in November
• Report and recommendations developed in late November and
early December
• Presentation of project report and deliverables at December 17,
2015 State Board Meeting
www.pcgeducation.com | Example Education Presentation 13

PCG Team and Delaware Project Leads
PCG Team
• Anna d'Entremont, Project Manager
• Christine Donis-Keller, Subject Matter Expert
• Allie Panetta, Analyst
• Annelise Eaton, Analyst
Delaware Project Leads
• Donna Johnson, Executive Director, State Board of Education
• Susan Keene Haberstroh, Policy and External Affairs, Department of Education
www.pcgeducation.com | DE Statewide Review of Educational Opportunities 14

www.publicconsultinggroup.com
Related Documents
![Te Pōkaitahi Reo Māori (Reo Toru) [Kaupae 3] NZ …...Nau mai haere mai rā - Welcome Te Pōkaitahi Reo Māori (Reo Toru) [Kaupae 3] | NZ Certificate in Te Reo Māori [Level 3] is](https://static.cupdf.com/doc/110x72/5f754ab8f676d919ba5370ac/te-pkaitahi-reo-mori-reo-toru-kaupae-3-nz-nau-mai-haere-mai-r-welcome.jpg)