Delaware Teacher anD a DminisTraTor Supply and Demand Survey Analysis Report JUNE 2013 K elly l. sherreTz chrisTopher G. K elly rachel a. maTos Institute for Public Administration School of Public Policy & Administration College of Arts & Sciences University of Delaware in cooperation with the Delaware Department of Education serving the public good, shaping tomorrow’s leaders www.ipa.udel.edu

Welcome message from author
This document is posted to help you gain knowledge. Please leave a comment to let me know what you think about it! Share it to your friends and learn new things together.
Transcript

Delaware Teacher anD aDminisTraTor
Supply and DemandSurvey Analysis Report
JUNE 2013
Kelly l. sherreTz
chrisTopher G. Kelly
rachel a. maTos
Institute for Public AdministrationSchool of Public Policy & AdministrationCollege of Arts & SciencesUniversity of Delaware
in cooperation with the Delaware Department of Education
serving the public good, shaping tomorrow’s leaders
www.ipa.udel.edu

Delaware Teacher and Administrator Supply and Demand Survey Analysis
REPORT | JUNE 2013
Kelly L. Sherretz, Christopher G. Kelly, and Rachel A. Matos
Institute for Public Administration School of Public Policy & Administration
College of Arts & Sciences University of Delaware
www.ipa.udel.edu
serving the public good, shaping tomorrow’s leaders
in cooperation with the
Delaware Department of Education

Delaware Teacher and Administrator Supply and Demand Survey Analysis June 2013
i
Preface As the Director of the Institute for Public Administration at the University of Delaware, I am pleased to provide this report, Delaware Teacher and Administrator Supply and Demand Survey Analysis for 2012-‐2013. Funded by the Delaware Department of Education (DOE), this report is the eleventh in a series of analyses of teacher and administrator supply and demand in Delaware. It reports the analysis of a survey of all 19 school districts and 16 of the 22 charter school personnel directors as well as an analysis of data from the Delaware payroll system. This report charts the trends of teacher and administrator hiring, difficult-‐to-‐fill positions, late hiring, and other factors important to the success of the state’s public schools. As the significance of the role of teachers and administrative leaders becomes more apparent in Delaware and as Delaware implements its Race to the Top activities, the importance of this series of studies grows. The Institute for Public Administration addresses the policy, planning, and management needs of its partners through the integration of applied research, professional development, and the education of tomorrow’s leaders. This study is an important part of this effort, as public education accounts for one-‐third of the state budget and is of great significance to the state economy and public. Jerome R. Lewis, Ph.D. Director, Institute for Public Administration
Delaware Teacher and Administrator Supply and Demand Survey Analysis June 2013
ii
Foreword The authors of this report would like to thank the Delaware Department of Education (DOE) for their support of this work. We also thank Angeline Willen, Director of the Teacher and Administrator Quality Development, and Atnre Alleyne, Harvard Data Strategist for DOE’s Teacher Leadership Effectiveness Unit. Thanks to DOE DEEDS Analyst Stu Markham for placing the survey on the DEEDS system and providing IPA with the resulting data, and DOE Education Associate Adrian Peoples for providing us with the DOE payroll data. We thank the 19 school districts and 16 charter school personnel directors for compiling data from their organizations and completing the survey form. We also thank IPA consultant Mark Deshon for his editorial work, IPA’s Sarah Pragg for her extensive graphic design, and IPA’s Kathy Murphy for her insights. Over the years, we have received input on this annual survey from many individuals. We thank all those who have assisted us. In short, this report was the result of the efforts and contributions of many individuals who care about the quality of the public school teachers and administrators in Delaware. Kelly L. Sherretz, IPA Associate Policy Scientist Christopher G. Kelly, IPA Public Administration Fellow Rachel A. Matos, IPA Public Administration Fellow

Delaware Teacher and Administrator Supply and Demand Survey Analysis June 2013
iii
Table of Contents
Executive Summary ................................................................................................................ 4
Delaware Profile ..................................................................................................................... 7
School District Supply and Demand Survey Results ................................................................. 9
Charter School Supply and Demand Survey Results .............................................................. 35
DOE Payroll Data Results ...................................................................................................... 55
Conclusions .......................................................................................................................... 58
Appendix A: School District Data .......................................................................................... 60
Appendix B: Charter School Data .......................................................................................... 65
Appendix C: Delaware Teacher and Administrator Supply and Demand Survey .................... 70

Delaware Teacher and Administrator Supply and Demand Survey Analysis June 2013
4
Executive Summary Methodology The 2013 Teacher and Administrator Supply and Demand Survey is an online survey completed by school district personnel directors and charter school administrators. The data were collected through the Delaware Department of Education’s DEEDs system in January and February 2013 for the 2012-‐2013 school year. The survey was conducted by the University of Delaware’s Institute for Public Administration in conjunction with the Delaware Department of Education (DOE). This is the eleventh year of the study. The study focuses on teacher hiring; teacher hiring difficulties; recruitment strategies and incentives; the reasons for teachers leaving, vacancies, and shortage areas; hiring for non-‐teaching positions; and administrative hiring and vacancies. New topic areas include hiring of inexperienced teachers, hiring in high-‐needs schools, the opinions of respondents on attractive features found in their school district or charter school, financial incentives used for recruitment and retention, and retirement projections. This year, 19 of the 19 school districts and 16 of the 22 charter school personnel directors responded to the survey. Unless otherwise noted, response rates for individual questions are assumed to be 19 for the school districts and 16 for the charter schools. Relevant DOE payroll data were also examined, and an analysis will be included in an independent section. Teacher Hiring According to the respondents, there were 1,037 teachers hired in Delaware on regular and temporary contracts for the 2012-‐2013 school year, which is a decrease from the 1,258 total teachers hired in 2011-‐2012. There were 753 teachers hired on regular contracts, 647 in districts, and 106 in charter schools. Overall, teacher hiring for the 2012-‐2013 school year is occurring slightly earlier than last year with 52.9 percent of teacher hires occurring in July or earlier, compared to 51.4 percent for the 2011-‐2012 school year. Teacher hiring in August or later was at 47.1 percent, slightly less than last year, when it was at 48.6 percent. Survey results indicated that 53.5 percent of district teacher hires occurred in July or earlier, which is slightly earlier than last year and a drastic improvement from the two years before that. Results indicated that 49.1 percent of charter-‐school-‐teacher hires occurred in July or earlier, which is a decrease from last year. The trend for early hiring in charter schools is inconsistent, with a decrease occurring one year followed up by an increase in the next, since the 2009-‐2010 school year. The respondents hired 308 teachers who were considered new to teaching—264 in districts and 44 in charter schools. These teachers who were considered new to teaching accounted for 40.9 percent of the total teachers hired on regular contracts for the 2012-‐2013 school year. There were four school districts and seven charter schools for which 40 percent or more of the teachers hired on regular contracts were considered new to teaching. There were an additional 329 teachers hired on temporary contracts—328 in districts and one in a charter school. Like last year, the most common reason listed by the respondents for issuing temporary contracts was that teachers were hired after the first student day.

Delaware Teacher and Administrator Supply and Demand Survey Analysis June 2013
5
Teacher Departures, Vacancies, and Shortages There were 507 teachers who left their positions, an increase from the 458 who left in the 2011-‐2012 school year, and the 443 who left the year before that. The most common reasons for teachers leaving were retirement (170 teachers), taking a position in another Delaware school district (73 teachers), and unknown reasons (85 teachers). For school districts the most common reason was retirement (168 teachers), and for charter schools it was reduction in force—RIF (15 teachers). For the 35 respondents, the three most difficult teaching positions to fill were foreign languages, considered the most difficult position to fill by 10 respondents; high school science, considered the most difficult position to fill by five respondents; and high school math, considered the most difficult position to fill by four respondents. This was similar to last year when high school math, science, and foreign language positions were the most difficult to fill. For school districts, the most difficult teaching position to fill was foreign languages (7), and this was the same for charter schools (3). For the 14 respondents where filling positions in high need schools this year was applicable, 64 percent found it moderately difficult or very difficult to fill positions, and 36 percent did not find it difficult. The three most common “major problems” leading to teacher shortages were a lack of teacher candidates in particular areas (5), lack of qualified teacher candidates in particular areas (5), and low salaries for experienced teachers in their district/charter school (3). For the 19 school districts that responded, the most common major problems were a lack of qualified teacher candidates in particular areas (4) and a lack of number of teacher candidates in particular areas (4). For the 16 charter schools, it was low starting salaries for teachers in their school (3). Again, this is similar to last year’s results. Dates for 476 vacancies were reported this year, with the largest portion—56.9 percent—being learned about by the respondents from January 1–June 31, 2012. School districts learned about the largest portion of their vacancies—58.8 percent—from January 1–June 31, 2012. Charter schools learned about vacancies even earlier than the districts, with 41.4 percent of their vacancies for 2012-‐2013 being learned about in December 2012 or earlier. To fill these vacancies, respondents requested 242 emergency certificates, with 40.9 percent coming from state-‐approved Alternative Routes to Certification (ARTC) organizations. Districts applied for 211 emergency certificates, with 38.9 percent coming from state-‐approved ARTC organizations. For charter schools, 31 emergency certificates were requested, with 54.8 percent coming from state-‐approved ARTC organizations. Recruitment and Incentives The three most helpful tools for recruitment were the school district’s or charter school’s website for advertising positions (7), the University of Delaware’s Project Search (6), and the school district’s or charter school’s website for online applications (6). For school districts, the most helpful tool for recruitment was the district’s website for advertising positions (6), and for charter schools it was the University of Delaware’s Project Search (4). In the respondents’ opinions, the three most common attractive features found in school districts were school culture and climate (18 respondents), supportive administrators (16 respondents), and quality of instruction (15 respondents). For charter schools, the three most common attractive features according to the respondents were school culture and climate (14 respondents), supportive administrators (11 respondents), and supportive teachers (11 respondents).

Delaware Teacher and Administrator Supply and Demand Survey Analysis June 2013
6
According to the survey results, 78.9 percent (15) of the school districts do not offer recruitment incentives to teacher candidates, although one of these school districts does offer some form of recruitment incentive to school psychologist candidates. Retirement Within the next five years, 576 teachers, 59 district office staff, 22 principals, and 16 assistant principals will be eligible for retirement for the 34 respondents who provided data for this topic (one district did not respond). As of the 2011-‐2012 school year, there were 8,364 teachers, 409 district office staff, 240 assistant principals, and 197 principals in the school districts and charter schools of Delaware1. This means that approximately seven percent of teachers, 14 percent of district office staff, 11 percent of principals, and seven percent of assistant principals will be eligible for retirement within the next five years. Administrator Hiring Over the course of the 2012-‐2013 school year, 32 principals were hired from a pool of 348 applicants. Of these 348 applicants, 96 or 27.6 percent of the applicants were deemed acceptable by the respondents. Of these 32 new hires, 28 occurred at schools within districts, and four occurred at charter schools. During the 2012-‐2013 school year, 39 assistant principals were hired from a pool of 1,072 applicants. Of these 1,072 applicants, 263 or 25 percent of the applicants were deemed acceptable by the respondents. Of these 39 new hires, 35 occurred at schools within districts, and four occurred at charter schools. According to the respondents, 75 percent (24) of the 32 principals were first-‐time administrators. Of the 39 assistant principals who were hired for the current school year, 71.8 percent (28) were first-‐time administrators. Administrator Departures The respondents provided information for 44 total administrative departures, with 38 from a school district, and six from a charter school. The three most common reasons for the departure of an administrator were retirement (16), taking a position in another Delaware school district (13), being counseled out of administration (3), and being dismissed (3). For school districts, the most common reason was retirement (15), and for charter schools the most common reason was RIF (2). Non-‐Teaching Positions The four most common responses for the most difficult non-‐teaching positions to fill were speech therapist (13 respondents), nurse (4 respondents), psychologist (3 respondents), and secondary school principal (3 respondents), with nine responding that they did not fill any of these positions for the 2012-‐2013 school year.
1 Delaware Educational Personnel Reports, 2012.

Delaware Teacher and Administrator Supply and Demand Survey Analysis June 2013
7
Delaware Profile There are 193 public schools in Delaware, which includes 22 charter schools and those within the 19 school districts. There are 8,587 teachers in Delaware within these public schools. Most of these teachers are white (86.8 percent) and female (76.1 percent)2. See Figures 1 and 2 for teacher demographics. The state average teacher salary is $57,292. The average salary is highest in New Castle County, followed by Sussex, then Kent—$58,959, $57,332, and $53,030, respectively3. These salaries are higher than the national average, which was $38,900 during the 2009-‐2010 school year4. The average administrator salary in Delaware is $96,500. In New Castle County, administrators’ salaries are on average slightly above the state average ($95,642), whereas salaries among Kent and Sussex County administrators are on average slightly below the state average—$94,974 and $94,171, respectively5.
Currently, there is an oversupply of elementary educators. In a January 2013 article from Education Week, Stephen Sawchuk notes that Delaware is currently overproducing elementary teachers at a rate of three graduates for each open position6. Individuals, who argue that production should be cut back through an increase in admission standards, or through the redirecting of elementary education students to high-‐needs subjects, claim that doing so will increase the quality of teachers produced by improving the preparation programs in which they are enrolled7. This improved quality in teacher preparation would be achieved, proponents of this view say, due to an increase in available resources and in admission standards8.
2 Delaware Educational Personnel Reports (2012). 3 Delaware Department of Education, http://profiles.doe.k12.de.us/SchoolProfiles/State/Default.aspx (Winter 2013). 4 U.S. Department of Education, National Center for Education Statistics, Beginning Teacher Longitudinal Study (BTLS), "First Through Third Wave Preliminary Data File," 2007–08, 2008–09, 2009–10. 5 Delaware Department of Education, http://profiles.doe.k12.de.us/SchoolProfiles/State/Default.aspx (Winter 2013). 6 Colleges Overproducing Elementary Teachers, Data Find, Stephen Sawchuk, Education Week, January 23, 2013. 7 Colleges Overproducing Elementary Teachers, Data Find, Stephen Sawchuk, Education Week, January 23, 2013. 8 Colleges Overproducing Elementary Teachers, Data Find, Stephen Sawchuk, Education Week, January 23, 2013.
Female 76%
Male 24%
Figure 2. Teacher Breakdown by Gender in Delaware
Amer. Indian 0.2%
African Amer. 10.4%
Asian Amer. 0.6%
Hispanic 1.9%
White 86.9%
Figure 1. Teacher Breakdown by Race in Delaware
Delaware Teacher and Administrator Supply and Demand Survey Analysis June 2013
8
According to the National Council on Teacher Quality (NCTQ), Delaware, like the nation as a whole, is struggling to adequately prepare future teachers for the challenges they will face in the classroom. In the NCTQ’s annual report for 2012, the national average grade for teacher preparation was a D+, while Delaware lagged behind with a D-‐9. They base their ratings off of six categories—raising admission standards to preparation courses, aligning teacher preparation with Common Core State Standards, improving student teaching preparation, increasing licensing standards, maintaining a high standard of quality for special education teachers, and increasing accountability for teacher preparation programs10. Currently, Delaware only fully meets the standards set by the NCTQ in one area, which is “secondary teacher preparation”11. Delaware partially meets the standards in the areas of “secondary teacher preparation in science and social studies, and middle school teacher preparation,” while it meets only a small part of the standards set in the area of “elementary of teacher preparation in math”12. The state fails to meet the NCTQ standards in the areas of “admission into preparation programs, elementary teacher preparation in general, and in reading instruction, in special education teacher preparation, assessing professional knowledge, student teaching, and teacher preparation program accountability”13.
To improve some of these problem areas, the state legislature recently signed Senate Bill 51, which amended Chapter 12, Title 14 of the Delaware Code. In summary, this new bill aims to increase positive outcomes related to teacher preparation by increasing the standards that must be met before an applicant can receive an initial license and by requiring that all educator-‐preparation programs first be approved by the state Department of Education and, following this approval, establishing high standards for admission14. Basically, SB 51 focuses on increasing licensing and admission standards while also improving teacher-‐preparation program accountability.
9 National Council on Teacher Quality Policy Yearbook, 2012. 10 National Council on Teacher Quality Policy Yearbook, 2012. 11 National Council on Teacher Quality Policy Yearbook, 2012. 12 National Council on Teacher Quality Policy Yearbook, 2012. 13 National Council on Teacher Quality Policy Yearbook, 2012. 14 Senate Bill 51, Delaware State Senate, 147th General Assembly.

Delaware Teacher and Administrator Supply and Demand Survey Analysis June 2013
9
School District Supply and Demand Survey Results This section of the report is an analysis of the data provided by personnel directors from the 19 Delaware school districts. Analyses include teacher hiring; teacher hiring difficulties; recruitment strategies and incentives; the reasons for teachers leaving, vacancies, and shortage areas; hiring for non-‐teaching positions; and administrative hiring and administrative vacancies. Unless otherwise stated, the number of responses for each individual question is 19. Teacher Hiring in Delaware
Overview This section examines teacher hiring in the 19 school districts in Delaware. It looks at the number of teachers hired on regular and temporary contracts, why temporary contracts were issued by school districts, the number of inexperienced teachers, and ARTC hires. Teacher hires that were on temporary contracts the year before are also included. Following this focus on teacher characteristics, a segment examining the magnitude and reasoning behind late hiring will be included. For the first time, hiring trends in high-‐needs schools will be examined. The teacher hiring section concludes with an examination of subject areas of hiring concern, and school district use of letters of intent. Teacher Hiring According to school district personnel directors, a total of 975 teachers were hired on regular and temporary contracts for the 2012-‐2013 school year. Of these teachers, 66.4 percent (647) were hired on regular contracts, and 33.6 percent (328) were hired on temporary contracts. Compared to the 1,169 hired for the 2011-‐2012 school year, when 71.1 percent (831) were hired on regular contracts and 28.9 percent (338) on temporary contracts.
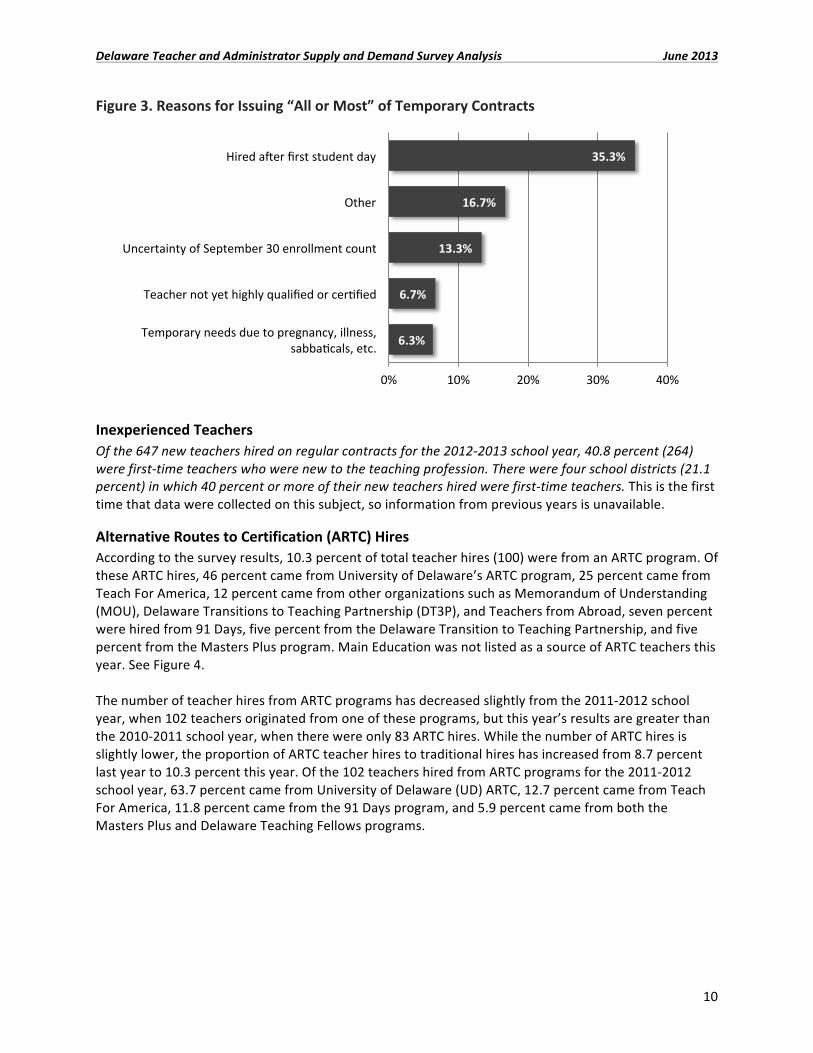
Reasons for Issuing Temporary Contracts Personnel directors indicated that the most common reason for issuing temporary contracts for the 2012-‐2013 school year was that the teachers were hired after the first student day of school. The survey results indicated that 11.8 percent (2) of the districts listed this as the reason that all of the teachers were hired on temporary contracts, and 23.5 percent (4) stated that most were hired for this reason. This reason was also the most common response in the previous school year, with 31.6 percent (6) of the school districts listing this as the reason that all of their teachers on temporary contracts were hired and with 15.8 percent (3) listing it as the reason that most were hired. Other responses that were listed as a reason why most of the teachers were hired on temporary contracts for the 2012-‐2013 school year included uncertainty of September 30 enrollment count, teacher not yet highly qualified or certified, temporary needs due to pregnancy, illness, sabbaticals, etc., and other. See Figure 3.
Delaware Teacher and Administrator Supply and Demand Survey Analysis June 2013
10
Figure 3. Reasons for Issuing “All or Most” of Temporary Contracts
Inexperienced Teachers Of the 647 new teachers hired on regular contracts for the 2012-‐2013 school year, 40.8 percent (264) were first-‐time teachers who were new to the teaching profession. There were four school districts (21.1 percent) in which 40 percent or more of their new teachers hired were first-‐time teachers. This is the first time that data were collected on this subject, so information from previous years is unavailable.
Alternative Routes to Certification (ARTC) Hires According to the survey results, 10.3 percent of total teacher hires (100) were from an ARTC program. Of these ARTC hires, 46 percent came from University of Delaware’s ARTC program, 25 percent came from Teach For America, 12 percent came from other organizations such as Memorandum of Understanding (MOU), Delaware Transitions to Teaching Partnership (DT3P), and Teachers from Abroad, seven percent were hired from 91 Days, five percent from the Delaware Transition to Teaching Partnership, and five percent from the Masters Plus program. Main Education was not listed as a source of ARTC teachers this year. See Figure 4. The number of teacher hires from ARTC programs has decreased slightly from the 2011-‐2012 school year, when 102 teachers originated from one of these programs, but this year’s results are greater than the 2010-‐2011 school year, when there were only 83 ARTC hires. While the number of ARTC hires is slightly lower, the proportion of ARTC teacher hires to traditional hires has increased from 8.7 percent last year to 10.3 percent this year. Of the 102 teachers hired from ARTC programs for the 2011-‐2012 school year, 63.7 percent came from University of Delaware (UD) ARTC, 12.7 percent came from Teach For America, 11.8 percent came from the 91 Days program, and 5.9 percent came from both the Masters Plus and Delaware Teaching Fellows programs.
35.3%
16.7%
13.3%
6.7%
6.3%
0% 10% 20% 30% 40%
Hired aoer first student day
Other
Uncertainty of September 30 enrollment count
Teacher not yet highly qualified or cerqfied
Temporary needs due to pregnancy, illness, sabbaqcals, etc.

Delaware Teacher and Administrator Supply and Demand Survey Analysis June 2013
11
Figure 4. Sources of Alternative Routes to Certification Hires
Hires that Were Previously on Temporary Contracts Of the 975 total teachers who were hired for the 2012-‐2013 school year, 36.5 percent (236) were on temporary contracts for the 2011-‐2012 school year. When Teachers Were Hired According to the personnel directors, late hiring (hiring in August or later) has decreased slightly from last year. For the 2012-‐2013 school year, 46.5 percent (301) of new teachers on regular contracts were hired in August or later. The percentage of teachers hired on regular contracts in August or later was 48.6 last year and 64.3 two years ago. See Figure 5. Like the previous two years, the highest percentage of teacher hires on regular contracts occurred in August. For the 2012-‐2013 school year, 36.8 percent of teacher hires occurred in August, a slight decrease from last year (37.9 percent). July had the next highest percentage of teacher hires on regular contracts for the 2012-‐2013 school year, at 21.6 percent, a change from last year—June, 23.1 percent. This year, the months with the next highest percentages of hires following July were June (13.8 percent) and May (12.8 percent). See Figure 6.
91 Days 7%
Delaware Transiaon to Teaching Partnership
5%
Main Educaaon 0%
Masters Plus 5% Other
12% Teach For America 25%
UD ARTC 46%

Delaware Teacher and Administrator Supply and Demand Survey Analysis June 2013
12
Figure 5. Month that Teacher Contract was Agreed Upon: Four-‐Year School District Comparison
Figure 6. Percent of Teachers Hired August or Later: Four-‐Year School District Comparison
4.2% 2.8% 12.9% 18.1% 8.0% 10.4%
23.1% 13.8% 27.6% 22.5%
15.4% 21.6%
40.5% 50.3%
37.9% 36.8%
8.0%
11.3% 6.5% 4.3% 11.7%
2.7% 4.2% 5.4%
0%
20%
40%
60%
80%
100%
2009-‐2010 (N=829)
2010-‐2011 (N=743*)
2011-‐2012 (N=831)
2012-‐2013 (N=647)
October or later
September
August
July
June
May or earlier
*two districts did not report months
60.2% 64.3%
48.6% 46.5%
20%
30%
40%
50%
60%
70%
2009-‐2010 2010-‐2011 2011-‐2012 2012-‐2013

Delaware Teacher and Administrator Supply and Demand Survey Analysis June 2013
13
Reasons for Late Hiring The three primary reasons for late hiring were uncertainty of the September 30 enrollment count, late increase in enrollment, and concerns about having to use local funds to fully fund additional teachers. Each of these factors was listed as a major reason leading to late hiring by 21.1 percent (4) of school districts. These results are similar to last year’s, when late increase in enrollment was the most common response (26.3 percent) for which factors were a major reason for late hiring. Last year, uncertainty of the September 30 enrollment count (21.1 percent), concerns about having to use local funds to fully fund additional teachers (15.8 percent), and difficulty in filling positions because of a lack of qualified applicants (15.8 percent) were also common responses for major reasons for late hiring. To gain a greater understanding of the factors leading to late hiring, factors listed most often as major or moderate reasons were examined. Late increase in enrollment, jumping, and late notification by teachers leaving for reasons other than retirement were all listed as a major or moderate reason for late hiring by 63.2 percent (12) of the school districts. Other, unlisted reasons were offered as major or moderate reasons by 15.8 percent (3) of the school districts and included lower enrollment leading to an excess of teachers who had to be placed, and new positions being created as a result of reorganization. See Figure 7.
Figure 7. Percent of School Districts Indicating a Major Reason for Hiring in August or Later due to…
Note: Survey options “Teachers left after first student day of school” and “Late notification by retiring teachers” were not indicated by any district. Hiring in High-‐Needs Schools Hiring in high-‐needs schools, which, for the purposes of this survey, were defined as schools with a minority population over 70 percent and/or have over 70 percent of students who are eligible for free or reduced lunch, or that are in the top 25 percent in the state with the English-‐Language Learner (ELL) population and meet one of the first two criteria, was also examined. When gauging the difficulty of filling teaching positions at high-‐needs schools, 5.3 percent (1) of the respondents stated that it was very
5.3%
5.3%
10.5%
10.5%
15.8%
21.1%
21.1%
21.1%
Late noqficaqon by teachers leaving for other reasons
Difficulty in filling posiqons because of lack of qualified applicants
Bumping (internal transfer process)
Other
Jumping
Uncertainty of September 30 enrollment count
Late increase in enrollment
Concern about having to use local funds to fully fund addiqonal teachers
0% 5% 10% 15% 20% 25%

Delaware Teacher and Administrator Supply and Demand Survey Analysis June 2013
14
difficult, 26.3 percent (5) that it was moderately difficult, 21.1 percent (4) that it was not difficult, and 47.4 percent (9) that this question was not applicable to their school. In the 10 school districts that found this question to be applicable, 700 total new teachers were hired, with 62.3 percent (436) hired on regular contracts, and 37.7 percent (264) hired on temporary contracts. Of the 436 new teachers that were hired on regular contracts, 45.4 percent (198) were first-‐time teachers with no prior teaching experience. Nearly half (204, 46.8 percent) of new teachers hired on regular contracts were hired in August or later, with the highest number of hires (184, 42.2 percent) occurring in August. According to the survey results, 13 percent (91) of the total new teachers hired came from an ARTC program, with 44 percent (40) coming from UD ARTC, 27.5 percent (25) from Teach For America, 6.6 percent (6) from 91 Days, and 5.5 percent (5) from both Masters Plus and Delaware Transition to Teaching Partnership. Nearly 11 percent (10) of these ARTC hires came from other sources including nine from Teachers from Abroad one from DT3P. For the 2012-‐2013 school year, there were 65 occurrences of teacher candidates rejecting a contract/offer made by a school district in this cohort among 70 percent (7) of the school districts. These same seven school districts also had some teacher candidates commit to work in their school district and later change their minds between the months of June to September. There were 22 instances of this happening during the current school year. According to the respondents in this cohort, 176 emergency certificates were requested for the 2012-‐2013 school year, with 38.6 percent (68) of these coming from a state-‐approved ARTC organization. At the time of this survey, 60 percent (6) of the school districts in this cohort had at least one open position.
Subject Areas of Hiring Concern The three most common responses for which teaching positions were difficult to fill were foreign languages, high school science, and high school math. The most common response was foreign languages, and it was considered to be a very or moderately difficult position to fill by 63.2 percent (12) of the school districts, and not applicable by 21.1 percent (4). The next most common responses were high school science and math, which were both considered to be very or moderately difficult to fill by 52.6 percent (10) of the school districts, and not applicable for 21.1 percent (4). The least difficult teaching position to fill was elementary education, which was considered to be not difficult to fill by 68.4 percent (13), and not applicable by 26.3 percent (5). Last year, the most common responses for which teaching positions were very difficult were the same as this year’s results. Foreign language positions were considered to be very difficult to fill by 26.3 percent (5) of the school districts in 2012-‐2013, which is a decrease from last year, when 47.4 percent (9) considered teaching positions in this subject to be very difficult to fill. High school math positions were considered to be very difficult to fill by 26.3 percent (5) of the school districts in 2012-‐2013, which is a decrease from last year, when 36.8 percent (7) considered teaching positions in this subject to be very difficult to fill. High school science positions were considered to be very difficult to fill by 15.8 percent (3) of the school districts in 2012-‐2013, which is a decrease from last year, when 36.8 percent (7) considered teaching positions in this subject to be very difficult to fill. Overall, while the most common responses are the same as last year, the number of school districts considering these subjects to be very difficult to fill has decreased. See Figure 8.
Delaware Teacher and Administrator Supply and Demand Survey Analysis June 2013
15
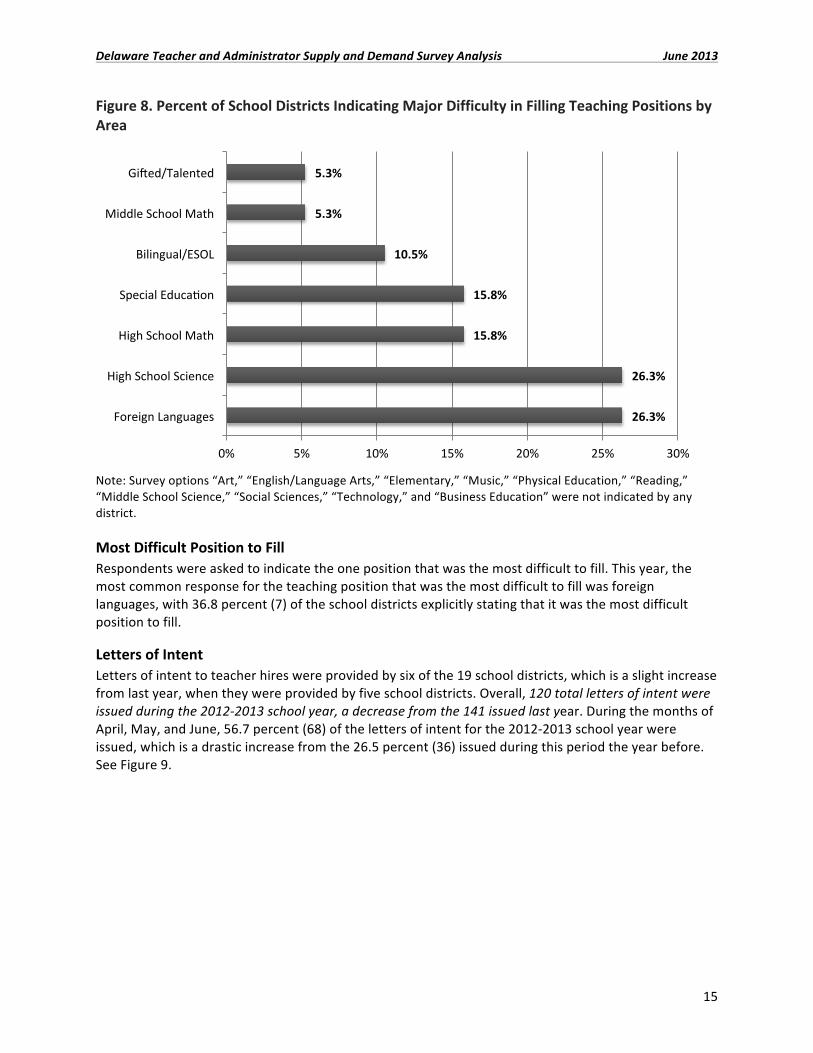
Figure 8. Percent of School Districts Indicating Major Difficulty in Filling Teaching Positions by Area
Note: Survey options “Art,” “English/Language Arts,” “Elementary,” “Music,” “Physical Education,” “Reading,” “Middle School Science,” “Social Sciences,” “Technology,” and “Business Education” were not indicated by any district. Most Difficult Position to Fill Respondents were asked to indicate the one position that was the most difficult to fill. This year, the most common response for the teaching position that was the most difficult to fill was foreign languages, with 36.8 percent (7) of the school districts explicitly stating that it was the most difficult position to fill.
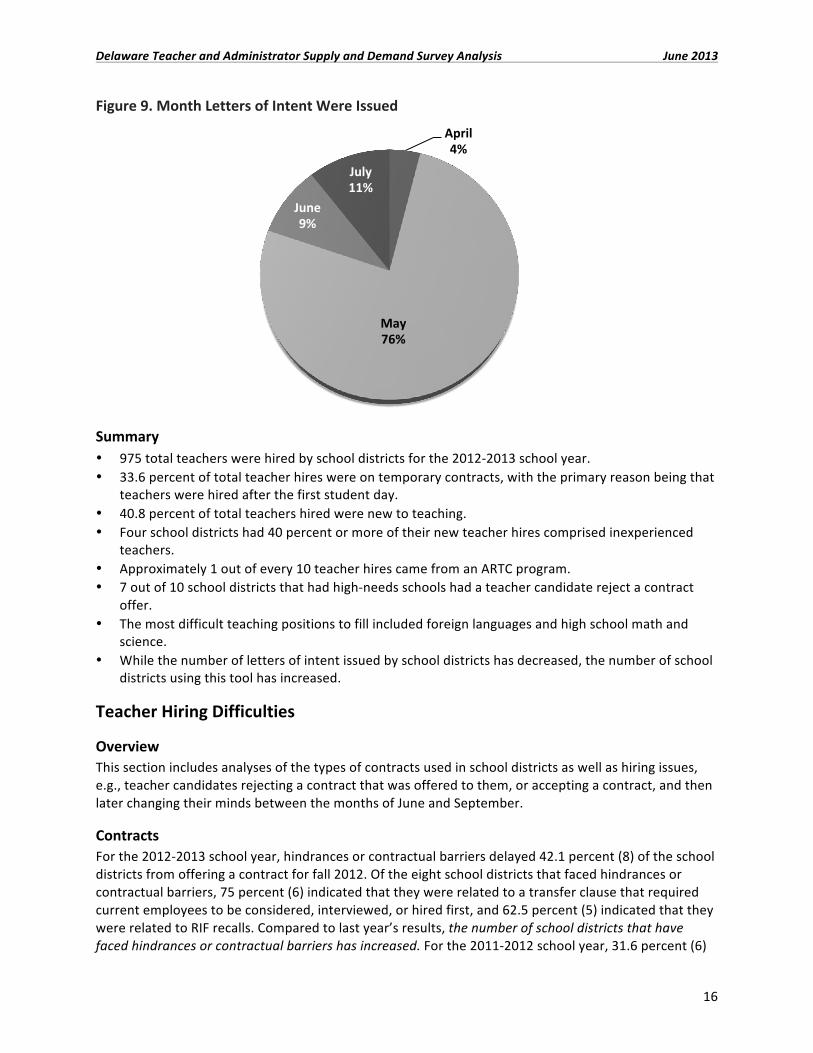
Letters of Intent Letters of intent to teacher hires were provided by six of the 19 school districts, which is a slight increase from last year, when they were provided by five school districts. Overall, 120 total letters of intent were issued during the 2012-‐2013 school year, a decrease from the 141 issued last year. During the months of April, May, and June, 56.7 percent (68) of the letters of intent for the 2012-‐2013 school year were issued, which is a drastic increase from the 26.5 percent (36) issued during this period the year before. See Figure 9.
26.3%
26.3%
15.8%
15.8%
10.5%
5.3%
5.3%
0% 5% 10% 15% 20% 25% 30%
Foreign Languages
High School Science
High School Math
Special Educaqon
Bilingual/ESOL
Middle School Math
Gioed/Talented
Delaware Teacher and Administrator Supply and Demand Survey Analysis June 2013
16
Figure 9. Month Letters of Intent Were Issued
Summary • 975 total teachers were hired by school districts for the 2012-‐2013 school year. • 33.6 percent of total teacher hires were on temporary contracts, with the primary reason being that
teachers were hired after the first student day. • 40.8 percent of total teachers hired were new to teaching. • Four school districts had 40 percent or more of their new teacher hires comprised inexperienced
teachers. • Approximately 1 out of every 10 teacher hires came from an ARTC program. • 7 out of 10 school districts that had high-‐needs schools had a teacher candidate reject a contract
offer. • The most difficult teaching positions to fill included foreign languages and high school math and
science. • While the number of letters of intent issued by school districts has decreased, the number of school
districts using this tool has increased.
Teacher Hiring Difficulties
Overview This section includes analyses of the types of contracts used in school districts as well as hiring issues, e.g., teacher candidates rejecting a contract that was offered to them, or accepting a contract, and then later changing their minds between the months of June and September.
Contracts For the 2012-‐2013 school year, hindrances or contractual barriers delayed 42.1 percent (8) of the school districts from offering a contract for fall 2012. Of the eight school districts that faced hindrances or contractual barriers, 75 percent (6) indicated that they were related to a transfer clause that required current employees to be considered, interviewed, or hired first, and 62.5 percent (5) indicated that they were related to RIF recalls. Compared to last year’s results, the number of school districts that have faced hindrances or contractual barriers has increased. For the 2011-‐2012 school year, 31.6 percent (6)
April 4%
May 76%
June 9%
July 11%

Delaware Teacher and Administrator Supply and Demand Survey Analysis June 2013
17
of the school districts had hindrances or contractual barriers limit their ability to offer a contract, with four identifying transfer clauses as the problem, one listing RIF issues as the key concern, and another stating that not knowing what was needed in terms of enrollment was the primary issue. According to the survey results, 47.4 percent (9) of the school districts attempted to renegotiate contractual barriers in their last collective bargaining agreement. Of these nine school districts that attempted to renegotiate their contractual barriers, three were successful, three were somewhat successful, and three failed to renegotiate these hindrances. These results are nearly identical to last year (2011-‐12), when 47.4 percent (9) of school districts tried to renegotiate their contracts at the last collective-‐bargaining negotiations, although only two were successful last year. Open contracts are the most common type of contract offered by school districts, with 84.2 percent (16) providing these to new hires. Specific-‐assignment contracts are offered by two districts, and one school district assigns teachers to a building. For the 2011-‐2012 school year, 73.7 percent (14) of the school districts offered an open contract, while 26.3 percent (5) offered specific-‐assignment contracts. Overall, there was an increase in school districts offering open contracts and a decrease in specific-‐assignment contracts.
Hiring Issues During the 2012-‐2013 school year, there were 75 instances in 11 school districts where a teacher candidate did not accept a contract offered by a school district. There were also 35 occurrences, affecting 11 of the school districts in Delaware, of individual teachers committing to work in a school district and later changing his/her mind between the months of June and September. The 11 school districts that had a teacher refuse a contract were also the same 11 school districts that had teachers change their minds after committing to a contract. Of the 35 people who committed to a contract and later changed their minds during the 2012-‐2013 school year, 42.9 percent took a position in another Delaware school district or charter school, 37.1 percent did so for unknown reasons, 11.4 percent took a position in another school district or charter school outside of Delaware, 5.7 percent decided not to teach, and 2.9 percent remained in their current positions. The number of times that this happened has increased since last year, when there were 26 instances of teachers committing to work in a school district and later changing their minds. Of the 26 teachers, 13 chose to go to another Delaware school district or charter school, five chose to take an out-‐of-‐state teaching position, one remained in his/her current position, three decided not to teach, and four changed their minds for other reasons. See Figure 10.

Delaware Teacher and Administrator Supply and Demand Survey Analysis June 2013
18
Figure 10. Reasons Why Teachers Who Committed to a District Later Changed Their Mind
Summary • Hindrances or contractual barriers impeded teacher hiring for 8 of 19 school districts, an increase
from last year. • Open contracts are the most common type of contract in school districts, and two more districts
than last year used them for the 2012-‐2013 school year. • There were 75 instances of individual teachers rejecting a contract among 11 school districts. • In these 11 school districts, there were 35 cases of teachers changing their minds between the
months of June and September after having accepted contracts. • The primary reason for a teacher changing his/her mind after having accepted a contract was that
he/she took a position in another Delaware school district or charter school.
Recruitment Strategies and Incentives
Overview The following section examines the recruitment strategies and use of incentives by the 19 school districts in Delaware. This section addresses recruitment budgets, recruitment tools used, as well as personnel directors’ views on attractive features that the schools in their district possess. Also examined is the use of incentives by school districts to promote positive development in staff and recruit teacher candidates. This year, hiring practices were examined of four categories that have desirable hiring outcomes. These four categories were (1) school districts that hire 60 percent or more of their teachers before August, (2) school districts that have not had any teacher candidates reject a contract or change their minds after accepting one between the months of June and September, (3) school districts that did not find any subjects very difficult to fill, and (4) school districts that did not have any open positions at the time that
0.0%
38.5%
7.7%
23.1%
30.8%
42.9%
11.4%
2.9%
5.7%
37.1%
0% 10% 20% 30% 40% 50%
Another Delaware school district or charter school posiqon
A posiqon in another school or charter outside of Delaware
Remain in current posiqon
Decided not to teach
Do not know
2012-‐2013
2011-‐2012

Delaware Teacher and Administrator Supply and Demand Survey Analysis June 2013
19
this survey was completed. There were no major differences between these groups and the results of all school districts. Recruitment Budget For the 2012-‐2013 school year, 73.7 percent (14) of the school districts had a recruitment budget. This is a slight decrease from last year, when 78.9 percent (15) of the school districts in Delaware had a recruitment budget. The mean and median amounts of money that school districts spent on advertisements, trips, and other out-‐of-‐pocket recruitment expenses were $8,558 and $5,000, respectively. The range of the amounts included:
• Up to $5,000 (9 districts) • $5,001-‐$10,000 (2 districts) • $10,001-‐$15,000 (1 district) • $15,001-‐$25,000 (2 districts)
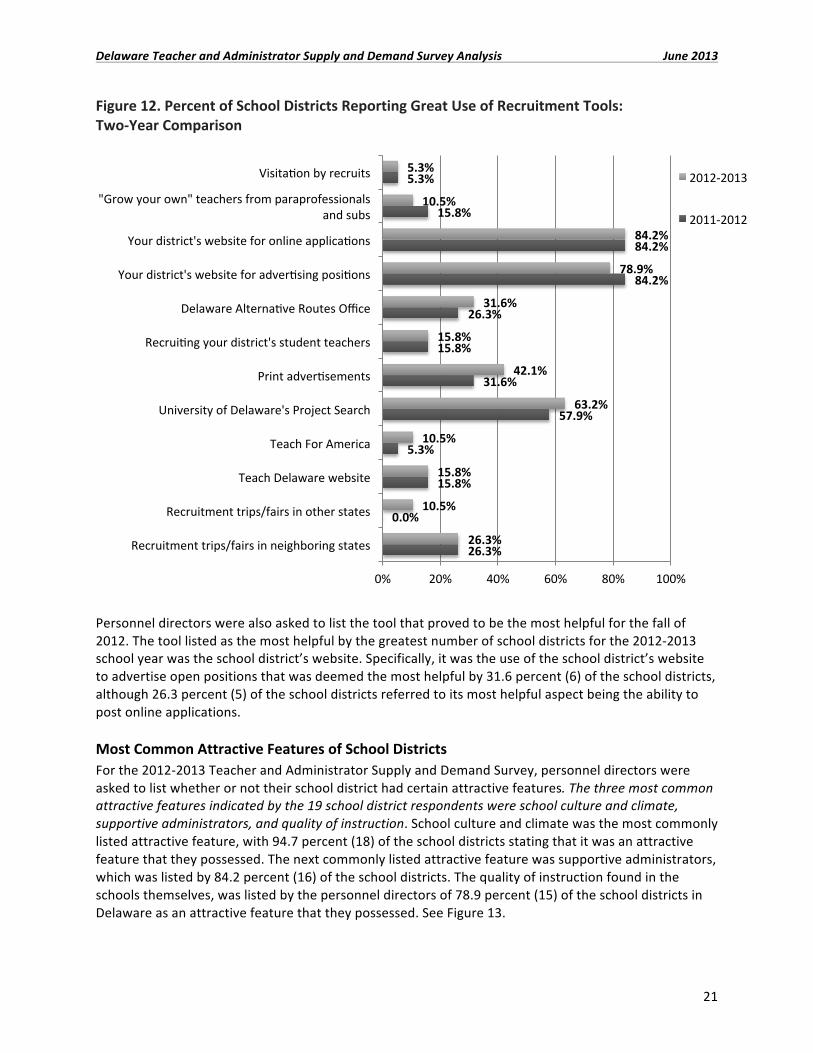
Use of Recruitment Tools The three most commonly utilized recruitment tools used by districts for the fall of 2012 were the school district’s website, the University of Delaware’s Project Search, and print advertisements. The school district’s website was greatly used by 84.2 percent (16) of the school districts to post online applications, and used by 78.9 percent (15) to advertise open positions. The University of Delaware’s Project Search was greatly used by 63.2 percent (12) of the school districts for recruitment purposes. The next most commonly utilized recruitment tool was print advertisements, which were greatly used by 42.1 percent (8) of the school districts in Delaware. These results are similar to last year, when the school district’s website being used to advertise positions (84.2 percent) and to post online applications (84.2 percent), and the University of Delaware’s Project Search (57.9 percent) were the most commonly listed greatly used recruitment tools. See Figures 11 and 12.

Delaware Teacher and Administrator Supply and Demand Survey Analysis June 2013
20
Figure 11. Percent of School Districts Reporting Great Use of Recruitment Tools
5.3%
10.5%
10.5%
10.5%
15.8%
15.8%
26.3%
31.6%
42.1%
63.2%
78.9%
84.2%
0% 20% 40% 60% 80% 100%
Visitaqon by recruits
Recruitment trips/fairs in other states
Teach For America
"Grow your own" teachers from paraprofessionals and subs
Teach Delaware website
Recruiqng your district's student teachers
Recruitment trips/fairs in neighboring states
Delaware Alternaqve Routes Office
Print adverqsements
University of Delaware's Project Search
Your district's website for adverqsing posiqons
Your district's website for online applicaqons
Delaware Teacher and Administrator Supply and Demand Survey Analysis June 2013
21
Figure 12. Percent of School Districts Reporting Great Use of Recruitment Tools: Two-‐Year Comparison
Personnel directors were also asked to list the tool that proved to be the most helpful for the fall of 2012. The tool listed as the most helpful by the greatest number of school districts for the 2012-‐2013 school year was the school district’s website. Specifically, it was the use of the school district’s website to advertise open positions that was deemed the most helpful by 31.6 percent (6) of the school districts, although 26.3 percent (5) of the school districts referred to its most helpful aspect being the ability to post online applications. Most Common Attractive Features of School Districts For the 2012-‐2013 Teacher and Administrator Supply and Demand Survey, personnel directors were asked to list whether or not their school district had certain attractive features. The three most common attractive features indicated by the 19 school district respondents were school culture and climate, supportive administrators, and quality of instruction. School culture and climate was the most commonly listed attractive feature, with 94.7 percent (18) of the school districts stating that it was an attractive feature that they possessed. The next commonly listed attractive feature was supportive administrators, which was listed by 84.2 percent (16) of the school districts. The quality of instruction found in the schools themselves, was listed by the personnel directors of 78.9 percent (15) of the school districts in Delaware as an attractive feature that they possessed. See Figure 13.
26.3%
0.0%
15.8%
5.3%
57.9%
31.6%
15.8%
26.3%
84.2%
84.2%
15.8%
5.3%
26.3%
10.5%
15.8%
10.5%
63.2%
42.1%
15.8%
31.6%
78.9%
84.2%
10.5%
5.3%
0% 20% 40% 60% 80% 100%
Recruitment trips/fairs in neighboring states
Recruitment trips/fairs in other states
Teach Delaware website
Teach For America
University of Delaware's Project Search
Print adverqsements
Recruiqng your district's student teachers
Delaware Alternaqve Routes Office
Your district's website for adverqsing posiqons
Your district's website for online applicaqons
"Grow your own" teachers from paraprofessionals and subs
Visitaqon by recruits 2012-‐2013
2011-‐2012

Delaware Teacher and Administrator Supply and Demand Survey Analysis June 2013
22
Figure 13. Attractive Qualities of Schools, Percent Indicating “Yes”
Salary and Incentives For the first time, personnel directors were asked whether or not they offered any recruitment incentives to teacher candidates and if the school district used any pay incentives, such as cash bonuses, salary increases, or incremental steps on the salary schedule to reward teachers. According to the survey results, 78.9 percent (15) of the school districts do not offer recruitment incentives to teacher candidates, although one of these school districts does offer some form of recruitment incentive to school psychologist candidates. The recruitment incentives offered by the four school districts that do offer them include a tuition reimbursement for advanced coursework, relocation loan, $2,500 bonus as part of the partnership zone, and an unspecified signing bonus. Of the 18 school districts that responded to the question of whether or not they offer pay incentives to reward desirable behavior, 61.1 percent (11) responded that they did not. Of the districts that do offer them, three responded that they offer them to recruit or retain teachers in fields of shortage, two offer them to reward National Board Certification for Professional Teaching Standards, one offers them to recruit teachers to teach in less desirable locations, and one offers them to reward excellence in teaching. Summary • 14 school districts, one fewer than last year, have a recruitment budget. • The mean amount of money that these 14 school districts spent on advertisements, trips, and other
out-‐of-‐pocket recruitment expenses was $8,558. • The most commonly used recruitment tools are the University of Delaware’s Project Search, the
school district’s website, and print advertisements. • School culture and climate, supportive administrators, and quality of instruction are the most
common attractive features.
5.3%
5.3%
15.8%
31.6%
36.8%
42.1%
63.2%
63.2%
68.4%
68.4%
78.9%
84.2%
94.7%
0% 20% 40% 60% 80% 100%
Performance incenqves
Housing, housing subsidies
Signing bonuses
Loan forgiveness
Class size
Teacher autonomy
Supporqve teachers
School faciliqes
Compensaqon and benefits
Professional development
Quality of instrucqon
Supporqve administrators
School culture and climate

Delaware Teacher and Administrator Supply and Demand Survey Analysis June 2013
23
• 15 of the 19 school districts do not offer incentives to teacher candidates. • The recruitment practices of the four breakout groups are similar to those of all of the school
districts, positive hiring outcomes may be linked to some other variable.
Departures, Reasons for Leaving, Vacancies, and Shortage Areas
Overview The following section will examine teacher departures, reasons for leaving, vacancies, and shortage areas for the 2012-‐2013 school year. Teacher Departures According to personnel directors, 444 total teachers left their school district during the 2012-‐2013 school year. This is an increase from last year, when 402 total teachers left their school districts. Reasons for Departures This year, 80.1 percent (359) of the teachers who left school districts departed for specified reasons, as opposed to unknown ones. This is a drastic increase from last year, when only 65.5 percent of teachers departed due to reasons that were known by the personnel director. For the 2012-‐2013 school year, the most common reason for teacher departures was retirement, with 37.8 percent (168) of the teachers who left having left for this reason. Last year, retirement was also the most common reason for teacher departures, with 23.9 percent (96) of the teachers who left having left for this reason. See Figure 14. Additional reasons for teachers departing were as follows:
• 14 percent (62) left to take a position in another Delaware school district/charter school. • 10.4 percent (46) left for known reasons other than the ones offered as responses. • 6.3 percent (28) were non-‐renewed/counseled out of teaching. • 4.9 percent (22) left due to family/personal reasons. • 4.7 percent (21) left to take a position in another district/charter school outside of Delaware. • 1.6 percent (7) were RIF’d. • 1.1 percent (5) became administrators.

Delaware Teacher and Administrator Supply and Demand Survey Analysis June 2013
24
Figure 14. Reasons for Teachers Leaving School Districts
Exit Survey For the 2012-‐2013 school year, 36.8 percent (7) of the school districts administered an exit survey to departing teachers. This is a decrease from last year, when 52.6 percent (10) of the school districts administered one. Of the 85 teachers who left their school districts for unknown reasons, 87.1 percent (74) left school districts that did not administer an exit survey.
Reasons for Teacher Shortages According to the personnel directors, the two primary reasons for teacher shortages during the 2012-‐2013 school year were a lack of qualified teacher candidates in particular areas and a lack of teacher candidates in particular areas. Each of these reasons was considered to be a major problem by 21.1 percent (4) of the school districts. These two reasons were also listed as the main factors leading to teacher shortages last year, with 42.1 percent (8) and 52.6 percent (10) of the school districts referring to them as major problems, respectively. See Figure 15.
18.0%
7.8%
8.9%
2.7%
11.3%
2.7%
25.6%
2.7%
20.2%
20.8%
6.2%
13.1%
3.0%
15.0%
1.2%
23.9%
10.7%
6.0%
14.0%
4.7%
6.3%
1.1%
4.9%
1.6%
37.8%
10.4%
19.1%
0% 10% 20% 30% 40%
Took a posiqon in another Delaware school district/charter school
Took a posiqon in another district outside Delaware
Non-‐renewed/counseled out of teaching
Became an administrator
Family/personal reasons
Were RIF'd
Reqred
Other known reasons for leaving
Do not know why teacher leo 2012-‐2013 (N=444)
2011-‐2012 (N=402)
2010-‐2011 (N=371)

Delaware Teacher and Administrator Supply and Demand Survey Analysis June 2013
25
To gain an even greater understanding of the factors that lead to teacher shortages, we examined which reasons were listed most often as a major or moderate problem. According to the personnel directors, the three primary reasons for teacher shortages during the 2012-‐2013 school year under this criteria were a lack of qualified teacher candidates in particular areas (73.7 percent), a lack of teacher candidates in a particular area (68.4 percent), and teachers moving from a school district into another district/charter school in Delaware (52.6 percent). The reasons that did not lead to teacher shortages were good teaching candidates failing PRAXIS I, indicated as not a problem by 84.2 percent (16) of the school districts, and perceived problems with teaching in Delaware, including discipline, class size, accountability, etc., indicated as not a problem by 78.9 percent (15) of the school districts. Figure 15. Percent of School Districts Indicating a Problem in Teachers Shortages due to…
21.1%
21.1%
5.3%
5.3%
47.4%
52.6%
47.4%
26.3%
26.3%
36.8%
15.8%
26.3%
15.8%
31.6%
26.3%
47.4%
73.7%
73.7%
63.2%
84.2%
73.7%
78.9%
0% 10% 20% 30% 40% 50% 60% 70% 80% 90%
Lack of qualified teacher candidates in parqcular areas
Lack of number of teacher candidates in parqcular areas
Moving from your district to another district in Delaware
Moving from your district to a district outside Delaware
Low starqng salaries
Low salaries for experienced teachers
Good candidates failing PRAXIS I
Good candidates failing PRAXIS II
Perceived Problems with teaching in Delaware (e.g. with respect to discipline,
class size, accountability)
Not a Problem Moderate Problem Major Problem

Delaware Teacher and Administrator Supply and Demand Survey Analysis June 2013
26
Open Positions Personnel directors from 47.4 percent (9) of the school districts reported that they had open teaching positions at the time of the survey. These nine school districts reported a total of 17 open positions. The subjects of these open positions included math (3), secondary science (2), elementary education (2), English (2), French (1), music (1), certified nursing assistant (1), special education (1), counseling (1), art (1), marine ROTC (1), and aviation (1). Last year, personnel directors reported that there were 14 unfilled teaching positions at the time they completed the survey. The subjects of the unfilled positions included English language arts (4), speech therapists (4), math (2), science (1), special education (1), foreign language (1), and IB coordinator (1).
When Vacancies Were Learned About Dates for 447 vacancies were reported for the 2012-‐2013 school year. Of these 447 vacancies, 25.5 percent (114) were learned about by respondents in April 2012 or earlier, and 74.5 percent (333) were learned about in May or later. These results show that vacancies are being learned about slightly later in the year than last year, when 28 percent of vacancies were learned about in April or earlier. The most vacancies were learned about in May, with the respondents being notified of 24.4 percent (109) of them during this month. This result is significantly different than last year, when the largest number of vacancies was reported in August—19.5 percent (120). See Figure 16. Figure 16. Number of Vacancies Learned About by Month (Percent of Teachers Reported)
6.9% 4.1% 3.1% 1.8%
1.2% 1.6% 1.1% 1.1%
3.1% 1.6% 1.1%
1.6%
2.2% 5.4%
5.2% 3.1%
2.7% 3.3% 5.7% 7.6%
2.4% 4.9% 3.9% 4.3%
9.9% 7.4% 7.8% 6.0%
12.7% 10.9% 10.6% 24.4%
10.1% 12.7% 16.3%
13.4% 20.6%
15.0% 11.4%
10.7%
14.0% 17.3% 19.5%
16.1%
7.0% 2.7%
6.8% 4.5%
7.0% 13.1%
7.3% 5.4%
0%
20%
40%
60%
80%
100%
2009-‐2010 (N=782) 2010-‐2011 (N=513) 2011-‐2012 (N=614) 2012-‐2013 (N=447)
October or later*
September*
August
July
June
May
April
March
February
January
December
November
October
*Current school year; all other months represent prior year

Delaware Teacher and Administrator Supply and Demand Survey Analysis June 2013
27
Vacancies Filled Internally This year, for the first time, the personnel directors were asked about the number of open positions that they filled internally. Of the 18 districts that responded to this question, 72.2 percent (13) filled at least one position internally. Of the 447 vacancies that were reported by personnel directors, 43.6 percent (195) were filled internally. The most common subject filled internally was elementary education (28).
Emergency Certificates For the 2012-‐2013 school year, a total of 211 emergency certificates were requested by the 19 school districts. Of these 211 emergency certificates, 38.9 percent (82) were filled by a person participating in an ARTC program. The most common subjects for which emergency certificates were requested included special education (21), English (13), English as a Second Language –ESL (12), and foreign languages (12). This is a decrease from last year, when 230 emergency certificates were requested, with the most common subjects including math (22), autistic teaching (19), and science (16). While teaching autistics, which is comparable to special education, was one of the most common subjects in both years, in the 2012-‐2013 school year the focus shifted toward language-‐related studies.
Eligible Retirees Over the Next Five Years This year, for the first time, personnel directors were asked to list how many teachers, principals, assistant principals, and district office staff would be eligible for retirement over the next five years. For the 18 school districts that responded to this question, there will be 551 teachers, 56 district office staff, 20 principals, and 15 assistant principals eligible for retirement over the next five years. As of the 2011-‐2012 school year, there were 7,971 teachers, 346 district office staff, 227 assistant principals, and 189 principals employed by the school districts of Delaware15.
Early-‐Retirement Incentives Early-‐retirement incentives were offered by 78.9 percent (15) of the school districts in Delaware. Of these districts, all used the same incentives that were offered last year. The last day of notification ranged from December 31 to April 1, with the most common day being March 1 (5). Every school district that offered incentives for early retirement had at least one teacher use it, and there were a total of 111 individuals who took advantage of the available early retirement–notification incentives.
Summary • 444 total teachers left their school districts this year. • Retirement is the most common reason for departure. • Only seven districts use exit surveys. • 87.1 percent of teachers who departed for unknown reasons left from a school district that did not
use an exit survey. • A lack of qualified and the number of teacher candidates in particular areas are the most common
reasons for teacher shortages, as it was last year. • Nine school districts had open positions when completing the survey. • Vacancies are being learned about slightly later than they were last year. • 43.6 percent of vacancies were filled internally.
15 Delaware Educational Personnel Reports, 2012

Delaware Teacher and Administrator Supply and Demand Survey Analysis June 2013
28
• 211 emergency certificates were issued this year, with 38.9 percent coming from an ARTC organization.
• 551 teachers, 56 district office staff, 20 principals, and 15 assistant principals are eligible for retirement over the next five years.
• 15 school districts offer early-‐retirement incentives.
Hiring Non-‐Teaching Positions
Overview The following section examines the school districts’ experiences with hiring non-‐teaching positions. It examines what non-‐teaching positions were the most difficult to fill, and which one was the least difficult, followed by the personnel directors’ opinions on how hiring for these positions will be different next year. This section will conclude with a brief analysis on which non-‐teaching position was the most commonly listed by personnel directors when they were asked which one was the most difficult to fill.
Hiring of Non-‐Teaching Positions The two most common responses made by personnel directors when asked which non-‐teaching positions were very difficult to fill were speech therapist and psychologist. These results are similar to last year’s, when these two occupations were among the most common responses made by personnel directors when asked which non-‐teaching positions were very difficult to fill. Speech therapist positions were considered to be very difficult to fill by 47.4 percent (9) of the school districts in 2012-‐2013, which is a decrease from last year, when 68.4 percent (13) considered this position to be very difficult to fill. Psychologist positions were considered to be very difficult to fill by 21.1 percent (4) of the school districts in 2012-‐2013, which is a decrease from last year, when 31.6 percent (6) considered this position to be very difficult to fill. Overall, while the most common responses are the same as last year, the amount of school districts considering these subjects to be very difficult to fill has decreased. To gain a greater understanding of hiring difficulties relating to non-‐teaching positions, positions listed most often as either moderately difficult or very difficult to fill were examined. The three most common responses under this criteria made by personnel directors when asked which non-‐teaching positions were difficult to fill were speech therapist, nurse, and psychologist. The most common response for this question was speech therapist, and it was considered to be either a moderately difficult or very difficult position to fill by 73.7 percent (14) of the school districts, and not applicable by 26.3 percent (5). The next most common response was nurse, which was considered to be either moderately difficult or very difficult to fill by 52.6 percent (10) of the school districts, and not applicable by 31.6 percent (6). Following nurse, the next most common response was psychologist, the position for which was considered to be either moderately difficult or very difficult to fill by 47.4 percent (9) of the school districts, and not applicable by 36.8 percent (7). The least difficult non-‐teaching position to fill was guidance counselor, which was considered not difficult to fill by 52.6 percent (10) of the school districts, and not applicable by 42.1 percent (8). See Figure 17.

Delaware Teacher and Administrator Supply and Demand Survey Analysis June 2013
29
Figure 17. Percent of School Districts Indicating Major Difficulty in Filling Non-‐Teaching Positions
Note: Survey options “Guidance Counselor,” “Elementary School Principal,” “Elementary School Assistant Principal,” and “Middle School Assistant Principal” were not indicated by any district. Personnel directors were also asked to anticipate if they would incur any changes in difficulty in non-‐teacher hiring for the next school year. Nearly 57.9 percent (12) of the school districts do not anticipate any change in difficulty or expect any vacancies in non-‐teaching positions for the next school year. For the seven schools that do expect a change to occur, they anticipate that the difficulty will increase for filling positions that cater to special needs, such as speech therapists, psychologists, and special education, although one said that the re-‐opening of an old building will lead to an increase in hiring of support personnel.
Most Difficult to Fill According to the personnel directors of 17 school districts that hired non-‐teaching positions for the 2012-‐2013 school year, the most difficult non-‐teaching position to fill was speech therapist, which was specifically mentioned by 63.2 percent (12) of them. These results are similar to last year, when speech therapist was the most difficult non-‐teaching position to fill, although the percentage of school districts that found it to be the most difficult to fill was at 47.4 percent. Secondary school principal (2), secondary school assistant principal (1), nurse (1), and psychologist (1) were also mentioned by personnel directors last year, when they were asked which non-‐teaching position was the most difficult to fill.
Summary • The two most difficult non-‐teaching positions to fill were speech therapist and psychologist. • The least difficult to fill was guidance counselor.
5.3%
15.8%
5.3%
5.3%
5.3%
5.3%
21.1%
47.4%
0.0%
5.3%
5.3%
10.5%
10.5%
10.5%
31.6%
68.4%
0% 10% 20% 30% 40% 50% 60% 70%
Middle School Principal
Librarian/Media Technology
High School Assistant Principal
Nurse
High School Principal
Central Office Administrator
Psychologist
Speech Therapist
2011-‐2012
2012-‐2013
Delaware Teacher and Administrator Supply and Demand Survey Analysis June 2013
30
• Overall, the number of school districts finding non-‐teaching positions very difficult to fill has decreased from last year.
• 12 school districts do not anticipate any changes in difficulty or expect any vacancies in non-‐teaching positions for the next school year.
• Speech therapist was explicitly stated as the most difficult position to fill by 12 school districts.
Administrative Hiring
Overview The following section examines administrative hiring in school districts for the 2012-‐2013 school year. It looks at the number of principals and assistant principals hired, the applicants, and acceptable applicants and will be followed by a brief analysis of the origins of hires of principals.
Principal Hiring Over the course of the 2012-‐2013 school year, 28 principals were hired from a pool of 325 applicants. Of these 325 applicants, only 28 percent (91) were deemed acceptable to fill the positions for which they applied. The number of new principals last year was 18. Last year, the percentage of acceptable applicants (24.2) included principals and assistant principals.
Hire Origins of Principals The origins of the 28 hires for the 2012-‐2013 school year were as follows: • 75 percent (21) were hired from within their own school district. • 14.3 percent (4) were hired from another school district/charter school in Delaware. • 7.1 percent (2) were hired from out of state. • 3.6 percent (1) was hired from the Delaware Leadership Project. The number of principals hired from within their own school district has increased from last year, when the total was 11. The number of principals hired from another school district/charter school in Delaware is the same as last year (4). The number of principals hired from out of state has decreased from last year, when the total was 3. See Figure 18.

Delaware Teacher and Administrator Supply and Demand Survey Analysis June 2013
31
Figure 18. Sources of Recently Hired School District Principals (Percent of Administrators Reported)
Assistant Principal Hiring Over the course of the 2012-‐2013 school year, 35 assistant principals were hired from a pool of 1,156 applicants. Of the 1,056 applicants for whom acceptability was determined, only 24.5 percent (259) were deemed acceptable to fill the position for which they applied. The number of new assistant principals hired has decreased from the 41 hired last year.
Hire Origins of Assistant Principals The origins of the 35 hires for the 2012-‐2013 school year were as follows: • 60 percent (21) were hired from within their own school district. • 28.6 percent (10) were hired from another school district/charter school in Delaware. • 5.7 percent (2) were hired from out of state. • 5.7 percent (2) were hired from the Delaware Leadership Project.
The number of assistant principals hired from within their own school district has decreased from last year, when the total was 25. The number of assistant principals hired from another school district/charter school in Delaware has increased from last year, when the total was nine. The number of assistant principals hired from out of state has decreased from last year, when the total was seven. The amount of assistant principals hired from the Delaware Leadership Project has increased from last year, when the total was zero. See Figure 19.
75.0% 61.1%
14.3%
22.2%
7.1% 16.7% 3.6%
0%
20%
40%
60%
80%
100%
2012-‐2013 Principals (N=28)
2011-‐2012 Principals (N=18)
Delaware Leadership Project
From out-‐of-‐state
From Delaware but outside your district
From inside your district

Delaware Teacher and Administrator Supply and Demand Survey Analysis June 2013
32
Figure 19. Sources of Recently Hired School District Assistant Principals (Percent of Administrators Reported)
First Time Administrators This year, for the first time, the personnel directors were asked to report the number of principal and assistant principal hires that were first-‐time administrators. According to the respondents, 78.6 percent (22) of the 28 principals were first-‐time administrators. Of the 35 assistant principals who were hired for the current school year, 71.4 percent (25) were first-‐time administrators.
Succession Planning Of the 28 principals who were hired for the current school year, 53.6 percent (15) were aspiring school leaders who participated in a school district’s succession-‐planning or development program to prepare/develop school administrators, and 37.1 percent (13) of the 35 assistant principal hires took part in one of these programs. Last year, of the 18 principals who were hired, 22.2 percent (4) participated in a succession-‐planning or development program, while 31.7 percent (13) participated in one of these.
Administrator Development According to the survey results, 84.2 percent (16) of the school districts have a program in place to prepare/develop school administrators. This is an increase from last year, when 68.4 percent (13) of school districts had a program of this nature. The personnel directors also reported that 73.7 percent (14) of the school districts have a program to support new principals during their induction stage, with each district mentioning that it is available to all principals who are new to the district. This is an increase from last year when 42.1 percent (8) of school districts had a program of this nature.
Summary • 28 principals were hired, and only 28 percent of the applicants for these positions were deemed
acceptable to fill them. • 75 percent of principal hires came from within their own school district.
60.0% 61.0%
28.6% 22.0%
5.7% 17.0% 5.7%
0%
20%
40%
60%
80%
100%
2012-‐2013 Asst. Principals (N=35)
2011-‐2012 Asst. Principals (N=41)
Delaware Leadership Project
From out-‐of-‐state
From Delaware but outside your district
From inside your district

Delaware Teacher and Administrator Supply and Demand Survey Analysis June 2013
33
• 78.6 percent of hires of principals were first-‐time administrators. • 35 assistant principals were hired, and only 24.5 percent of the applicants for these positions were
deemed acceptable to fill them. • 60 percent of assistant principal hires came from within their own school district. • 71.4 percent of assistant principal hires were first-‐time administrators. • 16 school districts have a program in place to prepare/develop school administrators.
Administrator Vacancies
Overview The following section examines administrator vacancies in school districts for the 2012-‐2013 school year. It focuses solely on the number of administrative departures and the reasons for why they occurred.
Administrative Departures For the 2012-‐2013 school year, the personnel directors reported information on 38 administrative departures. This is an increase from last year, when there were 34 reported administrative departures, but a decrease from the 2009-‐2010 and 2008-‐2009 school years (50 and 57, respectively).
Reasons for Administrative Departures The reasons for the 38 reported administrative departures for the 2012-‐2013 school year were as follows:
• 39.5 percent (15) retired. • 31.6 percent (12) took a position in another Delaware school district. • 7.9 percent (3) were either counseled out of administration or the school district. • 7.9 percent (3) were dismissed due to poor performance. • 5.3 percent (2) left for other known reasons. • 5.3 percent (2) took a position in another school district outside of Delaware. • 2.6 percent (1) took a position at a charter school.
The top three reasons for the 34 administrative departures last year were retirement, leaving to take a position in another Delaware school district, and unknown. The number of administrators leaving due to retirement increased from last year (10), and the number of administrators leaving to take a position in another Delaware school district increased from last year, when the total was nine (26.5 percent). This year, the reasons were known for all of the reported departures, as opposed to last year, when 17.6 percent of administrative departures occurred for unknown reasons. See Figure 20.

Delaware Teacher and Administrator Supply and Demand Survey Analysis June 2013
34
Figure 20. Reasons for District Administrator Departures (Percent of Administrators Reported)
Summary • There were 38 total administrative departures. • The primary reasons for departures were retirement and leaving to go to another Delaware school
district. • All administrators left for known reasons.
Reared 39%
Took a posiaon in another Delaware school district
32%
Were dismissed
8%
Were counseled out of administraaon, district or charter
8%
Took a posiaon in another district
outside of Delaware 5%
Other known reasons for leaving
5%
Took a posiaon at a charter school
3%
Note: Survey opqons "Returned to classroom," "Relocated with family,” “Family/personal reasons,” “Illness/death,” “RIF’d,” and “Do not know why administrator leo” were not indicated by any district.

Delaware Teacher and Administrator Supply and Demand Survey Analysis June 2013
35
Charter School Supply and Demand Survey Results This segment of the report is an analysis of the data provided by charter school personnel directors in the state of Delaware. Of the 22 charter schools in the state, 72.7 percent (16) participated in this year’s survey. The following segment includes sections dedicated to teacher hiring; teacher hiring difficulties; recruitment strategies and incentives; the reasons for teachers leaving, vacancies, and shortage areas; hiring for non-‐teaching positions; and administrative hiring and vacancies. Unless otherwise stated, the number of responses for each individual question is 16.
Overview The following section examines teacher hiring in 16 of the 22 charter schools in Delaware. It begins with a general look at the number of teachers hired on regular and temporary contracts and is followed by information detailing why temporary contracts were issued by these charter schools. Next, data for the number of inexperienced teachers, ARTC hires, and teacher hires that were on temporary contracts the year before are included. Following this focus on teacher-‐hire characteristics is a segment examining the magnitude and reasoning behind late hiring. For the first time in this series, hiring trends in high-‐needs schools is examined. The teacher-‐hiring section concludes with an examination of subject areas of hiring concern and charter school use of letters of intent.
Teacher Hiring in Charter Schools According to personnel directors, a total of 107 teachers were hired on regular and temporary contracts for the 2012-‐2013 school year. Of these 107 teachers, 99.1 percent (106) were hired on regular contracts, while one teacher was hired on a temporary contract. The total number of teachers hired for this year is higher than the number hired for the 2011-‐2012 school year, when 89 total teachers were hired by the 14 charter schools that responded to the survey, with 93.3 percent (83) having been hired on regular contracts and 6.7 percent (6) having been hired on temporary contracts, although the number hired on temporary contracts is less.
Reasons for Issuing Temporary Contracts The reason listed by the single charter school that hired a teacher on a temporary contract for the 2012-‐2013 school year was that he/she was hired after the first student day. Last year the reasons for issuing temporary contracts included teachers not being highly qualified or certified (1 charter), and due to special needs such as pregnancy, illness, sabbaticals, etc. (2 charters), with three charter schools explicitly stating that they do not use temporary contracts.
Inexperienced Teachers Of the 106 new teachers hired on regular contracts for the 2012-‐2013 school year, 41.5 percent (44) were first-‐time teachers with no prior teaching experience. There were seven charter schools in which 40 percent or more of their new teachers hired were first-‐time teachers. This is the first time that data were collected on this subject, so information from previous years is unavailable.
Alternative Routes to Certification According to the survey results, 21.7 percent (23) of teacher hires were from an ARTC program. Of these ARTC hires, 39.1 percent (9) came from UD ARTC, 34.8 percent (8) from Teach For America, 21.7 percent (5) from 91 Days, and 4.3 percent (1) from the Masters Plus program. There were no teachers from Main Education, the Delaware Transition to Teaching Partnership, or other unlisted programs.

Delaware Teacher and Administrator Supply and Demand Survey Analysis June 2013
36
Hires Who Were Previously on Temporary Contracts Of the 107 total teachers that were hired for the 2012-‐2013 school year, 3.8 percent (4) were on temporary contracts for the 2011-‐2012 school year.
When Teachers Were Hired According to the personnel directors, late hiring (hiring in August or later) has increased slightly from last year. For the 2012-‐2013 school year, 50.9 percent (54) of new teachers on regular contracts were hired in August or later. The percentages of teachers hired on regular contracts in August or later last year and two years ago were 45.8 and 66.7, respectively. Like the previous two years, the highest percentage of teacher hires on regular contracts occurred in August. For the 2012-‐2013 school year, 42.5 percent (45) of teacher hires occurred in August, which is a slight increase from last year (39.8 percent August hires). July had the next largest percentage of teacher hires on regular contracts for the 2012-‐2013 school year, at 32.1 percent (34), which is a slight decrease from last year’s 36.1 percent. This year, June and October involved the next highest hiring figures—12.3 percent (13) and 6.6 percent (7), respectively. See Figure 21.
Figure 21. Month that Teacher Contract was Agreed Upon: Comparison of School Districts and Charter Schools, 2012-‐2013
6.0% 12.9%
4.7%
18.1% 12.0%
23.1%
12.3%
13.8%
36.1%
15.4%
32.1%
21.6%
39.8% 37.9% 42.5% 36.8%
1.2% 6.5% 1.9% 4.3% 4.8% 4.2% 6.6% 5.4%
0%
20%
40%
60%
80%
100%
Charter Schools 2011-‐2012 (N=83)
School Districts 2011-‐2012 (N=831)
Charter Schools 2012-‐2013 (N=106)
School Districts 2012-‐2013 (N=647)
October or later
September
August
July
June
May or earlier

Delaware Teacher and Administrator Supply and Demand Survey Analysis June 2013
37
Reasons for Late Hiring The most common reasons listed by charter schools for late hiring were late notification by teachers leaving for reasons other than retirement, difficulty in filling positions due to a lack of qualified applicants, uncertainty of the September 30 enrollment count, teachers leaving after the first day, jumping, and difficulty in filling positions because of a lack of qualified applicants. Late notification by teachers leaving for reasons other than retirement was listed as a major reason leading to late hiring by 12.5 percent (2) of the charter schools. Difficulty in filling positions due to a lack of qualified applicants, uncertainty of the September 30 enrollment count, teachers leaving after the first day, jumping, and difficulty in filling positions because of a lack of qualified applicants were each listed as major reasons leading to late hiring by 6.3 percent (1) of the charter schools. See Figure 22. To gain a greater understanding of reasons that are leading to late hiring, factors that were listed most often as major or moderate reasons were examined. Late notification by teachers leaving for reasons other than retirement and difficulty in filling positions due to a lack of applicants were listed as major or moderate reasons for late hiring by 18.8 percent (3) of the charter schools. Uncertainty of the September 30 enrollment count, teachers leaving after the first day, and jumping were listed as major or moderate reasons for late hiring by 12.5 percent (2) of the charter schools. Other unlisted reasons were also mentioned by 12.5 percent (2) of the charter schools, including the need to hire special educators to accommodate high-‐needs students and the contract not being renewed by the school. See the graphic on page for a more detailed analysis.
Figure 22. Percent of Charter Schools Indicating a Reason for Hiring in August or Later Due to…
Note: Survey options “Late increase in enrollment,” “Late notification by retiring teachers,” “Concern about having to use local funds to fully fund additional teachers,” and “Bumping (internal transfer process)” were not indicated by any district or school.
Hiring in High-‐Needs Schools Also examined was hiring in high-‐needs schools, which, for the purposes of this survey, were defined as schools with a minority population over 70 percent and/or that have over 70 percent of students who are eligible for free or reduced lunch or schools that are in the top 25 percent in the state with the ELL
6.3%
6.3%
6.3%
6.3%
6.3%
12.5%
0% 5% 10% 15%
Uncertainty of September 30 enrollment count
Teachers hired aoer first student day of school
Jumping
Difficulty in filling posiqons because of lack of qualified applicants
Other
Late noqficaqon by teachers leaving for other reasons

Delaware Teacher and Administrator Supply and Demand Survey Analysis June 2013
38
population and meet one of the first two criteria. When gauging the difficulty of filling teaching positions at high-‐needs schools, none of the respondents stated that it was very difficult, 18.8 percent (3) stated that it was moderately difficult, 6.3 percent (1) that it was not difficult, and 75 percent (12) that this question was not applicable to their school. Subject Areas of Hiring Concern The three most common responses made by personnel directors when asked which teaching positions were difficult to fill were foreign languages, art, and middle school science. All three of these were considered to be a moderately difficult or very difficult position to fill by 18.8 percent (3) of the charter schools, and very difficult to fill by 6.3 percent (1) of them. Some charter schools considered these three responses to be not applicable. Art was considered not applicable for 75 percent (12) of the charter schools, foreign languages by 68.8 percent (11), and middle school science by 56.3 percent (9). The least difficult teaching positions to fill were English/language arts, which was considered to be not difficult to fill by 43.8 percent (7) of the charter schools and not applicable by 50 percent (8) of them, and elementary, which was considered to be not difficult to fill by 43.8 percent (7), and not applicable by 43.8 percent (7). See Figure 23. Figure 23. Comparison of Percent of School Districts and Charter Schools Indicating Major Difficulty in Filling Teaching Positions by Area
Note: Survey options “Elementary,” “English/Language Arts,” “Social Sciences,” “Technology,” “Business Education,” “Physical Education,” and “Reading” were not indicated by any district or school.
6.3%
6.3%
6.3%
6.3%
6.3%
6.3%
26.3%
15.8%
15.8%
10.5%
5.3%
26.3%
5.3%
0% 5% 10% 15% 20% 25% 30%
Art
Foreign Languages
High School Math
Music
Middle School Science
Special Educaqon
Bilingual/ESOL
Middle School Math
High School Science
Gioed/Talented
School Districts
Charter Schools

Delaware Teacher and Administrator Supply and Demand Survey Analysis June 2013
39
Foreign languages, which was considered to be very difficult to fill by 6.3 percent (1) of the charter schools for 2012-‐2013, was one of the most common responses (7.1 percent) made by personnel directors when asked which subjects were very difficult to fill last year, although subjects such as high school math (7.1 percent), high school science (7.1 percent), middle school math (7.1 percent), elementary (7.1 percent), special education (7.1 percent) and English (7.1 percent) were also listed as frequently. Most Difficult to Fill The most common response for the teaching position that was the most difficult to fill for the 2012-‐2013 school year was foreign languages, with 18.8 percent (3) of the charter schools considering it to be the most difficult to fill. Approximately 18.8 percent (3) of the charter schools considered this question to be not applicable. See Figure 24.
Figure 24. Charter School Most Difficult Positions to Fill
Letters of Intent Letters of intent to teacher hires were provided by 50 percent (8) of the charter schools, which is a significant increase from last year, when these were provided by four schools. Overall, 189 total letters of intent were issued during the 2012-‐2013 school year, which is a substantial increase from the 34 that were issued last year. During the months of April, May, and June, 70.9 percent (134) of the letters of intent for the 2012-‐2013 school year were issued, which is a drastic increase from the 38.2 percent (13) that were issued during this same period the year before.
Summary • 107 total teachers were hired for the 2012-‐2013 school year. • Only one teacher was hired on a temporary contract, and the reason was that he/she was hired
after the first student day. • 41.5 percent of teacher hires were new to teaching.
6.3%
6.3%
6.3%
6.3%
12.5%
12.5%
12.5%
18.8%
18.8%
0% 4% 8% 12% 16% 20%
Reading
Bilingual/ESOL
Art
Special Educaqon
MS Science
Elementary
HS Math
Foreign Language
N/A or None Hired

Delaware Teacher and Administrator Supply and Demand Survey Analysis June 2013
40
• 21.7 percent came from an ARTC organization. • 50.9 percent of teachers were hired in August or later, a slight increase from last year. • Late notification by teachers leaving for reasons other than retirement was the main reason for late
hiring. • 3 high-‐needs charter schools found filling teaching positions moderately difficult. • The most difficult teaching positions to fill were foreign languages, art, and middle school science. • 3 charter schools explicitly stated that foreign language positions were the most difficult to fill. • 189 total letters of intent were offered among eight charter schools.
Teacher Hiring Difficulties
Overview The following section includes an examination of hiring issues that charter schools face. These hiring issues involve (1) teacher candidate rejecting a contract that was offered to them and (2) accepting a contract and then later changing their minds between the months of June and September.
Hiring Issues During the 2012-‐2013 school year, there were three occurrences of teacher candidates declining a contract offered by a charter school. Of the 16 charter schools that responded to this survey, 6.3 percent (1) faced this issue. There were also 12 occurrences, affecting 25 percent (4) of the charter schools, of teachers committing to work in a charter school and later changing their minds between the months of June and September. The number of times that this has happened has decreased slightly from last year, when there were 14 such instances. Of the 12 people who committed to a contract and later changed their minds during the 2012-‐2013 school year, 66.7 percent (8) took a position in another Delaware school district or charter school, 25 percent (3) took a position in another district or charter school outside of Delaware, and 8.3 percent (1) did so for unknown reasons. These results are similar to last year, when the main reason that teachers committed to a contract and later changed their minds was to go to another Delaware district or charter school (6). See Figure 25.
Figure 25. Teachers who committed to a Charter and later changed their mind
Another Delaware school district or charter school
posiaon 67%
A posiaon in another school
district or charter school outside of
Delaware 25%
Remain in current posiaon
0%
Decided not to teach 0%
Do Not Know 8%

Delaware Teacher and Administrator Supply and Demand Survey Analysis June 2013
41
Summary • There were three occurrences of teacher candidates rejecting a contract offered by a charter school. • Four charter schools had teachers commit to work in their school and later change their minds
between the months of June and September; this happened 12 times. • The most common reason for a teacher candidate changing his/her mind was to take a position in
another Delaware charter school or school district.
Recruitment Strategies and Incentives
Overview The following section examines the recruitment strategies and use of incentives by the 16 charter schools that responded to this survey. It begins with an analysis on their use of recruitment budgets and tools and is followed by a section explaining the personnel director’s views on attractive features that their schools possess. After this analysis, the use of incentives to promote positive development in staff and to recruit teacher candidates by charter schools is discussed.
Recruitment Budget During the 2012-‐2013 school year, 31.3 percent (5) of the charter schools had a recruitment budget. The mean and median amounts of money that charter schools spent on advertisements, trips, and other out-‐of-‐pocket recruitment expenses were $8,125 and $1,250, respectively. Of the 16 charter schools that participated in this survey, 37.5 percent (6) spent money for these purposes. There were five charter schools with a budget of up to $5,000 and one charter school in the $15,001-‐$43,000 range.
Use of Recruitment Tools The most commonly utilized recruitment tools for the fall of 2012 were the school’s website, the Teach Delaware website, the University of Delaware’s Project Search, and print advertisements. The school’s website was greatly used by 37.5 percent (6) of the charter schools to advertise positions, and by 31.3 percent (5) to post online applications. The Teach Delaware website was greatly used by 31.3 percent (5) of the charter schools. Print advertisements and the University of Delaware’s Project Search were also commonly utilized recruitment tools and were each greatly used by 25 percent (4) of the charter schools. These results are similar to last year, when using the school website to advertise positions and to post online applications (37.5 percent), the University of Delaware’s Project Search (35.7 percent), and print advertisements (28.6 percent) were the most commonly listed greatly used recruitment tools. See Figure 26.

Delaware Teacher and Administrator Supply and Demand Survey Analysis June 2013
42
Figure 26. Comparison of Percent of School Districts and Charter Schools Reporting Great Use of Recruitment Tools
*Percentages may not equal 100 percent due to non-‐applicability or non-‐response
Personnel directors were also asked to list the tool that proved to be the most helpful for fall 2012. The tool listed as the most helpful by the greatest amount of charter schools for the 2012-‐2013 school year was the University of Delaware’s Project Search, which was deemed the most helpful by 25 percent (4) of them. Most Common Attractive Features For the 2012-‐2013 Teacher and Administrator Supply and Demand Survey, personnel directors were asked, for the first time, to list whether or not their charter school had certain attractive features. The three most common attractive features in the 16 charter schools that responded to this survey were school culture and climate, supportive administrators, and supportive teachers. School culture and climate was the most commonly listed attractive feature, with 87.5 percent (14) of the charter schools stating that it was an attractive feature that they possessed. The next most commonly listed attractive features were supportive teachers and administrators, which were each listed by 68.8 percent (11) of the charter schools. See Figure 27.
6.3%
6.3%
31.3%
6.3%
25.0%
25.0%
0.0%
6.3%
37.5%
31.3%
6.3%
26.3%
10.5%
15.8%
10.5%
63.2%
42.1%
15.8%
31.6%
78.9%
84.2%
10.5%
0% 20% 40% 60% 80% 100%
Recruitment trips/fairs in neighboring states
Recruitment trips/fairs in other states
Teach Delaware website
Teach For America
University of Delaware's Project Search
Print adverqsements
Recruiqng your district's student teachers
Delaware Alternaqve Routes office
Your district's website for adverqsing posiqons
Your district's website for online applicaqons
"Grow your own" teachers from paraprofessionals and subs
School Districts Charter Schools

Delaware Teacher and Administrator Supply and Demand Survey Analysis June 2013
43
Figure 27. Attractive Qualities of Charter Schools, Percent Indicating “Yes”
Note: Survey options "Signing bonuses" and "Housing, housing subsidies" were not indicated by any district or school.
Salary and Incentives For the first time, personnel directors were asked whether or not they offered any recruitment incentives to teacher candidates and if their charter school used any pay incentives, such as cash bonuses, salary increases, or incremental steps on the salary schedule to reward teachers for doing certain things. According to the survey results, 87.5 percent (14) of the charter schools do not offer recruitment incentives to teacher candidates. The two charter schools that do offer them offer leadership stipends or signing bonuses that are related to their membership of the Teacher and Leader Effectiveness Unit (TLEU). Of the 16 charter schools that responded to the question of whether or not they offer pay incentives to reward desirable behavior, 56.3 percent (9) responded that they did not. Of the seven charter schools that do offer pay incentives to reward desirable behavior, 57.1 percent (4) offer them to reward excellence in teaching, 28.6 percent (2) offer them to reward National Board Certification for Professional Teaching Standards, and 14.3 percent (1) offer them to recruit or retain teachers in fields of shortage.
Summary • 5 of the 16 charter schools have a recruitment budget. • The charter school’s website to advertise positions, the Teach Delaware website, and print
advertisements were the most commonly utilized recruitment tools. • The University of Delaware’s Project Search was referred to by four charter schools as the most
useful recruitment tool.
12.5%
12.5%
18.8%
18.8%
43.8%
50.0%
56.3%
62.5%
68.8%
68.8%
87.5%
0% 10% 20% 30% 40% 50% 60% 70% 80% 90% 100%
Compensaqon and benefits
Performance incenqves
Loan forgiveness
School faciliqes
Professional development
Quality of instrucqon
Class size
Teacher autonomy
Supporqve teachers
Supporqve administrators
School culture and climate
Delaware Teacher and Administrator Supply and Demand Survey Analysis June 2013
44
• School culture and climate, supportive administrators, and supportive teachers were the most common attractive features found in charter schools.
• 14 of 16 charter schools do not offer recruitment incentives to teacher candidates. • 9 of 16 do not offer incentives to reward desirable behavior.
Departures, Reasons for Leaving, Vacancies, and Shortage Areas
Overview The following section examines teacher departures, reasons for leaving, vacancies, and shortage areas for the 2012-‐2013 school year. It begins with a brief examination of the total number of teachers who left their charter school and includes an analysis of their reason for doing so. Following that is a brief sub-‐section examining the use of exit surveys by charter schools. After the exit-‐survey sub-‐section, an explanation of the reasons for teacher shortages is included, which is then followed by segments involving open positions, vacancies, and emergency certificates. The section concludes with an examination of eligible retirees over the next five years and retirement incentives.
Teacher Departures According to personnel directors, 63 teachers left their respective charter school during the 2012-‐2013 school year. This is a slight increase from last year, when 56 teachers left their respective charter school.
Reasons for Departures This year, 98.5 percent (62) of the teachers who left their charter schools departed for specified reasons, as opposed to unknown ones. This is similar to last year, when 98.4 (61) percent of teachers left for specified reasons that were known by their personnel director. The most common reason for teacher departures for the 2012-‐2013 school year was RIF—23.8 percent (15). Last year, the most common reason for teacher departures was non-‐renewal/counseling out, with 19.6 percent of teachers leaving for this reason. See Figure 28. Additional reasons for teachers departing for the 2012-‐2013 school year were as follows:
• 22.2 percent (14) either did not have their contract renewed or were counseled out of teaching. • 19.0 percent (12) left for family/personal reasons. • 19.0 percent (12) left to take a position in a Delaware charter school/school district. • 7.9 percent (5) took a position in a school district/charter outside of Delaware. • 3.2 percent (2) retired. • 3.2 percent (2) left for other known reasons. • 1.6 percent (1) became an administrator.

Delaware Teacher and Administrator Supply and Demand Survey Analysis June 2013
45
Figure 28. Reasons for Teachers Leaving: Comparison of School Districts and Charter Schools
Exit Survey Only two charter schools administered an exit survey to departing teachers.
Reasons for Teacher Shortages According to the personnel directors, the two primary reasons for teacher shortages were low salaries for experienced teachers and low starting salaries. The most common response was that there were low salaries for experienced teachers in their charter school, with 18.8 percent (3) of the charter schools stating that it was a major problem. The next most common response was that there were low starting salaries for teachers, with 12.5 percent (2) of the charter schools referring to it as a major problem. Last year, the most common responses were a lack of qualified teacher candidates (14.3 percent), low salaries for both experienced and new teachers (14.3 percent), and lack of number of teacher candidates in particular areas (14.3 percent).
19.1%
7.9%
1.6%
19.0%
23.8%
22.2%
3.2%
1.6%
14.0%
4.7%
4.9%
1.6%
6.3%
37.8%
10.4%
19.1%
0% 10% 20% 30% 40%
Took a posiqon in another Delaware school district/charter school
Took a posiqon in another district outside Delaware
Became an administrator
Family/personal reasons
Were RIF'd
Non-‐renewed/counseled out of teaching
Reqred
Other known reasons for leaving
Do not know why teacher leo
School Districts (N=444) Charter Schools (N=63)

Delaware Teacher and Administrator Supply and Demand Survey Analysis June 2013
46
To gain an even greater understanding of the factors that lead to teacher shortages, we decided to examine which reasons were listed most often as a major or moderate problem. According to the personnel directors, the primary reasons for teacher shortages for certain subjects during the 2012-‐2013 school year under this criteria were low starting salaries for teachers in their charter school, a lack of qualified teacher candidates in particular areas, low salaries for experienced teachers in their charter school, lack of number of teacher candidates in particular areas, and good teaching candidates failing the PRAXIS II. The most common responses were that there were low starting salaries for teachers in their charter school and a lack of qualified teacher candidates in particular areas, with 43.8 percent (7) of the charter schools referring to each as a major or moderate problem. Low salaries for experienced teachers, lack of number of teacher candidates in particular areas, and good teaching candidates failing the PRAXIS II were the next most common reasons for teacher shortages, with 31.3 percent (5) referring to them as a major or moderate problem. The least common reasons for teacher shortages were perceived problems with teaching in Delaware (i.e., discipline, class size, accountability, etc.), referred to as not a problem by 93.8 percent (15) of the charter schools, and teachers moving from their charter school to another school district or charter in Delaware, referred to as not a problem by 87.5 percent (14) of the charter schools. See Figure 29.
Figure 29. Comparison of Percent of School Districts and Charter Schools Indicating a Major Problem in Teacher Shortages due to…
Note: Survey options "Moving from your district to a district outside Delaware," "Good candidates failing PRAXIS I," and "Good candidates failing PRAXIS II" were not indicated by any district or school.
Open Positions Personnel directors from the three charter schools that responded to this question reported that they had open teaching positions at the time of the survey. Collectively, these three charter schools reported
6.3%
6.3%
6.3%
12.5%
18.8%
21.1%
21.1%
5.3%
5.3%
5.3%
0% 5% 10% 15% 20% 25%
Lack of qualified teacher candidates in parqcular areas
Lack of number of teacher candidates in parqcular areas
Moving from your district to another district in Delaware
Low starqng salaries
Low salaries for experienced teachers
Perceived Problems with teaching in Delaware (e.g. with respect to discipline, class size,
accountability)
Other problem School Districts
Charter Schools

Delaware Teacher and Administrator Supply and Demand Survey Analysis June 2013
47
eight open positions. The subjects of these open positions included middle school (2), kindergarten (2), English (1), social science (1), and science (1). This is an increase from last year, when personnel directors reported four unfilled teaching positions at the time they completed the survey. The subjects of the unfilled positions included math (3) and elementary education (1).
When Vacancies Were Learned About Dates for 29 vacancies were reported. Of these 29 vacancies, 51.7 percent (15) were learned about by respondents in April 2012 or earlier, and 48.3 percent (14) were learned about in May or later. These results show that vacancies are being learned about much earlier in the year than in the last year, when only 22.4 percent of vacancies were learned about in April or earlier. The most vacancies were learned about in November and October, with the respondents being notified of 20.7 percent (6) of them during each of these months. These results are significantly different than last year, when the largest number of vacancies was reported in June, with 36.2 percent being learned about during this month. See Figure 30.
Figure 30. Number of Vacancies Learned About by Month (Percent of Teachers Reported): Comparison of School Districts and Charter Schools
*Current school year; all other months represent prior year
20.7%
20.7%
10.3%
13.8%
3.4%
6.9%
17.2%
6.9%
1.2%
1.1%
1.6%
3.1%
7.6%
4.3%
6.0%
24.4%
13.4%
10.7%
16.1%
4.5%
5.4%
0% 5% 10% 15% 20% 25%
October or earlier
November
December
January
February
March
April
May
June
July
August
September*
October or later* School Districts (N=447)
Charter Schools (N=29)

Delaware Teacher and Administrator Supply and Demand Survey Analysis June 2013
48
Vacancies Filled Internally This year, for the first time, the personnel directors were asked about the number of open positions that they filled internally. Of the 16 charter schools that responded to this question, only four filled at least one position internally. Of the 29 vacancies that were reported by personnel directors, five were filled internally. The subject positions that were filled internally were math specialist (1), elementary education (1), reading specialist (1), and unspecified (2).
Emergency Certificates For the 2012-‐2013 school year 31 emergency certificates were requested by 62.5 percent (10) of the charter schools. Of these 31 emergency certificates, 54.8 percent (17) came from an ARTC organization. The subjects of the open positions for which emergency certificates were requested included science (5), foreign languages (4), English (3), math (2), elementary education (2), with an additional nine being requested for unspecified positions.
Eligible Retirees Over the Next Five Years This year, for the first time, personnel directors were asked to list how many teachers, principals, assistant principals, and district office staff would be eligible for retirement over the next five years. For the 16 charter schools that responded to this survey, there will be 25 teachers, three district office staff, two principals, and one assistant principal eligible for retirement within the next five years. As of the 2011-‐2012 school year, there were 663 teachers, 63 district office staff, 13 assistant principals, and eight principals employed by the charter schools in Delaware16. It must be noted that only 16 of the 22 charter schools provided data for eligible retirees over the next five years, while the total number of personnel employed encompasses all 22 charter schools.
Early-‐Retirement Incentives Early-‐retirement incentives were not offered by any of the 16 charter schools that responded to this survey for the 2012-‐2013 school year.
Summary • 63 teachers left their respective charter school during the 2012-‐2013 school year. • The most common reason for teacher departures was RIF (23.8 percent). • Two charter schools administer exit surveys to departing teachers. • The most common reasons for teacher shortages were low starting salaries for teachers in their
charter school and a lack of qualified candidates in certain subjects. • Collectively, three charter schools had five total open positions at the time of the survey. • 48.3 percent of vacancies were learned about in May or earlier, a drastic improvement from the
year before. • Five of the 29 vacancies were filled internally. • 10 charter schools requested 31 emergency certificates, with 54.8 percent coming from an ARTC
organization. • 25 teachers, three district office staff, two principals, and one assistant principal will be eligible for
retirement within the next five years. • No charter schools offer early-‐retirement incentives.
16 Delaware Educational Personnel Reports, 2012

Delaware Teacher and Administrator Supply and Demand Survey Analysis June 2013
49
Hiring for Non-‐Teaching Positions
Overview The following section examines the charter schools’ experiences with hiring for non-‐teaching positions. It begins with an examination of which non-‐teaching positions were the most and least difficult to fill, followed by the personnel directors’ opinions on how hiring for these positions will be different next year. This section concludes with a brief analysis on which non-‐teaching position was the most commonly listed by personnel directors when they were asked which one was the most difficult to fill.
Hiring of Non-‐Teaching Positions The most common responses made by personnel directors when asked which non-‐teaching positions were very difficult to fill included librarian/media technology, nurse, speech therapist, and elementary school principal. Each of these occupations was considered to be very difficult to fill by 6.3 percent (1) of the charter schools. These results are drastically different from last year, when guidance counselor was listed most frequently as the non-‐teaching position that was very difficult to fill by 21.4 percent (3) of the charter schools completing the survey, compared to this year, when none of them considered it very difficult to fill, although this is probably due to the fact that the many of the schools that responded to this survey did not have to hire a guidance counselor for this year. To gain a greater understanding of hiring difficulties relating to non-‐teaching positions, positions that were indicated most often as either moderately difficult or very difficult to fill were examined. Nurse and speech therapist were the most common responses under this criteria, and each was considered either moderately difficult or very difficult to fill by 12.5 percent (2) of the charter schools, and 75 percent (16) listed each of these as not applicable. The least difficult non-‐teaching position to fill was guidance counselor, which was considered not difficult to fill by 25 percent (4) of the charter schools, and not applicable by 75 percent (12). All 16 charter schools are either unsure or do not expect any change in difficulty when filling non-‐teaching positions next year. See Figure 31.

Delaware Teacher and Administrator Supply and Demand Survey Analysis June 2013
50
Figure 31. Comparison of Percent of School Districts and Charter Schools Indicating Major Difficulty in Filling Non-‐Teaching Positions
Note: Survey options "Guidance Counselor," "Elementary School Assistant Principal," and "Middle School Assistant Principal" were not indicated by any district or school. Most Difficult to Fill According to the personnel directors, for the 2012-‐2013 school year, the most difficult non-‐teaching position to fill was nurse, which was specifically mentioned by 18.8 percent (3) of them, with 43.8 percent (7) stating that no non-‐teaching positions were filled. Last year, the most difficult position to fill was guidance counselor, with 21.4 percent (3) of the charter schools that completed the survey describing it as so.
Summary • Speech therapist and nurse were the most difficult non-‐teaching positions to fill. • Guidance counselor, which was the most difficult to fill last year, was the least difficult to fill this
year. • All 16 charter schools are either unsure or do not expect any change in difficulty in filling non-‐
teaching positions next year. • Nurse was specifically mentioned by three charter schools as the most difficult non-‐teaching
position to fill.
Administrative Hiring
Overview The following section examines administrative hiring in charter schools for the 2012-‐2013 school year. It begins with an examination of the number of principals hired, applicants, and acceptable applicants, followed by a brief analysis of the origins of hires of principals. This examination will then be followed by
6.3%
6.3%
6.3%
6.3%
15.8%
21.1%
5.3%
47.4%
5.3%
5.3%
5.3%
5.3%
0% 10% 20% 30% 40% 50%
Librarian/Media Technology
Psychologist
Nurse
Speech Therapist
Elementary School Principal
Middle School Principal
Secondary School Principal
Secondary School Assistant Principal
Central Office Administrator
School Districts Charter Schools

Delaware Teacher and Administrator Supply and Demand Survey Analysis June 2013
51
one that focuses on assistant principals using the same template. Following this introductory examination is a segment regarding first-‐time administrators. This section concludes with segments that analyze the use of succession planning and administrator development charter schools.
Hiring of Principals Over the course of the 2012-‐2013 school year, four principals were hired from a pool of 23 applicants. Of these applicants, only 21.7 percent (5) were deemed acceptable to fill the positions for which they applied. The number of new principals hired this year is the same as last year. Last year, the percentage of acceptable applicants (14.9) included principals and assistant principals.
Hire Origins of Principals The origins of the four principal hires for the 2012-‐2013 school year were as follows:
• 50 percent (2) were hired from within their own charter school. • 50 percent (2) were hired from another school district/charter school in Delaware.
The number of principals hired from within their own charter school is the same as last year. The number of principals hired from another school district/charter school in Delaware is higher than last year, when the total was one. The only other principal hired last year came from out of state.
Assistant Principal Hiring Over the course of the 2012-‐2013 school year, four assistant principals were hired from a pool of 16 applicants. Of these applicants, only 25 percent (4) were deemed acceptable to fill the position for which they applied. The number of new assistant principals hired is the same as last year. Last year, the percentage of acceptable applicants (14.9) included principals and assistant principals.
Assistant Principal Hire Origins The origins of the four assistant principal hires for the 2012-‐2013 school year were as follows:
• 50 percent (2) were hired from inside their own charter school. • 25 percent (1) was hired from another school district/charter school in Delaware. • 25 percent (1) was hired from the Delaware Leadership Project.
The number of assistant principals hired from within their own charter school is the same as last year (2). The number of assistant principals hired from another school district/charter school in Delaware is also the same as last year. The origin of the other assistant principal who was hired last year is unknown/other. See Figure 32.

Delaware Teacher and Administrator Supply and Demand Survey Analysis June 2013
52
Figure 32. Comparison of Sources of Recently Hired School District and Charter School Administrators
First-‐Time Administrators This year, for the first time, the personnel directors were asked to report the number of principal and assistant principal hires who were first-‐time administrators. According to the respondents, half (2) of the four principals that were hired for the current school year were first-‐time administrators. Of the four assistant principals who were hired for the current school year, 75 percent (3) were first-‐time administrators.
Products of Succession Planning Of the four principals who were hired for the current school year, one was an aspiring school leader who participated in a charter school’s succession planning or program to prepare/develop school administrators. Of the four assistant principals, one was in this category.
Administrator Development According to the survey results, four of the charter schools have a program in place to prepare/develop school administrators. The personnel directors also reported that two of the charter schools have a program available to all new principals to support them during their induction stage. Summary
• Four principals were hired, and only 21.7 percent of the applicants for these positions were deemed acceptable to fill them.
50.0%
75.0%
50.0% 60.0%
25.0%
14.3%
25.0%
28.6%
7.1% 5.7% 25.0% 25.0%
3.60% 5.7%
0%
20%
40%
60%
80%
100%
Charter Principals (N=4)
School District Principals (N=28)
Charter Asst. Principals (N=4)
School District Asst. Principals
(N=35)
Delaware Leadership Project
Don't Know or Other
From out-‐of-‐state
From Delaware but outside your district
From inside your district

Delaware Teacher and Administrator Supply and Demand Survey Analysis June 2013
53
• Two principals hires came from within their respective school district, and two came from another school district/charter school in Delaware.
• 50 percent of principals hired were first-‐time administrators. • Four assistant principals were hired, and only 25 percent of the applicants for these positions
were deemed acceptable to fill them. • Two assistant principal hires came from within their respective school district, one from another
Delaware school district/charter, and one from the Delaware Leadership Project. • 75 percent of assistant principal hires were first-‐time administrators. • 14 of the charter schools have a program in place to prepare/develop school administrators.
Administrator Vacancies
Overview The following section examines administrator vacancies in charter schools for the 2012-‐2013 school year. It focuses solely on the number of and reasons for administrative departures.
Administrative Departures For the 2012-‐2013 school year, the personnel directors collectively reported six administrative departures. This is a decrease from last year, when there were eight reported administrative departures. The reasons for the six administrative departures for the 2012-‐2013 school year are as follows:
• 33.3 percent (2) were RIF’d. • 16.7 percent (1) took a position in another charter school. • 16.7 percent (1) took a position in a school district in Delaware. • 16.7 percent (1) left due to illness. • 16.7 percent (1) left due to retirement.
Last year, the reasons for administrative departures included taking a position in another district outside of Delaware, dismissal, illness, family/personal reasons, RIF, and relocation. See Figure 33.
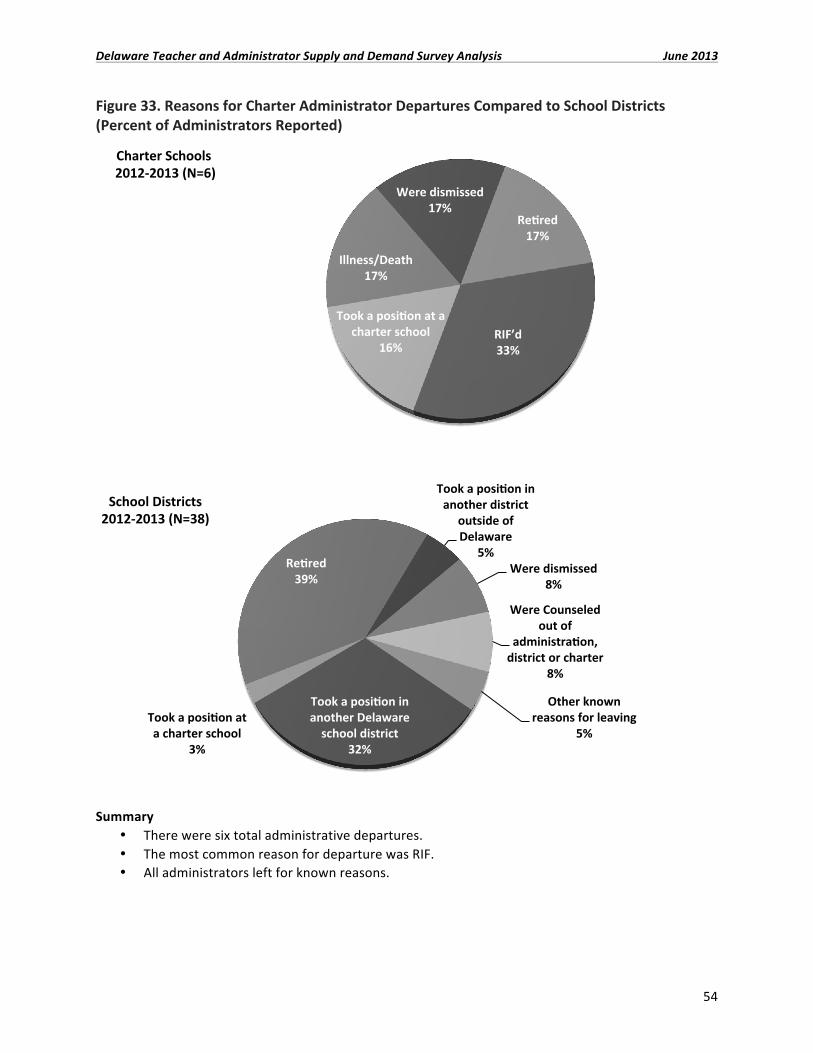
Delaware Teacher and Administrator Supply and Demand Survey Analysis June 2013
54
Figure 33. Reasons for Charter Administrator Departures Compared to School Districts (Percent of Administrators Reported)
Summary
• There were six total administrative departures. • The most common reason for departure was RIF. • All administrators left for known reasons.
RIF’d 33%
Took a posiaon at a charter school
16%
Illness/Death 17%
Were dismissed 17%
Reared 17%
Charter Schools 2012-‐2013 (N=6)
Took a posiaon in another Delaware school district
32%
Took a posiaon at a charter school
3%
Reared 39%
Took a posiaon in another district
outside of Delaware
5% Were dismissed
8%
Were Counseled out of
administraaon, district or charter
8%
Other known reasons for leaving
5%
School Districts 2012-‐2013 (N=38)

Delaware Teacher and Administrator Supply and Demand Survey Analysis June 2013
55
DOE Payroll Data Results As in prior years, data from the Delaware Department of Education’s payroll system, PHRST, were examined. From these data, the population of teachers and administrators who have left the field entirely or switched districts can be examined. These data also enabled an analysis of new hires based on payroll data. Data were analyzed for the teacher and administrator population at the end of the 2011-‐2012 school year and compared to those of the 2012-‐2013 school year. There are slight discrepancies between what the personnel directors indicated and DOE data due to some different definitions of status, time differences, and other unknown reasons. DOE payroll records indicate that 980 new teachers were hired by the 19 school districts and the 22 charter schools for the 2012-‐2013 school year. Of these, 439 were new to Delaware, 259 teachers moved from one district to another, and 252 were new hires within the same district. There were 30 teachers for whom no data were available because information was not available in the database. The personnel directors reported a total of 753 teachers hired. The discrepancy is due to several factors, including the method of determining new hires. For example, DOE compares who is on the payroll as a teacher on two specific dates in May 2012 and November 2012, while the personnel directors review the status of their contracted teachers across many months. This procedure also means that teachers moving from temporary to regular contracts are not counted as new hires by DOE. New-‐Teacher Hire Demographics Based on the data, there were 980 new teacher hires—439 teachers new to Delaware, 259 teachers who migrated from one district to another, and 252 new hires within the same district. There were 30 teachers for whom no data were available because information was not available in the database. Teacher Migration Data was provided for the type of migration, position change within the state, for 252 teachers. Teachers moving from one district to another comprised the largest percentage of the moves (74 percent). This was followed by a teacher moving from a district to a charter school (12 percent), a charter to a district (10 percent), and moving from a charter school to another charter school (3 percent). Departing Teachers According to DOE payroll records, there were 884 teachers who left teaching in Delaware districts and charters between May 2012 and November 2012. This is 10.3 percent of the teacher workforce in the state, a decrease from the 11.4 percent the previous year. The absolute number who left teaching this year was less than last year 884 versus 980. As in previous years, the most striking characteristic of departing teachers is that a large percentage leave soon after they start teaching in Delaware. Among the 884 teachers who left, 73 teachers (8 percent) exited with one year or less of Delaware teaching experience. Another 78 teachers (9 percent) left teaching in Delaware within the first two years of employments. Thus, 17 percent of teachers who left their teaching positions in Delaware did so within their first two years of teaching in the state. This is less than the 21.9 percent who left within the first two years of teaching last year. In addition, 77 teachers left with three years of experience, 46 left with four years of experience, and 50 left with five years of experience. Overall, 37 percent of teachers left within the first five years, this is the same as last year. See Figure 34.

Delaware Teacher and Administrator Supply and Demand Survey Analysis June 2013
56
Figure 34. Years of Experience of Teachers Lost to the Profession
According to DOE data, the teachers who left the profession had similar demographics to those that were new hires this year. The majority of teachers lost were white (82 percent) and female (77 percent). The age range of teachers leaving was 21 through 73. The most common ages at which teachers left the profession were 23 and 24, followed by 32 and 30. The position with the highest number of teachers leaving was elementary general (190). Of the 884 teachers who were lost to the profession, data on the education level of 804 were provided. Teachers with a master’s degree through a “master’s plus 45” composed the highest percentage of teachers (54 percent), followed by teachers with a bachelor’s degree through a “bachelor’s plus 30” (43 percent). Intrastate Movement Data was provided for the type of intrastate movement, position change within the state, for 252 teachers. Teachers moving from one district to another comprised the largest percentage of the moves (74 percent). This was followed by a teacher moving from a district to a charter school (12 percent), a charter to a district (10 percent), and moving from a charter school to another charter school (3 percent). See Figure 35.
8%
17%
26%
31%
37%
1%
Less than 1 Year
Two years or less
Three years or less
Four years or less
Five years or less
40 years or more
0% 5% 10% 15% 20% 25% 30% 35% 40%

Delaware Teacher and Administrator Supply and Demand Survey Analysis June 2013
57
Figure 35. Type of Teacher Migration
School Administrators DOE data indicate that, collectively, 90 principals and assistant principals were hired for the 2012-‐2013 school year. The majority of administrators hired were white (75 percent). Of the hires, 57 percent were female and 43 percent were male. The majority of the new administrators moved from district to district (83 percent) followed by district to DOE (11 percent) and six percent moving from charter to district. The most frequent numbers of administrator departures were among assistant, secondary, and elementary principals. Most administrators were lost at 9, 17, and 27 years of experience with a range of 1-‐35 years of experience. The age range of teachers lost was 32-‐65 years, with the most lost at ages 38 and 42. It is interesting to note that 42 percent of the administrators who left the profession were female and a higher percentage of females are being hired. Of the departures there was a slightly higher percentage of assistant principals leaving (57 percent) compared to principals (42 percent).
District to District 75%
District to Charter School 12%
Charter School to District 10%
Charter School to Charter School
3%

Delaware Teacher and Administrator Supply and Demand Survey Analysis June 2013
58
Conclusions On the whole, teacher hiring for the 2012-‐2013 school year occurred slightly earlier than it did last year, with 53.5 percent of teacher hires occurring in July or earlier, compared to 51.4 percent for last year. The majority of new teachers were still hired in August, but July was the month with the next highest number of hires—a change from last year, when June was second. The overall percent of teachers hired in June or earlier was 31.9, lower than last year’s 36 percent. There were 329 additional teachers hired on temporary contracts, slightly lower than last year’s 338. The most common reason for hiring on temporary contracts was that teachers were hired after the first student day. Of the new hires, 308 were considered new to teaching. Six districts used letters of intent, and those that did sent more early notices than they did last year. A sign of early hiring for the 2012-‐2013 school year was the substantial increase of early letters of intent from 50 to 76. However, there was a decrease in total letters of intent issued—from 141 to 120. What has led to the reduction in later teacher hiring in Delaware? The most obvious answer is Senate Bill 164 with House Amendment 1, the extension of SB 16. SB 16 requires that projections of enrollment be made by April 15 and that the State will guarantee that school districts receive funds equivalent to 98 percent of these projections. This bill was aimed at decreasing late teacher hiring, and it appears to have had the desired effect. The cause was not earlier teacher notification of vacancies, for notifications were the same as last year. This year the personnel directors reported that late increases in enrollment followed by the concern with the September 30 enrollment count and concern about having to use local funds to fully fund additional teachers were the reasons for reported late hiring. The percent of personnel directors indicating the September 30 enrollment count as a reason stayed the same as last year at 21.1 percent. The hope is that SB 164 with HA 1, extending the sunset date of SB 16 from April 2012 to April 2014, will continue to lead to sufficient funding for districts to continue hiring earlier and that more districts will take advantage of this process to hire teachers earlier. The extensive use of district websites and the University of Delaware’s Project Search continued to be the most frequently used recruitment tools among the state’s school districts, and there was an upswing in print advertisements this year. There were more districts indicating Project Search as a source of recruitment than last year. There has not been much of a rebound in out-‐of-‐state recruitment trips, with the reported number of recruitment trips to neighboring states remaining the same and non-‐neighboring states increasing slightly from last year. This year personnel directors were asked to report the number of teachers who took advantage of early-‐notification incentives for retirement, and about 65.3 percent of those retiring took advantage of such incentives. This suggests that teachers are taking advantage of these options where available. The districts still report struggling to hire speech therapists, a concern that extends back through all of these annual reports. This year almost two-‐thirds (63.2 percent) of the districts reported that speech therapist was the most difficult position to fill. The vast majority of administrators (93.7 percent) were hired from within the state, with virtually all new principals and assistant principals coming from Delaware. Less than 10 percent of new principals and assistant principals came from out of state. This year there was an increase in the percent of

Delaware Teacher and Administrator Supply and Demand Survey Analysis June 2013
59
districts indicating that they had their own administrator-‐preparation program as well as an increase in the percent with succession-‐planning programs. The results indicate that there is activity focused on administrator recruitment and internal preparation. It is not known if this is the result of budget concerns, a lack of candidates or positions to fill, or other factors. Sixteen of the 22 charter schools responded to the survey this year. These charter schools reported hiring 107 new teachers for 2012-‐2013. Late hiring of charter-‐school teachers mirrored that of school districts this year; however, districts hired slightly earlier than did charters (53.5 percent vs. 49.1 percent). Charters also increased their use of letters of intent. Although they are far less proactive in teacher-‐recruitment activities, charter schools are much less likely than school districts to report major difficulties in teacher hiring. (Of course, their lack of proactive recruiting may be the result of fewer hiring difficulties.) Charters report that foreign languages are the teaching areas with the greatest difficulty in hiring. This year charters reported that low salaries for new and inexperienced teachers limit their ability to recruit and hire teachers. Charter school respondents again indicated far less use of technology and recruiting trips than did district personnel directors. It is not clear if this is due to financial or personnel constraints, greater satisfaction with the recruitment pool, or other reasons. Whereas districts focused on their recruitment activities when noting the factors most helpful in attracting teachers this year, charters were most likely to cite their reputation and class size. As with last year, almost all school administrators were hired from within Delaware by charters and districts. There are still many teachers leaving Delaware teaching positions in the first five years of teaching (37.5 percent); this is slightly lower than last year but is still higher than two years ago. The reasons for this change are unclear. Overall, the recession and its aftermath are having less of an impact on teacher hiring in Delaware. There was earlier hiring this year, more letters of intent distributed, and fewer hiring difficulties. It is hoped that Senate Bill 164 with House Amendment 1, along with the (slowly) expending economy, will continue to improve hiring in Delaware’s school districts.

Delaware Teacher and Administrator Supply and Demand Survey Analysis June 2013
60
Appendix A: Traditional Public School Data Table 1. Month that Contract was Agreed Upon (Percent of Teachers Reported) 2009-‐2010
(N=829) 2010-‐2011 (N=743)
2011-‐2012 (N=831)
2012-‐2013 (N=975)
May or earlier 4.2% 2.8% 12.9% 18.1% June 8.0% 10.4% 23.1% 13.8% July 27.6% 22.5% 15.4% 21.6% August 40.5% 50.3% 37.9% 36.8% September 8.0% 11.3% 6.5% 4.3% October or later 11.7% 2.7% 4.2% 5.4% Table 2. Month that Contract was Agreed Upon (Percent of Teachers Reported) 2008-‐2009
(N=620) 2009-‐2010 (N=829)
2010-‐2011 (N=743)
2011-‐2012 (N=831)
2012-‐2013 (N=975)
August 43.9% 40.5% 50.3% 37.9% 36.8% September 8.1% 8.0% 11.3% 6.5% 4.3% October or later 9.0% 11.7% 2.7% 4.2% 5.4% August or Later 61.0% 60.2% 64.3% 48.6% 46.5% Table 3. Reasons for Hiring Teachers in August or Later (Percent of Districts) 2012-‐2013 Major Reason Moderate Reason Not a Reason Uncertainty of September 30 enrollment count 21.05% 21.05% 57.89% Late increase in enrollment 21.05% 42.11% 36.84% Teachers left after first student day of school 0% 42.10% 57.89%
Late notification by retiring teachers 0% 31.58% 68.42%
Late notification by teachers leaving for other reasons
5.26%
57.89% 36.84%
Concern about having to use local funds to fully fund additional teachers
21.05%
21.05% 57.89%
Jumping 15.78% 47.36% 36.84% Bumping (internal transfer process) 10.52% 21.05% 68.42%
Difficulty in filling positions because of lack of qualified applicants
5.26% 42.11% 52.63%
Other 10.52% 5.26% 84.21%

Delaware Teacher and Administrator Supply and Demand Survey Analysis June 2013
61
Table 4. Level of Difficulty Filling Teaching Positions by Area (Percent of Districts)* 2012-‐2013
Very Difficult
2012-‐2013 Moderately Difficult
2012-‐2013 Not Difficult
2011-‐2012 Very Difficult
Art 0% 10.53% 21.05% 5.3% Bilingual/ESOL 10.53% 21.05% 15.78% 21.1% English/Language Arts 0% 36.84% 36.84% 5.3% Elementary 0% 5.26% 68.42% 0% Foreign Languages 26.32% 36.84% 15.78% 47.4% Middle School Math 5.26% 21.05% 31.58% 0% High School Math 15.79% 36.84% 26.32% 36.8% Music 0% 21.05% 26.32% 5.3% Physical Education 0% 5.26% 42.11% 0% Reading 0% 26.31% 21.05% 0% Middle School Science 0% 36.84% 21.05% 0% High School Science 26.32% 26.31% 26.31% 36.8% Social Sciences 0% 0% 52.63% 0% Special Education 15.79% 26.31% 52.63% 21.1% Technology 0% 26.31% 10.53% 21.1% Business Education 0% 10.53% 15.79% 0% Gifted/Talented 5.26% 10.53% 0% 5.3% *Percentages may not equal 100 percent due to non-‐applicability or non-‐response. Table 5. Extent of Problem Related to Teacher Shortages for Fall 2012 Hiring (Percent of Districts) Major
Problem Moderate Problem
Not a Problem
Lack of qualified teacher candidates in particular areas 21.05% 47.37% 31.57%
Lack of number of teacher candidates in particular areas 21.05% 52.63% 26.31%
Moving from your district to another district in Delaware 5.26% 47.37% 47.36%
Moving from your district to a district outside Delaware 0% 26.31% 73.68%
Low starting salaries 0% 26.31% 73.68% Low salaries for experienced teachers 0% 36.84% 63.15% Good candidates failing PRAXIS I 0% 15.78% 84.21% Good candidates failing PRAXIS II 0% 26.31% 73.68% Perceived Problems with teaching in Delaware (e.g. with respect to discipline, class size, accountability)
5.26% 15.78% 78.94%
Other Problem 5.26% 5.26% 89.47%

Delaware Teacher and Administrator Supply and Demand Survey Analysis June 2013
62
Table 6. Reasons for teachers leaving School Districts (Four Year Comparison) 2009-‐2010
(N=375) 2010-‐2011 (N=371)
2011-‐2012 (N=402)
2012-‐2013 (N=444)
Took a position in another Delaware school district
17.1% 17.5% 20.6% 13.96%
Took a position in another district outside Delaware
5.1% 7.8% 6.2% 4.73%
Took a position at a charter school 0% 0.5% 0.2% 0% Became an administrator n/a 2.7% 3.0% 1.13% Relocated with family 6.1% 4.3% 6.5% 2.03% Family/personal reasons 5.3% 5.4% 8.0% 1.8% Illness/death 1.9% 1.6% 0.5% 1.13% Were RIF'd 3.5% 2.7% 1.2% 1.58% Were dismissed 4.0% 5.1% 7.2% 2.93% Were counseled out of teaching or district n/a 3.8% 1.7% 1.58% Retired 41.3% 25.6% 23.9% 37.84% Other known reasons for leaving 7.2% 2.7% 10.7% 10.36 Do not know why teacher left 8.8% 20.2% 6.0% 19.14% Non-‐renewal, Other n/a n/a 4.2% 1.8% Table 7. Number of Vacancies Learned About by Month (Percent of Teachers Reported) 2009-‐2010
(N=782) 2010-‐2011 (N=513)
2011-‐2012 (N=614)
2012-‐2013 (N=447)
October (prior school year) 6.9% 4.1% 3.1% 1.8% November (prior school year) 1.2% 1.6% 1.1% 1.12% December (prior school year) 3.1% 1.6% 1.1% 1.57% January (prior school year) 2.2% 5.4% 5.2% 3.13% February (prior school year) 2.7% 3.3% 5.7% 7.6% March (prior school year) 2.4% 4.9% 3.9% 4.25% April (prior school year) 9.9% 7.4% 7.8% 6.04% May (prior school year) 12.7% 10.9% 10.6% 24.39% June (prior school year) 10.1% 12.7% 16.3% 13.42% July (prior school year) 20.6% 15.0% 11.4% 10.74% August (prior school year) 14.0% 17.3% 19.5% 16.11% September (prior school year) 7.0% 2.7% 6.8% 4.47% October or later (current school year) 7.0% 13.1% 7.3% 5.37%

Delaware Teacher and Administrator Supply and Demand Survey Analysis June 2013
63
Table 8. Level of Difficulty Filling Non-‐Teaching Positions by Area (Percent of Districts) * 2012-‐2013
Very Difficult 2012-‐2013 Moderately Difficult
2012-‐2013 Not Difficult
2011-‐2012 Very Difficult
Librarian/Media Technology 15.79% 15.79% 15.79% 5.3% Psychologist 21.05% 26.32% 15.79% 31.6% Guidance Counselor 0% 5.26% 52.63% 0% Nurse 5.26% 47.37% 15.79% 10.5% Speech Therapist 47.37% 26.31% 0% 68.4% Elementary School Principal 0% 21.05% 10.53% 0% Elementary School Assistant Principal
0% 15.79% 31.58% 0%
Middle School Principal 5.26% 5.26% 21.05% 0% Middle School Assistant Principal
0% 15.79% 10.53% 0%
High School Principal 5.26% 21.05% 21.05% 10.5% High School Assistant Principal
5.26% 15.79% 31.58% 5.3%
Central Office Administrator 5.26% 15.79% 36.84% 10.5% *Percentages may not equal 100 percent due to non-‐applicability or non-‐response. Table 9. Use of Recruitment Tools (Percent of Districts) 2012-‐2013
Great Use 2012-‐2013 Some Use
2012-‐2013 No Use
2011-‐2012 Great Use
Recruitment trips/fairs in neighboring states 26.31% 52.63% 21.05% 26.3% Recruitment trips/fairs in other states 10.52% 21.05% 68.42% 0% Teach Delaware website 15.79% 21.05% 63.16% 15.8% Teach for America Program 10.53% 21.05% 68.42% 5.3% University of Delaware’s Project Search 63.16% 36.84% 0% 57.9% Print Advertisements 42.11% 52.63% 5.26% 31.6% Recruiting your district's student teachers 15.79% 68.43% 15.79% 15.8% Delaware Alternative Routes Office 31.58% 57.89% 10.53% 26.3% Your district's website for advertising positions
78.95% 15.79% 5.26% 84.2%
Your district's website for online applications 84.21% 5.26% 10.53% 84.2% "Grow your own" teachers from paraprofessionals and subs
10.53% 78.95% 10.53% 15.8%
Visitation by recruits 5.26% 26.31% 68.42% 5.3%

Delaware Teacher and Administrator Supply and Demand Survey Analysis June 2013
64
Table 10. Sources of Recently Hired District Administrators (Percent of Administrators Reported) Assistant Principals
(N=35) Principals (N=28)
2012-‐2013 Total (N=63)
From inside your district 60.0% 75.0% 66.7% From Delaware but outside your district
28.5% 14.3% 6.3%
From out-‐of-‐state 5.7% 7.1% 22.2% Don't Know or Other 0% 0% 0% Delaware Leadership Project 5.7% 3.6% 4.8% Table 11. Reasons for District Administrator Vacancies (Percent of Administrators Reported) 2009-‐2010
(N=50) 2010-‐2011 (N=35)
2011-‐2012 (N=34)
2012-‐2013 (N=38)
Took a position in another Delaware school district
22.5% 25.7% 26.5% 31.58%
Took a position in another district outside of Delaware
15.0% 2.8% 0% 5.26%
Took a position at a charter school 0% 2.8% 0% 2.63% Returned to classroom n/a 2.8% 2.9% 0% Relocated with family 0% 2.8% 0% 0% Family/personal reasons 0% 5.7% 5.9% 0% Illness/death 2.5% 0% 5.9% 0% Were dismissed 0% 0% 0% 7.89% RIF’d 0% 0% 0% 0% Were counseled out of administration, district or charter
n/a 8.6% 2.9% 7.89%
Retired 57.5% 8.6% 29.4% 39.47% Other known reasons for leaving 2.5% 40.0% 8.8% 5.26% Do not know why administrator left 0% 8.6% 17.6% 0%

Delaware Teacher and Administrator Supply and Demand Survey Analysis June 2013
65
Appendix B: Charter School Data Table 12. Month that Contract was Agreed Upon (Percent of Teachers Reported) Charter
Schools 2011-‐2012 (N=83)
School Districts 2011-‐2012 (N=831)
Charter Schools 2012-‐2013 (N=106)
School Districts 2012-‐2013 (N=1169)
May or earlier 6.0% 12.9% 4.71% 18.1% June 12.0% 23.1% 12.26% 13.8% July 36.1% 15.4% 32.08% 21.6% August 39.8% 37.9% 42.45% 36.8% September 1.2% 6.5% 1.89% 4.3% October or later 4.8% 4.2% 6.6% 5.4% Table 13. Level of Difficulty Filling Teaching Positions by Area (Percent of Charter Schools)* Very
Difficult Moderately Difficult
Not Difficult
Art 6.25% 12.5% 6.25% Bilingual/ESOL 0% 6.25% 0% English/Language Arts 0% 6.25% 43.75% Elementary 0% 12.5% 43.75% Foreign Languages 6.25% 12.5% 12.5% Middle School Math 0% 12.5% 18.75% High School Math 6.25% 6.25% 6.25% Music 6.25% 0% 25.0% Physical Education 0% 0% 18.75% Reading 0% 0% 25.0% Middle School Science 6.25% 12.5% 25.0% High School Science 0% 0% 6.25% Social Sciences 0% 0% 12.5% Special Education 6.25% 6.25% 18.75% Technology 0% 6.25% 12.5% Business Education 0% 0% 6.25% Gifted/Talented 0% 0% 6.25% *Percentages may not equal 100% due to non-‐applicability or non-‐response

Delaware Teacher and Administrator Supply and Demand Survey Analysis June 2013
66
Table 14. Extent of Problem Related to Teacher Shortages for Fall 2012 Hiring (Percent of Charter Schools) Major
Problem Moderate Problem
Not a Problem
Lack of qualified teacher candidates in particular areas
6.25%
37.5% 56.25%
Lack of number of teacher candidates in particular areas
6.25% 25.0% 68.75%
Moving from your district to another district in Delaware
6.25% 6.25% 87.5%
Moving from your district to a district outside Delaware
0% 18.75% 81.25%
Low starting salaries 12.5% 31.25% 56.25% Low salaries for experienced teachers 18.75% 12.5% 68.75%
Good candidates failing PRAXIS I 0% 25.0% 75.0% Good candidates failing PRAXIS II 0% 31.25% 68.75% Perceived Problems with teaching in Delaware (e.g. with respect to discipline, class size, accountability)
0% 6.25% 93.75%
Other Problem 0% 0% 100% Table 15. Reasons for Teachers Leaving Your Charter (Percent of Teachers Reported) Charter Schools
2011-‐2012 (N=56)
Charter School 2012-‐2013 (N=63)
Took a position in another Delaware school district 21.4% 17.46% Took a position in another district outside Delaware 3.6% 7.94% Took a position at a Charter School 3.6% 1.59% Became an administrator 3.6% 1.59% Relocated with family 14.3% 6.35% Family/Personal Reasons 5.4% 12.70% Illness/Death 1.8% 0% Were RIF'd 16.1% 23.81% Were dismissed 19.6% 6.35% Were counseled out of teaching or district 1.8% 1.59% Retired 1.8% 3.17% Other known reasons for leaving 1.8% 3.17% Do not know why teacher left 1.8% 1.59% Non-‐renewal, Other 3.6% 14.29%

Delaware Teacher and Administrator Supply and Demand Survey Analysis June 2013
67
Table 16. Number of Vacancies Learned About by Month (Percent of Teachers Reported)
Table 17. Level of Difficulty Filling Non-‐Teaching Positions by Area (Percent of Charters)* Very
Difficult Moderately Difficult
Not Difficult
Librarian/Media Technology 6.25% 0% 12.5% Psychologist 0% 6.25% 12.5% Guidance Counselor 0% 0% 25.0% Nurse 6.25% 6.25% 12.5% Speech Therapist 6.25% 6.25% 12.5% Elementary School Principal 6.25% 0% 6.25% Elementary School Assistant Principal 0% 0% 6.25% Middle School Principal 0% 0% 6.25% Middle School Assistant Principal 0% 0% 12.5% Secondary School Principal 0% 0% 12.5% Secondary School Assistant Principal 0% 0% 12.5% Central Office Administrator 0% 0% 0% *Percentages may not equal 100 percent due to non-‐applicability or non-‐response.
2011-‐2012 (N=58)
2012-‐2013 (N=29)
October or earlier (prior school year) 0% 20.69% November (prior school year) 0% 20.69% December (prior school year) 0% 0% January (prior school year) 0% 0% February (prior school year) 0% 10.34% March (prior school year) 0% 0% April (prior school year) 22.4% 0% May (prior school year) 19.0% 13.79% June (prior school year) 36.2% 3.45% July (prior school year) 1.7% 6.90% August (prior school year) 12.1% 17.24% September (current school year) 0% 6.90% October or later (current school year) 8.6% 0%

Delaware Teacher and Administrator Supply and Demand Survey Analysis June 2013
68
Table 18. Percent of Districts Indicating Use of Recruitment Tools (Percent of Charters)* Great Use Some Use No Use Recruitment trips/fairs in neighboring states 6.25% 0% 93.75% Recruitment trips/fairs in other states 6.25% 0% 93.75% Teach Delaware website 31.25% 37.5% 31.25% Teach for America Program 6.25% 12.5% 81.25% University of Delaware’s Project Search 25.0% 18.75% 56.25% Print Advertisements 25.0% 43.75% 31.25% Recruiting your district's student teachers 0% 12.5% 87.5% Delaware Alternative Routes Office 6.25% 37.5% 56.25% Your district's website for advertising positions
37.5% 31.25% 31.25%
Your district's website for online applications 31.25% 12.5% 56.25% "Grow your own" teachers from paraprofessionals and subs
6.25% 37.5% 56.25%
Visitation by recruits 6.25% 6.25% 87.5% *Percentages may not equal 100 percent due to non-‐applicability or non-‐response Table 19. Sources of Recently Hired Charter School Administrators (Percent of Administrators Reported) Assistant
Principals (N=4)
Principals (N=4)
From inside your district 50% 50% From Delaware but outside your district 50% 25% From out-‐of-‐state 0% 0% Don't Know or Other 0% 0% Delaware Leadership Project 0% 25%

Delaware Teacher and Administrator Supply and Demand Survey Analysis June 2013
69
Table 20. Reasons for Charter Administrator Vacancies (Percent of Administrators Reported) 2010-‐2011
(N=3) 2011-‐2012
(N=8) 2012-‐2013
(N=6)
Took a position in another Delaware school district
0% 0% 16.67%
Took a position in another district outside of Delaware
0% 25.0% 0%
Took a position at a charter school 0% 0% 16.67% Returned to classroom 0% 0% 0% Relocated with family 0% 12.5% 0% Family/personal reasons 0% 12.5% 0% Illness/Death 33.3% 12.5% 16.67% Were dismissed 0% 12.5% 0% RIF’d 33.3% 12.5% 33.33% Were Counseled out of administration, district or charter
n/a 0% 0%
Retired 33.3% 0% 16.67% Other known reasons for leaving 0% 12.5% 0% Do not know why administrator left 0% 0% 0%

Delaware Teacher and Administrator Supply and Demand Survey Analysis June 2013
70
Appendix C: Delaware Teacher and Administrator Supply and Demand Survey This annual survey has been commissioned by the Delaware Department of Education to help the state gain a greater understanding of issues related to the supply and demand of teachers and administrators in the state of Delaware. The survey gathers information on the practices of teacher, administrator, and support personnel hiring, vacancies, retirement, supply, and recruitment during the hiring period from March 1st 2012 until November 15th 2012. The survey is sent to personnel directors of each school district or charter school and the results will be presented only in the aggregate. The findings of the survey will be compiled in a report and shared with you in early spring. The report will also be made available on the University of Delaware’s Institute for Public Administration and Delaware Department of Education websites. If you have any questions about the survey, please feel free to contact Kelly Sherretz at [email protected]. Section 1: New Hires and Contracts: Teachers
1. How many NEW teachers did your district/charter school hire for the 2012-‐2013 school year? (This number SHOULD include teachers moving from temporary to regular contracts, but should NOT include teachers currently on temporary contracts.)
2. Of these new hires, how many were first time teachers with no prior teaching experience?
3. How many regular contracts were offered to new teachers in: April 2012 or earlier May 2012 June 2012 July 2012 August 2012 September 2012 October 2012 or later
4. Of all your 2012-‐2013 hires, how many teachers did you HIRE who were on TEMPORARY contracts in 2011-‐2012?
5. In addition to the teachers hired on regular contracts, how many teachers did you hire for the 2012-‐2013 school year on TEMPORARY contracts? Do not use temporary contracts (skip to 7).
6. What proportion of teachers were hired this year on temporary contracts for the following reasons?
a. Uncertainty of September 30 count All Most Half Few None b. Teacher not yet Highly Qualified or certified All Most Half Few None c. Other teacher credential reasons All Most Half Few None d. Temporary needs due to pregnancy, All Most Half Few None
illness, sabbaticals, etc. e. Hired after first student day All Most Half Few None f. Other All Most Half Few None
If “Other”, please specify
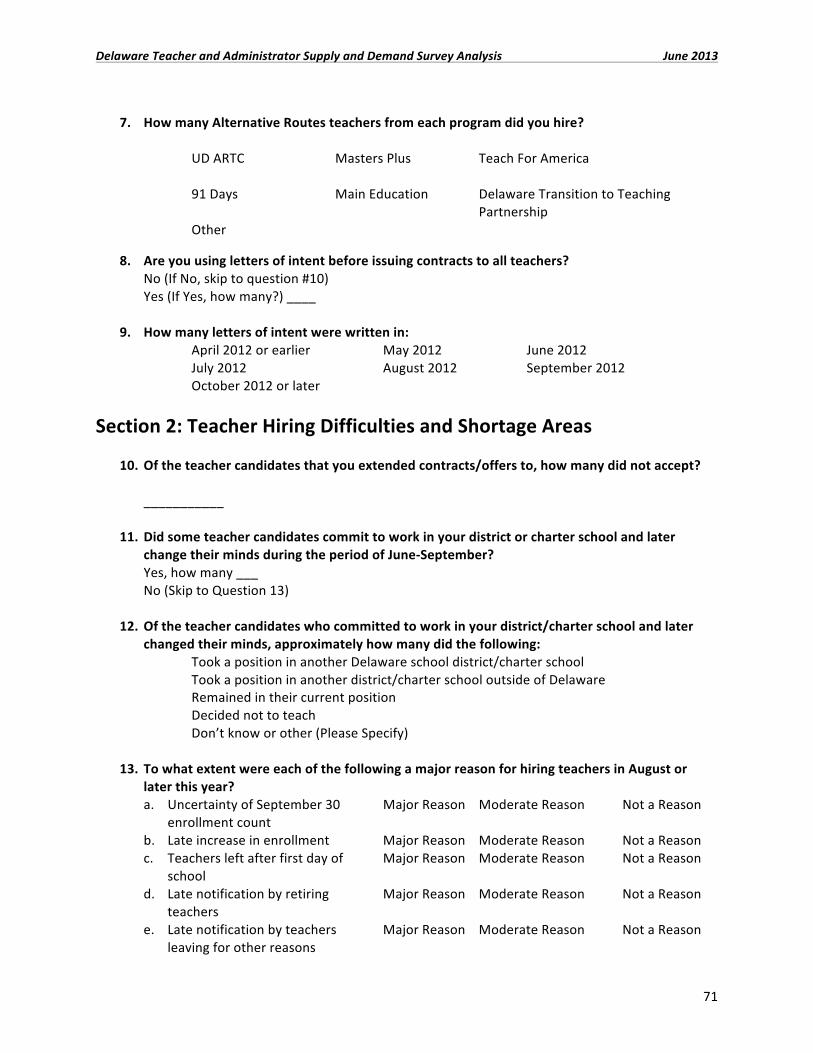
Delaware Teacher and Administrator Supply and Demand Survey Analysis June 2013
71
7. How many Alternative Routes teachers from each program did you hire?
UD ARTC Masters Plus Teach For America 91 Days Main Education Delaware Transition to Teaching
Partnership Other
8. Are you using letters of intent before issuing contracts to all teachers? No (If No, skip to question #10) Yes (If Yes, how many?) ____
9. How many letters of intent were written in: April 2012 or earlier May 2012 June 2012 July 2012 August 2012 September 2012 October 2012 or later
Section 2: Teacher Hiring Difficulties and Shortage Areas
10. Of the teacher candidates that you extended contracts/offers to, how many did not accept? ___________
11. Did some teacher candidates commit to work in your district or charter school and later change their minds during the period of June-‐September? Yes, how many ___ No (Skip to Question 13)
12. Of the teacher candidates who committed to work in your district/charter school and later changed their minds, approximately how many did the following:
Took a position in another Delaware school district/charter school Took a position in another district/charter school outside of Delaware Remained in their current position Decided not to teach Don’t know or other (Please Specify)
13. To what extent were each of the following a major reason for hiring teachers in August or
later this year? a. Uncertainty of September 30 Major Reason Moderate Reason Not a Reason
enrollment count b. Late increase in enrollment Major Reason Moderate Reason Not a Reason c. Teachers left after first day of Major Reason Moderate Reason Not a Reason
school d. Late notification by retiring Major Reason Moderate Reason Not a Reason
teachers e. Late notification by teachers Major Reason Moderate Reason Not a Reason
leaving for other reasons

Delaware Teacher and Administrator Supply and Demand Survey Analysis June 2013
72
f. Concern about having to use Major Reason Moderate Reason Not a Reason local funds to fully fund additional teachers
g. Jumping (vacancies created Major Reason Moderate Reason Not a Reason in the summer by teachers moving to another district)
h. Bumping (internal transfer Major Reason Moderate Reason Not a Reason process)
i. Difficulty in filling positions Major Reason Moderate Reason Not a Reason because of lack of qualified applicants, e.g. in math or science
j. Other Problem (Please specify) Major Reason Moderate Reason Not a Reason Please specify Other.
14. How difficult was it to fill TEACHING POSITIONS in each of the following areas? a. Art Very Difficult Moderately Difficult Not Difficult Not Applicable b. Bilingual/ESOL Very Difficult Moderately Difficult Not Difficult Not Applicable c. English/Language Arts Very Difficult Moderately Difficult Not Difficult Not Applicable d. Elementary Very Difficult Moderately Difficult Not Difficult Not Applicable e. Foreign Languages Very Difficult Moderately Difficult Not Difficult Not Applicable f. Middle School Math Very Difficult Moderately Difficult Not Difficult Not Applicable g. High School Math Very Difficult Moderately Difficult Not Difficult Not Applicable h. Music Very Difficult Moderately Difficult Not Difficult Not Applicable i. Physical Education Very Difficult Moderately Difficult Not Difficult Not Applicable j. Reading Very Difficult Moderately Difficult Not Difficult Not Applicable k. Middle School Science Very Difficult Moderately Difficult Not Difficult Not Applicable l. High School Science Very Difficult Moderately Difficult Not Difficult Not Applicable m. Social Science Very Difficult Moderately Difficult Not Difficult Not Applicable n. Special Education Very Difficult Moderately Difficult Not Difficult Not Applicable o. Technology Very Difficult Moderately Difficult Not Difficult Not Applicable p. Business Education Very Difficult Moderately Difficult Not Difficult Not Applicable q. Gifted/Talented Very Difficult Moderately Difficult Not Difficult Not Applicable
15. Which of the areas listed in QUESTION #14 was the MOST difficult for teacher hiring in your district/charter school for Fall 2012? Art Bilingual/ESOL English/Language Arts Elementary Foreign Languages Middle School Math High School Math Music Physical Education Reading Middle School Science High School Science Social Science Special Education Technology Business Education Gifted/Talented Not Applicable-‐ None Hired

Delaware Teacher and Administrator Supply and Demand Survey Analysis June 2013
73
16. How difficult was it to fill teaching positions at high needs schools? (For this survey a high needs school has a minority student population of over 70% and/or over 70% Free and Reduced Lunch. Or if the school is in the top 25% in the state with the ELL population and meets one of the first two criteria. )
Very Difficult Moderately Difficult Not Difficult Not Applicable
17. To what extent was each of the following a problem related to teacher shortages in your district or charter school for Fall 2012?
a. Lack of qualified teacher Major Problem Moderate Problem Not a Problem candidates in particular areas
b. Lack of number of teacher Major Problem Moderate Problem Not a Problem candidates in particular areas
c. Teachers moving from Major Problem Moderate Problem Not a Problem your district to another district/charter school in Delaware
d. Teachers moving from Major Problem Moderate Problem Not a Problem your district to a district/ charter school outside Delaware
e. Low starting salaries for Major Problem Moderate Problem Not a Problem teachers in your district
f. Low salaries for Major Problem Moderate Problem Not a Problem experienced teachers in your district
g. Good teaching candidates Major Problem Moderate Problem Not a Problem failing PRAXIS I
h. Good teaching candidates Major Problem Moderate Problem Not a Problem failing PRAXIS II
i. Perceived problems with Major Problem Moderate Problem Not a Problem teaching in Delaware (e.g. with respect to discipline, class size accountability)
j. Other problem (Please Major Problem Moderate Problem Not a Problem Specify)
Please specify Other.
18. Were there hindrances or contractual barriers that delayed your offering a contract for Fall 2012?
No Yes, Transfer clause requiring current employees to be considered, interviewed, or hired first
Yes, RIF recalls Yes, other: Please specify.

Delaware Teacher and Administrator Supply and Demand Survey Analysis June 2013
74
19. (Charter Schools Skip) Did your district try to renegotiate contractual barriers in your last collective bargaining negotiations? Yes No
20. (Charter Schools Skip) Was your district successful in changing these barriers? Yes Somewhat No
21. (Charter Schools Skip) What type of contract does your district offer candidates? Open contract within district Specific assignment, e.g. grade in building Other, please specify
22. How many emergency certificates and in what areas did you request this year? e.g Math(4); English(12); etc.
23. Of the emergency certificates requested, how many were requested from state-‐approved ARTC organizations?
Section 3: Teacher Vacancies 24. Are any teaching positions open in your district/charter school at this time?
Yes No If yes, in what areas (and how many?) e.g. Math (4); English (12); etc.
25. Of the vacancies that have occurred in your district or charter school over the past year, how many were filled internally? Please list the subjects and number below.
26. How many teacher vacancies (excluding those resulting from temporary contracts) did you learn about in: October 2011 or earlier November 2011 December 2011 January 2012 February 2012 March 2012 April 2012 May 2012 June 2012 July 2012 August 2012 September 2012 October 2012 or later
Section 4: Teacher Retention and Turnover 27. Does your district/charter school administer an exit survey?
Yes No 28. How many total teachers left your district/charter school this year? 29. How many left for the following reasons?
Took a position in another Delaware school district Took a position in another district outside of Delaware Took a position at a charter school Became an administrator Relocated with family Family/Personal Reasons Illness/death Reduction in Force (RIF)

Delaware Teacher and Administrator Supply and Demand Survey Analysis June 2013
75
Non-‐Renewal for Performance Were counseled out of teaching or district/charter school Retired Other known reasons for leaving Do not know why teacher left Non-‐Renewal, other Total_____
30. How many eligible retirees does your district/charter school have for the following categories for the next five years? Teachers_____ District Office Staff_____ Principals_____ Assistant Principals_____
31. Does your district/charter school offer any incentives for early notification of plans to retire?
Yes, continued from last year ______ No, never had incentives Yes, incentives added this year _______ No, had incentives but discontinued them
If yes, please list the last day for early notification:
If yes, please list the type of incentives that are offered:
32. Of those teachers who retired in this past year, how many earned the early retirement notification incentive? Not Applicable Please specify how many:
Section 5: Teacher and Administrator Recruitment
33. Do you have a recruitment budget? Yes No (If yes) What is the amount spent on advertisements, trips, and other out-‐of-‐pocket recruitment expenses in 2012-‐2013?
34. To what extent did your district/charter school use each of the following recruitment tools in teacher recruitment for Fall 2012?
a. Recruitment trips/fairs in Great Use Some Use No Use # of trips neighboring states (NJ, MD, PA)
b. Recruitment trips/fairs in other states Great Use Some Use No Use # of trips

Delaware Teacher and Administrator Supply and Demand Survey Analysis June 2013
76
c. Teach Delaware website Great Use Some Use No Use d. Teach For America program Great Use Some Use No Use e. University of Delaware Project Search Great Use Some Use No Use f. Print Advertisements Great Use Some Use No Use g. Recruiting your district’s/charter Great Use Some Use No Use # hired
school’s student teachers h. Delaware Alternative Routes Office Great Use Some Use No Use i. your district’s/charter’s website for Great Use Some Use No Use
advertising postions j. Your district’s/charter’s website for Great Use Some Use No Use
online applications k. “Grow your own” teachers from Great Use Some Use No Use
paraprofessionals and substitutes l. Visitation by recruits Great Use Some Use No Use 35. Which of these tools proved most helpful for Fall 2012?
Recruitment trips/fairs in neighboring states Recruitment trips/fairs in other states (NJ,MD,PA) Teach Delaware website Teach For America program University of Delaware Project Search Print Advertisements Recruiting your district’s or Delaware Alternative Routes Office charter school’s student teachers Your district’s/charter school’s website for Your district’s/charter school’s website for advertising positions online applications “Grow your own” teachers from Visitation by recruits Paraprofessionals and substitutes
In state recruitment fairs (other than project search)
36. Which of the following do you believe makes your district attractive to teachers as a place to work? (Select all that apply)
Compensation and Benefits Signing bonuses Performance incentives Housing, housing subsidies, or rent assistance School culture and climate Professional Development opportunities
Quality of instruction in the district School facilities in the district Supportive teachers in the district Supportive administrators in the district
Delaware Teacher and Administrator Supply and Demand Survey Analysis June 2013
77
Loan forgiveness or tuition subsidies Class sizes Teacher autonomy or involvement in decision-‐making None of the above Other: (please specify)
Section 6: Hiring: Non-‐Teaching Positions
37. To what extent did your district/charter school experience difficulties in filling each of the following NON-‐TEACHING POSITIONS for the 2012-‐2013 school year? a. Library sciences/Media Very Difficult Moderately Difficult Not Difficult N/A
Technology b. Psychologist Very Difficult Moderately Difficult Not Difficult N/A c. Guidance Counselor Very Difficult Moderately Difficult Not Difficult N/A d. Nurse Very Difficult Moderately Difficult Not Difficult N/A e. Speech Therapist Very Difficult Moderately Difficult Not Difficult N/A f. Elementary School Very Difficult Moderately Difficult Not Difficult N/A
Principal g. Elementary School Very Difficult Moderately Difficult Not Difficult N/A
Assistant Principal h. Middle School Principal Very Difficult Moderately Difficult Not Difficult N/A i. Middle School Assistant Very Difficult Moderately Difficult Not Difficult N/A
Principal j. Secondary School Very Difficult Moderately Difficult Not Difficult N/A
Principal k. Secondary School Very Difficult Moderately Difficult Not Difficult N/A
Assistant Principal l. Central Office Very Difficult Moderately Difficult Not Difficult N/A
Administrator m. Other Very Difficult Moderately Difficult Not Difficult N/A If Other, please specify?
38. Which of the areas listed in QUESTION #37 was the MOST difficult for non-‐teacher hiring in your district/charter school for Fall 2012?
Library Sciences/Media Technology Psychologist Guidance Counselor Nurse Speech Therapist Elementary School Principal Elementary School Assistant Principal Secondary School Principal Secondary School Assistant Principal Central Office Administrator Middle School Principal Middle School Assistant Principal Not applicable, none hired Other
39. What changes in difficulty in NON-‐TEACHER HIRING do you anticipate in the next year?

Delaware Teacher and Administrator Supply and Demand Survey Analysis June 2013
78
Section 7: New Hiring: Administrators 40. How many total applicants did you receive for principal positions for the 2012-‐2013 school
year?
41. How many total applicants did you receive for assistant principal positions for the 2012-‐2013 school year?
42. In your estimation, how many acceptable applicants, that is, those capable of filling the specific position for which they applied, did you receive for Principals_______ Assistant Principals_________
43. How many new assistant principals and principals did your district/charter school hire for the 2012-‐2013 school year? Assistant Principals Principals From Delaware Leadership Project From inside your district/charter school From Delaware but outside your district/charter school From out-‐of-‐state Don’t Know or Other
44. Of these new hires, how many were first time principals or assistant principals? Assistant Principals Principals
45. Of the assistant principals and principals you hired, how many aspiring school leaders participated in either your or another district’s succession planning or program to prepare/develop school administrators?
Assistant Principals ______ Principal______ 46. Does your district/charter school have its own program to prepare/develop school
administrators? Yes No
47. Does your district/charter school have a program to support new principals during their induction stage? Yes No (If yes) Who does the program serve, e.g. all new principals, new principals to the district?
48. How many school administrators left your district/charter school last year?
49. How many school administrators left your district/charter school for the following reason? Took a position in another Delaware school district Took a position in another district outside of Delaware Took a position at a charter school Returned to classroom Relocated with family Family/Personal reasons Illness/death

Delaware Teacher and Administrator Supply and Demand Survey Analysis June 2013
79
Non-‐Renewal for Performance Reduction in Force Were counseled out of administration or district or charter school Retired Other known reasons for leaving Do not know why administrator left
Section 8: Salary and Incentives 50. Does your district/charter school offer any recruitment incentives to teacher candidates? If so,
please list the incentives below.
51. Does your district/charter school currently use any pay incentives such as cash bonuses, salary increases, or different steps on the salary schedule to –
Reward teachers who have attained National Board for Professional Teaching Standards certification? Reward excellence in teaching? Recruit or retain teachers to teach in a less desirable location? Recruit or retain teachers to teach in fields of shortage?
Please indicate who completed this survey and provide contact information in case of the need for follow up. (Note: Results will not be reported by District, but are subject to FOIA requests.) Name Position Email Telephone Number Did you complete this survey for your district/charter school last year? Yes No Approximately how long did it take you to complete this survey? Are there any additional questions that you would like to see on this survey? If so, please provide the topic that you would like for us to include. Thank you for completing this survey

The University of Delaware is a non-discriminatory, equal opportunity, and affirmative action institution.See www.udel.edu/aboutus/legalnotices.html for detailed policy information.
Institute for Public AdministrationSchool of Public Policy & Administration
College of Arts & SciencesUniversity of Delaware
180 Graham Hall University of Delaware Newark, DE 19716-7380
phone: 302-831-8971 e-mail: [email protected] fax: 302-831-3488
www.ipa.udel.edu
The University of Delaware’s Institute for Public Administration (IPA) addresses the policy, planning,and management needs of its partners through the integration of applied research, professionaldevelopment, and the education of tomorrow’s leaders.
backpage_Layout 1 2/6/12 12:02 PM Page 1
Related Documents