University of the Witwatersrand,Johannesburg Doctoral Thesis Degradation Analysis of Metal Oxide Varistors under Harmonic Distortion Conditions Author: Pitshou Ntambu Bokoro Supervisor: Prof. I.R Jandrell A thesis submitted in fulfilment of the requirements for the degree Doctor of Philosophy in Electrical Engineering May 2016

Welcome message from author
This document is posted to help you gain knowledge. Please leave a comment to let me know what you think about it! Share it to your friends and learn new things together.
Transcript

University of theWitwatersrand,Johannesburg
Doctoral Thesis
Degradation Analysis of Metal OxideVaristors under Harmonic Distortion
Conditions
Author: Pitshou Ntambu Bokoro
Supervisor: Prof. I.R Jandrell
A thesis submitted in fulfilment of the requirements
for the degree Doctor of Philosophy
in Electrical Engineering
May 2016

Declaration of Authorship
I, Pitshou Bokoro, declare that this thesis titled, ’Degradation Analysis of Metal Oxide
Varistors under Harmonic Distortion Conditions’ and the work presented in it are my
own. I confirm that:
This thesis has never previously been submitted for a degree or any other qualifi-
cation at this University or any other institution.
Where I have consulted the published work of others, this is clearly attributed.
Where I have quoted from the work of others, the source is always given. With
the exception of such quotations, this thesis is entirely my own work.
Signed: Pitshou Bokoro
Date: May 2016
i

UNIVERSITY OF THE WITWATERSRAND, JOHANNESBURG
Abstract
Doctor of Philosophy
Degradation Analysis of Metal Oxide Varistors under Harmonic Distortion
Conditions
by Pitshou Bokoro
Modern electrical networks provide an opportunity for inevitable interaction between
metal oxide arresters and power system harmonics. Therefore, these arrester devices
are continuously exposed to the combined effect of distorted system voltage and envi-
ronmental thermal stresses. Recent studies supported by field experiments have shown
significant rise in the leakage current through these surge arrester devices when exposed
to ac voltage with harmonics. However, the major shortcoming in the current knowledge
and applications of varistor arresters resides on the reliability and the electrical stabil-
ity of these overvoltage protection units, when subjected to long-term and continuous
distorted ac voltage and thermal stresses from the environment.
Commercially-sourced ZnO arresters of similar size and electrical properties are tested
using standard ac accelerated degradation procedure or electro-thermal ageing test; the
V − I characteristic measurement and the high-frequency impulse tests. The times
to degradation, the coefficient of non-linearity, the reference voltages, as well as the
clamping voltage measured are used to analyse the reliability and the electrical stability
of the metal oxide-based arrester samples. The resistive component of the leakage current
is extracted from the measured total leakage current. The three-parameter Weibull
probability model is invoked in order to analyse the degradation phenomenon.
The results obtained indicate that for respective increase of 4.4%, 3.1% and 5.7% in the
3rd, the 5th and the 7th harmonic content, the resistive current is increased by 92.67%.
The mean life of the arrester samples is reduced by 40.91%, and the probability of
accelerated time to degradation is found to be 58.93%. The accelerated loss of stability
is proven by 81.71% reduction in the coefficient of non-linearity and 43.75% drop in the
reference voltage, which both indicate the shift of the V −I characteristic curve towards
the high conduction region.

Acknowledgements
The author would like to acknowledge the financial support from the High Voltage
Engineering Research Group of the University of the Witwatersrand and the contribution
of the Centre for Telecommunications of the University of Johannesburg.
iii

Contents
Declaration of Authorship i
Abstract ii
Acknowledgements iii
Contents iv
List of Figures vii
List of Tables ix
Abbreviations xi
Symbols xiii
1 Introduction 1
1.1 Background Theory . . . . . . . . . . . . . . . . . . . . . . . . . . . . . . 1
1.2 Problem Statement . . . . . . . . . . . . . . . . . . . . . . . . . . . . . . . 2
1.3 Scope of the Study . . . . . . . . . . . . . . . . . . . . . . . . . . . . . . . 2
1.3.1 Broad Objective . . . . . . . . . . . . . . . . . . . . . . . . . . . . 3
1.3.2 Specific Objectives . . . . . . . . . . . . . . . . . . . . . . . . . . . 3
1.4 Significance of Accelerated Degradation under Harmonic-Distortion . . . . 3
1.4.1 The Time to decrease the Schottky Barrier Height . . . . . . . . . 4
1.4.2 The Biasing Effect of Voltage Harmonics . . . . . . . . . . . . . . . 4
1.5 Overview of the Study . . . . . . . . . . . . . . . . . . . . . . . . . . . . . 5
1.6 Conclusion . . . . . . . . . . . . . . . . . . . . . . . . . . . . . . . . . . . 6
2 Literature Review 8
2.1 Introduction . . . . . . . . . . . . . . . . . . . . . . . . . . . . . . . . . . . 8
2.2 Electrical Degradation of Varistor Arresters: Causes and Symptoms . . . 8
2.2.1 High Amplitude Surge Currents . . . . . . . . . . . . . . . . . . . . 9
2.2.2 Continuous ac or dc Current Conduction . . . . . . . . . . . . . . 13
2.3 Power System Harmonics and Varistor Arresters . . . . . . . . . . . . . . 17
2.3.1 Leakage Current - based Condition Assessment . . . . . . . . . . . 17
iv

Contents v
2.3.2 Other Reported Effects . . . . . . . . . . . . . . . . . . . . . . . . 23
2.4 Statistical and Probabilistic Analysis of Electrical Degradation . . . . . . 24
2.4.1 Weibull and Log Normal Statistical Distribution . . . . . . . . . . 24
2.4.2 Probabilistic Analysis . . . . . . . . . . . . . . . . . . . . . . . . . 27
2.5 Physics of Electrical Degradation in MOVs . . . . . . . . . . . . . . . . . 27
2.6 Conclusion . . . . . . . . . . . . . . . . . . . . . . . . . . . . . . . . . . . 30
3 Experimental Work 32
3.1 Introduction . . . . . . . . . . . . . . . . . . . . . . . . . . . . . . . . . . . 32
3.2 Description of the Varistor Samples . . . . . . . . . . . . . . . . . . . . . . 32
3.3 V − I Characteristic Test . . . . . . . . . . . . . . . . . . . . . . . . . . . 33
3.3.1 Procedure . . . . . . . . . . . . . . . . . . . . . . . . . . . . . . . . 33
3.3.2 Measured Parameters . . . . . . . . . . . . . . . . . . . . . . . . . 34
3.4 Accelerated Degradation Test . . . . . . . . . . . . . . . . . . . . . . . . . 35
3.4.1 Procedure . . . . . . . . . . . . . . . . . . . . . . . . . . . . . . . . 35
3.4.2 Measured Parameters . . . . . . . . . . . . . . . . . . . . . . . . . 39
3.5 Impulse Tests . . . . . . . . . . . . . . . . . . . . . . . . . . . . . . . . . . 42
3.5.1 Procedure . . . . . . . . . . . . . . . . . . . . . . . . . . . . . . . . 42
3.5.2 Measured Parameters . . . . . . . . . . . . . . . . . . . . . . . . . 43
3.6 Conclusion . . . . . . . . . . . . . . . . . . . . . . . . . . . . . . . . . . . 43
4 Analysis of Electrical Degradation under Harmonic Distortion 45
4.1 Introduction . . . . . . . . . . . . . . . . . . . . . . . . . . . . . . . . . . . 45
4.2 Weibull Plots and Probability Functions . . . . . . . . . . . . . . . . . . . 45
4.2.1 Probability Functions and Electrical Degradation . . . . . . . . . . 46
4.2.2 Hypothesis Testing and Mean Life Comparison . . . . . . . . . . . 47
4.3 Case study 1: Analysis of BE Varistor Samples . . . . . . . . . . . . . . . 50
4.3.1 V-I curve and Coefficient of non-linearity . . . . . . . . . . . . . . 51
4.3.2 Clamping Voltage for BE Samples . . . . . . . . . . . . . . . . . . 53
4.3.3 Probability Functions of BE Samples . . . . . . . . . . . . . . . . . 53
4.4 Case Study 2: Analysis of YW Varistor Samples . . . . . . . . . . . . . . 57
4.4.1 V-I curve and Coefficient of non-linearity . . . . . . . . . . . . . . 59
4.4.2 Clamping Voltage for YW Samples . . . . . . . . . . . . . . . . . . 61
4.4.3 Probability Functions of YW Samples . . . . . . . . . . . . . . . . 63
4.5 Case study 3: Analysis of RL Varistor Samples . . . . . . . . . . . . . . . 65
4.5.1 V-I curve and Coefficient of non-linearity . . . . . . . . . . . . . . 66
4.5.2 Clamping Voltage for RL Samples . . . . . . . . . . . . . . . . . . 68
4.5.3 Probability Functions of RL Samples . . . . . . . . . . . . . . . . . 70
4.6 Conclusion . . . . . . . . . . . . . . . . . . . . . . . . . . . . . . . . . . . 74
5 The Effect of Voltage Harmonics on the Resistive Current 76
5.1 Introduction . . . . . . . . . . . . . . . . . . . . . . . . . . . . . . . . . . . 76
5.2 Decomposition of the Leakage Current . . . . . . . . . . . . . . . . . . . . 76
5.3 Resistive Current Analysis . . . . . . . . . . . . . . . . . . . . . . . . . . . 78
5.3.1 BE Samples . . . . . . . . . . . . . . . . . . . . . . . . . . . . . . . 79
5.3.2 YW Samples . . . . . . . . . . . . . . . . . . . . . . . . . . . . . . 81
5.3.3 RL Samples . . . . . . . . . . . . . . . . . . . . . . . . . . . . . . . 83

Contents vi
5.4 Mechanism of Accelerated Electrical Degradation . . . . . . . . . . . . . . 85
5.5 Conclusion . . . . . . . . . . . . . . . . . . . . . . . . . . . . . . . . . . . 86
6 Conclusions and Future Directions 87
6.1 Introduction . . . . . . . . . . . . . . . . . . . . . . . . . . . . . . . . . . . 87
6.2 Results Obtained . . . . . . . . . . . . . . . . . . . . . . . . . . . . . . . . 87
6.2.1 Higher Probability of Degradation and Reduced Mean Life . . . . 88
6.2.2 Higher Rate of Degradation . . . . . . . . . . . . . . . . . . . . . . 88
6.2.3 Accelerated Loss of Stability . . . . . . . . . . . . . . . . . . . . . 88
6.2.4 Increased Clamping Voltage . . . . . . . . . . . . . . . . . . . . . . 89
6.2.5 Voltage Harmonics and Accelerated Electrical Degradation . . . . 89
6.3 Interpretation of the Results . . . . . . . . . . . . . . . . . . . . . . . . . . 89
6.4 Future Directions . . . . . . . . . . . . . . . . . . . . . . . . . . . . . . . . 90
A V − I Measurements 91
B Measurement of the Applied Voltage and the Leakage Current 100
C Times to degradation 105
D Chi-Square Distribution Table 115
Bibliography 117

List of Figures
2.1 Critical coefficient values . . . . . . . . . . . . . . . . . . . . . . . . . . . . 26
3.1 V-I test set up . . . . . . . . . . . . . . . . . . . . . . . . . . . . . . . . . 34
3.2 Heating Program: Time vs Temperature . . . . . . . . . . . . . . . . . . . 36
3.3 Connection arrangement of Varistor Samples . . . . . . . . . . . . . . . . 38
3.4 Harmonic source connection . . . . . . . . . . . . . . . . . . . . . . . . . . 39
3.5 Harmonic filter connection . . . . . . . . . . . . . . . . . . . . . . . . . . . 40
3.6 Accelerated degradation test set up . . . . . . . . . . . . . . . . . . . . . . 40
3.7 Degradation time pattern for failed or spoiled samples . . . . . . . . . . . 41
3.8 Degradation time pattern for survived samples . . . . . . . . . . . . . . . 41
3.9 Impulse test set up . . . . . . . . . . . . . . . . . . . . . . . . . . . . . . . 43
4.1 Block diagram of the Weibull Probability Analysis . . . . . . . . . . . . . 46
4.2 Time reduction at equal reliability Point . . . . . . . . . . . . . . . . . . . 49
4.3 Applied Voltage Stress . . . . . . . . . . . . . . . . . . . . . . . . . . . . . 50
4.4 Frequency Components BEW . . . . . . . . . . . . . . . . . . . . . . . . . 51
4.5 Applied Voltage Stress . . . . . . . . . . . . . . . . . . . . . . . . . . . . . 51
4.6 Frequency Components BEH . . . . . . . . . . . . . . . . . . . . . . . . . 52
4.7 Mean V-I curve BE Samples . . . . . . . . . . . . . . . . . . . . . . . . . . 53
4.8 Clamping Voltage BE Samples . . . . . . . . . . . . . . . . . . . . . . . . 54
4.9 Clamping Voltage BEW Samples . . . . . . . . . . . . . . . . . . . . . . . 54
4.10 Clamping Voltage BEH Samples . . . . . . . . . . . . . . . . . . . . . . . 55
4.11 Cumulative Density Function BEW Samples . . . . . . . . . . . . . . . . . 55
4.12 Cumulative Density Function BEH . . . . . . . . . . . . . . . . . . . . . . 56
4.13 Reliability curves BEW and BEH Samples . . . . . . . . . . . . . . . . . . 57
4.14 Degradation rate curves BEW and BEH Samples . . . . . . . . . . . . . . 58
4.15 Probability Density Functions BEW and BEH Samples . . . . . . . . . . 58
4.16 Applied Voltage Stress YWW . . . . . . . . . . . . . . . . . . . . . . . . . 59
4.17 Frequency Components YWW . . . . . . . . . . . . . . . . . . . . . . . . 59
4.18 Applied Voltage Stress YWH . . . . . . . . . . . . . . . . . . . . . . . . . 60
4.19 Frequency Components YWH . . . . . . . . . . . . . . . . . . . . . . . . . 60
4.20 V-I curve YW Samples . . . . . . . . . . . . . . . . . . . . . . . . . . . . . 61
4.21 Clamping Voltage YW Samples . . . . . . . . . . . . . . . . . . . . . . . . 62
4.22 Clamping Voltage YWW Samples . . . . . . . . . . . . . . . . . . . . . . 62
4.23 Clamping Voltage YWH Samples . . . . . . . . . . . . . . . . . . . . . . . 63
4.24 Cumulative Density Function YWW Samples . . . . . . . . . . . . . . . . 64
4.25 Cumulative Density Function YWH Samples . . . . . . . . . . . . . . . . 64
4.26 Reliability Curves YWW and YWH Samples . . . . . . . . . . . . . . . . 65
vii

List of Figures viii
4.27 Degradation rate curves YWW and YWH Samples . . . . . . . . . . . . . 66
4.28 Probability Density Function YWW and YWH Samples . . . . . . . . . . 66
4.29 Applied Voltage Stress RLW . . . . . . . . . . . . . . . . . . . . . . . . . 67
4.30 Frequency Components RLW . . . . . . . . . . . . . . . . . . . . . . . . . 67
4.31 Applied Voltage Stress RLH . . . . . . . . . . . . . . . . . . . . . . . . . . 68
4.32 Frequency Components RLH . . . . . . . . . . . . . . . . . . . . . . . . . 68
4.33 V-I curve RL Samples . . . . . . . . . . . . . . . . . . . . . . . . . . . . . 69
4.34 Clamping Voltage RL Samples . . . . . . . . . . . . . . . . . . . . . . . . 69
4.35 Clamping Voltage RLW Samples . . . . . . . . . . . . . . . . . . . . . . . 70
4.36 Clamping Voltage RLH Samples . . . . . . . . . . . . . . . . . . . . . . . 71
4.37 Cumulative Density Function RLW Samples . . . . . . . . . . . . . . . . . 71
4.38 Cumulative Density Function RLH Samples . . . . . . . . . . . . . . . . . 72
4.39 Reliability curves RLW and RLH Samples . . . . . . . . . . . . . . . . . . 72
4.40 Degradation rate curves RLW and RLH Samples . . . . . . . . . . . . . . 73
4.41 Probability Density Function RLW and RLH Samples . . . . . . . . . . . 73
5.1 Leakage Current BEW . . . . . . . . . . . . . . . . . . . . . . . . . . . . . 79
5.2 Leakage Current BEH . . . . . . . . . . . . . . . . . . . . . . . . . . . . . 80
5.3 Resistive Current Components BE Samples . . . . . . . . . . . . . . . . . 80
5.4 Leakage Current YWW . . . . . . . . . . . . . . . . . . . . . . . . . . . . 81
5.5 Leakage Current YWH . . . . . . . . . . . . . . . . . . . . . . . . . . . . . 81
5.6 Resistive Current Components YW Samples . . . . . . . . . . . . . . . . . 82
5.7 Leakage Current RLW . . . . . . . . . . . . . . . . . . . . . . . . . . . . . 83
5.8 Leakage Current RLH . . . . . . . . . . . . . . . . . . . . . . . . . . . . . 84
5.9 Resistive Current Components RL Samples . . . . . . . . . . . . . . . . . 84
5.10 Distribution of charge carriers in ZnO microstructure . . . . . . . . . . . . 85
D.1 Chi-Square Table . . . . . . . . . . . . . . . . . . . . . . . . . . . . . . . . 116

List of Tables
3.1 Electrical Specifications of the sample groups . . . . . . . . . . . . . . . . 33
4.1 Classification of Tested BE Samples . . . . . . . . . . . . . . . . . . . . . 52
4.2 Change in Reference Voltage and Coefficient of non-linearity (BE Samples) 52
4.3 Clamping Voltages . . . . . . . . . . . . . . . . . . . . . . . . . . . . . . . 53
4.4 Estimated Weibull Parameters of BEW and BEH distributions . . . . . . 55
4.5 Degradation times of p% Arrester Components . . . . . . . . . . . . . . . 57
4.6 Classification of Tested YW Samples . . . . . . . . . . . . . . . . . . . . . 59
4.7 Change in Reference Voltage and Coefficient of non-linearity (YW Samples) 61
4.8 Clamping Voltages YW Samples . . . . . . . . . . . . . . . . . . . . . . . 62
4.9 Estimated Weibull Parameters of YWW and YWH distributions . . . . . 65
4.10 Degradation times of p% Arrester Components . . . . . . . . . . . . . . . 65
4.11 Classification of Tested RL Samples . . . . . . . . . . . . . . . . . . . . . 67
4.12 Change in Reference Voltage and Coefficient of non-linearity (RL Samples) 70
4.13 Clamping Voltages for RL Samples . . . . . . . . . . . . . . . . . . . . . . 70
4.14 Estimated Weibull Parameters of RLW and RLH distributions . . . . . . 71
4.15 Degradation times of p% Arrester Components . . . . . . . . . . . . . . . 74
A.1 V − I measurement without external harmonics - BEW . . . . . . . . . . 92
A.2 V − I measurement without external harmonics - BEH . . . . . . . . . . . 93
A.3 V − I measurement without external harmonics - YWW . . . . . . . . . . 94
A.4 V − I measurement with external harmonics - YWH . . . . . . . . . . . . 95
A.5 V − I measurement without external harmonics - RLW . . . . . . . . . . 96
A.6 V − I measurement without external harmonics - RLH . . . . . . . . . . . 97
A.7 V − I measurement without external harmonics - RLH (Continued) . . . 98
A.8 V − I measurement Before degradation (BE samples) . . . . . . . . . . . 99
B.1 Measurement of the applied voltage . . . . . . . . . . . . . . . . . . . . . 100
B.2 Measurement of the applied voltage . . . . . . . . . . . . . . . . . . . . . 101
B.3 Harmonic Components of the applied voltage: BEW samples . . . . . . . 102
B.4 Harmonic Components of the applied voltage: BEH samples . . . . . . . . 102
B.5 Harmonic Components of the applied voltage: YWW samples . . . . . . . 102
B.6 Harmonic Components of the applied voltage: YWH samples . . . . . . . 102
B.7 Harmonic Components the applied voltage: RLW samples . . . . . . . . . 102
B.8 Harmonic Components of the applied voltage: RLH samples . . . . . . . . 102
B.9 Measurement of the Leakage Current . . . . . . . . . . . . . . . . . . . . . 103
B.10 Measurement of the Leakage Current . . . . . . . . . . . . . . . . . . . . . 103
B.11 Resistive Current Components: BEW samples . . . . . . . . . . . . . . . . 104
ix

List of Tables x
B.12 Resistive Current Components: BEH samples . . . . . . . . . . . . . . . . 104
B.13 Resistive Current Components: YWW samples . . . . . . . . . . . . . . . 104
B.14 Resistive Current Components: YWH samples . . . . . . . . . . . . . . . 104
B.15 Resistive Current Components: RLW samples . . . . . . . . . . . . . . . . 104
B.16 Resistive Current Components: RLH samples . . . . . . . . . . . . . . . . 104
C.1 Times to degradation for BEW Samples . . . . . . . . . . . . . . . . . . . 105
C.2 Times to degradation for BEH Samples . . . . . . . . . . . . . . . . . . . 107
C.3 Times to degradation for YWW Samples . . . . . . . . . . . . . . . . . . . 108
C.4 Times to degradation for YWH Samples . . . . . . . . . . . . . . . . . . . 111
C.5 Times to degradation for RLW Samples . . . . . . . . . . . . . . . . . . . 112
C.6 Times to degradation for RLH Samples . . . . . . . . . . . . . . . . . . . 113
C.7 Times to degradation for RLH Samples(Continued) . . . . . . . . . . . . . 114

Abbreviations
ATP Alternative Transient Program
AVR Applied Voltage Ratio
CDF Cumulative Density Function
CoO Cobalt Oxide
Cr2O3 Chromium Dioxide
CSV Comma Separated
Er2O3 Erbium Oxide
GDT Gas Discharge Tube
IEEE Institute of Electrical and Electronics Engineers
FFT Fast Fourier Transform
MCOV Maximum Continuous Operating Voltage
MOV Metal Oxide Varistor
MSCM Modified Shifted Current Method
MTTF Mean Time To Failure
ML Mean Life
Nd2O3 Neodymium Oxide
PDF Probability Density Function
PEA Pulse Electro Acoustic
PrO Praseodymium Oxides
PWM Pulse Width Modulation
SPD Surge Protective Devices
THC Third Harmonic Current
THRC Third Harmonic Resistive Current
TSC Thermally Stimulated Current
VSI Voltage Source Inverters
xi

Abbreviations xii
Y2O3 Yttrium Oxide
ZnO Zinc Oxide

Symbols
α coefficient of non-linearity -
β shape parameter -
δxy life reduction factor %
γ location parameter hrs
θ scale parameter hrs
η(xi, yi) correlation function -
C(xi, yi) C - intercept function -
E1mA breakdown field V/cm2
F (i, n) percentage cumulative degradation %
F (t) cumulative density function -
f(t, β, θ, γ) probability density failure -
h(t) degradation-rate function -
IL total leakage current mA
IR resistive component of leakage current µA
i(t) instantaneous current mA
m(xi, yi) slope function -
Pr [tx ≥ ty] probability of reduced lifetime -
ti extrapolated degradation time hrs
tm measured degradation time seconds
tp time at which p% of varistor will be degraded hrs
WR resistive power losses W
χ20.01 chi-square distribution -
z likelihood test statistic -
xiii

To the one above all without whom nothing is possible.
To my wife Arlette and twin boys Emmanuel and Nathanael for
their continued love and support.
To Prof. Jandrell for his visionary leadership, words of wisdom and
unwavering support.
To Dr. Hove for his participation in this project.
To Dr. Paul for advices and encouragements.
To all that may have assisted in any way possible...
xiv

Chapter 1
Introduction
1.1 Background Theory
Modern electrical or power systems increasingly experience harmonic-distortion as a
result of continuous growth in the use of non-linear loads [1, 2]. Power system harmonics
have since been reported to be one of the fastest rising power quality disturbances
encountered in recent years [3, 4]. On the other end, overvoltage protection in electrical
systems nowadays consists of essential practice given the high cost of equipment involved,
as well as for the purpose of ensuring service reliability.
Over the last three decades, metal oxide varistors (MOVs) have proven to be quite a pop-
ular and efficient protection option available against lightning or switching surges. The
effectiveness of varistor arresters could mainly be attributed to the following qualities:
non-linear current-voltage (V − I) characteristic; high energy absorption capabilities;
and relatively fast surge clamping mechanism [5, 6].
However, the long-term stability of MOVs, which is critical to the performance of these
surge protective devices (SPD), remains somewhat dependent on the environmental
(electrical or physical) conditions in which these devices may be subjected to operate
under. The loss of stability often referred to as degradation or ageing is reported to be
one of the most common causes of MOV failure [7, 8].
Electrical Degradation results from long-term operation of varistor devices under ac or
dc voltage[9, 10], as well as from high magnitude of surge currents discharged through
these protection units [11, 12]. The degradation phenomenon is manifested in terms of
measurable changes in electrical (decrease in the coefficient of non-linearity, decrease in
the reference voltage, increase in the degradation rate, V − I shift, increased clamping
1

Chapter 1. Introduction 2
voltage. . . ) or physical properties (reduced double schottky barrier. . . ) of varistor
arresters [13, 14].
The prevalence of harmonic-producing loads or power electronics equipment in modern
electrical circuits has paved the way to the inevitable operation of MOV-based arresters
in ac circuits and systems with distorted voltage. Therefore, the performance reliability
and the stability of MOVs operating under the above described condition is worthy of
investigation.
1.2 Problem Statement
Recent studies conducted in this field suggested that harmonic distortion in the applied
voltage to MOV-based arresters cause the third harmonic current (THC) component of
the leakage current to increase, and thus introducing errors in the THC-based condition
assessment of these devices. Although the influence of voltage harmonics on the acceler-
ated loss of stability or degradation of MOV-based arresters is intuitively not expected,
field experience suggest that similar MOV units will unexpectedly fail at different times
and for several well documented causes. The one cause of accelerated failure that has
not been considered or explored in this field is the long-term effect of voltage and current
harmonics on performance reliability and electrical stability, and hence the useful life of
MOV-based surge arrester units. Since the continuous operation of MOV units under
fundamental ac voltage and temperature results in the decrease of the Schottky barrier
interface or the intergranular regions. It is therefore important to establish whether or
not harmonic voltage components embedded on the applied voltage, and temperature
will on the long run significantly increase the pace or reduce the time at which the
Schottky barrier is overcome, and consequently accelerating the electrical degradation
process. Thus the following fundamental research question: Will voltage and/or current
harmonics accelerate the degradation of MOVs under long-term distorted ac supply?
1.3 Scope of the Study
This study firstly entails the physical implementation of accelerated degradation test of
low voltage ZnO-based surge arresters, at elevated voltage and temperature with and
without an injection of harmonic voltage components from an external source of harmon-
ics. Secondly, the scope of this study extends to the statistical analysis and comparison
of the following parameters: the mean time to degradation (or mean life) based on the
reliability function and the probability of reduced time to degradation or failure between

Chapter 1. Introduction 3
two Weibull probability distributions; the frequency or rate of degradation based on the
failure rate functions; the electrical stability of these ZnO overvoltage components based
on the non-linear coefficient, the reference voltage and the shift in the V − I charac-
teristic curve; the high-frequency protection voltage based on the clamping voltage; the
resistive component of the total leakage current before and after injection of harmonics.
Therefore, this study is aimed at attaining the following broad and specific objectives:
1.3.1 Broad Objective
The broad objective of this research study is to analyse the probability of accelerated
degradation of MOV-based surge arresters under long-term distorted ac voltage supply
conditions.
1.3.2 Specific Objectives
The specific objectives of this study consist of the following:
1. To evaluate the non-linearity coefficient of MOV samples subjected to accelerated
with and without harmonic-distortion.
2. To analyse the degradation rate of MOV samples subjected to accelerated ac degra-
dation with and without harmonic-distortion.
3. To examine the behaviour of the clamping voltage of MOV samples subjected to
accelerated degradation with and without harmonic-distortion.
1.4 Significance of Accelerated Degradation under Harmonic-
Distortion
Over the last three decades, MOV-based surge arresters have been effectively used to
mitigate or reduce the risk of insulation failure in power systems, as a result of high
amplitude induced voltage and currents that may originate from switching or lightning
surges. Therefore, production stalling and subsequent economical and financial impli-
cations that may arise as a result of insulation breakdown in power systems depend
somehow on the health condition and performance of MOV-based surge arresters under
both steady-state and transient operation conditions.
Just as MOVs are important components in electrical networks, power electronics devices
consist of efficient and cost-effective means of providing control and switching of electrical

Chapter 1. Introduction 4
loads in power systems. However, the drawback in this switching technique remains the
flow of non-linear currents which interact with the system impedance, and thus causing
the system voltage to be distorted. Under inevitable harmonic-distortion conditions,
risk prevention of insulation failure in power systems requires in-depth knowledge and
understanding of the reliability of MOV-based surge arresters operating under distorted
system voltage.
Accelerated electrical degradation of MOV arresters subjected to distorted ac system
voltage at standard operating temperature shall therefore imply the probability of re-
duced life expectancy or time to degradation, and significant loss of electrical stability
of these overvoltage devices. The probability of reduced life expectancy measures the
reliability of these devices and the shift of the V − I characteristic curve indicates the
loss of electrical stability.
The practically implemented electrical degradation of MOV-based surge arresters under
the influence of temperature and voltage, such as undertaken in this study, provides the
best possible and available representation technique of arrester’s useful life deterioration
under continuous ac or dc conduction. Therefore, accelerated degradation can be logi-
cally evaluated in terms of statistical comparison of the average or mean time to electrical
degradation and the average rise in the resistive current component of two populations
of ZnO arrester devices. Fundamentally, the mean time to electrical degradation and the
increase in the resistive leakage current for ZnO arresters imply the following physical
significances:
1.4.1 The Time to decrease the Schottky Barrier Height
The mean time to electrical degradation is associated to the time corresponding to
increased number of charge carriers in the varistor microstructure, sufficient to overcome
the intergranular regions and thus leading to the decrease in the schottky barrier height.
1.4.2 The Biasing Effect of Voltage Harmonics
The rise in the resistive current component through ZnO devices when harmonics are
present in the voltage stress has been well documented in the literature. The relatively
shorter life expectancy of ZnO arresters when subjected to distorted ac voltage stress,
such as observed in this study, has paved the way for the fundamental understanding of
the effect of voltage harmonics on the varistor microstructure. Therefore, the time to
degradation, the electrical stability and other electrical measurements observed in this
study consist of reasonable manifestation of the physical changes that may have taken

Chapter 1. Introduction 5
place in the microstructure of ZnO arrester populations. The reduction in the time to
the occurrence of the described physical changes in the microstructure of ZnO arresters
poses a significant threat to the reliability of power systems, as the shorter the time to
degradation, the quicker the electrical degradation process.
1.5 Overview of the Study
Chapter 1 introduces the relevance of MOV-based overvoltage protection and harmonic-
distortion in modern power systems. The potential risk of accelerated degradation asso-
ciated with varistor-based SPDs subjected to long-term and continuous operation under
harmonic-distortion conditions is highlighted. The extent at which, the underlined prob-
lem in this study is approached, is discussed in this chapter. Before concluding on this
chapter, the pertinence and the significance as well as the layout of this report are
discussed.
The second chapter of this study commences with a survey of major causes, aggravating
factors and typical symptoms of electrical degradation or ageing associated with MOV
arresters. A review of problematic interaction between varistor SPDs and power sys-
tem harmonics is also undertaken, followed by the physics or mechanisms of electrical
degradation. Chapter 2 concludes on the following:
• The inaccuracies and lack of practical implementation for many of the techniques
suggested in a bid to extract the resistive component of the total leakage current;
• The application of the accelerated degradation test, at elevated voltage and tem-
perature, as a viable technique to simulate electrical degradation of MOV-based
surge arresters;
• The appropriate application of the Weibull probability distribution in the analysis
of electrical degradation or failure;
• The gap in the knowledge of the effect of voltage harmonics on the acceleration of
electrical degradation of varistor arresters.
Chapter 3 presents a description of the varistor samples used, the experimental works
undertaken and the measurement conditions of the electrical parameters required in
this study. The performance conditions of the V − I characteristic test and the high-
frequency test, before and after degradation are indicated. The set-up of the accelerated
degradation procedure as well as the systematic measurement of the degradation or

Chapter 1. Introduction 6
failure times and the leakage current are also discussed. This chapter paves the way to
the analysis of electrical degradation based on the measurements obtained.
Chapter 4 introduces the application of the Weibull probability distribution on the
analysis of the degradation times. The assessment and determination of the average
values of the V − I characteristic, the coefficient of non-linearity, the reference voltages
and the clamping voltages. This chapter concludes on the following:
• The comparative behaviour of the PDF and CDF patterns of the degraded ZnO
arrester populations;
• The probability of accelerated time to degradation for arrester populations sub-
jected to harmonic distortion;
• The accelerated rate or frequency of degradation for arrester populations subjected
to harmonic distortion;
• The accelerated loss of stability for arrester populations subjected to harmonic
distortion.
• The Influence of degradation under distorted voltage on the clamping voltage
behaviour.
Chapter 5 investigates the impact of voltage harmonic content in the applied stress
on the resistive component of the total leakage current, and consequently on electrical
degradation of MOV-based surge arresters. This chapter concludes on the contribution of
voltage harmonics to the net biasing voltage effect, which results on the resistive current
being increased, hence the electrical degradation of MOV arresters. The fundamental
and the third harmonic resistive current (THRC) are proven to be the most dominant
current components in the resistive current. The fundamental concept of accelerated
electrical degradation with respect to the microstructure behaviour of ZnO devices is
also discussed.
Chapter 6 concludes the study on the basis of the results obtained and discussed in
chapters 4 and 5. The recommendations pertaining to further research opportunities in
this field of study are also provided.
1.6 Conclusion
The efficient and reliable coexistence between power electronics devices and MOV-based
surge arresters in modern power systems, justifies the basis of further knowledge on

Chapter 1. Introduction 7
probable accelerated electrical degradation, of these overvoltage protective units, under
harmonic-distortion conditions. Therefore, the performance reliability and the electrical
stability of MOV-based arresters subjected to continuous operation under harmonic-
distortion and environmental temperature are important contribution to the current
knowledge and applications of ZnO arrester devices.

Chapter 2
Literature Review
2.1 Introduction
In this section, a survey of studies pertaining to the fundamental causes and multiple
symptoms or characteristics of electrical degradation or ageing, as applicable to MOV-
based surge arresters, is undertaken. The state of knowledge associated to the interaction
between varistor arresters and power system harmonics is equally discussed. A brief
description of statistical and probabilistic approaches to electrical degradation analysis
is also highlighted, followed by a review of the major theories and principles that support
the mechanisms or physics of electrical degradation in MOV arresters.
2.2 Electrical Degradation of Varistor Arresters: Causes
and Symptoms
Electrical degradation of varistor arresters is generally caused by the discharge of high-
amplitude surge or impulse currents and by long-term exposure to continuous ac or dc
current conduction [9]–[12]. Environmental conditions such as heat, humidity or radi-
ation, are reported to be contributing factors or favouring agents to the degradation
phenomenon [10, 13, 14]. Therefore, electrical degradation or ageing fundamentally
requires a trigger action, which is generally known as the primary cause, to which ac-
celerating or aggravating factors is usually associated. The electrical characteristics or
symptoms associated to electrical degradation in MOVs are inevitably studied in con-
junction with the standard developed techniques of artificially inducing or causing this
form of degradation phenomenon.
8

Chapter 2. Literature Review 9
2.2.1 High Amplitude Surge Currents
High amplitude surge currents generally result from switching and lightning transients.
The following studies made use of standard lightning impulse wave generators to induce
degradation on MOV arresters:
1. Sargent, Dunlop and Darveniza [11] used standard 8/20µs impulse, at rated surge
current of zinc oxide varistor samples involved, to study the effects of both single
and multiple surge currents on the degradation of metal oxide arresters. The
following observations are made:
• Both single and multiple pulses are capable of causing changes in electrical,
physical and the microstructure of the MOVs.
• Severe degradation is encountered in case of multiple pulse currents being
discharged through the MOV arresters.
This work seems to be focussed on the amplitude and number of pulse currents
as the major factor responsible for physical and electrical changes observed, as
well as for the development of additional phases and the formation of localised hot
spots in the microstructure of the MOV samples. However, for similar number
and magnitude of pulse currents applied at a constant time between successive
activation, different degrees of MOV defects or rather degradation observed could
be attributed to several other factors clearly not considered in this study.
2. De Salles, Martinez and de Queiroz [10] applied a set of standard 8/20µs impulse
currents to similar MOV arresters at the following environmental or surface tem-
perature conditions: room temperature or 20o C; 60o C and 80o C. The amplitude
of the surge currents used are of the following values: 10 kA, 15 kA, 20 kA and
30 kA. The electrical ageing of the arrester devices was monitored on the basis
of measured changes in the watt losses, which best fitted the logistic probability
distribution. The Boxplot Minitab statistical software tool was invoked to evalu-
ate the confidence intervals and the mean values of the measured parameter under
different surface temperature conditions considered in this study. The following
observations are made:
• Similar watt loss pattern is noted at amplitudes close (10 kA and 15 kA) to
the rated surge current discharge of the samples at the temperature of 80o C
and for the same number of impulses.
• Increasingly higher watt loss pattern is observed at much higher amplitudes
(20 kA and 30 kA) to the rated current discharge of the samples at the
temperature of 80o C and for the same number of impulses.

Chapter 2. Literature Review 10
• For each pulse amplitude discharged through the samples, the highest watt
loss for 10 kA and 30 kA amplitude is measured at the highest surface tem-
perature.
These findings seem to confirm that the amplitude level of the surge current,
discharged through MOV devices, is the main trigger of electrical degradation.
However, the major benefit of this work resides on the fact that it tends to complete
the work presented in [11], in the sense that the contributing effect of environmental
temperature condition, in which arrester devices are subjected to, is demonstrated
to be an aggravating factor to the ageing process.
3. Vasic et al [15] subjected two different types of varistors, amongst other available
overvoltage protection units, to a thousand 8/20µs impulses. Varistor samples used
in this study consisted of: 10 mm and 14 mm diameter size, with rated ac value of
230 V for each. The rated surge current withstand capabilities were 2.5 kA and 4.5
kA, respectively. The degradation process is measured on the basis of the change
in the voltage-current (V − I) characteristic curve, the voltage-resistance (V −R) characteristic curve and the varistor breakdown or reference voltage (V1mA).
These measurements are obtained after every hundred pulse currents. A Statistical
analysis was conducted on the obtained data and the following conclusions are
drawn up:
• An increase in varistor activation results in an increase of the varistor resis-
tance and the breakdown voltage value.
• The V −I characteristic of varistor seems to drift towards the high conduction
region as the number of activation increases.
• The rate at which the V − I characteristic drifts towards the high conduction
region appears to be quite low, and this could be translated in a small change
of the coefficient of non-linearity (α).
The major contribution of this study is founded on the fact that previous pulse
current discharges do not necessarily cause drastic change of the non-linearity
coefficient of MOV devices. Furthermore, high varistor resistance and breakdown
voltage observed could be attributed to polarisation phenomenon, which in many
cases is described as a manifestation stage of degradation [16, 17]. However, the
pulse currents used in this study are rated amplitude transient currents, which
sum up this work as an attempt to investigate the effects of several cumulative
pulse currents of rated amplitude discharged on MOV arresters. The contributing
effect of temperature is completely overlooked on the basis that it is likely to be
pronounced when degradation results from dc or ac continuous conduction.

Chapter 2. Literature Review 11
4. Nahm [18] investigated the ageing characteristics of Er2O3 doped PrO1.83−ZnOvaristors with the aid of a multi-surge current generator, capable of producing
standard 8/20 µs impulse currents in various amplitudes. The content of the
Er2O3 additives used in the study was 0.5 mol% and 2.0 mol%. The time be-
tween three successive impulses of similar magnitude was two minutes, whereas ten
minutes transition time are conceided each time a higher magnitude triggering is
conducted. At respective content of Er2O3, the following quantities are measured
before and after surge degradation at various amplitude levels: the current-density
curve (E−J); the breakdown field (E1mA/cm2); the non-linear coefficient at differ-
ent (V − I) curve regions; the clamping voltage (Vc); and the clamp voltage ratio
(kc = Vc/V1mA). The following observations are made:
• PrO1.83 − ZnO varistor samples doped with 0.5 mol% of Er2O3 exhibited
small variation of the E–J characteristics in the breakdown region, whereas
those doped with 2.0 mol% of Er2O3 exhibited large variation in the break-
down region.
• PrO1.83−ZnO varistors with 0.5 mol% content of Er2O3 show small variation
in the %∆E1mA/cm2 and %∆α as opposed to those with 2.0 mol% content.
• The clamping voltage of PrO1.83−ZnO varistors doped with 0.5 mol% content
of Er2O3 increased in the range of 272–324 V/mm for surge currents of 5–50
A, and 544–640 V/mm for surge currents of 0.4–1.8 kA. For 2.0 mol% content
of Er2O3, The clamping voltage increased in the range of 365–510 V/mm for
surge currents of 5–50 A, and 670–930 V/mm for surge currents of 0.4-1.8
kA.
• The clamp voltage ratio of PrO1.83 − ZnO varistors doped with 0.5 mol%
content of Er2O3 increased in the range of 1.65–1.97 for surge currents of
5–50 A, and 2.22–3.17 for surge currents of 0.4–1.8 kA. For 2.0 mol% content
of Er2O3, the clamp voltage ratio increased in the range of 1.56–1.84 for surge
currents of 5–50 A, and 1.92–3.13 for surge currents of 0.4–1.8 kA.
For the purpose of Nahm’s study, an impulse generator is used to induce degrada-
tion and to subsequently observe the clamping characteristics of the varistor de-
vices. A dc wave generator was also used to monitor the stability characteristics of
arresters involved. The findings obtained in this study showed that PrO1.83−ZnOvaristors doped with 0.5 mol% content of Er2O3 prove to be more stable than those
doped with 2.0 mol% content of Er2O3. The high clamping characteristic is associ-
ated with high content of Er2O3 in PrO1.83−ZnO varistors. Therefore, it clearly
emerges out of this study that the stability and clamping characteristics of MOV

Chapter 2. Literature Review 12
arresters are important performance parameters of MOV-based arresters. Further-
more, excellent stability behaviour of MOVs may not necessarily be associated to
good clamping characteristics.
5. Tsukamoto [19] investigated the degradation mechanism of MOV surge arresters
as a result of 4/10 µs, 8/20 µs and 10/350 µs impulse waves. The change in the
varistor voltage point (∆V1mA) recorded after impulse application was therefore
measured against the impulse charge transfer. The impulse current distribution
across the edge and centre parts of varistor samples was conducted using the spot
electrode method. Therefore varistor arresters having a diameter between 32-74
mm and a height between 3-36 mm were used in this study. The following findings
are obtained:
• For a 10/350 µs single shot the change in the varistor voltage started to occur
at the charge transfer of 0.2 C/cm2 and rapidly changed to -10 % above 0.35
C/cm2.
• For a 4/10 µs and 8/20 µs, the change in the varistor voltage is recorded
at much lower charge transfer of 0.03 C/cm2 and reached -10 % above 0.1
C/cm2.
• The spot electrode method showed that for steep waveforms such as the 4/10
µs and 8/20 µs, the drop in varistor voltage is high on the edge. This implies
higher impulse current distribution on the edge of MOV samples.
• The change in varistor voltage in terms of the number of shots indicated that
for a positive applied impulse, the varistor voltage is continuously decreased
until saturation is reached (no change despite increase in number of shots).
For a negative applied impulse, the varistor voltage continuously increases.
These phenomena could be attributed to the reported increase of interstitial
zinc ion concentration near grain boundary and the damage of the bismuth
oxide in grain boundary which causes reduction of resistance.
The most important contribution of this work rests on the high decrease of varistor
voltage mostly across the edge as a result of higher steep impulse wave current
distribution in this region of MOV arresters. This finding basically attempts to
provide fundamental understanding of the degradation mechanism as a result of
high-frequency and high amplitude surge currents.

Chapter 2. Literature Review 13
2.2.2 Continuous ac or dc Current Conduction
Continuous ac or dc current conduction result from long-term exposure of MOV arresters
to dc or/and power-frequency voltages. The following studies made use of dc or 50 Hz
ac sine wave voltage generators to induce degradation on varistor arresters:
1. Eda, Iga and Matsuoka [9] used laboratory prepared ZnO samples of 14 mm di-
ameter and 1.8 mm thickness to study the effect of dc and ac voltage bias, and
that of temperature biasing on thermal runaway or degradation. The V − I char-
acteristics of the arresters is measured using a dc constant current supply ranging
from 1µA to 1 mA. The capacitance and dielectric properties are measured at 1
VRMS at frequency range of 500 Hz to 1 MHz using a capacitance bridge, and the
bias voltage for capacitance dependence was assessed at 1 kHz in the range of 0 to
100 V/mm. The thermally stimulated current (TSC) is measured in quartz tube
by changing the ambient temperature at a rate of 0.333oK/s with no bias voltage.
The following are observed:
• Asymmetrical change in the V − I characteristic of ZnO ceramics is caused
by applied dc bias.
• Symmetrical change in the V − I characteristic of ZnO ceramics is caused by
applied ac bias.
• A decrease in the capacitance and an increase in the dielectric loss in the
low-frequency region after dc and ac biasing.
• A TSC is observed in ZnO ceramics after dc biasing.
• Both asymmetrical and symmetrical changes in the V − I characteristic of
ZnO ceramics can be attributed to the deformation of the schottky barrier.
The V − I characteristic, the capacitance and the dielectric loss are used in this
study as basic degradation symptoms of MOV devices subjected dc and ac continu-
ous conduction. Therefore, the findings obtained suggest that dc or ac conduction
can each effectively cause varistor arresters to reach degradation or end of life.
However, the degradation symptoms or characteristics produced are mainly de-
pendant on the nature and the time of biasing voltage applied to MOV arresters.
The operating temperature appears to be an important factor in this process.
2. Zhou, Zhang and Gong [20] studied the degradation phenomena of low voltage
ZnO varistors caused by dc biasing on the basis of the V − I characteristic and
the capacitance-voltage (C − V ) measurement. The ZnO samples are therefore
subjected to dc bias at the temperature of 140 oC for 120 hours of operation. The

Chapter 2. Literature Review 14
magnitude of the dc bias was set at 0.75 V1mA. The V − I characteristic is used to
analyse the stability of ZnO varistors against dc bias, and the C − V relationship
served to estimate the barrier height and the depletion width before and after dc
degradation. The complex-capacitance plane analysis is also invoked to investigate
the impact of dc degradation on deep bulk traps of low-voltage ZnO varistors. The
following observations are made:
• The change in V − I characteristic implies an increase in the leakage current
and a decrease in the reference voltage after degradation.
• The leakage current increases with the biasing time, and this could be inter-
preted as stability measurement of ZnO devices against biasing, as suggested
in [21]. The following relationship is therefore applied:
IL = IL0 + k · t1/2 (2.1)
Where: IL is the leakage current at biasing time t, IL0 is the leakage current
at t = 0, k is the coefficient of stability or the degradation rate expressed in
µA/h.
• The decrease in the barrier height and the depletion width after degradation
could be explained in terms of the defect structure model proposed in [22, 23].
• The properties of the deep bulk traps change after degradation, and the
decrease in the relaxation time is due to the fact that trapped electrons are
easily released from the deep bulk trap.
These findings confirm the observations made in [9], as far as dc biasing and the
schottcky barrier are concerned. While the V − I characteristic as well as the
leakage current are proven to be important measuring parameters which reveal
the stability of MOV arresters. The biasing time and the magnitude of the bias
voltage, together with the operating temperature consist of major triggering and
aggravating factors of dc degradation process, respectively.
3. Nahm [24] applied dc bias or stress to investigate the effect of Er2O3 additives on
the microstructure, and consequently the electrical properties and the degradation
behaviour of ZnO − Pr6O11 − CoO − Cr2O3 − Y2O3 −Er2O3. The electric field-
current density (E − J) characteristics, the breakdown field E1mA/cm2 and the
leakage current density at 0.8 E1mA/cm2 are systematically measured to achieve
the objectives of this study. The non-linearity coefficient is also assessed within the
following range of the current density: 1.0 mA/cm2 - 10 mA/cm2. The following
relationship is applied:

Chapter 2. Literature Review 15
α =1
logE2 − logE1(2.2)
Where: E1 and E2 are electric fields at leakage current density of 1.0 mA/cm2 and
10 mA/cm2, respectively. The dc stress applied consisted of four continuous con-
ditions: 0.85E1mA/115oC/24h; 0.90E1mA/120oC/24h; 0.95E1mA/125oC/24h and
0.95E1mA/150oC/24h. The degradation rate was determined using equation 2.1.
The following results are obtained:
• The addition of Er2O3 content shift the E − J characteristic curve towards
the lower field strength.
• The breakdown field increases with an addition of Er2O3 content to the
varistor ceramic microstructure. This could be attributed to the decrease
in the average grain size.
• The non-linearity coefficient increases with an increase of Er2O3 content.
• Excellent stability is observed at 1.0 mol % content of Er2O3.
These findings demonstrate the improved stability of varistor devices as a result
of Er2O3 oxide additives doping. Therefore the higher the breakdown field and
the coefficient of non-linearity, the lower the leakage current and the coefficient of
stability or degradation rate. Furthermore, since the (V − I) characteristic change
in the slope is temperature dependant[25], the measure of the stability coefficient
of a varistor device is always measured at specific operating temperature.
4. Wang, Tang and Yao [26] used ac degradation characteristics to test the effect of
mol % content of Nd2O3 additives on the electrical properties of low-voltage Zinc
Oxide varistor ceramics. Therefore varistor ceramics with 0; 0.03; 0.06; 0.09 and
0.12 mol % content of Nd2O3 are degraded with continuous ac stress of 1.0 V1mA
magnitude, at 125oC for 24 hours. The V − I characteristic, the non-linearity
coefficient α, the varistor voltage V1mA and the coefficient of stability k are thus
evaluated. The C − V characteristic is also used to determine the barrier height
and the depletion width. The following findings are made:
• The V − I characteristic of varistor ceramics with Nd2O3 content show more
linear response in the breakdown region.
• The varistor voltage increases with an increase in Nd2O3 content. This can
be attributed to the decrease in the average grain size.
• The non-linearity coefficient increases with an increase of Nd2O3 content.
• The leakage current decreases with an increase in Nd2O3 content.

Chapter 2. Literature Review 16
• The coefficient of stability decreases with an increase in Nd2O3 content.
The major contribution of this study lies on the improved stability of MOV ar-
resters when the content of Nd2O3 additives is increased. However, the shortcom-
ing is that the effect of Nd2O3 additives on the clamping characteristics is not
known.
5. He et al [27] studied the influence of Y2O3 on ac degradation or ageing character-
istics of high voltage gradient ZnO varistors. These varistor devices are subjected
to continuous ac stress of 0.85V1mA at 135oC for a duration of 168 hours. The
Y2O3 doping content was as follows: 0.00 mol %; 0.50 mol %; 0.75 mol % and 1.00
mol %. The E − J characteristic curve, the breakdown field and the non-linear
coefficient, before and after ac stress, are measured for varistors with and without
Y2O3 content. Similarly, the leakage current measured at 0.75E1mA before and
after the stress are used to assess the coefficient of stability. The C − V charac-
teristic curve and the double barrier schottcky parameters were also determined.
The following findings were observed:
• The most obvious increase in the breakdown field is observed in samples with
1.00 mol % content of Y2O3- doped varistor devices.
• The leakage currents for all the samples at different content of Y2O3 increased
after ac stress. However, the most significant increase is observed for 0.50 mol
% of Y2O3.
• The lowest coefficient of stability is found to be 0.081µA /h, which is higher
than that of the samples with 0.00 mol %, and is associated to samples doped
with 0.75 mol % of Y2O3 content.
• The barrier height reduction after ac degradation is quite pronounced for
samples doped with Y2O3 content or high voltage gradient samples, with the
largest variation being recorded at 0.50 mol% content of Y2O3.
These findings indicate that high voltage gradient varistor samples, produced by
doping of traditional varistors with different mol % content of Y2O3 additives,
are not stable given their relatively high degradation rates. Therefore, this study
evaluated the benefit of producing high voltage gradient varistor arresters on the
basis of operational stability under continuous 50 Hz ac voltage stress. However,
the reasons behind the negative impact of the oxide additives, used in this work,
are not clearly revealed in this study.

Chapter 2. Literature Review 17
2.3 Power System Harmonics and Varistor Arresters
The increasing demand of high efficiency converters and other power electronic compo-
nents, for improved control and switching of modern electrical and electronic systems
or equipment, has paved the way for the continued presence of distorted voltage and
currents in circuits involving these devices. The interaction between MOVs and power
quality problems, such as harmonics, is becoming more and more pronounced in modern
power systems [28]. Therefore, the use of MOV-based arresters for overvoltage protec-
tion of non-linear devices inevitably implies direct exposure to distorted voltages and
currents. The current state of knowledge pertaining to the interaction between MOV
arresters and power system harmonic disturbances, is centred on measurement errors
associated to leakage current-based condition assessment of varistor devices operating
in circuits with distorted voltage:
2.3.1 Leakage Current - based Condition Assessment
Leakage current measurements are the most commonly applied technique mostly used in
the field [14, 29], to assess the health condition of arresters. However, when the supply
voltage contains harmonic-distortion, this method suffers considerable shortcomings.
The following studies describe the various aspects of this assessment methodology:
1. Hinrichsen [30] used a computer program to simulate the characteristics of both re-
sistive and third harmonic components of the total leakage current, obtained under
continuous operating voltage and temperature, in order to study the high risk of
measurement errors and therefore misinterpretations of results, that could be asso-
ciated to on-line monitoring of gapless arresters in ac transmission or distribution
circuits. The following findings are made:
• Electrical ageing or degradation of MOV arresters can be detected by mea-
suring the resistive component or power losses. A phase-correct voltage signal
is required for this purpose or some compensation circuit to do away with the
capacitive current component.
• The third harmonic component (THC) displays similar voltage dependence
to the resistive component of the total leakage current. Despite its low am-
plitude, the THC can be used as an indirect measurement of the resistive
current. This characteristic forms the basis of its prominent use in the indi-
rect method of health assessment of MOV-based arresters.
• The THC to resistive current ratio changes with temperature and the presence
of third harmonic in the voltage causes the THC to increase.

Chapter 2. Literature Review 18
• For a 3% third harmonic with phase angles between 0o to 360o superimposed
in the applied voltage across a MOV arrester, the highest measurement error
in the THC is found to be between 120o and 270o.
• Adequate stability verification procedures during development and running
production should be encouraged over a high risk of measurement errors and
costly on-line monitoring.
These findings highlight the technical challenges related to practical implementa-
tion of leakage current measurement based on-line monitoring of MOV arresters
in ac transmission and distribution circuits. However, the long-term stability of
varistor arresters, is such an important factor to the reliability of the protected sys-
tem, and should be monitored either permanently on-line or off-line at regular time
intervals. Stability verification during production, such as suggested in this work,
does not mean that the MOV devices will not undergo degradation. Furthermore,
environmental factors in which arresters may be operating could fundamentally be
different from the conditions during production tests.
2. Yan, Wen and Yi [31] incorporated both compensation and harmonics analysis
methods into a computer-based numerical harmonics approach. In this technique,
an analogue-digital (A/D) card leakage current monitor, which basically consisted
of a surge counter with a built-in current transformer, is implemented to measure
the MOV leakage current. This measured current signal is then digitally processed
to offset all capacitive harmonic components present in the leakage current. The
resistive harmonic components thus extracted are used to determine the total
resistive current of the arrester. Therefore, the leakage current, the peak resistive
current and the power loss of MOV arresters were measured under the following
range of applied voltage: 0.6 kV to 2.3 kV . The following findings were observed:
• The resistive component of the leakage current is very small (about 2%) of the
leakage current, and can quickly rise with an increase of the applied voltage.
This quantity can indeed provide the working condition of arresters.
• Higher order resistive currents tend to increase while the fundamental compo-
nent remains low when MOV arresters are either electrically or/and thermally
degraded.
• Numerical harmonics analysis method provide overall monitoring of MOV
arresters since the energy absorbed and degradation are measured.
The observations made in this work confirmed the need for monitoring resistive cur-
rent of MOV since the characteristics of this current component provide good indi-
cation of arresters’ condition. However, the numerical harmonics analysis appears

Chapter 2. Literature Review 19
to be theoretically sound but quite difficult and expensive technique to physically
implement on line. It requires sophisticated capacitive compensation circuits in or-
der to eliminate capacitive current components, and some digital signal processing
(DSP) methods capable of evaluating higher order resistive harmonic components.
3. Jaroszewski, Kostyla and Wieczorek [32] simulated varistor equivalent circuit in
the Matlab software environment in order to study the effect of voltage harmonics
content on the leakage current-based diagnosis technique. Therefore, for a number
of simulation runs consisting of several magnitudes of the supply voltage and odd
harmonic voltage components, the following findings were made:
• The THC is found to be present in the current response of varistors irrespec-
tive of the applied voltage being higher or lower than the varistor maximum
continuous operating voltage (MCOV).
• The THC is visibly noticed in the varistor current spectrum when higher
order harmonics are present in the applied voltage of lower magnitude than
the varistor MCOV.
• Significant increase of the THC is observed when the harmonics content in
the supply voltage increase.
• High current conduction through varistor devices result from operation under
supply voltage of magnitude higher than the varistor MCOV.
• Higher harmonics present in the supply voltage may cause measurement errors
and therefore misdiagnosis of the actual condition of varistor arresters, since
an increase of the THC cannot necessarily be associated to ageing of varistor
blocks.
The findings resulting from this work consist of an important foundation for con-
dition monitoring and performance analysis of MOV arresters, operating in ac
distorted transmission or distribution circuits. Harmonics in the system voltage
are identified to be negatively influencing leakage-based condition assessment of
varistor devices. However, this work did not attempt to quantify such an influence
of harmonics on the monitoring of arresters.
4. Karawita and Raghuveer [33] used the generally constant phase shift between the
capacitive and the resistive components of the total leakage current to investigate
the effectiveness of the phase shift criteria-based diagnosis of MOV arresters. In
this method, the phase shift (φc1,t1) between the fundamental component of the
capacitive and that of the total leakage current is increased from zero until the peak
value of the fundamental capacitive current ( ic1) is reached. The ic1 is therefore
subtracted from the peak value of the fundamental total leakage current ( it1)

Chapter 2. Literature Review 20
to obtain the peak value of the remaining resistive current component ( ir). The
phase shift between the generated ir and the ic1 is compared to that obtained using
compensation techniques. The phase shift method and compensation techniques
were therefore applied to the following samples: one unaged and two aged samples
of 10 kV of MCOV; two new station arresters of 36.5 kV MCOV and one new
polymeric distribution arrester of 15.3 kV of MCOV. The following findings were
made:
• The magnitude of the resistive current generated in this method closely com-
pares with that obtained using compensation technique, and therefore can be
used to diagnose the condition of the arrester. This is mostly applicable to
one unaged and two aged samples of 10 kV of MCOV, since the mean phase
shift was constant.
• Step change in the phase shift, such as observed in the testing of the two new
station arresters, renders the use of this technique difficult. For one degree
change in the phase shift between ir and ic1 , the percentage error in ir is
7.8%.
• The presence of harmonics in the applied voltage can possibly affect the peak
of the resistive current, and therefore making this diagnostic technique quite
problematic.
The findings made in this work suggest that the phase shift technique could be
possibly used to diagnose the condition of MOV arresters. However, this method
suffers a great deal of inaccuracy in the determination process of the resistive
current, as a result of the assumption that all harmonic capacitive currents are
embedded in the resistive current component, and the interference of voltage har-
monics with the peak value of the resistive current.
5. Abdul-Malek, Yusof and Yousof [34] proposed the modified shifted current method
(MSCM)-based algorithm, in order to extract the resistive current component from
the measured total leakage current of MOV arresters, and hence to assess the
condition of MOVs. The MSCM-based algorithm was therefore implemented in
LabView data acquisition software program with functional block diagrams, before
being transferred on a metal oxide surge arrester intelligent monitoring system
(MOSAIMS). This technique was used to monitor the leakage current of an aged
Ohio Brass 12 kV, 5kA MOV arrester. The results obtained were compared to
those resulting from conventional compensation techniques conducted on the same
arrester sample. The following observations were made:

Chapter 2. Literature Review 21
• The total leakage current obtained from the MSCM technique proves to be
dominantly resistive.
• The waveforms obtained from the MSCM show good overlap with those re-
sulting from conventional compensation method. This indicated a good agree-
ment between the two techniques.
• A deviation of about 5% is however observed between the two waveforms
(MSCM and compensation techniques), which could be associated to mea-
surement errors and harmonic effects.
The findings described in this work demonstrate the capability of the MSCM
technique to successfully subtract the capacitive component, by injecting a quarter
cycle shifted leakage current. The extracted resistive current can thus be obtained
from field measurement. However, this method just as many others remain prone
to noise, harmonics and other interferences.
6. Khodsuz, Mirzaie and Seyyedbarzegar [35] investigated the suitability of the max-
imum value of the fundamental and third harmonic resistive currents as well as
that of the fundamental capacitive current, in the condition monitoring of MOV
arresters. Equivalent circuit of surge arrester has been modelled, using the electro-
magnetic transient program-alternative transient program (EMTP-ATP) software
package, in order to study the effects of voltage fluctuations, third harmonic volt-
age components, overvoltage and ageing on the accuracy of the afore-mentioned
current indicators. The signal processing analysis aspect has been achieved using
the Matlab package. The following findings were made:
• For an increase or a decrease of 5% of the nominal voltage, irregular varia-
tions of the maximum fundamental and third harmonic resistive currents are
observed, whereas a 5% variation is observed in the maximum fundamental
capacitive current in both cases of 5% increase or decrease of the nominal
voltage. This implies that the fundamental capacitive current is the best
indicator of voltage fluctuation.
• The ratio of the fundamental capacitive current measured during overvoltage
condition to normal rated value could be used as an indicating criterion of
overvoltage during surge arrester current measurement.
• The presence of third harmonic voltage in the supply voltage causes the third
harmonic resistive current indicator to increase, while the fundamental resis-
tive and capacitive currents are less sensitive to the presence of harmonics in
the supply voltage.
• Both the maximum fundamental and third harmonic resistive currents can
be effective in indicating ageing or degradation of MOV arresters.

Chapter 2. Literature Review 22
These findings highlight the effectiveness of the fundamental capacitive current
component as an indicator of voltage fluctuations and overvoltages. The sensitivity
of the third harmonic resistive current, to the presence of higher voltage harmonics
in the supply, is also validated in this work. The fundamental resistive current is
also proven to be able to serve as an indicator of degradation along with the third
harmonic resistive current.
7. Shulzhenko et al [36] studied the influences of higher-frequency voltage signals,
generated in the switching process of single-phase voltage source inverter (VSI) and
three-phase full bridge pulse width modulation (PWM) inverter, on the operation
of MOV arresters. In the case of single-phase VSI, the installed MOV arresters
were subjected to a square wave whose fast Fourier transform (FFT) revealed
the presence of high-frequencies ranging from 16.7 kHz-0.5 MHz. For the three-
phase PWM inverter, arresters were subjected to a triangular wave containing
high-frequencies ranging from 15-60 kHz. The following findings were obtained:
• In both cases of inverters used, the total power losses are estimated to be
less than the maximum average power of the MOV devices in use. The total
power losses are estimated using the sum of the watt losses resulting from
all the components (fundamental and harmonics). This could be written as
follows:
W = Wo +2
T
T2∫
0
wi (t) dt (2.3)
Where: W is the average or resistive power losses, Wo is the dc power loss, T
is the period of the switching frequency and wi(t) is the instantaneous power
loss.
• The capacitive currents obtained at 50 Hz and 13 kHz as well as the V − Icharacteristics of the MOV arresters could be accurately represented using
equivalent circuit model of MOVs.
• In the long-term operation of MOV arresters, if the higher-frequency voltage
signals are high enough as the operating voltage of MOV arresters, resis-
tive current components will dominate the capacitive component and cause
thermal instability of the varistor devices.
These findings suggest amongst others that long-term degradation of varistor de-
vices, subjected to ac fundamental embedded with noise frequencies, is possible
unless such frequencies (noise) are of high enough magnitude as the operating
voltage of these varistors.

Chapter 2. Literature Review 23
2.3.2 Other Reported Effects
Several other claims on the effects of power system harmonics on varistor arresters are
discussed in this section:
1. The IEEE C62.48TM [37] relative to the interactions between power system dis-
turbances and SPDs suggests the following:
• SPDs with inductive and capacitive components may be prone to harmonic-
caused failure.
• SPDs will react to harmonic voltages in a similar fashion they react to any
voltage. Therefore, if the threshold voltage of the SPD device is exceeded,
conduction may take place which could eventually shorten the life of these
SPDs.
• The response of SPDs to noise will depend on the design of the SPD and the
magnitude and frequency of noise pulses.
These suggestions consist of precautionary measures based on the generally doc-
umented effects of power system harmonics on devices with similar components
(inductance and capacitance). Furthermore, no analytical study provides evidence
of the effect of continuously applied harmonic-distortion, embedded on the funda-
mental voltage component, on the degradation of SPDs.
2. Macanda and Cantagrel [38] studied the influence of surge arresters on ac distri-
bution networks. Four type 1 ac SPDs, which basically consisted of three air-gap
and one gapless arresters, were therefore tested in three-phase, three or four-wire
ac circuit configurations. The surge currents applied to these SPDs were 15 x 8/20
µs with a peak value of 25 kA and 5 x 10/350 µs of the following values: 0.1, 0.25,
0.5, 0.75 and 1.0 p.u of the SPD’s nominal peak value (25 kA). The gapless or
MOV-based arrester was connected in series with a gas discharge tube (GDT) on
a three-phase, three-wire circuit. The following observations were made:
• No follow current was experienced during the entire test sequence related to
MOV-based or gapless arrester technology.
• The MOV-based arrester did not show any bad influence or disturbances on
the power quality of the three-phase, three-wire ac circuit.
This work seems to suggest that bad ac voltage quality resulting from the operation
of type 1 ac SPDs during surge conditions are mainly caused by follow currents.

Chapter 2. Literature Review 24
This therefore implies that MOV-based arrester technology cannot create bad in-
terference with ac circuit during surge conditions, in which they are connected,
since they are immune of follow currents. However, the focus of this work was
specifically oriented on the performance-related issues ac type 1 arresters during
surge conditions. The stability of these arresters during power-frequency operation
which could, on the long run, impact on the performance of these arresters was
completely overlooked.
The gap in the knowledge of ZnO arrester devices operating continuously in electric net-
works with distorted voltage remains the probability of accelerated electrical degradation
or ageing of MOV-based surge arresters.
2.4 Statistical and Probabilistic Analysis of Electrical Degra-
dation
The useful life of MOV arresters is usually defined as the time required for these surge
protection components to reach degradation or end of life [9]. Therefore lifetime pre-
diction of MOV arresters is of utmost importance to the reliability of power systems.
Since varistor arresters are meant to behave like solid insulators [39], statistical methods
recommended to the analysis of insulator’s life could therefore be applied to varistor
arresters. The following statistical techniques are proposed:
2.4.1 Weibull and Log Normal Statistical Distribution
The following studies demonstrated the common applications of the two or three-parameter
Weibull model in the analysis and prediction of the degradation or failure times:
1. Cygan and Laghari [40] conducted a review of the methods and models applied to
analyse and predict lifetimes of solid insulators subjected to electrical and thermal
stresses. The following findings are reported:
• The most popular technique to accelerate the ageing or degradation of an in-
sulating material is to subject the material at higher voltage and temperature
than normal operating conditions.
• The Weibull and log normal statistical distributions are most commonly ap-
plied to analyse life deterioration of solid insulating materials.

Chapter 2. Literature Review 25
• The cumulative damage theory forms the basis of multi-stress ageing and
therefore provides better approximation of the degradation phenomena of
electrical insulation.
2. The IEEE 930TM [41] provides fundamental guidelines related to the application of
the two or three-parameter Weibull analysis of insulation life data (times to degra-
dation or degradation voltage). The following recommendations are proposed:
• The percentage cumulative degradation of the Weibull cumulative density
function (CDF ) is obtained using the Ross approximation’s expression [42,
43, 44]:
F (i, n) ≈(i− 0.44
n+ 0.25
)× 100 (2.4)
Where: F (i, n) is the percentage cumulative degradation, i = 1, 2, ...r is the
rank number of degradation times and n is the number of samples subjected
to accelerated degradation test.
• The adequacy or the goodness of fit of the CDF obtained is verified using the
correlation factor η, which should be higher or equal to the Weibull critical
coefficient value, provided in figure 2.1. The correlation factor is given by the
following equation:
η (xi, yi) =
∑(xi − x) · (yi − y)√∑
(xi − x)2 ·∑
(yi − y)2(2.5)
Where: η (xi, yi) is the correlation function, xi = ln[− ln
(1− F (i,n)
100
)], yi =
ln (ti), x =∑xir , y =
∑yir . ti is the degradation time and r is the number of
degraded samples.
• For large degradation data (r > 20) the shape and scale parameters of the
Weibull distribution are estimated using the least squares regression method.
This method implies the determination of the slope and the C-intercept,
prior to the estimation of the Weibull parameters. The shape parameter β is
expressed as:
β =1
m (xi, yi)=
∑(xi − x)2∑
(xi − x) · (yi − y)(2.6)
Where: m (xi, yi) =∑
(xi−x)·(yi−y)∑(xi−x)2
, is the slope function. The scale parameter
is obtained using the exponential of the C-intercept function. This yields the
following expression:
θ = exp c = exp [y −m (xi, yi) · x] (2.7)

Chapter 2. Literature Review 26
Figure 2.1: Critical coefficient values[41].
Where: C = y −m (xi, yi) · x, is the C-intercept function.
The proposed recommendations form the backbone of the Weibull statistical anal-
ysis. On the basis of the obtained parameters, the probability density function
(PDF ), the unreliability or (CDF ) as well as the reliability and the hasard func-
tions of the degradation times of the Weibull distribution can be determined.
These probability functions provide reasonable means or tools of analysis and pre-
diction of the failure or degradation rate and the survival or reliability, and more
importantly of the lifetime estimates of the samples involved.
3. Meshkatoddini [45] used Monte Carlo algorithm in order to statistically study the
conduction phenomenon in thin ZnO varistors. The following observations are
made:
• The number of conducting ZnO grains that provide the current path between
the electrodes of thin varistors fits a log normal statistical distribution.

Chapter 2. Literature Review 27
• The turn on point or the conduction threshold voltage and the non-linearity
coefficient of the ZnO varistors can be controlled by a small fraction of non-
conducting grains.
From these observations, it could be deduced that the increase in the number of
ZnO conducting paths of varistor could be associated to the device conduction,
which is associated to the probability of degradation. Therefore, the Log normal
statistical distribution could also be applied to degradation studies.
2.4.2 Probabilistic Analysis
1. Amicucci, D’Elia and Gentile [46] included the physical behaviour of a metal ox-
ide material in order to improve the mathematical model based on probabilistic
arguments, and aimed at estimating the failure probability of MOVs as a result of
lightning-related stresses. The study shows that:
• The obtained model enables the expected life of MOV, expressed as the mean
time to failure (MTTF ), to be estimated in terms of the number of lightning
flashes that influence the protected circuit.
2. Brown [47] conducted a comprehensive study on the degradation phenomena of
MOV-based arresters. Amongst other observations highlighted in the study, the
following are noted:
• The lifetime of a MOV can be expressed in terms of the Arrhenius rate equa-
tion:
t = to · exp
[Ea − f(V )
RT
](2.8)
Where: t is the time to degradation, to and R are constants, Ea is the activa-
tion energy, f (V ) is the applied voltage and T is the absolute temperature.
• The failure rate of MOVs under normal operation can be estimated by the
Arrhenius model, if the most significant stress is thermal and the expected
mean life (ML) is logarithmically related to the inverse of temperature.
2.5 Physics of Electrical Degradation in MOVs
The degradation symptoms of varistor arresters could be regarded as manifestations
of change process in the microstructure of these protective devices. The relationship
between the fundamental causes and symptoms of electrical degradation could be well

Chapter 2. Literature Review 28
understood in terms of the microstructure behaviour of varistor arresters. The follow-
ing studies have attempted to provide better understanding of electrical degradation
mechanism:
1. He et al [48] studied the mechanisms of ZnO varistor degradation under long-
term ac voltage operation and temperature. Fifteen varistors of 18 mm diameter
were therefore subjected to accelerated degradation test under the following major
conditions: ac applied voltage ratios (AV R = Vmax/V1mA): 1.072; 1.042; 1.004;
0.984 and environmental temperatures of 20 oC and 45 oC, and lastly for a q- value
of 0.75 at the following temperatures: 90 oC, 110 oC, 130 oC, 150 oC and 170 oC.
A watt loss versus time characteristic of the varistor samples in use is measured
and plotted to analyse the degradation process. The following observations were
made:
• For AV R >0.9 and environment temperature T >160 oC, a steep rise of the
watt loss is observed until thermal breakdown takes place. This is gener-
ally attributed to low intergranular barrier (usually observed in poor quality
varistor devices), which at higher operating voltage and temperature, will
cause high resistive current and therefore high watt loss able to overcome the
varistor thermal dispersion capability. This will subsequently lead to thermal
breakdown of the device.
• For AV R >0.9 and an environment temperature of T ≤ 100oC, a steep rise
of the watt loss is observed, followed by a slow down period characterised by
small increases in the watt loss, before a sharp rise in the watt loss magnitude,
which eventually leads to thermal breakdown of the device. The steep rise in
the watt loss can be attributed to the decrease of the schottky barrier height as
a result of recombination of Zn interstitials near the schottcky barrier interface
and the Zinc holes, under the influence of applied voltage and temperature.
The resistive current will therefore increase leading to increase in the watt
loss. The small increase in the watt loss could be explained by the presence of
Zn interstitials in the schottky barrier which slows down the decrease process
of the barrier height. The sharp increase in the watt loss result from further
decrease of the barrier height to a stage that prompted resistive current to
increase leading to thermal breakdown of the device.
• For AV R >0.9 and temperature T >100 oC, a rise in the watt loss is firstly
observed, followed by a decrease before reaching a stable value. The decrease
in the watt loss could be attributed to the thermal treatment phenomenon
which causes the neutral atoms to separate in the intergranular region, and
thus leading to the increase of the barrier height.

Chapter 2. Literature Review 29
These findings fundamentally suggest that the three basic outcomes of accelerated
degradation test on varistor devices could be understood in terms of the schottky
barrier height, the migration of zinc interstitials and the thermal treatment of the
varistors.
2. Zheng et al [49] studied the space charge characteristics of aged or degraded ZnO
varistors of 10 mm diameter and 1.4 mm thickness. These samples were degraded
using 8/20 µs current impulse of the following peak amplitudes: 50 x 50 A; 100 x
50 A; 200 x 50 A; 100 x 100 A; and 200 x 200 A. The V − I test was conducted on
both degraded and non-degraded samples, followed by the TSC and pulse electro-
acoustic (PEA) tests. The following findings were made:
• The higher the number of pulses, the higher the increase in the varistor tem-
perature which causes more space charges and traps to be developed in the
varistor microstructure and consequently a decrease in the schottky barrier
height. This results in a drift of the V − I characteristic curve towards the
high conduction region.
• An increase in the peak amplitude of the impulse current wave has a tendency
to generate more available space charges and traps, thus reducing the schottky
barrier height to enable a drift of the V − I characteristic curve towards the
high conduction region.
• The TSC results confirm the migration of interstitial zinc ions which prompts
the decrease of the schottky barrier height, hence the drift of V − I charac-
teristic curves towards the high conduction region.
These findings mainly attributed the drift V − I characteristic curve of degraded
ZnO varistors, which is a key symptom of degradation or ageing, to the creation
of space charges and traps followed by the migration of interstitial Zinc ions, as a
result of successive high amplitude pulses discharged through these devices. This
migration results in the decrease of the schottky barrier height.
3. He et al [50] studied the ageing mechanism of 25 individual grain boundaries in ZnO
varistor arresters using microcontact measurement. Prior to this technique, ZnO
varistor samples are degraded using accelerated degradation test at the following
voltage and temperature: 0.85V1mA/135 oC. The ageing time intervals consisted
of 0, 24 and 48 hours. The microcontact measurements were conducted using a
probe station, an optical high magnification microscope, and coaxial probes with
0.5 µm replaceable tip equipped with two probe positioners. These probes are
manually adjusted by the positioners to make electrical contact with the deposited
microelectrodes. A digital source meter was connected with the probes’ coaxial

Chapter 2. Literature Review 30
cables to determine the V –I curves of individual grain boundaries. The ageing or
degradation rates of individual grains were also evaluated using equation 2.1. The
following observations were made:
• Based on the leakage current measured in the pre-breakdown region, the
degradation characteristics of individual grain boundaries could be either a
monotonic ( the V − I curve gradually and monotonously move towards the
high conduction region with ageing time) process. In this case, the leakage
current continuously increases while the non-linear coefficient decreases. The
width of the non-linear region of the V − I curve is significantly reduced
with ageing time. The breakdown voltage of this grain boundary is in the
proximity of 3.02 V.
• The degradation characteristics of individual grain boundaries could also be
a non-monotonic process ( the drift of the V − I curve towards the high
conduction region is not continuous given a recovery phenomenon in the pre-
breakdown region). In this case, the leakage current decreases then increases
before eventually decreasing. However, the non-linear coefficient decreases.
The breakdown voltage of this grain boundary is in the proximity of 3.31 V.
• Different grain boundaries may follow different ageing or degradation process
as the ageing test time increased.
• Given the non-uniform ageing characteristic of individual grain boundaries,
the degradation rates of different grain boundaries are consequently non-
uniform and range from 10−7 to 10−3 A.h−1/2. This basically implies that
the degradation mechanism of a bulk ZnO varistor sample is the synthetical
effect of several millions of individual grain boundaries with different ageing
rates.
These findings fundamentally suggest that the degradation mechanism could be
explained in terms of the migration of zinc interstitials and oxygen desorption at
the interface of the grain boundaries. On the other end, the migration of negatively
charged defects in grain boundaries towards the interface and the absorption of
oxygen could form the basic mechanism of electrical properties recovery.
2.6 Conclusion
Degradation or ageing of MOV-base surge arresters results either from high-magnitude
impulse currents discharged through these devices, or from long-term continuous expo-
sure to ac or dc voltages. The degradation phenomenon generally upsets the stability

Chapter 2. Literature Review 31
and performance qualities of MOV arresters, which could be clearly observed in terms
of various defective symptoms that may affect the electrical characteristics (Shift of the
V − I curve, increase of the leakage current, decrease of the non-linearity coefficient...)
of these transient overvoltage protection units.
The reported studies related to the development of new oxide additives, in a bid to
improve the electrical characteristics of varistor arresters, have indicated the use of ac-
celerated degradation or ageing tests as reliable alternative to simulate long-term failure
of MOV arresters under continuous ac or dc applied voltage and environmental temper-
ature in few hours.
The current state of knowledge in this field is centred on diagnostic or monitoring tech-
niques of the resistive leakage current, for the purpose of correct interpretation or eval-
uation of real health condition of arresters in service.
The leakage current of MOV arresters such as described in the literature consists of the
resistive and capacitive current components. The resistive component, which consists of
the fundamental and odd harmonic currents, is reported to be the most reliable indica-
tor of degradation given its proportionality to the power losses or heat generated inside
arrester devices. However, the magnitude of the resistive current component is shown
to be sensitive to the environmental temperature as well as to harmonic disturbances
embedded on the fundamental applied voltage across varistor arresters. Harmonics on
the system voltage are reported to cause the magnitude of the resistive current to in-
crease further. This ultimately raises the question of suspected influence of harmonics
on accelerated degradation, and not only on leakage current-based diagnostic techniques
as currently reported.
The deterioration of electrical properties of varistor arresters during ageing consists of
visible outcome of a complex microstructural mechanism, which may be approached in
terms of statistical and probabilistic analysis.
The gap in the knowledge of electrical degradation of MOV-based arresters is found to be
on the probability of harmonic-induced accelerated degradation of these surge arrester
devices on the long-term basis, given the well reported influence of harmonic frequencies
on the resistive leakage current, which is relied upon for degradation diagnosis purpose.

Chapter 3
Experimental Work
3.1 Introduction
A description of the ZnO varistor samples as well as an account of the experimental
work conducted in this study is provided in this chapter. The measurement techniques
of desired electrical characteristics or properties of the varistor devices such as: the V −Icharacteristic test performed on the samples before and after accelerated degradation
test, the 50 Hz ac accelerated degradation test, with and without external harmonic-
distorting load, as well as the high-amplitude impulse test are also discussed. The pur-
pose of the tests conducted, standard procedures and expected measurement outcomes
such as recommended by various standards are also highlighted in this part of the study.
3.2 Description of the Varistor Samples
The arrester samples, used in this work, consisted of 360 commercially-sourced low-
voltage ZnO varistor disks from three leading manufacturers. The ZnO disks are coated
with epoxy resin and the terminals are formed of tinned copper leads. These varistor
arresters are assigned the following codes: BE; YW and RL sample groups, for identifi-
cation purposes. The diameters of the varistor samples, the rated reference or varistor
voltage (both at ac and dc), the clamping voltage, the maximum nominal discharge
current and the MCOV of the sample groups are provided in table 3.1. The following
alphabetical letters: W and H are further assigned to the identification codes described
above in order to indicate whether or not accelerated degradation is conducted with or
without an external source of harmonics. The letter W is used to designate the samples
subjected to accelerated degradation without external source of harmonics. However,
in this condition the increased voltage applied across varistor samples during the test,
32

Chapter 3. Experimental Work 33
Table 3.1: Electrical Specifications of the sample groups
Samples Diameter V1mAac V1mAdc Vc Peak Current (8/20 µs) MCOV
BE 20 205 170 340 8 130
YW 20 200 170 340 6.5 130
RL 20 228 184 340 6.5 130
Unit mm V V V kA V
and the resulting distorted current flow cause harmonic distortion in the mains voltage.
Therefore, BEW01 referred to sample number 1 of the BE group is subjected to accel-
erated degradation without external harmonic source. On the other end, the letter H
is used to designate the samples subjected to degradation test with an external source
of harmonics. BEH referred to samples from BE group degraded in a presence of an
external harmonic source connected to the system.
3.3 V − I Characteristic Test
The IEEE standard C62.62TM [51] recommends the watt loss and leakage current tests
be conducted as part of the characteristic or performance tests on arrester devices.
Yet, the varistor’s watt loss, the leakage current and the reference voltage consist of
various aspects of the V − I characteristic curve [29]. Therefore, the V − I test consists
of a reliable alternative technique to measure these important electrical characteristics
of varistor arresters under normal operating condition. Furthermore, the V − I curve
could be used to obtain the non-linear coefficient of the varistor arresters, and could
consequently be relied upon to provide good indication of the health condition of MOV
arresters in the context of degradation [9, 26].
3.3.1 Procedure
For the purpose of this test, a variable ac source is used to supply a 4-pin ac/dc bridge
rectifier chip (RS 204), through a transformer. The varistor arrester under test is con-
nected across the dc terminals of the ac/dc bridge converter. The TBM 811 digital
ammeter, able to provide current readings from micro-ampere scale, is connected in
series with the device under test to monitor the current. The Escort EDM-82 digital
voltmeter is connected across the MOV arrester to provide voltage readings. The cur-
rent measured in the milli- ampere scale consisted of: 10−3, 10−2, 10−1, 1, 10 and 100.
The V − I test set up is shown in figure 3.1. The V − I measurement points obtained
at room temperature are used to plot the V − I characteristic curves (plotted with Mi-
crosoft Excel 2010) for the samples BEW, BEH, YWW, YWH, RLW and RLH, before

Chapter 3. Experimental Work 34
and after ac accelerated degradation test. The V − I measurements obtained for all the
sample groups, before and after ac degradation test, are shown in Appendix A.
Figure 3.1: V-I test set up
3.3.2 Measured Parameters
The V − I readings obtained are used to plot the characteristic curve of the samples,
using the graphic plot tool of the Microsoft Excel package. The reference voltage V1mAdc
is read off the voltmeter when the ammeter reads a current of 1 mA. The coefficient of
non-linearity is obtained using relationship 2.2. Degradation on varistor samples could
therefore be observed on the basis of the V−I shift towards the high current region, which
should be confirmed in terms of a decrease in the dc reference voltage V1mAdc and the
coefficient of non-linearity [24, 26]. Although the change in the reference voltage should
be higher than 5% [52], in order to confirm degradation, this study rather considered at
least 5% change (∆V1mAdc ≥ 5%) in the reference voltage. The mean values of the V −Imeasurement points can be used to plot the mean V − I curve of the samples before

Chapter 3. Experimental Work 35
and after degradation. In this context, the percentage change in the mean value of the
reference voltage measurement point, before and after degradation, could be determined
as follows:
4 V 1mAdc =
(Vb1mAdc − Va1mAdc
)Vb1mAdc
× 100 (3.1)
Where: 4V 1mAdc is the percentage change in the mean reference voltage point, Vb1mAdc
is the mean reference voltage before degradation, and Va1mAdc is the mean reference
voltage after degradation.
3.4 Accelerated Degradation Test
The IEEE C62.34 [53] and the IEEE C62.11TM [54] both recommend the accelerated
degradation or ageing test be conducted on MOV arresters, as means of simulating long-
term performance characteristics of these SPDs. This test is based on the Arrhenius life
test model, and is performed at elevated voltage and temperature over a period of
time. The simultaneous action of both thermal and electrical stresses is very common
in real life cases [40]. Therefore, the electro-thermal ageing test, such as referred to,
is basically meant to simulate real life insulation degradation or ageing process [55],
by extrapolation of the facts gathered to long-term degradation under normal service
voltage and temperature conditions.
3.4.1 Procedure
This test is achieved by combining the following components: the heat chamber or oven,
the 50 Hz ac supply voltage, the ac voltage controller (harmonic source), the harmonic
filter unit (when harmonics are not required), the high-temperature conductors and the
data acquisition units.
1. The Oven or Heat Chamber:
Since temperature consists of an important aggravating factor of MOV-based surge
arresters, the oven or heat chamber forms the most critical piece of equipment
in the implementation of accelerated degradation test. This chamber provides
a source of thermal stress, which in real life condition, could originate from the
environment in which MOV arresters may be continuously subjected to. For short

Chapter 3. Experimental Work 36
term degradation results, the magnitude of the thermal stress provided to the
samples is accelerated using Arrhenius model. The oven used in this work consisted
of the Nabertherm P330 which is described in [56]. This heat chamber is made up
of 9 settable heating programs or courses (P1-P9), and 40 time-segments divided
in groups of 10 blocks(A-J). Every block consists of 4 time-segments: 2 ramp and
2 holding times. Therefore, a heating program or course may consist of one or a
combination of many time segment blocks. The temperature versus time diagram
of the heating program adopted in this study is indicated in figure 3.2. This figure
shows that the temperature used for this degradation test is T2B = 135oC, which
is held at time t2B (second time-segment of block B) set for 96 hours. The ramp
and holding (transition) times are each set for 5 minutes. The waiting or OFF
time refers to the time-period before the first ramp time. This basically resulted in
t2B being reached approximately 30 minutes (including temperature fluctuations
time) after the oven start up time. To ensure that this test process ends after
96 hours, all temperature and time-segments beyond T2B and t2B are assigned a
zero value during programming. This ensures that after the set test time is over,
the oven will switch off and enters the cooling mode. The oven is independently
supplied from a three-phase source.
Figure 3.2: Heating Program: Time vs Temperature
2. The 50 Hz ac Supply Voltage:
The 50 Hz ac supply voltage represents the ac field stress to which MOV de-
vices may be continuously subjected to in transmission or distribution circuits.

Chapter 3. Experimental Work 37
The combination of the heat chamber and the 50 Hz ac supply form the basis
of continuous electro-thermal ageing or degradation phenomena. The continuous
magnitude of the ac field stress provided is 85% of the sample breakdown voltage
(See table 3.1). The 50 Hz ac supply voltage is sourced from a 220/500 V step
up transformer which in turn is supplied from a variable ac voltage source. This
arrangement is made to provide electrical isolation and to maintain the variable
ac source at low voltage value. For the entire test period, the voltage stress en-
sured across the transformer output terminals is 85% of the ac reference voltage
(0.85V1mAac) for respective samples. This supply voltage system is time-controlled
using an electronic timer-unit set to trigger 30 minutes after the oven is set on.
All five conductors supplying ZnO samples are each terminated to the transformer
output via 250 V, 125 mA protective fuses. Therefore, when the current through a
ZnO device reaches a value beyond 125 mA, the fuse is blown out to safely isolate
the varistor device from the supply.
3. The External Source of Harmonics:
The external source of harmonics represents the source of harmonic disturbances
that may be affecting the 50 Hz applied voltage appearing across MOV devices.
This source of harmonics consisted of a triac-based ac voltage controller unit con-
nected across the secondary output terminals of the transformer. This unit is
made to control a dominantly resistive load of 83.3 kΩ. The firing angle of the
controller consisted of a potentiometer-based control knob, which is adjusted in a
manner that resulted in the applied voltage stress to the entire system be distorted
dominantly with the 3rd and the 5th harmonic frequencies, as well as other odd
harmonics such as the 7th and 9th.
4. The Data Acquisition System:
The data acquisition system consisted of 1×3-channel K5020 and two MT250 data
logger units, capable of recording voltages across each of the five varistor samples
in a sampling rate of 30 seconds. The data logging process is trigger as soon
as the voltage source is launched. This enabled us to distinguish the samples
that failed from those that manage to survive the process. The 2-channel TDS
1001B Tektronix digital scope is also used to monitor the applied voltage waveform,
while the 4-channel Rigol DS 1204B digital scope is utilised to capture the leakage
current signal in comma separate values (CSV) format. For this purpose, the

Chapter 3. Experimental Work 38
current signal is recorded through a 5/1 A current transformer (CT) together
with a current probe connected to the scope. The leakage current measurement is
provided in Appendix B.
5. High Temperature Conductors:
Each test run accommodated 5 varistor samples connected across terminal blocks,
which are mounted in parallel on a concrete platform. To reinforce the insula-
tion between the terminal blocks, the concrete platform is coated with a high-
temperature (750oF ) RTV silicone adhesive sealant. The connection between the
terminal blocks and the 50 Hz ac voltage source is made using 1.5 mm2 high-
temperature and single-core silicon conductors (Silflex), capable to withstand a
temperature of 180oC [57].
The connection arrangement of varistor samples across the terminal blocks inside the
oven is illustrated in figure 3.3, whereas the block diagram illustrating the connection
of the harmonic source in the test system is shown in figure 3.4.
Figure 3.3: Connection arrangement of Varistor Samples
In the event of harmonic source not being required, both the resistive load and the
varistor arresters inside the oven are supplied from the transformer output terminals,
through a single-phase harmonic filter (FN 2090) in an attempt to completely eliminate
harmonic distortion in the applied voltage stress. However, the conduction through
varistor devices at elevated voltage and temperature caused the applied voltage stress
to experience similar types of harmonic frequencies, as indicated above, yet at much
lower content or permissible levels [58]. The block diagram illustrating the connection

Chapter 3. Experimental Work 39
of single-phase harmonic filter in the test system is shown in figure 3.5. The complete
accelerated degradation test system used in this study is shown in figure 3.6.
Figure 3.4: Harmonic source connection
3.4.2 Measured Parameters
The failure or degradation times obtained as a result of this test are extrapolated to
time-values, corresponding to standard operation at 40oC, using the Arrhenius life ac-
celerating model described in [53, 54]. This is expressed in equation 3.2 below:
ti (hour) = tm × 2.5(T2B−40)/(10) (3.2)
Where: ti is the extrapolated degradation time-value, tm and T2B are actual measured
degradation time and applied temperature, respectively. The expression: 2.5(T2B−40)/(10)
is termed the accelerating factor. The degradation status of the samples is verified on
the basis of the following conditions:
1. Degraded Samples: tm ≤ t2B and 4V1mAdc ≥ 5%
2. Survived Samples: tm = t2B and 4V1mAdc < 5%
3. Spoiled Samples: tm < t2B and 4V1mAdc < 5%

Chapter 3. Experimental Work 40
Figure 3.5: Harmonic filter connection
Figure 3.6: Accelerated degradation test set up

Chapter 3. Experimental Work 41
For degraded and spoiled samples, the time to degradation pattern, recorded in the
data logger, is interrupted at given random time. This is shown in figure 3.7. However
the degradation or failure condition can only be confirmed after the V − I test is con-
ducted, at room temperature. For survived samples, the time to degradation pattern
recorded completes the full time cycle of the test process, and the V − I test proves to
be unsuccessful. This is shown in figure 3.8.
Figure 3.7: Degradation time pattern for failed or spoiled samples
Figure 3.8: Degradation time pattern for survived samples
The time-values obtained in equation 3.2 are important factors to the determination of

Chapter 3. Experimental Work 42
the scale and the shape parameters of the Weibull probability distribution, and subse-
quently the hasard or degradation rate, the survival or reliability and the probability
density functions of the varistor samples under harmonic distortion conditions. The
recorded breakdown times for the samples are provided in Appendix C.
3.5 Impulse Tests
The surge performance characteristics of varistor arresters can be studied on the basis
of standard combination waveform [53, 54]. This waveform consists of: 1.2/50 µs open-
circuit voltage and 8/20 µs short-circuit current. For the purpose of this test, the
clamping voltage of varistor samples before and after ac degradation test is studied.
3.5.1 Procedure
This test is performed using a combination impulse generator which consisted of: a 250
V ac variable source supplying a diode rectifier unit, through a 220/22 000 V step-up
transformer, 4 x 34.5 µF series-connected capacitor units, a dumping gap system, wave
shape components, high voltage (HV) probes and the 2-channel TDS 1001B Tektronix
digital scope.
The variable ac source and the step-up transformer serve to supply the diode rectifier
input. The high-voltage dc that results from the rectifier is used to charge up the
capacitors. The charging voltage across the capacitors is monitored using a 1000:1 HV
probe, which in turn is connected to a digital voltmeter.
The dumping gap system consists of a switch operated solenoid which is intended to
ensure complete discharge of capacitors to earth. The wave shape components consisted
of resistors and inductors connected across the capacitor units.
The Pearson coil, which is a high-frequency current transformer, was used to step-down
the current prior measurement using a current probe. An additional 1000:1 HV probe is
connected across the output terminals of the generator together with the sample under
test. Both the current and voltage are captured using a digital scope.
Each varistor sample is connected across the output terminal of the impulse generator,
and is subjected to 8/20 µs impulse currents ranging from 10 kA to 15 kA. The clamping
voltage is captured and subsequently measured on the scope’s screen. The set up of the
combination generator is shown in figure 3.9.

Chapter 3. Experimental Work 43
Figure 3.9: Impulse test set up
3.5.2 Measured Parameters
For the purpose of the impulse tests, the clamping voltage (Vc) parameter of the ZnO
varistor arrester samples is measured. The clamping voltage helps to indicate whether
or not the surge protection characteristic of varistor samples is affected as a result of
degradation. The test measurements obtained are provided in Appendix D.
3.6 Conclusion
The ZnO varistor samples used in this study are described in terms of their size and
electrical characteristics. The recommended experimental methodology applicable to
this study: the 50 Hz accelerated degradation test with and without an external har-
monic source, the dc V − I characteristic test and the high-frequency impulse test are
discussed. The various standards that provide the guidelines related to procedures and
expected measurement outcomes are also referred to in this chapter.
The V − I characteristic tests is conducted before and after degradation of the samples.
This test enables the following critical characteristics to be probed: the reference voltage
and the non-linearity coefficient. The 50 Hz ac accelerated degradation test is aimed

Chapter 3. Experimental Work 44
at simulating the long-term degradation phenomenon of varistor samples at different
content of harmonic distortion. The relevance of this test, as far as this study is con-
cerned, resides in the fact that the extrapolated time to degradation or life estimates of
varistor samples and subsequently the degradation rate can be statistically determined.
The impulse tests conducted serve to test the signs of degradation in terms of surge
protection characteristics, by studying the clamping voltage between varistor samples
degraded at different content of harmonic distortion.

Chapter 4
Analysis of Electrical Degradation
under Harmonic Distortion
4.1 Introduction
In this chapter, the probability of aggravated electrical degradation of ZnO arresters, as
a result of continuous operation under distorted ac voltage, is analysed using the three-
parameter Weibull statistical tool, given the failure-free characteristic of the distribution
across some time interval [59]. The scale and shape parameters of the degradation time
distribution obtained, in each of the arrester population observed, are estimated prior to
the determination of the hasard or degradation rate function, the survival or reliability
function as well as the PDF . The average values of the coefficient of non-linearity and
that of the clamping voltage for the varistor populations studied are also computed.
The hypothesis testing is applied, using the likelihood ratio test, in order to test any
possibility of equal estimated parameters between the distributions involved, which may
lead to similar probability functions. The probability of aggravated degradation, as a
result of increased harmonic currents during continuous exposure to distorted ac voltage
stress, is assessed using the mean life comparison test. Therefore, this chapter consists
of three case studies aimed at analysing the degradation time pattern of the BE, YW
and RL varistor arrester populations when subjected to acceleration degradation test
with and without external harmonics.
4.2 Weibull Plots and Probability Functions
Subsequent to the accelerated degradation test on ZnO arrester populations, the degra-
dation indicators such as described in section 3.4.2 are verified. This process enables the
45

Chapter 4.Analysis of Electrical Degradation under Harmonic Distortion 46
non-degraded (survived and spoiled) samples to be removed. The extrapolated times
as well as the percentage cumulative degradation of the arresters are determined using
equations (3.2) and (2.3), respectively. The data obtained from these equations can be
utilised to test the good fitness of the obtained distribution, using equation (2.4) as well
as figure 2.1. Therefore the CDF of the distribution can be plotted, and the probability
functions (Reliability and Degradation rate functions) can also be deduced, following the
estimation of the parameters, as described in 2.4.1. The block diagram of this process
is given in figure 4.1.
Figure 4.1: Block diagram of the Weibull Probability Analysis
4.2.1 Probability Functions and Electrical Degradation
Since electrical degradation of various populations of ZnO arresters is studied over a
determined period of time, and the recorded time to degradation fits the Weibull prob-
ability distribution. The density function of the time to degradation distribution is
modelled using the three-parameter Weibull. This is expressed as follows:
f (t, β, θ, γ) =β
θ·(t− γθ
)β−1
exp
(− t− γ
θ
)β; t > γ > 0 (4.1)
Where: f (t, β, θ, γ) is the PDF which represents the probability of electrical degradation
occurring at random time t within the defined time-interval. β is the shape parameter
of the distribution, θ is the scale parameter, and γ is the location parameter or the
minimum time to degradation of the distribution.
The PDF consists of a product of two functions: the hasard and the reliability functions.
The hasard function is used to indicate the frequency or rate at which electrical degrada-
tion in a studied population of ZnO arresters is taking place across a given time-interval.
This function can therefore be termed as the degradation rate function. It is expressed
as follows:

Chapter 4.Analysis of Electrical Degradation under Harmonic Distortion 47
h (t) =β
θ·(t− γθ
)β−1
; t > γ > 0, β > 0, γ > 0 (4.2)
Where: h (t) is the degradation rate function, expressed in failures per hour.
The reliability function is the complement of the CDF, and represents the probability of
survival of ZnO arrester components under the conditions subjected to. This is expressed
as:
R (t) = exp
(− t− γ
θ
)β; t > γ > 0, β > 0, θ > 0 (4.3)
Where: R (t) is the reliability function.
Therefore, the CDF or probability of electrical degradation of a ZnO arrester population
can be expressed as follows:
F (t) = 1− exp
(− t− γ
θ
)β; t > γ > 0, β > 0, θ > 0 (4.4)
Where: F (t) is the CDF or the probability of electrical degradation.
It is worth noting that higher probability of survival implies lower probability of degra-
dation, and consequently lower degradation rate. This therefore suggests that the prob-
ability of electrical degradation of a ZnO population can be analysed on the basis of the
probability functions.
4.2.2 Hypothesis Testing and Mean Life Comparison
The probability functions described in section 4.2.1 are dependent on the estimated pa-
rameters of the Weibull probability distribution. Therefore, equal estimated parameters
could lead to the possibility of equal probability functions, and in turn to similar degra-
dation behaviour. In this study, the hypothesis testing is applied to test any possibility
of equal reliability and degradation rate functions of the resulting Weibull distributions
(time to degradation with and without external harmonics). The following hypotheses
are formulated:
1. The null hypothesis (H0): f1 (t) = f2 (t) which implies: h1 (t) = h2 (t) and R1 (t)
= R2 (t), t ∈ [t1, tj ].

Chapter 4.Analysis of Electrical Degradation under Harmonic Distortion 48
2. The alternative hypothesis (Ha): f1 (t) 6= f2 (t) which implies: h1 (t) 6= h2 (t) and
R1 (t) 6= R2 (t), t ∈ [t1, tj ].
The likelihood ratio could be used as the statistic test of the hypothesis testing. In
order to favour the null hypothesis over the alternative one, the likelihood ratio should
be higher than the chi-square distribution(χ2)
distribution, at 0.01 significance level
with 1 degree of freedom (df) [60, 61]. Therefore, the statistic test is given as follows:
z = −2 ln
∏ji=1
β1θ1·(t−γθ1
)β1−1exp
[−(t−γθ1
)β1]∏ji=1
β2θ2·(t−γθ2
)β2−1exp
[−(t−γθ2
)β2] ≥ χ20.01 (4.5)
Where: χ20.01 is the chi-square distribution at 0.01 significance level.
In this case, electrical degradation analysis based on reliability function seeks to predict
and compare the mean life of two ZnO arrester populations. The mean life or the mean
time to degradation of a population or a system consists of an integral evaluation of the
reliability function [62, 63]. For acceleration degradation on a population or system, the
mean life or mean time to degradation is expected to be reduced. Therefore, the mean
life of arrester population subjected to accelerated degradation test, in the presence
of an external source of harmonics, is compared to that of similar arrester population
degraded without harmonics. The mean life is expressed as follows:
ML =
∞∫0
R (t) dt =
∞∫0
[exp
(− t− γ
θ
)β]dt (4.6)
Where: ML is the mean life of an arrester population.
For aggravated electrical degradation: ML1 >ML2, which implies that∞∫0
R1 (t) dt >∞∫0
R2 (t) dt.
ML1 and ML2 are the mean lives of ZnO arrester population degraded without and with
external harmonics, respectively. The time at which a certain proportion of ZnO arrester
population will degrade can be estimated by re-arranging equation (4.4). This yields
the following expression:
tp = θ[− ln
(1− p
100
)]1/β+ γ (4.7)
Where: tp is time at which p% of arresters will be degraded, and p is the proportion of
arresters.

Chapter 4.Analysis of Electrical Degradation under Harmonic Distortion 49
Therefore, the percentile or B-live test at 10%, 50% and 90% can be conducted to predict
the time at which p% proportion of arrester components are likely to degrade.
The time to degradation could also be expressed in terms of the corresponding reliability
value, in order to estimate the time reduction factor as well as the probability of time
reduction, at any given point on the reliability curve. This could be better observed in
terms of figure 4.2.
Figure 4.2: Time reduction at equal reliability Point
The time (tx) and (ty) can be obtained by re-arranging equation (4.4). This yields the
following: tx = θx (− ln q)1/βx +γ and ty = θy (− ln q)1/βy +γ. Therefore, at any reliabil-
ity value(q = 1− p
100
), the time reduction factor between similar arrester components
subjected to different content of external harmonics is given as follows:
δxy =txty
=θx (− ln q)1/βx + γ
θy (− ln q)1/βy + γ(4.8)
Where: δxy is the time or life reduction factor between time to degradation tx and
ty, θx and θy are respective scale parameters, βx and βy are shape parameters, γ is the
minimum life parameter, Rx (t) and Ry (t) are reliability functions, and q is the reliability
value.
The probability of time tx being greater than or equal to ty implies the probability of
reduced time to degradation between two distributions, which must be higher than 0.5
or 50%. This is expressed by the following probability condition [64]:

Chapter 4.Analysis of Electrical Degradation under Harmonic Distortion 50
Pr [tx ≥ ty] =
∞∫0
fy(t)Rx(t)dt>0.5 (4.9)
Where: Pr [tx ≥ ty] is the probability of reduced time to degradation, fy (t) is the PDF
and Rx (t) is the reliability function.
In case the conditional probability expressed in (4.9) is less than 0.5, this will imply that
the opposite statement expressed as: Pr [ty ≥ tx] = 1 -∞∫0
fy(t)Rx(t)dt >0.5 is therefore
true.
4.3 Case study 1: Analysis of BE Varistor Samples
In this section, the electrical behaviour of ZnO arrester samples, identified as BEW and
BEH group arresters, is analysed and compared on the basis of the V − I characteristic
curve and coefficient of non-linearity, the clamping voltage and the probability functions
of the time to degradation distribution obtained. The time-domain of the continuous
applied ac voltage stress across BEW samples is shown in figure 4.3.
Figure 4.3: Applied Voltage Stress BEW
The frequency components associated to this voltage are indicated in figure 4.4. The
level of harmonic components is found to be 1.89% for the 3rd, 2.5% for the 5th and
0.94% for the 7th (See Appendix B).
The time-domain of the continuous applied ac voltage stress across BEH samples is

Chapter 4.Analysis of Electrical Degradation under Harmonic Distortion 51
shown in figure 4.5, and the harmonic components associated to the voltage across BEH
samples are indicated in figure 4.6. The level of harmonic components is as follows:
6.24% for the 3rd, 5.58% for the 5th and 6.63% for the 7th (See Appendix B).
Figure 4.4: Frequency Components BEW
Figure 4.5: Applied Voltage Stress BEH
4.3.1 V-I curve and Coefficient of non-linearity
Based on the V − I measurements of the BEW and BEH varistor samples provided in
Appendix A, the following classification could be drawn out in terms of the conditions
specified in section 3.4.2. This is indicated in Table 4.1 below:

Chapter 4.Analysis of Electrical Degradation under Harmonic Distortion 52
Figure 4.6: Frequency Components BEH
Table 4.1: Classification of Tested BE Samples
BE Sample Group Degraded Survived Spoiled
BEW 27 30 3
BEH 37 18 5
The mean V −I characteristic of the degraded BEW and BEH samples, before and after
accelerated degradation test, can therefore be plotted and thus enabling the percentage
change for the mean V1mAdc of the BEW and BEH samples be determined using equa-
tion (3.1). The BEW and BEH mean V − I curves are shown in figure 4.7.
This reveals a percentage change for the mean V1mAdc of 10.80% for the BEW sam-
ples and 43.75% for the BEH samples. The coefficient of non-linearity could also be
determined on the basis of the mean V − I characteristic curves of the BEW and BEH
samples, by using equation (2.2). This yields the following: before degradation the mean
coefficient of non-linearity for BE samples is found to be 82, and after degradation this
coefficient is worked out to be 53, which represents 35.37% reduction for BEW samples,
and mean value of 15, which shows 81.71% reduction for BEH samples. These values are
indicated in table 4.2. Therefore, the BEH arrester components are proven to have their
stability characteristics significantly reduced as compared to the BEW components.
Table 4.2: Change in Reference Voltage and Coefficient of non-linearity (BE Samples)
BE Samples V 1mAdc (V) α ∆V 1mAdc (%) ∆α (%)
Non-degraded 176 82 - -
BEW 157 53 10.80 35.37
BEH 99 15 43.75 81.71

Chapter 4.Analysis of Electrical Degradation under Harmonic Distortion 53
Figure 4.7: Mean V-I curve BE Samples
4.3.2 Clamping Voltage for BE Samples
The surge protection characteristics tested on BE varistor samples upon the discharge
of peak surge currents, ranging between 10 kA and 15 kA, show the mean clamping
voltage of 0.4 kV for non-degraded samples, and a mean clamping voltage value of 0.5
kV for both BEW and BEH ZnO arrester samples. This is indicated in table 4.3.
Table 4.3: Clamping Voltages
BE Samples Clamping Voltage (V c) [kV]
Non-degraded 0.4
BEW 0.5
BEH 0.5
These values show that although the clamping voltage for degraded components is higher
than non-degraded, there is however no difference in terms of the clamping voltage value
of arresters subjected to higher or lower magnitude of harmonic content. The respective
clamping or protection voltages are shown in figures 4.8, 4.9 and 4.10.
4.3.3 Probability Functions of BE Samples
The accelerated breakdown time-points (ti) and the percentage cumulative degradation
F (i, n) obtained respectively from (3.2) and (2.3), are used to plot the CDF of the BEW

Chapter 4.Analysis of Electrical Degradation under Harmonic Distortion 54
Figure 4.8: Clamping Voltage BE Samples
Figure 4.9: Clamping Voltage BEW Samples
and BEH time to degradation probability distribution. This is shown in figures 4.11 and
4.12, respectively. The time-points, the percentage cumulative degradation as well as
the determination process of the distribution parameters are shown in Appendix C.
The correlation factors obtained for the BEW and BEH distributions, using equation
(2.4), are found to be: η1 = 0.958317 and η2 = 0.955857. It could be seen that the
obtained correlation coefficients are higher than the critical values shown in figure 2.1,
which is an indication of good fit to the Weibull probability distributions. Applying the
three-parameter Weibull probability distribution described above, the following param-
eters and functions are assigned to BEW samples: β1, θ1, γ1, h1 (t), R1 (t) and f1 (t).
Similarly, β2, θ2, γ2, h2 (t), R2 (t) and f2 (t) are also assigned to the BEH samples.
The shape and scale parameters obtained respectively from equations (2.5) and (2.6),

Chapter 4.Analysis of Electrical Degradation under Harmonic Distortion 55
Figure 4.10: Clamping Voltage BEH Samples
for BEW and BEH distributions are indicated in table 4.4. From the CDF graphs de-
scribed above, it could be shown that both distributions displayed the minimum time
to degradation or location parameter of 100.6 hours.
Figure 4.11: Cumulative Density Function BEW Samples
Table 4.4: Estimated Weibull Parameters of BEW and BEH distributions
Distributions β θ γ
BEW 0.98 4167.6 100.6
BEH 1.093 2746.5 100.6
Applying the likelihood ratio test described in equation (4.5) yields a value of z = 2.1460
which is less than the corresponding chi-square distribution value (See Appendix D) at
0.01 significance level(χ2
0.01 = 6.635). This therefore favours the alternative hypothesis,

Chapter 4.Analysis of Electrical Degradation under Harmonic Distortion 56
Figure 4.12: Cumulative Density Function BEH
and implies no possibility of similar degradation rate or reliability functions. The relia-
bility and degradation rate graphs are shown in figures 4.13 and 4.14, respectively. These
graphs indicate that BEH arrester samples show higher degradation rate and therefore
prove to be less reliable than BEW arrester samples across the observed time-interval.
The obtained PDF curves of the BEW and BEH arrester populations are also shown
in figure 4.15. This indicates higher density of degradation when higher harmonics are
present in the applied voltage.
The mean life of these arrester populations can be determined using equation (4.6). This
equation indicates that the mean life of BEW arrester population is found to be 4252.65
hours. On the other end, the mean life of the BEH arrester population is worked out to
be 2512.81 hours. This shows that arrester population degraded in the presence of an
external source of harmonics experienced 40.91% reduction in terms of their mean life
value, which is in agreement with the plotted curves of the reliability and degradation
rate functions of these respective ZnO arrester populations.
The results obtained from the percentile or B-live and the acceleration factor test con-
ducted on BE samples are indicated in table 4.5. These results show that for the same
observed proportion of arresters, the time to degradation for BEH arrester devices is
shorter than that of BEW arrester samples. The time reduction factor at 10%, 50% and
90% reliability can also be determined using equation (4.8). This shows that the time
ratio or life reduction factor, as obtained at indicated reliability points, is not uniform
and shows a decreasing trend. This therefore implies a non-uniform increasing trend of
the degradation rate.

Chapter 4.Analysis of Electrical Degradation under Harmonic Distortion 57
Table 4.5: Degradation times of p% Arrester Components
p% tp BEW [hour] tp BEH [hour] δxy (x = BEH, y = BEW)
10 519.99 451.04 0.87
50 2967.8 2064.6 0.70
90 9861.6 5991.4 0.61
Figure 4.13: Reliability curves BEW and BEH Samples
The probability Pr [t2 ≥ t1] is determined using equation (4.9). This yields 0.4107 or
41.07% probability of BEW arrester devices experiencing shorter degradation time than
BEH. Therefore, the probability of reduced degradation time for BEH arrester should
be: Pr [t1 ≥ t2] = 1 - Pr [t2 ≥ t1] = 0.5893 or 58.93%.
4.4 Case Study 2: Analysis of YW Varistor Samples
The electrical characteristics of the ZnO arrester population identified as YWW and
YWH are analysed and compared, on the basis of the V − I characteristic curve and
coefficient of non-linearity, the clamping voltage and the probability functions of the time
to degradation distribution obtained. The time-domain of the continuous applied ac
voltage stress across YWW samples is shown in figure 4.16. The frequency components
associated to this voltage are indicated in figure 4.17. The level of harmonic components

Chapter 4.Analysis of Electrical Degradation under Harmonic Distortion 58
Figure 4.14: Degradation rate curves BEW and BEH Samples
Figure 4.15: Probability Density Functions BEW and BEH Samples
is found to be 1.28% for the 3rd, 1.89% for the 5th and 0.72% for the 7th (See Appendix
B). The time-domain of the continuous applied ac voltage stress across YWH samples
is shown in figure 4.18, and the frequency components associated to the voltage across
YWH samples are indicated in figure 4.19. The level of harmonic components are as
follows: 9.8% for the 3rd, 6.9% for the 5th and 5.8% for the 7th (See Appendix B).

Chapter 4.Analysis of Electrical Degradation under Harmonic Distortion 59
Figure 4.16: Applied Voltage Stress YWW
Figure 4.17: Frequency Components YWW
4.4.1 V-I curve and Coefficient of non-linearity
The V −I measurements of both the YWW and YWH samples (See Appendix B) enable
the classification of the tested ZnO arresters be conducted on the basis of the conditions
described in 3.4.2. This is indicated in table 4.6.
Table 4.6: Classification of Tested YW Samples
YW Sample Group Degraded Survived Spoiled
YWW 36 11 13
YWH 47 6 7

Chapter 4.Analysis of Electrical Degradation under Harmonic Distortion 60
Figure 4.18: Applied Voltage Stress YWH
Figure 4.19: Frequency Components YWH

Chapter 4.Analysis of Electrical Degradation under Harmonic Distortion 61
The V − I characteristic of the degraded YWW and YWH samples, is plotted, and the
variation of the V1mAdc can thus be observed to be 40.49 % for the YWW and 65.64
% for the YWH samples. The mean V − I curve of these samples is provided in figure
4.20. The coefficient of non-linearity deduced from the plotted V −I characteristic yields
the following: before degradation the mean coefficient of non-linearity for YW samples
is found to be 48, and after degradation this coefficient is worked out to be 14, which
represents 70.83% reduction for YWW samples, and mean value of 12, which shows
75.00% reduction for YWH samples. These values are indicated in table 4.7. It can be
observed that the stability of YWH arrester samples is further compromised.
Figure 4.20: V-I curve YW Samples
Table 4.7: Change in Reference Voltage and Coefficient of non-linearity (YW Samples)
YW Samples V 1mAdc [V] α ∆V 1mAdc (%) ∆α (%)
Non-degraded 163 48 - -
YWW 97 14 40.49 70.83
YWH 56 12 65.64 75.00
4.4.2 Clamping Voltage for YW Samples
Both YWW and YWH arrester samples subjected to peak surge currents, ranging be-
tween 10 kA and 15 kA, display an increase of the protection or clamping voltage as
compared to samples not subjected to the degradation process. These values show that

Chapter 4.Analysis of Electrical Degradation under Harmonic Distortion 62
although the clamping voltage for degraded components is higher than non-degraded,
there is however no difference in terms of the clamping voltage value of arresters sub-
jected to higher or lower magnitude of harmonic content. This is indicated in table
4.8.
Table 4.8: Clamping Voltages YW Samples
YW Samples Clamping Voltage (V c) [kV]
Non-degraded 0.35 - 0.4
YWW 0.4 - 0.5
YWH 0.4 - 0.5
The respective clamping or protection voltages are shown in figures 4.21, 4.22 and 4.23.
Figure 4.21: Clamping Voltage YW Samples
Figure 4.22: Clamping Voltage YWW Samples

Chapter 4.Analysis of Electrical Degradation under Harmonic Distortion 63
Figure 4.23: Clamping Voltage YWH Samples
4.4.3 Probability Functions of YW Samples
Using the breakdown time-points (ti) and the percentage cumulative degradation F (i, n)
relative to the YWW and YWH samples (See Appendix C), the respective CDF can
therefore be plotted. This is indicated in figures 4.24 and 4.25.
The CDF obtained show good fit to the Weibull probability distribution, with corre-
lation factors of 0.935602 and 0.951579 for the YWW and YWH arrester population,
respectively. The estimated parameters of these distributions are indicated in table 4.9.
The likelihood ratio test is found to be 0.63976 which therefore rules out any possibility
of similar degradation or reliability functions for both distributions (See Appendix D).
Based on the reliability and degradation rate functions obtained, it can be seen that the
YWH arrester population showed higher degradation rate as compared to the YWW
varistors. This therefore proves low reliability. The reliability and degradation graphs
of the YWW and YWH arrester populations are shown in figures 4.26 and 4.27, respec-
tively. The mean life of YWW and YWH ZnO arrester population is obtained using
relationship (4.6). This shows that the mean life time of YWW arrester population is
863.288 hours, whereas that of the YWH varistors is determined to be 538.464 hours.
This indicates that YWH arresters experienced 37.63% reduction in terms of their mean
life value, which is confirmed in the reliability curves.
The reliability and degradation rate graphs demonstrate that the YWH arrester pop-
ulation have higher degradation rate and therefore lower reliability compared to the
YWW population. This can also be confirmed in terms of the PDF curves which show
higher density of degradation for YWH arrester devices. This is shown in figure 4.28.
The percentile test results indicated in table 4.10, demonstrates that for any similar p%
of arresters, the time to degradation for YWH is shorter than that of YWW arrester

Chapter 4.Analysis of Electrical Degradation under Harmonic Distortion 64
population.
Figure 4.24: Cumulative Density Function YWW Samples
Figure 4.25: Cumulative Density Function YWH Samples
The time reduction factor at 10%, 50% and 90% reliability are determined using (4.8).
This shows that the life reduction factor for YWH arrester samples, at the observed
reliability points, is decreasingly trending at not uniform. The probability Pr [t2 ≥ t1]
is determined using equation (4.9). This yields 0.2384 or 23.84% probability of YWW
arrester devices experiencing shorter degradation time than YWH. Therefore, the prob-
ability of reduced degradation time for YWH arrester should be: Pr [t1 ≥ t2] = 1 -
Pr [t2 ≥ t1] = 0.7616 or 76.16%.

Chapter 4.Analysis of Electrical Degradation under Harmonic Distortion 65
Table 4.9: Estimated Weibull Parameters of YWW and YWH distributions
Distributions β θ η
YWW 1.46 1103.3 100.6
YWH 1.71 726.68 100.6
Figure 4.26: Reliability Curves YWW and YWH Samples
Table 4.10: Degradation times of p% Arrester Components
p% tp YWW [hour] tp YWH [hour] δxy (x = YWH, y = YWW)
10 336.81 295.5 0.88
50 958.96 687.09 0.72
90 2054 1284.1 0.63
4.5 Case study 3: Analysis of RL Varistor Samples
The electrical characteristics of the ZnO arrester population identified as RLW and RLH
are analysed and compared, on the basis of the V −I characteristic curve and coefficient
of non-linearity, the clamping voltage and the probability functions. The time-domain
of the continuous applied ac voltage stress across RLW samples is shown in figure 4.29,
and the frequency components associated to this voltage are indicated in figure 4.30.
The level of harmonic components is found to be 1.49% for the 3rd, 2.65% for the 5th
and 0.12% for the 7th (See Appendix B).
The time-domain of the continuous applied ac voltage stress across RLH samples is
shown in figure 4.31, and The frequency components associated to the voltage across
RLH samples are indicated in figure 4.32. The level of harmonic components are as
follows: 4.5% for the 3rd, 5.5% for the 5th and 4.7% for the 7th (See Appendix B).

Chapter 4.Analysis of Electrical Degradation under Harmonic Distortion 66
Figure 4.27: Degradation rate curves YWW and YWH Samples
Figure 4.28: Probability Density Function YWW and YWH Samples
4.5.1 V-I curve and Coefficient of non-linearity
The V − I measurements of the RLW and RLH samples (See Appendix B) render
the classification of the tested devices possible. This classification is conducted on the
basis of the conditions described in 3.4.2, provides a classification of the samples after
accelerated degradation test. This is indicated in table 4.11. The V − I characteristic
of the degraded RLW and RLH samples, is plotted, and the variation of the V1mAdc can
thus be observed to be 49.14 % for the RLW and 66.29 % for the RLH samples. The
V − I curve of these samples is provided in figure 4.33.

Chapter 4.Analysis of Electrical Degradation under Harmonic Distortion 67
Figure 4.29: Applied Voltage Stress RLW
Figure 4.30: Frequency Components RLW
The coefficient of non-linearity obtained from the plotted V − I characteristic reveals
the following: before degradation the average coefficient of non-linearity for RL samples
is found to be 52, and after degradation this coefficient is worked out to be 17, which
represents 67.31% reduction for RLW samples, and mean value of 12, which shows
76.92% reduction for RLH samples. These values are shown in table 4.12.
Table 4.11: Classification of Tested RL Samples
RL Sample Group Degraded Survived Spoiled
RLW 41 12 7
RLH 56 1 3

Chapter 4.Analysis of Electrical Degradation under Harmonic Distortion 68
Figure 4.31: Applied Voltage Stress RLH
Figure 4.32: Frequency Components RLH
4.5.2 Clamping Voltage for RL Samples
The RLW and RLH arrester samples subjected to peak surge currents, ranging between
10 kA and 15 kA, show increase of the clamping voltage as compared to the samples
not subjected to the degradation process. These values show that although the clamp-
ing voltage for degraded components is higher than non-degraded, there is however no
difference in terms of the clamping voltage value of arresters subjected to higher or
lower magnitude of harmonic content. This is indicated in table 4.13, and the respective
clamping or protection voltages are shown in figures 4.34, 4.35 and 4.36.

Chapter 4.Analysis of Electrical Degradation under Harmonic Distortion 69
Figure 4.33: V-I curve RL Samples
Figure 4.34: Clamping Voltage RL Samples

Chapter 4.Analysis of Electrical Degradation under Harmonic Distortion 70
Table 4.12: Change in Reference Voltage and Coefficient of non-linearity (RL Sam-ples)
RL Samples V 1mAdc [V] α ∆V 1mAdc (%) ∆α (%)
Non-degraded 175 52 - -
RLW 89 17 49.14 67.31
RLH 59 12 66.29 76.92
Table 4.13: Clamping Voltages for RL Samples
YW Samples Clamping Voltages (V c) [kV]
Non-degraded 0.35 - 0.4
RLW 0.4 - 0.5
RLH 0.4 - 0.5
Figure 4.35: Clamping Voltage RLW Samples
4.5.3 Probability Functions of RL Samples
The breakdown time-points (ti) and the percentage cumulative degradation F (i, n) rel-
ative to the RLW and RLH arrester populations (See Appendix C), are used to plot the
respective CDF of the probability distributions obtained. This is indicated in figures
4.37 and 4.38.
The CDF obtained show good fit to the Weibull probability distribution; this is sup-
ported by the correlation factors obtained: 0.969156 and 0.974395 for the RLW and
RLH arrester population, respectively. The estimated parameters of these distributions
are therefore given in table 4.14.
The likelihood ratio test is found to be -1.2855 which rules out any possibility of simi-
lar degradation rate and reliability functions for both distributions (See Appendix D).
Based on the degradation rate and reliability function, it could be observed that the RLH

Chapter 4.Analysis of Electrical Degradation under Harmonic Distortion 71
Figure 4.36: Clamping Voltage RLH Samples
Figure 4.37: Cumulative Density Function RLW Samples
Table 4.14: Estimated Weibull Parameters of RLW and RLH distributions
Distributions β θ η
RLW 1.63 1079.4 100.6
RLH 1.8 765.22 100.6
arrester population are likely to experience shorter time to degradation as compared to
the RLW arrester samples. The reliability and degradation graphs of the RLW and RLH
arrester populations are shown in figures 4.39 and 4.40, respectively. The mean life of
RLW and RLH ZnO arrester population is obtained using relationship (4.6). This shows
that the mean life time of RLW arrester population is 770.852 hours, whereas that of

Chapter 4.Analysis of Electrical Degradation under Harmonic Distortion 72
Figure 4.38: Cumulative Density Function RLH Samples
the RLH varistors is determined to be 538.622 hours. Therefore, a 30.13% reduction in
terms of the mean life is recorded.
The reliability and degradation rate graphs demonstrate that the RLH arrester popu-
lation display higher degradation rate and therefore lower reliability compared to the
RLW population. This can also be confirmed in terms of the PDF curves shown in figure
4.41, which indicates higher density of degraded RLH arrester samples. The percentile
and time reduction test results indicated in table 4.15, which demonstrate that for any
similar p% of arresters, the time to degradation for RLH is shorter than that of RLW
arrester population.
Figure 4.39: Reliability curves RLW and RLH Samples

Chapter 4.Analysis of Electrical Degradation under Harmonic Distortion 73
Figure 4.40: Degradation rate curves RLW and RLH Samples
Figure 4.41: Probability Density Function RLW and RLH Samples

Chapter 4.Analysis of Electrical Degradation under Harmonic Distortion 74
Table 4.15: Degradation times of p% Arrester Components
p% tp RLW [hour] tp RLH [hour] δxy (x = RLH, y = RLW)
10 371.99 319.79 0.86
50 962.64 724.85 0.75
90 1901.1 1316.8 0.69
The time reduction factor observed at 10%, 50% and 90% reliability points are de-
termined using (4.8). This shows that the time or life reduction shows non-uniform
decreasing trend. The probability Pr [t2 ≥ t1] is determined using equation (4.9). This
yields 0.2900 or 29.00% probability of RLW arrester devices experiencing shorter degra-
dation time than RLH. Therefore, the probability of reduced degradation time for RLH
arrester should be: Pr [t1 ≥ t2] = 1 - Pr [t2 ≥ t1] = 0.70991 or 70.99%.
4.6 Conclusion
In this section, the three-parameter Weibull probability distribution is applied to analyse
the probability of aggravated electrical degradation of ZnO arrester populations, sub-
jected to thermal and distorted ac voltage stress. The distortion is originated from an
external source of harmonics. The electrical stability of ZnO devices is also tested on the
basis of the V −I characteristic curve and the coefficient of non-linearity. The protection
function of arrester devices is equally analysed using the clamping voltage measurement.
In all the three case studies presented in this chapter, arrester devices degraded in the
presence of external harmonics showed the following: significant reduction in the mean
life (40.91% for BE, 37.63% for YW and 30.13% for RL samples); non-uniform decreas-
ing reliability trend and therefore increasing degradation at non-uniform rate; and a
higher probability of reduced time to degradation ( 58.93% for BEH, 76.16% for the
YWH and 70.99% for the RLH). The CDF observed across the three case studies, shows
higher value of the estimated shape parameter and lower value of the estimated scale
parameter, for the time to degradation probability distribution of arresters degraded
in the presence of external harmonics. The possibility of estimated parameters of one
distribution being equal to the other is ruled on the strength of the likelihood ratio
test results obtained in each of the cases observed. This therefore implies that higher
harmonic components embedded in the applied voltage stress results in higher degrada-
tion or failure rate and therefore lower reliability, which consequently promote higher
density of degraded arrester devices, significant reduction of the mean life as a result
of a higher time acceleration factor as well as a higher probability of reduced time to
degradation. On the other end, the electrical stability of ZnO devices, subjected to ac-
celerated degradation with external harmonics in the applied voltage stress, supported

Chapter 4.Analysis of Electrical Degradation under Harmonic Distortion 75
the observations made in terms of the probability functions. It could be noticed in the
case studies undertaken that the mean values of the reference voltage and the coefficient
of non-linearity are significantly reduced for the arrester samples subjected to external
harmonics. The BEH arresters declined by 43.75% and 81.71% in terms of the reference
voltage and the coefficient of non-linearity, respectively. The YWH observed a decrease
of 65.64% in the reference voltage and of 75% in the coefficient of non-linearity. The
RLH in turn showed a decline of 66.29% and 76.92% in terms the reference voltage and
the coefficient of non-linearity. Although an increase in the clamping voltage is observed
in some of the cases observed, it could be observed that the effect of external harmonics
on the protection quality is not significantly pronounced given the similar margin of the
clamping voltage value measured before and after degradation with external harmonics.

Chapter 5
The Effect of Voltage Harmonics
on the Resistive Current
5.1 Introduction
In the previous chapter, the influence of harmonics on the probability of accelerated or
aggravated electrical degradation is mainly approached on the basis of the mean time
to degradation, the comparison of the V − I characteristic of MOV samples, as well as
in terms of the surge clamping performance. In this section, an attempt to analyse the
observed lifetime reduction and accelerated loss of stability of MOV samples in terms
of the resistive component of the total leakage current is undertaken. Therefore, the
impact of externally applied distorted voltage on the behaviour of the resistive current
and consequently on the mechanism of electrical degradation is also described. The
CSV measurements of the leakage current spectrum, obtained in both conditions of the
accelerated degradation test, are used in conjunction with the Fourier’s expansion-based
technique to decompose the total leakage current. The ion migration and diffusion
theories are examined in the light of distorted applied field stress.
5.2 Decomposition of the Leakage Current
The knowledge of the resistive component of the total leakage current of ZnO arrester
is essential to the condition or health assessment of these devices [30]–[35]. Given the
distorted and periodic nature of the total leakage current and the applied voltage wave-
forms measured across ZnO arresters, the generalised Fourier’s expression of a distorted
signal can be applied to model these measured electrical quantities (leakage current and
76

Chapter 5. The Effect of Voltage Harmonics on the Resistive Current 77
applied voltage) of varistor arresters. From this model, the instantaneous power equa-
tion, which consists of the active and reactive component, can be further developed.
Since the power losses experienced by surge arresters subjected to distorted voltage are
determined by the summation of power losses resulting from each component in the
applied voltage [36, 65, 66, 67]. The resistive current component is therefore derived
from the active or resistive power equation resulting from all frequency components in
the applied voltage. The generalised Fourier’s expression of a distorted signal is written
as follows[68, 69]:
i (t) =ao2
+2∑
h=0
[a(2h+1) cosω(2h+1)t+ b(2h+1) sinω(2h+1)t
](5.1)
Where: i (t) is the leakage current function; h is an integer, ao = 2T
T∫0
i (t) dt, a(2h+1) =
2T
T∫0
i (t)·(cos(2h+ 1)t) dt and b(2h+1) = 2T
T∫0
i (t)·(sin(2h+ 1)t) dt, are Fourier coefficients
of respective harmonic frequencies, and T , is the period of the function.
In order to evaluate the Fourier coefficients, the following 20 equally divided time-points
across the full cycle of the waveform (18o, 36o, 54o, 72o...360o) are located in the CSV
data obtained. The corresponding current values are also sourced from the same CSV
data (See Appendix B). These data enable the determination of the Fourier coefficients of
the leakage current or the applied voltage. The generalised Fourier’s equation described
in (5.1) can thus be re-written using the general expression of a non-sinusoidal equation
of an electrical quantity [70]. This yields the following current expression:
i (t) =Io2
+m∑h=0
√2I(2h+1)sin
[ω(2h+1)t+ φ(2h+1)
](5.2)
Where: I(2h+1) =√a2
(2h+1) + b2(2h+1) is the RMS value of i (t), ω(2h+1) = 2(2h+1)ΠT is
the angular frequency, and φ(2h+1) = arctana(2h+1)
b(2h+1)is the respective phase angle of the
harmonic frequency component, with h and m are integers.
Applying the above steps to the measured voltage across ZnO varistor arresters, will
also enable the non-sinusoidal voltage equation to be expressed as follows:
v (t) =Vo2
+
m∑h=0
√2V(2h+1)sin
[ω(2h+1)t+ ψ(2h+1)
](5.3)

Chapter 5. The Effect of Voltage Harmonics on the Resistive Current 78
Where: V(2h+1) is the RMS value of v (t) , and ψ(2h+1), is the phase angle of respective
frequency voltage component.
Since the resistive component of the leakage current is associated to the active power or
watt losses (WR) in conductive ZnO varistor arresters [48, 67, 71]. This power component
can be derived from the instantaneous power w (t) equation given by the product of
equations (5.1) and (5.2). This yields the following equation (neglecting dc components):
w(t) =
m∑h=0
√2I(2h+1)sin
[ω(2h+1)t+ φ(2h+1)
]·√
2V(2h+1)sin[ω(2h+1)t+ ψ(2h+1)
](5.4)
From equation (5.4), the active or resistive power equation is determined as follows:
WR =
m∑h=0
V(2h+1) · I(2h+1)cos[ψ(2h+1) − φ(2h+1)
](5.5)
Where: WR is the active or resistive power component, and I(2h+1)cos[ψ(2h+1) − φ(2h+1)
]represents the resistive current at (2h+ 1)th harmonic component.
The magnitude of the total resistive components constituting the leakage current could
be effectively determined using the expression:
IR =
√√√√ m∑h=0
[I(2h+1)cos
(ψ(2h+1) − φ(2h+1)
)]2=√I2
1 + I23 + I2
5 + ...I2m (5.6)
Where: IR is the total resistive component of the total leakage current, I1, I3, I5 and Im
are fundamental, third harmonic, fifth and mth harmonic resistive currents, respectively.
Based on the resistive current component thus obtained the variations of each harmonic
resistive component as a result of respective voltage harmonic frequency can be deter-
mined. The contributions of individual harmonic currents towards the total resistive
current through ZnO devices can also be quantified.
5.3 Resistive Current Analysis
Applying the above described technique, the leakage current and the CSV current and
voltage data of five randomly selected ZnO arrester devices, obtained in both accelerated
degradation test conditions of the study, are used to assess the behaviour of the resistive

Chapter 5. The Effect of Voltage Harmonics on the Resistive Current 79
current components (fundamental, third and fifth) before and after harmonic injection
from the external source of harmonics.
5.3.1 BE Samples
The CSV data of the leakage current waveforms of five randomly selected BEW and
BEH arrester samples are exported to the Matlab software package 7.0 in order to plot
the leakage current signal. This is shown in figures 5.1 and 5.2, respectively.
Figure 5.1: Leakage Current BEW
The magnitude of the resistive fundamental and harmonic current components, deter-
mined using the above procedure, for randomly selected BEW (before external harmonic
injection) and BEH (after harmonic injection) arrester samples are shown in figure 5.3.
This indicates that the external source of harmonic causes the resistive current compo-
nent to increase further. The total resistive current before and after external injection
of harmonics is obtained using equation (5.6). This yields 0.014 mA and 0.191 mA, re-
spectively. Therefore, it could be observed that the most dominant current components
in the resistive leakage current, in both degraded arrester populations, are the funda-
mental and the THRC. These components respectively represent 92.86% and 38.46% of
the resistive current before harmonics injection, and 71.73% and 54.45% of the resistive
current after harmonics injection. The fifth harmonic component amounts to 21.43%
and 42.93% of the resistive current in each respective case. The increase in the resistive
current, observed in arrester population degraded in the presence of external harmonics,
can be attributed to the contribution of harmonic voltage components to the resultant
biasing voltage. This explains the pronounced shift in the V − I curve, the high degra-
dation rate function and other parameters as opposed to the BEW arrester population.

Chapter 5. The Effect of Voltage Harmonics on the Resistive Current 80
Figure 5.2: Leakage Current BEH
The degradation signs observed in BEH arrester population are therefore attributed to
the rise in the resistive current, which in turn results from harmonic components in the
applied voltage. Furthermore, it could be noticed that an increase from 1.89% to 6.24%
in the third harmonic voltage content and from 2.5% to 5.58% in the fifth harmonic
voltage content, the rise in the resulting current components are from 0.005 mA to 0.104
mA and 0.003 mA to 0.082 mA of the fundamental component, respectively. This illus-
trates the contribution of each voltage harmonic component to the increase of the total
resistive current, hence to the electrical degradation process.
Figure 5.3: Resistive Current Components BE Samples

Chapter 5. The Effect of Voltage Harmonics on the Resistive Current 81
5.3.2 YW Samples
The CSV data of the leakage current waveforms of the YWW and YWH arrester samples
are exported to the Matlab software package version 7.0 in order to plot the leakage
current signal. The leakage current waveforms obtained for the YWW and YWH arrester
populations are depicted in figures 5.4 and 5.5, respectively.
Figure 5.4: Leakage Current YWW
Figure 5.5: Leakage Current YWH

Chapter 5. The Effect of Voltage Harmonics on the Resistive Current 82
The magnitude of the fundamental and harmonic resistive current components obtained
from randomly selected YWW and YWH arrester devices are also determined. This is
indicated in figure 5.6. As observed in the case of BE samples, further increase of the
resistive current is noted as a result of the connection of an external source of harmonics.
Figure 5.6: Resistive Current Components YW Samples
The total resistive current before and after external injection of harmonics is obtained
using equation (5.6). This reveals 0.092 mA and 0.295 mA, respectively. Therefore, it
could be observed that the fundamental and the THRC are the most dominant har-
monic current components in the resistive leakage current, in both arrester populations
degraded with and without external harmonic source, since they consist respectively of
76.09% and 65.22% of the resistive current before injection of harmonics, and 81.36%
and 54.24% of the resistive current after harmonics injection. The fifth harmonic cur-
rent represents 54.35% and 20.34% of the resistive current, respectively. The increase
in the resistive current, observed in arrester population degraded in the presence of an
external source of harmonics, is attributed to the harmonic voltage components in the
applied voltage. These voltage components individually contribute to the rise of the
overall biasing voltage across ZnO arrester devices. This therefore indicates the shorter
time to degradation and other signs of ageing experienced by YWH arrester popula-
tion. These degradation signs are caused by the increase of the resistive current which is
subsequently triggered by the presence of harmonic components in the applied voltage.
Furthermore, it could be noticed for an increase from 1.28% to 9.8% in the third har-
monic voltage content and from 1.89% to 6.9% in the fifth harmonic voltage content, the
change in the resulting current components are from 0.06 mA to 0.16 mA and 0.005 mA
to 0.06 mA, respectively. This demonstrates the contribution of each voltage harmonic

Chapter 5. The Effect of Voltage Harmonics on the Resistive Current 83
content to the growth in the total resistive current, hence to the increased probability
of accelerated degradation.
5.3.3 RL Samples
Similarly to the steps followed above, the CSV data of the leakage current waveforms of
the RLW and RLH arrester components are exported to the Matlab software package
version 7.0 in order to plot the leakage current signal. The leakage current waveforms
obtained for the RLW and RLH arrester populations are depicted in figures 5.7 and 5.8,
respectively.
Figure 5.7: Leakage Current RLW
The fundamental and harmonic resistive currents obtained from randomly selected RLW
and RLH arrester components are indicated in figure 5.9. This once again indicates that
the external source of harmonic triggers further increase in the resistive current.
The total resistive current before and after external injection of harmonics such as ex-
pressed in equation (5.6) yields the following: 0.040 mA and 0.502 mA, respectively.
Therefore, the fundamental and the THRC consist respectively of 88.22% and 7.5% of
the resistive current, before external harmonics are injected, 71.71% and 55.78% of the
resistive current. The fifth harmonic current represents 4.3% and 41.83% of the resistive
current, respectively. The rise in the resistive current, observed in arrester population
degraded in the presence of external harmonics, is attributed to the contribution of
harmonic voltage components to the overall biasing voltage across these devices. The
analysis of the RLH arrester devices showed severe degradation in terms of the V − I

Chapter 5. The Effect of Voltage Harmonics on the Resistive Current 84
Figure 5.8: Leakage Current RLH
Figure 5.9: Resistive Current Components RL Samples
curve, degradation rate function and other parameters as opposed to the RLW compo-
nents. This is related to higher resistive current, which is triggered by harmonic voltage
components in the applied voltage. Furthermore, it could be noticed for an increase
from 1.49% to 4.5% in the third harmonic voltage content and from 2.65% to 5.5% in
the fifth harmonic voltage content, the change in the resulting current components are
from 0.003 mA to 0.28 mA and 0.0017 mA to 0.21 mA, respectively. This indicates
the impact of each voltage harmonic content to the magnitude rise of the total resistive
current, hence to the prospect of accelerated degradation.
It is therefore important to understand the fundamental mechanism of this induced and
potentially destructive current conduction through MOV arresters.

Chapter 5. The Effect of Voltage Harmonics on the Resistive Current 85
5.4 Mechanism of Accelerated Electrical Degradation
The electrical conduction through MOV arresters is fundamentally attributed to the ion
migration (Zinc interstitials or oxygen vacancies) to the intergranular or the interface
region of the varistor microstructure [48, 49, 72]. This charge migration phenomenon
is made possible by the following important factors: the environmental temperature
and the externally applied voltage stress to the arrester device. Therefore, both the
applied electric field and temperature could be associated to the depletion of the trapped
charges in the intergranular region, which is commonly referred to as the reduction of the
schottky barrier height. Furthermore, the C−V analysis technique such as demonstrated
in [9, 20, 27], express the inter-dependency between the applied voltage stress and the
capacitance of the intergranular region.
Therefore the higher increase in the resistive current component observed, in the varistor
samples subjected to distorted applied voltage stress, could therefore be attributed to
the effect of voltage harmonics on the migration of charges in the arrester microstructure.
This basically implies that the rate of charge migration, which in turn causes the collapse
of the barrier height or the decay in the capacitance of the grain boundary region, must
have substantially increased as a result of harmonics embedded on the voltage stress.
The external biasing effect of distorted voltage stress is described in figure 5.10.
Figure 5.10: Distribution of charge carriers in ZnO microstructure

Chapter 5. The Effect of Voltage Harmonics on the Resistive Current 86
5.5 Conclusion
The total leakage current of ZnO arrester devices, used in the degradation tests con-
ducted in this study, is decomposed in a bid to obtain the resistive component. The
fundamental and harmonic components of the resistive current are further analysed
and compared in terms of the content variations and contributions to the resistive cur-
rent. The microstructural implications of accelerated electrical degradation were also
discussed. In terms of the resistive current components, it could be observed that the
fundamental and the THRC are the most dominant components in the resistive leakage
current. All harmonic current components have the tendency to increase in response
to the rise in the voltage harmonic content. The rise in the magnitude of the resistive
current of the arrester samples degraded with external harmonics is an indication of
the contribution of harmonic frequencies to ion migration and therefore the collapse of
the schottky barrier height. Therefore, the harmonic frequencies in the applied voltage
systematically contribute to the overall biasing voltage applied to the arresters. Based
on these observations, voltage harmonic components in the applied voltage across BEH,
YWH and RLH arresters are significant contributing factors to the accelerated degrada-
tion observed in these arrester populations. Therefore, the presence of higher content of
third and fifth harmonic voltage contribute to the increase of the total leakage current,
and hence to the high probability of aggravated electrical degradation of BEH, YWH
and RLH ZnO arrester populations.

Chapter 6
Conclusions and Future
Directions
6.1 Introduction
The inevitable exposure of ZnO arrester devices to harmonic distorted system voltage
in modern electric systems, raises the fundamental question of possible aggravated or
accelerated electrical degradation of these overvoltage protective units. Artificial accel-
erated degradation test, which consists of a highly recommended technique of simulating
long-term degradation process under service conditions, is conducted on three sets of
commercially-sourced ZnO arrester devices. The continuously applied voltage stress
is distorted and the environmental temperature is maintained constant. The three-
parameter Weibull statistical approach is thus applied in order to analyse the mean
time to degradation or mean life, the probability of reduced time to degradation and
the degradation rate functions of ZnO arrester samples. The V −I characteristic as well
as the clamping voltage of the arrester samples are equally measured to verify electri-
cal degradation condition. The resistive component of the total leakage current is also
evaluated in a bid to determine the impact of harmonic voltage frequencies, embedded
in the applied voltage stress, on accelerated electrical degradation phenomenon of ZnO
arresters.
6.2 Results Obtained
Subsequent to the test and process followed in this study in order to obtain the degra-
dation time distribution, which showed good fit to the Weibull distribution, the results
87

Chapter 6. Conclusions and Future Directions 88
obtained in this study are presented and analysed in terms of the following probability
functions and electrical parameters: the time to degradation or life expectancy of ZnO
arresters, the hasard or degradation rate function, the V −I characteristic, the clamping
voltage and the resistive component of the leakage current.
6.2.1 Higher Probability of Degradation and Reduced Mean Life
The time to degradation of ZnO arresters under the test conditions of this study tech-
nically implies a measure of the probability of survival (life expectancy), or of reliable
performance of these surge protective units under distorted supply voltage conditions.
Therefore, the mean time to degradation or the mean life, the B-lives as well as the
probability of reduced time to degradation between the arrester populations involved in
this study are measured and compared. It is found across all the samples tested, that the
mean life of ZnO arresters subjected to external harmonics is significantly reduced com-
pared to that of arrester components tested without external harmonics. Similarly, the
probability of reduced time to degradation for ZnO devices tested with external harmon-
ics is considerably higher. This is also confirmed in terms of the time reduction factor
obtained at 10%, 50% and 90% reliability. The B-live test results also indicates that
for any pth percentile of arrester components tested with higher content of harmonics,
the time to degradation is shorter than that of arrester subjected to external harmonics.
Therefore, the mean life or the life expectancy of ZnO arresters is significantly reduced
when subjected to continuous supply voltage with harmonic distortion.
6.2.2 Higher Rate of Degradation
The hasard or the degradation rate function is used to provide the basis of analysis of
the frequency or pace at which ZnO arresters, subjected to distorted voltage conditions,
are likely to experience degradation. The results obtained indicate that the arrester
populations, subjected to degradation with external harmonics, are found to be exhibit-
ing a higher pace or frequency of degradation. However, this frequency of degradation
is found to be increasing at non-uniform rate. Therefore, the higher the harmonic dis-
tortion content in the applied voltage, the higher the frequency or pace of degradation
of ZnO arresters.
6.2.3 Accelerated Loss of Stability
The V−I characteristic curves is used as an alternative technique to measure degradation
and ultimately the stability of ZnO arresters under distorted conditions. The results

Chapter 6. Conclusions and Future Directions 89
obtained in terms of the V − I curve, the reference voltage and the coefficient of non-
linearity indicate further drift of the V − I characteristic towards the high conduction
region and consequently a significant decrease in the reference voltage and the coefficient
of non-linearity for arrester populations, degraded in the presence of external harmonics.
This therefore implies that higher harmonics in the applied voltage contribute to loss of
stability and therefore to accelerated degradation or of Zinc oxide arresters.
6.2.4 Increased Clamping Voltage
The clamping voltage is measured in a bid to evaluate the impact of higher content of
harmonic distortion on high-frequency performance of ZnO arresters. This revealed that
ZnO arrester populations, subjected to degradation with external harmonics, experience
an increase in the protection or clamping voltage. However, this increase in the clamping
voltage value may not be necessarily higher than that of arrester populations subjected
to applied voltage stress without external harmonics.
6.2.5 Voltage Harmonics and Accelerated Electrical Degradation
The analysis of the resistive component of the leakage current, under both accelerated
degradation conditions observed in this study, shows that voltage harmonic components
embedded on the applied voltage stress contribute to the overall biasing voltage of ar-
rester components. This fundamentally suggests that voltage harmonics in the applied
stress play a significant contributing role in the drift or migration of charged particles
into the intergranular region. This results in the depletion of the trapped charges and
therefore to the reduction of the barrier height. In other words, the overall capacitance
effect of the device is overcome leading to various conductive paths being made available
in the microstructure. This prompts an increase of harmonic current components and
therefore the resistive current, which subsequently leads to rise in the watt losses and
eventually to the demise of the arrester devices. Therefore, the higher the harmonic
frequencies in the applied voltage, the higher the resistive current and the higher the
probability of reduced life expectancy or accelerated degradation of MOV-based surge
arresters.
6.3 Interpretation of the Results
The accelerated degradation test, such as implemented in this study, represents the in-
fluence of voltage harmonics on the long-term deterioration process of ZnO arresters

Chapter 6. Conclusions and Future Directions 90
operating under standard temperature and voltage conditions. The high probability of
reduced life expectancy or time to degradation that resulted from this study implies that
the reliability of ZnO arrester devices decreases with an increase in harmonic content
in the applied voltage stress. The decrease in reliability comes as a result of increased
resistive current which in turn will cause a rise in the watt losses, and subsequently a
device breakdown of these overvoltage protective units.
The non-uniform and increasing rate of degradation of ZnO arresters may be attributed
to the non-monotonic disintegration mechanism of grain boundaries that governs the
degradation or failure process of individual arrester units. The trend at which this phe-
nomenon takes place may not necessarily be the same for identical arrester components,
and may change in the course of time to either become constant or even decrease. This
also justifies the fact that some arrester devices have survived the test.
The accelerated loss of stability is an indication of the fact that harmonic components
in the applied voltage contribute, on the long run together with temperature, to further
decrease of the Schottcky barrier.
Although the increase in the clamping voltage is associated to the degradation indicators
of ZnO arresters, however such an increase of the clamping voltage is not necessarily
accelerated by harmonic content in the applied voltage. This suggests that the degra-
dation time of ZnO arresters may not reflect a complete disintegration process of the
grain boundaries of the MOV.
The continuous presence of harmonic frequency components in the applied voltage con-
sists of additional electric field to the several millions of grain boundaries or microvaristor
that constitute the ZnO arrester blocks. This additional field increases the overall bias-
ing effect which in conjunction with the environmental temperature, do accelerate the
migration process of charged particles.
6.4 Future Directions
This study introduces the probabilistic approach of accelerated electrical degradation of
ZnO arresters operating in distorted electric circuits. Further studies should build on the
foundation of this study in order to research on: accumulated energy absorbed by ZnO
arresters subjected to the simultaneous effect of steady state harmonic and transient
overvoltage; the analysis of the effect of harmonics on the breakdown voltage of ZnO
arresters; the development of analytical models, capable of providing or describing the
relationship between harmonic content in the applied voltage and the lifetime of MOV-
based surge arresters, as well as on the reduction of the Schottky barrier height.

Appendix A
V − I Measurements
The V − I characteristic of arrester samples are given in the tables below:
Mean V − I curve calculation:
BE Samples (Non-degraded)
V0.001mA =∑V0.001mA
60 = 6 V ; V0.01mA =∑V0.01mA
60 = 97 V; V0.1mA =∑V0.1mA60 = 170 V;
V1mA =∑V1mA60 = 175 V; V10mA =
∑V10mA60 = 185 V; V100mA =
∑V100mA
60 = 200 V.
BEW Samples (degraded without external harmonics)
V0.001mA =∑V0.001mA
27 = 6 V ; V0.01mA =∑V0.01mA
27 = 49 V; V0.1mA =∑V0.1mA27 = 147 V;
V1mA =∑V1mA27 = 160 V; V10mA =
∑V10mA27 = 175 V; V100mA =
∑V100mA
27 = 185 V.
BEH Samples (degraded with external harmonics)
V0.001mA =∑V0.001mA
37 = 4 V ; V0.01mA =∑V0.01mA
37 = 39 V; V0.1mA =∑V0.1mA37 = 80 V;
V1mA =∑V1mA37 = 100 V; V10mA =
∑V10mA37 = 135 V; V100mA =
∑V100mA
37 = 145 V.
YW Samples (Non-degraded)
V0.001mA =∑V0.001mA
60 = 6 V ; V0.01mA =∑V0.01mA
60 = 99 V; V0.1mA =∑V0.1mA60 = 157 V;
V1mA =∑V1mA60 = 163 V; V10mA =
∑V10mA60 = 171 V; V100mA =
∑V100mA
60 = 179 V.
YWW Samples (degraded without external harmonics)
V0.001mA =∑V0.001mA
36 = 6 V ; V0.01mA =∑V0.01mA
36 = 73 V; V0.1mA =∑V0.1mA36 = 85 V;
V1mA =∑V1mA36 = 97 V; V10mA =
∑V10mA36 = 115 V; V100mA =
∑V100mA
36 = 126 V.
YWH Samples (degraded with external harmonics)
V0.001mA =∑V0.001mA
47 = 4 V ; V0.01mA =∑V0.01mA
47 = 35 V; V0.1mA =∑V0.1mA47 = 44 V;
V1mA =∑V1mA47 = 56 V; V10mA =
∑V10mA47 = 68 V; V100mA =
∑V100mA
47 = 80 V.
91

Appendix A. V − I Measurements 92
RL Samples (Non-degraded)
V0.001mA =∑V0.001mA
60 = 7 V ; V0.01mA =∑V0.01mA
60 = 98 V; V0.1mA =∑V0.1mA60 = 170 V;
V1mA =∑V1mA60 = 175 V; V10mA =
∑V10mA60 = 183 V; V100mA =
∑V100mA
60 = 190 V.
RLW Samples (degraded without external harmonics)
V0.001mA =∑V0.001mA
41 = 6 V ; V0.01mA =∑V0.01mA
41 = 58 V; V0.1mA =∑V0.1mA41 = 76 V;
V1mA =∑V1mA41 = 89 V; V10mA =
∑V10mA41 = 102 V; V100mA =
∑V100mA
41 = 113 V.
RLH Samples (degraded with external harmonics)
V0.001mA =∑V0.001mA
56 = 4 V ; V0.01mA =∑V0.01mA
56 = 38 V; V0.1mA =∑V0.1mA56 = 47 V;
V1mA =∑V1mA56 = 59 V; V10mA =
∑V10mA56 = 71 V; V100mA =
∑V100mA
56 = 83 V.
Table A.1: V − I measurement without external harmonics - BEW
Samples 0.001 0.01 0.1 1 10 100 current (mA)
1 6 53 147 162 177 185 V
2 6 49 152 160 175 188 V
3 6 47 143 157 179 184 V
4 6 52 151 156 174 185 V
5 6 54 143 154 175 189 V
6 6 47 150 160 175 189 V
7 6 53 148 161 172 187 V
8 6 52 147 159 177 189 V
9 6 49 153 164 176 186 V
10 7 54 148 157 170 185 V
11 6 53 146 160 175 185 V
12 6 49 149 160 175 186 V
13 6 49 148 160 179 188 V
14 6 55 151 161 177 187 V
15 6 49 143 165 176 186 V
16 6 47 149 166 175 189 V
17 5 51 146 164 178 188 V
18 6 50 145 158 175 185 V
19 6 48 150 156 168 178 V
20 5 47 146 162 169 180 V
21 6 56 148 161 176 186 V
22 6 51 147 160 175 185 V
23 6 49 145 159 175 185 V
24 5 50 145 157 169 180 V
25 6 47 146 160 174 184 V
26 6 50 149 157 175 186 V
27 6 50 143 161 177 187 V

Appendix A. V − I Measurements 93
Table A.2: V − I measurement without external harmonics - BEH
Samples 0.001 0.01 0.1 1 10 100 current (mA)
1 4 40 83 104 136 145 V
2 4 41 82 102 130 148 V
3 4 40 83 104 135 144 V
4 4 39 81 100 130 145 V
5 5 38 80 100 131 149 V
6 3 40 80 100 132 149 V
7 4 40 84 104 135 147 V
8 4 38 77 97 137 149 V
9 5 40 83 101 136 146 V
10 5 39 78 99 130 145 V
11 4 39 76 97 135 144 V
12 4 41 79 100 135 146 V
13 4 39 81 102 139 148 V
14 4 40 80 101 137 147 V
15 4 42 83 103 136 146 V
16 4 40 79 100 135 149 V
17 4 39 76 97 128 138 V
18 4 43 84 103 135 145 V
19 4 41 80 99 128 138 V
20 4 40 76 100 139 146 V
21 4 42 81 101 136 146 V
22 4 39 77 97 135 145 V
23 4 38 85 102 135 145 V
24 4 37 82 100 129 140 V
25 4 40 80 101 134 144 V
26 4 35 79 100 135 146 V
27 4 39 80 100 137 147 V
28 4 41 81 101 135 145 V
29 4 35 82 102 128 148 V
30 4 35 84 101 139 140 V
31 4 39 80 100 136 146 V
32 4 40 80 100 135 145 V
33 4 41 81 102 135 145 V
34 4 38 83 101 139 140 V
35 4 37 79 101 139 144 V
36 5 39 82 100 135 146 V
37 4 41 75 94 137 147 V

Appendix A. V − I Measurements 94
Table A.3: V − I measurement without external harmonics - YWW
Samples 0.001 0.01 0.1 1 10 100 current (mA)
1 6 70 86 98 118 125 V
2 6 71 86 96 116 128 V
3 6 70 83 98 115 126 V
4 6 73 85 97 114 125 V
5 6 72 85 99 115 126 V
6 6 73 88 97 117 126 V
7 5 70 84 99 115 127 V
8 6 74 87 97 117 129 V
9 6 73 83 96 116 126 V
10 6 74 80 98 113 125 V
11 6 73 86 97 115 124 V
12 6 71 86 97 115 127 V
13 6 75 85 96 114 127 V
14 6 73 83 94 114 127 V
15 6 72 82 98 116 126 V
16 6 70 83 95 115 129 V
17 6 75 86 97 116 128 V
18 6 73 84 97 115 126 V
19 6 71 85 97 117 126 V
20 6 75 88 97 117 126 V
21 6 73 87 97 116 127 V
22 6 77 87 97 115 127 V
23 6 74 85 95 115 125 V
24 6 75 82 93 114 126 V
25 5 70 87 97 114 126 V
26 6 75 81 95 115 126 V
27 6 69 80 99 117 127 V
28 6 71 81 97 115 125 V
29 6 75 85 95 118 128 V
30 6 73 85 95 113 126 V
31 6 75 85 95 116 126 V
32 6 70 85 96 115 125 V
33 6 71 81 95 115 125 V
34 6 73 88 98 114 126 V
35 6 75 85 97 115 126 V
36 6 75 85 97 115 126 V

Appendix A. V − I Measurements 95
Table A.4: V − I measurement with external harmonics - YWH
Samples 0.001 0.01 0.1 1 10 100 current (mA)
1 4 33 46 56 68 78 V
2 5 35 46 56 68 78 V
3 5 34 43 58 67 76 V
4 4 34 45 57 69 75 V
5 4 35 45 59 65 76 V
6 4 36 48 57 67 76 V
7 4 33 44 59 65 77 V
8 5 35 47 57 67 79 V
9 4 35 43 56 66 76 V
10 4 34 40 58 63 83 V
11 4 33 46 57 65 80 V
12 4 35 46 57 65 80 V
13 4 35 45 56 64 81 V
14 4 33 43 54 64 83 V
15 5 34 44 58 66 80 V
16 4 33 44 55 65 81 V
17 4 35 46 57 66 78 V
18 4 33 44 57 72 76 V
19 4 32 45 57 67 76 V
20 5 35 43 57 67 80 V
21 4 33 42 57 68 83 V
22 4 37 47 57 68 77 V
23 4 34 45 55 69 85 V
24 5 35 44 53 70 80 V
25 5 33 47 56 73 80 V
26 4 35 44 55 65 80 V
27 4 39 44 54 67 77 V
28 5 32 42 57 65 85 V
29 4 35 45 55 68 78 V
30 4 33 45 55 71 81 V
31 4 35 44 55 73 83 V
32 4 33 46 56 70 80 V
33 4 32 43 55 72 81 V
34 4 33 48 58 73 86 V
35 4 35 40 57 70 80 V
36 4 35 45 57 70 76 V
37 4 35 44 55 65 76 V
38 4 39 46 59 67 80 V
39 4 39 46 57 69 82 V
40 4 35 45 55 70 81 V
41 4 35 45 55 63 76 V
42 4 35 45 55 66 86 V
43 4 32 45 56 68 85 V
44 4 38 40 55 65 80 V
45 4 33 40 58 64 76 V
46 4 35 45 57 70 81 V
47 4 35 40 57 72 80 V

Appendix A. V − I Measurements 96
Table A.5: V − I measurement without external harmonics - RLW
Samples 0.001 0.01 0.1 1 10 100 current (mA)
1 5 59 76 86 103 113 V
2 6 60 76 86 96 114 V
3 6 60 73 88 97 117 V
4 6 57 75 87 99 109 V
5 6 58 75 89 102 112 V
6 5 56 78 87 97 115 V
7 5 58 74 89 105 115 V
8 4 58 77 87 97 114 V
9 6 57 73 86 103 113 V
10 6 61 70 88 103 113 V
11 6 62 76 87 105 115 V
12 6 58 76 87 105 115 V
13 6 58 78 90 104 114 V
14 6 59 78 87 99 109 V
15 6 58 76 88 104 114 V
16 6 57 76 91 100 110 V
17 6 57 76 90 103 113 V
18 5 59 77 87 102 112 V
19 6 60 75 89 103 111 V
20 6 58 73 89 97 113 V
21 6 58 72 90 100 110 V
22 6 57 77 93 103 112 V
23 6 60 75 89 103 114 V
24 6 56 76 89 101 110 V
25 6 59 77 89 102 112 V
26 6 58 76 87 102 111 V
27 6 59 76 90 105 116 V
28 6 62 76 87 100 114 V
29 6 58 75 92 102 112 V
30 6 63 75 87 102 112 V
31 6 56 76 89 103 113 V
32 6 58 76 89 100 113 V
33 6 58 75 89 102 112 V
34 6 60 78 90 103 113 V
35 6 61 76 87 102 112 V
36 6 57 75 87 102 111 V
37 6 58 76 92 101 111 V
38 6 55 76 89 102 113 V
39 6 57 76 89 104 113 V
40 6 57 75 89 101 112 V
41 6 56 75 89 102 112 V

Appendix A. V − I Measurements 97
Table A.6: V − I measurement without external harmonics - RLH
Samples 0.001 0.01 0.1 1 10 100 current (mA)
1 4 39 46 58 73 83 V
2 4 40 46 60 76 84 V
3 4 40 43 58 77 87 V
4 4 37 45 60 79 89 V
5 5 38 45 59 72 82 V
6 4 36 48 57 77 85 V
7 5 38 44 59 75 85 V
8 5 38 47 59 77 84 V
9 4 37 43 56 73 83 V
10 4 41 48 58 73 83 V
11 4 42 46 57 75 85 V
12 4 38 46 57 75 85 V
13 4 38 48 60 74 84 V
14 5 39 48 57 79 89 V
15 5 38 46 58 74 84 V
16 4 37 46 61 70 80 V
17 3 37 46 60 73 83 V
18 4 39 47 60 72 82 V
19 4 40 45 59 73 81 V
20 4 38 47 59 77 83 V
21 3 38 48 60 70 80 V
22 5 37 47 63 73 82 V
23 4 40 45 59 73 84 V
24 4 36 46 59 71 80 V
25 4 39 47 59 72 82 V
26 4 38 46 57 72 81 V
27 4 39 46 60 68 86 V
28 4 42 46 57 70 84 V
29 4 38 47 62 72 82 V
30 4 43 47 57 66 82 V
31 4 36 47 59 67 83 V
32 3 38 46 59 70 83 V
33 4 38 45 59 72 82 V
34 4 40 48 60 73 83 V
35 5 41 46 57 72 82 V
36 4 37 45 57 72 81 V
37 4 38 46 62 71 81 V
38 4 35 46 59 72 83 V
39 5 37 46 59 65 83 V
40 4 37 45 59 66 82 V
41 4 36 47 59 67 82 V
42 4 40 47 56 70 84 V

Appendix A. V − I Measurements 98
Table A.7: V − I measurement without external harmonics - RLH (Continued)
43 4 40 45 58 71 87 V
44 4 37 50 57 70 89 V
45 4 38 45 59 72 82 V
46 4 36 48 57 70 85 V
47 4 38 49 59 65 85 V
48 4 38 47 57 65 84 V
49 4 37 50 56 65 83 V
50 4 41 49 58 69 83 V
51 4 42 46 57 75 85 V
52 4 38 46 57 67 85 V
53 4 38 48 60 76 80 V
54 4 39 48 57 68 89 V
55 4 38 49 58 70 79 V
56 4 38 49 58 69 80 V

Appendix A. V − I Measurements 99
Table A.8: V − I measurement Before degradation (BE samples)
Samples 0.001 0.01 0.1 1 10 100 current (mA)
1 6 87 170 177 187 201 V
2 6 93 175 182 191 208 V
3 6 97 176 182 192 208 V
4 6 90 173 181 191 207 V
5 6 95 173 182 190 207 V
6 6 100 169 179 188 202 V
7 6 88 174 182 191 207 V
8 6 90 178 185 195 210 V
9 6 101 168 175 184 200 V
10 7 92 171 177 187 201 V
11 6 91 168 176 185 199 V
12 6 82 167 176 184 198 V
14 6 80 165 174 183 197 V
15 6 91 166 173 182 196 V
16 6 83 168 174 183 199 V
17 7 87 173 181 191 206 V
18 7 92 175 182 191 206 V
19 6 88 166 176 184 199 V
20 6 91 175 182 192 205 V
21 6 83 165 173 182 196 V
22 6 91 177 183 192 209 V
23 6 80 174 183 190 205 V
24 6 94 167 173 183 198 V
25 6 98 179 185 195 211 V
26 6 97 171 179 188 203 V
27 6 85 168 176 186 200 V
28 6 100 176 183 192 209 V
29 6 101 169 176 186 200 V
30 7 101 176 183 192 207 V...
......
......
...... V
60 7 101 176 183 192 207 V

Appendix B
Measurement of the Applied
Voltage and the Leakage Current
The measurement of the applied voltage are:
Table B.1: Measurement of the applied voltage
x y cosx ycosx sinx ysinx cos3x ycos3x sin3x ysin3x
18 4.40 0.9511 4.1847 0.3090 1.3597 0.5878 2.5863 0.8090 3.5597
36 7.60 0.8090 6.1486 0.5878 4.4672 -0.3090 -2.3486 0.9511 7.2281
54 11.2 0.5878 6.5833 0.8090 9.0610 -0.9511 -10.6519 0.3090 3.4610
72 13.6 0.3090 4.2027 0.9511 12.9344 -0.8090 -11.0027 -0.5878 -7.9939
90 14 0 0 1 14 0 0 -1 -14
108 13.6 -0.3090 -4.2027 0.9511 12.9344 0.8090 11.0027 -0.5878 -7.9939
126 12 -0.5878 -7.0535 0.8090 9.7082 0.9511 11.4127 0.3090 3.7082
144 8.8 -0.8090 -7.1194 0.5878 5.1726 0.3090 2.7194 0.9511 8.3693
162 4.4 -0.9511 -4.1847 0.3090 1.3597 -0.5878 -2.5863 0.8090 3.5597
180 -0.8 -1 0.8 0 0 -1 0.8 0 0
198 -4.8 -0.9511 4.5651 -0.3090 1.4833 -0.5878 2.8214 -0.8090 3.8833
216 -8 -0.8090 6.4722 -0.5878 4.7023 0.3090 -2.4722 -0.9511 7.6085
234 -11.6 -0.5878 6.8184 -0.8090 9.3846 0.9511 -11.0323 -0.3090 3.5846
252 -14.4 -0.3090 4.4499 -0.9511 13.6953 0.8090 -11.6499 0.5878 -8.4642
270 -14.8 0 0 -1 14.8 0 0 1 -14.8
288 -14 0.3090 -4.3263 -0.9511 13.3148 -0.8090 11.3263 0.5878 -8.2291
306 -12.4 24.17 -1.2849 7.25 1.359688 0.58779 2.586276 0.80902 3.559688
324 -9.2 0.8090 -7.4430 -0.5878 5.4077 -0.3090 2.8430 -0.9511 8.7498
342 -4.80 0.9511 -4.5651 -0.3090 1.4833 0.5878 -2.8214 -0.8090 3.8833
360 0.00 1 0 0 0 1 0 0 0
Since the value of 0.02 in the CSV data corresponds 360o (See time-domain fig. 5.1 and
others), the following relationship applies to determine the angle values in CSV data:
100

Appendix B. Measurement of the Applied Voltage and the Leakage Current 101
Table B.2: Measurement of the applied voltage
x y cos5x ycos5x sin5x ysin5x cos7x ycos7x sin7x ysin7x
18 4.40 0 0 1 4.4 -0.5878 -2.5863 0.8090 3.5597
36 7.60 -1 -7.6 0 0 -0.3090 -2.3486 -0.9511 -7.2281
54 11.2 0 0 -1 -11.2 0.9511 10.6519 0.3090 3.4610
72 13.6 1 13.6 0 0 -0.8090 -11.0027 0.5878 7.9939
90 14 0 0 1 14 0 0 -1 -14
108 13.6 -1 -13.6 0 0 0.8090 11.0027 0.5878 7.9939
126 12 0 0 -1 -12 -0.9511 -11.4127 0.3090 3.7082
144 8.8 1 8.8 0 0 0.3090 2.7194 -0.9511 -8.3693
162 4.4 0 0 1 4.4 0.5878 2.5863 0.8090 3.5597
180 -0.8 -1 0.8 0 0 -1 0.8 0 0
198 -4.8 0 0 -1 4.8 0.5878 -2.8214 -0.8090 3.8833
216 -8 1 -8 0 0 0.3090 -2.4722 0.9511 -7.6085
234 -11.6 0 0 1 -11.6 -0.9511 11.0323 -0.3090 3.5846
252 -14.4 -1 14.4 0 0 0.8090 -11.6499 -0.5878 8.4642
270 -14.8 0 0 -1 14.8 0 0 1 -14.8
288 -14 1 -14 0 0 -0.8090 11.3263 -0.5878 8.2291
306 -12.4 0 0 1 -12.4 0.9511 -11.7931 -0.3090 3.8319
324 -9.2 -1 9.2 0 0 -0.3090 2.8430 0.9511 -8.7498
342 -4.80 0 0 -1 4.8 -0.5878 2.8214 -0.8090 3.8833
360 0.00 1 0 0 0 1 0 0 0
18o = 18×0.02360 = 1.00 x 10⁻³; 36o = 36×0.02
360 = 2.00 x 10⁻³; 54o = 54×0.02360 = 3.00 x 10⁻³;
342o = 342×0.02360 = 1.900 x 10⁻²; 360o = 360×0.02
360 = 2.00 x 10⁻²
an =
∑ycosnx
0.01(B.1)
bn =
∑ysinnx
0.01(B.2)
cn =√a2n + b2n (B.3)
ψn = arctananbn
(B.4)

Appendix B. Measurement of the Applied Voltage and the Leakage Current 102
Table B.3: Harmonic Components of the applied voltage: BEW samples
order an bn cn ψn %
1 -195.85 14530 14531 -0.77 -
3 273.97 -5.38 274.02 -88.88 1.89
5 360 1.78E-13 360 90 2.5
7 -30.366 139.72 136.38 -12.262 0.94
Table B.4: Harmonic Components of the applied voltage: BEH samples
order an bn cn ψn %
1 -6594.5 12664 14278 -27.507 -
3 889.67 58.019 891.56 86.269 6.24
5 720 340 796.24 64.722 5.58
7 935.28 146.46 946.68 81.10 6.63
Table B.5: Harmonic Components of the applied voltage: YWW samples
order an bn cn ψn %
1 115.91 13304 13305 0.5 -
3 160 -60 170.88 26.15 1.28
5 110.95 226.01 251.77 -69.44 1.89
7 -35.671 89.34 96.198 -21.77 0.72
Table B.6: Harmonic Components of the applied voltage: YWH samples
order an bn cn ψn %
1 132550 9688.6 13290 85.819 -
3 1230.9 429.18 1303.6 70.79 9.8
5 760 520 920.87 55.62 6.9
7 -671.51 386.19 774.64 -60.096 5.8
Table B.7: Harmonic Components the applied voltage: RLW samples
order an bn cn ψn %
1 187010 14046 187540 85.705 -
3 2800 -0.002 2800 21.921 1.49
5 1857.5 4615.9 497.56 -90 2.65
7 -198.11 112.55 227.85 -60.398 0.12
Table B.8: Harmonic Components of the applied voltage: RLH samples
order an bn cn ψn %
1 1440.6 14212 14285 5.788 -
3 -588.89 -244.55 637.65 67.448 4.5
5 -520 -580 778.97 41.878 5.5
7 -474.43 -474.43 670.95 45 4.7

Appendix B. Measurement of the Applied Voltage and the Leakage Current 103
Table B.9: Measurement of the Leakage Current
x y cosx ycosx sinx ysinx cos3x ycos3x sin3x ysin3x
18 0.096 4.20 0.4032 0.3090 0.0297 0.5878 0.0564 0.809 0.078
36 0.06 7.6 0.456 0.5878 0.03553 -0.3090 -0.0185 0.951 0.057
54 0.048 10.6 0.5088 0.8090 0.0388 -0.9511 -0.04565 0.309 0.015
72 0.028 12.8 0.3584 0.9511 0.0266 -0.8090 -0.0227 -0.588 -0.017
90 0.008 12.8 0.1024 1 0.008 0 0 -1 -0.008
108 0.012 12.4 0.1488 0.9511 0.0114 0.8090 0.0097 -0.588 -0.007
126 0.156 10.8 1.6848 0.8090 0.126 0.9511 0.148 0.3090 0.048
144 0.264 7.8 2.059 0.5878 0.1552 0.3090 0.0816 0.9511 0.251
162 0.188 4.00 0.752 0.3090 0.0581 -0.5878 -0.1105 0.8090 0.152
180 -0.184 -1 0.184 0 0 -1 0.184 0 0
198 -0.096 -4.4 0.4224 -0.3090 0.0297 -0.5878 0.0564 -0.809 0.078
216 -0.044 -8 0.352 -0.5878 0.0259 0.3090 -0.0136 -0.951 0.042
234 -0.044 -10.8 0.475 -0.8090 0.0356 0.9511 -0.0418 -0.309 0.0136
252 -0.032 -13 0.416 -0.9511 0.0304 0.8090 -0.0259 0.5878 -0.019
270 -0.016 -12.8 0.2048 -0.9511 0.0152 -0.8090 0.0129 0.588 -0.009
288 -14 0.3090 -4.3263 -0.9511 13.3148 -0.8090 11.3263 0.588 -8.23
306 -0.164 -11 1.804 -0.8090 0.1327 -0.9511 0.156 -0.454 0.075
324 -0.028 -8.00 2.24 -0.5878 0.1646 -0.3090 0.0865 -0.9511 0.266
342 -0.204 -4 0.816 -0.3090 0.0630 0.5878 -0.1199 -0.8090 0.165
360 0.196 0.4 0.0784 0 0 1 0.196 0 0
Table B.10: Measurement of the Leakage Current
x y cos5x ycos5x sin5x ysin5x cos7x ycos7x sin7x ysin7x
18 0.096 0 0 1 -0.192 -0.58779 0.112856 0.80902 -0.15533
36 7.60 -1 0.136 0 0 -0.3090 0.04203 -0.9511 0.1293
54 11.2 0 0 -1 0.088 0.9511 -0.0837 0.3090 -0.027194
72 13.6 1 -0.064 0 0 -0.8090 0.0517773 0.5878 -0.037619
90 14 0 0 1 -0.04 0 0 -1 0.04
108 13.6 -1 -0.012 0 0 0.8090 0.009708 0.5878 0.0070535
126 12 0 0 -1 -0.156 -0.9511 -0.1483654 0.3090 0.048207
144 8.8 1 0.264 0 0 0.3090 0.08158 -0.9511 -0.25108
162 4.4 0 0 1 0.188 0.5878 0.110505 0.8090 0.152096
180 -0.8 -1 0.184 0 0 -1 0.184 0 0
198 -4.8 0 0 -1 0.096 0.5878 -0.05643 -0.8090 0.07767
216 -8 1 -0.044 0 0 0.3090 -0.0136 0.9511 -0.04185
234 -11.6 0 0 1 -0.044 -0.9511 0.041847 -0.3090 0.013597
252 -14.4 -1 0.032 0 0 0.8090 -0.02589 -0.5878 0.018809
270 -14.8 0 0 -1 0.024 0 0 1 -0.024
288 -14 1 -0.016 0 0 -0.8090 0.012944 -0.5878 0.009405
306 -12.4 0 0 1 -0.164 0.9511 -0.15597 -0.3090 0.050679
324 -9.2 -1 0.28 0 0 -0.3090 0.086526 0.9511 -0.2663
342 -4.80 0 0 -1 0.204 -0.5878 0.119909 -0.8090 0.16504
360 0.00 1 0.196 0 0 1 0.196 0 0

Appendix B. Measurement of the Applied Voltage and the Leakage Current 104
Table B.11: Resistive Current Components: BEW samples
Components Sample 1 Sample 2 Sample 3 Sample 4 Sample 5 Ave.Value Unit
Fund. 0.011 0.014 0.013 0.012 0.013 0.013 mA
Third 0.006 0.005 0.007 0.004 0.005 0.0054 mA
Fifth 0.004 0.004 0.0025 0.0026 0.003 0.00322 mA
Table B.12: Resistive Current Components: BEH samples
Components Sample 1 Sample 2 Sample 3 Sample 4 Sample 5 Ave.Value Unit
Fund. 0.137 0.14 0.134 0.137 0.138 0.137 mA
Third 0.109 0.105 0.101 0.099 0.104 0.104 mA
Fifth 0.079 0.085 0.082 0.08 0.082 0.082 mA
Table B.13: Resistive Current Components: YWW samples
Components Sample 1 Sample 2 Sample 3 Sample 4 Sample 5 Ave.Value Unit
Fund. 0.09 0.065 0.071 0.061 0.062 0.07 mA
Third 0.057 0.061 0.059 0.06 0.061 0.06 mA
Fifth 0.0048 0.0052 0.0049 0.005 0.0051 0.005 mA
Table B.14: Resistive Current Components: YWH samples
Components Sample 1 Sample 2 Sample 3 Sample 4 Sample 5 Ave.Value Unit
Fund. 0.239 0.237 0.25 0.238 0.241 0.24 mA
Third 0.173 0.161 0.158 0.156 0.153 0.16 mA
Fifth 0.062 0.071 0.06 0.057 0.055 0.061 mA
Table B.15: Resistive Current Components: RLW samples
Components Sample 1 Sample 2 Sample 3 Sample 4 Sample 5 Ave.Value Unit
Fund. 0.03 0.036 0.042 0.044 0.049 0.04 mA
Third 0.0026 0.0025 0.0031 0.0039 0.0029 0.003 mA
Fifth 0.0016 0.0015 0.0016 0.0019 0.0019 0.0017 mA
Table B.16: Resistive Current Components: RLH samples
Components Sample 1 Sample 2 Sample 3 Sample 4 Sample 5 Ave.Value Unit
Fund. 0.34 0.36 0.38 0.37 0.35 0.36 mA
Third 0.26 0.28 0.3 0.29 0.27 0.28 mA
Fifth 0.2 0.21 0.19 0.21 0.22 0.21 mA

Appendix C
Times to degradation
The times to degradation, the percentage cumulative degradation and the logarithmic
values assigned to the BEW, BEH, YWW, YWH, RLW and RLH samples are given:
Table C.1: Times to degradation for BEW Samples
tm(minutes) ti (hours) F (i, n) (%) xi yi1 100.5 0.93 -4.6731 4.61
1 100.5 2.59 -3.6404 4.615
1 100.5 4.25 -3.1366 4.61
2 201.1 5.91 -2.7982 5.3
2 201.1 7.57 -2.5419 5.3
2 201.1 9.23 -2.3347 5.3
3 301.6 10.89 -2.1602 5.71
6 603.2 12.55 -2.0091 6.4
6 603.2 14.21 -1.8756 6.4
6 603.2 15.87 -1.7556 6.4
7 703.7 17.53 -1.6464 6.56
7 703.7 19.19 -1.5461 6.56
8 804.3 20.85 -1.4532 6.69
13 1307 22.51 -1.3664 7.18
14 1407 24.17 -1.2849 7.25
14 1408 25.83 -1.2079 7.25
15 1508 27.49 -1.1349 7.32
15 1508 29.15 -1.0654 7.32
16 1609 30.81 -0.99882 7.38
17 1709 32.47 -0.93497 7.44
17 1709 34.12 -0.87387 7.44
19 1910 35.78 -0.81451 7.55
20 2011 37.44 -0.75706 7.61
23 2312 40.76 -0.64708 7.75
28 2815 42.42 -0.59422 7.94
34 3418 44.83 -0.51961 8.14
105

Appendix C. Times to degradation 106
Applying equation (2.5) yields the correlation factor for BEW varistor components:
η (xi, yi) = (−4.6731+44.4721)·(4.61−179.65)+...+(−0.51961+44.4721)·(8.14−179.65)√[(−4.6731+44.4721)2+...+(−0.51961+44.4721)2]·[(4.61−179.65)2+...+(8.14−179.65)2]
η (xi, yi) = 0.955857 which is higher than the critical coefficient value (See figure 2.1 ).
Equation (2.6) enables the determination of the shape parameter for BEW samples:
β = (−4.6731+44.4721)2+...+(−0.51961+44.4721)2
[(−4.6731+44.4721)·(4.61−179.65)]+...+[(−0.51961+44.4721)·(8.14−179.65)]
β = 0.97961
The scale parameter is calculated using equation (2.7):
θ = exp[179.65− [(−4.6731+44.4721)·(4.61−179.65)]+...+[(−0.51961+44.4721)·(8.14−179.65)]
(−4.6731+44.4721)2+...+(−0.51961+44.4721)2· (−44.4721)
]
θ = 4167.6 hours.
For BEH samples:
Applying equation (2.5) yields the correlation factor:
η (xi, yi) = (−4.6731+1.29364)·(4.61−6.73)+...+(−0.68882+1.29364)·(8.011−6.73)√[(−4.6731+1.29364)2+...+(−0.68882+1.29364)2]·[(4.61−6.73)2+...+(8.011−6.73)2]
η (xi, yi) = 0.958317 which is higher than the critical coefficient value (See figure 2.1 ).
Equation (2.6) enables the determination of the shape parameter for BEH samples:
β = (−4.6731+1.29364)2+...+(−0.68882+1.29364)2
[(−4.6731+1.29364)·(4.61−6.73)]+...+[(−0.68882+1.29364)·(8.011−6.73)]
β = 1.0929
The scale parameter is calculated using equation (2.7):
θ = exp[6.73− [(−4.6731+1.29364)·(4.61−6.73)]+...+[(−0.68882+1.29364)·(8.011−6.73)]
(−4.6731+1.29364)2+...+(−0.68882+1.29364)2· (−1.29364)
]
θ = 2746.5 hours.
Applying equation (2.5) yields the correlation factor for YWW varistor components:
η (xi, yi) = (−4.6731+1.31044)·(4.61−6.107127)+...+(−0.1142+1.31044)·(7.606−6.107127)√[(−4.6731+1.31044)2+...+(−0.1142+1.31044)2]·[(4.61−6.107127)2+...+(7.606−6.107127)2]

Appendix C. Times to degradation 107
Table C.2: Times to degradation for BEH Samples
tm(minutes) ti (hours) F (i, n) (%) xi yi1 100.5 0.93 -4.6731 4.610158
1 100.5 2.59 -3.6404 4.610158
1 100.5 4.25 -3.1366 4.610158
2 201.1 5.91 -2.7982 5.306782
2 201.1 7.57 -2.5419 5.306782
2 201.1 9.23 -2.3347 5.306782
3 301.6 10.89 -2.1602 5.709102
3 301.6 12.55 -2.0091 5.709102
3 301.6 14.21 -1.8756 5.709102
5 502.67 15.87 -1.7556 6.219934
5 502.67 17.53 -1.6464 6.219934
5 502.67 19.19 -1.5461 6.219934
10 1005.3 20.85 -1.4532 6.913041
10 1005.3 22.51 -1.3664 6.913041
10 1005.3 24.17 -1.2849 6.913041
11 1105.9 25.83 -1.2079 7.008415
11 1105.9 27.49 -1.1349 7.008415
11 1105.9 29.15 -1.0654 7.008415
11 1105.9 30.81 -0.99882 7.008415
12 1206.4 32.47 -0.93497 7.095396
12 1206.4 34.12 -0.87387 7.095396
12 1206.4 35.78 -0.81451 7.095396
14 1407.5 37.44 -0.75706 7.249571
14 1407.5 39.10 -0.70131 7.249571
15 1508 40.76 -0.64708 7.318540
15 1508 42.42 -0.59422 7.318540
15 1508 44.83 -0.51961 7.318540
15 1508 45.74 -0.49203 7.318540
19 1910.1 47.4 -0.44246 7.554911
20 2010.7 49.06 -0.39375 7.606238
20 2010.7 50.72 -0.3458 7.606238
20 2010.7 52.38 -0.29852 7.606238
20 2010.7 54.04 -0.20557 7.606238
24 2412.8 55.7 -0.49203 7.788543
30 3016 57.36 -0.15973 8.011687
30 3016 59.02 -0.11419 8.011687
30 3016 60.68 -0.68882 8.011687
η (xi, yi) = 0.935602 which is higher than the critical coefficient value (See figure 2.1 ).
Equation (2.6) enables the determination of the shape parameter for YWW samples:
β = (−4.6731+1.31044)2+...+(−0.1142+1.31044)2
[(−4.6731+1.31044)·(4.61−6.107127)]+...+[(−0.11421+1.31044)·(7.606−6.107127)]
β = 1.4578

Appendix C. Times to degradation 108
Table C.3: Times to degradation for YWW Samples
tm(minutes) ti (hours) F (i, n) (%) xi yi1 100.5 0.93 -4.6731 4.610456
1 100.5 2.59 -3.6404 4.610456
1 100.5 4.25 -3.1366 4.610456
2 201.1 5.91 -2.7982 5.303554
2 201.1 7.57 -2.5419 5.303554
2 201.1 9.23 -2.3347 5.303554
2 201.1 10.89 -2.1602 5.303554
2 201.1 12.55 -2.0091 5.303554
3 301.6 14.21 -1.8756 5.709035
3 301.6 15.87 -1.7556 5.709035
3 301.6 17.53 -1.6464 5.709035
3 301.6 19.19 -1.5461 5.709035
3 301.6 20.85 -1.4532 5.709035
3 301.6 22.51 -1.3664 5.709035
4 402.1 24.17 -1.2849 5.996701
4 402.1 25.83 -1.2079 5.996701
4 402.1 27.49 -1.1349 5.996701
5 502.63 29.15 -1.0654 6.219854
5 502.63 30.81 -0.99882 6.219854
5 502.63 32.47 -0.93497 6.219854
5 502.63 34.12 -0.87387 6.219854
5 502.63 35.78 -0.81451 6.219854
6 603.16 37.44 -0.75706 6.402183
6 603.16 39.10 -0.70131 6.402183
7 703.68 40.76 -0.64708 6.556324
7 703.68 42.42 -0.59422 6.556324
8 804.21 44.83 -0.51961 6.689860
8 804.21 45.74 -0.49203 6.689860
8 804.21 47.4 -0.44246 6.689860
9 904.73 49.06 -0.39375 6.807637
10 1005.3 50.72 -0.3458 6.913041
10 1005.3 52.38 -0.29852 6.913041
13 1306.8 54.04 -0.2518 7.175337
15 1507.9 55.7 -0.20557 7.318473
17 1708.9 57.36 -0.15973 7.443605
20 2010.5 59.02 -0.11419 7.606139
The scale parameter is calculated using equation (2.7):
θ = exp[6.107127− [(−4.6731+1.31044)·(4.61−6.107127)]+...+[(−0.1142+1.31044)·(8.14−6.107127)]
(−4.6731+1.31044)2+...+(−0.1142+1.31044)2· (−1.31044)
]
θ = 1103.3 hours.
For YWH samples:

Appendix C. Times to degradation 109
Applying equation (2.5) yields the correlation factor:
η (xi, yi) = (−4.6731+0.96645)·(4.61−6.024655)+...+(0.3933+0.96645)·(7.008−6.024655)√[(−4.6731+1.29364)2+...+(0.3933+0.96645)2]·[(4.61−6.024655)2+...+(7.008−6.024655)2]
η (xi, yi) = 0.951579 which is higher than the critical coefficient value (See figure 2.1 ).
Equation (2.6) enables the determination of the shape parameter for YWH samples:
β = (−4.6731+0.96645)2+...+(0.3933+0.96645)2
[(−4.6731+0.96645)·(4.61−6.024655)]+...+[(0.3933+0.96645)·(7.008−6.024655)]
β = 1.7141
The scale parameter is calculated using equation (2.7):
θ = exp[6.73− [(−4.6731+0.96645)·(4.61−6.024655)]+...+[(0.3933+0.96645)·(7.008−6.024655)]
(−4.6731+0.96645)2+...+(0.3933+0.96645)2· (−0.96645)
]
θ = 726.68 hours.
Applying equation (2.5) yields the correlation factor for RLW varistor components:
η (xi, yi) = (−4.6731+1.14801)·(4.61−6.280336)+...+(0.11191+1.14801)·(7.31847−6.280336)√[(−4.6731+1.14801)2+...+(0.11191+1.14801)2]·[(4.61−6.280336)2+...+(7.31847−6.280336)2]
η (xi, yi) = 0.969156 which is higher than the critical coefficient value (See figure 2.1 ).
Equation (2.6) enables the determination of the shape parameter for RLW samples:
β = (−4.6731+1.14801)2+...+(0.11191+1.14801)2
[(−4.6731+1.14801)·(4.61−6.280336)]+...+[(0.11191+1.14801)·(7.31847−6.280336)]
β = 1.63
The scale parameter is calculated using equation (2.7):
θ = exp[6.280336− [(−4.6731+1.14801)·(4.61−6.280336)]+...+[(0.11191+1.14801)·(8.14−6.280336)]
(−4.6731+1.14801)2+...+(−0.1142+1.14801)2· (−1.14801)
]
θ = 1079.4 hours.
For RLH samples:
Applying equation (2.5) yields the correlation factor:
η (xi, yi) = (−4.6731+0.83043)·(4.61−6.166468)+...+(0.3933+0.83043)·(7.09531−6.1664685)√[(−4.6731+0.83043)2+...+(0.3933+0.83043)2]·[(4.61−6.166468)2+...+(7.09531−6.166468)2]

Appendix C. Times to degradation 110
η (xi, yi) = 0.974395 which is higher than the critical coefficient value (See figure 2.1 ).
Equation (2.6) enables the determination of the shape parameter for RLH samples:
β = (−4.6731+0.83043)2+...+(0.7877+0.83043)2
[(−4.6731+0.83043)·(4.61−6.166468)]+...+[(0.7877+0.83043)·(7.09531−6.166468)]
β = 1.75
The scale parameter is calculated using equation (2.7):
θ = exp[6.166468− [(−4.6731+0.83043)·(4.61−6.166468)]+...+[(0.7877+0.83043)·(7.09531−6.166468)]
(−4.6731+0.83043)2+...+(0.7877+0.83043)2· (−0.83043)
]
θ = 765.22 hours.
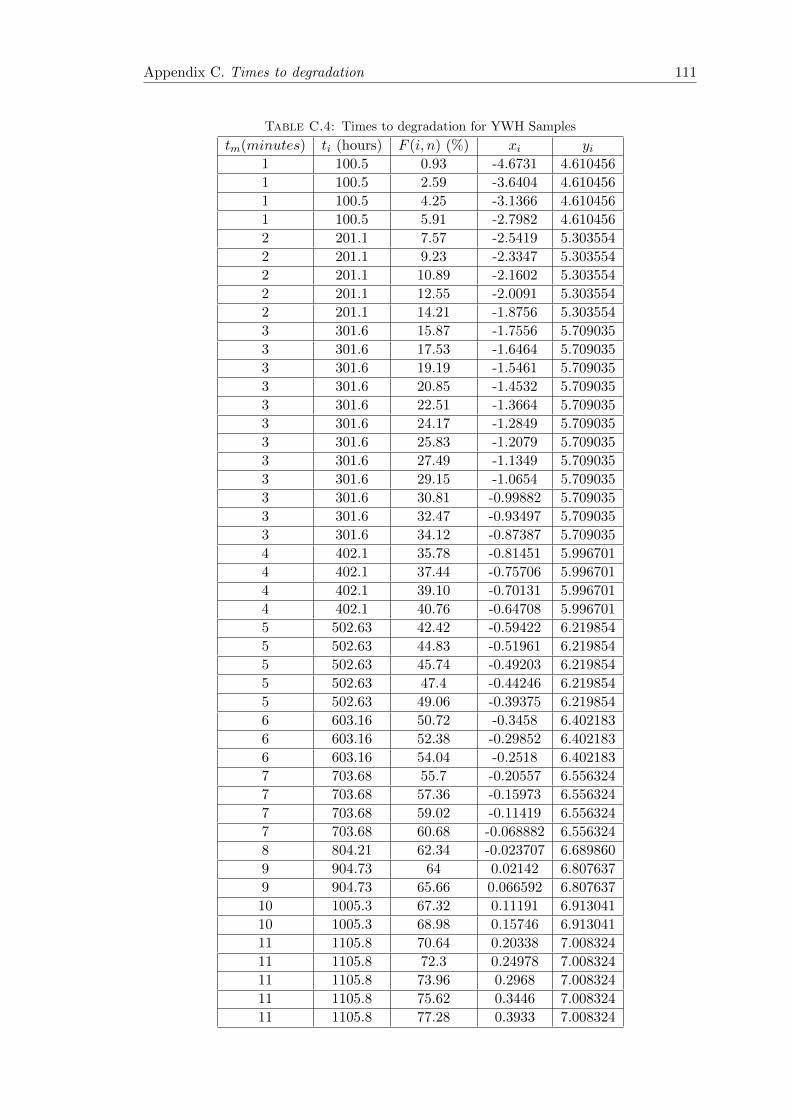
Appendix C. Times to degradation 111
Table C.4: Times to degradation for YWH Samples
tm(minutes) ti (hours) F (i, n) (%) xi yi1 100.5 0.93 -4.6731 4.610456
1 100.5 2.59 -3.6404 4.610456
1 100.5 4.25 -3.1366 4.610456
1 100.5 5.91 -2.7982 4.610456
2 201.1 7.57 -2.5419 5.303554
2 201.1 9.23 -2.3347 5.303554
2 201.1 10.89 -2.1602 5.303554
2 201.1 12.55 -2.0091 5.303554
2 201.1 14.21 -1.8756 5.303554
3 301.6 15.87 -1.7556 5.709035
3 301.6 17.53 -1.6464 5.709035
3 301.6 19.19 -1.5461 5.709035
3 301.6 20.85 -1.4532 5.709035
3 301.6 22.51 -1.3664 5.709035
3 301.6 24.17 -1.2849 5.709035
3 301.6 25.83 -1.2079 5.709035
3 301.6 27.49 -1.1349 5.709035
3 301.6 29.15 -1.0654 5.709035
3 301.6 30.81 -0.99882 5.709035
3 301.6 32.47 -0.93497 5.709035
3 301.6 34.12 -0.87387 5.709035
4 402.1 35.78 -0.81451 5.996701
4 402.1 37.44 -0.75706 5.996701
4 402.1 39.10 -0.70131 5.996701
4 402.1 40.76 -0.64708 5.996701
5 502.63 42.42 -0.59422 6.219854
5 502.63 44.83 -0.51961 6.219854
5 502.63 45.74 -0.49203 6.219854
5 502.63 47.4 -0.44246 6.219854
5 502.63 49.06 -0.39375 6.219854
6 603.16 50.72 -0.3458 6.402183
6 603.16 52.38 -0.29852 6.402183
6 603.16 54.04 -0.2518 6.402183
7 703.68 55.7 -0.20557 6.556324
7 703.68 57.36 -0.15973 6.556324
7 703.68 59.02 -0.11419 6.556324
7 703.68 60.68 -0.068882 6.556324
8 804.21 62.34 -0.023707 6.689860
9 904.73 64 0.02142 6.807637
9 904.73 65.66 0.066592 6.807637
10 1005.3 67.32 0.11191 6.913041
10 1005.3 68.98 0.15746 6.913041
11 1105.8 70.64 0.20338 7.008324
11 1105.8 72.3 0.24978 7.008324
11 1105.8 73.96 0.2968 7.008324
11 1105.8 75.62 0.3446 7.008324
11 1105.8 77.28 0.3933 7.008324

Appendix C. Times to degradation 112
Table C.5: Times to degradation for RLW Samples
tm(minutes) ti (hours) F (i, n) (%) xi yi1 100.5 0.93 -4.6731 4.610456
1 100.5 2.59 -3.6404 4.610456
1 100.5 4.25 -3.1366 4.610456
2 201.05 5.91 -2.7982 5.303554
3 301.6 7.57 -2.5419 5.709035
3 301.6 9.23 -2.3347 5.709035
3 301.6 10.89 -2.1602 5.709035
3 301.6 12.55 -2.0091 5.709035
3 301.6 14.21 -1.8756 5.709035
4 402.1 15.87 -1.7556 5.996701
4 402.1 17.53 -1.6464 5.996701
4 402.1 19.19 -1.5461 5.996701
4 402.1 20.85 -1.4532 5.996701
4 402.1 22.51 -1.3664 5.996701
5 301.6 24.17 -1.2849 6.219854
5 301.6 25.83 -1.2079 6.219854
5 301.6 27.49 -1.1349 6.219854
5 301.6 29.15 -1.0654 6.219854
5 301.6 30.81 -0.99882 6.219854
5 301.6 32.47 -0.93497 6.219854
5 301.6 34.12 -0.87387 6.219854
5 402.1 35.78 -0.81451 6.219854
7 703.68 37.44 -0.75706 6.556324
7 703.68 39.10 -0.70131 6.556324
7 703.68 40.76 -0.64708 6.556324
7 703.68 42.42 -0.59422 6.556324
7 703.68 44.83 -0.51961 6.556324
7 703.68 45.74 -0.49203 6.556324
7 703.68 47.4 -0.44246 6.556324
8 804.21 49.06 -0.39375 6.689860
9 904.73 50.72 -0.3458 6.807637
9 904.73 52.38 -0.29852 6.807637
10 1005.3 54.04 -0.2518 6.913041
11 1105.8 55.7 -0.20557 7.008324
11 1105.8 57.36 -0.15973 7.008324
11 1105.8 59.02 -0.11419 7.008324
12 703.68 60.68 -0.068882 7.095313
12 804.21 62.34 -0.023707 7.095313
13 1306.8 64 0.02142 7.175337
14 1407.4 65.66 0.066592 7.249499
15 1507.9 67.32 0.11191 7.318473

Appendix C. Times to degradation 113
Table C.6: Times to degradation for RLH Samples
tm(minutes) ti (hours) F (i, n) (%) xi yi1 100.5 0.93 -4.6731 4.610456
1 100.5 2.59 -3.6404 4.610456
1 100.5 4.25 -3.1366 4.610456
1 100.5 5.91 -2.7982 4.610456
1 100.5 7.57 -2.5419 4.610456
2 201.05 9.23 -2.3347 5.303554
2 201.05 10.89 -2.1602 5.303554
2 201.05 12.55 -2.0091 5.303554
2 201.05 14.21 -1.8756 5.303554
2 201.05 15.87 -1.7556 5.303554
2 201.05 17.53 -1.6464 5.303554
3 301.58 19.19 -1.5461 5.709035
3 301.58 20.85 -1.4532 5.709035
3 301.58 22.51 -1.3664 5.709035
4 402.1 24.17 -1.2849 5.996701
4 402.1 25.83 -1.2079 5.996701
4 402.1 27.49 -1.1349 5.996701
4 402.1 29.15 -1.0654 5.996701
4 402.1 30.81 -0.99882 5.996701
4 402.1 32.47 -0.93497 5.996701
4 402.1 34.12 -0.87387 5.996701
5 502.63 35.78 -0.81451 6.219854
5 502.63 37.44 -0.75706 6.219854
5 502.63 39.10 -0.70131 6.219854
5 502.63 40.76 -0.64708 6.219854
5 502.63 42.42 -0.59422 6.219854
5 502.63 44.83 -0.51961 6.219854
5 502.63 45.74 -0.49203 6.219854
5 502.63 47.4 -0.44246 6.219854
6 603.16 49.06 -0.39375 6.402183
6 603.16 50.72 -0.3458 6.402183
6 603.16 52.38 -0.29852 6.402183
6 603.16 54.04 -0.2518 6.402183
6 603.16 55.7 -0.20557 6.402183
6 603.16 57.36 -0.15973 6.402183
7 703.68 59.02 -0.11419 6.556324
7 703.68 60.68 -0.068882 6.556324
7 703.68 62.34 -0.023707 6.556324
7 703.68 64 0.02142 6.556324
7 703.68 65.66 0.066592 6.556324
8 804.21 67.32 0.11191 6.689860
8 804.21 68.98 0.15746 6.689860

Appendix C. Times to degradation 114
Table C.7: Times to degradation for RLH Samples(Continued)
tm(minutes) ti (hours) F (i, n) (%) xi yi9 904.73 70.64 0.20338 6.807637
9 904.73 72.3 0.24978 6.807637
9 904.73 73.96 0.2968 6.807637
9 904.73 75.62 0.3446 6.807637
10 1507.9 77.28 0.3933 6.913041
10 1507.9 78.94 0.4433 6.913041
10 1507.9 80.6 0.4946 6.913041
10 1507.9 82.26 0.5477 6.913041
10 1507.9 83.92 0.603 6.913041
11 1507.9 85.58 0.6609 7.008324
11 1507.9 87.24 0.7222 7.008324
11 1507.9 88.9 0.7877 7.008324
12 1507.9 90.56 0.8588 7.095313
12 1507.9 92.22 0.93751 7.095313

Appendix D
Chi-Square Distribution Table
Calculation of the test stastic of the hypothesis testing:
BE Samples:
z = −2 ln
∏4500i=200
β1θ1·(t−γθ1
)β1−1exp
[−(t−γθ1
)β1]∏4500i=200
β2θ2·(t−γθ2
)β2−1exp
[−(t−γθ2
)β2] ≥ χ20.01
z =(2.46×10−4×0.91)×...×(2.35×10−4×0.36)(3.33×10−4×0.85)×...×(4.16×10−4×0.17)
z = 2.1460 < 6.635 (See figure 92).
YW Samples:
z = −2 ln
∏1200i=200
β1θ1·(t−γθ1
)β1−1exp
[−(t−γθ1
)β1]∏1200i=200
β2θ2·(t−γθ2
)β2−1exp
[−(t−γθ2
)β2] ≥ χ20.01
z =(4.37×10−4×0.96)×...×(1.32×10−3×0.63)(5.73×10−4×0.91)×...×(3.16×10−3×0.34)
z = 0.63976 < 6.635 (See figure 92).
RL Samples:
z = −2 ln
∏1400i=200
β1θ1·(t−γθ1
)β1−1exp
[−(t−γθ1
)β1]∏1400i=200
β2θ2·(t−γθ2
)β2−1exp
[−(t−γθ2
)β2] ≥ χ20.01
z =(4.37×10−4×0.86)×...×(1.43×10−3×0.14)(5.73×10−4×0.79)×...×(3.56×10−3×0.05)
z = - 1.2855 < 6.635 (See figure 92).
115

Appendix D. Chi-Square Distribution Table 116
Figure D.1: Chi-Square Table [73]

Bibliography
[1] G. D’ Antona, C. Muscas, and S. Sulis. Harmonic source estimation: a new ap-
proach for the localisation of non- linear loads. Proceedings of the 13th International
Conference on Harmonics and Quality of Power, Wollongong, Australia, October
2008.
[2] D. Serfontein and A. Rens. The validation of single point measurements for the
localisation of multiple harmonic sources. Proceedings of the 14th International
Conference on Harmonics and Quality of Power, Bergamo, Italy, September 2010.
[3] M. Balci and M. Hocaoglu. On the validity of harmonic source detection methods
and indices. Proceedings of the 14th International Conference on Harmonics and
Quality of Power, Bergamo, Italy, September 2010.
[4] R. Herrera, P. Salmeron, and S. Litran. Assessment of harmonic distortion sources
in power networks with capacitor banks. Proceedings of the 11th International Con-
ference on Renewable Energies and Power Quality, Las Palmas de Gran Canary,
Spain, April 2011.
[5] C.Nahm. Pulse aging behaviour of zno-pr6o11-coo-cr2o3-dy2o3 varistor ceramics
with sintering time. Ceramics international, 37(6):1409–1414, May 2011.
[6] W. Sun, Y. Li, D. Zeng, R. Cai, and Z. Meng G. Yang. Investigation of voltage-
current characteristics of zno varistors under 8/20 microsecond impulse current. The
IEEE Power Engineering and Automation Conference, Wuhan, China, September
2011.
[7] Z. Nanfa, K. Guoyao, and G. Yaping. Long duration impulse withstand capability of
spd. The Asia-Pacific International Symposium on Electromagnetic Compatibility,
Beijing, China, April 2010.
[8] J. Rossman, J. Nelson, and M. Droke. Reliability and failure of porcelain high-
voltage surge arresters. International Conference on High Voltage Engineering and
Application, New Orleans, USA, October 2010.
117

Bibliography 118
[9] K. Eda, A. Iga, and M. Matsuoka. Degradation mechanism of non-ohmic zinc oxide
ceramics. Journal of Applied Physics, 1(5):2678–2684, January 1980.
[10] C.de Salles, M. L. Martinez, and A.A. de Queiroz. Ageing of metal oxide varitors
due to surges. Proceedings of the International Symposium on Lightning Protection
(XI SIPDA), Fortaleza, Brazil, October 2011.
[11] R.A. Sargent, G. L. Dunlop, and M. Darveniza. Effects of multiple impulse currents
on the microstructure and electrical properties of metal oxide varistors. IEEE
Transactions on Electrical Insulation, 6(3):586–592, June 1992.
[12] P.Osmokrovic, B. Loncar, S. Stankovic, and S.Vasic. Aging of the over-voltage
protection elements caused by over-voltages. Microelectronics Reliability, 12(12):
1959–1966, December 2002.
[13] M.Wang, K.Hu, B.Y. Zhao, and N.F. Zhang. Degradation phenomena due to humid-
ity in low voltage zno varistors. Ceramics International, 11(2):151–154, November
2007.
[14] V. Larsen and K. Lien. In-service testing and diagnosis of gapless metal oxide surge
arresters. Proceedings of the 9th International Symposium on Lightning Protection,
Foz do iguacu, Brazil, November 2007.
[15] A.Vasic, M. Vujisic, K. Stankovic, and P.Osmokrovic. Aging of overvoltage protec-
tion elements caused by past activations. Journal of Microelectronics, Electronic
Components and Materials, 42(3):197–204, October 2012.
[16] Epcos Data Book. Siov metal oxide varistors. pages 51–52, 2008. URL http:
//www.epcos.com.
[17] T. Saha and K. Madira. Modeling metal oxide surge arrester for the modern polar-
ization based diagnostics. IEEE Transactions on Dielectrics and Electrical Insula-
tion, 12(6):1249–1258, December 2005.
[18] C. Nahm. Aging characteristics of zno–pro1.83-based semiconducting varistors for
surge protection reliability. Microelectronics Reliability, 54(11):2417–2422, Novem-
ber 2014.
[19] N. Tsukamoto. Study of degradation by impulse having 4/10lls and 8/20lls wave-
form for movs (metal oxide varistors). 2014 International Conference on Lightning
Protection (ICLP), Shanghai, China, October 2014.
[20] D.Zhou, C.Zhang, and S.Gong. Degradation phenomena due to dc bias in low-
voltage zno varistors. Materials Science and Engineering: B, 1-3(99):412–415, May
2003.

Bibliography 119
[21] T.Gupta. Application of zinc oxide varistors. Journal of American Ceramics Soci-
ety, 73(7):1817–1840, September 1990.
[22] M.Trontelj, D. Kolar, and V. Krasevec. Influence of additives on varistor microstruc-
ture, in advances in ceramics. Journal of American Ceramic Society, 7(7):107–116,
September 1983.
[23] T.Gupta, W.Carlson, M. Yan, and A. Houer. Influence of additives on varistor
microstructure, in advances in ceramics. Journal of American Ceramic Society, 7
(7):30–40, September 1983.
[24] C. Nahm. Microstructure, electrical properties, and aging behavior of
zno–pr6o11–coo–cr2o3–y2o3–er2o3 varistor ceramics. Ceramics International, 37
(8):3049–3054, December 2011.
[25] H. Cui, Q.Wang, and Y. Tu. Thermally stimulated current characteristics of aged
zno varistors under different applied voltage ratios. Proceedings of the Asia-Pacific
Power and Energy Engineering Conference (APPEEC),Wuhan,China, March 2011.
[26] M.Wang, Q.Tang, and C.Yao. Electrical properties and ac degradation characteris-
tics of low voltage zno varistors doped with nd2o3. Ceramics International, 36(3):
1095–1099, January 2010.
[27] J. He, J. Liu, J. Hu, and W. Long. Ac ageing characteristics of y2o3-doped zno varis-
tors with high voltage gradient. Materials Letters, 65(17-18):2595–2597, September
2011.
[28] M. Khederzadeh. Impact of mov operation on power quality in transmission lines
compensated by tcsc. Transmission and distribution conference and exposition,
Chicago, USA, April 2008.
[29] J. Woodworth. Field testing of arresters. ArresterFacts-002, 2011. URL http:
//www.arresterworks.com.
[30] V. Hinrichsen. Monitoring of high voltage metal oxide surge arresters. 6th Inter-
national Conference on Electrical Insulation, Bilbao, Spain, October 1997.
[31] X. Yan, Y. Wen, and X. Yi. Study on the resistive leakage current characteristic of
mov surge arresters. Proceedings of the Asia-Pacific IEEE/PES Transmission and
Distribution Conference and Exhibition,Yokohama, Japan, October 2002.
[32] M.Jaroszewski, P. Kostyla, and K. Wieczorek. Effect of voltage harmonics content
on arrester diagnostic result. Proceedings of the International Conference on Solid
Dielectrics (ICSD 2004), Toulouse, France, July 2004.

Bibliography 120
[33] C. Karawita and M.Raghuveer. Leakage current based assessment of degradation of
mosa using an alternative technique. Annual Report of the Conference on Electrical
Insulation and Dielectric Phenomena (CEIDP’05), pages 199–201, October 2005.
[34] Z.Abdul-Malek, N.Yusof, and M. Yousof. Field experience on surge arrester con-
dition monitoring – modified shifted current method. Proceedings of the 45th Uni-
versities Power Engineering Conference (UPEC 2010), Cardiff, United Kingdom,
September 2010.
[35] M. Khodsuz, M. Mirzaie, and S. Seyyedbarzegar. Metal oxide surge arrester con-
dition monitoring based on analysis of leakage current components. International
Journal of Electrical Power and Energy Systems, 12(6):188–193, November 2014.
[36] E. Shulzhenko, M. Rock, M. Birle, and C. Leu. Applying of surge arresters in
power electronic network components. Proceedings of the International Conference
on Lightning Protection, Shanghai, China, October 2014.
[37] IEEE Standards C62.48 TM-2005. Guide on interactions between power system dis-
turbances and surge-protective devices. IEEE power engineering society, November
2005.
[38] C. Macanda and M. Cantagrel. ac power quality and surge protectors. 7th Asia-
Pacific International Conference on Lightning, Chengdu, China, November 2011.
[39] J. Woodworth. Arrester condition monitors: A state of the art review.
ArresterFacts-036, 2012. URL http://www.arresterworks.com.
[40] P. Cygan and J.R. Laghari. A review of electrical and thermal multistress ageing
models. IEEE International Symposium on Electrical Insulation, Toronto, Canada,
June 1990.
[41] IEEE Standards 930 TM 2007. Guide for the statistical analysis of electrical insula-
tion breakdown data. IEEE Dielectrics and Electrical Insulation Society, September
2007.
[42] R. Ross. Graphical methods for plotting and evaluating weibull distributed data.
IEEE International conference on properties and applications of dielectric materials,
Brisbane, Australia, July 1994.
[43] J. White. The moments of log-weibull order statistics. Technometrics, 11(2):373–
386, February 1969.
[44] H. Yahyaoui, P. Notingher, S. Agnel, and Y. Kieffel. Proprietes dielectriques d’une
resine epoxy chargee d’alumine sous l’effet du champ electrique continu et de la

Bibliography 121
temperature. Journees JCGE’2014 - SEEDS, Jun 2014, Saint- Louis, France, June
2014. URL http://www.hal.archives-ouvertes.fr/hal-01083915.
[45] M. R. Meshkatoddini. Statistical study of the thin metal-oxide varistor ceramics.
Australian Journal of Basic and Applied Sciences, 5(4):751–763, January 2010.
[46] G. L. Amicucci, B. D’Elia, and P. Gentile. Mean time to failure of metal oxide
varistors under lightning stress. Proceedings of the IEEE Power Tech Conference,
Bologna, Italy, June 2003.
[47] K. Brown. Metal oxide varistor degradation. International Association of Electrical
Inspectors (IAEI) News Magazine, April 2004.
[48] J. He, R. Zeng, Y. Tu, S. Han, and H. Cho. Aging characteristics and mechanisms
of zno nonlinear varistors. Proceedings of The 6th International Conference on
Properties and Applications of Dielectric Materials, Xi’an, China, June 2000.
[49] Z. Zheng, H. Cui, Q. Wang, S. Hen, and Y. Tu. Space charge characteristics of
zno varistors after pulse degradation. Proceedings of the Asia-Pacific Power and
Energy Conference (APPEEC), Shanghai, China, March 2012.
[50] J. He, J. Liu, J. Hu, R. Zeng, and W. Long. Non-uniform ageing behavior of indi-
vidual grain boundaries in zno varistor ceramics. Journal of the European Ceramic
Society, 31(2):1451–1456, February 2011.
[51] IEEE Standards C62.62 TM-2010. Test specifications for surge-protective devices
(spds) for use on the load side of the service equipment in low-voltage (1000 v and
less) ac power circuits. IEEE power and energy society, December 2010.
[52] J. Woodworth. Arrester reference voltage. ArresterFacts-027, 2011. URL http:
//www.arresterworks.com.
[53] IEEE Standards C62.34 1996. Performance of low-voltage surge-protective devices
(secondary arresters). IEEE Surge Protective Devices Committee of the Power
Engineering Society, December 1996.
[54] IEEE Standards C62.11 TM 2012. Standard for metal-oxide surge arresters for ac
power circuits higher than 1 kv. IEEE power and energy society, December 2012.
[55] R. Hernandez, I. Ramrez, R. Saldivar, and G. Montoya. Analysis of accelerated
ageing of non-ceramic insulation equipments. IET Generation, Transmission and
Distribution, 6(1):59–68, January 2012.
[56] Nabertherm GmbH. High temperature laboratory furnace. Operating Manual, 2011.
URL http://www.nabertherm.com.

Bibliography 122
[57] Lapp Cables Group. Operating instructions. High Temperature Cables, 2013. URL
http://www.lappkabel.co.za.
[58] IEEE Power Standards Coordinating Committee. Guide for applying harmonic
limits on power systems. IEEE Standards P519.1TM/D12, November 2012.
[59] T. Halim, K. Muthusamy, S.W. Lam, and S.Y. Chia. Review and classification of
reliability statistical models exhibiting failure-free life characteristic. 40th Interna-
tional Conference on Computers and Industrial Engineering, 2010, July 2010.
[60] P.D. O’Connor and A. Kleyner. Practical reliability engineering, john wiley & sons.
pages 87–92, 2011.
[61] A. J. Dobson, J. Annette, and A. Barnett. An introduction to generalized linear
models, crc press. pages 81–82, 2008.
[62] M. Kayid, I. A. Ahmad, S. Izadkhah, and A. M. Abouammoh. Further results
involving the mean time to failure order, and the decreasing mean time to failure
class. IEEE Transactions on Reliability, 62(3):670–678, September 2013.
[63] Y. Liu, W. Tang, and R. Zhao. Reliability and mean time to failure of unrepairable
systems with fuzzy random lifetimes. IEEE Transactions on Fuzzy Systems, 15(5):
1009–1026, October 2007.
[64] G. G Brown and H. C. Rutemiller. Evaluation of prob of x higher than y when
both x and y are three-parameter weibull distributions. IEEE Transactions on
Reliability, R.22(2):78–82, June 1973.
[65] Z. Nanfa, X. Jianhu, S. Zhen, and D. Liuhua. A deep insight into zno nonlinear
resistor. IEEE Transactions on Power Electronics, October 2014.
[66] D. Wei, L. Weidong, F. Zhiyang, and C. Jian. The network-model on-line monitoring
system of zno surge arresters in 500kv substation. IEEE IEEE/PES Transmission
and Distribution Conference and Exhibition: Asia and Pacific, Dalian, China, April
2005.
[67] J.D. Glover, M.S. Sarma, and T.J. Overbye. Power systems analysis and design,
4th ed. cengage learning, united states of america. pages 232–233, 2005.
[68] Z. Bing, K.J. Karimi, and J. Sun. Input impedance modeling and analysis of line-
commutated rectifiers. IEEE Transactions on Power Electronics, 24(10):2338–2346,
October 2009.
[69] K.A. Stroud and D.J. Booth. Advanced engineering mathematics, palgrave macmil-
lan. pages 232–233, 2011.

Bibliography 123
[70] J. Bird. Electrical circuit theory and technology 5th ed. routledge, united kingdom.
pages 193–195, 2014.
[71] F. Iliasa, D. Cristian, L. Popa, and D. Vatau. A few aspects concerning the thermal
connection of zno based varistors. IEEE Universities Power Engineering Confer-
ence, Cardiff, Wales, United Kingdom, 31 August - 03 September 2010.
[72] S. Li, J. Li, W. Liu, J. Lin, J. He, and P. Cheng. Advances in zno varistors in
china during the past 30 years - fundamentals, processing, and applications. IEEE
Electrical Insulation Magazine, 31(4):35–44, August 2015.
[73] Chi-square distribution table. Chi-Square Table, Last access 2015. URL http:
//www.statistics.com/chi-square.
Related Documents