Edinburgh Research Explorer Defining the robust behaviour of the plant clock gene circuit with absolute RNA timeseries and open infrastructure Citation for published version: Flis, A, Fernández, AP, Zielinski, T, Mengin, V, Sulpice, R, Stratford, K, Hume, A, Pokhilko, A, Southern, MM, Seaton, DD, McWatters, HG, Stitt, M, Halliday, KJ & Millar, AJ 2015, 'Defining the robust behaviour of the plant clock gene circuit with absolute RNA timeseries and open infrastructure', Open Biology, vol. 5, no. 10, 150042. https://doi.org/10.1098/rsob.150042 Digital Object Identifier (DOI): 10.1098/rsob.150042 Link: Link to publication record in Edinburgh Research Explorer Document Version: Publisher's PDF, also known as Version of record Published In: Open Biology Publisher Rights Statement: C 2015 The Authors. Published by the Royal Society under the terms of the Creative Commons Attribution License http://creativecommons.org/licenses/by/4.0/, which permits unrestricted use, provided the original author and source are credited. General rights Copyright for the publications made accessible via the Edinburgh Research Explorer is retained by the author(s) and / or other copyright owners and it is a condition of accessing these publications that users recognise and abide by the legal requirements associated with these rights. Take down policy The University of Edinburgh has made every reasonable effort to ensure that Edinburgh Research Explorer content complies with UK legislation. If you believe that the public display of this file breaches copyright please contact [email protected] providing details, and we will remove access to the work immediately and investigate your claim. Download date: 25. Jun. 2022

Welcome message from author
This document is posted to help you gain knowledge. Please leave a comment to let me know what you think about it! Share it to your friends and learn new things together.
Transcript
Edinburgh Research Explorer
Defining the robust behaviour of the plant clock gene circuit withabsolute RNA timeseries and open infrastructure
Citation for published version:Flis, A, Fernández, AP, Zielinski, T, Mengin, V, Sulpice, R, Stratford, K, Hume, A, Pokhilko, A, Southern,MM, Seaton, DD, McWatters, HG, Stitt, M, Halliday, KJ & Millar, AJ 2015, 'Defining the robust behaviour ofthe plant clock gene circuit with absolute RNA timeseries and open infrastructure', Open Biology, vol. 5, no.10, 150042. https://doi.org/10.1098/rsob.150042
Digital Object Identifier (DOI):10.1098/rsob.150042
Link:Link to publication record in Edinburgh Research Explorer
Document Version:Publisher's PDF, also known as Version of record
Published In:Open Biology
Publisher Rights Statement:C 2015 The Authors. Published by the Royal Society under the terms of the Creative Commons AttributionLicense http://creativecommons.org/licenses/by/4.0/, which permits unrestricted use, provided the original authorand source are credited.
General rightsCopyright for the publications made accessible via the Edinburgh Research Explorer is retained by the author(s)and / or other copyright owners and it is a condition of accessing these publications that users recognise andabide by the legal requirements associated with these rights.
Take down policyThe University of Edinburgh has made every reasonable effort to ensure that Edinburgh Research Explorercontent complies with UK legislation. If you believe that the public display of this file breaches copyright pleasecontact [email protected] providing details, and we will remove access to the work immediately andinvestigate your claim.
Download date: 25. Jun. 2022
on October 19, 2015http://rsob.royalsocietypublishing.org/Downloaded from
rsob.royalsocietypublishing.org
ResearchCite this article: Flis A et al. 2015 Defining
the robust behaviour of the plant clock gene
circuit with absolute RNA timeseries and open
infrastructure. Open Biol. 5: 150042.
http://dx.doi.org/10.1098/rsob.150042
Received: 30 March 2015
Accepted: 14 September 2015
Subject Area:systems biology/genetics/bioinformatics/
molecular biology
Keywords:circadian rhythms, plant biology,
gene regulatory networks, biological clocks,
model optimization, data management
Authors for correspondence:Mark Stitt
e-mail: [email protected]
Karen J. Halliday
e-mail: [email protected]
Andrew J. Millar
e-mail: [email protected]
†Present address: Biosciences KTN, The Roslin
Institute, Easter Bush, Midlothian EH25 9RG, UK.‡Present address: NUIG, Plant Systems Biology
Laboratory, Plant and AgriBiosciences Research
Centre, Botany and Plant Science, Galway, Ireland.
Electronic supplementary material is available
at http://dx.doi.org/10.1098/rsob.150042.
& 2015 The Authors. Published by the Royal Society under the terms of the Creative Commons AttributionLicense http://creativecommons.org/licenses/by/4.0/, which permits unrestricted use, provided the originalauthor and source are credited.
Defining the robust behaviour of theplant clock gene circuit with absoluteRNA timeseries and open infrastructure
Anna Flis1, Aurora Pinas Fernandez2,†, Tomasz Zielinski2, Virginie Mengin1,Ronan Sulpice1,‡, Kevin Stratford3, Alastair Hume2,3, Alexandra Pokhilko2,4,Megan M. Southern5, Daniel D. Seaton2, Harriet G. McWatters2, Mark Stitt1,Karen J. Halliday2 and Andrew J. Millar2
1Max Planck Institute of Molecular Plant Physiology, Am Muehlenberg 1, 14476 Potsdam-Golm, Germany2SynthSys and School of Biological Sciences, University of Edinburgh, C.H. Waddington Building,Edinburgh EH9 3JD, UK5EPCC, University of Edinburgh, James Clerk Maxwell Building, Edinburgh EH9 3JZ, UK6Institute of Molecular Cell and Systems Biology, University of Glasgow, Bower Building, Glasgow G12 8QQ, UK7Department of Biological Sciences, University of Warwick, Coventry CV4 7AL, UK
AJM, 0000-0003-1756-3654
Our understanding of the complex, transcriptional feedback loops in the circa-
dian clock mechanism has depended upon quantitative, timeseries data from
disparate sources. We measure clock gene RNA profiles in Arabidopsis thalianaseedlings, grown with or without exogenous sucrose, or in soil-grown plants
and in wild-type and mutant backgrounds. The RNA profiles were strikingly
robust across the experimental conditions, so current mathematical models
are likely to be broadly applicable in leaf tissue. In addition to providing
reference data, unexpected behaviours included co-expression of PRR9 and
ELF4, and regulation of PRR5 by GI. Absolute RNA quantification revealed
low levels of PRR9 transcripts (peak approx. 50 copies cell21) compared
with other clock genes, and threefold higher levels of LHY RNA (more than
1500 copies cell21) than of its close relative CCA1. The data are disseminated
from BioDare, an online repository for focused timeseries data, which is
expected to benefit mechanistic modelling. One data subset successfully con-
strained clock gene expression in a complex model, using publicly available
software on parallel computers, without expert tuning or programming. We
outline the empirical and mathematical justification for data aggregation in
understanding highly interconnected, dynamic networks such as the clock,
and the observed design constraints on the resources required to make this
approach widely accessible.
1. IntroductionCircadian clocks are found widely among organisms from archaea to mammals
[1,2]. These internal time-keepers generate approximately 24 h rhythms in the
expression of 10–30% of genes, even without environmental cues. In natural con-
ditions, circadian rhythms are entrained by light and temperature cycles. Their
function is to coordinate internal processes with the external day/night cycle
[3,4] and also, through photoperiodism, relative to the seasonal cycle [5]. The cir-
cadian system of each organism includes a phylum-specific gene regulatory
network that is required for most rhythmicity [6], as well as non-transcriptional
oscillator(s) that are less well characterized in eukaryotes [7].
In plants, the clock gene network includes highly connected, negative regula-
tors forming a complicated circuit. This has been best studied in Arabidopsisthaliana. One simplification (figure 1a) visualizes the circuit as a three-loop
1.0
0.8
0.6
0.4
0.2
0
1.
2.
2B.
2A.
3.
4.
5.
6.
7.
LHYCCA1PRR9PRR7PRR5TOC1GILUXELF3ELF4
ROBuST sd
TiMet ros
TiMet sd1 Ws-2; elf3-4.
Ws-2; lhy-21 cca1-11.
TiMet sd2 Ws-2.
McWatters sd
Edwards sd3% suc; 22°C
3% suc; 22°C
3% suc; 20°CCol-0
Col-0
Col-0; gi-201; toc1-101; prr7-3 prr9-1
Col-0
Southern sd
(× 7 d, 22°C)
(× 12 d)
(× 9 d)
(× 7 d)
(× 5 d) ...
(× 11 d)
(× 20 d) ...
0% suc; 17°C
Col-4; prr7-3; prr9-1; prr7-3 prr9-1Ws-2; gi-11; toc1-9; lhy-21; cca1-11;
(× 2d, 17°C) ...LHY/CCA1
PRR9 PRR7 PRR5 TOC1
ZTL
AND
ELF4 ELF3evening complex
Pokhilko model
LUX
GIOR
rela
tive
RN
A le
vel
time (h)0 6 12 18 24
0 12 24 h
0 12 24 h
0 12 24 36 48 60 72 h
0 12 24 36 48 60
12 24 36 48 60 72 84 96
0 12 24 36 48 60
0 12 24 h
0 12 24
0 12 24 h 0 12 24 h
0 12 24 h
0
0% suc; 20°C/18°C; absolute quantification.
C24; toc1-2; tic-1Ws-2; elf3-4; elf4-1; gi-11; lhy-21 cca1-11;TOC1-ox; GI-ox
soil; 20°C/18°C; absolute quantification.
soil; 20°C/18°C; absolute quantification.
12 24 h
0 12 24 h
lhy-21 cca1-11; lhy-21 cca1-11 gi-11.
(b)
(a) (c)
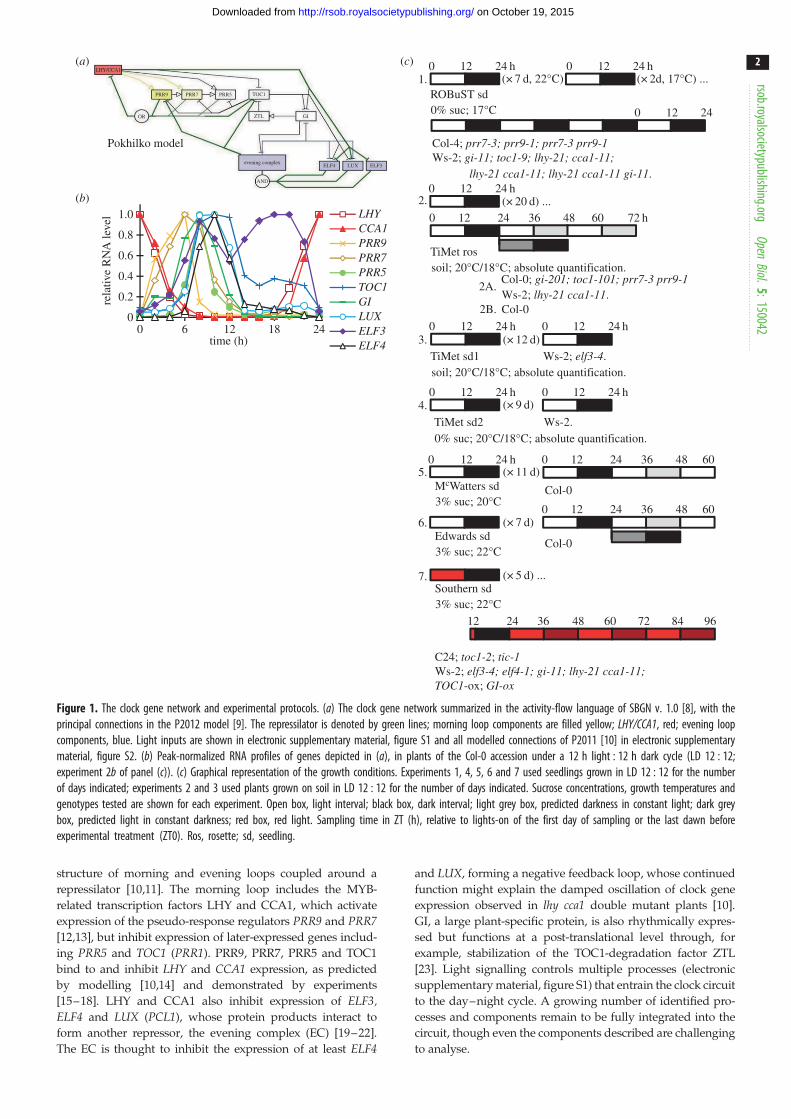
Figure 1. The clock gene network and experimental protocols. (a) The clock gene network summarized in the activity-flow language of SBGN v. 1.0 [8], with theprincipal connections in the P2012 model [9]. The repressilator is denoted by green lines; morning loop components are filled yellow; LHY/CCA1, red; evening loopcomponents, blue. Light inputs are shown in electronic supplementary material, figure S1 and all modelled connections of P2011 [10] in electronic supplementarymaterial, figure S2. (b) Peak-normalized RNA profiles of genes depicted in (a), in plants of the Col-0 accession under a 12 h light : 12 h dark cycle (LD 12 : 12;experiment 2b of panel (c)). (c) Graphical representation of the growth conditions. Experiments 1, 4, 5, 6 and 7 used seedlings grown in LD 12 : 12 for the numberof days indicated; experiments 2 and 3 used plants grown on soil in LD 12 : 12 for the number of days indicated. Sucrose concentrations, growth temperatures andgenotypes tested are shown for each experiment. Open box, light interval; black box, dark interval; light grey box, predicted darkness in constant light; dark greybox, predicted light in constant darkness; red box, red light. Sampling time in ZT (h), relative to lights-on of the first day of sampling or the last dawn beforeexperimental treatment (ZT0). Ros, rosette; sd, seedling.
rsob.royalsocietypublishing.orgOpen
Biol.5:150042
2
on October 19, 2015http://rsob.royalsocietypublishing.org/Downloaded from
structure of morning and evening loops coupled around a
repressilator [10,11]. The morning loop includes the MYB-
related transcription factors LHY and CCA1, which activate
expression of the pseudo-response regulators PRR9 and PRR7[12,13], but inhibit expression of later-expressed genes includ-
ing PRR5 and TOC1 (PRR1). PRR9, PRR7, PRR5 and TOC1
bind to and inhibit LHY and CCA1 expression, as predicted
by modelling [10,14] and demonstrated by experiments
[15–18]. LHY and CCA1 also inhibit expression of ELF3,ELF4 and LUX (PCL1), whose protein products interact to
form another repressor, the evening complex (EC) [19–22].
The EC is thought to inhibit the expression of at least ELF4
and LUX, forming a negative feedback loop, whose continued
function might explain the damped oscillation of clock gene
expression observed in lhy cca1 double mutant plants [10].
GI, a large plant-specific protein, is also rhythmically expres-
sed but functions at a post-translational level through, for
example, stabilization of the TOC1-degradation factor ZTL
[23]. Light signalling controls multiple processes (electronic
supplementary material, figure S1) that entrain the clock circuit
to the day–night cycle. A growing number of identified pro-
cesses and components remain to be fully integrated into the
circuit, though even the components described are challenging
to analyse.
rsob.royalsocietypublishing.orgOpen
Biol.5:150042
3
on October 19, 2015http://rsob.royalsocietypublishing.org/Downloaded from
Formal, mathematical models have been helpful in under-
standing the plant clock, because its components are highly
interconnected by nonlinear regulation (electronic supple-
mentary material, figure S2; reviewed in [24]). Model
development was necessarily based upon timeseries data,
where the system was manipulated using mutations and by
varying light or temperature inputs. More detailed models
demanded greater precision and breadth in the data, which
raised two major issues. First, data collation was laborious,
because the numerical data underlying published timeseries
graphs were rarely accessible [25]. Although the potential
benefits of data sharing are recognized [26,27], in practice,
useful sharing requires cyber infrastructure, which is currently
best-developed for omics data rather than the many focused
studies in the clock literature [28]. Second, the published data
on Arabidopsis clocks used several genetic backgrounds
and growth conditions, introducing ill-defined variation to
the results.
To provide directly comparable data, we conducted large-
scale qRT-PCR assays for the RNA levels of multiple clock
genes. Overlapping studies in four laboratories using different
growth stages and conditions highlighted the robustness of
most expression profiles and the few instances where they
varied. Visualizing the data as phase plane plots suggested
new dynamic interactions and their genetic regulators. Absol-
ute RNA quantification revealed the low expression levels of
ELF3 and PRR9. To facilitate similar projects, we introduce
data aggregation in the online BioDare resource, and illustrate
the utility of our datasets by reoptimizing the P2011 clock
model [10] with the open-source application SYSTEMS BIOLOGY
SOFTWARE INFRASTRUCTURE (SBSI) [29], highlighting key areas
for future experiments.
2. Results2.1. Large-scale measurement of clock gene RNA
profilesThis study was motivated by two projects that integrated circa-
dian regulation into research on other plant physiological
systems, which were incompatible with the growth conditions
used in earlier circadian research. The Regulation of Biological
Signalling by Temperature (ROBuST) project studied the
interactions of ambient temperature with circadian and light
signalling circuits; exogenous sucrose inhibits light signalling
[30,31] and was therefore excluded. The Timing of Metabolism
(TiMet) project studied circadian regulation of the starch path-
way, among others, which is best characterized in rosette plants
grown on soil. To measure the rhythmic expression in a set of
clock-related genes (figure 1b), we used automated systems in
Golm and Edinburgh to quantify mRNA levels for components
of the clock circuit every 2 h, in multiple conditions and mutant
backgrounds [32,33] (figure 1c). The ROBuST dataset tested
13-day-old, wild-type (WT) and mutant seedlings grown at
178C on agar medium without additional sucrose. Datasets
from the TiMet project tested 21-day-old rosette plants grown
at 208C on soil (TiMet ros) and 13-day-old seedlings on soil
(TiMet sd1). The TiMet rosette data were collected from WT
and clock mutant Arabidopsis thaliana plants grown under
light : dark (LD) cycles in two experiments, followed by con-
stant light (LL) or constant dark (DD) in one study. Three
further studies were compared, from seedlings grown on sterile
agar media without sucrose (TiMet sd2, using the same
medium as the ROBuST data), or with exogenous sucrose
under white (McWatters, this paper; and Edwards et al. [34])
or red light (Southern, this paper; and [21,35]).
2.2. Data presentationTime is expressed as zeitgeber time (ZT) in hours since the
last dark–light transition, by convention; the first dark–light
transition within the sampling interval is 0 h on our plots.
TiMet data are presented as absolute values [33], obtained by
calibrating RNA extraction efficiency with heterologous control
RNAs (electronic supplementary matetial, table S1) to calcu-
late the number of copies of each RNA per gram fresh weight
(gFW). Estimated cell numbers per gFW (see electronic sup-
plementary material) were used to calculate RNA copies per
cell. The other datasets are normalized relative to a control
transcript (ACTIN7 for ROBuST; ACTIN2 for Edwards and
Southern; bTUBULIN4 for McWatters). ACTIN2 and GAPDHcontrols were also assayed with two amplicons each in the
TiMet assays, for comparison among datasets. Data were repli-
cated in biological duplicate or triplicate samples and in
equivalent sampling on successive days (0–12 h and 24–36 h
in the TiMet and Edwards datasets). Data are presented on
linear scales to reflect the potential for protein synthesis and
hence regulatory effects on downstream targets (in keeping
with most of the literature; figures 2 and 3; electronic sup-
plementary material, figure S5) and on logarithmic scales to
reveal the full dynamic range of RNA expression, and hence
the influence of multiple upstream regulators (figures 4–6;
electronic supplementary material, figure S3 and S4). Further
technical comparison among the studies is presented in the
electronic supplementary material.
2.3. Similarity and specific variations of wild-type RNAprofiles across datasets
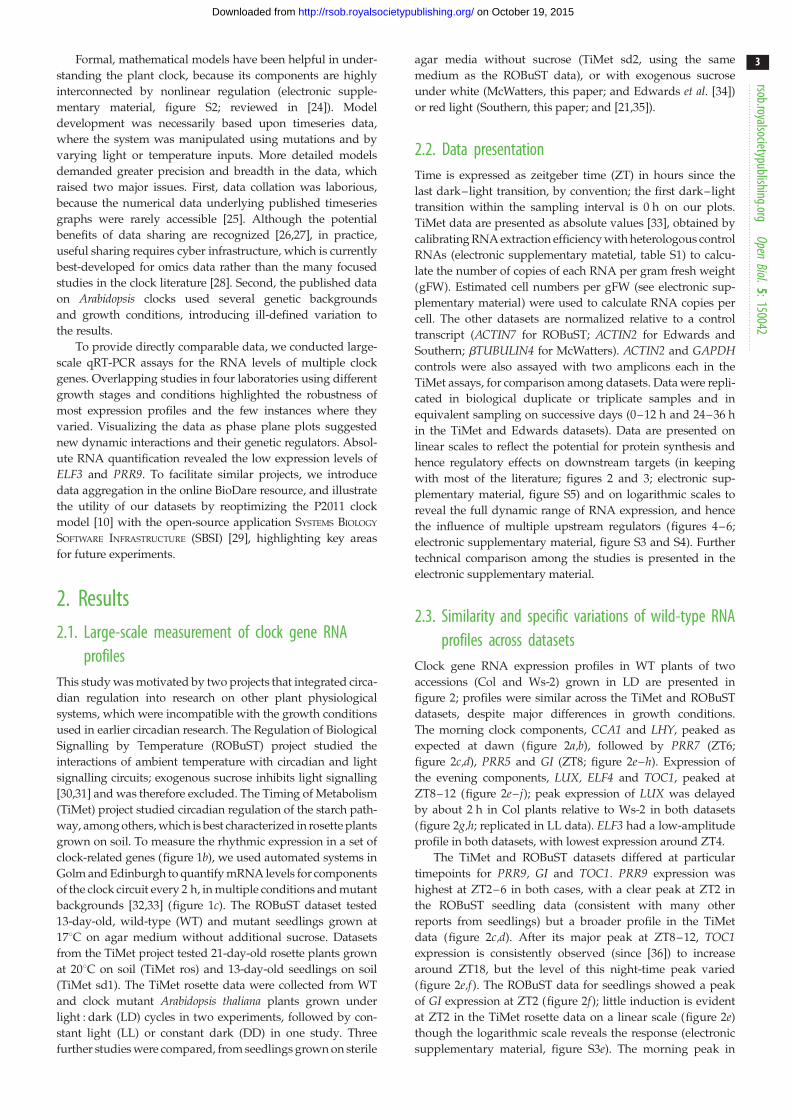
Clock gene RNA expression profiles in WT plants of two
accessions (Col and Ws-2) grown in LD are presented in
figure 2; profiles were similar across the TiMet and ROBuST
datasets, despite major differences in growth conditions.
The morning clock components, CCA1 and LHY, peaked as
expected at dawn (figure 2a,b), followed by PRR7 (ZT6;
figure 2c,d), PRR5 and GI (ZT8; figure 2e–h). Expression of
the evening components, LUX, ELF4 and TOC1, peaked at
ZT8–12 (figure 2e–j); peak expression of LUX was delayed
by about 2 h in Col plants relative to Ws-2 in both datasets
(figure 2g,h; replicated in LL data). ELF3 had a low-amplitude
profile in both datasets, with lowest expression around ZT4.
The TiMet and ROBuST datasets differed at particular
timepoints for PRR9, GI and TOC1. PRR9 expression was
highest at ZT2–6 in both cases, with a clear peak at ZT2 in
the ROBuST seedling data (consistent with many other
reports from seedlings) but a broader profile in the TiMet
data (figure 2c,d). After its major peak at ZT8–12, TOC1expression is consistently observed (since [36]) to increase
around ZT18, but the level of this night-time peak varied
(figure 2e,f ). The ROBuST data for seedlings showed a peak
of GI expression at ZT2 (figure 2f ); little induction is evident
at ZT2 in the TiMet rosette data on a linear scale (figure 2e)
though the logarithmic scale reveals the response (electronic
supplementary material, figure S3e). The morning peak in

1 × 10¹⁰
8 × 10⁹
6 × 10⁹
4 × 10⁹
2 × 10⁹
3 × 10⁹
2 × 10⁹
2 × 10⁹
1 × 10⁹
5 × 10⁸
6 × 10⁹
4 × 10⁹
2 × 10⁹
0
0
0
Col0 TOC1
Col0 CCA1Col0 LUXWS CCA1WS LUX
Col4 CCA1Col4 LUXWS CCA1WS LUX
WS TOC1
Col0 GI
WS GI
Col4 TOC1
WS TOC1
Col4 GI
Col4 PRR9
WS PRR9
Col0 PRR9
WS PRR9
WS GI
copy
no.
/gfr
wco
py n
o./g
frw
copy
no.
/gfr
w
TiMet ros dataset ROBuST dataset
expr
essi
on (
arb.
uni
ts)
expr
essi
on (
arb.
uni
ts)
expr
essi
on (
arb.
uni
ts)
time after dawn (h)0 4 8 12 16 20 24
time after dawn (h)0 4 8 12 16 20 24
0
1
2
3
4
5
0
5
10
15
0
2
4
6
8
10
(b)(a)
(c) (d )
(e) ( f )
Figure 2. Clock gene expression in wild-type plants under LD cycles. Transcript levels in Col-0 and Ws-2 WT under LD 12 : 12 were measured by qRT-PCR, inexperiment 2 (TiMet ros) including eight external RNA standards to allow absolute quantification in Col-0 and Ws-2 (a,c,e) and in experiment 1 (ROBuST) normalizedto the ACTIN7 control in Col-4 and Ws-2 (b,d,f ). Data represent transcripts of (a,b) LHY and CCA1, (c,d) PRR9, and (e,f ) TOC1 and GI. Error bars show SD, for two tothree biological replicates. Electronic supplementary material, figure S3 shows the data on logarithmic plots.
rsob.royalsocietypublishing.orgOpen
Biol.5:150042
4
on October 19, 2015http://rsob.royalsocietypublishing.org/Downloaded from
GI is likely to be an acute response to lights-on. Rapid
sampling in the Southern data [35] and in a follow-up micro-
array study [10] suggested that induction is rapid but
transient, and therefore sensitive to sampling time. Nonethe-
less, the data suggest that either the magnitude or kinetics of
light responsiveness vary across the conditions tested. The
difference in PRR9 profiles could reflect slower activation of
PRR9 in the TiMet data, consistent with lower light respon-
siveness in rosettes than in seedlings or with faster
repression of PRR9 in seedlings. The level of GI transcripts
at ZT12 also varied from 4% to 40% of the peak level, with
the lowest level in rosettes of Ws-2 (figures 2e,f and 3c). GIexpression is light sensitive at this phase [37], so our results
are consistent with variation in light responsiveness.
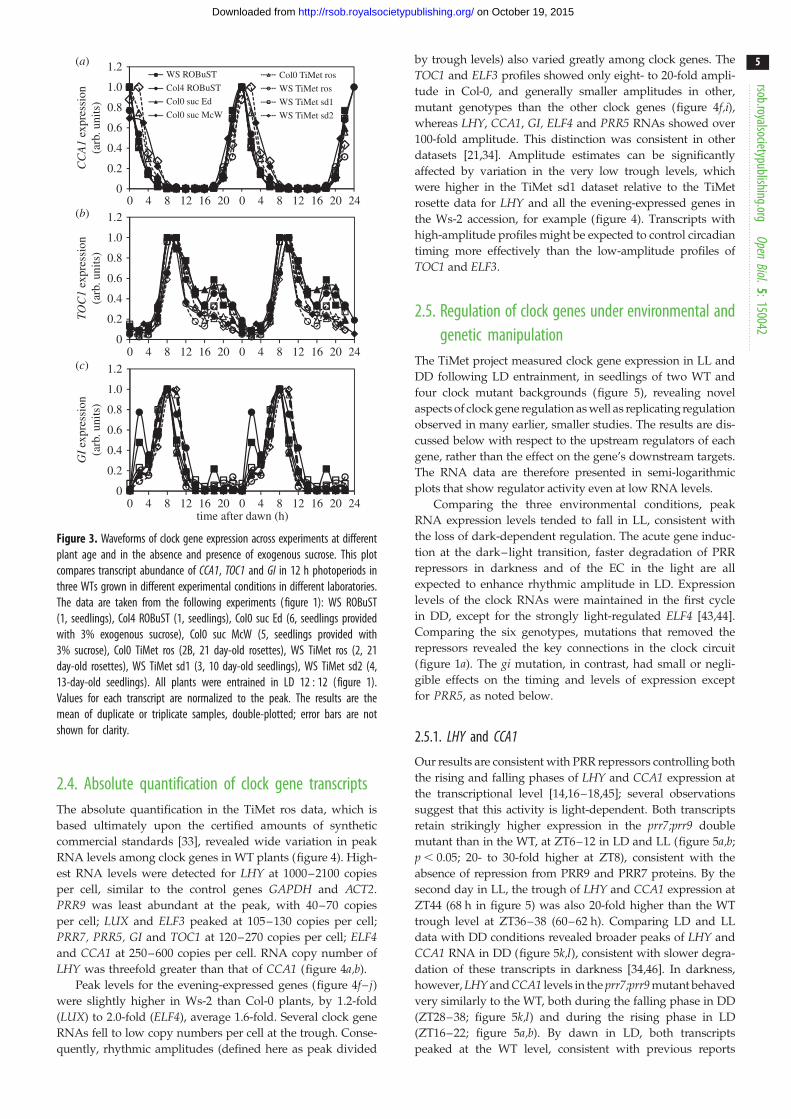
Sucrose modestly increases expression of the evening
clock components TOC1 and GI [38], particularly in dark-
ness [39], and can repress PRR7 with subsequent effects
on CCA1 under low light [40], along with transcriptome-
wide effects under LD cycles [41,42]. We therefore compared
the expression profiles for CCA1, TOC1 and GI in plants
grown without (ROBuST and TiMet data) or with exogenous
sucrose (McWatters, Edwards and Southern datasets;
figure 3). To facilitate comparison, TiMet data were normal-
ized to control transcripts (two amplicons each in GAPDHand ACTIN2), as for the other studies. Each profile was
normalized to its maximum. Expression profiles of CCA1across the different timeseries matched closely despite
the differences in accession and experimental protocols
(figure 3a). The times of peak, mid-rising and mid-falling
phases differed by at most 2 h (one sampling interval)
among datasets. In the falling phase at ZT4, the profiles
in McWatters, TiMet ros and TiMet sd2 data were delayed
relative to the other data. The night-time expression of
TOC1 at ZT18 varied from 20% to 60% of the main peak
level (figure 3b), with high expression in ROBuST, Edwards
and TiMet sd2 datasets. The expression of GI at ZT2 in the
TiMet and Edwards seedling data was about 20% of the
main peak level (figure 3c, also in Southern data [35]), inter-
mediate between the levels in ROBuST and TiMet rosette data
(discussed above). These features of the expression profiles
showed no clear relationship with growth medium or
developmental stage.
0
0.2
0.4
0.6
0.8
1.0
1.2
0
0.2
0.4
0.6
0.8
1.0
1.2
0
0.2
0.4
0.6
0.8
1.0
1.2
WS ROBuST
Col0 suc McW
Col0 suc Ed
Col4 ROBuSTCol0 TiMet ros
WS TiMet sd2
WS TiMet sd1
WS TiMet rosC
CA
1 ex
pres
sion
(arb
. uni
ts)
TOC
1 ex
pres
sion
(arb
. uni
ts)
GI
expr
essi
on(a
rb. u
nits
)
time after dawn (h)0 4 8 12 16 20 0 4 8 12 16 20 24
0 4 8 12 16 20 0 4 8 12 16 20 24
0 4 8 12 16 20 0 4 8 12 16 20 24(b)
(a)
(c)
Figure 3. Waveforms of clock gene expression across experiments at differentplant age and in the absence and presence of exogenous sucrose. This plotcompares transcript abundance of CCA1, TOC1 and GI in 12 h photoperiods inthree WTs grown in different experimental conditions in different laboratories.The data are taken from the following experiments (figure 1): WS ROBuST(1, seedlings), Col4 ROBuST (1, seedlings), Col0 suc Ed (6, seedlings providedwith 3% exogenous sucrose), Col0 suc McW (5, seedlings provided with3% sucrose), Col0 TiMet ros (2B, 21 day-old rosettes), WS TiMet ros (2, 21day-old rosettes), WS TiMet sd1 (3, 10 day-old seedlings), WS TiMet sd2 (4,13-day-old seedlings). All plants were entrained in LD 12 : 12 (figure 1).Values for each transcript are normalized to the peak. The results are themean of duplicate or triplicate samples, double-plotted; error bars are notshown for clarity.
rsob.royalsocietypublishing.orgOpen
Biol.5:150042
5
on October 19, 2015http://rsob.royalsocietypublishing.org/Downloaded from
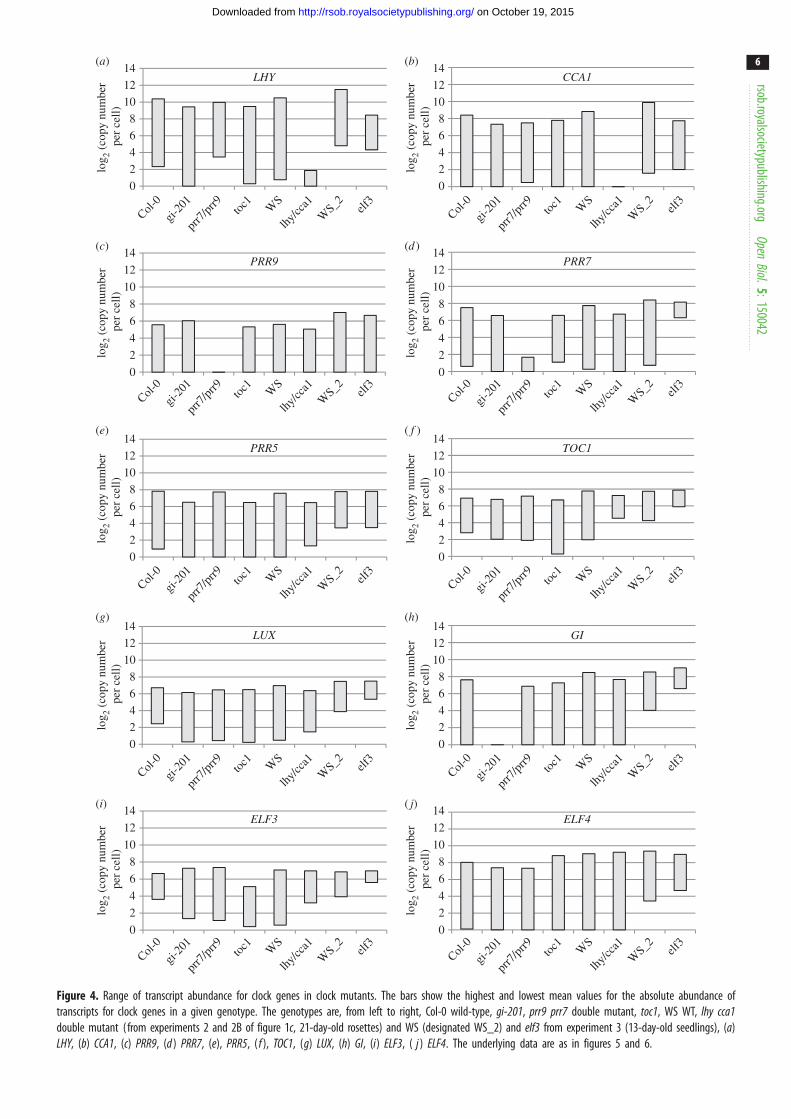
2.4. Absolute quantification of clock gene transcriptsThe absolute quantification in the TiMet ros data, which is
based ultimately upon the certified amounts of synthetic
commercial standards [33], revealed wide variation in peak
RNA levels among clock genes in WT plants (figure 4). High-
est RNA levels were detected for LHY at 1000–2100 copies
per cell, similar to the control genes GAPDH and ACT2.
PRR9 was least abundant at the peak, with 40–70 copies
per cell; LUX and ELF3 peaked at 105–130 copies per cell;
PRR7, PRR5, GI and TOC1 at 120–270 copies per cell; ELF4and CCA1 at 250–600 copies per cell. RNA copy number of
LHY was threefold greater than that of CCA1 (figure 4a,b).
Peak levels for the evening-expressed genes (figure 4f– j)were slightly higher in Ws-2 than Col-0 plants, by 1.2-fold
(LUX) to 2.0-fold (ELF4), average 1.6-fold. Several clock gene
RNAs fell to low copy numbers per cell at the trough. Conse-
quently, rhythmic amplitudes (defined here as peak divided
by trough levels) also varied greatly among clock genes. The
TOC1 and ELF3 profiles showed only eight- to 20-fold ampli-
tude in Col-0, and generally smaller amplitudes in other,
mutant genotypes than the other clock genes (figure 4f,i),whereas LHY, CCA1, GI, ELF4 and PRR5 RNAs showed over
100-fold amplitude. This distinction was consistent in other
datasets [21,34]. Amplitude estimates can be significantly
affected by variation in the very low trough levels, which
were higher in the TiMet sd1 dataset relative to the TiMet
rosette data for LHY and all the evening-expressed genes in
the Ws-2 accession, for example (figure 4). Transcripts with
high-amplitude profiles might be expected to control circadian
timing more effectively than the low-amplitude profiles of
TOC1 and ELF3.
2.5. Regulation of clock genes under environmental andgenetic manipulation
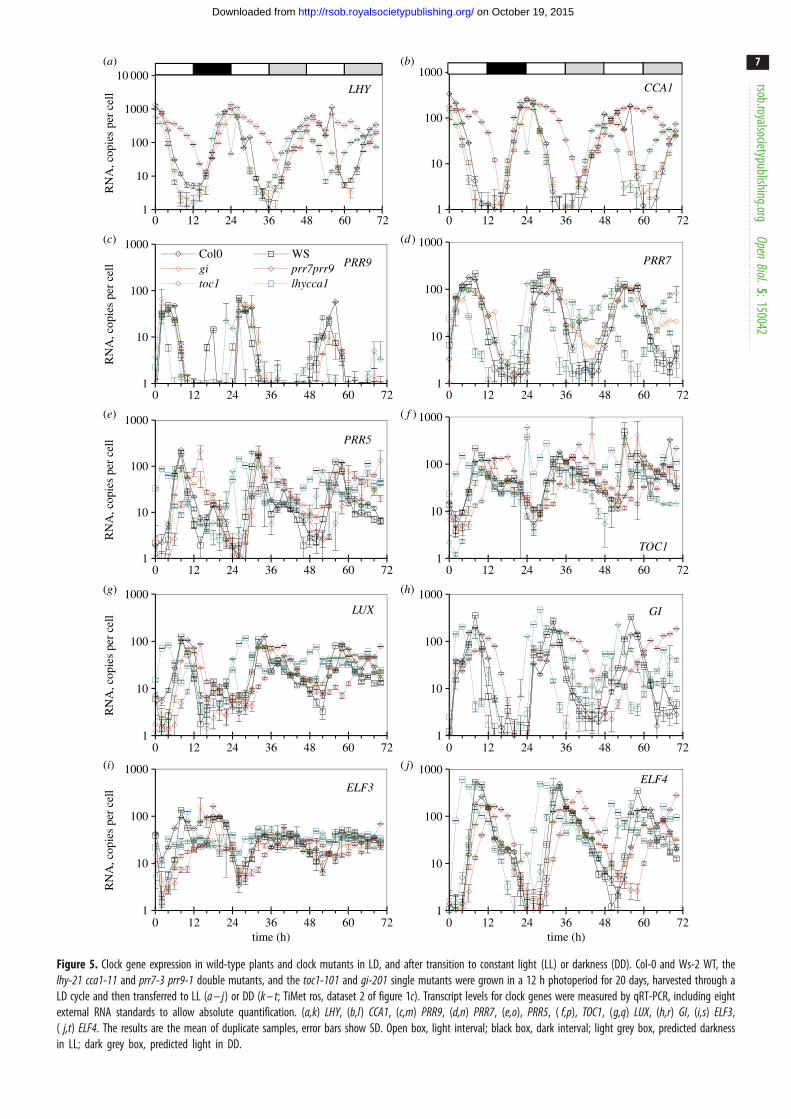
The TiMet project measured clock gene expression in LL and
DD following LD entrainment, in seedlings of two WT and
four clock mutant backgrounds (figure 5), revealing novel
aspects of clock gene regulation as well as replicating regulation
observed in many earlier, smaller studies. The results are dis-
cussed below with respect to the upstream regulators of each
gene, rather than the effect on the gene’s downstream targets.
The RNA data are therefore presented in semi-logarithmic
plots that show regulator activity even at low RNA levels.
Comparing the three environmental conditions, peak
RNA expression levels tended to fall in LL, consistent with
the loss of dark-dependent regulation. The acute gene induc-
tion at the dark–light transition, faster degradation of PRR
repressors in darkness and of the EC in the light are all
expected to enhance rhythmic amplitude in LD. Expression
levels of the clock RNAs were maintained in the first cycle
in DD, except for the strongly light-regulated ELF4 [43,44].
Comparing the six genotypes, mutations that removed the
repressors revealed the key connections in the clock circuit
(figure 1a). The gi mutation, in contrast, had small or negli-
gible effects on the timing and levels of expression except
for PRR5, as noted below.
2.5.1. LHY and CCA1
Our results are consistent with PRR repressors controlling both
the rising and falling phases of LHY and CCA1 expression at
the transcriptional level [14,16–18,45]; several observations
suggest that this activity is light-dependent. Both transcripts
retain strikingly higher expression in the prr7;prr9 double
mutant than in the WT, at ZT6–12 in LD and LL (figure 5a,b;
p , 0.05; 20- to 30-fold higher at ZT8), consistent with the
absence of repression from PRR9 and PRR7 proteins. By the
second day in LL, the trough of LHY and CCA1 expression at
ZT44 (68 h in figure 5) was also 20-fold higher than the WT
trough level at ZT36–38 (60–62 h). Comparing LD and LL
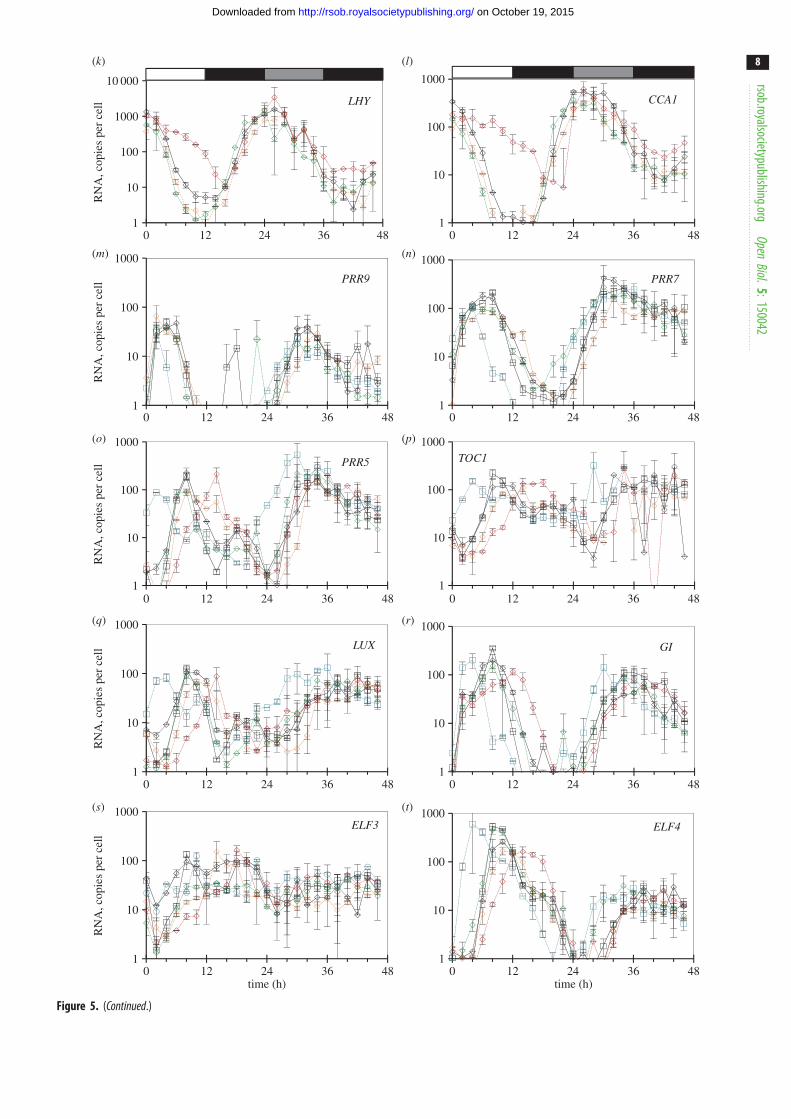
data with DD conditions revealed broader peaks of LHY and
CCA1 RNA in DD (figure 5k,l), consistent with slower degra-
dation of these transcripts in darkness [34,46]. In darkness,
however, LHY and CCA1 levels in the prr7;prr9 mutant behaved
very similarly to the WT, both during the falling phase in DD
(ZT28–38; figure 5k,l) and during the rising phase in LD
(ZT16–22; figure 5a,b). By dawn in LD, both transcripts
peaked at the WT level, consistent with previous reports
0
2
4
6
8
10
12
14
0
2
4
6
8
10
12
14
0
LHY
PRR9
PRR5
LUX
ELF3
Col-0
gi-20
1
prr7
/prr9
toc1
WS
lhy/cc
a1
WS_2 elf
3
Col-0
gi-20
1
prr7
/prr9
toc1
WS
lhy/cc
a1
WS_2 elf
3
Col-0
gi-20
1
prr7
/prr9
toc1
WS
lhy/cc
a1
WS_2 elf
3
Col-0
gi-20
1
prr7
/prr9
toc1
WS
lhy/cc
a1
WS_2 elf
3
Col-0
gi-20
1
prr7
/prr9
toc1
WS
lhy/cc
a1
WS_2 elf
3
2
4
6
8
10
12
14
log 2
(cop
y nu
mbe
r p
er c
ell)
log 2
(cop
y nu
mbe
r p
er c
ell)
log 2
(cop
y nu
mbe
r p
er c
ell)
log 2
(cop
y nu
mbe
r p
er c
ell)
log 2
(cop
y nu
mbe
r p
er c
ell)
0
2
4
6
8
10
12
14
0
2
4
6
8
10
12
14
CCA1
PRR7
TOC1
GI
ELF4
Col-0
gi-20
1
prr7
/prr9
toc1
WS
lhy/cc
a1
WS_2 elf
3
Col-0
gi-20
1
prr7
/prr9
toc1
WS
lhy/cc
a1
WS_2 elf
3
Col-0
gi-20
1
prr7
/prr9
toc1
WS
lhy/cc
a1
WS_2 elf
3
Col-0
gi-20
1
prr7
/prr9
toc1
WS
lhy/cc
a1
WS_2 elf
3
Col-0
gi-20
1
prr7
/prr9
toc1
WS
lhy/cc
a1
WS_2 elf
3
0
2
4
6
8
10
12
14
0
2
4
6
8
10
12
14
0
2
4
6
8
10
12
14
log 2
(cop
y nu
mbe
r p
er c
ell)
log 2
(cop
y nu
mbe
r p
er c
ell)
log 2
(cop
y nu
mbe
r p
er c
ell)
log 2
(cop
y nu
mbe
r p
er c
ell)
log 2
(cop
y nu
mbe
r p
er c
ell)
0
2
4
6
8
10
12
14
0
2
4
6
8
10
12
14
(b)(a)
(c) (d )
(h)
( j)
(e)
(g)
(i)
( f )
Figure 4. Range of transcript abundance for clock genes in clock mutants. The bars show the highest and lowest mean values for the absolute abundance oftranscripts for clock genes in a given genotype. The genotypes are, from left to right, Col-0 wild-type, gi-201, prr9 prr7 double mutant, toc1, WS WT, lhy cca1double mutant (from experiments 2 and 2B of figure 1c, 21-day-old rosettes) and WS (designated WS_2) and elf3 from experiment 3 (13-day-old seedlings), (a)LHY, (b) CCA1, (c) PRR9, (d ) PRR7, (e), PRR5, ( f ), TOC1, (g) LUX, (h) GI, (i) ELF3, ( j ) ELF4. The underlying data are as in figures 5 and 6.
rsob.royalsocietypublishing.orgOpen
Biol.5:150042
6
on October 19, 2015http://rsob.royalsocietypublishing.org/Downloaded from
time (h)
1
10
100
1000
10 000LHY
1
10
100
1000CCA1
1
10
100
1000
PRR9Col0 WSgi prr7prr9toc1 lhycca1
1
10
100
1000
PRR7
1
10
100
1000
PRR5
1
10
100
1000
TOC1
1
10
100
1000LUX
1
10
100
1000
GI
1
10
100
1000
0 12 24 36 48 60 72time (h)
0 12 24 36 48 60 72
0 12 24 36 48 60 72 0 12 24 36 48 60 72
0 12 24 36 48 60 72 0 12 24 36 48 60 72
0 12 24 36 48 60 72 0 12 24 36 48 60 72
0 12 24 36 48 60 72 0 12 24 36 48 60 72
ELF3
1
10
100
1000ELF4
RN
A, c
opie
s pe
r ce
llR
NA
, cop
ies
per
cell
RN
A, c
opie
s pe
r ce
llR
NA
, cop
ies
per
cell
RN
A, c
opie
s pe
r ce
ll
(b)(a)
(c) (d)
(h)
( j)
(e)
(g)
(i)
( f )
Figure 5. Clock gene expression in wild-type plants and clock mutants in LD, and after transition to constant light (LL) or darkness (DD). Col-0 and Ws-2 WT, thelhy-21 cca1-11 and prr7-3 prr9-1 double mutants, and the toc1-101 and gi-201 single mutants were grown in a 12 h photoperiod for 20 days, harvested through aLD cycle and then transferred to LL (a – j) or DD (k – t; TiMet ros, dataset 2 of figure 1c). Transcript levels for clock genes were measured by qRT-PCR, including eightexternal RNA standards to allow absolute quantification. (a,k) LHY, (b,l) CCA1, (c,m) PRR9, (d,n) PRR7, (e,o), PRR5, ( f,p), TOC1, (g,q) LUX, (h,r) GI, (i,s) ELF3,( j,t) ELF4. The results are the mean of duplicate samples, error bars show SD. Open box, light interval; black box, dark interval; light grey box, predicted darknessin LL; dark grey box, predicted light in DD.
rsob.royalsocietypublishing.orgOpen
Biol.5:150042
7
on October 19, 2015http://rsob.royalsocietypublishing.org/Downloaded from
1
10
100
1000
10 000
LHY
1
10
100
1000
CCA1
1
10
100
1000
PRR7
1
10
100
1000TOC1
1
10
100
1000
GI
1
10
100
1000ELF4
time (h)0 12 24 36 48
RN
A, c
opie
s pe
r ce
ll
1
10
100
1000
PRR9
RN
A, c
opie
s pe
r ce
ll
(m)
1
10
100
1000
PRR5
RN
A, c
opie
s pe
r ce
ll
(o)
1
10
100
1000
LUX
RN
A, c
opie
s pe
r ce
ll
(q)
1
10
100
1000ELF3
time (h)0 12 24 36 48
0 12 24 36 480 12 24 36 48
0 12 24 36 480 12 24 36 48
0 12 24 36 480 12 24 36 48
0 12 24 36 480 12 24 36 48
RN
A, c
opie
s pe
r ce
ll
(s)
(k)
(n)
(p)
(r)
(t)
(l)
Figure 5. (Continued.)
rsob.royalsocietypublishing.orgOpen
Biol.5:150042
8
on October 19, 2015http://rsob.royalsocietypublishing.org/Downloaded from
RN
A, c
opie
s pe
r ce
llR
NA
, cop
ies
per
cell
RN
A, c
opie
s pe
r ce
ll
1
10
100
1000
10 000WS
elf3
1
10
100
1000
1
10
100
1000
(b)(a)
(c) (d )
(h)
time (h)0 4 8 12 16 20 24
( j)
(e)
RN
A, c
opie
s pe
r ce
ll
1
10
100
1000(g)
time (h)
RN
A, c
opie
s pe
r ce
ll
1
10
100
1000
1
10
100
1000
1
10
100
1000
1
10
100
1000
1
10
100
1000
1
10
100
1000
0 4 8 12 16 20 24
0 4 8 12 16 20 240 4 8 12 16 20 24
0 4 8 12 16 20 240 4 8 12 16 20 24
0 4 8 12 16 20 240 4 8 12 16 20 24
0 4 8 12 16 20 240 4 8 12 16 20 24
(i)
( f )
LHY CCA1
PRR7
TOC1
GI
ELF4
PRR9
PRR5
LUX
ELF3
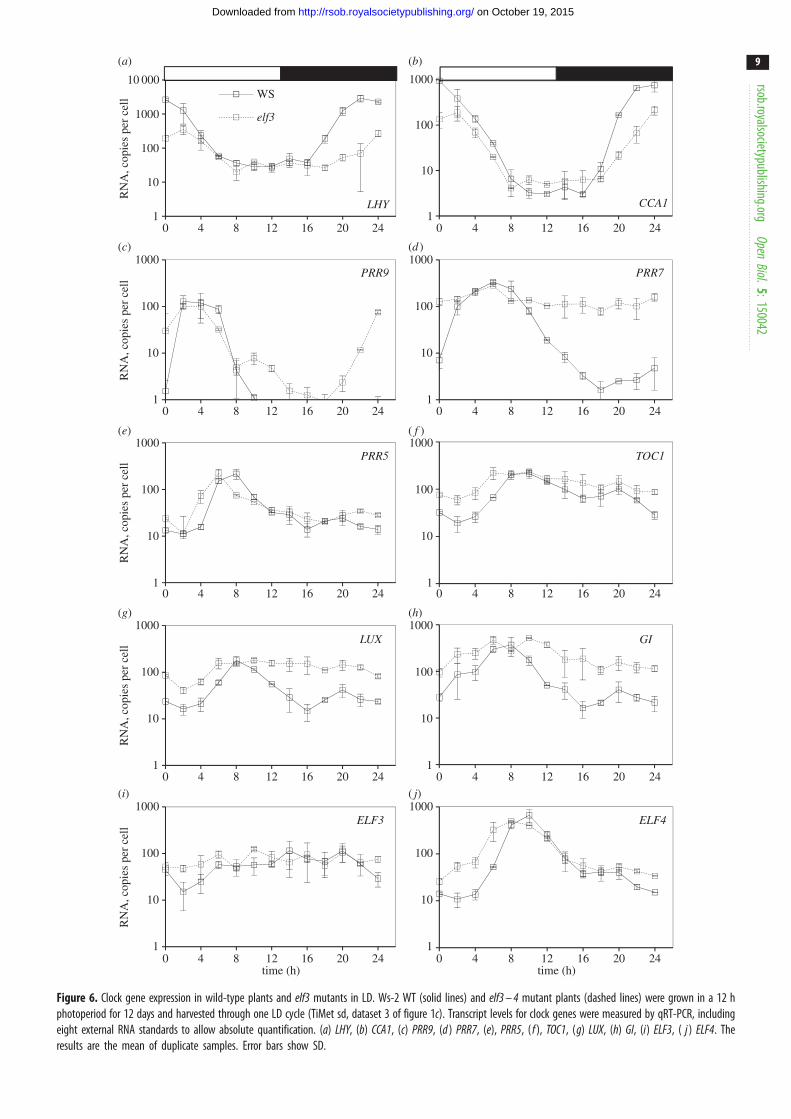
Figure 6. Clock gene expression in wild-type plants and elf3 mutants in LD. Ws-2 WT (solid lines) and elf3 – 4 mutant plants (dashed lines) were grown in a 12 hphotoperiod for 12 days and harvested through one LD cycle (TiMet sd, dataset 3 of figure 1c). Transcript levels for clock genes were measured by qRT-PCR, includingeight external RNA standards to allow absolute quantification. (a) LHY, (b) CCA1, (c) PRR9, (d ) PRR7, (e), PRR5, ( f ), TOC1, (g) LUX, (h) GI, (i) ELF3, ( j ) ELF4. Theresults are the mean of duplicate samples. Error bars show SD.
rsob.royalsocietypublishing.orgOpen
Biol.5:150042
9
on October 19, 2015http://rsob.royalsocietypublishing.org/Downloaded from
rsob.royalsocietypublishing.orgOpen
Biol.5:150042
10
on October 19, 2015http://rsob.royalsocietypublishing.org/Downloaded from
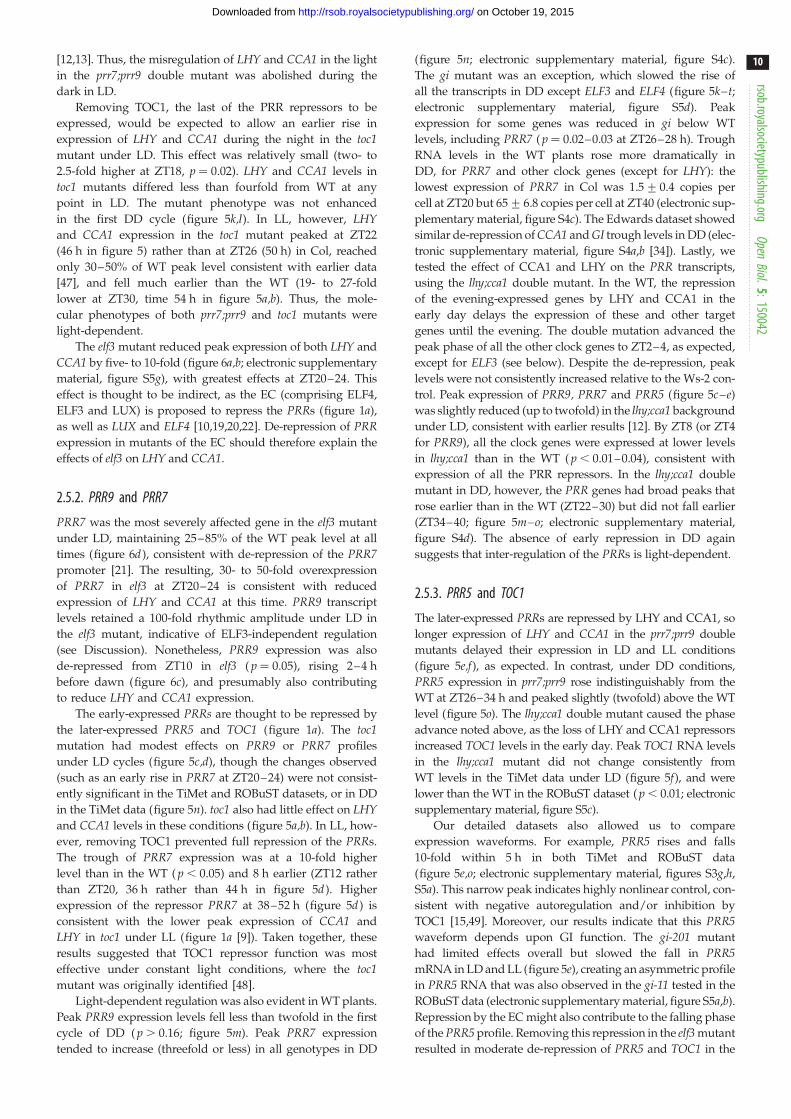
[12,13]. Thus, the misregulation of LHY and CCA1 in the light
in the prr7;prr9 double mutant was abolished during the
dark in LD.
Removing TOC1, the last of the PRR repressors to be
expressed, would be expected to allow an earlier rise in
expression of LHY and CCA1 during the night in the toc1mutant under LD. This effect was relatively small (two- to
2.5-fold higher at ZT18, p ¼ 0.02). LHY and CCA1 levels in
toc1 mutants differed less than fourfold from WT at any
point in LD. The mutant phenotype was not enhanced
in the first DD cycle (figure 5k,l). In LL, however, LHYand CCA1 expression in the toc1 mutant peaked at ZT22
(46 h in figure 5) rather than at ZT26 (50 h) in Col, reached
only 30–50% of WT peak level consistent with earlier data
[47], and fell much earlier than the WT (19- to 27-fold
lower at ZT30, time 54 h in figure 5a,b). Thus, the mole-
cular phenotypes of both prr7;prr9 and toc1 mutants were
light-dependent.
The elf3 mutant reduced peak expression of both LHY and
CCA1 by five- to 10-fold (figure 6a,b; electronic supplementary
material, figure S5g), with greatest effects at ZT20–24. This
effect is thought to be indirect, as the EC (comprising ELF4,
ELF3 and LUX) is proposed to repress the PRRs (figure 1a),
as well as LUX and ELF4 [10,19,20,22]. De-repression of PRRexpression in mutants of the EC should therefore explain the
effects of elf3 on LHY and CCA1.
2.5.2. PRR9 and PRR7
PRR7 was the most severely affected gene in the elf3 mutant
under LD, maintaining 25–85% of the WT peak level at all
times (figure 6d ), consistent with de-repression of the PRR7promoter [21]. The resulting, 30- to 50-fold overexpression
of PRR7 in elf3 at ZT20–24 is consistent with reduced
expression of LHY and CCA1 at this time. PRR9 transcript
levels retained a 100-fold rhythmic amplitude under LD in
the elf3 mutant, indicative of ELF3-independent regulation
(see Discussion). Nonetheless, PRR9 expression was also
de-repressed from ZT10 in elf3 ( p ¼ 0.05), rising 2–4 h
before dawn (figure 6c), and presumably also contributing
to reduce LHY and CCA1 expression.
The early-expressed PRRs are thought to be repressed by
the later-expressed PRR5 and TOC1 (figure 1a). The toc1mutation had modest effects on PRR9 or PRR7 profiles
under LD cycles (figure 5c,d), though the changes observed
(such as an early rise in PRR7 at ZT20–24) were not consist-
ently significant in the TiMet and ROBuST datasets, or in DD
in the TiMet data (figure 5n). toc1 also had little effect on LHYand CCA1 levels in these conditions (figure 5a,b). In LL, how-
ever, removing TOC1 prevented full repression of the PRRs.
The trough of PRR7 expression was at a 10-fold higher
level than in the WT ( p , 0.05) and 8 h earlier (ZT12 rather
than ZT20, 36 h rather than 44 h in figure 5d ). Higher
expression of the repressor PRR7 at 38–52 h (figure 5d ) is
consistent with the lower peak expression of CCA1 and
LHY in toc1 under LL (figure 1a [9]). Taken together, these
results suggested that TOC1 repressor function was most
effective under constant light conditions, where the toc1mutant was originally identified [48].
Light-dependent regulation was also evident in WT plants.
Peak PRR9 expression levels fell less than twofold in the first
cycle of DD ( p . 0.16; figure 5m). Peak PRR7 expression
tended to increase (threefold or less) in all genotypes in DD
(figure 5n; electronic supplementary material, figure S4c).
The gi mutant was an exception, which slowed the rise of
all the transcripts in DD except ELF3 and ELF4 (figure 5k–t;electronic supplementary material, figure S5d). Peak
expression for some genes was reduced in gi below WT
levels, including PRR7 ( p ¼ 0.02–0.03 at ZT26–28 h). Trough
RNA levels in the WT plants rose more dramatically in
DD, for PRR7 and other clock genes (except for LHY): the
lowest expression of PRR7 in Col was 1.5+0.4 copies per
cell at ZT20 but 65+6.8 copies per cell at ZT40 (electronic sup-
plementary material, figure S4c). The Edwards dataset showed
similar de-repression of CCA1 and GI trough levels in DD (elec-
tronic supplementary material, figure S4a,b [34]). Lastly, we
tested the effect of CCA1 and LHY on the PRR transcripts,
using the lhy;cca1 double mutant. In the WT, the repression
of the evening-expressed genes by LHY and CCA1 in the
early day delays the expression of these and other target
genes until the evening. The double mutation advanced the
peak phase of all the other clock genes to ZT2–4, as expected,
except for ELF3 (see below). Despite the de-repression, peak
levels were not consistently increased relative to the Ws-2 con-
trol. Peak expression of PRR9, PRR7 and PRR5 (figure 5c–e)
was slightly reduced (up to twofold) in the lhy;cca1 background
under LD, consistent with earlier results [12]. By ZT8 (or ZT4
for PRR9), all the clock genes were expressed at lower levels
in lhy;cca1 than in the WT ( p , 0.01–0.04), consistent with
expression of all the PRR repressors. In the lhy;cca1 double
mutant in DD, however, the PRR genes had broad peaks that
rose earlier than in the WT (ZT22–30) but did not fall earlier
(ZT34–40; figure 5m–o; electronic supplementary material,
figure S4d). The absence of early repression in DD again
suggests that inter-regulation of the PRRs is light-dependent.
2.5.3. PRR5 and TOC1
The later-expressed PRRs are repressed by LHY and CCA1, so
longer expression of LHY and CCA1 in the prr7;prr9 double
mutants delayed their expression in LD and LL conditions
(figure 5e,f), as expected. In contrast, under DD conditions,
PRR5 expression in prr7;prr9 rose indistinguishably from the
WT at ZT26–34 h and peaked slightly (twofold) above the WT
level (figure 5o). The lhy;cca1 double mutant caused the phase
advance noted above, as the loss of LHY and CCA1 repressors
increased TOC1 levels in the early day. Peak TOC1 RNA levels
in the lhy;cca1 mutant did not change consistently from
WT levels in the TiMet data under LD (figure 5f), and were
lower than the WT in the ROBuST dataset ( p , 0.01; electronic
supplementary material, figure S5c).
Our detailed datasets also allowed us to compare
expression waveforms. For example, PRR5 rises and falls
10-fold within 5 h in both TiMet and ROBuST data
(figure 5e,o; electronic supplementary material, figures S3g,h,
S5a). This narrow peak indicates highly nonlinear control, con-
sistent with negative autoregulation and/or inhibition by
TOC1 [15,49]. Moreover, our results indicate that this PRR5waveform depends upon GI function. The gi-201 mutant
had limited effects overall but slowed the fall in PRR5mRNA in LD and LL (figure 5e), creating an asymmetric profile
in PRR5 RNA that was also observed in the gi-11 tested in the
ROBuST data (electronic supplementary material, figure S5a,b).
Repression by the EC might also contribute to the falling phase
of the PRR5 profile. Removing this repression in the elf3 mutant
resulted in moderate de-repression of PRR5 and TOC1 in the
rsob.royalsocietypublishing.orgOpen
Biol.5:150042
11
on October 19, 2015http://rsob.royalsocietypublishing.org/Downloaded from
late night ( p , 0.01, ZT0/24; p ¼ 0.01 for PRR5 ZT22) and
potentially in the early morning ( p ¼ 0.06–0.08; ZT2–4;
figure 6e,f). In contrast, de-repression of the early PRRs in elf3was greatest in the early night (see above), indicating that the
profile of regulators varies among the PRR family members
(see Discussion).
2.5.4. GI
The main peak of GI expression in the late day behaves simi-
larly to PRR5, with delayed expression in the prr7;prr9 double
mutant owing to longer expression of LHY and CCA1 under
LD and LL but not DD, and an advanced phase in the
lhy;cca1 double mutant (figure 5h,p). In contrast to PRR5but similarly to PRR9 and PRR7, GI was de-repressed from
ZT10 in the elf3 mutant ( p , 0.01), consistent with [21] and
the Southern dataset (electronic supplementary material,
figure S5f ). The Southern dataset showed that the expression
of GI was similar in elf3 and elf4 mutants, but there was much
less effect on CCA1 in elf4 than elf3 (electronic supplementary
material, figure S5g), indicating that the effects of the EC
components can be distinct.
2.5.5. ELF3
The ELF3 rhythmic profile has low amplitude, as noted
above, with a trough at ZT2–4 and peaks at both ZT8 and
ZT18–20 in WT plants under LD in the TiMet and ROBuST
datasets (figure 5i,s; electronic supplementary material,
figures S3i– j, S5d). The trough of ELF3 expression is de-
repressed at ZT4 in the lhy;cca1 double mutant ( p , 0.01),
though there is no peak at this time, in contrast to all the
other clock genes. The rise in ELF3 expression is delayed in
the prr7;prr9 double mutant ( p , 0.01–0.05, at ZT6–10), con-
sistent with repression by increased levels of LHY and CCA1
(figure 5i). The elf3–4 allele contains a small deletion in the
coding region [50] and accumulates the mutant RNA. The
mutant expression profile suggests de-repression at ZT2
( p ¼ 0.06; figure 6i), consistent with lower expression of
LHY and CCA1 in elf3 (noted above).
2.5.6. ELF4 and LUX
The two remaining EC components tested, ELF4 and LUX,share the evening expression peak determined by LHY/CCA1-mediated repression, with a phase advance in lhy;cca1 and a
delay in prr7;prr9 in LD and LL conditions (figure 5g,j). Strik-
ingly, however, the phase separation among the clock genes
was lost in the lhy;cca1 double mutant under LL, such that
PRR9 and ELF4 peaked together at 50 and 66 h (discussed
below). Thus, LHY and CCA1 contribute to the 4 h separation
of peak times between PRR9 (54 h) and ELF4 (58 h) in the
Ws-2 control under LL. In DD, peak expression of ELF4 was
the most reduced of all the genes, to less than 10% of the LD
peak level ( p , 0.01 in Col and Ws; figure 5t), consistent with
the loss of light activation [44] and/or sugar signalling. ELF4was also de-repressed earlier in the toc1 mutant under DD
than the other genes (ZT28–36 h; figure 5j), rising as early as
in the lhy;cca1 double mutant. Under LD conditions, the toc1mutant de-repressed ELF4 at ZT2–6, earlier than WT. Peak
expression of LUX did not fall significantly in DD (figure 5q).
LUX was broadly de-repressed in the elf3 mutant, remaining
at the WT peak level at ZT6–22 h (figure 6g), in a similar pattern
to PRR7. This result is consistent with LUX binding to its cog-
nate promoter [20] resulting in negative autoregulation
(figure 1a [10]). ELF4 expression in the elf3 mutant, in contrast,
showed a pattern more similar to TOC1 and PRR5 (see above),with de-repression only from ZT22–ZT6 h (figure 6j).
2.6. Alternative visualization gives new insights intoco-regulation of clock genes
Data visualization is critical in analysing the complex inter-
actions within the clock gene circuit, in order to generate
new hypotheses. Timeseries plots do not show these inter-
actions directly. They can be revealed in phase plane diagrams
that plot the levels of two components against each other
(figure 7), though this format is less familiar (see electronic sup-
plementary material). First, phase plane plots emphasize the
relative timing of clock components, rather than control by the
light : dark cycle. For example, GI rose without (before) TOC1,
especially in Col plants of the TiMet and ROBuST datasets
that were grown without exogenous sucrose. High TOC1levels extended later than high GI, particularly in Ws-2 plants
of the TiMet datasets (figure 7a). Second, this visualization can
reveal interactions among the components plotted. Forexample,
figure 7b shows TOC1 RNA levels in younger plants were main-
tained at 35–55% of the peak level at ZT20–22, when CCA1expression rose above 50% of its peak level. TOC1 levels were
lower for the same CCA1 level in rosette plants. The logarithmic
scale shows this more clearly (figure 7c). This suggests that
CCA1 protein is not yet an effective repressor of TOC1 at this
phase, especially in younger tissues.
Finally, the phase plane diagrams can show how the inter-
action of two genes depends upon a third regulator. Expression
peaks of PRR9 and ELF4 were far out of phase in the WT
(figure 7d), for example. Data from LL (filled symbols) suggest
a negative correlation in the subjective night, when ELF4 falls
as PRR9 rises. However, the two genes peak then fall together
in the lhy cca1 double mutant under LL, at ZT26 and ZT42
(figure 7e; equivalent to timepoints 50 and 66 h in figure 5),
creating a diagonal with a positive gradient (red dashed line,
figure 7f). PRR9 also had an earlier peak that was not shared
by ELF4 (ZT22 and ZT38, or 46 and 62 h in figure 5; black
arrowheads in figure 7f ). Both features were reproduced on
two successive cycles, though PRR9 expression was less than
1% of the WT peak level. Thus LHY, CCA1 and the LD cycle
all differentiate PRR9 expression from ELF4, but in their
absence, PRR9 and ELF4 expression profiles are similar for
much of the circadian cycle (six of eight timepoints in the
short, 16 h cycle of the mutant), presumably controlled by
the other PRRs and/or the EC. Likewise, phase plane diagrams
for the prr7;prr9 double mutant (electronic supplementary
material, figure S6) suggested that not only CCA1 and LHY,
but also the PRRs repress ELF4 in the WT. In addition to visu-
alization, many other aspects of data management benefit
significantly from online data infrastructure.
2.7. Online infrastructure for data sharingOur open-source BioDare (Biological Data repository) [51] sup-
ports data from many small-scale experiments that collectively
represent a significant resource (table 1). Empirical evidence
indicates that these data are essential to understand complex
biological regulation, and mathematical analysis shows why

0
0.2
0.4
0.6
0.8
1.0
0 0.2 0.4 0.6 0.8 1.0
0 0.2 0.4 0.6 0.8 1.0
rela
tive
GI
leve
l
relative TOC1 level
0
0.2
0.4
0.6
0.8
1.0
rela
tive
TO
C1
leve
l
rela
tive
TO
C1
leve
l
relative CCA1 level
ZT0
ZT0
ZT0
0.01
0.1
1
0.0001 0.001 0.01 0.1 1
WS ROBuST
Col4 ROBuST
Col0 suc McW
Col0 suc Edw
WS ros TiMet
Col0 ros TiMet
WS sd1 TiMet
relative CCA1 level
0.02
0.2
0.0002 0.0020.001
0.01
0.1
1
rela
tive
ELF
4 le
vel
Col LD
Col LL
0.001
0.01
0.1
1
relative PRR9 level relative PRR9 level relative PRR9 level
Col LDlhy cca1 LL
ZT0
ZT12
ZT12
ZT12
ZT0
0.0001 0.001 0.01 0.1 1 0.0001 0.01 1
lhy cca1 LD lhy cca1 LDlhy cca1 LL day 1lhy cca1 LL day 2
(b)
(a)
(c)
(d ) (e) ( f )
Figure 7. Phase plane diagrams reveal pairwise gene interactions. (a – c) Normalized RNA profiles of figure 3 are represented as phase plane diagrams, plotting (a)GI and TOC1, and TOC1 and CCA1 on (b) linear and (c) logarithmic scales. Larger markers indicate ZT0 datapoint, arrows indicate the direction of time. (d – f ) RNAprofiles of figure 5 are represented as phase plane diagrams on logarithmic scales, plotting data for ELF4 and PRR9 (d ) in wild-type Col plants under LD and LL(0 – 22 h in figure 5, dashed line; 24 – 70 h, solid line), and (e) in Col plants under LD and lhy cca1 double mutants under LD and LL (solid blue line), with ( f ) arescaled view of a subset of the data from the lhy cca1 double mutants. Larger markers indicate 0 (ZT0) and 12 h (ZT12) datapoints in the cycle labelled LD. Thesetimepoints are equivalent to 24 (ZT0) and 36 h (ZT12) in the cycle labelled LL. Arrows indicate the direction of time. (d ) Red dashed line marks falling ELF4 levelsduring the night-time trough of PRR9 in LD. ( f ) Red dashed line marks correlated PRR9 and ELF4 levels; arrowheads mark an earlier peak on each cycle in PRR9.Timepoints 48 (ZT24) to 70 h (ZT46) under LL are plotted in brown to emphasize the similar profiles on successive days.
rsob.royalsocietypublishing.orgOpen
Biol.5:150042
12
on October 19, 2015http://rsob.royalsocietypublishing.org/Downloaded from
this is the case (see Discussion). In addition to six rhythm-
analysis algorithms [52] and protocols for analysis, statistical
summary and visualization [53], BioDare facilitates data shar-
ing and public dissemination by providing a stable identifier
for each experiment. Detailed metadata (experimental descrip-
tion) ensure that the data can be reused appropriately. Results
can be compared across studies and laboratories (‘data
aggregation’) by searching the metadata for genotype,
marker gene and other terms (figure 8). Increased expression
of GI in the elf3 mutant, for example, is highlighted despite
the greater technical variability of manual assay preparation
in the Southern dataset compared with the later, robotized
assays in the TiMet data (figure 6h; electronic supplementary
material, figure S5f and Methods).
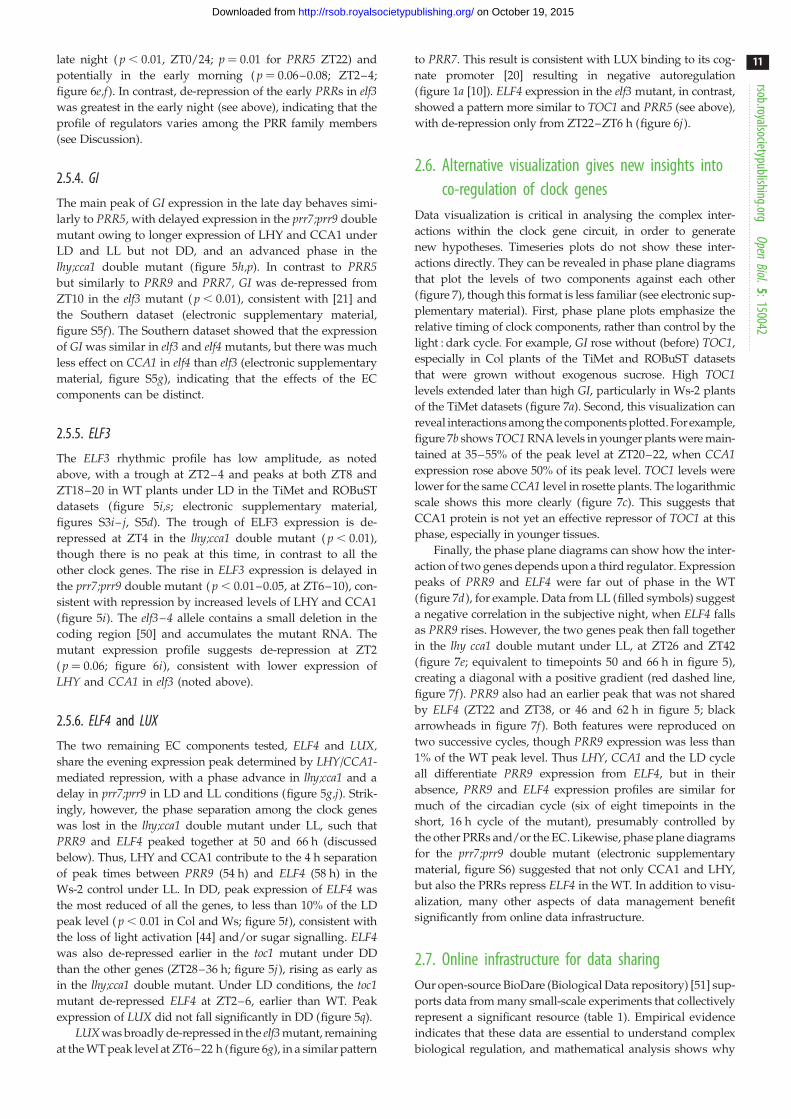
Table 1. Usage statistics of BioDare (Feb 2015), from originating groups and selected external users. An experiment represents a dataset similar to one of theabove-described studies, which includes multiple timeseries, from samples of multiple genotypes, assays or reporters and/or environmental conditions. Totalsinclude minor users that are not listed individually; the total number of data points is over 41 million.
research group location experiments % total experiments timeseries % total timeseries
A. J. Millar Edinburgh, UK 332 14 41 890 18
A. Hall Liverpool, UK 261 11 79 228 34
D. Bell-Pedersen Texas A&M, USA 138 6 1428 1
J. Agren Uppsala, Sweden 18 1 9370 4
K .J. Halliday Edinburgh, UK 230 10 5043 2
L. Larrondo Santiago, Chile 75 3 6429 3
M. Jones Essex, UK 89 4 3148 1
M. Hastings MRC LMB, UK 1071 45 58 770 25
S. Harmer UC Davis, USA 37 2 11 353 5
S. A. Kay USC, USA 38 2 12 972 6
All BioDare 2344 232 844
PEDRO
datadescription
PEDRO
156 fields
naive3705 fields
dataretrieval
text search394 exp’ts
‘aggregate’6 exp’ts
Figure 8. Computational infrastructure for systems chronobiology. Customized wizards in the PEDRO XML editor capture detailed metadata (right panel, showing CCA1 :LUC in sample wizard). Rather than filling 3705 metadata fields for this experiment, as a naive spreadsheet would require, PEDRO captures the information with only 156entries. After uploading the metadata and numerical data to BioDare, results can be displayed in the web browser (centre panel) with powerful secondary processingfunctions. The left-hand sidebar in this screen has shortcuts to common tasks and recent activity. A naive text search for ‘CCA1’ returned 394 experiments (exp’ts),whereas BioDare’s ‘aggregate’ function retrieved six specific results by searching the structured metadata, with secondary filters. The search shown (right panel) aggre-gated qPCR assays of CCA1 in wild-type plants (see main text) including datasets 1, 3, 4 and 6 of figure 1c. The export button above the graph downloads the data shownto a spreadsheet-compatible file.
rsob.royalsocietypublishing.orgOpen
Biol.5:150042
13
on October 19, 2015http://rsob.royalsocietypublishing.org/Downloaded from
2.8. Optimizing clock models with public resourcesOne goal of such comparisons is to determine how much of
the available data is matched by a particular mathematical
model: the ROBuST and TiMet experiments were designed to
test models of the clock gene circuit under different growth
conditions. However, testing complex models against large
datasets requires skills that are rare among plant molecular
researchers. We therefore tested whether our comprehen-
sive data and better computational resources could make
modelling more accessible. The open-source SBSI allows
non-programmers to optimize model parameters in order to
match diverse data, on large, parallel computers [29]. As a
test case, we addressed a recognized limitation of the original
P2011 model [10], termed P2011.1.1. The model was developed
to understand circadian clock function under light–dark cycles
and, separately, under constant light. Following a transition
from LD to LL (as in figure 5a–j), the first peak in expression
of the combined LHY/CCA1 component under constant light
occurred at ZT28.4 h (52.4 h in figure 7a), about 2.5 h later
than in the TiMet ros data (as noted [25,54]). The model’s
light–dark function was replaced with the input signal step
function [55] to represent the LD–LL transition in the commu-
nity model exchange format, SBML [56]. The resulting model
P2011.1.2 was optimized in SBSI (see electronic supplementary
material), testing model simulations with many alternative
parameter sets against the TiMet ros RNA dataset, including
the LD–LL transition (figure 5a–j), and against circadian
period values for clock mutants and WT plants [29].
The optimized parameter set of model P2011.2.1 more clo-
sely matched the data, including an earlier peak of LHY/CCA1in LL at ZT26.5 h (figure 9a) and a closer match to TOC1 and
GI profiles in LD (ZT10–12 h; figure 9b,c), while retaining
other qualitative behaviours. LHY/CCA1 expression rises in LL
after the PRR repressor proteins are degraded. Consistent with
this notion, removing TOC1, the last gene in the PRR repressor
wave, advanced the phase of the entire clock mechanism in LL.
Results for PRR7 are shown in figure 9d,e. PRR protein degra-
dation rates were not strongly affected in P2011.2.1; rather,
overall PRR levels were lower than in P2011.1.2 (not shown).
In the simulated toc1 mutant, the peak of LHY/CCA1 was 1.4 h
earlier than simulated WT in P2011.1.2, 2.5 h earlier in
P2011.2.1, but 4 h earlier in the data (figure 5a,b). The simu-
lations of PRR7 show the same improved timing of the new
0
0.4
0.8
1.2
1.6
2.0
2.4
00.10.20.30.40.50.60.70.80.9
TOC1
0 12 24 36 48 60 72time (h)
0 12 24 36 48 60 72time (h)
GI
(b)
0
0.2
0.4
0.6
0.8
expr
essi
on (
arb.
uni
ts)
1.0
1.2 experimental data
old model
new model
LHY/CCA1
0 12 24 36 48 60 72time (h)
(a) (c)
expr
essi
on (
arb.
uni
ts)
expr
essi
on (
arb.
uni
ts)
0
0.2
0.4
0.6
0.8
1.0
1.2
1.4
0 12 24 36 48 60 72
PRR7, WT
time (h)
(d )
0
0.2
0.4
0.6
0.8
1.0
1.2
1.4
0 12 24 36 48 60 72
PRR7, toc1
time (h)
(e)
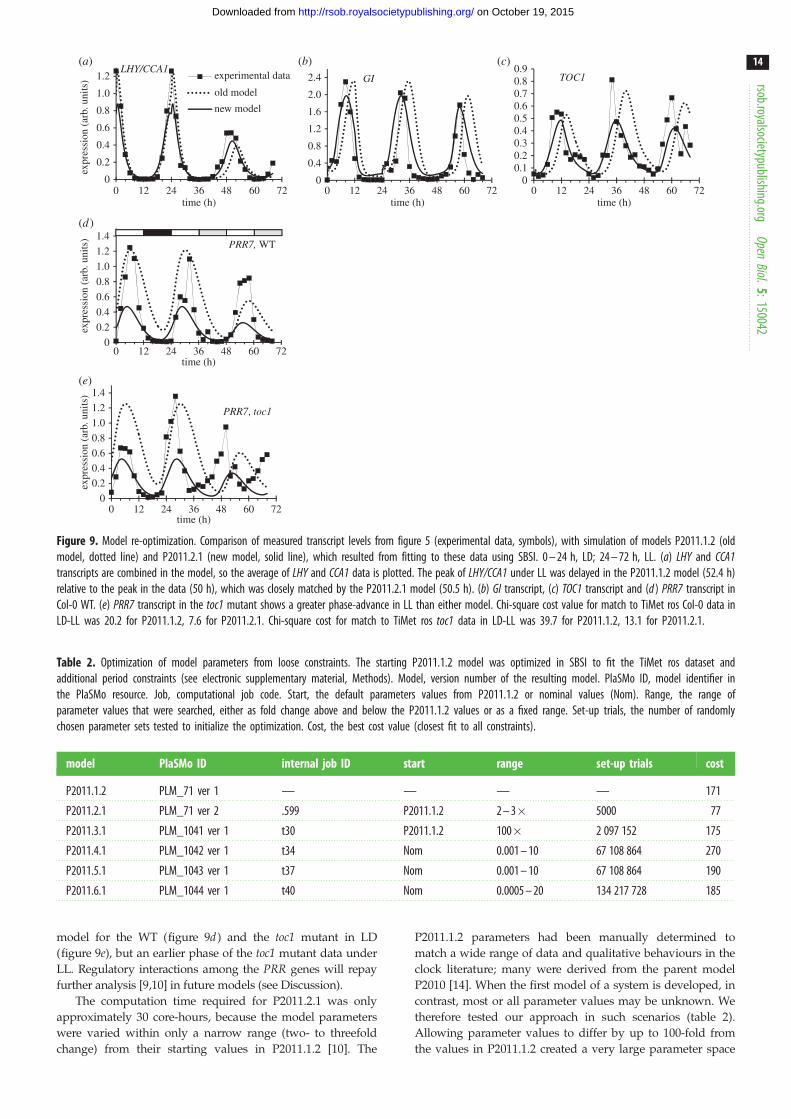
Figure 9. Model re-optimization. Comparison of measured transcript levels from figure 5 (experimental data, symbols), with simulation of models P2011.1.2 (oldmodel, dotted line) and P2011.2.1 (new model, solid line), which resulted from fitting to these data using SBSI. 0 – 24 h, LD; 24 – 72 h, LL. (a) LHY and CCA1transcripts are combined in the model, so the average of LHY and CCA1 data is plotted. The peak of LHY/CCA1 under LL was delayed in the P2011.1.2 model (52.4 h)relative to the peak in the data (50 h), which was closely matched by the P2011.2.1 model (50.5 h). (b) GI transcript, (c) TOC1 transcript and (d ) PRR7 transcript inCol-0 WT. (e) PRR7 transcript in the toc1 mutant shows a greater phase-advance in LL than either model. Chi-square cost value for match to TiMet ros Col-0 data inLD-LL was 20.2 for P2011.1.2, 7.6 for P2011.2.1. Chi-square cost for match to TiMet ros toc1 data in LD-LL was 39.7 for P2011.1.2, 13.1 for P2011.2.1.
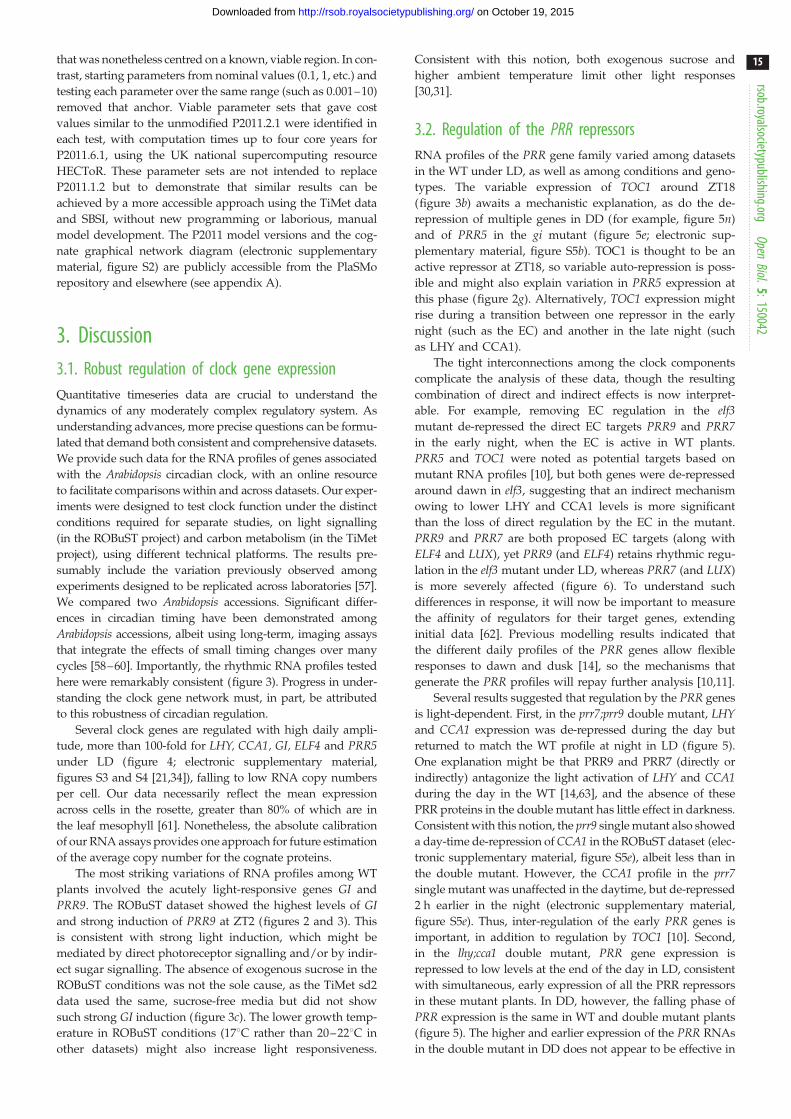
Table 2. Optimization of model parameters from loose constraints. The starting P2011.1.2 model was optimized in SBSI to fit the TiMet ros dataset andadditional period constraints (see electronic supplementary material, Methods). Model, version number of the resulting model. PlaSMo ID, model identifier inthe PlaSMo resource. Job, computational job code. Start, the default parameters values from P2011.1.2 or nominal values (Nom). Range, the range ofparameter values that were searched, either as fold change above and below the P2011.1.2 values or as a fixed range. Set-up trials, the number of randomlychosen parameter sets tested to initialize the optimization. Cost, the best cost value (closest fit to all constraints).
model PlaSMo ID internal job ID start range set-up trials cost
P2011.1.2 PLM_71 ver 1 — — — — 171
P2011.2.1 PLM_71 ver 2 .599 P2011.1.2 2 – 3� 5000 77
P2011.3.1 PLM_1041 ver 1 t30 P2011.1.2 100� 2 097 152 175
P2011.4.1 PLM_1042 ver 1 t34 Nom 0.001 – 10 67 108 864 270
P2011.5.1 PLM_1043 ver 1 t37 Nom 0.001 – 10 67 108 864 190
P2011.6.1 PLM_1044 ver 1 t40 Nom 0.0005 – 20 134 217 728 185
rsob.royalsocietypublishing.orgOpen
Biol.5:150042
14
on October 19, 2015http://rsob.royalsocietypublishing.org/Downloaded from
model for the WT (figure 9d) and the toc1 mutant in LD
(figure 9e), but an earlier phase of the toc1 mutant data under
LL. Regulatory interactions among the PRR genes will repay
further analysis [9,10] in future models (see Discussion).
The computation time required for P2011.2.1 was only
approximately 30 core-hours, because the model parameters
were varied within only a narrow range (two- to threefold
change) from their starting values in P2011.1.2 [10]. The
P2011.1.2 parameters had been manually determined to
match a wide range of data and qualitative behaviours in the
clock literature; many were derived from the parent model
P2010 [14]. When the first model of a system is developed, in
contrast, most or all parameter values may be unknown. We
therefore tested our approach in such scenarios (table 2).
Allowing parameter values to differ by up to 100-fold from
the values in P2011.1.2 created a very large parameter space
rsob.royalsocietypublishing.orgOpen
Biol.5
15
on October 19, 2015http://rsob.royalsocietypublishing.org/Downloaded from
that was nonetheless centred on a known, viable region. In con-
trast, starting parameters from nominal values (0.1, 1, etc.) and
testing each parameter over the same range (such as 0.001–10)
removed that anchor. Viable parameter sets that gave cost
values similar to the unmodified P2011.2.1 were identified in
each test, with computation times up to four core years for
P2011.6.1, using the UK national supercomputing resource
HECToR. These parameter sets are not intended to replace
P2011.1.2 but to demonstrate that similar results can be
achieved by a more accessible approach using the TiMet data
and SBSI, without new programming or laborious, manual
model development. The P2011 model versions and the cog-
nate graphical network diagram (electronic supplementary
material, figure S2) are publicly accessible from the PlaSMo
repository and elsewhere (see appendix A).
:1500423. Discussion3.1. Robust regulation of clock gene expressionQuantitative timeseries data are crucial to understand the
dynamics of any moderately complex regulatory system. As
understanding advances, more precise questions can be formu-
lated that demand both consistent and comprehensive datasets.
We provide such data for the RNA profiles of genes associated
with the Arabidopsis circadian clock, with an online resource
to facilitate comparisons within and across datasets. Our exper-
iments were designed to test clock function under the distinct
conditions required for separate studies, on light signalling
(in the ROBuST project) and carbon metabolism (in the TiMet
project), using different technical platforms. The results pre-
sumably include the variation previously observed among
experiments designed to be replicated across laboratories [57].
We compared two Arabidopsis accessions. Significant differ-
ences in circadian timing have been demonstrated among
Arabidopsis accessions, albeit using long-term, imaging assays
that integrate the effects of small timing changes over many
cycles [58–60]. Importantly, the rhythmic RNA profiles tested
here were remarkably consistent (figure 3). Progress in under-
standing the clock gene network must, in part, be attributed
to this robustness of circadian regulation.
Several clock genes are regulated with high daily ampli-
tude, more than 100-fold for LHY, CCA1, GI, ELF4 and PRR5under LD (figure 4; electronic supplementary material,
figures S3 and S4 [21,34]), falling to low RNA copy numbers
per cell. Our data necessarily reflect the mean expression
across cells in the rosette, greater than 80% of which are in
the leaf mesophyll [61]. Nonetheless, the absolute calibration
of our RNA assays provides one approach for future estimation
of the average copy number for the cognate proteins.
The most striking variations of RNA profiles among WT
plants involved the acutely light-responsive genes GI and
PRR9. The ROBuST dataset showed the highest levels of GIand strong induction of PRR9 at ZT2 (figures 2 and 3). This
is consistent with strong light induction, which might be
mediated by direct photoreceptor signalling and/or by indir-
ect sugar signalling. The absence of exogenous sucrose in the
ROBuST conditions was not the sole cause, as the TiMet sd2
data used the same, sucrose-free media but did not show
such strong GI induction (figure 3c). The lower growth temp-
erature in ROBuST conditions (178C rather than 20–228C in
other datasets) might also increase light responsiveness.
Consistent with this notion, both exogenous sucrose and
higher ambient temperature limit other light responses
[30,31].
3.2. Regulation of the PRR repressorsRNA profiles of the PRR gene family varied among datasets
in the WT under LD, as well as among conditions and geno-
types. The variable expression of TOC1 around ZT18
(figure 3b) awaits a mechanistic explanation, as do the de-
repression of multiple genes in DD (for example, figure 5n)
and of PRR5 in the gi mutant (figure 5e; electronic sup-
plementary material, figure S5b). TOC1 is thought to be an
active repressor at ZT18, so variable auto-repression is poss-
ible and might also explain variation in PRR5 expression at
this phase (figure 2g). Alternatively, TOC1 expression might
rise during a transition between one repressor in the early
night (such as the EC) and another in the late night (such
as LHY and CCA1).
The tight interconnections among the clock components
complicate the analysis of these data, though the resulting
combination of direct and indirect effects is now interpret-
able. For example, removing EC regulation in the elf3mutant de-repressed the direct EC targets PRR9 and PRR7in the early night, when the EC is active in WT plants.
PRR5 and TOC1 were noted as potential targets based on
mutant RNA profiles [10], but both genes were de-repressed
around dawn in elf3, suggesting that an indirect mechanism
owing to lower LHY and CCA1 levels is more significant
than the loss of direct regulation by the EC in the mutant.
PRR9 and PRR7 are both proposed EC targets (along with
ELF4 and LUX), yet PRR9 (and ELF4) retains rhythmic regu-
lation in the elf3 mutant under LD, whereas PRR7 (and LUX)
is more severely affected (figure 6). To understand such
differences in response, it will now be important to measure
the affinity of regulators for their target genes, extending
initial data [62]. Previous modelling results indicated that
the different daily profiles of the PRR genes allow flexible
responses to dawn and dusk [14], so the mechanisms that
generate the PRR profiles will repay further analysis [10,11].
Several results suggested that regulation by the PRR genes
is light-dependent. First, in the prr7;prr9 double mutant, LHYand CCA1 expression was de-repressed during the day but
returned to match the WT profile at night in LD (figure 5).
One explanation might be that PRR9 and PRR7 (directly or
indirectly) antagonize the light activation of LHY and CCA1during the day in the WT [14,63], and the absence of these
PRR proteins in the double mutant has little effect in darkness.
Consistent with this notion, the prr9 single mutant also showed
a day-time de-repression of CCA1 in the ROBuST dataset (elec-
tronic supplementary material, figure S5e), albeit less than in
the double mutant. However, the CCA1 profile in the prr7single mutant was unaffected in the daytime, but de-repressed
2 h earlier in the night (electronic supplementary material,
figure S5e). Thus, inter-regulation of the early PRR genes is
important, in addition to regulation by TOC1 [10]. Second,
in the lhy;cca1 double mutant, PRR gene expression is
repressed to low levels at the end of the day in LD, consistent
with simultaneous, early expression of all the PRR repressors
in these mutant plants. In DD, however, the falling phase of
PRR expression is the same in WT and double mutant plants
(figure 5). The higher and earlier expression of the PRR RNAs
in the double mutant in DD does not appear to be effective in
rsob.royalsocietypublishing.orgOpen
Biol.5:150042
16
on October 19, 2015http://rsob.royalsocietypublishing.org/Downloaded from
suppressing PRR expression. The faster degradation of the PRR
proteins in darkness presumably contributes to these effects; it
will be interesting to determine whether the interaction of the
photoreceptor PHYB with clock proteins (including TOC1
[64]) also mediates the light sensitivity of this process.
3.3. Effects of exogenous sucroseCurrent models of the Arabidopsis circadian clock are necess-
arily based on disparate data, much of it derived from
seedlings grown on media containing high levels of sucrose.
The presence or absence of exogenous sucrose under the con-
ditions tested here affected the clock RNA profiles less, or at
least no more, than other experimental parameters, despite
the widespread regulation of plant genes by sucrose [41,65].
Consistent with this, effects of exogenous sucrose on clock
gene expression in WT plants have previously been reported
under very low light fluence rates or in the presence of photo-
synthetic inhibitors [40], in DD, CO2-free air or the starchless
pgm mutant [39,66,67]. PRR7 was induced in sugar-starved
conditions (extended DD and at night in pgm) and was
repressed by resupply of 3% exogenous sucrose (electronic
supplementary material, figure S7a). Only the TiMet rosette
study tested PRR7 in DD, finding increased PRR7 levels
(figure 5n), especially in the trough of the profile (electronic
supplementary material, figure S4c). Trough levels of CCA1and GI were also raised in DD in the TiMet data, and in the
Edwards experiment that included 3% exogenous sucrose
(electronic supplementary material, figure S3 [34]). De-
repression of the trough levels in DD is neither specific to
PRR7 nor to sugar limitation. Transcript levels of the TOC1-
and PRR5-degrading F-box protein ZTL, and its homologues
LKP2 and FKF1, also rose slightly in sugar-starved conditions
(electronic supplementary material, figure S7b [67]), suggesting
one possible mechanism for de-repression of PRR7 via faster
degradation of PRR repressors.
3.4. Open resources for small-scale resultsOur results will be useful to generate and test many hypoth-
eses beyond those reported here. The potential for such future
value might, in principle, justify the additional effort in cur-
ating and disseminating our data. In practice, future value
motivated little data sharing, compared with present value.
We therefore outline the mathematical understanding of
and empirical evidence for such present value, together
with practical steps that increased both present and future
value relative to the effort involved in sharing data.
No suitable community repository existed for our results.
One reason was the relatively large effort required to describe
accurately many small data files, which deters researchers
and resource developers from sharing such data [68]. The lar-
gest-scale omics and sequencing studies have different data
structures, motivations, stakeholders and economics, which
can facilitate data sharing [69] including exemplary resources
in the circadian field [70–72]. However, mathematical analy-
sis explains why the results of small-scale experiments
are often particularly valuable in understanding biological
systems. Gutenkunst et al. [73] showed that parameters
were ‘sloppy’ in dynamic models of a range of biological
regulatory systems, meaning that a wide range of parameter
values could generate the simple behaviours that they tested.
Rand et al. [74–76] tested how many parameter changes
could affect the dynamic behaviour of such systems. All
possible behaviours were tested and only a handful of beha-
viours could be readily achieved by changing parameters
(these behaviours have also been termed the ‘dynatype’
of the system, by analogy to the phenotype of an orga-
nism [77]). For circadian clocks, a change in period was the
most accessible behaviour: many different parameter changes
altered period under constant conditions [74]. The related,
empirical result is that genetic screens seeking mutants with
altered circadian period have not only identified clock com-
ponents, but also many genes that affect the clock less
directly [78,79]. Observing a change in period gives little evi-
dence for the role of the mutated gene in the plant and does
not strongly constrain any particular parameter in the model,
but rather has a small constraining effect upon a large
number of parameters, in agreement with Gutenkunst et al.[73]. A measured period value can therefore easily be accom-
modated without fundamentally changing the model. In
contrast, manipulating the system to test less accessible beha-
viours provides strong constraints, albeit potentially on fewer
parameters [76]. It is much more likely that such results
would not be accommodated by any reasonable parameter
values, falsifying the current model and leading to new under-
standing during the development of a better model. Thus, the
number of manipulations tested is crucial; model analysis can
prioritize the most informative manipulations [80,81].
One consequence for experimental design is that the
number of manipulations is more important than the number
of components tested. This concept is familiar from the statisti-
cal clustering of microarray timeseries. The behaviour of a
single cluster mean can adequately represent hundreds of indi-
vidual transcripts, even for genes with complex light and
circadian regulation [82]. The individual transcript data are
more valuable in identifying coregulated, downstream genes
than in understanding the clock system upstream. Thus, tar-
geted qRT-PCR or reporter gene assays have been more
widely used in understanding the clock gene circuit, although
they lacked a data-sharing resource. Despite the limited justifi-
cation for costly omic assays, targeted data-sharing resources
[67,70] have ensured that a subset of transcriptomics data
have been reused effectively in clock studies.
Empirical evidence for the value of multiple manipula-
tions comes from 10 years of modelling the plant clock gene
circuit and output pathways. Constraining the models with
timeseries data from many conditions was a critical tool [83],
resulting in multiple, experimentally validated predictions.
Gleaning the data from electronic supplementary material or
by ‘scraping’ numerical values from published charts made
this possible. In practice, aggregating the numerical data has
often taken a major effort, after which the data were shared
on author web sites [25,84] or on BioDare [82,85,86].
BioDare [51] was developed to share timeseries data
from relatively small-scale experiments conducted within
individual laboratories (such as the Edwards, Southern and
McWatters datasets) or in collaborative projects with few part-
ners (such as ROBuST and TiMet). A regular user might upload
an experiment with several hundred timeseries each week
[87,88]. However, the user must also provide experimental
metadata that are sufficiently detailed to pinpoint the most rel-
evant experiment among hundreds to thousands of similar
studies (table 1). The resource must therefore streamline the
process of writing the structured metadata to minimize the
weekly effort involved, and then use the metadata to provide
rsob.royalsocietypublishing.orgOpen
Biol.5:150042
17
on October 19, 2015http://rsob.royalsocietypublishing.org/Downloaded from
powerful search functions, for later users to discover relevant
data that were previously unknown to them. Figure 8 illus-
trates metadata capture using ‘wizard’ forms in BioDare,
data aggregation based upon the resulting metadata, and visu-
alization of the data from a small set of relevant experiments,
whereas a naive text search returned an impractically large
number of results.
The potential future value of shared data resulted in fewer
than a dozen datasets being shared in the early phases of
our projects. To provide immediate value from depositing
data, BioDare therefore offers data processing (detrending,
averaging) and visualization along with specialized circadian
data analysis [52,53]. Stable identifier URLs conveniently
direct collaborators to specific datasets and can be cited in
publications [88,89]. The citations will be tracked by the
Thomson Reuters Data Citation Index, giving a metric analo-
gous to publication citations to recognize data-sharing
contributions [90]. BioDare is available as a community
resource that could be linked to organism-specific databases
[91]. BioDare complements our repository of plant systems
models (PlaSMo) [92].
3.5. From visualization to modellingOur analysis here was model-assisted but manual, so data visu-
alization was important. For example, phase-plane diagrams
can reveal conditional pairwise interactions including subtle
effects at low RNA levels, such as the correlation of PRR9and ELF4 expression in the lhy cca1 double mutant under LL
(figure 6d–f ). In contrast, PRR9 and ELF4 expression are uncor-
related or anticorrelated in the WT under LD. Such changes in
dynamics are important in forming hypotheses during model
development. Expert modelling has a subjective element.
Objective machine-learning methods can also to contribute to
hypothesis generation [93], though understanding such a con-
ditionally connected network (electronic supplementary
material, figure S2) is challenging by any approach [94].
Dense transcriptional regulatory interactions might be
general for plant environmental response pathways [95], jus-
tifying investment in infrastructure to support their analysis.
Mathematical models can powerfully express hypotheses
about such circuits, so long as the starting model adequately
recapitulates most data. Qualitatively, the variation among
our datasets was smaller than the departure of the model
simulations from the data (figures 3 and 9). The existing cir-
cadian clock models are therefore equally applicable to the
several growth conditions tested, at least in leaf tissue.
The transition from LD to LL is one case where the model
departed from the data, to which it had not previously been
constrained (also noted in references [54,88]). The P2011.2.1
model’s 2 h late phase in LL (figure 9) is caused by the
slower degradation of PRR proteins in the light than in the
dark [16,45]. Without a dark night to reduce PRR levels,
their slow degradation delays the rise in LHY/CCA1 on the
first cycle in LL in the model. PRR9, PRR7 and PRR5 RNA
levels are reduced in the second cycle in LL in both model
and data (figures 5c–e and 9e), restoring an approximately
24 h period in subsequent cycles. It is reassuring but not
surprising that re-optimization of the model could better
match this behaviour, but the models’ detailed behaviour is
non-trivial. Reducing the levels of PRR proteins in the new
parameter set advanced the phase of the first peak in LL.
Simplified models that included only the PRR protein
changes also reduced the effect of the PRRs on the period
of the clock in constant light (data not shown), contradicting
the data. The re-optimization allowed multiple parameter
changes to advance the phase of the P2011.2.1 model under
LL while retaining the observed effects of PRRs on clock
period, such as the short period of the toc1 mutant (figure 9e).
Most significantly, this result was obtained using tools
designed to be accessible to biological researchers with no
specialist computing or mathematical skills. Development of
P2011.2.1 required no new programming, nor the hand-crafted
cost functions that were used to optimize previous models
[25,83–85], nor the laborious, expert parameter exploration
used to construct its parent models [10,14,96]. Our intention
was that the scarcity of these skills should no longer present
an insuperable barrier, though of course they remain beneficial,
not least to keep abreast of relevant method development [80].
To test whether this approach could assist new model develop-
ment, as well as adjustment of an existing model, we repeated
the parameter search within a wide range of values and/or
after setting P2011.1.2 model parameters to nominal values.
Greater computational power is required when there are
fewer constraints on the model’s parameter values; however,
viable solutions were identified (table 2) and suitable comput-
ing resources are increasingly accessible [97]. The approach and
infrastructure presented here allow a wider range of biologists
to engage with complicated models, which will be essential
tools to understand the mechanisms and physiological
functions of complex biological networks.
Author contributions. Designed experiments: A.F., R.S., K.S., H.G.M.,M.S., A.J.M., K.J.H. Performed experiments: A.F., A.P.F., V.M.,M.M.S., H.G.M., K.S., A.J.M. Designed infrastructure: T.Z., A.J.M.,K.J.H. Built infrastructure: T.Z., A.H.; Analysed data: D.D.S., A.P.,M.M.S., H.G.M., A.J.M., M.S., K.J.H. A.F., H.G.M., M.S. and A.J.M.wrote the paper with input from all authors.
Competing interests. We declare we have no competing interests.
Funding. Supported by awards from UK BBSRC and EPSRC (ROBuSTBB/F005237/1 and SynthSys BB/D019621/1) and from the EuropeanCommission (FP7 collaborative project TiMet, contract 245143). Thiswork made use of the facilities of HECToR, the UK’s national high-performance computing service, which was provided by UoEHPCx Ltd at the University of Edinburgh, Cray Inc. and NAG Ltd,and funded by the Office of Science and Technology throughEPSRC’s High End Computing Programme.
Acknowledgements. We are grateful to Gavin Steel and Kelly Stewart forexpert technical assistance, Martin Beaton and Richard Adams forsupport of BioDare and SBSI, Uriel Urquiza for preparing SBMLfiles, David Rand for insightful discussion, and members of theA.J.M. and K.J.H. laboratories, who curated data for BioDare.
Appendix AA.1. Experimental proceduresExperimental methods were similar or identical to published
protocols [33,88,98], as detailed in the electronic supplemen-
tary material. Statistical significance of comparisons reported
in the results is from two-tailed t-tests compared with the cog-
nate WT plants at the same timepoint, unless otherwise stated.
Homoscedasticity is assumed, because all comparisons
reported are within individual datasets for the same PCR pri-
mers. Significance is not corrected for multiple comparisons
(reducing significance), nor for support from neighbouring
timepoints or replication across cycles or studies (which can
increase significance).
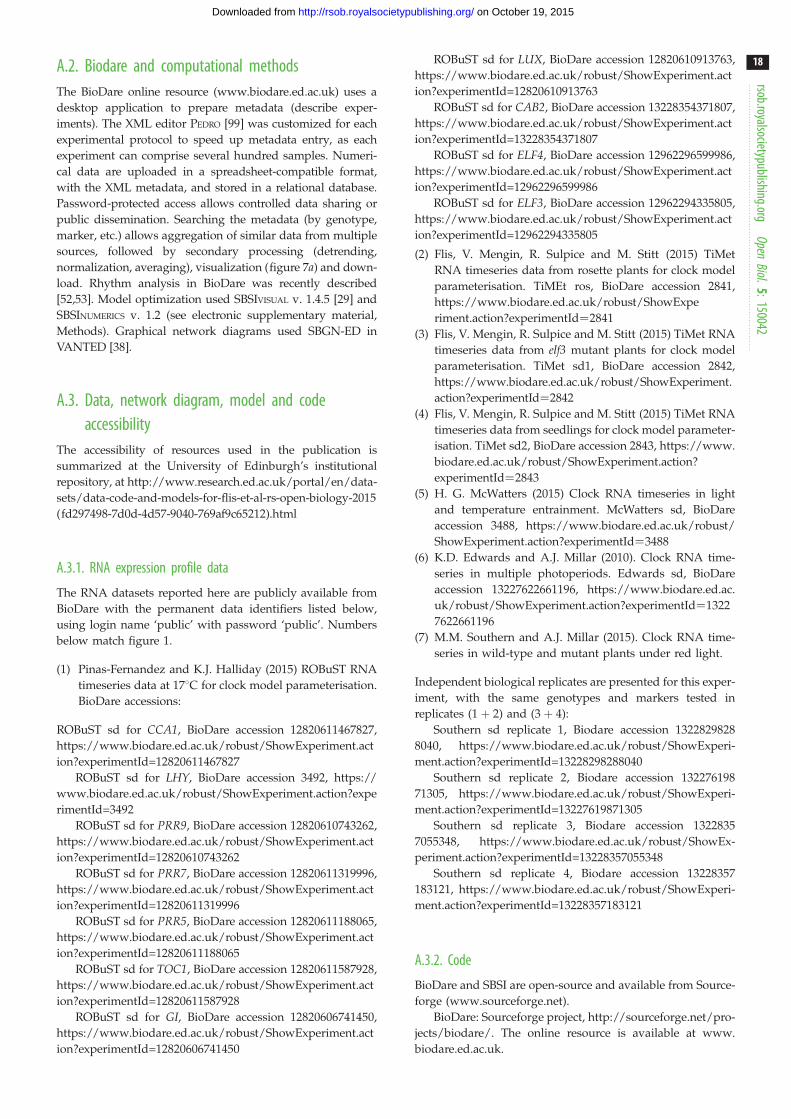
rsob.royalsocietypublishing.orgOpen
Biol.5:150042
18
on October 19, 2015http://rsob.royalsocietypublishing.org/Downloaded from
A.2. Biodare and computational methodsThe BioDare online resource (www.biodare.ed.ac.uk) uses a
desktop application to prepare metadata (describe exper-
iments). The XML editor PEDRO [99] was customized for each
experimental protocol to speed up metadata entry, as each
experiment can comprise several hundred samples. Numeri-
cal data are uploaded in a spreadsheet-compatible format,
with the XML metadata, and stored in a relational database.
Password-protected access allows controlled data sharing or
public dissemination. Searching the metadata (by genotype,
marker, etc.) allows aggregation of similar data from multiple
sources, followed by secondary processing (detrending,
normalization, averaging), visualization (figure 7a) and down-
load. Rhythm analysis in BioDare was recently described
[52,53]. Model optimization used SBSIVISUAL v. 1.4.5 [29] and
SBSINUMERICS v. 1.2 (see electronic supplementary material,
Methods). Graphical network diagrams used SBGN-ED in
VANTED [38].
A.3. Data, network diagram, model and codeaccessibility
The accessibility of resources used in the publication is
summarized at the University of Edinburgh’s institutional
repository, at http://www.research.ed.ac.uk/portal/en/data-
sets/data-code-and-models-for-flis-et-al-rs-open-biology-2015
(fd297498-7d0d-4d57-9040-769af9c65212).html
A.3.1. RNA expression profile data
The RNA datasets reported here are publicly available from
BioDare with the permanent data identifiers listed below,
using login name ‘public’ with password ‘public’. Numbers
below match figure 1.
(1) Pinas-Fernandez and K.J. Halliday (2015) ROBuST RNA
timeseries data at 178C for clock model parameterisation.
BioDare accessions:
ROBuST sd for CCA1, BioDare accession 12820611467827,
https://www.biodare.ed.ac.uk/robust/ShowExperiment.act
ion?experimentId=12820611467827
ROBuST sd for LHY, BioDare accession 3492, https://
www.biodare.ed.ac.uk/robust/ShowExperiment.action?expe
rimentId=3492
ROBuST sd for PRR9, BioDare accession 12820610743262,
https://www.biodare.ed.ac.uk/robust/ShowExperiment.act
ion?experimentId=12820610743262
ROBuST sd for PRR7, BioDare accession 12820611319996,
https://www.biodare.ed.ac.uk/robust/ShowExperiment.act
ion?experimentId=12820611319996
ROBuST sd for PRR5, BioDare accession 12820611188065,
https://www.biodare.ed.ac.uk/robust/ShowExperiment.act
ion?experimentId=12820611188065
ROBuST sd for TOC1, BioDare accession 12820611587928,
https://www.biodare.ed.ac.uk/robust/ShowExperiment.act
ion?experimentId=12820611587928
ROBuST sd for GI, BioDare accession 12820606741450,
https://www.biodare.ed.ac.uk/robust/ShowExperiment.act
ion?experimentId=12820606741450
ROBuST sd for LUX, BioDare accession 12820610913763,
https://www.biodare.ed.ac.uk/robust/ShowExperiment.act
ion?experimentId=12820610913763
ROBuST sd for CAB2, BioDare accession 13228354371807,
https://www.biodare.ed.ac.uk/robust/ShowExperiment.act
ion?experimentId=13228354371807
ROBuST sd for ELF4, BioDare accession 12962296599986,
https://www.biodare.ed.ac.uk/robust/ShowExperiment.act
ion?experimentId=12962296599986
ROBuST sd for ELF3, BioDare accession 12962294335805,
https://www.biodare.ed.ac.uk/robust/ShowExperiment.act
ion?experimentId=12962294335805
(2) Flis, V. Mengin, R. Sulpice and M. Stitt (2015) TiMet
RNA timeseries data from rosette plants for clock model
parameterisation. TiMEt ros, BioDare accession 2841,
https://www.biodare.ed.ac.uk/robust/ShowExpe
riment.action?experimentId¼2841
(3) Flis, V. Mengin, R. Sulpice and M. Stitt (2015) TiMet RNA
timeseries data from elf3 mutant plants for clock model
parameterisation. TiMet sd1, BioDare accession 2842,
https://www.biodare.ed.ac.uk/robust/ShowExperiment.
action?experimentId¼2842
(4) Flis, V. Mengin, R. Sulpice and M. Stitt (2015) TiMet RNA
timeseries data from seedlings for clock model parameter-
isation. TiMet sd2, BioDare accession 2843, https://www.
biodare.ed.ac.uk/robust/ShowExperiment.action?
experimentId¼2843
(5) H. G. McWatters (2015) Clock RNA timeseries in light
and temperature entrainment. McWatters sd, BioDare
accession 3488, https://www.biodare.ed.ac.uk/robust/
ShowExperiment.action?experimentId¼3488
(6) K.D. Edwards and A.J. Millar (2010). Clock RNA time-
series in multiple photoperiods. Edwards sd, BioDare
accession 13227622661196, https://www.biodare.ed.ac.
uk/robust/ShowExperiment.action?experimentId¼1322
7622661196
(7) M.M. Southern and A.J. Millar (2015). Clock RNA time-
series in wild-type and mutant plants under red light.
Independent biological replicates are presented for this exper-
iment, with the same genotypes and markers tested in
replicates (1 þ 2) and (3 þ 4):
Southern sd replicate 1, Biodare accession 1322829828
8040, https://www.biodare.ed.ac.uk/robust/ShowExperi-
ment.action?experimentId=13228298288040
Southern sd replicate 2, Biodare accession 132276198
71305, https://www.biodare.ed.ac.uk/robust/ShowExperi-
ment.action?experimentId=13227619871305
Southern sd replicate 3, Biodare accession 1322835
7055348, https://www.biodare.ed.ac.uk/robust/ShowEx-
periment.action?experimentId=13228357055348
Southern sd replicate 4, Biodare accession 13228357
183121, https://www.biodare.ed.ac.uk/robust/ShowExperi-
ment.action?experimentId=13228357183121
A.3.2. Code
BioDare and SBSI are open-source and available from Source-
forge (www.sourceforge.net).
BioDare: Sourceforge project, http://sourceforge.net/pro-
jects/biodare/. The online resource is available at www.
biodare.ed.ac.uk.
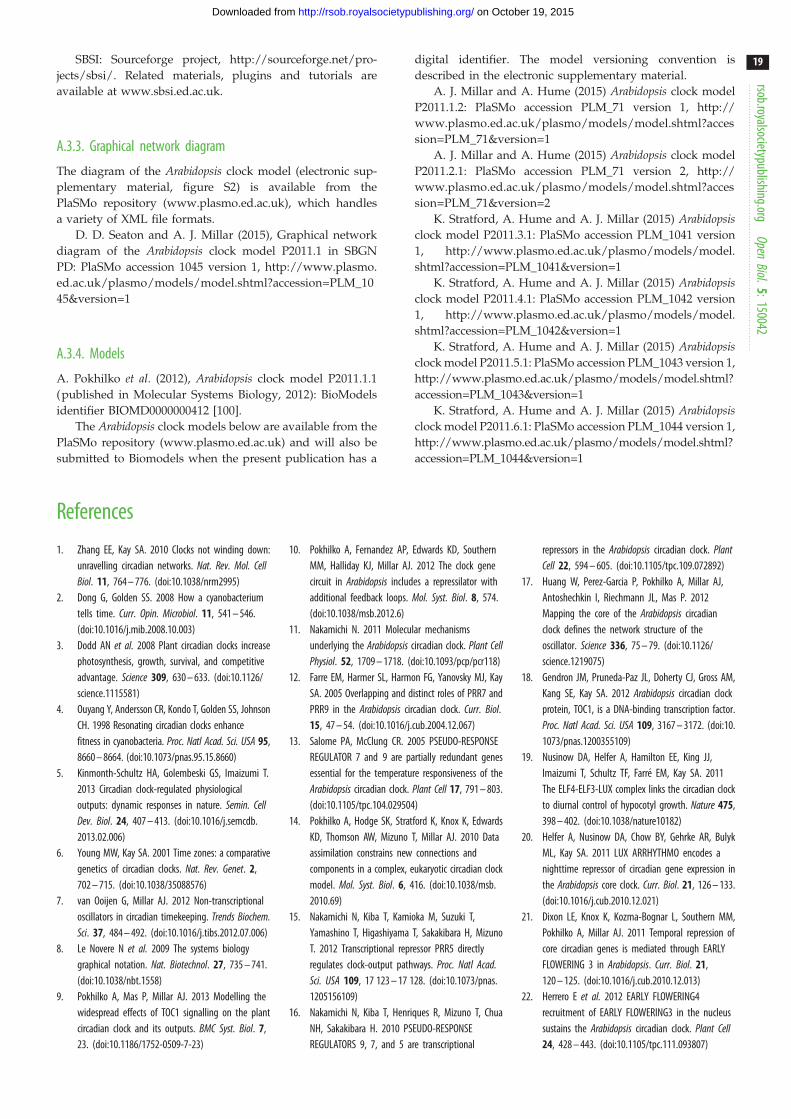
rsob
19
on October 19, 2015http://rsob.royalsocietypublishing.org/Downloaded from
SBSI: Sourceforge project, http://sourceforge.net/pro-
jects/sbsi/. Related materials, plugins and tutorials are
available at www.sbsi.ed.ac.uk.
.royalsocietypublishing.orgOpenBiol.5:15
A.3.3. Graphical network diagram
The diagram of the Arabidopsis clock model (electronic sup-
plementary material, figure S2) is available from the
PlaSMo repository (www.plasmo.ed.ac.uk), which handles
a variety of XML file formats.
D. D. Seaton and A. J. Millar (2015), Graphical network
diagram of the Arabidopsis clock model P2011.1 in SBGN
PD: PlaSMo accession 1045 version 1, http://www.plasmo.
ed.ac.uk/plasmo/models/model.shtml?accession=PLM_10
45&version=1
0042
A.3.4. Models
A. Pokhilko et al. (2012), Arabidopsis clock model P2011.1.1
(published in Molecular Systems Biology, 2012): BioModels
identifier BIOMD0000000412 [100].
The Arabidopsis clock models below are available from the
PlaSMo repository (www.plasmo.ed.ac.uk) and will also be
submitted to Biomodels when the present publication has a
digital identifier. The model versioning convention is
described in the electronic supplementary material.
A. J. Millar and A. Hume (2015) Arabidopsis clock model
P2011.1.2: PlaSMo accession PLM_71 version 1, http://
www.plasmo.ed.ac.uk/plasmo/models/model.shtml?acces
sion=PLM_71&version=1
A. J. Millar and A. Hume (2015) Arabidopsis clock model
P2011.2.1: PlaSMo accession PLM_71 version 2, http://
www.plasmo.ed.ac.uk/plasmo/models/model.shtml?acces
sion=PLM_71&version=2
K. Stratford, A. Hume and A. J. Millar (2015) Arabidopsisclock model P2011.3.1: PlaSMo accession PLM_1041 version
1, http://www.plasmo.ed.ac.uk/plasmo/models/model.
shtml?accession=PLM_1041&version=1
K. Stratford, A. Hume and A. J. Millar (2015) Arabidopsisclock model P2011.4.1: PlaSMo accession PLM_1042 version
1, http://www.plasmo.ed.ac.uk/plasmo/models/model.
shtml?accession=PLM_1042&version=1
K. Stratford, A. Hume and A. J. Millar (2015) Arabidopsisclock model P2011.5.1: PlaSMo accession PLM_1043 version 1,
http://www.plasmo.ed.ac.uk/plasmo/models/model.shtml?
accession=PLM_1043&version=1
K. Stratford, A. Hume and A. J. Millar (2015) Arabidopsisclock model P2011.6.1: PlaSMo accession PLM_1044 version 1,
http://www.plasmo.ed.ac.uk/plasmo/models/model.shtml?
accession=PLM_1044&version=1
References
1. Zhang EE, Kay SA. 2010 Clocks not winding down:unravelling circadian networks. Nat. Rev. Mol. CellBiol. 11, 764 – 776. (doi:10.1038/nrm2995)
2. Dong G, Golden SS. 2008 How a cyanobacteriumtells time. Curr. Opin. Microbiol. 11, 541 – 546.(doi:10.1016/j.mib.2008.10.003)
3. Dodd AN et al. 2008 Plant circadian clocks increasephotosynthesis, growth, survival, and competitiveadvantage. Science 309, 630 – 633. (doi:10.1126/science.1115581)
4. Ouyang Y, Andersson CR, Kondo T, Golden SS, JohnsonCH. 1998 Resonating circadian clocks enhancefitness in cyanobacteria. Proc. Natl Acad. Sci. USA 95,8660 – 8664. (doi:10.1073/pnas.95.15.8660)
5. Kinmonth-Schultz HA, Golembeski GS, Imaizumi T.2013 Circadian clock-regulated physiologicaloutputs: dynamic responses in nature. Semin. CellDev. Biol. 24, 407 – 413. (doi:10.1016/j.semcdb.2013.02.006)
6. Young MW, Kay SA. 2001 Time zones: a comparativegenetics of circadian clocks. Nat. Rev. Genet. 2,702 – 715. (doi:10.1038/35088576)
7. van Ooijen G, Millar AJ. 2012 Non-transcriptionaloscillators in circadian timekeeping. Trends Biochem.Sci. 37, 484 – 492. (doi:10.1016/j.tibs.2012.07.006)
8. Le Novere N et al. 2009 The systems biologygraphical notation. Nat. Biotechnol. 27, 735 – 741.(doi:10.1038/nbt.1558)
9. Pokhilko A, Mas P, Millar AJ. 2013 Modelling thewidespread effects of TOC1 signalling on the plantcircadian clock and its outputs. BMC Syst. Biol. 7,23. (doi:10.1186/1752-0509-7-23)
10. Pokhilko A, Fernandez AP, Edwards KD, SouthernMM, Halliday KJ, Millar AJ. 2012 The clock genecircuit in Arabidopsis includes a repressilator withadditional feedback loops. Mol. Syst. Biol. 8, 574.(doi:10.1038/msb.2012.6)
11. Nakamichi N. 2011 Molecular mechanismsunderlying the Arabidopsis circadian clock. Plant CellPhysiol. 52, 1709 – 1718. (doi:10.1093/pcp/pcr118)
12. Farre EM, Harmer SL, Harmon FG, Yanovsky MJ, KaySA. 2005 Overlapping and distinct roles of PRR7 andPRR9 in the Arabidopsis circadian clock. Curr. Biol.15, 47 – 54. (doi:10.1016/j.cub.2004.12.067)
13. Salome PA, McClung CR. 2005 PSEUDO-RESPONSEREGULATOR 7 and 9 are partially redundant genesessential for the temperature responsiveness of theArabidopsis circadian clock. Plant Cell 17, 791 – 803.(doi:10.1105/tpc.104.029504)
14. Pokhilko A, Hodge SK, Stratford K, Knox K, EdwardsKD, Thomson AW, Mizuno T, Millar AJ. 2010 Dataassimilation constrains new connections andcomponents in a complex, eukaryotic circadian clockmodel. Mol. Syst. Biol. 6, 416. (doi:10.1038/msb.2010.69)
15. Nakamichi N, Kiba T, Kamioka M, Suzuki T,Yamashino T, Higashiyama T, Sakakibara H, MizunoT. 2012 Transcriptional repressor PRR5 directlyregulates clock-output pathways. Proc. Natl Acad.Sci. USA 109, 17 123 – 17 128. (doi:10.1073/pnas.1205156109)
16. Nakamichi N, Kiba T, Henriques R, Mizuno T, ChuaNH, Sakakibara H. 2010 PSEUDO-RESPONSEREGULATORS 9, 7, and 5 are transcriptional
repressors in the Arabidopsis circadian clock. PlantCell 22, 594 – 605. (doi:10.1105/tpc.109.072892)
17. Huang W, Perez-Garcia P, Pokhilko A, Millar AJ,Antoshechkin I, Riechmann JL, Mas P. 2012Mapping the core of the Arabidopsis circadianclock defines the network structure of theoscillator. Science 336, 75 – 79. (doi:10.1126/science.1219075)
18. Gendron JM, Pruneda-Paz JL, Doherty CJ, Gross AM,Kang SE, Kay SA. 2012 Arabidopsis circadian clockprotein, TOC1, is a DNA-binding transcription factor.Proc. Natl Acad. Sci. USA 109, 3167 – 3172. (doi:10.1073/pnas.1200355109)
19. Nusinow DA, Helfer A, Hamilton EE, King JJ,Imaizumi T, Schultz TF, Farre EM, Kay SA. 2011The ELF4-ELF3-LUX complex links the circadian clockto diurnal control of hypocotyl growth. Nature 475,398 – 402. (doi:10.1038/nature10182)
20. Helfer A, Nusinow DA, Chow BY, Gehrke AR, BulykML, Kay SA. 2011 LUX ARRHYTHMO encodes anighttime repressor of circadian gene expression inthe Arabidopsis core clock. Curr. Biol. 21, 126 – 133.(doi:10.1016/j.cub.2010.12.021)
21. Dixon LE, Knox K, Kozma-Bognar L, Southern MM,Pokhilko A, Millar AJ. 2011 Temporal repression ofcore circadian genes is mediated through EARLYFLOWERING 3 in Arabidopsis. Curr. Biol. 21,120 – 125. (doi:10.1016/j.cub.2010.12.013)
22. Herrero E et al. 2012 EARLY FLOWERING4recruitment of EARLY FLOWERING3 in the nucleussustains the Arabidopsis circadian clock. Plant Cell24, 428 – 443. (doi:10.1105/tpc.111.093807)
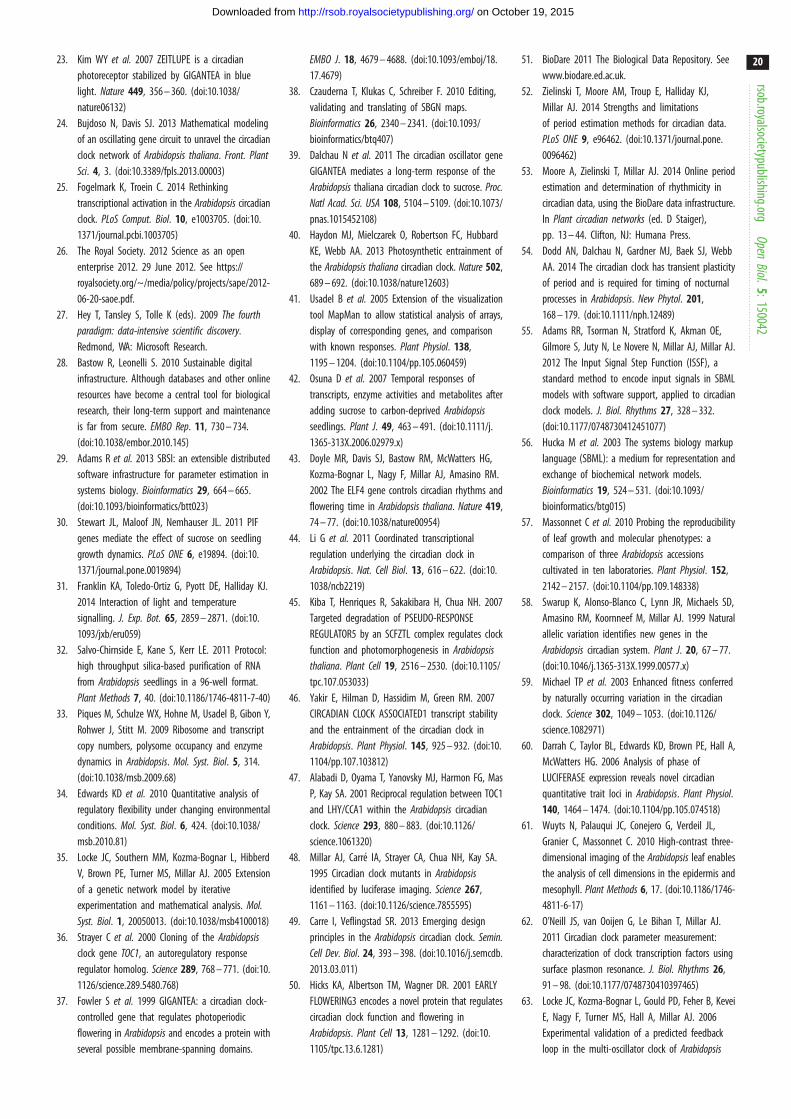
rsob.royalsocietypublishing.orgOpen
Biol.5:150042
20
on October 19, 2015http://rsob.royalsocietypublishing.org/Downloaded from
23. Kim WY et al. 2007 ZEITLUPE is a circadianphotoreceptor stabilized by GIGANTEA in bluelight. Nature 449, 356 – 360. (doi:10.1038/nature06132)
24. Bujdoso N, Davis SJ. 2013 Mathematical modelingof an oscillating gene circuit to unravel the circadianclock network of Arabidopsis thaliana. Front. PlantSci. 4, 3. (doi:10.3389/fpls.2013.00003)
25. Fogelmark K, Troein C. 2014 Rethinkingtranscriptional activation in the Arabidopsis circadianclock. PLoS Comput. Biol. 10, e1003705. (doi:10.1371/journal.pcbi.1003705)
26. The Royal Society. 2012 Science as an openenterprise 2012. 29 June 2012. See https://royalsociety.org/~/media/policy/projects/sape/2012-06-20-saoe.pdf.
27. Hey T, Tansley S, Tolle K (eds). 2009 The fourthparadigm: data-intensive scientific discovery.Redmond, WA: Microsoft Research.
28. Bastow R, Leonelli S. 2010 Sustainable digitalinfrastructure. Although databases and other onlineresources have become a central tool for biologicalresearch, their long-term support and maintenanceis far from secure. EMBO Rep. 11, 730 – 734.(doi:10.1038/embor.2010.145)
29. Adams R et al. 2013 SBSI: an extensible distributedsoftware infrastructure for parameter estimation insystems biology. Bioinformatics 29, 664 – 665.(doi:10.1093/bioinformatics/btt023)
30. Stewart JL, Maloof JN, Nemhauser JL. 2011 PIFgenes mediate the effect of sucrose on seedlinggrowth dynamics. PLoS ONE 6, e19894. (doi:10.1371/journal.pone.0019894)
31. Franklin KA, Toledo-Ortiz G, Pyott DE, Halliday KJ.2014 Interaction of light and temperaturesignalling. J. Exp. Bot. 65, 2859 – 2871. (doi:10.1093/jxb/eru059)
32. Salvo-Chirnside E, Kane S, Kerr LE. 2011 Protocol:high throughput silica-based purification of RNAfrom Arabidopsis seedlings in a 96-well format.Plant Methods 7, 40. (doi:10.1186/1746-4811-7-40)
33. Piques M, Schulze WX, Hohne M, Usadel B, Gibon Y,Rohwer J, Stitt M. 2009 Ribosome and transcriptcopy numbers, polysome occupancy and enzymedynamics in Arabidopsis. Mol. Syst. Biol. 5, 314.(doi:10.1038/msb.2009.68)
34. Edwards KD et al. 2010 Quantitative analysis ofregulatory flexibility under changing environmentalconditions. Mol. Syst. Biol. 6, 424. (doi:10.1038/msb.2010.81)
35. Locke JC, Southern MM, Kozma-Bognar L, HibberdV, Brown PE, Turner MS, Millar AJ. 2005 Extensionof a genetic network model by iterativeexperimentation and mathematical analysis. Mol.Syst. Biol. 1, 20050013. (doi:10.1038/msb4100018)
36. Strayer C et al. 2000 Cloning of the Arabidopsisclock gene TOC1, an autoregulatory responseregulator homolog. Science 289, 768 – 771. (doi:10.1126/science.289.5480.768)
37. Fowler S et al. 1999 GIGANTEA: a circadian clock-controlled gene that regulates photoperiodicflowering in Arabidopsis and encodes a protein withseveral possible membrane-spanning domains.
EMBO J. 18, 4679 – 4688. (doi:10.1093/emboj/18.17.4679)
38. Czauderna T, Klukas C, Schreiber F. 2010 Editing,validating and translating of SBGN maps.Bioinformatics 26, 2340 – 2341. (doi:10.1093/bioinformatics/btq407)
39. Dalchau N et al. 2011 The circadian oscillator geneGIGANTEA mediates a long-term response of theArabidopsis thaliana circadian clock to sucrose. Proc.Natl Acad. Sci. USA 108, 5104 – 5109. (doi:10.1073/pnas.1015452108)
40. Haydon MJ, Mielczarek O, Robertson FC, HubbardKE, Webb AA. 2013 Photosynthetic entrainment ofthe Arabidopsis thaliana circadian clock. Nature 502,689 – 692. (doi:10.1038/nature12603)
41. Usadel B et al. 2005 Extension of the visualizationtool MapMan to allow statistical analysis of arrays,display of corresponding genes, and comparisonwith known responses. Plant Physiol. 138,1195 – 1204. (doi:10.1104/pp.105.060459)
42. Osuna D et al. 2007 Temporal responses oftranscripts, enzyme activities and metabolites afteradding sucrose to carbon-deprived Arabidopsisseedlings. Plant J. 49, 463 – 491. (doi:10.1111/j.1365-313X.2006.02979.x)
43. Doyle MR, Davis SJ, Bastow RM, McWatters HG,Kozma-Bognar L, Nagy F, Millar AJ, Amasino RM.2002 The ELF4 gene controls circadian rhythms andflowering time in Arabidopsis thaliana. Nature 419,74 – 77. (doi:10.1038/nature00954)
44. Li G et al. 2011 Coordinated transcriptionalregulation underlying the circadian clock inArabidopsis. Nat. Cell Biol. 13, 616 – 622. (doi:10.1038/ncb2219)
45. Kiba T, Henriques R, Sakakibara H, Chua NH. 2007Targeted degradation of PSEUDO-RESPONSEREGULATOR5 by an SCFZTL complex regulates clockfunction and photomorphogenesis in Arabidopsisthaliana. Plant Cell 19, 2516 – 2530. (doi:10.1105/tpc.107.053033)
46. Yakir E, Hilman D, Hassidim M, Green RM. 2007CIRCADIAN CLOCK ASSOCIATED1 transcript stabilityand the entrainment of the circadian clock inArabidopsis. Plant Physiol. 145, 925 – 932. (doi:10.1104/pp.107.103812)
47. Alabadi D, Oyama T, Yanovsky MJ, Harmon FG, MasP, Kay SA. 2001 Reciprocal regulation between TOC1and LHY/CCA1 within the Arabidopsis circadianclock. Science 293, 880 – 883. (doi:10.1126/science.1061320)
48. Millar AJ, Carre IA, Strayer CA, Chua NH, Kay SA.1995 Circadian clock mutants in Arabidopsisidentified by luciferase imaging. Science 267,1161 – 1163. (doi:10.1126/science.7855595)
49. Carre I, Veflingstad SR. 2013 Emerging designprinciples in the Arabidopsis circadian clock. Semin.Cell Dev. Biol. 24, 393 – 398. (doi:10.1016/j.semcdb.2013.03.011)
50. Hicks KA, Albertson TM, Wagner DR. 2001 EARLYFLOWERING3 encodes a novel protein that regulatescircadian clock function and flowering inArabidopsis. Plant Cell 13, 1281 – 1292. (doi:10.1105/tpc.13.6.1281)
51. BioDare 2011 The Biological Data Repository. Seewww.biodare.ed.ac.uk.
52. Zielinski T, Moore AM, Troup E, Halliday KJ,Millar AJ. 2014 Strengths and limitationsof period estimation methods for circadian data.PLoS ONE 9, e96462. (doi:10.1371/journal.pone.0096462)
53. Moore A, Zielinski T, Millar AJ. 2014 Online periodestimation and determination of rhythmicity incircadian data, using the BioDare data infrastructure.In Plant circadian networks (ed. D Staiger),pp. 13 – 44. Clifton, NJ: Humana Press.
54. Dodd AN, Dalchau N, Gardner MJ, Baek SJ, WebbAA. 2014 The circadian clock has transient plasticityof period and is required for timing of nocturnalprocesses in Arabidopsis. New Phytol. 201,168 – 179. (doi:10.1111/nph.12489)
55. Adams RR, Tsorman N, Stratford K, Akman OE,Gilmore S, Juty N, Le Novere N, Millar AJ, Millar AJ.2012 The Input Signal Step Function (ISSF), astandard method to encode input signals in SBMLmodels with software support, applied to circadianclock models. J. Biol. Rhythms 27, 328 – 332.(doi:10.1177/0748730412451077)
56. Hucka M et al. 2003 The systems biology markuplanguage (SBML): a medium for representation andexchange of biochemical network models.Bioinformatics 19, 524 – 531. (doi:10.1093/bioinformatics/btg015)
57. Massonnet C et al. 2010 Probing the reproducibilityof leaf growth and molecular phenotypes: acomparison of three Arabidopsis accessionscultivated in ten laboratories. Plant Physiol. 152,2142 – 2157. (doi:10.1104/pp.109.148338)
58. Swarup K, Alonso-Blanco C, Lynn JR, Michaels SD,Amasino RM, Koornneef M, Millar AJ. 1999 Naturalallelic variation identifies new genes in theArabidopsis circadian system. Plant J. 20, 67 – 77.(doi:10.1046/j.1365-313X.1999.00577.x)
59. Michael TP et al. 2003 Enhanced fitness conferredby naturally occurring variation in the circadianclock. Science 302, 1049 – 1053. (doi:10.1126/science.1082971)
60. Darrah C, Taylor BL, Edwards KD, Brown PE, Hall A,McWatters HG. 2006 Analysis of phase ofLUCIFERASE expression reveals novel circadianquantitative trait loci in Arabidopsis. Plant Physiol.140, 1464 – 1474. (doi:10.1104/pp.105.074518)
61. Wuyts N, Palauqui JC, Conejero G, Verdeil JL,Granier C, Massonnet C. 2010 High-contrast three-dimensional imaging of the Arabidopsis leaf enablesthe analysis of cell dimensions in the epidermis andmesophyll. Plant Methods 6, 17. (doi:10.1186/1746-4811-6-17)
62. O’Neill JS, van Ooijen G, Le Bihan T, Millar AJ.2011 Circadian clock parameter measurement:characterization of clock transcription factors usingsurface plasmon resonance. J. Biol. Rhythms 26,91 – 98. (doi:10.1177/0748730410397465)
63. Locke JC, Kozma-Bognar L, Gould PD, Feher B, KeveiE, Nagy F, Turner MS, Hall A, Millar AJ. 2006Experimental validation of a predicted feedbackloop in the multi-oscillator clock of Arabidopsis
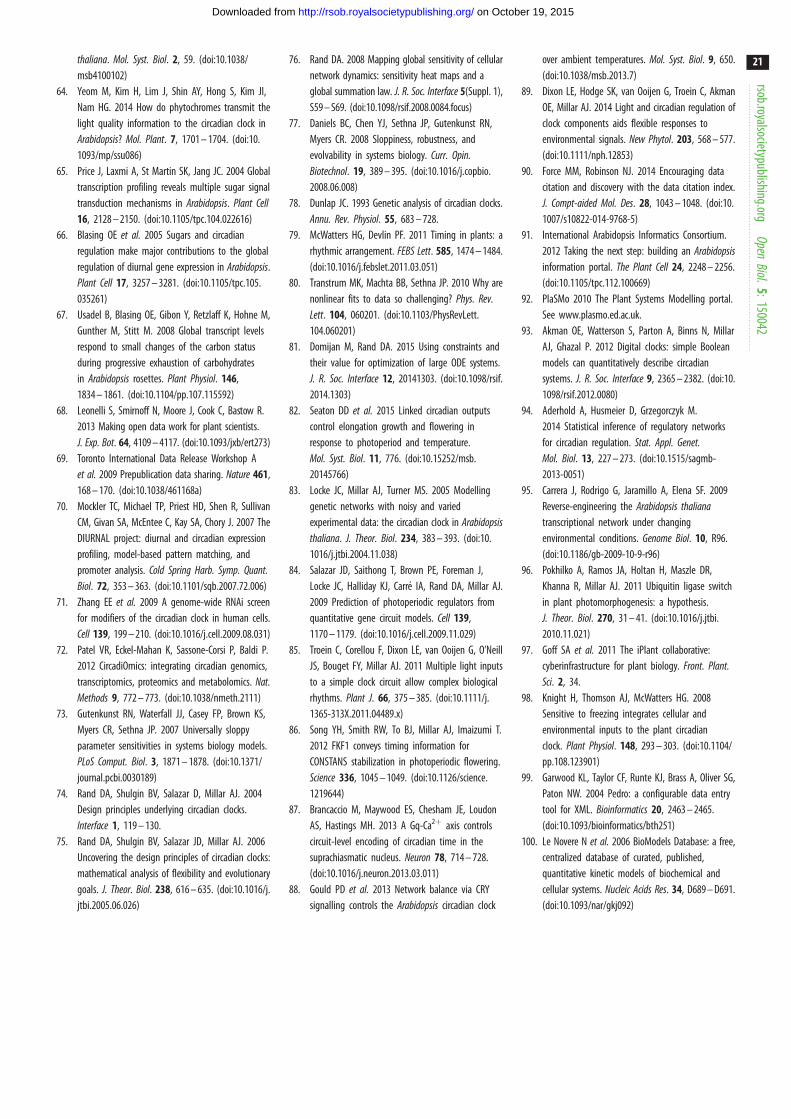
rsob.royalsocietypublishing.orgOpen
Biol.5:150042
21
on October 19, 2015http://rsob.royalsocietypublishing.org/Downloaded from
thaliana. Mol. Syst. Biol. 2, 59. (doi:10.1038/msb4100102)
64. Yeom M, Kim H, Lim J, Shin AY, Hong S, Kim JI,Nam HG. 2014 How do phytochromes transmit thelight quality information to the circadian clock inArabidopsis? Mol. Plant. 7, 1701 – 1704. (doi:10.1093/mp/ssu086)
65. Price J, Laxmi A, St Martin SK, Jang JC. 2004 Globaltranscription profiling reveals multiple sugar signaltransduction mechanisms in Arabidopsis. Plant Cell16, 2128 – 2150. (doi:10.1105/tpc.104.022616)
66. Blasing OE et al. 2005 Sugars and circadianregulation make major contributions to the globalregulation of diurnal gene expression in Arabidopsis.Plant Cell 17, 3257 – 3281. (doi:10.1105/tpc.105.035261)
67. Usadel B, Blasing OE, Gibon Y, Retzlaff K, Hohne M,Gunther M, Stitt M. 2008 Global transcript levelsrespond to small changes of the carbon statusduring progressive exhaustion of carbohydratesin Arabidopsis rosettes. Plant Physiol. 146,1834 – 1861. (doi:10.1104/pp.107.115592)
68. Leonelli S, Smirnoff N, Moore J, Cook C, Bastow R.2013 Making open data work for plant scientists.J. Exp. Bot. 64, 4109 – 4117. (doi:10.1093/jxb/ert273)
69. Toronto International Data Release Workshop Aet al. 2009 Prepublication data sharing. Nature 461,168 – 170. (doi:10.1038/461168a)
70. Mockler TC, Michael TP, Priest HD, Shen R, SullivanCM, Givan SA, McEntee C, Kay SA, Chory J. 2007 TheDIURNAL project: diurnal and circadian expressionprofiling, model-based pattern matching, andpromoter analysis. Cold Spring Harb. Symp. Quant.Biol. 72, 353 – 363. (doi:10.1101/sqb.2007.72.006)
71. Zhang EE et al. 2009 A genome-wide RNAi screenfor modifiers of the circadian clock in human cells.Cell 139, 199 – 210. (doi:10.1016/j.cell.2009.08.031)
72. Patel VR, Eckel-Mahan K, Sassone-Corsi P, Baldi P.2012 CircadiOmics: integrating circadian genomics,transcriptomics, proteomics and metabolomics. Nat.Methods 9, 772 – 773. (doi:10.1038/nmeth.2111)
73. Gutenkunst RN, Waterfall JJ, Casey FP, Brown KS,Myers CR, Sethna JP. 2007 Universally sloppyparameter sensitivities in systems biology models.PLoS Comput. Biol. 3, 1871 – 1878. (doi:10.1371/journal.pcbi.0030189)
74. Rand DA, Shulgin BV, Salazar D, Millar AJ. 2004Design principles underlying circadian clocks.Interface 1, 119 – 130.
75. Rand DA, Shulgin BV, Salazar JD, Millar AJ. 2006Uncovering the design principles of circadian clocks:mathematical analysis of flexibility and evolutionarygoals. J. Theor. Biol. 238, 616 – 635. (doi:10.1016/j.jtbi.2005.06.026)
76. Rand DA. 2008 Mapping global sensitivity of cellularnetwork dynamics: sensitivity heat maps and aglobal summation law. J. R. Soc. Interface 5(Suppl. 1),S59 – S69. (doi:10.1098/rsif.2008.0084.focus)
77. Daniels BC, Chen YJ, Sethna JP, Gutenkunst RN,Myers CR. 2008 Sloppiness, robustness, andevolvability in systems biology. Curr. Opin.Biotechnol. 19, 389 – 395. (doi:10.1016/j.copbio.2008.06.008)
78. Dunlap JC. 1993 Genetic analysis of circadian clocks.Annu. Rev. Physiol. 55, 683 – 728.
79. McWatters HG, Devlin PF. 2011 Timing in plants: arhythmic arrangement. FEBS Lett. 585, 1474 – 1484.(doi:10.1016/j.febslet.2011.03.051)
80. Transtrum MK, Machta BB, Sethna JP. 2010 Why arenonlinear fits to data so challenging? Phys. Rev.Lett. 104, 060201. (doi:10.1103/PhysRevLett.104.060201)
81. Domijan M, Rand DA. 2015 Using constraints andtheir value for optimization of large ODE systems.J. R. Soc. Interface 12, 20141303. (doi:10.1098/rsif.2014.1303)
82. Seaton DD et al. 2015 Linked circadian outputscontrol elongation growth and flowering inresponse to photoperiod and temperature.Mol. Syst. Biol. 11, 776. (doi:10.15252/msb.20145766)
83. Locke JC, Millar AJ, Turner MS. 2005 Modellinggenetic networks with noisy and variedexperimental data: the circadian clock in Arabidopsisthaliana. J. Theor. Biol. 234, 383 – 393. (doi:10.1016/j.jtbi.2004.11.038)
84. Salazar JD, Saithong T, Brown PE, Foreman J,Locke JC, Halliday KJ, Carre IA, Rand DA, Millar AJ.2009 Prediction of photoperiodic regulators fromquantitative gene circuit models. Cell 139,1170 – 1179. (doi:10.1016/j.cell.2009.11.029)
85. Troein C, Corellou F, Dixon LE, van Ooijen G, O’NeillJS, Bouget FY, Millar AJ. 2011 Multiple light inputsto a simple clock circuit allow complex biologicalrhythms. Plant J. 66, 375 – 385. (doi:10.1111/j.1365-313X.2011.04489.x)
86. Song YH, Smith RW, To BJ, Millar AJ, Imaizumi T.2012 FKF1 conveys timing information forCONSTANS stabilization in photoperiodic flowering.Science 336, 1045 – 1049. (doi:10.1126/science.1219644)
87. Brancaccio M, Maywood ES, Chesham JE, LoudonAS, Hastings MH. 2013 A Gq-Ca2þ axis controlscircuit-level encoding of circadian time in thesuprachiasmatic nucleus. Neuron 78, 714 – 728.(doi:10.1016/j.neuron.2013.03.011)
88. Gould PD et al. 2013 Network balance via CRYsignalling controls the Arabidopsis circadian clock
over ambient temperatures. Mol. Syst. Biol. 9, 650.(doi:10.1038/msb.2013.7)
89. Dixon LE, Hodge SK, van Ooijen G, Troein C, AkmanOE, Millar AJ. 2014 Light and circadian regulation ofclock components aids flexible responses toenvironmental signals. New Phytol. 203, 568 – 577.(doi:10.1111/nph.12853)
90. Force MM, Robinson NJ. 2014 Encouraging datacitation and discovery with the data citation index.J. Compt-aided Mol. Des. 28, 1043 – 1048. (doi:10.1007/s10822-014-9768-5)
91. International Arabidopsis Informatics Consortium.2012 Taking the next step: building an Arabidopsisinformation portal. The Plant Cell 24, 2248 – 2256.(doi:10.1105/tpc.112.100669)
92. PlaSMo 2010 The Plant Systems Modelling portal.See www.plasmo.ed.ac.uk.
93. Akman OE, Watterson S, Parton A, Binns N, MillarAJ, Ghazal P. 2012 Digital clocks: simple Booleanmodels can quantitatively describe circadiansystems. J. R. Soc. Interface 9, 2365 – 2382. (doi:10.1098/rsif.2012.0080)
94. Aderhold A, Husmeier D, Grzegorczyk M.2014 Statistical inference of regulatory networksfor circadian regulation. Stat. Appl. Genet.Mol. Biol. 13, 227 – 273. (doi:10.1515/sagmb-2013-0051)
95. Carrera J, Rodrigo G, Jaramillo A, Elena SF. 2009Reverse-engineering the Arabidopsis thalianatranscriptional network under changingenvironmental conditions. Genome Biol. 10, R96.(doi:10.1186/gb-2009-10-9-r96)
96. Pokhilko A, Ramos JA, Holtan H, Maszle DR,Khanna R, Millar AJ. 2011 Ubiquitin ligase switchin plant photomorphogenesis: a hypothesis.J. Theor. Biol. 270, 31 – 41. (doi:10.1016/j.jtbi.2010.11.021)
97. Goff SA et al. 2011 The iPlant collaborative:cyberinfrastructure for plant biology. Front. Plant.Sci. 2, 34.
98. Knight H, Thomson AJ, McWatters HG. 2008Sensitive to freezing integrates cellular andenvironmental inputs to the plant circadianclock. Plant Physiol. 148, 293 – 303. (doi:10.1104/pp.108.123901)
99. Garwood KL, Taylor CF, Runte KJ, Brass A, Oliver SG,Paton NW. 2004 Pedro: a configurable data entrytool for XML. Bioinformatics 20, 2463 – 2465.(doi:10.1093/bioinformatics/bth251)
100. Le Novere N et al. 2006 BioModels Database: a free,centralized database of curated, published,quantitative kinetic models of biochemical andcellular systems. Nucleic Acids Res. 34, D689 – D691.(doi:10.1093/nar/gkj092)
1
Supporting Information
Contents Supporting Information .............................................................................................................. 1
Supplementary Methods ........................................................................................................ 2
Plant materials .................................................................................................................... 2
Growth, harvesting, RNA extraction and analysis ............................................................. 2
Evaluation of datasets ........................................................................................................ 5
Supplementary Analysis ........................................................................................................ 6
Interpretation of Phase-Plane Diagrams ............................................................................ 6
Model versioning and optimisation.................................................................................... 7
Supplementary Figure Legends ............................................................................................. 8
Supplementary Figure 1. Overview of the clock gene circuit ............................................ 8
Supplementary Figure 2. Detailed schema of the P2011 model ........................................ 9
Supplementary Figure 3. Logarithmic plots of clock gene expression in wild-type plants
under LD cycles .............................................................................................................................. 9
Supplementary Figure 4. RNA profiles under DD............................................................. 9
Supplementary Figure 5. Mutant effects are consistent among data sets. .......................... 9
Supplementary Figure 6. Phase plane diagrams reveal altered regulation in prr7 prr9
mutants. ......................................................................................................................................... 10
Supplementary Figure 7. Regulation of clock-related genes in low-sugar conditions. .... 10
Supplementary Table Legends ............................................................................................. 10
Supplementary Table 1. mRNA calibration standards. .................................................... 10
Supplementary Table 2. qRT-PCR primer sequences...................................................... 11
Supplementary References ................................................................................................... 12
Supplementary Tables .......................................................................................................... 13
Supplementary Table 1 .................................................................................................... 13
Supplementary Table 2. qRT-PCR primer sequences...................................................... 14
Supplementary Figures ........................................................................................................ 17

2
Supplementary Methods
Plant materials
The biological materials and allele numbers used in each experiment are shown in Figure 1C.
Growth, harvesting, RNA extraction and analysis
ROBuST dataset (Experiment 1 of Figure 1C)
Seedlings were grown on half-strength Murashige & Skoog media (MS) with 1.2 % agar, without
added sucrose. Following 7 days of entrainment under LD cycles of 12h L:12h D at 22°C, seedlings
were transferred to 17°C on the same light regime, and on the fifth day at 17°C seedlings were
harvested every two hours into 1 ml of RNAlater (Ambion; Austin, Texas, USA). Lighting was 60
μmol/m2/s white fluorescent light provided in a Binder (Tuttlingen, Germany) temperature-controlled
incubator. Biological triplicates were independently sampled. Samples at ZT0 were taken just before
lights-on, and samples at ZT12 just after lights-off. All sampling during lights-off was conduction in a
temperature-controlled dark room. Total RNA was extracted (GE Healthcare Illustra RNAspin 96
RNA Isolation Kit, Buckinghamshire, UK) according to the manufacturer’s instructions. cDNA was
synthesized from 1 μg of total RNA (Invitrogen SuperScript VILO cDNA Synthesis kit, Paisley,
Scotland) and diluted 1:10 in H2O. qRT-PCR reactions were carried out and analysed as previously
described (1) in technical triplicate. Expression values were normalized to the control transcript
ACTIN 7 (ACT7), amplified with primers 5’ CAGTGTCTGGATCGGAGGAT 3’ and 5’
TGAACAATCGATGGACCTGA 3’.
TiMet datasets
a. Plants grown on soil: TiMet rosette and seedling 1 datasets (Experiments 2 and 3 of
Figure1C)
Arabidopsis thaliana seeds were sown on wet soil, covered with transparent lids and transferred
to growth chambers. Plants were grown in 12 h light / 12 h dark cycles with a light intensity adjusted
to 160 µmol m-2s-1. Temperature was 20 C during the light phase and 18 C during the dark phase. Pots
were randomized to decrease positional effect. After a week lids were removed and the excess plants
were thinned. After another seven days plants were treated with Nematodes as a biological pest control.
On the 21st day (rosette plants) or 13th day (seedlings) after sowing two biological replicates per
time point were harvested and immediately frozen in liquid nitrogen. Each replicate consisted of a pool
of 5-7 plants. Sampling was performed with 2h intervals, starting at ZT0, within 5-10 minutes before
the given time point. Plant material was ground using a Ball-Mill (Retch, Germany). Around 50 mg of
3
material from each sample was aliquoted into 2ml microcentrifuge tubes (Eppendorf, Germany). RNA
was extracted using the RNeasy Plant Mini Kit (QIAGEN) by following the manufacturer’s
instructions. Briefly, the RLC buffer (500µL) was added to the frozen plant powder and the mixture
was homogenised. RNA standards were added (see below). RNA was eluted from the RNeasy spin
column twice, first with 50 µL and then with 30 µL of RNase-free water. The concentration of RNA
was determined using the Nano-Drop ND-1000 UV-Vis spectrophotometer (Nano-Drop Technologies).
b. Plants grown in sterile media: TiMet seedling 2 dataset (Experiment 4 of Figure1C)
Surface-sterilized seeds were sown on half-strength Murashige-Skoog media (MS) with 1.2 %
agar without addition of sucrose. After 4 days of stratification in the dark at 4 C plates were transferred
to growth chambers and grown for 10 days in 12 light / 12 dark cycles, with light intensity of approx.
100 µmol m-2s-1 and temperature of 22 C during the day and 18 C during the night. Seedlings were
harvested on the 10th day into 2ml Eppendorf tubes and immediately frozen in liquid nitrogen. For each
time point, three independent biological replicates were collected; each included 10-20 seedlings.
Samples were taken within 10 – 15 min before the given time point. Frozen seedlings were ground
using a Ball-Mill (Retch, Germany). RNA was extracted using the RNeasy Plant Mini Kit (QIAGEN)
but using half the volume of all buffers. RNA standards were added (see below). In the last step RNA
was eluted from the RNeasy spin column once with 20 µL of RNase-free water. The concentration of
RNA was determined using the Nano-Drop ND-1000 UV-Vis spectrophotometer (Nano-Drop
Technologies).
c. cDNA preparation and analysis
Contaminating DNA was removed from samples using TURBO DNA-freeTM kit (Applied
Biosystems) by following the manufacturer’s instructions. The concentration of RNA was determined
using Nano-Drop spectrophotometer. 1µg of DNase treated RNA was used for cDNA synthesis.
Reverse transcription used the SuperScript III First-Standard Synthesis System Kit (Invitrogen).
Briefly, 1µg of DNase treated RNA was mixed with 2µL of oligo(dT) primers (50µM), 2µL of random
hexamers (50ng/µL) and 1µL of dNTP mix (10mM). Mixture of a final volume of 11µL was incubated
for 5 min at 65˚C in a Verti 96 Well Thermal Cycler (Applied Biosystems, Deutschland). After cooling
down the mixture for 5 min on ice the extension reaction was performed by adding 0.5µL of reverse
transcriptase (SuperScript III RT 200 U/µl), 2µL of 10X First strand synthesis buffer, 4µL of MgCl2
(25mM), 2µL of DTT (0.1M) and 0.5µL of RNase OUT (40 U/µL). Incubation for 10 min at 25˚C was
followed by 50 min incubation at 50˚C. Next, enzyme was inactivated by heating for 5 min at 85˚C. To
digest all RNA that could potentially be left in samples 1 µL RNase H (2 U/µL) was added to the
mixture and incubated at 37˚C for 20 min and then for 5 min at 85˚C. Samples were diluted in RNase-
free water (dilution 1/5).
4
The cDNA was used for qRT-PCR reactions to monitor the expression level of 10 core clock
genes (LHY, CCA1, TOC1, PRR9, PRR7, PRR5, GI, ELF3, ELF4 and LUX). To control the quality of
performed reactions, four pairs of primers encoding housekeeping genes (ACT2 155, ACT2 633,
GAPDH 3’, GAPDH 5’) were included to the measurements. Primer sequences are listed in
Supplementary Table 2. To allow absolute quantification, 8 pairs of primers from the ArrayControl
RNA Spikes (Applied Biosystems) were included (see below). The 22 pairs of primers were dispensed
(200nM of each primer) into 384-well plates for using PerkinElmer Evolution P3 Precision Pipetting
Platform (PerkinElmer Life Science, Rodgau-Jügesheim, Germany). PCR mix was prepared by adding
0.5µL of cDNA and 2.5µL of Power SYBR Green PCR Master Mix (Applied Biosystems, Deutschland)
to already prepared primers. The qRT-PCR reactions were carried out following the recommended
thermal profile: 2 min at 50˚C, 10 min at 95˚C, followed by 40 cycles of 95˚C for 15 s and 60 ˚C for 1
min, in an ABI PRISM 7900 HT sequence detection system (Applied Biosystems Deutschland,
Darmstadt, Germany). The specificity of the amplifications was tested by heating from 60˚C to 95˚C
with a speed of 1.9 ˚C min-1, resulting in melting curves. Data analysis was performed using SDS 2.4
software (Applied Biosystems Deutschland). Data were normalised on the basis of results obtained from
measurements of standard material that was included in all performed experiments. The standard
samples were collected from Arabidopsis thaliana plants, ecotype Col-0, grown on soil in a glasshouse.
d. Data calibration to absolute values
The transcript data are expressed in RNA copy number per cell. This absolute quantification of
the transcripts level was achieved using artificial poly(A)+ RNAs (ArrayControl RNA Spikes - Applied
Biosystems) as internal standards. Eight different artificial mRNA spikes with known concentration
(Supplementary Table 1) were mixed and the same amount of the spikes mix was added to all tested
samples at the first step of the RNA extraction procedure (after adding the RLC buffer to the frozen
plant material, see above). The efficiency and the Ct values of all 8 spikes were used to generate a
standard curve for each sample. Each measured data point was plotted against the standard curve to
calculate the concentration of mRNA in units of copy number per gram fresh weight (copy number / g
FW). The procedure is very similar to our earlier report (2), which also addressed the accuracy of the
measurements. Our results are in line with their conclusion that, for a single timepoint with achievable
replication, “Precise quantification of changes of [less than] two-fold is difficult using qRT–PCR.”.
Adjacent timepoints and successive daily cycles in circadian data provide greater support than the
single-timepoint assays in (2). Rigorous assessment of the uncertainties will require more sophisticated
statistical models, as the system’s behaviour is not independent at successive, 2-h timepoints.
To determine the cell number per g FW, the genome copy number per gFW was quantified. For
this purpose artificial DNA spikes were added to the extract during DNA extraction (at the beginning
of the protocol). Next, PCR reactions with primers for genes that are known to have only a single copy
5
per genome (e.g. mitochondrial 26S ribosomal RNA protein, NADH dehydrogenase subunit 9,
NAD(P)H dehydrogenase subunit H protein) were performed. The ploidy level of the samples was
estimated using flow cytometry. Finally, the genome copy number per g FW was divided by the ploidy
level. The resulting number (25.000.000 copy number/g FW) was used to express metabolite and
transcript data.
McWatters dataset (Experiment 5 of Figure 1C)
Seedlings were grown on sterile media containing 3% sucrose. Entire seedlings including
roots were harvested every 3h. RNA was extracted, amplified and analysed, all using methods
previously described (3).
Edwards dataset (Experiment 6 of Figure 1C)
Seedlings were grown on sterile media containing 3% sucrose. Entire seedlings including
roots were harvested every 2h. RNA was extracted and analysed as described (4).
Southern dataset (Experiment 7 of Figure 1C)
Seedlings were grown on sterile media containing 3% sucrose, harvested every 3h with
additional sampling times around light-dark transitions; RNA was extracted, amplified and analysed,
as described (5).
Evaluation of datasets
The larger data sets reported here were acquired using automated, quantitative RT-PCR platforms that
were established as shared facilities for research centres in Golm and Edinburgh. The experiments
remained laborious and costly, despite the automation and reduced reagent costs from small assay
volumes; further miniaturisation of these assays shows promise for future studies (as in 6). Large-
scale data cannot usually be acquired with the same uniformity as small-scale datasets. Replacing
individual measurements with supplementary experiments to improve technical quality is infeasible,
because the broad scope of genotypes, conditions and timepoints in the original studies makes such
experiments expensive relative to the small number of improved data points, and introduces a further
source of variation. Thus we note technical variation in order to inform subsequent analysis,
reinforcing the point that only a small proportion of the data were affected. RNAs with low amplitude
regulation (TOC1, ELF3) or low expression levels (PRR9) are most obviously affected. Automated
liquid handling avoided the sample-to-sample variation of manual pipetting in the earlier, Southern
data (Supplementary Figure 5E, 5F) but risked introducing larger-scale effects. Three issues affected
multiple samples. One timepoint (ZT24) in the ROBuST data was discarded for several genotypes due

6
to a harvesting error; ZT24 data are expected to be very similar to ZT0 but the tissue is one day older.
Some technical replicates in ROBuST were discarded and repeated wholesale when a trend was
discovered across multiple samples, due to a progressive liquid handling error in the robot used in
PCR setup. The first Col-0 samples in the TiMet rosette dataset showed high biological variability due
to harvesting or calibration, so the entire first 24h of the timeseries were replaced by a supplementary
experiment (shown as experiment 2B in Figure 1C).
No molecular phenotype was detected when the toc1 mutant was tested under red light in the
Southern data set (data not shown). The strong toc1-2 mis-sense allele that was used in this study
causes a splicing defect (7). The expected change in the size of the TOC1 transcript was detected
using the method described (7) on our RNA samples, confirming their genotype (8). toc1-2 seedlings
do show hypocotyl elongation defects when grown under red light on media without exogenous
sucrose (9), so the absence of molecular phenotype is possibly due to 3% sucrose in our media. The
toc1-9 and toc1-100 alleles tested under white light in the ROBuST and TiMet data sets gave the
expected molecular phenotypes.
We found no consistent effect on the RNA profiles from normalisation to endogenous control RNAs.
TiMet rosette data were normalised to absolute, external standards (Figure 1) or to internal controls
(Figure 3), for comparison to the profiles from other data sets. The profiles were very similar in both
analyses, even for features that varied across experiments. In the GI profile, for example, the minor
peak at ZT2 was 20% of the major peak at ZT8 in Figure 1 in Col in Figure 1 (18% in Figure 3), or
11% (10%) in Ws. The 1-2% differences were much less than the biological variation (see Figure 1).
Supplementary Analysis
Interpretation of Phase-Plane Diagrams
Phase plane diagrams plot the levels of two components against each other (Figure 7), exactly
as in a scatter plot used to test for correlation. The data in scatter plots do not usually have a
meaningful sequence. Timeseries do, so the data points in a phase plane diagram are connected by a
line that represents their time sequence. Data symbols for ZT0 and ZT12 are enlarged to provide time
references, because sample times are not directly plotted. Rhythmic profiles in phase lead to a
diagonal plot with a positive gradient, for example for GI and TOC1 expression (Figure 7A), whereas
rhythms 90 or 270 degrees out of phase produce a circular plot. GI and TOC1 expression reached
peak and trough levels at overlapping timepoints, elongating the plot along the positive diagonal. The
plots form an open shape rather than a line, because GI rose without (before) TOC1, especially in Col
plants of the TiMet and ROBuST data sets, without exogenous sucrose. High TOC1 occurred after

7
high GI, particularly in Ws plants of the TiMet data sets. This relative timing is of course easy to see
in conventional timeseries plots, and has been noted in many past studies.
Rhythms 180 degrees out of phase yield a right-angled plot on a linear scale, or a diagonal of
gradient -1 on a logarithmic scale, illustrated in the plots of CCA1 and TOC1 RNA (Figures 7B, 7C)
The logarithmic scale shows that CCA1 expression rises over 100-fold along roughly horizontal lines,
indicating little effect on TOC1. In contrast, the rise in TOC1 expression directly correlates with
falling CCA1, resulting in diagonals with negative gradients (Figure 7C). Linear scale plots might best
represent potential protein synthesis, which is usually assumed to increase linearly with mRNA level;
hence linear plots suggest likely effects on downstream targets. On the other hand, logarithmic scale
plots reveal the effects of upstream regulators, even at low RNA levels that are indistinguishable on a
linear scale.
The dependence of an interaction of two genes upon a third regulator was strikingly
illustrated by plotting the profiles of PRR9 and ELF4, which peak far out of phase in the wild type
(Figure 7D). Starting from ZT0, acute light activation of PRR9 drives peak expression at ZT2-6 while
ELF4 expression is minimal. ELF4 expression rises to peak at ZT10 as PRR9 falls, consistent with
some contribution to repressing PRR9. ELF4 expression falls at night (red dashed line) while PRR9
expression is minimal. Data from LL (filled symbols) suggest a negative correlation in the subjective
night, when ELF4 falls as PRR9 rises. In the lhy cca1 double mutant under LD cycles (Figure 7E,
open symbols), PRR9 is partially de-repressed at ZT0, but remains out of phase with ELF4. However,
the two genes are co-regulated for part of the cycle under LL, creating a diagonal with a positive
gradient (red dashed line, Figure 6F).
Phase plane diagrams for the prr7 prr9 double mutant (Figure S6) showed that ELF4
expression rose while CCA1 (and LHY, not shown) were still significantly expressed at the end of the
day, suggesting that not only CCA1 and LHY but also the PRRs repress ELF4 in the wild type.
Removing PRR9 and PRR7 also revealed simpler correlations of PRR5 expression with CCA1 and
ELF4 (Figures S6E, S6H).
Model versioning and optimisation
We have adapted the Community Earth System Model version-naming convention (10)
(www2.cesm.ucar.edu/models) to describe version of our clock models. Models are named as
Axxxx.Y.Z., where A is a letter of the model author’s surname, xxxx is the year of submission, Y is a
version number marking a significant change in the model that alters its dynamics such as a new
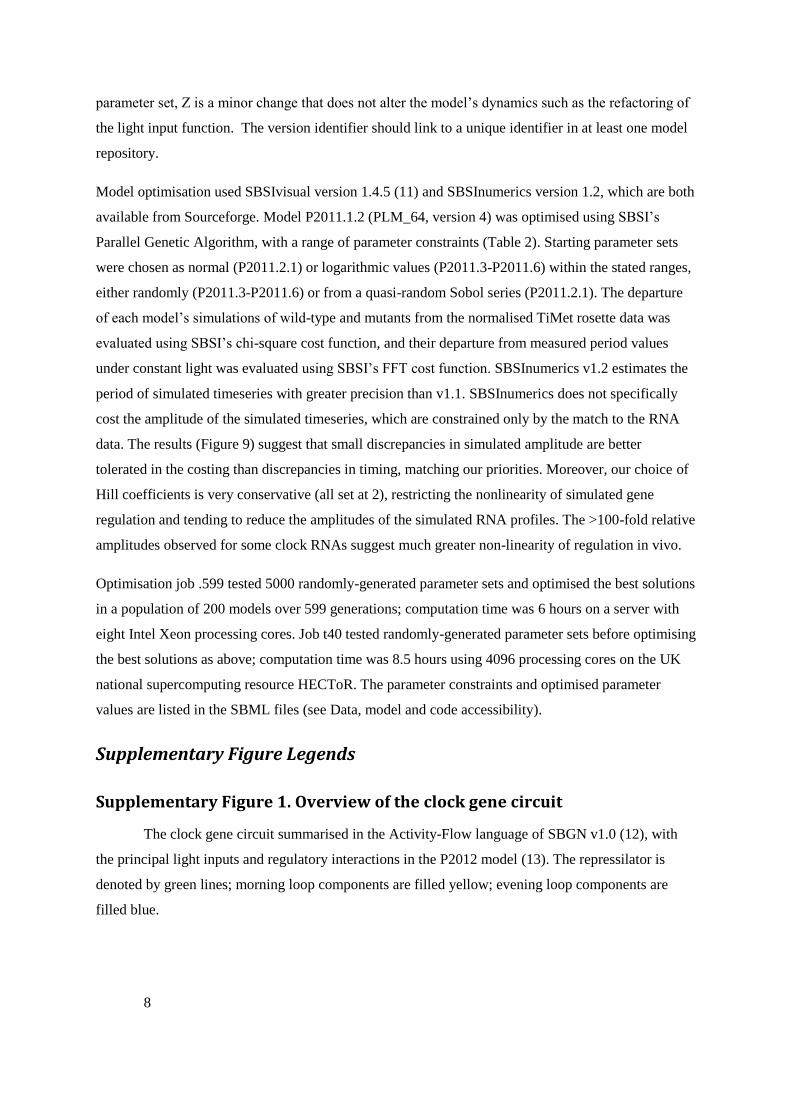
8
parameter set, Z is a minor change that does not alter the model’s dynamics such as the refactoring of
the light input function. The version identifier should link to a unique identifier in at least one model
repository.
Model optimisation used SBSIvisual version 1.4.5 (11) and SBSInumerics version 1.2, which are both
available from Sourceforge. Model P2011.1.2 (PLM_64, version 4) was optimised using SBSI’s
Parallel Genetic Algorithm, with a range of parameter constraints (Table 2). Starting parameter sets
were chosen as normal (P2011.2.1) or logarithmic values (P2011.3-P2011.6) within the stated ranges,
either randomly (P2011.3-P2011.6) or from a quasi-random Sobol series (P2011.2.1). The departure
of each model’s simulations of wild-type and mutants from the normalised TiMet rosette data was
evaluated using SBSI’s chi-square cost function, and their departure from measured period values
under constant light was evaluated using SBSI’s FFT cost function. SBSInumerics v1.2 estimates the
period of simulated timeseries with greater precision than v1.1. SBSInumerics does not specifically
cost the amplitude of the simulated timeseries, which are constrained only by the match to the RNA
data. The results (Figure 9) suggest that small discrepancies in simulated amplitude are better
tolerated in the costing than discrepancies in timing, matching our priorities. Moreover, our choice of
Hill coefficients is very conservative (all set at 2), restricting the nonlinearity of simulated gene
regulation and tending to reduce the amplitudes of the simulated RNA profiles. The >100-fold relative
amplitudes observed for some clock RNAs suggest much greater non-linearity of regulation in vivo.
Optimisation job .599 tested 5000 randomly-generated parameter sets and optimised the best solutions
in a population of 200 models over 599 generations; computation time was 6 hours on a server with
eight Intel Xeon processing cores. Job t40 tested randomly-generated parameter sets before optimising
the best solutions as above; computation time was 8.5 hours using 4096 processing cores on the UK
national supercomputing resource HECToR. The parameter constraints and optimised parameter
values are listed in the SBML files (see Data, model and code accessibility).
Supplementary Figure Legends
Supplementary Figure 1. Overview of the clock gene circuit
The clock gene circuit summarised in the Activity-Flow language of SBGN v1.0 (12), with
the principal light inputs and regulatory interactions in the P2012 model (13). The repressilator is
denoted by green lines; morning loop components are filled yellow; evening loop components are
filled blue.
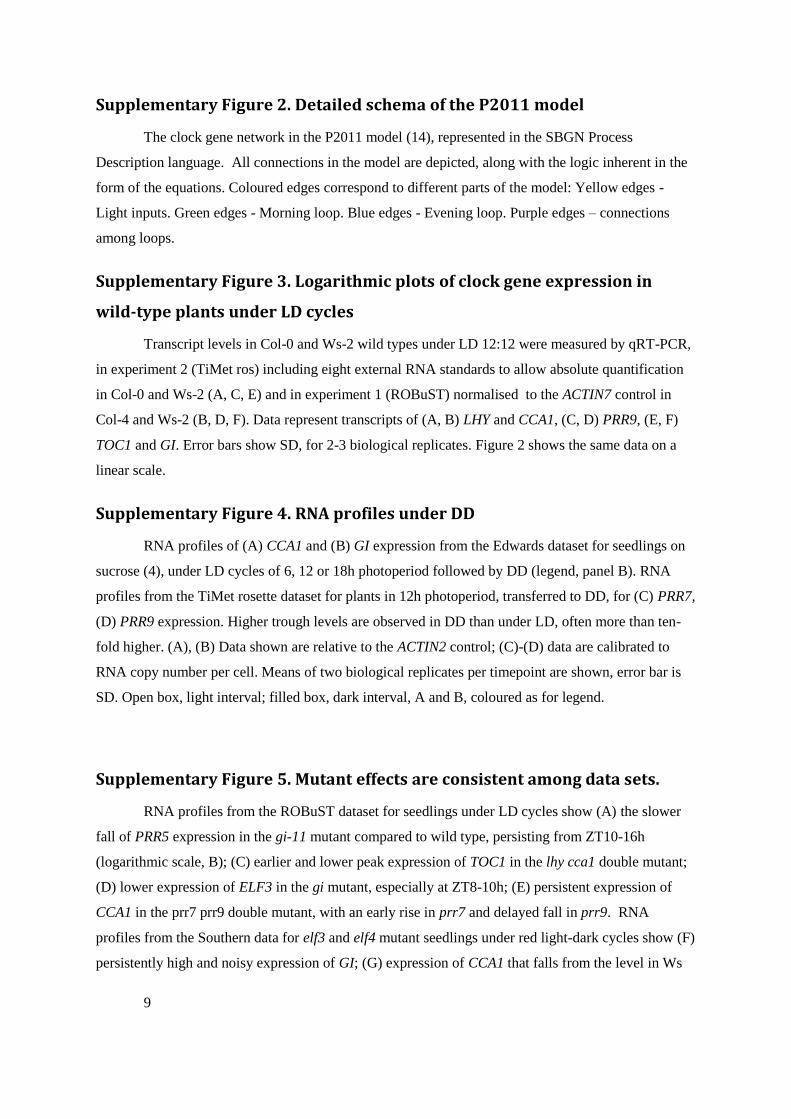
9
Supplementary Figure 2. Detailed schema of the P2011 model
The clock gene network in the P2011 model (14), represented in the SBGN Process
Description language. All connections in the model are depicted, along with the logic inherent in the
form of the equations. Coloured edges correspond to different parts of the model: Yellow edges -
Light inputs. Green edges - Morning loop. Blue edges - Evening loop. Purple edges – connections
among loops.
Supplementary Figure 3. Logarithmic plots of clock gene expression in
wild-type plants under LD cycles
Transcript levels in Col-0 and Ws-2 wild types under LD 12:12 were measured by qRT-PCR,
in experiment 2 (TiMet ros) including eight external RNA standards to allow absolute quantification
in Col-0 and Ws-2 (A, C, E) and in experiment 1 (ROBuST) normalised to the ACTIN7 control in
Col-4 and Ws-2 (B, D, F). Data represent transcripts of (A, B) LHY and CCA1, (C, D) PRR9, (E, F)
TOC1 and GI. Error bars show SD, for 2-3 biological replicates. Figure 2 shows the same data on a
linear scale.
Supplementary Figure 4. RNA profiles under DD
RNA profiles of (A) CCA1 and (B) GI expression from the Edwards dataset for seedlings on
sucrose (4), under LD cycles of 6, 12 or 18h photoperiod followed by DD (legend, panel B). RNA
profiles from the TiMet rosette dataset for plants in 12h photoperiod, transferred to DD, for (C) PRR7,
(D) PRR9 expression. Higher trough levels are observed in DD than under LD, often more than ten-
fold higher. (A), (B) Data shown are relative to the ACTIN2 control; (C)-(D) data are calibrated to
RNA copy number per cell. Means of two biological replicates per timepoint are shown, error bar is
SD. Open box, light interval; filled box, dark interval, A and B, coloured as for legend.
Supplementary Figure 5. Mutant effects are consistent among data sets.
RNA profiles from the ROBuST dataset for seedlings under LD cycles show (A) the slower
fall of PRR5 expression in the gi-11 mutant compared to wild type, persisting from ZT10-16h
(logarithmic scale, B); (C) earlier and lower peak expression of TOC1 in the lhy cca1 double mutant;
(D) lower expression of ELF3 in the gi mutant, especially at ZT8-10h; (E) persistent expression of
CCA1 in the prr7 prr9 double mutant, with an early rise in prr7 and delayed fall in prr9. RNA
profiles from the Southern data for elf3 and elf4 mutant seedlings under red light-dark cycles show (F)
persistently high and noisy expression of GI; (G) expression of CCA1 that falls from the level in Ws
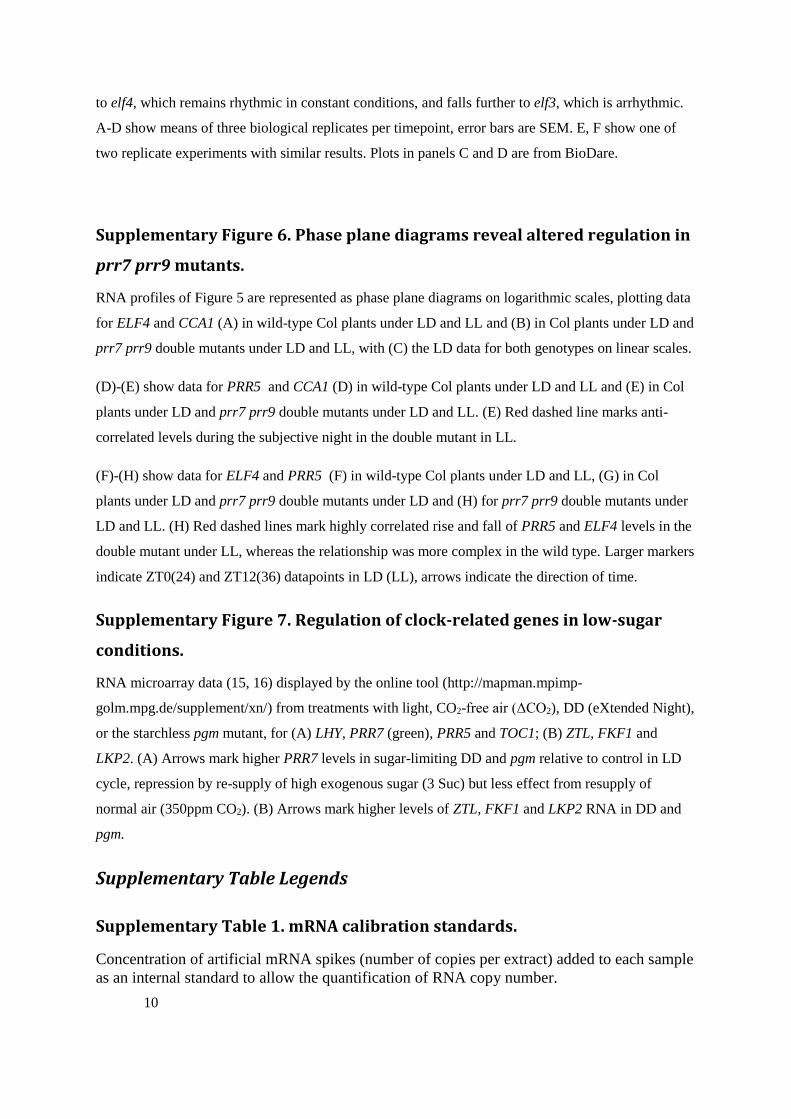
10
to elf4, which remains rhythmic in constant conditions, and falls further to elf3, which is arrhythmic.
A-D show means of three biological replicates per timepoint, error bars are SEM. E, F show one of
two replicate experiments with similar results. Plots in panels C and D are from BioDare.
Supplementary Figure 6. Phase plane diagrams reveal altered regulation in
prr7 prr9 mutants.
RNA profiles of Figure 5 are represented as phase plane diagrams on logarithmic scales, plotting data
for ELF4 and CCA1 (A) in wild-type Col plants under LD and LL and (B) in Col plants under LD and
prr7 prr9 double mutants under LD and LL, with (C) the LD data for both genotypes on linear scales.
(D)-(E) show data for PRR5 and CCA1 (D) in wild-type Col plants under LD and LL and (E) in Col
plants under LD and prr7 prr9 double mutants under LD and LL. (E) Red dashed line marks anti-
correlated levels during the subjective night in the double mutant in LL.
(F)-(H) show data for ELF4 and PRR5 (F) in wild-type Col plants under LD and LL, (G) in Col
plants under LD and prr7 prr9 double mutants under LD and (H) for prr7 prr9 double mutants under
LD and LL. (H) Red dashed lines mark highly correlated rise and fall of PRR5 and ELF4 levels in the
double mutant under LL, whereas the relationship was more complex in the wild type. Larger markers
indicate ZT0(24) and ZT12(36) datapoints in LD (LL), arrows indicate the direction of time.
Supplementary Figure 7. Regulation of clock-related genes in low-sugar
conditions.
RNA microarray data (15, 16) displayed by the online tool (http://mapman.mpimp-
golm.mpg.de/supplement/xn/) from treatments with light, CO2-free air (ΔCO2), DD (eXtended Night),
or the starchless pgm mutant, for (A) LHY, PRR7 (green), PRR5 and TOC1; (B) ZTL, FKF1 and
LKP2. (A) Arrows mark higher PRR7 levels in sugar-limiting DD and pgm relative to control in LD
cycle, repression by re-supply of high exogenous sugar (3 Suc) but less effect from resupply of
normal air (350ppm CO2). (B) Arrows mark higher levels of ZTL, FKF1 and LKP2 RNA in DD and
pgm.
Supplementary Table Legends
Supplementary Table 1. mRNA calibration standards.
Concentration of artificial mRNA spikes (number of copies per extract) added to each sample
as an internal standard to allow the quantification of RNA copy number.

11
Supplementary Table 2. qRT-PCR primer sequences.
The PCR primer sequences used in the TiMet studies are listed below. The PCR primer
sequences used in the ROBuST data set are listed in the public record for each transcript on
BioDare (please see Data Accessibility), and the primer sequences for other studies are listed
in their original publications and in the BioDare records (please see Data Accessibility).
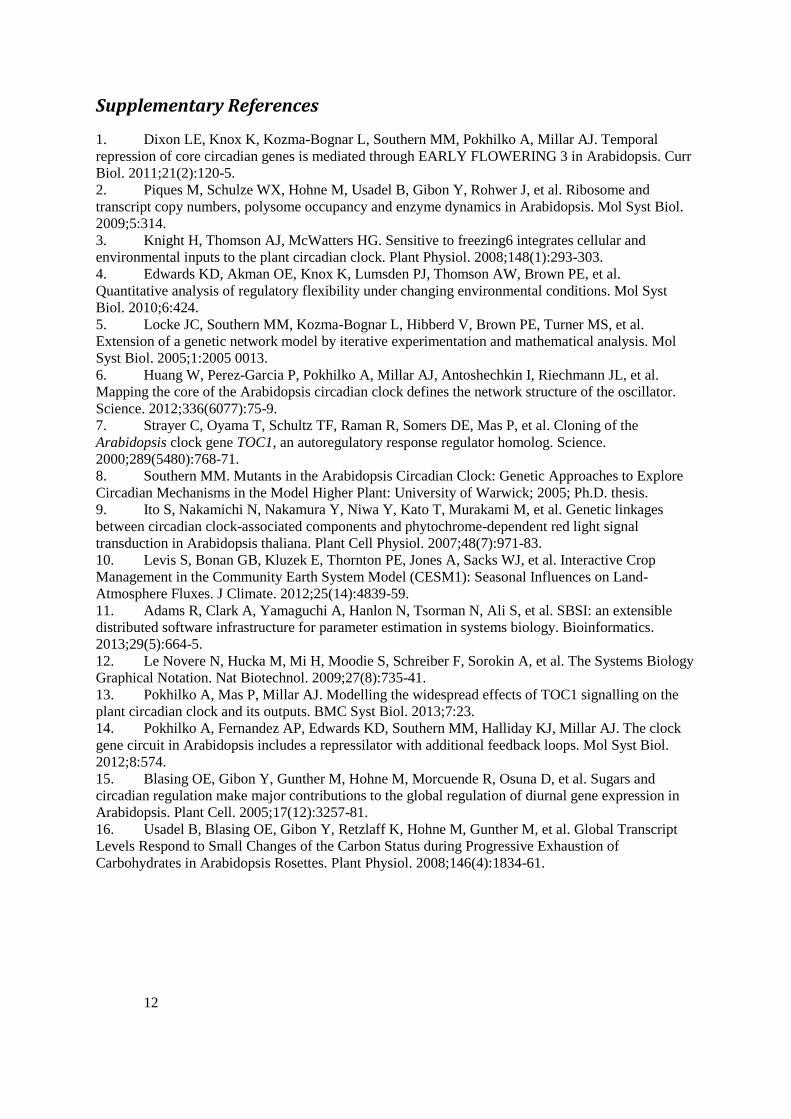
12
Supplementary References
1. Dixon LE, Knox K, Kozma-Bognar L, Southern MM, Pokhilko A, Millar AJ. Temporal
repression of core circadian genes is mediated through EARLY FLOWERING 3 in Arabidopsis. Curr
Biol. 2011;21(2):120-5.
2. Piques M, Schulze WX, Hohne M, Usadel B, Gibon Y, Rohwer J, et al. Ribosome and
transcript copy numbers, polysome occupancy and enzyme dynamics in Arabidopsis. Mol Syst Biol.
2009;5:314.
3. Knight H, Thomson AJ, McWatters HG. Sensitive to freezing6 integrates cellular and
environmental inputs to the plant circadian clock. Plant Physiol. 2008;148(1):293-303.
4. Edwards KD, Akman OE, Knox K, Lumsden PJ, Thomson AW, Brown PE, et al.
Quantitative analysis of regulatory flexibility under changing environmental conditions. Mol Syst
Biol. 2010;6:424.
5. Locke JC, Southern MM, Kozma-Bognar L, Hibberd V, Brown PE, Turner MS, et al.
Extension of a genetic network model by iterative experimentation and mathematical analysis. Mol
Syst Biol. 2005;1:2005 0013.
6. Huang W, Perez-Garcia P, Pokhilko A, Millar AJ, Antoshechkin I, Riechmann JL, et al.
Mapping the core of the Arabidopsis circadian clock defines the network structure of the oscillator.
Science. 2012;336(6077):75-9.
7. Strayer C, Oyama T, Schultz TF, Raman R, Somers DE, Mas P, et al. Cloning of the
Arabidopsis clock gene TOC1, an autoregulatory response regulator homolog. Science.
2000;289(5480):768-71.
8. Southern MM. Mutants in the Arabidopsis Circadian Clock: Genetic Approaches to Explore
Circadian Mechanisms in the Model Higher Plant: University of Warwick; 2005; Ph.D. thesis.
9. Ito S, Nakamichi N, Nakamura Y, Niwa Y, Kato T, Murakami M, et al. Genetic linkages
between circadian clock-associated components and phytochrome-dependent red light signal
transduction in Arabidopsis thaliana. Plant Cell Physiol. 2007;48(7):971-83.
10. Levis S, Bonan GB, Kluzek E, Thornton PE, Jones A, Sacks WJ, et al. Interactive Crop
Management in the Community Earth System Model (CESM1): Seasonal Influences on Land-
Atmosphere Fluxes. J Climate. 2012;25(14):4839-59.
11. Adams R, Clark A, Yamaguchi A, Hanlon N, Tsorman N, Ali S, et al. SBSI: an extensible
distributed software infrastructure for parameter estimation in systems biology. Bioinformatics.
2013;29(5):664-5.
12. Le Novere N, Hucka M, Mi H, Moodie S, Schreiber F, Sorokin A, et al. The Systems Biology
Graphical Notation. Nat Biotechnol. 2009;27(8):735-41.
13. Pokhilko A, Mas P, Millar AJ. Modelling the widespread effects of TOC1 signalling on the
plant circadian clock and its outputs. BMC Syst Biol. 2013;7:23.
14. Pokhilko A, Fernandez AP, Edwards KD, Southern MM, Halliday KJ, Millar AJ. The clock
gene circuit in Arabidopsis includes a repressilator with additional feedback loops. Mol Syst Biol.
2012;8:574.
15. Blasing OE, Gibon Y, Gunther M, Hohne M, Morcuende R, Osuna D, et al. Sugars and
circadian regulation make major contributions to the global regulation of diurnal gene expression in
Arabidopsis. Plant Cell. 2005;17(12):3257-81.
16. Usadel B, Blasing OE, Gibon Y, Retzlaff K, Hohne M, Gunther M, et al. Global Transcript
Levels Respond to Small Changes of the Carbon Status during Progressive Exhaustion of
Carbohydrates in Arabidopsis Rosettes. Plant Physiol. 2008;146(4):1834-61.
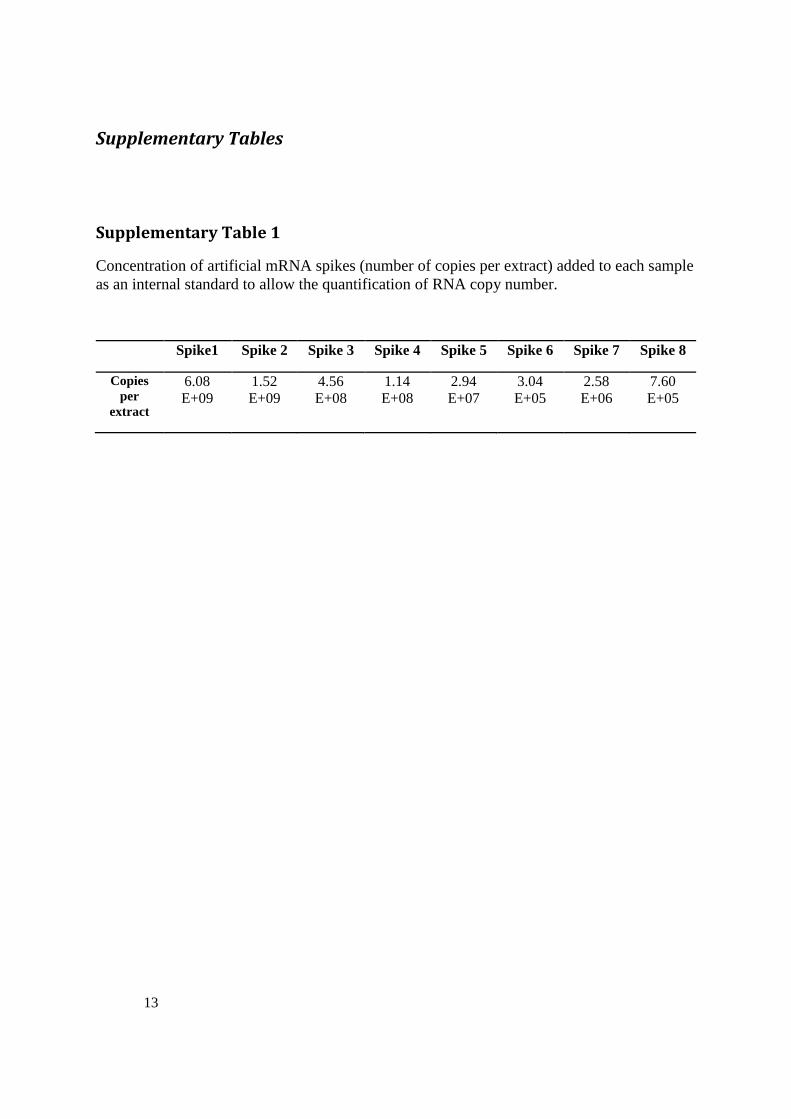
13
Supplementary Tables
Supplementary Table 1
Concentration of artificial mRNA spikes (number of copies per extract) added to each sample
as an internal standard to allow the quantification of RNA copy number.
Spike1 Spike 2 Spike 3 Spike 4 Spike 5 Spike 6 Spike 7 Spike 8
Copies
per
extract
6.08
E+09 1.52
E+09 4.56
E+08 1.14
E+08 2.94
E+07 3.04
E+05 2.58
E+06 7.60
E+05
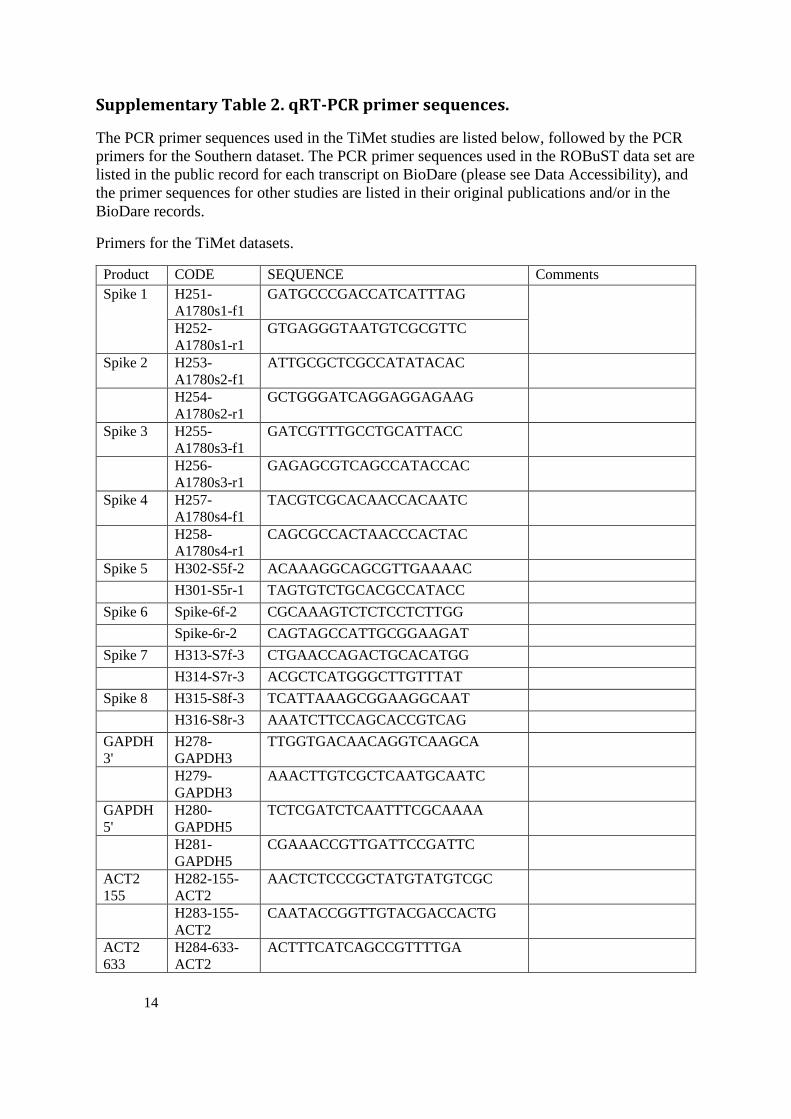
14
Supplementary Table 2. qRT-PCR primer sequences.
The PCR primer sequences used in the TiMet studies are listed below, followed by the PCR
primers for the Southern dataset. The PCR primer sequences used in the ROBuST data set are
listed in the public record for each transcript on BioDare (please see Data Accessibility), and
the primer sequences for other studies are listed in their original publications and/or in the
BioDare records.
Primers for the TiMet datasets.
Product CODE SEQUENCE Comments
Spike 1 H251-
A1780s1-f1
GATGCCCGACCATCATTTAG
H252-
A1780s1-r1
GTGAGGGTAATGTCGCGTTC
Spike 2 H253-
A1780s2-f1
ATTGCGCTCGCCATATACAC
H254-
A1780s2-r1
GCTGGGATCAGGAGGAGAAG
Spike 3 H255-
A1780s3-f1
GATCGTTTGCCTGCATTACC
H256-
A1780s3-r1
GAGAGCGTCAGCCATACCAC
Spike 4 H257-
A1780s4-f1
TACGTCGCACAACCACAATC
H258-
A1780s4-r1
CAGCGCCACTAACCCACTAC
Spike 5 H302-S5f-2 ACAAAGGCAGCGTTGAAAAC
H301-S5r-1 TAGTGTCTGCACGCCATACC
Spike 6 Spike-6f-2 CGCAAAGTCTCTCCTCTTGG
Spike-6r-2 CAGTAGCCATTGCGGAAGAT
Spike 7 H313-S7f-3 CTGAACCAGACTGCACATGG
H314-S7r-3 ACGCTCATGGGCTTGTTTAT
Spike 8 H315-S8f-3 TCATTAAAGCGGAAGGCAAT
H316-S8r-3 AAATCTTCCAGCACCGTCAG
GAPDH
3'
H278-
GAPDH3
TTGGTGACAACAGGTCAAGCA
H279-
GAPDH3
AAACTTGTCGCTCAATGCAATC
GAPDH
5'
H280-
GAPDH5
TCTCGATCTCAATTTCGCAAAA
H281-
GAPDH5
CGAAACCGTTGATTCCGATTC
ACT2
155
H282-155-
ACT2
AACTCTCCCGCTATGTATGTCGC
H283-155-
ACT2
CAATACCGGTTGTACGACCACTG
ACT2
633
H284-633-
ACT2
ACTTTCATCAGCCGTTTTGA
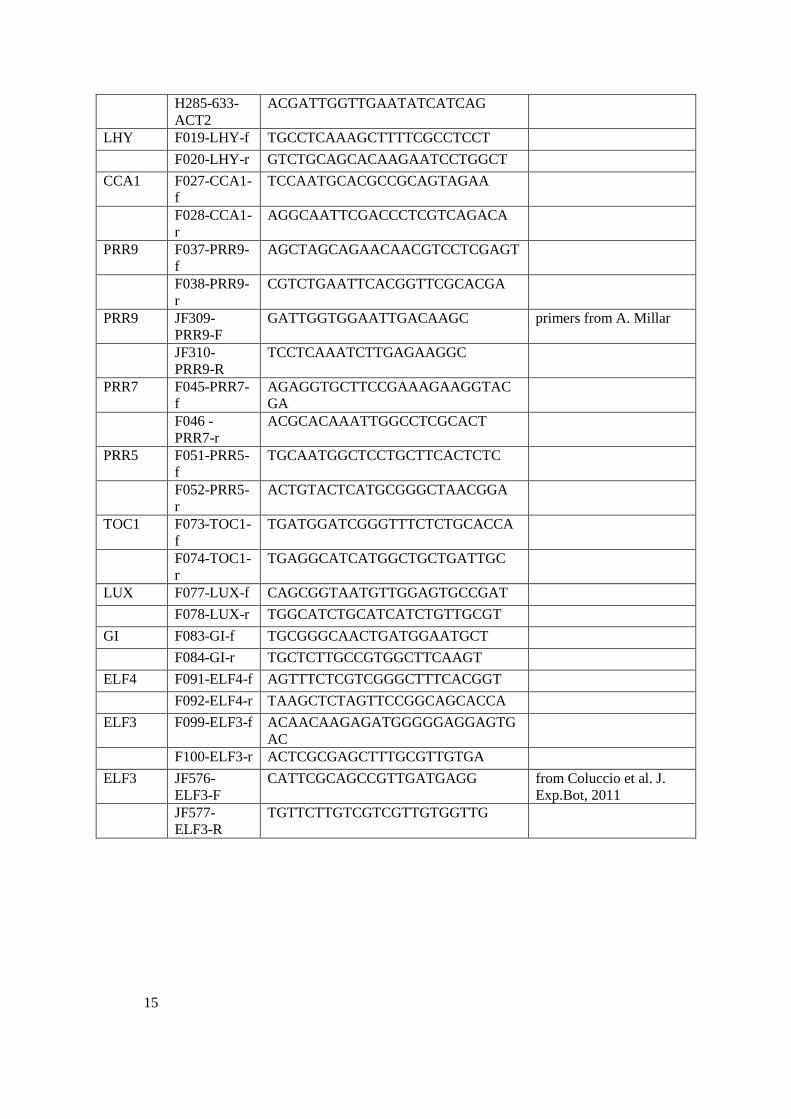
15
H285-633-
ACT2
ACGATTGGTTGAATATCATCAG
LHY F019-LHY-f TGCCTCAAAGCTTTTCGCCTCCT
F020-LHY-r GTCTGCAGCACAAGAATCCTGGCT
CCA1 F027-CCA1-
f
TCCAATGCACGCCGCAGTAGAA
F028-CCA1-
r
AGGCAATTCGACCCTCGTCAGACA
PRR9 F037-PRR9-
f
AGCTAGCAGAACAACGTCCTCGAGT
F038-PRR9-
r
CGTCTGAATTCACGGTTCGCACGA
PRR9 JF309-
PRR9-F
GATTGGTGGAATTGACAAGC primers from A. Millar
JF310-
PRR9-R
TCCTCAAATCTTGAGAAGGC
PRR7 F045-PRR7-
f
AGAGGTGCTTCCGAAAGAAGGTAC
GA
F046 -
PRR7-r
ACGCACAAATTGGCCTCGCACT
PRR5 F051-PRR5-
f
TGCAATGGCTCCTGCTTCACTCTC
F052-PRR5-
r
ACTGTACTCATGCGGGCTAACGGA
TOC1 F073-TOC1-
f
TGATGGATCGGGTTTCTCTGCACCA
F074-TOC1-
r
TGAGGCATCATGGCTGCTGATTGC
LUX F077-LUX-f CAGCGGTAATGTTGGAGTGCCGAT
F078-LUX-r TGGCATCTGCATCATCTGTTGCGT
GI F083-GI-f TGCGGGCAACTGATGGAATGCT
F084-GI-r TGCTCTTGCCGTGGCTTCAAGT
ELF4 F091-ELF4-f AGTTTCTCGTCGGGCTTTCACGGT
F092-ELF4-r TAAGCTCTAGTTCCGGCAGCACCA
ELF3 F099-ELF3-f ACAACAAGAGATGGGGGAGGAGTG
AC
F100-ELF3-r ACTCGCGAGCTTTGCGTTGTGA
ELF3 JF576-
ELF3-F
CATTCGCAGCCGTTGATGAGG from Coluccio et al. J.
Exp.Bot, 2011
JF577-
ELF3-R
TGTTCTTGTCGTCGTTGTGGTTG

16
Primers for the Southern dataset (8).
Product Forward primer Reverse primer
ACT2 CAGTGTCTGGATCGGAGGAT TGAACAATCGATGGACCTGA
LHY CAACAGCAACAACAATGCAACTAC AGAGAGCCTGAAACGCTATACGA
CCA1 CTGTGTCTGACGAGGGTCGAA ATATGTAAAACTTTGCGGCAATACCT
GI AATTCAGCACGCGCCTATTG GTTGCTTCTGCTGCAGGAACTT
TOC1 ATCTTCGCAGAATCCCTGTGATA GCACCTAGCTTCAAGCACTTTACA
ELF3 GGAAAGCCATTGCCAATCAA ATCCGGTGATGCAGCAATAAGT
ELF4 CGACAATCACCAATCGAGAATG AATGTTTCCGTTGAGTTCTTGAATC

Supplementary Figure 1
Supplementary Figure 1. Overview of the clock gene circuit The clock gene circuit summarised in the Activity-Flow language of SBGN v1.0 (Le Novere et al., 2009), with the principal light inputs and regulatory interactions in the P2012 model (Pokhilko et al., 2013). The repressilator is denoted by green lines; morning loop components are filled yellow; evening loop components are filled blue.
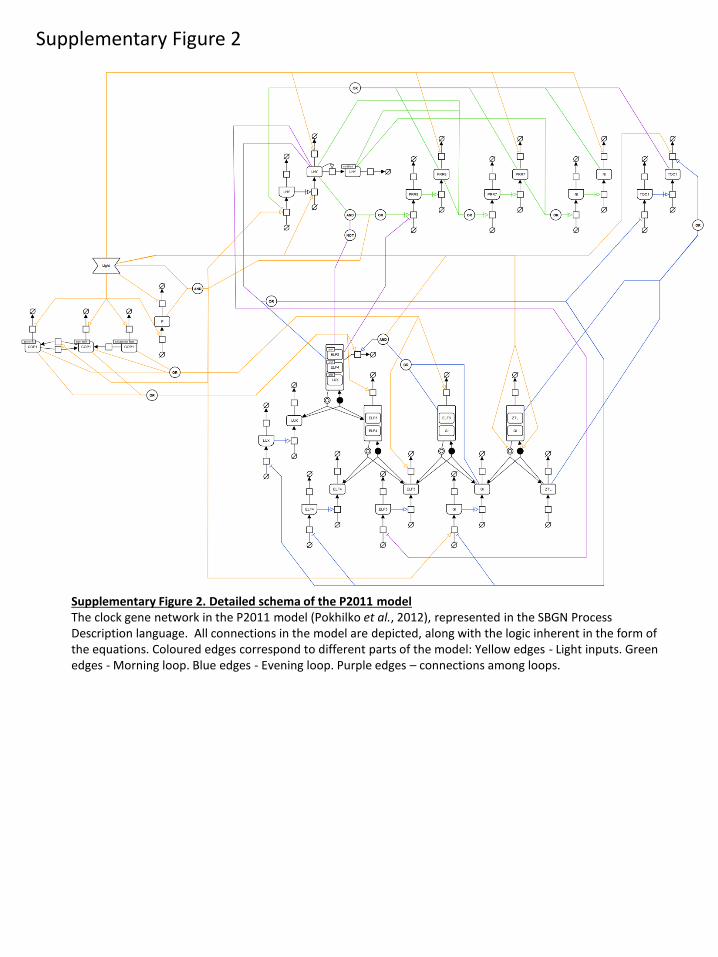
Supplementary Figure 2
Supplementary Figure 2. Detailed schema of the P2011 model The clock gene network in the P2011 model (Pokhilko et al., 2012), represented in the SBGN Process Description language. All connections in the model are depicted, along with the logic inherent in the form of the equations. Coloured edges correspond to different parts of the model: Yellow edges - Light inputs. Green edges - Morning loop. Blue edges - Evening loop. Purple edges – connections among loops.
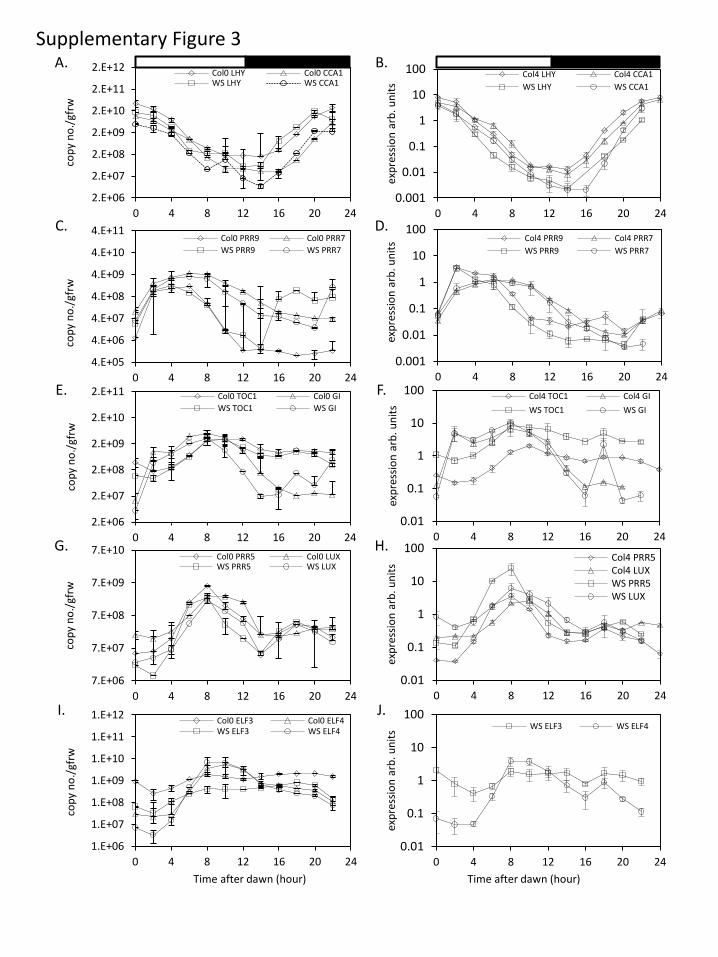
A. B.
C. D.
E. F.
G. H.
I. J.
Time after dawn (hour) Time after dawn (hour)
2.E+06
2.E+07
2.E+08
2.E+09
2.E+10
2.E+11
2.E+12
0 4 8 12 16 20 24
cop
y n
o./
gfrw
Col0 LHY Col0 CCA1WS LHY WS CCA1
4.E+05
4.E+06
4.E+07
4.E+08
4.E+09
4.E+10
4.E+11
0 4 8 12 16 20 24
cop
y n
o./
gfrw
Col0 PRR9 Col0 PRR7
WS PRR9 WS PRR7
2.E+06
2.E+07
2.E+08
2.E+09
2.E+10
2.E+11
0 4 8 12 16 20 24
cop
y n
o./
gfrw
Col0 TOC1 Col0 GI
WS TOC1 WS GI
7.E+06
7.E+07
7.E+08
7.E+09
7.E+10
0 4 8 12 16 20 24
cop
y n
o./
gfrw
Col0 PRR5 Col0 LUXWS PRR5 WS LUX
1.E+06
1.E+07
1.E+08
1.E+09
1.E+10
1.E+11
1.E+12
0 4 8 12 16 20 24
cop
y n
o./
gfrw
Col0 ELF3 Col0 ELF4WS ELF3 WS ELF4
0.001
0.01
0.1
1
10
100
0 4 8 12 16 20 24
exp
ress
ion
arb
. un
its
Col4 LHY Col4 CCA1
WS LHY WS CCA1
0.001
0.01
0.1
1
10
100
0 4 8 12 16 20 24ex
pre
ssio
n a
rb. u
nit
s Col4 PRR9 Col4 PRR7
WS PRR9 WS PRR7
0.01
0.1
1
10
100
0 4 8 12 16 20 24
exp
ress
ion
arb
. un
its
Col4 TOC1 Col4 GI
WS TOC1 WS GI
0.01
0.1
1
10
100
0 4 8 12 16 20 24
exp
ress
ion
arb
. un
its
Col4 PRR5Col4 LUXWS PRR5WS LUX
0.01
0.1
1
10
100
0 4 8 12 16 20 24
exp
ress
ion
arb
. un
its WS ELF3 WS ELF4
Supplementary Figure 3
Supplementary Figure 3. Logarithmic plots of clock gene expression in wild-type plants under LD cycles Transcript levels in Col-0 and Ws-2 wild types under LD 12:12 were measured by qRT-PCR, in experiment 2 (TiMet ros) including eight external RNA standards to allow absolute quantification in Col-0 and Ws-2 (A, C, E) and in experiment 1 (ROBuST) normalised to the ACTIN7 control in Col-4 and Ws-2 (B, D, F). Data represent transcripts of (A, B) LHY and CCA1, (C, D) PRR9, (E, F) TOC1 and GI. Error bars show SD, for 2-3 biological replicates. Figure 2 shows the same data on a linear scale.
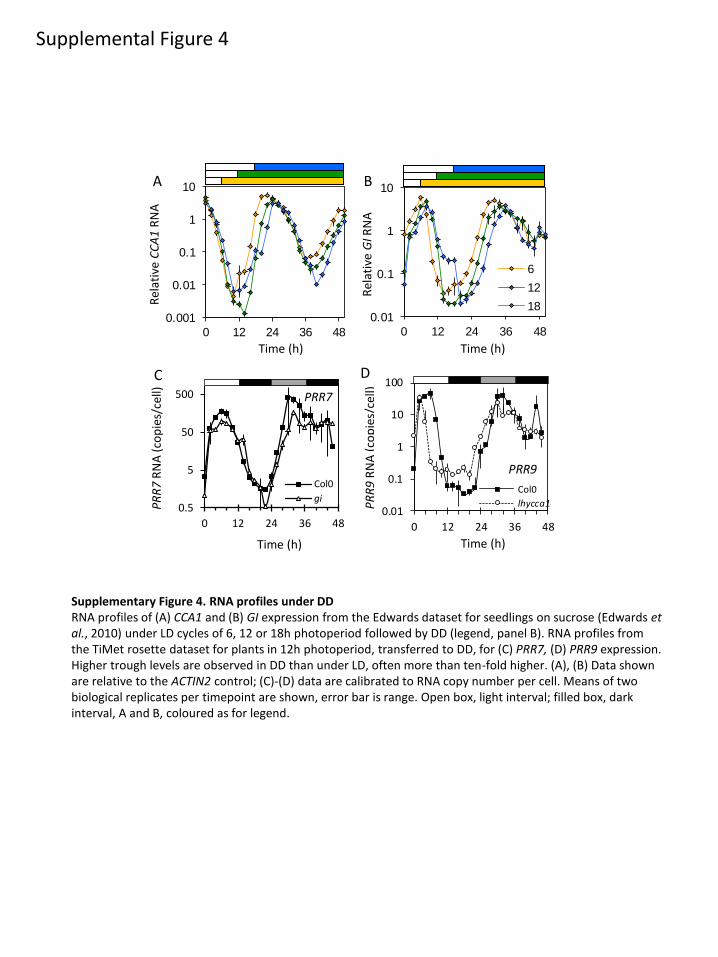
Supplemental Figure 4
0.001
0.01
0.1
1
10
0 12 24 36 48
0.01
0.1
1
10
0 12 24 36 48
6
12
18
Time (h)
Rel
ativ
e C
CA
1 R
NA
Rel
ativ
e G
I RN
A
Time (h)
A B
0.5
5
50
500
0 12 24 36 48
PRR7
Col0
gi
Time (h)
PR
R7
RN
A (
cop
ies/
cell)
C
Time (h)
D P
RR
9 R
NA
(co
pie
s/ce
ll)
0.01
0.1
1
10
100
0 12 24 36 48
PRR9
Col0
lhycca1
Supplementary Figure 4. RNA profiles under DD RNA profiles of (A) CCA1 and (B) GI expression from the Edwards dataset for seedlings on sucrose (Edwards et al., 2010) under LD cycles of 6, 12 or 18h photoperiod followed by DD (legend, panel B). RNA profiles from the TiMet rosette dataset for plants in 12h photoperiod, transferred to DD, for (C) PRR7, (D) PRR9 expression. Higher trough levels are observed in DD than under LD, often more than ten-fold higher. (A), (B) Data shown are relative to the ACTIN2 control; (C)-(D) data are calibrated to RNA copy number per cell. Means of two biological replicates per timepoint are shown, error bar is range. Open box, light interval; filled box, dark interval, A and B, coloured as for legend.
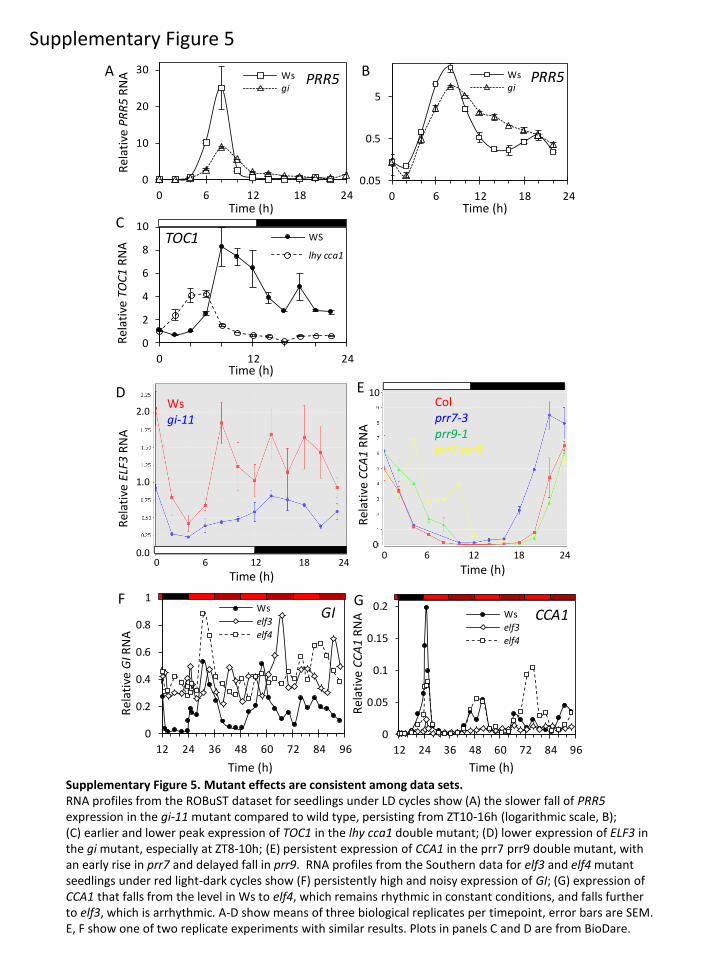
Supplementary Figure 5
0.05
0.5
5
0 6 12 18 24
PRR5Wsgi
Time (h)
Rel
ativ
e P
RR
5 R
NA
0
10
20
30
0 6 12 18 24
PRR5Wsgi
Time (h)
A B
0.0
1.0
2.0
0 6 12 18 24
Time (h)
Rel
ativ
e EL
F3 R
NA
Ws gi-11
D
0 6 12 18 24
Time (h)
Rel
ativ
e C
CA
1 R
NA
0
10 E Col prr7-3 prr9-1 prr7 prr9
Time (h)
Rel
ativ
e G
I RN
A
F
0
0.2
0.4
0.6
0.8
1
12 24 36 48 60 72 84 96
GIWs
elf3
elf4
0
0.05
0.1
0.15
0.2
12 24 36 48 60 72 84 96
CCA1Ws
elf3
elf4
G
Rel
ativ
e C
CA
1 R
NA
Time (h)
Supplementary Figure 5. Mutant effects are consistent among data sets. RNA profiles from the ROBuST dataset for seedlings under LD cycles show (A) the slower fall of PRR5 expression in the gi-11 mutant compared to wild type, persisting from ZT10-16h (logarithmic scale, B); (C) earlier and lower peak expression of TOC1 in the lhy cca1 double mutant; (D) lower expression of ELF3 in the gi mutant, especially at ZT8-10h; (E) persistent expression of CCA1 in the prr7 prr9 double mutant, with an early rise in prr7 and delayed fall in prr9. RNA profiles from the Southern data for elf3 and elf4 mutant seedlings under red light-dark cycles show (F) persistently high and noisy expression of GI; (G) expression of CCA1 that falls from the level in Ws to elf4, which remains rhythmic in constant conditions, and falls further to elf3, which is arrhythmic. A-D show means of three biological replicates per timepoint, error bars are SEM. E, F show one of two replicate experiments with similar results. Plots in panels C and D are from BioDare.
C
0
2
4
6
8
10
0 12 24
TOC1 WS
lhy cca1
Time (h)
Rel
ativ
e TO
C1
RN
A

0.001
0.01
0.1
1
0.0005 0.005 0.05 0.5
Rel
ati
ve E
LF4
leve
l
Relative CCA1 level
Col LD
Col LL0.001
0.01
0.1
1
0.0005 0.005 0.05 0.5
Rel
ati
ve E
LF4
leve
lRelative CCA1 level
Col LD
prr7 prr9 LD
prr7 prr9 LL
0.001
0.01
0.1
1
0.0005 0.005 0.05 0.5
Rel
ati
ve P
RR
5le
vel
Relative CCA1 level
Col LD
Col LL0.001
0.01
0.1
1
0.0005 0.005 0.05 0.5
Rel
ati
ve P
RR
5le
vel
Relative CCA1 level
Col LD
prr7 prr9 LD
prr7 prr9 LL
0.001
0.01
0.1
1
0.001 0.01 0.1 1
Rel
ati
ve E
LF4
leve
l
Relative PRR5 level
Col LD
Col LL
0.001
0.01
0.1
1
0.001 0.01 0.1 1
Rel
ati
ve E
LF4
leve
l
Relative PRR5 level
Col LD
prr7 prr9 LD
0.001
0.01
0.1
1
0.001 0.01 0.1 1
Rel
ati
ve E
LF4
leve
l
Relative PRR5 level
prr7 prr9 LD
prr7 prr9 LL
A B
D E
F G H
ZT12
ZT0
ZT0
ZT12
Supplementary Figure 6
0
0.2
0.4
0.6
0.8
1
0 0.2 0.4 0.6 0.8 1
Rel
ati
ve E
LF4
leve
l
Relative CCA1 level
Col LDprr7 prr9 LD
ZT12
ZT0
C
Supplementary Figure 6. Phase plane diagrams reveal altered regulation in prr7 prr9 mutants. RNA profiles of Figure 5 are represented as phase plane diagrams on logarithmic scales, plotting data for ELF4 and CCA1 (A) in wild-type Col plants under LD and LL and (B) in Col plants under LD and prr7 prr9 double mutants under LD and LL, with (C) the LD data for both genotypes on linear scales. (D)-(E) show data for PRR5 and CCA1 (D) in wild-type Col plants under LD and LL and (E) in Col plants under LD and prr7 prr9 double mutants under LD and LL. (E) Red dashed line marks anti-correlated levels during the subjective night in the double mutant in LL. (F)-(H) show data for ELF4 and PRR5 (F) in wild-type Col plants under LD and LL, (G) in Col plants under LD and prr7 prr9 double mutants under LD and (H) for prr7 prr9 double mutants under LD and LL. (H) Red dashed lines mark highly correlated rise and fall of PRR5 and ELF4 levels in the double mutant under LL, whereas the relationship was more complex in the wild type. Larger markers indicate ZT0(24) and ZT12(36) datapoints in LD (LL), arrows indicate the direction of time.
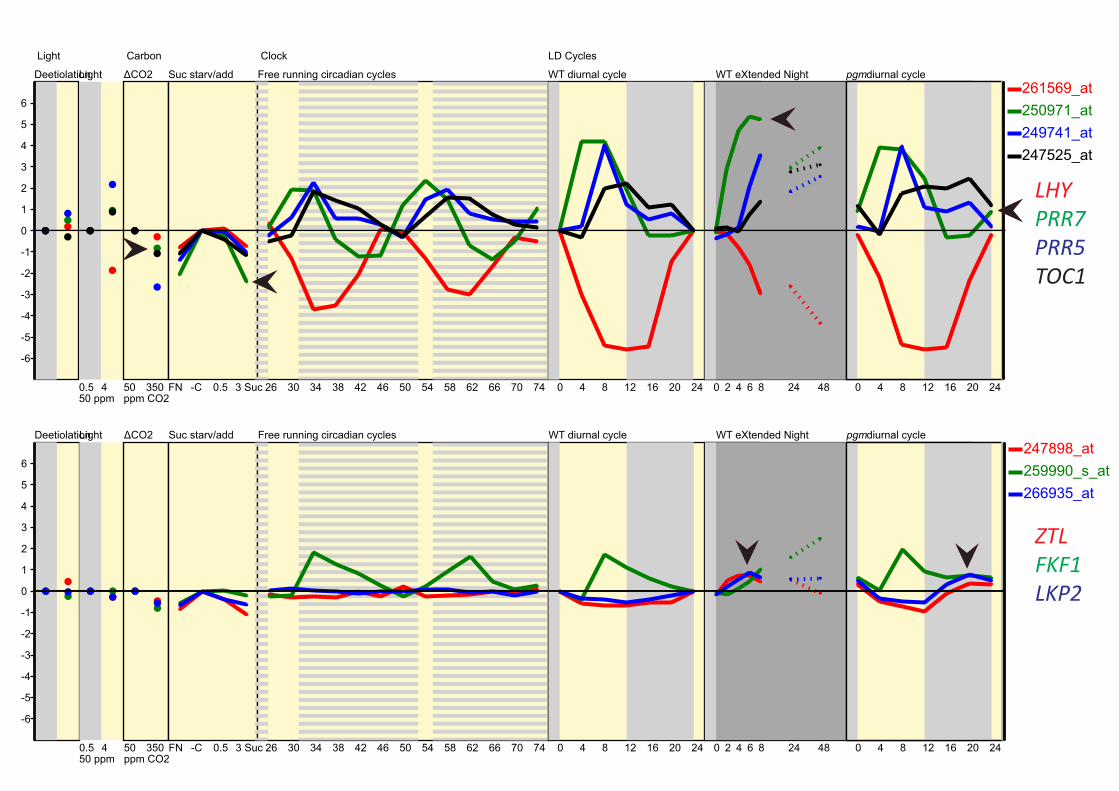
Light
DeetiolationLight
0.5 450 ppm
Carbon
ΔCO2
50 350ppm CO2
Suc starv/add
FN -C 0.5 3 Suc
Clock
Free running circadian cycles
26 30 34 38 42 46 50 54 58 62 66 70 74
LD Cycles
WT diurnal cycle
0 4 8 12 16 20 24
WT eXtended Night
0 2 4 6 8 24 48
pgm diurnal cycle
0 4 8 12 16 20 24
-6
-5
-4
-3
-2
-1
0
1
2
3
4
5
6261569_at250971_at249741_at247525_at
DeetiolationLight
0.5 450 ppm
ΔCO2
50 350ppm CO2
Suc starv/add
FN -C 0.5 3 Suc
Free running circadian cycles
26 30 34 38 42 46 50 54 58 62 66 70 74
WT diurnal cycle
0 4 8 12 16 20 24
WT eXtended Night
0 2 4 6 8 24 48
pgm diurnal cycle
0 4 8 12 16 20 24
-6
-5
-4
-3
-2
-1
0
1
2
3
4
5
6247898_at259990_s_at266935_at
LHYPRR7PRR5TOC1
ZTLFKF1LKP2
Supplementary Figure 7. Regulation of clock-related genes in low-sugar conditions. RNA microarray data (Blasing et al., 2005; Usadel et al., 2008) displayed by the online tool (http://mapman.mpimp-golm.mpg.de/supplement/xn/) from
treatments with light, CO2-free air (ΔCO2), DD (eXtended Night), or the starchless pgm mutant, for (A) LHY, PRR7 (green), PRR5 and TOC1; (B) ZTL, FKF1
and LKP2. (A) Arrows mark higher PRR7 levels in sugar-limiting DD and pgm relative to control in LD cycle, repression by re-supply of high exogenous
sugar (3 Suc) but less effect from resupply of normal air (350ppm CO2). (B) Arrows mark higher levels of ZTL, FKF1 and LKP2 RNA in DD and pgm.
Related Documents