Defining the AmerisourceBergen way. 2003 Annual Report

Welcome message from author
This document is posted to help you gain knowledge. Please leave a comment to let me know what you think about it! Share it to your friends and learn new things together.
Transcript

Defining the AmerisourceBergen way.
2003 Annual Report
Annual Report 2003AmerisourceBergen (NYSE:ABC) is the largest pharmaceutical services company
in the United States dedicated solely to the pharmaceutical supply channel. We work
with our branded, generic, and specialty pharmaceutical manufacturer customers
to distribute pharmaceutical products and services to America’s healthcare providers.
With more than $45 billion in operating revenue, the Company is headquartered
in Valley Forge, PA, and employs more than 14,000 people.
AmerisourceBergen is a leader in providing pharmaceuticals and related services
to the hospital systems/acute care market, physician’s offices, alternate care and
mail order facilities, independent community pharmacies, and regional chain
pharmacies. The Company is also a leader in the long term care pharmacy and
workers’ compensation fulfillment marketplaces. We provide logistical expertise,
contract packaging services, and product marketing assistance to our manufacturer
customers, and pride ourselves on our industry leading customer service. Our goal
is to help all of our customers improve their businesses and ultimately improve
the quality of healthcare in America.
www.amerisourcebergen.com
AmerisourceBergen is
committed to expanding
the value added services
we provide to our
customers along the
pharmaceutical supply
channel through
internal development
and through acquisition
of companies like
Anderson Packaging,
shown on the cover.
Defining the AmerisourceBergen way.
2003 Annual Report
2
6
4
1213
Financial
$45,5
R. David Yost, AmerisourceBergen’s
Chief Executive Officer, gives
an overview of fiscal year 2003
and the Company’s future outlook.
Robert E. Martini, Chairman of
AmerisourceBergen’s Board of
Directors, recaps Board activities
for fiscal year 2003 and gives
an update on the Company’s
Corporate Governance activities.
List of members of the Company’s Board
of Directors and AmerisourceBergen
Corporate Officers.
Defining the AmerisourceBergen Way: delivering
shareholder value through disciplined growth.
AmerisourceBergen Management’s
Discussion and Analysis of Financial
Condition and Results of Operations.
Contents
To Our
Shareholders:For fiscal 2003, the associates
of AmerisourceBergen promised to stay
focused on the pharmaceutical supply
channel and to deliver strong financial
results. It is my pleasure to report to
you that our promises were kept.
In fiscal year 2003, the Company
generated operating revenue of $45.5
billion, a 13% increase over fiscal 2002,
which when combined with a sharp
reduction in operating costs as a
percentage of revenue, produced a 28%
increase in net income over the prior
year. Earnings per share were $3.89,
a 23% increase over the previous year.
And that’s on top of a 50% increase
in earnings per share delivered in 2002.
Our strong financial results were
delivered while being disciplined in the
use of our capital, and generating over
$350 million in cash from operations.
We kept our receivables to 17 days,
the best in the industry, and produced
exceptional inventory productivity.
Besides solid financial performance,
our disciplined execution continues
to deliver on other commitments.
We are substantially ahead of schedule
in delivering $150 million in merger
related synergies promised by the end
of fiscal 2004. And, since the merger,
we have enhanced our role in the
pharmaceutical supply channel with
the investment of nearly $500 million
in five acquisitions that provide
AmerisourceBergen strong positions
in such important channel services
as pharmacy automation, contract
packaging, patient safety, and
physician education.
Underpinning these results
is the superior performance of
AmerisourceBergen associates.
They are building a collaborative
culture, centered on execution and
discipline, and it is my great pleasure
to work with them.
Disciplined Growth StrategyFocused on the pharmaceutical
supply channel, AmerisourceBergen
continues to execute our simple, two-part
growth strategy: Deliver “best in class”
pharmaceutical distribution and provide
“best in class” solutions and services to
the channel.
During 2003, we made outstanding
progress on our Optimiz program, which
is designed to create a world class
distribution network in our pharmaceutical
distribution business by 2007. During
the year, six more distribution centers
(DCs) were consolidated, and with 2002’s
seven consolidations, we now operate
38 distribution centers out of an original
51 DCs. When complete, the network
will have 30 distribution centers
including six new highly automated
“greenfield” facilities with approximately
300,000 square feet each. We now have
four of the new DCs under construction,
with the first scheduled to open in the
summer of 2004. We also remodeled
two DCs out of the seven planned,
and implemented our warehouse
management system, PkMS, in three
of our facilities, producing significant
productivity improvement and nearly
perfect order accuracy.
In our PharMerica segment, we
completed the migration of all long
term care pharmacy facilities to a
single operating system, and developed
plans to capture additional operating
efficiencies through automation.
We continue to add solutions and
services for our healthcare providers
and pharmaceutical manufacturer
customers. During the year we acquired
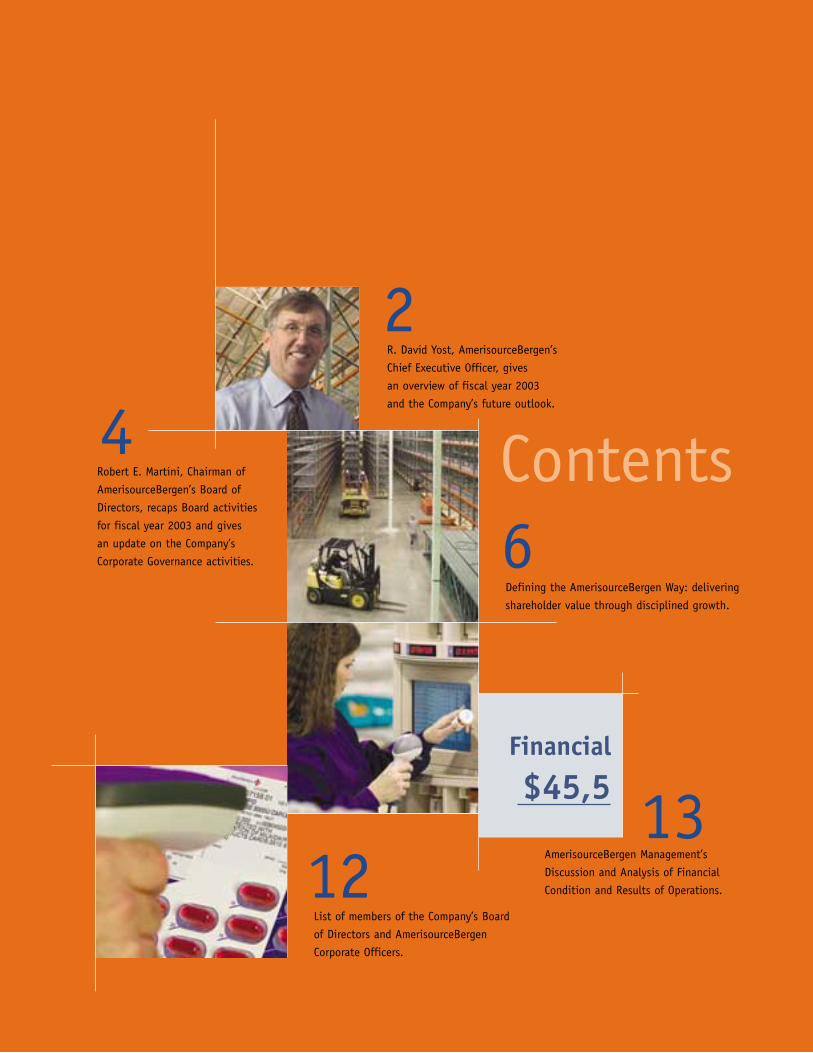
Our Optimiz program drives inventory accuracyto 99.99%, order accuracy to 99.94%, andimproves warehouse productivity by 40%.Pharmaceutical distribution continues
to be a very healthy business, withdouble digit growthforecasted well into the future.
Earnings per share increased23% in FY003, on top of a 50%increase in FY 2002.
2
Diluted EarningsPer ShareFY Ending September 30
1999 2000 2001 2002 2003
$1.
90
$1.
31
$2.
10
$3.
89
$3.
16

AmerisourceBergen is dedicated to building on its successes
in the pharmaceutical supply channel and taking advantage of the
many opportunities on the horizon to add value for our customers
and shareholders. R. David Yost
Anderson Packaging, a leading contract
packager for manufacturers; Bridge
Medical®, and its leading patient safety
software technology for the acute care
market; and U.S. Bioservices, which
provides reimbursement consulting and
the delivery of complex drug therapies
for manufacturers looking to bring new
products to market. Our acquisitions
since the beginning of fiscal 2002
have already collectively added to the
Company’s gross margin in FY 2003.
Fiscal 2004 will also be a active
building year for our Company. In the
pharmaceutical distribution segment,
we expect to have five greenfields
under construction and have planned
three consolidations, along with three
installations of PkMS, and one DC
remodeling. As we complete the
Optimiz program, we expect to deliver
cost savings well beyond fiscal 2004
and firmly establish ourselves as the
lowest cost service provider in the
industry. We have the ability to make
moderately sized acquisitions and expect
to continue our disciplined acquisition
activity with the right opportunities.
The FutureWe continue to view the
pharmaceutical supply channel as
a positive and stable environment.
The basic fundamental drivers of this
industry—demographics (the aging
of America) and the country’s demand
for new drugs—have not changed.
Our suppliers continue to invest tens
of billions of dollars developing the
products we will distribute in the
future. Pharmaceutical distribution
continues to be a good business to be
in, with double digit growth forecasted
far into the future.
Robert E. Martini
Fellow shareholders:
In our second full year of operations
AmerisourceBergen again delivered
outstanding operating performance while
achieving its aggressive plans in its network
consolidation and build-out process. The
Company also has thoroughly reviewed its
corporate governance structure and taken
measures to further strengthen its internal controls and reporting
mechanisms. AmerisourceBergen is fully compliant with corporate
governance requirements and the current New York Stock Exchange
listing standards.
Your Directors are actively engaged in the oversight and governance
of the Company, each lending his or her individual expertise and
fulfilling their responsibilities thoughtfully and completely. The
Governance and Nominating Committee conducted a formal
assessment of the Board and, while there were no deficiencies
noted, the Board adopted some enhancements to its oversight
and conduct procedures. In addition, the Board adopted Corporate
Governance Principles and modified the title and charters of its
committees to ensure compliance with the New York Stock Exchange’s
corporate governance rules. These corporate governance documents
are published in the 2004 proxy statement.
All Directors and Company associates are required to comply with
AmerisourceBergen’s updated Code of Ethics and Business Conduct.
As required by the Sarbanes-Oxley Act of 2002, the CEO, CFO
and Controller also are subject to a Code of Ethics that complies
with Securities and Exchange Commission regulations. We have
implemented additional disciplines and will continue to monitor
and adopt policies and procedures as warranted.
We are most appreciative of the insight and guidance that we have
received from Francis G. “Buck” Rodgers, who will be retiring from
the Board after 22 years with the AmerisourceBergen and Bergen
Brunswig Boards, which he so dutifully served.
AmerisourceBergen prides itself on delivering shareholder value by
managing itself with integrity, reporting its financial results forthrightly,
and exceeding its customers’ expectations. This report outlines the
progress your management has made in the past year and the
opportunities ahead.
Thank you for your continued support.
Sincerely,
Robert E. Martini
Chairman of the Board
January 12, 2004
4
As always, there are changes ahead.
The new Medicare drug benefit, recently
signed into law, is expected to bring a
substantial increase in drug utilization
and revenue for AmerisourceBergen
in 2006. We will be ready and able to
leverage the added volume through our
highly efficient distribution centers.
On December 31, 2003 we lost the
Department of Veterans Affairs contract,
which represents more than $3 billion
in annual operating revenue and expires
March 31, 2004. While disappointing,
we expect to quickly move to take out
costs associated with this contract and
begin to re-deploy the associated capital
to replace lost earnings.
The U.S. Food and Drug
Administration (FDA) is seeking to
address reported incidents of counterfeit
merchandise in the channel. These are
rare in the context of the $200 billion
pharmaceutical industry. Nonetheless,
AmerisourceBergen and our peers, along
with pharmaceutical manufacturers, are
upgrading our safety procedures and
standards. The movement of product
from manufacturer to primary distributor
to healthcare provider continues to
be the “gold standard” of security and
reliability. Your Company will continue
to work closely with the FDA and
manufacturers, and will maintain our
leadership in this area.
The industry is continuing to evolve
from a model where pharmaceutical
distributors have the traditional
opportunity for earning profits from
speculating on price appreciation and
manufacturer deals, to one characterized
by incentives that more closely match
our inventory with the demand from
the healthcare provider. The industry
will be moving toward a fee-for-service
relationship with the brand name
pharmaceutical suppliers. Over time this
will result in a more efficient channel
with more product moving through
full-service distributors and more stable
and predictable earning power for
AmerisourceBergen. The change will be
positive for the Company in the long run.
Any temporary negative impact from this
change should impact AmerisourceBergen
less than its peers because we have run
with lower inventory and have been
historically the least dependent on
speculation profits and deals. Our cost
savings from the building of our world
class distribution network will also
help us smoothly manage this change.
In my 30 years in the industry, I have
experienced many changes and I am
confident that with continued discipline
AmerisourceBergen will adapt quickly and
well to any evolution in the marketplace.
I want to thank AmerisourceBergen
Director Francis G. “Buck” Rodgers
for his many years of service to
AmerisourceBergen as he retires from
the Board of Directors this year. The
Company and I have been well served
by his counsel and active participation
on the Board and I will miss his
unwavering optimism.
I also want to thank our many
associates. Their continuing daily efforts
in exceeding customer expectations
have allowed our Company to maintain
its leadership position in the industry.
GoalsAmerisourceBergen’s long-term
goals are to grow revenue with the
pharmaceutical market, which is
expected to expand 10% to 13%
between now and 2007; continue to
expand our operating margin; deliver
return on committed capital in excess
of 20%, and increase earnings per
share 15% or more annually, excluding
special items.
AmerisourceBergen is solidly on
track, and tracking in a solid industry.
Thank you for your continuing support.
R. David Yost
Chief Executive Officer
January 12, 2004
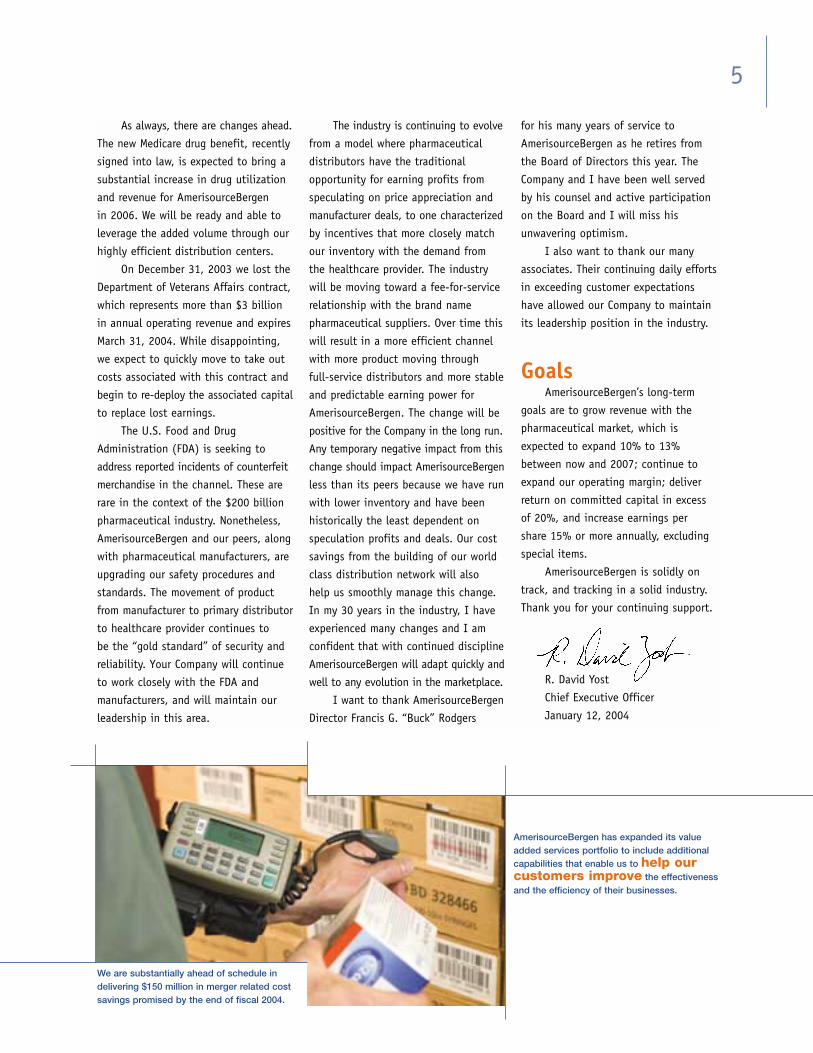
AmerisourceBergen has expanded its valueadded services portfolio to include additionalcapabilities that enable us to help ourcustomers improve the effectivenessand the efficiency of their businesses.
We are substantially ahead of schedule indelivering $150 million in merger related costsavings promised by the end of fiscal 2004.
5
Definingthe AmerisourceBergen Way.
Disciplined. Efficient. Innovative.
Successful. These are just some
of the words that help define the
AmerisourceBergen way of doing
business. We focus on delivering
outstanding service on a daily basis,
serving healthcare providers and
pharmaceutical manufacturers with
products and services to help them
improve their businesses and ultimately
improve the quality of healthcare
delivered in America. We operate in
a $200 billion industry that is growing
revenue at a double-digit rate. Fueled
by tens of billions of dollars in annual
drug research and development spending
and an aging population, the sale of
pharmaceutical products in the United
States will continue to expand through-
out the decade. AmerisourceBergen
is well positioned to benefit from this
organic growth in the pharmaceutical
supply channel in two ways: by delivering
pharmaceutical products and unique
services to the nation’s healthcare
providers, and by offering drug
manufacturers value added programs
and services to help them meet the
demands of the marketplace and preserve
the integrity of the pharmaceutical
supply channel. By leveraging our scale
and building upon the framework of our
essential role in the marketplace, we
are able to provide exceptional value to
our provider and manufacturer customers
as well as to our shareholders.
America’s healthcare providers
rely on AmerisourceBergen to deliver
pharmaceuticals and related products
on a just-in-time-basis and with nearly
100% order accuracy. In our business,
the standard is perfection. Whether
we are handling oral solid medications,
vaccines and other injectables, oncology
and other specialty drugs, or over the
counter products, our customers are
confident that the right product will
get to the right place at the right
time. AmerisourceBergen’s expertise
in handling the vast array of types
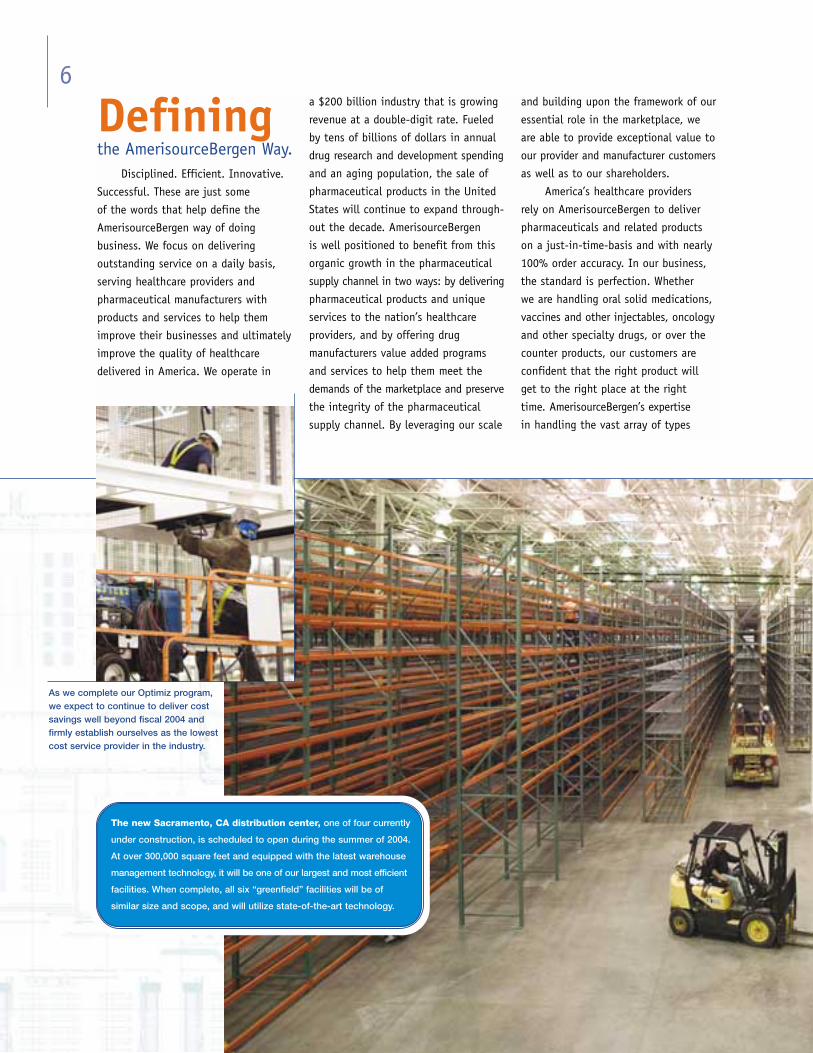
The new Sacramento, CA distribution center, one of four currently
under construction, is scheduled to open during the summer of 2004.
At over 300,000 square feet and equipped with the latest warehouse
management technology, it will be one of our largest and most efficient
facilities. When complete, all six “greenfield” facilities will be of
similar size and scope, and will utilize state-of-the-art technology.
As we complete our Optimiz program,we expect to continue to deliver costsavings well beyond fiscal 2004 andfirmly establish ourselves as the lowestcost service provider in the industry.
6
of pharmaceuticals available today is
unmatched in the industry. Our provider
customers include local retail pharmacies,
national and regional pharmacy chains,
regional food and drug store chains,
hospitals, long term care facilities,
clinics, physician offices, and prescription
mail order facilities. Our logistical
expertise in both traditional and
specialty product distribution and
in dispensing, combined with our
inventory management, reimbursement
consulting, packaging, pharmacy
automation, and other service offerings
make us a valuable partner in
providing healthcare today.
AmerisourceBergen is poised for
future growth through building the
“best in class” distribution network
and continuing to acquire and develop
“best in class” value added services to
our provider and manufacturer customers.
We continue to identify new market
opportunities across the pharmaceutical
supply channel, focusing on prospects
with attractive growth rates, EBIT
margins, return on committed capital
(ROCC), and a solid strategic fit with our
core business. The right services and
solutions include those that drive market
share, drive efficiency, and improve
patient care for our provider and manu-
facturer customers alike. We continue
to build our logistics and inventory
management capabilities and to create
innovative tools for preserving product
integrity. We recognize that healthcare
is delivered locally and healthcare capital
is precious, so we focus on open
architecture solutions that allow our
customers to preserve existing invest-
ments and allow us to have maximum
flexibility in meeting their needs.
AmerisourceBergen is investing in
the business for the long-term, utilizing
a strategy of disciplined execution that
rewards our customers, our associates,
and our shareholders. Our Optimiz
program is increasing the capacity of
our distribution network through facility
consolidations, new construction,
and expansions of existing facilities.
The Optimiz program also standardizes
and upgrades warehouse management
systems across the network, improving
warehouse productivity as much as 40
percent. Two years into the integration
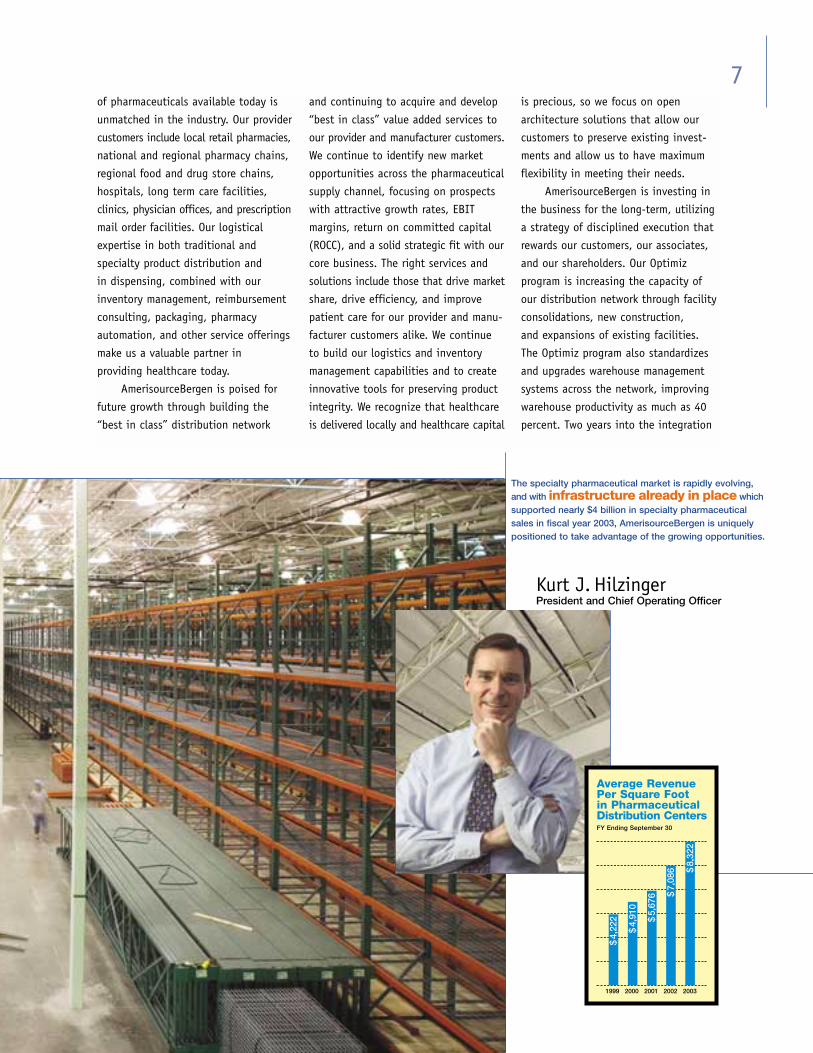
The specialty pharmaceutical market is rapidly evolving,and with infrastructure already in place whichsupported nearly $4 billion in specialty pharmaceuticalsales in fiscal year 2003, AmerisourceBergen is uniquelypositioned to take advantage of the growing opportunities.
7
Kurt J. HilzingerPresident and Chief Operating Officer
Average Revenue Per Square Foot in PharmaceuticalDistribution CentersFY Ending September 30
1999 2000 2001 2002 2003
$4,
910
$4,
222 $
5,67
6
$8,
322
$7,
086
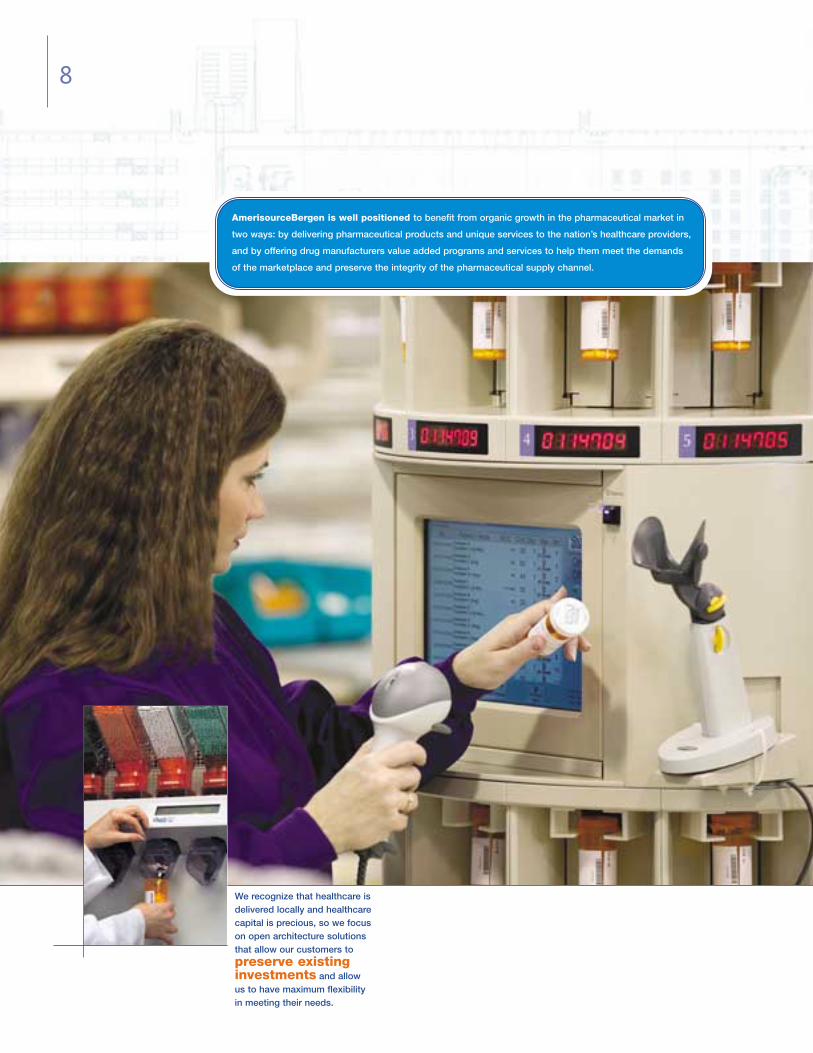
AmerisourceBergen is well positioned to benefit from organic growth in the pharmaceutical market in
two ways: by delivering pharmaceutical products and unique services to the nation’s healthcare providers,
and by offering drug manufacturers value added programs and services to help them meet the demands
of the marketplace and preserve the integrity of the pharmaceutical supply channel.
We recognize that healthcare isdelivered locally and healthcarecapital is precious, so we focuson open architecture solutionsthat allow our customers topreserve existinginvestments and allow us to have maximum flexibility in meeting their needs.
8
process, AmerisourceBergen remains on
schedule and on budget. We have already
captured substantial synergy savings
well ahead of schedule, and we will
continue to capture additional savings
as we work toward the completion of
the build out process in 2007.
DefiningValuethe AmerisourceBergen Way.
Most recently, AmerisourceBergen
has expanded its value added services
portfolio to include additional capabilities
that enable us to help our customers
improve the effectiveness and the
efficiency of their businesses. For
example, our pharmacy automation
unit, AutoMed, offers fully scalable
and integratable equipment designed
to help alleviate the three major issues
facing all pharmacies today: rising costs,
the shortage of pharmacists, and the
need to reduce medication errors.
AutoMed has products and work flow
solutions that can be applied to every
type of provider customer in our portfolio
of business to improve operating
efficiency, consumer satisfaction, and
safety. AutoMed’s automation equipment
is currently in use in the mail order
fulfillment centers of three of the four
largest pharmacy benefit managers, and
we’ve taken the expertise gleaned from
those installations and made it available
to the rest of our provider customer base.
For retail customers, introducing
effective automation into their stores
means that pharmacists can better
manage workload, leaving more time
for counseling patients and building
business. For institutional customers,
utilizing AutoMed’s barcode enabled
automation systems means that facilities
can accurately and cost effectively track
medications and the entire dispensing
process literally from the loading dock
to the patient’s bedside.
AmerisourceBergen’s Bridge Medical
bedside verification system completes
the process by tracking, on a patient-
by-patient basis, that the right drug
is given in the right dose at the right
time. Improved medication tracking
dramatically improves a facility’s
knowledge of its drug inventory,
and can streamline the patient billing
process, yielding cost savings and
greater operating efficiency. All of
our systems are designed in an open
architecture format to allow customers
to preserve existing capital investments
and seamlessly integrate with existing
systems. Our own Choice Systems® experts
facilitate the process of technology
installation and integration, a service
unmatched in the industry.
AmerisourceBergen has strengthened
its relationships with the leading
branded and generic pharmaceutical
manufacturers to not only provide
product distribution services, but to
also offer contract packaging, product
marketing assistance, and reimbursement
consulting. Our goal is to continue our
growth by offering additional services
in the supply channel to manufacturers
thereby enhancing our ability to add
value and to allow our manufacturer
customers to focus on their core
business of developing, manufacturing,
and marketing pharmaceuticals.
AmerisourceBergen’s Packaging Group
consists of American Health Packaging,
which focuses on packaging for
providers, and Anderson Packaging,
which is a leader in packaging for
manufacturers. Both operations include
FDA-compliant facilities and state-of-
the-art equipment and product safety
technology. The packaging group is a
leader in patient compliance packaging,
patient safety initiatives and developing
anti-counterfeiting technologies.
Packaging involves taking bulk shipments
of pharmaceuticals received directly
from the manufacturers and packaging
the medications into usable formats,
whether it be in bottles, unit dose form,
Scan-A-Dose form, foil packs, punch
cards, or packaged for commercial sale
or product sample distribution. In the
process, all packages are imprinted with
a bar code, which enables the medication
tracking capabilities of AutoMed, Bridge
Medical, and other barcode scanning
systems. In all, AmerisourceBergen’s
Packaging Group has over one million
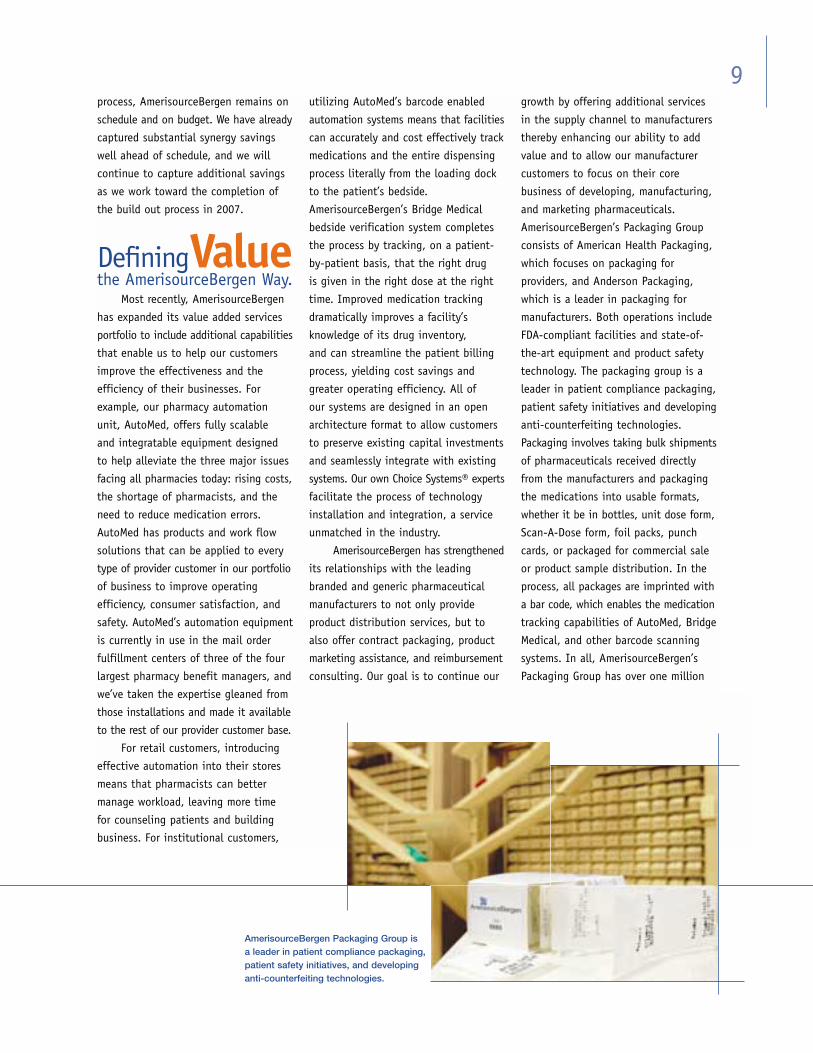
AmerisourceBergen Packaging Group is a leader in patient compliance packaging,patient safety initiatives, and developinganti-counterfeiting technologies.
9
square feet of capacity and over 75
packaging lines.
As more biotech and other specialty
products enter the marketplace,
AmerisourceBergen is also well positioned
to offer value added services to specialty
drug manufacturers and providers.
Specialty pharmaceuticals typically fit
the following profile: expensive products
geared towards a small patient population;
injectable products requiring special
handling and dosing; special adminis-
tration and patient support requirements;
and complex reimbursement procedures.
Specialty pharmaceutical products include
traditional pharmaceuticals requiring
special handling, biopharmaceuticals
such as those created using genetic
engineering, and therapeutic blood
plasma products.
AmerisourceBergen’s Specialty
Group business model begins with
identifying products with great potential,
preparing the market through practice
management, and expanding access
by developing a reimbursement model.
From that point, we focus on building
a distribution model that serves both
the provider and the patient, linking
distribution and reimbursement.
We promote both the patient access
and clinical sides of our model in the
marketplace, support patient monitoring,
and help providers to effectively manage
the patient experience. The specialty
pharmaceutical market is rapidly evolving,
and AmerisourceBergen is uniquely
positioned to take advantage of the
growing opportunities with a $4 billion
footprint already in place today.
Another growing segment of the
pharmaceutical marketplace in which
we operate is long term care (LTC)
pharmacy. AmerisourceBergen’s
PharMerica operations offer long term
care providers safe, cost-effective
distribution systems, medication
management services, and regulatory
compliance assistance. PharMerica also
offers manufacturers opportunities to
drive market share through participating
in our Senior Select Formulary®, as well
as valuable data which helps measure
product efficacy, utilization, and
compliance in the elderly population.
PharMerica offers institutional pharmacies
integrated medication management
systems capable of handling unit dose
distribution and intravenous infusion
systems, helping to improve safety and
reduce medication errors. Going forward,
PharMerica will take advantage of
opportunities to partner with other
AmerisourceBergen resources, such as
the Company’s comprehensive generic
drugs program, automation technology
from AutoMed, and/or packaging
solutions from AmerisourceBergen
Packaging Group to offer its customers
a comprehensive and customized
solution for their LTC pharmacy needs.
the Futurethe AmerisourceBergen Way.
AmerisourceBergen is committed
to improving healthcare in America by
delivering the best customer service in
the industry and continuing to quickly
adapt to the ever changing market.
These are exciting times in our industry,
and we remain confident that the
investments we have made in technology,
new facilities, new value added services
and the like will carry us forward well
into the future. We will continue to
adapt to the changing needs of our
customers, finding innovative ways
to be rewarded for exceptional service.
AmerisourceBergen is dedicated to
building on its success in the pharma-
ceutical supply channel and taking
advantage of the many opportunities
on the horizon to add value for our
customers and shareholders.
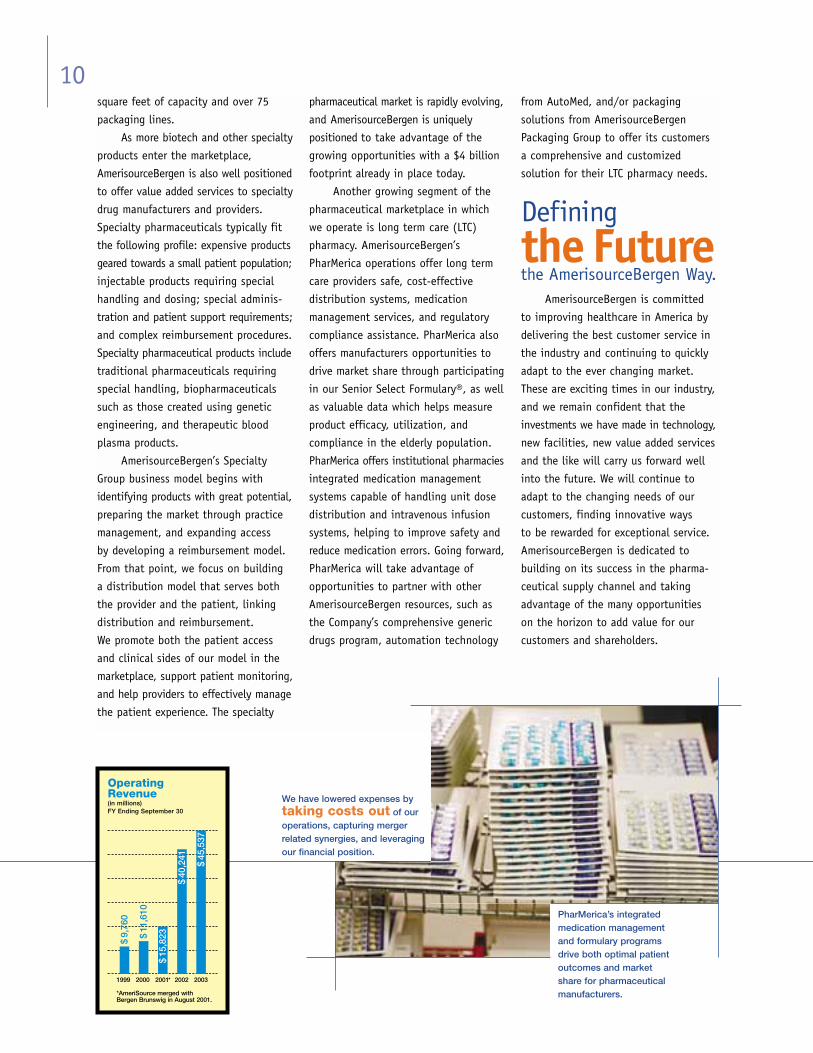
We have lowered expenses bytaking costs out of ouroperations, capturing merger related synergies, and leveragingour financial position.
PharMerica’s integratedmedication management and formulary programsdrive both optimal patientoutcomes and market share for pharmaceuticalmanufacturers.
10
Operating Revenue(in millions)FY Ending September 30
1999 2000 2001* 2002 2003
*AmeriSource merged with Bergen Brunswig in August 2001.
$11
,610
$9,
760
$15
,823
$45
,537
$40
,241
Defining
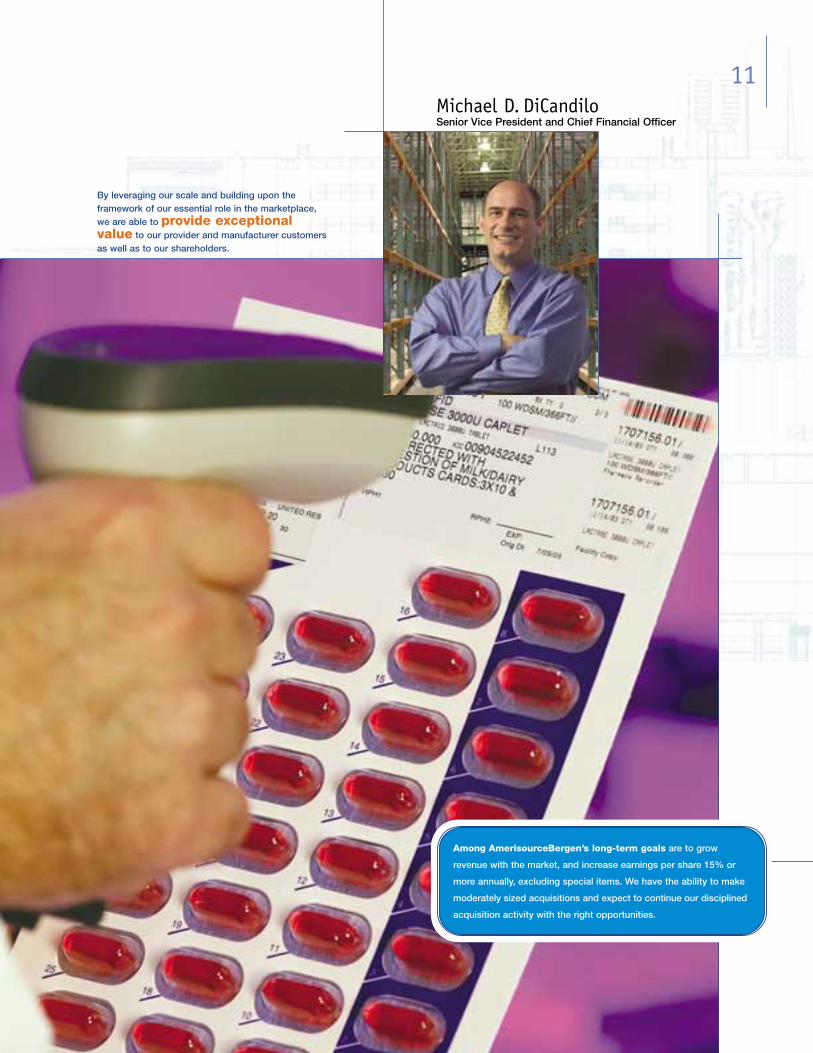
By leveraging our scale and building upon the framework of our essential role in the marketplace,we are able to provide exceptionalvalue to our provider and manufacturer customersas well as to our shareholders.
11Michael D. DiCandiloSenior Vice President and Chief Financial Officer
Among AmerisourceBergen’s long-term goals are to grow
revenue with the market, and increase earnings per share 15% or
more annually, excluding special items. We have the ability to make
moderately sized acquisitions and expect to continue our disciplined
acquisition activity with the right opportunities.
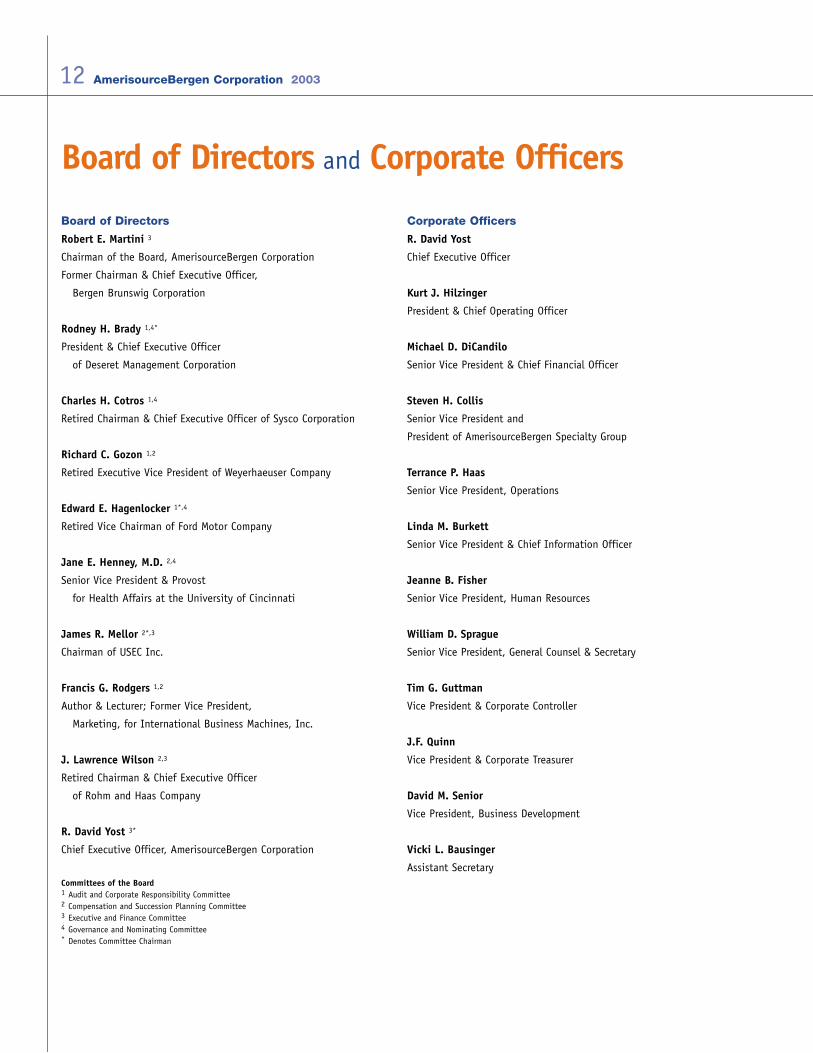
Board of Directors
Robert E. Martini 3
Chairman of the Board, AmerisourceBergen Corporation
Former Chairman & Chief Executive Officer,
Bergen Brunswig Corporation
Rodney H. Brady 1,4*
President & Chief Executive Officer
of Deseret Management Corporation
Charles H. Cotros 1,4
Retired Chairman & Chief Executive Officer of Sysco Corporation
Richard C. Gozon 1,2
Retired Executive Vice President of Weyerhaeuser Company
Edward E. Hagenlocker 1*,4
Retired Vice Chairman of Ford Motor Company
Jane E. Henney, M.D. 2,4
Senior Vice President & Provost
for Health Affairs at the University of Cincinnati
James R. Mellor 2*,3
Chairman of USEC Inc.
Francis G. Rodgers 1,2
Author & Lecturer; Former Vice President,
Marketing, for International Business Machines, Inc.
J. Lawrence Wilson 2,3
Retired Chairman & Chief Executive Officer
of Rohm and Haas Company
R. David Yost 3*
Chief Executive Officer, AmerisourceBergen Corporation
Committees of the Board1 Audit and Corporate Responsibility Committee2 Compensation and Succession Planning Committee3 Executive and Finance Committee4 Governance and Nominating Committee* Denotes Committee Chairman
Corporate Officers
R. David Yost
Chief Executive Officer
Kurt J. Hilzinger
President & Chief Operating Officer
Michael D. DiCandilo
Senior Vice President & Chief Financial Officer
Steven H. Collis
Senior Vice President and
President of AmerisourceBergen Specialty Group
Terrance P. Haas
Senior Vice President, Operations
Linda M. Burkett
Senior Vice President & Chief Information Officer
Jeanne B. Fisher
Senior Vice President, Human Resources
William D. Sprague
Senior Vice President, General Counsel & Secretary
Tim G. Guttman
Vice President & Corporate Controller
J.F. Quinn
Vice President & Corporate Treasurer
David M. Senior
Vice President, Business Development
Vicki L. Bausinger
Assistant Secretary
Board of Directors and Corporate Officers
12 AmerisourceBergen Corporation 2003
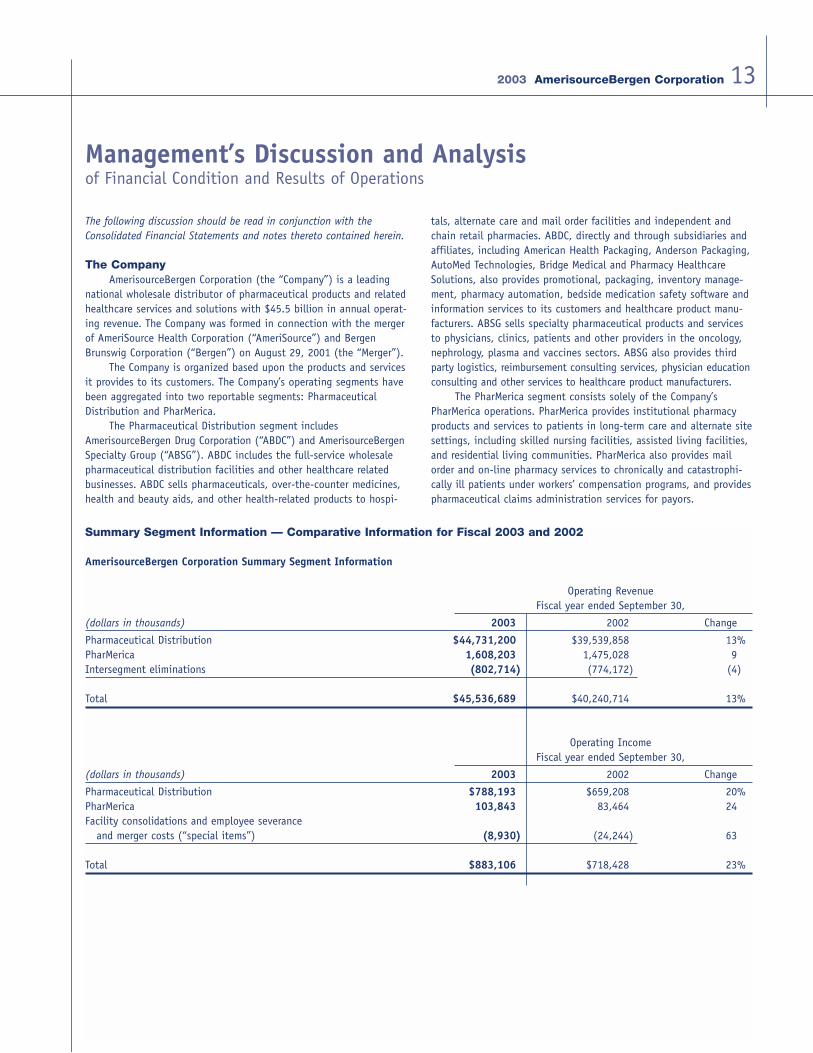
Summary Segment Information — Comparative Information for Fiscal 2003 and 2002
AmerisourceBergen Corporation Summary Segment Information
Operating RevenueFiscal year ended September 30,
(dollars in thousands) 2003 2002 Change
Pharmaceutical Distribution $44,731,200 $39,539,858 13%PharMerica 1,608,203 1,475,028 9Intersegment eliminations (802,714) (774,172) (4)
Total $45,536,689 $40,240,714 13%
Operating IncomeFiscal year ended September 30,
(dollars in thousands) 2003 2002 Change
Pharmaceutical Distribution $788,193 $659,208 20%PharMerica 103,843 83,464 24Facility consolidations and employee severance
and merger costs (“special items”) (8,930) (24,244) 63
Total $883,106 $718,428 23%
Management’s Discussion and Analysisof Financial Condition and Results of Operations
The following discussion should be read in conjunction with theConsolidated Financial Statements and notes thereto contained herein.
The CompanyAmerisourceBergen Corporation (the “Company”) is a leading
national wholesale distributor of pharmaceutical products and relatedhealthcare services and solutions with $45.5 billion in annual operat-ing revenue. The Company was formed in connection with the mergerof AmeriSource Health Corporation (“AmeriSource”) and BergenBrunswig Corporation (“Bergen”) on August 29, 2001 (the “Merger”).
The Company is organized based upon the products and servicesit provides to its customers. The Company’s operating segments havebeen aggregated into two reportable segments: PharmaceuticalDistribution and PharMerica.
The Pharmaceutical Distribution segment includesAmerisourceBergen Drug Corporation (“ABDC”) and AmerisourceBergenSpecialty Group (“ABSG”). ABDC includes the full-service wholesalepharmaceutical distribution facilities and other healthcare relatedbusinesses. ABDC sells pharmaceuticals, over-the-counter medicines,health and beauty aids, and other health-related products to hospi-
tals, alternate care and mail order facilities and independent andchain retail pharmacies. ABDC, directly and through subsidiaries andaffiliates, including American Health Packaging, Anderson Packaging,AutoMed Technologies, Bridge Medical and Pharmacy HealthcareSolutions, also provides promotional, packaging, inventory manage-ment, pharmacy automation, bedside medication safety software andinformation services to its customers and healthcare product manu-facturers. ABSG sells specialty pharmaceutical products and servicesto physicians, clinics, patients and other providers in the oncology,nephrology, plasma and vaccines sectors. ABSG also provides thirdparty logistics, reimbursement consulting services, physician educationconsulting and other services to healthcare product manufacturers.
The PharMerica segment consists solely of the Company’sPharMerica operations. PharMerica provides institutional pharmacyproducts and services to patients in long-term care and alternate sitesettings, including skilled nursing facilities, assisted living facilities,and residential living communities. PharMerica also provides mailorder and on-line pharmacy services to chronically and catastrophi-cally ill patients under workers’ compensation programs, and providespharmaceutical claims administration services for payors.
132003 AmerisourceBergen Corporation
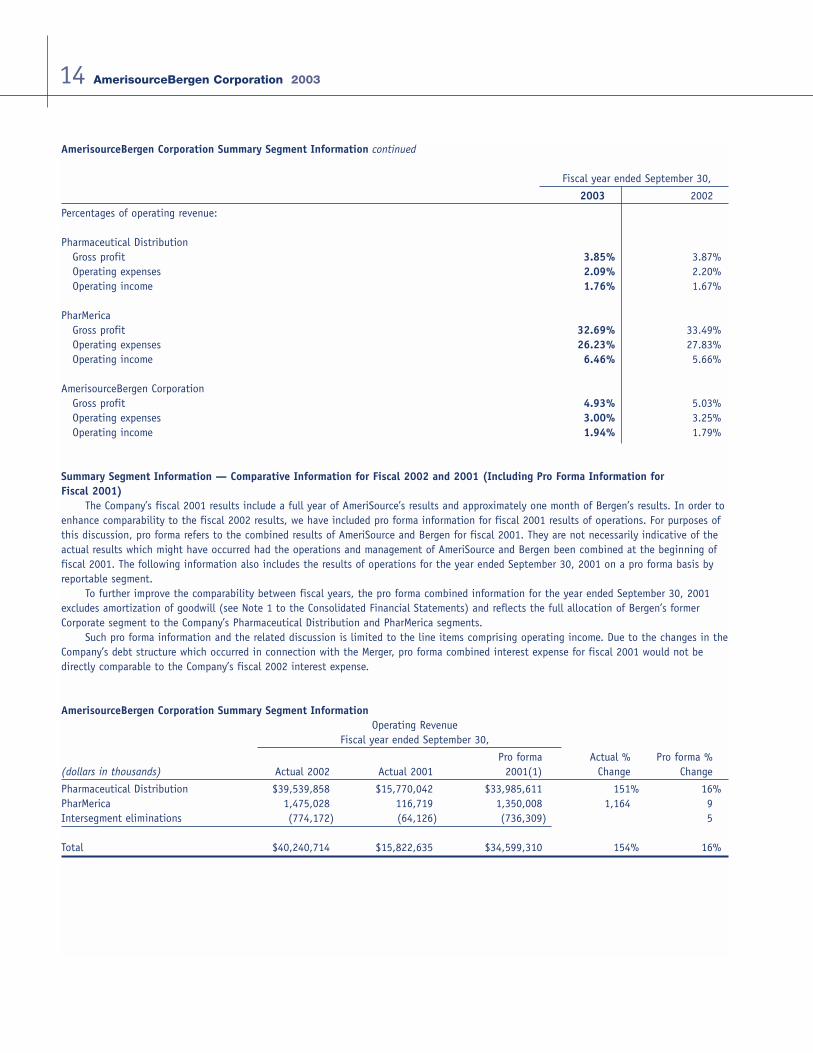
AmerisourceBergen Corporation Summary Segment Information continued
Fiscal year ended September 30,
2003 2002
Percentages of operating revenue:
Pharmaceutical DistributionGross profit 3.85% 3.87%Operating expenses 2.09% 2.20%Operating income 1.76% 1.67%
PharMericaGross profit 32.69% 33.49%Operating expenses 26.23% 27.83%Operating income 6.46% 5.66%
AmerisourceBergen CorporationGross profit 4.93% 5.03%Operating expenses 3.00% 3.25%Operating income 1.94% 1.79%
Summary Segment Information — Comparative Information for Fiscal 2002 and 2001 (Including Pro Forma Information for Fiscal 2001)
The Company’s fiscal 2001 results include a full year of AmeriSource’s results and approximately one month of Bergen’s results. In order toenhance comparability to the fiscal 2002 results, we have included pro forma information for fiscal 2001 results of operations. For purposes ofthis discussion, pro forma refers to the combined results of AmeriSource and Bergen for fiscal 2001. They are not necessarily indicative of theactual results which might have occurred had the operations and management of AmeriSource and Bergen been combined at the beginning offiscal 2001. The following information also includes the results of operations for the year ended September 30, 2001 on a pro forma basis byreportable segment.
To further improve the comparability between fiscal years, the pro forma combined information for the year ended September 30, 2001excludes amortization of goodwill (see Note 1 to the Consolidated Financial Statements) and reflects the full allocation of Bergen’s formerCorporate segment to the Company’s Pharmaceutical Distribution and PharMerica segments.
Such pro forma information and the related discussion is limited to the line items comprising operating income. Due to the changes in theCompany’s debt structure which occurred in connection with the Merger, pro forma combined interest expense for fiscal 2001 would not bedirectly comparable to the Company’s fiscal 2002 interest expense.
AmerisourceBergen Corporation Summary Segment InformationOperating Revenue
Fiscal year ended September 30,
Pro forma Actual % Pro forma %(dollars in thousands) Actual 2002 Actual 2001 2001(1) Change Change
Pharmaceutical Distribution $39,539,858 $15,770,042 $33,985,611 151% 16%PharMerica 1,475,028 116,719 1,350,008 1,164 9Intersegment eliminations (774,172) (64,126) (736,309) 5
Total $40,240,714 $15,822,635 $34,599,310 154% 16%
14 AmerisourceBergen Corporation 2003
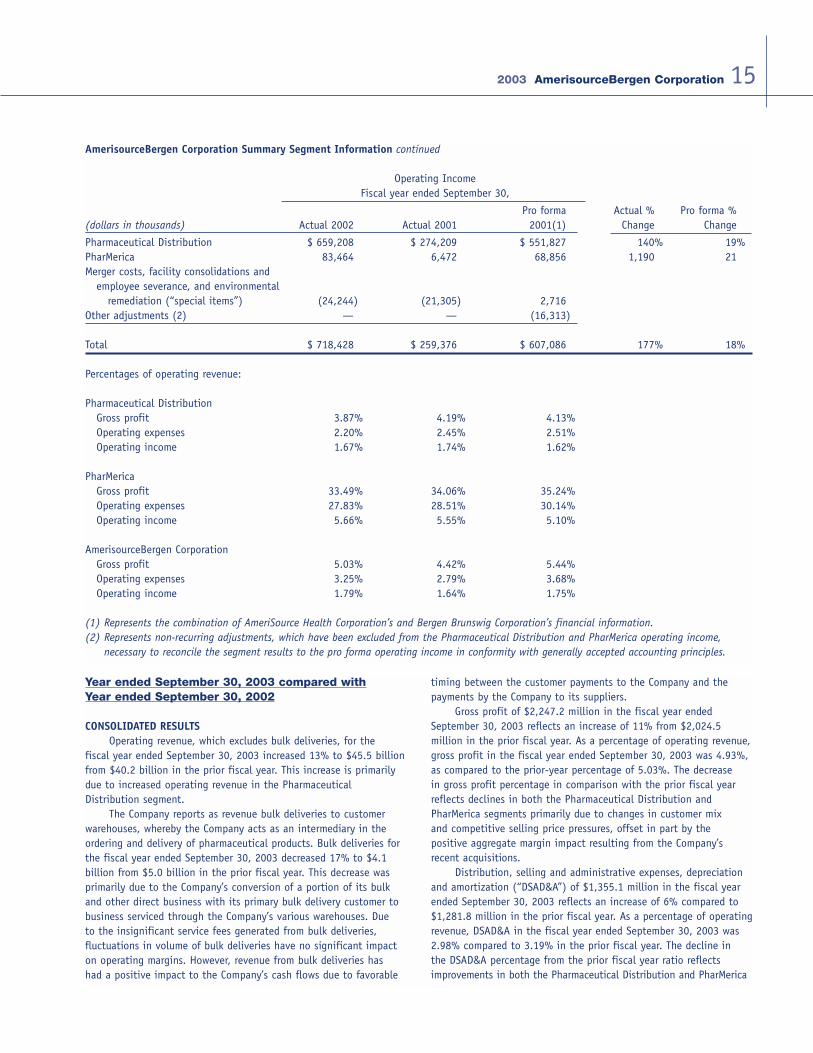
AmerisourceBergen Corporation Summary Segment Information continued
Operating IncomeFiscal year ended September 30,
Pro forma Actual % Pro forma %(dollars in thousands) Actual 2002 Actual 2001 2001(1) Change Change
Pharmaceutical Distribution $ 659,208 $ 274,209 $ 551,827 140% 19%PharMerica 83,464 6,472 68,856 1,190 21Merger costs, facility consolidations and
employee severance, and environmental remediation (“special items”) (24,244) (21,305) 2,716
Other adjustments (2) — — (16,313)
Total $ 718,428 $ 259,376 $ 607,086 177% 18%
Percentages of operating revenue:
Pharmaceutical DistributionGross profit 3.87% 4.19% 4.13%Operating expenses 2.20% 2.45% 2.51%Operating income 1.67% 1.74% 1.62%
PharMericaGross profit 33.49% 34.06% 35.24%Operating expenses 27.83% 28.51% 30.14%Operating income 5.66% 5.55% 5.10%
AmerisourceBergen CorporationGross profit 5.03% 4.42% 5.44%Operating expenses 3.25% 2.79% 3.68%Operating income 1.79% 1.64% 1.75%
(1) Represents the combination of AmeriSource Health Corporation’s and Bergen Brunswig Corporation’s financial information.(2) Represents non-recurring adjustments, which have been excluded from the Pharmaceutical Distribution and PharMerica operating income,
necessary to reconcile the segment results to the pro forma operating income in conformity with generally accepted accounting principles.
152003 AmerisourceBergen Corporation
Year ended September 30, 2003 compared withYear ended September 30, 2002
CONSOLIDATED RESULTSOperating revenue, which excludes bulk deliveries, for the
fiscal year ended September 30, 2003 increased 13% to $45.5 billionfrom $40.2 billion in the prior fiscal year. This increase is primarilydue to increased operating revenue in the PharmaceuticalDistribution segment.
The Company reports as revenue bulk deliveries to customerwarehouses, whereby the Company acts as an intermediary in theordering and delivery of pharmaceutical products. Bulk deliveries forthe fiscal year ended September 30, 2003 decreased 17% to $4.1 billion from $5.0 billion in the prior fiscal year. This decrease wasprimarily due to the Company’s conversion of a portion of its bulkand other direct business with its primary bulk delivery customer tobusiness serviced through the Company’s various warehouses. Due to the insignificant service fees generated from bulk deliveries, fluctuations in volume of bulk deliveries have no significant impacton operating margins. However, revenue from bulk deliveries has had a positive impact to the Company’s cash flows due to favorable
timing between the customer payments to the Company and the payments by the Company to its suppliers.
Gross profit of $2,247.2 million in the fiscal year endedSeptember 30, 2003 reflects an increase of 11% from $2,024.5 million in the prior fiscal year. As a percentage of operating revenue,gross profit in the fiscal year ended September 30, 2003 was 4.93%,as compared to the prior-year percentage of 5.03%. The decrease in gross profit percentage in comparison with the prior fiscal yearreflects declines in both the Pharmaceutical Distribution andPharMerica segments primarily due to changes in customer mix and competitive selling price pressures, offset in part by the positive aggregate margin impact resulting from the Company’srecent acquisitions.
Distribution, selling and administrative expenses, depreciationand amortization (“DSAD&A”) of $1,355.1 million in the fiscal yearended September 30, 2003 reflects an increase of 6% compared to$1,281.8 million in the prior fiscal year. As a percentage of operatingrevenue, DSAD&A in the fiscal year ended September 30, 2003 was2.98% compared to 3.19% in the prior fiscal year. The decline in the DSAD&A percentage from the prior fiscal year ratio reflectsimprovements in both the Pharmaceutical Distribution and PharMerica
segments due to customer mix changes, operational efficiencies andcontinued benefits from the merger integration effort.
In connection with the Merger, the Company developed integration plans to consolidate its distribution network and eliminate duplicate administrative functions, which are expected toresult in synergies of approximately $150 million annually by the endof fiscal 2004. The Company’s plan is to have a distribution facilitynetwork consisting of 30 facilities in the next three to four years.This will be accomplished by building six new facilities, expandingseven facilities, and closing 27 facilities. During fiscal 2003, theCompany began construction activities on three of its new facilitiesand completed two of the seven facility expansions. During fiscal2003 and 2002, the Company closed six and seven distribution facilities, respectively. The Company anticipates closing three additional facilities in fiscal 2004.
In September 2001, the Company announced plans to closeseven distribution facilities in fiscal 2002, consisting of six formerAmeriSource facilities and one former Bergen facility. A charge of$10.9 million was recognized in the fourth quarter of fiscal 2001related to the AmeriSource facilities, and included $6.2 million ofseverance for approximately 260 warehouse and administrative personnel to be terminated, $2.3 million in lease and contract cancellations, and $2.4 million for the write-down of assets relatedto the facilities to be closed. Approximately $0.2 million of costsrelated to the Bergen facility were included in the Merger purchaseprice allocation. During the fiscal year ended September 30, 2003,severance accruals of $1.8 million recorded in September 2001 werereversed into income because certain employees who were expectedto be severed either voluntarily left the Company or were retained inother positions within the Company.
During the fiscal year ended September 30, 2002, the Companyannounced further integration initiatives relating to the closure ofBergen’s repackaging facility and the elimination of certain Bergenadministrative functions, including the closure of a related officefacility. The cost of these initiatives of approximately $19.2 million,which included $15.8 million of severance for approximately 310employees to be terminated, $1.6 million for lease cancellationcosts, and $1.8 million for the write-down of assets related to thefacilities to be closed, resulted in additional goodwill being recordedduring fiscal 2002. At September 30, 2003, substantially all of the310 employees have been terminated.
Since September 2002, the Company has announced plans toclose six distribution facilities in fiscal 2003 and eliminate certainadministrative and operational functions (“the fiscal 2003 initia-tives”). As of September 30, 2003, the six facilities were closed.During the fiscal year ended September 30, 2003, the Companyrecorded severance costs of $10.3 million and lease cancellationcosts of $1.1 million relating to the fiscal 2003 initiatives. Employeeseverance and lease cancellation costs related to the fiscal 2003 initiatives have been recognized in accordance with the provisions of Statement of Financial Accounting Standards (“SFAS”) No. 146,“Accounting for Costs Associated with Exit or Disposal Activities.”Employee severance costs are generally expensed during the employ-ee service period and lease cancellation and other costs are generallyexpensed when the Company becomes contractually bound to paysuch costs. In the future, the Company expects to incur an additional$1.0 million of employee severance costs relating to the fiscal 2003
initiatives. As of September 30, 2003, approximately 520 employeeshad been provided termination notices as a result of the fiscal 2003initiatives, of which 490 were terminated. Additional amounts forintegration initiatives will be recognized in subsequent periods asfacilities to be consolidated are identified and specific plans areapproved and announced.
The Company paid a total of $13.8 million and $15.6 million foremployee severance and lease and contract cancellation costs in thefiscal years ended September 30, 2003 and 2002, respectively, related to the aforementioned integration plans. Remaining unpaidamounts of $5.0 million for employee severance and lease cancella-tion costs are included in accrued expenses and other in the accompanying consolidated balance sheet at September 30, 2003.Most employees receive their severance benefits over a period oftime, generally not to exceed 12 months, while others may receive a lump-sum payment.
During the fiscal year ended September 30, 2002, the Companyexpensed approximately $24.2 million of merger costs, primarilyrelated to integrating the operations of AmeriSource and Bergen.Such costs were comprised primarily of consulting fees, whichamounted to $16.6 million. The merger costs also included a $2.1million adjustment to the Company’s fourth quarter 2001 charge of$6.5 million relating to the accelerated vesting of AmeriSource stockoptions. Effective October 1, 2002, the Company converted its merger integration office to an operations management office.Accordingly, the costs of the operations management office areincluded within distribution, selling and administrative expenses inthe Company’s consolidated statements of operations.
Operating income of $883.1 million for the fiscal year endedSeptember 30, 2003 reflects an increase of 23% from $718.4 millionin the prior fiscal year. Special items reduced the Company’s operat-ing income by $8.9 million in the fiscal year ended September 30,2003 and by $24.2 million in the prior fiscal year. The Company’soperating income as a percentage of operating revenue was 1.94% inthe fiscal year ended September 30, 2003 compared to 1.79% in theprior fiscal year. The improvement was primarily due to the loweramount of special items and the aforementioned DSAD&A expensepercentage reduction.
The Company recorded equity in losses of affiliates and other of $8.0 million and $5.6 million during the fiscal years endedSeptember 30, 2003 and 2002, respectively. These amounts primarily consisted of impairment charges relating to investments in technology companies.
During the fiscal year ended September 30, 2003, the Companyrecorded a $4.2 million loss resulting from the early retirement ofdebt (see Note 5 of “Notes to Consolidated Financial Statements”).
Interest expense increased 3% in the fiscal year endedSeptember 30, 2003 to $144.7 million from $140.7 million in theprior fiscal year. Average borrowings, net of invested cash, under theCompany’s debt facilities during the fiscal year ended September 30,2003 were $2.3 billion as compared to average borrowings, net of invested cash, of $2.0 billion in the prior fiscal year. Average borrowing rates under the Company’s debt facilities decreased to5.6% in the current fiscal year from 6.1% in the prior fiscal year. Theincrease in average borrowings, net of invested cash, was primarily a result of additional merchandise inventories on hand during thecurrent fiscal year compared to the prior fiscal year. The decrease in
16 AmerisourceBergen Corporation 2003
average borrowing rates resulted from lower percentages of fixed-ratedebt outstanding to total debt outstanding in the current fiscal yearcompared to the prior fiscal year, as well as lower market interestrates on variable-rate debt.
Income tax expense of $284.9 million in the fiscal year endedSeptember 30, 2003 reflects an effective tax rate of 39.2%, versus39.7% in the prior fiscal year. The Company has been able to lowerits effective tax rate during the current fiscal year by implementingtax planning strategies.
Net income of $441.2 million for the fiscal year endedSeptember 30, 2003 reflects an increase of 28% from $344.9 millionin the prior fiscal year. Diluted earnings per share of $3.89 in thefiscal year ended September 30, 2003 reflects a 23% increase ascompared to $3.16 per share in the prior fiscal year. Special itemsand the loss on early retirement of debt had the effect of decreasingnet income by $8.0 million and reducing diluted earnings per shareby $0.07 for the fiscal year ended September 30, 2003. Special items had the effect of decreasing net income by $14.6 million and reducing diluted earnings per share by $0.13 for the fiscal yearended September 30, 2002. The growth in earnings per share wassmaller than the growth in net income for the fiscal year endedSeptember 30, 2003 due to the issuance of Company common stockin connection with the acquisitions described in Note 2 to theCompany’s consolidated financial statements and in connection with the exercise of stock options.
SEGMENT INFORMATION
Pharmaceutical Distribution SegmentPharmaceutical Distribution operating revenue of $44.7 billion
for the fiscal year ended September 30, 2003 reflects an increase of13% from $39.5 billion in the prior fiscal year. The Company’s recentacquisitions contributed less than 0.5% of the segment’s operatingrevenue growth for the fiscal year ended September 30, 2003. Duringthe fiscal year ended September 30, 2003, 56% of operating revenuewas from sales to institutional customers and 44% was from retailcustomers; this compares to a customer mix in the prior fiscal yearof 53% institutional and 47% retail. In comparison with the prior-year results, sales to institutional customers increased 20% primarilydue to (i) the previously mentioned conversion of bulk delivery andother direct business with the Company’s primary bulk delivery customer to business serviced through the Company’s various warehouses, which contributed 4% of the total operating revenuegrowth; (ii) above market rate growth of the ABSG specialty pharma-ceutical business; and (iii) higher revenues from customers engagedin the mail order sale of pharmaceuticals. Sales to retail customersincreased by 5% in comparison to the prior fiscal year. The growthrate of sales to retail customers has declined during fiscal 2003 compared to the fiscal 2002 growth primarily due to lower growthtrends in the retail market and the below market growth of certain of the Company’s large regional chain customers. Additionally, retailsales in the second-half of fiscal 2003 were adversely impacted bythe loss of a large customer. This segment’s growth largely reflectsU.S. pharmaceutical industry conditions, including increases in prescription drug utilization and higher pharmaceutical prices offset,in part, by the increased use of lower priced generics. The segment’sgrowth has also been impacted by industry competition and changes
in customer mix. Industry growth rates, as estimated by industrydata firm IMS Healthcare, Inc., are expected to be between 10% and13% over the next four years. Future operating revenue growth willcontinue to be driven by industry growth trends, competition withinthe industry and customer consolidation.
Pharmaceutical Distribution gross profit of $1,721.5 million inthe fiscal year ended September 30, 2003 reflects an increase of 12%from $1,530.5 million in the prior fiscal year. As a percentage ofoperating revenue, gross profit in the fiscal year ended September30, 2003 was 3.85%, as compared to 3.87% in the prior fiscal year.The slight decline in gross profit as a percentage of operating revenue was the net result of the negative impact of a change incustomer mix to a higher percentage of large institutional, mail order and chain accounts, and the continuing competitive pricingenvironment, offset primarily by the positive aggregate impact ofrecently-acquired companies, which amounted to 15 basis points inthe fiscal year ended September 30, 2003. Downward pressures onsell-side gross profit margin are expected to continue and there canbe no assurance that the inclusion of additional businesses that generate higher margins or that increases in the buy-side componentof the gross margin, including increases derived from manufacturerprice increases, negotiated deals and secondary market opportunities,will be available in the future to fully or partially offset the antici-pated decline of the sell-side margin. The Company expects that buy-side opportunities may decrease in the future as pharmaceuticalmanufacturers increasingly seek to control the supply channelthrough product allocations that limit the inventory the Companycan purchase and through the imposition of inventory managementand other agreements that prohibit or severely restrict the Company’sright to purchase inventory from secondary source suppliers.Although the Company seeks in any such agreements to obtainappropriate compensation from pharmaceutical manufacturers forforegoing buy-side opportunities, there can be no assurance that theagreements will function as intended and replace any or all lost profitopportunities. The Company’s cost of goods sold includes a last-in,first-out (“LIFO”) provision that is affected by changes in inventoryquantities, product mix, and manufacturer pricing practices, whichmay be impacted by market and other external influences.
Pharmaceutical Distribution operating expenses of $933.3 million in the fiscal year ended September 30, 2003 reflects anincrease of 7% from $871.3 million in the prior fiscal year. As a percentage of operating revenue, operating expenses in the fiscalyear ended September 30, 2003 were 2.09%, as compared to 2.20%in the prior fiscal year. The decrease in the expense percentagereflects the changing customer mix described above, efficiencies of scale, the elimination of redundant costs through the merger integration process, the continued emphasis on productivity through-out the Company’s distribution network and a reduction of bad debtexpense, offset, in part, by higher expense ratios associated with theCompany’s recent acquisitions.
Pharmaceutical Distribution operating income of $788.2 millionin the fiscal year ended September 30, 2003 reflects an increase of20% from $659.2 million in the prior fiscal year. As a percentage ofoperating revenue, operating income in the fiscal year endedSeptember 30, 2003 was 1.76%, as compared to 1.67% in the priorfiscal year. The improvement over the prior-year percentage was dueto a reduction in the operating expense ratio in excess of the decline
172003 AmerisourceBergen Corporation
in gross margin, which was partially the result of the Company’s ability to capture synergy cost savings from the Merger. While management historically has been able to lower expense ratios and expects to continue to do so, there can be no assurance thatreductions will occur in the future, or that expense ratio reductionswill exceed possible declines in gross margins. Additionally, there canbe no assurance that merger integration efforts will proceed asplanned or result in the desired cost savings.
PharMerica SegmentPharMerica’s operating revenue increased 9% for the fiscal
year ended September 30, 2003 to $1,608.2 million compared to$1,475.0 million in the prior fiscal year. This increase is principallyattributable to the growth in PharMerica’s workers’ compensationbusiness, which has grown at a faster rate than its long-term carebusiness. During the second-half of fiscal 2003, the growth rate ofthe workers’ compensation business began to slow down, partiallydue to the loss of a significant customer. The slow down in the workers’ compensation business is expected to continue in fiscal2004 and as a result, the operating revenue growth rate in fiscal2004 for the PharMerica segment is expected to be in the mid-singledigits. The future operating revenue growth rate will be impacted bycompetitive pressures, changes in the regulatory environment andthe pharmaceutical inflation rate.
PharMerica’s gross profit of $525.6 million for the fiscal yearended September 30, 2003 increased 6% from gross profit of $494.0million in the prior fiscal year. PharMerica’s gross profit margindeclined slightly to 32.69% for the fiscal year ended September 30,2003 from 33.49% in the prior fiscal year. This decrease is primarilythe result of a change in the sales mix, with a greater proportion of PharMerica’s current year revenues coming from its workers’ compensation business, which has lower gross profit margins andlower operating expenses than its long-term care business. In addition, industry competitive pressures continue to adversely affect gross profit margins.
PharMerica’s operating expenses of $421.8 million for the fiscalyear ended September 30, 2003 increased from $410.5 million in theprior fiscal year. As a percentage of operating revenue, operatingexpenses were reduced to 26.23% in the fiscal year ended September30, 2003 from 27.83% in the prior fiscal year. The percentage reduc-tion was primarily due to the continued improvements in operatingpractices, the aforementioned shift in customer mix towards theworkers’ compensation business and a reduction in bad debt expense.
PharMerica’s operating income of $103.8 million for the fiscalyear ended September 30, 2003 increased by 24% from $83.5 millionin the prior fiscal year. As a percentage of operating revenue, operatingincome in the fiscal year ended September 30, 2003 was 6.46%, ascompared to 5.66% in the prior fiscal year. The improvement was due to the aforementioned reduction in the operating expense ratio,which was greater than the reduction in gross profit margin. Whilemanagement historically has been able to lower expense ratios andexpects to continue to do so, there can be no assurance that reductions will occur in the future, or that expense ratio reductionswill exceed possible further declines in gross margins.
Intersegment EliminationsThese amounts represent the elimination of the Pharmaceutical
Distribution segment’s sales to PharMerica. AmerisourceBergen DrugCompany is the principal supplier of pharmaceuticals to PharMerica.
Year ended September 30, 2002 compared withYear ended September 30, 2001
CONSOLIDATED RESULTSOperating revenue, which excludes bulk deliveries, for the fiscal
year ended September 30, 2002 increased 154% to $40.2 billionfrom $15.8 billion in the prior fiscal year. This increase is primarilydue to increased operating revenue in the PharmaceuticalDistribution segment as a result of the Merger. Operating revenueincreased 16% from $34.6 billion in the prior fiscal year on a proforma combined basis. This increase is primarily due to the 16%increase in the Pharmaceutical Distribution segment.
The Company reports as revenue bulk deliveries to customerwarehouses, whereby the Company acts as an intermediary in theordering and delivery of pharmaceutical products. As a result of theMerger, bulk deliveries increased to $5.0 billion in the fiscal yearended September 30, 2002 compared to $368.7 million in the priorfiscal year. Revenue from bulk deliveries increased 10% from $4.5billion in the prior fiscal year on a pro forma combined basis. Due tothe insignificant service fees generated from these bulk deliveries,fluctuations in volume have no significant impact on operating margins. However, revenue from bulk deliveries has a positive impactto the Company’s cash flows due to favorable timing between thecustomer payments to us and the payments by us to our suppliers.
Gross profit of $2,024.5 million in the fiscal year endedSeptember 30, 2002 reflects an increase of 189% from $700.1 million in the prior fiscal year on a historical basis and an increaseof 8% from $1,880.7 million in the prior fiscal year on a pro formacombined basis. As a percentage of operating revenue, gross profit inthe fiscal year ended September 30, 2002 was 5.03%, as comparedto prior-year percentages of 4.42% on a historical basis and 5.44%on a pro forma combined basis. The increase in the gross profit percentage from prior fiscal year historical results was primarily dueto the inclusion of PharMerica in the current year. PharMerica, due tothe nature of its prescription fulfillment business, has significantlyhigher gross margins and operating expense ratios than theCompany’s Pharmaceutical Distribution segment. The decrease ingross profit percentage in comparison with the prior fiscal year pro forma combined percentage reflects declines in both thePharmaceutical Distribution and PharMerica segments due to changes in customer mix and competitive selling price pressures.
Distribution, selling and administrative expenses, depreciationand amortization (“DSAD&A”) of $1,281.8 million in the fiscal yearended September 30, 2002 reflects an increase of 206% compared to$419.4 million in the prior fiscal year on a historical basis and anincrease of less than 1% compared to $1,276.4 million in the priorfiscal year on a pro forma combined basis. As a percentage of operating revenue, DSAD&A in the fiscal year ended September 30,2002 was 3.19%, as compared to prior fiscal year percentages of2.65% on a historical basis and 3.69% on a pro forma combined
18 AmerisourceBergen Corporation 2003
basis. The increases in the DSAD&A percentage from the prior fiscalyear historical results were primarily due to the inclusion ofPharMerica in the current year, as explained above. The decrease inthe DSAD&A percentage from the prior fiscal year pro forma combinedratio reflects improvements in both the Pharmaceutical Distributionand PharMerica segments due to customer mix changes, operationalefficiencies and benefits from the merger integration effort.
In connection with the Merger, the Company developed integration plans to consolidate its distribution network and eliminate duplicate administrative functions, which are expected toresult in synergies of approximately $150 million annually by the endof fiscal 2004. The Company’s plan is to have a distribution facilitynetwork consisting of 30 facilities in the next three to four years.This will be accomplished by building six new facilities, expandingseven facilities, and closing 27 facilities. During 2002, the Companyclosed seven distribution facilities.
In September 2001, the Company announced plans to closeseven distribution facilities in fiscal 2002, consisting of six formerAmeriSource facilities and one former Bergen facility. A charge of$10.9 million was recognized in the fourth quarter of fiscal 2001related to the AmeriSource facilities, and included $6.2 million ofseverance for approximately 260 warehouse and administrative personnel to be terminated, $2.3 million in lease and contract cancellations, and $2.4 million for the write-down of assets relatedto the facilities to be closed. Approximately $0.2 million of costsrelated to the Bergen facility were included in the Merger purchaseprice allocation.
During the fiscal year ended September 30, 2002, the Companyannounced further integration initiatives relating to the closure ofBergen’s repackaging facility and the elimination of certain Bergenadministrative functions, including the closure of a related officefacility. The cost of these initiatives of approximately $19.2 million,which included $15.8 million of severance for approximately 310employees to be terminated, $1.6 million for lease cancellationcosts, and $1.8 million for the write-down of assets related to thefacilities to be closed, resulted in additional goodwill being recordedduring fiscal 2002.
In connection with the Merger, the Company expensed mergercosts in the fiscal year ended September 30, 2002 of $24.2 million,consisting primarily of integration consulting fees of $16.6 million.The merger costs also included a $2.1 million increase to theCompany’s fourth quarter fiscal 2001 charge of $6.5 million relatingto the accelerated vesting of AmeriSource stock options. Total mergercosts in fiscal 2001 amounted to $13.1 million, primarily consistingof consulting fees and the accelerated stock option vesting charge.
Operating income of $718.4 million for the fiscal year endedSeptember 30, 2002 reflects an increase of 177% from $259.4 millionin the prior fiscal year. Special items had the effect of reducing theCompany’s operating income in the fiscal year ended September 30,2002 and 2001 by $24.2 million and $21.3 million, respectively. The Company’s operating income as a percentage of operating revenue was 1.79% in the fiscal year ended September 30, 2002, ascompared to prior-year percentages of 1.64% on a historical basisand 1.75% on a pro forma combined basis. The improvements aredue to the aforementioned DSAD&A expense percentage reductionsmore than offsetting the reductions in gross margin.
Equity in losses of affiliates and other was $5.6 million and$10.9 million in fiscal 2002 and fiscal 2001, respectively. The fiscal2002 amount principally reflects an impairment of the Company’sinvestment in a healthcare technology company. The majority of the fiscal 2001 amount represents the impact of the Company’sinvestment in Health Nexus, LLC, which was accounted for on theequity method. The Company’s percentage ownership in the successorto Health Nexus, LLC fell below 20% in November 2001, and thisinvestment is now accounted for using the cost method.
Interest expense, which includes the distributions on preferredsecurities of a subsidiary trust, increased 194% in the fiscal yearended September 30, 2002 to $140.7 million compared to $47.9 million in the prior fiscal year, primarily as a result of the Merger.Average borrowings, net of invested cash, under the Company’s debtfacilities during the fiscal year ended September 30, 2002 were $2.0billion as compared to average borrowings, net of invested cash, of$696 million in the prior fiscal year. Average borrowing rates underthe Company’s variable-rate debt facilities decreased to 3.5% in thecurrent fiscal year from 6.2% in the prior fiscal year, due to lowermarket interest rates.
Income tax expense of $227.1 million in the fiscal year endedSeptember 30, 2002 reflects an effective tax rate of 39.7% versus38.3% in the prior fiscal year. The tax rate for fiscal 2002 was higherthan the prior fiscal year’s tax rate as a result of the Merger.
Net income of $344.9 million for the fiscal year endedSeptember 30, 2002 reflects an increase of 179% from $123.8 million in the prior fiscal year. Diluted earnings per share of $3.16 inthe fiscal year ended September 30, 2002 reflects a 50% increase ascompared to $2.10 per share in the prior fiscal year. Special itemshad the effect of reducing net income and diluted earnings per sharefor the fiscal year ended September 30, 2002 by $14.6 million and$0.13, respectively, and for the fiscal year ended September 30,2001 by $13.1 million and $0.21, respectively. Diluted earnings per share for the fiscal year ended September 30, 2002 reflects the full-year impact of the shares issued to effect the Merger.
SEGMENT INFORMATION
Pharmaceutical Distribution SegmentPharmaceutical Distribution operating revenue of $39.5 billion
for the fiscal year ended September 30, 2002 increased 151% from$15.8 billion in the prior fiscal year on a historical basis andincreased 16% from $34.0 billion in the prior fiscal year on a proforma combined basis. During the fiscal year ended September 30,2002, 53% of operating revenue was from sales to institutional customers and 47% was from retail customers; this compares to acustomer mix in the prior fiscal year of 53% institutional and 47%retail on a historical basis and 52% institutional and 48% retail on a pro forma combined basis. In comparison with prior fiscal year proforma combined results, sales to institutional customers increased by 19% primarily due to higher revenues from mail order facilities,ABSG’s specialty pharmaceutical business and alternate site facilities.Sales to retail customers increased 14% over the prior fiscal year ona pro forma combined basis, principally due to higher revenues fromregional drug store chains, including the pharmacy departments ofsupermarkets. This segment’s growth largely reflects national industry
192003 AmerisourceBergen Corporation
economic conditions, including increases in prescription drug usageand higher pharmaceutical prices. Operating revenue increased 18%in the first half of the year and 14% in the second half of the yearwhen compared to the same periods in the prior year on a pro formacombined basis as the Company reached the April 2002 anniversarydate of the addition of a large mail order customer.
Pharmaceutical Distribution gross profit of $1,530.5 million inthe fiscal year ended September 30, 2002 increased 132% from$660.4 million in the prior fiscal year on a historical basis andincreased 9% from $1,405.0 million in the prior fiscal year on a proforma combined basis. As a percentage of operating revenue, grossprofit in the fiscal year ended September 30, 2002 was 3.87%, ascompared to prior fiscal year percentages of 4.19% on a historicalbasis and 4.13% on a pro forma combined basis. The year-to-yeardeclines reflect the net impact of a number of factors, including thechange in customer mix to a higher percentage of large institutional,mail order and chain accounts, and the continuing competitive pricing environment, offset, in part, by higher buy-side margins than in the prior year.
Pharmaceutical Distribution operating expenses of $871.3 million in the fiscal year ended September 30, 2002 increased 126%from $386.2 million in the prior fiscal year on a historical basis andincreased 2% from $853.1 million in the prior fiscal year on a proforma combined basis. As a percentage of operating revenue, operating expenses in the fiscal year ended September 30, 2002 were 2.20%, as compared to prior-year percentages of 2.45% on ahistorical basis and 2.51% on a pro forma combined basis. Thesedecreases in expense percentages reflect the changing customer mix described above, efficiencies of scale, the elimination of redundant costs through the merger integration process and the continued emphasis on productivity throughout the Company’s distribution network.
Pharmaceutical Distribution operating income of $659.2 millionin the fiscal year ended September 30, 2002 increased 140% from$274.2 million in the prior fiscal year on a historical basis andincreased 19% from $551.8 million in the prior fiscal year on a pro forma combined basis. As a percentage of operating revenue,operating income was 1.67% in the fiscal year ended September 30,2002, as compared to prior-year percentages of 1.74% on a historicalbasis and 1.62% on a pro forma combined basis. The improvementover the prior-year pro forma combined percentage was due to areduction in the operating expense ratio, which was greater than thereduction in gross profit margin. The reduction of the operatingexpense ratio was partially due to the Company’s ability to capturesynergy cost savings from the Merger.
PharMerica SegmentThe PharMerica segment was acquired in connection with
the Merger and the historical amounts for the fiscal year endedSeptember 30, 2001 are comprised of only one month of PharMerica’soperating results. Accordingly, the discussion below focuses all comparisons with the prior-year on a pro forma combined basis.
PharMerica’s operating revenue increased 9% for the fiscal yearended September 30, 2002 to $1.48 billion compared to $1.35 billion in the prior fiscal year. This increase is principally attributableto growth in PharMerica’s workers’ compensation business, which has
grown at a faster rate than its long-term care business.PharMerica’s gross profit of $494.0 million for the fiscal year
ended September 30, 2002 increased 4% from gross profit of $475.8million in the prior fiscal year. PharMerica’s gross profit margindeclined to 33.49% for the fiscal year ended September 30, 2002from 35.24% in the prior fiscal year. This decrease is primarily theresult of a change in the sales mix, with a greater proportion of PharMerica’s current year revenues coming from its workers’ compensation business, which has lower gross profit margins and lower operating expenses than its long-term care business.
PharMerica’s operating expenses of $410.5 million for the fiscalyear ended September 30, 2002 increased 1% from operating expensesof $406.9 million in the prior fiscal year. As a percentage of operatingrevenue, operating expenses were reduced to 27.83% in the fiscal year ended September 30, 2002 from 30.14% in the prior fiscal year.The percentage reduction is due to several factors, including the aforementioned shift in customer mix towards the workers’ compensa-tion business, consolidation of technology platforms, the consolidationor sale of several pharmacies, and a reduction in bad debt expense.
PharMerica’s operating income of $83.5 million for the fiscalyear ended September 30, 2002 increased 21% compared to operatingincome of $68.9 million in the prior fiscal year. As a percentage ofoperating revenue, operating income was 5.66% in the fiscal yearended September 30, 2002, an increase of 56 basis points from5.10% in the prior fiscal year. The year-to-year improvement in the operating income percentage was due to the aforementionedreductions in the operating expense ratio, which were greater thanthe reductions in gross profit margin.
Intersegment EliminationsThese amounts represent the elimination of the Pharmaceutical
Distribution segment’s sales to PharMerica. AmerisourceBergen DrugCompany is the principal supplier of pharmaceuticals to PharMerica.
Critical Accounting PoliciesCritical accounting policies are those accounting policies that
can have a significant impact on the Company’s financial positionand results of operations that require the use of complex and subjective estimates based upon past experience and management’sjudgment. Because of the uncertainty inherent in such estimates,actual results may differ from these estimates. Below are those policies applied in preparing the Company’s financial statements thatmanagement believes are the most dependent on the application ofestimates and assumptions. For additional accounting policies, seeNote 1 of “Notes to Consolidated Financial Statements.”
Allowance for Doubtful AccountsTrade receivables are primarily comprised of amounts owed to
the Company through its pharmaceutical service activities and arepresented net of an allowance for doubtful accounts. In determiningthe appropriate allowance, the Company considers a combination offactors, such as industry trends, its customers’ financial strength andcredit standing, and payment and default history. The calculation ofthe required allowance requires a substantial amount of judgment asto the impact of these and other factors on the ultimate realizationof its trade receivables.
20 AmerisourceBergen Corporation 2003
Merchandise InventoriesInventories are stated at the lower of cost or market. Cost for
approximately 94% and 96% of the Company’s inventories atSeptember 30, 2003 and 2002, respectively, is determined using the last-in, first-out (LIFO) method. If the Company had used thefirst-in, first-out (FIFO) method of inventory valuation, whichapproximates current replacement cost, inventories would have beenapproximately $185.6 million and $152.3 million higher than theamounts reported at September 30, 2003 and 2002, respectively.
Goodwill and Intangible AssetsThe Company adopted Financial Accounting Standards Board
(“FASB”) SFAS No. 142 “Goodwill and Other Intangible Assets” as ofOctober 1, 2001. Under SFAS No. 142, goodwill and intangible assetswith indefinite lives are not amortized; rather, they are tested forimpairment on at least an annual basis. Accordingly, the Companyceased amortization of all goodwill and intangible assets with indefinite lives as of October 1, 2001. Intangible assets with finitelives, primarily customer lists, non-compete agreements and softwaretechnology, will continue to be amortized over their useful lives.
SFAS No. 142 requires a two-step impairment test for goodwill.The first step is to compare the carrying amount of the reportingunit’s assets to the fair value of the reporting unit. If the fair valueexceeds the carrying value, no further work is required and noimpairment loss is recognized. If the carrying amount exceeds thefair value then the second step is required to be completed, whichinvolves allocating the fair value of the reporting unit to each assetand liability, with the excess being implied goodwill. An impairmentloss occurs if the amount of the recorded goodwill exceeds theimplied goodwill. The determination of the fair value of theCompany’s reporting units is based, among other things, on estimates of future operating performance of the reporting unitbeing valued. The Company is required to complete an impairmenttest for goodwill and record any resulting impairment losses annually.Changes in market conditions, among other factors, may have animpact on these estimates. The Company completed its requiredannual impairment tests in the fourth quarters of fiscal 2003 and2002 and determined that there was no impairment.
Stock OptionsThe Company has the choice to account for stock options using
either Accounting Principles Board Opinion No. 25 (“APB 25”) orSFAS No. 123, “Accounting for Stock-Based Compensation.” TheCompany has elected to use the accounting method under APB 25and the related interpretations to account for its stock options.Under APB 25, generally, when the exercise price of the Company’sstock options equals the market price of the underlying stock on thedate of grant, no compensation expense is recognized. Had theCompany elected to use SFAS No. 123 to account for its stockoptions under the fair value method, it would have been required torecord compensation expense and as a result, diluted earnings pershare for the fiscal years ended September 30, 2003, 2002 and 2001would have been lower by $0.16, $0.10 and $0.38, respectively. SeeNote 8 of “Notes to Consolidated Financial Statements.”
Liquidity and Capital ResourcesThe following table illustrates the Company’s debt structure at
September 30, 2003, including availability under revolving creditfacilities and the receivables securitization facility (in thousands):
Outstanding AdditionalBalance Availability
Fixed-Rate Debt:Bergen 71⁄4% senior notes due 2005 $ 99,849 $ —81⁄8% senior notes due 2008 500,000 —71⁄4% senior notes due 2012 300,000 —AmeriSource 5% convertible
subordinated notes due 2007 300,000 —Bergen 67⁄8% exchangeable
subordinated debentures due 2011 8,425 —Bergen 7.80% trust preferred
securities due 2039 275,960 —Other 4,920 —
Total fixed-rate debt 1,489,154 —
Variable-Rate Debt:Term loan facility due 2004 to 2006 240,000 —Blanco revolving credit facility
due 2004 55,000 —Revolving credit facility due 2006 — 937,081Receivables securitization facility
due 2006 — 1,050,000Total variable-rate debt 295,000 1,987,081
Total debt, including current portion $ 1,784,154 $ 1,987,081
The Company’s working capital usage fluctuates widely duringthe year due to seasonal inventory buying requirements and buy-sidepurchasing opportunities. During fiscal 2003, the Company’s highestutilization occurred during its third quarter and was 74% of the $2.1billion of aggregate availability under its revolving credit facility andpreviously existing receivables securitization facilities.
In July 2003, the Company entered into a new $1.05 billionreceivables securitization facility (“ABC Securitization Facility”) and terminated the existing AmeriSource and Bergen securitizationfacilities. At September 30, 2003, there were no borrowings underthe ABC Securitization Facility. In connection with the ABCSecuritization Facility, ABDC sells on a revolving basis certainaccounts receivable to a wholly-owned special purpose entity(“ARFC”), which in turn sells a percentage ownership interest in thereceivables to commercial paper conduits sponsored by financialinstitutions. ABDC is the servicer of the accounts receivable under the ABC Securitization Facility. After the maximum limit ofreceivables sold has been reached and as sold receivables are collected, additional receivables may be sold up to the maximumamount available under the facility. Under the terms of the ABCSecuritization Facility, a $550 million tranche has an expiration dateof July 2006 (the three-year tranche) and a $500 million trancheexpires in July 2004 (the 364-day tranche). The Company intends torenew the 364-day tranche on an annual basis. Interest rates arebased on prevailing market rates for short-term commercial paper
212003 AmerisourceBergen Corporation
plus a program fee of 75 basis points for the three-year tranche and 45 basis points for the 364-day tranche. The Company pays acommitment fee of 30 basis points and 25 basis points on anyunused credit with respect to the three-year tranche and the 364-daytranche, respectively. The program and commitment fee rates willvary based on the Company’s debt ratings. Borrowings and paymentsunder the ABC Securitization Facility are applied on a pro-rata basisto the $550 million and $500 million tranches. In connection withentering into the ABC Securitization Facility, the Company incurredapproximately $2.4 million of costs which were deferred and arebeing amortized over the life of the ABC Securitization Facility. Thisfacility is a financing vehicle utilized by the Company because itoffers an attractive interest rate relative to other financing sources.The Company securitizes its trade accounts, which are generally non-interest bearing, in transactions that are accounted for as borrowings under SFAS No. 140, “Accounting for Transfers andServicing of Financial Assets and Extinguishments of Liabilities.”
In November 2002, the Company issued $300 million of 71⁄4%senior notes due November 15, 2012 (the “71⁄4% Notes”). The 71⁄4%Notes are redeemable at the Company’s option at any time beforematurity at a redemption price equal to 101% of the principalamount thereof plus accrued and unpaid interest and liquidated damages, if any, to the date of redemption and, under some circumstances, a redemption premium. Interest on the 71⁄4% Notes is payable semiannually in arrears, commencing May 15, 2003. The71⁄4% Notes rank junior to the Senior Credit Agreement (definedbelow) and equal to the Company’s 81⁄8% senior notes due 2008 andsenior to the debt of the Company’s subsidiaries. The Company usedthe net proceeds of the 71⁄4% Notes to repay $15 million of the TermFacility (defined below) in December 2002, to repay $150 million inaggregate principal of the Bergen 73⁄8% senior notes in January 2003and to redeem the PharMerica 83⁄8% senior subordinated notes due2008, at a redemption price equal to 104.19% of the $123.5 millionprincipal amount, in April 2003. The cost of the redemption premiumrelated to the PharMerica 83⁄8% senior subordinated notes has beenreflected in the Company’s consolidated statement of operations forthe fiscal year ended September 30, 2003 as a loss on the earlyretirement of debt. In connection with the issuance of the 71⁄4%Notes, the Company incurred approximately $5.7 million of costswhich were deferred and are being amortized over the ten-year termof the notes.
In connection with the Merger, the Company issued $500 millionof 81⁄8% senior notes due 2008 (the “81⁄8% Notes “) and entered into a $1.3 billion senior secured credit facility (the “Senior CreditAgreement”) with a syndicate of lenders. Proceeds from these facilities were used to: replace existing AmeriSource and Bergenrevolving credit facilities; pay certain merger transaction fees andfees associated with the financings; redeem $184.6 million ofPharMerica 83⁄8% senior subordinated notes due 2008 via a tenderoffer; and meet general corporate purposes. In addition, theCompany assumed $405.3 million of fixed debt. During fiscal 2002,the Company redeemed all $20.6 million of the Bergen 7% convertiblesubordinated debentures due 2006 pursuant to a tender offerrequired as a result of the Merger. The 81⁄8% Notes are redeemable atthe Company’s option at any time before maturity at a redemptionprice equal to 101% of the principal amount thereof plus accrued
and unpaid interest and liquidated damages, if any, to the date ofredemption and, under some circumstances, a redemption premium.The 81⁄8% Notes pay interest semiannually in arrears and rank juniorto the Senior Credit Agreement.
The Senior Credit Agreement consists of a $1.0 billion revolvingcredit facility (the “Revolving Facility”) and a $300 million term loanfacility (the “Term Facility”), both maturing in August 2006. TheTerm Facility has scheduled principal payments on a quarterly basisthat began on December 31, 2002, totaling $60 million in each offiscal 2003 and 2004, and $80 million and $100 million in fiscal2005 and 2006, respectively. The scheduled term loan payments weremade in fiscal 2003. There were no borrowings outstanding under theRevolving Facility at September 30, 2003. Interest on borrowingsunder the Senior Credit Agreement accrues at specified rates basedon the Company’s debt ratings. Such rates range from 1.0% to 2.5%over LIBOR or 0% to 1.5% over prime. In April 2003, the Company’sdebt rating was raised by one of the rating agencies and in accordancewith the terms of the Senior Credit Agreement, interest on borrowingssince April 2003 have accrued at lower rates. At September 30, 2003,the rate was 1.25% over LIBOR or .25% over prime. Availabilityunder the Revolving Facility is reduced by the amount of outstandingletters of credit ($62.9 million at September 30, 2003). The Companypays quarterly commitment fees to maintain the availability underthe Revolving Facility at specified rates based on the Company’s debtratings ranging from 0.250% to 0.500% of the unused availability. At September 30, 2003, the rate was 0.300%. The Senior CreditAgreement contains restrictions on, among other things, additionalindebtedness, distributions and dividends to stockholders, investmentsand capital expenditures. Additional covenants require compliancewith financial tests, including leverage and fixed charge coverageratios, and maintenance of minimum tangible net worth. TheCompany may choose to repay or reduce its commitments under theSenior Credit Agreement at any time. Substantially all of theCompany’s assets, except for trade receivables which were previouslysold into the AmeriSource and Bergen receivables securitization facilities and currently are sold into the ABC Securitization Facility(as described above), collateralize the Senior Credit Agreement.
In connection with issuing the 81⁄8% Notes and entering intothe Senior Credit Agreement, the Company incurred approximately$24.0 million of costs, which were deferred and are being amortizedover the term of the respective issues.
In December 2000, the Company issued $300.0 million of 5%convertible subordinated notes due December 1, 2007. The noteshave an annual interest rate of 5%, payable semiannually, and areconvertible into common stock of the Company at $52.97 per shareat any time before their maturity or their prior redemption or repurchase by the Company. On or after December 3, 2004, theCompany has the option to redeem all or a portion of the notes thathave not been previously converted. Net proceeds from the notes ofapproximately $290.6 million were used to repay existing borrowings,and for working capital and other general corporate purposes. Inconnection with the issuance of the notes, the Company incurredapproximately $9.4 million of financing fees, which were deferredand are being amortized over the seven-year term of the notes.
In connection with the Merger, the Company assumed Bergen’sCapital I Trust (the “Trust”), a wholly-owned subsidiary of Bergen. In
22 AmerisourceBergen Corporation 2003
May 1999, the Trust issued 12,000,000 shares of 7.80% trust originated preferred securities (SM) (TOPrS(SM)) (the “Trust PreferredSecurities”) at $25 per security. The proceeds of such issuances wereinvested by the Trust in $300 million aggregate principal amount ofBergen’s 7.80% subordinated deferrable interest notes due June 30,2039 (the “Subordinated Notes”). The Subordinated Notes representthe sole assets of the Trust and bear interest at the annual rate of7.80%, payable quarterly, and are redeemable by the Company beginning in May 2004 at 100% of the principal amount thereof. The Trust Preferred Securities will be redeemable upon any repaymentof the Subordinated Notes at 100% of the liquidation amount beginning in May 2004. The obligations of the Trust related to theTrust Preferred Securities are fully and unconditionally guaranteed by the Company.
Holders of the Trust Preferred Securities are entitled to cumulative cash distributions at an annual rate of 7.80% of the liquidation amount of $25 per security. The Trust has continued toremit the required cash distributions since its inception. TheCompany, under certain conditions, may cause the Trust to defer thepayment of distributions for successive periods of up to 20 consecutivequarters. During such periods, accrued distributions on the TrustPreferred Securities will compound quarterly at an annual rate of
7.80%. Also during such periods, the Company may not declare orpay distributions on its capital stock; may not redeem, purchase ormake a liquidation payment on any of its capital stock; and may notmake interest, principal or premium payments on, or repurchase orredeem, any of its debt securities that rank equal with or junior tothe Subordinated Notes.
The Company’s operating results have generated sufficient cashflow which, together with borrowings under its debt agreements andcredit terms from suppliers, have provided sufficient capital resourcesto finance working capital and cash operating requirements, and tofund capital expenditures, acquisitions, repayment of debt and thepayment of interest on outstanding debt. The Company’s primaryongoing cash requirements will be to finance working capital, fundthe repayment of debt and the payment of interest on debt, financeMerger integration initiatives and fund capital expenditures and routine growth and expansion through new business opportunities.Future cash flows from operations and borrowings are expected to be sufficient to fund the Company’s ongoing cash requirements.
Following is a summary of the Company’s contractual obligationsfor future principal payments on its debt, minimum rental paymentson its noncancelable operating leases and minimum payments on itsother commitments at September 30, 2003 (in thousands):
232003 AmerisourceBergen Corporation
Payments Due by Period
Total Within 1 year 1-3 years 4-5 years After 5 years
Debt $ 1,808,345 $ 116,430 $ 281,396 $ 801,396 $ 609,123
Operating Leases 182,701 52,414 78,230 30,270 21,787Other Commitments 90,875 87,295 2,229 1,351 —
Total $ 2,081,921 $ 256,139 $ 361,855 $ 833,017 $ 630,910
The debt amounts in the above table differ from the relatedcarrying amounts on the consolidated balance sheet due to the purchase accounting adjustments recorded in order to reflectBergen’s obligations at fair value on the effective date of the Merger. These differences are being amortized over the terms of the respective obligations.
The $55 million Blanco revolving credit facility, which expires inMay 2004, is included in the “Within 1 year” column in the aboverepayment table. However, this borrowing is not classified in the cur-rent portion of long-term debt on the consolidated balance sheet atSeptember 30, 2003 because the Company has the ability and intentto refinance it on a long-term basis. Additionally, borrowings underthe Blanco facility are secured by a standby letter of credit under theSenior Credit Agreement, and therefore the Company is effectivelyfinancing this debt on a long-term basis through that arrangement.
In connection with its merger integration plans, the Companyintends to build six new distribution facilities and expand seven others (two of which are complete) over the next three to four years.Five of the new distribution facilities will be owned by the Companyand, in December 2002, the Company entered into a 15-year leaseobligation totaling $17.4 million for the other new facility; this obligation is reflected in Operating Leases in the above table. TheCompany has begun to enter into commitments relating to siteselection, purchase of land, design and construction of the new facilities on a turnkey basis with a construction development
company. As of September 30, 2003, the Company has entered into$87.0 million of commitments primarily relating to the constructionof three new facilities. The Company will take ownership of and make payment on each new facility as the developer substantiallycompletes construction. The facility commitments entered into as ofSeptember 30, 2003 are included in Other Commitments in the abovetable. As of September 30, 2003, the developer has incurred $25.6million relating to the construction of the new facilities. This amounthas been recorded in property and equipment and accrued expensesand other in the consolidated balance sheet.
Any outstanding contingent payments relating to recentlyacquired companies, as described below, are not reflected in theabove table. These contingencies, along with any others, becomecommitments of the Company when they are realized.
During the fiscal year ended September 30, 2003, theCompany’s operating activities provided $354.8 million of cash. Cashprovided by operations in fiscal 2003 was principally the result ofnet income of $441.2 million and non-cash items of $271.2 million,offset in part, by a $278.4 million increase in merchandise inventoriesand a $58.0 million increase in accounts receivable. The increase inmerchandise inventories reflects inventory required to support therevenue increase. Accounts receivable increased only by 1%, excludingchanges in the allowance for doubtful accounts and customer additions due to acquired companies, in comparison to the 13%increase in operating revenues. Average days sales outstanding for
the Pharmaceutical Distribution segment increased slightly to 16.9days in the fiscal year ended September 30, 2003 from 16.4 days inthe prior fiscal year primarily due to the strong revenue growth ofAmerisourceBergen Specialty Group, which generally has a higherreceivable investment than the core distribution business. Averagedays sales outstanding for the PharMerica segment improved to 39.3days in the fiscal year ended September 30, 2003 from 43.5 days inthe prior fiscal year as a result of the continued improvements incentralized billing and collection practices. Non-cash items of $271.2million included $127.2 million of deferred income taxes. The taxplanning strategies implemented by the Company has enabled theCompany to lower its current tax payments and liability whileincreasing its deferred taxes during the fiscal year ended September30, 2003. Operating cash uses during the fiscal year endedSeptember 30, 2003 included $134.2 million in interest paymentsand $118.4 million of income tax payments, net of refunds.
During the year ended September 30, 2002, the Company’soperating activities provided $535.9 million in cash. Cash providedby operations in fiscal 2002 was principally the result of $344.9 million of net income and $190.0 million of non-cash items affectingnet income. Changes in operating assets and liabilities were only$1.0 million as a $362.2 million increase in merchandise inventoriesand a $133.6 million increase in accounts receivable were offset primarily by a $514.1 increase in accounts payable, accrued expensesand income taxes. The increase in merchandise inventories reflectsinventory required to support the strong revenue increase, as well asinventory purchased to take advantage of buy-side gross profitopportunities including opportunities associated with manufacturerprice increases and negotiated deals. Inventory grew at a lower ratethan revenues due to the consolidation of seven facilities in fiscal2002 and improved inventory management. Accounts receivable,before changes in the allowance for doubtful accounts, increasedonly 3%, despite the 16% increase in operating revenues, on a proforma combined basis. During the fiscal year ended September 30,2002, the Company’s days sales outstanding improved as a result ofcontinued emphasis on receivables management at the local level.Average days sales outstanding for the Pharmaceutical Distributionsegment improved to 16.4 days in fiscal 2002 from 17.7 days in theprior year, on a pro forma combined basis. Average days sales out-standing for the PharMerica segment improved to 43.5 days in fiscal2002 from 53.4 days in the prior year, on a pro forma combinedbasis. The $376.0 million increase in accounts payable was primarilydue to the merchandise inventory increase as well as the timing ofpayments to suppliers. Operating cash uses during the fiscal yearended September 30, 2002 included $137.9 million in interest payments and $111.9 million of income tax payments, net of refunds.
During the year ended September 30, 2001, the Company’soperating activities used $45.9 million in cash. Cash used in operations in fiscal 2001 resulted from increases of $726.1 million inmerchandise inventories and $151.6 million in accounts receivablepartially offset by an increase in accounts payable, accrued expensesand income taxes of $613.3 million. The increase in merchandiseinventories reflected necessary inventories to support the strong revenue increase, and inventory purchased to take advantage of buy-side gross profit margin opportunities including opportunitiesassociated with manufacturer price increases and negotiated deals.
Additionally, inventories at September 30, 2001 included safety stockpurchased due to uncertainties regarding possible increased customerdemands or disruptions in the supply stream as the result of the terrorist events of September 11, 2001. The increase in accountspayable, accrued expenses and income taxes is net of merger-relatedpayments of approximately $58.8 million, primarily executive compensation payments made in August 2001.
The Company paid a total of $13.8 million, $15.6 million and$2.9 million of severance, contract, and lease cancellation and othercosts in fiscal 2003, 2002 and 2001, respectively, related to the costreduction plans discussed above. Severance accruals of $4.9 millionand remaining contract and lease obligations of $0.1 million atSeptember 30, 2003 are included in accrued expenses and other inthe consolidated balance sheet.
Capital expenditures for the years ended September 30, 2003,2002 and 2001 were $90.6 million, $64.2 million and $23.4 million,respectively, and relate principally to investments in warehouseexpansions and improvements, information technology and warehouseautomation. The Company developed merger integration plans toconsolidate its existing pharmaceutical distribution facility networkand establish new, more efficient distribution centers. More specifi-cally, the Company’s plan is to have a distribution facility networkconsisting of 30 facilities, which will be accomplished by building sixnew facilities, expanding seven facilities, closing 27 facilities andimplementing a new warehouse operating system. During fiscal 2003,a construction development company incurred $25.6 million on theCompany’s behalf relating to the construction of three of the newfacilities. This amount will be recorded as a capital expenditure whenthe related facilities are substantially complete, at which time, theCompany will make payment to the construction development companyand take ownership of each respective facility. The Company anticipatesthat future cash flows from operations along with existing availabilityunder the revolving credit facility and receivables securitization facility will be adequate to fund these merger integration plans. The Company expects to spend approximately $150 million to $200million for capital expenditures during fiscal 2004.
In June 2003, the Company acquired Anderson Packaging Inc.(“Anderson”), a leading provider of physician and retail contractedpackaging services to pharmaceutical manufacturers. The purchaseprice was approximately $100.1 million, which included the repayment of Anderson debt of $13.8 million and $0.8 million oftransaction costs associated with the acquisition. The Company paidpart of the purchase price by issuing 814,145 shares of its commonstock, as set forth in the acquisition agreement, with an aggregatemarket value of $55.6 million. The Company paid the remaining purchase price, which was approximately $44.5 million, in cash.
In April 2003, the Company acquired an additional 40% equityinterest in a physician education and management consulting company and satisfied the residual contingent obligation for the initial 20% equity interest for an aggregate $24.7 million in cash.The acquisition of the remaining 40% equity interest is expected tooccur in the second quarter of fiscal 2004 and the purchase pricewill be based on the calendar 2003 operating results of the physicianeducation and management consulting company. An additional payment may be earned by the selling shareholders under theCompany’s current agreement with such shareholders based on the
24 AmerisourceBergen Corporation 2003
2004 operating results of the physician education and managementconsulting company. The Company currently expects to pay between$30 million and $40 million, in the aggregate, for the remaining40% equity interest and any additional payment.
The Company also used cash of $3.0 million to purchase three smaller companies related to the Pharmaceutical Distributionsegment and paid $9.8 million to eliminate the right of the formerowners of AutoMed Technologies, Inc. (“AutoMed”) to receive up to$55.0 million in contingent payments based on AutoMed achievingdefined earnings targets through the end of calendar 2004.
In January 2003, the Company acquired US BioservicesCorporation (“US Bio”), a national pharmaceutical products and services provider focused on the management of high-cost complextherapies and reimbursement support for a total base purchase priceof $160.2 million, which included the repayment of US Bio debt of$14.8 million and $1.5 million of transaction costs associated withthis acquisition. The Company paid part of the base purchase priceby issuing 2,399,091 shares of its common stock, as set forth in theacquisition agreement, with an aggregate market value of $131.0million. The Company paid the remaining $29.2 million of the basepurchase price in cash. The agreement also provides for contingentpayments of up to $27.6 million in cash based on US Bio achievingdefined earnings targets through the end of the first quarter of calendar 2004. In July 2003, an initial contingent payment of $2.5 million was paid in cash by the Company.
In January 2003, the Company acquired Bridge Medical, Inc.(“Bridge”), a leading provider of barcode-enabled point-of-care software designed to reduce medication errors, to enhance theCompany’s offerings in the pharmaceutical supply channel, for a totalbase purchase price of $28.4 million, which included $0.7 million oftransaction costs associated with this acquisition. The Company paidpart of the base purchase price by issuing 401,780 shares of its common stock with an aggregate market value of $22.9 million and the remaining base purchase price was paid with $5.5 million of cash.
During fiscal 2002, the Company acquired AutoMed for $120.4million. In June 2003, the Company amended the 2002 agreementunder which it acquired AutoMed. The Company also acquired othersmaller businesses for $15.8 million. Additionally, the Company purchased equity interests in various businesses for $4.1 million.
During fiscal 2001, the Company sold the net assets of one of its specialty products distribution facilities for approximately$13.0 million.
During fiscal 2000, the Company and three other healthcare distributors formed an Internet-based company that is an independent, commercially neutral healthcare product informationexchange focused on streamlining the process involved in identifying,purchasing and distributing healthcare products and services. TheCompany contributed $1.2 million and $6.5 million to the joint venture in fiscal 2002 and 2001, respectively, and its ownershipinterest of approximately 22% was accounted for under the equitymethod. This entity merged in November 2001 with the GlobalHealth Exchange LLC, a similar venture, and the Company’s ongoingownership interest in the Global Health Exchange, LLC is 4%. Sincethen, the Company has accounted for its share of the joint ventureusing the cost method of accounting.
During the fiscal year ended September 30, 2003, the Companyissued the aforementioned $300 million of 71⁄4% Notes. The Companyused the net proceeds of the 71⁄4% Notes to repay $15 million of theterm loan, to repay $150 million in aggregate principal of theBergen 73⁄8% senior notes and redeem the PharMerica 83⁄8% seniorsubordinated notes due 2008 at a redemption price equal to104.19% of the $123.5 million principal amount. The Company alsorepaid an additional $45 million of the term loan, as scheduled.During the year ended September 30, 2002, the Company made net repayments of $37.0 million on its receivables securitizationfacilities. The Company also repaid debt of $23.1 million during theyear, principally consisting of $20.6 million for the retirement ofBergen’s 7% debentures pursuant to a tender offer which wasrequired as a result of the Merger. Cash provided by financing activities in fiscal 2001 primarily represents the net effect of borrowings to fund working capital requirements, the refinancing and merger costs described above.
The Company has paid quarterly cash dividends of $0.025 pershare on its common stock since the first quarter of fiscal 2002.Most recently, a dividend of $0.025 per share was declared by theboard of directors on October 29, 2003, and was paid on December1, 2003 to stockholders of record at the close of business onNovember 17, 2003. The Company anticipates that it will continue to pay quarterly cash dividends in the future. However, the paymentand amount of future dividends remain within the discretion of the Company’s board of directors and will depend upon theCompany’s future earnings, financial condition, capital requirementsand other factors.
Market RiskThe Company’s most significant market risk is the effect of
changing interest rates. The Company manages this risk by using acombination of fixed-rate and variable-rate debt. At September 30,2003, the Company had approximately $1.5 billion of fixed-rate debtwith a weighted average interest rate of 7.2% and $295.0 million ofvariable-rate debt with a weighted average interest rate of 2.6%. Theamount of variable-rate debt fluctuates during the year based on theCompany’s working capital requirements. The Company periodicallyevaluates various financial instruments that could mitigate a portion of its exposure to variable interest rates. However, there areno assurances that such instruments will be available on termsacceptable to the Company. There were no such financial instrumentsin effect at September 30, 2003. For every $100 million of unhedgedvariable-rate debt outstanding, a 26 basis-point increase in interestrates (one-tenth of the average variable rate at September 30, 2003) would increase the Company’s annual interest expense by$0.26 million.
Recently Issued Financial Accounting StandardsIn May 2003, the FASB issued SFAS No. 150, “Accounting for
Certain Financial Instruments with Characteristics of both Liabilitiesand Equity.” This statement clarifies the definition of a liability, ascurrently defined by FASB Concepts Statement No. 6 “Elements ofFinancial Statements,” as well as other items. The statement requiresthat financial instruments that embody an obligation of an issuer beclassified as a liability. Furthermore, the standard provides guidance
252003 AmerisourceBergen Corporation
for the initial and subsequent measurement as well as disclosurerequirements of these financial instruments. SFAS No. 150 is effective for financial instruments entered into or modified after May 31, 2003, and otherwise is effective at the beginning of thefirst interim period beginning after June 15, 2003. The adoption ofthis statement did not have a material impact on the Company’sfinancial position or results of operations.
In January 2003, the FASB issued Interpretation (“FIN”) No. 46, “Consolidation of Variable Interest Entities, an Interpretationof Accounting Research Bulletin No. 51.” This interpretation clarifies the application of Accounting Research Bulletin No. 51,“Consolidated Financial Statements,” and requires consolidation ofvariable interest entities by their primary beneficiaries if certain conditions are met. This interpretation applies to variable interestentities created or obtained after January 31, 2003. For variableinterest entities created or obtained before February 1, 2003, theadoption of this standard is effective as of December 31, 2003 for avariable interest in special-purpose entities and as of March 31, 2004for all other variable interest entities. The Company did not create or obtain any variable interest entity after January 31, 2003. TheCompany is in the process of evaluating the adoption of this standard, as it relates to variable interest entities held by theCompany prior to February 1, 2003, but does not believe it will have a material impact on its consolidated financial statements.
In December 2002, the FASB issued SFAS No. 148, “Accountingfor Stock-Based Compensation — Transition and Disclosure.” SFAS No. 148 amends SFAS No. 123, “Accounting for Stock-BasedCompensation,” to provide alternative methods of transition to SFASNo. 123’s fair value method of accounting for stock-based employeecompensation. SFAS No. 148 also amends the disclosure provisions of SFAS No. 123 and Accounting Principles Board Opinion No. 28,“Interim Financial Reporting,” to require disclosure in the summaryof significant accounting policies of the effects of an entity’saccounting policy with respect to stock-based employee compensationon reported net income and earnings per share in annual and interimfinancial statements. The adoption of the standard was effective forfiscal years and interim periods beginning after December 15, 2002.The Company did not adopt the fair value method of accounting forstock-based compensation. As required, the Company adopted thedisclosure provisions of this standard. (See Notes 1 and 8 to theConsolidated Financial Statements.)
In November 2002, the FASB issued FIN No. 45, “Guarantor’sAccounting and Disclosure Requirements for Guarantees, IncludingIndirect Guarantees of Indebtedness of Others.” This interpretationenhances the disclosures to be made by a guarantor in its interimand annual financial statements about obligations under certainguarantees that it has issued. It also clarifies that a guarantor isrequired to recognize, at the inception of a guarantee, a liability forthe fair value of the obligation undertaken in issuing the guarantee.The adoption of the initial recognition and measurement requirementsof FIN No. 45 did not have an impact on the Company’s consolidatedfinancial statements.
Forward-Looking StatementsCertain of the statements contained in this Management’s
Discussion and Analysis of Financial Condition and Results ofOperations (“MD&A”) and elsewhere in this report are “forward-looking statements” within the meaning of Section 27A of theSecurities Act and Section 21E of the Exchange Act. These statements are based on management’s current expectations and aresubject to uncertainty and changes in circumstances. Actual resultsmay vary materially from the expectations contained in the forward-looking statements. The forward-looking statements herein includestatements addressing management’s views with respect to futurefinancial and operating results and the benefits and other aspects of the merger between AmeriSource Health Corporation and BergenBrunswig Corporation. Various factors, including competitive pressures, success of integration, restructuring or systems initiatives,market interest rates, regulatory changes, changes in customer mix,changes in pharmaceutical manufacturers’ pricing and distributionpolicies, changes in U.S. Government policies, customer insolvencies,or the loss of one or more key customer or supplier relationships,could cause actual outcomes and results to differ materially fromthose described in forward-looking statements. Certain additionalfactors that management believes could cause actual outcomes andresults to differ materially from those described in forward-lookingstatements are set forth in this MD&A, in Item 1 (Business) underthe heading “Certain Risk Factors”, elsewhere in Item 1 (Business)and elsewhere in this report.
26 AmerisourceBergen Corporation 2003
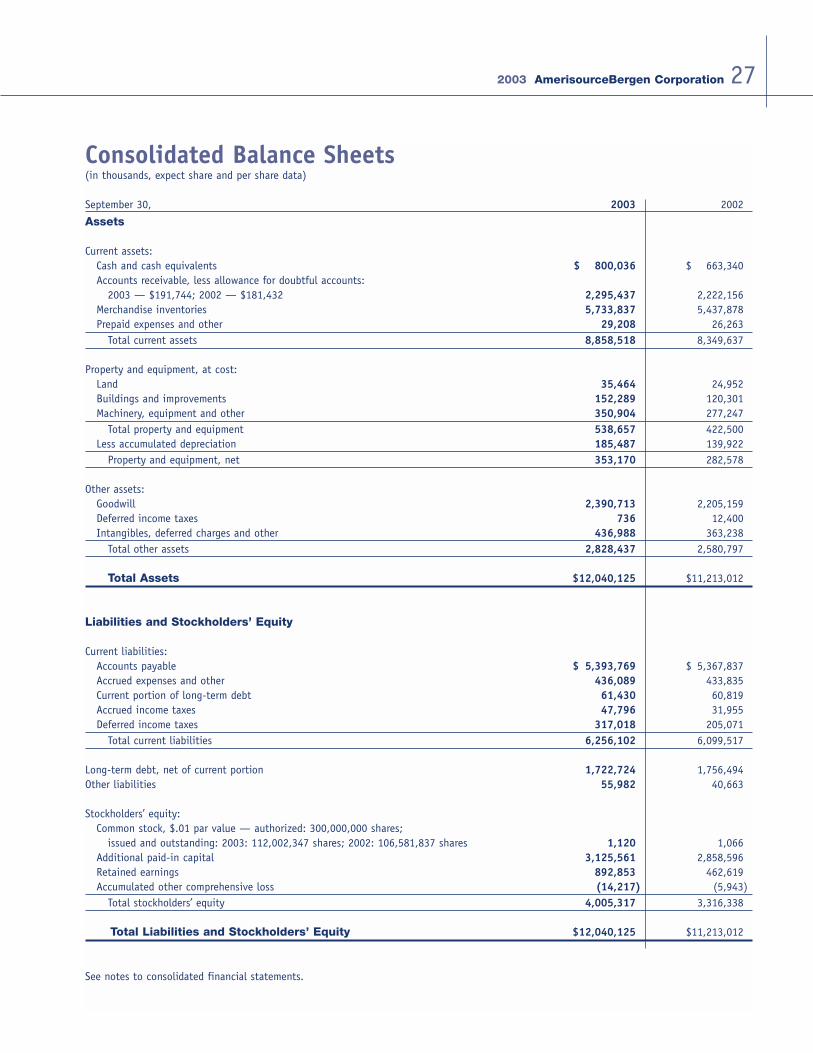
Consolidated Balance Sheets(in thousands, expect share and per share data)
September 30, 2003 2002
Assets
Current assets:Cash and cash equivalents $ 800,036 $ 663,340Accounts receivable, less allowance for doubtful accounts:
2003 — $191,744; 2002 — $181,432 2,295,437 2,222,156Merchandise inventories 5,733,837 5,437,878Prepaid expenses and other 29,208 26,263
Total current assets 8,858,518 8,349,637
Property and equipment, at cost:Land 35,464 24,952Buildings and improvements 152,289 120,301Machinery, equipment and other 350,904 277,247
Total property and equipment 538,657 422,500Less accumulated depreciation 185,487 139,922
Property and equipment, net 353,170 282,578
Other assets:Goodwill 2,390,713 2,205,159Deferred income taxes 736 12,400Intangibles, deferred charges and other 436,988 363,238
Total other assets 2,828,437 2,580,797
Total Assets $12,040,125 $11,213,012
Liabilities and Stockholders’ Equity
Current liabilities:Accounts payable $ 5,393,769 $ 5,367,837Accrued expenses and other 436,089 433,835Current portion of long-term debt 61,430 60,819Accrued income taxes 47,796 31,955Deferred income taxes 317,018 205,071
Total current liabilities 6,256,102 6,099,517
Long-term debt, net of current portion 1,722,724 1,756,494Other liabilities 55,982 40,663
Stockholders’ equity:Common stock, $.01 par value — authorized: 300,000,000 shares;
issued and outstanding: 2003: 112,002,347 shares; 2002: 106,581,837 shares 1,120 1,066Additional paid-in capital 3,125,561 2,858,596Retained earnings 892,853 462,619Accumulated other comprehensive loss (14,217) (5,943)
Total stockholders’ equity 4,005,317 3,316,338
Total Liabilities and Stockholders’ Equity $12,040,125 $11,213,012
272003 AmerisourceBergen Corporation
See notes to consolidated financial statements.
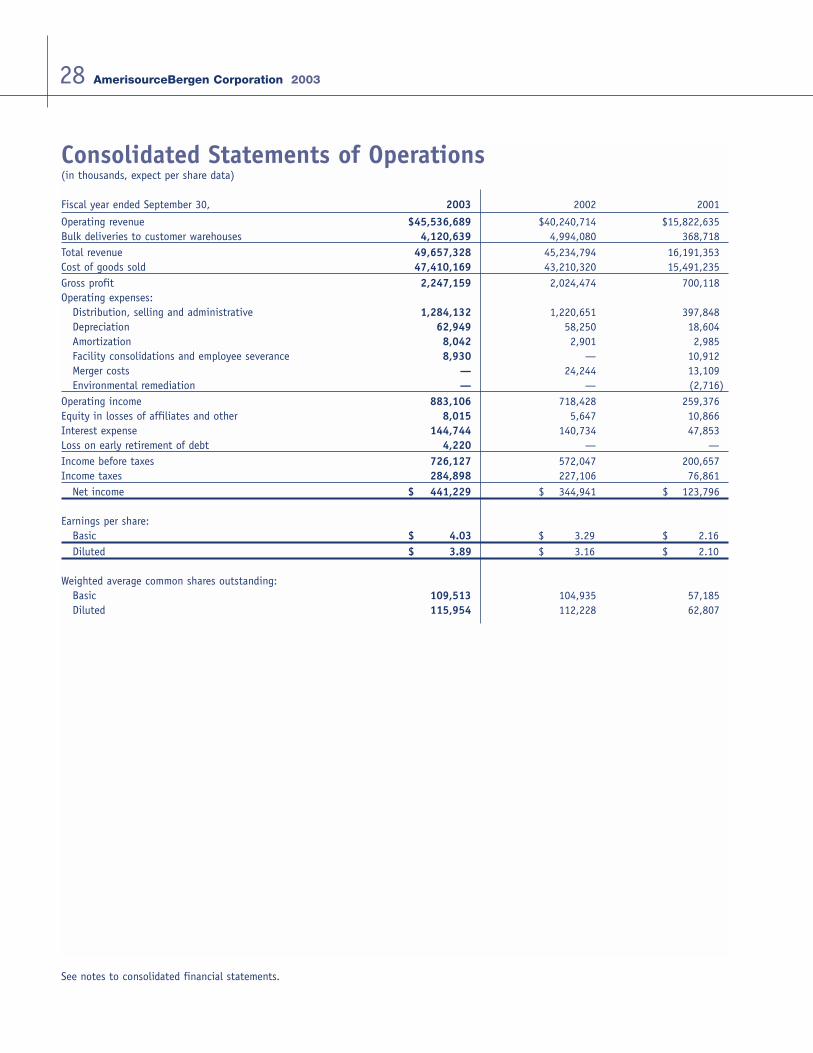
Consolidated Statements of Operations(in thousands, expect per share data)
Fiscal year ended September 30, 2003 2002 2001
Operating revenue $45,536,689 $40,240,714 $15,822,635Bulk deliveries to customer warehouses 4,120,639 4,994,080 368,718Total revenue 49,657,328 45,234,794 16,191,353Cost of goods sold 47,410,169 43,210,320 15,491,235Gross profit 2,247,159 2,024,474 700,118Operating expenses:
Distribution, selling and administrative 1,284,132 1,220,651 397,848Depreciation 62,949 58,250 18,604Amortization 8,042 2,901 2,985Facility consolidations and employee severance 8,930 — 10,912Merger costs — 24,244 13,109Environmental remediation — — (2,716)
Operating income 883,106 718,428 259,376Equity in losses of affiliates and other 8,015 5,647 10,866Interest expense 144,744 140,734 47,853Loss on early retirement of debt 4,220 — —Income before taxes 726,127 572,047 200,657Income taxes 284,898 227,106 76,861
Net income $ 441,229 $ 344,941 $ 123,796
Earnings per share:Basic $ 4.03 $ 3.29 $ 2.16Diluted $ 3.89 $ 3.16 $ 2.10
Weighted average common shares outstanding:Basic 109,513 104,935 57,185Diluted 115,954 112,228 62,807
28 AmerisourceBergen Corporation 2003
See notes to consolidated financial statements.
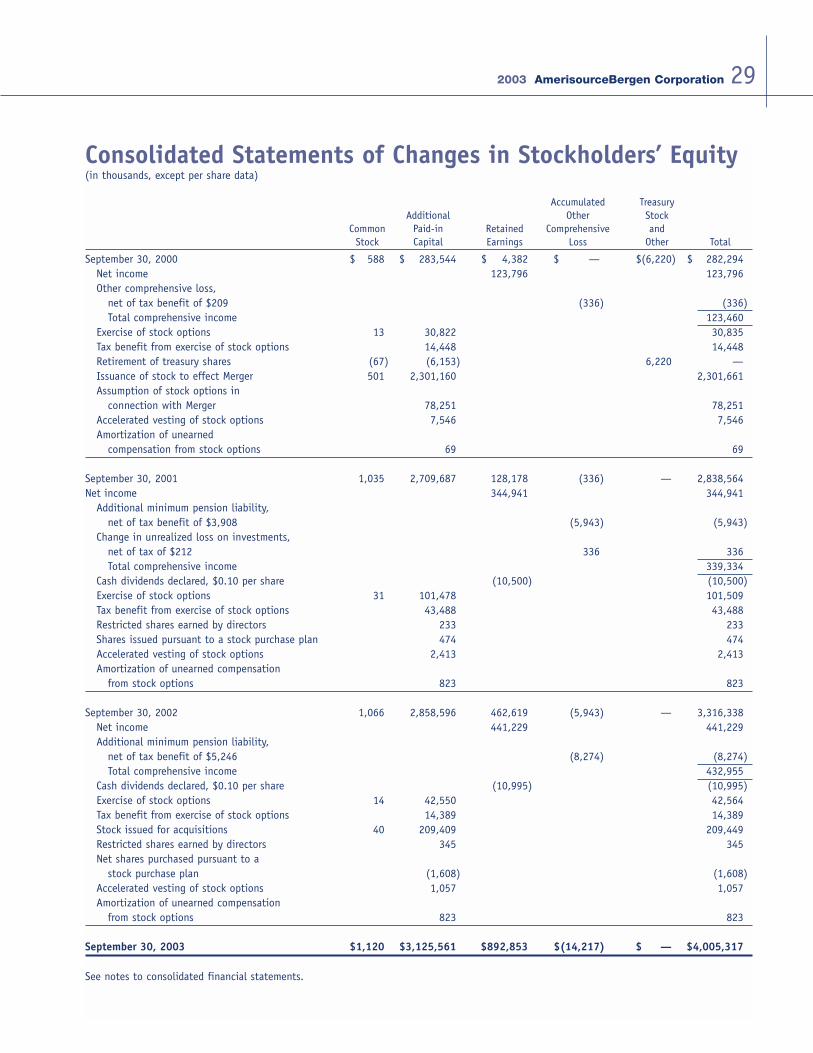
Consolidated Statements of Changes in Stockholders’ Equity(in thousands, except per share data)
Accumulated TreasuryAdditional Other Stock
Common Paid-in Retained Comprehensive andStock Capital Earnings Loss Other Total
September 30, 2000 $ 588 $ 283,544 $ 4,382 $ — $(6,220) $ 282,294Net income 123,796 123,796Other comprehensive loss,
net of tax benefit of $209 (336) (336)Total comprehensive income 123,460
Exercise of stock options 13 30,822 30,835Tax benefit from exercise of stock options 14,448 14,448Retirement of treasury shares (67) (6,153) 6,220 —Issuance of stock to effect Merger 501 2,301,160 2,301,661Assumption of stock options in
connection with Merger 78,251 78,251Accelerated vesting of stock options 7,546 7,546Amortization of unearned
compensation from stock options 69 69
September 30, 2001 1,035 2,709,687 128,178 (336) — 2,838,564Net income 344,941 344,941
Additional minimum pension liability, net of tax benefit of $3,908 (5,943) (5,943)
Change in unrealized loss on investments, net of tax of $212 336 336Total comprehensive income 339,334
Cash dividends declared, $0.10 per share (10,500) (10,500)Exercise of stock options 31 101,478 101,509Tax benefit from exercise of stock options 43,488 43,488Restricted shares earned by directors 233 233Shares issued pursuant to a stock purchase plan 474 474Accelerated vesting of stock options 2,413 2,413Amortization of unearned compensation
from stock options 823 823
September 30, 2002 1,066 2,858,596 462,619 (5,943) — 3,316,338Net income 441,229 441,229Additional minimum pension liability,
net of tax benefit of $5,246 (8,274) (8,274)Total comprehensive income 432,955
Cash dividends declared, $0.10 per share (10,995) (10,995)Exercise of stock options 14 42,550 42,564Tax benefit from exercise of stock options 14,389 14,389Stock issued for acquisitions 40 209,409 209,449Restricted shares earned by directors 345 345Net shares purchased pursuant to a
stock purchase plan (1,608) (1,608)Accelerated vesting of stock options 1,057 1,057Amortization of unearned compensation
from stock options 823 823
September 30, 2003 $1,120 $3,125,561 $892,853 $(14,217) $ — $4,005,317
292003 AmerisourceBergen Corporation
See notes to consolidated financial statements.
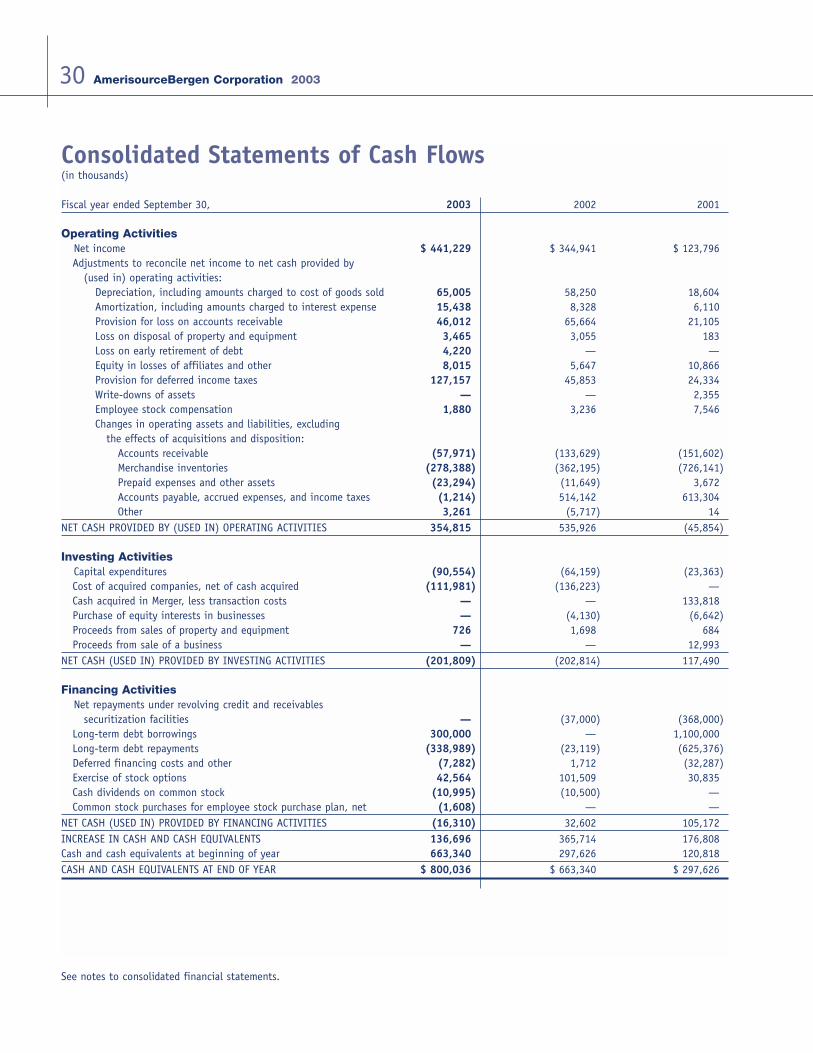
Consolidated Statements of Cash Flows(in thousands)
Fiscal year ended September 30, 2003 2002 2001
Operating ActivitiesNet income $ 441,229 $ 344,941 $ 123,796Adjustments to reconcile net income to net cash provided by
(used in) operating activities:Depreciation, including amounts charged to cost of goods sold 65,005 58,250 18,604Amortization, including amounts charged to interest expense 15,438 8,328 6,110Provision for loss on accounts receivable 46,012 65,664 21,105Loss on disposal of property and equipment 3,465 3,055 183Loss on early retirement of debt 4,220 — —Equity in losses of affiliates and other 8,015 5,647 10,866Provision for deferred income taxes 127,157 45,853 24,334Write-downs of assets — — 2,355Employee stock compensation 1,880 3,236 7,546Changes in operating assets and liabilities, excluding
the effects of acquisitions and disposition:Accounts receivable (57,971) (133,629) (151,602)Merchandise inventories (278,388) (362,195) (726,141)Prepaid expenses and other assets (23,294) (11,649) 3,672Accounts payable, accrued expenses, and income taxes (1,214) 514,142 613,304Other 3,261 (5,717) 14
NET CASH PROVIDED BY (USED IN) OPERATING ACTIVITIES 354,815 535,926 (45,854)
Investing ActivitiesCapital expenditures (90,554) (64,159) (23,363)Cost of acquired companies, net of cash acquired (111,981) (136,223) —Cash acquired in Merger, less transaction costs — — 133,818Purchase of equity interests in businesses — (4,130) (6,642)Proceeds from sales of property and equipment 726 1,698 684Proceeds from sale of a business — — 12,993
NET CASH (USED IN) PROVIDED BY INVESTING ACTIVITIES (201,809) (202,814) 117,490
Financing ActivitiesNet repayments under revolving credit and receivables
securitization facilities — (37,000) (368,000)Long-term debt borrowings 300,000 — 1,100,000Long-term debt repayments (338,989) (23,119) (625,376)Deferred financing costs and other (7,282) 1,712 (32,287)Exercise of stock options 42,564 101,509 30,835Cash dividends on common stock (10,995) (10,500) —Common stock purchases for employee stock purchase plan, net (1,608) — —
NET CASH (USED IN) PROVIDED BY FINANCING ACTIVITIES (16,310) 32,602 105,172INCREASE IN CASH AND CASH EQUIVALENTS 136,696 365,714 176,808Cash and cash equivalents at beginning of year 663,340 297,626 120,818CASH AND CASH EQUIVALENTS AT END OF YEAR $ 800,036 $ 663,340 $ 297,626
30 AmerisourceBergen Corporation 2003
See notes to consolidated financial statements.
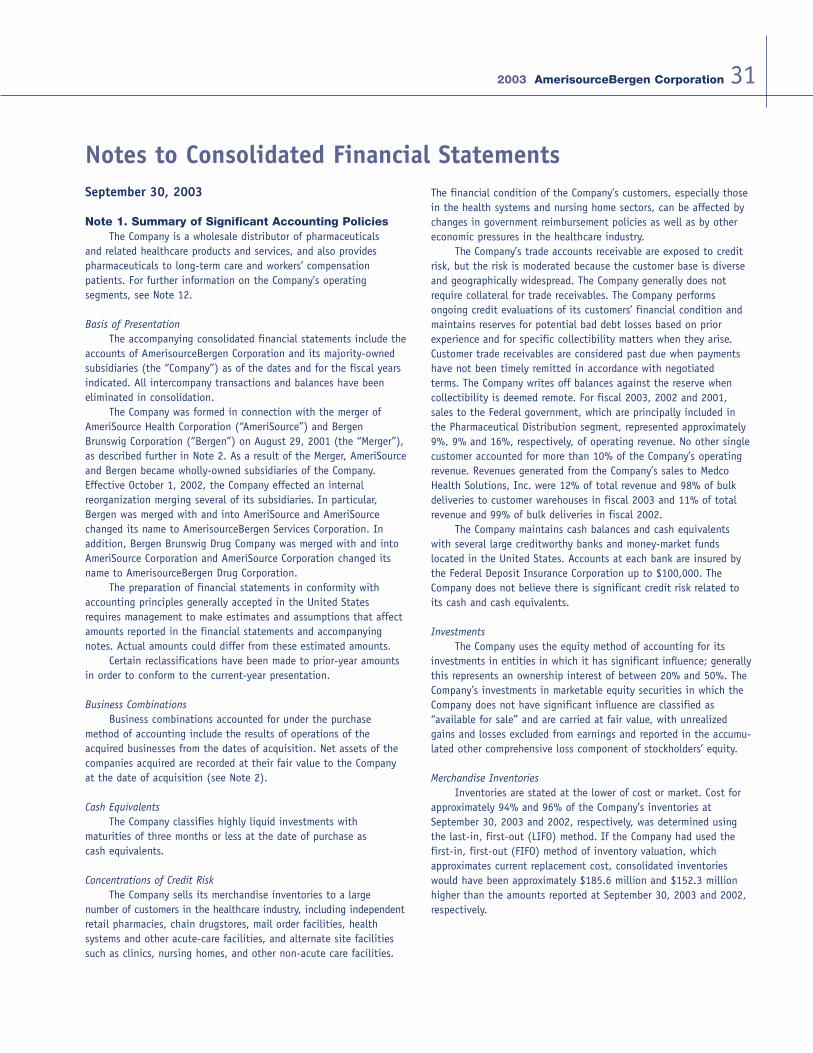
September 30, 2003
Note 1. Summary of Significant Accounting PoliciesThe Company is a wholesale distributor of pharmaceuticals
and related healthcare products and services, and also provides pharmaceuticals to long-term care and workers’ compensationpatients. For further information on the Company’s operating segments, see Note 12.
Basis of PresentationThe accompanying consolidated financial statements include the
accounts of AmerisourceBergen Corporation and its majority-ownedsubsidiaries (the “Company”) as of the dates and for the fiscal yearsindicated. All intercompany transactions and balances have beeneliminated in consolidation.
The Company was formed in connection with the merger ofAmeriSource Health Corporation (“AmeriSource”) and BergenBrunswig Corporation (“Bergen”) on August 29, 2001 (the “Merger”),as described further in Note 2. As a result of the Merger, AmeriSourceand Bergen became wholly-owned subsidiaries of the Company.Effective October 1, 2002, the Company effected an internal reorganization merging several of its subsidiaries. In particular,Bergen was merged with and into AmeriSource and AmeriSourcechanged its name to AmerisourceBergen Services Corporation. Inaddition, Bergen Brunswig Drug Company was merged with and intoAmeriSource Corporation and AmeriSource Corporation changed itsname to AmerisourceBergen Drug Corporation.
The preparation of financial statements in conformity withaccounting principles generally accepted in the United Statesrequires management to make estimates and assumptions that affectamounts reported in the financial statements and accompanyingnotes. Actual amounts could differ from these estimated amounts.
Certain reclassifications have been made to prior-year amountsin order to conform to the current-year presentation.
Business CombinationsBusiness combinations accounted for under the purchase
method of accounting include the results of operations of theacquired businesses from the dates of acquisition. Net assets of thecompanies acquired are recorded at their fair value to the Companyat the date of acquisition (see Note 2).
Cash EquivalentsThe Company classifies highly liquid investments with
maturities of three months or less at the date of purchase as cash equivalents.
Concentrations of Credit RiskThe Company sells its merchandise inventories to a large
number of customers in the healthcare industry, including independentretail pharmacies, chain drugstores, mail order facilities, health systems and other acute-care facilities, and alternate site facilitiessuch as clinics, nursing homes, and other non-acute care facilities.
The financial condition of the Company’s customers, especially thosein the health systems and nursing home sectors, can be affected bychanges in government reimbursement policies as well as by othereconomic pressures in the healthcare industry.
The Company’s trade accounts receivable are exposed to creditrisk, but the risk is moderated because the customer base is diverseand geographically widespread. The Company generally does notrequire collateral for trade receivables. The Company performs ongoing credit evaluations of its customers’ financial condition andmaintains reserves for potential bad debt losses based on prior experience and for specific collectibility matters when they arise.Customer trade receivables are considered past due when paymentshave not been timely remitted in accordance with negotiated terms. The Company writes off balances against the reserve whencollectibility is deemed remote. For fiscal 2003, 2002 and 2001,sales to the Federal government, which are principally included inthe Pharmaceutical Distribution segment, represented approximately9%, 9% and 16%, respectively, of operating revenue. No other singlecustomer accounted for more than 10% of the Company’s operatingrevenue. Revenues generated from the Company’s sales to MedcoHealth Solutions, Inc. were 12% of total revenue and 98% of bulkdeliveries to customer warehouses in fiscal 2003 and 11% of totalrevenue and 99% of bulk deliveries in fiscal 2002.
The Company maintains cash balances and cash equivalentswith several large creditworthy banks and money-market funds located in the United States. Accounts at each bank are insured bythe Federal Deposit Insurance Corporation up to $100,000. TheCompany does not believe there is significant credit risk related toits cash and cash equivalents.
InvestmentsThe Company uses the equity method of accounting for its
investments in entities in which it has significant influence; generallythis represents an ownership interest of between 20% and 50%. TheCompany’s investments in marketable equity securities in which theCompany does not have significant influence are classified as “available for sale” and are carried at fair value, with unrealizedgains and losses excluded from earnings and reported in the accumu-lated other comprehensive loss component of stockholders’ equity.
Merchandise InventoriesInventories are stated at the lower of cost or market. Cost for
approximately 94% and 96% of the Company’s inventories atSeptember 30, 2003 and 2002, respectively, was determined usingthe last-in, first-out (LIFO) method. If the Company had used thefirst-in, first-out (FIFO) method of inventory valuation, whichapproximates current replacement cost, consolidated inventorieswould have been approximately $185.6 million and $152.3 millionhigher than the amounts reported at September 30, 2003 and 2002,respectively.
312003 AmerisourceBergen Corporation
Notes to Consolidated Financial Statements
Property and EquipmentProperty and equipment are stated at cost and depreciated on
the straight-line method over the estimated useful lives of theassets, which range from 3 to 40 years.
Goodwill and Intangible AssetsThe Company adopted Financial Accounting Standards Board
(“FASB”) Statement of Financial Accounting Standards (“SFAS”) No.142 “Goodwill and Other Intangible Assets” as of October 1, 2001.Under SFAS No. 142, goodwill and intangible assets with indefinitelives are not amortized; rather, they are tested for impairment on atleast an annual basis. Accordingly, the Company ceased amortizationof all goodwill and intangible assets with indefinite lives as ofOctober 1, 2001. Intangible assets with finite lives, primarily cus-tomer lists, non-compete agreements and software technology, willcontinue to be amortized over their useful lives. Had the Companynot amortized goodwill during the fiscal year ended September 30,2001, net income for that year would have been approximately $0.9million higher than the reported amount and diluted earnings pershare would have been $0.02 higher than the reported amount.
SFAS No. 142 requires a two-step impairment test for goodwill.The first step is to compare the carrying amount of the reportingunit’s assets to the fair value of the reporting unit. If the fair valueexceeds the carrying value, no further work is required and noimpairment loss is recognized. If the carrying amount exceeds thefair value then the second step is required to be completed, whichinvolves allocating the fair value of the reporting unit to each assetand liability, with the excess being implied goodwill. An impairmentloss occurs if the amount of the recorded goodwill exceeds theimplied goodwill. The determination of the fair value of theCompany’s reporting units is based upon, among other things, estimates of future operating performance of the reporting unitbeing valued. The Company is required to complete an impairmenttest for goodwill and record any resulting impairment losses annually.Changes in market conditions, among other factors, may have animpact on these estimates. The Company completed its requiredannual impairment tests in the fourth quarters of fiscal 2003 and2002 and determined that there was no impairment.
Revenue RecognitionThe Company recognizes revenue when products are delivered
to customers. Service revenues are recognized as services are performed provided there are no further obligations to the customer.Revenues as reflected in the accompanying consolidated statementsof operations are net of sales returns and allowances. The Companyrecognizes sales returns as a reduction of revenue and cost of salesfor the sales price and cost, respectively, when products are returned.The Company’s customer return policy generally allows customers toreturn products only if the products can be resold at full value orreturned to suppliers for credit.
Along with other companies in the pharmaceutical distributionindustry, the Company reports the gross dollar amount of bulk deliveries to customer warehouses in revenue and the related costsin cost of goods sold. Bulk delivery transactions are arranged by theCompany at the express direction of the customer, and involve eithershipments from the supplier directly to customers’ warehouse sites or
shipments from the supplier to the Company for immediate shipmentto the customers’ warehouse sites. Gross profit earned by theCompany on bulk deliveries was not material in any year presented.
Shipping and Handling CostsShipping and handling costs include all costs to warehouse,
pick, pack and deliver inventory to customers. These costs, whichwere $381.8 million, $374.5 million and $173.4 million for the fiscalyears ended September 30, 2003, 2002 and 2001, respectively, areincluded in distribution, selling and administrative expenses.
Recently Issued Financial Accounting StandardsIn May 2003, the Financial Accounting Standards Board
(“FASB”) issued SFAS No. 150, “Accounting for Certain FinancialInstruments with Characteristics of both Liabilities and Equity.” Thisstatement clarifies the definition of a liability, as currently definedby FASB Concepts Statement No. 6 “Elements of FinancialStatements,” as well as other items. The statement requires thatfinancial instruments that embody an obligation of an issuer be classified as a liability. Furthermore, the standard provides guidancefor the initial and subsequent measurement as well as disclosurerequirements of these financial instruments. SFAS No. 150 is effective for financial instruments entered into or modified after May31, 2003, and otherwise is effective at the beginning of the firstinterim period beginning after June 15, 2003. The adoption of thisstatement did not have a material impact on the Company’s financialposition or results of operations.
In January 2003, the FASB issued Interpretation (“FIN”) No. 46,“Consolidation of Variable Interest Entities, an Interpretation ofAccounting Research Bulletin No. 51.” This interpretation clarifiesthe application of Accounting Research Bulletin No. 51,“Consolidated Financial Statements,” and requires consolidation ofvariable interest entities by their primary beneficiaries if certain conditions are met. This interpretation applies to variable interestentities created or obtained after January 31, 2003. For variableinterest entities created or obtained before February 1, 2003, theadoption of this standard is effective as of December 31, 2003 for avariable interest in special-purpose entities and as of March 31, 2004for all other variable interest entities. The Company did not create or obtain any variable interest entity after February 1, 2003. TheCompany is in the process of evaluating the adoption of this standard, as it relates to variable interest entities held by theCompany prior to February 1, 2003, but does not believe it will have a material impact on its consolidated financial statements.
In December 2002, the FASB issued SFAS No. 148, “Accountingfor Stock-Based Compensation – Transition and Disclosure.” SFAS No. 148 amends SFAS No. 123, “Accounting for Stock-BasedCompensation,” to provide alternative methods of transition to SFAS No. 123’s fair value method of accounting for stock-basedemployee compensation. SFAS No. 148 also amends the disclosureprovisions of SFAS No. 123 and Accounting Principles Board Opinion No. 28, “Interim Financial Reporting,” to require disclosurein the summary of significant accounting policies of the effects of an entity’s accounting policy with respect to stock-based employeecompensation on reported net income and earnings per share inannual and interim financial statements. The adoption of the
32 AmerisourceBergen Corporation 2003
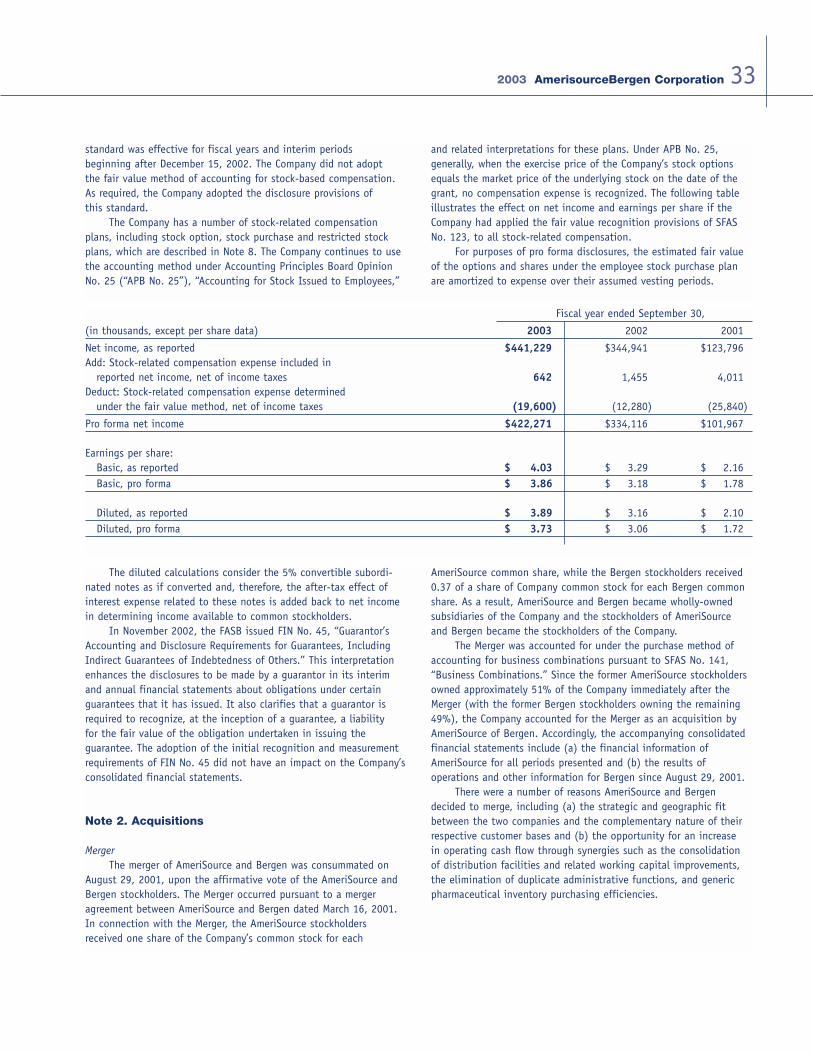
standard was effective for fiscal years and interim periods beginning after December 15, 2002. The Company did not adopt the fair value method of accounting for stock-based compensation.As required, the Company adopted the disclosure provisions of this standard.
The Company has a number of stock-related compensationplans, including stock option, stock purchase and restricted stockplans, which are described in Note 8. The Company continues to usethe accounting method under Accounting Principles Board OpinionNo. 25 (“APB No. 25”), “Accounting for Stock Issued to Employees,”
and related interpretations for these plans. Under APB No. 25, generally, when the exercise price of the Company’s stock optionsequals the market price of the underlying stock on the date of thegrant, no compensation expense is recognized. The following tableillustrates the effect on net income and earnings per share if theCompany had applied the fair value recognition provisions of SFASNo. 123, to all stock-related compensation.
For purposes of pro forma disclosures, the estimated fair valueof the options and shares under the employee stock purchase planare amortized to expense over their assumed vesting periods.
332003 AmerisourceBergen Corporation
Fiscal year ended September 30,
(in thousands, except per share data) 2003 2002 2001
Net income, as reported $441,229 $344,941 $123,796Add: Stock-related compensation expense included in
reported net income, net of income taxes 642 1,455 4,011Deduct: Stock-related compensation expense determined
under the fair value method, net of income taxes (19,600) (12,280) (25,840)
Pro forma net income $422,271 $334,116 $101,967
Earnings per share:Basic, as reported $ 4.03 $ 3.29 $ 2.16Basic, pro forma $ 3.86 $ 3.18 $ 1.78
Diluted, as reported $ 3.89 $ 3.16 $ 2.10Diluted, pro forma $ 3.73 $ 3.06 $ 1.72
The diluted calculations consider the 5% convertible subordi-nated notes as if converted and, therefore, the after-tax effect ofinterest expense related to these notes is added back to net incomein determining income available to common stockholders.
In November 2002, the FASB issued FIN No. 45, “Guarantor’sAccounting and Disclosure Requirements for Guarantees, IncludingIndirect Guarantees of Indebtedness of Others.” This interpretationenhances the disclosures to be made by a guarantor in its interimand annual financial statements about obligations under certainguarantees that it has issued. It also clarifies that a guarantor isrequired to recognize, at the inception of a guarantee, a liability for the fair value of the obligation undertaken in issuing the guarantee. The adoption of the initial recognition and measurementrequirements of FIN No. 45 did not have an impact on the Company’sconsolidated financial statements.
Note 2. Acquisitions
MergerThe merger of AmeriSource and Bergen was consummated on
August 29, 2001, upon the affirmative vote of the AmeriSource andBergen stockholders. The Merger occurred pursuant to a mergeragreement between AmeriSource and Bergen dated March 16, 2001.In connection with the Merger, the AmeriSource stockholdersreceived one share of the Company’s common stock for each
AmeriSource common share, while the Bergen stockholders received0.37 of a share of Company common stock for each Bergen commonshare. As a result, AmeriSource and Bergen became wholly-ownedsubsidiaries of the Company and the stockholders of AmeriSource and Bergen became the stockholders of the Company.
The Merger was accounted for under the purchase method ofaccounting for business combinations pursuant to SFAS No. 141,“Business Combinations.” Since the former AmeriSource stockholdersowned approximately 51% of the Company immediately after theMerger (with the former Bergen stockholders owning the remaining49%), the Company accounted for the Merger as an acquisition byAmeriSource of Bergen. Accordingly, the accompanying consolidatedfinancial statements include (a) the financial information ofAmeriSource for all periods presented and (b) the results of operations and other information for Bergen since August 29, 2001.
There were a number of reasons AmeriSource and Bergen decided to merge, including (a) the strategic and geographic fitbetween the two companies and the complementary nature of theirrespective customer bases and (b) the opportunity for an increase in operating cash flow through synergies such as the consolidationof distribution facilities and related working capital improvements,the elimination of duplicate administrative functions, and generic pharmaceutical inventory purchasing efficiencies.
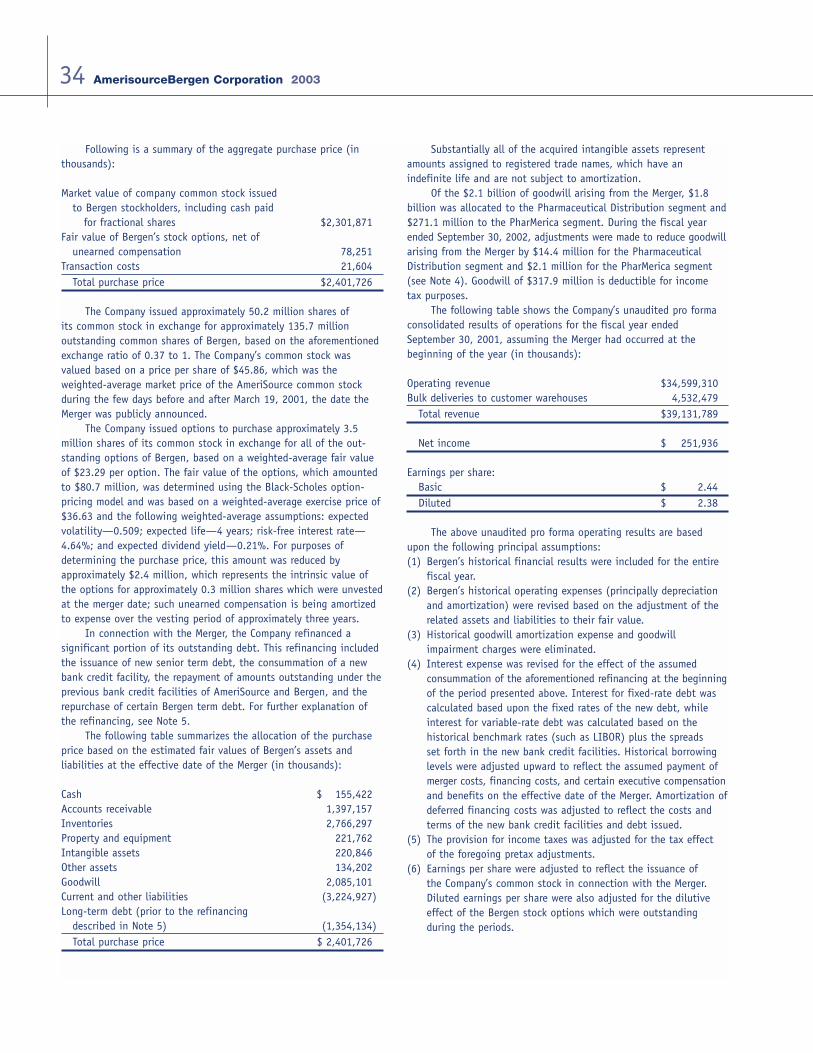
Following is a summary of the aggregate purchase price (inthousands):
Market value of company common stock issued to Bergen stockholders, including cash paid
for fractional shares $2,301,871Fair value of Bergen’s stock options, net of
unearned compensation 78,251Transaction costs 21,604
Total purchase price $2,401,726
The Company issued approximately 50.2 million shares of its common stock in exchange for approximately 135.7 million outstanding common shares of Bergen, based on the aforementionedexchange ratio of 0.37 to 1. The Company’s common stock was valued based on a price per share of $45.86, which was the weighted-average market price of the AmeriSource common stockduring the few days before and after March 19, 2001, the date theMerger was publicly announced.
The Company issued options to purchase approximately 3.5 million shares of its common stock in exchange for all of the out-standing options of Bergen, based on a weighted-average fair valueof $23.29 per option. The fair value of the options, which amountedto $80.7 million, was determined using the Black-Scholes option-pricing model and was based on a weighted-average exercise price of$36.63 and the following weighted-average assumptions: expectedvolatility—0.509; expected life—4 years; risk-free interest rate—4.64%; and expected dividend yield—0.21%. For purposes of determining the purchase price, this amount was reduced by approximately $2.4 million, which represents the intrinsic value ofthe options for approximately 0.3 million shares which were unvestedat the merger date; such unearned compensation is being amortizedto expense over the vesting period of approximately three years.
In connection with the Merger, the Company refinanced a significant portion of its outstanding debt. This refinancing includedthe issuance of new senior term debt, the consummation of a newbank credit facility, the repayment of amounts outstanding under theprevious bank credit facilities of AmeriSource and Bergen, and therepurchase of certain Bergen term debt. For further explanation ofthe refinancing, see Note 5.
The following table summarizes the allocation of the purchaseprice based on the estimated fair values of Bergen’s assets and liabilities at the effective date of the Merger (in thousands):
Cash $ 155,422Accounts receivable 1,397,157Inventories 2,766,297Property and equipment 221,762Intangible assets 220,846Other assets 134,202Goodwill 2,085,101Current and other liabilities (3,224,927)Long-term debt (prior to the refinancing
described in Note 5) (1,354,134)Total purchase price $ 2,401,726
Substantially all of the acquired intangible assets representamounts assigned to registered trade names, which have an indefinite life and are not subject to amortization.
Of the $2.1 billion of goodwill arising from the Merger, $1.8 billion was allocated to the Pharmaceutical Distribution segment and$271.1 million to the PharMerica segment. During the fiscal yearended September 30, 2002, adjustments were made to reduce goodwillarising from the Merger by $14.4 million for the PharmaceuticalDistribution segment and $2.1 million for the PharMerica segment(see Note 4). Goodwill of $317.9 million is deductible for income tax purposes.
The following table shows the Company’s unaudited pro formaconsolidated results of operations for the fiscal year endedSeptember 30, 2001, assuming the Merger had occurred at the beginning of the year (in thousands):
Operating revenue $34,599,310Bulk deliveries to customer warehouses 4,532,479
Total revenue $39,131,789
Net income $ 251,936
Earnings per share:Basic $ 2.44Diluted $ 2.38
The above unaudited pro forma operating results are basedupon the following principal assumptions:(1) Bergen’s historical financial results were included for the entire
fiscal year.(2) Bergen’s historical operating expenses (principally depreciation
and amortization) were revised based on the adjustment of therelated assets and liabilities to their fair value.
(3) Historical goodwill amortization expense and goodwill impairment charges were eliminated.
(4) Interest expense was revised for the effect of the assumed consummation of the aforementioned refinancing at the beginningof the period presented above. Interest for fixed-rate debt wascalculated based upon the fixed rates of the new debt, whileinterest for variable-rate debt was calculated based on the historical benchmark rates (such as LIBOR) plus the spreads set forth in the new bank credit facilities. Historical borrowinglevels were adjusted upward to reflect the assumed payment ofmerger costs, financing costs, and certain executive compensationand benefits on the effective date of the Merger. Amortization ofdeferred financing costs was adjusted to reflect the costs andterms of the new bank credit facilities and debt issued.
(5) The provision for income taxes was adjusted for the tax effect of the foregoing pretax adjustments.
(6) Earnings per share were adjusted to reflect the issuance of the Company’s common stock in connection with the Merger.Diluted earnings per share were also adjusted for the dilutiveeffect of the Bergen stock options which were outstanding during the periods.
34 AmerisourceBergen Corporation 2003
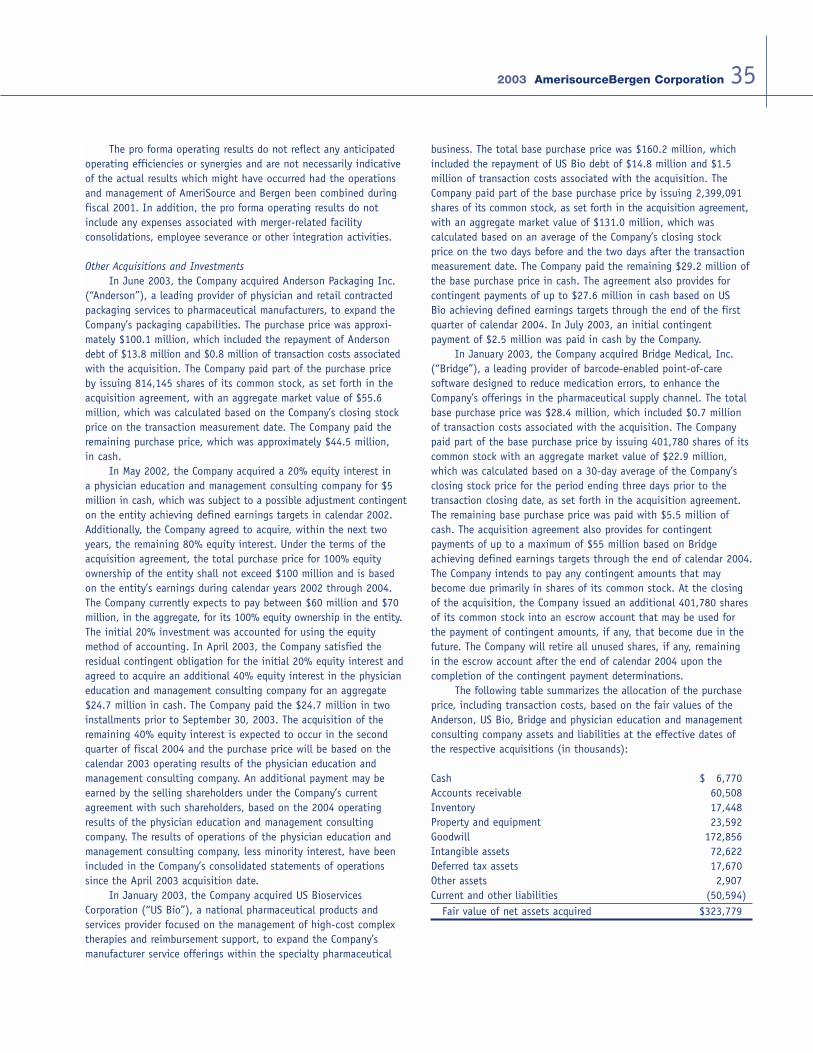
The pro forma operating results do not reflect any anticipatedoperating efficiencies or synergies and are not necessarily indicativeof the actual results which might have occurred had the operationsand management of AmeriSource and Bergen been combined duringfiscal 2001. In addition, the pro forma operating results do notinclude any expenses associated with merger-related facility consolidations, employee severance or other integration activities.
Other Acquisitions and InvestmentsIn June 2003, the Company acquired Anderson Packaging Inc.
(“Anderson”), a leading provider of physician and retail contractedpackaging services to pharmaceutical manufacturers, to expand theCompany’s packaging capabilities. The purchase price was approxi-mately $100.1 million, which included the repayment of Andersondebt of $13.8 million and $0.8 million of transaction costs associatedwith the acquisition. The Company paid part of the purchase price by issuing 814,145 shares of its common stock, as set forth in theacquisition agreement, with an aggregate market value of $55.6 million, which was calculated based on the Company’s closing stockprice on the transaction measurement date. The Company paid theremaining purchase price, which was approximately $44.5 million, in cash.
In May 2002, the Company acquired a 20% equity interest in a physician education and management consulting company for $5 million in cash, which was subject to a possible adjustment contingenton the entity achieving defined earnings targets in calendar 2002.Additionally, the Company agreed to acquire, within the next twoyears, the remaining 80% equity interest. Under the terms of theacquisition agreement, the total purchase price for 100% equityownership of the entity shall not exceed $100 million and is basedon the entity’s earnings during calendar years 2002 through 2004.The Company currently expects to pay between $60 million and $70million, in the aggregate, for its 100% equity ownership in the entity.The initial 20% investment was accounted for using the equitymethod of accounting. In April 2003, the Company satisfied theresidual contingent obligation for the initial 20% equity interest andagreed to acquire an additional 40% equity interest in the physicianeducation and management consulting company for an aggregate$24.7 million in cash. The Company paid the $24.7 million in twoinstallments prior to September 30, 2003. The acquisition of theremaining 40% equity interest is expected to occur in the secondquarter of fiscal 2004 and the purchase price will be based on thecalendar 2003 operating results of the physician education and management consulting company. An additional payment may beearned by the selling shareholders under the Company’s currentagreement with such shareholders, based on the 2004 operatingresults of the physician education and management consulting company. The results of operations of the physician education andmanagement consulting company, less minority interest, have beenincluded in the Company’s consolidated statements of operationssince the April 2003 acquisition date.
In January 2003, the Company acquired US BioservicesCorporation (“US Bio”), a national pharmaceutical products and services provider focused on the management of high-cost complextherapies and reimbursement support, to expand the Company’s manufacturer service offerings within the specialty pharmaceutical
business. The total base purchase price was $160.2 million, whichincluded the repayment of US Bio debt of $14.8 million and $1.5million of transaction costs associated with the acquisition. TheCompany paid part of the base purchase price by issuing 2,399,091shares of its common stock, as set forth in the acquisition agreement,with an aggregate market value of $131.0 million, which was calculated based on an average of the Company’s closing stock price on the two days before and the two days after the transactionmeasurement date. The Company paid the remaining $29.2 million ofthe base purchase price in cash. The agreement also provides forcontingent payments of up to $27.6 million in cash based on US Bio achieving defined earnings targets through the end of the firstquarter of calendar 2004. In July 2003, an initial contingent payment of $2.5 million was paid in cash by the Company.
In January 2003, the Company acquired Bridge Medical, Inc.(“Bridge”), a leading provider of barcode-enabled point-of-care software designed to reduce medication errors, to enhance theCompany’s offerings in the pharmaceutical supply channel. The totalbase purchase price was $28.4 million, which included $0.7 millionof transaction costs associated with the acquisition. The Companypaid part of the base purchase price by issuing 401,780 shares of itscommon stock with an aggregate market value of $22.9 million,which was calculated based on a 30-day average of the Company’sclosing stock price for the period ending three days prior to thetransaction closing date, as set forth in the acquisition agreement.The remaining base purchase price was paid with $5.5 million ofcash. The acquisition agreement also provides for contingent payments of up to a maximum of $55 million based on Bridgeachieving defined earnings targets through the end of calendar 2004.The Company intends to pay any contingent amounts that maybecome due primarily in shares of its common stock. At the closingof the acquisition, the Company issued an additional 401,780 sharesof its common stock into an escrow account that may be used forthe payment of contingent amounts, if any, that become due in thefuture. The Company will retire all unused shares, if any, remainingin the escrow account after the end of calendar 2004 upon the completion of the contingent payment determinations.
The following table summarizes the allocation of the purchaseprice, including transaction costs, based on the fair values of theAnderson, US Bio, Bridge and physician education and managementconsulting company assets and liabilities at the effective dates ofthe respective acquisitions (in thousands):
Cash $ 6,770Accounts receivable 60,508Inventory 17,448Property and equipment 23,592Goodwill 172,856Intangible assets 72,622Deferred tax assets 17,670Other assets 2,907Current and other liabilities (50,594)
Fair value of net assets acquired $323,779
352003 AmerisourceBergen Corporation
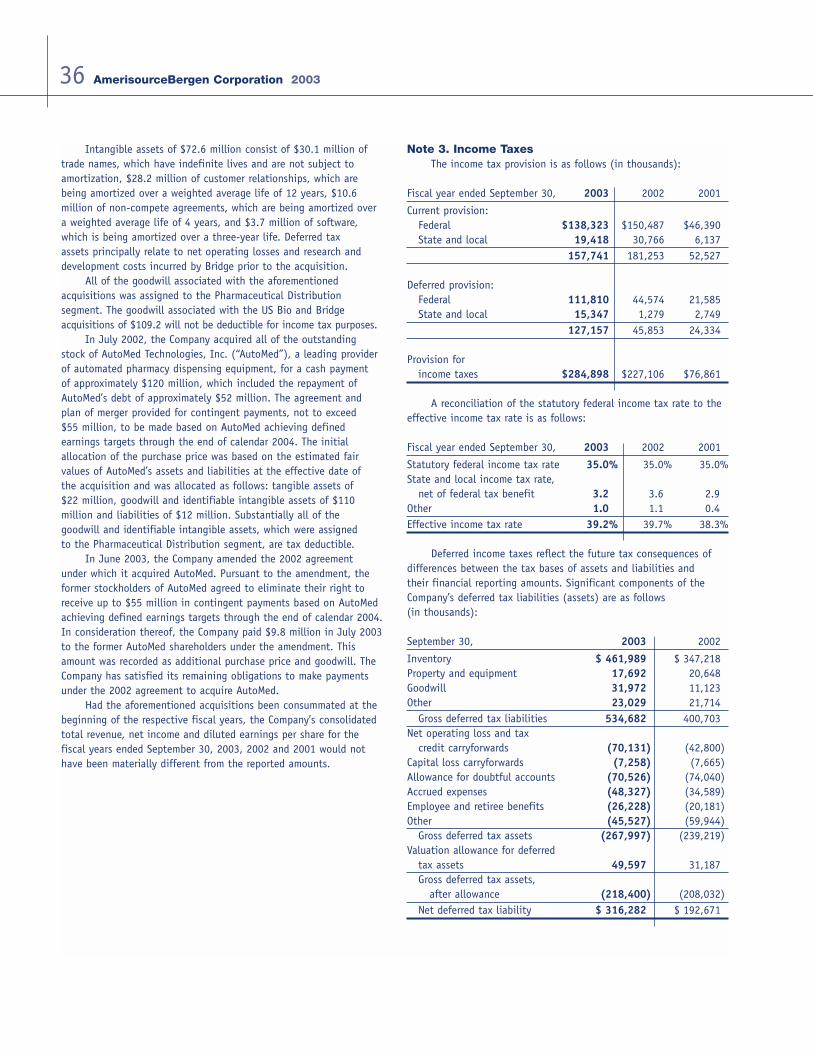
Intangible assets of $72.6 million consist of $30.1 million oftrade names, which have indefinite lives and are not subject toamortization, $28.2 million of customer relationships, which arebeing amortized over a weighted average life of 12 years, $10.6 million of non-compete agreements, which are being amortized overa weighted average life of 4 years, and $3.7 million of software,which is being amortized over a three-year life. Deferred tax assets principally relate to net operating losses and research anddevelopment costs incurred by Bridge prior to the acquisition.
All of the goodwill associated with the aforementioned acquisitions was assigned to the Pharmaceutical Distribution segment. The goodwill associated with the US Bio and Bridge acquisitions of $109.2 will not be deductible for income tax purposes.
In July 2002, the Company acquired all of the outstandingstock of AutoMed Technologies, Inc. (“AutoMed”), a leading providerof automated pharmacy dispensing equipment, for a cash payment of approximately $120 million, which included the repayment ofAutoMed’s debt of approximately $52 million. The agreement andplan of merger provided for contingent payments, not to exceed $55 million, to be made based on AutoMed achieving defined earnings targets through the end of calendar 2004. The initial allocation of the purchase price was based on the estimated fair values of AutoMed’s assets and liabilities at the effective date of the acquisition and was allocated as follows: tangible assets of $22 million, goodwill and identifiable intangible assets of $110 million and liabilities of $12 million. Substantially all of the goodwill and identifiable intangible assets, which were assigned to the Pharmaceutical Distribution segment, are tax deductible.
In June 2003, the Company amended the 2002 agreement under which it acquired AutoMed. Pursuant to the amendment, theformer stockholders of AutoMed agreed to eliminate their right toreceive up to $55 million in contingent payments based on AutoMedachieving defined earnings targets through the end of calendar 2004.In consideration thereof, the Company paid $9.8 million in July 2003to the former AutoMed shareholders under the amendment. Thisamount was recorded as additional purchase price and goodwill. TheCompany has satisfied its remaining obligations to make paymentsunder the 2002 agreement to acquire AutoMed.
Had the aforementioned acquisitions been consummated at thebeginning of the respective fiscal years, the Company’s consolidatedtotal revenue, net income and diluted earnings per share for the fiscal years ended September 30, 2003, 2002 and 2001 would nothave been materially different from the reported amounts.
Note 3. Income TaxesThe income tax provision is as follows (in thousands):
Fiscal year ended September 30, 2003 2002 2001
Current provision:Federal $138,323 $150,487 $46,390State and local 19,418 30,766 6,137
157,741 181,253 52,527
Deferred provision:Federal 111,810 44,574 21,585State and local 15,347 1,279 2,749
127,157 45,853 24,334
Provision for income taxes $284,898 $227,106 $76,861
A reconciliation of the statutory federal income tax rate to theeffective income tax rate is as follows:
Fiscal year ended September 30, 2003 2002 2001
Statutory federal income tax rate 35.0% 35.0% 35.0%State and local income tax rate,
net of federal tax benefit 3.2 3.6 2.9Other 1.0 1.1 0.4Effective income tax rate 39.2% 39.7% 38.3%
Deferred income taxes reflect the future tax consequences ofdifferences between the tax bases of assets and liabilities and their financial reporting amounts. Significant components of theCompany’s deferred tax liabilities (assets) are as follows (in thousands):
September 30, 2003 2002
Inventory $ 461,989 $ 347,218Property and equipment 17,692 20,648Goodwill 31,972 11,123Other 23,029 21,714
Gross deferred tax liabilities 534,682 400,703Net operating loss and tax
credit carryforwards (70,131) (42,800)Capital loss carryforwards (7,258) (7,665)Allowance for doubtful accounts (70,526) (74,040)Accrued expenses (48,327) (34,589)Employee and retiree benefits (26,228) (20,181)Other (45,527) (59,944)
Gross deferred tax assets (267,997) (239,219)Valuation allowance for deferred
tax assets 49,597 31,187Gross deferred tax assets,
after allowance (218,400) (208,032)Net deferred tax liability $ 316,282 $ 192,671
36 AmerisourceBergen Corporation 2003
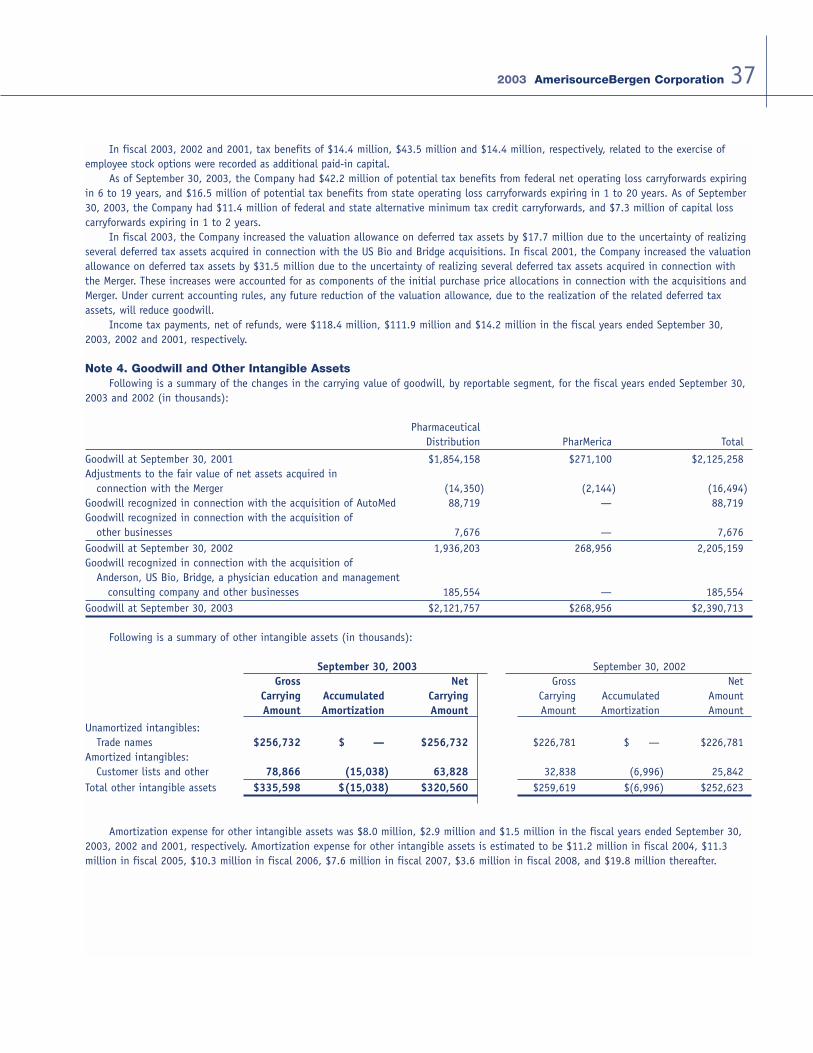
In fiscal 2003, 2002 and 2001, tax benefits of $14.4 million, $43.5 million and $14.4 million, respectively, related to the exercise ofemployee stock options were recorded as additional paid-in capital.
As of September 30, 2003, the Company had $42.2 million of potential tax benefits from federal net operating loss carryforwards expiringin 6 to 19 years, and $16.5 million of potential tax benefits from state operating loss carryforwards expiring in 1 to 20 years. As of September30, 2003, the Company had $11.4 million of federal and state alternative minimum tax credit carryforwards, and $7.3 million of capital losscarryforwards expiring in 1 to 2 years.
In fiscal 2003, the Company increased the valuation allowance on deferred tax assets by $17.7 million due to the uncertainty of realizingseveral deferred tax assets acquired in connection with the US Bio and Bridge acquisitions. In fiscal 2001, the Company increased the valuationallowance on deferred tax assets by $31.5 million due to the uncertainty of realizing several deferred tax assets acquired in connection withthe Merger. These increases were accounted for as components of the initial purchase price allocations in connection with the acquisitions andMerger. Under current accounting rules, any future reduction of the valuation allowance, due to the realization of the related deferred taxassets, will reduce goodwill.
Income tax payments, net of refunds, were $118.4 million, $111.9 million and $14.2 million in the fiscal years ended September 30,2003, 2002 and 2001, respectively.
Note 4. Goodwill and Other Intangible AssetsFollowing is a summary of the changes in the carrying value of goodwill, by reportable segment, for the fiscal years ended September 30,
2003 and 2002 (in thousands):
PharmaceuticalDistribution PharMerica Total
Goodwill at September 30, 2001 $1,854,158 $271,100 $2,125,258Adjustments to the fair value of net assets acquired in
connection with the Merger (14,350) (2,144) (16,494)Goodwill recognized in connection with the acquisition of AutoMed 88,719 — 88,719Goodwill recognized in connection with the acquisition of
other businesses 7,676 — 7,676Goodwill at September 30, 2002 1,936,203 268,956 2,205,159Goodwill recognized in connection with the acquisition of
Anderson, US Bio, Bridge, a physician education and management consulting company and other businesses 185,554 — 185,554
Goodwill at September 30, 2003 $2,121,757 $268,956 $2,390,713
Following is a summary of other intangible assets (in thousands):
September 30, 2003 September 30, 2002Gross Net Gross Net
Carrying Accumulated Carrying Carrying Accumulated AmountAmount Amortization Amount Amount Amortization Amount
Unamortized intangibles:Trade names $256,732 $ — $256,732 $226,781 $ — $226,781
Amortized intangibles:Customer lists and other 78,866 (15,038) 63,828 32,838 (6,996) 25,842
Total other intangible assets $335,598 $(15,038) $320,560 $259,619 $(6,996) $252,623
Amortization expense for other intangible assets was $8.0 million, $2.9 million and $1.5 million in the fiscal years ended September 30,2003, 2002 and 2001, respectively. Amortization expense for other intangible assets is estimated to be $11.2 million in fiscal 2004, $11.3 million in fiscal 2005, $10.3 million in fiscal 2006, $7.6 million in fiscal 2007, $3.6 million in fiscal 2008, and $19.8 million thereafter.
372003 AmerisourceBergen Corporation
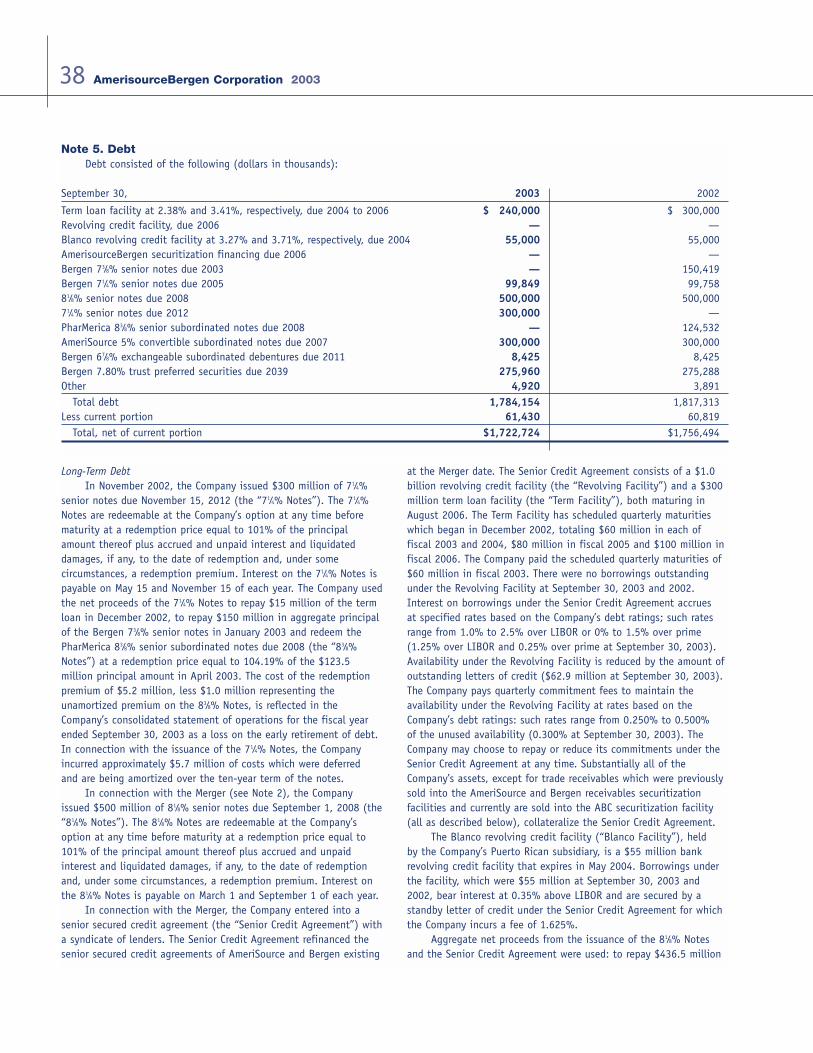
Note 5. DebtDebt consisted of the following (dollars in thousands):
September 30, 2003 2002
Term loan facility at 2.38% and 3.41%, respectively, due 2004 to 2006 $ 240,000 $ 300,000Revolving credit facility, due 2006 — —Blanco revolving credit facility at 3.27% and 3.71%, respectively, due 2004 55,000 55,000AmerisourceBergen securitization financing due 2006 — —Bergen 73⁄8% senior notes due 2003 — 150,419Bergen 71⁄4% senior notes due 2005 99,849 99,75881⁄8% senior notes due 2008 500,000 500,00071⁄4% senior notes due 2012 300,000 —PharMerica 83⁄8% senior subordinated notes due 2008 — 124,532AmeriSource 5% convertible subordinated notes due 2007 300,000 300,000Bergen 67⁄8% exchangeable subordinated debentures due 2011 8,425 8,425Bergen 7.80% trust preferred securities due 2039 275,960 275,288Other 4,920 3,891
Total debt 1,784,154 1,817,313Less current portion 61,430 60,819
Total, net of current portion $1,722,724 $1,756,494
38 AmerisourceBergen Corporation 2003
Long-Term DebtIn November 2002, the Company issued $300 million of 71⁄4%
senior notes due November 15, 2012 (the “71⁄4% Notes”). The 71⁄4%Notes are redeemable at the Company’s option at any time beforematurity at a redemption price equal to 101% of the principalamount thereof plus accrued and unpaid interest and liquidated damages, if any, to the date of redemption and, under some circumstances, a redemption premium. Interest on the 71⁄4% Notes ispayable on May 15 and November 15 of each year. The Company usedthe net proceeds of the 71⁄4% Notes to repay $15 million of the termloan in December 2002, to repay $150 million in aggregate principalof the Bergen 73⁄8% senior notes in January 2003 and redeem thePharMerica 83⁄8% senior subordinated notes due 2008 (the “83⁄8%Notes”) at a redemption price equal to 104.19% of the $123.5 million principal amount in April 2003. The cost of the redemptionpremium of $5.2 million, less $1.0 million representing the unamortized premium on the 83⁄8% Notes, is reflected in theCompany’s consolidated statement of operations for the fiscal yearended September 30, 2003 as a loss on the early retirement of debt.In connection with the issuance of the 71⁄4% Notes, the Companyincurred approximately $5.7 million of costs which were deferred and are being amortized over the ten-year term of the notes.
In connection with the Merger (see Note 2), the Companyissued $500 million of 81⁄8% senior notes due September 1, 2008 (the“81⁄8% Notes”). The 81⁄8% Notes are redeemable at the Company’soption at any time before maturity at a redemption price equal to101% of the principal amount thereof plus accrued and unpaid interest and liquidated damages, if any, to the date of redemptionand, under some circumstances, a redemption premium. Interest onthe 81⁄8% Notes is payable on March 1 and September 1 of each year.
In connection with the Merger, the Company entered into asenior secured credit agreement (the “Senior Credit Agreement”) witha syndicate of lenders. The Senior Credit Agreement refinanced thesenior secured credit agreements of AmeriSource and Bergen existing
at the Merger date. The Senior Credit Agreement consists of a $1.0billion revolving credit facility (the “Revolving Facility”) and a $300million term loan facility (the “Term Facility”), both maturing inAugust 2006. The Term Facility has scheduled quarterly maturitieswhich began in December 2002, totaling $60 million in each of fiscal 2003 and 2004, $80 million in fiscal 2005 and $100 million infiscal 2006. The Company paid the scheduled quarterly maturities of$60 million in fiscal 2003. There were no borrowings outstandingunder the Revolving Facility at September 30, 2003 and 2002.Interest on borrowings under the Senior Credit Agreement accrues at specified rates based on the Company’s debt ratings; such ratesrange from 1.0% to 2.5% over LIBOR or 0% to 1.5% over prime(1.25% over LIBOR and 0.25% over prime at September 30, 2003).Availability under the Revolving Facility is reduced by the amount ofoutstanding letters of credit ($62.9 million at September 30, 2003).The Company pays quarterly commitment fees to maintain the availability under the Revolving Facility at rates based on theCompany’s debt ratings: such rates range from 0.250% to 0.500% of the unused availability (0.300% at September 30, 2003). TheCompany may choose to repay or reduce its commitments under theSenior Credit Agreement at any time. Substantially all of theCompany’s assets, except for trade receivables which were previouslysold into the AmeriSource and Bergen receivables securitization facilities and currently are sold into the ABC securitization facility(all as described below), collateralize the Senior Credit Agreement.
The Blanco revolving credit facility (“Blanco Facility”), held by the Company’s Puerto Rican subsidiary, is a $55 million bankrevolving credit facility that expires in May 2004. Borrowings underthe facility, which were $55 million at September 30, 2003 and2002, bear interest at 0.35% above LIBOR and are secured by astandby letter of credit under the Senior Credit Agreement for whichthe Company incurs a fee of 1.625%.
Aggregate net proceeds from the issuance of the 81⁄8% Notesand the Senior Credit Agreement were used: to repay $436.5 million
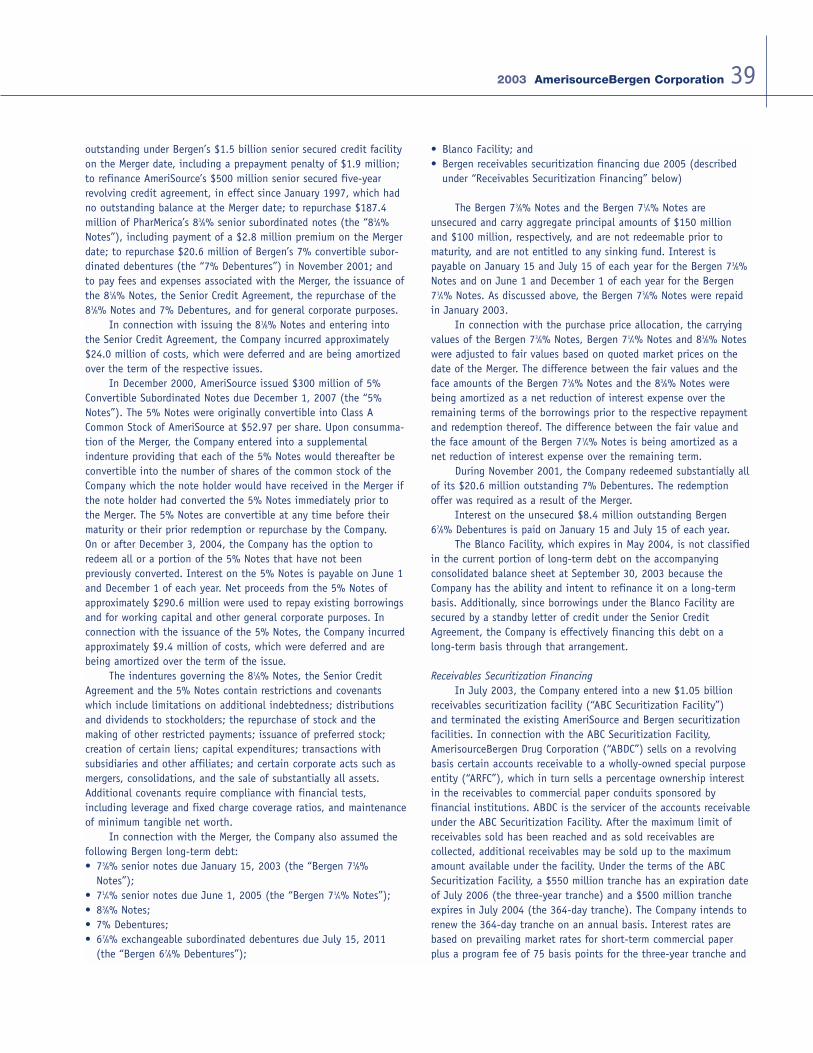
outstanding under Bergen’s $1.5 billion senior secured credit facilityon the Merger date, including a prepayment penalty of $1.9 million;to refinance AmeriSource’s $500 million senior secured five-yearrevolving credit agreement, in effect since January 1997, which hadno outstanding balance at the Merger date; to repurchase $187.4million of PharMerica’s 83⁄8% senior subordinated notes (the “83⁄8%Notes”), including payment of a $2.8 million premium on the Mergerdate; to repurchase $20.6 million of Bergen’s 7% convertible subor-dinated debentures (the “7% Debentures”) in November 2001; and to pay fees and expenses associated with the Merger, the issuance ofthe 81⁄8% Notes, the Senior Credit Agreement, the repurchase of the83⁄8% Notes and 7% Debentures, and for general corporate purposes.
In connection with issuing the 81⁄8% Notes and entering intothe Senior Credit Agreement, the Company incurred approximately$24.0 million of costs, which were deferred and are being amortizedover the term of the respective issues.
In December 2000, AmeriSource issued $300 million of 5%Convertible Subordinated Notes due December 1, 2007 (the “5%Notes”). The 5% Notes were originally convertible into Class ACommon Stock of AmeriSource at $52.97 per share. Upon consumma-tion of the Merger, the Company entered into a supplemental indenture providing that each of the 5% Notes would thereafter beconvertible into the number of shares of the common stock of theCompany which the note holder would have received in the Merger ifthe note holder had converted the 5% Notes immediately prior tothe Merger. The 5% Notes are convertible at any time before theirmaturity or their prior redemption or repurchase by the Company. On or after December 3, 2004, the Company has the option toredeem all or a portion of the 5% Notes that have not been previously converted. Interest on the 5% Notes is payable on June 1and December 1 of each year. Net proceeds from the 5% Notes ofapproximately $290.6 million were used to repay existing borrowingsand for working capital and other general corporate purposes. Inconnection with the issuance of the 5% Notes, the Company incurredapproximately $9.4 million of costs, which were deferred and arebeing amortized over the term of the issue.
The indentures governing the 81⁄8% Notes, the Senior CreditAgreement and the 5% Notes contain restrictions and covenantswhich include limitations on additional indebtedness; distributionsand dividends to stockholders; the repurchase of stock and the making of other restricted payments; issuance of preferred stock; creation of certain liens; capital expenditures; transactions with subsidiaries and other affiliates; and certain corporate acts such asmergers, consolidations, and the sale of substantially all assets.Additional covenants require compliance with financial tests, including leverage and fixed charge coverage ratios, and maintenanceof minimum tangible net worth.
In connection with the Merger, the Company also assumed thefollowing Bergen long-term debt:• 73⁄8% senior notes due January 15, 2003 (the “Bergen 73⁄8%
Notes”);• 71⁄4% senior notes due June 1, 2005 (the “Bergen 71⁄4% Notes”);• 83⁄8% Notes;• 7% Debentures;• 67⁄8% exchangeable subordinated debentures due July 15, 2011
(the “Bergen 67⁄8% Debentures”);
• Blanco Facility; and• Bergen receivables securitization financing due 2005 (described
under “Receivables Securitization Financing” below)
The Bergen 73⁄8% Notes and the Bergen 71⁄4% Notes are unsecured and carry aggregate principal amounts of $150 million and $100 million, respectively, and are not redeemable prior tomaturity, and are not entitled to any sinking fund. Interest ispayable on January 15 and July 15 of each year for the Bergen 73⁄8%Notes and on June 1 and December 1 of each year for the Bergen71⁄4% Notes. As discussed above, the Bergen 73⁄8% Notes were repaidin January 2003.
In connection with the purchase price allocation, the carryingvalues of the Bergen 73⁄8% Notes, Bergen 71⁄4% Notes and 83⁄8% Noteswere adjusted to fair values based on quoted market prices on thedate of the Merger. The difference between the fair values and theface amounts of the Bergen 73⁄8% Notes and the 83⁄8% Notes werebeing amortized as a net reduction of interest expense over theremaining terms of the borrowings prior to the respective repaymentand redemption thereof. The difference between the fair value andthe face amount of the Bergen 71⁄4% Notes is being amortized as anet reduction of interest expense over the remaining term.
During November 2001, the Company redeemed substantially allof its $20.6 million outstanding 7% Debentures. The redemptionoffer was required as a result of the Merger.
Interest on the unsecured $8.4 million outstanding Bergen 67⁄8% Debentures is paid on January 15 and July 15 of each year.
The Blanco Facility, which expires in May 2004, is not classifiedin the current portion of long-term debt on the accompanying consolidated balance sheet at September 30, 2003 because theCompany has the ability and intent to refinance it on a long-termbasis. Additionally, since borrowings under the Blanco Facility aresecured by a standby letter of credit under the Senior CreditAgreement, the Company is effectively financing this debt on a long-term basis through that arrangement.
Receivables Securitization FinancingIn July 2003, the Company entered into a new $1.05 billion
receivables securitization facility (“ABC Securitization Facility”) and terminated the existing AmeriSource and Bergen securitization facilities. In connection with the ABC Securitization Facility,AmerisourceBergen Drug Corporation (“ABDC”) sells on a revolvingbasis certain accounts receivable to a wholly-owned special purposeentity (“ARFC”), which in turn sells a percentage ownership interestin the receivables to commercial paper conduits sponsored by financial institutions. ABDC is the servicer of the accounts receivableunder the ABC Securitization Facility. After the maximum limit ofreceivables sold has been reached and as sold receivables are collected, additional receivables may be sold up to the maximumamount available under the facility. Under the terms of the ABCSecuritization Facility, a $550 million tranche has an expiration dateof July 2006 (the three-year tranche) and a $500 million trancheexpires in July 2004 (the 364-day tranche). The Company intends torenew the 364-day tranche on an annual basis. Interest rates arebased on prevailing market rates for short-term commercial paperplus a program fee of 75 basis points for the three-year tranche and
392003 AmerisourceBergen Corporation
45 basis points for the 364-day tranche. The Company pays a commitment fee of 30 basis points and 25 basis points on anyunused credit with respect to the three-year tranche and the 364-daytranche, respectively. The program and commitment fee rates willvary based on the Company’s debt ratings. Borrowings and paymentsunder the ABC Securitization Facility are applied on a pro-rata basisto the $550 million and $500 million tranches. In connection withentering into the ABC Securitization Facility, the Company incurredapproximately $2.4 million of costs which were deferred and arebeing amortized over the life of the ABC Securitization Facility. The Company securitizes its trade accounts, which are generally non-interest bearing, in transactions that are accounted for as borrowings under SFAS No. 140, “Accounting for Transfers andServicing of Financial Assets and Extinguishments of Liabilities.”
The agreement governing the ABC Securitization Facility contains restrictions and covenants which include limitations on theincurrence of additional indebtedness, making of certain restrictedpayments, issuance of preferred stock, creation of certain liens, andcertain corporate acts such as mergers, consolidations and sale ofsubstantially all assets.
The Company previously utilized the receivables securitizationfacilities initiated by AmeriSource (the “ARFC Securitization Facility”)and Bergen (the “Blue Hill Securitization Program”). In connectionwith an internal reorganization on October 1, 2002 (see Note 1),both of these securitization facilities were amended to permit suchreorganization and to provide for the designation of the trade receivables of the merged ABDC that would be sold into the ARFCSecuritization Facility and the Blue Hill Securitization Program.
The ARFC Securitization Facility previously provided a total borrowing capacity of $400 million. In connection with the ARFCSecuritization Facility, ABDC sold on a revolving basis certainaccounts receivable to ARFC, which in turn sold a percentage ownership interest in the receivables to a commercial paper conduitsponsored by a financial institution. ABDC was the servicer of theaccounts receivable under the ARFC Securitization Facility. After themaximum limit of receivables sold had been reached and as soldreceivables were collected, additional receivables may have been soldup to the maximum amount receivable under the facility. The ARFCSecuritization Facility had an expiration date of May 2004, prior toits termination. Interest was at a rate at which funds were obtainedby the financial institution to fund the receivables (short-term commercial paper rates) plus a program fee of 38.5 basis points. Inorder to borrow available amounts under this securitization facility, a back-up 364-day liquidity facility was required to be in place.ABDC was required to pay a commitment fee of 25 basis points on any unused credit in excess of $25 million. At September 30,2002, there were no borrowings outstanding under the ARFCSecuritization Facility.
The Blue Hill Securitization Program previously provided a totalborrowing capacity of $450 million. In connection with the Blue HillSecuritization Program, ABDC sold on a revolving basis certainaccounts receivable to a 100%-owned special purpose entity (“BlueHill”), which in turn sold a percentage ownership interest in thereceivables to a commercial paper conduit sponsored by a financialinstitution. ABDC was the servicer of the accounts receivable underthe Blue Hill Securitization Program. After the maximum limit of
receivables sold had been reached and as sold receivables were collected, additional receivables may have been sold up to the maximum amount receivable under the program. The Blue HillSecuritization Program had an expiration date of December 2005,prior to its termination. Interest was at short-term commercial paperrates plus a program fee of 75 basis points. ABDC was required topay a commitment fee of 25 basis points on any unused credit. AtSeptember 30, 2002, there were no borrowings outstanding underthe Blue Hill Securitization Program.
Transactions under the ARFC Securitization Facility and the BlueHill Securitization Program were accounted for as borrowings inaccordance with SFAS No. 140.
Preferred Securities of TrustIn connection with the Merger, the Company assumed Bergen’s
Capital I Trust (the “Trust”), a wholly-owned subsidiary of Bergen. In May 1999, the Trust issued 12,000,000 shares of 7.80% TrustOriginated Preferred Securities (SM) (TOPrS(SM)) (the “Trust PreferredSecurities”) at $25 per security. The proceeds of such issuances wereinvested by the Trust in $300 million aggregate principal amount ofBergen’s 7.80% Subordinated Deferrable Interest Notes due June 30,2039 (the “Subordinated Notes”). The Subordinated Notes representthe sole assets of the Trust and bear interest at the annual rate of7.80%, payable quarterly, and are redeemable by the Company beginning in May 2004 at 100% of the principal amount thereof. TheTrust Preferred Securities will be redeemable upon any repayment ofthe Subordinated Notes at 100% of the liquidation amount beginningin May 2004. The obligations of the Trust related to the PreferredSecurities are fully and unconditionally guaranteed by the Company.
Holders of the Trust Preferred Securities are entitled to cumulative cash distributions at an annual rate of 7.80% of the liquidation amount of $25 per security. Cash distributions are classified as interest expense in the accompanying consolidatedstatements of operations. The Company, under certain conditions,may cause the Trust to defer the payment of distributions for successive periods of up to 20 consecutive quarters. During suchperiods, accrued distributions on the Trust Preferred Securities willcompound quarterly at an annual rate of 7.80%. Also during suchperiods, the Company may not declare or pay distributions on itscapital stock; may not redeem, purchase or make a liquidation payment on any of its capital stock; and may not make interest,principal or premium payments on, or repurchase or redeem, any of its debt securities that rank equal with or junior to theSubordinated Notes.
In connection with the purchase price allocation, the carryingvalue of the Trust Preferred Securities was adjusted to fair valuebased on quoted market prices on the date of the Merger. The difference between the fair value and the face amount of the Trust Preferred Securities is accreted to redemption value over theremaining term of the Trust Preferred Securities and is recorded as an increase in interest expense in the accompanying consolidatedstatements of operations.
The Subordinated Notes and the related Trust investment in theSubordinated Notes have been eliminated in consolidation and theTrust Preferred Securities are reflected as outstanding debt in theaccompanying consolidated balance sheets.
40 AmerisourceBergen Corporation 2003
Other InformationScheduled future principal payments of long-term debt are
$116.4 million in fiscal 2004, $180.6 million in fiscal 2005, $100.7million in fiscal 2006, $0.7 million in fiscal 2007, $800.7 million infiscal 2008 and $585.1 million thereafter.
Interest paid on the above indebtedness, including distributionsmade on the Trust Preferred Securities, during the fiscal years endedSeptember 30, 2003, 2002 and 2001 was $134.2 million, $137.9 million and $50.9 million, respectively.
Total amortization of financing fees and expenses, as well asthe premiums and discounts related to the adjustment of the carrying values of certain Bergen debt to fair value in connectionwith the Merger, for the fiscal years ended September 30, 2003, 2002 and 2001 was $7.4 million, $5.4 million, and $3.1 million,respectively. These amounts are included in interest expense in theaccompanying consolidated statements of operations.
Note 6. Stockholders’ Equity and Earnings per ShareThe authorized capital stock of the Company consists of
300,000,000 shares of common stock, par value $0.01 per share (the“Common Stock”), and 10,000,000 shares of preferred stock, parvalue $0.01 per share (the “Preferred Stock”).
The board of directors is authorized to provide for the issuanceof shares of Preferred Stock in one or more series with various designations, preferences and relative, participating, optional orother special rights and qualifications, limitations or restrictions.Except as required by law, or as otherwise provided by the board ofdirectors of the Company, the holders of Preferred Stock will have no voting rights and will not be entitled to notice of meetings ofstockholders. Holders of Preferred Stock will be entitled to receive,when declared by the board of directors, out of legally availablefunds, dividends at the rates fixed by the board of directors for therespective series of Preferred Stock, and no more, before any dividends will be declared and paid, or set apart for payment, onCommon Stock with respect to the same dividend period. No sharesof Preferred Stock have been issued as of September 30, 2003.
Upon the merger of AmeriSource and Bergen in August 2001, all outstanding shares of AmeriSource Class A, Class B and Class Ccommon stock were exchanged for shares of the Company’s CommonStock on a one-for-one basis.
The holders of the Company’s Common Stock are entitled to onevote per share and have the exclusive right to vote for the board ofdirectors and for all other purposes as provided by law. Subject tothe rights of holders of the Company’s Preferred Stock, holders ofCommon Stock are entitled to receive ratably on a per share basissuch dividends and other distributions in cash, stock or property ofthe Company as may be declared by the board of directors from timeto time out of the legally available assets or funds of the Company.The Company has paid quarterly dividends of $0.025 per share onCommon Stock since the first quarter of fiscal 2002.
Basic earnings per share is computed on the basis of theweighted average number of shares of common stock outstandingduring the periods presented. Diluted earnings per share is computedon the basis of the weighted average number of shares of commonstock outstanding during the period plus the dilutive effect of stock
options. Additionally, the calculations consider the 5% convertiblesubordinated notes (see Note 5) as if converted and, therefore, theafter-tax effect of interest expense related to these notes is addedback to net income in determining income available to commonstockholders. The following table (in thousands) is a reconciliation of the numerator and denominator of the computation of basic anddiluted earnings per share.
Fiscal year ended September 30, 2003 2002 2001
Net income $441,229 $344,941 $123,796Interest expense — convertible
subordinated notes, net of income taxes 9,997 9,922 8,112Income available to
common stockholders $451,226 $354,863 $131,908
Weighted average common shares outstanding — basic 109,513 104,935 57,185
Effect of dilutive securities:Options to purchase
common stock 777 1,629 1,076Convertible subordinated notes 5,664 5,664 4,546
Weighted average common shares outstanding —
diluted 115,954 112,228 62,807
Note 7. Pension and Other Benefit PlansThe Company continues to maintain certain defined benefit,
defined contribution, and postretirement health plans initiated byAmeriSource and Bergen prior to the Merger. In connection with theMerger integration, the Company evaluated these benefit plans anddeveloped company-wide plans, which involved modification,replacement or merger of certain predecessor plans.
Defined Benefit PlansThe Company provides a benefit for the majority of its former
AmeriSource employees under three different noncontributory definedbenefit pension plans consisting of a salaried plan, a union plan anda supplemental executive retirement plan. For each employee, thebenefits are based on years of service and average compensation.Pension costs, which are computed using the projected unit creditcost method, are funded to at least the minimum level required bygovernment regulations. During fiscal 2002, the salaried and the supplemental executive retirement plans were closed to new participants and benefits that can be earned by active participantsin the plan were limited. The above changes in the salaried plan and the supplemental executive retirement plan had the effect ofreducing the projected benefit obligation as of September 30, 2002by $12.7 million and increasing pension expense by $0.9 million infiscal 2002.
The Company has an unfunded supplemental executive retirement plan for its former Bergen officers and key employees.This plan is a “target” benefit plan, with the annual lifetime benefit
412003 AmerisourceBergen Corporation
based upon a percentage of salary during the five final years of pay at age 62, offset by several other sources of income including benefitspayable under a prior supplemental retirement plan. During fiscal 2002, the plan was closed to new participants and benefits that can beearned by active participants were limited.
The following table sets forth (in thousands) a reconciliation of the changes in the Company-sponsored defined benefit pension plans:
Fiscal year ended September 30, 2003 2002
Change in Projected Benefit Obligations:Benefit obligation at beginning of year $ 79,078 $ 85,026Service cost 4,169 5,644Interest cost 5,642 6,038Actuarial losses 14,358 4,655Benefit payments (4,236) (9,882)Change due to amendments of plans — (12,689)Other — 286
Benefit obligation at end of year $ 99,011 $ 79,078
Change in Plan Assets:Fair value of plan assets at beginning of year $ 51,584 $ 51,389Actual return on plan assets 2,855 (1,356)Employer contributions 7,163 6,652Expenses (761) (1,117)Benefit payments (4,236) (3,984)
Fair value of plan assets at end of year $ 56,605 $ 51,584
Funded Status and Amounts Recognized:Funded status $(42,406) $(27,494)Unrecognized net actuarial loss 30,977 14,582Unrecognized prior service cost 542 692
Net amount recognized $(10,887) $(12,220)
Amounts recognized in the balance sheets consist of:Accrued benefit liability $(34,805) $(22,763)Intangible asset 542 692Accumulated other comprehensive loss 23,376 9,851
Net amount recognized $(10,887) $(12,220)
Weighted average assumptions used in computing the funded status of the plans were as follows:
2003 2002 2001
Discount rate 6.00% 7.00% 7.50%Rate of increase in compensation levels 4.00% 5.50% 5.75%Expected long-term rate of return on assets 8.00% 8.75% 10.00%
The following table provides components of net periodic benefit cost for the Company-sponsored defined benefit pension plans togetherwith contributions charged to expense for multi-employer union-administered defined benefit pension plans that the Company participates in(in thousands):
Fiscal year ended September 30, 2003 2002 2001
Components of Net Periodic Benefit Cost:Service cost $ 4,735 $ 5,731 $ 4,571Interest cost on projected benefit obligation 5,644 6,038 4,746Expected return on plan assets (5,082) (5,390) (5,486)Amortization of prior service cost 150 361 377Recognized net actuarial loss 722 755 298Loss due to amendments of plans — 864 —
Net periodic pension cost of defined benefit pension plans 6,169 8,359 4,506
Net pension cost of multi-employer plans 1,673 1,141 520Total pension expense $ 7,842 $ 9,500 $ 5,026
42 AmerisourceBergen Corporation 2003
Plan assets at September 30, 2003 are invested principally in listed stocks, corporate and government bonds, and cash equivalents. As ofSeptember 30, 2003 and 2002, all of the Company-sponsored defined benefit pension plans had projected and accumulated benefit obligationsin excess of plan assets.
The Company owns life insurance covering substantially all of the participants in the Bergen supplemental retirement plans. At September30, 2003, the policies have an aggregate cash surrender value of approximately $33.4 million (which is included in other assets in the accompanying consolidated balance sheet) and an aggregate death benefit of approximately $55.0 million.
Postretirement Benefit PlansThe Company provides medical benefits to certain retirees, principally former employees of Bergen. Employees became eligible for such
postretirement benefits after meeting certain age and years of service criteria. During fiscal 2002, the plans were closed to new participantsand benefits that can be earned by active participants were limited. As a result of special termination benefit packages previously offered, the Company also provides dental and life insurance benefits to a limited number of retirees and their dependents. These benefit plans areunfunded.
The following table sets forth (in thousands) a reconciliation of the changes in the Company-sponsored postretirement benefit plans:
Fiscal year ended September 30, 2003 2002
Change in Projected Benefit Obligations:Benefit obligation at beginning of year $ 16,891 $ 17,069Interest cost 1,374 1,306Actuarial losses (gains) 4,127 (15)Benefit payments (1,831) (1,469)
Benefit obligation at end of year $ 20,561 $ 16,891
Change in Plan Assets:Fair value of plan assets at beginning of year $ — $ —Employer contributions 1,831 1,469Benefit payments (1,831) (1,469)
Fair value of plan assets at end of year $ — $ —
Funded Status and Amounts Recognized:Funded status $(20,561) $(16,891)Unrecognized net actuarial loss (gain) 3,853 (168)
Net amount recognized $(16,708) $(17,059)
Amounts recognized in the balance sheets consist of:Accrued benefit liability $(16,708) $(17,059)
Weighted average assumptions used in computing the funded status of the plans were as follows:
2003 2002
Discount rate 6% 7%Health care trend rate 5 – 13% 5 – 11%
The following table provides components of net periodic benefit cost for the Company-sponsored postretirement benefit plans in (in thousands):
Fiscal year ended September 30, 2003 2002
Components of Net Periodic Benefit Cost:Interest cost on projected benefit obligation $1,374 $1,306Amortization of prior service cost 133 —Recognized net actuarial loss (28) (17)
Total postretirement benefit expense $1,479 $1,289
432003 AmerisourceBergen Corporation
Defined Contribution PlansThe Company sponsors an Employee Investment Plan, as
amended July 1, 2002, which is a defined contribution 401(k) plancovering salaried and certain hourly employees. Eligible participantsmay contribute to the plan from 2% to 18% of their regular compen-sation before taxes. The Company contributes $1.00 for each $1.00invested by the participant up to the participant’s investment of 3%of salary, and $0.50 for each additional $1.00 invested by the participant up to the participant’s investment of an additional 2% ofsalary. An additional discretionary contribution, in an amount not toexceed the limits established by the Internal Revenue Code, may also be made depending upon the Company’s performance. All contri-butions are invested at the direction of the employee in one or morefunds. All contributions vest immediately except for the discretionarycontributions made by the Company that vest over a four-year period.
PharMerica sponsors a Profit Sharing Plan, which is a definedcontribution 401(k) plan, which is generally available to its employees with 90 days of service and excludes those employeescovered under a collective bargaining agreement. Eligible partici-pants may contribute 1% to 15% of their pretax compensation.PharMerica contributes $0.50 for each $1.00 invested by the participant up to the first 4% of the participant’s contribution but not exceeding 2% of the participant’s compensation. All contributions are invested at the direction of the employee in one or more investment funds. Employee contributions vest immediatelyand employer contributions vest based on a cliff vesting scale.
Bergen had sponsored the Pre-tax Investment RetirementAccount Plan, a defined contribution 401(k) plan, which was generally available to its employees with 30 days of service. Underthe terms of the plan, Bergen had guaranteed a contribution of$1.00 for each $1.00 invested by the participant up to the participant’s investment of 3% of salary, and $0.50 for each additional $1.00 invested by the participant up to the participant’sinvestment of an additional 2% of salary, subject to plan and regulatory limitations. Bergen also had the option to make additional cash or stock contributions to the plan at its discretion.All participants vested immediately in Bergen’s contributions fromthe first day of participation in the plan. Effective July 1, 2002, theBergen plan was merged into the Employee Investment Plan.
Costs of the defined contribution plans charged to expense forthe fiscal years ended September 30, 2003, 2002 and 2001 amountedto $17.3 million, $10.9 million and $2.2 million, respectively.
Deferred Compensation PlanThe Company adopted Bergen’s deferred compensation plan.
This unfunded plan, under which 740,000 shares of Common Stockare authorized for issuance, allows eligible officers, directors and key management employees to defer a portion of their annual compensation. The amount deferred may be allocated by the employee to cash, mutual funds or stock credits. Stock credits,including dividend equivalents, are equal to the full and fractionalnumber of shares of Common Stock that could be purchased with theparticipant’s compensation allocated to stock credits based on theaverage of closing prices of Common Stock during each month, plus,at the discretion of the board of directors, up to one-half of a share of Common Stock for each full share credited. Stock credit
distributions are made in shares of Common Stock. No shares ofCommon Stock have been issued under the deferred compensationplan at September 30, 2003.
Note 8. Stock Compensation Plans
Stock Option PlansIn accordance with SFAS No. 123, “Accounting for Stock-Based
Compensation,” the Company elected to account for stock-basedcompensation under APB Opinion No. 25 (“APB 25”) and its relatedinterpretations. Under APB 25, generally, when the exercise price ofthe Company’s employee stock options equals the market price of the underlying stock on the date of grant, no compensation expenseis recognized.
The Company has several stock-related compensation plans thatwere initiated by AmeriSource and Bergen prior to the Merger. Inconnection with the Merger integration, the Company has mergedcertain of the predecessor plans. The Company currently has fiveemployee stock option plans that provide for the granting of incentive and nonqualified stock options to acquire shares ofCommon Stock to employees at a price not less than the fair marketvalue of the Common Stock on the date the option is granted.Option terms and vesting periods are determined at the date of grantby a committee of the board of directors. Options generally vest overfour years and expire in six or ten years. The Company also has fournon-employee director stock option plans that provide for the granting of nonqualified stock options to acquire shares of CommonStock to non-employee directors at the fair market value of theCommon Stock on the date of the grant. Vesting periods for the non-employee director plans range from immediate vesting to threeyears and options expire in six or ten years.
At September 30, 2003, there were outstanding options to purchase 8.3 million shares of Common Stock under the aforemen-tioned plans. Options for an additional 4.8 million shares may begranted under these plans.
All outstanding stock options granted prior to February 15,2001 under the above plans became fully vested on the day beforethe Merger, and generally became exercisable on August 28, 2002. As a result of the accelerated vesting of AmeriSource stock options,the Company recorded a charge of $1.1 million, $2.1 million and$6.5 million in fiscal 2003, 2002, and 2001, respectively. The fiscal2003 charge was classified as distribution, selling and administrativein the accompanying consolidated statements of operations and the fiscal 2002 and 2001 charges were classified as merger costs (see Note 10) in the accompanying consolidated statements of operations.
44 AmerisourceBergen Corporation 2003
A summary of the Company’s stock option activity and related information for its option plans for the fiscal years ended September 30 follows:
2003 2002 2001
Weighted Weighted WeightedAverage Average Average
Options Exercise Options Exercise Options Exercise(000’s) Price (000’s) Price (000’s) Price
Outstanding at beginning of year 7,801 $53 8,756 $42 3,634 $24Acquired in Merger — — 240 47 3,465 37Granted 2,430 56 2,173 70 3,220 56Exercised (1,385) 33 (3,046) 33 (1,326) 23Forfeited (591) 67 (322) 63 (237) 27
Outstanding at end of year 8,255 $56 7,801 $53 8,756 $42
Exercisable at end of year 3,616 $49 4,002 $40 2,921 $39
A summary of the status of options outstanding at September 30, 2003 follows:
Outstanding Options Exercisable OptionsWeightedAverage Weighted Weighted
Remaining Average AverageNumber Contractual Exercise Number Exercise(000’s) Life Price (000’s) Price
$12 – $ 35 956 5 years $23 949 $23
$38 – $ 54 1,267 7 years 46 1,077 44
$55 – $ 60 2,363 9 years 55 127 57
$63 – $ 70 1,688 8 years 65 935 65
$71 – $ 76 1,937 9 years 71 484 71
$77 – $108 44 4 years 93 44 94Total 8,255 8 years $56 3,616 $49
452003 AmerisourceBergen Corporation
Employee Stock Purchase PlanIn February 2002, the stockholders approved the adoption of
the AmerisourceBergen 2002 Employee Stock Purchase Plan (the“Plan” or “ESPP”), under which up to an aggregate of 4,000,000shares of Common Stock may be sold to eligible employees (generallydefined as employees with at least 30 days of service with theCompany). Under the Plan, the participants may elect to have theCompany withhold up to 25% of base salary to purchase shares ofthe Company’s Common Stock at a price equal to 85% of the fairmarket value of the stock on the first or last business day of eachsix-month purchase period, whichever is lower. Each participant islimited to $25,000 of purchases during each calendar year. The initial purchase period began on July 1, 2002 and ended onDecember 31, 2002. The second purchase period began on January 1, 2003 and ended on June 30, 2003. The Company acquired53,039 shares and 51,326 shares from the open market for issuanceto participants in connection with the first and second ESPP purchase periods, respectively. As of September 30, 2003, theCompany has withheld $1.7 million from eligible employees for thepurchase of Common Stock in connection with the third purchaseperiod, which began on July 1, 2003.
Pro Forma DisclosuresPro forma disclosures, as required by SFAS No. 123, regarding
net income and earnings per share have been determined as if theCompany had accounted for its employee stock options under the fairvalue method.
The fair values for the Company’s options were estimated at thedate of grant using a Black-Scholes option pricing model with thefollowing assumptions for the years ended September 30, 2003, 2002and 2001: a risk-free interest rate ranging from 2.22% to 5.07%;expected dividend yield ranging from 0.0% to 0.2%; a volatility factor of the expected market price of the Company’s Common Stockranging from .335 to .497 and a weighted average expected life ofthe options of 5 years. The weighted average fair value of optionsgranted during the years ended September 30, 2003, 2002 and 2001was $20.36, $25.96 and $27.00, respectively.
Note 9. LeasesAt September 30, 2003, future minimum payments totaling
$182.7 million under noncancelable operating leases with remainingterms of more than one fiscal year were due as follows: 2004 —$52.4 million; 2005 — $44.5 million; 2006 — $33.8 million; 2007— $19.5 million; 2008 — $10.7 million; and thereafter — $21.8million. In the normal course of business, operating leases are generally renewed or replaced by other leases. Certain operating leases include escalation clauses.
Total rental expense was $61.7 million in fiscal 2003, $59.7million in fiscal 2002 and $22.4 million in fiscal 2001.
Note 10. Facility Consolidations and EmployeeSeverance and Merger Costs
Facility Consolidations and Employee SeveranceIn connection with the Merger, the Company developed
integration plans to consolidate its distribution network and eliminate duplicate administrative functions, which are expected toresult in synergies of approximately $150 million annually by the endof fiscal 2004. The Company’s plan is to have a distribution facilitynetwork consisting of 30 facilities in the next three to four years.This will be accomplished by building six new facilities, expandingseven facilities, and closing 27 facilities. During fiscal 2003, theCompany began construction activities on three of its new facilitiesand completed two of the seven facility expansions. During fiscal2003 and 2002, the Company closed six and seven distribution facilities, respectively. The Company anticipates closing three additional facilities in fiscal 2004.
In September 2001, the Company announced plans to closeseven distribution facilities in fiscal 2002, consisting of six formerAmeriSource facilities and one former Bergen facility. A charge of$10.9 million was recognized in the fourth quarter of fiscal 2001related to the AmeriSource facilities, and included $6.2 million ofseverance for approximately 260 warehouse and administrative personnel to be terminated, $2.3 million in lease and contract cancellations, and $2.4 million for the write-down of assets relatedto the facilities to be closed. Approximately $0.2 million of costsrelated to the Bergen facility were included in the Merger purchaseprice allocation. During the fiscal year ended September 30, 2003,severance accruals of $1.8 million recorded in September 2001 werereversed into income because certain employees who were expectedto be severed either voluntarily left the Company or were retained inother positions within the Company. The severance expense in fiscal2001 included $1.1 million associated with the acceleration of stockoption vesting.
During the fiscal year ended September 30, 2002, the Companyannounced further integration initiatives relating to the closure ofBergen’s repackaging facility and the elimination of certain Bergenadministrative functions, including the closure of a related officefacility. The cost of these initiatives of approximately $19.2 million,which included $15.8 million of severance for approximately 310employees to be terminated, $1.6 million for lease cancellationcosts, and $1.8 million for the write-down of assets related to thefacilities to be closed, resulted in additional goodwill being recorded
during fiscal 2002. At September 30, 2003, substantially all of the310 employees have been terminated.
Since September 2002, the Company has announced plans toclose six distribution facilities in fiscal 2003 and eliminate certain administrative and operational functions (“the fiscal 2003initiatives”). As of September 30, 2003, the six facilities wereclosed. During the fiscal year ended September 30, 2003, theCompany recorded severance costs of $10.3 million and lease cancellation costs of $1.1 million relating to the fiscal 2003 initiatives. Employee severance and lease cancellation costs relatedto the fiscal 2003 initiatives have been recognized in accordancewith the provisions of SFAS No. 146, “Accounting for CostsAssociated with Exit or Disposal Activities.” Employee severancecosts are generally expensed during the employee service period andlease cancellation and other costs are generally expensed when theCompany becomes contractually bound to pay such costs. In futurequarters, the Company expects to incur an additional $1.0 million of employee severance costs relating to the fiscal 2003 initiatives.As of September 30, 2003, approximately 520 employees had beenprovided termination notices as a result of the fiscal 2003 initiatives, of which 490 were terminated. Additional amounts forintegration initiatives will be recognized in subsequent periods asfacilities to be consolidated are identified and specific plans areapproved and announced.
Most employees receive their severance benefits over a periodof time, generally not to exceed 12 months, while others may receivea lump-sum payment.
The following table displays the activity in accrued expensesand other from September 30, 2001 to September 30, 2003 relatedto the integration plans discussed above (in thousands):
LeaseCancellation
Employee Costs andSeverance Other Total
Balance as of September 30, 2001 $ 5,259 $ 1,997 $ 7,256
Amounts charged to goodwill 15,795 1,616 17,411Payments made (12,898) (2,658) (15,556)Balance as of
September 30, 2002 8,156 955 9,111Expense recorded 10,318 1,112 11,430Payments made (11,785) (1,986) (13,771)Employee severance reduction (1,754) — (1,754)Balance as of
September 30, 2003 $ 4,935 $ 81 $ 5,016
46 AmerisourceBergen Corporation 2003
472003 AmerisourceBergen Corporation
Merger CostsIn connection with its acquisition of Bergen, the Company
expensed merger-related costs of $24.2 million in fiscal 2002 and$13.1 million in fiscal 2001, respectively.
The following table summarizes the major components of themerger-related costs included in the accompanying consolidatedstatements of operations in the fiscal years ended September 30 (in thousands):
2002 2001
Consulting fees $16,551 $ 5,574Accelerated stock option vesting 2,149 6,472Employee compensation and travel 3,675 242Other 1,869 821
$24,244 $13,109
Effective October 1, 2002, the Company converted its mergerintegration office to an operations management office. Accordingly,the costs of the operations management office are included withindistribution, selling and administrative expenses in the Company’sconsolidated statements of operations.
Note 11. Legal Matters and ContingenciesIn the ordinary course of its business, the Company becomes
involved in lawsuits, administrative proceedings and governmentalinvestigations, including antitrust, environmental, product liability,regulatory and other matters. Large and sometimes unspecified damages or penalties may be sought from the Company in some matters, and some matters may require years for the Company toresolve. The Company establishes reserves from time to time basedon its periodic assessment of the potential outcomes of pendingmatters. There can be no assurance that an adverse resolution of one or more matters during any subsequent reporting period will nothave a material adverse effect on the Company’s results of operationsfor that period. However, on the basis of information furnished by counsel and others, the Company does not believe that the resolution of currently pending matters (including those mattersspecifically described below), individually or in the aggregate, willhave a material adverse effect on the Company’s financial condition.
Environmental RemediationThe Company is subject to contingencies pursuant to
environmental laws and regulations at a former distribution center.As of September 30, 2003, the Company has an accrued liability of $0.9 million that represents the current estimate of costs to remediate the site. However, changes in regulation or technology ornew information concerning the site could affect the actual liability.
Government InvestigationIn June 2000, the Company learned that the U.S. Department
of Justice had commenced an investigation focusing on the activitiesof a customer that illegally resold merchandise purchased from theCompany and on the Company’s business relationship with that customer. The Company was contacted initially by the government atthat time and cooperated fully. The Company had discontinued doing
business with the customer in question in February 2000, after concluding this customer had demonstrated suspicious purchasingbehavior. From 2001 until recently, the Company had no further contact with the government on this investigation. In September2003, the Company learned that a former employee of the Companypled guilty to charges arising from his involvement with this customer. In November 2003, the Company was contacted by theU.S. Attorney’s Office in Sacramento, California, for some additionalinformation relating to the investigation. The Company believes that it has not engaged in any wrongdoing, but cannot predict theoutcome of this investigation at this time.
ABDC MatterIn January 2002, Bergen Brunswig Drug Company (now known
as AmerisourceBergen Drug Corporation) was served with a complaintfiled in the United States District Court for the District of New Jerseyby one of its manufacturer vendors, Bracco Diagnostics Inc.(“Bracco”). The complaint, which includes claims for fraud, breach ofNew Jersey’s Consumer Fraud Act, breach of contract and unjustenrichment, involves disputes relating to chargebacks and credits.The Court granted the Company’s motion to dismiss the fraud andNew Jersey Consumer Fraud Act counts. Bracco also tried to amendthe complaint to include a federal racketeering claim. Bracco’smotion to amend the complaint was denied by the Court. TheCompany has answered the remaining counts of the complaint. Factdiscovery has been completed but expert discovery is still ongoing.
PharMerica MatterIn November 2002, a class action was filed in Hawaii state
court on behalf of consumers who allegedly received “recycled” medications from a PharMerica institutional pharmacy in Honolulu,Hawaii. The plaintiffs allege that it was a deceptive trade practiceunder Hawaii law to sell “recycled” medications (i.e., medicationsthat had previously been dispensed and then returned to the pharmacy) without disclosing that the medications were “recycled.”In September, 2003, the Hawaii Circuit Court heard and granted theplaintiffs’ motion to certify the case as a class action. The class consists of consumers who purchased drugs in product lines in which recycling occurred, but those product lines have not yet beenidentified. PharMerica intends to vigorously defend itself against theclaims raised in this class action. It is PharMerica’s position that theclass members suffered no harm and are not entitled to recover anydamages. PharMerica is not aware of any evidence, or any specificclaim, that any particular class member received medications thatwere ineffective because they had been “recycled.” Discovery in thiscase is ongoing.
Note 12. Business Segment InformationThe Company is organized based upon the products and services
it provides to its customers. The Company’s operations have beenaggregated into two reportable segments: PharmaceuticalDistribution and PharMerica.
The Pharmaceutical Distribution segment includesAmerisourceBergen Drug Corporation (“ABDC”) andAmerisourceBergen Specialty Group (“ABSG”). ABDC includes the
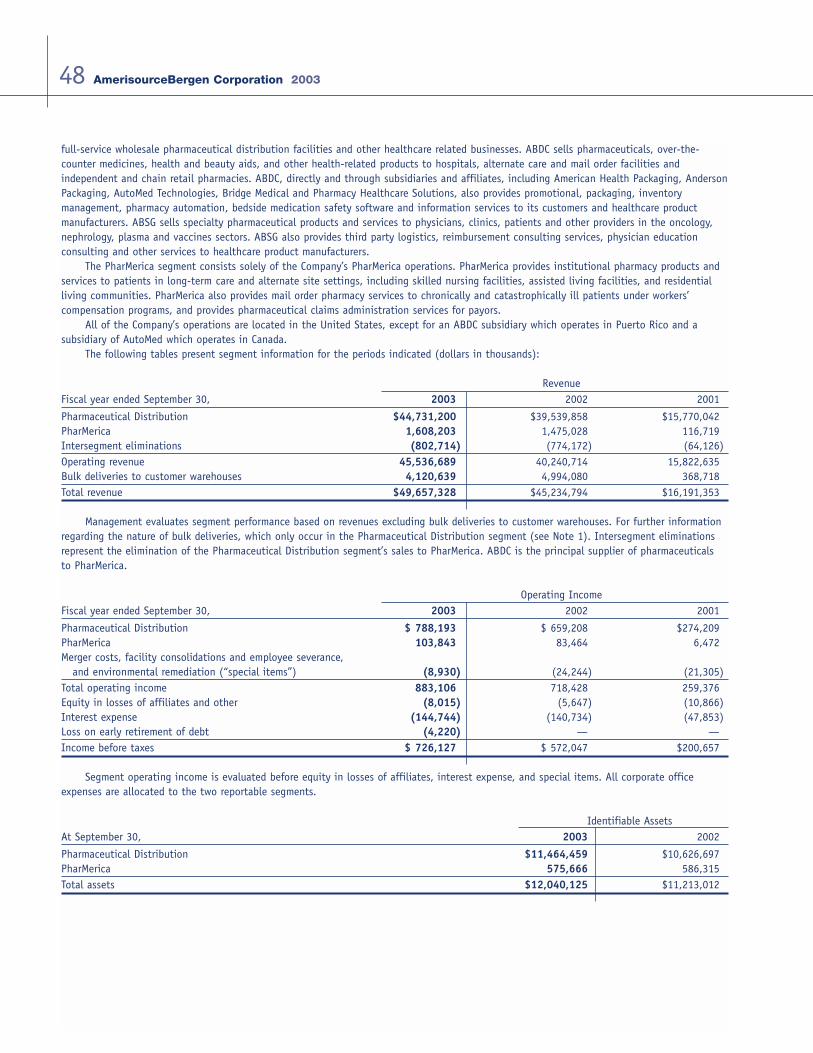
full-service wholesale pharmaceutical distribution facilities and other healthcare related businesses. ABDC sells pharmaceuticals, over-the-counter medicines, health and beauty aids, and other health-related products to hospitals, alternate care and mail order facilities and independent and chain retail pharmacies. ABDC, directly and through subsidiaries and affiliates, including American Health Packaging, AndersonPackaging, AutoMed Technologies, Bridge Medical and Pharmacy Healthcare Solutions, also provides promotional, packaging, inventory management, pharmacy automation, bedside medication safety software and information services to its customers and healthcare product manufacturers. ABSG sells specialty pharmaceutical products and services to physicians, clinics, patients and other providers in the oncology,nephrology, plasma and vaccines sectors. ABSG also provides third party logistics, reimbursement consulting services, physician education consulting and other services to healthcare product manufacturers.
The PharMerica segment consists solely of the Company’s PharMerica operations. PharMerica provides institutional pharmacy products andservices to patients in long-term care and alternate site settings, including skilled nursing facilities, assisted living facilities, and residentialliving communities. PharMerica also provides mail order pharmacy services to chronically and catastrophically ill patients under workers’ compensation programs, and provides pharmaceutical claims administration services for payors.
All of the Company’s operations are located in the United States, except for an ABDC subsidiary which operates in Puerto Rico and a subsidiary of AutoMed which operates in Canada.
The following tables present segment information for the periods indicated (dollars in thousands):
RevenueFiscal year ended September 30, 2003 2002 2001
Pharmaceutical Distribution $44,731,200 $39,539,858 $15,770,042PharMerica 1,608,203 1,475,028 116,719Intersegment eliminations (802,714) (774,172) (64,126)Operating revenue 45,536,689 40,240,714 15,822,635Bulk deliveries to customer warehouses 4,120,639 4,994,080 368,718Total revenue $49,657,328 $45,234,794 $16,191,353
Management evaluates segment performance based on revenues excluding bulk deliveries to customer warehouses. For further informationregarding the nature of bulk deliveries, which only occur in the Pharmaceutical Distribution segment (see Note 1). Intersegment eliminationsrepresent the elimination of the Pharmaceutical Distribution segment’s sales to PharMerica. ABDC is the principal supplier of pharmaceuticals to PharMerica.
Operating IncomeFiscal year ended September 30, 2003 2002 2001
Pharmaceutical Distribution $ 788,193 $ 659,208 $274,209PharMerica 103,843 83,464 6,472Merger costs, facility consolidations and employee severance,
and environmental remediation (“special items”) (8,930) (24,244) (21,305)Total operating income 883,106 718,428 259,376Equity in losses of affiliates and other (8,015) (5,647) (10,866)Interest expense (144,744) (140,734) (47,853)Loss on early retirement of debt (4,220) — —Income before taxes $ 726,127 $ 572,047 $200,657
Segment operating income is evaluated before equity in losses of affiliates, interest expense, and special items. All corporate officeexpenses are allocated to the two reportable segments.
Identifiable AssetsAt September 30, 2003 2002
Pharmaceutical Distribution $11,464,459 $10,626,697PharMerica 575,666 586,315Total assets $12,040,125 $11,213,012
48 AmerisourceBergen Corporation 2003
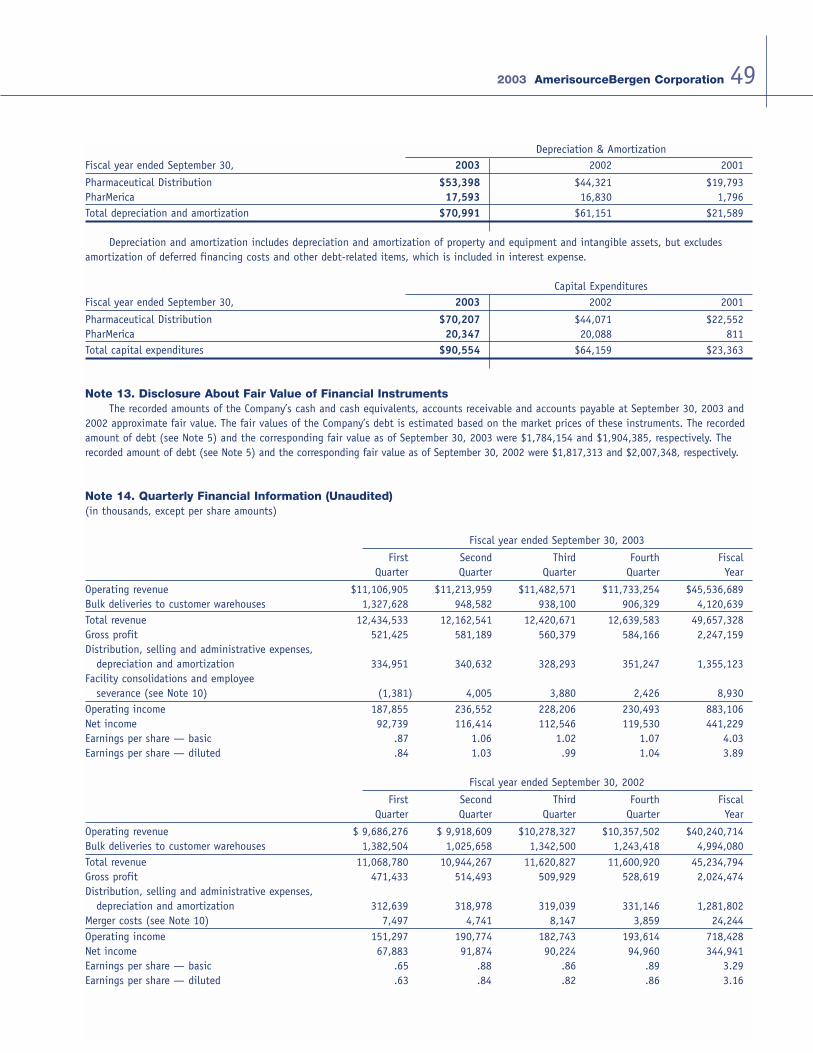
Depreciation & AmortizationFiscal year ended September 30, 2003 2002 2001
Pharmaceutical Distribution $53,398 $44,321 $19,793PharMerica 17,593 16,830 1,796Total depreciation and amortization $70,991 $61,151 $21,589
Depreciation and amortization includes depreciation and amortization of property and equipment and intangible assets, but excludes amortization of deferred financing costs and other debt-related items, which is included in interest expense.
Capital ExpendituresFiscal year ended September 30, 2003 2002 2001
Pharmaceutical Distribution $70,207 $44,071 $22,552PharMerica 20,347 20,088 811Total capital expenditures $90,554 $64,159 $23,363
Note 13. Disclosure About Fair Value of Financial InstrumentsThe recorded amounts of the Company’s cash and cash equivalents, accounts receivable and accounts payable at September 30, 2003 and
2002 approximate fair value. The fair values of the Company’s debt is estimated based on the market prices of these instruments. The recordedamount of debt (see Note 5) and the corresponding fair value as of September 30, 2003 were $1,784,154 and $1,904,385, respectively. Therecorded amount of debt (see Note 5) and the corresponding fair value as of September 30, 2002 were $1,817,313 and $2,007,348, respectively.
Note 14. Quarterly Financial Information (Unaudited)(in thousands, except per share amounts)
Fiscal year ended September 30, 2003
First Second Third Fourth FiscalQuarter Quarter Quarter Quarter Year
Operating revenue $11,106,905 $11,213,959 $11,482,571 $11,733,254 $45,536,689Bulk deliveries to customer warehouses 1,327,628 948,582 938,100 906,329 4,120,639Total revenue 12,434,533 12,162,541 12,420,671 12,639,583 49,657,328Gross profit 521,425 581,189 560,379 584,166 2,247,159Distribution, selling and administrative expenses,
depreciation and amortization 334,951 340,632 328,293 351,247 1,355,123Facility consolidations and employee
severance (see Note 10) (1,381) 4,005 3,880 2,426 8,930Operating income 187,855 236,552 228,206 230,493 883,106Net income 92,739 116,414 112,546 119,530 441,229Earnings per share — basic .87 1.06 1.02 1.07 4.03Earnings per share — diluted .84 1.03 .99 1.04 3.89
Fiscal year ended September 30, 2002
First Second Third Fourth FiscalQuarter Quarter Quarter Quarter Year
Operating revenue $ 9,686,276 $ 9,918,609 $10,278,327 $10,357,502 $40,240,714Bulk deliveries to customer warehouses 1,382,504 1,025,658 1,342,500 1,243,418 4,994,080Total revenue 11,068,780 10,944,267 11,620,827 11,600,920 45,234,794Gross profit 471,433 514,493 509,929 528,619 2,024,474Distribution, selling and administrative expenses,
depreciation and amortization 312,639 318,978 319,039 331,146 1,281,802Merger costs (see Note 10) 7,497 4,741 8,147 3,859 24,244Operating income 151,297 190,774 182,743 193,614 718,428Net income 67,883 91,874 90,224 94,960 344,941Earnings per share — basic .65 .88 .86 .89 3.29Earnings per share — diluted .63 .84 .82 .86 3.16
492003 AmerisourceBergen Corporation
50 AmerisourceBergen Corporation 2003
REPORT OF ERNST & YOUNG LLP, INDEPENDENT AUDITORS
To the Board of Directors and Stockholders ofAmerisourceBergen Corporation
We have audited the accompanying consolidated balance sheetsof AmerisourceBergen Corporation and subsidiaries as of September30, 2003 and 2002, and the related consolidated statements of oper-ations, changes in stockholders’ equity, and cash flows for each ofthe three years in the period ended September 30, 2003. Thesefinancial statements are the responsibility of the Company’s manage-ment. Our responsibility is to express an opinion on these financialstatements based on our audits.
We conducted our audits in accordance with auditing standardsgenerally accepted in the United States. Those standards require thatwe plan and perform the audit to obtain reasonable assurance aboutwhether the financial statements are free of material misstatement.An audit includes examining, on a test basis, evidence supportingthe amounts and disclosures in the financial statements. An auditalso includes assessing the accounting principles used and signifi-cant estimates made by management, as well as evaluating the over-all financial statement presentation. We believe that our audits pro-vide a reasonable basis for our opinion.
In our opinion, the consolidated financial statements referredto above present fairly, in all material respects, the consolidatedfinancial position of AmerisourceBergen Corporation and subsidiariesat September 30, 2003 and 2002, and the consolidated results oftheir operations and their cash flows for each of the three years inthe period ended September 30, 2003, in conformity with account-ing principles generally accepted in the United States.
Philadelphia, PennsylvaniaNovember 4, 2003
Reprinted below are the certifications pursuant to section 1350of the Sarbanes-Oxley Act of 2002 that were filed with the SECas part of the company’s Annual Report on Form 10-K for theFiscal Year Ended September 30, 2003.
Section 1350 Certification of Chief Executive Officer
In connection with the Annual Report of AmerisourceBergenCorporation (the “Company”) on Form 10-K for the fiscal year endedSeptember 30, 2003 as filed with the Securities and ExchangeCommission on the date hereof (the “Report”), I, R. David Yost,Chief Executive Officer of the Company, certify, pursuant to 18U.S.C. Section 1350, as adopted pursuant to Section 906 of theSarbanes-Oxley Act of 2002, that to the best of my knowledge:
(1) The Report fully complies with the requirements of Section13(a) or 15(d) of the Securities Exchange Act of 1934; and
(2) The information contained in the Report fairly presents, in allmaterial respects, the financial condition and results of opera-tions of the Company.
R. David YostChief Executive OfficerDecember 19, 2003
Section 1350 Certification of Chief Financial Officer
In connection with the Annual Report of AmerisourceBergenCorporation (the “Company”) on Form 10-K for the fiscal year endedSeptember 30, 2003 as filed with the Securities and ExchangeCommission on the date hereof (the “Report”), I, Michael D.DiCandilo, Senior Vice President and Chief Financial Officer of theCompany, certify, pursuant to 18 U.S.C. Section 1350, as adoptedpursuant to Section 906 of the Sarbanes-Oxley Act of 2002, that tothe best of my knowledge:
(1) The Report fully complies with the requirements of Section13(a) or 15(d) of the Securities Exchange Act of 1934; and
(2) The information contained in the Report fairly presents, in allmaterial respects, the financial condition and results of opera-tions of the Company.
Michael D. DiCandiloSenior Vice President and Chief Financial OfficerDecember 19, 2003
Rule 13a-14(a)/15d-14(a)Certification of Chief Executive Officer
I, R. David Yost, certify that:
1. I have reviewed this Annual Report on Form 10-K (the “Report”)of AmerisourceBergen Corporation (the “Registrant”);
2. Based on my knowledge, this Report does not contain any untruestatement of a material fact or omit to state a material fact nec-essary to make the statements made, in light of the circumstancesunder which such statements were made, not misleading withrespect to the period covered by this Report;
3. Based on my knowledge, the financial statements, and otherfinancial information included in this Report, fairly present in allmaterial respects the financial condition, results of operationsand cash flows of the Registrant as of, and for, the periods pre-sented in this Report;
4. The Registrant’s other certifying officer and I are responsible forestablishing and maintaining disclosure controls and procedures(as defined in Exchange Act Rules 13a-15(e) and 15d-15(e)) forthe Registrant and we have:(a) Designed such disclosure controls and procedures, or caused
such disclosure controls and procedures to be designed underour supervision, to ensure that material information relatingto the Registrant, including its consolidated subsidiaries, ismade known to us by others within those entities, particularlyduring the period in which this Report is being prepared;
(b) Evaluated the effectiveness of the Registrant’s disclosure con-trols and procedures and presented in this Report our conclu-sions about the effectiveness of the disclosure controls andprocedures, as of the end of the period covered by this Reportbased on such evaluation; and
(c) Disclosed in this report any change in the Registrant’s inter-nal control over financial reporting that occurred during theRegistrant’s most recent fiscal quarter (the Registrant’s fourthfiscal quarter in the case of an annual report) that has mate-rially affected, or is reasonably likely to materially affect, theRegistrant’s internal control over financial reporting; and
5. The Registrant’s other certifying officer and I have disclosed,based on our most recent evaluation of internal control overfinancial reporting, to the Registrant’s auditors and the auditcommittee of Registrant’s board of directors:(a) All significant deficiencies and material weaknesses in the
design or operation of internal control over financial reportingwhich are reasonably likely to adversely affect the Registrant’sability to record, process, summarize and report financialinformation; and
(b) Any fraud, whether or not material, that involves managementor other employees who have a significant role in theRegistrant’s internal control over financial reporting.
Date: December 19, 2003
R. David YostChief Executive Officer
Rule 13a-14(a)/15d-14(a) Certification of Chief Financial Officer
I, Michael D. DiCandilo, certify that:
1. I have reviewed this Annual Report on Form 10-K (the “Report”)of AmerisourceBergen Corporation (the “Registrant”);
2. Based on my knowledge, this Report does not contain any untruestatement of a material fact or omit to state a material fact nec-essary to make the statements made, in light of the circumstancesunder which such statements were made, not misleading withrespect to the period covered by this Report;
3. Based on my knowledge, the financial statements, and otherfinancial information included in this Report, fairly present in allmaterial respects the financial condition, results of operationsand cash flows of the Registrant as of, and for, the periods pre-sented in this Report;
4. The Registrant’s other certifying officer and I are responsible forestablishing and maintaining disclosure controls and procedures(as defined in Exchange Act Rules 13a-15(e) and 15d-15(e)) forthe Registrant and we have:(a) Designed such disclosure controls and procedures, or caused
such disclosure controls and procedures to be designed underour supervision, to ensure that material information relatingto the Registrant, including its consolidated subsidiaries, ismade known to us by others within those entities, particularlyduring the period in which this Report is being prepared;
(b) Evaluated the effectiveness of the Registrant’s disclosure con-trols and procedures and presented in this Report our conclu-sions about the effectiveness of the disclosure controls andprocedures, as of the end of the period covered by this Reportbased on such evaluation; and
(c) Disclosed in this report any change in the Registrant’s inter-nal control over financial reporting that occurred during theRegistrant’s most recent fiscal quarter (the Registrant’s fourthfiscal quarter in the case of an annual report) that has mate-rially affected, or is reasonably likely to materially affect, theRegistrant’s internal control over financial reporting; and
5. The Registrant’s other certifying officer and I have disclosed,based on our most recent evaluation of internal control overfinancial reporting, to the Registrant’s auditors and the auditcommittee of Registrant’s board of directors:(a) All significant deficiencies and material weaknesses in the
design or operation of internal control over financial reportingwhich are reasonably likely to adversely affect the Registrant’sability to record, process, summarize and report financialinformation; and
(b) Any fraud, whether or not material, that involves managementor other employees who have a significant role in theRegistrant’s internal control over financial reporting.
Date: December 19, 2003
Michael D. DiCandiloSenior Vice President and Chief Financial Officer
512003 AmerisourceBergen Corporation
Reprinted below are the certifications pursuant to section 302 of the Sarbanes-Oxley Act of 2002 that were filed with the SEC as partof the company’s Annual Report on Form 10-K for the Fiscal Year Ended September 30, 2003.
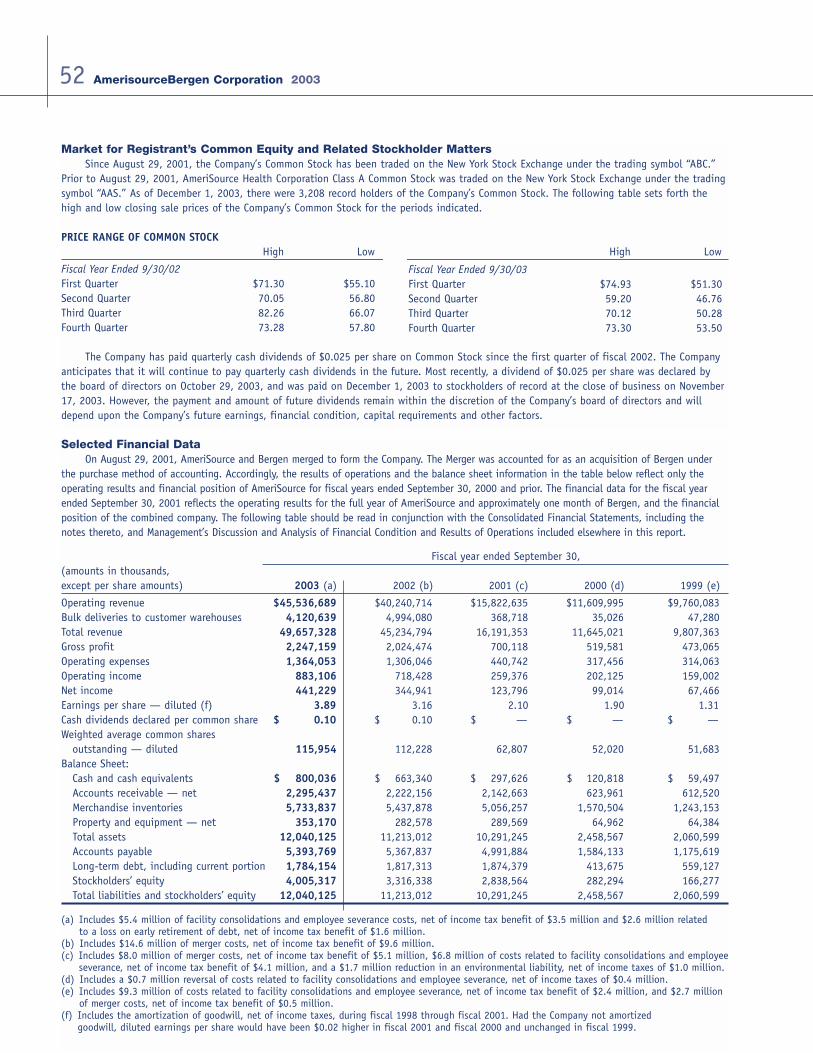
52 AmerisourceBergen Corporation 2003
Selected Financial DataOn August 29, 2001, AmeriSource and Bergen merged to form the Company. The Merger was accounted for as an acquisition of Bergen under
the purchase method of accounting. Accordingly, the results of operations and the balance sheet information in the table below reflect only theoperating results and financial position of AmeriSource for fiscal years ended September 30, 2000 and prior. The financial data for the fiscal yearended September 30, 2001 reflects the operating results for the full year of AmeriSource and approximately one month of Bergen, and the financialposition of the combined company. The following table should be read in conjunction with the Consolidated Financial Statements, including thenotes thereto, and Management’s Discussion and Analysis of Financial Condition and Results of Operations included elsewhere in this report.
Fiscal year ended September 30,(amounts in thousands,except per share amounts) 2003 (a) 2002 (b) 2001 (c) 2000 (d) 1999 (e)
Operating revenue $45,536,689 $40,240,714 $15,822,635 $11,609,995 $9,760,083Bulk deliveries to customer warehouses 4,120,639 4,994,080 368,718 35,026 47,280Total revenue 49,657,328 45,234,794 16,191,353 11,645,021 9,807,363Gross profit 2,247,159 2,024,474 700,118 519,581 473,065Operating expenses 1,364,053 1,306,046 440,742 317,456 314,063Operating income 883,106 718,428 259,376 202,125 159,002Net income 441,229 344,941 123,796 99,014 67,466Earnings per share — diluted (f) 3.89 3.16 2.10 1.90 1.31Cash dividends declared per common share $ 0.10 $ 0.10 $ — $ — $ —Weighted average common shares
outstanding — diluted 115,954 112,228 62,807 52,020 51,683Balance Sheet:
Cash and cash equivalents $ 800,036 $ 663,340 $ 297,626 $ 120,818 $ 59,497Accounts receivable — net 2,295,437 2,222,156 2,142,663 623,961 612,520Merchandise inventories 5,733,837 5,437,878 5,056,257 1,570,504 1,243,153Property and equipment — net 353,170 282,578 289,569 64,962 64,384Total assets 12,040,125 11,213,012 10,291,245 2,458,567 2,060,599Accounts payable 5,393,769 5,367,837 4,991,884 1,584,133 1,175,619Long-term debt, including current portion 1,784,154 1,817,313 1,874,379 413,675 559,127Stockholders’ equity 4,005,317 3,316,338 2,838,564 282,294 166,277Total liabilities and stockholders’ equity 12,040,125 11,213,012 10,291,245 2,458,567 2,060,599
(a) Includes $5.4 million of facility consolidations and employee severance costs, net of income tax benefit of $3.5 million and $2.6 million related to a loss on early retirement of debt, net of income tax benefit of $1.6 million.
(b) Includes $14.6 million of merger costs, net of income tax benefit of $9.6 million.(c) Includes $8.0 million of merger costs, net of income tax benefit of $5.1 million, $6.8 million of costs related to facility consolidations and employee
severance, net of income tax benefit of $4.1 million, and a $1.7 million reduction in an environmental liability, net of income taxes of $1.0 million.(d) Includes a $0.7 million reversal of costs related to facility consolidations and employee severance, net of income taxes of $0.4 million.(e) Includes $9.3 million of costs related to facility consolidations and employee severance, net of income tax benefit of $2.4 million, and $2.7 million
of merger costs, net of income tax benefit of $0.5 million.(f) Includes the amortization of goodwill, net of income taxes, during fiscal 1998 through fiscal 2001. Had the Company not amortized
goodwill, diluted earnings per share would have been $0.02 higher in fiscal 2001 and fiscal 2000 and unchanged in fiscal 1999.
Market for Registrant’s Common Equity and Related Stockholder MattersSince August 29, 2001, the Company’s Common Stock has been traded on the New York Stock Exchange under the trading symbol “ABC.”
Prior to August 29, 2001, AmeriSource Health Corporation Class A Common Stock was traded on the New York Stock Exchange under the tradingsymbol “AAS.” As of December 1, 2003, there were 3,208 record holders of the Company’s Common Stock. The following table sets forth thehigh and low closing sale prices of the Company’s Common Stock for the periods indicated.
PRICE RANGE OF COMMON STOCKHigh Low High Low
Fiscal Year Ended 9/30/02First Quarter $71.30 $55.10Second Quarter 70.05 56.80Third Quarter 82.26 66.07Fourth Quarter 73.28 57.80
The Company has paid quarterly cash dividends of $0.025 per share on Common Stock since the first quarter of fiscal 2002. The Companyanticipates that it will continue to pay quarterly cash dividends in the future. Most recently, a dividend of $0.025 per share was declared bythe board of directors on October 29, 2003, and was paid on December 1, 2003 to stockholders of record at the close of business on November17, 2003. However, the payment and amount of future dividends remain within the discretion of the Company’s board of directors and willdepend upon the Company’s future earnings, financial condition, capital requirements and other factors.
Fiscal Year Ended 9/30/03First Quarter $74.93 $51.30Second Quarter 59.20 46.76Third Quarter 70.12 50.28Fourth Quarter 73.30 53.50
Shareholder ServicesOur transfer agent, The Bank of New York, can help you with a variety of shareholder services, including:• Change of address• Lost stock certificates• Stock transfer• Account consolidation
The Bank of New York can be reached at:Telephone: 800-524-4458, 610-312-5303, or TDD 800-936-4237Internet: www.stockbny.comEmail: [email protected]: The Bank of New York
Shareholder Relations DepartmentP.O. Box 11258 Church Street StationNew York, NY 10286
Additional InformationFinancial documents, such as our annual report on SEC Form 10-K,quarterly reports on SEC Form 10-Q, the Company’s Code of Ethicsand Business Conduct and other reports and filings may be obtainedfrom the Company website at www.amerisourcebergen.com, or bycalling the Company’s Investor Relations department at 610-727-7429.
Investor RelationsShareholders, security analysts, portfolio managers, and otherinvestors desiring further information about the Company shouldcontact Michael N. Kilpatric, Vice President, Corporate & InvestorRelations at 610-727-7118, or [email protected].
Annual MeetingAmerisourceBergen shareholders are invited to attend our annualmeeting on Friday, March 5, 2004, at 2:00 p.m. Central Time at the Hyatt Regency DFW located at the Dallas/Fort Worth Airport in Dallas, Texas.
Independent AuditorsErnst & Young LLP, Philadelphia, PA
Stock ListingAmerisourceBergen is listed on The New York Stock Exchange underthe symbol ABC.
Corporate Information
532003 AmerisourceBergen Corporation
AmerisourceBergen CorporationP.O. Box 959
Valley Forge, Pennsylvania 19482
610-727-7000
www.amerisourcebergen.com
Related Documents