ORIGINAL PAPER Defining drivers of nitrogen stable isotopes (d 15 N) of surface sediments in temperate lakes Morgan Botrel • Irene Gregory-Eaves • Roxane Maranger Received: 21 January 2013 / Accepted: 20 September 2014 / Published online: 7 October 2014 Ó Springer Science+Business Media Dordrecht 2014 Abstract The nitrogen stable isotopic signature (d 15 N) of sediment is a powerful tool to understand eutrophication history, but its interpretation remains a challenge. In a large-scale comparative approach, we identified the most important drivers influencing surface sediments d 15 N of 65 lakes from two regions of Canada using proxies that reflect watershed nitro- gen (N) sources, internal lake microbial cycling and productivity. Across regions, we found that water column total nitrogen (TN), %N in the sediments and lake morphometric variables were the best predictors of sedimentary d 15 N, explaining 66 % of its variation. Significant relationships were also found between sediment d 15 N and human-derived N load (R 2 adj: = 0.23, p \ 0.001), the latter being a strong predictor of TN (R 2 adj: = 0.68, p \ 0.001). Despite a relatively strong overall relationship, variation parti- tioning revealed an interesting difference in the dominant variable that influenced regional d 15 N. Alberta lake sedimentary d 15 N signature was domi- nated by human derived N load. In contrast, internal processing appeared to be more important in Quebec lakes, where sediment d 15 N was best explained by %N in the sediments and lake volume. Overall, our findings support the use of d 15 N in paleolimnological investigations to reconstruct changing N sources to lakes but also highlight that regions may have distinctive drivers. Interpretations of sediment d 15 N are likely to be strongest when multiple lines of evidence are employed and when placed in a regional context. Keywords Nitrogen stable isotopes Á Nitrogen load Á Lake sediments Á Organic matter degradation Á Diagenesis Á Eutrophication Introduction Eutrophication is one of the greatest threats to freshwater ecosystems and ultimately results in the dominance of noxious algal blooms, decreases in oxygen concentrations and losses in biodiversity (Smith and Schindler 2009). Despite the widespread consensus that phosphorus (P) loads need to be controlled to mitigate eutrophication in lakes (Schin- dler 2006), there is growing evidence that enhanced nitrogen (N) inputs can further degrade water quality M. Botrel (&) Á R. Maranger De ´partement des sciences biologiques, Universite ´ de Montre ´al, C.P. 6128 suc. Centre-ville, Montreal, QC H3C 3J7, Canada e-mail: [email protected] M. Botrel Á I. Gregory-Eaves Á R. Maranger Groupe de recherche interuniversitaire en limnologie et en environnement aquatique (GRIL), Montreal, QC, Canada I. Gregory-Eaves Department of Biology, McGill University, Montreal, QC, Canada 123 J Paleolimnol (2014) 52:419–433 DOI 10.1007/s10933-014-9802-6

Welcome message from author
This document is posted to help you gain knowledge. Please leave a comment to let me know what you think about it! Share it to your friends and learn new things together.
Transcript

ORIGINAL PAPER
Defining drivers of nitrogen stable isotopes (d15N) of surfacesediments in temperate lakes
Morgan Botrel • Irene Gregory-Eaves •
Roxane Maranger
Received: 21 January 2013 / Accepted: 20 September 2014 / Published online: 7 October 2014
� Springer Science+Business Media Dordrecht 2014
Abstract The nitrogen stable isotopic signature
(d15N) of sediment is a powerful tool to understand
eutrophication history, but its interpretation remains a
challenge. In a large-scale comparative approach, we
identified the most important drivers influencing
surface sediments d15N of 65 lakes from two regions
of Canada using proxies that reflect watershed nitro-
gen (N) sources, internal lake microbial cycling
and productivity. Across regions, we found that
water column total nitrogen (TN), %N in the
sediments and lake morphometric variables were the
best predictors of sedimentary d15N, explaining 66 %
of its variation. Significant relationships were also
found between sediment d15N and human-derived N
load (R2adj: = 0.23, p \ 0.001), the latter being a strong
predictor of TN (R2adj: = 0.68, p \ 0.001). Despite a
relatively strong overall relationship, variation parti-
tioning revealed an interesting difference in the
dominant variable that influenced regional d15N.
Alberta lake sedimentary d15N signature was domi-
nated by human derived N load. In contrast, internal
processing appeared to be more important in Quebec
lakes, where sediment d15N was best explained by
%N in the sediments and lake volume. Overall, our
findings support the use of d15N in paleolimnological
investigations to reconstruct changing N sources to
lakes but also highlight that regions may have
distinctive drivers. Interpretations of sediment d15N
are likely to be strongest when multiple lines of
evidence are employed and when placed in a regional
context.
Keywords Nitrogen stable isotopes �Nitrogen load �Lake sediments � Organic matter degradation �Diagenesis � Eutrophication
Introduction
Eutrophication is one of the greatest threats to
freshwater ecosystems and ultimately results in the
dominance of noxious algal blooms, decreases in
oxygen concentrations and losses in biodiversity
(Smith and Schindler 2009). Despite the widespread
consensus that phosphorus (P) loads need to be
controlled to mitigate eutrophication in lakes (Schin-
dler 2006), there is growing evidence that enhanced
nitrogen (N) inputs can further degrade water quality
M. Botrel (&) � R. Maranger
Departement des sciences biologiques, Universite de
Montreal, C.P. 6128 suc. Centre-ville, Montreal,
QC H3C 3J7, Canada
e-mail: [email protected]
M. Botrel � I. Gregory-Eaves � R. Maranger
Groupe de recherche interuniversitaire en limnologie et en
environnement aquatique (GRIL), Montreal, QC, Canada
I. Gregory-Eaves
Department of Biology, McGill University, Montreal, QC,
Canada
123
J Paleolimnol (2014) 52:419–433
DOI 10.1007/s10933-014-9802-6
through the proliferation of toxic cyanobacteria (Giani
et al. 2005; Monchamp et al. 2014). Paleolimnology
provides a unique long-term understanding of the
impact of N pollution on lake ecosystems. Sedimen-
tary nitrogen stable isotopes (d15N) of organic matter
have served as an informative metric of such impacts.
However, the d15N sediment signature is a complex
indicator with many possible interpretations : it can
serve to identify the dominant source of N to lakes, the
influence of internal microbial cycling or changes in
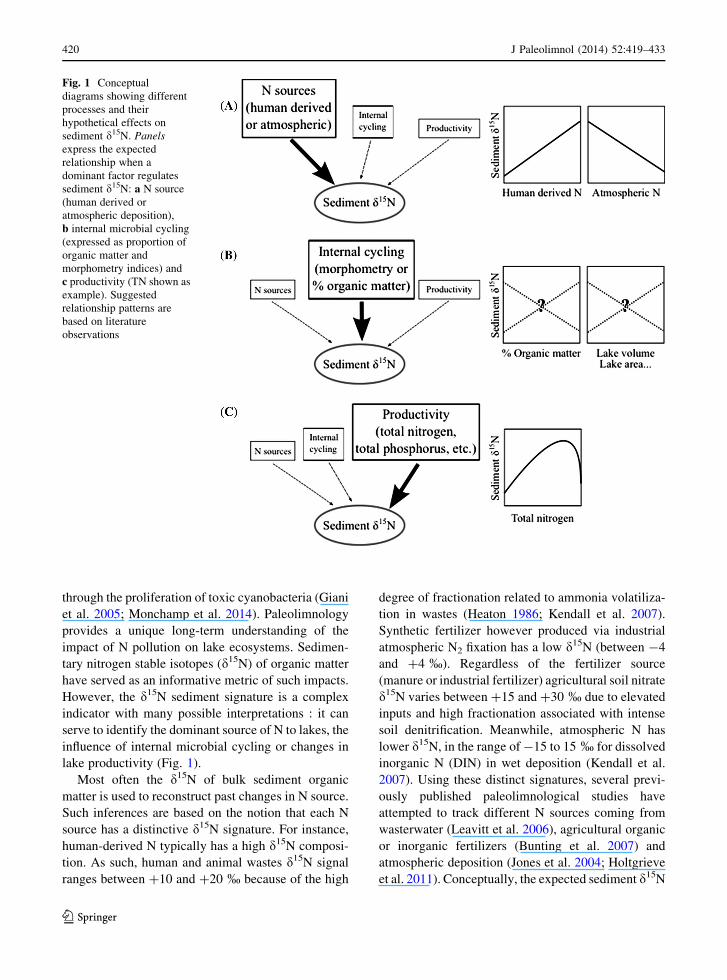
lake productivity (Fig. 1).
Most often the d15N of bulk sediment organic
matter is used to reconstruct past changes in N source.
Such inferences are based on the notion that each N
source has a distinctive d15N signature. For instance,
human-derived N typically has a high d15N composi-
tion. As such, human and animal wastes d15N signal
ranges between ?10 and ?20 % because of the high
degree of fractionation related to ammonia volatiliza-
tion in wastes (Heaton 1986; Kendall et al. 2007).
Synthetic fertilizer however produced via industrial
atmospheric N2 fixation has a low d15N (between -4
and ?4 %). Regardless of the fertilizer source
(manure or industrial fertilizer) agricultural soil nitrate
d15N varies between ?15 and ?30 % due to elevated
inputs and high fractionation associated with intense
soil denitrification. Meanwhile, atmospheric N has
lower d15N, in the range of -15 to 15 % for dissolved
inorganic N (DIN) in wet deposition (Kendall et al.
2007). Using these distinct signatures, several previ-
ously published paleolimnological studies have
attempted to track different N sources coming from
wasterwater (Leavitt et al. 2006), agricultural organic
or inorganic fertilizers (Bunting et al. 2007) and
atmospheric deposition (Jones et al. 2004; Holtgrieve
et al. 2011). Conceptually, the expected sediment d15N
Fig. 1 Conceptual
diagrams showing different
processes and their
hypothetical effects on
sediment d15N. Panels
express the expected
relationship when a
dominant factor regulates
sediment d15N: a N source
(human derived or
atmospheric deposition),
b internal microbial cycling
(expressed as proportion of
organic matter and
morphometry indices) and
c productivity (TN shown as
example). Suggested
relationship patterns are
based on literature
observations
420 J Paleolimnol (2014) 52:419–433
123

signature will depend on the dominant N source, with
N derived from agriculture or human waste increasing
the d15N signature while atmospheric inputs results in
a lower one (Fig. 1a).
Since lakes are intense biological reactors and act
as sinks for reactive N through sediment burial and
loss via denitrification (Harrison et al. 2009), the d15N
signature of the externally derived N sources can be
altered by N retention in two ways. First, bacteria can
indirectly change sediment d15N through the remin-
eralization of organic matter resulting in the release of
ammonium to the water column which can further be
nitrified and denitrified. This remineralized DIN
available to primary producers could have a different
d15N compared to the original external source signa-
ture. Evidence of this indirect effect on sediment d15N
has been previously observed (Hodell and Schelske
1998; Hadas et al. 2009). Second, bacteria can directly
alter the sediment d15N through the degradation of
organic matter. The d15N changes can be caused by
bacterial consumption and the fractionation of the
organic N pool, via the preferential degradation of
certain N forms or through the increase of bacterial
biomass (Lehmann et al. 2002; Kohzu et al. 2011).
Yet, there is conflicting evidence on the effect of
degradation on sedimentary d15N where some studies
have found it resulted in an increase in the isotopic
signature (Ostrom et al. 1998; Freudenthal et al. 2001),
whereas others have found that it resulted in a decrease
(Galman et al. 2009; Kohzu et al. 2011). Another
potential proxy for the influence of internal N
processing by microbes on sediment d15N is lake
morphometry (Fig. 1b). Indeed, lake N retention is
strongly linked to primary morphometric features such
as water residence time and lake shape (Finlay et al.
2013; Harrison et al. 2009), but no studies to our
knowledge have considered how morphometry influ-
ences sediment d15N.
The organic matter, and therefore, the sediment
d15N also depend on the assimilation of nutrients by
primary producers. From this perspective, there would
be an expected positive unimodal relationship
between d15N and trophic state explained by fraction-
ation during N assimilation and N fixation (Fig. 1c)
(Gu 2009). During assimilation, phytoplankton tends
to fractionate N and preferentially incorporate the 14N
isotope. As N becomes more limiting with increasing
trophic state, phytoplankton would have a lower
fractionation effect and thus incorporate more of the
heavier isotope 15N resulting in higher d15N signature
(Wada and Hattori 1978; Fogel and Cifuentes 1993).
In hypereutrophic lakes, low N:P ratios could lead to
atmospheric N fixation (-1 to -2 %) as the main N
source, resulting in a marked decrease in planktonic
d15N (Gu et al. 1996; Brenner et al. 1999). Several
paleolimnological studies have used sedimentary d15N
as an indicator of past productivity (Brenner et al.
1999; Wu et al. 2006) and N fixation (Riedinger-
Whitmore et al. 2005; Schindler et al. 2008).
To assess what are the most important drivers of
sediment d15N, we used a comparative approach to
quantify the relative influences of three broad factors:
external N sources, internal microbial cycling and
productivity. Specifically, we examined the relation-
ships between surface sediment d15N of 65 lakes and
their respective watershed N inputs, land use, mor-
phometric indices, sediment organic matter content
and productivity metrics as proxies for the three
factors of classification mentionned. We address the
question in temperate lakes from two geographically
distinct regions impacted by human activities.
Study sites
To capture a broad range in land use, lake shape and
trophic state, data were collected from two contrasting
regions of Canada in 40 lakes from southern Quebec
and 25 lakes across Alberta (Fig. 2). In our subset of
Southern Quebec, the majority of lakes lie in the
Appalachian Mountains with some located in the Saint
Lawrence Lowlands, all of them being in a region
dominated by mixed forest where agriculture is
present at different intensities. Our Quebec lake have
circumneutral pH, span large P and N gradients and
are predominantly shallow (Vermaire et al. 2011). Our
sampled Alberta lakes are located in the Boreal Plain
and the Aspen Parkland, a transition zone between the
prairies and boreal forest biomes. The exceptions to
this are Elkwater, Reesor and Spruce Coulee reservoir,
which are located on a plateau rising 200 m above the
Canadian prairies and fall within the Cypress Hill
Provincial Park. Alberta sites are generally low
elevation lakes, with large watersheds and are natu-
rally productive as their watershed soils are rich in P
(Prepas and Trew 1983). Agriculture is well developed
in the parkland region thus contributing to the cultural
eutrophication of lakes (Taranu and Gregory-Eaves
2008).
J Paleolimnol (2014) 52:419–433 421
123

Materials and methods
Collection of sediment samples and isotopic
analysis
To measure N stable isotopes, surface sediments (top
0–1 cm) were retrieved from the deep-water deposi-
tional zone of the lakes (Glew et al. 2001). Sediments
from Quebec were collected in summers 2007 and
2008 and sediments from Alberta in summer 2006.
Based on 210Pb age models, the upper 1 cm of Quebec
lakes represents * 2 years of sedimentation (Verm-
aire 2011) and for Alberta lakes, between * 2 years
to a maximum of 5 years (Koster et al. 2008). N
isotopic composition was measured on freeze-dried
homogenized bulk sediment using a continuous flow
Micromass IsoprimeTM IRMS coupled to a Carlo Erba
NC 1500 elemental analyzer located at the GEOTOP
Research Center (Universite du Quebec a Montreal).
For most samples, the analytical precision was ±
0.2 %, but for samples with low N (\ 1 %N) the
analytical precision was ± 0.4 %. Isotopic values are
reported as the d notation (d = ([Rsample-Rstandard]/
Rstandard) 9 1000, where R = 15N/14N). Values for
d15N are referenced against atmospheric N2 gas. d15N
duplicates were run on 10 % of samples; coefficient of
variation was less than 10 %.
Watershed and land use data acquisition
To determine watershed characteristics and quantify
the coverage of land use, we used geographic infor-
mation system (GIS) techniques. The watersheds were
first delineated using digital elevation models (DEM)
Fig. 2 Map of the study sites and the major river systems from Southern Quebec and Alberta provinces of Canada. Region location
presented in inset
422 J Paleolimnol (2014) 52:419–433
123

at a scale of 1:50,000 (Canadian Digital Elevation
Data Level 1 available at www.geobase.ca) loaded in
ESRI ArcGIS 9.3 and processed through the spatial
analyst hydrology tools. To obtain the final watershed
overlays, we substracted the lakes’ outlines taken from
digitized bathymetric maps when available or from the
Canadian National Topographic Database (NTDB;
www.geogratis.ca) to the watershed layers computed
with the DEM. We then calculated the lake and
watershed areas using the Canadian Albers equal-area
conic projection to minimize distortion. The water-
shed maximum and mean slope statistics were esti-
mated using the spatial analyst surface tool on DEM
data and the drainage ratio was calculated as the
watershed area divided by the lake area (WA:LA). The
proportions of land use type cover was finally com-
puted by clipping the watershed overlay on the land
use layers. For Quebec lakes, the vegetation cover and
number of buildings were taken from the spatial
database CanVec (CanVec; www.geogratis.ca) and
agricultural cover was acquired from the Base de
donnee sur les cultures generalisees (BDCG:: www.
fadq.qc.ca/). For Alberta lakes, land coverage of these
same land use types was made available by Alberta
Environment (Z. E. Taranu pers. comm.) and number
of buildings extracted from CanVec.
Estimation of watershed N load
GIS techniques were also used to calculate the
watershed N load coming from human and from
atmospheric deposition. Our approach to calculate
watershed human derived N load was to combine
census data on fertilizer, livestock and human popu-
lation that were applied to each watershed and convert
them in kg of N. County level data on fertilizer
expense and farm animal numbers were acquired from
the 2006 Canadian census of agriculture (Statistics
Canada 2006a,b) and the number of inhabitants from
the 2006 census of population (Statistics Canada:
http://www12.statcan.ca/). Fertilizer expenditure in
dollars were converted to kg of N using provincial
total amount of fertilizer and nutrient sold (Canadian
Fertilizer Institute: http://www.cfi.ca/elibrary/). Live-
stock N excretion reported in Culley and Barnett
(1984) were used to estimate the total N from manure
since they best represent agricultural practices in
Canada. N produced by the human population was
estimated to be 5.6 kg per individual per year (Castro
et al. 2003), representative of a typical North Ameri-
can diet and the use of septic tanks.
To obtain spatial data describing N from fertilizer
and animal wastes at the watershed scale, county level
data were scaled by weighting each county by the
agricultural land area included within the watershed
boundaries to the total area of agricultural land of each
county. For this calculation we assumed that the
fertilizer sold in one county is applied within that same
county. Similarly, population data were scaled to
watershed by weighing with number of buildings.
Atmospheric N deposition was estimated by multi-
plying lake and watershed area by an average N
deposition rate of 8 kg N ha-1 year-1 for Quebec and
4 kg N ha-1 year-1 for Alberta (Schindler et al. 2006;
Krzyzanowski 2010). The human-derived and atmo-
spheric estimated N loads are all reported as
kg N year-1.
Sediment geochemical analyses
To test wether degradation of the organic matter can
alter sediment d15N, we measured elemental propor-
tion of sedimentary N and carbon (C) on the same
samples as for isotope analysis with a Fisons EA1108
Elemental Analyzer according to standard techniques
(Meyers and Ishiwatari 1993). All %C measurements
reported represent organic carbon content since car-
bonates were removed prior to analyses by fumigation
with 1 M HCl (Helie 2009). This method was suitable
for our samples as none of the sites were located in
regions dominated with dolomite which resist the
fumigation treatment (J.-F Helie pers. comm.). Ana-
lytical precision for organic C and for N was ± 0.02
and ± 0.05 % respectively and replicate were run on
10 % of samples with a coefficient of variation less
than 10 %.
Morphometry data acquisition
Lake morphometry was characterized using GIS
methods to further test possible effect of N retention
on sediment d15N. Using raster overlay of the lake
bathymetry, lake volume was first calculated as well as
shoreline length. For Quebec lakes, bathymetric maps
(provided by Service des bibliotheques et archives,
Universite de Sherbrooke) were digitized in point
J Paleolimnol (2014) 52:419–433 423
123

vector layer that were rasterized to 1-m cell size using
the nearest neighbour algorithm. For most Alberta
lakes, rasterized bathymetric map were obtained from
the Alberta Geological Survey (AGS; www.ags.gov.
ab.ca) except for four lakes where bathymetric maps
were obtained from Alberta Lake Management Soci-
ety (ALMS; http://www.alms.ca) and digitized. Lake
volume was calculated following the formula
V(x1,x2) = ((Ax1 ? Ax2)/2) 9 (X2 - X1) where A is
area and X is depth interval (Kalff 2002); volume was
summed for all depth increments. For six lakes,
bathymetric maps were not available and regression
models between lake area and volume was applied to
account for missing data (R2adj: [ 0.77, Botrel 2011).
All other morphometric indices were derived from
these measurements. Mean depth was calculated as the
ratio of volume to lake area (V/LA), the index of basin
permanence (IBP; Kerekes 1977) was computed as the
Table 1 Summary table of the N sources, internal cycling and productivity variables used in this study
#
* indicates significant regional differences at p \ 0.05, 4 are the variables kept for the MLR, (poly) indicates the variable kept for
MLR was the second order polynome. % Agr represents proportion of agriculture area on watershed, % Forest proportion of forest
area on watershed, Building # number of buildings on watershed, % Water proportion of water area on watershed, WA watershed
area, WA:LA watershed area to lake area ratio, Human N watershed human derived N load, Atm. dep. atmospheric deposition on the
watershed, %N sed proportion of sediment N, %C sed proportion of sediment C C:N sed elemental sediment C:N ratio, LA lake
area, SL shoreline length, Zmax maximum lake depth, Zmean mean lake depth, IBP index of basin permanence, V:WA lake volume to
watershed area ratio, TN total nitrogen concentration, TP total phosphorus concentration, DP dissolved phosphorus concentration,
DOC dissolved organic carbon concentration, chla chlorophyll a, N:P ratio of lake total N to total P
424 J Paleolimnol (2014) 52:419–433
123

ratio of volume to shore line length (V/SL) and V:WA
refers to the ratio of volume to watershed area.
Retrieval of water chemistry data
To test our hypotheses of the influence of productivity
on sediment d15N, we acquired lake water chemistry
data (Table 1). For all Quebec lakes, physicochemical
variables were primarily measured at a single time
point in August when the sediment samples were
originally collected (Vermaire et al. 2011). For some
of these lakes, growing season means were also
available through a monitoring program (three to four
visits from May to November, Prairie and Parkes
2007). For Alberta, all lake chemistry data represent-
ing average growing season values (one to five
visit from May to September) was acquired from
publicly available monitoring programs (Lake Water
Quality Data: http://environment.alberta.ca/; Provin-
cial Parks Lake Monitoring Program: http://www.
environnement.gov.ab.ca/info/; Alberta Lake Man-
agement Society: http://www.alms.ca). In order to
remain consistent among regions, we ran simple least
square regression models (R2adj: [ 0.60, Botrel 2011)
between Quebec single point measures from August
and the growing season averages to correct for the
potential differences. In a few instances, a regression
model approach was also applied, (R2adj: [ 0.77, Bo-
trel 2011) to account for missing data in the Quebec
and Alberta datasets.
Statistical analyses
To first assess the overall difference between the two
regions, a multivariate ANOVA with a redundancy
analysis (RDA) was conducted on the isotopes and
environmental data (the explanatory variables) and a
binary factor coding for the regions (the response
variable) using the ‘‘vegan’’ package in R (Legendre
and Anderson 1999). To determine if individual
variables were significantly different between regions,
multiple T-tests with a Holm correction for multiple
comparisons were done. To further described the
environmental data structure we used principle com-
ponent analysis (PCA).
To test whether N sources, organic matter, mor-
phometry or productivity are significant predictors of
sediment d15N and explain maximum variation, a least
square multiple linear regression (MLR) approach was
used. Because of high colinearity in the dataset,
variables were first screened to remove those that were
highly correlated with each other. Simple linear
regressions were computed between d15N and each
explanatory variable. Since one of our working
hypotheses included a non-linear response model,
polynomial regressions were also computed between
d15N and each variable. Only significant polynomial
terms were included as new variables into our models
(volume2 and IBP2). Variables with the highest
adjusted R2 (R2adj:) were first selected and the variable
related to the selection with an r [ 0.6 were consid-
ered collinear and eliminated. We then ran forward
selection on the pre-selected variables (‘‘packfor’’
package in R) and the MLR (‘‘ape’’ package in R).
On the explanatory variables selected by MLR, we
ran analysis of covariance (ANCOVA) to compare
relationships (slopes and intercepts) between the two
regions. Finally, to determine what is the most impor-
tant predictor of d15N when removing the effect of other
predictors, variation partitioning was computed on
these same explanatory variable of d15N (Borcard et al.
1992). Prior to all analyses, variables were transformed
(square-root or natural logarithm) to satisfy the
assumption of normality and a multivariate Levene’s
test was conducted to satisfy homoscedasticity. Anal-
yses were performed in R statistical software.
Results
Interregional difference in response
and explanatory variables
Several environmental variables in the three broad
classification factors of interest and the sedimentary
d15N signature were significantly different between
regions (Table 1; MANOVA p \ 0.05). Alberta lakes
exibited significantly higher d15N sedimentary signa-
ture than Quebec lakes (mean d15N = 4.1 and 2.5 %respectively, p \ 0.001). Most of our N source
variables were also higher for Alberta. For example,
Alberta lakes had greater human derived N load,
watershed area and atmospheric deposition but Que-
bec lakes were characterised by steeper slopes. These
differences in N load were not reflected in land-use
coverage which was similar between regions. Strong
J Paleolimnol (2014) 52:419–433 425
123

differences were also observed in some sediment
variables where Alberta had higher %N, although
%C and C:N was similar to Quebec lakes. Several
morphometric variables also differed significantly
where Quebec lakes generally had smaller surface
areas and volumes and were shallower. Despite the
differences in basin and watershed morphometries, the
drainage ratio and V:WA were similar between the
two regions. The majority of the productivity variables
(TN, TP, pH, DP, chla) that reflect lake trophic status
were higher for Alberta, but secchi depth and N:P
ratios were similar across regions.
Using a PCA analysis we observed strong colin-
earity among multiple variables reflective of different
broad factors of classification: sources, internal
cycling and productivity (Fig. 3). The first PCA axis
accounted for 37 % of the variance and illustrated that
lakes were located along a trophic gradient with
Alberta lakes being more nutrient rich compared to
Quebec lakes. The small angles between the produc-
tivity variables on the PCA (TN, DP, TP, DOC, chla,
pH, secchi depth) was in agreement with correlation
analysis revealing that these variables were highly and
significantly correlated with each other and with the N
source variables (p [ 0.6, p \ 0.01). The second PCA
axis accounted for 15 % of the variance and showed
that lakes were on a size gradient with Alberta lakes
being in general bigger and deeper. Again, we found
-2 -1 0 1
-2
-1
0
1
2
PCA axis 1 (37%)
PCA
axis
2(1
5%)
WAMax slope
Volume
ZmaxZmean
SLLA
WA:LA
IBP
TN
TPDP
DOC
Secchi
%C sedHuman N
Atm.dep.
chla
Build.%N sed
% Agr% Water
pHC:Nsed Mean slope
%Forest
N:P
IBP2
V:WA
QuebecAlberta
Productivity variablesInternal cycling variablesN source variables
Fig. 3 Principal component analysis (PCA) of the environ-
mental data, scaling type 2. First axis explains 37 % of the
variation and second axis 15 %. Environmental variables:
angles between arrows are proportional to the correlations
between variables. Arrow styles represent our three broad
variable classifications : gray represents N source, dashed
internal cycling and black productivity. Shorter arrows are
variables that contribute less to the formation of the reduce
space; angles in that case are less representative. Points
represent sites from both regions and where they are located
along the gradients
426 J Paleolimnol (2014) 52:419–433
123

strong correlation between the morphometric vari-
ables (r [ 0.6, p \ 0.01) representative of internal
cycling. Given observed high colinearity, only ten
environmental variables were kept for MLR (Table 1).
Predictors of sedimentary d15N variation
Simple regression analyses across the two regions
showed that nutrient concentrations were the strongest
explanatory variables of d15N. Total nitrogen (TN)
and dissolved phosphorus (DP) concentrations were
the strongest predictors (respectively R2adj: = 0.32 and
0.29, p \ 0.01, n = 65;). Morphometric variables also
explained a significant fraction of the variation
whereby volume and IBP were related in a unimodal
fashion to d15N (respectively R2adj: = 0.28 and 0.25,
p \ 0.01). Finally, sediment N content (%N) and
watershed human derived N load were also found to be
significant predictors of d15N (respectively R2adj: =
0.15 and 0.23, p \ 0.01). Overall our MLR model
showed that 66 % of the variation of the sedimentary
d15N signature was explained by TN, %N in the
sediment and morphometry (Table 2). Most of the
variation was explained by TN and %N in the sediment.
IBP2 was only marginally significant and thus elimi-
nated from further analyses.
Numerous regional differences in the relationship
between the selected environment variables and the
sediment d15N were detected using ANCOVA. For
example, both the slope and intercept for the models
describing the relationship between sedimentary d15N
and TN were significantly different (interaction of
region and d15N: F1,61 = 8.6, p = 0.005; Fig. 4a).
Part of this observed difference could be explained by
the smaller range of TN concentrations in Quebec
lakes. Nonetheless, TN was significantly correlated
with human derived N load for both regions (Fig. 4b).
The relationship between human derived N load and
TN had similar slopes (F1,61 = 0.6, p = 0.43) but
significantly different intercepts (F1,62 = 19.5,
p \ 0.01), where Alberta lakes had 2.5 mg L-1 higher
TN concentrations on average for a similar human
derived N load.
A regional difference was also observed when
considering internal lake cycling variables. In the
sedimentary d15N– %N relationship (R2adj: = 0.47,
p \ 0.001, Fig. 4c) we found similar slopes (F1,61 =
2.6, p = 0.11) but significantly different intercepts
between regions, with the d15N signature being
* 2.6 % higher on average in Alberta lakes for a
similar %N sediment content (F1,62 = 40.5, p \0.01). When considering lake volume, both slopes
and intercepts were regionally different (interaction of
region and d15N: F1,61 = 3.3, p = 0.07) and the
relationship is best modelled by seperate regressions
(Fig. 4d). In this case, lake volume was a significant
predictor of the d15N signature for Quebec lakes only.
Variation partitioning
In order to characterize the relative importance of the
broad factors of classification to the overall d15N of the
sediment, variation partitioning was computed inde-
pendently for the two regions using lake volume, TN
and %N in the sediments as predictor variables
(Fig. 5). In Quebec lakes, we found that %N in the
sediments explained most variation (34 %, p = 0.05),
with an additional 20 % shared with lake volume
(p = 0.05, Fig. 5a). A modest fraction of the variation
in d15N was explained by TN, but this variation
overlapped completely with lake volume (2 %) and
%N in the sediments (1 %). A different pattern was
observed for Alberta lakes where TN was the most
important predictor explaining uniquely 48 %
(p = 0.01) of the d15N variation (Fig. 5b). %N in
the sediments explained an additional 19 % (p =0.05)
of the variation in d15N from Alberta lakes, whereas
lake volume only explained 3 % (Fig. 5b).
Discussion
Defining the controls of sedimentary d15N variation is
of primary importance for its application to paleolim-
nological records and identifying causes of eutrophi-
cation. Our analysis of surface sediments from 65
temperate lakes demonstrated that over a large spatial
Table 2 Least squares MLR results with forward selection
using permutation test to model sediment d15N
Significant
explanatory variables
Standardized
coefficient
p value
(two-tail)R2
adj:
TN (ln) 0.52 0.001 0.66
%N sediment (H) -0.59 0.001
Volume (ln) 0.27 0.008
IBP2 (ln) -0.20 0.011
J Paleolimnol (2014) 52:419–433 427
123

scale, lake TN concentration is a strong predictor
variable of sedimentary d15N. Given that TN was
highly correlated to human derived N load, this
suggests the sediment isotopic signature of our
systems was most likely regulated by N sources.
These findings are in agreement with spatial (Selbie
et al. 2009; Bunting et al. 2010) and temporal studies
(Elliott and Brush 2006, Bunting et al. 2007) of
sedimentary d15N control. Interestingly, the %N in
sediment explained a similar fraction of the variance
in sedimentary d15N, whereby lakes with lower
sediment N content tend to have higher d15N signa-
tures. This result indicates internal microbial
transformations are important in shaping sediment
d15N and is consistent with studies that observed a 15N
enrichment of the residual organic material as a
function of degradation in oxygenated waters (Altabet
1988; Freudenthal et al. 2001). Volume also entered
the model as a significant variable highlighting the
importance of N retention (Harrison et al. 2009).
Despite a wide range in productivity in our study
lakes, we failed to support the idea that d15N serves as
an indicator of increasing productivity and fixation by
cyanobacteria (Gu et al. 1996; Gu 2009; Fig. 1c). Our
analysis also showed strong regional differences in the
dominant variables influencing sedimentary d15N,
-2
0
2
4
6
8
ln(TN)
δ15N
(o/ oo
)
QC: δ15N = 1.1 ln(TN) + 3.5 R2adj. = 0.02, p = 0.17
AB: δ15N = 1.9 ln(TN) + 3.7R2adj. = 0.40, p < 0.001
-1
0
1
2
ln(human derived N)
ln(T
N)
QC: ln(TN) = 0.1 ln(hum. N) - 2.1 AB: ln(TN) = 0.1 ln(hum. N) -1.2
R2adj. = 0.68, p < 0.0001
(B) TN and human derived N
Quebec
Alberta
SitesLinear regression
Linear regression
-2
0
2
4
6
8
sqrt(%N sediments)
δ15N
(o / oo)
QC: δ15N = -3.4 sqrt(%N sed) + 6.2AB: δ15N = -3.4 sqrt(%Nsed) + 8.8
R2adj. = 0.47, p < 0.0001
-1 0 1 2 6 8 10 12 14
0. 5 1.0 1.5 12 14 16 18 20
-2
0
2
4
6
8
ln(lake volume)
δ15N
(o / oo)
QC: δ15N = 0.6 ln(volume) - 5.8R2adj. = 0.24, p < 0.001
AB: δ15N = 0.3 ln(volume) - 0.2R2adj. = 0.00, p = 0.63
(A) δ15N and total nitrogen
(C) δ15N and %N sediments (D) δ15N and lake volume
Sites
Fig. 4 Analysis of covariance on the variables selected by the
forward selection to compare the linear relationships between
regions: a relationship between d15N and TN, with significant
regional differences in slopes and intercepts; b relationship
between TN and watershed human derived N load, showing
similar slopes but different intercepts between regions; c rela-
tionship between d15N and %N in the sediments, having similar
slopes but different intercepts between regions; d relationship
between d15N and lake volume, differing regionally in both
slopes and intercepts
428 J Paleolimnol (2014) 52:419–433
123

where proxies of internal cycling dominated in
Quebec and external sources in Alberta.
The role of N sources on sedimentary d15N
Studies on d15N distribution in ecosystems have long
recognized the use of d15N natural abundance as a
tracer of different anthropogenic N sources (Heaton
1986). Our analysis provides broad support for the
presence of a positive relationship between TN and
sediment d15N. TN was itself highly correlated to
human derived N load, suggesting TN is reflective of
the watershed N sources and sediment d15N is
dependent upon the magnitude of N inputs (Fig. 4a,b).
Paleolimnological reconstructions often report
increasing trends in d15N coincident with human
population growth or more intense agricultural
practice since post-industrialisation (Bunting et al.
2007, Engstrom et al. 2006). Indeed this pattern is
what we observed across regions, but was driven
primarily by the strong significant relationship in
Alberta lakes.
Regionally, the average TN concentrations and
watershed human derived N load were higher in the
Alberta lakes relative to Quebec, which may explain
part of the observed higher average d15N sediment
signatures in Alberta. However, these regions also
differed in the dominant anthropogenic N source type,
which can alter the average sediment d15N signature at
the landscape scale (Kendall et al. 2007). Alberta lakes
experience more substantial agricultural N loads, 6.8
times more on average, whereas atmospheric N depo-
sition is relatively more important in Quebec (Botrel
2011). The human watershed N signal may be lost in
Quebec lakes due to the effect of mixing N from
agricultural and human wastes (high d15N) with equally
important inputs of N from atmospheric deposition with
low d15N (Table 1). The dominance of certain crop
types such as N fixing legumes which are more
prevalent in Quebec would further contribute to lower
the d15N signature (BDCG:: www.fadq.qc.ca/).
Potential effect of degradation on sedimentary d15N
Our study revealed a significant relationship between
N content in sediments and the d15N signature across
both regions where lake sediments with low %N
tended to have higher d15N. Bunting et al. (2010)
found the same relationship between sediment N and
d15N in surface sediments of 75 lakes from the Rocky
mountains in Alberta (R2 = 0.45). The consistency of
this relationship in various lake systems across Canada
suggests that it is a common feature of temperate
lakes, although very few studies report it. In Quebec
lakes, %N in the sediments was the strongest
predictor variable of the sediment d15N isotopic
signature.
The spatially consistent relationship between sed-
iment %N and d15N could be explained by nitrogen
consumption via bacterial degradation during sedi-
mentation. High amounts of primary organic matter
consumed by bacteria in the water column will result
in a low proportion of total reaching the sediment
surface (Meyers 1997). Increases in the d15N of the
residual organic matter in sediment has been observed
in marine studies when particles settle through an
0.34
0.03
0.02
0.200.01
Residuals = 0.40
0.48
0.19
0.010.02
Residuals = 0.41
TN
%N sediments
Volume
Volume
TN
%N sediments
(B) Total sedimentary δ15N variation, Alberta
(A) Total sedimentary δ15N variation, Quebec
Fig. 5 Variation partitioning of the explanatory variables of
sedimentary d15N signature: a for Quebec, b for Alberta. Sum of
b does not total 1 because the best model of d15N includes both
TN and %N in the sediment
J Paleolimnol (2014) 52:419–433 429
123

oxygentated water column (Altabet 1988; Altabet and
Francois 1994; Freudenthal et al. 2001). Laboratory
experiments exposing particulate organic matter
(POM) to oxygenated conditions confirm that rapid
degradation results in an increase of d15N (Lehmann
et al. 2002). The causal mechanism would be the
preferential release of 14N dissolved N from bacterial
metabolism.
The observed negative relationship between lake
volume and %N of sediments in Quebec lakes
suggests that residence time is also an important
factor explaining d15N shift during water column
particle degradation. Shallow, smaller lakes have
shorter water residence times and particles would be
subject to less processing (Kalff 2002). The oscillation
between oxic and anoxic conditions in the water
columns of large and deep lakes can further increase
the average d15N signature of the POM as observed in
Lake Kinneret (Hadas et al. 2009). We found some
support for this effect in our systems when considered
regionally, where the effect of increasing volume in
Quebec lakes resulted in overall higher signatures
(Fig. 4d).
Another possible factor explaining the relationship
between sediment d15N and %N in the sediment is the
composition of the organic matter itself. If the
relationship was driven by the organic matter compo-
sition, one would expect a negative relationship
between sediment C:N and d15N (Selbie et al. 2009;
Woodward et al. 2012). However, this hypothesis is
not suported by our data. The absence of a relationship
may be due to the low atomic sediment C:N ratio of
our sites (max = 18), being more representative of
aquatic organic matter relative to the higher C:N
values reported for vascular plants (Meyers and
Ishiwatari 1993). Indeed, previous studies have shown
an increase in the variability of the relationship
between sediment C:N and d15N, when C:N is less
than 20 (Woodward et al. 2012).
Limitations of the use of d15N as an indicator
of productivity
Our analysis failed to support the hypothesis that
sediment d15N was driven by changes in phytoplank-
ton N assimilation and fixation along a trophic
gradient as outlined in Fig. 1c. In addition to the lack
of consistency between this response model and our
isotopic data, analyses of water chemistry support this
conclusion. For example, we detected significant
negative relationships between N:P and TP in both
regions, indicative of a declining contribution of N to
the total nutrient pool when fertilizer, sewage and
animal manure, as well as internal loading are the
predominant nutrient sources (Downing and McCau-
ley 1992). These data suggest that N limitation is
possible (Pick and Lean 1987), and yet we failed to
detect a significant relationship between sediment
d15N and the lake water N:P ratio, which would be
expected if N-fixation was a dominant process oper-
ating in lakes with low N:P. This result was surprising
for our Alberta lakes where phytoplankton communi-
ties were dominated by nitrogen-fixing taxa such as
Anabaena and Aphanizomenon, (Taranu et al. 2012).
A change in sediment isotopic signature as a function
of fixation has been observed in highly hyper-eutro-
phic subtropical lakes (Gu et al. 1996). Unfortunately,
we do not have any estimates of fixation for these
Alberta lakes but Lewis and Wurtsbaugh (2008) make
a convincing case that the N arising from fixation,
even in some eutrophic lakes, is relatively small. As
such, we suggest that the elevated signature of the
anthropogenic N load diluted the effect of low d15N
coming from fixation and/or fixation was a minor N
input in these Alberta lakes. However, it would be
interesting in the future to mechanistically model the
inputs required by N fixation that could influence
sediment d15N signature for lakes with a given N
watershed load.
The importance of N sources in our study also
suggests that fractionation by phytoplankton assimi-
lation is not a dominant process controlling sediment
d15N in our study lakes. The fractionation effect of
phytoplankton assimilation is typically observed by a
negative relationship between sediment d15N and
water column NO3- concentration. Previous studies
have observed this relationship in oceans (Altabet and
Francois 1994) and oligotrophic lakes with high
residence times (Owen et al. 1999; Teranes and
Bernasconi 2000). However, in a detailed study of a
subset of our Quebec lakes spanning a broad trophic
gradient, no such effect was observed as nitrification
was apparent in the dual isotopic NO3- signal
throughout the summer, despite low overall concen-
tration in the upper water column (Botrel 2011).
Interestingly, the strongest assimilation fractionation
effect observed in lake systems to date was reported in
Lake Lugano, where summer and fall sediment strata
430 J Paleolimnol (2014) 52:419–433
123

could be analyzed and interpreted seperately (Teranes
and Bernasconi 2000). However, the seasonally var-
iable assimilation effect (Hodell and Schelske 1998)
would be diluted in lakes where sediments are not
laminated and thus summer and winter sediment
deposition are integrated upon sediment core extru-
sion. Although DIN depletion over the course of
summer is likely an overall feature of our Quebec
lakes, we cannot say conclusively that some level of
fractionation did not occur as a function of incomplete
uptake in Alberta lakes.
Recommendations for paleolimnological
reconstruction
Paleolimnological reconstructions are powerful tools
to understand eutrophication histories in lake systems.
Several studies have clearly demonstrated recent shifts
in sediment d15N signatures due to changes in N
sources (Bunting et al. 2007) or changes in fraction-
ation during phytoplankton assimilation including a
shift in biomass of N fixers (Gu et al. 1996). Such
studies support a dominant driver influencing the
observed change is signature. The heterogeneity of
lakes captured in this comparative study present the
full spectrum of possible drivers of d15N sediment and
how these may vary across regions. Our study
highlights that since sediments represent the integra-
tion of the functional, spatial and temporal variation of
lake organic matter, paleolimnological reconstruction
looking at simply one driver should also consider
alternate hypotheses. Furthermore, sedimentary d15N
should be considered within a regional context, where
knowledge of the isotopic signature of the major N
sources is critical.
Our spatially explicit analysis also suggested that
degradation is a possible determinant of d15N from
surface sediment, but we cannot claim that this trend
would be transposed through time. Studies comparing
multiple cores taken at different years showed that
diagenesis tended to lower sediment d15N with aging
(Galman et al. 2009; Kohzu et al. 2011). However,
Kohzu et al. (2011) also showed the importance of the
oxidation–reduction boundary in determining the
direction of the d15N diagenesis patterns. Our study
points out that there should be careful interpretation of
upper sediment signatures that are subjected to
degradation in oxygenated waters. We recommend
the examination of the %N profile to determine the
depth at which %N is more constant, indicative of
reduced bacterial consumption. Given the multiple
factors that may influence it, sedimentary d15N should
thus be used as part of a multiproxy approach, in
conjunction with proxies of algal community compo-
sition such as fossil pigments and of the organic matter
sources such as sediment C:N ratio to assess changes
in N sources and productivity over time.
Acknowledgments We would like to thank members of the
Maranger and the Gregory-Eaves labs for technical help during
this study, in particular K. Simpson, Z. Taranu and J. Vermaire.
Thank you to J. Cardille for help with GIS, G. McDonald for
guidance on human derived N loading and to J.-F. Helie and A.
Adamowicz at the Centre de Recherche en Geochimie et en
Geodynamique (GEOTOP) for isotopic analysis and method
advice. Comments that improved the manuscript were provided
by M.A. Altabet, E. Galbraith and anonymous reviewers. This
project was supported by the FQRNT-funded strategic group
Groupe de recherche interuniversitaire en limnologie et en
environnement aquatique (GRIL) and Natural Sciences and
Engineering Research Council of Canada (NSERC) grants to
RM and IGE.
References
Altabet MA (1988) Variations in nitrogen isotopic composition
between sinking and suspended particles—implications for
nitrogen cycling and particle transformation in the open
ocean. Deep-Sea Res 35:535–554
Altabet MA, Francois R (1994) Sedimentary nitrogen isotopic
ratio as a recorder for surface ocean nitrate utilization.
Global Biogeochem Cy 8:103–116
Borcard D, Legendre P, Drapeau P (1992) Partialling out the
spatial component of ecological variation. Ecology 73:
1045–1055
Botrel M (2011) Caracterisation du cycle et des sources d’azote
dans les lacs temperes par l’utilisation d’isotopes stables.
M.Sc. thesis, Univ. de Montreal
Brenner M, Whitmore TJ, Curtis JH, Hodell DA, Schelske CL
(1999) Stable isotope (delta C-13 and delta N-15) signa-
tures of sedimented organic matter as indicators of historic
lake trophic state. J Paleolimnol 22:205–221
Bunting L, Leavitt PR, Gibson CE, McGee EJ, Hall VA (2007)
Degradation of water quality in Lough Neagh, Northern
Ireland, by diffuse nitrogen flux from a phosphorus-rich
catchment. Limnol Oceanogr 52:354–369
Bunting L, Leavitt PR, Weidman RP, Vinebrooke RD (2010)
Regulation of the nitrogen biogeochemistry of mountain
lakes by subsidies of terrestrial dissolved organic matter
and the implications for climate studies. Limnol Oceanogr
55:333–345
Castro MS, Driscoll CT, Jordan TE, Reay WG, Boynton WR
(2003) Sources of nitrogen to estuaries in the United States.
Estuaries 26:803–814
Culley JLB, Barnett GM (1984) Land disposal of manure in the
Province of Quebec. Can J Soil Sci 64:75–86
J Paleolimnol (2014) 52:419–433 431
123

Downing JA, McCauley E (1992) The nitrogen—phosphorus
relationship in lakes. Limnol Oceanogr 37:936–945
Elliott EM, Brush GS (2006) Sedimented organic nitrogen iso-
topes in freshwater wetlands record long-term changes in
watershed nitrogen source and land use. Environ Sci
Technol 40:2910–2916
Engstrom DR, Schottler SP, Leavitt PR, Havens KE (2006) A
reevaluation of the cultural eutrophication of lake Oke-
echobee using multiproxy sediment records. Ecol Appl
16:1194–1206
Finlay JC, Small GE, Sterner RW (2013) Human influences on
nitrogen removal in lakes. Sciences 342:247–250
Fogel ML, Cifuentes LA (1993) Isotope fractionation during
primary production. In: Engel MH, Macko SA (eds) Organic
Geochemistry. Plenum Press, New York, pp 73–98
Freudenthal T, Wagner T, Wenzhofer F, Zabel M, Wefer G
(2001) Early diagenesis of organic matter from sediments
of the eastern subtropical Atlantic: evidence from stable
nitrogen and carbon isotopes. Geochim Cosmochim Ac
65:1795–1808
Galman V, Rydberg J, Bigler C (2009) Decadal diagenetic
effects on delta C-13 and delta N-15 studied in varved lake
sediment. Limnol Oceanogr 54:917–924
Giani A, Bird DF, Prairie YT, Lawrence JF (2005) Empirical
study of cyanobacterial toxicity along a trophic gradient of
lakes. Can J Fish Aquat Sci 62:2100–2109
Glew JR, Smol JP, Last WM (2001) Sediment cores collection
and extrusion. In: Last WP, Smol JP (eds) Tracking envi-
ronmental changes using lake sediments, vol 1. Kluwer
Academic, Dordrecht, pp 73–106
Gu B (2009) Variations and controls of nitrogen stable isotopes
in particulate organic matter of lakes. Oecologia 160:
421–431
Gu BH, Schelske CL, Brenner M (1996) Relationship between
sediment and plankton isotope ratios (delta C-13 and delta
N-15) and primary productivity in Florida lakes. Can J Fish
Aquat Sci 53:875–883
Hadas O, Altabet MA, Agnihotri R (2009) Seasonally varying
nitrogen isotope biogeochemistry of particulate organic
matter in Lake Kinneret, Israel. Limnol Oceanogr 54:75–85
Harrison JA, Maranger RJ, Alexander RB, Giblin AE, Jacinthe
PA, Mayorga E, Seitzinger SP, Sobota DJ, Wollheim WM
(2009) The regional and global significance of nitrogen
removal in lakes and reservoirs. Biogeochemistry 93:
143–157
Heaton THE (1986) Isotopic studies of nitrogen pollution in the
hydrosphere and atmosphere - a review. Chem Geol 59:
87–102
Hodell DA, Schelske CL (1998) Production, sedimentation, and
isotopic composition of organic matter in lake Ontario.
Limnol Oceanogr 43:200–214
Holtgrieve GW, Schindler DE, Hobbs WO, Leavitt PR, Ward
EJ, Bunting L, Chen G, Finney BP, Gregory-Eaves I,
Holmgren S, Lisac MJ, Lisi PJ, Nydick K, Rogers LA,
Saros JE, Selbie DT, Shapley MD, Walsh PB, Wolfe AP
(2011) A coherent signature of anthropogenic nitrogen
deposition to remote watersheds of the Northern Hemi-
sphere. Science 334:1545–1548
Helie J (2009) Elemental and stable isotopic approaches for
studying the organic and inorganic carbon components in
natural samples. From Deep-Sea to Coastal Zones:
methods—techniques for studying paleoenvironmentsiop
conference series: earth and environmental science,
012005, 10.1088/1755-1307/5/1/012005
Jones RI, King L, Dent MM, Maberly SC, Gibson CE (2004)
Nitrogen stable isotope ratios in surface sediments, epili-
thon and macrophytes from upland lakes with differing
nutrient status. Freshwater Biol 49:382–391
Kalff J (2002) Limnology: inland water ecosystems. Prentice-
Hall. 592 p
Kendall C, Elliot EM, Wankel SD (2007) Tracing anthropo-
genic inputs of nitrogen to ecosystems. In: Michener R,
Lajtha K (eds) Stable isotope in ecology and environmental
science. Blackwell, Malden, pp 375–449
Kerekes J (1977) The index of lake Basin Permanence. Int Rev
Hydrobiol 62:291–293
Kohzu A, Imai A, Miyajima T, Fukushima T, Matsushige K,
Komatsu K, Kawasaki N, Miura S, Sato T (2011) Direct
evidence for nitrogen isotope discrimination during sedi-
mentation and early diagenesis in Lake Kasumigaura,
Japan. Org Geochem 42:173–183
Koster D, Taranu ZE, Hall RI, Gregory-Eaves I (2008) baseline
water quality information for the Moose lake watershed
management plan. Consultant report http://www.lica.ca/
attachments/065_Moose_Lake_Paleo_Study_Final_Oct_
08_McGil_%20University.pdf
Krzyzanowski J (2010) Review and Identification of Research Needs
to Address Key Issues Related to Reactive Nitrogen (RN)
Deposition and Eutrophication in a Canadian Context (Final
Report). http://www.ccme.ca/assets/pdf/rn_eutrophication_
1450.pdf
Leavitt PR, Brock CS, Ebel C, Patoine A (2006) Landscape-
scale effects of urban nitrogen on a chain of freshwater
lakes in central North America. Limnol Oceanogr 51:
2262–2277
Legendre P, Anderson MJ (1999) Distance-based redundancy
analysis: testing multispecies responses in multifactorial
ecological experiments. Ecol Monogr 69:1–24
Lehmann MF, Bernasconi SM, Barbieri A, McKenzie JA (2002)
Preservation of organic matter and alteration of its carbon
and nitrogen isotope composition during simulated and
in situ early sedimentary diagenesis. Geochim Cosmochim
Ac 66:3573–3584
Lewis WM Jr, Wurtsbaugh WA (2008) Control of lacustrine
phytoplankton by nutrients: erosion of the phosphorus
paradigm. Internat Rev Hydrobiol 93:446–465
Meyers PA (1997) Organic geochemical proxies of paleocea-
nographic, paleolimnologic, and paleoclimatic processes.
Org Geochem 27:213–250
Meyers PA, Ishiwatari R (1993) Lacustrine organic geochem-
istry—An overview of organic matter sources and dia-
genesis in lake-sediments. Org Geochem 20:867–900
Monchamp M, Pick FR, Beisner BE, Maranger R (2014)
Nitrogen forms influence microcystin concentration and
composition via changes in cyanobacterial community
structure. PlosOne 9:e85573
Ostrom NE, Long DT, Bell EM, Beals T (1998) The origin and
cycling of particulate and sedimentary organic matter and
nitrate in lake Superior. Chem. Geol 152:13–28
Owen JS, Mitchell MJ, Michener RH (1999) Stable nitrogen and
carbon isotopic composition of seston and sediment in two
Adirondack lakes. Can J Fish Aquat Sci 56:2186–2192
432 J Paleolimnol (2014) 52:419–433
123

Pick FR, Lean DSR (1987) The role of macronutrients (C, N, P)
in controlling cyanobacterial dominance in temperate
lakes. New Zeal J Mar Fresh 21:425–434
Prairie YT, Parkes A (2007) Developpement d’outils de gestion
simples permettant d’evaluer la capacite de support des
lacs en regard de l’eutrophisation—Volet Estrie. (Unpub-
lished report), Projet de recherche CRSNG-PARDE:50
Prepas EE, Trew DO (1983) Evaluation of the phosphorus
chlorophyll relationship for lakes off the precambrian
shield in Western Canada. Can J Fish Aquat Sci 40:27–35
Riedinger-Whitmore MA, Whitmore TJ, Smoak JM, Brenner
M, Moore A, Curtis J, Schelske CL (2005) Cyanobacterial
proliferation is a recent response to eutrophication in many
Florida lakes: a paleolimnological assessment. Lake Res-
ervoir Manage 21:423–435
Schindler DW (2006) Recent advances in the understanding
and management of eutrophication. Limnol Oceanogr 51:
356–363
Schindler DW, Dillon PJ, Schreier H (2006) A review of
anthropogenic sources of nitrogen and their effects on
Canadian aquatic ecosystems. Biogeochemistry 79:25–44
Schindler DW, Wolfe AP, Vinebrooke R, Crowe A, Blais JM,
Miskimmin B, Freed R, Perren B (2008) The cultural
eutrophication of Lac la Biche, Alberta, Canada: a paleo-
ecological study. Can J Fish Aquat Sci 65:2211–2223
Selbie DT, Finney BP, Barto D, Bunting L, Chen GJ, Leavitt PR,
MacIsaac EA, Schindler DE, Shapley MD, Gregory-Eaves
I (2009) Ecological, landscape, and climatic regulation of
sediment geochemistry in North American sockeye salmon
nursery lakes: insights for paleoecological salmon inves-
tigations. Limnol Oceanogr 54:1733–1745
Smith VH, Schindler DW (2009) Eutrophication science:where
do we go from here? Trends Ecol and Evol 24:201–207
Statistics Canada (2006a) Farm business operating expenses and
paid agricultural labour. Census of agriculture. Ottawa:
Statistics Canada, agriculture division
Statistics Canada (2006b) Livestock, poultry and colonies of
bees. Census of agriculture. Ottawa: Statistics Canada,
agriculture division
Taranu ZE, Gregory-Eaves I (2008) Quantifying relationships
among phosphorus, agriculture, and lake depth at an inter-
regional scale. Ecosystems 11:715–725
Taranu ZE, Zurawell R, Pick FR, Gregory-Eaves I (2012) Pre-
dicting cyanobacterial dynamics in the face of global
change: the importance of scale and environmental con-
text. Glob Change Biol 18:3477–3490
Teranes JL, Bernasconi SM (2000) The record of nitrate utili-
zation and productivity limitation provided by delta N-15
values in lake organic matter—A study of sediment trap
and core sediments from Baldeggersee, Switzerland.
Limnol Oceanogr 45:801–813
Vermaire J (2011) Reconstructing macrophyte biomass
dynamics in temperate lakes of northeastern North Amer-
ica using paleolimnology. Ph.D. thesis. McGill Univ
Vermaire J, Prairie Y, Gregory-Eaves I (2011) The influence of
submerged macrophytes on sedimentary diatoms assem-
blages. J Phycol 47:1230–1240
Wada E, Hattori A (1978) Nitrogen isotope effect in the
assimilation of inorganic nitrogenous compounds by mar-
ine diatoms. Geomicrobiol J 1:85–101
Woodward CA, Potito AP, Beilman DW (2012) Carbon and
nitrogen stable isotope ratios in surface sediments from lakes
of western Ireland: implications for inferring past lake pro-
ductivity and nitrogen loading. J Paleolimnol 47:167–184
Wu JL, Lin L, Gagan MK, Schleser GH, Wang SM (2006)
Organic matter stable isotope (delta C-13, delta N-15)
response to historical eutrophication of lake Taihu, China.
Hydrobiologia 563:19–29
J Paleolimnol (2014) 52:419–433 433
123
Related Documents


