Defining and Quantifying Severity of Impairment in Autism Spectrum Disorders Across the Lifespan by Katherine Oberle Gotham A dissertation submitted in partial fulfillment of the requirements of the degree of Doctor of Philosophy (Psychology) in The University of Michigan 2010 Doctoral Committee Professor Catherine Lord, Chair Professor Albert Cain Professor Israel Liberzon Professor Mohammad Ghaziuddin

Welcome message from author
This document is posted to help you gain knowledge. Please leave a comment to let me know what you think about it! Share it to your friends and learn new things together.
Transcript
Defining and Quantifying Severity of Impairment
in Autism Spectrum Disorders Across the Lifespan
by
Katherine Oberle Gotham
A dissertation submitted in partial fulfillment of the requirements of the degree of
Doctor of Philosophy (Psychology)
in The University of Michigan 2010
Doctoral Committee Professor Catherine Lord, Chair Professor Albert Cain
Professor Israel Liberzon Professor Mohammad Ghaziuddin

ii
Dedication To my family, Steven Brunwasser and Mary Gotham in particular; my friends, Somer Bishop and Kathryn Howell in particular; and my advisor, Catherine Lord; with immense gratitude to each.
iii
Acknowledgements
This research was supported by grants from the National Institutes of Mental
Health (RO1 MH57167 and MH066469) and the National Institute of Child Health and
Human Development (HD 35482-01) to Catherine Lord, an Autism Speaks Pre-doctoral
Training Fellowship (Principal Investigator: Catherine Lord; Fellow: Katherine Gotham),
as well as the Blue Cross Blue Shield Foundation of Michigan research award and a
Rackham Pre-doctoral Research Grant awarded to Katherine Gotham.
I am indebted to Drs. Catherine Lord, Andrew Pickles, and Somer Bishop for
their invaluable mentorship and collaboration. “Standardizing ADOS scores for a
measure of severity in autism spectrum disorders” (Chapter 2) was co-authored with
Andrew Pickles and Catherine Lord; it was published in May of 2009 in the Journal of
Autism and Developmental Disorders. “Modeling trajectories of ASD severity in
children using standardized ADOS scores” (Chapter 3) also was co-authored with
Andrew Pickles and Catherine Lord, and has been submitted for publication in the
Archives of General Psychiatry. “Effects of insight and social participation on depressive
symptoms in ASD” (Chapter 4) was co-authored with Somer Bishop and Catherine Lord.
I gratefully acknowledge the children and families who participated in the various
research projects. I thank the faculty and staff at the University of Chicago, University of
North Carolina, and University of Michigan, particularly Whitney Guthrie, Melissa
Maye, Lindsay Harvey, Jessica Liang, Themba Carr, Marisela Huerta, So Hyun Kim, and

iv
Shanping Qiu, who assisted in collecting and preparing these data. I am very grateful to
Brady West and LingLing Zhang for providing statistical support. I also thank Ixchel
Montenegro, Cristina Popa, Jack Williams, Elizabeth Buvinger, and Chandler Lehman
for assistance with manuscript preparation, and Kathryn Larson, Kathy Hatfield, Ellen
Bucholz, Mary Yonkovit, and Linda Anderson for various methods of support during the
production of this dissertation. Finally, I would like to express my gratitude to Drs.
Albert Cain, Mohammad Ghaziuddin, and Israel Liberzon for their valuable critiques that
have served to improve this work.
v
Table of Contents
Dedication…………………………………………………………………………………ii Acknowledgements………………………………………………………………………iii List of Tables……………………………………………………………………………..vi List of Figures...………………………………………………………………………….vii Abstract……………………………………………………………………….…………viii Chapter
I. Introduction……...………………………………………………………………….1
II. Standardizing ADOS Scores for a Measure of Severity in Autism Spectrum Disorders ………………………...……...……………………………..11
III. Modeling Trajectories of ASD Severity in Children Using Standardized ADOS Scores …………………………...……...…………………………….…..42
IV. Effects of Insight and Social Participation on Depressive Symptoms in ASD.......71
V. Conclusion..…………...………………………………………………………....170
vi
List of Tables
Table 2.1 Sample Description…….…………………………………………………………….30 2.2 Mapping of ADOS raw totals onto calibrated severity scores ………………………31 2.3 Raw Score and Calibrated Severity Score Means and Standard Deviations by Age/Language Cell (ASD Assessment Only)………………………………………..32 2.4 Multiple Linear Regression Models for Calibrated Severity Scores and ADOS
Raw Totals in ASD Assessments………………………………………………….....33 3.1 Latent Severity Class Model Comparison …………………………………………..61 3.2 Latent Severity Classes: Descriptives and Predictors………...……………………..62 4.1 Recruitment and Participation Description ……...………………………………....112 4.2 Sample Description ……...………………………………………………………....113 4.3 Parent Participant Description……...……………………………………………....114 4.4 Measure Protocol. ……..……………………………………………………...…....115 4.5 Factor Loadings from Behavioral Perception Inventory Examiner-Proband
Difference scores ………...………………………………………………………..117 4.6 Multiple Linear Regression Model: Standardized Age and Behavioral Perception
Inventory (Part A) Factor Scores Predicting Beck Depression Inventory Total Scores...................................................................................................................... 118
4.7 Multiple Linear Regression Model: Social Motivation and Participation Measures
as Predictors of Beck Depression Inventory Total Scores..................................... 119
vii
List of Figures
Figure 2.1 Age by Language Level Calibration Cells…………………………………………...34 2.2 Distributions of ADOS Raw Total Scores by Age/Language Cells (ASD
Assessments Only)…………………………………………………………………...35 2.3 Distributions of Calibrated Severity Scores by Age/Language Cells (ASD
Assessments Only)………………………………………………………………….36 2.4 Distributions of Calibrated Severity Scores by Diagnostic Group…………………..37 2.5 Case Summaries of Longitudinal Severity Scores…………………………………...38 3.1 ADOS Severity Score Latent Trajectory Classes …………………...…………..…..63 3.2 Verbal IQ Trajectories by Latent Severity Class ……………………………….…...64 3.3 Vineland Adaptive Behavior Scales “Daily Living” V-scores by Latent Class ...…..65 4.1 Interaction of Social Interests and Habits Questionnaire Friendship Factors—Social Current by Social Wishes ………………………………………………………….…...120 4.2 Interaction of Social Interests and Habits Questionnaire “Current-Friendship” Factor by Autism Diagnostic Interview-Revised “Shared Enjoyment” Algorithm Total, Age 4-5, Recoded………………………………………………………………..121
viii
Abstract
Defining and Quantifying Severity of Impairment in Autism Spectrum Disorders
Across the Lifespan
by
Katherine Oberle Gotham
Chair: Catherine Lord
Individuals with autism spectrum disorders (ASD) vary considerably in language
level, cognitive ability, symptom severity, as well as comorbid psychopathology and
behavioral issues. The first study in this three-paper project suggests preliminary means
to stratify this diverse population into more homogeneous subgroups by ASD severity.
Autism Diagnostic Observation Schedule (ADOS) scores were standardized within a
large sample to approximate an autism severity metric. The resulting metric was less
associated with verbal IQ than were ADOS raw totals, and resulted in increased
comparability across age- and language-specific modules of this instrument.
In the second study, standardized ADOS scores were used to plot longitudinal
trajectories of ASD severity among children and adolescents. Four latent trajectory
ix
classes were identified, including persistent severe and persistent moderate groups, as
well as much smaller classes that increased or decreased in ASD severity over time.
Comorbid psychopathology is another way to characterize impairment in the
autism spectrum. The third paper in this series posits that better understanding of the
mechanisms that cause and/or maintain depressive symptoms in ASD will contribute to
the ability to prevent and treat them, therefore providing one way to improve quality of
life for these individuals. The objectives of this study were (1) to explore the relationship
between insight into one’s own core autism symptoms and the level of depressive
symptoms as described by the individual and an informant, and (2) to explore the
relationship between social motivation, social participation, and level of depressive
symptoms. Insight into functional independence impairments significantly predicted
higher depression scores on the Beck Depression Inventory in the sample of adolescents
and adults with borderline to above average IQ and ASD. This dissertation is thus
focused on severity of impairment in autism spectrum disorders, with ‘impairment’
defined in relation to both autism-specific and comorbid factors.
1
Chapter I
Introduction
Since its original description by Leo Kanner in 1943, autism has come to be
recognized as a neurodevelopmental disorder that manifests in infancy or early childhood
and encompasses both delays and deviance in a “triad” of behavioral domains (Wing &
Gould, 1979): reciprocal social interaction, communication, and restricted and repetitive
behaviors and interests. Autism is the cornerstone of a spectrum of disorders, commonly
referred to as autism spectrum disorders (ASD) or pervasive developmental disorders
(PDD). This spectrum includes Asperger syndrome (AS) and Pervasive Developmental
Disorder-Not Otherwise Specified (PDD-NOS, or atypical autism).1
Impairment in social reciprocity is believed to be the central defining
characteristic of autism spectrum disorders (Williams White, Koenig, & Scahill, 2007;
Carter, Davis, Klin, & Volkmar, 2005). Difficulties in social interaction present in
various ways within and across individuals, such as a toddler who does not direct eye
contact or a changed facial expression to her parent when something startles her, but
looks up briefly in the direction of the noise and continues playing, an adolescent who
interjects abruptly during a group conversation to bring up his own interest in
videogames, or an adult who makes no response to another’s comment about having a
1 The autism spectrum also includes two very rare disorders, Rett’s disorder and Childhood Disintegrative Disorder (CDD). For the purpose of this paper, these disorders will be excluded from further mention because of their low prevalence and lack of representation in the samples described.
2
terrible day. Delay, impairment in, or absence of communication strategies is also
characteristic of autism. These difficulties are evident in both verbal (e.g., late onset of
phrase speech, pronoun reversal, stereotyped speech) and nonverbal (e.g., minimal use of
gestures) aspects of communication. Restricted, repetitive behaviors and interests (RRBs)
comprise the third domain of autism symptomatology. These include repetitive motor
mannerisms (e.g., hand flapping), unusual sensory interests (e.g., squinting one’s eyes to
peer at a wind-up toy), and restricted or unusual topics of interest (e.g., collecting ticket
stubs, learning and reciting everything there is to know about the Roman emperor Nero).
Whereas autism was previously believed to occur in approximately 4 children out
of 10,000 based on epidemiological studies published in the 1960’s, the autism spectrum
is thought to have a combined prevalence rate of 50-60 out of 10,000 school-age children
(Chakrabarti & Fombonne, 2005). Research initiated by the Center for Disease Control
suggested that number was closer to 1 in 150 live births, with the proportion even greater
for males as the more commonly affected sex (CDC, 2007). Refinements to diagnostic
criteria surely have impacted these increased prevalence rates (Bishop, Whitehouse,
Watt, & Line, 2008), and growing ASD prevalence and awareness of the disorders in turn
demand greater research attention to the boundaries of and within this spectrum. Indeed,
one of the primary issues in ASD diagnosis today is a debate about the clinical and
biological validity of distinct categorical disorders within the spectrum.
Just as there is no reliable biological marker for the autism spectrum,
differentiating between subtypes on this spectrum also falls under the realm of behavioral
phenotyping. Partly art and partly science, this form of assessment often yields different
results by lab and by clinician. For this reason, many clinical researchers have proposed
3
a shift from a categorical approach in ASD diagnosis towards a more dimensional
framework (Constantino & Todd, 2005; Gotham, Pickles, & Lord, 2009). Continuous
measures of social and communication difficulties as well as restricted and repetitive
behaviors could be used to evaluate a child’s level of impairment/ competence across
different domains. New techniques would be necessary in order to quantify symptoms on
a dimensional scale, with the advantageous result that we may be able to develop more
meaningful measures of severity. There is currently no well-defined benchmark for
“average autism,” so it is difficult to classify children with ASD as mild or severe,
especially since a child may have very severe symptoms in one domain of behavior and
relatively mild symptoms in another. Validating instruments that take a quantitative
approach to symptoms across domains could improve our ability to describe different
developmental trajectories and responses to treatment, which would in turn further efforts
to identify subgroups of children with ASD and to isolate endophenotypes that map onto
specific genetic or neurobiological findings.
Studies of monozygotic twin concordance for autism, and of families in which
parents have multiple affected children, have established that risk for ASD is influenced
by genetic factors (Morrow et al., 2008; Constantino & Todd, 2008). However, the
heterogeneity of autism – prompting some researchers to employ the term “autisms” –
adds to the challenge of identifying causal factors. Because ASDs are developmental
disorders, they both influence and are influenced by developmental levels of the
individual, such as language level, “mental age,” and chronological age. Unlike Down
Syndrome or other common developmental disorders, the autism spectrum encompasses
a wide range of cognitive and language abilities: approximately 15% of individuals
4
remain nonverbal into later childhood and beyond, compared to 40% who are using fluent
complex speech at these ages (Lord et al., 2006); up to 60% have nonverbal IQs in the
average range while many others with ASD are intellectually disabled (Fombonne, 2005;
Tidmarsh & Volkmar, 2003). Thus, individuals with ASD can look quite different from
each other: A nonverbal sixteen-year-old who avoids eye contact and spins in circles
might share a diagnosis of autism with a hyperactive, verbally fluent four-year-old who
seeks out others to talk at length about his interest in maps and state capitols. If ASD
indeed results from a variety of causes, as evidence suggests (Morrow et al., 2008), then
researchers must wade through this heterogeneity of symptom expression and
developmental level in order to collect samples of individuals similar enough to shed
light on a specific one or two out of many possible causal factors. If a general sample is
collected based on categorical diagnoses alone, this sample will likely be comprised of
ASDs of various etiologies, masking robust findings of specific factors.
Using continuous measures of language ability, IQ, or behavior such as
aggression or anxiety may well help to stratify research samples into more homogeneous
groups. In fact, genetics researchers commonly group samples by age of first words or
phrases, savant skills, or compulsive behavior (Hus, Pickles, Cook, Risi, & Lord, 2007).
It is important to note, however, that selecting samples based on similarity of these non-
ASD-specific factors may lead to findings of gene locations implicated in precisely these
non-ASD-specific conditions, such as intellectual disability. Though similar in IQ or
language development or savant skills, these samples may mask heterogeneity of ASD-
specific symptoms and etiologies. However, the field has no reliable continuous or
categorical measure of severity of autism-specific symptoms by which to stratify research
5
samples. The first study in this three-paper project aims to provide a temporary measure
of severity of ‘autism’ as it is defined by a ‘gold-standard’ ASD assessment tool, the
Autism Diagnostic Observation Schedule (ADOS; Lord et al., 2000). This was
undertaken by standardizing ADOS diagnostic algorithm scores within a large sample to
approximate an autism severity metric. Using a dataset of 1415 individuals aged 2-16
years with ASD or nonspectrum diagnoses, an ASD-only subset of 1807 assessments
from 1118 individuals were divided into narrow age- and language-cells. Within each
cell, severity scores were based on percentiles of raw totals corresponding to each ADOS
diagnostic classification. Calibrated severity scores had more uniform distributions across
developmental groups and were less influenced by participant demographics than raw
totals. They also showed the expected difference in distribution across autism, PDD-
NOS, and nonspectrum diagnoses when scores were applied to the NS sample (again,
these data were not used in the creation of the metric itself). This metric should be useful
in comparing assessments across modules and time, as well as identifying trajectories of
autism severity and behavioral phenotypes for clinical, genetic, and neurobiological
research. Chapter 2 of this dissertation details the methods and results of this study.
The objective of the second paper in this series was to plot longitudinal
trajectories of ASD severity among children and adolescents using the standardized
ADOS scores developed in the first study. Unique trajectories may be a preliminary
means by which to conceptualize distinct ASD subtypes. In this study, the standardized
ADOS severity metric reported in Chapter 2 (Gotham, Pickles, & Lord, 2009) was
applied to 1026 cases of data collected longitudinally from 345 clinic referrals and
research participants aged 2-15 years with clinical best estimate diagnoses (of autism,
6
ASD, or nonspectrum disorders), verbal and nonverbal IQ scores, and repeated ADOS
assessments. This was an inception cohort of consecutive ASD referrals to state-funded
and private university autism clinics, as well as research participants and clinical patients
assessed at these clinics at various ages. Standardized scores were fitted for latent classes
of severity trajectories with and without covariates. Adaptive behavior and IQ trajectories
over time were modeled and patterns of ADOS domain change described within each of
the best-fit latent classes. Chapter 3 of this dissertation describes the methods and results
of this study in more detail. If replicated, identified classes of autism severity trajectory
may contribute to clinical prognostic ability and to subtyping samples for neurobiological
and genetic research.
From a genetic and neurobiological standpoint, it is important to identify ASD
severity along a dimensional spectrum in order to identify possible etiological factors.
One reason that so much time, money, and human effort continues to be expended toward
identifying the cause of ASD is that it is very difficult to eradicate social and repetitive
behavior symptoms, and virtually impossible to “cure” these disorders. Perhaps with the
knowledge of genetic or neurobiological causes, biological interventions can be
developed, specific psychosocial factors can be targeted, and preventative measures can
be taken. Until that knowledge is available, a practical stance on current intervention
should include focus on tractable factors that affect quality of life in individuals with
ASD.
The third paper in this dissertation addresses the public health issue of depressive
symptoms in adolescents and adults with high-functioning autism spectrum disorders. In
many autism spectrum research samples in which co-occurring psychopathology has been
7
analyzed, depression is present at much higher rates than in the general population
(Stewart, Barnard, Pearson, Hasan, & O’Brien, 2006). The purpose of this study is to
examine psychosocial mechanisms that may impact the development of depressive
symptoms in autism spectrum disorders (ASD). A sample of 46 individuals with ASD,
aged 15 – 31, was recruited through local clinics, social groups, job-finding groups, and
ongoing research projects; these participants received a standard autism diagnostic
assessment including cognitive testing, and completed questionnaires and semi-structured
interviews about social support, symptoms of depression and anxiety, and other
psychological comorbidities. Using a measure created for this project, participants rated
their own ASD-associated behaviors, as did the examiner assessing them; participants
also reported on their own current participation in social interaction along with their
desired level of participation. These data were used to explore the hypotheses that (1)
greater awareness of one’s own social impairments is associated with higher levels of
depressive symptoms, and (2) a disparity between social motivation and social
participation will predict higher levels of depressive symptoms in this population. With
adequate study of the social mechanisms of depressive symptoms in ASD, we may find
evidence that relatively simple treatments may improve quality of life for individuals
with ASD and their families. The fourth chapter of this dissertation reviews findings on
depressive symptoms in ASD and describes the methods and results of this study in
greater detail.
As a whole, then, this dissertation examines the concept of ‘severity’ across the
lifespan in autism spectrum disorders. Quantifying autism-specific severity in children
and adolescents ideally will aid in stratifying research samples for etiological studies of

8
ASD, as well as providing a clinical tool for assessing change over time. Examining
autism-specific severity trajectories similarly may contribute to phenotypic subtyping and
reliability of clinical prognosis. In the adolescent and adult ASD population, this project
takes a broader view of “severity” in the sense that comorbid psychopathology influences
global severity of impairment beyond autism-specific features.
9
References
Bishop, D.V.M., Whitehouse, A.J.O., Watt, H.T., & Line, E.A. (2008). Autism and diagnostic substitution: evidence from a study of adults with a history of developmental language disorder. Developmental Medicine and Child Neurology, 50(5), 341-345.
Carter, A. S., Davis, N. O., Klin, A., & Volkmar, F. R. (2005). Social development in
autism. In F. R. Volkmar, R. Paul, A. Klin, & D. Cohen (Eds.), Handbook of autism and pervasive developmental disorders: Vol. 1. Diagnosis, development, neurobiology, and behavior. Hoboken, NJ: John Wiley & Sons.
Center for Disease Control (2007). Prevalence of autism spectrum disorders – Autism
and developmental disabilities monitoring network, six sites, United States, 2000. CDC Morbidity and Mortality Weekly Report, 56, 1-11.
Chakrabarti, S. & Fombonne, E. (2005). Pervasive developmental disorders in preschool
children: confirmation of high prevalence. American Journal of Psychiatry, 162, 1133-1141.
Constantino, J.N. & Todd, R.D. (2005). Intergenerational Transmission of Subthreshold
Autistic Traits in the General Population. Biological Psychiatry, 57, 655-660. Constantino, J.N. & Todd, R.D. (2008). Genetic epidemiology of pervasive
developmental disorders. In J. Hudziak, ed. Developmental psychopathology and wellness: Genetic and environmental influences. Arlington, Virginia: American Psychiatric Publishing, Inc., pp. 209-224.
Fombonne, E. (2005). The changing epidemiology of autism. Journal of Applied
Research in Intellectual Disabilities, 18, 281-294. Gotham, K., Pickles, A., Lord, C. (2009). Standardizing ADOS scores for a measure of
severity in autism spectrum disorders. Journal of Autism and Developmental Disorders, 39(5), 693.
Howlin, P. (2003). Outcome in high-functioning adults with autism with and without
early language delays: Implications for the differentiation between autism and Asperger syndrome. Journal of Autism and Developmental Disorders, 33, 3-13.
Hus, V., Pickles, A., Cook, E., Risi, S., & Lord, C. (2007). Using the Autism Diagnostic
Interview-Revised to increase phenotypic homogeneity in genetic studies of autism. Biological Psychiatry, 61, 438-448.
10
Lord, C., Risi, S., DiLavore, P., Shulman, C., Thurm, A., & Pickles, A. (2006). Autism from 2 to 9 years of age. Archives of General Psychiatry, 63(6), 694-701.
Lord, C., Risi, S., Lambrecht, L., Cook, E.H. Jr., Leventhal, B.L., DiLavore, P.C., et al.
(2000). The Autism Diagnostic Observation Schedule-Generic: A standard measure of social and communication deficits associated with the spectrum of autism. Journal of Autism and Developmental Disorders, 30, 205-223.
Morrow, E., Yoo, S., Flavell, S., Kim, T, Lin, Y. Hill, R. et al. (2008). Identifying autism
loci and genes by tracing recent shared ancestry. Science, 321, 218-23. Stewart, M., Barnard, L., Pearson, J., Hasan, R., O’Brien, G. (2006). Presentation of
depression in autism and Asperger syndrome: A review. Autism, 10, 103-113. Tidmarsh, L. & Volkmar, F. R. (2003). Diagnosis and epidemiology of autism spectrum
disorders. Canadian Journal of Psychiatry, 48(8), 517-25. Williams White, S., Koenig, K., & Scahill, L. (2007). Social skills development in
children with autism spectrum disorders: A review of the intervention research. Journal of Autism and Developmental Disorders, 37, 1858-1868.
Wing, L., & Gould, J. (1979). Severe impairments of social interaction and
associated abnormalities in children: Epidemiology and classification. Journal of Autism and Developmental Disorders, 9(1), 11-29.
11
Chapter II
Standardizing ADOS Scores for a Measure of Severity in Autism Spectrum Disorders
Currently, levels of impairment in children with autism spectrum disorders (ASD)
are measured largely in terms of language delay, cognitive functioning, or behavioral
issues such as aggression. While these are important factors in overall adaptive
functioning, they are not core features of the autism spectrum. Measuring the relative
severity of autism-specific features could contribute to our ability to accurately describe
ASD phenotypes across samples and across time in clinical and treatment research. An
ASD severity metric could be used in categorizing samples based on severity trajectories
(see Liang, Tayo, Cai, & Kelemen, 2005; Harold et al., 2009) into more homogeneous
groups in genetic and other neurobiological studies; it would also address a need to
document severity as part of clinical assessment.
At this point, measures that provide autism severity ratings, such as the Childhood
Autism Rating Scale (CARS; Schopler, Reichler, & Renner, 1986), the Gilliam Autism
Rating Scale (GARS; Gilliam, 1995), or the Autism Behavior Checklist (ABC; Krug,
Arick, & Almond, 1980), tend to yield scores that are either strongly correlated with IQ
or that do not correspond to standard measures of diagnosis (Gilliam, 1995; Volkmar et
al., 1988; Spiker, Lotspeich, Dimiceli, Myers, & Risch, 2002; South et al., 2002;
Szatmari, Bryson, Boyle, Streiner, & Duku, 2003). The Social Responsiveness Scale
(SRS; Constantino et al., 2003) provides a method for quantifying social impairment that
12
has shown relative independence from participant characteristics such as IQ. SRS scores
are based on parent or teacher report, however, and thus a complementary measure of
ASD severity that offers the opportunity to take into account the observations of an
experienced clinician would be desirable.
For genetic, neuroscience, and intervention research, severity of core autism
features often has been estimated using primary phenotyping measures, the Autism
Diagnostic Observation Schedule (ADOS; Lord et al., 2000) and the Autism Diagnostic
Interview-Revised (ADI-R; Rutter, LeCouteur, & Lord, 2003). While it is true that higher
ADI-R and ADOS scores indicate that an individual has a greater number of items
representing core deficits and/or greater severity of impairment, scores were not
normalized for this purpose and vary in the degree to which they are correlated with both
IQ and chronological age. Attempts to indicate severity using ADI-R item scores selected
to operationalize ICD-10 criteria for the disorder proved successful in predicting the
number of affected relatives of verbal probands, but not for nonverbal probands (Pickles
et al., 2000). One limitations of ADI-R scores as a severity metric is that nonverbal
children are not scored on roughly 25% of the total ADI-R items, and so communication
domain summary scores are restricted by non-random missing data.
The ADOS, a semi-structured autism diagnostic observation, has shown strong
predictive validity against best estimate diagnoses (Gotham, Risi, Pickles, & Lord, 2007),
making it a common choice among phenotyping measures. In each of four
developmental- and language-level dependent modules, a protocol of social presses is
administered by a trained examiner, and then behavioral items relevant to ASD are scored
on a 4-point scale, with 0 indicating ‘no abnormality of type specified’ and 3 indicating
13
‘moderate to severe abnormality.’ Specific items comprise an algorithm for each module;
these items are summed and compared to thresholds, which results in a classification of
“autism,” “autism spectrum disorder,” or “nonspectrum.”
Because the ADOS has been used to catalogue ASD features in large samples,
ADOS raw totals are a common stand-in for a measure of autism severity. This
instrument was created for diagnostic purposes, and thus was not specifically designed to
facilitate longitudinal and cross-sectional comparison of data. As an individual gains
language skills, he or she potentially moves through ADOS modules, making raw scores
not directly comparable across time. Additionally, effects of age and language level on
domain total and algorithm scores have been observed (Joseph, Tager-Flusberg, & Lord,
2002; de Bildt et al., 2004; Gotham et al., 2007).
In 2007, the original ADOS algorithms were revised in part for the purpose of
increasing the comparability across modules 1-3. Algorithms with the same number of
items and of similar content across modules were created (Gotham et al., 2007). These
revisions resulted in improved specificity of the measure among more impaired
populations, while generally maintaining or improving predictive validity among
individuals of other developmental levels (e.g., fluent speakers). The algorithm domain
structure now includes a Social Affect (SA) and a Restricted, Repetitive Behavior (RRB)
domain for each of the five developmentally-based algorithms corresponding to modules
1-3. Comparability of item content and total item number across these algorithms was
intended to improve the interpretability of longitudinal comparisons using the measure.
Still, items are necessarily developmentally graded across modules, making calibration
necessary to compare algorithm totals.
14
Some effects of participant characteristics still exist within and across ADOS
modules as well. Revised algorithm totals met the goal of independence from
chronological age and decreased association with verbal IQ, with the exception of
Module 1 scores (Gotham et al., 2007). A replication of the algorithm revisions in an
independent dataset again found low correlations between raw scores and age, verbal IQ,
and nonverbal IQ, though significant associations remained between verbal IQ and Social
Affect domain total scores for Module 1 recipients with few or no single words and
Module 2 recipients aged 5 or older (Gotham et al., 2008).
True normalization of severity of autism would require a representative
population, but to date, population studies have been too small, e.g., Brick Township
(Bertrand et al., 2001), have not used the ADOS (Chakrabarti & Fombonne, 2005; CDC,
2007), or have collected samples older than most clinically assessed children (Baird et al,
2006). Acknowledging these limitations, in the present study we elected to standardize
ADOS scores using a large “convenience” sample of individuals with ASD. Our goals
were to reduce remaining participant demographic effects to the greatest possible degree,
and generate standard scores that would approximate a severity metric for the construct
of ‘autism spectrum’ as it is measured on the ADOS. This metric ideally will be useful in
(1) allowing comparison of assessments across modules and time; (2) providing a means
of assessing the relationship between severity in ASD and verbal and nonverbal IQ; and
(3) identifying different trajectories of autism severity independent of verbal IQ both for
clinical purposes and for phenotypic subgrouping in genetic and neurobiological
research. We hope that calibrated severity scores can then be replicated in smaller
15
population-based studies and tested for validity in predicting treatment responsiveness
and other clinical outcomes in children with ASD.
Our first approach to developing a severity metric was to calibrate ADOS
algorithm totals using eight age/language cells chosen on the basis of theoretically-driven
expectations for specific age ranges with similar developmental impairments. This would
have allowed a ‘prefix’ on the severity score that indicated age and language level out of
the eight possible groups (ranging from young Module 1’s with no words to fluent
speakers, aged 5-10). Within each cell, raw totals were converted to Z-scores, which were
then converted to a 100-point scale. This method yielded calibrated scores that fanned
out, with increasing variability of individuals’ ADOS totals over time and age. Thus, an
alternative approach was chosen in which a greater number of age/language cells were
used, and severity scores within each cell were based on the raw total percentiles that
corresponded to each of three possible ADOS diagnostic classifications. This method is
described in more detail below.
Methods
Participants
Analyses were conducted on data from 1415 individuals, of which 355 individuals
with ASD diagnoses had repeated measure data. The final dataset included 2195
assessments, where ‘assessment’ is defined as contemporaneous ADOS data and a best
estimate clinical diagnosis. Autism diagnoses were assigned to 1187 assessments (54% of
entire sample); 599 assessments were given diagnoses of non-autism ASD (27% of the
sample, including n=12 with Asperger Disorder, n=3 with Childhood Disintegrative
Disorder, and n=584 with Pervasive Developmental Disorder, Not Otherwise Specified,
16
or PDD-NOS), and 409 had non-ASD developmental delays (19%). Contemporaneous
verbal IQ data was available for 2007 assessments (91.4% of the entire sample) and
nonverbal IQ data for 1989 assessments (91.0%). Please refer to Table 2.1 for a detailed
description of the dataset by revised algorithm group.
Chronological ages in the sample ranged from 2 to 16 years (see Table 2.1 for age
range by algorithm group). Recipients of ADOS Module 4 (older adolescents and adults
with fluent speech) were not included in these analyses because of smaller sample size
and the different relevance of age equivalents in adults. Females comprised 22% of the
dataset (N=478 assessments). Ethnicities represented by these data include 14% African
American (N=306 assessments); 3% Asian American (N=58); 77% Caucasian (N=1699);
0.5% Native American (N=10); 2% biracial (N=40); and other (N=20) or race not
specified (N=62) totaling 4% of assessments. Twenty-three percent of the sample
reported maternal education at the graduate or professional level; 56% of mothers had a
bachelor’s degree or some college education, and 21% of mothers had a high school
degree or less.
Within the nonspectrum sample of 409 assessments, 111 had a primary diagnosis
of a language disorder (27% of nonspectrum total), 80 were assessments with nonspecific
intellectual disability (20%), 56 with Down syndrome (14%), 55 with oppositional
defiant disorder, ADD and/or ADHD (13%), 31 with mood and/or anxiety disorders
(8%), 29 with Fetal Alcohol Spectrum Disorders (7%), 24 with non-ASD genetic and/or
physical disabilities such as Fragile X, Williams syndrome, or mild cerebral palsy (6%),
and 23 had an early delay that clinicians were not comfortable categorizing (5%).
17
The majority of participants were self-, school-, or physician-referred clinic
patients at the University of Michigan Autism and Communication Disorders Center
(UMACC) or the University of Chicago Developmental Disorders Clinic. The rest
participated in a longitudinal study conducted through the Treatment and Education of
Autistic and Communication Handicapped Children (TEACCH) Centers at the University
of North Carolina, Chapel Hill, and the University of Chicago clinic, or received
diagnostic evaluations through recent, ongoing studies at UMACC, including those
focused on participants with non-ASD developmental delays, ASD-affected sibling pairs,
or children between 12 and 36 months of age who failed a social-communication
screener. Out of 399 participants with repeated assessments through clinic reevaluations
or longitudinal research, 301 individuals had 2 or 3 ADOS assessments (57% with
autism, 31% with PDD-NOS, and 12% NS), and 98 individuals had between 4 and 8
assessments (58% with autism, 33% with PDD-NOS, and 9% NS). Individuals with
longitudinal data did not differ significantly in gender, race, or maternal education from
those with only one assessment point, however they had significantly lower mean verbal
IQs (M=49.6, SD=27.8) and nonverbal IQs (M=73.0, SD=23.8) at first assessment than
did single assessments (verbal IQ M=68.2, SD=32.8; nonverbal IQ M=77.9, SD=27.5);
verbal IQ t(1351)=9.7, p<.001 and nonverbal IQ t(1334)=3.0, p<.01.
Measures and Procedure
The most typical research protocol across sites and projects was the initial
administration of the ADI-R and the Vineland Adaptive Behavior Scales, 1st (VABS;
Sparrow, Balla, & Cicchetti, 1984) or 2nd edition (Vineland II; Sparrow, Cicchetti, &
Balla, 2005), to a parent or caregiver, followed by a child evaluation in which
18
psychometric testing preceded the ADOS. The second most common protocol was a re-
evaluation consisting of psychometric testing and an ADOS. In both cases, a clinical
diagnosis was made by a psychologist and/or psychiatrist after review of all data. The
ADI-R was available for 1700 assessments (77% of sample) and the Vineland for 1710
assessments (78%). The ADOS was administered and scored by a clinical psychologist or
trainee who met standard requirements for research reliability. The Pre-Linguistic Autism
Diagnostic Observation Schedule (PL-ADOS; DiLavore, Lord, & Rutter, 1995) was
given in 418 assessments (19%) and the piloted ADOS-T (Luyster et al., submitted), a
toddler version of the ADOS, was given in 82 assessments (4%); for both measures,
identical items were recorded to Module 1 algorithm scores. A developmental hierarchy
of cognitive measures, most frequently the Mullen Scales of Early Learning (MSEL;
Mullen, 1995) and the Differential Ability Scales (DAS; Elliot, 1990), determined IQ
scores.
Clinic-referred participants received oral feedback and a written report without
financial compensation. Participants recruited only for the purpose of research received
financial compensation and a written summary of evaluation results. Institutional Review
Boards at the University of Chicago or the University of Michigan approved all
procedures related to this project.
Mapping a standardized severity metric onto raw ADOS scores
Severity scores were created by dividing the pool of assessments from individuals
with ASD into narrowly defined age and language cells, and standardizing raw total
scores from the revised algorithms (Gotham et al., 2007) within these cells. In order to
maximize the number of cases available for standardization, assessments missing data
19
from any one item from either the Social Affect (SA) or Restricted Repetitive Behavior
(RRB) domains of the revised ADOS algorithms were retained by adding to the domain
total an average item score from that participant’s existing domain data. The ASD sample
alone was used for raw total standardization: this included all assessments corresponding
to a best estimate diagnosis of autism or ASD, as well as data from 13 individuals who
had ADOS data with a contemporaneous nonspectrum diagnosis but who were later
diagnosed with ASD. This subsample (N=1807 assessments from 1118 individuals) was
separated into groups based on the five revised algorithms used with children: Module 1
No Words, Module 1 Some Words, Module 2 Younger than 5; Module 2 Age 5 and
Older; and Module 3. Within each of these five developmental cells, distributions of
summed Social Affect and Restricted Repetitive Behaviors totals were generated
separately for every one-year age group between 2 and 16 years; these age cells were
collapsed when possible in order to create the fewest number of age- and language-level-
determined ‘calibration cells’ with similar raw total score distributions. Younger age cells
were purposely kept distinct to anticipate developmental changes and more frequent
assessments in young children as they transition from toddlerhood to preschool to school
programs. Age cells with similar distributions were collapsed only within the same
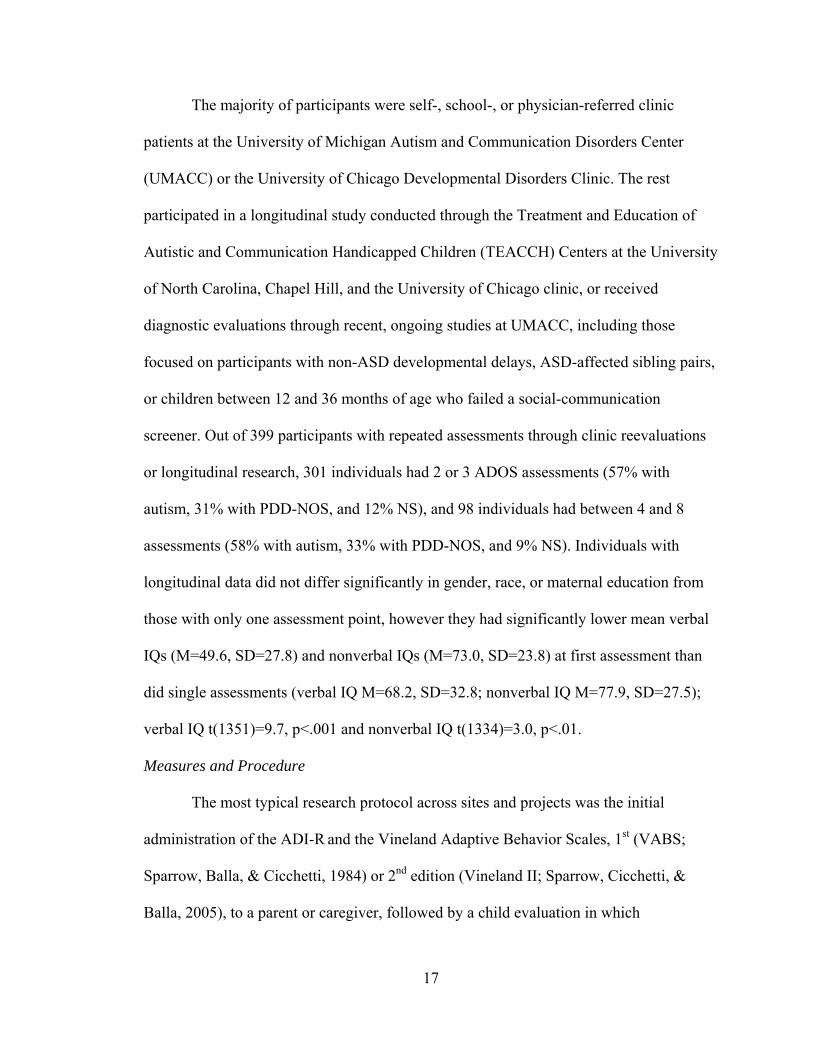
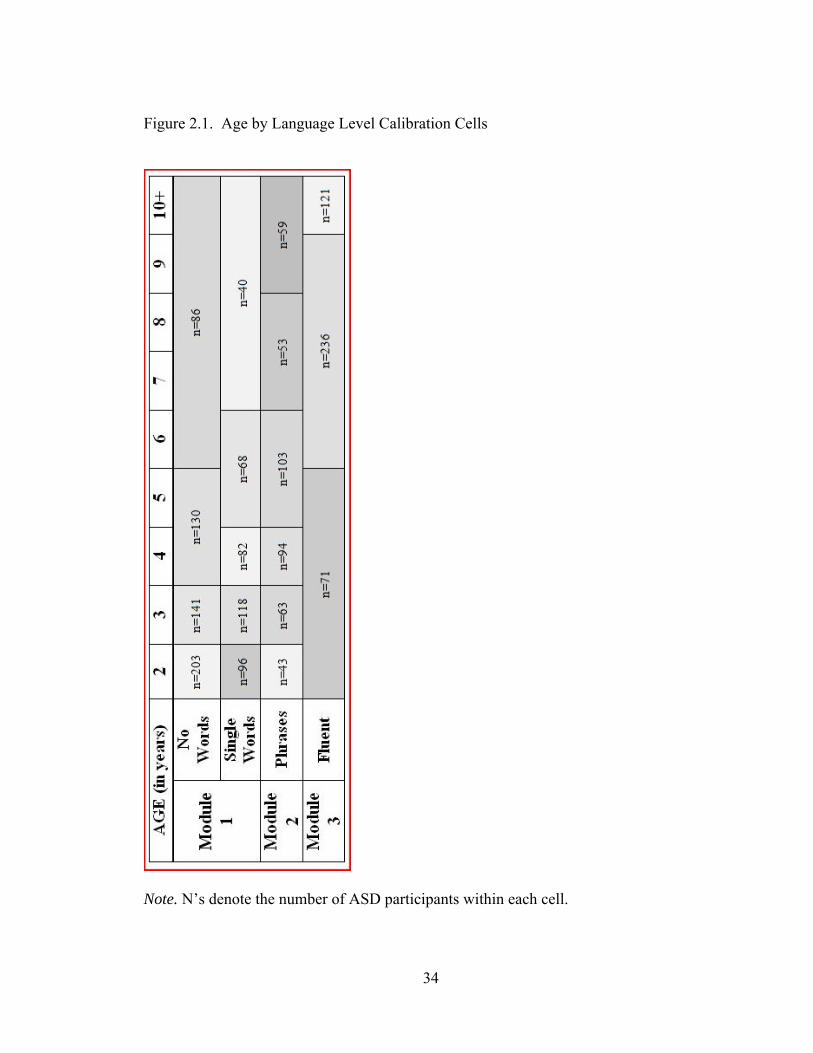
algorithm. Eighteen calibration cells resulted (see Figure 2.1).
Within each of these 18 cells, raw ADOS totals were mapped onto a 10-point
severity metric. After considering a variety of approaches, severity scores 1-3 were set so
as to represent the distribution of raw scores receiving a nonspectrum ADOS
classification within that calibration cell, severity scores 4-5 represented ASD-
classification ADOS totals, and 6-10 represented raw totals receiving an autism
20
classification within that cell. ADOS classification thresholds were determined by the
revised algorithm relevant to each calibration cell. The range of raw totals corresponding
to each point on the severity metric was determined by the percentiles of available data
associated with each severity point within a classification range. Lower severity scores
are associated with less autism impairment. Table 2.2 shows the raw score range
corresponding to each severity point within each calibration cell.
Design and Analysis
Distributions of raw totals and severity scores were compared to assess whether
severity score distributions across age/language cells were more uniform than raw score
distributions. Linear regression models were analyzed to compare the relative
independence of severity scores and raw totals from participant characteristics, such as
chronological age, verbal and nonverbal IQ, and verbal and nonverbal “current” mental
ages. Several assessments with longitudinal data were then chosen to exemplify various
patterns of severity change over time across diagnostic groups.
Results
Comparing distributions of severity scores and raw ADOS totals by calibration cell
In line with the goal of increasing comparability across modules and
developmental levels, severity scores for ASD participants were expected to have a more
uniform distribution across age- and language-level calibration cells than would raw
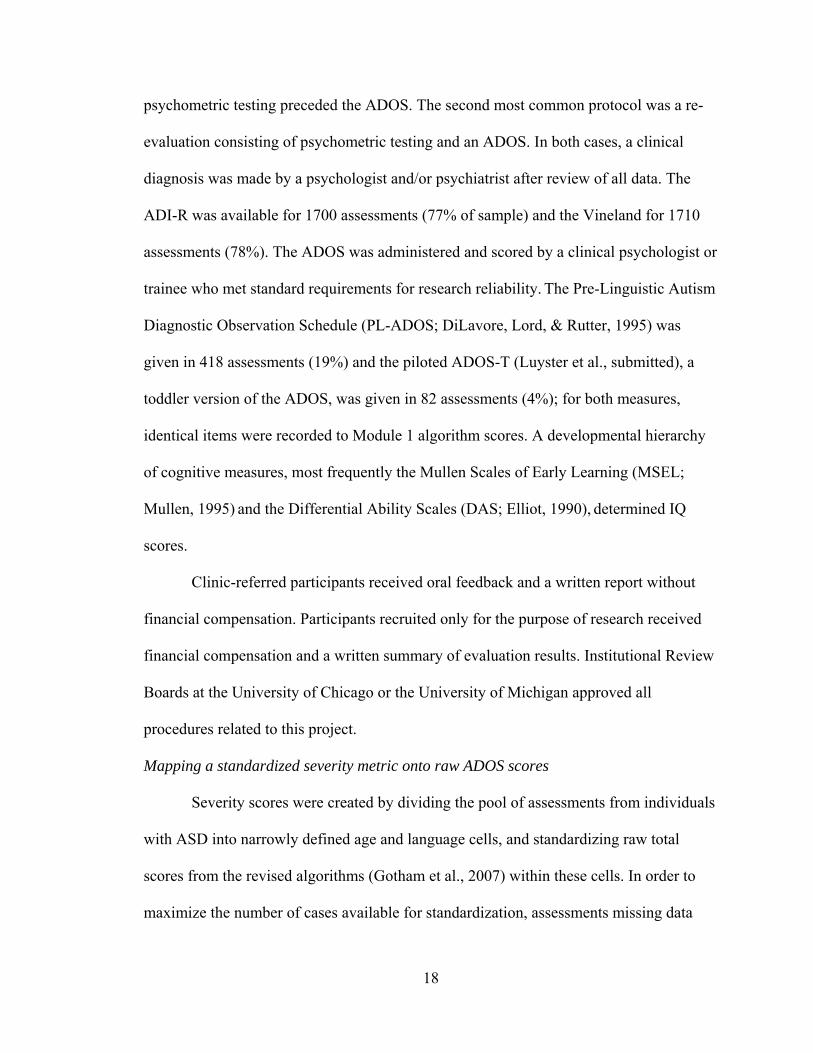
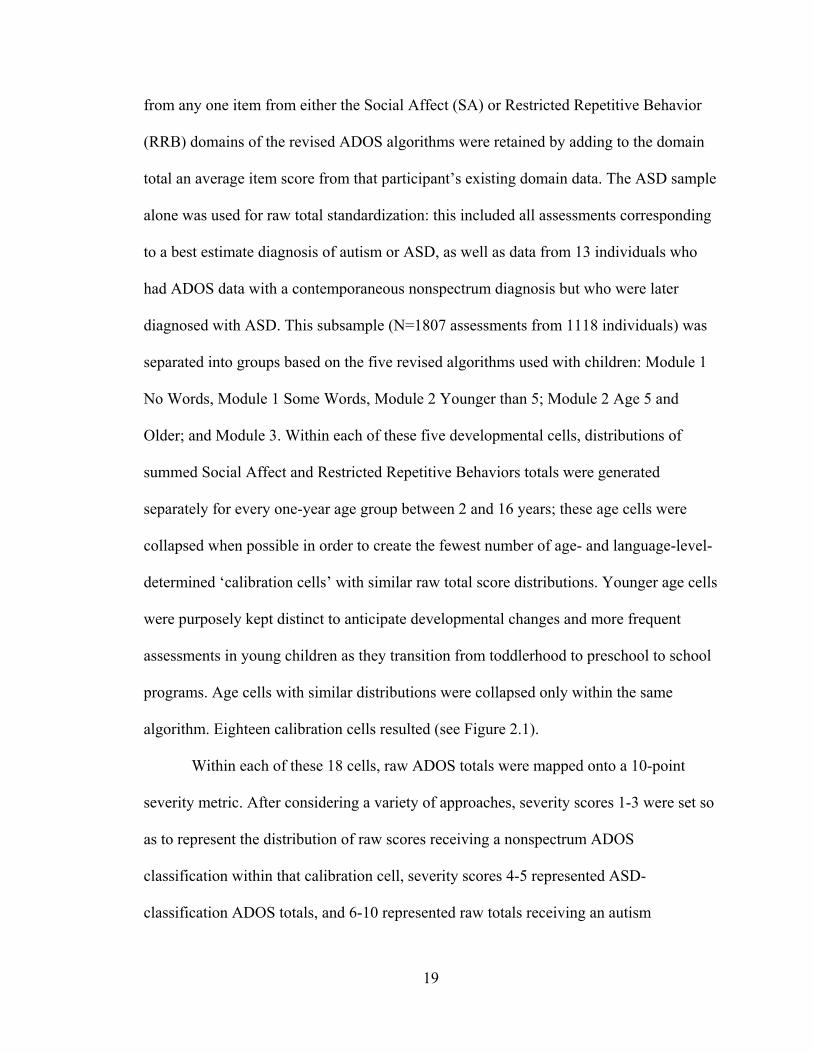
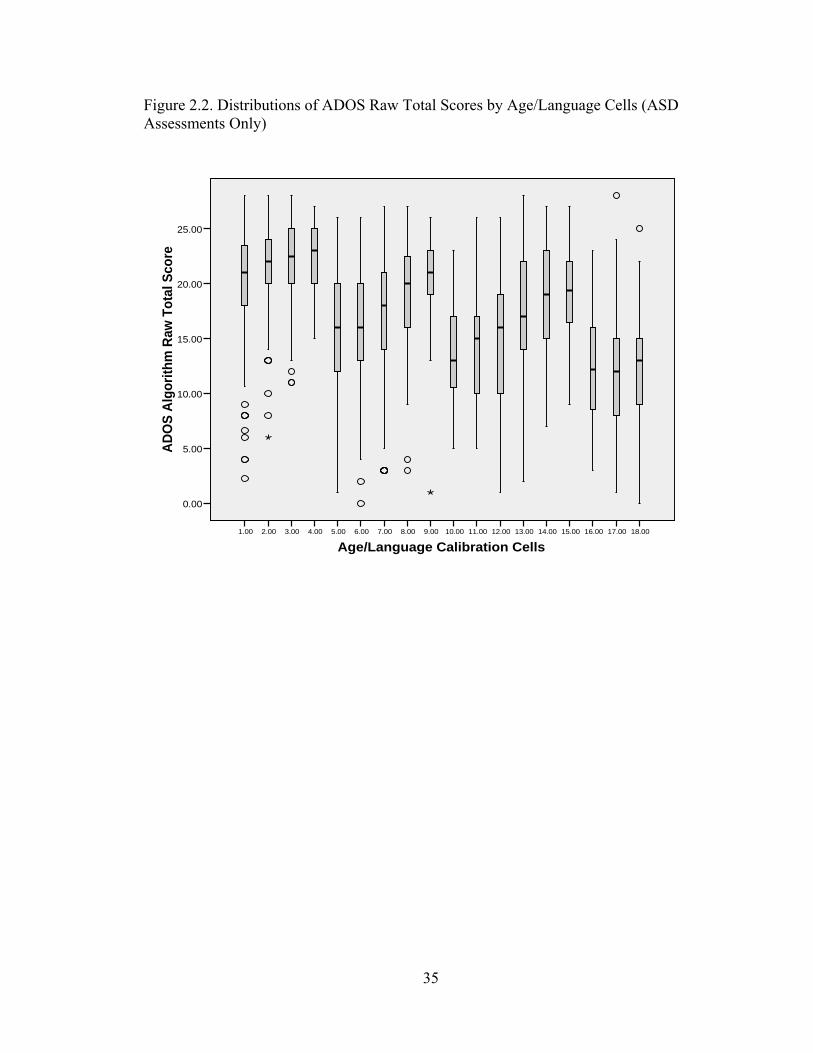
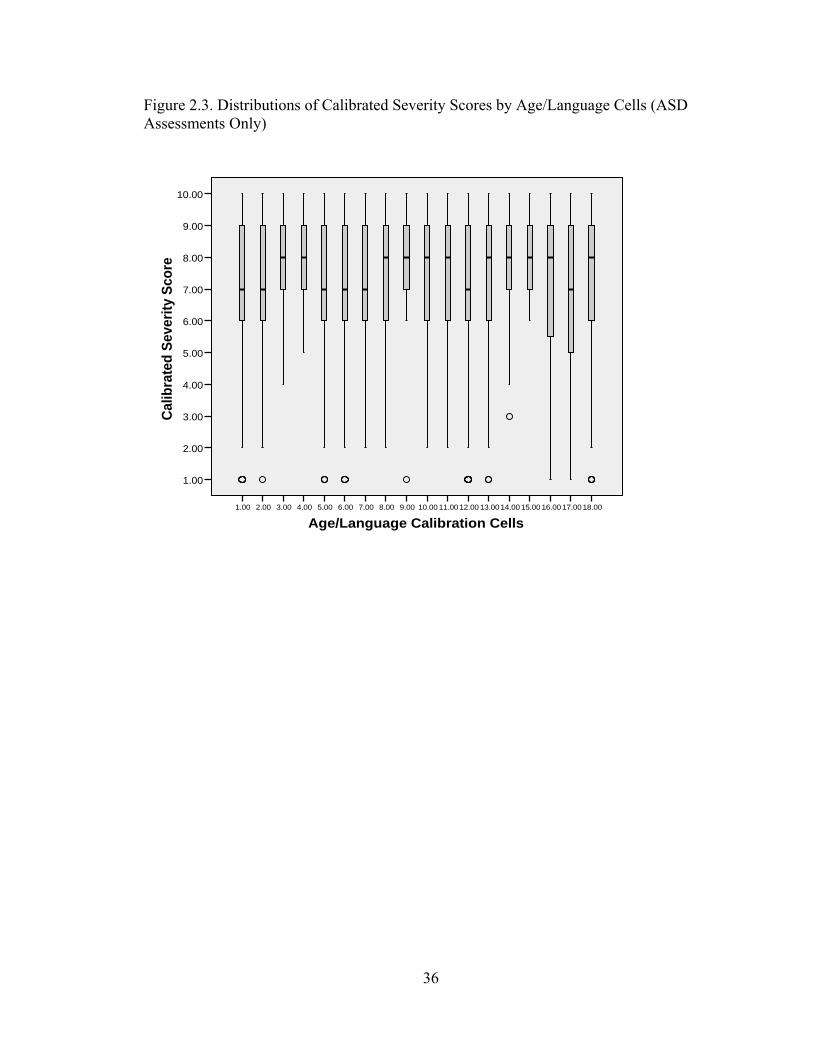
totals. Distributions of raw ADOS totals were generated for each of the 18 calibration
cells (Figure 2.2) and compared to the distribution of severity scores for each cell (Figure
2.3). Distributions of severity scores showed increased comparability across the
21
age/language cells, though they were not uniform. The means and standard deviations of
both severity scores and raw totals are listed by age/language cell in Table 2.3.
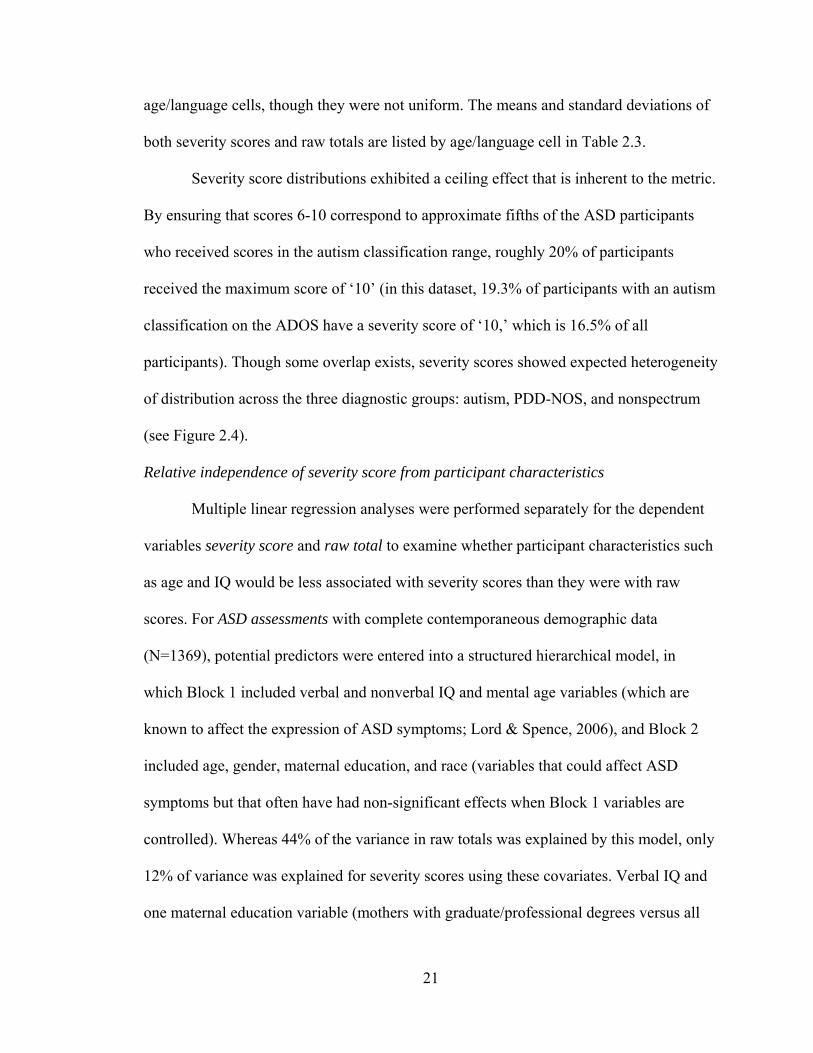
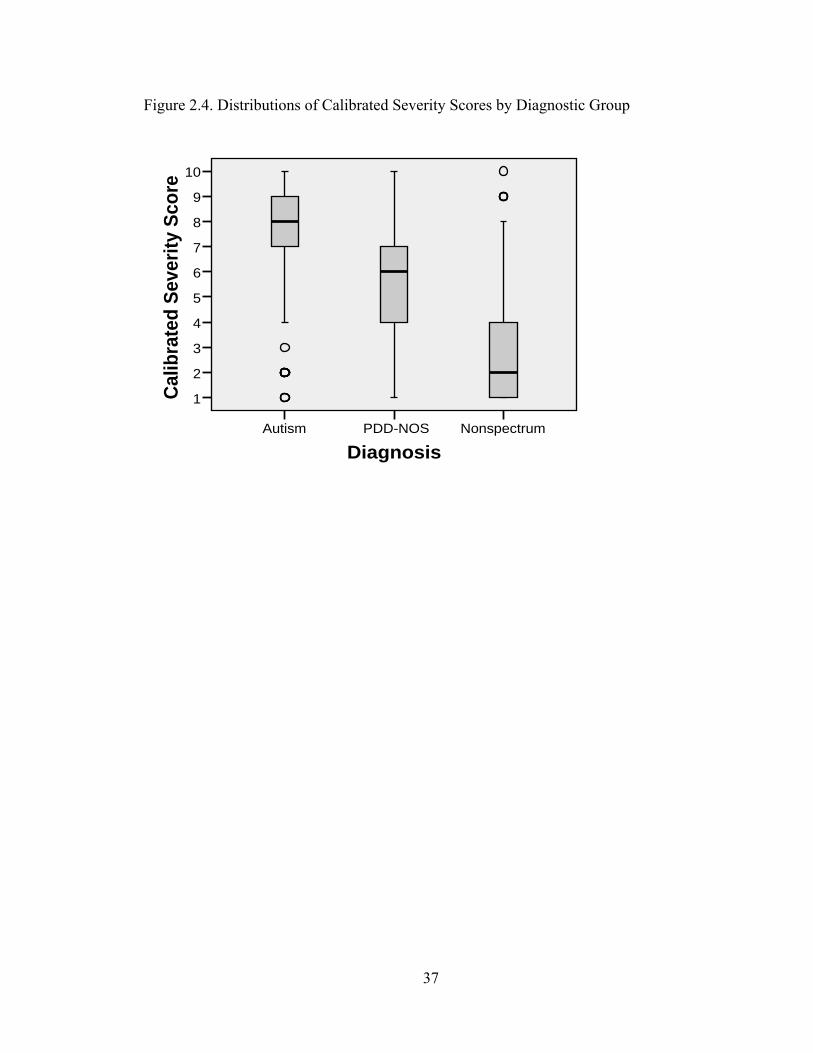
Severity score distributions exhibited a ceiling effect that is inherent to the metric.
By ensuring that scores 6-10 correspond to approximate fifths of the ASD participants
who received scores in the autism classification range, roughly 20% of participants
received the maximum score of ‘10’ (in this dataset, 19.3% of participants with an autism
classification on the ADOS have a severity score of ‘10,’ which is 16.5% of all
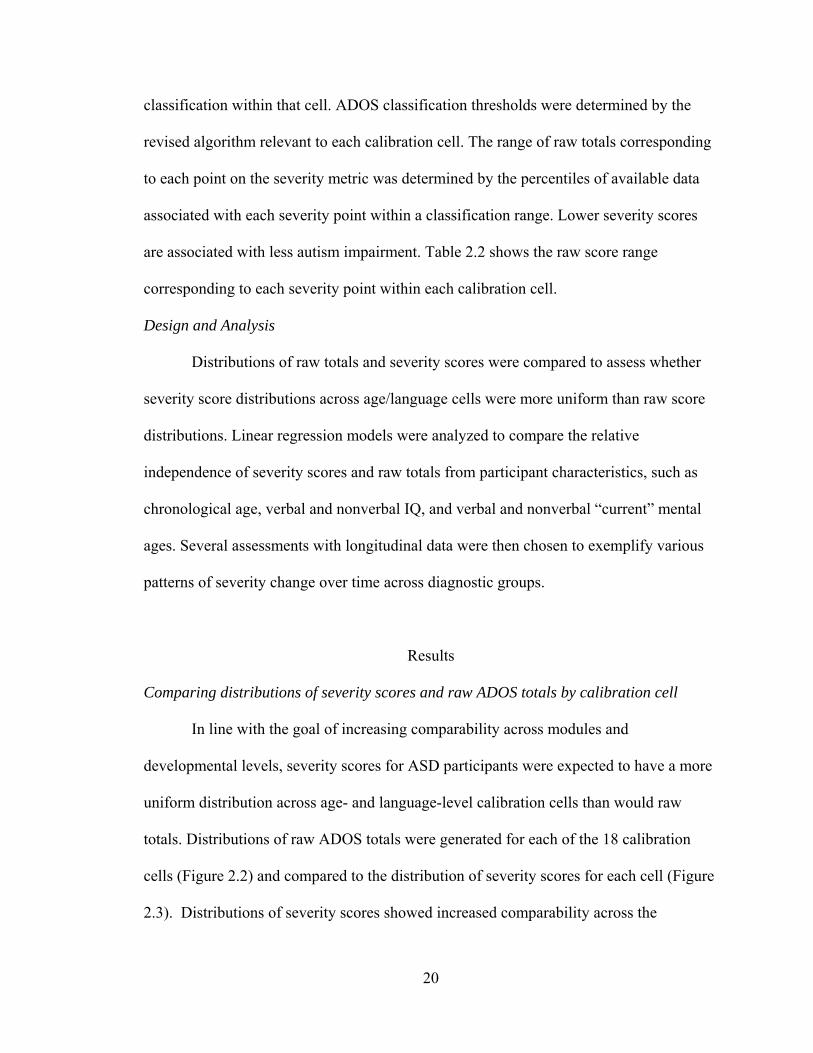
participants). Though some overlap exists, severity scores showed expected heterogeneity
of distribution across the three diagnostic groups: autism, PDD-NOS, and nonspectrum
(see Figure 2.4).
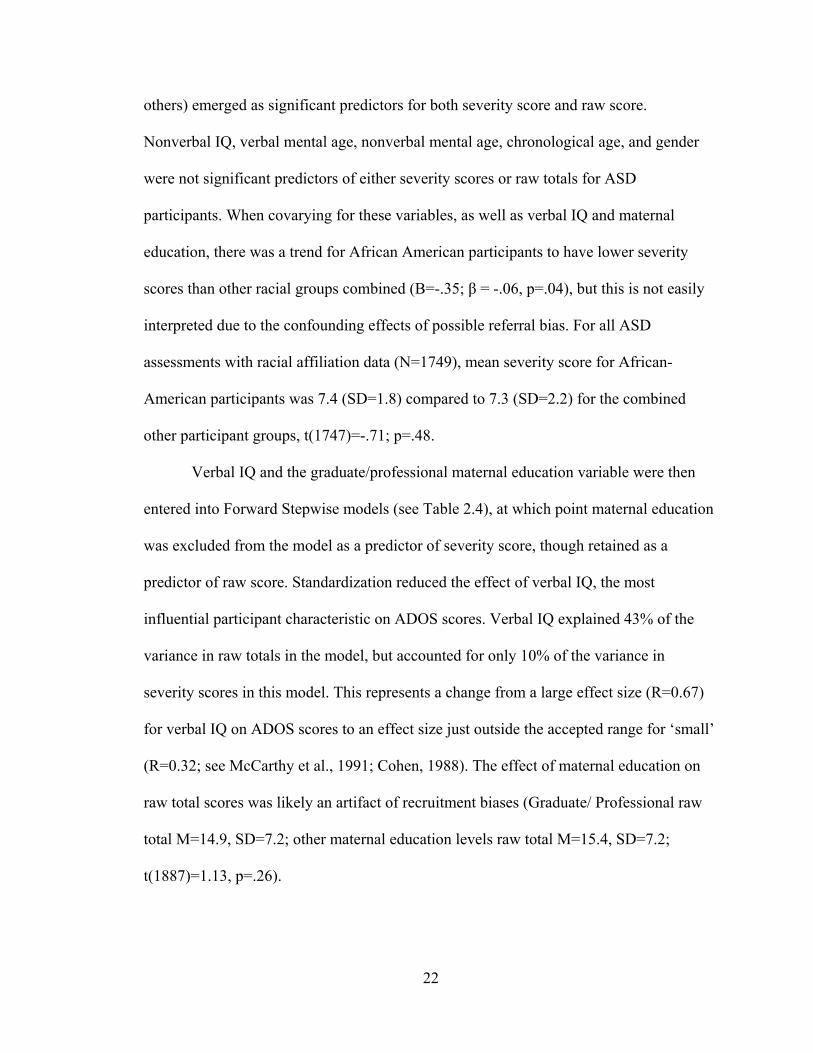
Relative independence of severity score from participant characteristics
Multiple linear regression analyses were performed separately for the dependent
variables severity score and raw total to examine whether participant characteristics such
as age and IQ would be less associated with severity scores than they were with raw
scores. For ASD assessments with complete contemporaneous demographic data
(N=1369), potential predictors were entered into a structured hierarchical model, in
which Block 1 included verbal and nonverbal IQ and mental age variables (which are
known to affect the expression of ASD symptoms; Lord & Spence, 2006), and Block 2
included age, gender, maternal education, and race (variables that could affect ASD
symptoms but that often have had non-significant effects when Block 1 variables are
controlled). Whereas 44% of the variance in raw totals was explained by this model, only
12% of variance was explained for severity scores using these covariates. Verbal IQ and
one maternal education variable (mothers with graduate/professional degrees versus all
22
others) emerged as significant predictors for both severity score and raw score.
Nonverbal IQ, verbal mental age, nonverbal mental age, chronological age, and gender
were not significant predictors of either severity scores or raw totals for ASD
participants. When covarying for these variables, as well as verbal IQ and maternal
education, there was a trend for African American participants to have lower severity
scores than other racial groups combined (B=-.35; β = -.06, p=.04), but this is not easily
interpreted due to the confounding effects of possible referral bias. For all ASD
assessments with racial affiliation data (N=1749), mean severity score for African-
American participants was 7.4 (SD=1.8) compared to 7.3 (SD=2.2) for the combined
other participant groups, t(1747)=-.71; p=.48.
Verbal IQ and the graduate/professional maternal education variable were then
entered into Forward Stepwise models (see Table 2.4), at which point maternal education
was excluded from the model as a predictor of severity score, though retained as a
predictor of raw score. Standardization reduced the effect of verbal IQ, the most
influential participant characteristic on ADOS scores. Verbal IQ explained 43% of the
variance in raw totals in the model, but accounted for only 10% of the variance in
severity scores in this model. This represents a change from a large effect size (R=0.67)
for verbal IQ on ADOS scores to an effect size just outside the accepted range for ‘small’
(R=0.32; see McCarthy et al., 1991; Cohen, 1988). The effect of maternal education on
raw total scores was likely an artifact of recruitment biases (Graduate/ Professional raw
total M=14.9, SD=7.2; other maternal education levels raw total M=15.4, SD=7.2;
t(1887)=1.13, p=.26).
23
When the initial hierarchical block models were applied to the full sample (ASD
and nonspectrum assessments combined), significant predictors of severity scores
included verbal IQ, gender (with males the more severe group), and maternal education;
significant predictors of raw totals included verbal IQ, nonverbal mental age, gender,
chronological age, and maternal education (these statistics are available from the
authors). This again indicates that, when severity scores are applied to a clinical referral
population, they are less influenced by participant characteristics than are raw ADOS
totals.
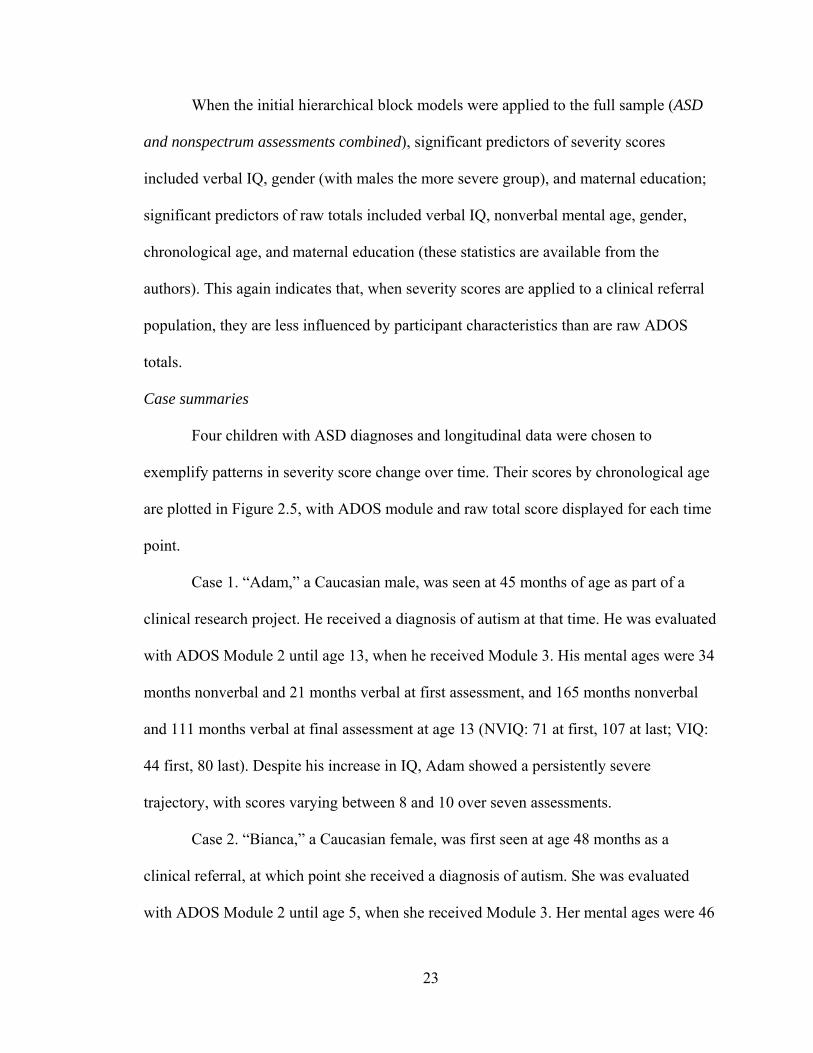
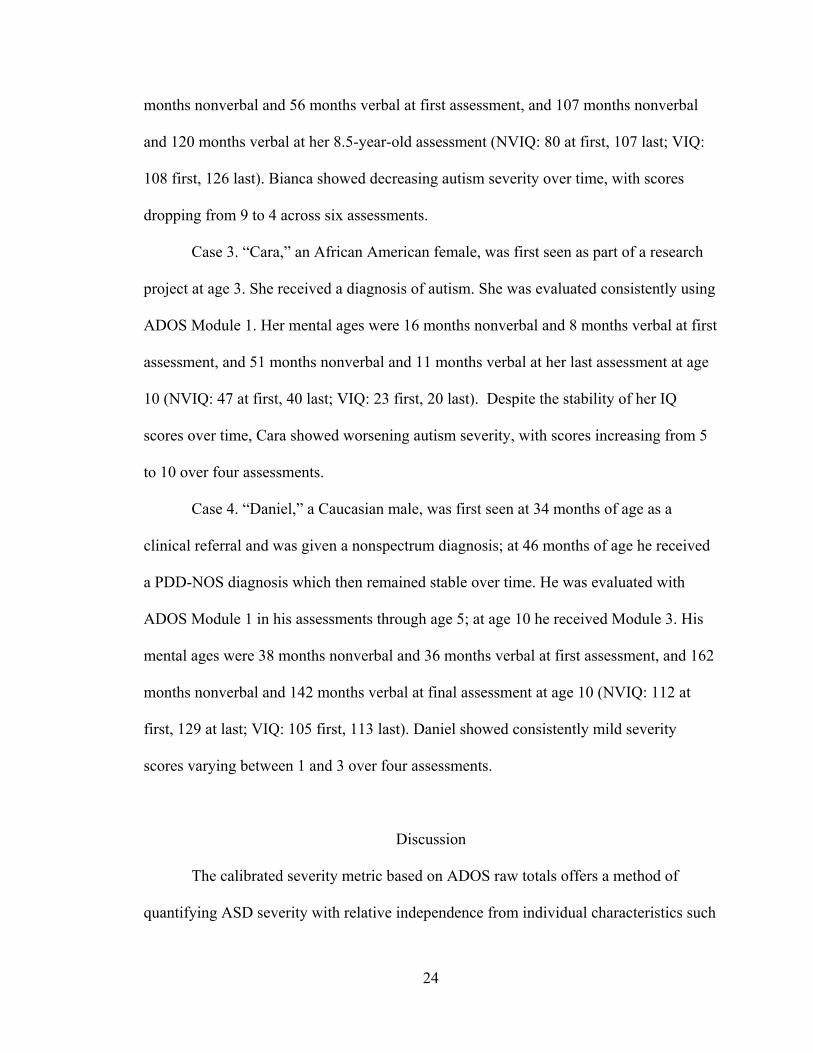
Case summaries
Four children with ASD diagnoses and longitudinal data were chosen to
exemplify patterns in severity score change over time. Their scores by chronological age
are plotted in Figure 2.5, with ADOS module and raw total score displayed for each time
point.
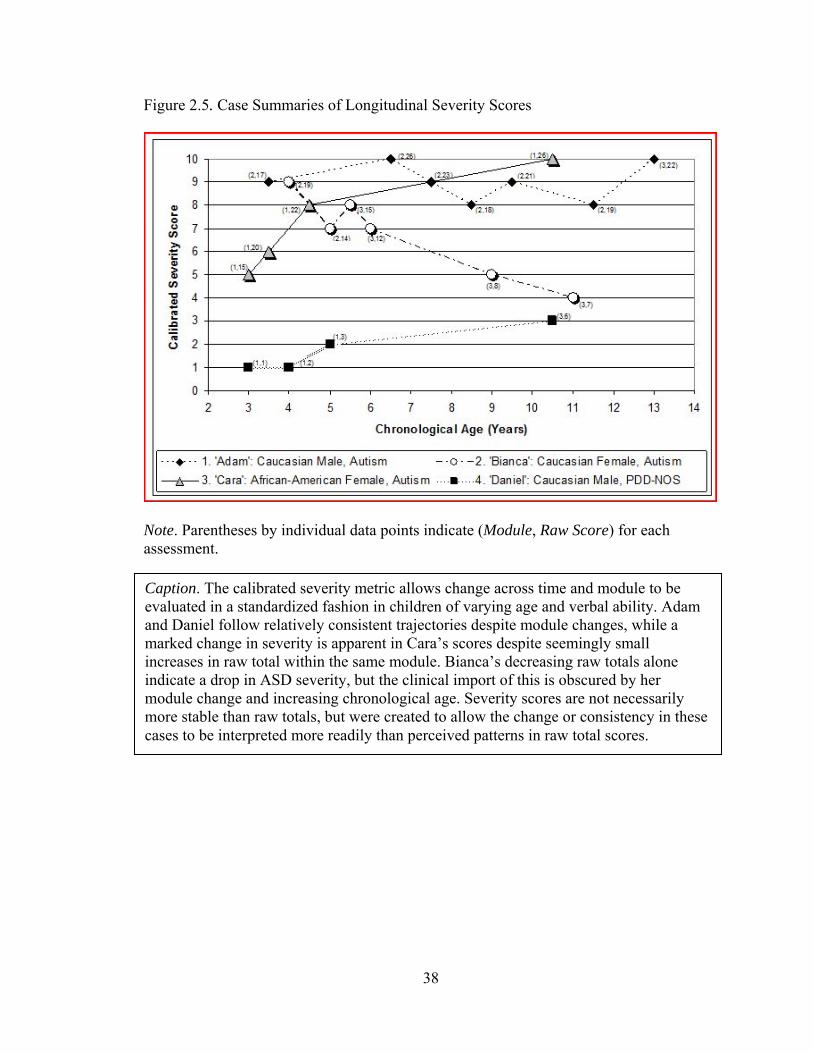
Case 1. “Adam,” a Caucasian male, was seen at 45 months of age as part of a
clinical research project. He received a diagnosis of autism at that time. He was evaluated
with ADOS Module 2 until age 13, when he received Module 3. His mental ages were 34
months nonverbal and 21 months verbal at first assessment, and 165 months nonverbal
and 111 months verbal at final assessment at age 13 (NVIQ: 71 at first, 107 at last; VIQ:
44 first, 80 last). Despite his increase in IQ, Adam showed a persistently severe
trajectory, with scores varying between 8 and 10 over seven assessments.
Case 2. “Bianca,” a Caucasian female, was first seen at age 48 months as a
clinical referral, at which point she received a diagnosis of autism. She was evaluated
with ADOS Module 2 until age 5, when she received Module 3. Her mental ages were 46
24
months nonverbal and 56 months verbal at first assessment, and 107 months nonverbal
and 120 months verbal at her 8.5-year-old assessment (NVIQ: 80 at first, 107 last; VIQ:
108 first, 126 last). Bianca showed decreasing autism severity over time, with scores
dropping from 9 to 4 across six assessments.
Case 3. “Cara,” an African American female, was first seen as part of a research
project at age 3. She received a diagnosis of autism. She was evaluated consistently using
ADOS Module 1. Her mental ages were 16 months nonverbal and 8 months verbal at first
assessment, and 51 months nonverbal and 11 months verbal at her last assessment at age
10 (NVIQ: 47 at first, 40 last; VIQ: 23 first, 20 last). Despite the stability of her IQ
scores over time, Cara showed worsening autism severity, with scores increasing from 5
to 10 over four assessments.
Case 4. “Daniel,” a Caucasian male, was first seen at 34 months of age as a
clinical referral and was given a nonspectrum diagnosis; at 46 months of age he received
a PDD-NOS diagnosis which then remained stable over time. He was evaluated with
ADOS Module 1 in his assessments through age 5; at age 10 he received Module 3. His
mental ages were 38 months nonverbal and 36 months verbal at first assessment, and 162
months nonverbal and 142 months verbal at final assessment at age 10 (NVIQ: 112 at
first, 129 at last; VIQ: 105 first, 113 last). Daniel showed consistently mild severity
scores varying between 1 and 3 over four assessments.
Discussion
The calibrated severity metric based on ADOS raw totals offers a method of
quantifying ASD severity with relative independence from individual characteristics such
25
as age and verbal IQ. It should have utility in various genetic, neurobiological, and
clinical research endeavors, including treatment trials, that otherwise would use
unstandardized ADOS raw totals. Calibrated scores have more uniform distributions
across age- and language-groups compared to raw totals, making it possible to compare
children’s scores longitudinally across distinct algorithms. In part because of the modular
system of the ADOS, chronological age, nonverbal IQ, and verbal and nonverbal mental
age did not predict either raw totals or severity scores in this sample. The severity metric
builds on this modular system to reduce the influence of participants’ verbal IQ, which
accounted for 10% of the variance in severity scores versus 43% of the variance in raw
totals, a reduction from a large to medium effect size. The remaining influence of verbal
IQ on the severity metric can be seen in the drift of mean scores toward greater severity
in older age groups with lower language levels (Modules 1 and 2). This apparent age
effect seems likely to be explained by lower verbal IQ in the older children without fluent
speech. Though this effect has not been eliminated entirely, the calibrated metric is better
able to measure autism severity beyond verbal impairment than are raw ADOS totals.
Calibrating scores within narrowly-defined age/language cells achieved the
reduction in verbal IQ effects within the new metric and corrected for artificial variability
in individuals’ scores across time. Unfortunately, a greater number of calibration cells
precludes a user-friendly age/language ‘prefix’ to the severity score, as mentioned in the
introduction. The method described here necessarily defines autism severity in relation to
individuals of similar age and language ability. When using these scores clinically and for
research, one must keep in mind the age/language level of the child/sample, as there
clearly will be developmental and adaptive functioning differences among children with
26
the same severity score on this 10-point scale. This is true of all standardized scores.
Calibrated severity scores do not measure functional impairment, but are intended to
provide a marker of severity of autism symptoms relative to age and language level. The
module a child can be given depends on his/her expressive language level, and thus will
continue to be an important indicator of adaptive functioning for most children.
The dataset described here included children from various areas in the United
States, both urban and rural. Participants represented both consecutive clinic referrals and
research participants. While this is likely a representative sample for a North American
clinical research center, it is worth examining how referral bias might have influenced
these calibrated scores. Though the dataset was large (N=1807 assessments from children
with ASD), its division into age/language cells for calibration resulted in a few small cell
sizes. For example, children under age 5 who are not language delayed are unlikely to be
referred for an evaluation unless they exhibit notable ASD symptomatology, so we would
expect these cells to have a more limited distribution in the higher end of the range of
ADOS scores. Another referral bias involved the tendency for children of higher severity
to have more clinic reevaluations than those with less pronounced features of ASD.
Indeed, the mean severity scores across the 18 calibration groups ranged from 6.64 (in
young children with fluent speech) to 8.10 (in older children with phrase speech only),
indicating that severity scores are still somewhat influenced by developmental level and
referral bias.
After attempting a number of methods for standardizing ADOS scores, we believe
that the present method of using ADOS diagnostic classifications to ‘anchor’ severity
scores best controls for recruitment effects that would be present in any large clinical
27
research sample, and therefore results in a metric more likely to be generalizable across
datasets. If a cell in this calibration sample had predominantly high- or low-scoring
children, this restricted range would only be assigned to severity scores associated with
one classification (autism, ASD, or nonspectrum), allowing for more variability in other
datasets across the other possible classifications. Ideally this method circumvents to some
degree the inevitable effects of recruitment. Anchoring severity scores to ADOS
classification instead of clinical diagnosis also avoids conflicting dimensional and
diagnostic assignment. Within the present method, severity scores reflect ADOS raw
totals regardless of the participant’s diagnosis, so a child with a non-ASD best estimate
diagnosis potentially could receive a score of 6 on the metric while a child with autism
receives a 3, if the former child showed more autistic symptomatology relative to his/her
age and language within that 45 minute assessment than did the child with autism.
More work is needed to test the validity and utility of this calibrated severity
metric. Module change, especially into Module 3 (fluent speech), may inflate an
individual’s severity score. Some longitudinal variation in these scores is expected, but
the purpose of the metric is to measure change beyond typical variation in ASD. For this
reason, the fact that approximately 20% of ASD assessments with ‘autism’ ADOS
classifications receive the highest severity score of 10, creating a ceiling effect, was
preferred over drawing out the distribution of the metric with the result of less
meaningful differences between scores. We hope to further examine patterns of severity
score change over time in a longitudinal sample, identifying trajectory classes and the
risk variables that predict class membership.
28
Another future direction is to calibrate the Social Affect and Restricted, Repetitive
Behavior (RRB) domains of the revised ADOS algorithms separately in order to measure
severity within these symptom domains. This process will need to employ a different
method of mapping raw scores onto a severity metric, due to the fact that each domain
has a smaller range of possible raw totals than the overall score (with a maximum of only
8 points for the RRB domain).
Limitations
Although based on a large sample, this is not a metric of symptom severity in a
“true” ASD population because ADOS data on such samples do not exist at present. As
larger population studies become available, the metric should be recalibrated within those
samples for a more accurate reflection of the distribution of ADOS scores in the ASD
population.
These results also may be influenced by the historical period in which some of the
data were collected. This sample grew over a 16-year period in which patterns in ASD
identification evolved. As greater numbers of children are identified at earlier ages (thus
including milder cases at younger ages), it is possible that severity scores might have
been assigned differently to raw totals if only recently collected data were used.
Conclusion
The ADOS calibrated severity metric represents a step towards achieving greater
comparability of scores across time, age, and module, and is less influenced by verbal IQ
than raw scores. Therefore, it should provide a better measure of ASD severity than other
methods currently available, including ADOS raw total scores. This metric must be
replicated in a large independent sample. To test the validity of the metric, calibrated

29
scores should be used to track observed changes in ASD severity against sources of
convergent validity.
Calibrated scores could be used to predict outcome, changes in adaptive skills
over time, and associations between severity of core features and clinical characteristics
such as behavior problems, peer relationships, and school achievement. This metric may
also prove useful in interpreting results from studies of the effectiveness of interventions,
and in characterizing samples for genetic and neurobiological research. An important
reminder, however, is that the calibrated severity metric is based on a relatively brief,
office-based observation with a clinician, and thus is only one part of a necessarily
broader picture of the strengths and difficulties of a child with ASD.
30
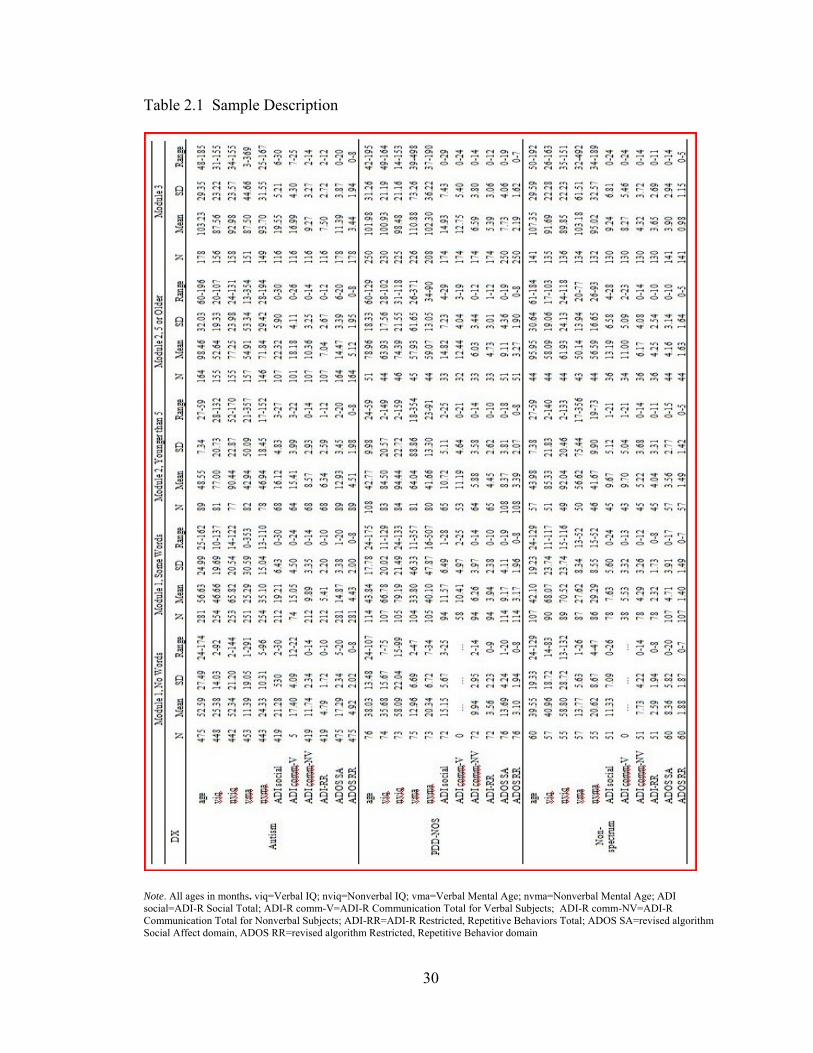
Table 2.1 Sample Description
Note. All ages in months. viq=Verbal IQ; nviq=Nonverbal IQ; vma=Verbal Mental Age; nvma=Nonverbal Mental Age; ADI social=ADI-R Social Total; ADI-R comm-V=ADI-R Communication Total for Verbal Subjects; ADI-R comm-NV=ADI-R Communication Total for Nonverbal Subjects; ADI-RR=ADI-R Restricted, Repetitive Behaviors Total; ADOS SA=revised algorithm Social Affect domain, ADOS RR=revised algorithm Restricted, Repetitive Behavior domain
31
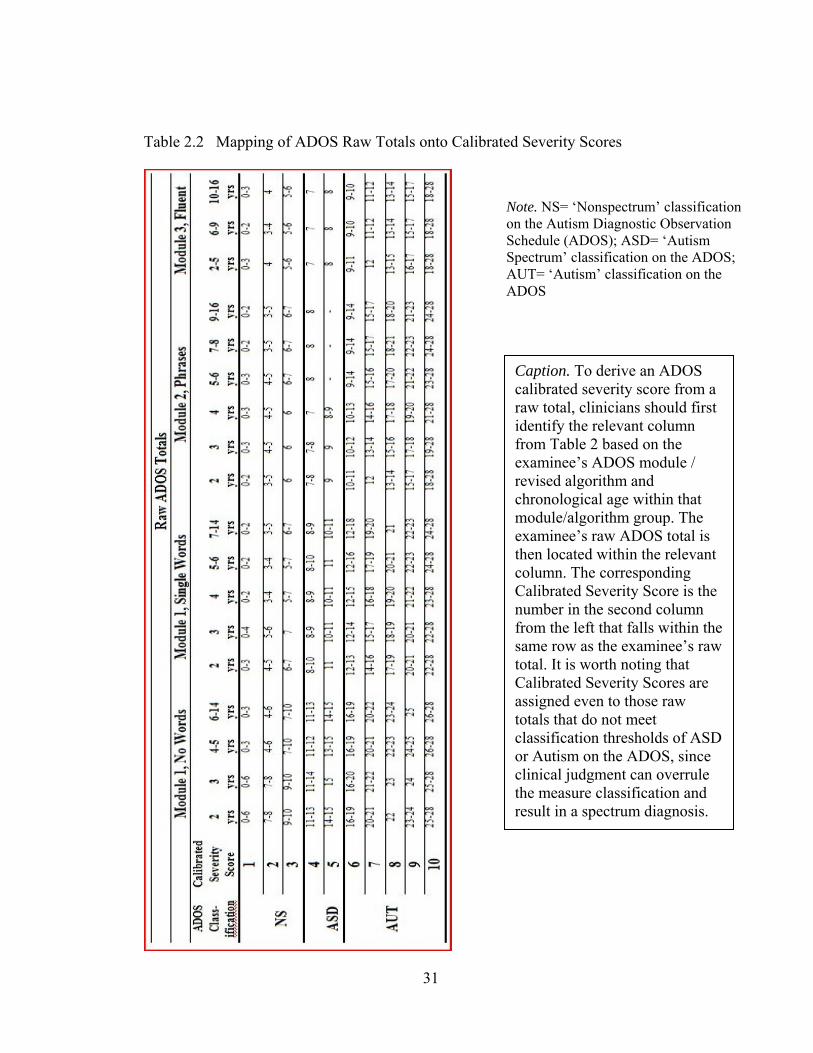
Table 2.2 Mapping of ADOS Raw Totals onto Calibrated Severity Scores
Caption. To derive an ADOS calibrated severity score from a raw total, clinicians should first identify the relevant column from Table 2 based on the examinee’s ADOS module / revised algorithm and chronological age within that module/algorithm group. The examinee’s raw ADOS total is then located within the relevant column. The corresponding Calibrated Severity Score is the number in the second column from the left that falls within the same row as the examinee’s raw total. It is worth noting that Calibrated Severity Scores are assigned even to those raw totals that do not meet classification thresholds of ASD or Autism on the ADOS, since clinical judgment can overrule the measure classification and result in a spectrum diagnosis.
Note. NS= ‘Nonspectrum’ classification on the Autism Diagnostic Observation Schedule (ADOS); ASD= ‘Autism Spectrum’ classification on the ADOS; AUT= ‘Autism’ classification on the ADOS
32
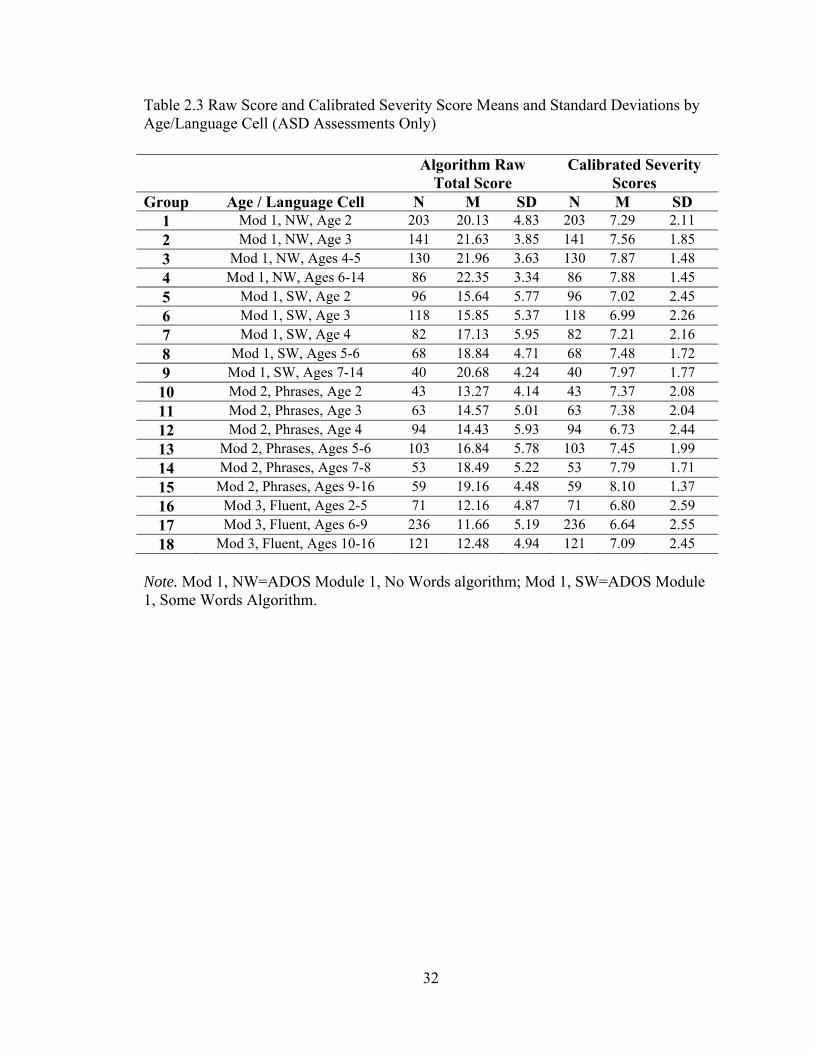
Table 2.3 Raw Score and Calibrated Severity Score Means and Standard Deviations by Age/Language Cell (ASD Assessments Only)
Note. Mod 1, NW=ADOS Module 1, No Words algorithm; Mod 1, SW=ADOS Module 1, Some Words Algorithm.
Algorithm Raw Total Score
Calibrated Severity Scores
Group Age / Language Cell N M SD N M SD 1 Mod 1, NW, Age 2 203 20.13 4.83 203 7.29 2.11 2 Mod 1, NW, Age 3 141 21.63 3.85 141 7.56 1.85 3 Mod 1, NW, Ages 4-5 130 21.96 3.63 130 7.87 1.48 4 Mod 1, NW, Ages 6-14 86 22.35 3.34 86 7.88 1.45 5 Mod 1, SW, Age 2 96 15.64 5.77 96 7.02 2.45 6 Mod 1, SW, Age 3 118 15.85 5.37 118 6.99 2.26 7 Mod 1, SW, Age 4 82 17.13 5.95 82 7.21 2.16 8 Mod 1, SW, Ages 5-6 68 18.84 4.71 68 7.48 1.72 9 Mod 1, SW, Ages 7-14 40 20.68 4.24 40 7.97 1.77 10 Mod 2, Phrases, Age 2 43 13.27 4.14 43 7.37 2.08 11 Mod 2, Phrases, Age 3 63 14.57 5.01 63 7.38 2.04 12 Mod 2, Phrases, Age 4 94 14.43 5.93 94 6.73 2.44 13 Mod 2, Phrases, Ages 5-6 103 16.84 5.78 103 7.45 1.99 14 Mod 2, Phrases, Ages 7-8 53 18.49 5.22 53 7.79 1.71 15 Mod 2, Phrases, Ages 9-16 59 19.16 4.48 59 8.10 1.37 16 Mod 3, Fluent, Ages 2-5 71 12.16 4.87 71 6.80 2.59 17 Mod 3, Fluent, Ages 6-9 236 11.66 5.19 236 6.64 2.55 18 Mod 3, Fluent, Ages 10-16 121 12.48 4.94 121 7.09 2.45
33
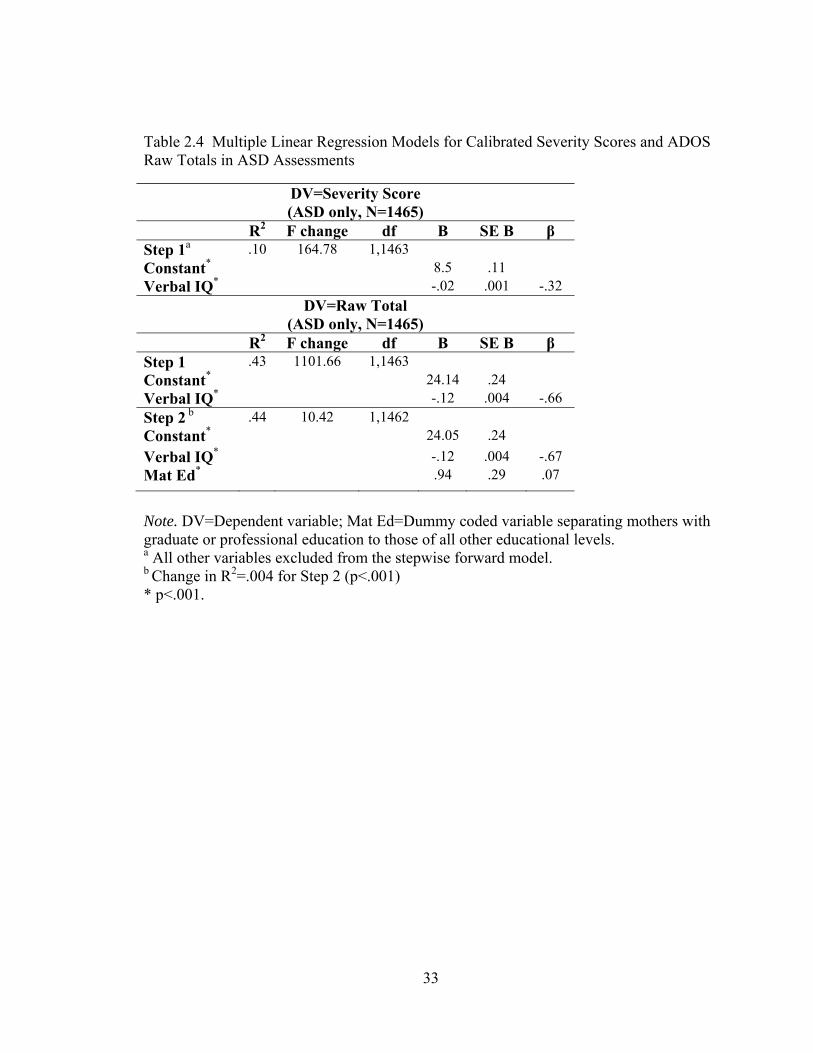
Table 2.4 Multiple Linear Regression Models for Calibrated Severity Scores and ADOS Raw Totals in ASD Assessments
Note. DV=Dependent variable; Mat Ed=Dummy coded variable separating mothers with graduate or professional education to those of all other educational levels. a All other variables excluded from the stepwise forward model. b Change in R2=.004 for Step 2 (p<.001) * p<.001.
DV=Severity Score (ASD only, N=1465)
R2 F change df B SE B β Step 1a .10 164.78 1,1463 Constant* 8.5 .11 Verbal IQ* -.02 .001 -.32
DV=Raw Total (ASD only, N=1465)
R2 F change df B SE B β Step 1 .43 1101.66 1,1463 Constant* 24.14 .24 Verbal IQ* -.12 .004 -.66 Step 2 b .44 10.42 1,1462 Constant* 24.05 .24 Verbal IQ* -.12 .004 -.67 Mat Ed* .94 .29 .07
34
Figure 2.1. Age by Language Level Calibration Cells
Note. N’s denote the number of ASD participants within each cell.
35
Figure 2.2. Distributions of ADOS Raw Total Scores by Age/Language Cells (ASD Assessments Only)
Age/Language Calibration Cells18.0017.0016.0015.0014.0013.0012.0011.0010.009.008.007.006.005.004.003.002.001.00
ADO
S Al
gorit
hm R
aw T
otal
Sco
re
25.00
20.00
15.00
10.00
5.00
0.00
36
Figure 2.3. Distributions of Calibrated Severity Scores by Age/Language Cells (ASD Assessments Only)
Age/Language Calibration Cells18.0017.0016.0015.0014.0013.0012.0011.0010.009.008.007.006.005.004.003.002.001.00
Calib
rate
d Se
verit
y Sc
ore
10.00
9.00
8.00
7.00
6.00
5.00
4.00
3.00
2.00
1.00
37
Figure 2.4. Distributions of Calibrated Severity Scores by Diagnostic Group
DiagnosisNonspectrumPDD-NOSAutism
Calib
rate
d Se
verit
y Sc
ore 10
9
8
7
6
5
4
3
2
1
38
Figure 2.5. Case Summaries of Longitudinal Severity Scores
Note. Parentheses by individual data points indicate (Module, Raw Score) for each assessment.
total scores. Caption. The calibrated severity metric allows change across time and module to be evaluated in a standardized fashion in children of varying age and verbal ability. Adam and Daniel follow relatively consistent trajectories despite module changes, while a marked change in severity is apparent in Cara’s scores despite seemingly small increases in raw total within the same module. Bianca’s decreasing raw totals alone indicate a drop in ASD severity, but the clinical import of this is obscured by her module change and increasing chronological age. Severity scores are not necessarily more stable than raw totals, but were created to allow the change or consistency in these cases to be interpreted more readily than perceived patterns in raw total scores.
39
References
Baird, G., Simonoff, E., Pickles, A., Chandler, S. Loucas, T., Meldrum, D. & Charman, T. (2006) Prevalence of Disorders of the Autism Spectrum in a Population Cohort of Children in South Thames – the Special Needs and Autism Project (SNAP). Lancet. 368, 210-5.
Bertrand, J., Mars, A., Boyle, C., Bove, F., Yeargin-Allsopp, M., & Decoufle, A. (2001).
Prevalence of autism in a United States population: The Brick Township, New Jersey, investigation. Pediatrics, 108(5), 1155-1161.
Centers for Disease Control and Prevention. (2007). Prevalence of autism spectrum
disorders – Autism and Developmental Disabilities Monitoring Network, 14 sites, United States, 2002. MMWR: Morbidity and Mortality Weekly Report, 56, 12-27.
Chakrabarti, S., & Fombonne, E. (2005). Pervasive developmental disorders in preschool
children: Confirmation of high prevalence. American Journal of Psychiatry, 162(6), 1133-1141.
Cohen, J. (1988). Statistical power analysis for the behavioral sciences. Hillsdale, NJ:
Lawrence Erlbaum Associates (2nd ed.). Constantino, J. N., Davis, S. A., Todd, R. D., Schindler, M. K., Gross, M. M., Brophy, S.
L., et al. (2003). Validation of a brief quantitative measure of autistic traits: Comparison of the social responsiveness scale with the autism diagnostic interview-revised. Journal of Autism and Developmental Disorders, 33(4), 427-433.
de Bildt, A., Sytema, S., Ketelaars, C., Kraijer, D., Mulder, E., Volkmar, F., & Minderaa,
R. (2004). Interrelationship between autism diagnostic observation schedule-generic (ADOS-G), autism diagnostic interview-revised (ADI-R), and the diagnostic and statistical manual of mental disorders (DSM-IV-TR) classification in children and adolescents with mental retardation. Journal of Autism and Developmental Disorders, 34(2), 129-137.
DiLavore, P.C., Lord, C., & Rutter, M. (1995). The Pre-Linguistic Autism Diagnostic
Observation Schedule. Journal of Autism and Developmental Disorders, 25, 355-379. Elliot, C.D. (1990). Differential abilities scale (DAS). San Antonio, TX: Psychological
Corporation. Gilliam, J. E. (1995). Gilliam autism rating scale. Austin, TX: Pro-Ed. Gotham, K., Risi, S., Pickles, A., & Lord, C. (2007). The Autism Diagnostic Observation
Schedule (ADOS): Revised algorithms for improved diagnostic validity. Journal of Autism and Developmental Disorders, 37, 400-408.
40
Gotham, K., Risi, S., Dawson, G., Tager-Flusberg, H., Joseph, R., Carter, A., et al.
(2008). A replication of the Autism Diagnostic Observation Schedule (ADOS) revised algorithms. Journal of the American Academy of Child and Adolescent Psychiatry, 47(6), 643-651.
Harold, D., Abraham, R., Hollingsworth, P., Sims, R., Gerrish, A.,…Williams., J. (2009).
Genome-wide association study identifies variants at CLU and PICALM associated with Alzheimer's disease. Nature Genetics, 41, 1088-1093.
Joseph, R.M., Tager-Flusberg, H., & Lord, C. (2002). Cognitive profiles and social-
communicative functioning in children with autism spectrum disorder. Journal of Child Psychology and Psychiatry and Allied Disciplines, 43(6), 807-821.
Krug, D.A., Arick, J.R., & Almond, P.J. (1980). Behavior checklist for identifying
severely handicapped individuals with high levels of autistic behavior. Journal of Child Psychology and Psychiatry and Allied Disciplines, 21(3), 221-229.
Liang, Y., Tayo, B., Cai, X., & Kelemen, A. (2005). Differential and trajectory methods
for time course gene expression data. Bioinformatics, 21(13), 3009-3016. Lord, C., Risi, S., Lambrecht, L., Cook, E. H., Jr., Leventhal, B.L., DiLavore, P.C.,
Pickles, A., & Rutter, M. (2000). The Autism Diagnostic Observation Schedule-Generic: A standard measure of social and communication deficits associated with the spectrum of autism. Journal of Autism & Developmental Disorders, 30, 205-223.
Lord, C. & Spence, S. (2006). Autism spectrum disorders: phenotype and diagnosis. In S.
Moldin & J. Rubenstein (eds.) Understanding autism: From basic neuroscience to treatment, pp. 1-23. New York: Taylor and Francis.
Luyster, R., Gotham, K., Guthrie, W., Coffing, M., Petrak, R., Pierce, K., Bishop, S.,
Esler, A., Hus, V., Richler, J., Risi, S., & Lord, C. (submitted). The Autism Diagnostic Observation Schedule -- Toddler Module: A new module of a standardized diagnostic measure for ASD. Journal of Autism and Developmental Disorders.
McCarthy, P.L., Cicchetti, D. V., Sznajderman, S.D., Forsyth, B.C., Baron, M.A., Fink,
H.D.,Czarkowski, N., Bauchner, H., & Lustman-Findling, K. (1991). Demographic, clinical and psychosocial predictors of the reliability of mothers' clinical judgments. Pediatrics, 88, 1041-1046.
Mullen, E. (1995). Mullen scales of early learning (AGS ed.). Circle Pines, MN:
American Guidance Service.
41
Pickles, A., Starr, E., Kazak, S., Bolton, P., Papanikolaou, K., Bailey, A., Goodman, R., & Rutter, M. (2000). Variable expression of the autism broader phenotype: findings from the extended pedigrees. Journal of Child Psychology & Psychiatry & Allied Disciplines, 41, 491-502.
Rutter, M., Le Couteur, A., & Lord, C. (2003). Autism Diagnostic Interview-Revised – WPS (WPS ed.). Los Angeles: Western Psychological Services.
Schopler, E., Reichler, R.J., & Renner, B.R. (1986). The Childhood Autism Rating Scale
(CARS) for diagnostic screening and classification of autism. Irvington, NY: Irvington.
Sparrow, S., Balla, D., & Cicchetti, D. (1984). Vineland Adaptive Behavior Scales. Circle
Pines, Minnesota: American Guidance Service. Sparrow, S.S., Cicchetti, D.V., & Balla, D.A. (2005). Vineland Adaptive Behavior Scales
(2nd ed.). Circle Pines, MN: American Guidance Service, Inc. Spiker, D., Lotspeich, L. J., Dimiceli, S., Myers, R. M., & Risch, N. (2002). Behavioral
phenotypic variation in autism multiplex families: evidence for a continuous severity gradient. American Journal of Medical Genetics, 114(2), 129-136.
South, M., Williams, B.J., McMahon, W.M., Owley, T., Filipek, P.A., Shernoff, E.,
Corsello, C., Lainhart, J.E., Landa, R., & Ozonoff, S. (2002). Utility of the Gilliam Autism Rating Scale in research and clinical populations. Journal of Autism and Developmental Disorders, 32(6), 593-599.
Szatmari, P., Bryson, S.E., Boyle, M.H., Streiner, D.L., & Duku, E. (2003). Predictors of
outcome among high functioning children with autism and Asperger syndrome. Journal of Child Psychology and Psychiatry, 44, 520-528.
Volkmar, F.R., Cicchetti, D.V., Dykens, E., Sparrow, S., Leckman, J.F., & Cohen, D.F.
(1988). An evaluation of the Autism Behavior Checklist. Journal of Autism and Development Disorders, 18, 81-97.
42
Chapter III
Modeling Trajectories of ASD Severity in Children Using
Standardized ADOS Scores
Over recent decades, the use of standardized assessment instruments (Lord et al.,
2000; Rutter, Le Couteur, & Lord, 2003) has produced a strong research base for
diagnosis of autism spectrum disorders (ASD). The same instruments have also
contributed to proposed refinements to the current classification system, such as
streamlining social and communication symptom domains to reflect a single underlying
factor (Constantino et. al., 2004; Gotham, Risi, Pickles, & Lord, 2007; Robertson,
Tanguay, L’Ecuyer, Sims, & Waltrip, 1999). With increasing amounts of carefully
phenotyped longitudinal data available, these instruments may now be used to track
changes in autism symptom profiles over time, potentially leading to more detailed
prognostic estimates in ASD as well as opportunities to study the course of this disorder
over the lifespan.
Research on ASD prognosis to date has largely focused on stability of diagnosis,
verbal and cognitive outcomes, and symptom domain change over time. Using measures
such as the Autism Diagnostic Interview – Revised (ADI-R: Rutter, Le Couteur, & Lord,
2003) or best-estimate diagnoses influenced by the ADI-R, the Autism Diagnostic
Observation Schedule (ADOS: Lord et al., 2000) and clinical judgment, stability of ASD
diagnosis has been most recently reported between 63% and 98% (Cederlund, Hagberg,
43
Billstedt, Gillberg, & Gillberg, 2008; Eaves & Ho, 2008; Lord et. al, 2006; McGovern &
Sigman, 2005; Turner, Stone, Pozdol, & Coonrod, 2006; Turner & Stone, 2007). Lower
estimates often reflect changes within the autism spectrum and/or in younger samples
(McGovern & Sigman, 2005; Turner & Stone, 2007). However, diagnostic stability as
high as 88% has been reported across larger time spans beginning in early childhood
(Eaves & Ho, 1996; Turner, Stone, Pozdol, & Coonrod, 2006).
Studies of cognitive outcome have had more variable conclusions. Distinct IQ
trajectories have been noted in the ASD population; groups with initially higher IQs often
make great gains while lower functioning groups remain relatively stable or show small
improvements over time (Anderson et. al., 2007; Gabriels, Hill, Pierce, Rogers, &
Wehner, 2001). By contrast, the small sample of children with ASD (N=26) described by
Turner and co-authors (2006) showed remarkable cognitive gains between ages 2 and 9,
with just 16% of the sample above the range of intellectual disability (e.g., IQ>=70) at
first assessment compared to 72% at final follow-up. Sigman and McGovern (2005) also
reported cognitive and language gains between preschool and mid-childhood for a third
of their sample, followed by stability or slight decline from mid-childhood through
adolescence/adulthood. Charman and colleagues (2005) added the caveat that stable
group means in cognitive scores within their sample masked considerable individual
variability across early to mid-childhood, a finding replicated in a longitudinal sample of
children with ASD measured in mid-childhood and again as adults (Farley et. al., 2009).
Comparing longitudinal change in cognitive ability across these and other studies is
complicated by the different reliability properties of specific IQ tests used.
44
Within the small but growing body of literature on trajectory of ASD-specific
symptom expression over time, severity has most often been quantified with scores from
the ADI-R and the Childhood Autism Rating Scale (Schopler, Reichler, & Renner, 1986).
The 2004 Seltzer, Shattuck, & Abbeduto (2004) review indicates collected findings of
general improvement over the lifespan in the three core DSM-IV (American Psychiatric
Association, 1994) symptom domains, including improvement in reciprocal social
interaction and communication and a diminishing of restricted and repetitive behaviors.
Yet clear impairment remained in adulthood across all three domains. Communication
skills often improved most, with the greatest stability of symptom expression observed in
restricted, repetitive behaviors.
In the Seltzer review as well as in more recent empirical studies, improvement
was noted in social reciprocity across various ages: from ages 12-19 (McGovern &
Sigman, 2005); between adolescence/adulthood and retrospective reports of age 5 (Piven,
Harper, Palmer, & Arndt, 1996); and between reports of age 4-5 and current reports at
age 7 (Charman et. al., 2005). Continued impairment was always associated with these
gains, however, (Billstedt, Gillberg, & Gillberg, 2007) and one study reported a slight
worsening in social skills in children with autism assessed between ages 4-6 and again
two years later (Howlin, Mawhood, & Rutter, 2000). Because communication skills are
defined and measured in various ways (e.g., as verbal IQ, verbal proficiency level,
social/pragmatic use of language, or nonverbal communication), the magnitude of
improvements can be difficult to compare across studies. Improvements in absolute levels
of verbal or communication skills for samples with autism have been reported (Anderson
et. al., 2007; Charman et. al., 2005; Howlin, Mawhood, & Rutter, 2000; Mawhood,
45
Howlin, & Rutter, 2000; Sigman & McGovern, 2005; Starr, Szatmari, Bryson, &
Zwaigenbaum, 2003) with little evidence of decline. Restricted, repetitive behaviors had
the most variable outcome across time, with reports of improvement (decreased totals on
this ADI-R domain across ages 12-19; McGovern & Sigman, 2005), variability in
outcome across age groups and samples (Billstedt, Gillberg, & Gillberg, 2007; Charman
et. al., 2005), and stability across time in this symptom domain (Piven, Harper, Palmer, &
Arndt, 1996; Starr, Szatmari, Bryson, & Zwaigenbaum, 2003). While the research
attention paid to autism trajectories is encouraging, it is challenging to build a coherent
picture of stability and change in ASD over time given the variability of participant
demographics (e.g., chronological age, developmental level), measures used, and study
design (e.g., retrospective versus prospective data analysis). Sample and method
differences within the literature may mask patterns in symptom gains or losses in
subgroups on the spectrum, if such do indeed exist.
Another obstacle in plotting the trajectories of ASD symptom expression is that
the ADOS is often a primary measure used in phenotyping research samples. Although
the modular format of this measure contributes to its strong predictive validity across age
and developmental levels, this aspect of the ADOS makes longitudinal comparisons
difficult. In each of four developmental- and language-level dependent modules within
this standardized assessment instrument, a protocol of semi-structured social activities is
administered and scored by a trained examiner. Specific items comprise an algorithm for
each module, which yields a classification of “autism,” “autism spectrum disorder,” or
“nonspectrum.” The ADOS has shown strong diagnostic sensitivity and specificity
against best estimate diagnoses (Gotham, Risi, Pickles, & Lord, 2007), making it a
46
common choice among phenotyping measures. Comparing ADOS data over time,
however, is confounded by observed effects of age and language level on algorithm or
domain total scores (Gotham, Risi, Pickles, & Lord, 2007; de Bildt et. al., 2004; Joseph,
Tager-Flusberg, & Lord, 2002). Additionally, as a child ages or gains language skills, he
or she often moves through ADOS modules, making raw scores even less directly
comparable across time.
Two recent updates have been made to the ADOS with the purpose of increasing
the comparability of the modules used with children and adolescents. First, revised
algorithms were created with the same number of items and of similar content across
modules 1-3 (Gotham, Risi, Pickles, & Lord, 2007). Five new algorithms correspond to
specific developmental groups within these three modules, resulting in minimal
association between ADOS totals and chronological age, generally decreased association
between ADOS total and verbal IQ when compared to the original algorithms, and
improved predictive validity of the measure in most developmental groups (Gotham et.
al., 2008; Gotham, Risi, Pickles, & Lord, 2007). Second, ADOS revised algorithm raw
total scores were standardized within 1807 cases from participants with ASD to produce
a calibrated severity metric (Gotham, Pickles, & Lord, 2009; see Chapter 2). This 10-
point scale was proposed as an alternative method of quantifying ASD severity on the
ADOS with greater independence from participant characteristics such as chronological
age and IQ. The resulting metric showed more uniform distribution across age- and
language-level determined groups than did raw total scores. Standardization also reduced
the percentage of variance accounted for by verbal IQ from 43% using raw totals to 10%
using severity scores. It is important to note that calibrated severity scores do not measure
47
functional impairment but rather provide a marker of ASD severity on the ADOS
benchmarked to be consistent with diagnostic category and relative to age and language
level. Used for this purpose, the metric provides a solution for comparing ADOS scores
across modules and time. Because the standardization was not based on a population
sample, however, the scores may be subject to recruitment effects.
The present study uses standardized ADOS scores to plot changes in ASD
severity over time in a mixed prospective cohort. The primary goal is to identify latent
trajectory classes, or patterns of change over time, in autism severity in children and
adolescents. Because cognitive functioning has been found to influence ASD symptom
presentation (Bishop, Richler, & Lord, 2006; Gabriels, Hill, Pierce, Rogers, & Wehner,
2001; Joseph, Tager-Flusberg, & Lord, 2002; Matson, 2007), the design included
covarying both verbal and nonverbal IQ (as well as other participant characteristics such
as gender and race) in the modeling of ASD severity trajectory classes. A further aim is
to compare trajectories of IQ and measures of adaptive functioning for each of the
resulting ASD severity trajectory classes.
Methods Participants
Analyses were conducted on data from 345 individuals referred for ASD
evaluations. Inclusion criteria required repeated ADOS administrations with
contemporaneous best estimate clinical diagnoses, verbal and nonverbal IQ scores, and
complete data on gender and racial affiliation. The final dataset included 1026 cases,
where ‘case’ is defined as contemporaneous ADOS data and a best estimate clinical
48
diagnosis. Final (i.e., most recent) diagnoses of autism were assigned to 231 individuals
(67% of all cases); 104 individuals received final diagnoses of Pervasive Developmental
Disorder, Not Otherwise Specified (PDD-NOS; 30% of all cases); and 10 individuals
(3% of all cases) ultimately received nonspectrum diagnoses, though they were clinically
referred for ASD and were given an ASD diagnosis at one or more assessments. Five of
these participants had final diagnoses of language disorders, two had intellectual
disability, one each had Tourette’s disorder, a mood disorder, or Oppositional Defiant
Disorder with ADHD. Data from participants identified as ‘nonspectrum’ at all
longitudinal time points were not included in this sample in order to model severity
trajectories within the autism spectrum.
Chronological ages in the sample ranged from 2 to 15 years. Female participants
(n=63) contributed data for 18% of all cases. Ethnicities represented include 18% African
American cases (from 62 individuals); 2% Asian American (n=7 individuals); 78%
Caucasian (n=272); 1% biracial (n=3); and one participant who selected ‘other.’ Twenty-
five percent of the sample reported maternal education at the graduate or professional
level; 21% of mothers had a high school degree or less.
Within this sample, 159 individuals were consecutive referrals to the Treatment
and Education of Autistic and Communication Handicapped Children (TEACCH)
Centers at the University of North Carolina, Chapel Hill, and the University of Chicago
Developmental Disorders Clinic who participated in a longitudinal study of the “Early
Diagnosis of Autism Spectrum Disorders” conducted through these universities. These
participants were referred for possible autism before 36 months of age, and most were
evaluated again around ages 5 and 9. For more detailed information on the data collection
49
procedures associated with this study, see the methods reported in Lord (1995), and Lord
et al., (2006). The remainder of participants (186 individuals) in the current sample
received diagnostic evaluations as clinic patients or participants of various research
projects at the University of Michigan Autism and Communication Disorders Center
(UMACC) or University of Chicago clinic, and then returned for self- or school-referred
clinical reevaluations or received another evaluation through a research project at these
clinics. Out of 345 total participants with repeated assessments through clinic
reevaluations or longitudinal research, 258 individuals had 2 or 3 ADOS assessments,
and 87 had between 4 and 8 assessments.
Measures and Procedure
A standard research protocol was employed across sites and projects. This
included the initial administration of the Autism Diagnostic Interview – Revised (Rutter,
Le Couteur, & Lord, 2003), a standardized, semi-structured interview of parents and
caregivers for the purpose of taking a developmental history specific to ASD features,
followed by the Vineland Adaptive Behavior Scales (VABS), 1st or 2nd edition (Sparrow,
Balla, & Cicchetti, 1984; Sparrow, Cicchetti, & Balla, 2005), a standardized
parent/caregiver interview of adaptive functioning across social, communication, daily
living, and motor skills domains. Next, a child assessment took place, which included
psychometric testing and the ADOS. An alternative protocol was a re-evaluation
consisting of the child assessment only. In both cases, a clinical diagnosis was made by a
psychologist and/or psychiatrist after review of all data. The ADI-R was available for 328
individuals and the Vineland for 330 individuals. The ADOS was administered and
scored by a clinical psychologist or trainee who met standard requirements for research
50
reliability. The Pre-Linguistic Autism Diagnostic Observation Schedule (PL-ADOS:
DiLavore, Lord, & Rutter, 1995) was given in 350 cases (34%) and the toddler module of
the ADOS (Luyster et. al., 2009) was given in 37 cases (4%); for both measures, identical
items were recoded to Module 1 algorithm scores. A developmental hierarchy of
cognitive measures, most frequently the Mullen Scales of Early Learning (MSEL:
Mullen, 1995) and the Differential Ability Scales (Elliot, 1990), determined IQ scores.
Research-only participants received financial compensation and a written
summary of evaluation results. Clinic-referred participants received oral feedback and a
written report without financial compensation. Institutional Review Boards at the
University of North Carolina, Chicago, or Michigan approved all procedures.
Research Design and Statistical Analyses
ADOS calibrated severity scores (Gotham, Pickles, & Lord, 2009) for participants
with longitudinal data were analyzed for patterns of stability or change using the
Generalized Linear Latent and Mixed Models, or gllamm, procedure (Rabe-Hesketh,
Skrondal, & Pickles, 2004) in Stata version 10 (StataCorp, 2007). Mixed-effects models
resulting in 3 to 6 trajectory classes with linear and quadratic random dimensions were
compared for goodness of fit (Pickles & Croudace, in press). Models were fitted first
without and then including the baseline covariates verbal IQ, nonverbal IQ, gender, and
race, and the most parsimonious model was chosen. The linear fixed part coefficients,
representing linear and quadratic relationships of age with ADOS severity scores for the
whole sample, were tested for significance using an overall likelihood ratio Chi-square
test to determine whether there was evidence of a common trend for all individuals.
51
Baseline covariates were examined for significance as predictors of the model-assigned
latent class membership using multinomial logistic regression.
In order to examine the concurrent development of the VABS Daily Living Skills
V-scale scores and Verbal IQ, we plotted the smoothed (fractional polynomial) mean
scores by age for each trajectory class. Wald-tests from GEE multivariate regression
models with an exchangeable working correlation matrix (which are equivalent to
repeated measures ANOVA but not requiring complete data and with the use of the
robust parameter covariance matrix estimator not assuming a constant error variance)
were used to test for class differences in the intercept (centered at age 6 to allow
intercepts to provide estimates of class means at this point), linear, and quadratic trends.
Finally, we used an overall likelihood ratio Chi-square test to examine trajectory class
differences in treatment variables representing total number of hours of parent training
with TEACCH techniques and total hours of parent training in Applied Behavior
Analysis (ABA) techniques by age 5 (see Anderson, Oti, Lord, & Welch, 2009, for a
more detailed description of these treatment variables); this analysis was run only on the
subsample of data collected through the “Early Diagnosis of Autism Spectrum Disorders”
longitudinal study.
Results
Latent classes by ADOS severity score trajectory
A linear model of five latent trajectory classes was found to have the most
parsimonious fit to longitudinal ADOS severity score data in this sample, as suggested by
the lowest Bayesian Information Criteria (BIC) in comparison to other models (see Table
52
3.1). A greater number of dimensions or classes led to models with higher BIC. The
linear fixed part coefficients of the five class model showed no evidence of a significant
relationship between ADOS severity and chronological age in the sample (χ2(2)=0.33,
p=0.8), suggesting there was no significant overall age trend masked by the grouping into
latent classes.
One of the five classes in this best fitting model included only 6 participants (one
with autism, two with PDD-NOS, and three with nonspectrum final diagnoses
[intellectual disability (n=1); language disorders (n=2)]). These children, who had a total
of 22 assessments, appeared to have stable mild severity scores in the range of 1 to 3 over
time, with one outlying assessment case receiving a severity score of 6. Because of the
small size of this class, these participants were dropped from further analyses. The four
remaining latent trajectory classes are shown in Figure 3.1. Participant chronological age
was restricted to a maximum of 10 years for graphical representation of the data, because
data for the 11-15 age span were sparse and thus less reliable. The four classes included a
persistent high severity class (Class 1: Persistent High; 46% of observed data in the
sample), a moderately severe class (Class 2: Persistent Moderate; 38%), a class that
tended to increase in ASD severity over time (Class 3: Worsening; 9%), and a class that
decreased in ASD severity over time (Class 4: Improving; 7%). The average probability
with which children were assigned to their best class was high for classes 1, 3, and 4
(0.82, 0.79 and 0.81 respectively), but was rather lower (0.68) for class 2 (Persistent
Moderate). The average probability that children assigned to this class might have
belonged to class 3 (Worsening) was not small (0.21). As suggested by our labeling,
70% of the Worsening class exhibited worsening scores, but the remaining 30% showed
53
variability across time, some of them “ending” on an improving score. By contrast, all
children assigned to the Improving group had most recent severity scores milder than
previous scores. Table 3.2 describes initial and final diagnostic measures and
demographic variables of the 339 participants assigned to the four latent classes. ADI-R
domain totals are reported as sums of “Current” scores of only those algorithm items
comparable across age groups at both initial and final assessment, in order to compare
stability or change over time by latent class. Trends in raw scores were observed to fall
(e.g., improve) slightly over time in Current Social-Communication scores on the ADI-R
and Social Affect scores on the ADOS, and to rise (e.g., worsen) slightly over time in
Restricted Repetitive Behavior scores across the first three classes. The Worsening class
was the only group to exhibit greater severity over time in any ADI-R Current domain
mean score (Verbal Communication and RRB). Not surprisingly, ADOS raw scores
(which highly influence the calibrated severity scores on which the model was based)
showed dramatic improvement in the Improving class alone.
Covariates as predictors of latent class membership
As shown in Table 3.2, gender, race, and nonverbal IQ did not significantly
predict latent class membership in multinomial logistic regression analyses of the
covariates at initial assessment. However, initial verbal IQ was a significant predictor:
higher verbal IQ predicted membership in the Improving, Worsening, and Moderate
classes over the Persistent High class. Relative risk ratios (RRR) were generated from
multinomial logistic regression analyses of the covariates; for this procedure, race and
gender were entered as binary predictors (0=Caucasian or Male; 1=Other Race or
Female), and verbal and nonverbal IQ scores were standardized. RRRs indicate the
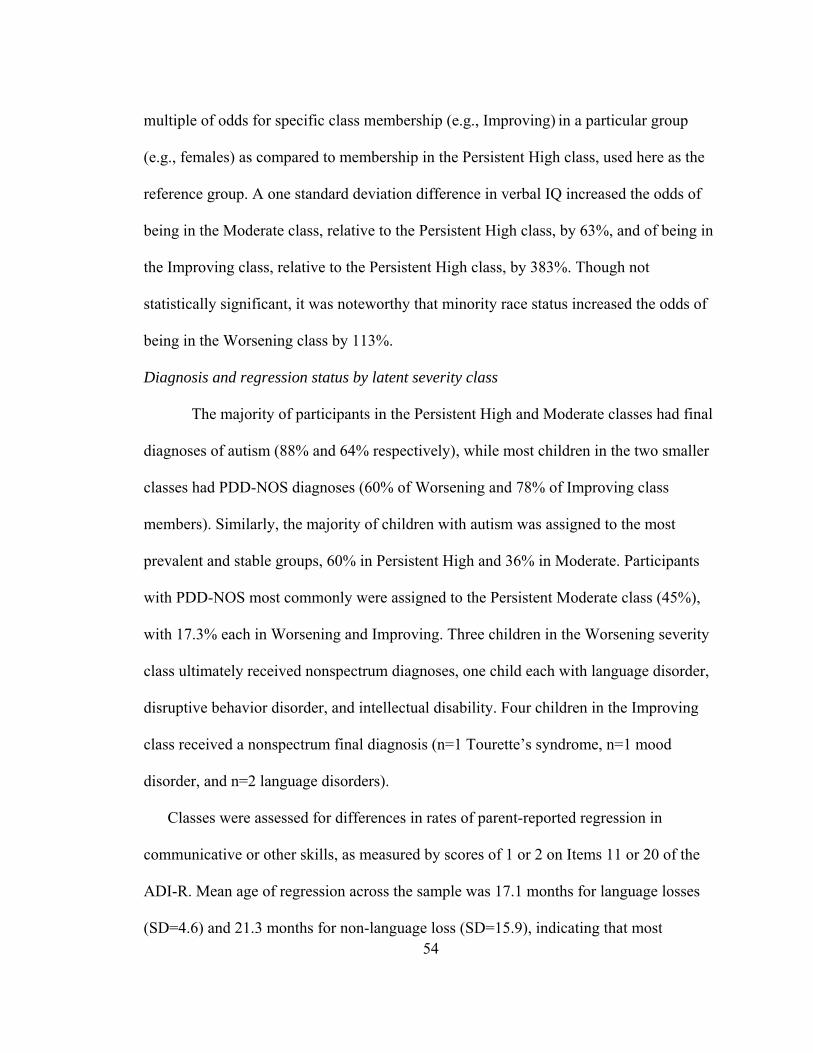
54
multiple of odds for specific class membership (e.g., Improving) in a particular group
(e.g., females) as compared to membership in the Persistent High class, used here as the
reference group. A one standard deviation difference in verbal IQ increased the odds of
being in the Moderate class, relative to the Persistent High class, by 63%, and of being in
the Improving class, relative to the Persistent High class, by 383%. Though not
statistically significant, it was noteworthy that minority race status increased the odds of
being in the Worsening class by 113%.
Diagnosis and regression status by latent severity class
The majority of participants in the Persistent High and Moderate classes had final
diagnoses of autism (88% and 64% respectively), while most children in the two smaller
classes had PDD-NOS diagnoses (60% of Worsening and 78% of Improving class
members). Similarly, the majority of children with autism was assigned to the most
prevalent and stable groups, 60% in Persistent High and 36% in Moderate. Participants
with PDD-NOS most commonly were assigned to the Persistent Moderate class (45%),
with 17.3% each in Worsening and Improving. Three children in the Worsening severity
class ultimately received nonspectrum diagnoses, one child each with language disorder,
disruptive behavior disorder, and intellectual disability. Four children in the Improving
class received a nonspectrum final diagnosis (n=1 Tourette’s syndrome, n=1 mood
disorder, and n=2 language disorders).
Classes were assessed for differences in rates of parent-reported regression in
communicative or other skills, as measured by scores of 1 or 2 on Items 11 or 20 of the
ADI-R. Mean age of regression across the sample was 17.1 months for language losses
(SD=4.6) and 21.3 months for non-language loss (SD=15.9), indicating that most
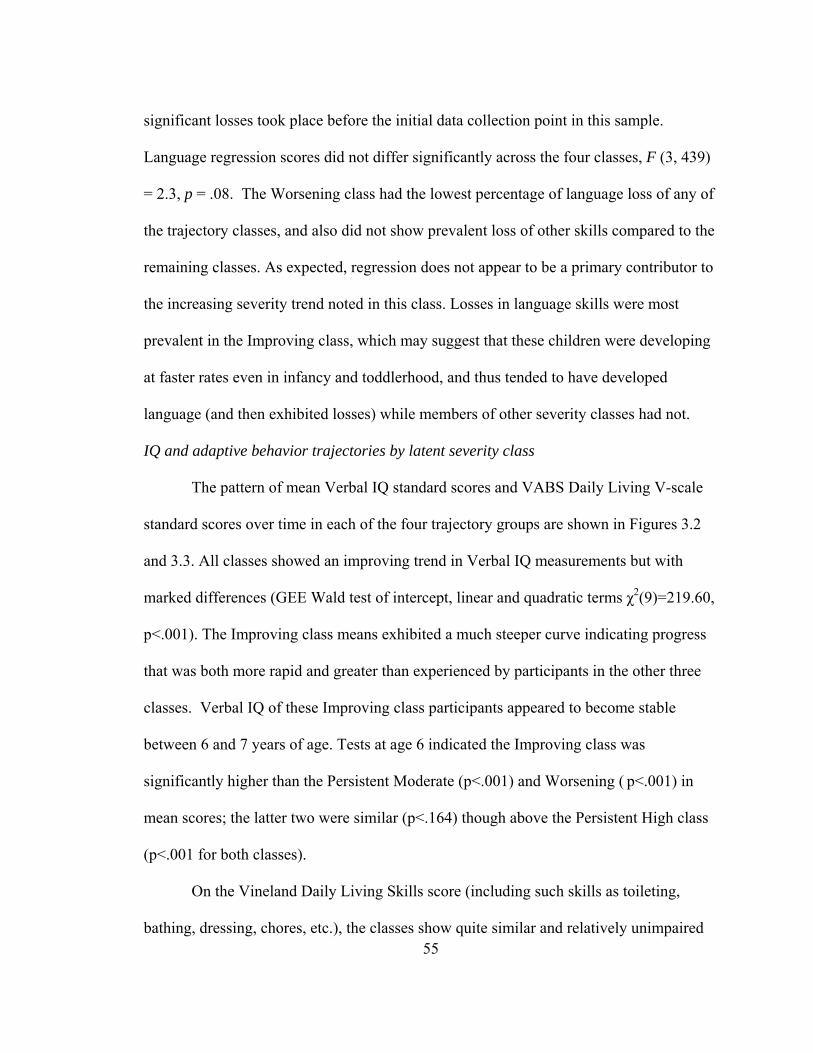
55
significant losses took place before the initial data collection point in this sample.
Language regression scores did not differ significantly across the four classes, F (3, 439)
= 2.3, p = .08. The Worsening class had the lowest percentage of language loss of any of
the trajectory classes, and also did not show prevalent loss of other skills compared to the
remaining classes. As expected, regression does not appear to be a primary contributor to
the increasing severity trend noted in this class. Losses in language skills were most
prevalent in the Improving class, which may suggest that these children were developing
at faster rates even in infancy and toddlerhood, and thus tended to have developed
language (and then exhibited losses) while members of other severity classes had not.
IQ and adaptive behavior trajectories by latent severity class
The pattern of mean Verbal IQ standard scores and VABS Daily Living V-scale
standard scores over time in each of the four trajectory groups are shown in Figures 3.2
and 3.3. All classes showed an improving trend in Verbal IQ measurements but with
marked differences (GEE Wald test of intercept, linear and quadratic terms χ2(9)=219.60,
p<.001). The Improving class means exhibited a much steeper curve indicating progress
that was both more rapid and greater than experienced by participants in the other three
classes. Verbal IQ of these Improving class participants appeared to become stable
between 6 and 7 years of age. Tests at age 6 indicated the Improving class was
significantly higher than the Persistent Moderate (p<.001) and Worsening ( p<.001) in
mean scores; the latter two were similar (p<.164) though above the Persistent High class
(p<.001 for both classes).
On the Vineland Daily Living Skills score (including such skills as toileting,
bathing, dressing, chores, etc.), the classes show quite similar and relatively unimpaired
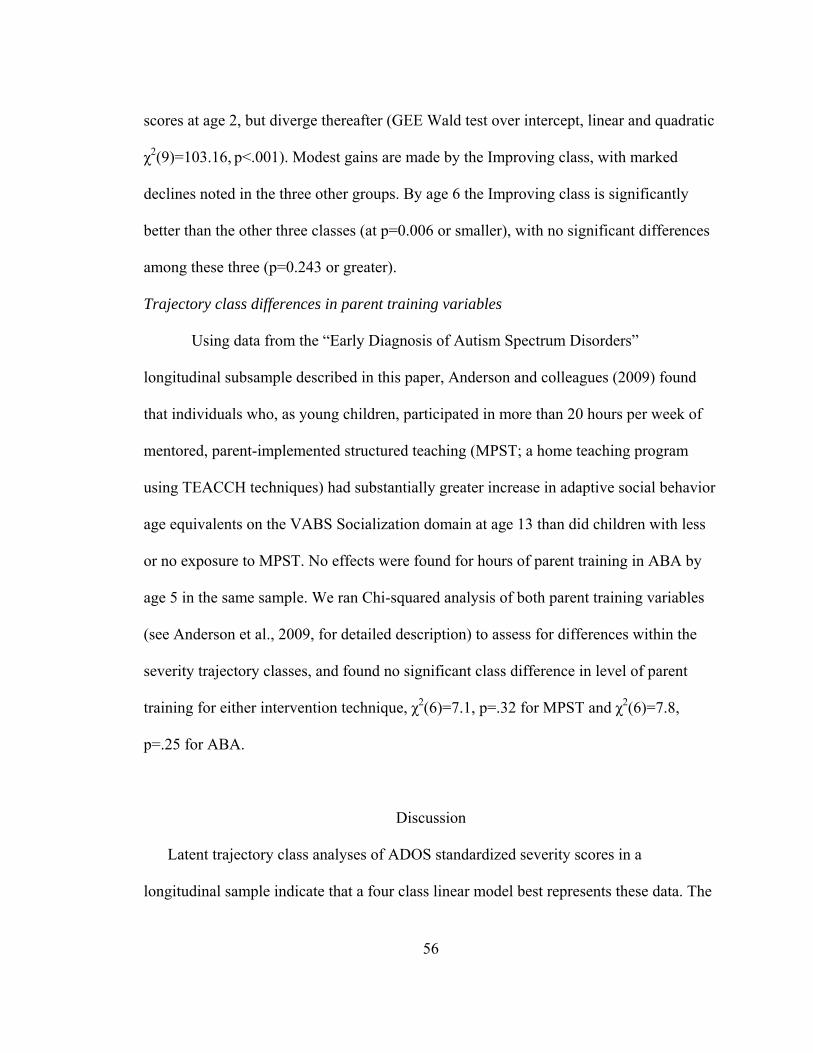
56
scores at age 2, but diverge thereafter (GEE Wald test over intercept, linear and quadratic
χ2(9)=103.16, p<.001). Modest gains are made by the Improving class, with marked
declines noted in the three other groups. By age 6 the Improving class is significantly
better than the other three classes (at p=0.006 or smaller), with no significant differences
among these three (p=0.243 or greater).
Trajectory class differences in parent training variables
Using data from the “Early Diagnosis of Autism Spectrum Disorders”
longitudinal subsample described in this paper, Anderson and colleagues (2009) found
that individuals who, as young children, participated in more than 20 hours per week of
mentored, parent-implemented structured teaching (MPST; a home teaching program
using TEACCH techniques) had substantially greater increase in adaptive social behavior
age equivalents on the VABS Socialization domain at age 13 than did children with less
or no exposure to MPST. No effects were found for hours of parent training in ABA by
age 5 in the same sample. We ran Chi-squared analysis of both parent training variables
(see Anderson et al., 2009, for detailed description) to assess for differences within the
severity trajectory classes, and found no significant class difference in level of parent
training for either intervention technique, χ2(6)=7.1, p=.32 for MPST and χ2(6)=7.8,
p=.25 for ABA.
Discussion
Latent trajectory class analyses of ADOS standardized severity scores in a
longitudinal sample indicate that a four class linear model best represents these data. The
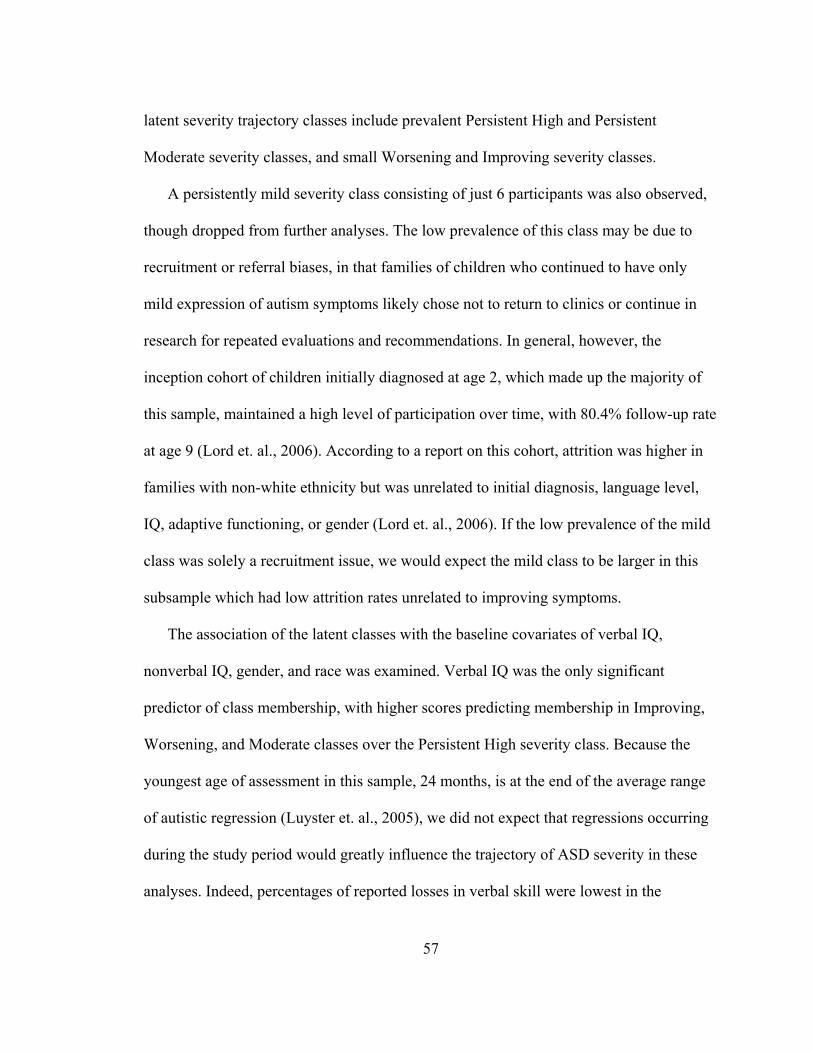
57
latent severity trajectory classes include prevalent Persistent High and Persistent
Moderate severity classes, and small Worsening and Improving severity classes.
A persistently mild severity class consisting of just 6 participants was also observed,
though dropped from further analyses. The low prevalence of this class may be due to
recruitment or referral biases, in that families of children who continued to have only
mild expression of autism symptoms likely chose not to return to clinics or continue in
research for repeated evaluations and recommendations. In general, however, the
inception cohort of children initially diagnosed at age 2, which made up the majority of
this sample, maintained a high level of participation over time, with 80.4% follow-up rate
at age 9 (Lord et. al., 2006). According to a report on this cohort, attrition was higher in
families with non-white ethnicity but was unrelated to initial diagnosis, language level,
IQ, adaptive functioning, or gender (Lord et. al., 2006). If the low prevalence of the mild
class was solely a recruitment issue, we would expect the mild class to be larger in this
subsample which had low attrition rates unrelated to improving symptoms.
The association of the latent classes with the baseline covariates of verbal IQ,
nonverbal IQ, gender, and race was examined. Verbal IQ was the only significant
predictor of class membership, with higher scores predicting membership in Improving,
Worsening, and Moderate classes over the Persistent High severity class. Because the
youngest age of assessment in this sample, 24 months, is at the end of the average range
of autistic regression (Luyster et. al., 2005), we did not expect that regressions occurring
during the study period would greatly influence the trajectory of ASD severity in these
analyses. Indeed, percentages of reported losses in verbal skill were lowest in the
58
Worsening class, indicating that the increase in ASD symptoms in this class was not the
same as that which parents report as regression.
Diagnostic differences also map onto severity trajectory classes. The majority of
participants in the Persistent High and Moderate classes had final diagnoses of autism,
and similarly the majority of children with autism were members of these classes. The
majority of children with PDD-NOS were assigned to the Persistent Moderate class. Most
children in the Worsening and Improving classes had PDD-NOS diagnoses. Only three
children in the Worsening severity class and four in the Improving class ultimately
received nonspectrum diagnoses. While there will always be children with unclear
clinical presentations, it is interesting to see how these difficult cases are represented in
ASD severity trajectories. The Worsening class as a whole may be thought of as an
unusual group, with a mixed presentation on both ADOS calibrated severity metric scores
(with the majority worsening but others variable) and current ADI-R domains (i.e.,
improving Social and Nonverbal Communication mean scores and slightly worsening
Verbal Communication and RRB scores). These trends warrant further exploration in
other datasets.
Again, by using calibration cells to derive the standardized ADOS scores, ‘autism
severity’ is defined only in relation to children of similar age and language ability, and is
therefore not a measure of functional impairment. However, the differences in IQ and
adaptive behavior noted across these trajectory classes (e.g., lowest IQ mean in the
Persistent High severity class) indicate that severity of autism characteristics continues to
be strongly linked to cognitive and adaptive functioning – at least in the forms of
measurement we have available.
59
We did not find class differences in TEACCH-based or ABA parent training hours by
age 5 in the longitudinal study subsample. Though Anderson and colleagues did note
effects of the TEACCH-based training on VABS social domain age equivalents at age 13,
they acknowledged that this was not a randomized controlled trial of this intervention.
Data were based on parent report of treatment or training received, with no checks on
quality or actual implementation of intervention. Further, children who are more severely
impaired tend to be enrolled in more hours of intervention, which may obscure treatment
effects in severity class analyses such as this one. Future examination of trajectory class
differences in carefully controlled intervention data is needed.
Limitations
All longitudinal data available in the UMACC database were used in this sample,
including an inception cohort assessed at ages 2, 3, 5, and 10, as well as clinic patients
and research participants with multiple ADOS administrations over time. Though the
inception cohort comprised the majority of the sample, we would expect caregivers of
clinic patients to self-refer for repeated evaluations more often in the case of persistently
severe autism characteristics. Therefore we would expect the high and moderate severity
groups to be more prevalent due to recruitment or referral bias, as was observed.
Similarly, because they were identified at early ages despite a historical context of limited
public awareness of ASD, the group of children comprising the inception cohort is likely
to have lower IQ and higher ADOS scores (e.g., a more severe sample; Richler, Bishop,
Kleinke, & Lord, 2007) than samples diagnosed at age 2 in more recent years. Thus the
present sample is likely skewed toward higher average severity than we would expect to
see in a population cohort. For a related discussion of the representativeness of the
60
sample used in the ADOS severity score standardization, see Gotham et al., 2009. Other
limitations include the possibility that changing to a more demanding language-based
ADOS module may artificially inflate an individual’s severity score, though evidence for
this has not been apparent in our samples.
Conclusions
Insight into the direction, magnitude, and age periods associated with ASD severity
changes would aid clinical prognostic estimates and the study of developmental trajectory
of these disorders. However, more longitudinal and epidemiological research is needed to
distinguish the appearance of ASD severity subgroups from the developmental
differences of samples tested at different ages. Before these trajectory class findings can
inform research and clinical practice, it is crucial that analyses be replicated in large
datasets with less recruitment bias, such as the longitudinal Pathways Study in Canada
that follows all children with ASD diagnoses in a given province (Szatmari et. al., 2010),
or the epidemiological dataset associated with the Autism and Developmental Disabilities
Monitoring (ADDM) Network (Centers for Disease Control, 2006). Future directions
include exploration of the effects of other risk variables on class membership, as well as
study of the association between trajectory classes and distal outcomes such as academic
placement and peer relationships. Further evidence for multiple ‘autisms’ (DeLong, 1999;
Morrow et. al., 2008; Pelphrey, Adolphs, & Morris, 2004) may lead to inclusion of
severity trajectories as an aspect of ASD phenotyping.
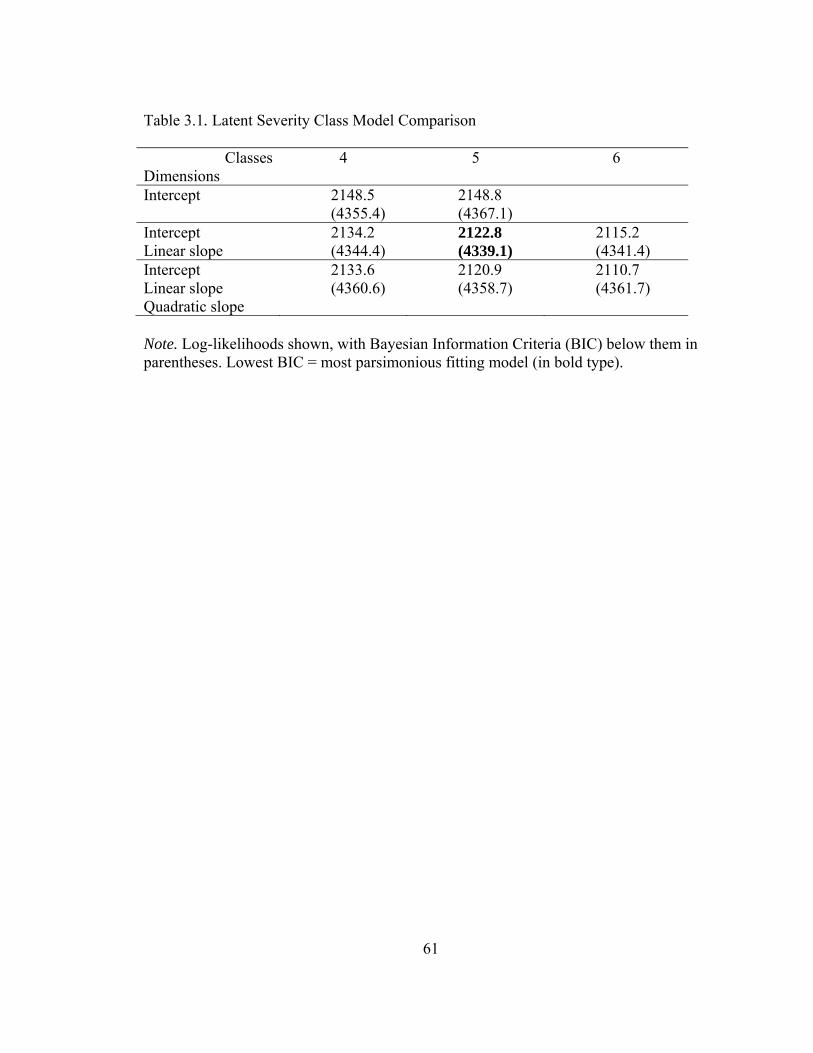
61
Table 3.1. Latent Severity Class Model Comparison
Classes Dimensions
4 5 6
Intercept 2148.5 (4355.4)
2148.8 (4367.1)
Intercept Linear slope
2134.2 (4344.4)
2122.8 (4339.1)
2115.2 (4341.4)
Intercept Linear slope Quadratic slope
2133.6 (4360.6)
2120.9 (4358.7)
2110.7 (4361.7)
Note. Log-likelihoods shown, with Bayesian Information Criteria (BIC) below them in parentheses. Lowest BIC = most parsimonious fitting model (in bold type).
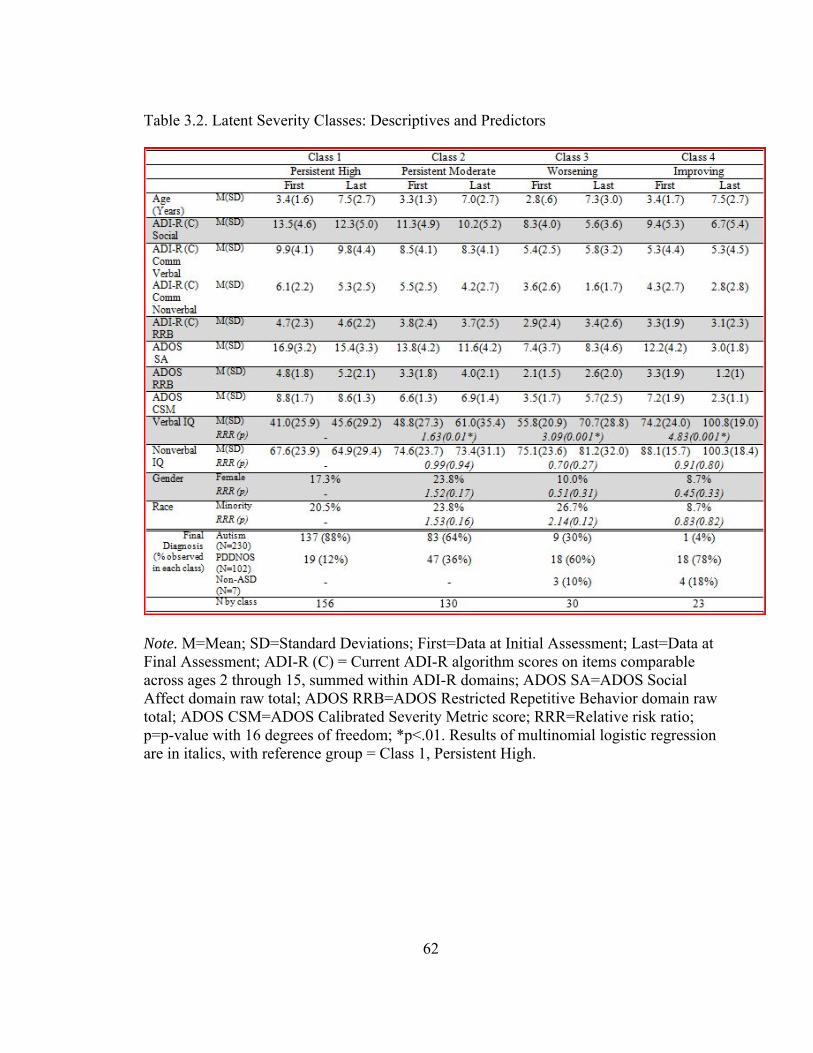
62
Table 3.2. Latent Severity Classes: Descriptives and Predictors
Note. M=Mean; SD=Standard Deviations; First=Data at Initial Assessment; Last=Data at Final Assessment; ADI-R (C) = Current ADI-R algorithm scores on items comparable across ages 2 through 15, summed within ADI-R domains; ADOS SA=ADOS Social Affect domain raw total; ADOS RRB=ADOS Restricted Repetitive Behavior domain raw total; ADOS CSM=ADOS Calibrated Severity Metric score; RRR=Relative risk ratio; p=p-value with 16 degrees of freedom; *p<.01. Results of multinomial logistic regression are in italics, with reference group = Class 1, Persistent High.
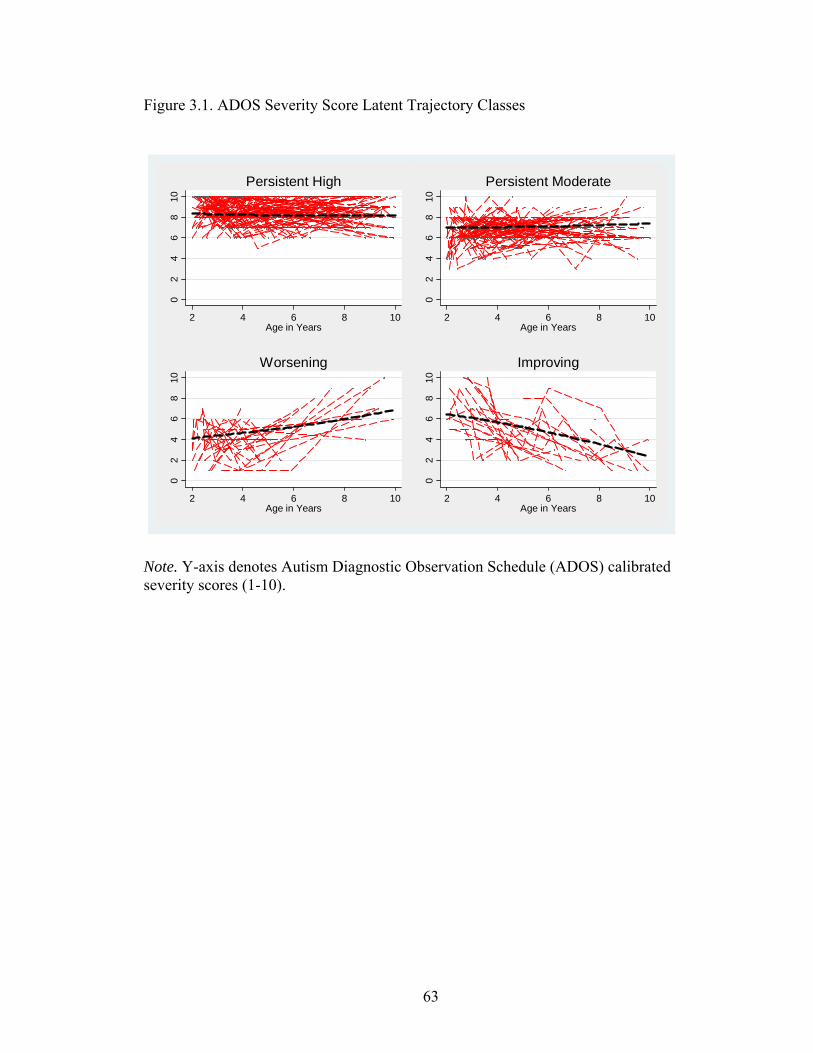
63
Figure 3.1. ADOS Severity Score Latent Trajectory Classes
02
46
810
2 4 6 8 10Age in Years
Persistent High
02
46
810
2 4 6 8 10Age in Years
Persistent Moderate0
24
68
10
2 4 6 8 10Age in Years
Worsening
02
46
810
2 4 6 8 10Age in Years
Improving
Note. Y-axis denotes Autism Diagnostic Observation Schedule (ADOS) calibrated severity scores (1-10).
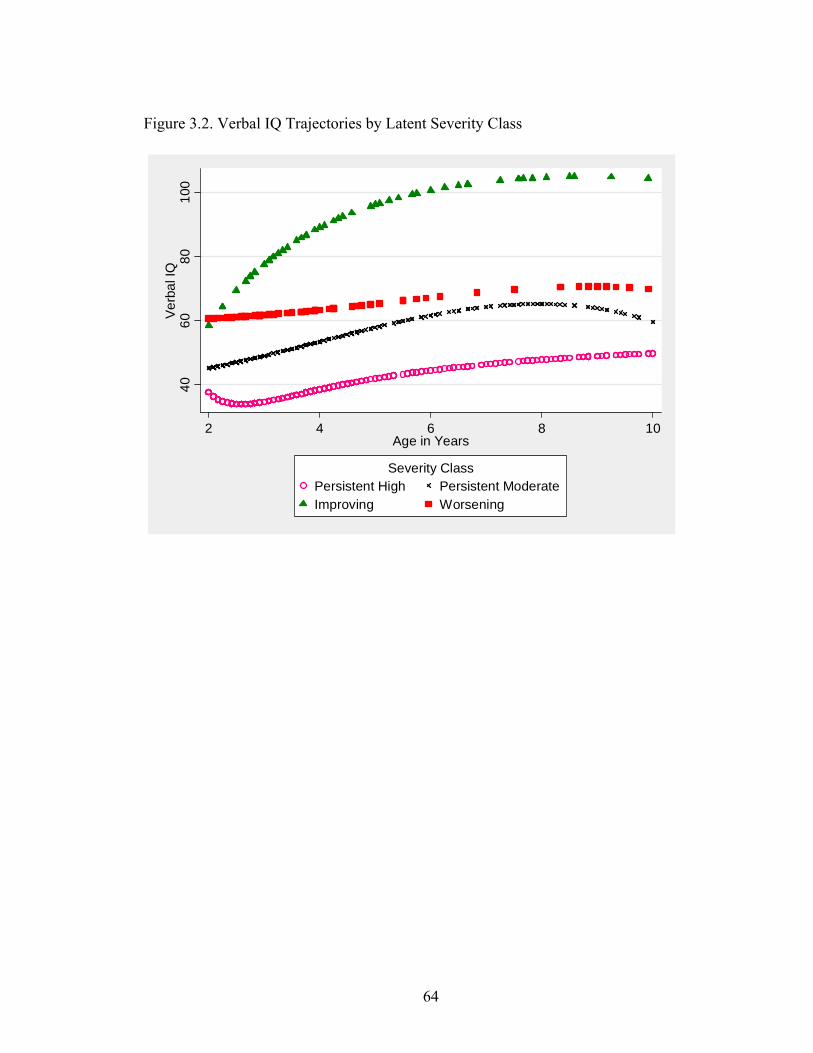
64
Figure 3.2. Verbal IQ Trajectories by Latent Severity Class
4060
8010
0V
erba
l IQ
2 4 6 8 10Age in Years
Persistent High Persistent ModerateImproving Worsening
Severity Class
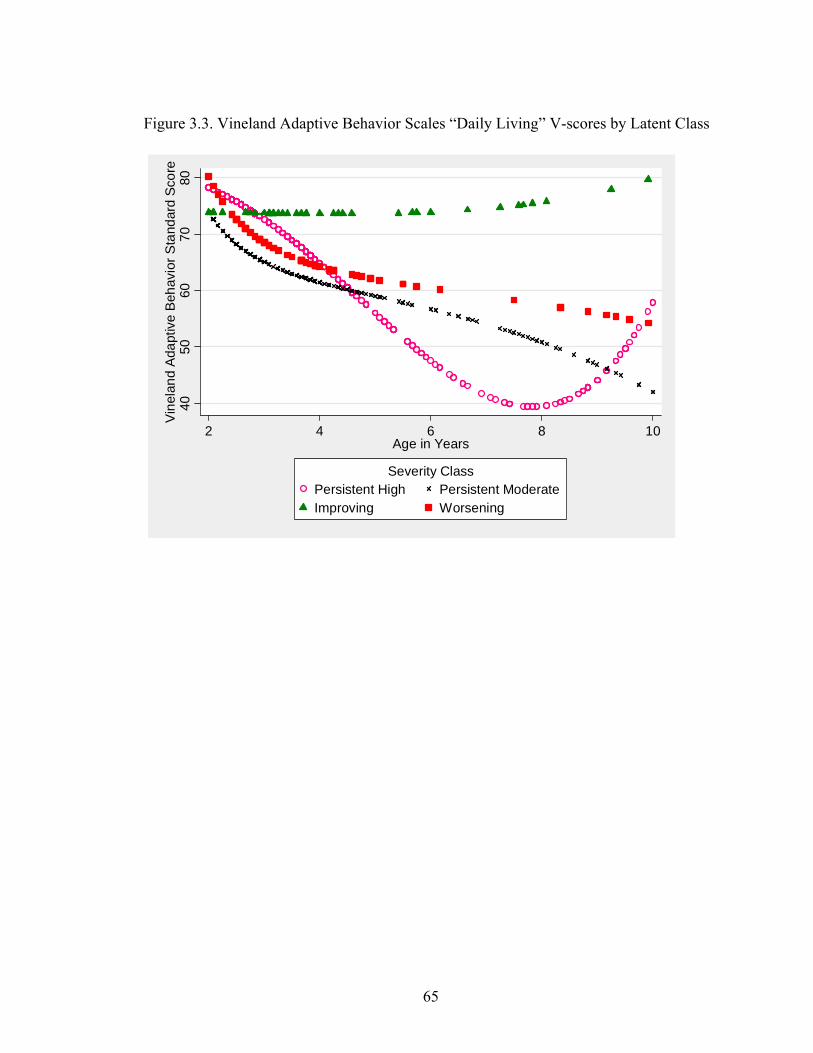
65
Figure 3.3. Vineland Adaptive Behavior Scales “Daily Living” V-scores by Latent Class
4050
6070
80V
inel
and
Ada
ptiv
e B
ehav
ior S
tand
ard
Scor
e
2 4 6 8 10Age in Years
Persistent High Persistent ModerateImproving Worsening
Severity Class
66
References
American Psychiatric Association (1994). Diagnostic and Statistical Manual of Mental
Disorders, 4th ed. Washington, DC: APA Press. Anderson, D., Lord, C., Risi, S., DiLavore, P., Shulman, C., Thurm, A., Welch, K., &
Pickles, A. (2007). Patterns of growth in verbal abilities among children with autism spectrum disorder. Journal of Consulting and Clinical Psychology, 75(4), 594-604.
Anderson, D., Oti, R., Lord, C., & Welch, K. (2009). Patterns of growth in adaptive
social abilities among children with autism spectrum disorders. Journal of Abnormal Child Psychology, 37, 1019-1034.
Billstedt, E., Gillberg, C., & Gillberg, C. (2007). Autism in adults: symptom patterns and
early childhood predictors. Use of the DISCO in a community sample followed from childhood. Journal of Child Psychology and Psychiatry, 48(11), 1102-1110.
Bishop, S. L., Richler, J. & Lord, C. (2006). Association between restrictive and
repetitive behaviors and nonverbal IQ in children with autism spectrum disorders. Child Neuropsychology, 12, 247-67.
Charman, T., Taylor, E., Drew, A., Cockerill, H., Brown, J., & Baird, G. (2005).
Outcome at 7 years of children diagnosed with autism at age 2: predictive validity of assessments conducted at 2 and 3 years of age and pattern of symptom change over time. Journal of Child Psychology and Psyciatry, 46(5), 500-513.
Cederlund, M., Hagberg, B., Billstedt, E., Gillberg, I.C., & Gillberg, C. (2008). Asperger
syndrome and autism: A comparative longitudinal follow-up study more than 5 years after original diagnosis. Journal of Autism and Developmental Disorders, 38, 72-85.
Center for Disease Control (2006). Prevalence of autism spectrum disorders – Autism
and developmental disabilities monitoring network, United States, 2006. Morbidity and Mortality Weekly Report, 58, 1-20.
Constantino, J.N., Gruber, C.P., Davis, S., Hayes, S., Passanante, N., & Przybeck, T.
(2004). The factor structure of autistic traits. Journal of Child Psychology and Psychiatry, 45 (4), 719-726.
67
De Bildt, A., Sytema, S., Ketelaars, C., Kraijer, D., Mulder, E., Volkmar, F., & Minderaa, R. (2004). Interrelationship between autism diagnostic observation schedule-generic (ADOS-G), autism diagnostic interview-revised (ADI-R), and the diagnostic and statistical manual of mental disorders (DSM-IV-TR) classification in children and adolescents with mental retardation. Journal of Autism and Developmental Disorders, 34(2), 129-137.
DeLong, G. R. (1999). Autism: New data suggest a new hypothesis. Neurology, 52, 911–
916. DiLavore, P.C., Lord, C., & Rutter, M. (1995). The Pre-Linguistic Autism Diagnostic
Observation Schedule. Journal of Autism and Developmental Disorders, 25, 355-379.
Eaves, L. & Ho, H. (1996). Brief report: Stability and change in cognitive and behavioral
characteristics of autism through childhood. Journal of Autism and Developmental Disorders, 26(5), 557-569.
Eaves, L. & Ho, H. (2008). Young adult outcome of autism spectrum disorders. Journal
of Autism and Developmental Disorders, 38, 739-747. Elliot, C. D. (1990). Differential abilities scale (DAS). San Antonio, TX: Psychological
Corporation. Farley, M.A., McMahon, W., Fombonne, E., Jenson, W., Miller, J., Gardner, M., et al.
(2009). Twenty-year outcome for individuals with autism and average or near-average cognitive abilities. Autism Research, 2(2), 109-118.
Gabriels, R., Hill, D., Pierce, R., Rogers, S., & Wehner, B. (2001). Predictors of
treatment outcome in young children with autism: A retrospective study. Autism, 5(4), 407-429.
Gotham, K., Pickles, A., Lord, C. (2009). Standardizing ADOS scores for a measure of
severity in autism spectrum disorders. Journal of Autism and Developmental Disorders, 39(5), 693.
Gotham, K., Risi, S., Pickles, A., & Lord, C. (2007). The Autism Diagnostic Observation
Schedule (ADOS): Revised algorithms for improved diagnostic validity. Journal of Autism and Developmental Disorders, 37, 400-408.
Gotham, K., Risi, S., Dawson, G., Tager-Flusberg, H., Joseph, R., Carter, A., et al.
(2008). A replication of the Autism Diagnostic Observation Schedule (ADOS) revised algorithms. Journal of the American Academy of Child and Adolescent Psychiatry, 47(6), 643-651.
68
Howlin, P., Mawhood, L., & Rutter, M. (2000). Autism and developmental receptive
language disorder—a follow up comparison in early adult life: Social, behavioural, and psychiatric outcomes. Journal of Child Psychology and Psychiatry, 41(5), 561-578.
Joseph, R.M., Tager-Flusberg, H., & Lord, C. (2002). Cognitive profiles and social-
communicative functioning in children with autism spectrum disorder. Journal of Child Psychology and Psychiatry and Allied Disciplines, 43(6), 807-821.
Lord, C. (1995). Follow-up of two-year-olds referred for possible autism. Journal of
Child Psychology and Psychiatry and Allied Disciplines, 36(8), 1365. Lord, C., Risi, S., DiLavore, P., Shulman, C., Thurm, A., & Pickles, A. (2006). Autism
from 2 to 9 years of age. Archives of General Psychiatry, 63(6), 694-701. Lord, C., Risi, S., Lambrecht, L., Cook, E.H. Jr., Leventhal, B.L., DiLavore, P.C., et al.
(2000). The Autism Diagnostic Observation Schedule-Generic: A standard measure of social and communication deficits associated with the spectrum of autism. Journal of Autism and Developmental Disorders, 30, 205-223.
Luyster, R., Gotham, K., Guthrie, W., Coffing, M., Petrak, R., Pierce, K., Bishop, S.,
Esler, A., Hus, V., Richler, J., Risi, S., & Lord, C. (2009). The Autism Diagnostic Observation Schedule -- Toddler Module: A new module of a standardized diagnostic measure for ASD. Journal of Autism and Developmental Disorders, 39(9), 1305-1320.
Luyster, R., Richler, J., Risi, S., Hsu, W., Dawson, G., Bernier, R. et al. (2005). Early
regression in social communication in autism spectrum disorders: A CPEA study. Developmental Neuropsychology, 27(3), 311–336.
Matson, J. (2007). Determining treatment outcome in early intervention programs for
autism spectrum disorders: A critical analysis of measurement issues in learning based interventions. Research in Developmental Disabilities, 28, 207-218.
Mawhood, L., Howlin, P., & Rutter, M. (2000). Autism and developmental receptive
language disorder—a comparative follow-up in early adult life. I: cognitive and language outcomes. Journal of Child Psychology and Psychiatry, 41(5), 547-559.
McGovern, C.W., & Sigman, M. (2005). Continuity and change from early childhood to
adolescence in autism. Journal of Child Psychology and Psychiatry, 46(4), 401-408.
69
Morrow, E., Yoo, S.Y., Flavell, S., et al. (2008). Identifying autism loci and genes by tracing recent shared ancestry. Science, 321, 218-223.
Mullen, E. (1995). Mullen Scales of Early Learning. AGS ed. Circle Pines, MN:
American Guidance Service. Pelphrey, K., Adolphs, R., Morris, J. (2004). Neuroanatomical substrates of social
cognition dysfunction in autism. Mental Retardation and Developmental Disabilities Research Reviews, 10, 259-271.
Pickles, A. & Croudace, T. (in press). Latent mixture models for multivariate and
longitudinal outcomes. Statistical Methods in Medical Research. Piven, J., Harper, J., Palmer, P., & Arndt, S. (1996). Course of behavioral change in
autism: A retrospective study of high-IQ adolescents and adults. Journal of the American Academy of Child and Adolescent Psychiatry, 35(4), 523-529.
Rabe-Hesketh, S., Skrondal, A., & Pickles, A. (2004). Theory and methods. Generalized
multi-level structural equation modeling. Psychometrika, 69(2), 167. Richler, J., Bishop, S., Kleinke, J., & Lord, C. (2007). Restricted and repetitive behaviors
in young children with autism spectrum disorders. Journal of Autism and Developmental Disorders, 37, 73-85.
Robertson, J.M., Tanguay, P.E., L’Ecuyer, S., Sims, A., & Waltrip, C. (1999). Domains
of social communication handicap in autism spectrum disorder. Journal of the American Academy of Child and Adolescent Psychiatry, 38(6), 738-745.
Rutter, M., Le Couteur, A., & Lord, C. (2003). Autism Diagnostic Interview-Revised –
WPS (WPS ed.). Los Angeles: Western Psychological Services. Seltzer, M., Shattuck, P., & Abbeduto, L. (2004). Trajectory of development in
adolescents and adults with autism. Mental Retardation and Developmental Disabilities Research Reviews, 10(4), 2004, 234-247.
Schopler, E., Reichler, R., & Renner, B. (1986). The childhood autism rating scale
(CARS) for diagnostic screening and classification of autism. Part of the series Diagnosis and teaching curricula for autism and developmental disabilities. New York: Irvington.
Sigman, M. & McGovern, C.W. (2005). Improvement in cognitive and language skills
from preschool to adolescence in autism. Journal of Autism and Developmental Disorders, 35(1), 15-23.
70
Sparrow, S., Balla, D., & Cicchetti, D. (1984). Vineland Adaptive Behavior Scales. Circle
Pines, Minnesota: American Guidance Service. Sparrow, S. S., Cicchetti, D. V., & Balla, D. A. (2005). Vineland Adaptive Behavior
Scales (2nd ed.). Circle Pines, MN: American Guidance Service Inc. Starr, E., Szatmari, P., Bryson, S., & Zwaigenbaum, L. (2003). Stability and change
among high-functioning children with pervasive developmental disorders: A 2-year outcome study. Journal of Autism and Developmental Disorders, 33(1), 15-22.
StataCorp (2007) Stata Statistical Software: Release 10.0. Stata Corporation, College
Station, TX. Szatmari, P., Bryson, S., Fombonne, E., Mirenda, P., Roberts, W., Smith, I., Vaillancourt,
T., Volden, J., Waddell, C., Zwaigenbaum, L., & Pathways in ASD Study Team (personal communication, 2010). Pathways in ASD Study.
Turner, L. & Stone, W. (2007). Variability in outcome for children with an ASD
diagnosis at age 2. Journal of Child Psychology and Psychiatry, 48(8), 793-802. Turner, L., Stone, W., Pozdol, S., & Coonrod, E. (2006). Follow-up of children with
autism spectrum disorders from age 2 to age 9. Autism, 10(3), 243–265.
71
Chapter IV
Effects of Insight and Social Participation on Depressive Symptoms in ASD
Depression is a pervasive public health concern affecting over 5% of adults in the
U.S. at any one time and almost 16% across lifetimes (CDC, 2008). The disorder is
associated with physical morbidity and consumes a great deal of health care resources
(Greenberg et al., 2003). Loneliness and lack of social connectedness have been shown
to predict depression in typically developing populations (Williams & Galliher, 2006;
Cacioppo, Hughes, Waite, Hawkley, & Thisted, 2006). Behavioral characteristics that
lead individuals to be regarded as odd or different may lead to rejection, loneliness, and
poor self-esteem (Sletta, Valas, & Skaalvik, 1996), in turn placing such individuals at
increased risk for depression. Individuals with social impairments like those common to
autism spectrum disorders, then, are likely at elevated risk for this disabling disorder.
Autism spectrum disorders (ASD) include diagnoses of autism, Asperger
syndrome, and Pervasive Developmental Disorder – Not Otherwise Specified. An ASD
significantly impedes an individual’s ability to negotiate reciprocal social interactions
(Howlin, Goode, Hutton, & Rutter, 2004; Lord et al., 2000). Perhaps for this reason, ASD
has been linked to depression historically. A child described in Kanner’s original
observation of autism had a tendency to lapse into a “momentary fit of depression”
(Kanner, 1943). Children described by Asperger (1944) had features that raise the
possibility of disrupted mood, such as irritability and blunted affect.
72
Prevalence of depression in ASD
Though depressive symptoms are not a central or specific feature of ASD, more
rigorous study of depression in this population is necessitated by prevalence estimates.
Although population-based studies of psychiatric comorbidity in ASD have not been
undertaken, there is evidence from clinic-based and community studies that depression
and anxiety disorders are common across the lifespan (Howlin, 2000; Kim, Szatmari,
Bryson, Streiner, & Wilson, 2000; Leyfer et al., 2006). Prevalence estimates vary, with
reported rates of 10% (Leyfer et al., 2006), 17% (Kim et al., 2000), 30% (Wing, 1981),
37% (Ghaziuddin, Weidmer-Mikhail, & Ghaziuddin, 1998), 41% (Howlin, 2000), and
58% (Lainhart, 1999). Stewart and colleagues (2006) summarized depression as
occurring in 4 – 34% of ASD samples they reviewed, a range encompassing much higher
rates than those in the general population. Brereton and colleagues (2006) found that
depressive symptoms were significantly higher in their sample of 381 individuals with
ASD (aged 4-24) versus 550 similarly-aged individuals with Intellectual Disability,
indicating that developmental disability alone might not account for the high prevalence
of these comorbid symptoms in the ASD population.
Many studies have replicated the existence of a large subgroup within the autism
spectrum that has a high incidence of familial mood disorders (documented prior to the
birth of a child with special needs), suggesting the two families of disorders are related
clinically and genetically (DeLong, 2004). Continued research on depression in ASD is
crucial in order to draw comparisons between brain structure and function in individuals
with these disorders and to account for high rates of prevalence and heritability. Related
73
findings should impact our ability to improve quality of life in individuals who suffer
with both types of disorders.
Presentation of depression in ASD
Characteristics of autism can complicate observation of, and eventual diagnosis
based on, depressive symptoms. A number of typical symptoms of depression to the
general population have been identified in cases with comorbid ASD, including notably
decreased self care (Clarke, Baxter, Perry, & Prasher, 1999; Wing, 1981), loss of interest
in activities (Clarke, Littlehouse, Corbett, & Joseph, 1989; Gillberg, 1985), and
psychomotor retardation (Ghaziuddin & Tsai, 1991). Other common symptoms of
depression, such as those related to appetite, sleep, communication of affect through
facial expression or intonation, and ability to concentrate, are easily masked by pre-
existing symptoms of autism (Stewart et al., 2006). Feelings of worthlessness or guilt are
not frequently reported in the ASD population (Stewart et al., 2006), perhaps due in part
to difficulties with self-report (discussed later). Informal case studies provide a limited
number of reports of suicidal behavior, primarily in adults with ASD as opposed to more
narrowly defined autism (Ghaziuddin, 2005; Wachtel, Griffin, & Reti, 2010).
Ghaziuddin indexes possible depressive symptoms specific to or more common in ASD,
such as irritability, increase in social withdrawal beyond what is normal for that
individual, a change in the character of obsessions (with fixations taking on a more
morbid tone), and an increase in compulsive behavior (Ghaziuddin, 2005).
The presentation of depression in ASD also depends on age, level of intelligence,
and level of verbal skills. While depression or depressive symptoms can occur across the
entire autism spectrum (Stewart et al., 2006), individuals who have more verbal skills or
74
milder ASD symptoms seem to be either particularly affected or more easily identified
(Cederlund, Hagberg, & Gillberg, 2009; Hurtig et al., 2009). Many standard diagnostic
measures require verbal self-report and rely on both the insight to recognize symptoms
and the verbal aptitude to describe them. Thus, more able ASD clients can better report a
history of depressed mood and loss of interest in previously enjoyed activities. In their
sample of 46 individuals with ASD aged 18 to 44, Sterling and colleagues found that the
43% of participants who endorsed significant levels of past or current depressive
symptoms tended to have higher cognitive abilities and less social impairment (as
measured by the Autism Diagnostic Observation Schedule; Lord et al., 2000) than did the
overall sample (Sterling, Dawson, Estes, & Greenson, 2008). Several other authors have
noted that depression was the most common co-occurring disorder in adolescent and
adult samples with Asperger syndrome (n=35; Ghaziuddin et al., 1998) and other more
able autism spectrum diagnoses (MA-ASD; N=74 from 8 studies; Howlin, 2000). Even
then, the incidence of depression is thought to be underreported in MA-ASD
(Ghaziuddin, Ghaziuddin, & Greden, 2002).
Risk factors for depression in ASD
Higher depression rates in the More Able ASD population usually are linked to
better verbal self-report ability as discussed above. Alternatively, Ghaziuddin et al.
speculated that individuals with greater cognitive ability may in fact be more likely to
suffer from depression than others with ASD due to greater awareness of their social
deficits and greater desire for social connection (Ghaziuddin et al., 2002). Studies of
individuals with schizophrenia have found that greater insight into one’s diagnosis and
impairments is related to higher rates of depression (Mutsatsa et al., 2006). In a sample of
75
22 children with ASD aged 7-13, Vickerstaff and colleagues noted that higher
chronological age and IQ was associated with higher levels of insight into social skill
impairments, and that low perceived social competence was associated with higher levels
of depressive symptoms (Vickerstaff, Heriot, Wong, Lopes, & Dossetor, 2007). Previous
research suggests both that the desire for social relations increases markedly in many
individuals with ASD by adolescence and early adulthood (McGovern & Sigman, 2005),
and simultaneously, individuals develop heightened awareness of social isolation within
this age period (Ghaziuddin, Alessi & Greden, 1995). It is not surprising, then, that
depression in autism also tends to increase with age (Cederlund et al, 2009; Vickerstaff et
al., 2007). Thus, while higher verbal and/or cognitive abilities are associated with many
positive outcomes (e.g., better academic achievement), they are not necessarily protective
of the emotional well-being of people with ASD.
Adolescents and adults seem to be at particular risk, with reports of elevated rates
of loneliness (Lasgaard, Nielsen, Eriksen, & Goossens, 2010; Bauminger & Kasari, 2000)
and self-perception of low peer approval and high social incompetence (Hedley &
Young, 2006; Williamson, Craig, & Slinger, 2008) compared to typical peers. Although
several studies have reported that a significant minority of more able young adults and
adolescents with ASD have friends (Bauminger & Kasari, 2000; Baron-Cohen &
Wheelwright, 2003), findings unanimously suggest that there are differences in both the
number and quality of these relationships (Bauminger & Shulman, 2003). Howlin and
colleagues (2004) reported that, of 21 to 48-year-olds with ASD, about one-quarter
reported having only one friendship with some intimacy and shared enjoyment, and more
than half reported having no friendship-like relationships at all.
76
Anxiety is another potential link between ASD and depression. Though there are
few systematic investigations, Lainhart’s review (1999) states that up to 84 % of children
and adults with autism are reported to have at least one type of anxiety (e.g., social
anxiety, separation anxiety). She notes that anxiety is so common in ASD that a separate
diagnosis of an anxiety disorder often is not given, even in the face of very obvious and
impairing symptoms. Clinical levels of anxiety are especially common in the MA-ASD
population, again attributed to increased awareness of impairment (Howlin, 2000; Kim et
al., 2000; Lainhart, 1999; Tantam, 1991). Anxiety is likely associated with depression
within ASD as has been established in the general population (Gaynes et al., 1999).
Therefore we will collect data on anxiety symptoms in our sample, though we focus on
depressive symptoms as the primary outcome within this dissertation project.
Challenges in assessing depression in ASD
Despite the pressing need for research into ASD and comorbid depression,
progress is complicated by obstacles to assessing depressive symptoms in individuals
with ASD. Assessment of most depression criteria in the general population relies on
communication skills often absent or abnormal in ASD. Additionally, even those with
relatively well-developed language often have difficulty expressing feeling or mood
states and fail to use abstract concepts or metaphors (Perry, Marston, Hinder, Munden, &
Roy, 2001). Individuals on the autism spectrum tend to perceive, remember, and interpret
both social and nonsocial information differently, and often exhibit limited insight and
perspective-taking skill (Johnson, Filliter, & Murphy, 2009; Hedley & Young, 2006;
Stewart et al., 2006; Beebe & Risi, 2003; Blackshaw, Kinderman, Hare & Hatton, 2001;
Hare, 1997). In a 2004 paper by Hill, Berthoz, and Frith, 27 adults with high-functioning
77
autism, or HFA (i.e., ASD and IQ>70), had much more difficulty identifying and
describing feelings, and had more externally oriented thinking, than did 35 adult controls
and 47 ASD family members. Almost 85% of the ASD group fell in the slightly or
severely impaired ranges on the Toronto Alexithymia Scale, a questionnaire that
operationalizes deficiency in understanding, processing, and/or describing emotions,
whereas 79-83% of the control groups fell in the nonimpaired range on this measure.
Validity of depression diagnosis likely is compromised when individuals with
ASD do not have sufficient ability to communicate about abstractions in order to describe
their internal states (Costello, Egger, & Angold, 2005). Despite the implied difficulty of
reporting on their feelings, however, the ASD group in the Hill et al. sample endorsed
high levels of depressive symptoms on the Beck Depression Inventory (BDI-II; Beck,
1996), with 75% meeting clinical cut-offs for depressive concern versus 27% of the
relatives and 17% of the typical controls. In a 2009 study by Cederlund and colleagues,
scores on the Beck Depression Inventory (BDI) were consistent with clinical diagnoses of
depression in a sample of 76 young men with Asperger syndrome. This is a promising
start, though validation studies of commonly used depression inventories and interviews
are needed in ASD samples.
Treatment
Families and clinicians clearly acknowledge the need for depression treatment for
individuals with ASD. One indication of this is the very high rate of psychotropic
medication use in the ASD population (Esbensen, Greenberg, Seltzer, Aman, 2009;
Aman, Lam, & Collier-Crespin, 2003). Though in many cases selective serotonin
reuptake inhibitors (SSRIs) are prescribed in an attempt to reduce repetitive behavior or
78
anxiety over insistence on sameness in routines, this family of drugs also is used
commonly for the purpose of treating depressive symptoms in adolescents and adults
with ASD. Reportedly over 50% of individuals with MA-ASD take such medication for
the purpose of treating mood and anxiety disorders (Ghaziuddin et al., 2002). Despite its
prevalent use, few if any randomized controlled studies exist exploring the effectiveness
of psychotropic medication in treating depressive disorders in individuals with ASD
(Gerhard, Chavez, Olfsun, & Crystral, 2009).
Young people with MA-ASD have been supported in achieving better outcomes
in terms of employment and partial independence than were observed in previous decades
(Howlin et al., 2004); it is ironic that, by including individuals with ASD in the
community and helping them to develop more insight into the social world, we may
perhaps be increasing their risk for depressive symptoms. The field of autism research
and clinical work has an important challenge ahead to support positive outcomes in the
mental health, well-being, and social networks of these individuals, in addition to
continuing to build opportunities for independent living and jobs. Fortunately,
interventions to improve social contact and support networks are becoming more well-
established (e.g., Laugeson, Frankel, Mogil, & Dillon, 2009). With adequate study of the
social mechanisms contributing to or protecting against depressive symptoms in ASD, we
may find evidence of the need for relatively simple treatments to complement or reduce
the need for multiple medications to address depression in ASD.
Psychosocial pathways to depression in ASD
The purpose of this project is to examine psychosocial mechanisms that may
impact the development of depression in adolescents and adults with MA-ASD. To our
79
knowledge, no previous studies have examined the direct relationship between insight
into social deficits or unfulfilled desire for social contact with depressive symptoms in
this population. Specifically, we want to test (1) whether greater awareness of one’s own
social impairments is associated with higher levels of depressive symptoms, and (2)
whether a disparity between social interest and social participation predicts higher levels
of depressive symptoms in this population. We would expect that participants with ASD
will tend to endorse fewer autism symptoms and rate these symptoms as less impairing
than will professionals/caregivers. However, we hypothesize that participants with higher
levels of insight into their ASD symptoms will report higher levels of depressive
symptoms. We also plan to examine whether level of social participation moderates the
relationship between insight into ASD symptoms and self- and caregiver-ratings of
depressive symptoms. We hypothesize that a profile in which social motivation is higher
than social participation will be associated with higher levels of depressive symptoms.
The study of comorbid depression in ASD has been hindered by a lack of
appropriate measures and the inherent difficulty in recognizing psychiatric symptoms in
individuals who also have impairments in language, cognitive functioning,
communication of affect, and insight (Leyfer et al., 2006). To ensure a reasonably limited
scope, this project focuses on “depressive symptoms” as an outcome measure, rather than
on clinical diagnoses of depressive disorders. Measurement issues reviewed above apply
to the symptoms as well as the disorder. In the absence of depression measures that have
been validated in the ASD population, we will use the BDI as the outcome measure in
this study.
80
Methods
Participants
Data were collected from a sample of 46 adolescents and adults with autism
spectrum disorders. Inclusion criteria included (1) chronological age between 15 years, 0
months and 35 years, 11 months, (2) a verbal IQ of 70 or greater, (3) reading
comprehension at the fifth-grade level or beyond, (4) a clinical diagnosis of an ASD,
including Autistic Disorder (i.e., autism), Asperger syndrome, and Pervasive
Developmental Disorder-Not Otherwise Specified (PDD-NOS), and (5) the willingness
of a parent/caregiver who was familiar with the participant as a young child to participate
as well. Exclusion criteria included significant sensory or motor impairment (e.g.,
blindness, severe cerebral palsy) that would preclude completion of the standard
assessment battery, as well as acute psychiatric disorder (e.g., schizophrenia).
Participants ranged in age from 15 to 31 years old. Families were recruited from
recent clinic or research participants at the University of Michigan Autism and
Communication Disorders Center (UMACC) who consented to be re-contacted for future
research (n=14, including 9 former UMACC social group members), those currently
participating in UMACC adult or “teen” social groups (n=5), 21 individuals participating
in the “Longitudinal Studies of Autism Spectrum Disorders: 2 to 22,” a NIMH-funded
research project currently ongoing at UMACC, as well as 6 participants who responded
to public recruitment for this project in the southern Michigan area. Community
recruitment strategies included sending flyers and making presentations at ASD resource
centers, social groups, or job-coaching groups. Longitudinal study probands were
81
consecutive ASD referrals at age 2 to clinics in North Carolina and the Chicago
metropolitan area (Lord et al., 2006); they have been seen at ages 2, 3, 5 and 9 years and
now range in age from 16-22 years. These participants had face-to-face assessments
conducted by researchers traveling from UMACC to North Carolina, Chicago, or new
locations to which the families have moved. The rest of the sample was seen at the
UMACC clinic or in their homes in Michigan.
An additional 26 participants were recruited, consented, assessed, and given
monetary incentives, however their data were excluded from this sample due to verbal IQ
below 70 (n=9), probable diagnoses of Bipolar disorder in addition to previously
diagnosed ASD (n=2), or failure to meet criteria for a best estimate clinical diagnosis of
an ASD (n=14), as well as one eligible participant who chose not to answer a significant
number of items and measures within the research protocol, rendering her data unusable
due to missing values. Table 4.1 outlines recruitment and participation details of this
sample.
Mean chronological age in the sample was 20 years, 10 months (SD=5 years).
Mean verbal IQ was 106 (SD=15.7) and nonverbal IQ was 104 (SD=15.7). Data were
available from 5 females (11% of the sample). Race and ethnicity of the sample included
78% Caucasian, 11% African American, 5% with two or more racial affiliations, and one
person (2%) each from the Asian, American Indian, and “Other” categories. The majority
of the sample (73%) currently was living at home with one or both parents, 12% lived in
college or university housing, 5% lived on their own with significant in-home
professional assistance, 4% lived on their own with relative or complete independence,
and 7% did not provide information about their living situation. Participant education
82
varied as follows: 31% of the sample was currently in high school receiving significant
services, 27% was in high school with minimal to no special education services, 32% had
attempted some college or was currently in college, 3% had completed a college degree,
and 7% did not provide information on their educational level. Maternal education ranged
from 28% with graduate education, 24% who completed Bachelor’s degrees, 29% with
some college, 5% high school graduates, and 2% who had completed 9th grade, with data
not provided for one participant. See Table 4.2 for a more detailed description of this
sample, and Table 4.3 for information on parent/caregiver participants.
Best estimate clinical diagnoses of autism, based on clinical judgment informed
by diagnostic measures referenced later, were assigned to 20 individuals (43%), PDD-
NOS diagnoses were made in 21 participants (46%), and 5 (11%) had Asperger
syndrome. In addition to a diagnosis on the autism spectrum, 5 individuals received a
diagnosis of an anxiety disorder (n=2 with Generalized Anxiety Disorder and n=3 with
Anxiety Disorder, Not Otherwise Specified; 11% of the sample) and 8 participants
received a diagnosis of a depressive disorder (6 with Recurrent Major Depressive
Disorder, 1 with a single current episode of MDD, and 1 with Dysthymic Disorder; 17%
of sample). Procedures regarding diagnostic decision-making are included in the next
section.
Procedures
The data collection protocol included a packet of questionnaires and a face-to-
face assessment for both the adolescent or adult participant with ASD (i.e., proband) and
his/her parent or childhood caregiver (because no non-parent caregivers participated in
this sample, we will refer to “parent” participants from this point on). The estimated time

83
to complete the mailed questionnaire packets was approximately 20 minutes for probands
and 15 minutes for parents. Face-to-face assessments took approximately 3 hours for
probands and 4 hours for parents. Some measures used solely to confirm ASD diagnoses
were not re-administered for those participants who previously had received an ASD
diagnosis from UMACC. Participants received $50 for the proband session and $50 for
the parent session; both probands and parents received gift cards dependent on their own
participation only. For participants in the Longitudinal Study, incentives for full
participation included gift cards of $50 as well as brief reports on the assessment results.
Additional measures were added to the Longitudinal protocol for these participants. All
research participants had access to extended fee-for-service clinical services through
UMACC, with financial assistance offered as needed.
Data were collected and clinical diagnoses assigned by graduate students in the
University of Michigan clinical psychology doctoral program and UMACC research
assistants, all of whom had undergone extensive training to achieve research reliability on
the Autism Diagnostic Observation Schedule (ADOS; Lord et al., 2000) and the Autism
Diagnostic Interview-Revised (ADI-R; Rutter, LeCouteur, & Lord, 2003). Examiners had
a minimum of two years’ experience assessing individuals with ASD and making autism
spectrum diagnoses. In some cases, different research examiners assessed the proband
and parent participants; both examiners discussed the case and came to a consensus
agreement about clinical diagnoses (both in regard to the autism spectrum diagnosis and
relevant other mental health conditions) based on all available information, including
standardized rating instruments and a brief unstructured clinical interview (see Table 4.4
for a list of measures taken into account in making clinical diagnoses).
84
A risk management protocol for this study included assessment of suicidal
ideation, seeking of supervision from a licensed clinical psychologist, and arrangements
to transport participants to the nearest hospital Emergency Department if necessary. Steps
1 and 2 of this plan occurred in two cases, and these participants received follow-up
services from both UMACC and local mental health resources. All individuals given a
diagnosis of a mood disorder through this study received clinical feedback and
recommendations, except in the case of one individual whose disorder was already
known to his family and who was receiving psychiatric care. The University of Michigan
Institutional Review Board in Health and Behavioral Sciences approved all procedures
related to this study.
Measures
Proband measures
The standard battery for participants with ASD was as follows: in the mailed
packets, probands received informed consent documents and a demographic
questionnaire, along with a number of questionnaires pertaining to psychological health
(see Table 4.4 for a complete list of the assessment protocol). During the face-to-face
assessment, probands completed the Wechsler Abbreviated Scale of Intelligence
(Wechsler, 1999) for a measure of cognitive ability; the Neale Analysis of Reading
Ability (Neale, 1997) or the Wide Range Achievement Test (WRAT; Wilkinson &
Robertson, 2006) reading comprehension subtests in order to verify reading
comprehension necessary to complete questionnaires; the ADOS to confirm diagnosis; a
brief close-ended interview on depressive symptoms intended for populations with
developmental delays, the Self-Report Depression Questionnaire (SRDQ; Reynolds &
85
Baker, 1988); the Beck Depression Inventory (BDI-II; Beck, 1996) or Child Depression
Inventory (CDI; Kovacs, 1992) depending on age; and an adapted version of the Social
Support Questionnaire (SSQ; Sarason, Sarason, Shearling, & Pierce, 1987).
The Behavioral Perception Inventory (BPI)
In addition to the instruments above, participants completed two new measures
created specifically for our variables of interest. The first is the Behavioral Perception
Inventory (BPI), on which participants rate to what degree each of 34 autism-related
symptoms and positively-worded “filler” items describes their own behavior (Part A),
and to what degree others think the behavior in question applies to the participant (Part
B). Responses are in the form of two distinct four-point Likert scales for self-ratings in
Part A of each item (Almost Never, A Little, Pretty Much, Almost Always) and ratings of
others’ perception of one’s own behavior (e.g., “How much do others think you… [do the
behavior in question]”) in Part B (Not Much, A Little, Pretty Much, Very Much). The BPI
contains 3 sets of questions that are asked twice throughout the measure, once with
positive wording (e.g., “Do you remember to ask others about their interests and
experiences”) and once with negative wording (e.g., “Do you forget to ask others about
their interests and experiences?”). These question pairs are intended to function as a
validity scale, allowing data to be excluded for those who rate themselves highly
inconsistently on the same concept or when the question is reframed in a positive or
negative direction.
After the proband assessment, a clinician-rated version of the BPI was completed
by the examiner, who rated the proband on the same items and using the same scale as
did the proband him or herself. Parents also filled out a parent-version of the BPI about
86
their children. See Appendix A of this chapter for proband-, clinician-, and parent-rated
versions of the BPI.
The Social Interests and Habits Questionnaire
The second new measure created for this study was the Social Interests and Habits
Questionnaire (SIH; see Appendix B), which assesses participants’ wish for involvement
in several social domains as well as their current degree of involvement. The “Social
Current” section (SIH-SC) includes 7 questions about social participatory behaviors rated
on a four-point likert scale (None, A Little, Pretty Much, A Lot) and 6 qualitative
questions about the proband’s current social participation (e.g., “If you do have a job
now, what do you do at your job?”). The “Social Wishes” section (SIH-SW) includes 7
similar, Likert-rated questions about the proband’s desire for the same social
participatory behaviors, as well as 4 additional Likert-rated questions and 4 write-in
response questions that address desire for the social behaviors measured qualitatively on
the SIH-SC (e.g., “If you got a first job or a new job someday, what kind of job would
you want?”). The SIH includes a final section (“Social-Others,” SIH-SO) with 7 Likert-
rated questions that ask the proband to rate the social practices of other people his/her
age, in order to assess for response patterns biased by social desirability effects. The SIH
was counter-balanced such that a random half of participants rated their desired amount
of social experiences (SIH-SW) before answering questions about their actual amount of
current social contact (SIH-SC), with the other half of participants receiving the ‘current’
questions before the ‘desired’ questions. The SIH-SO was always given last. Only the
first seven questions of the SIH-SC and -SW were used in these analyses, thus excluding
the qualitative questions at this point.
87
The proband battery was structured to avoid bias or contamination of responses.
In addition to the counter-balancing of the SIH, the self-report depression measures
(SRDQ and BDI) were administered directly following the cognitive test, before the
ADOS, BPI, or measures of social experiences and support, in order to eliminate a
priming effect of potentially negative topics.
Parent measures
Parent participants received a mailed packet containing consent forms (and
permission forms for those with participating children under 18), as well as a background
history form and a number of questionnaires regarding their child’s emotional health. See
Table 4.4 for a complete list of parent-rated instruments. During the face-to-face
assessment, parents completed the Autism Diagnostic Interview-Revised (ADI-R; Rutter,
LeCouteur, & Lord, 2003) in order to confirm diagnosis; the second edition of the
Vineland Adaptive Behavior Scales (Sparrow, Cicchetti, & Balla, 2005) to assess
adaptive functioning of the participant; an interview on the proband’s depressive
symptoms adapted for use in both adolescents and adults, the Children’s Depression
Rating Scale (CDRS; Poznanski & Mokros, 1996); and a brief interview about mental
health history of the proband's immediate and extended family. Parents also completed
the parent version of the BPI, on which they rated the adolescent/adult participants’
behavior for the same symptoms and on the same scale as those rated by the proband
him/herself (see Appendix A).
Statistical analysis
As the measures used to operationalize the two main hypotheses of this study
were newly created for that purpose, Cronbach’s alpha coefficient was used to measure
88
internal consistency within the BPI and the SIH. Correlations were generated between
new measure items and participant age and verbal IQ to assess the effects of these
participant characteristics on item responses.
To address the first hypothesis, that higher insight into one’s autism symptoms
will predict greater levels of depressive symptoms, raw totals of Proband BPI scores and
Examiner BPI scores were entered into a multiple linear regression model, along with
chronological age centered at the sample mean, as predictors of Beck Depression
Inventory scores. The interaction between Proband and Examiner BPI scores as a
predictor of BDI scores could not be assessed due to multicollinearity between raters’
BPI totals. See the end of this section for information on meeting assumptions for this
and all other regression analyses described herein.
Next, exploratory methods were used in an attempt to make inferences about
particular symptom groupings in which differing levels of insight might influence
depression scores. BPI scores were compared across participants, parents, and examiners
to operationalize level of symptom-related insight for each individual. Bivariate
correlations were generated for each differently-rated item pair (e.g., Parent BPI Item 3
and Examiner BPI Item 3) in order to make a decision about whether to combine the
measures into the standard BPI rating to which the proband’s own ratings would be
compared; consistent correlation at or above r=.70 was chosen as the criterion for
combining information from both raters. Correlations between Examiner and Parent
ratings generally failed to meet this criterion, so BPI-Examiner ratings were used alone as
the comparison to the Proband ratings. The difference between Examiner and Proband
ratings (e.g., BPI Item 2, Part A: Examiner Rating=3 and Proband Rating=1; 3 – 1 yields
89
a difference score of 2) were generated to assess item-level patterns of awareness of
symptoms (e.g., strong Examiner-Proband agreement), lack of insight (e.g., Examiner
rates symptom as more impairing than does Proband), or oversensitivity (e.g., Proband
rates symptom as more impairing than does Examiner). Examiner-Proband difference
scores for each of 25 items (excluding positive “filler” items) were then entered into an
exploratory factor analysis (EFA) model to examine the correlation structure of the 25
difference items.
Standardized factor scores from the EFA were entered into a multiple linear
regression model, along with standardized chronological age and verbal IQ covariates, as
predictors of continuous depression scores on the BDI. Insight factor scores and age and
verbal IQ covariates were also entered into logistic regression models as predictors of
clinical diagnosis of a mood disorder (with a binary rating 0=‘No Depressive Disorder’
and 1=‘Depressive Disorder Present’). Linear regression was used to further examine
whether adaptive behavior skills predict depressive symptoms, and if so, whether they
mediated the impact of insight into functional independence. The same analyses were
undertaken separately for Part A (Proband’s rating of own behavior) and Part B (Proband
rates the degree to which other people think the behavior applies to him or herself), or the
corresponding Examiner-Proband difference scores, for each BPI question.
To address the second hypothesis, in which a disparity between social interest and
social participation will be associated with higher depressive symptoms, exploratory
factor analyses were conducted separately for SIH-Social Current items and SIH-Social
Wishes items. Linear regression (with dependent variable=BDI scores) and logistic
regression (with dependent variable=clinical diagnosis of depression) with age and verbal
90
IQ covariates were used to assess each extracted SIH factor score independently, as well
as interactions between the “Social Currrent” and “Social Wishes” factors, as predictors
of these outcomes. To explore these results further, a subdomain total from the ADI-R
algorithm that quantifies parent report of shared enjoyment behaviors at age 4-5 was used
to represent a pre-depression retrospective report of proband social interest (i.e., as an
alternative indicator of social interest that was not measured simultaneously to the BDI);
this score was entered into a regression model as a predictor of BDI scores, controlling
for age.
For all regression models described above, tolerance and variance inflation factor
(VIF) statistics were checked for evidence of multicollinearity; criteria for concern were
tolerance scores less than 0.2 and mean VIF greater than 1. Standardized residuals were
plotted against standardized predicted values, and partial plots were also examined for
evidence of violations of homogeneity of variance and linearity. Standardized residual
histograms and normal probability plots were assessed for indications of normal
distributions in the variables of interest. Cook’s Distances were checked for scores
greater than 1 to draw attention to single cases that may have had undue influence on the
models.
Results
The entire sample of 46 individuals was used in analyses related to the Social
Interests and Habits Questionnaire. Data from 7 participants were excluded from analyses
of the Behavioral Perception Inventory based on validity checks embedded in the
measure. BPI data were excluded from those individuals (Age Range=16-20 years, M=19
91
years, SD=1.7; Verbal IQ Range=72-126; M=98, SD=22) whose responses varied over 3
points on the Likert scale on any one of 3 conceptually-identical pairs of questions, as
well as those whose responses varied at least 2 points on two or more on the question
pairs. This brought the sample size to 39 for analyses of the BPI.
For all versions of the BPI, positively-worded items were reverse-coded such that
increasing scores denote increasing ASD symptomatology ratings. Further, “filler” items
intended to make the questionnaire a more positive experience for participants (e.g., “Do
you spend time doing things you enjoy, like reading or watching TV?”) were excluded
from BPI analyses, leaving an item set of 28.
For each regression model described below, assumptions were met for adequate
use of these analyses, with the exception of a model including Proband BPI total,
Examiner BPI total, and an interaction term for both. In this one case, tolerance scores
ranged from 0.01 to 0.03 and variance inflation factor (VIF) statistics from 29.4 to 81.7,
indicating serious concern about multicollinearity between the predictors; this analysis
was not interpreted or reported. For all other regression analyses, tolerance scores were
around 0.8-0.9 and VIF statistics were around 1 on average, indicating no concern about
multicollinearity between model predictors. No evidence of violations of homogeneity of
variance and linearity were noted in the plots of standardized residuals by standardized
predicted values or partial plots, with the exception of Z-scores based on chronological
age, which showed evidence of possible heteroscedasticity (i.e., unequal variance of
residuals). Standardized residual histograms and normal probability plots indicated
normal distributions of the variables of interest. Cook’s Distances were all well below 1,
indicating that no single case had undue influence on the models.
92
Instrument development
Internal consistency
Internal consistency of the new measures was assessed with Cronbach’s alpha
coefficient (Cronbach, 1951). Alphas on the BPI were highest for Examiner (0.92) and
Caregiver (0.90) versions, and lowest, though still acceptable, for the Proband Rating
Others’ Perceptions (Part B of each Proband-rated item), at 0.86. Cronbach’s alphas for
the SIH were somewhat lower, at 0.64 for the SIH-Social Current scale items and 0.58 for
the SIH-Social Wishes scale. Though this falls below satisfactory levels (.70 is generally
accepted as such; Streiner & Norman, 2003), a low number of items tends to deflate
Cronbach’s alpha coefficient spuriously, and only 7 items were included in the SIH
analyses. It is also possible that uncorrelated latent factors (e.g., two possibilities were
‘desire to spend time doing hobbies alone’ and ‘desire to spend time outside of the house
or with friends’) exist in this measure, with potentially larger alpha coefficients within
factors.
Correlation with age and verbal IQ
Item correlations with chronological age and verbal IQ were also reviewed in
order to examine the independence of the measures from these participant characteristics.
The BPI-Caregiver had no items correlated above r=.30 with either age or verbal IQ. For
the BPI-Examiner, two items correlated with chronological age beyond r=.30 (“When
[proband] sets long-term goals, they are realistic” at r=.47, p<.01, and “[Proband] does
things that are rude or inappropriate even when he/she doesn’t mean to” at r=-.33,
p=.05) and one item correlated with Verbal IQ beyond r=.30 (“It is easy for [proband] to
keep a conversation going” at r=-.43, p<.01). For the BPI-Proband, three items correlated
93
with chronological age above r=.30 (Items 14, 16, and 33), though none above r=.35, and
three items correlated with Verbal IQ above r=.30 (Items 10, 22, and 29), though none
above an absolute value of .45.
All SIH-SC and SIH-SW items were correlated with chronological age and verbal
IQ at no more than r=.30 with the exception of “How often would you want to spend time
with family members?” (SIH-SW Item 1; r=-0.40 with Chronological Age, p<.01) and
“How often do you chat online with friends?” (Item 4 on SIH-SC Item 4; r=.34 with
Verbal IQ, p<.05). None of the significant correlations between new measure items and
age or IQ were judged to be high or concerning, especially as both characteristics would
be controlled for in regression analyses.
Behavioral Perception Inventory totals as predictors of depressive symptoms
Because of the small sample size for BPI analyses (n=39), only 3 or fewer
parameters could be estimated in linear regression models (Harrell, 2001). Initially,
chronological age and verbal IQ variables were centered at the sample mean and entered
into a multiple linear regression model as sole predictors of Beck Depression Inventory
scores, in order to assess the effects of these participant characteristics on depression.
These predictors explained only 12% of the model variance, and the overall model
F(2,36)=2.4 failed to reach significance. Verbal IQ had no significant association with
BDI scores in this model, but age was significant at the p<.05 level (B=2.6; β = .34,
p=.04). No particular pattern emerged between chronological age and BDI scores in a
scatterplot; the two variables were correlated at r=.30 (p<.05), suggesting that higher BDI
scores may be somewhat associated with older ages.
94
The 28 usable, recoded BPI raw item scores were summed for Proband Part A
(i.e., Proband Rates Self) ratings and for Examiner BPI ratings. Proband and Examiner
BPI totals were entered into a regression model, again with BDI totals as the dependent
variable. Standardized chronological age was included as a covariate in the model.
Controlling for Examiner BPI totals, Proband-rated BPI totals were highly significant
predictors of BDI scores, B=.44; β = .59, p<.001. This finding indicates that higher levels
of perceived autism-related impairment are associated with higher levels of depressive
symptoms on the BDI, controlling for actual level of impairment (Examiner-rated BPI
total). Standardized age and Proband and Examiner BPI totals were also entered into
logistic regression models as predictors of clinical diagnosis of a mood disorder, and
none of the three variables was a significant predictor of depressed diagnosis.
Because of multicollinearity in the data, the interaction of Proband and Examiner
BPI totals could not be assessed for patterns in depressive symptoms on the BDI. Thus,
overall group depression scores could not be compared between individuals with good
insight into their actual symptoms (e.g., Proband and Examiner scores both low or both
high) and individuals who tend to rate themselves as being more impaired on the BPI due
to a “halo effect” of negative cognitions, perhaps as a result of depression (e.g., Examiner
BPI scores lower than Proband BPI scores). For this reason, we went on to attempt more
exploratory analyses of the relationship between Proband and Examiner BPI scores and
BDI scores.
95
Exploratory analyses of the effects of symptom domain-specific insight
Computing “insight” scores
Bivariate correlations were generated for all items from Caregiver and Examiner
versions of the BPI for the purpose of creating a combined standard rating to which
probands’ own self-ratings would be compared for insight into symptoms. Correlations
between the two non-proband versions were lower than expected, and none exceeded the
desired cut-point of r=.70. Because many items on the BPI were based on ASD
symptoms elicited and scored in the ADOS, the Examiner BPI scores (based on ratings
from clinicians who have achieved research reliability on the ADOS) were used as the
absolute rating of proband symptomatology.
The difference between Examiner and Proband ratings was generated for each
item by subtracting Proband ratings from Examiner ratings after each had been recoded
to progress in the same direction (with higher scores indicating greater impairment). On
these difference scores, high positive numbers (2 to 3) on Examiner-Proband Difference
scores represented symptoms that the examiner rated as more evident in or problematic
for the proband than did the proband him or herself. Larger negative numbers (-2 to -3)
indicated those symptoms about which probands tended to show possible oversensitivity,
in that the proband rated him or herself as more impaired on that symptom than did the
examiner. Scores of or close to 0 (-1 to 1) indicated strong Examiner-Proband agreement
and thus awareness of ASD symptoms on the proband’s part.
Exploratory factor analysis of BPI Examiner-Proband differences
Exploratory factor analyses were run including Examiner-Proband Difference
scores, Chronological Age, and Verbal IQ. Promax rotation was chosen to allow for
96
correlation between factors. Communalities (the percentage of variance in a given item
explained by all of the factors) were less than 0.50 for fourteen of the 28 Part A items and
10 of the 28 Part B items, indicating a potentially underpowered analysis. Item-to-subject
ratio also was quite low (1:1.8), and thus these results may be specific to the current small
sample.
Examiner-Proband Rates Self (Part A) Difference scores: Ten factors had
eigenvalues above 1.00 and explained 77% of the variance in the model. To maximize
interpretability, items were forced to load onto 3 factors (indicated by the scree plot as a
good cut point), which explained 42% of the variance (see Table 4.5). The first factor
included 8 items pertaining to difficulty making friends (4, 19), conversation (15, 26),
and monologue (10, 16, 21, 30), as well as 11 other items (e.g., 11-feels comfortable in
social situations). This factor, named “Insight into Conversation/ Monologue,” explained
24% of variance in the model. The second factor included 4 items related to insistence on
sameness in routine and rituals (2, 9, 23) and noticing or remembering details (3); this
was named the “Insight into Compulsive/Ritualized” factor, and it was negatively
correlated with Item 14: Stands too close to others (i.e., this item had a negative factor
loading of -.49). The final factor had two strong loadings, Item 6: Realistic future goals
and Item 20: Independent in caring for self, and one negative loading (28: Eye contact).
The third factor explained 8% of the variance and was called the “Insight into Functional
Independence” factor. The three factors were minimally correlated (r<.20).
Examiner-Proband Rates Others’ Perception of Self (Part B) Differences scores:
Nine factors had eigenvalues above 1.00 and explained 74% of the variance in the model.
Part B item difference scores were forced to load onto 4 factors as indicated by the scree
97
plot, and these first four factors explained 49% of the variance (see Table 4.5). The first
factor included 14 items pertaining to comfort with routine, insistence on sameness,
hyperfocus, and conversational monologue, as well as stereotyped or odd speech and
rude/ inappropriate behavior and interrupting. This factor, though slightly different from
the Proband-Rates-Self factor described above, was named the “Insight into
Compulsive/Ritualized (B)” factor, and it described 21% of the variance. The second
factor, called “Developmental Effects” and describing 11% of the variance, had negative
factor loadings for Age and Verbal IQ and included items 20: Independent in caring for
self and 33: Hard to keep attention where it’s supposed to be. The third factor explained
9% of the model variance and related to making friends and the ability to read sarcasm
and facial expressions (per loadings of 4 items); it was named “Insight into Peer
Difficulties.” The final factor again had a strong loading for Item 6: Realistic future goals
(though not Item 20: Independent in caring for self). It also included Item 29: Controls
anger and anxiety and had a negative loading for 28: Eye contact. This so-named “Future
Goals” factor with these three items explained only 7% of the model variance. However,
with a factor loading of .76 for Item 6, the evidence that a four-factor solution met ‘best-
fit’ criteria by eigenvalues and scree plot, and its similarity to the BPI Proband-Rates-Self
factor, it was retained as a distinct factor. All four factors had low positive correlations, at
or below r=.30.
BPI difference factors as predictors of BDI totals
Multiple linear regression analyses were performed separately for factor scores
derived from BPI Part A (Examiner-Proband Rates Self) and Part B (Examiner-Proband
Rates Others’ Perception of Self) items. Beck Depression Inventory totals were entered
98
as the dependent variable to examine the effects of ASD symptom awareness (or
“insight”) on depressive symptoms. Models were run with the three BPI Part A (Proband
Rates Self) Difference Factors alone and with standardized age scores included; in both
cases, only Factor 3: “Insight into Functional Independence” was a significant predictor
of BDI scores (see Table 4.6). Evidenced in scatterplots of these data, greater degrees of
agreement between Proband and Examiner ratings, up through Proband ratings of
impairment that surpassed the Examiner ratings, were associated with increasing levels of
depressive symptoms primarily for Factor 3 scores.
Because a 4-factor solution best fit BPI Part B (Proband rates others’ perception)
Difference Scores, not all the Part B factors and covariates could be entered in the same
regression model due to sample size parameter-constraints. Various combinations of
predictors were entered into separate regression models. Neither Part B factor loadings
nor standardized age predicted BDI scores at a significant level.
BPI difference factors as predictors of clinical diagnosis
Insight factors and age and verbal IQ covariates were also entered into logistic
regression models as predictors of clinical diagnosis of a mood disorder. Interestingly,
Part A Examiner-Proband Rates Self Factor 2 (“Insight into Compulsive/Ritualized
Behavior”) significantly predicted a clinical diagnosis of depression, whether or not
standardized age and verbal IQ variables were included in the model, B(SE)=1.5(0.7),
p=0.03, Nagelkerke R2=.45. In this case, individuals who received clinical diagnoses of
depressive disorders in this sample (n=8) tended to have poorer insight into their
compulsive/ritualized behavior. No other factors for either Part A or Part B difference
scores, age, or IQ were significant.
99
Vineland Adaptive Behavior scores as predictors of BDI totals
Results of linear regression models with BPI insight factors as predictors
indicated that awareness of impairments in setting realistic goals and caring for one’s self
independently was associated with depressive symptoms. We next used adaptive
behavior scores from the Vineland Adaptive Behavior Scales, 2nd edition, to assess
whether insight into functional independence impairments or the actual functional
independence impairments themselves were driving the association between that insight
factor and BDI scores. Scatterplots and bivariate correlations indicated that all
subdomains of the Vineland-II, including Communication, Daily Living Skills,
Socialization domain standard scores, and the Overall Adaptive Behavior Composite
standard score (VABCST) were similarly negatively correlated with BDI scores, e.g.,
VABCST and BDI r=-.45, p<.01. In other words, better adaptive behavior was
associated with less depression. Therefore, only the overall composite score (the
VABCST) was entered into a linear regression model predicting BDI totals, again
controlling for age and verbal IQ. VABCST approached significance in the model (B=-
0.2; β =-.37, p=.05), whereas age and IQ did not. However, when centered age, verbal IQ,
VABCST, and the “Insight into Functional Independence” factor (Factor 3 of BPI Part A)
were entered simultaneously, only the Insight factor was a significant predictor of BDI
totals (B=-3.0; β =-.34, p=.04). Multicollinearity was not noted in the regression
diagnostics, and the standardized score of overall adaptive skills was correlated at 0.19
with factor loadings of insight into functional independence. The actual adaptive behavior
score also approached significance (B=-.2; β =-.4, p=.06), in the direction of poorer
100
adaptive behavior scores being associated with higher scores on the BDI, but the degree
of impairment itself did not control for the impact of insight into adaptive impairments.
Exploratory factor analysis of SIH
In Hypothesis 2, we predicted that a disparity between social interest and social
participation as measured by the Social Interests and Habits Questionnaire would be
associated with higher depressive symptoms. Exploratory factor analyses were
undertaken separately for SIH-Social Current items and SIH-Social Wishes items to first
explore the factor structure of this new measure. Again, analyses were run with Promax
rotation to allow for correlation between factors. Item-to-subject ratio was 1:6.6, and all
communalities were above 0.50, except for age and verbal IQ in the SIH-SW analyses,
which indicates that the factors explained an adequate percentage of variance for all SIH
items.
SIH-Social Current scale: Three factors had eigenvalues above 1.00 and explained
63% of the variance in the model. The first factor, “Current-Friends,” included items 2, 3,
and 4, all related to spending time with friends in person, on the phone, or online. The
second factor included items 1, 5, and 7 related to spending time with family and going to
social events or activities outside the home. Verbal IQ had a negative loading on this
“Current-Family/Outside Activities” factor. The last factor was named the “Current-
Hobby” factor, because it was driven by Item 6: Doing a hobby at home. The only other
item to load on this factor was Age, yet it was judged to be a “real” factor despite its low
population because Item 6 had a loading of .81, and the factor explained 15% of the
model variance. All factors were correlated below r=.15.
101
SIH-Social Wishes scale: Three factors had eigenvalues above 1.00 and explained
60% of the variance in the Social Wishes model. The first factor, “Desired-Friends,”
included the same items as Factor 1 of SIH-SC. The second factor of Social Wishes,
however, included items 1 and 6, related to spending time with family and doing a hobby
at home. Chronological age and verbal IQ had negative loadings on this “Desired-
Family/Hobby” factor. The last SW factor, “Desired-Social Events” was clearly related to
social events and activities outside of the house (items 5 and 7). Each factor accounted
for 16-25% of the model variance, and all were positively (though not strongly)
correlated.
Social Motivation/Participation Disparity as a predictor of depression
SIH factors as predictors of BDI totals and clinical diagnosis
On the assumption that higher social motivation and lower actual participation
would be associated with higher BDI scores, interaction terms were calculated for
“Current-Friends” by “Desired-Friends” and all other relevant pairs (“Current-
Family/Outside Activities” by “Desired-Family/Hobby”; “Current-Family/Outside
Activities” by “Desired-Social Events”; and “Current-Hobby” by “Desired-
Family/Hobby”). Multiple linear regression models were generated controlling for
standardized age and verbal IQ, each of the two independent terms, and the interaction
term. For example, one such model might include the following predictors: Age-centered,
VIQ-centered, “Current-Friends,” “Desired-Friends,” “Current-Friends x Desired-Friends
Interaction.” Verbal IQ was dropped due to consistent non-significant results and
parameter constraints. Though age approached significance in some of the models, none
of the independent factors or interaction terms predicted BDI scores, contrary to
102
expectations. Logistic regression was conducted with the same predictors, again with no
significant results.
In graphing the (nonsignificant) interaction terms, it appeared that individuals
with lower social interest (on any of the SW domains) and lower social participation (on
the corresponding SC domain) have the highest levels of depressive symptoms on the
BDI (see Figure 4.1). Individuals with higher social participation tend to have BDI
scores in the “no concern” range, regardless of level of social interest or motivation.
Early “Shared Enjoyment” as a predictor of BDI totals
We postulated that one reason for the findings above is that depression itself
affects social motivation. It was possible that, by measuring depressive symptoms and
social motivation simultaneously, we were getting Social Wishes responses that had
already been negatively affected by depressed mood. No clear pre-depression rating of
Social Motivation exists in our data, so we used the “Shared Enjoyment” subtotal on the
Autism Diagnostic Interview-Revised (ADI-R) diagnostic algorithm as a stand-in for
trait-level Social Motivation. This subtotal indicates parents’ retrospective ratings of their
children at age 4-5 on the concepts of Showing and Directing Attention, Offering to
Share, and Seeking to Share Enjoyment With Others. Higher scores on this total indicate
more impairment, i.e., less socially-motivated behavior. This method of using this ADI-
R subtotal as a stand-in is limited in that (1) we do not know how stable Shared
Enjoyment behaviors would be from ages 4-5 through adulthood, and (2) impairments in
Shared Enjoyment might not equate to lack of motivation but rather inherent lack of skill
to seek such social input.
103
The following predictors were entered into a linear regression model predicting
BDI scores: standardized chronological age, the SIH “Current-Friends” factor, the ADI-R
Shared Enjoyment algorithm subtotal, Age 4-5 (which had been reverse-scored so that
increasing scores denote higher social interest, then centered at the sample mean), and the
interaction of the Current-Friendship factor and Shared Enjoyment recoded total. Age,
Shared Enjoyment at 4-5, and the interaction of current participation with friends and
seeking to share enjoyment at 4-5 were all significant terms in the model (see Table 4.7).
The direction of the results was again contrary to our expectations for autism: Lower
sharing of enjoyment at 4-5 and lower current participation with friends predicted the
highest level of depressive symptoms (see Figure 4.2), suggesting that people with less
positive social affect earlier in life may have fewer positive interactions and greater levels
of depressive symptoms in adolescence and adulthood. The next highest group was those
with both higher shared enjoyment at 4-5 and higher current participation with friends.
Discussion
Summary of primary findings
In this study of depressive symptoms in adolescents and adults with autism
spectrum disorders, we found evidence to support the high prevalence of depressive
features in ASD, with 17% of the sample meeting criteria for a clinical diagnosis of a
mood disorder and 51% of the sample scoring in the range of mild clinical concern or
above on the Beck Depression Inventory. Of those with clinical diagnoses of depressive
disorders, 75% (n=6) scored in the moderate to severe range on the BDI; the remaining 2
individuals scored in the minimal concern range, indicating the need for future study of
104
the utility of common measures of depression in the ASD population. More
encouragingly, BDI scores were only minimally associated with age and were not
associated with verbal IQ level in this sample that ranged from mid-adolescence through
mid-adulthood and borderline cognitive functioning through above average intelligence.
The ability of this instrument to quantify depressive symptoms within the More Able
ASD population does not appear to be confounded by these participant characteristics.
Insight into autism-related impairments, as operationalized by proband-rated
Behavioral Perception Inventory total scores, predicted higher levels of depressive
symptomatology on the Beck Depression Inventory, even when controlling for examiner-
rated BPI totals that indicate actual levels of impairment. Insight into social impairments,
as operationalized by factor scores of differences in examiner- and proband-rated
Behavioral Perception Inventory item scores, did not predict higher BDI scores as
expected. However, insight into functional independence limitations, measured by scores
on this factor of the BPI, was a significant predictor of BDI scores, with greater
Examiner-Proband agreement (i.e., proband oversensitivity) associated with higher levels
of depressive symptoms. The BPI factor “Insight into Compulsive/Ritualized Behavior”
predicted binary clinical diagnosis of depression in the direction that poor insight into
these behaviors was associated with the diagnosis of a depressive disorder. Contrary to
our hypothesis, unfulfilled social motivation did not predict BDI scores. When both
social participation and social motivation were low, greater depressive symptomatology
tended to be noted on the BDI. Insight into ASD-associated impairments and social
interest and participation, as operationalized by the new measures created for this study,
were independent of chronological age and verbal IQ.
105
Instrumentation
The Behavioral Perception Inventory showed evidence of good internal
consistency. Factors derived from Part A of each item, requiring the respondent to rate
his/her own behavior, had a more theoretically meaningful factor structure and resulted in
significant associations with the outcome measure (BDI scores) compared with Part B
items, which asked respondents to rate the degree to which others perceive a given
behavior in the proband him/herself. Part B items clearly required a higher level of
abstract thinking, and were likely too verbally complex for many individuals to rate
consistently. The seven people whose data were excluded for highly inconsistent ratings
on the BPI ‘validity check’ items ranged across verbal IQ levels from 72 to 126, however
all were 20 years of age or younger. Rating of others’ perceptions of one’s self may be
especially difficult for adolescents in this population. Exploratory factor analysis of the
BPI Examiner-Proband difference scores indicated some predictive items and potentially
meaningful factors, however this procedure was likely underpowered.
The Social Interests and Habits Questionnaire, created to operationalize Social
Motivation and Social Participation, had low Cronbach’s alpha coefficients within these
subscales. This was likely due to the presence of a strong “Hobby” factor that was
negatively correlated with the rest of the social interest factors. This factor was driven
largely by one item that assessed interest in doing hobbies at home (which encompasses
solitary activity); due to the small number of items assessed in the overall subscales
(seven), this item could have significant impact on representations of internal
consistency. Factors extracted from the SIH seemed meaningful, but again were based on
very few items.
106
Implications about insight
The predictive significance of the “Functional Independence” factor on BPI
scores was robust despite a small sample size and was not explained by direct effects of
adaptive behavior impairments themselves. This suggests that knowing that one is
limited in achieving certain goals or functioning independently at the same level as one’s
peers is likely a catalyst for depression, in contrast to the existence of these limitations
alone. Insight into limited realistic goals and independence in caring for one’s self could
signify an understandable negative response to true limitations. It could also be an artifact
of depression itself, in that depressed respondents were more likely to rate themselves as
impaired in this way. On the other hand, we might have then expected a halo effect, with
the depressive group also endorsing poor social skills and other limitations on the BPI.
This association between awareness of symptoms and depressive scores was limited to
the Functional Independence factor.
Poor insight into compulsive or ritualized behavior was associated with clinical
diagnoses of depression. This also may be an artifact within this small sample, but if
replicated in others, requires closer examination. Again, contrary to expectations, insight
into social impairments did not predict depressive symptoms or disorders. This also
necessitates follow-up studies in independent samples to explore whether the finding is
driven by measurement inaccuracy, or whether there is a need to revisit the assumption
that higher cognitive abilities are associated with more depression due to higher levels of
insight into social limitations caused by ASD.
107
Implications about social motivation and participation
Differences in factor structure across the Social Wishes and Social Current
subscales indicate that there is a mismatch between desired and actual social participation
in adolescents and adults with ASD. Desire to spend time with one’s family or doing a
hobby at home loaded together, while desire for outside events and activities loaded on a
separate factor. Current opportunities to socialize loaded separately onto a
Family/Outside Events factor and onto a Hobby factor. This suggests that adolescents’
and adults’ participation in activities outside the home are associated with, and likely
mediated by, time spent with their families, though they may wish to participate in
outside events and activities independently. If replicated in a larger sample, further
exploration of these patterns may help in making recommendations for families in terms
of facilitating social participation for adolescents and adults with ASD.
In terms of the hypothesis that discrepancy between social motivation and
participation would predict depressive features, the group we predicted would have
highest depression totals actually had among the lowest in our sample. That is,
individuals with higher social motivation and lower social participation did not appear to
be particularly affected by depressive symptomatology. The group that tended toward the
highest BDI scores showed a profile of low social motivation and low social
participation. For some participants at least, depression may be the causal factor of this
profile instead of the reverse, and thus our hypothesis could not be measured fully due to
the absence of social motivation data that pre-dated onset (or increase) of depressive
symptoms. However, these results do underscore the urgent need to study treatment for
depression in ASD, as this comorbid disorder may exacerbate problems with motivation
108
to participate in the social world – when such participation is already compromised
within the autism spectrum.
Attempts were made to use the “Shared Enjoyment” algorithm subtotal of the
ADI-R as a trait-level measure of Social Motivation unbiased by current depression. This
was limited in that these scores rated proband social initiations at age 4-5, usually
through retrospective parent report; it is unclear whether seeking to share enjoyment and
make other social initiations at age 4-5 generally would stay stable through adulthood
within this population. This hypothesis would be better explored with a trait-based
measure of Social Motivation that focuses on the concept prior to onset of depressive
features.
Implications for treatment
The findings from this study, though preliminary, have important implications for
treatment of depressive disorders in ASD. Adaptive behavior appears to influence and be
influenced by depression. The awareness of deficits in functional independence, rather
than social skill, were associated with symptoms of depression in this sample. This would
suggest that, in order to ameliorate depressive symptoms in people with More Able ASD,
it is important to work to improve adaptive competence and independent living skills.
Because the awareness of these limitations appears to be significant, psychoeducation
about ASD, intended to build understanding of one’s own real impairments and to
explore strengths, as well as cognitive behavioral strategies promoting tolerance of
negative affect and undesired realities, also may be beneficial in depression prevention
and intervention in this population.
109
We had limited capability to test unfulfilled social motivation and participation as
predictors of depressive symptoms because of the potential effects of depression on the
“independent” variables. However, findings from this study, though preliminary, suggest
that more direct treatment to promote social motivation (e.g., identifying and providing
motivators for social behavior) and to improve adaptive skills is needed in the More Able
ASD population.
Limitations
The findings are limited by small sample size and measures that require
validation. The sample size, which varied from 33 to 46 by analysis, due to missing or
invalid data, led to underpowered analyses in this study, particularly with regard to BPI
exploratory factor analysis and regression models. A number of other important
predictors (such as rumination and perceived social support) could not be included in
multinomial regression models in order to accommodate the control variables and
predictors of interest. Smaller sample size results in larger standard errors for regression
coefficients and thus limits power to detect relationships. On the other hand, BPI
Functional Independence (Part A, Factor 3) had consistently significant effects despite
these limitations.
Recruitment bias may exist in this sample. The community recruitment strategies
and consent form information were explicit regarding this as a study of “well-being” and
“emotional health,” which potentially could have attracted more people with emotional
health concerns.
Interrater and test-retest reliability have not yet been established for the newly
created study measures, the BPI and SIH. The BPI “Functional Independence” factor was
110
strong in terms of factor loadings and model variance explained, but nonetheless was
based largely on two items of untested validity to measure insight into adaptive behavior.
The present data may be useful as pilot data in expanding the examples to make a
stronger measure of insight into functional impairments common to the autism spectrum.
Future Directions
Validation studies in ASD samples are needed for depression measures with
strong predictive performance in the general population. We have much to learn about
presentation of depression in ASD through (1) descriptions of items endorsed most and
least frequently in the ASD population, (2) comparison of self- and parent-report
instruments, and (3) examination of various measures’ (including the BDI’s) agreement
with clinical diagnosis of depressive disorders. The role of different age groups in the
trajectory of depression in ASD should also be explored, as well as similarities in
presentation and prevalence of depression in other developmental disabilities to explore
the specificity to ASD of comorbid depression. As a field, we also need to develop the
means to assess and treat mood disorders in individuals with limited language and
intellectual disabilities. Because of the specific recruitment of individuals with borderline
to above average intelligence for this sample, these findings cannot be generalized to the
broader population of individuals with ASD; different paths and predictors of depression
likely exist for less able ASD populations.
Exploration of psychosocial mechanisms underlying depressive symptoms in
More Able ASD should inform treatment development, for example whether
comprehensive treatment designed to modify multiple functioning domains is indicated
as a means to enhance motivation and quality of life in this population beyond “treatment
111
as usual” for depression. We plan to explore other risk and protective factors to
depressive symptoms in this population, such as rumination, repetitive behaviors,
perceived social support, and reciprocity of friendship. Ultimately, we hope that
providing relatively inexpensive treatments of co-occurring problems in ASD in a timely
manner will prove effective in changing the quality of life of adults with ASD and their
families.
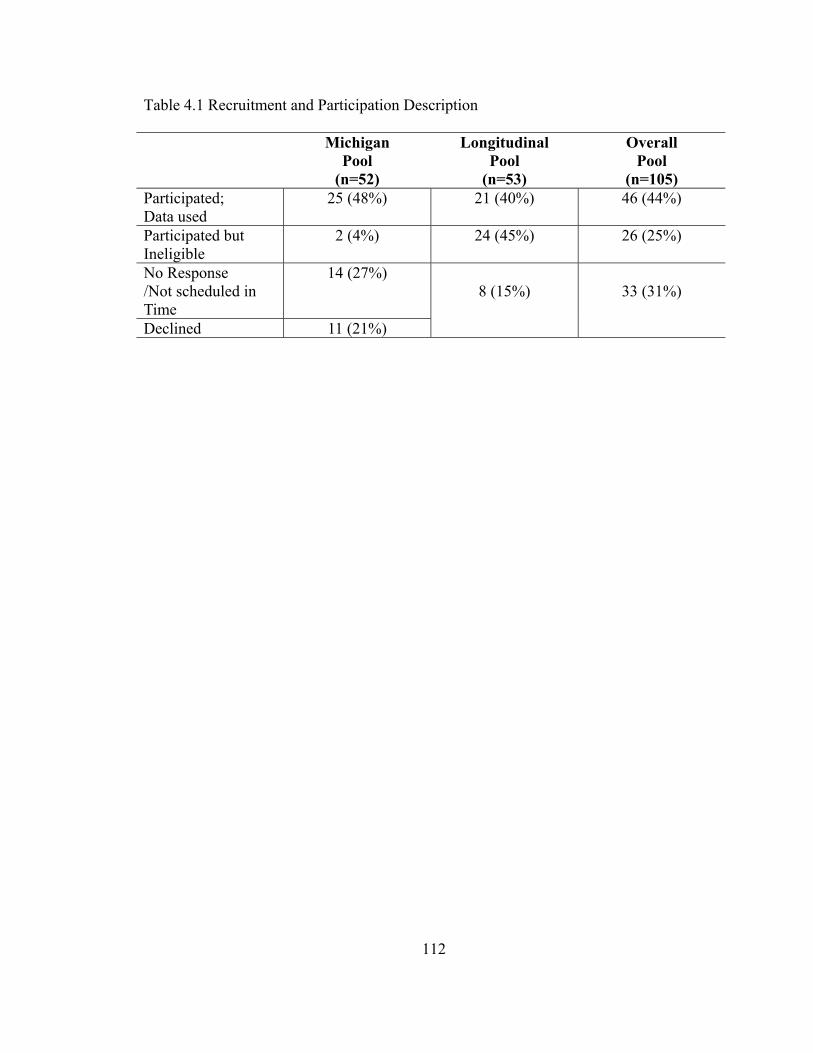
112
Table 4.1 Recruitment and Participation Description Michigan
Pool (n=52)
Longitudinal Pool
(n=53)
Overall Pool
(n=105)Participated; Data used
25 (48%) 21 (40%) 46 (44%)
Participated but Ineligible
2 (4%) 24 (45%) 26 (25%)
No Response /Not scheduled in Time
14 (27%) 8 (15%)
33 (31%)
Declined 11 (21%)
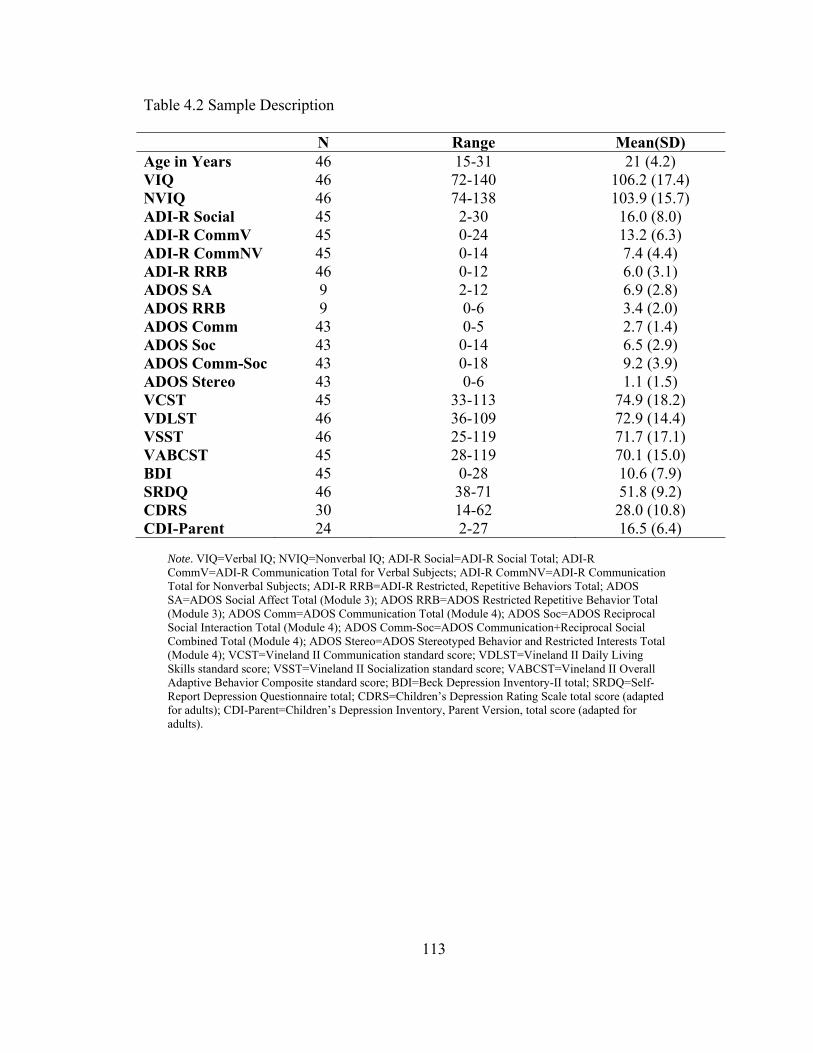
113
Table 4.2 Sample Description
N Range Mean(SD) Age in Years 46 15-31 21 (4.2) VIQ 46 72-140 106.2 (17.4) NVIQ 46 74-138 103.9 (15.7) ADI-R Social 45 2-30 16.0 (8.0) ADI-R CommV 45 0-24 13.2 (6.3) ADI-R CommNV 45 0-14 7.4 (4.4) ADI-R RRB 46 0-12 6.0 (3.1) ADOS SA 9 2-12 6.9 (2.8) ADOS RRB 9 0-6 3.4 (2.0) ADOS Comm 43 0-5 2.7 (1.4) ADOS Soc 43 0-14 6.5 (2.9) ADOS Comm-Soc 43 0-18 9.2 (3.9) ADOS Stereo 43 0-6 1.1 (1.5) VCST 45 33-113 74.9 (18.2) VDLST 46 36-109 72.9 (14.4) VSST 46 25-119 71.7 (17.1) VABCST 45 28-119 70.1 (15.0) BDI 45 0-28 10.6 (7.9) SRDQ 46 38-71 51.8 (9.2) CDRS 30 14-62 28.0 (10.8) CDI-Parent 24 2-27 16.5 (6.4)
Note. VIQ=Verbal IQ; NVIQ=Nonverbal IQ; ADI-R Social=ADI-R Social Total; ADI-R CommV=ADI-R Communication Total for Verbal Subjects; ADI-R CommNV=ADI-R Communication Total for Nonverbal Subjects; ADI-R RRB=ADI-R Restricted, Repetitive Behaviors Total; ADOS SA=ADOS Social Affect Total (Module 3); ADOS RRB=ADOS Restricted Repetitive Behavior Total (Module 3); ADOS Comm=ADOS Communication Total (Module 4); ADOS Soc=ADOS Reciprocal Social Interaction Total (Module 4); ADOS Comm-Soc=ADOS Communication+Reciprocal Social Combined Total (Module 4); ADOS Stereo=ADOS Stereotyped Behavior and Restricted Interests Total (Module 4); VCST=Vineland II Communication standard score; VDLST=Vineland II Daily Living Skills standard score; VSST=Vineland II Socialization standard score; VABCST=Vineland II Overall Adaptive Behavior Composite standard score; BDI=Beck Depression Inventory-II total; SRDQ=Self-Report Depression Questionnaire total; CDRS=Children’s Depression Rating Scale total score (adapted for adults); CDI-Parent=Children’s Depression Inventory, Parent Version, total score (adapted for adults).
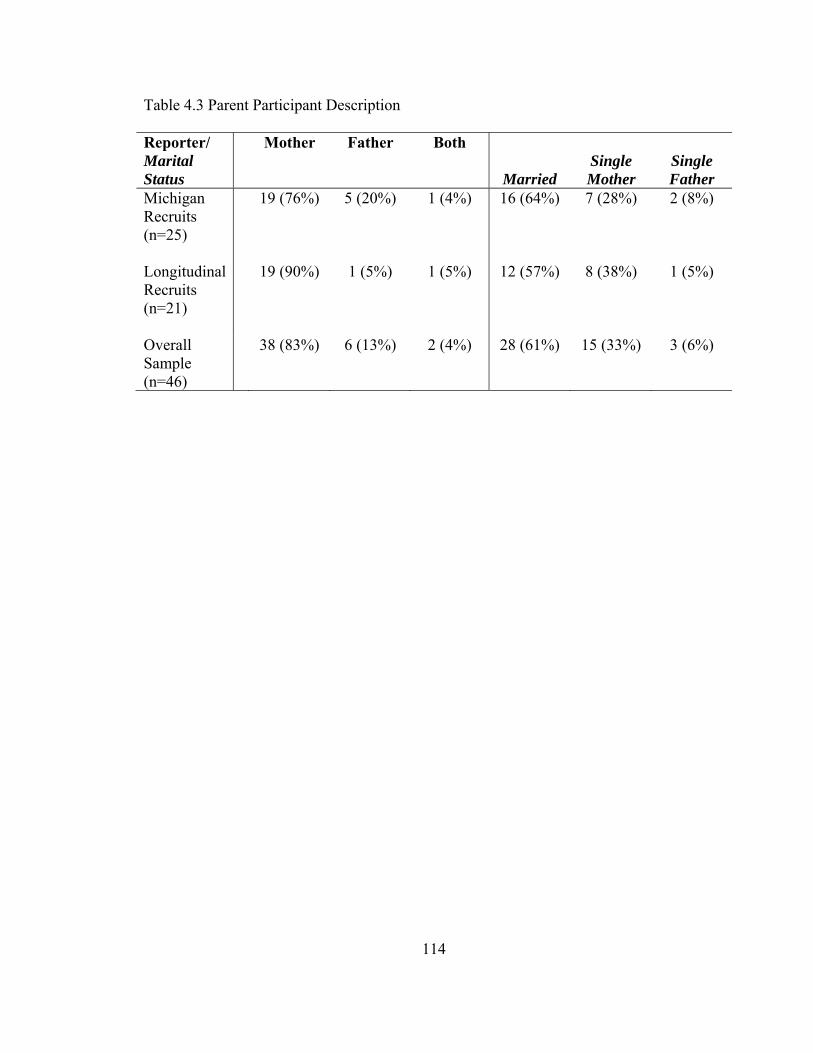
114
Table 4.3 Parent Participant Description Reporter/ Marital Status
Mother Father Both
Married
Single Mother
Single Father
Michigan Recruits (n=25)
19 (76%) 5 (20%) 1 (4%) 16 (64%) 7 (28%) 2 (8%)
Longitudinal Recruits (n=21)
19 (90%) 1 (5%) 1 (5%) 12 (57%) 8 (38%) 1 (5%)
Overall Sample (n=46)
38 (83%) 6 (13%) 2 (4%) 28 (61%) 15 (33%) 3 (6%)
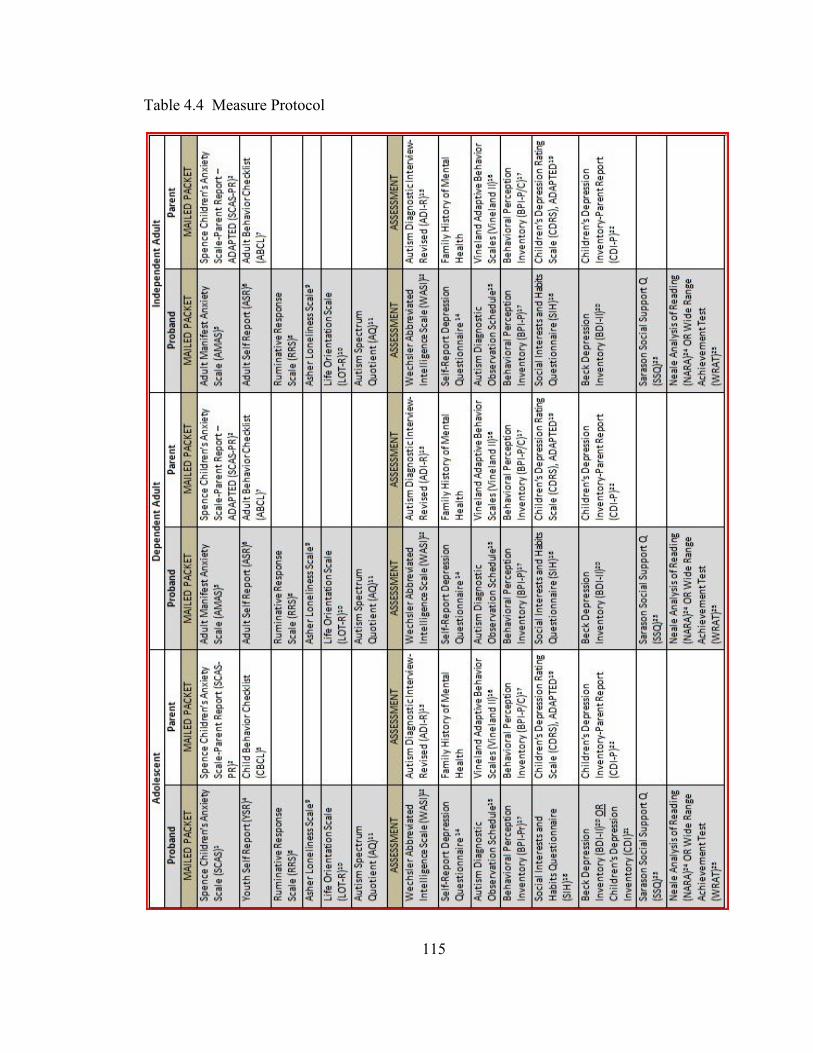
115
Table 4.4 Measure Protocol

116
1Spence, Barrett, & Turner, 2003 2Nauta et al., 2004 3Lowe & Reynolds, 2004 4Achenbach, 1991 5Achenbach & Rescorla, 2000 6Achenbach, 1997 7Tenneij & Koot, 2007 8Nolen-Hoeksema & Jackson, 2001 9Asher, Hymel, & Renshaw, 1984 10Scheier, Carver, & Bridges, 1994 11Baron-Cohen, Wheelwright, Skinner, Martin, & Clubley, 2001 12Wechsler, 1999 13Rutter, LeCouteur, & Lord, 2003 14Reynolds & Baker, 1988 15Lord et al., 2000 16Sparrow, Cicchetti, & Balla, 2005 17Gotham, Bishop, & Lord, unpublished 18Bishop, Gotham, & Lord, unpublished 19Poznanski & Mokros, 1996 20Beck, 1996 21Kovacs, 1992 22Wierzbicki, 1987 23Sarason, Sarason, Shearling, & Pierce, 1987 24Neale, 1997 25Wilkinson & Robertson, 2006
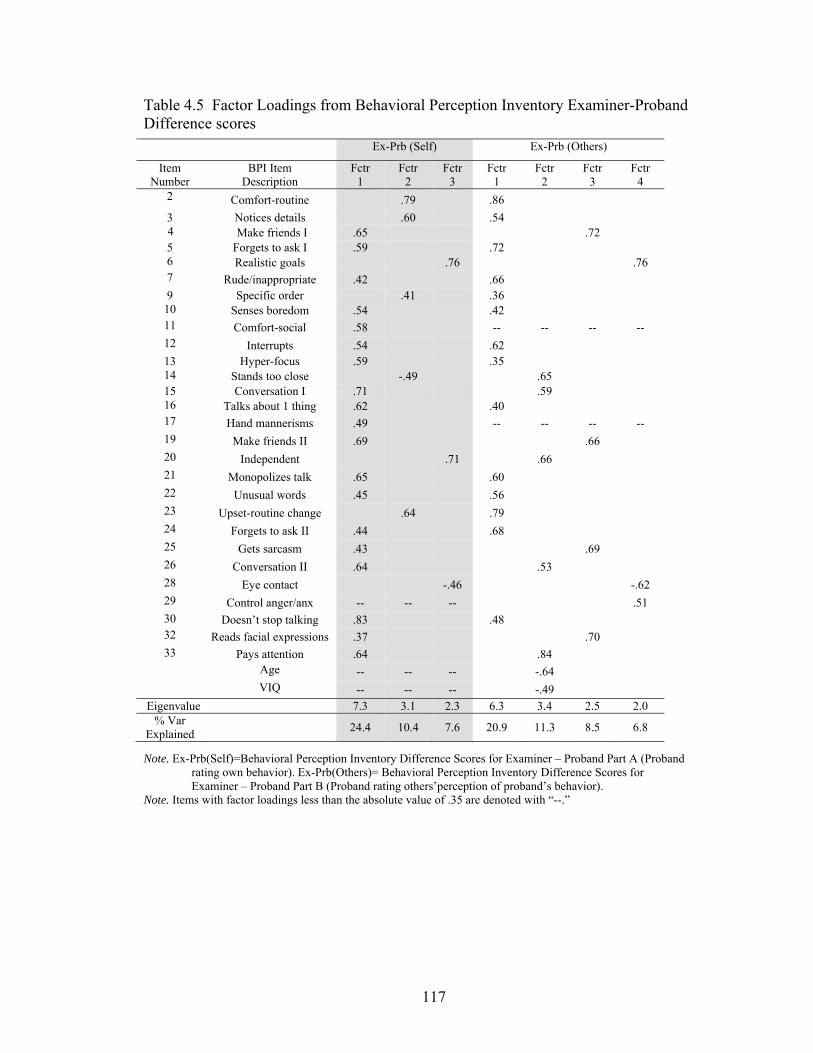
117
Table 4.5 Factor Loadings from Behavioral Perception Inventory Examiner-Proband Difference scores
Note. Ex-Prb(Self)=Behavioral Perception Inventory Difference Scores for Examiner – Proband Part A (Proband rating own behavior). Ex-Prb(Others)= Behavioral Perception Inventory Difference Scores for Examiner – Proband Part B (Proband rating others’perception of proband’s behavior).
Note. Items with factor loadings less than the absolute value of .35 are denoted with “--.”
Ex-Prb (Self) Ex-Prb (Others)
Item Number
BPI Item Description
Fctr 1
Fctr 2
Fctr 3
Fctr 1
Fctr 2
Fctr 3
Fctr 4
2 Comfort-routine .79 .86 3 Notices details .60 .54
4 Make friends I .65 .72 5 Forgets to ask I .59 .72 6 Realistic goals .76 .76 7 Rude/inappropriate .42 .66 9 Specific order .41 .36 10 Senses boredom .54 .42 11 Comfort-social .58 -- -- -- -- 12 Interrupts .54 .62 13 Hyper-focus .59 .35 14 Stands too close -.49 .65 15 Conversation I .71 .59 16 Talks about 1 thing .62 .40 17 Hand mannerisms .49 -- -- -- -- 19 Make friends II .69 .66 20 Independent .71 .66 21 Monopolizes talk .65 .60 22 Unusual words .45 .56 23 Upset-routine change .64 .79 24 Forgets to ask II .44 .68 25 Gets sarcasm .43 .69 26 Conversation II .64 .53 28 Eye contact -.46 -.62 29 Control anger/anx -- -- -- .51 30 Doesn’t stop talking .83 .48 32 Reads facial expressions .37 .70 33 Pays attention .64 .84 Age -- -- -- -.64 VIQ -- -- -- -.49
Eigenvalue 7.3 3.1 2.3 6.3 3.4 2.5 2.0 % Var
Explained 24.4 10.4 7.6 20.9 11.3 8.5 6.8
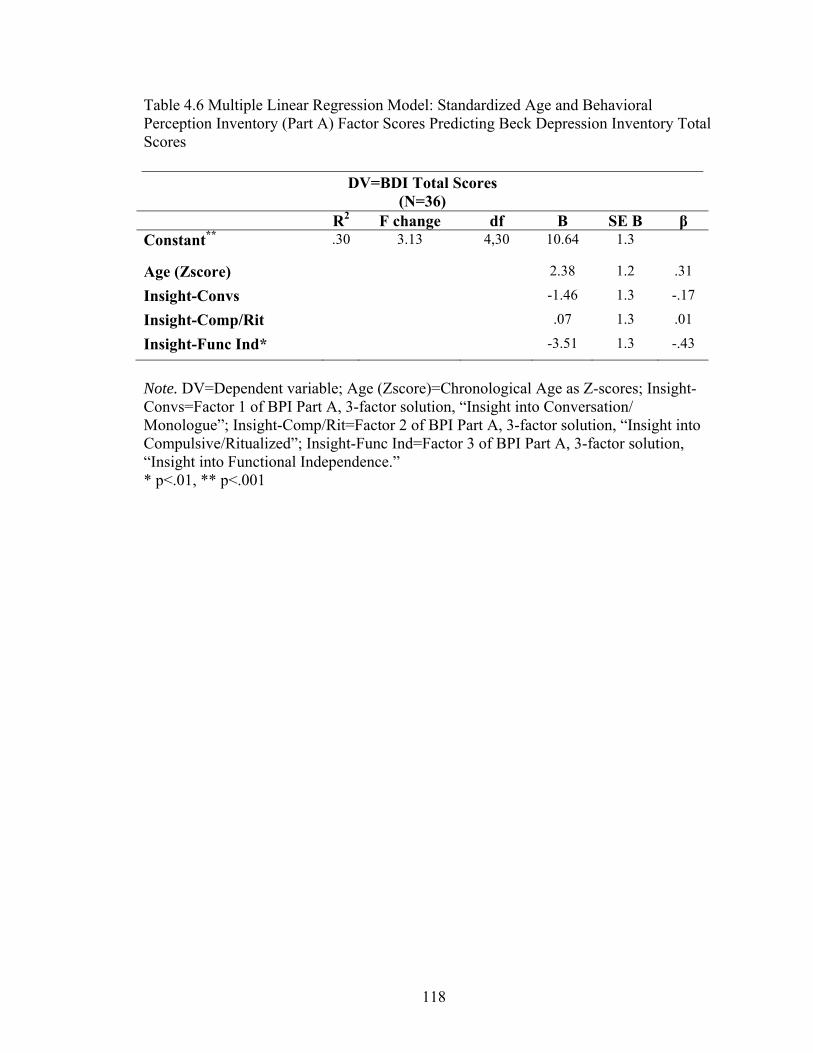
118
Table 4.6 Multiple Linear Regression Model: Standardized Age and Behavioral Perception Inventory (Part A) Factor Scores Predicting Beck Depression Inventory Total Scores
Note. DV=Dependent variable; Age (Zscore)=Chronological Age as Z-scores; Insight-Convs=Factor 1 of BPI Part A, 3-factor solution, “Insight into Conversation/ Monologue”; Insight-Comp/Rit=Factor 2 of BPI Part A, 3-factor solution, “Insight into Compulsive/Ritualized”; Insight-Func Ind=Factor 3 of BPI Part A, 3-factor solution, “Insight into Functional Independence.” * p<.01, ** p<.001
DV=BDI Total Scores (N=36)
R2 F change df B SE B β Constant** .30 3.13 4,30 10.64 1.3
Age (Zscore) 2.38 1.2 .31
Insight-Convs -1.46 1.3 -.17
Insight-Comp/Rit .07 1.3 .01
Insight-Func Ind* -3.51 1.3 -.43
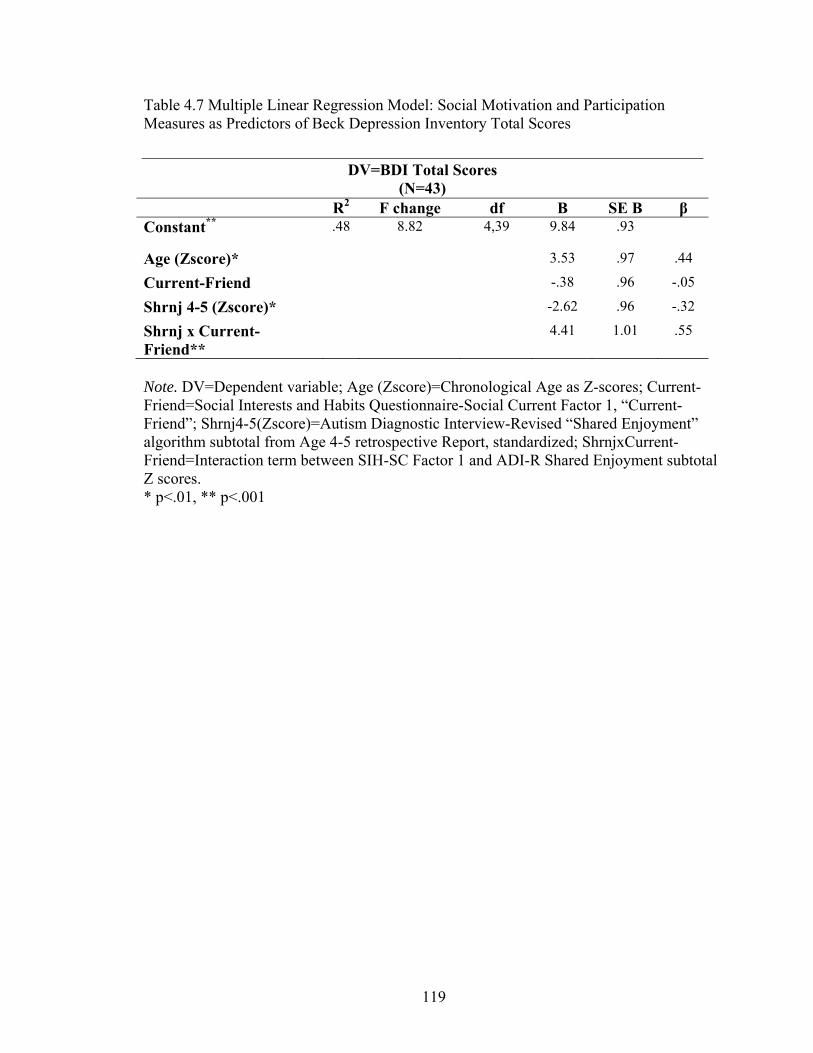
119
Table 4.7 Multiple Linear Regression Model: Social Motivation and Participation Measures as Predictors of Beck Depression Inventory Total Scores
Note. DV=Dependent variable; Age (Zscore)=Chronological Age as Z-scores; Current-Friend=Social Interests and Habits Questionnaire-Social Current Factor 1, “Current-Friend”; Shrnj4-5(Zscore)=Autism Diagnostic Interview-Revised “Shared Enjoyment” algorithm subtotal from Age 4-5 retrospective Report, standardized; ShrnjxCurrent-Friend=Interaction term between SIH-SC Factor 1 and ADI-R Shared Enjoyment subtotal Z scores. * p<.01, ** p<.001
DV=BDI Total Scores (N=43)
R2 F change df B SE B β Constant** .48 8.82 4,39 9.84 .93
Age (Zscore)* 3.53 .97 .44
Current-Friend -.38 .96 -.05
Shrnj 4-5 (Zscore)* -2.62 .96 -.32
Shrnj x Current-Friend**
4.41 1.01 .55
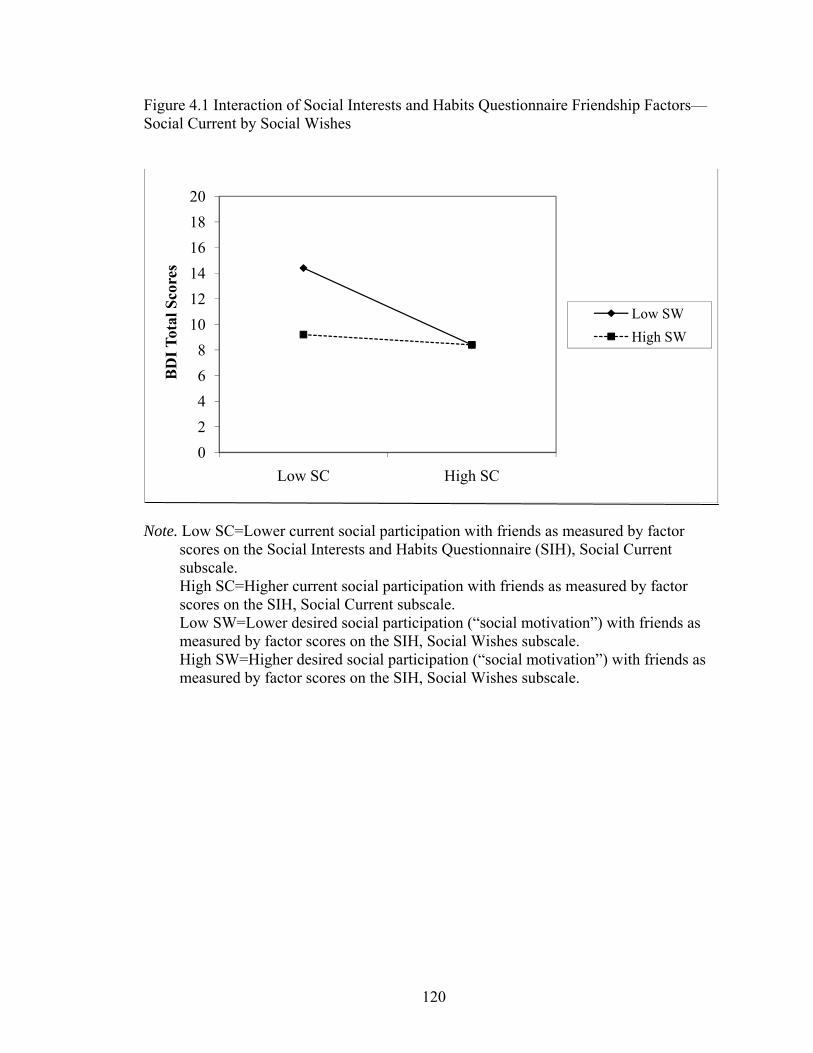
120
Figure 4.1 Interaction of Social Interests and Habits Questionnaire Friendship Factors—Social Current by Social Wishes
Note. Low SC=Lower current social participation with friends as measured by factor
scores on the Social Interests and Habits Questionnaire (SIH), Social Current subscale. High SC=Higher current social participation with friends as measured by factor scores on the SIH, Social Current subscale. Low SW=Lower desired social participation (“social motivation”) with friends as measured by factor scores on the SIH, Social Wishes subscale. High SW=Higher desired social participation (“social motivation”) with friends as measured by factor scores on the SIH, Social Wishes subscale.
02468
101214161820
Low SC High SC
BD
I Tot
al S
core
s
Low SWHigh SW
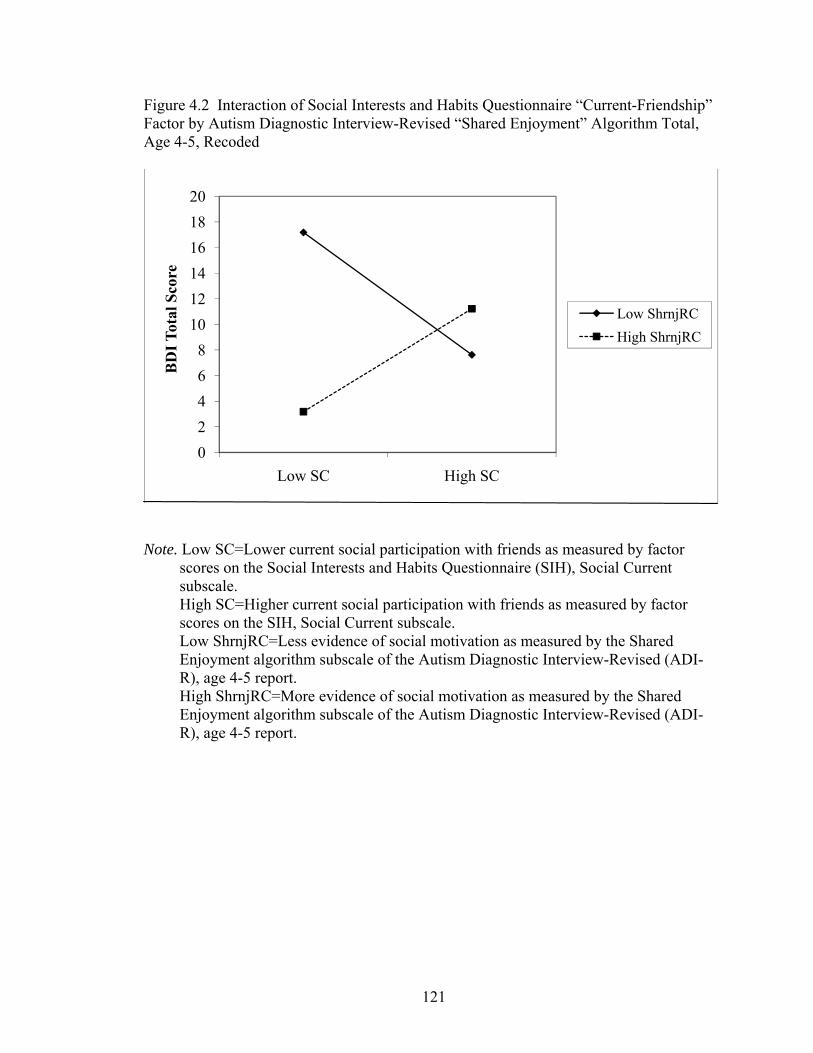
121
Figure 4.2 Interaction of Social Interests and Habits Questionnaire “Current-Friendship” Factor by Autism Diagnostic Interview-Revised “Shared Enjoyment” Algorithm Total, Age 4-5, Recoded
Note. Low SC=Lower current social participation with friends as measured by factor
scores on the Social Interests and Habits Questionnaire (SIH), Social Current subscale. High SC=Higher current social participation with friends as measured by factor scores on the SIH, Social Current subscale. Low ShrnjRC=Less evidence of social motivation as measured by the Shared Enjoyment algorithm subscale of the Autism Diagnostic Interview-Revised (ADI-R), age 4-5 report. High ShrnjRC=More evidence of social motivation as measured by the Shared Enjoyment algorithm subscale of the Autism Diagnostic Interview-Revised (ADI-R), age 4-5 report.
02468
101214161820
Low SC High SC
BD
I Tot
al S
core
Low ShrnjRCHigh ShrnjRC
122
Appendix A: Behavioral Perception Inventory
List of Measures
1. Behavioral Perception Inventory (BPI): Proband Form…..………………...…123
2. Behavioral Perception Inventory (BPI): Parent/Caregiver Form………………143
3. Behavioral Perception Inventory (BPI): Examiner Form..………….…………149
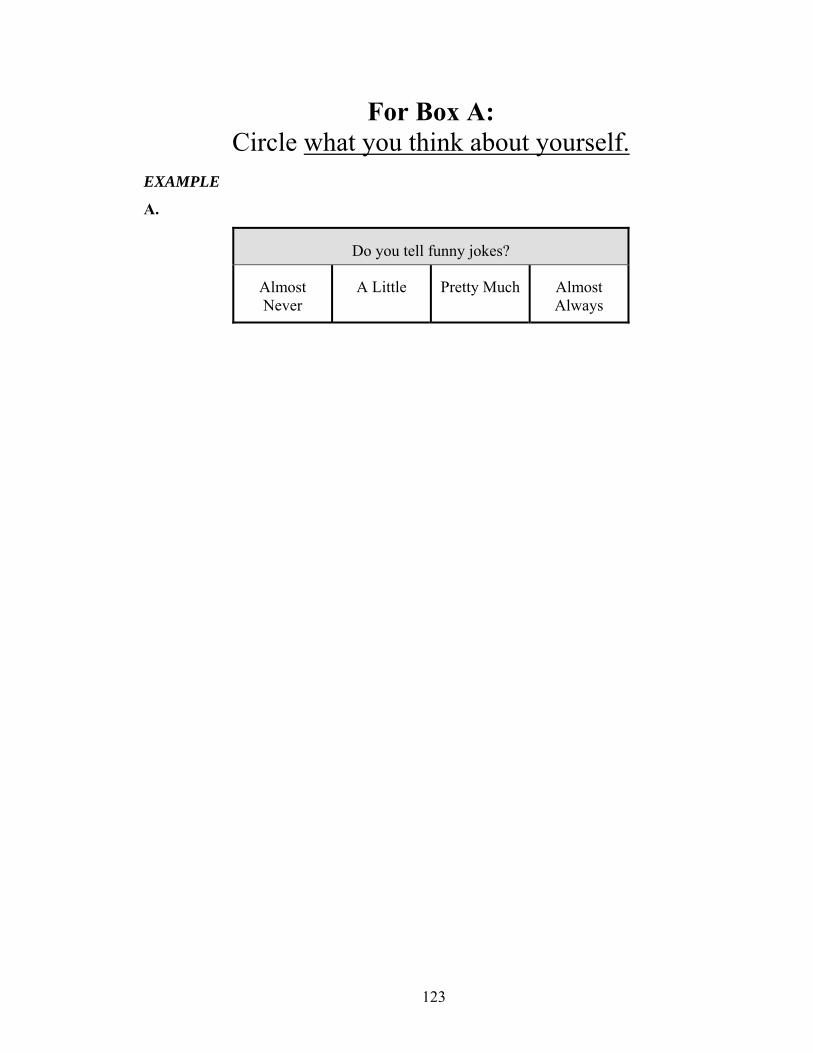
123
For Box A: Circle what you think about yourself.
EXAMPLE
A.
Do you tell funny jokes?
Almost Never
A Little
Pretty Much
Almost Always
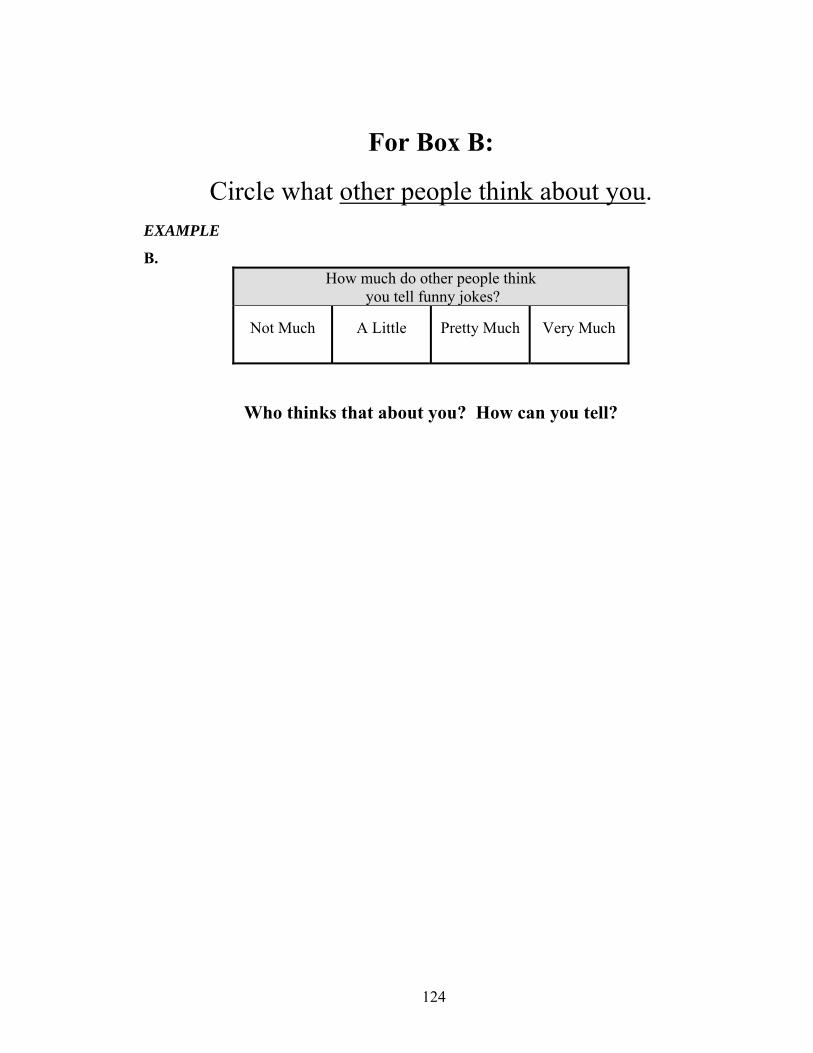
124
For Box B:
Circle what other people think about you. EXAMPLE
B. How much do other people think
you tell funny jokes?
Not Much
A Little
Pretty Much
Very Much
Who thinks that about you? How can you tell?
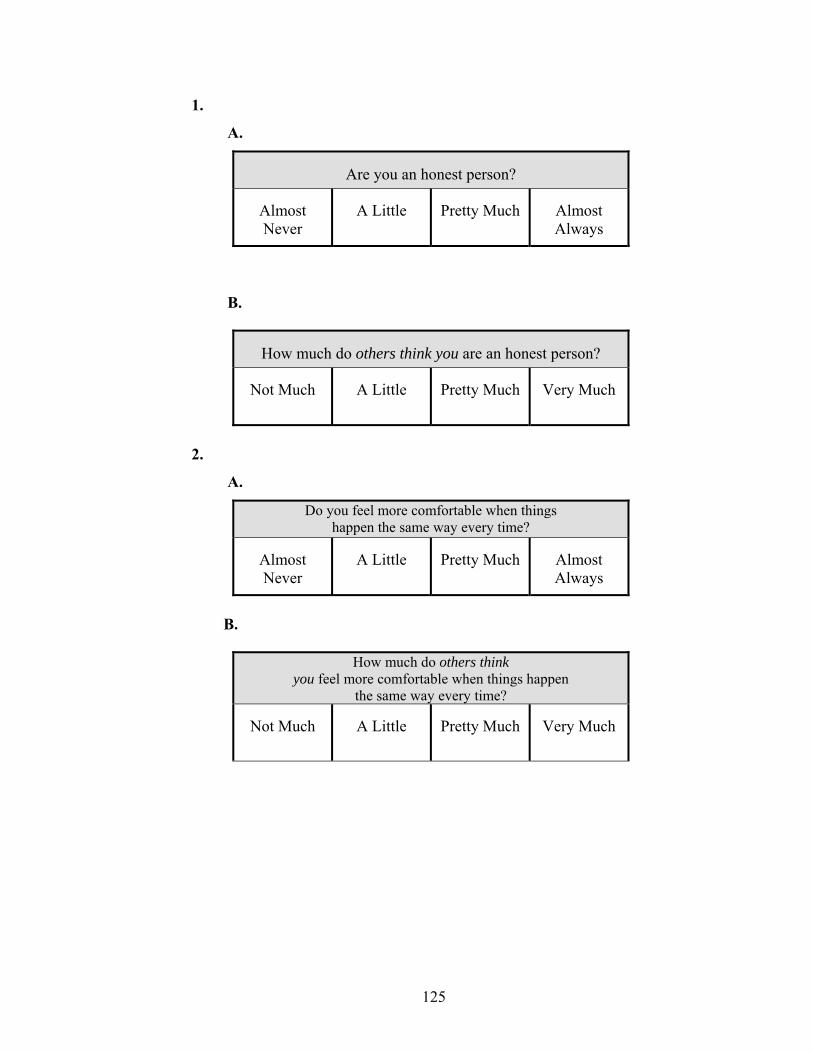
125
1.
A.
Are you an honest person?
Almost Never
A Little
Pretty Much
Almost Always
B.
How much do others think you are an honest person?
Not Much
A Little
Pretty Much
Very Much
2.
A.
Do you feel more comfortable when things happen the same way every time?
Almost Never
A Little
Pretty Much
Almost Always
B.
How much do others think you feel more comfortable when things happen
the same way every time?
Not Much
A Little
Pretty Much
Very Much

126
3.
A.
Do you notice or remember details that most people do not?
Almost Never
A Little
Pretty Much
Almost Always
B.
How much do others think you notice or remember details that most people do not?
Not Much
A Little
Pretty Much
Very Much
4.
A.
Is it easy for you to make new friends?
Almost Never
A Little
Pretty Much
Almost Always
B.
How much do others think that it is easy for you to make new friends?
Not Much
A Little
Pretty Much
Very Much
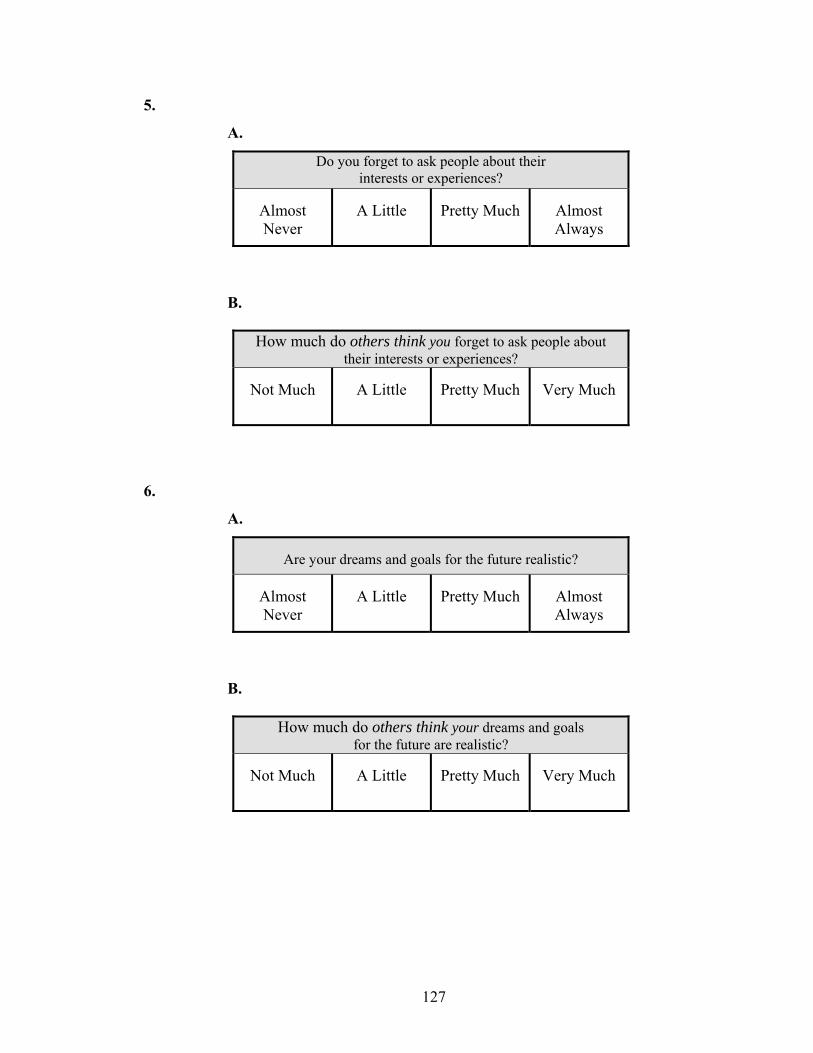
127
5.
A.
Do you forget to ask people about their interests or experiences?
Almost Never
A Little
Pretty Much
Almost Always
B.
How much do others think you forget to ask people about their interests or experiences?
Not Much
A Little
Pretty Much
Very Much
6.
A.
Are your dreams and goals for the future realistic?
Almost Never
A Little
Pretty Much
Almost Always
B.
How much do others think your dreams and goals for the future are realistic?
Not Much
A Little
Pretty Much
Very Much
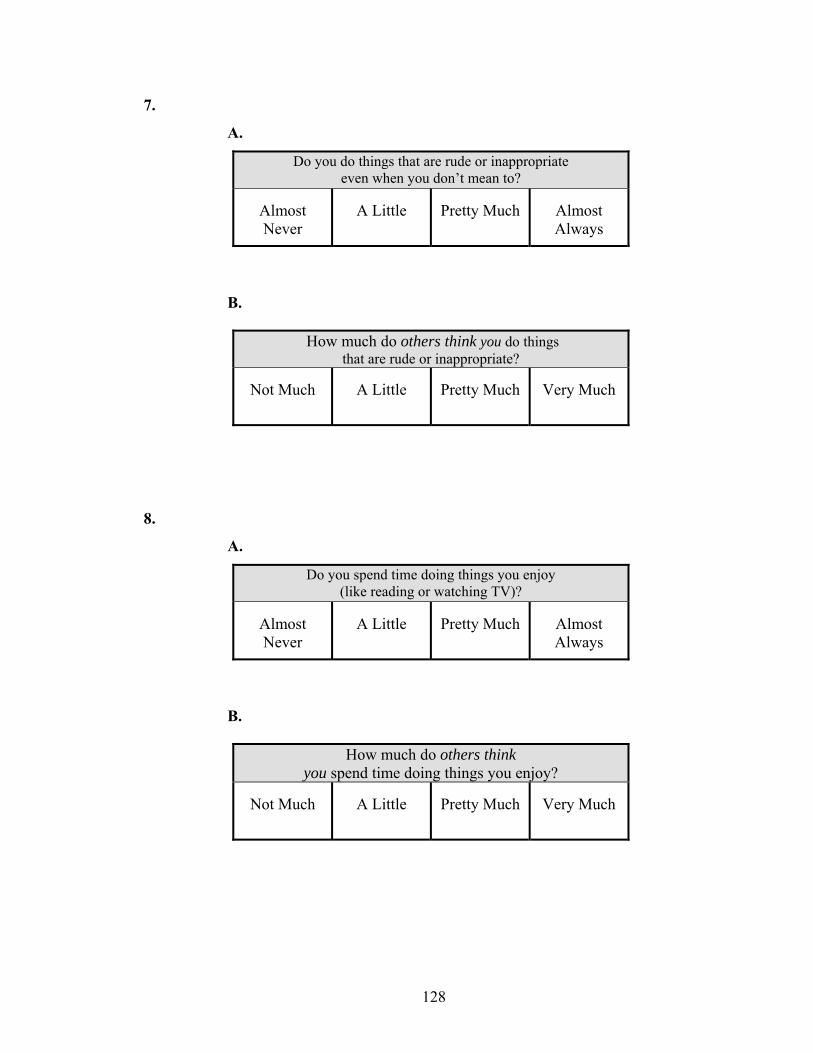
128
7.
A.
Do you do things that are rude or inappropriate even when you don’t mean to?
Almost Never
A Little
Pretty Much
Almost Always
B.
How much do others think you do things that are rude or inappropriate?
Not Much
A Little
Pretty Much
Very Much
8.
A.
Do you spend time doing things you enjoy (like reading or watching TV)?
Almost Never
A Little
Pretty Much
Almost Always
B.
How much do others think you spend time doing things you enjoy?
Not Much
A Little
Pretty Much
Very Much
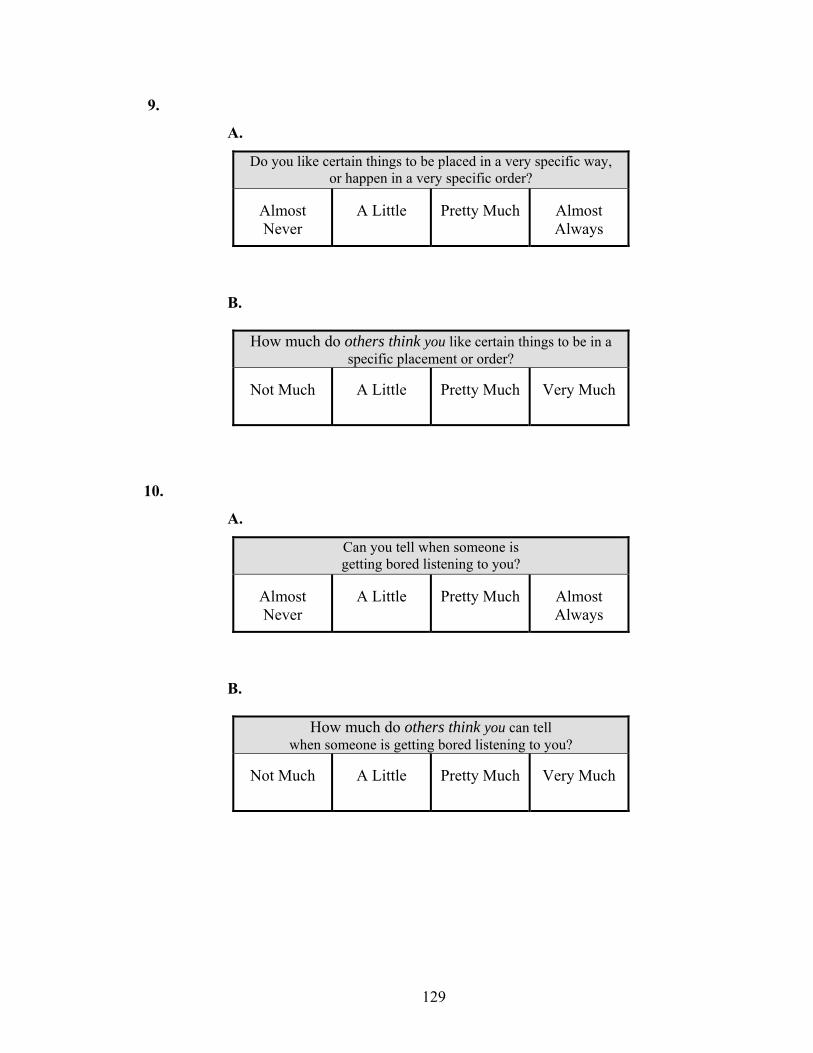
129
9.
A.
Do you like certain things to be placed in a very specific way, or happen in a very specific order?
Almost Never
A Little
Pretty Much
Almost Always
B.
How much do others think you like certain things to be in a specific placement or order?
Not Much
A Little
Pretty Much
Very Much
10.
A.
Can you tell when someone is getting bored listening to you?
Almost Never
A Little
Pretty Much
Almost Always
B.
How much do others think you can tell when someone is getting bored listening to you?
Not Much
A Little
Pretty Much
Very Much
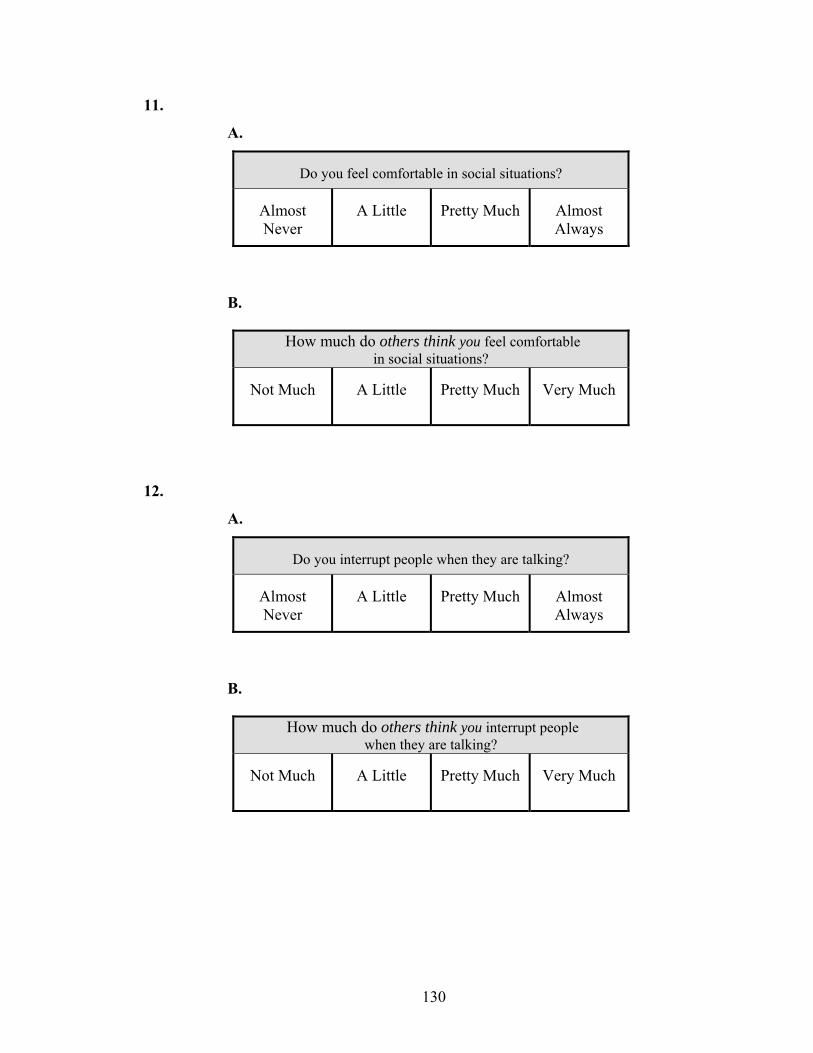
130
11.
A.
Do you feel comfortable in social situations?
Almost Never
A Little
Pretty Much
Almost Always
B.
How much do others think you feel comfortable in social situations?
Not Much
A Little
Pretty Much
Very Much
12.
A.
Do you interrupt people when they are talking?
Almost Never
A Little
Pretty Much
Almost Always
B.
How much do others think you interrupt people when they are talking?
Not Much
A Little
Pretty Much
Very Much
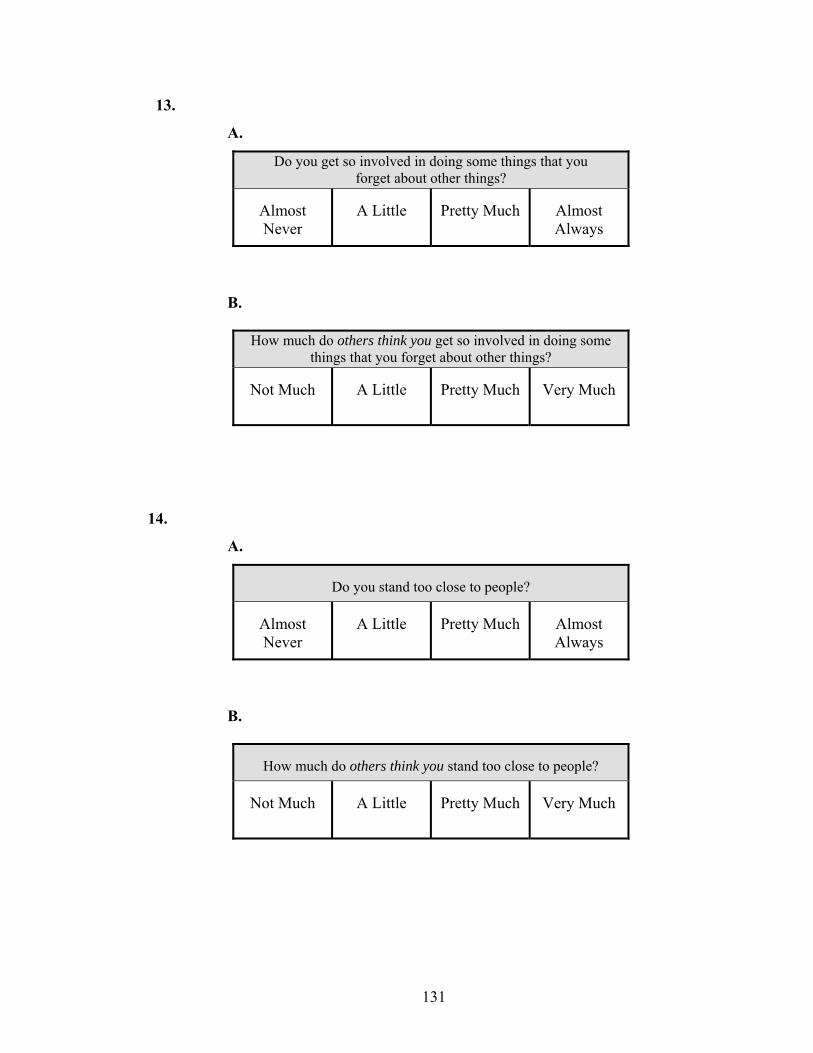
131
13.
A.
Do you get so involved in doing some things that you forget about other things?
Almost Never
A Little
Pretty Much
Almost Always
B.
How much do others think you get so involved in doing some things that you forget about other things?
Not Much
A Little
Pretty Much
Very Much
14.
A.
Do you stand too close to people?
Almost Never
A Little
Pretty Much
Almost Always
B.
How much do others think you stand too close to people?
Not Much
A Little
Pretty Much
Very Much
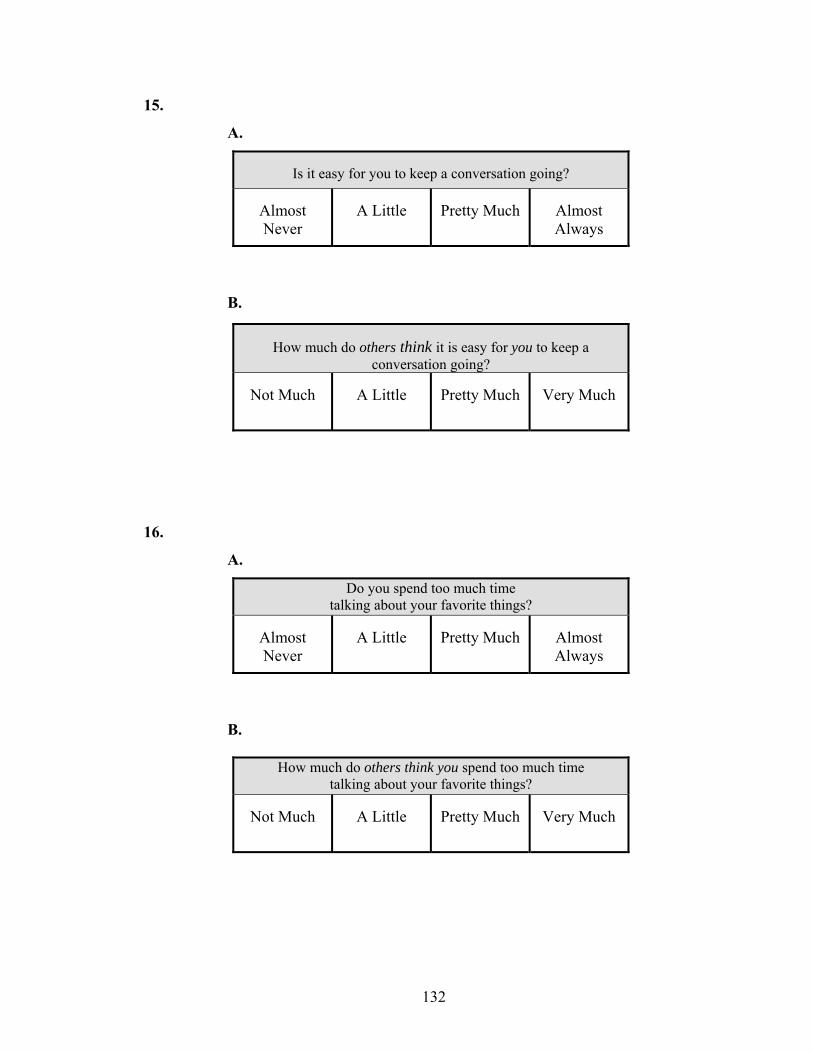
132
15.
A.
Is it easy for you to keep a conversation going?
Almost Never
A Little
Pretty Much
Almost Always
B.
16.
A.
Do you spend too much time talking about your favorite things?
Almost Never
A Little
Pretty Much
Almost Always
B.
How much do others think you spend too much time talking about your favorite things?
Not Much
A Little
Pretty Much
Very Much
How much do others think it is easy for you to keep a
conversation going?
Not Much
A Little
Pretty Much
Very Much
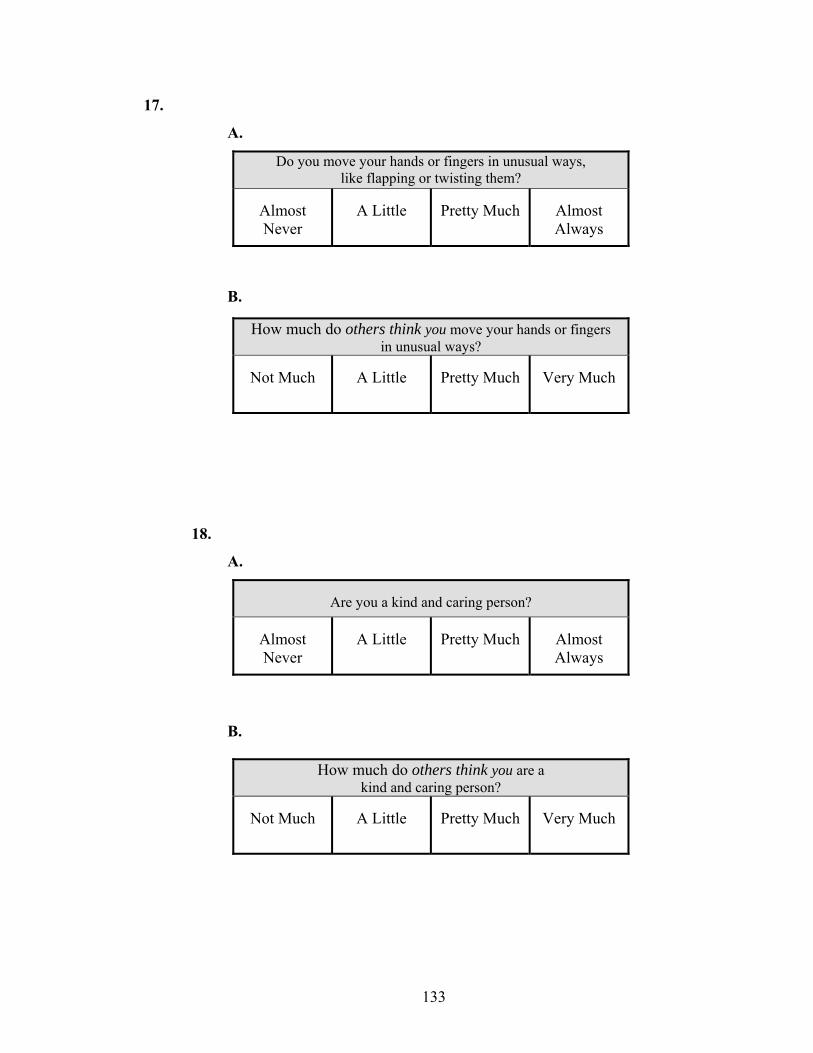
133
17.
A.
Do you move your hands or fingers in unusual ways, like flapping or twisting them?
Almost Never
A Little
Pretty Much
Almost Always
B.
How much do others think you move your hands or fingers in unusual ways?
Not Much
A Little
Pretty Much
Very Much
18.
A.
Are you a kind and caring person?
Almost Never
A Little
Pretty Much
Almost Always
B.
How much do others think you are a kind and caring person?
Not Much
A Little
Pretty Much
Very Much

134
19.
A.
Is it difficult for you to make new friends?
Almost Never
A Little
Pretty Much
Almost Always
B.
How much do others think that it is difficult for you to make new friends?
Not Much
A Little
Pretty Much
Very Much
20.
A.
Are you independent in taking care of yourself?
Almost Never
A Little
Pretty Much
Almost Always
B.
How much do others think you are independent in taking care of yourself?
Not Much
A Little
Pretty Much
Very Much
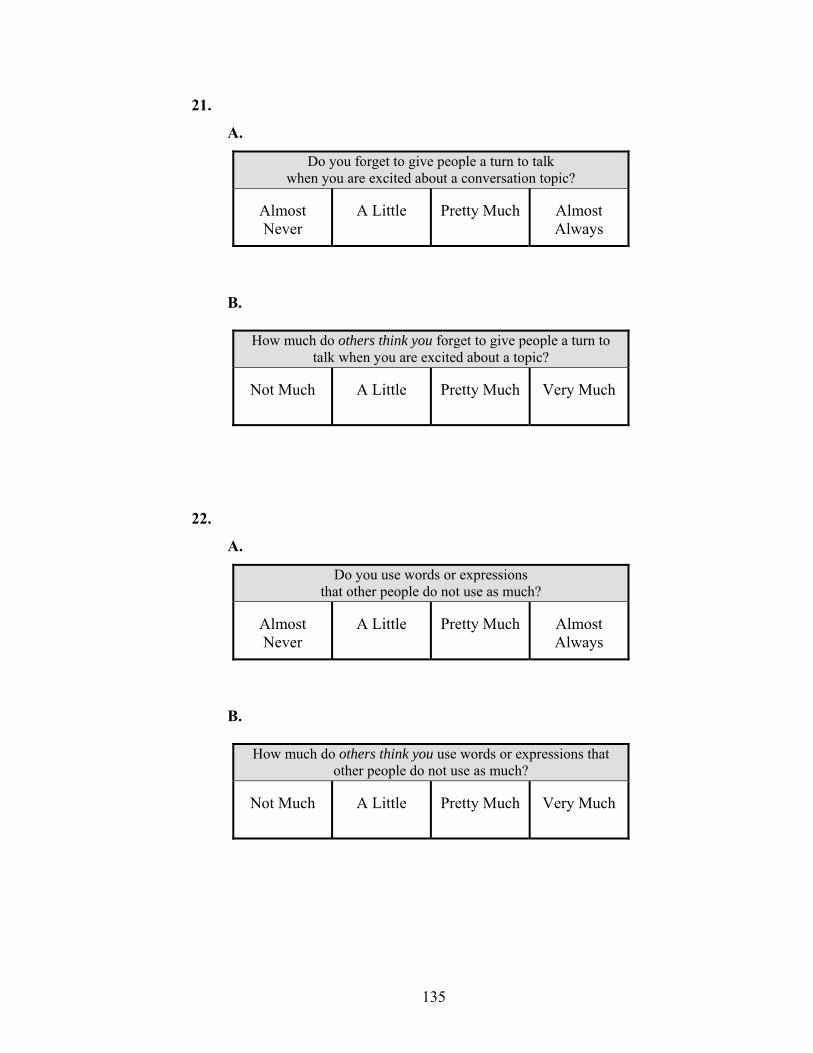
135
21.
A.
Do you forget to give people a turn to talk when you are excited about a conversation topic?
Almost Never
A Little
Pretty Much
Almost Always
B.
How much do others think you forget to give people a turn to talk when you are excited about a topic?
Not Much
A Little
Pretty Much
Very Much
22.
A.
Do you use words or expressions that other people do not use as much?
Almost Never
A Little
Pretty Much
Almost Always
B.
How much do others think you use words or expressions that other people do not use as much?
Not Much
A Little
Pretty Much
Very Much
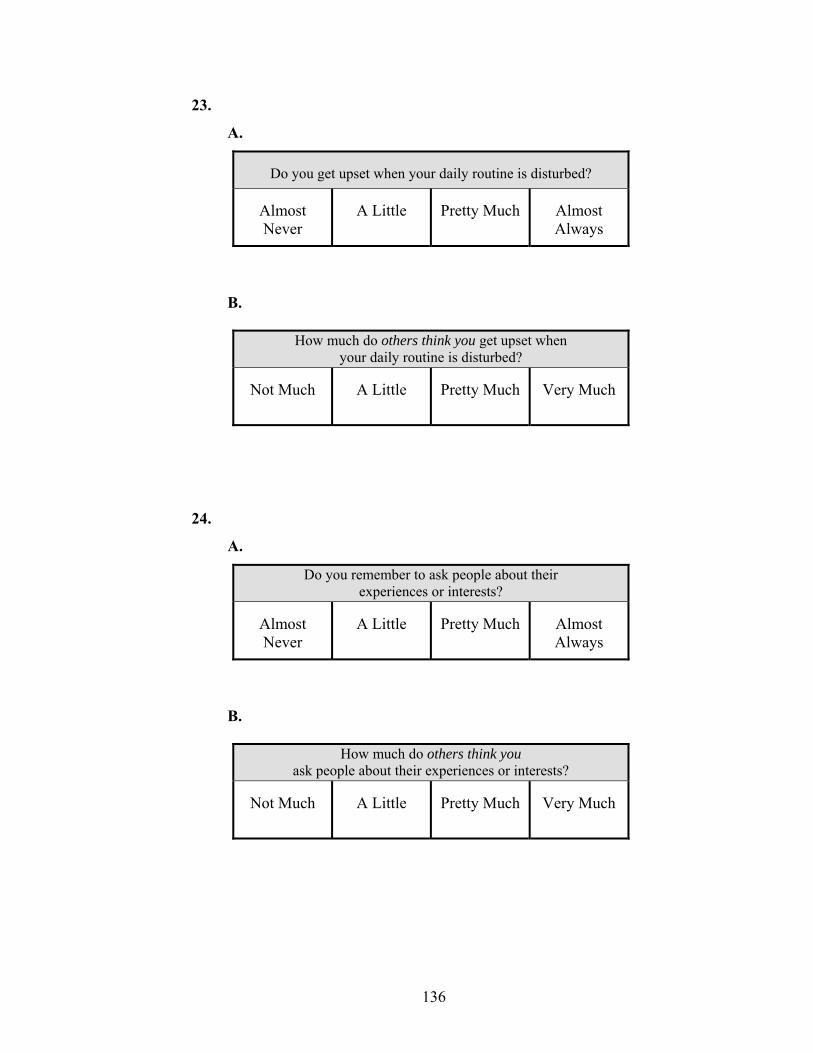
136
23.
A.
Do you get upset when your daily routine is disturbed?
Almost Never
A Little
Pretty Much
Almost Always
B.
How much do others think you get upset when your daily routine is disturbed?
Not Much
A Little
Pretty Much
Very Much
24.
A.
Do you remember to ask people about their experiences or interests?
Almost Never
A Little
Pretty Much
Almost Always
B.
How much do others think you ask people about their experiences or interests?
Not Much
A Little
Pretty Much
Very Much
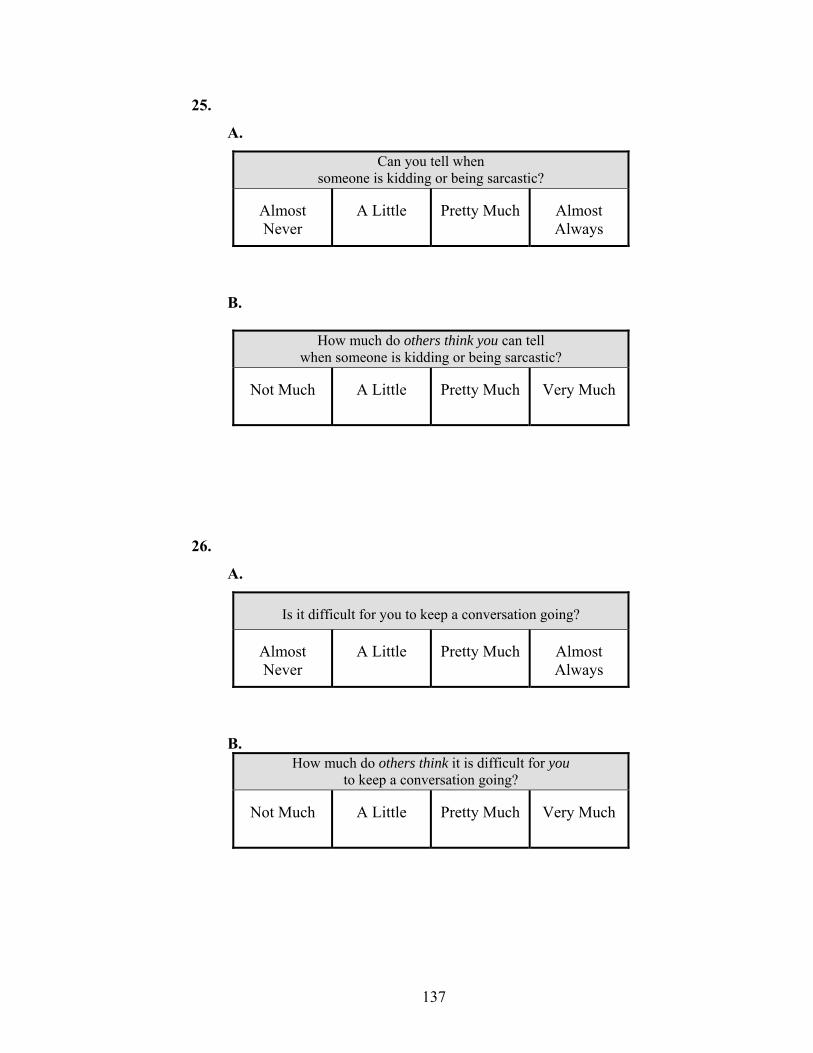
137
25.
A.
Can you tell when someone is kidding or being sarcastic?
Almost Never
A Little
Pretty Much
Almost Always
B.
How much do others think you can tell when someone is kidding or being sarcastic?
Not Much
A Little
Pretty Much
Very Much
26.
A.
Is it difficult for you to keep a conversation going?
Almost Never
A Little
Pretty Much
Almost Always
B.
How much do others think it is difficult for you to keep a conversation going?
Not Much
A Little
Pretty Much
Very Much
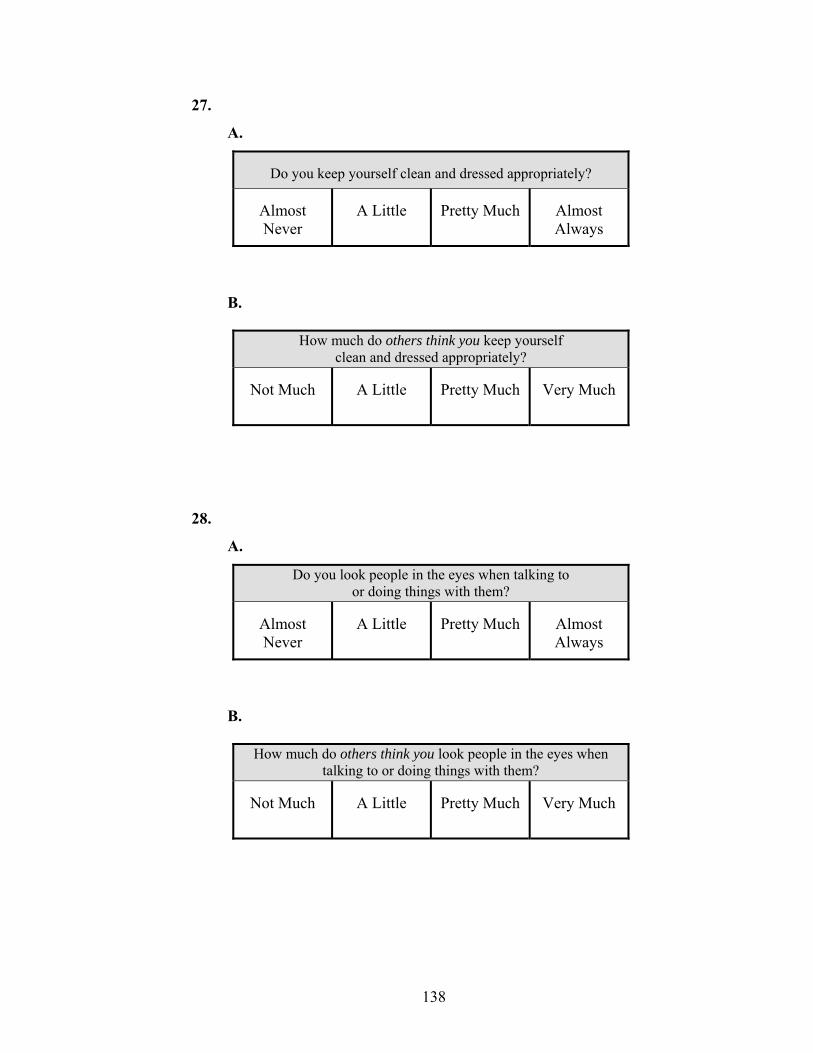
138
27.
A.
Do you keep yourself clean and dressed appropriately?
Almost Never
A Little
Pretty Much
Almost Always
B.
How much do others think you keep yourself clean and dressed appropriately?
Not Much
A Little
Pretty Much
Very Much
28.
A.
Do you look people in the eyes when talking to or doing things with them?
Almost Never
A Little
Pretty Much
Almost Always
B.
How much do others think you look people in the eyes when talking to or doing things with them?
Not Much
A Little
Pretty Much
Very Much
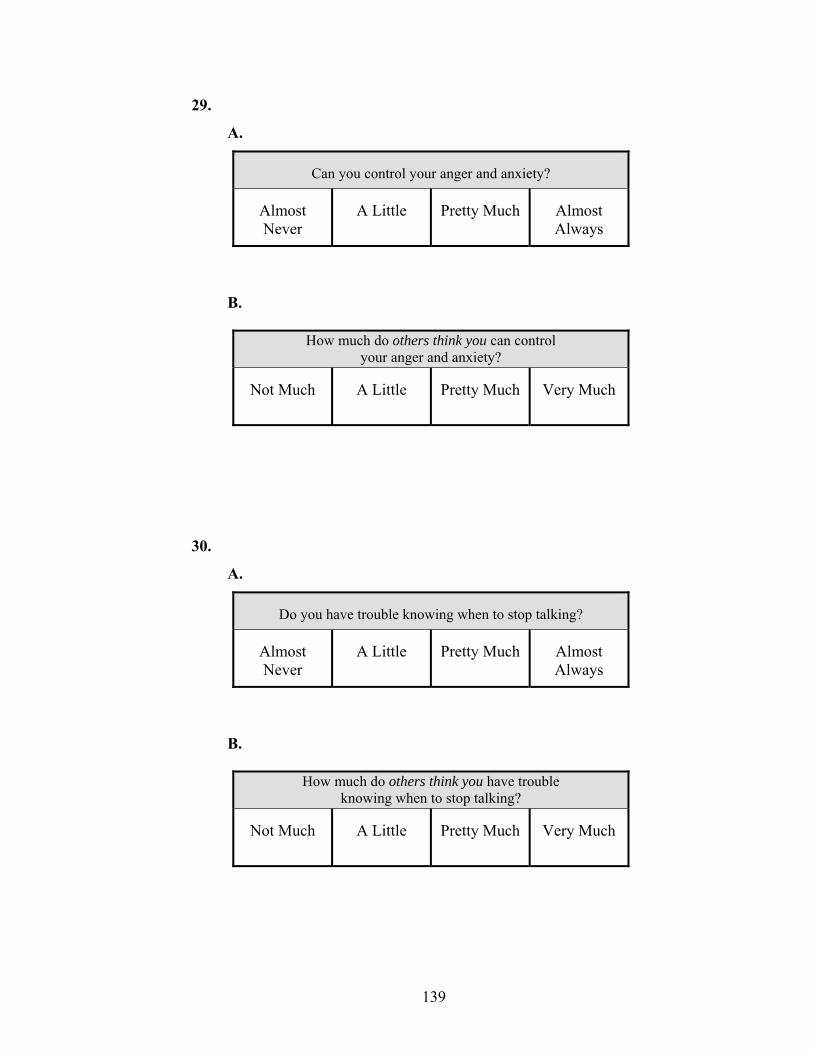
139
29.
A.
Can you control your anger and anxiety?
Almost Never
A Little
Pretty Much
Almost Always
B.
How much do others think you can control your anger and anxiety?
Not Much
A Little
Pretty Much
Very Much
30.
A.
Do you have trouble knowing when to stop talking?
Almost Never
A Little
Pretty Much
Almost Always
B.
How much do others think you have trouble knowing when to stop talking?
Not Much
A Little
Pretty Much
Very Much
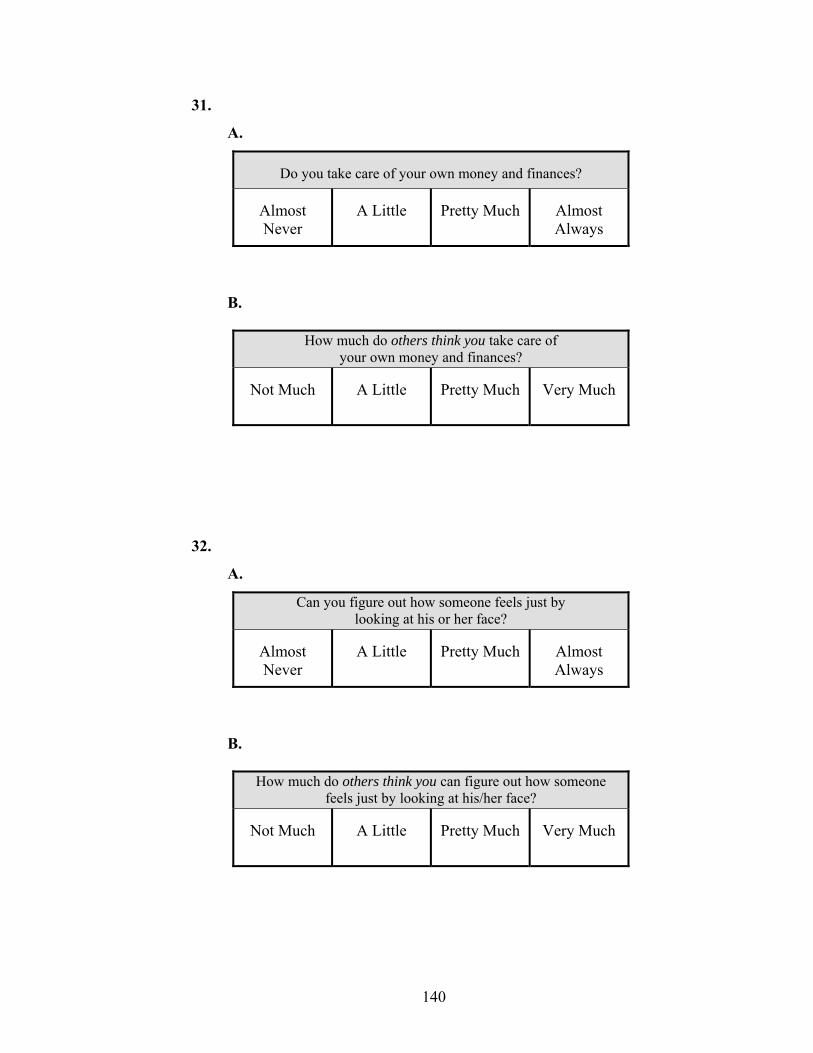
140
31.
A.
Do you take care of your own money and finances?
Almost Never
A Little
Pretty Much
Almost Always
B.
How much do others think you take care of your own money and finances?
Not Much
A Little
Pretty Much
Very Much
32.
A.
Can you figure out how someone feels just by looking at his or her face?
Almost Never
A Little
Pretty Much
Almost Always
B.
How much do others think you can figure out how someone feels just by looking at his/her face?
Not Much
A Little
Pretty Much
Very Much
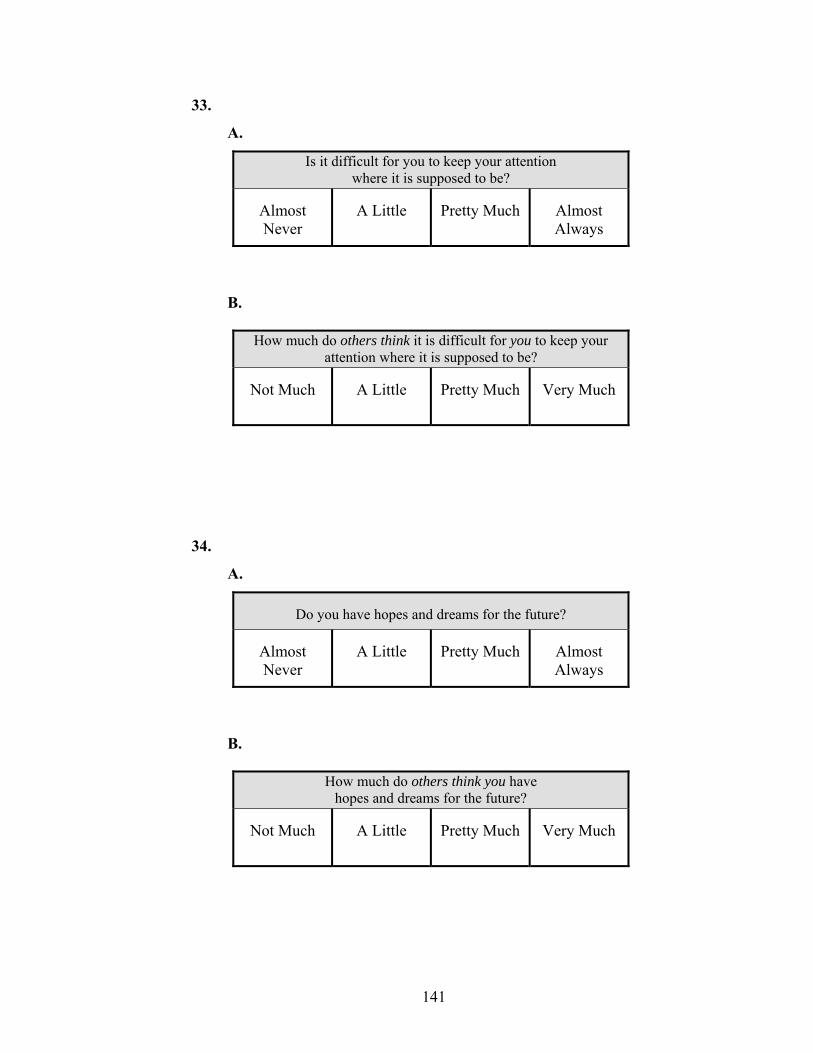
141
33.
A.
Is it difficult for you to keep your attention where it is supposed to be?
Almost Never
A Little
Pretty Much
Almost Always
B.
How much do others think it is difficult for you to keep your attention where it is supposed to be?
Not Much
A Little
Pretty Much
Very Much
34.
A.
Do you have hopes and dreams for the future?
Almost Never
A Little
Pretty Much
Almost Always
B.
How much do others think you have hopes and dreams for the future?
Not Much
A Little
Pretty Much
Very Much
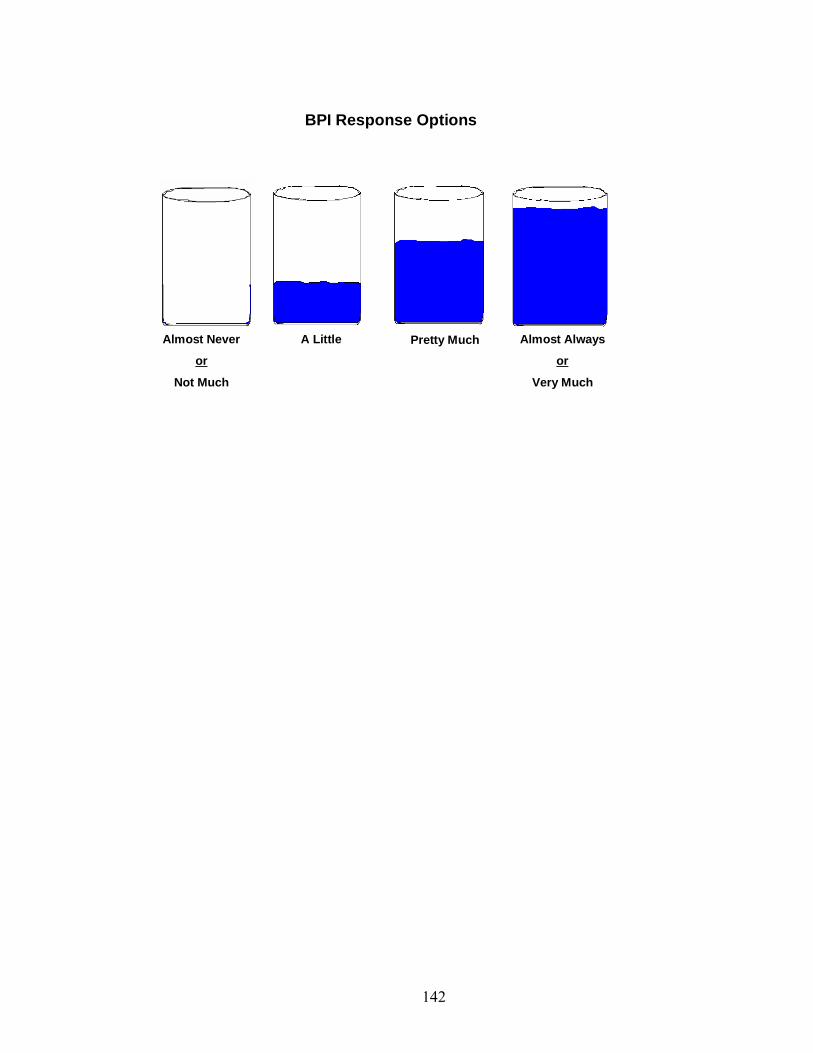
142
Almost Always
or
Very Much
Pretty MuchAlmost Never
or
Not Much
A Little
BPI Response Options
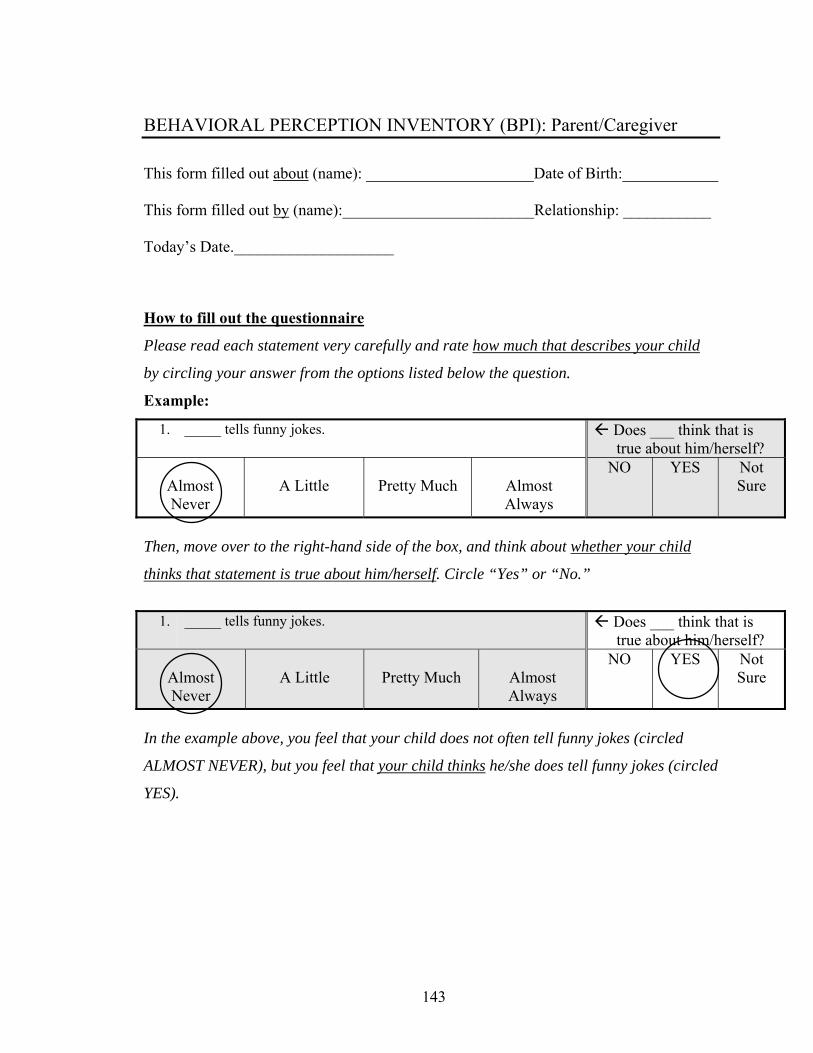
143
BEHAVIORAL PERCEPTION INVENTORY (BPI): Parent/Caregiver
This form filled out about (name): _____________________Date of Birth:____________ This form filled out by (name):________________________Relationship: ___________ Today’s Date.____________________
How to fill out the questionnaire
Please read each statement very carefully and rate how much that describes your child
by circling your answer from the options listed below the question.
Example:
1. _____ tells funny jokes. Does ___ think that is true about him/herself?
Almost Never
A Little
Pretty Much
Almost Always
NO YES Not Sure
Then, move over to the right-hand side of the box, and think about whether your child
thinks that statement is true about him/herself. Circle “Yes” or “No.”
1. _____ tells funny jokes. Does ___ think that is
true about him/herself?
Almost Never
A Little
Pretty Much
Almost Always
NO YES Not Sure
In the example above, you feel that your child does not often tell funny jokes (circled
ALMOST NEVER), but you feel that your child thinks he/she does tell funny jokes (circled
YES).
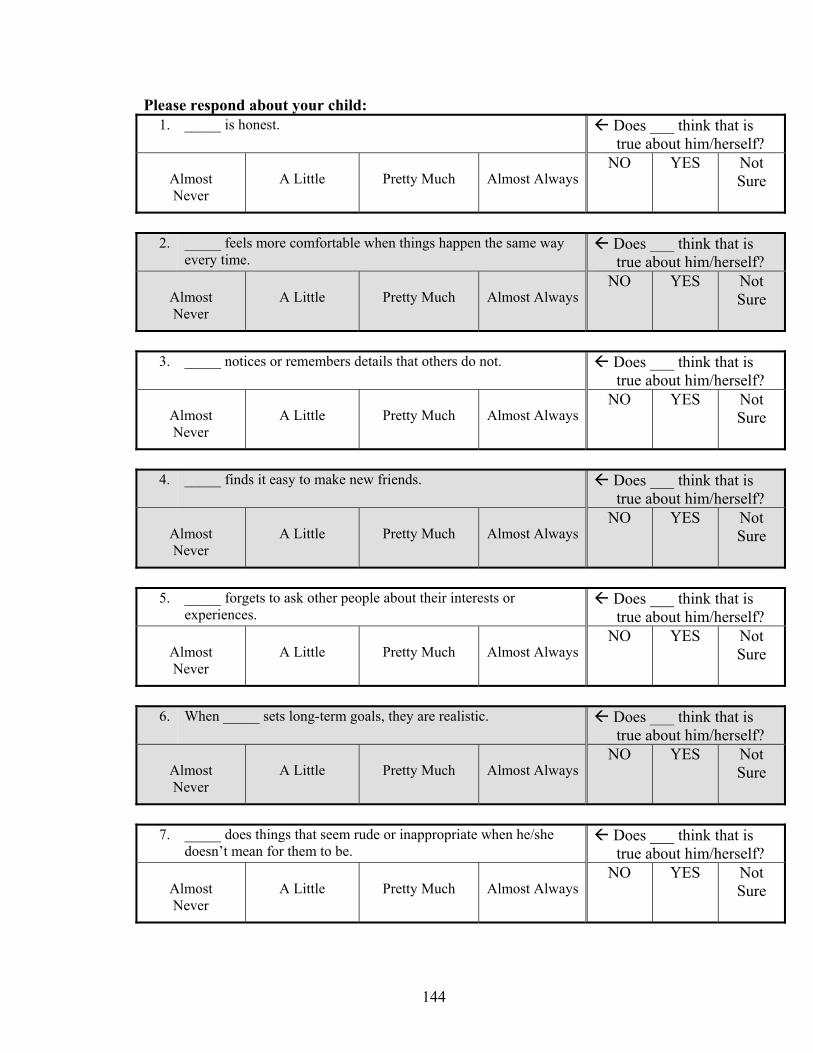
144
Please respond about your child: 1. _____ is honest. Does ___ think that is
true about him/herself?
Almost Never
A Little
Pretty Much
Almost Always
NO YES Not Sure
2. _____ feels more comfortable when things happen the same way
every time. Does ___ think that is true about him/herself?
Almost Never
A Little
Pretty Much
Almost Always
NO YES Not Sure
3. _____ notices or remembers details that others do not. Does ___ think that is
true about him/herself?
Almost Never
A Little
Pretty Much
Almost Always
NO YES Not Sure
4. _____ finds it easy to make new friends. Does ___ think that is
true about him/herself?
Almost Never
A Little
Pretty Much
Almost Always
NO YES Not Sure
5. _____ forgets to ask other people about their interests or
experiences. Does ___ think that is true about him/herself?
Almost Never
A Little
Pretty Much
Almost Always
NO YES Not Sure
6. When _____ sets long-term goals, they are realistic. Does ___ think that is
true about him/herself?
Almost Never
A Little
Pretty Much
Almost Always
NO YES Not Sure
7. _____ does things that seem rude or inappropriate when he/she
doesn’t mean for them to be. Does ___ think that is true about him/herself?
Almost Never
A Little
Pretty Much
Almost Always
NO YES Not Sure
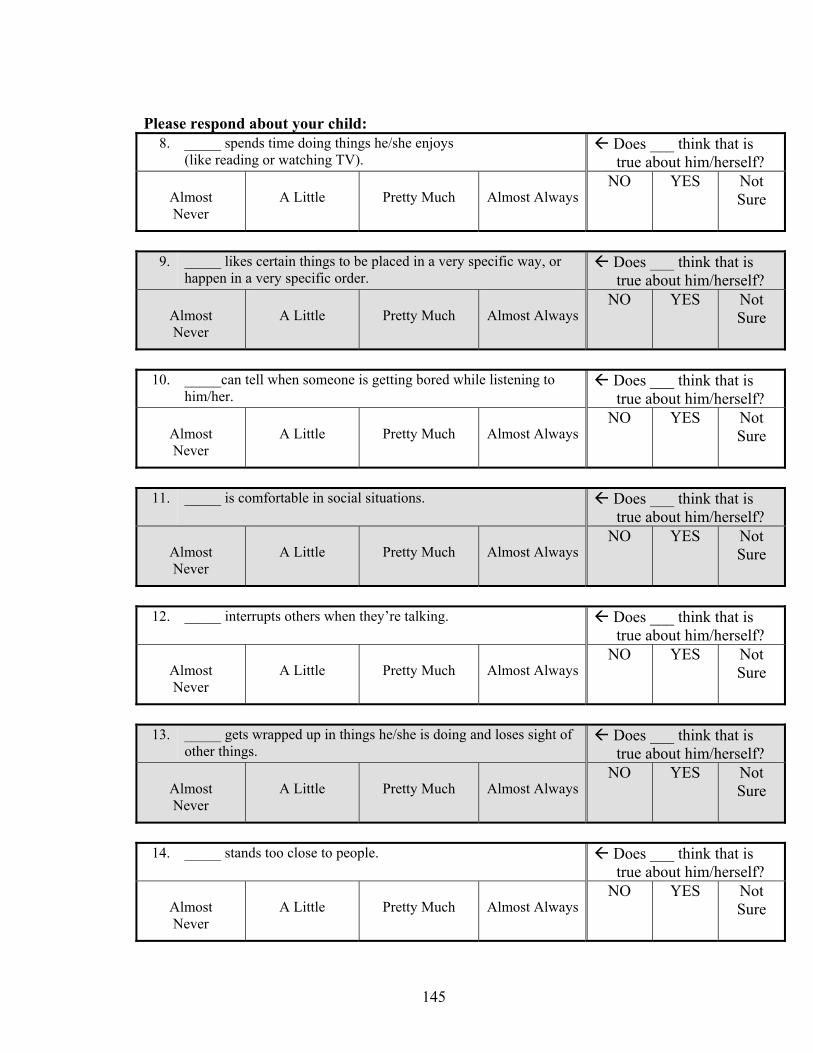
145
Please respond about your child:
8. _____ spends time doing things he/she enjoys (like reading or watching TV).
Does ___ think that is true about him/herself?
Almost Never
A Little
Pretty Much
Almost Always
NO YES Not Sure
9. _____ likes certain things to be placed in a very specific way, or
happen in a very specific order. Does ___ think that is true about him/herself?
Almost Never
A Little
Pretty Much
Almost Always
NO YES Not Sure
10. _____can tell when someone is getting bored while listening to
him/her. Does ___ think that is true about him/herself?
Almost Never
A Little
Pretty Much
Almost Always
NO YES Not Sure
11. _____ is comfortable in social situations. Does ___ think that is
true about him/herself?
Almost Never
A Little
Pretty Much
Almost Always
NO YES Not Sure
12. _____ interrupts others when they’re talking. Does ___ think that is
true about him/herself?
Almost Never
A Little
Pretty Much
Almost Always
NO YES Not Sure
13. _____ gets wrapped up in things he/she is doing and loses sight of
other things. Does ___ think that is true about him/herself?
Almost Never
A Little
Pretty Much
Almost Always
NO YES Not Sure
14. _____ stands too close to people. Does ___ think that is
true about him/herself?
Almost Never
A Little
Pretty Much
Almost Always
NO YES Not Sure
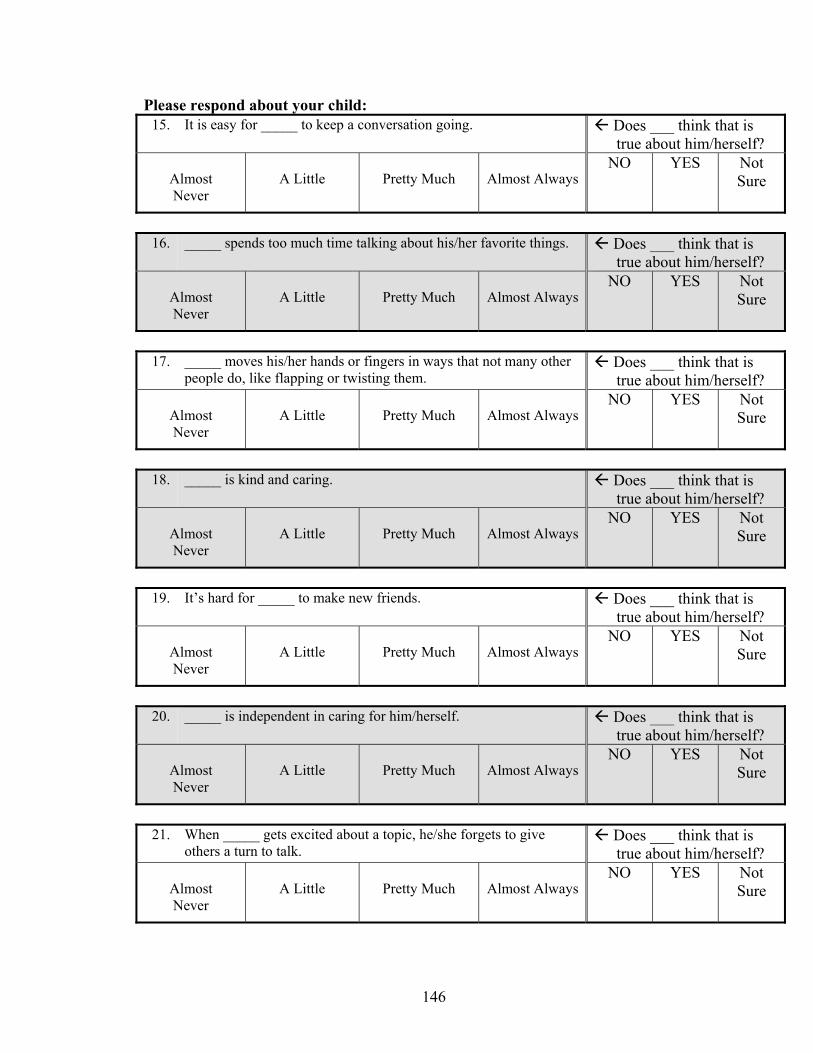
146
Please respond about your child: 15. It is easy for _____ to keep a conversation going. Does ___ think that is
true about him/herself?
Almost Never
A Little
Pretty Much
Almost Always
NO YES Not Sure
16. _____ spends too much time talking about his/her favorite things. Does ___ think that is
true about him/herself?
Almost Never
A Little
Pretty Much
Almost Always
NO YES Not Sure
17. _____ moves his/her hands or fingers in ways that not many other
people do, like flapping or twisting them. Does ___ think that is true about him/herself?
Almost Never
A Little
Pretty Much
Almost Always
NO YES Not Sure
18. _____ is kind and caring. Does ___ think that is
true about him/herself?
Almost Never
A Little
Pretty Much
Almost Always
NO YES Not Sure
19. It’s hard for _____ to make new friends. Does ___ think that is
true about him/herself?
Almost Never
A Little
Pretty Much
Almost Always
NO YES Not Sure
20. _____ is independent in caring for him/herself. Does ___ think that is
true about him/herself?
Almost Never
A Little
Pretty Much
Almost Always
NO YES Not Sure
21. When _____ gets excited about a topic, he/she forgets to give
others a turn to talk. Does ___ think that is true about him/herself?
Almost Never
A Little
Pretty Much
Almost Always
NO YES Not Sure
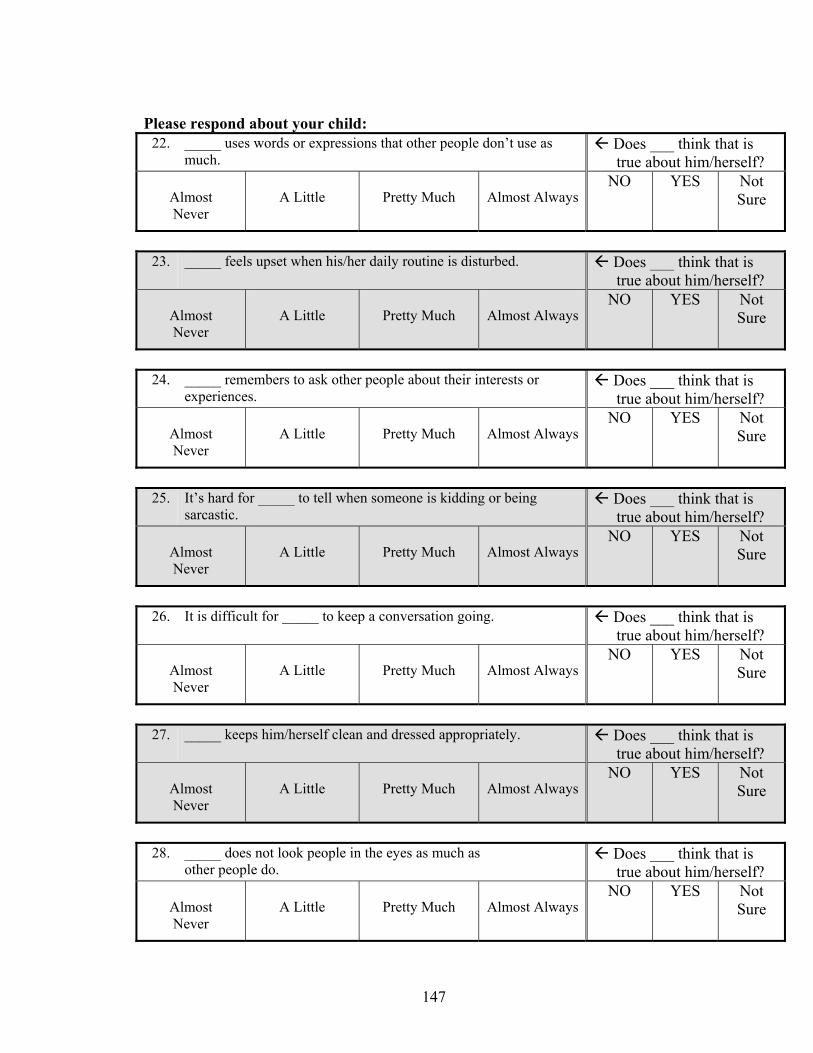
147
Please respond about your child:
22. _____ uses words or expressions that other people don’t use as much.
Does ___ think that is true about him/herself?
Almost Never
A Little
Pretty Much
Almost Always
NO YES Not Sure
23. _____ feels upset when his/her daily routine is disturbed.
Does ___ think that is true about him/herself?
Almost Never
A Little
Pretty Much
Almost Always
NO YES Not Sure
24. _____ remembers to ask other people about their interests or
experiences. Does ___ think that is true about him/herself?
Almost Never
A Little
Pretty Much
Almost Always
NO YES Not Sure
25. It’s hard for _____ to tell when someone is kidding or being
sarcastic. Does ___ think that is true about him/herself?
Almost Never
A Little
Pretty Much
Almost Always
NO YES Not Sure
26. It is difficult for _____ to keep a conversation going. Does ___ think that is
true about him/herself?
Almost Never
A Little
Pretty Much
Almost Always
NO YES Not Sure
27. _____ keeps him/herself clean and dressed appropriately. Does ___ think that is
true about him/herself?
Almost Never
A Little
Pretty Much
Almost Always
NO YES Not Sure
28. _____ does not look people in the eyes as much as
other people do. Does ___ think that is true about him/herself?
Almost Never
A Little
Pretty Much
Almost Always
NO YES Not Sure
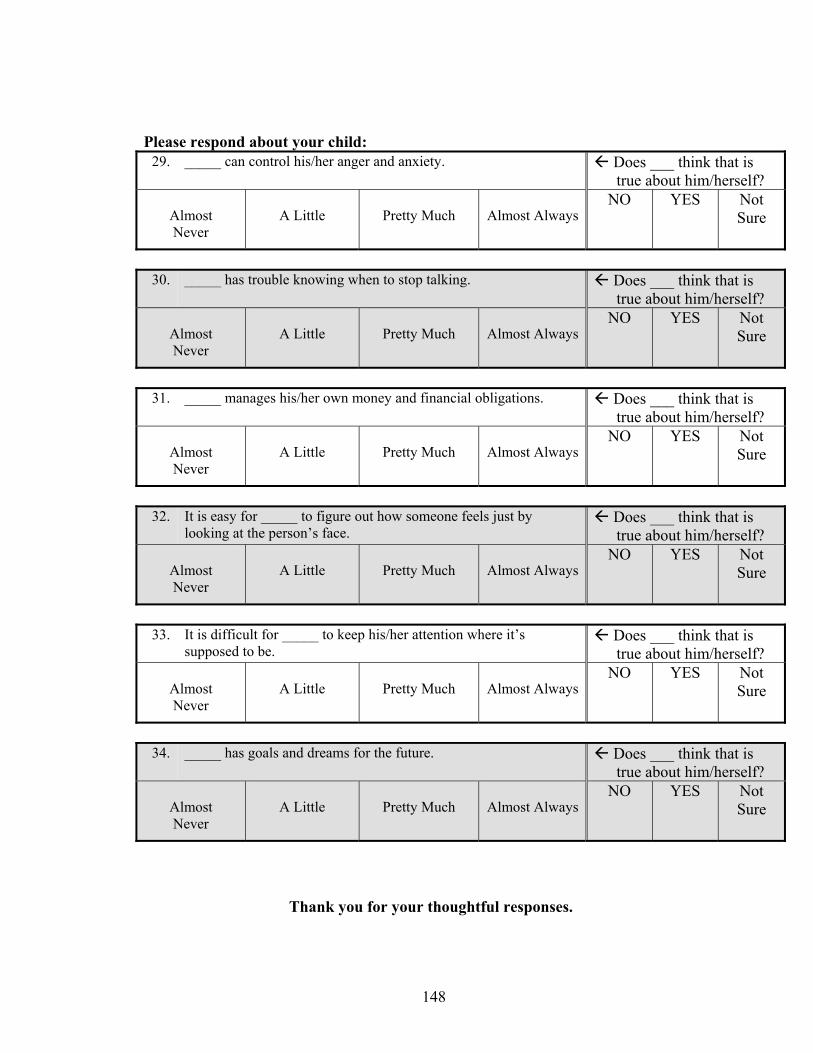
148
Please respond about your child: 29. _____ can control his/her anger and anxiety. Does ___ think that is
true about him/herself?
Almost Never
A Little
Pretty Much
Almost Always
NO YES Not Sure
30. _____ has trouble knowing when to stop talking.
Does ___ think that is true about him/herself?
Almost Never
A Little
Pretty Much
Almost Always
NO YES Not Sure
31. _____ manages his/her own money and financial obligations. Does ___ think that is
true about him/herself?
Almost Never
A Little
Pretty Much
Almost Always
NO YES Not Sure
32. It is easy for _____ to figure out how someone feels just by
looking at the person’s face. Does ___ think that is true about him/herself?
Almost Never
A Little
Pretty Much
Almost Always
NO YES Not Sure
33. It is difficult for _____ to keep his/her attention where it’s
supposed to be. Does ___ think that is true about him/herself?
Almost Never
A Little
Pretty Much
Almost Always
NO YES Not Sure
34. _____ has goals and dreams for the future. Does ___ think that is
true about him/herself?
Almost Never
A Little
Pretty Much
Almost Always
NO YES Not Sure
Thank you for your thoughtful responses.
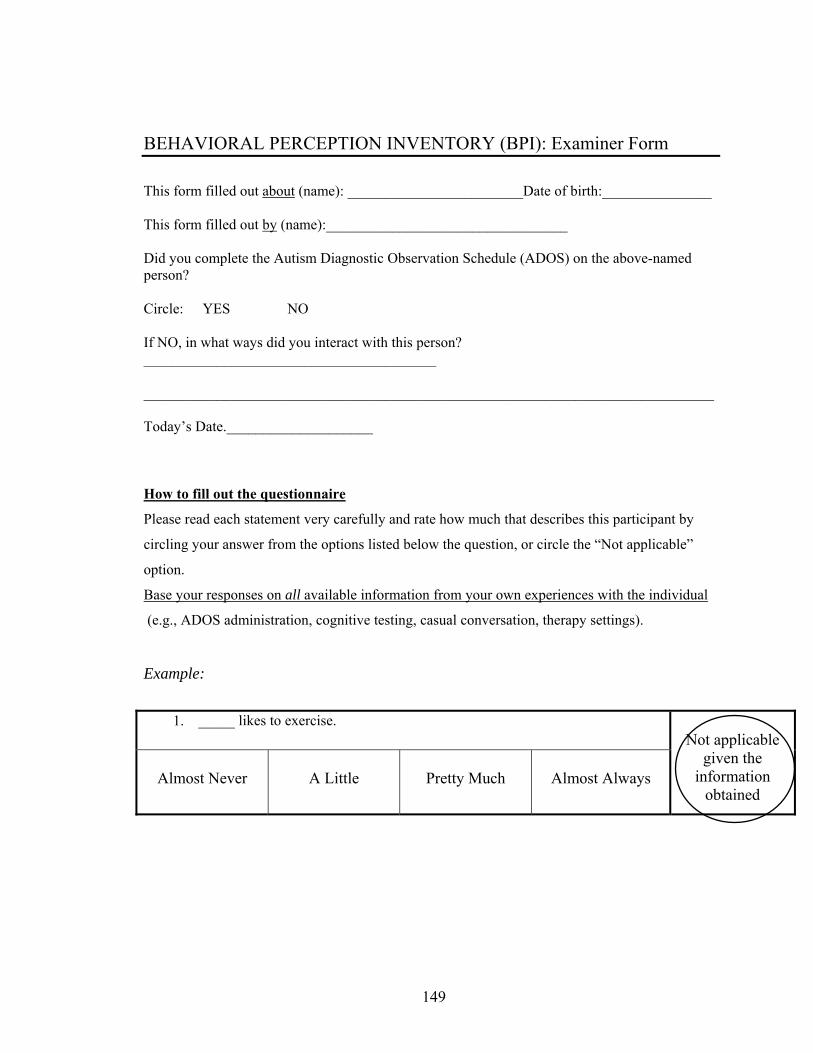
149
BEHAVIORAL PERCEPTION INVENTORY (BPI): Examiner Form
This form filled out about (name): ________________________Date of birth:_______________ This form filled out by (name):_________________________________ Did you complete the Autism Diagnostic Observation Schedule (ADOS) on the above-named person? Circle: YES NO If NO, in what ways did you interact with this person? ________________________________________ ______________________________________________________________________________ Today’s Date.____________________
How to fill out the questionnaire
Please read each statement very carefully and rate how much that describes this participant by
circling your answer from the options listed below the question, or circle the “Not applicable”
option.
Base your responses on all available information from your own experiences with the individual
(e.g., ADOS administration, cognitive testing, casual conversation, therapy settings).
Example:
1. _____ likes to exercise.
Not applicable given the
information obtained
Almost Never
A Little
Pretty Much
Almost Always
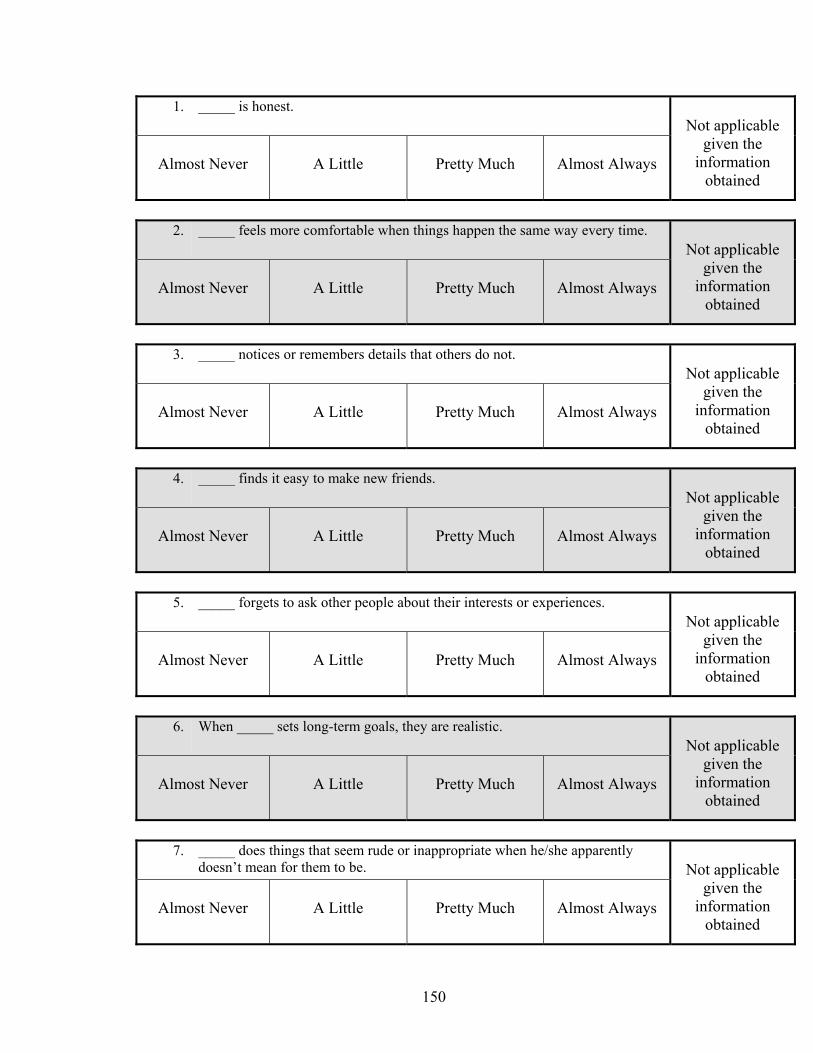
150
1. _____ is honest. Not applicable
given the information
obtained
Almost Never
A Little
Pretty Much
Almost Always
2. _____ feels more comfortable when things happen the same way every time.
Not applicable given the
information obtained
Almost Never
A Little
Pretty Much
Almost Always
3. _____ notices or remembers details that others do not.
Not applicable given the
information obtained
Almost Never
A Little
Pretty Much
Almost Always
4. _____ finds it easy to make new friends.
Not applicable given the
information obtained
Almost Never
A Little
Pretty Much
Almost Always
5. _____ forgets to ask other people about their interests or experiences.
Not applicable given the
information obtained
Almost Never
A Little
Pretty Much
Almost Always
6. When _____ sets long-term goals, they are realistic.
Not applicable given the
information obtained
Almost Never
A Little
Pretty Much
Almost Always
7. _____ does things that seem rude or inappropriate when he/she apparently
doesn’t mean for them to be.
Not applicable given the
information obtained
Almost Never
A Little
Pretty Much
Almost Always
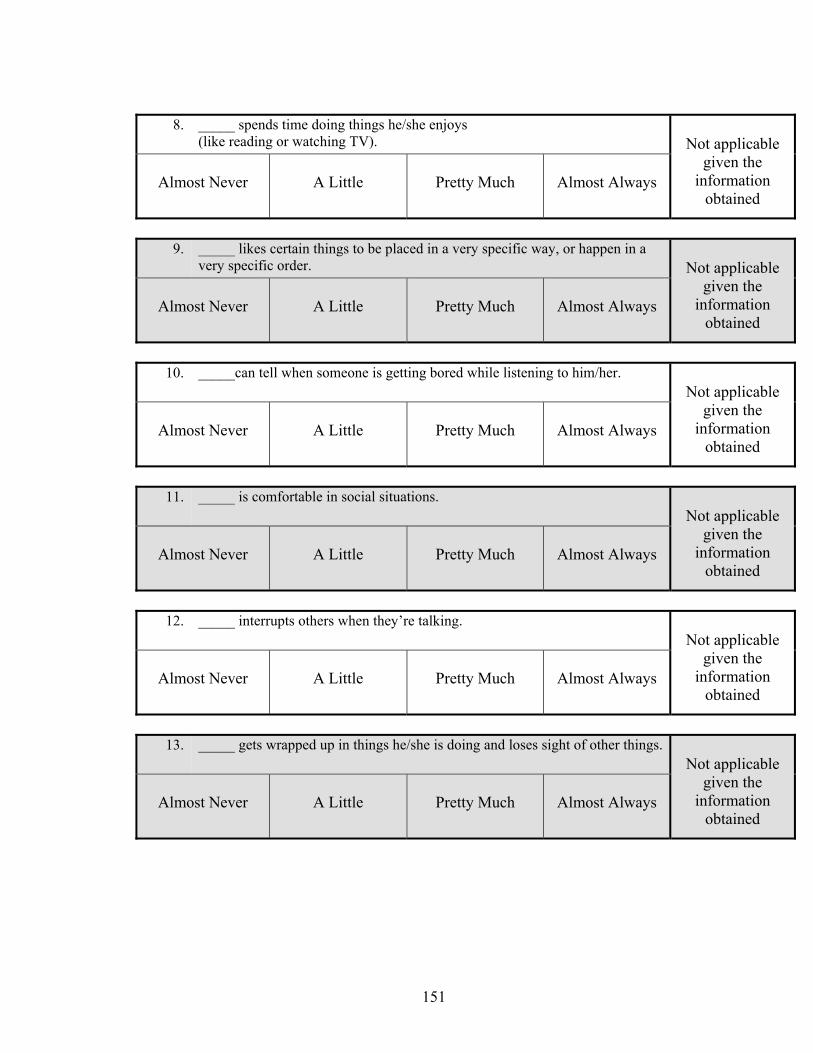
151
8. _____ spends time doing things he/she enjoys
(like reading or watching TV).
Not applicable given the
information obtained
Almost Never
A Little
Pretty Much
Almost Always
9. _____ likes certain things to be placed in a very specific way, or happen in a
very specific order.
Not applicable given the
information obtained
Almost Never
A Little
Pretty Much
Almost Always
10. _____can tell when someone is getting bored while listening to him/her.
Not applicable given the
information obtained
Almost Never
A Little
Pretty Much
Almost Always
11. _____ is comfortable in social situations.
Not applicable given the
information obtained
Almost Never
A Little
Pretty Much
Almost Always
12. _____ interrupts others when they’re talking.
Not applicable given the
information obtained
Almost Never
A Little
Pretty Much
Almost Always
13. _____ gets wrapped up in things he/she is doing and loses sight of other things.
Not applicable given the
information obtained
Almost Never
A Little
Pretty Much
Almost Always
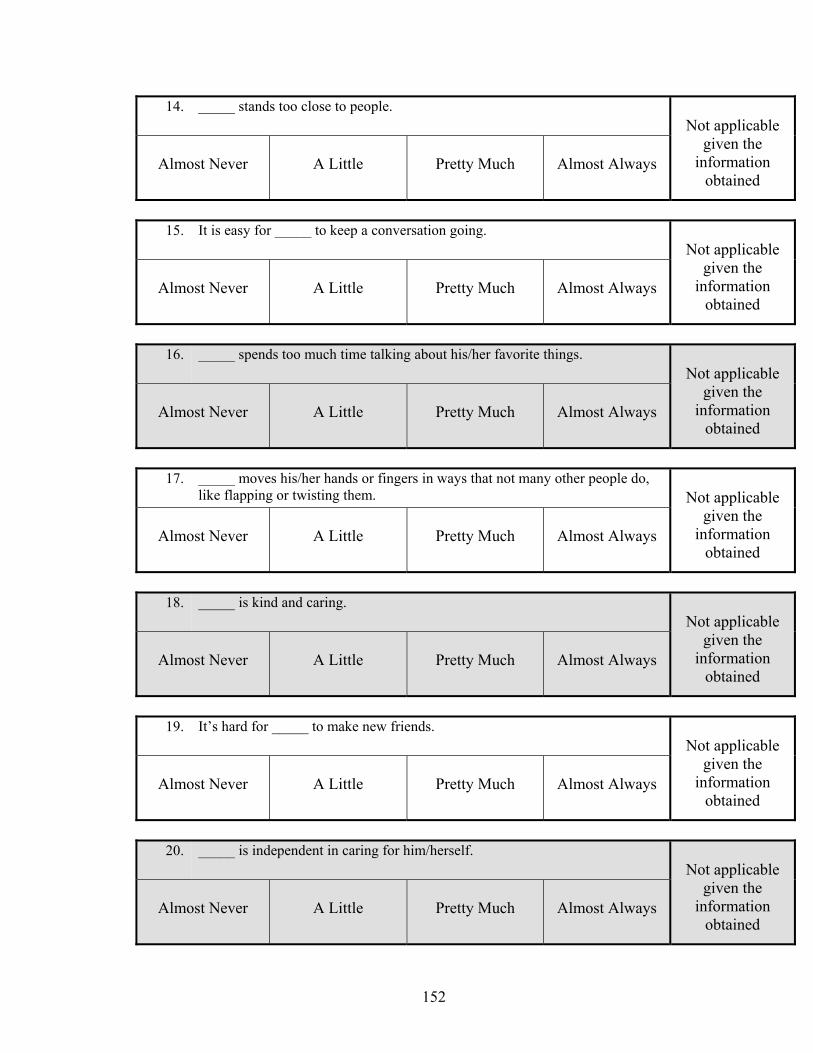
152
14. _____ stands too close to people. Not applicable
given the information
obtained
Almost Never
A Little
Pretty Much
Almost Always
15. It is easy for _____ to keep a conversation going.
Not applicable given the
information obtained
Almost Never
A Little
Pretty Much
Almost Always
16. _____ spends too much time talking about his/her favorite things.
Not applicable given the
information obtained
Almost Never
A Little
Pretty Much
Almost Always
17. _____ moves his/her hands or fingers in ways that not many other people do,
like flapping or twisting them.
Not applicable given the
information obtained
Almost Never
A Little
Pretty Much
Almost Always
18. _____ is kind and caring.
Not applicable given the
information obtained
Almost Never
A Little
Pretty Much
Almost Always
19. It’s hard for _____ to make new friends.
Not applicable given the
information obtained
Almost Never
A Little
Pretty Much
Almost Always
20. _____ is independent in caring for him/herself.
Not applicable given the
information obtained
Almost Never
A Little
Pretty Much
Almost Always
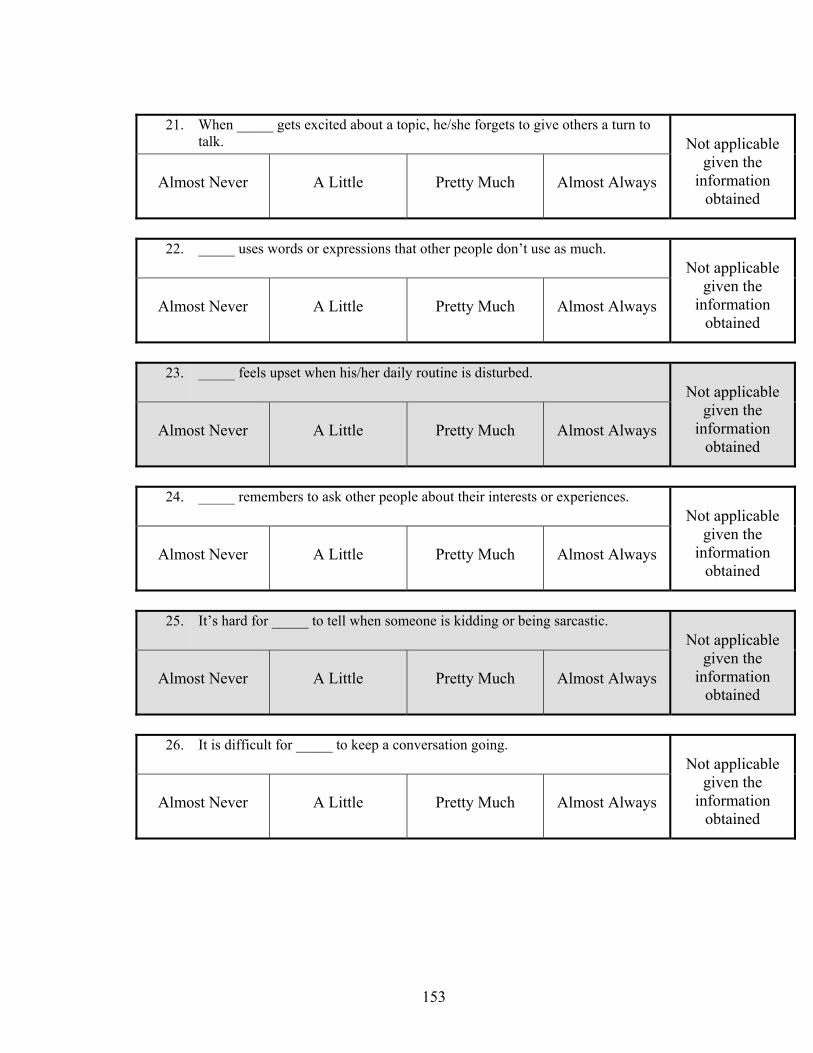
153
21. When _____ gets excited about a topic, he/she forgets to give others a turn to
talk.
Not applicable given the
information obtained
Almost Never
A Little
Pretty Much
Almost Always
22. _____ uses words or expressions that other people don’t use as much.
Not applicable given the
information obtained
Almost Never
A Little
Pretty Much
Almost Always
23. _____ feels upset when his/her daily routine is disturbed.
Not applicable given the
information obtained
Almost Never
A Little
Pretty Much
Almost Always
24. _____ remembers to ask other people about their interests or experiences.
Not applicable given the
information obtained
Almost Never
A Little
Pretty Much
Almost Always
25. It’s hard for _____ to tell when someone is kidding or being sarcastic.
Not applicable given the
information obtained
Almost Never
A Little
Pretty Much
Almost Always
26. It is difficult for _____ to keep a conversation going.
Not applicable given the
information obtained
Almost Never
A Little
Pretty Much
Almost Always
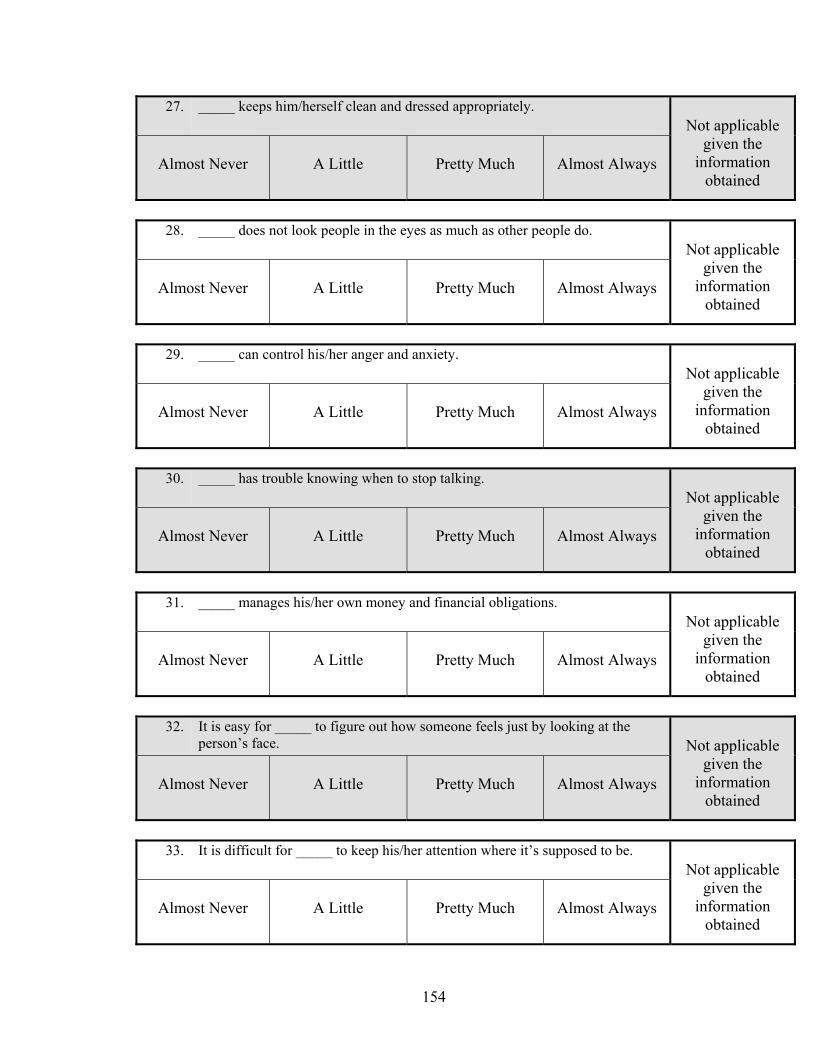
154
27. _____ keeps him/herself clean and dressed appropriately. Not applicable
given the information
obtained
Almost Never
A Little
Pretty Much
Almost Always
28. _____ does not look people in the eyes as much as other people do.
Not applicable given the
information obtained
Almost Never
A Little
Pretty Much
Almost Always
29. _____ can control his/her anger and anxiety.
Not applicable given the
information obtained
Almost Never
A Little
Pretty Much
Almost Always
30. _____ has trouble knowing when to stop talking.
Not applicable given the
information obtained
Almost Never
A Little
Pretty Much
Almost Always
31. _____ manages his/her own money and financial obligations.
Not applicable given the
information obtained
Almost Never
A Little
Pretty Much
Almost Always
32. It is easy for _____ to figure out how someone feels just by looking at the
person’s face.
Not applicable given the
information obtained
Almost Never
A Little
Pretty Much
Almost Always
33. It is difficult for _____ to keep his/her attention where it’s supposed to be.
Not applicable given the
information obtained
Almost Never
A Little
Pretty Much
Almost Always
155
34. _____ has goals and dreams for the future.
Not applicable given the
information obtained
Almost Never
A Little
Pretty Much
Almost Always
Thank you for your thoughtful responses.
156
Appendix B: Social Interests and Habits Questionnaire
List of Measures
1. Social Interests and Habits Questionnaire (SIH): Social Current Subscale.……157
2. Social Interests and Habits Questionnaire (SIH): Social Wishes Subscale.……159
3. Social Interests and Habits Questionnaire (SIH): Social Other Subscale.……...161
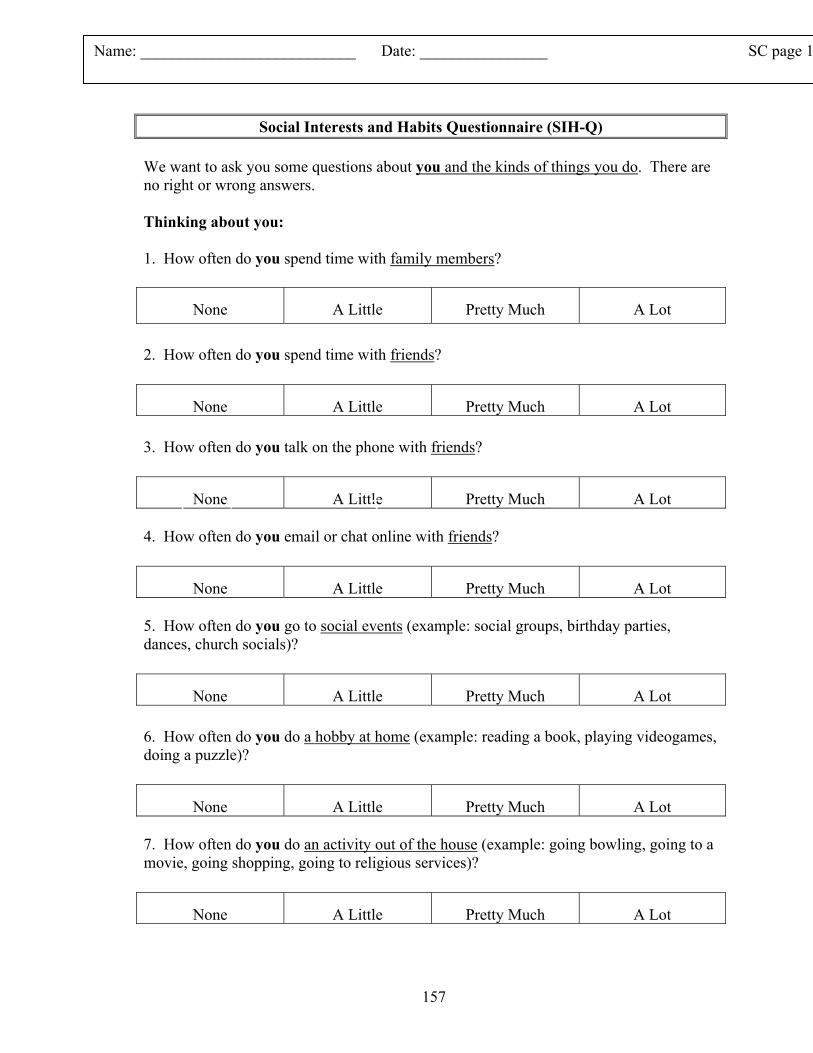
157
Social Interests and Habits Questionnaire (SIH-Q)
We want to ask you some questions about you and the kinds of things you do. There are no right or wrong answers. Thinking about you: 1. How often do you spend time with family members?
2. How often do you spend time with friends?
3. How often do you talk on the phone with friends?
4. How often do you email or chat online with friends?
5. How often do you go to social events (example: social groups, birthday parties, dances, church socials)?
6. How often do you do a hobby at home (example: reading a book, playing videogames, doing a puzzle)?
7. How often do you do an activity out of the house (example: going bowling, going to a movie, going shopping, going to religious services)?
None
A Little
Pretty Much
A Lot
None
A Little
Pretty Much
A Lot
None
A Little
Pretty Much
A Lot
None
A Little
Pretty Much
A Lot
None
A Little
Pretty Much
A Lot
None
A Little
Pretty Much
A Lot
None
A Little
Pretty Much
A Lot
1 2 5
Name: ___________________________ Date: ________________ SC page 1
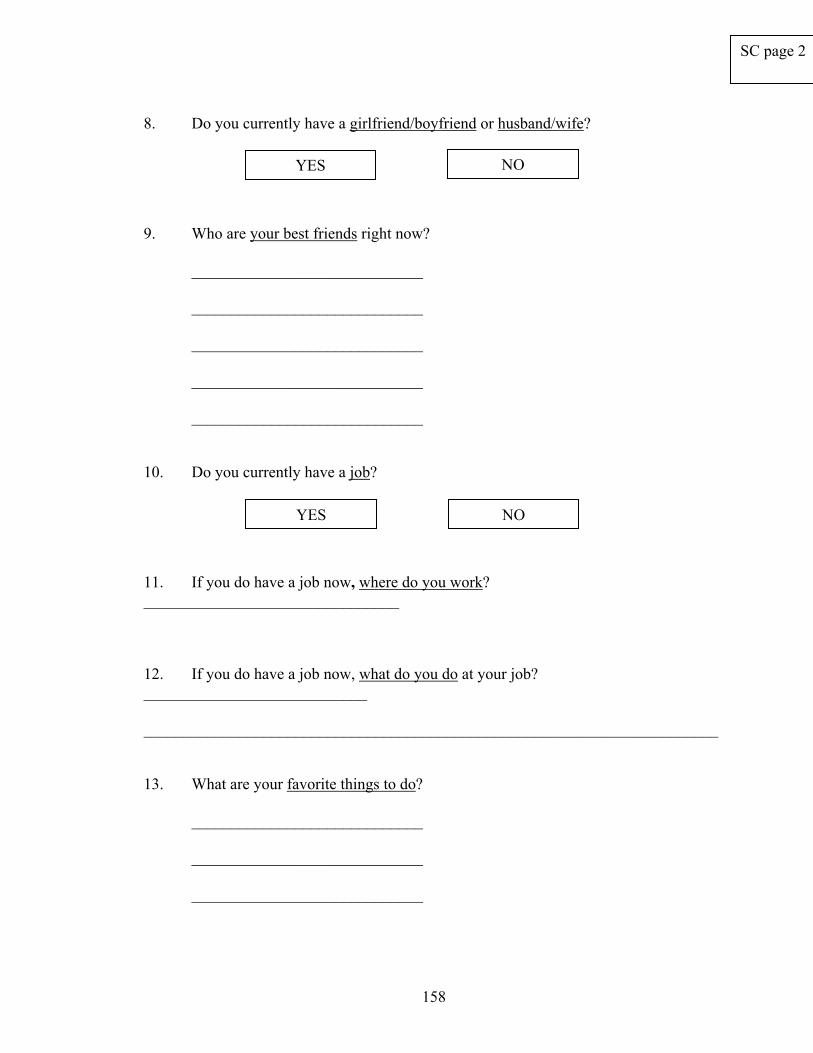
158
8. Do you currently have a girlfriend/boyfriend or husband/wife? 9. Who are your best friends right now? _____________________________ _____________________________ _____________________________ _____________________________ _____________________________ 10. Do you currently have a job? 11. If you do have a job now, where do you work? ________________________________ 12. If you do have a job now, what do you do at your job? ____________________________ ________________________________________________________________________ 13. What are your favorite things to do?
_____________________________ _____________________________ _____________________________
NO YES
YES NO
SC page 2
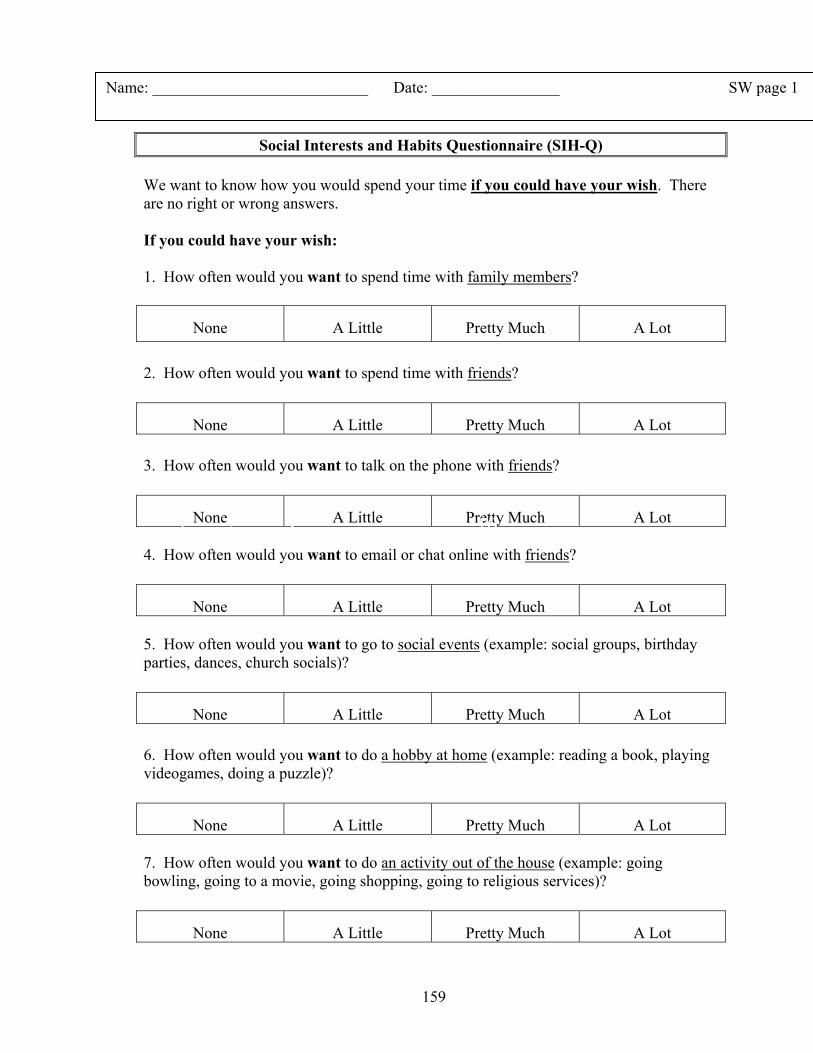
159
Appendix B: Social Habits and Interests Questionnaire
Social Interests and Habits Questionnaire (SIH-Q) We want to know how you would spend your time if you could have your wish. There are no right or wrong answers. If you could have your wish: 1. How often would you want to spend time with family members?
2. How often would you want to spend time with friends?
3. How often would you want to talk on the phone with friends?
4. How often would you want to email or chat online with friends?
5. How often would you want to go to social events (example: social groups, birthday parties, dances, church socials)?
6. How often would you want to do a hobby at home (example: reading a book, playing videogames, doing a puzzle)?
7. How often would you want to do an activity out of the house (example: going bowling, going to a movie, going shopping, going to religious services)?
None
A Little
Pretty Much
A Lot
None
A Little
Pretty Much
A Lot
None
A Little
Pretty Much
A Lot
None
A Little
Pretty Much
A Lot
None
A Little
Pretty Much
A Lot
None
A Little
Pretty Much
A Lot
None
A Little
Pretty Much
A Lot
1 2 3 10
Name: ___________________________ Date: ________________ SW page 1
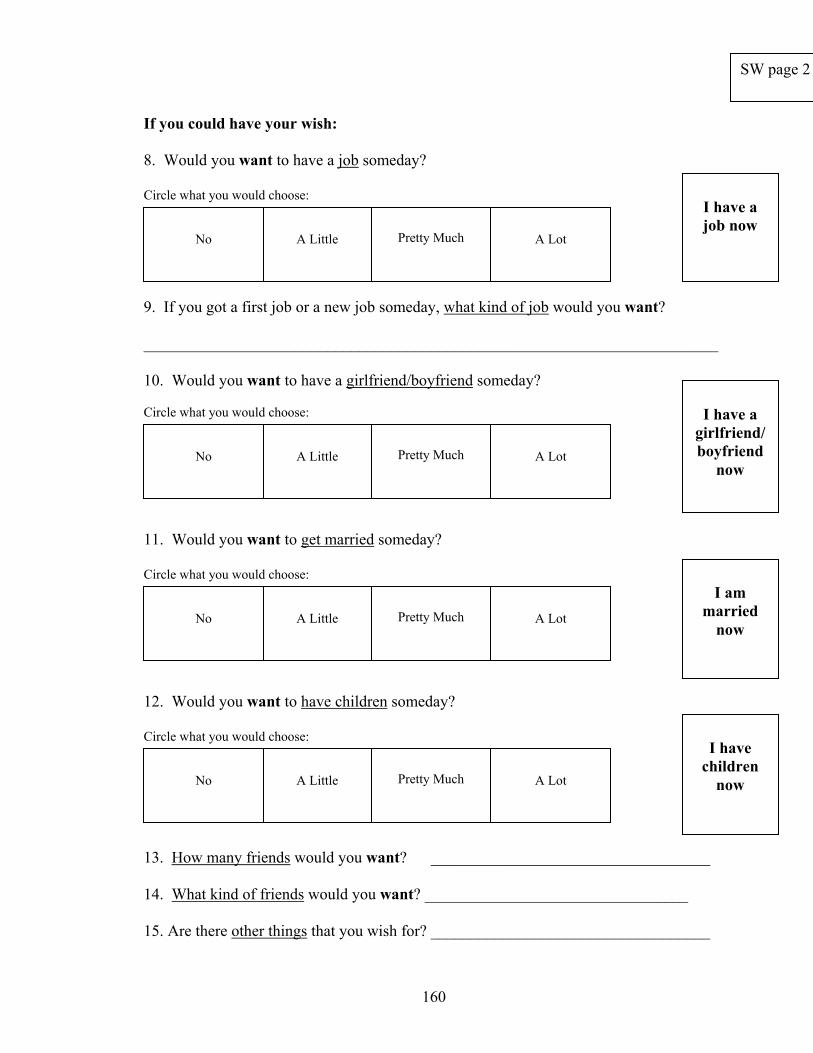
160
If you could have your wish: 8. Would you want to have a job someday? Circle what you would choose: 9. If you got a first job or a new job someday, what kind of job would you want? ________________________________________________________________________ 10. Would you want to have a girlfriend/boyfriend someday? Circle what you would choose: 11. Would you want to get married someday? Circle what you would choose: 12. Would you want to have children someday? Circle what you would choose: 14. Where would you like to live? 13. How many friends would you want? ___________________________________ 14. What kind of friends would you want? _________________________________ 15. Are there other things that you wish for? ___________________________________
No
A Little
Pretty Much
A Lot
I have a job now
I am
married now
I have a
girlfriend/boyfriend
now
No
A Little
Pretty Much
A Lot
No
A Little
Pretty Much
A Lot
No
A Little
Pretty Much
A Lot
I have
children now
SW page 2
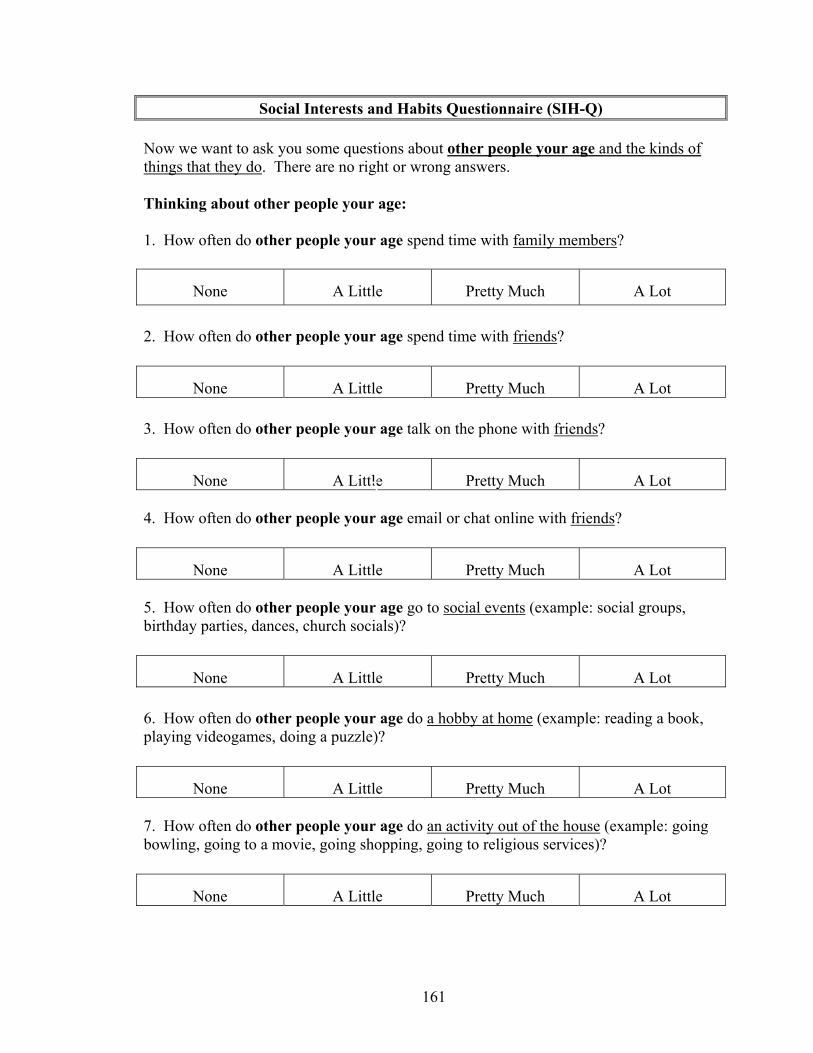
161
Social Interests and Habits Questionnaire (SIH-Q) Now we want to ask you some questions about other people your age and the kinds of things that they do. There are no right or wrong answers. Thinking about other people your age: 1. How often do other people your age spend time with family members?
2. How often do other people your age spend time with friends?
3. How often do other people your age talk on the phone with friends?
4. How often do other people your age email or chat online with friends?
5. How often do other people your age go to social events (example: social groups, birthday parties, dances, church socials)?
6. How often do other people your age do a hobby at home (example: reading a book, playing videogames, doing a puzzle)?
7. How often do other people your age do an activity out of the house (example: going bowling, going to a movie, going shopping, going to religious services)?
None
A Little
Pretty Much
A Lot
None
A Little
Pretty Much
A Lot
None
A Little
Pretty Much
A Lot
None
A Little
Pretty Much
A Lot
None
A Little
Pretty Much
A Lot
None
A Little
Pretty Much
A Lot
None
A Little
Pretty Much
A Lot
5
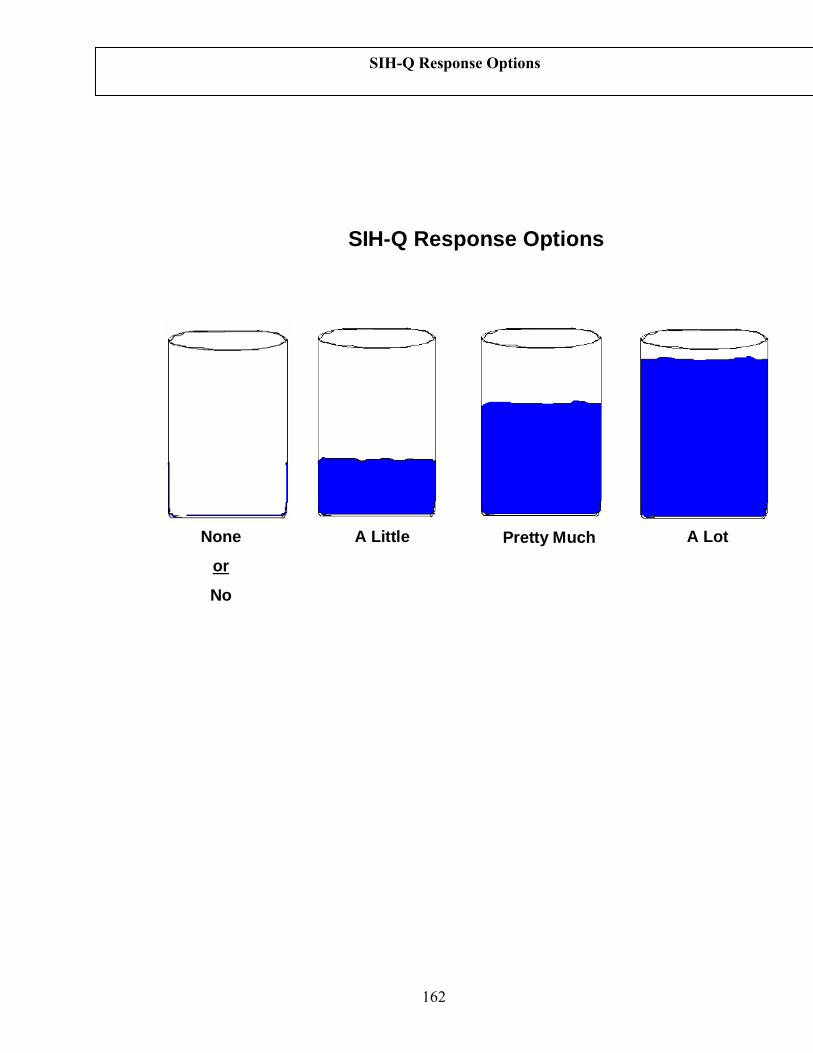
162
A LotPretty MuchNone
or
No
A Little
SIH-Q Response Options
SIH-Q Response Options
163
References
Achenbach, T. (1991). Manual for the Youth Self-Report and 1991 Profile. Burlington, VT: University of Vermont, Department of Psychiatry.
Achenbach, T. (1997) Young Adult Self Report. Burlington, VT: University of Vermont,
Department of Psychiatry. Achenbach, T., & Rescorla, L. (2000). Manual for the Aseba forms and profiles.
Burlington VT.: University of Vermont Center for Children, Youth and Families. Asher, S.R., Hymel, S., & Renshaw, P.D. (1984). Loneliness in children. Child
Development, 55(4), 1456-1464. Aman, M. G., Lam, K. L., & Collier-Crespin, A. (2003). Prevalence and patterns of use
of psychoactive medicines among individuals with autism in the Autism Society of Ohio. Journal of Autism and Developmental Disorders, 33, 527-534.
Asperger, H. (1944/1991). Die “autistischen psychopathen” in kind esalter. Arc hive fur
Psychiatrie und Nervenkrankheiten, 117, 76-136. Translated by U. Frith (Ed.), Autism and Asperger syndrome (1991, pp. 37-92). Cambridge: Cambridge University.
Baron-Cohen, S., & Wheelwright, S. (2003). The Friendship Questionnaire (FQ): An
investigation of adults with Asperger Syndrome or High Functioning Autism, and normal sex differences. Journal of Autism & Developmental Disorders, 33, 509-517.
Baron-Cohen, S., Wheelwright, S., Skinner, R., Martin, J., Clubley, E. (2001). The
Autism-Spectrum Quotient (AQ): evidence from Asperger syndrome/high functioning autism, males and females, scientists and mathematicians. Journal of Autism & Developmental Disorders, 33(1), 5–17.
Bauminger, N. & Kasari, C. (2000). Loneliness and friendship in high-functioning
children with autism. Child Development, 71(2), 447-456. Bauminger, N., & Shulman, C. (2003). The development and maintenance of friendship
in high functioning children with autism: Maternal perceptions. Autism, 7(1), 81-97.
Beck, A. T., & Steer, R. A. (1984). Internal consistencies of the original and revised Beck
Depression Inventories. Journal of Clinical Psychology, 40, 1365-1367. Beck, A., Steer, R., Ball, R., & Ranieri, W.F. (1996). Comparison of Beck Depression
Inventories–IA and –II in psychiatric outpatients. Journal of Personality Assessment, 67(3), 588-597.
164
Beebe, D. & Risi, S. (2003). Treatment of adolescents and young adults with high-
functioning autism or Asperger syndrome. In M. Reinecke, F. Dattilio, & A. Freeman (Eds.), Cognitive therapy with children and adolescents: A casebook for clinical practice (2nd ed.) (pp. 369-401). New York, NY: Guilford Press.
Blackshaw, A., Kinderman, P., Hare, D., & Hatton, C. (2001). Theory of mind, causal
attribution and paranoia in Asperger syndrome. Autism, 5(2), 147-163. Brereton, A.V., Tonge, B.J., Einfeld, S. (2006). Psychopathology in children and
adolescents with autism compared to young people with intellectual disability. Journal of Autism and Developmental Disorders, 36(7), 863-870.
Cacioppo, J. T., Hughes, M. E., Waite, L. J., Hawkley, L. C., & Thisted, R. A. (2006).
Loneliness as a specific risk factor for depressive symptoms: Cross-sectional and longitudinal analyses. Psychology and aging, 21, 140-151.
Cederlund, M., Hagberg, B., Gillberg, C. (2010). Asperger syndrome in adolescent and
young adult males. Interview, self - and parent assessment of social, emotional, and cognitive problems. Research in Developmental Disabilities, 31(2), 287-298.
Centers for Disease Control and Prevention (2008). Depression in the United States
household population, 2005-2006. National Center for Health Statistics Data Brief, 7, 1-7.
Clarke, D., Baxter, M., Perry, D., Prasher, V. (1999). The diagnosis of affective and
psychotic disorders in adults with autism: Seven case reports. Autism, 3, 149-164. Clarke, D.J., LittleJohns, C.S., Corbett, J.A., & Joseph, S. (1989). Pervasive
developmental disorders and psychoses in adult life. British Journal of Psychiatry, 155, 692-699.
Costello, E. J., Egger, H., & Angold, A. (2005). 10-Year research update review: The
epidemiology of child and adolescent psychiatric disorders: I. Methods and publish health burden. Journal of the American Academy of Child and Adolescent Psychiatry, 44(10), 972-986.
DeLong, R. (2004). Autism and familial major mood disorder: Are they related? Journal
of Neuropsychiatry and Clinical Neuroscience, 16, 199-213. Esbensen, A., Greenberg, J., Seltzer, M., Aman, M. (2009). A longitudinal investigation
of psychotropic and non-psychotropic medication use among adolescents and adults with autism spectrum disorders. Journal of Autism and Developmental Disorders, 39(9), 1339-1349.
165
Gaynes, B.N., Magruder, K., Burns, B., Wagner, H.R., Yarnall, K., Broadhead, W. (1999). Does a coexisting anxiety disorder predict persistence of depressive illness in primary care patients with major depression? General Hospital Psychiatry, 21(3), 158-167.
Gerhard, T., Chavez, B., Olfson, M., & Crystal, S. (2009). National patterns in the
outpatient pharmacological management of children and adolescents with autism spectrum disorder. Journal of Clinical Psychopharmacology, 29(3), 307-310.
Ghaziuddin, M. (2005). Mental health aspects of autism and aspergers syndrome. Jessica
Kingsley Publishers: London, England. Ghaziuddin, M., Alessi, N., & Greden, J. F. (1995). Life events and depression in
children with pervasive developmental disorders. Journal of Autism and Developmental Disorders, 25(5), 495-502.
Ghaziuddin, M., Weidmer-Mikhail, E., Ghaziuddin, N. (1998). Comorbidity of Asperger
syndrome: A preliminary report. Journal of Intellectual Disability Research, 42(4), 279-283.
Ghaziuddin, M., Ghaziuddin, N., Greden, J. (2002). Depression in persons with autism:
Implications for research and clinical care. Journal of Autism and Developmental Disorders, 32(4), 299-306.
Ghaziuddin, M., & Tsai, L. (1991). Depression in autistic disorder. British Journal of
Psychiatry, 159, 721-723. Gillberg, C. (1985). Asperger's syndrome and recurrent psychosis--a case study. Journal
of Autism & Developmental Disorders, 15(4), 389-397. Greenberg, P., Kessler, R., Birnbaum, H., Leong, S., Lowe, S., Berglund, P., & Corey-
Lisle, P. (2003). The economic burden of depression in the United States: How did it change between 1990 and 2000? Journal of Child Psychiatry, 64(12), 1465-1475.
Hare, D.J. (1997). The use of cognitive-behavioral therapy with people with Asperger
syndrome: A case study. Autism, 1(2), 215-225. Harrell, F. E. (2001). Regression modeling strategies. Springer: New York. Hedley, D. & Young, R. (2006). Social comparison processes and depressive symptoms
in children and adolescents with Asperger syndrome. Autism, 10(2), 139-153. Hill, E., Berthoz, S., & Frith, U. (2004). Brief report: Cognitive processing of own
emotions in individuals with autistic spectrum disorder and in their relatives. Journal of Autism and Developmental Disorders, 34, 229-235.
166
Howlin, P. (2000). Outcome in adult life for more able individuals with autism or
Asperger syndrome. Autism, 4(1), 63-83 Howlin, P., Goode, S., Hutton, J., & Rutter, M. (2004). Adult outcome for children with
autism. Journal of Child Psychology and Psychiatry, 45(2), 212-229. Hurtig, T., Kuusikko, S., Mattila, M., Haapsamo, H., Ebeling, H., Jussila, K., Joskitt, L.,
Pauls, D., Moilanen, I. (2009). Multi-informant reports of psychiatric symptoms among high-functioning adolescents with Asperger syndrome or autism. Autism, 13(6), 583-598.
Johnson, S., Filliter, J., Murphy, R. (2009). Discrepancies between self- and parent-
perceptions of autistic traits and empathy in high functioning children and adolescents on the autism spectrum. Journal of Autism and Developmental Disorders, 39, 1706-1714.
Kanner, L. (1943). Autistic disturbances of affective contact. Nervous Child, 2, 217-250. Kim, J., Szatmari, P., Bryson, S., Streiner, D., & Wilson, F. (2000). The prevalence of
anxiety and mood problems among children with autism and Asperger syndrome. Autism, 4(2), 117-132.
Kovacs, M. (1992). Children's Depression Inventory. North Tonawanda, NY: Multi-
Health Systems. Lasgaard, M., Nielsen, A., Eriksen, M., & Goossens, L. (2010). Loneliness and social
support in adolescent boys with autism spectrum disorders. Journal of Autism and Developmental Disorders, 40(2), 218-226.
Lainhart, J. (1999). Psychiatric problems in individuals with autism, their parents and
siblings. International Review of Psychiatry, 11(4), 278-298. Laugeson, E., Frankel, F., Mogil, C., & Dillon, A. (2009). Parent-assisted social skills
training to improve friendships in teens with autism spectrum disorders. Journal of Autism and Developmental Disorders, 39 (4), 596.
Leyfer, O., Folstein, S., Bacalman, S., Davis, N., Dinh, E., Morgan, J., Tager-Flusberg,
H., & Lainhart, J. (2006). Comorbid psychiatric disorders in children with autism: Interview development and rates of disorders. Journal of Autism and Developmental Disorders, 36.
Lord, C., Risi, S., DiLavore, P., Shulman, C., Thurm, A., & Pickles, A. (2006). Autism
from 2 to 9 years of age. Archives of General Psychiatry, 63(6), 694-701.
167
Lord, C., Risi, S., Lambrecht, L., Cook, E.H., Jr., Leventhal, B.L., DiLavore, P.C., Pickles, A., Rutter, M. (2000). The Autism Diagnostic Observation Schedule-Generic: A standard measure of social and communication deficits associated with the spectrum of autism. Journal of Autism and Developmental Disorders, 30, 205-223.
Lowe, P. & Reynolds, C. (2004). Psychometric analyses of the Adult Manifest Anxiety
Scale—Adult Version among young and middle-aged adults. Educational and Psychological Measurement, 64, 661-682.
McGovern, C. & Sigman, M. (2005). Continuity and change from early childhood to
adolescence in autism. Journal of Child Psychology and Psychiatry, 46(4), 401-408.
Mutsatsa, S.H., Joyce, E.M., Hutton, S.B., Barnes, T. (2006). Relationship between
insight, cognitive function, social function and symptomatology in schizophrenia: The West London first episode study. European Archives of Psychiatry and Clinical Neuroscience, 256(6), 356-363.
Nauta, M., Scholing, A., Rapee, R., Abbott, M., Spence, S. & Waters, A. (2004). A
parent report measure of children's anxiety. Behaviour Research and Therapy, 42(7), 813-839.
Neale, M.D. (1997). Neale Analysis of Reading Ability – Revised. Windsor, UK: NFER-
Nelson. Nolen-Hoeksema, S. & Jackson, B. (2001). Mediators of the gender difference in
rumination. Psychology of Women Quarterly, 25, 37-47. Perry, D. W., Marston, G. M., Hinder, S. A. J., Munden, A. C., & Roy, A. (2001). The
phenomenology of depressive illness in people with a learning disability and autism. Autism, 5, 265-275.
Poznanski, E. O., & Mokros, H. B. (1996). Children's Depression Rating Scale Revised
(CDRS-R). Los Angeles, CA: Western Psychological Services. Reynolds, W.M. & Baker, J. (1988). Assessment of depression in persons with mental
retardation. American Journal on Mental Retardation, 93(1), 93-105. Russell, E., & Sofronoff, K. (2005). Anxiety and social worries in children with Asperger
syndrome. Australian and New Zealand Journal of Psychiatry, 39(7), 633-638. Rutter, M., Le Couteur, A., & Lord, C. (2003). Autism Diagnostic Interview-Revised–
WPS (WPS ed.). Los Angeles: Western Psychological Services.
168
Sarason, I.G., Sarason, B.R., Shearing, E.N., & Pierce, G.R. (1987). A brief measure of social support: Practical and theoretical implications. Journal of Social and Personal Relationships, 4, 497-510.
Scheier, M.F., Carver, C.S., & Bridges, M.W. (1994). Distinguishing optimism from
neuroticism (and trait anxiety, self-mastery, and self-esteem): A re-evaluation of the Life Orientation Test. Journal of Personality and Social Psychology, 67, 1063-1078.
Sletta, O., Valas, H., Skaalvik, E. (1996). Peer-relations, loneliness and self-perceptions
in school aged children. The British Journal of Educational Psychology, 66(4), 431.
Sparrow, S. S., Cicchetti, D. V., & Balla, D. A. (2005). Vineland Adaptive Behavior
Scales (2nd ed.). Circle Pines, MN: American Guidance Service Inc. Spence, S.H., Barrett, P.M., & Turner, C.M. (2003). Psychometric properties of the
Spence Children's Anxiety Scale with young adolescents. Journal of Anxiety Disorders, 17(6), 605-625.
Sterling, L., Dawson, G., Estes, A., & Greenson, J. (2008). Characteristics associated
with presence of depressive symtpoms in adults with autism spectrum disorders. Journal of Autism & Developmental Disorders, 38, 1011-1018.
Stewart, M., Barnard, L., Pearson, J., Hasan, R., O’Brien, G. (2006). Presentation of
depression in autism and Asperger syndrome: A review. Autism, 10, 103-113. Streiner, D.L. & Norman, G (2003). Health Measurement Scales: A Practical Guide to
Their Development and Use. Oxford University Press. Tantam, D. (1991). Asperger syndrome in adulthood. In U. Frith (Ed.), Autism and
Asperger syndrome (pp. 147-183). Cambridge, England: Cambridge University Press.
Tenneij, N.H. & Koot, H.M. (2007). A preliminary investigation into the utility of the
Adult Behavior Checklist in the assessment of psychopathology in people with low IQ. Journal of Applied Research in Intellectual Disabilities, 20(5), 391-400.
Vickerstaff, S., Heriot, S., Wong, M.G., Lopes, A., & Dossetor, D. (2007). Intellectual
ability, self-perceived social competence and depressive symptomatology in children with high-functioning Autistic Spectrum Disorders. Journal of Autism and Developmental Disorders, 37(9), 1647-1664.
Wachtel, E., Griffin, M., & Reti, I. (2010). Electroconvulsive therapy in a man with
autism experiencing severe depression, catatonia, and self-injury. Journal of Electroconvulsive Therapy, 26(1), 70-73.
169
Wechsler, D. (1999). Wechsler abbreviated scale of intelligence. Psychological
Corporation: San Antonio, TX. Wierzbicki, M. (1987). A parent form of the Children's Depression Inventory: Reliability
and validity in nonclinical populations. Journal of Clinical Psychology, 43(4), 390-397.
Wilkinson, G. S., & Robertson, G. J. (2006). Wide Range Achievement Test 4,
professional manual. Lutz, FL: Psychological Assessment Resources. Williams, K. L., & Galliher, R. V. (2006). Predicting depression and self-esteem from
social connectedness, support, and competence. Journal of Social & Clinical Psychology, 25, 855-874.
Williamson, S., Craig, J., & Slinger, R. (2008). Exploring the relationship between
measures of self-esteem and psychological adjustment among adolescents with Asperger syndrome. Autism, 12, 391-402.
Wing, L. (1981). Language, social, and cognitive impairments in autism and severe
mental retardation. Journal of Autism and Developmental Disorders, 11(1), 31-44.
170
Chapter V
Conclusion
Over the last twenty years, improvements in the assessment of autism spectrum
disorders (ASD) have been associated with greater comparability of findings across
research projects and the ability to reliably describe milder cases; they have also been
associated with dramatically increased prevalence rates and heightened public
awareness and concern regarding this family of disorders. Efforts to identify causal
factors have grown dramatically but continue to be complicated by the heterogeneous
presentation of autism spectrum disorders. Continued advancements in diagnostic
practices and descriptive capabilities are needed to define boundaries within this
spectrum and to identify subtypes for treatment and etiological research.
The first two studies in this three-paper project suggest preliminary means to
stratify this diverse population into more homogeneous subgroups by ASD severity in
order to detect genetic and neurobiological similarities within more narrow groupings.
The ability to quantify autism severity could contribute to research into possible causes
and prognoses of these disorders, which ideally may come to impact prevention or
treatment of future generations with ASD. In order to intervene positively in the lives of
individuals currently living with ASD, however, it may be much more important to
identify tractable factors affecting quality of life. The proportion of adolescents and
adults with ASD and comorbid depression is much greater than that of depression in the
171
general population. The third paper in this series has implications about the targeted
treatment of adaptive behavior skills as a means to prevent or treat depressive
symptoms in adolescents and adults with ASD and thus improve quality of life for these
individuals.
Severity of impairment in autism spectrum disorders is defined differently in
relation to both autism-specific and comorbid factors; arguably, different definitions of
impairment become more salient in the lives of individuals with ASD at different age
periods. The three studies that comprise this dissertation represent steps toward
measurement of autism-specific severity in children and adolescents and treatment of
depression-related impairments in adolescent and adults. Further research on these
topics will inform our use and revision of new measurement techniques and
instruments described herein, and is needed to extend our understanding of these and
many other possible definitions of “impairment” in autism spectrum disorders.
Related Documents