HFMA’S VALUE PROJECT: PHASE 2 Defining and Delivering Value With the Support of

Welcome message from author
This document is posted to help you gain knowledge. Please leave a comment to let me know what you think about it! Share it to your friends and learn new things together.
Transcript
HFMA’S VAlue Project: PHASe 2
Defining and Delivering Value
With the Support of
of all the transformations reshaping American health care, none is more profound than the shift toward payment for value. Medicare payment is factoring in quality and patient satisfac-tion, while private payers are pursuing performance and risk-based payment structures. Meanwhile, rising healthcare costs are creating more price sensitivity among healthcare purchasers, including government agencies, employers, and patients themselves, who are being asked to pay higher premiums, copayments and deductibles for their care.
these financial pressures make it imperative for all providers of care to develop collaborative approaches that combine strong clinical outcomes with effective cost containment.
Phase 1 of HFMA’s Value Project, which was initiated in 2010, identified four organizational capabilities as strategic imperatives for providers. these include:•People and culture: the ability to collaborate, effectively
manage change, communicate a value message, and create accountability to value-driven goals
•Business intelligence: the ability to collect, analyze, and connect quality and financial data to support organizational decision-making
•Performance improvement: the ability to eliminate clinical variation, unsafe practices, and waste
•Contract and risk management: the ability to assess the potential risks and benefits of acquiring other providers or engaging with them contractually to build a value-focused network, and to predict and manage different forms of patient-related risk under different payment methodologies
With the support of 16 leading hospitals and health systems (listed at the back of this report), which serve as the project’s steering committee and research sponsors, Phase 2 of the Value Project was initiated in November 2011. Its objectives include the following:• Gain insights into stakeholder perspectives on how new
payment methods can create value.• understand what purchasers and payers seek from
value providers.• learn how providers are preparing for value-based payment.
Defining and Delivering Value is the first of a series of reports to address these objectives. together with McManis consulting, HFMA has engaged in the primary research for this report, including surveys and interviews with executives representing payers, purchasers, and government agencies to gain external stakeholder perspectives on value metrics and value-based
ABout the VAlue ProjeCt
payment methodologies. organizations interviewed include the following:
America’s Health Insurance Plans
catalyst for Payment reform
office of clinical Standards and Quality, the centers for Medicare & Medicaid Services (cMS)
center for Medicare and Medicaid Innovation, Medicare Demonstrations Group, cMS
excellus Bluecross BlueShield
leapfrog Group
lockton companies
MedPAc
National Association of Insurance commissioners
National Business Group on Health
National Quality Forum
State of Maine
united Healthcare
Additionally, HFMA interviewed hospital, medical group, and health system cFos to better understand their planning efforts related to business intelligence and costing capabilities. Individuals from the following hospital organizations partici-pated in these interviews:
Advocate Health care
Beth Israel Deaconess Medical center
Bon Secours Virginia Health System
Bothwell regional Medical center
Dean Health clinic
Fairview Health Services
Howard county Medical center
longmont united Hospital
Novant Health
Providence Health
uAB Medicine | uAB Hospital
university of Iowa Healthcare
HFMA also conducted two industry surveys. the first, on value metrics, was conducted in December 2011 and focused on trends in contractual payment and other arrangements between commercial health insurance carriers or large employ-ers and provider organizations whose payment arrangements were based on value metrics.
the second survey, conducted in February 2012, focused on the role of costing and business intelligence in a value-based payment environment.
Subsequent Value Project Phase 2 publications will detail the strategies and tactics that various types of provider organi-zations are pursuing to prepare for value-based payment. For additional information, visit the Value Project website at www.hfma.org/ValueProject.
1
exeCutiVe SummAry
o f the many forces transforming our nation’s
healthcare system, none is more significant
than the turn from payment based on volume
to payment based on value.
Value is driving a fundamental reorientation of the
healthcare system around the quality and cost-effectiveness
of care. As in any industry, value in health care is defined
through the relationship of two factors: the quality of care
and the price paid for it.
Increasingly, key stakeholders—including government
payers, commercial health plans, employers, and patients—
expect to know the value of the healthcare services they are
purchasing. They are seeking out providers who will give
them this information and follow through with cost-
effective care. In other words, they expect to receive value.
Phase 1 of HFMA’s Value Project, initiated in 2010,
identified four capabilities as strategic imperatives for
hospitals to prepare for this new payment environment.
These include:
•People and culture
•Business intelligence
•Performance improvement
•Contract and risk management
With the support of 16 leading hospitals and health
systems, Phase 2 of the Value Project began in November
2011. Its objectives include the following:
•Gain insights into stakeholder perspectives on how new
payment methods can create value.
•Understand what purchasers and payers seek from value
providers.
•Learn how providers are preparing for value-based
payment.
Phase 2 findings are based on research conducted by
HFMA and its partner, McManis Consulting. This research
included interviews with 13 executive leaders at organiza-
tions representing payers, purchasers, and government
agencies. Additionally, HFMA fielded two surveys of
provider organization CFOs, one focusing on value metrics
and the other on costing and business intelligence capabili-
ties, and conducted interviews with 12 finance officers at a
range of organizations regarding their business intelligence
and costing capabilities.
All stakeholders recognize that the future will focus on
value improvement, with an emphasis on effective cost
management. Payers recognize the need for a more focused
set of value metrics. CMS has indicated that, longer term,
the triple-aim based National Quality Strategy will be
utilized to align Medicare and Medicaid performance
programs and metrics. Based on these findings, HFMA
recommends the following guidelines for the development
and use of value metrics:
•Work to replace process metrics with patient-centered
functional outcomes.
•Align value metrics with the “triple aim” of improving
care for individuals, improving the health of populations,
and reducing the per capita costs of health care.
•Focus on a limited set of metrics to drive performance.
•Use payment incentives and penalties selectively,
emphasizing performance on metrics that have been
proven or stakeholders agree are most likely to drive
the most desirable quality or cost outcomes.
•Report provider-specific performance to end users in
a way that is understandable and actionable.
The findings from HFMA Value Project research and
interviews indicate that payers, purchasers, and providers
anticipate a real commitment to pursuing value-based
payment methodologies over the next three to five years.
Stakeholders believe the path forward is largely one of
experimentation with payment methods. Leading providers
are actively identifying and proposing bundled payment
models to payers, and some are leapfrogging to address
population risk management. Meanwhile, external
2
stakeholders and providers view care delivery as the key to
improving value in health care. Payers and purchasers are
encouraging new care delivery models. Leading providers
are proactively experimenting with new partnerships
and approaches.
Leading hospitals also are investing in core business
intelligence and costing capabilities, with a more immediate
emphasis on clinical information system enhancements.
Some organizations are moving from “directional” costing
data to more precise and granular information across
care settings.
Additionally, leading providers are creating opportunities
for physicians and front line staff to identify and execute on
initiatives to improve value, according to Value Project
research and interviews. They are actively and purposefully
fostering agile environments of aligned physicians and
engaged staff who can drive the necessary changes forward.
Based on the initial research in Phase 2, providers are
encouraged to take the following action steps.
Do not delay in developing the four value-driving capa-bilities required to adapt in a new payment environment. Leading organizations are making improvements in all four
areas, with each determining how best to balance and
sequence these initiatives.
Embrace strategic agility for your organization. Providers
are laying the foundation to change course successfully, and
sometimes quickly, as strategies evolve in a highly dynamic
healthcare market environment.
Seek stakeholder alignment around a common set of value metrics that are meaningful to their intended end users. HFMA recommends that, in the near term, provider
organizations use contract negotiations with commercial
carriers to push for alignment of contract value-based
metrics with CMS value-based metrics, to enable greater
organizational focus.
Explore strategic partnerships and opportunities with payers, employers and patients. Leading organizations are
pursuing unique arrangements with key stakeholders that
emphasize focus on the critical healthcare needs of the
providers’ patient populations.
Prepare to differentiate the effectiveness of care provided by your organization within a value-driven, competitive marketplace. Although the extent to which
changing market dynamics will drive purely price-sensitive
purchasing of health care remains uncertain, provider
organizations need to be thoughtful about the value propo-
sition they intend to offer purchasers.
Work on the Value Project continues. Both Phase 1 and
the research to date on Phase 2 reveal that, in some ways,
different types of providers, especially hospitals and health
systems, are pursuing divergent paths through the transi-
tioning payment environment. Subsequent Phase 2
publications will advance the Value Project by detailing
strategies and tactics different types of provider organiza-
tions are pursuing to prepare for value-based payment.
3
Defining VAlue
A s established in Value in Health Care: Current State
and Future Directions, the first report of HFMA’s
Value Project, value is located at the intersection
of a purchaser’s perception of the quality of a good or
service and the amount he or she is willing to pay for that
good or service.
As in other industries, value is a concept of relative
worth. In health care, measuring value remains elusive.
The definition of quality varies depending upon the stake-
holder—and there are many stakeholders in health care,
among them patients, employers, payers, and providers.
In many cases, because of how health insurance is typically
financed, the full amount paid for health care is not apparent.
And, under the traditional payment system, providers
typically are not compensated for producing value; instead,
they are rewarded for the volume of services they provide:
Value = Quality* in relation to total payment for care**
*= a composite of patient outcomes, safety and experiences
**= the cost to all purchasers of purchasing care
This report uses the term payer to describe insuring
entities, such as CMS or a commercial insurance company.
However, insuring entities play a dual role in that they
also function in part as purchasers of healthcare services.
Purchasers include the patient (primary purchaser),
employers, and/or state and federal programs, such as
Medicaid and Medicare (secondary purchasers), and
commercial health plans (serving as an intermediary
between purchasers and providers.) Provider is intended
as an umbrella term encompassing hospitals, health
systems, and physicians.
To avoid confusion, this report uses the term payment
to describe the cost of purchasing services—the amount paid
by the patient, employer, and government purchasers—and
the term cost to describe the healthcare provider’s cost of
providing the service. In a purchaser-centered value
equation, the provider’s cost is relevant to the purchaser
only to the extent it drives the amount of payment. But the
cost of providing care remains an important consideration
for providers, who are tasked with maintaining financial
viability while improving quality of care.
Interviews conducted with executive leaders at 13 organi-
zations representing payers, purchasers and government
agencies provide the external perspective on value metrics and
value-based payment methodologies examined in this report.
This section of this report summarizes findings related to:
•Purchasers’ definitions of value
•The role of care delivery as the key to value improvement
•Approaches to value performance standards and
value-based payment
•Commitment to pursuing value-based payment
•Views on the role and likely effectiveness of consumers
in driving value
•Predictions about the near-term impact of insurance
exchanges in driving quality improvement
PurChASerS’ DefinitionS of VAlueThe interviews revealed that purchasers generally define value
as a combination of quality and price—“the right care for the
right price”—and believe this is not what they are getting.
Employers. Employers continue to offer health benefits
to employees to remain attractive to job-seekers, and to
help ensure a healthy and satisfied workforce. Although
they generally perceive value in health care to be a function
of both quality and payment, employers of all sizes who were
interviewed by HFMA are generally much more concerned
about containing the cost of health insurance benefits for
their employees than they were even a few years ago. Today,
human resources directors are increasingly being held
accountable for maintaining a budget for health insurance
expenditures. In some cases, C-suite executives are becom-
ing directly involved in health insurance negotiations.
Employers use a variety of tactics to contain their health-
care costs. Most employers continue to increase employee
cost-sharing in plan design as a primary tactic to contain
insurance costs. Some employers are eager to utilize pro-
vider-specific price and quality data to differentiate them
into preferred and nonpreferred (e.g., tiered) networks,
typically with cost sharing that encourages utilization of
preferred providers. More knowledgeable employers and
consultants express concern about providers’ cost-shifting
efforts and attempt to ferret out evidence of cost shifting
in contract negotiations.
4
The interviews revealed significant frustration among
employers regarding the topic of value in health care and
the difficulties they experience obtaining meaningful
quality data and measures of performance. As one inter-
viewee noted, “Most employers don’t have the patience to
deal with health care’s peculiarities. Engaging employers in
how hard it will be to provide the right care at the right price
won’t go far; the employer response will be, ‘Be competitive
the way I need you to be.’” An employer leader noted that
larger employers in general are not particularly interested
in process indicators as a measure of quality: “They want to
know outcomes.”
The employer perspective on the definition of healthcare
value varies, depending on the size, sophistication, and
level of engagement of the employer in their healthcare
purchasing decisions. Employers in the “mid-size” range
of 1,000 to 10,000 employees shop on price, in part because
quality data that differentiate among providers are hard to
obtain and difficult to utilize in practice. Employers of this
size in general continue to define quality in terms of network
breadth, access, and employee satisfaction. Further, it is
very difficult for employers of this size to persuade a health
plan to customize a network or plan design.
Larger employers tend to have more leverage in the market,
and some are exerting it. For example, a few large employers
are beginning to contract directly with preferred providers
(Lowe’s with Cleveland Clinic, PepsiCo with Johns Hopkins).
The state of Maine is an example of a large public employer
with sufficient market clout and political cover to utilize
quality and price data to drive provider tiering decisions.
Insurers. Insurers—including commercial carriers and
CMS—also define value in health care as a relationship
between quality and the amount paid for care. CMS’s
strategies to improve value will be consistent with the
National Quality Strategy announced by the U.S. Department
of Health and Human Services in March 2011; its core
goals are better care for individuals, better population
health, and more affordable care. Commercial insurers
are pursuing similar aims, although their tactics differ
depending on the size and markets of the carriers.
For example, one plan reported it is largely pursuing
quality-focused metrics in its provider contract negotia-
tions. Another carrier, however, is insisting upon quality
and efficiency metrics.
CAre DeliVery trAnSformAtionNearly every interviewee commented on the need to drive
changes in the structure and process of healthcare delivery
as the key means of improving value. All interviewees are
using levers at their disposal to encourage care delivery
transformation.
Encouraging new care delivery models. A CMS represen-
tative described emerging payment mechanisms as
“forcing a level of coordination” in a provider community.
Numerous CMS programs, such as the Community-Based
Care Transitions Program, are specifically designed to
encourage improved care coordination across provider
organizations. A commercial carrier described its payment
strategies as intended to “move providers along the
continuum” of being able to accept financial risk. Some
of the interviewees emphasized that payment is a blunt
mechanism to improve value, and is not “the end goal.”
As one stated, “It’s about business process reengineering.”
Payment mechanisms are generally designed to
encourage, but not dictate, delivery system alignment. For
example, a CMS leader commented, “As soon as (value-
based purchasing) becomes more outcomes-oriented, you
have to look outside your walls to be successful.” CMS is
not aligning the delivery system, but rather “providing
opportunities for providers to innovate.” An employer
representative stated that employers and health plans
should lay out their goals—good outcomes, patient safety,
efficiency, and reasonable price—and “let providers figure
out the solution.”
Experimentation with care delivery models. Several of
the interviewees indicated that the key to care delivery
transformation is through experimentation. “There are
many good ideas out there; they need to get more traction
and spread across the industry,” one person commented.
All of the interviewees are pushing such experiments.
For example, the National Association of Insurance
Commissioners (NAIC) sees opportunity to drive value by
setting the risk adjustment methodology required for plans
participating in the insurance exchange to reward carriers
for enrolling and managing the risk of patients with chronic
disease, versus “cherry picking” healthy applicants.
Employer organizations are pushing payment initiatives
that would penalize care practices that are known to put
patients at risk, such as nonpayment for elective induction
of labor before 39 weeks.
5
CMS’s Innovation Center was established to experiment
with different programs to improve healthcare value.
Commercial carriers are offering menus of value metrics
and payment terms in provider contract negotiations, as
well as analytical and clinical consulting services to assist
provider organizations in understanding their patient
populations and improving care coordination.
Emphasis on primary care and deemphasis on inpatient care. Many interviews revealed a strategic emphasis on
shoring up primary care. One commercial carrier is offering
incentives and technical support for the development of
patient-centered medical homes (PCMHs). America’s Health
Insurance Plans (AHIP) reported that “contracts for medical
homes are appearing in all states now.” The state of Maine
requires all of its preferred contracted primary care practices
to be certified medical homes. Both carriers and employers
indicated they are paying additional fees for care coordina-
tion as part of their PCMH contracts. These findings are
consistent with data presented in a 2011 Medical Group
Management Association (MGMA) study,1 which indicate
that 43 commercial health plan or multi-payer PCMH pilots
and demonstrations were underway in April 2011.
Commercial carriers generally appear to be focusing
more on primary care and medical groups than on inpatient
care. One interviewee commented that they are working
primarily with medical groups (not hospitals) to reduce
readmissions. That individual cited reduced readmissions
and the Affordable Care Act provisions on medical loss
ratios and insurance rate reviews as having significant
implications for hospitals.
The MGMA PCMH study indicates that although
physician-owned practices represent about 54 percent
of established PCMHs, only 22 percent are represented
by hospital-owned medical practices. An insurance execu-
tive noted, “Hospitals that are stepping up healthcare IT
and changing their business models are the vanguard
of the future.”
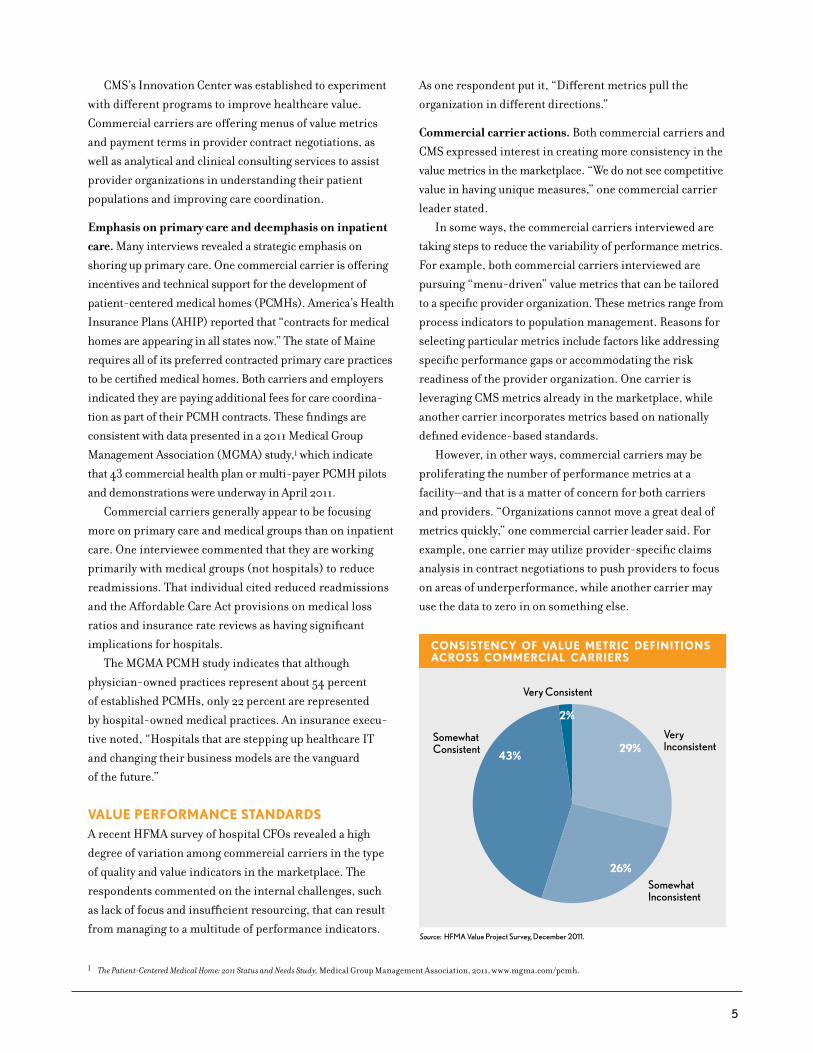
VAlue PerformAnCe StAnDArDS A recent HFMA survey of hospital CFOs revealed a high
degree of variation among commercial carriers in the type
of quality and value indicators in the marketplace. The
respondents commented on the internal challenges, such
as lack of focus and insufficient resourcing, that can result
from managing to a multitude of performance indicators.
As one respondent put it, “Different metrics pull the
organization in different directions.”
Commercial carrier actions. Both commercial carriers and
CMS expressed interest in creating more consistency in the
value metrics in the marketplace. “We do not see competitive
value in having unique measures,” one commercial carrier
leader stated.
In some ways, the commercial carriers interviewed are
taking steps to reduce the variability of performance metrics.
For example, both commercial carriers interviewed are
pursuing “menu-driven” value metrics that can be tailored
to a specific provider organization. These metrics range from
process indicators to population management. Reasons for
selecting particular metrics include factors like addressing
specific performance gaps or accommodating the risk
readiness of the provider organization. One carrier is
leveraging CMS metrics already in the marketplace, while
another carrier incorporates metrics based on nationally
defined evidence-based standards.
However, in other ways, commercial carriers may be
proliferating the number of performance metrics at a
facility—and that is a matter of concern for both carriers
and providers. “Organizations cannot move a great deal of
metrics quickly,” one commercial carrier leader said. For
example, one carrier may utilize provider-specific claims
analysis in contract negotiations to push providers to focus
on areas of underperformance, while another carrier may
use the data to zero in on something else.
CONSISTENCY OF VALUE METRIC DEFINITIONS ACROSS COMMERCIAL CARRIERS
Source: HFMA Value Project Survey, December 2011.
Very Consistent
SomewhatConsistent
SomewhatInconsistent
VeryInconsistent
26%
43%
2%
29%
1 The Patient-Centered Medical Home: 2011 Status and Needs Study, Medical Group Management Association, 2011, www.mgma.com/pcmh.
6
guiDelineS for the DeVeloPment AnD uSe of VAlue metriCS
Interviews with purchasers, payers, and provider organizations revealed some dissatisfaction with value metrics in use today. these criticisms highlighted an over-emphasis on processes rather than outcomes, the inconsistency and proliferation of metrics, and the lack of usefulness of performance data to purchasers.
In 2008, HFMA defined five principles to guide reform of the healthcare payment system: quality, alignment, fairness/sustainability, simplification, and societal benefit.2 consistent with these principles, and based upon interviews with purchasers, payers, and providers, HFMA proposes to all stakeholders the following guidelines for the improvement of metrics and reporting to promote the quality and cost-effectiveness of healthcare delivery.
Work to replace process metrics with patient-centered functional outcomes. HFMA’s 2008 payment reform white paper notes that, consistent with the principle of quality, “wherever possible, payments should reward positive out-comes, rather than adherence to processes.” employer orga-nizations consistently expressed that patient-centered functional outcomes, such as return to functioning or number and kinds of complications after a certain type of surgery, are preferable to process-based measures, and conveyed frustration that the market is lagging in providing these types of metrics. Providers, too, expressed significant interest in functional outcomes measures, with many indicating they are superior to process indicators as measurements of healthcare quality. organizations requiring process metrics should work to establish the connection between these metrics and quality or cost outcomes.
Align value metrics with the “triple aim” of improving care for individuals, improving the health of populations, and reducing the per capita costs of health care. HFMA’s 2008 white paper on payment reform encouraged alignment of payment reform with the nation’s health goals. Since that time, there has been broad coalescence around the Institute of Healthcare Improvement’s “triple Aim,” including its role as foundation for the National Quality Strategy.
In furtherance of these goals, value metrics should align incentives for providers to coordinate care. Hospitals and health systems note that in some cases they are incentivized to coordinate care, but other providers with whom they interact (e.g., independent physicians) do not have similar incentives available. to optimize payment as a lever to coordi-nate care, all providers involved in care coordination efforts should be incentivized to work together more effectively.
focus on a limited set of metrics to drive perfor-mance. Although many things can be measured, a much fewer number of metrics should be selected to drive performance. consistent with HFMA’s payment reform principle of simplification, value metrics should be used to judiciously target high-priority areas of improvement for the healthcare system, minimizing administrative burdens and optimizing the use of limited organizational resources. this guidance applies to payers in their contractual negotia-tions with providers as well as to providers, which may benefit from highlighting a select number of performance metrics for strategic organizational focus.
use payment incentives and penalties selectively, emphasizing performance on metrics that have been proven or stakeholders agree are most likely to drive the most desirable quality or cost outcomes. Payment mechanisms are a blunt way to drive provider behavior and, if used indiscriminately, can result in unin-tended consequences such as underuse of services in a capitated model. this issue relates to HFMA’s payment reform principle of fairness/sustainability.
just as stakeholders should focus on a limited number of high-impact metrics and refine them over time, so should payers be careful in how they drive provider performance through experimentation with payment. understanding the intended and unintended consequences that result from payment experiments will be critical to refine approaches to value-based payment over time.
report provider-specific performance to end users in a way that is understandable and actionable. consistent with the HFMA principle of alignment, provider-specific quality and price data should be accessible to pur-chasers in an understandable format. For example, patients may require straightforward rating systems that distinguish among providers’ performance on quality and price.
Further, to be actionable, it is important that performance standards allow for distinction among providers over time. For example, if all providers are incentivized to achieve performance within an extremely narrow range, that may not allow a purchaser to distinguish provider performance. Payers should be careful to convey performance expecta-tions in a way that not only continually focuses on high impact areas, but also at levels that allow purchasers to discern excellent from average performers.
2 See Healthcare Payment Reform: From Principles to Action, HFMA, September 2008, available at hfma.org/reform.
7
Carriers do not seem to be working among themselves to standardize performance expectations. For example, although each carrier interviewed is attempting to tap into already-defined metrics, one carrier signaled an intention to incorporate both quality and efficiency in its metrics, while the other is utilizing quality-focused metrics without an efficiency component.
CMS strategies. Today, there are many different measures across several different CMS quality reporting and perfor-mance programs that impact hospitals. Among these are Inpatient Quality Reporting, Hospital Value-Based Purchasing, Medicare Shared Savings Program, Outpatient Quality Reporting, and the Readmissions Reduction Program. Performance measures within certain programs are numerous, such as those for the Medicare Shared Savings Program, which encompasses standards related to preventive health, care coordination and patient safety, patient/caregiver experience, and at-risk populations. But despite the com-plexity involved in dealing with a number of CMS programs and metrics, one employer organization leader described a sense of coalescence within the healthcare industry that stems from a convergence around key metrics, such as those used to demonstrate meaningful use and to bench-mark quality of care in accountable care organizations.
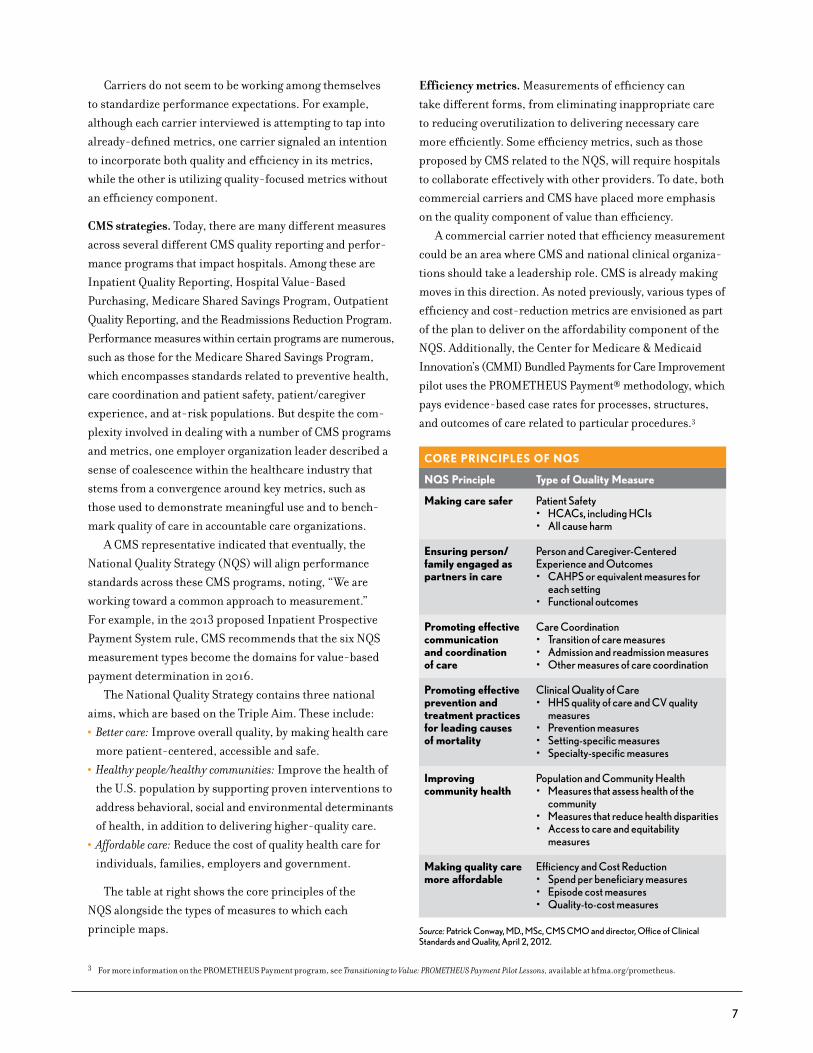
A CMS representative indicated that eventually, the National Quality Strategy (NQS) will align performance standards across these CMS programs, noting, “We are working toward a common approach to measurement.” For example, in the 2013 proposed Inpatient Prospective Payment System rule, CMS recommends that the six NQS measurement types become the domains for value-based payment determination in 2016.
The National Quality Strategy contains three national aims, which are based on the Triple Aim. These include:•Better care: Improve overall quality, by making health care
more patient-centered, accessible and safe.•Healthy people/healthy communities: Improve the health of
the U.S. population by supporting proven interventions to address behavioral, social and environmental determinants of health, in addition to delivering higher-quality care.
•Affordable care: Reduce the cost of quality health care for individuals, families, employers and government.
The table at right shows the core principles of the NQS alongside the types of measures to which each principle maps.
Efficiency metrics. Measurements of efficiency can take different forms, from eliminating inappropriate care to reducing overutilization to delivering necessary care more efficiently. Some efficiency metrics, such as those proposed by CMS related to the NQS, will require hospitals to collaborate effectively with other providers. To date, both commercial carriers and CMS have placed more emphasis on the quality component of value than efficiency.
A commercial carrier noted that efficiency measurement could be an area where CMS and national clinical organiza-tions should take a leadership role. CMS is already making moves in this direction. As noted previously, various types of efficiency and cost-reduction metrics are envisioned as part of the plan to deliver on the affordability component of the NQS. Additionally, the Center for Medicare & Medicaid Innovation’s (CMMI) Bundled Payments for Care Improvement pilot uses the PROMETHEUS Payment® methodology, which pays evidence-based case rates for processes, structures, and outcomes of care related to particular procedures.3
Core PrinCiPleS of nQS
nQS Principle type of Quality measure
making care safer Patient Safety• HcAcs, including HcIs• All cause harm
ensuring person/family engaged as partners in care
Person and caregiver-centered experience and outcomes• cAHPS or equivalent measures for
each setting• Functional outcomes
Promoting effective communication and coordination of care
care coordination• transition of care measures• Admission and readmission measures• other measures of care coordination
Promoting effective prevention and treatment practices for leading causes of mortality
clinical Quality of care• HHS quality of care and cV quality
measures• Prevention measures• Setting-specific measures• Specialty-specific measures
improving community health
Population and community Health• Measures that assess health of the
community• Measures that reduce health disparities• Access to care and equitability
measures
making quality care more affordable
efficiency and cost reduction• Spend per beneficiary measures• episode cost measures• Quality-to-cost measures
Source: Patrick conway, MD., MSc, cMS cMo and director, office of clinical Standards and Quality, April 2, 2012.
3 For more information on the PROMETHEUS Payment program, see Transitioning to Value: PROMETHEUS Payment Pilot Lessons, available at hfma.org/prometheus.
8
Clinical organizations, too, are contributing to discus-
sions on efficiency measurement by providing leadership
on the issue of medical appropriateness. In March 2012,
nine national clinical associations, including the American
Academy of Allergy, Asthma & Immunology and American
Academy of Family Physicians, produced a collective list of
45 evidence-based recommendations to reduce overuse and
misuse of specified services. This kind of information could
prove useful to payers, purchasers and providers as they
focus their efforts to demonstrate and improve efficiency.
The National Quality Forum (NQF) is another stake-
holder that is beginning to focus on efficiency measures,
which a leader there defined as “quality over resource use,
at the population level.” NQF sees efficiency measures as a
key step to eventually defining value in health care. At this
point, NQF is working on measures of resource use. These
initiatives are focused on diabetes care, capturing all patient
costs (not just those attributed to the patients’ diabetes)
over a measurement year. The organization is also working
on episode-based approaches in two areas: hip and knee
replacement and pneumonia. For both approaches, data
across all care settings will be gathered so that costs can
later be broken down and attributed per care setting.
Employer organizations, too, are pushing measures of
efficiency. Several organizations interviewed are sponsoring
payment mechanisms related to elective early inductions of
labor, with the goal of minimizing or eliminating payment
for these unnecessary procedures. Leapfrog is starting to
work with employers on identifying other overused proce-
dures, including unnecessary episiotomies.
Functional outcomes metrics. Employer representatives
cited “outcomes first” as the most important measures of
quality. For purchasers, outcomes research and measure-
ment can identify potentially effective strategies they
can implement to improve the quality and value of care.
Employer organizations noted that these kinds of metrics
are the most difficult to find in health care, aside from
CMS’s measurements of readmissions and mortality. Some
employers and providers interviewed for Phase 2 of the
Value Project also faulted CMS and commercial payers for
focusing heavily on certain process-of-care indicators that
“don’t deliver value to the patient.”
A subset of outcomes measurement is assessment of
return to functioning. These types of measures assess how
people function after an acute event (such as complications
or return to function after a knee replacement), or with
management of a chronic condition. According to the
Agency for Healthcare Research and Quality, “The difference
between traditional clinical measures for a disease and the
outcomes that matter to patients can be dramatic.”4
Functional outcomes measures are generally under-
represented in quality assessment in the United States.
CMS requires Medicare Advantage plans to distribute the
Medicare Health Outcomes Survey to samples of patients,
so that they can self-assess their functional status.
Similarly, the Consumer Assessment of Healthcare
Providers and Systems survey contains questions related to
health and functional status. These approaches, however, do
not yet require active participation of the delivery system in
understanding and driving to improve functional outcomes.
Development of additional functional outcomes measures is
among the goals of CMS in assessing progress on the NQS.
The U.S. is lagging other nations in measuring and
reporting on functional outcomes. For example, Sweden
requires every hospital and county to report annually on
certain functional outcomes related to orthopedic services.
The Picker Institute, the Foundation for Accountability, and
the PROMIS team have produced numerous instruments
and measurements of quality, with an emphasis on “symp-
toms, functioning and outcomes that matter to people.”5
Process-of-care metrics. As noted above, interviewees
confirmed that employers are less interested in process-
of-care metrics than they are in performance on outcomes.
However, process-of-care metrics are heavily featured in
CMS’s approach to value measurement to date. Another
concern related to process-of-care metrics is that, as defined,
they are likely to drive providers to performance within a
narrow band. This approach could have two impacts of
concern to providers. First, it could result in providers
expending resources to get incremental improvement on
an already high level of demonstrated performance. Second,
it may not enable providers to compete on the basis of
quality, since it will not be distinguishable.
4 “Outcomes Research Fact Sheet,” Agency for Healthcare Research and Quality, www.ahrq.gov.5 Lansky, D., “Public Reporting of Health Care Quality: Principles for Moving Forward,” Health Affairs, http://healthaffairs.org/blog/2012/04/09/public-reporting-of-health-
care-quality-principles-for-moving-forward.
9
VAriAtionS in VAlue-BASeD PAyment meChAniSmS
A lthough HFMA’s interviews suggested that payers
and purchasers are interested in creating greater
focus in value measurement, they also confirmed
that payers and purchasers intend to experiment with a
variety of value-based payment mechanisms. When asked
what specific type of value-based payment they expected to
be most prevalent in three to five years, the typical response
from payers was “not to place bets” on any one methodology.
There are several reasons for this approach. A key reason
is the lack of certainty about which payment mechanisms
most effectively drive results and which might create
unintended consequences. As Suzanne Delbanco, executive
director and founder of The Catalyst for Payment Reform,
states, “The big problem is moving from national standards
of performance to a standard method of payment, because
no one knows yet what will work best.”
For purposes of this report, value-based payment
methodologies include:
•Pay for performance relative to quality, utilization, or
efficiency benchmarks
•Bundled payments based on episode of care
•Shared saving and loss programs
•Capitation or global payment
The need for flexibility in provider contract negotiations,
based on providers’ structure, ability to manage population
risk, and other factors, also was cited by payers and
purchasers. Although payers are attempting to use various
payment mechanisms to push providers toward greater
integration and assumption of financial risk, this can be a
difficult process. As one executive stated, “Payment policy
is best used in support of care redesign, but it’s not neces-
sarily simple.”
The fact that geographic market variation also affects
payment models is another reason to experiment with a
variety of value-based payment mechanisms, carriers and
employer organizations say. As one employer organization
leader suggested, “You can do very different things in
California, where capitation is more common.”
In terms of which specific payment methodologies might
become most prevalent, several interviewees commented that
a fee-for-service “chassis” could still be used, provided that
gainsharing issues could be resolved. One interviewee com-
mented that claims systems are not configured for bundled
payment, while another stated that capitation is insufficient
because it does not allow for containment of trend.
Shared savings and loss programs are expected to gain
traction. As one interviewee noted, “Whoever can figure
out how to own the patient, the patient’s data, and patient
management will be the successful entity.” In this leader’s
view, this could be the employer, a payer, or, in some
markets, a provider.
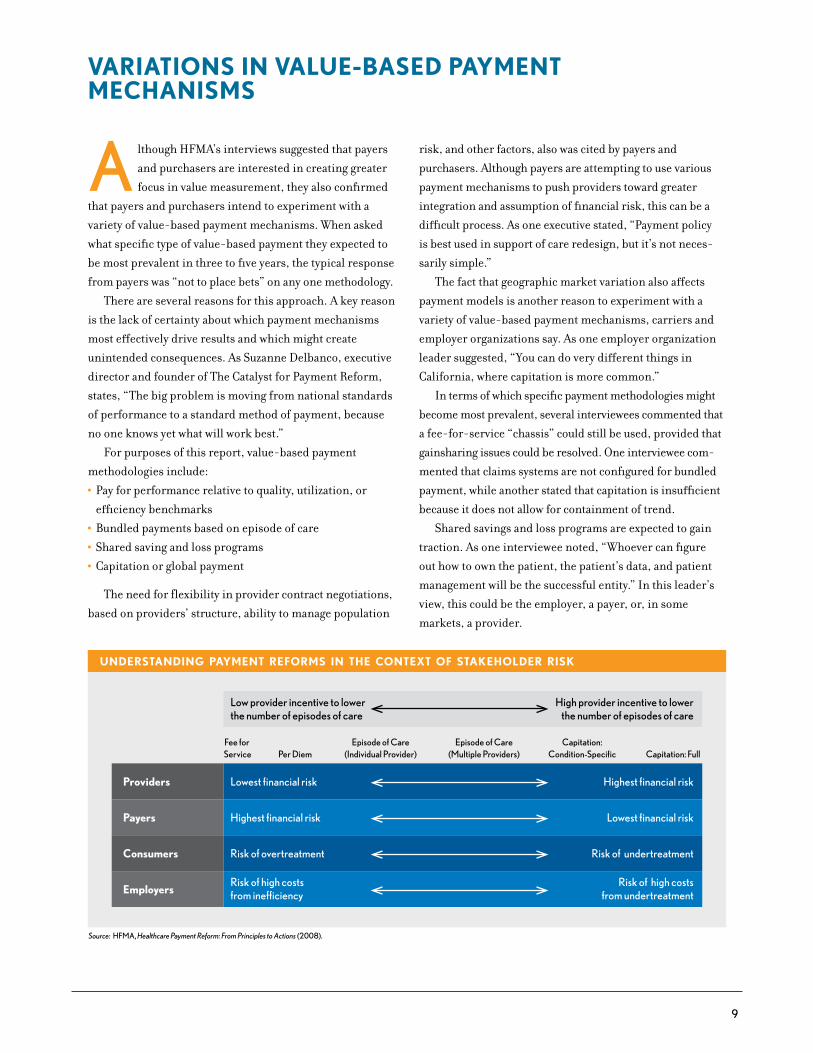
UNDERSTANDING PAYMENT REFORMS IN THE CONTEXT OF STAKEHOLDER RISK
Source: HFMA, Healthcare Payment Reform: From Principles to Actions (2008).
Low provider incentive to lowerthe number of episodes of care
High provider incentive to lowerthe number of episodes of care
Lowest financial riskProviders Highest financial risk
Highest financial riskPayers Lowest financial risk
Risk of overtreatmentConsumers Risk of undertreatment
Risk of high costsfrom inefficiencyEmployers
Risk of high costsfrom undertreatment
Fee for Service Per Diem
Episode of Care(Individual Provider)
Episode of Care(Multiple Providers)
Capitation:Condition-Specific Capitation: Full
10
Commitment to PurSuing VAlue- BASeD PAymentAll payers interviewed expressed a commitment to pushing
value-based payment. CMS has communicated its schedule
for increasing the percentage of hospital payment at risk for
performance, and in 2015, will introduce value modifiers
for professional services. Both cost and quality data are to
be included in calculating payments for physicians. MedPAC
leaders have expressed openness to experimenting with
value-based payment methods. One commercial carrier’s
goal is to have 75 percent of commercial, nonmanaged care
members in a plan that utilizes value-based contracting by
2015; currently, fewer than 5 percent of its members are in
such a plan. Another carrier estimates that 20 percent of
its providers will experience some form of financial risk
sharing within five years.
Business leaders generally expressed optimism that
employers are increasingly becoming more willing to take
stronger positions on value-based payment, especially
where there is a clear quality argument. As better provider-
specific quality and price data emerge, these leaders expect
that employers will be more willing to tier, if not eliminate,
providers from their networks. In anticipation of this, a
carrier interviewed by HFMA is building capabilities for
products that offer highly modular network configurations.
Other levers to drive value include the following.
Consumer engagement. Viewpoints on the potential for
patient engagement to improve value ranged from skeptical
to strongly supportive. Some indicated little optimism that
consumers will drive value in any meaningful way, since
this has not been demonstrated to date. One interviewee
noted that achieving transparency is more difficult than one
might expect. “If I find out that Hospital X is best at outpa-
tient care, but my orthopedist doesn’t practice there, what
do I do, fire my doctor?” one interviewee commented. And
concerns about provider-specific data reliability led one
commercial carrier leader to state, “We’re not big fans of
consumer transparency.”
On the other hand, some interviewees view consumer
transparency as a vital complement to value-based payment
mechanisms. For example, a CMS representative described it
as “incredibly important;” he sees consumer engagement as
an outcome of CMS’s efforts to drive improved reporting.
Meanwhile, a commercial carrier described consumer trans-
parency as a “key ingredient” for driving improved value.
All interviewees agreed that the quality and price data
available to healthcare consumers today are insufficient.
Many commented on the need for a simple rating system
of providers, although one CMS leader stressed the need
to have population-specific ratings (e.g., for the elderly,
lower-income mothers and children). A CMS leader stated
that developing data useful to consumers will require “a
dialogue among CMS, patients, medical boards, private
payers, and the private sector.”
Several interviewees noted that consumer engagement
today may be inhibited not only because of lack of trans-
parency and understandable metrics, but also for other
reasons. One issue that surfaced pertains to benefit design,
and the sense that today’s benefit structures don’t neces-
sarily make it easy for the patient to “do the right thing.”
Others mentioned that fragmented care delivery can also
impede the patient’s ability to engage appropriately in his
or her care.
Insurance exchanges. None of the interviewees who
discussed the insurance exchanges sees them as a vehicle
for driving quality in the near term. Most states are con-
centrating on getting core technical capabilities in place
by January 2014, and will be “passive,” meaning they will
not set many rules or requirements about participation in
the exchange. According to the NAIC, once the exchanges
are up and running, and the market and government have
had some time to assess the impact, states might become
more active purchasers and more assertive about quality
standards for plan participation. Employer representatives
generally expressed the same viewpoint and conveyed
disappointment that the exchanges would not be more
insistent about quality initially.
Research suggests that consumers using the insurance
exchanges will be sensitive to price. A study of likely
consumers of health insurance exchanges in 2014 by PwC
Health Research Institute revealed that individuals who are
likely to be Medicaid- or subsidy-eligible consider price
to be more important than benefits when choosing health
insurance. This study also showed that price becomes a
more important consideration than benefits as self-
reported health status worsens.6
6 Change the Channel: Health Insurance Exchanges Expand Choice and Competition, PwC Health Research Institute, July 2011.
11
DeliVering VAlue
I nterviews and surveys conducted with hospital and
health system leaders indicate that they are beginning
to invest and organize in preparation for the emerging
payment environment. This section of the report reveals
areas of synergy between external stakeholders and providers.
Most notably, external stakeholders and providers:
•Recognize that the future requires them to focus on cost
containment
•Anticipate a real commitment to pursuing value-based
payment methodologies over the next three to five years
•Believe the path forward is largely one of experimentation
with payment methods
•View care delivery as the key to improving value in health care
This section examines these topics from the perspective
of the provider and also discusses findings related to:
•Approaches providers are taking toward experimentation
with care delivery and payment methodologies
•Plans for investment in costing and business intelligence
capabilities
•How organizational leaders are developing more change-
oriented cultures and workforces
•Outcomes providers anticipate from these efforts
foCuS on CoSt ContAinmentRegardless of the emergence of value-based payment or
state or federal healthcare legislation, interviewees predict
a future of reduced revenue and noted that their organiza-
tions are working toward improved efficiency.
“We’ll get paid less for each unit of service,” says
Dominic Nakis, CFO of Oak Brook, Ill.-based Advocate
Health Care, “We need to become more cost-efficient.”
Cost containment initiatives at Advocate include (but are
not limited to) labor productivity, supply cost management
in physician preference items, logistics and commodity
purchases, and clinical effectiveness initiatives such as
length of stay variability analysis, cardiac order sets, blood
and radiology utilization, and management of ventilation
days for ICU patients.
Dean Health in Madison, Wis., recognizes that the
employer community cannot withstand the double-digit
premium increases of the past. Dean Health’s goal for
2012 is to wring out $20 million in costs, having already
successfully cut a similar amount from last year’s budget.
Longmont United Hospital, based in Longmont, Colo.,
has maintained a focus on cost containment. For example,
the hospital put case managers in the emergency depart-
ment, which accounts for 70 percent of the hospital’s
inpatient admissions, to more appropriately triage what
route (inpatient or other) these patients take for care.
Neil Bertrand, Longmont’s CFO, estimates this practice
costs the organization $10 million in revenue annually,
but stated, “It is the right way to deliver care.”
UAB Hospital of Birmingham, Ala., has already tackled
key initiatives, including productivity analyses and supply
cost containment. The hospital’s overall goal is to reduce
cost while maintaining or improving quality.
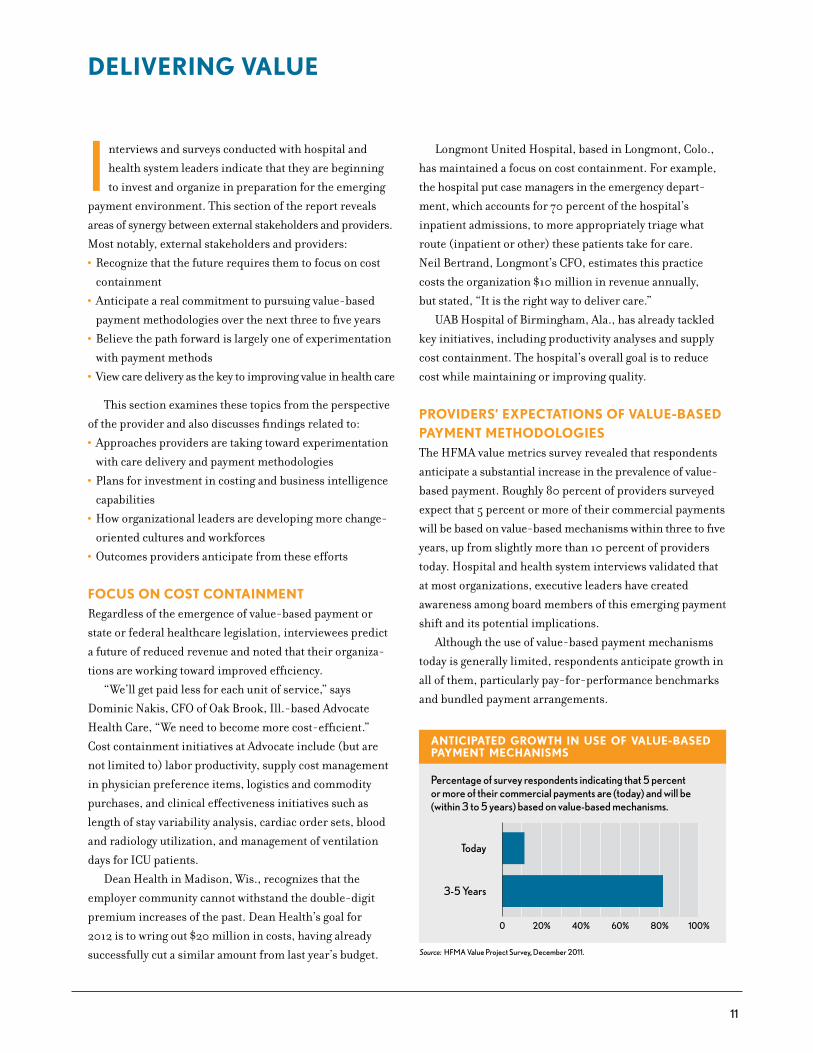
ProViDerS’ exPeCtAtionS of VAlue-BASeD PAyment methoDologieSThe HFMA value metrics survey revealed that respondents
anticipate a substantial increase in the prevalence of value-
based payment. Roughly 80 percent of providers surveyed
expect that 5 percent or more of their commercial payments
will be based on value-based mechanisms within three to five
years, up from slightly more than 10 percent of providers
today. Hospital and health system interviews validated that
at most organizations, executive leaders have created
awareness among board members of this emerging payment
shift and its potential implications.
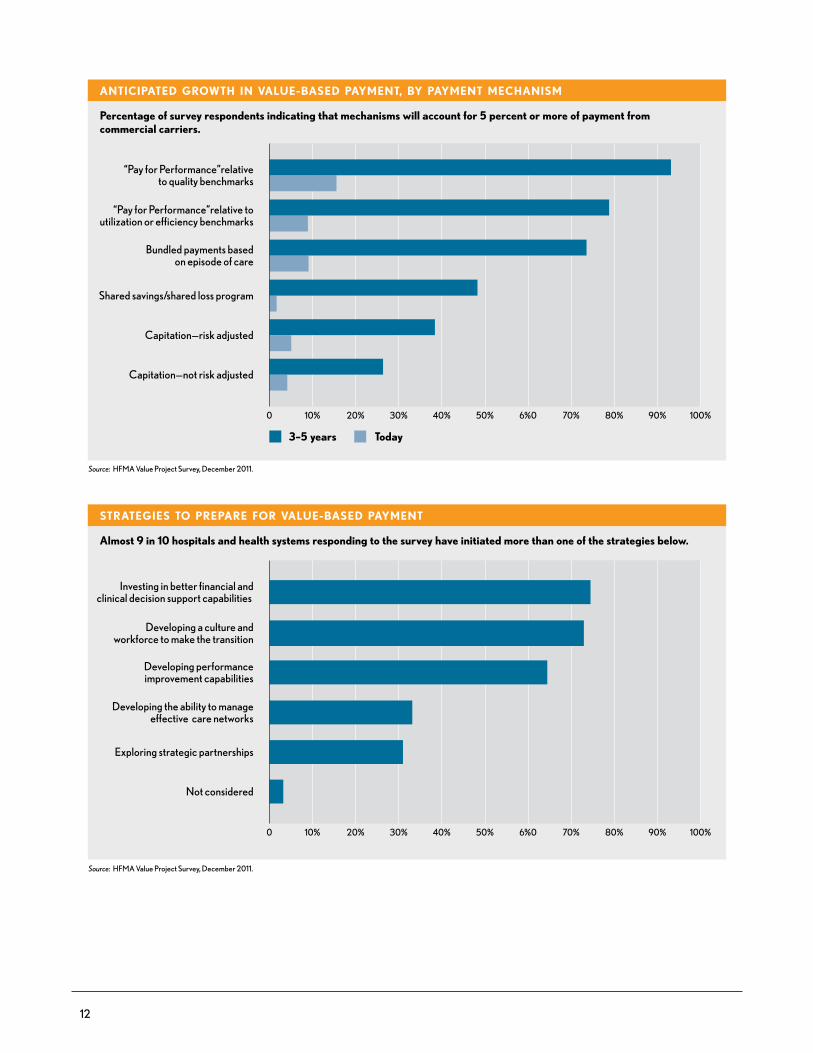
Although the use of value-based payment mechanisms
today is generally limited, respondents anticipate growth in
all of them, particularly pay-for-performance benchmarks
and bundled payment arrangements.
ANTICIPATED GROWTH IN USE OF VALUE-BASED PAYMENT MECHANISMS
Percentage of survey respondents indicating that 5 percent or more of their commercial payments are (today) and will be (within 3 to 5 years) based on value-based mechanisms.
Today
3-5 Years
0 20% 40% 60% 80% 100%
Source: HFMA Value Project Survey, December 2011.
12
0 10% 20% 30% 40% 50% 6%0 70% 80% 100%90%
ANTICIPATED GROWTH IN VALUE-BASED PAYMENT, BY PAYMENT MECHANISM
Percentage of survey respondents indicating that mechanisms will account for 5 percent or more of payment from commercial carriers.
“Pay for Performance”relativeto quality benchmarks
“Pay for Performance”relative toutilization or efficiency benchmarks
Bundled payments basedon episode of care
Shared savings/shared loss program
Capitation—risk adjusted
Capitation—not risk adjusted
Source: HFMA Value Project Survey, December 2011.
Today3–5 years
STRATEGIES TO PREPARE FOR VALUE-BASED PAYMENT
Almost 9 in 10 hospitals and health systems responding to the survey have initiated more than one of the strategies below.
Investing in better financial andclinical decision support capabilities
Developing a culture and workforce to make the transition
Developing performanceimprovement capabilities
Developing the ability to manageeffective care networks
Exploring strategic partnerships
Not considered
Source: HFMA Value Project Survey, December 2011.
0 10% 20% 30% 40% 50% 6%0 70% 80% 100%90%
13
Most providers are actively preparing for value-based
payment by investing in better financial and clinical decision
support capabilities and focusing on developing a culture
and workforce to make the transition to a different payment
environment (see the exhibit at bottom left).
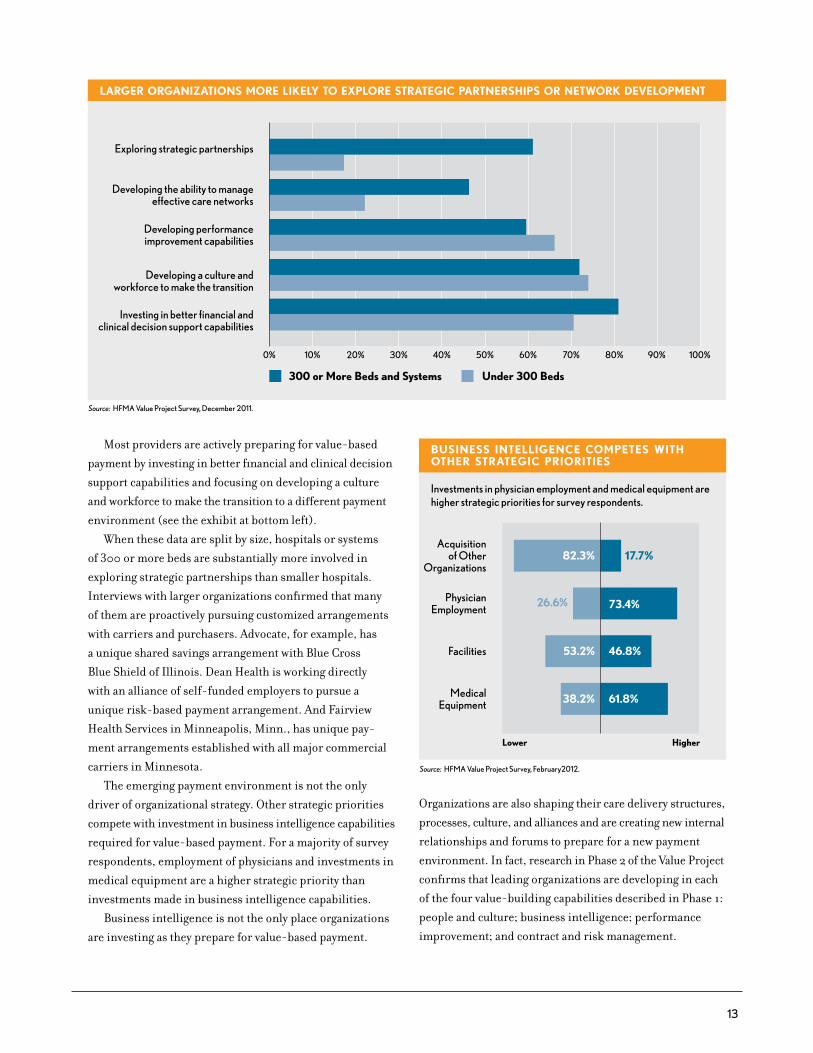
When these data are split by size, hospitals or systems
of 300 or more beds are substantially more involved in
exploring strategic partnerships than smaller hospitals.
Interviews with larger organizations confirmed that many
of them are proactively pursuing customized arrangements
with carriers and purchasers. Advocate, for example, has
a unique shared savings arrangement with Blue Cross
Blue Shield of Illinois. Dean Health is working directly
with an alliance of self-funded employers to pursue a
unique risk-based payment arrangement. And Fairview
Health Services in Minneapolis, Minn., has unique pay-
ment arrangements established with all major commercial
carriers in Minnesota.
The emerging payment environment is not the only
driver of organizational strategy. Other strategic priorities
compete with investment in business intelligence capabilities
required for value-based payment. For a majority of survey
respondents, employment of physicians and investments in
medical equipment are a higher strategic priority than
investments made in business intelligence capabilities.
Business intelligence is not the only place organizations
are investing as they prepare for value-based payment.
LARGER ORGANIZATIONS MORE LIKELY TO EXPLORE STRATEGIC PARTNERSHIPS OR NETWORK DEVELOPMENT
Exploring strategic partnerships
Developing the ability to manageeffective care networks
Developing performanceimprovement capabilities
Developing a culture andworkforce to make the transition
Investing in better financial andclinical decision support capabilities
Source: HFMA Value Project Survey, December 2011.
Under 300 Beds300 or More Beds and Systems
0% 10% 20% 30% 40% 50% 60% 70% 80% 100% 90%
BUSINESS INTELLIGENCE COMPETES WITH OTHER STRATEGIC PRIORITIES
17.7%82.3%
53.2%
38.2% 61.8%
46.8%
73.4%
Investments in physician employment and medical equipment are higher strategic priorities for survey respondents.
Acquisitionof Other
Organizations
PhysicianEmployment
Facilities
MedicalEquipment
Lower Higher
Source: HFMA Value Project Survey, February2012.
26.6%
Organizations are also shaping their care delivery structures,
processes, culture, and alliances and are creating new internal
relationships and forums to prepare for a new payment
environment. In fact, research in Phase 2 of the Value Project
confirms that leading organizations are developing in each
of the four value-building capabilities described in Phase 1:
people and culture; business intelligence; performance
improvement; and contract and risk management.
14
CAre DeliVery AS the PrimAry meChAniSm to imProVe VAlueLike external stakeholders, provider organizations inter-
viewed see care delivery as the primary mechanism to
maintain or improve quality while driving out cost. As
noted by Fred Hargett, CFO of Novant Health in Winston-
Salem, N.C., “The key to improving cost structure will be
through changes in care delivery.” Melinda Hancock, CFO
of Richmond-based Bon Secours Virginia Health System,
was more specific, saying, “The only way to manage business
is through primary care physicians. They are critical for
population health and disease management.” This empha-
sis on clinical care management resulted in numerous care
delivery-focused investments and experiments.
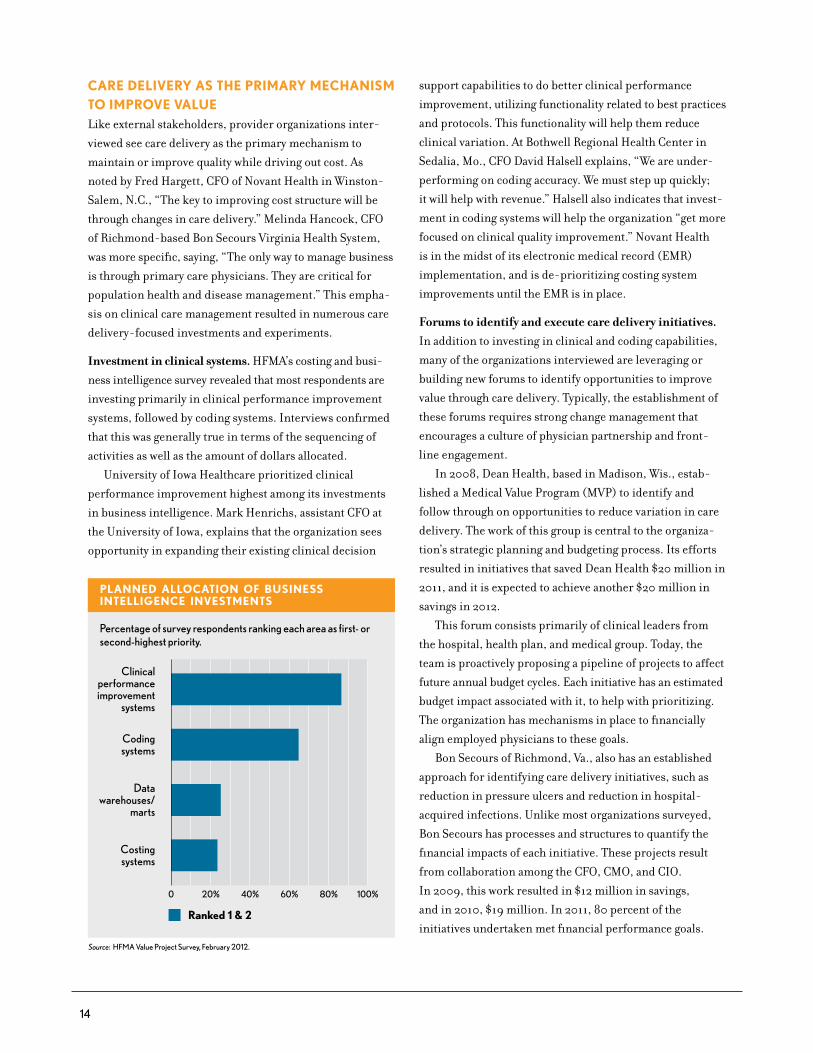
Investment in clinical systems. HFMA’s costing and busi-
ness intelligence survey revealed that most respondents are
investing primarily in clinical performance improvement
systems, followed by coding systems. Interviews confirmed
that this was generally true in terms of the sequencing of
activities as well as the amount of dollars allocated.
University of Iowa Healthcare prioritized clinical
performance improvement highest among its investments
in business intelligence. Mark Henrichs, assistant CFO at
the University of Iowa, explains that the organization sees
opportunity in expanding their existing clinical decision
support capabilities to do better clinical performance
improvement, utilizing functionality related to best practices
and protocols. This functionality will help them reduce
clinical variation. At Bothwell Regional Health Center in
Sedalia, Mo., CFO David Halsell explains, “We are under-
performing on coding accuracy. We must step up quickly;
it will help with revenue.” Halsell also indicates that invest-
ment in coding systems will help the organization “get more
focused on clinical quality improvement.” Novant Health
is in the midst of its electronic medical record (EMR)
implementation, and is de-prioritizing costing system
improvements until the EMR is in place.
Forums to identify and execute care delivery initiatives.
In addition to investing in clinical and coding capabilities,
many of the organizations interviewed are leveraging or
building new forums to identify opportunities to improve
value through care delivery. Typically, the establishment of
these forums requires strong change management that
encourages a culture of physician partnership and front-
line engagement.
In 2008, Dean Health, based in Madison, Wis., estab-
lished a Medical Value Program (MVP) to identify and
follow through on opportunities to reduce variation in care
delivery. The work of this group is central to the organiza-
tion’s strategic planning and budgeting process. Its efforts
resulted in initiatives that saved Dean Health $20 million in
2011, and it is expected to achieve another $20 million in
savings in 2012.
This forum consists primarily of clinical leaders from
the hospital, health plan, and medical group. Today, the
team is proactively proposing a pipeline of projects to affect
future annual budget cycles. Each initiative has an estimated
budget impact associated with it, to help with prioritizing.
The organization has mechanisms in place to financially
align employed physicians to these goals.
Bon Secours of Richmond, Va., also has an established
approach for identifying care delivery initiatives, such as
reduction in pressure ulcers and reduction in hospital-
acquired infections. Unlike most organizations surveyed,
Bon Secours has processes and structures to quantify the
financial impacts of each initiative. These projects result
from collaboration among the CFO, CMO, and CIO.
In 2009, this work resulted in $12 million in savings,
and in 2010, $19 million. In 2011, 80 percent of the
initiatives undertaken met financial performance goals.
PLANNED ALLOCATION OF BUSINESS INTELLIGENCE INVESTMENTS
Percentage of survey respondents ranking each area as first- or second-highest priority.
Clinicalperformanceimprovement
systems
Codingsystems
Datawarehouses/
marts
Costingsystems
0 20% 40% 60% 80% 100%
Source: HFMA Value Project Survey, February 2012.
Ranked 1 & 2
15
The organization today is focusing on initiatives that
favorably affect cost per case, with a particular focus on
those that affect fixed versus variable cost.
Novant Health, serving North Carolina, Virginia, South
Carolina, and Georgia, recently established an Innovation
Group, a “bottoms up” forum to share ideas for improving
or maintaining quality while reducing cost in clinically
oriented areas as well as in support departments. So far, the
ideas submitted have been small in scale, but creative. The
organization is not yet measuring the cost impacts of ideas
generated by the Innovation Group: At this early stage, CFO
Fred Hargett notes, “You have to go on faith that there’s a
favorable cost impact.”
As described in HFMA’s People and Culture report, some
leading organizations are augmenting their care delivery
improvements by involving patients directly in the process.
At Spectrum Health, leaders established patient and family
advisory councils to help prioritize and design improve-
ment activities. Similarly, the Cleveland Clinic created an
Office of Patient Experience to involve patients and care-
givers directly in care improvement initiatives.
Experimentation with care delivery approaches. A number
of interviewees indicated that they are experimenting with
different approaches to care delivery. For instance, one
multihospital system is forging a new relationship with
community long-term care facilities to collaboratively
improve management of readmissions from those settings.
Longmont United Hospital, Longmont, Colo., is pursuing
innovative arrangements with other providers. The hospital
recently organized a co-management agreement forming a
limited liability company (LLC) with all orthopedic surgeons
and neurosurgeons in the area.7 Immediate goals of the
LLC are to establish and manage to quality and efficiency
measures. Ultimately, the goals of this organization are to:
•Create aligned incentives
•Prepare for bundled payment
•Foster behavior modification on the part of all parties
Additionally, Longmont United is participating in
the newly created Boulder Valley Care Network (BVCN).
BVCN was created at the urging of the Boulder Valley School
District, which sought help from area providers to manage
costs and care in its self-funded plan. BVCN is a provider
consortium including Boulder Community Hospital and
Avista Hospital and their related medical staffs. Including
the hospitals’ medical staffs, a total of seven provider
entities are involved in the BVCN.
In collaboration with the community school district,
BVCN medical leaders are starting to analyze chronic
disease in the district’s population. BVCN and the school
district have designed incentives for savings, to be distrib-
uted among the providers. BVCN is also discussing the
possibility of applying for ACO status. BVCN providers are
not linked electronically, but hope to leverage the Colorado
Regional Health Information Organization (CORHIO) for
that capability.
Some organizations indicated they are beginning to
focus on their own self-funded population of employees as a
means of gaining experience with population care manage-
ment. Longmont United Hospital intends to contract with
the BVCN and utilize the care management approaches
there as a means of better analyzing, identifying, and
executing opportunities to improve care management for
the Longmont United Hospital insured population.
Contracted networks. Many interviewees commented that
their organizations are working to align their contracted
physicians with their cost and quality efforts. Whether
they are successful could impact their ability to manage
outcomes-based payment arrangements.
Most interviewees are working to ensure that network
physicians are on EHRs. One organization is considering a
carrot-and-stick approach to this issue, offering subsidies,
but with a deadline to implement or risk contract
termination.
Dean Health is well along the path toward aligning its
contracted network. Over time, Dean has developed the
“Dean Value Contract,” which CFO Steve Caldwell described
as a process of aligning physicians to value in contractual
terms that are “as sophisticated as possible.” The Dean
Value Contract has migrated contracted physicians to be
accountable for key metrics of importance to Dean Health,
including patient satisfaction, total cost of care, clinical
quality, and generic drug metrics.
7 This model is consistent with an HFMA co-management case study from Iowa Health-Des Moines, available at hfma.org/IowaHealthCaseStudy.
16
PurPoSeful exPerimentAtion With VAlue-BASeD PAyment methoDologieS
t o prepare for value-based payment, some hospitals
and health systems are pursuing a path of experi-
mentation (e.g., with bundled payments), while
others are pushing commercial carriers to move directly to
shared savings arrangements. Experience with financial
risk management and market environment appear to
influence which path organizations take. The organizations
pursuing shared savings arrangements tend to have more
experience with financial risk management, with greater
leverage in markets moving more aggressively toward
value-based payment methods.
Experimentation. Many organizations interviewed are
proactively positioning to experiment with different value-
based payment methodologies, as a strategy to learn what is
required to be successful in these different arrangements.
This approach is emerging regardless of the current degree
of market pressure to include value-based payment mecha-
nisms in contracts. For example, UAB Hospital is proactively
pursuing bundled payment arrangements. UAB pulled
together a cross-functional team that used data from dispa-
rate sources to identify opportunities. The organization
packaged a chronic obstructive pulmonary disease (COPD)
proposal for CMS, which it plans to submit in June 2012.
Additionally, leaders for the organization are meeting with
UAB’s major commercial carrier, Blue Cross, to push for a
unique payment arrangement related to the COPD bundle.
At Longmont United, the BVCN will participate in
CMS’s bundled payment initiative with PROMETHEUS.
The hospital will be one of just two providers in Colorado
participating in this initiative. Longmont is now sending
data to PROMETHEUS so that the vendor can help identify
bundled payment opportunities, with a goal of finding three
to five high-volume or high-cost areas with variation in care.
Novant Health’s strategy is to approach value-based
payment through experimentation, Hargett says. He noted
that Novant is open to trying different types of value-based
arrangements. The organization has negotiated numerous
pay-for-performance arrangements already with commer-
cial carriers while continuing to evaluate shared savings or
episode-of-care payment arrangements.
Shared savings. Because of its long history in running its
own health plan, Dean has tremendous experience in
population risk management. The organization’s goal is to
pursue population-based payment methodologies. Its efforts
to contract on a shared savings basis with a major local
self-funded consortium has had some success through pay
for performance, and the parties are discussing moving to
gainsharing in the future. Dean has applied for the Medicare
Shared Savings program, to begin in July. The organization
is less interested in bundled payment or pay for performance,
and is very willing to take full risk with payers.
Fairview Health Services, based in Minneapolis, has
shared savings agreements in place with all four major
commercial health plans in its market. Altogether, Fairview
has roughly 300,000 patients in commercial shared savings
arrangements. Additionally, Fairview has been approved as
a Pioneer ACO, and anticipates that about 19,000 Medicare
patients will be involved. Fairview is also considering methods
of bundled payment; however, its primary focus related to
value-based payment is population health management.
Effective Jan. 1, 2011, Advocate Health Care, based
near Chicago, initiated a commercial shared savings
arrangement with Blue Cross. Advocate CFO Dominic
Nakis describes this as a deliberate move on Advocate’s
part to pursue population-based risk arrangements and to
gain experience with this particular payment methodology.
Additionally, Advocate has had capitated payments “for
quite some time,” through Medicare Advantage plans and
other commercial HMO contracts, Nakis says. He estimates
that about 275,000 lives are covered under these capitated
arrangements. Advocate is not pursuing bundled payments.
Fairview and Advocate shared some common first
experiences as they embarked on population risk manage-
ment. Notably, each invested in care coordinators. Both are
also learning how to analyze and act upon longitudinal
claims data.
Daniel Fromm, Fairview’s CFO, notes, “We want to
receive patient-level claims data as frequently as we can get
it.” Some commercial carriers have been willing to provide
Fairview with longitudinal data, and others have provided
aggregated statistics. Fairview created an analytics function
17
within the finance department to work with these data;
however, both finance and clinical staff review and use the
data to assess aspects of care and cost (such as per-member,
per-month costs for pharmaceuticals, total cost of care,
and high claims management) and to find opportunities to
manage patients well in lower-cost settings. They also try
to use the data to manage capacity at a particular location.
Blue Cross sends Advocate complete longitudinal patient
data for the patients attributed to Advocate in the shared
services arrangement. Advocate invested in a population
health management system in early 2011, which allows for
the aggregation of total spend for each attributed patient
across all healthcare providers, whether they are within or
outside of the Advocate network. This in turn allows for data
mining to find opportunities to deliver care across venues
in more cost-effective ways, and identify higher-cost
situations that can be managed by case managers. Advocate
hired an actuary to work with the data, whose analyses are
then shared with case managers.
A few organizations interviewed expressed reservations
about shared savings arrangements and ACOs in particular
because of the lack of accountability required of the patient.
Leading organizations such as Advocate and Fairview are
mitigating this concern by obtaining and analyzing as much
longitudinal data as possible, and by experimenting with
care coordinators to best meet the clinical service needs of
patients participating in these shared savings arrangements.
Interviewees noted that tackling emerging payment
methodologies created some stronger relationships within
their organizations. Specifically, partnerships among
contracting, finance and physician leaders were beginning
to emerge. At UAB, efforts at defining episodes of care
for bundled payment are tightening these relationships.
At Longmont, some commercial carriers are proposing
specific areas of focus, with associated payment arrange-
ments; in these cases, contracting staff work with the quality
improvement department to determine what is feasible.
18
CoSting AnD BuSineSS intelligenCe inVeStmentS
A s provider organizations grapple with a future of
reduced payment, a key issue is where to focus
attention. Effective business intelligence and
costing systems can help to identify internal trends of cost
growth as well as facilitate comparisons to evidence-based
standards of care.
Many organizations interviewed acknowledge that they
require improved costing and decision support capabilities
to be successful in a value-based payment environment. As
noted previously, organizations surveyed are prioritizing
clinical system investments, but they also anticipate dra-
matic improvements, particularly in their inpatient costing
capabilities.
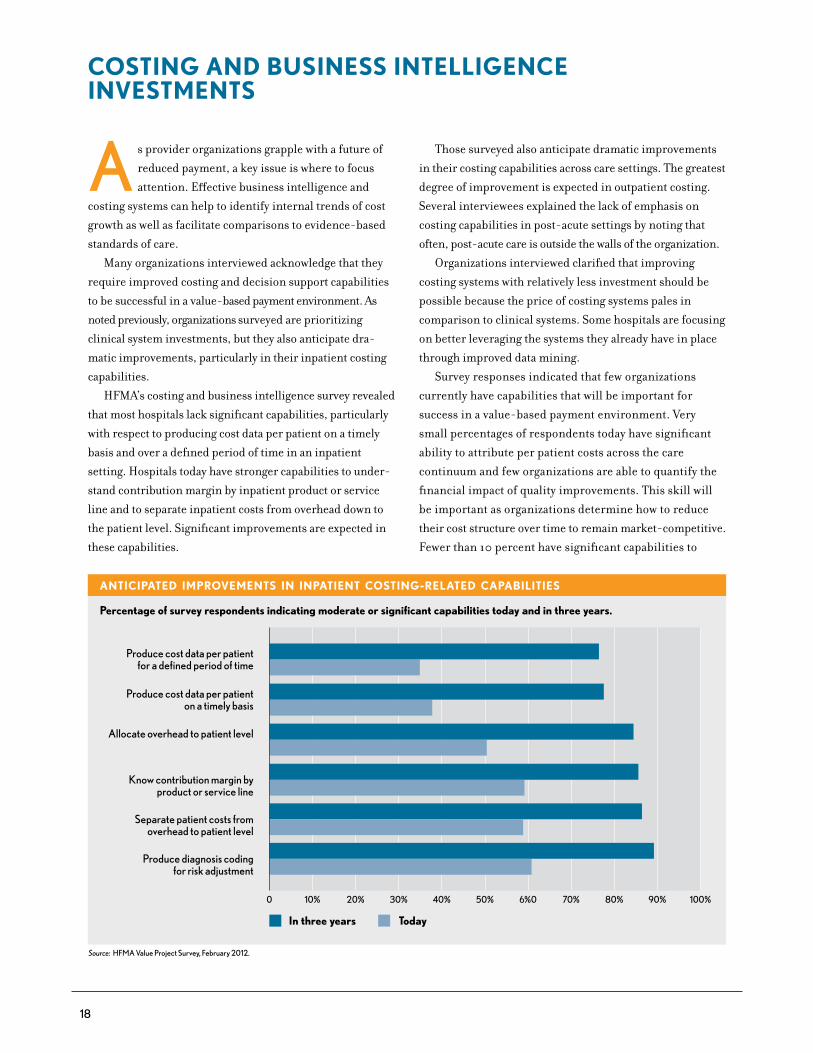
HFMA’s costing and business intelligence survey revealed
that most hospitals lack significant capabilities, particularly
with respect to producing cost data per patient on a timely
basis and over a defined period of time in an inpatient
setting. Hospitals today have stronger capabilities to under-
stand contribution margin by inpatient product or service
line and to separate inpatient costs from overhead down to
the patient level. Significant improvements are expected in
these capabilities.
Those surveyed also anticipate dramatic improvements
in their costing capabilities across care settings. The greatest
degree of improvement is expected in outpatient costing.
Several interviewees explained the lack of emphasis on
costing capabilities in post-acute settings by noting that
often, post-acute care is outside the walls of the organization.
Organizations interviewed clarified that improving
costing systems with relatively less investment should be
possible because the price of costing systems pales in
comparison to clinical systems. Some hospitals are focusing
on better leveraging the systems they already have in place
through improved data mining.
Survey responses indicated that few organizations
currently have capabilities that will be important for
success in a value-based payment environment. Very
small percentages of respondents today have significant
ability to attribute per patient costs across the care
continuum and few organizations are able to quantify the
financial impact of quality improvements. This skill will
be important as organizations determine how to reduce
their cost structure over time to remain market-competitive.
Fewer than 10 percent have significant capabilities to
ANTICIPATED IMPROVEMENTS IN INPATIENT COSTING-RELATED CAPABILITIES
Percentage of survey respondents indicating moderate or significant capabilities today and in three years.
Produce cost data per patientfor a defined period of time
Produce cost data per patienton a timely basis
Allocate overhead to patient level
Know contribution margin by product or service line
Separate patient costs from overhead to patient level
Produce diagnosis coding for risk adjustment
Source: HFMA Value Project Survey, February 2012.
TodayIn three years
0 10% 20% 30% 40% 50% 6%0 70% 80% 100%90%
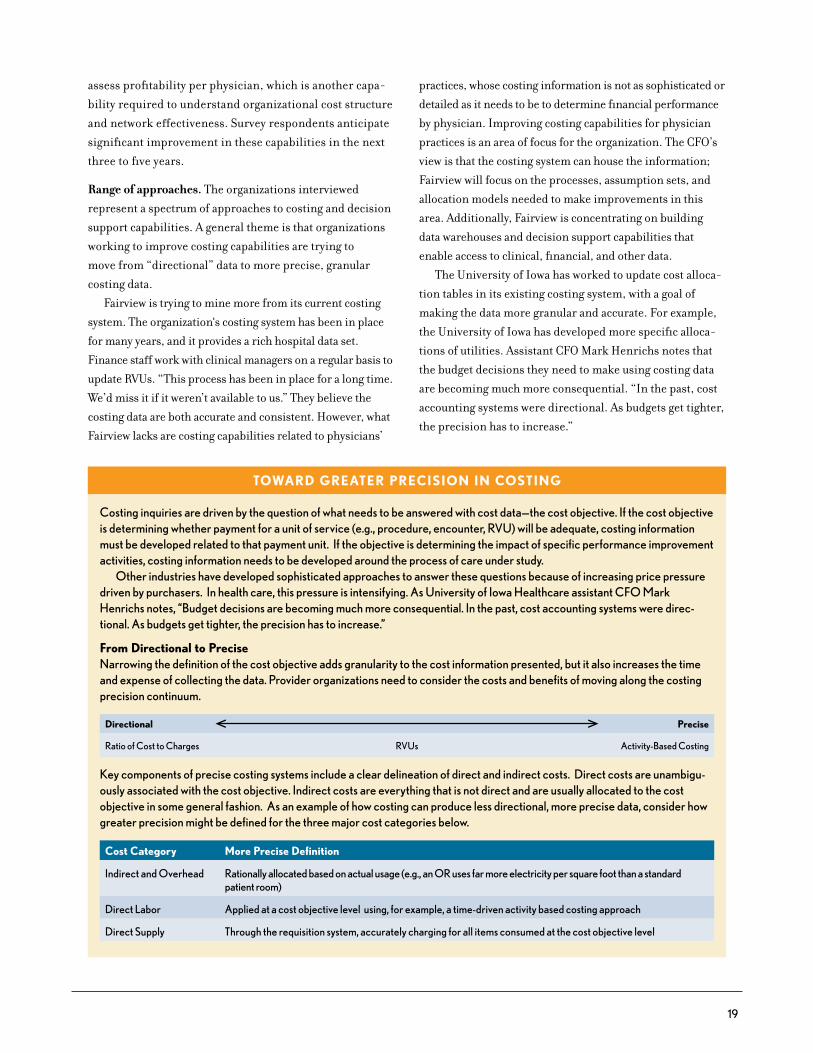
19
toWArD greAter PreCiSion in CoSting
costing inquiries are driven by the question of what needs to be answered with cost data—the cost objective. If the cost objective is determining whether payment for a unit of service (e.g., procedure, encounter, rVu) will be adequate, costing information must be developed related to that payment unit. If the objective is determining the impact of specific performance improvement activities, costing information needs to be developed around the process of care under study.
other industries have developed sophisticated approaches to answer these questions because of increasing price pressure driven by purchasers. In health care, this pressure is intensifying. As university of Iowa Healthcare assistant cFo Mark Henrichs notes, “Budget decisions are becoming much more consequential. In the past, cost accounting systems were direc-tional. As budgets get tighter, the precision has to increase.”
from Directional to PreciseNarrowing the definition of the cost objective adds granularity to the cost information presented, but it also increases the time and expense of collecting the data. Provider organizations need to consider the costs and benefits of moving along the costing precision continuum.
Directional Precise
ratio of cost to charges rVus Activity-Based costing
Key components of precise costing systems include a clear delineation of direct and indirect costs. Direct costs are unambigu-ously associated with the cost objective. Indirect costs are everything that is not direct and are usually allocated to the cost objective in some general fashion. As an example of how costing can produce less directional, more precise data, consider how greater precision might be defined for the three major cost categories below.
Cost Category more Precise Definition
Indirect and overhead rationally allocated based on actual usage (e.g., an or uses far more electricity per square foot than a standard patient room)
Direct labor Applied at a cost objective level using, for example, a time-driven activity based costing approach
Direct Supply through the requisition system, accurately charging for all items consumed at the cost objective level
assess profitability per physician, which is another capa-
bility required to understand organizational cost structure
and network effectiveness. Survey respondents anticipate
significant improvement in these capabilities in the next
three to five years.
Range of approaches. The organizations interviewed
represent a spectrum of approaches to costing and decision
support capabilities. A general theme is that organizations
working to improve costing capabilities are trying to
move from “directional” data to more precise, granular
costing data.
Fairview is trying to mine more from its current costing
system. The organization‘s costing system has been in place
for many years, and it provides a rich hospital data set.
Finance staff work with clinical managers on a regular basis to
update RVUs. “This process has been in place for a long time.
We’d miss it if it weren’t available to us.” They believe the
costing data are both accurate and consistent. However, what
Fairview lacks are costing capabilities related to physicians’
practices, whose costing information is not as sophisticated or
detailed as it needs to be to determine financial performance
by physician. Improving costing capabilities for physician
practices is an area of focus for the organization. The CFO’s
view is that the costing system can house the information;
Fairview will focus on the processes, assumption sets, and
allocation models needed to make improvements in this
area. Additionally, Fairview is concentrating on building
data warehouses and decision support capabilities that
enable access to clinical, financial, and other data.
The University of Iowa has worked to update cost alloca-
tion tables in its existing costing system, with a goal of
making the data more granular and accurate. For example,
the University of Iowa has developed more specific alloca-
tions of utilities. Assistant CFO Mark Henrichs notes that
the budget decisions they need to make using costing data
are becoming much more consequential. “In the past, cost
accounting systems were directional. As budgets get tighter,
the precision has to increase.”
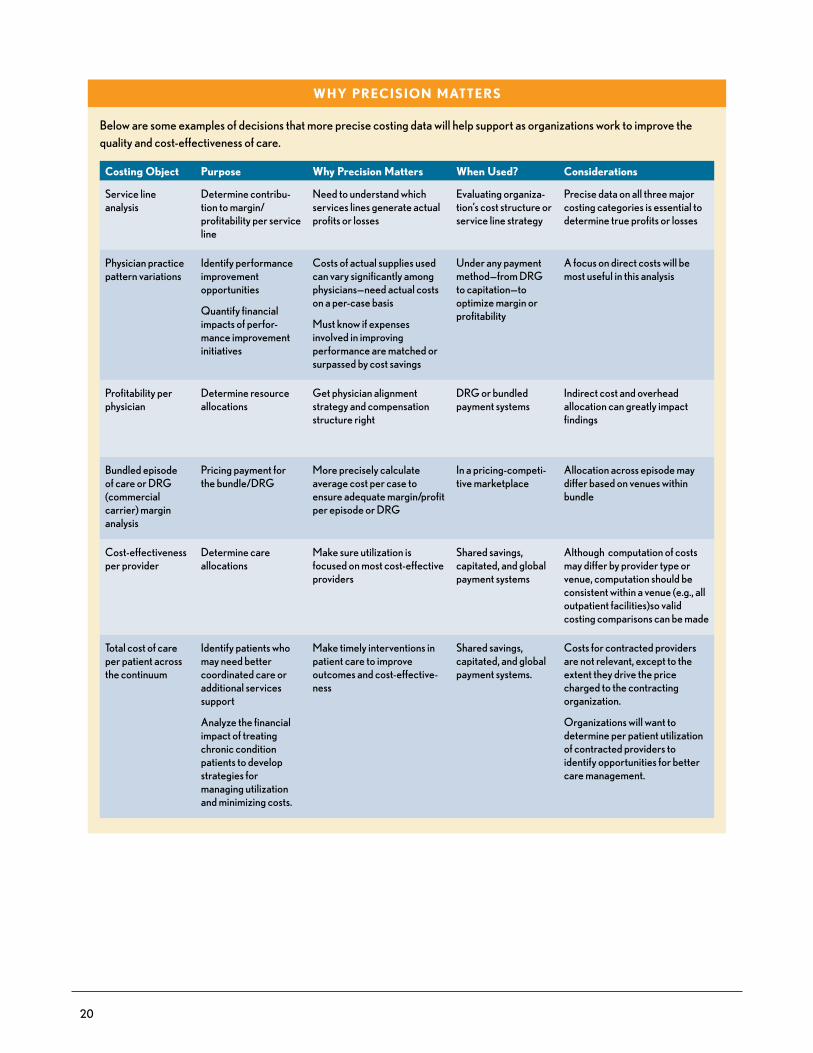
20
Why PreCiSion mAtterS
Below are some examples of decisions that more precise costing data will help support as organizations work to improve the quality and cost-effectiveness of care.
Costing object Purpose Why Precision matters When used? Considerations
Service line analysis
Determine contribu-tion to margin/profitability per service line
Need to understand which services lines generate actual profits or losses
evaluating organiza-tion’s cost structure or service line strategy
Precise data on all three major costing categories is essential to determine true profits or losses
Physician practice pattern variations
Identify performance improvement opportunities
Quantify financial impacts of perfor-mance improvement initiatives
costs of actual supplies used can vary significantly among physicians—need actual costs on a per-case basis
Must know if expenses involved in improving performance are matched or surpassed by cost savings
under any payment method—from DrG to capitation—to optimize margin or profitability
A focus on direct costs will be most useful in this analysis
Profitability per physician
Determine resource allocations
Get physician alignment strategy and compensation structure right
DrG or bundled payment systems
Indirect cost and overhead allocation can greatly impact findings
Bundled episode of care or DrG (commercial carrier) margin analysis
Pricing payment for the bundle/DrG
More precisely calculate average cost per case to ensure adequate margin/profit per episode or DrG
In a pricing-competi-tive marketplace
Allocation across episode may differ based on venues within bundle
cost-effectiveness per provider
Determine care allocations
Make sure utilization is focused on most cost-effective providers
Shared savings, capitated, and global payment systems
Although computation of costs may differ by provider type or venue, computation should be consistent within a venue (e.g., all outpatient facilities)so valid costing comparisons can be made
total cost of care per patient across the continuum
Identify patients who may need better coordinated care or additional services support
Analyze the financial impact of treating chronic condition patients to develop strategies for managing utilization and minimizing costs.
Make timely interventions in patient care to improve outcomes and cost-effective-ness
Shared savings, capitated, and global payment systems.
costs for contracted providers are not relevant, except to the extent they drive the price charged to the contracting organization.
organizations will want to determine per patient utilization of contracted providers to identify opportunities for better care management.
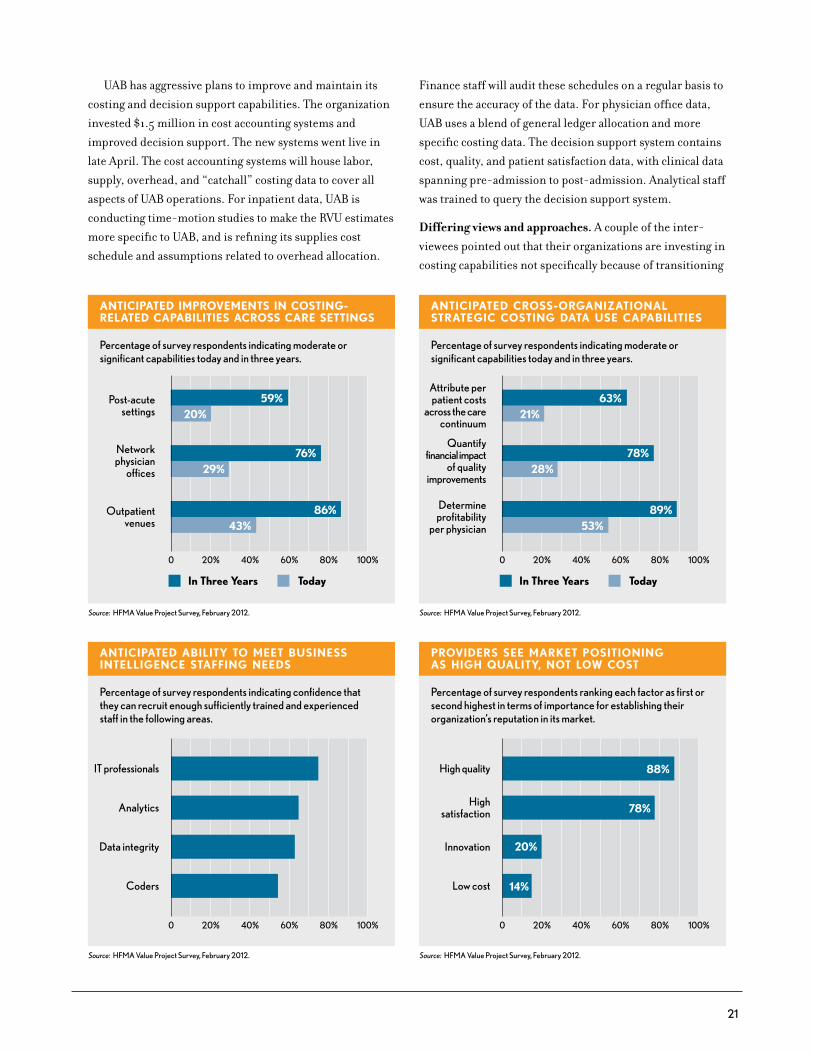
21
UAB has aggressive plans to improve and maintain its
costing and decision support capabilities. The organization
invested $1.5 million in cost accounting systems and
improved decision support. The new systems went live in
late April. The cost accounting systems will house labor,
supply, overhead, and “catchall” costing data to cover all
aspects of UAB operations. For inpatient data, UAB is
conducting time-motion studies to make the RVU estimates
more specific to UAB, and is refining its supplies cost
schedule and assumptions related to overhead allocation.
Finance staff will audit these schedules on a regular basis to
ensure the accuracy of the data. For physician office data,
UAB uses a blend of general ledger allocation and more
specific costing data. The decision support system contains
cost, quality, and patient satisfaction data, with clinical data
spanning pre-admission to post-admission. Analytical staff
was trained to query the decision support system.
Differing views and approaches. A couple of the inter-
viewees pointed out that their organizations are investing in
costing capabilities not specifically because of transitioning
ANTICIPATED IMPROVEMENTS IN COSTING-RELATED CAPABILITIES ACROSS CARE SETTINGS
Percentage of survey respondents indicating moderate or significant capabilities today and in three years.
Post-acutesettings
Networkphysician
offices
Outpatientvenues
0 20% 40% 60% 80% 100%
Source: HFMA Value Project Survey, February 2012.
TodayIn Three Years
59%20%
76%29%
86%43%
ANTICIPATED ABILITY TO MEET BUSINESS INTELLIGENCE STAFFING NEEDS
Percentage of survey respondents indicating confidence that they can recruit enough sufficiently trained and experienced staff in the following areas.
IT professionals
Analytics
Data integrity
Coders
0 20% 40% 60% 80% 100%
Source: HFMA Value Project Survey, February 2012.
ANTICIPATED CROSS-ORGANIZATIONAL STRATEGIC COSTING DATA USE CAPABILITIES
Percentage of survey respondents indicating moderate or significant capabilities today and in three years.
Attribute perpatient costs
across the carecontinuum
Quantify financial impact
of qualityimprovements
Determineprofitability
per physician
0 20% 40% 60% 80% 100%
Source: HFMA Value Project Survey, February 2012.
TodayIn Three Years
63%21%
78%28%
89%53%
PROVIDERS SEE MARKET POSITIONING AS HIGH QUALITY, NOT LOW COST
Percentage of survey respondents ranking each factor as first or second highest in terms of importance for establishing their organization’s reputation in its market.
High quality
Highsatisfaction
Innovation
Low cost
0 20% 40% 60% 80% 100%
Source: HFMA Value Project Survey, February 2012.
88%
78%
20%
14%
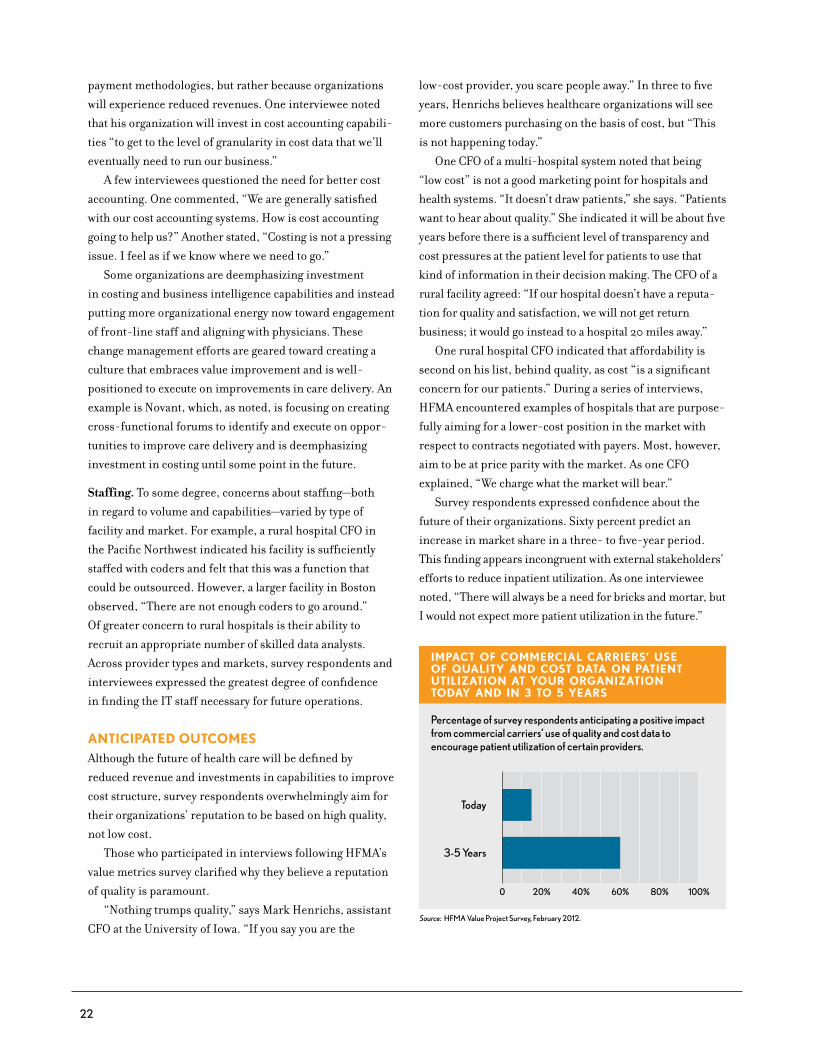
22
payment methodologies, but rather because organizations
will experience reduced revenues. One interviewee noted
that his organization will invest in cost accounting capabili-
ties “to get to the level of granularity in cost data that we’ll
eventually need to run our business.”
A few interviewees questioned the need for better cost
accounting. One commented, “We are generally satisfied
with our cost accounting systems. How is cost accounting
going to help us?” Another stated, “Costing is not a pressing
issue. I feel as if we know where we need to go.”
Some organizations are deemphasizing investment
in costing and business intelligence capabilities and instead
putting more organizational energy now toward engagement
of front-line staff and aligning with physicians. These
change management efforts are geared toward creating a
culture that embraces value improvement and is well-
positioned to execute on improvements in care delivery. An
example is Novant, which, as noted, is focusing on creating
cross-functional forums to identify and execute on oppor-
tunities to improve care delivery and is deemphasizing
investment in costing until some point in the future.
Staffing. To some degree, concerns about staffing—both
in regard to volume and capabilities—varied by type of
facility and market. For example, a rural hospital CFO in
the Pacific Northwest indicated his facility is sufficiently
staffed with coders and felt that this was a function that
could be outsourced. However, a larger facility in Boston
observed, “There are not enough coders to go around.”
Of greater concern to rural hospitals is their ability to
recruit an appropriate number of skilled data analysts.
Across provider types and markets, survey respondents and
interviewees expressed the greatest degree of confidence
in finding the IT staff necessary for future operations.
AntiCiPAteD outComeSAlthough the future of health care will be defined by
reduced revenue and investments in capabilities to improve
cost structure, survey respondents overwhelmingly aim for
their organizations’ reputation to be based on high quality,
not low cost.
Those who participated in interviews following HFMA’s
value metrics survey clarified why they believe a reputation
of quality is paramount.
“Nothing trumps quality,” says Mark Henrichs, assistant
CFO at the University of Iowa. “If you say you are the
low-cost provider, you scare people away.” In three to five
years, Henrichs believes healthcare organizations will see
more customers purchasing on the basis of cost, but “This
is not happening today.”
One CFO of a multi-hospital system noted that being
“low cost” is not a good marketing point for hospitals and
health systems. “It doesn’t draw patients,” she says. “Patients
want to hear about quality.” She indicated it will be about five
years before there is a sufficient level of transparency and
cost pressures at the patient level for patients to use that
kind of information in their decision making. The CFO of a
rural facility agreed: “If our hospital doesn’t have a reputa-
tion for quality and satisfaction, we will not get return
business; it would go instead to a hospital 20 miles away.”
One rural hospital CFO indicated that affordability is
second on his list, behind quality, as cost “is a significant
concern for our patients.” During a series of interviews,
HFMA encountered examples of hospitals that are purpose-
fully aiming for a lower-cost position in the market with
respect to contracts negotiated with payers. Most, however,
aim to be at price parity with the market. As one CFO
explained, “We charge what the market will bear.”
Survey respondents expressed confidence about the
future of their organizations. Sixty percent predict an
increase in market share in a three- to five-year period.
This finding appears incongruent with external stakeholders’
efforts to reduce inpatient utilization. As one interviewee
noted, “There will always be a need for bricks and mortar, but
I would not expect more patient utilization in the future.”
IMPACT OF COMMERCIAL CARRIERS’ USE OF QUALITY AND COST DATA ON PATIENT UTILIZATION AT YOUR ORGANIZATION TODAY AND IN 3 TO 5 YEARS
Percentage of survey respondents anticipating a positive impact from commercial carriers’ use of quality and cost data to encourage patient utilization of certain providers.
Today
3-5 Years
0 20% 40% 60% 80% 100%
Source: HFMA Value Project Survey, February 2012.
23
reCommenDAtionS
r esearch conducted in Phase 2 of HFMA’s Value
Project reveals a marketplace environment in
transition, with myriad quality metrics and a strong
desire on the part of purchasers and payers for more
efficiency and functional outcomes metrics. Payers intend
to purposefully experiment with value-based payment
methodologies over the next several years, developing an
array of approaches to encourage providers to accept
greater financial risk over time. New payment approaches
and performance measures are geared toward facilitating
provider-led efforts to streamline care delivery.
Although initial value-based payment arrangements
offer providers opportunities to share or retain savings
or earn incentives, the ultimate goal of these approaches
is for savings to accrue to healthcare purchasers, thereby
creating value for the customer. It is expected that these
payment models will evolve over time, and that, to be
successful, providers will need to demonstrate their ability
to deliver quality care at a lower price to the purchaser.
In simultaneously managing today’s dynamic environ-
ment and preparing for a future of risk-based payment,
providers are utilizing technical and change leadership
skills to transform care delivery while investing in capa-
bilities to drive performance improvement. Moving
forward, we recommend that provider organizations take
the following steps to position for success in this emerging
payment environment:
Recommendation No. 1: Do not delay in developing the four value-driving capabilities required to adapt in a new payment environment. Phase 1 of the Value Project
identified four key capabilities required for success in
the emerging payment environment (see the sidebar at
right). Research conducted to date in Phase 2 of the Value
Project further validates that organizations are preparing
for payment changes by developing these capabilities.
Particular steps that leading organizations are taking now
include the following:
•Developing change management capabilities to prepare
an agile workforce and organizational culture (people
and culture)
•Establishing strategic plans with incentives to align
organizations to the most important goals (people
and culture)
•Cultivating physician leadership (people and culture)
•Implementing clinical decision support systems/EHRs
(business intelligence)
•Refining costing capabilities to move from a directional to
a more precise view of costing data (business intelligence)
•Identifying variations and work on standardization
(performance improvement)
•Developing the ability to mitigate risk by understanding
population-specific drivers of utilization and cost under
risk-based contracts and identifying actionable leverage
points for influencing these drivers (contract and risk
management)
HFMA’s research indicates that, although value-based
payment is just emerging in most markets today, the majority
of organizations are taking proactive steps to ready for this
new future. Some are articulating organizational goals
aligned with value improvement, and determining mecha-
nisms to incentivize focus on the most critical initiatives.
Most are anticipating that improvements in care delivery
processes and structures will be the primary vehicle by
which they deliver greater value, and are investing in clinical
and coding capabilities. Many organizations are establishing
•People and culture: the ability to instill a culture of col-laboration, creativity, and accountability
•Business intelligence: the ability to collect, analyze, and connect accurate quality and financial data to sup-port organizational decision making
•Performance improvement: the ability to use data to reduce variability in clinical processes and improve the delivery, cost-effectiveness, and outcomes of care
•Contract and risk management: the ability to develop and manage effective care networks and predict and manage different forms of patient-related risk
the four VAlue-DriVing CAPABilitieS
24
or leveraging internal forums to identify and act upon
opportunities to improve clinical care. To be effective,
these types of forums typically require physician leadership,
alignment, and buy-in, as well as engagement by front-line
staff. Developing staff capabilities to be involved in perfor-
mance improvement is a priority in many organizations.
Most providers are assessing their costing and decision
support capabilities and determining how best to ensure
the breadth and depth of data they need to identify clinical
improvement opportunities, ensure physician engagement
in these improvement efforts, and measure results.
Organizations are first ensuring the consistency of their
costing data, and many are investing further to achieve the
precision and appropriate granularity in these data that
increasing price pressures and new payment methods might
require. Organizations also are determining what analytical
skills and resources are necessary to utilize the data to help
drive decisions.
An organization that has not yet begun to assess the
impacts of the shifting payment environment is at risk of
lagging the market. Beginning the process through scenario
analysis, financial planning, and board discussions are good
initial steps. Additionally, assessing the current state of
capabilities required, as described in the HFMA report Value
in Health Care: Current State and Future Directions, is important.
Leading organizations are not only assessing what
capabilities they need, but also determining how best to
balance and sequence them as they navigate the emerging
payment environment. Some organizations are placing
more emphasis on physician alignment and front-line
engagement and development, for example, while others
are more focused on technical capabilities such as decision-
support. Although business intelligence, contracting and
risk management, performance improvement, and empha-
sis on workforce are all important in the emerging payment
environment, leaders should assess how best to organize
these efforts based on the capabilities of their organizations
and their markets.
Recommendation No. 2: Embrace strategic agility for your organization. Become comfortable with ambiguity
and with learning from both successes and failures as
your organization experiments with change. Simplify
organizational structures and decision-making processes
to empower front-line staff to seek solutions. Balance
a culture of accountability with a culture of creativity
(i.e., while managers should be held accountable for
targets, they must also be encouraged to create/innovate).
In today’s dynamic market environment, it is important
for organizations to develop the ability to be strategically
agile—that is, to lay the foundation to change course success-
fully, and sometimes quickly, as strategies evolve. Leading
providers are developing strategic agility in different ways:
•Many providers are proactively readying for a variety of
payment methodologies, intending to experiment as a way
to gain knowledge about what it takes to be successful
under these new payment arrangements. Providers
purposefully embarking on a path of experimentation
with payment models are determining what level of detail
is required in their costing data and whether that level
of detail can be obtained through improved data mining,
better maintenance of costing data, or investments in
new costing systems.
•Many organizations are pursuing ways to foster greater
physician engagement in improvement efforts. Numerous
provider organizations are creating internal cross-functional
forums to identify initiatives, execute them and measure
results. To ensure physician participation, some providers
are paying physicians to participate in these forums,
and discussing what kinds of incentive structures best
align physicians to these efforts. Some organizations are
determining how best to involve contracted physicians in
improvement activities. For example, the Dean Value
Contract utilized by Dean Health specifies that contracted
providers must achieve performance on patient satisfaction,
total cost of care, clinical quality, and generic drug metrics.
•Provider organizations are creating opportunities and
environments in which front-line staff are empowered to
identify and act on initiatives to improve and streamline
care delivery. Key to fostering this engagement is leader-
ship’s acceptance that some performance improvement
initiatives will fail while others succeed; the emphasis is
on failing fast, extracting key lessons, and using that
knowledge in the next iteration of experiments. Value in
Health Care: Current State and Future Directions offers
examples of two health systems—Sharp HealthCare in
San Diego, Calif., and Bellin Health in Green Bay, Wis.—
that have developed processes for periodic evaluation
of programs to identify successes and failures so resources
can be redeployed to pursue more promising opportunities.
25
•Shifting care to lower-cost settings and other market
dynamics create financial vulnerabilities for hospitals.
The most successful organizations of the future are now
beginning to create flexibilities in their operating structure
(e.g., by concentrating on fixed as well as variable cost
reductions and by designing facilities in purposefully
modular fashions).
Organizations that are proactively experimenting with
different payment methods, aligning with physicians,
empowering staff, and discussing ways to create more
nimble infrastructure are beginning to develop more agile
cultures. As healthcare leaders know, it typically takes a
long time to change cultures. These are important first
steps to position healthcare organizations for success in a
highly dynamic environment.
Recommendation No. 3: Seek stakeholder alignment around a common set of value metrics that are meaningful to their intended end users. Given
widespread acknowledgment of CMS’s leading role in
developing value metrics, in the near term, provider
organizations should use contract negotiations with
commercial carriers to push for alignment of contract
value-based metrics with CMS value-based metrics.
Recognizing the limitations of current metrics, longer
term, all stakeholders should embrace the refinement
and adoption of value metrics consistent with the following
guidelines for the development and use of value metrics
suggested by the Value Project’s Phase 2 research:
•Work to replace process metrics with patient-centered
functional outcomes.
•Align value metrics with the “triple aim” of improving
care for individuals, improving the health of populations,
and reducing the per capita costs of health care.
•Focus on a limited set of metrics to drive performance.
•Use payment incentives and penalties selectively,
emphasizing performance on metrics that have been
proven or stakeholders agree are most likely to drive
the most desirable quality or cost outcomes.
•Report provider-specific performance to end users in
a way that is understandable and actionable.
External stakeholders, including employer organiza-
tions, CMS, and commercial carriers, acknowledge that
expecting providers to focus on too many performance
metrics at one time can diffuse focus and effectiveness.
Providers, too, emphasized this point.
Virtually all hospitals are now participating in CMS’s
value-based purchasing program. The performance standards
required for incentives in this program can serve as a useful
starting point for providers in their negotiations with health
plans on what types of performance metrics to include in
commercial contracts. Leveraging already-required metrics
in this manner will help providers focus more effectively on
fewer performance standards.
Longer term, value metrics will require refinement.
HFMA advocates that value metrics be refined consistent
with principles including working to replace process metrics
with more outcomes-oriented performance indicators,
aligning value metrics with the goals of IHI’s “Triple Aim,”
and focusing on a limited set of influential performance
drivers. The National Quality Strategy is an emerging
framework of quality metrics that may, over time, serve to
align stakeholder interests in performance improvement.
Recommendation No. 4: Explore strategic partnerships and opportunities with payers, employers and patients in your service area. For commercial carriers, action items
could include:
•Partnering to identify opportunities to improve care and
contain costs in employer-sponsored insurance, individual
insurance, and Medicare Advantage plans
•Developing chronic disease management programs
For self-funded employers, action items could include:
•Working to understand/define employer goals for
employee health (e.g., smoking cessation, weight reduction,
exercise) and productivity (e.g., days absent for illness of
employee or family member)
•Developing on-site workplace clinics
•Developing chronic disease management programs
For the benefit of patients, action items could include:
•Incorporating patient perspectives in operations and
planning (e.g., patient advisory councils)
•Compiling data on patient expectations and actual out-
comes for common procedures and using these to set
patient expectations and track performance
•Establishing partnerships with other community health
partners (e.g., physicians, social services agencies, etc.)
to support desired patient outcomes
26
Depending on its market environment and internal
capabilities and capacity, there may be an opportunity for a
provider to improve care in partnership with commercial
carriers, community health leaders, self-funded employer
purchasers, and patients. For example, a provider could
examine available clinical and financial data specific to
its patient population to identify areas of concern, such
as obesity, excessive use of the emergency department, or
overuse of services within a clinical department. Community
leaders or an influential area employer also could approach
a commercial carrier with a proposal to jointly focus on
improving care in a specific area; this could be an effective
way to prepare for value-based payment while forging new
strategic partnerships.
Many organizations contacted for this project are
proactively finding ways to identify and act on strategic
improvement opportunities of highest importance to
their patient populations. For example, Longmont United
Hospital of Longmont, Colo., is working with other local
community providers to meet the healthcare needs of the
area school district and other large employers. This
arrangement better positions Longmont United to identify
and act on opportunities to improve care in partnership
with important purchasers.
Some providers are working directly with patients to
obtain their input on and prioritize care delivery improve-
ments. For example, as noted in HFMA’s report Building
Value-Driving Capabilities: People and Culture, Spectrum
Health has established a patient advisory council to engage
patients directly in performance improvement.
Depending on an organization’s internal capabilities
and capacity as well as its external market environment,
an opportunity may exist for a provider to be proactive in
approaching local purchasers about outcomes measure-
ment. Employers are particularly interested in outcomes
as a measurement of value, and the market is lagging in
providing these data, particularly on a severity-adjusted
basis. A provider may have a unique opportunity to provide
leadership and influence in this area by identifying,
defining, and demonstrating performance on outcomes.
Further, pursuing outcomes measurement creates a unique
opportunity to involve patients in defining expectations
related to return to functioning.
Recommendation No. 5: Prepare to differentiate the effectiveness of care provided by your organization within a value-driven, competitive marketplace. Be explicit
about the value equation (quality in relation to total
payment for care) that your organization intends to offer
the market. Shift the organization’s focus from procedure-
based pricing to total payment for care. Ensure that the
benefits of your delivery system are seen and enjoyed by
purchasers (i.e., maintain focus on value through the
purchaser’s perspective).
Although the degree to which the insurance exchanges
and other market dynamics will drive purely price-sensitive
purchasing in health care is uncertain, research conducted
through HFMA’s Value Project confirms that the price of
health insurance and health care is of escalating concern to
purchasers. With the increasing availability of provider-
specific quality and efficiency data, purchasers will be armed
with the information necessary to determine provider
networks and drive decisions at the point of care. As price
sensitivity escalates, these decisions will likely be based
more on price over time.
Given these market dynamics, provider organizations
should be thoughtful about the value proposition they
intend to offer purchasers. In many organizations, the
optimal position will most likely involve the capability to
demonstrate lower total cost on the array of services provided.
Other providers may opt to maintain a higher price position
while carefully defining the factors (e.g., better clinical
outcomes or higher levels of patient satisfaction) that
accompany the higher price. If much better quality comes at
a slightly higher price, a purchaser can still enjoy value
provided that the higher price position is acceptable.
Providers that heavily cross-subsidize across payers
should bring a laser focus to this effort. Market dynamics
such as escalating price sensitivity across payers, employers’
increasing understanding of the impacts of cross subsidiza-
tion, and regulators’ authority to influence plans available
27
on insurance exchanges suggest that significant cross
subsidization will not remain a viable financial strategy
for long.
It is important that providers that heavily cross-
subsidize across payers objectively analyze and segment
each customer base to do the following:
•Understand what value equation is viable in each
market segment
•Determine which patient segments should remain as
part of the provider’s patient base in the future
•Determine aggressive plans to accomplish that end state
Recognizing that it will take time to transition to the
leaner cost structure that will likely be required to reduce
cross subsidization, providers should work with state
and federal regulators and representatives to explain the
challenges, implications, and multi-year plan to minimize
cross subsidization.
Providers have work to do internally and externally to
ready for this future. As noted, providers should be explicit
about the value equation (quality in relation to total pay-
ment for care) that they intend to offer purchaser segments,
and should focus internal efforts toward that goal. As noted,
decision support and analytical capabilities, an engaged
workforce, improved contracting capabilities, and perfor-
mance improvement skills are necessary to develop a more
streamlined and flexible operation.
Providers also should begin to engage in internal
discussions about the steps necessary to transition success-
fully from a “quality” reputation to one based on “value.”
Many providers already realize that higher cost to the
purchaser often indicates lower quality due to overtreat-
ment. Externally, provider organizations would be well
served to begin discussions in their communities about
how, in health care, there is little relationship between
high quality and high cost of care. m

28
reSeArCh SPonSorS
research for this report was sponsored by the 16 hospitals and health systems represented on HFMA’s Value Steering Group:
HFMA’s research was conducted with the assistance of McManis consulting.
Special thanks to terry Allison rappuhn for her assistance with the project.
PuBliCAtion SPonSor
hfmA’S VAlue ProjeCt: PhASe 2 Defining AnD DeliVering VAlue
june 2012 Copyright 2012
healthcare financial management Association3 Westbrook Corporate Center, Suite 600Westchester, il 60154-5732
All rights reserved.Correspondence: [email protected]
the Healthcare Financial Management Association (HFMA) provides the resources healthcare organizations need to achieve sound fiscal health in order to provide excellent patient care. With more than 35,000 members, HFMA is the nation’s leading membership organization of healthcare finance executives and leaders. We provide education, analysis, and guidance; we lead change and innovative thinking; and we create practical tools and solutions that help our members get results. Addressing capital access to improved patient care to technology advancement, HFMA is an indispensable resource on healthcare finance issues.
PuBliSheD By
Related Documents