Defining and Comparing Content Measures of Topological Relations FRANCISCO GODOY AND ANDREA RODRÍGUEZ Department of Information Engineering and Computer Science University of Concepción and Research Center for Web Computing University of Chile Edmundo Larenas 215, Concepción, Chile. {fgodoyf,andrea}@udec.cl Abstrac t This work defines and compares three content measures that characterize topological relations between rectangular regions in a two-dimensional space. These content measures use simplified views of spatial objects in order to create an efficient mechanism for capturing the topological content of spatial configurations. The content measures are compared based on the correlation between two similarity rankings: (1) a similarity ranking defined in terms of the distance of content-measure values and (2) a similarity ranking defined in terms of the error of the geometric adjustment between pairs of objects. The correlation between similarity rankings is used as indicator of how well these content measures characterize topological relations. Such content measures provide mechanisms for creating efficient methods to describe and access information on the basis of the topological content of spatial configurations. Keywords: topological relations, content measures, similarity function.

Welcome message from author
This document is posted to help you gain knowledge. Please leave a comment to let me know what you think about it! Share it to your friends and learn new things together.
Transcript
Defining and Comparing Content Measures of Topological Relations
FRANCISCO GODOY AND ANDREA RODRÍGUEZ
Department of Information Engineering and Computer Science
University of Concepción and
Research Center for Web Computing
University of Chile
Edmundo Larenas 215, Concepción, Chile.
{fgodoyf,andrea}@udec.cl
Abstract
This work defines and compares three content measures that characterize topological relations
between rectangular regions in a two-dimensional space. These content measures use simplified
views of spatial objects in order to create an efficient mechanism for capturing the topological
content of spatial configurations. The content measures are compared based on the correlation
between two similarity rankings: (1) a similarity ranking defined in terms of the distance of
content-measure values and (2) a similarity ranking defined in terms of the error of the geometric
adjustment between pairs of objects. The correlation between similarity rankings is used as
indicator of how well these content measures characterize topological relations. Such content
measures provide mechanisms for creating efficient methods to describe and access information
on the basis of the topological content of spatial configurations.
Keywords: topological relations, content measures, similarity function.
1 Introduction
The complexity and volume of spatial information available in current structured, semi-structured, and non-structured data repositories have made content-based retrieval achallenging and important area of investigation. The main idea of a content-based searchof spatial information is to find instances in a data repository whose content descriptionis most similar to the content of a user request. Fundamental to a solution to this typeof problem is, therefore, to define an appropriate content description that characterizesand allows us to compare spatial information.
This study aims to define a systematic way to characterize spatial information,in particular, topological relations in spatial configurations. Unlike previous studies oncontent-based retrieval in image databases [1, 9, 18, 19, 38, 39, 42], this work focuseson the characterization of configurations that are seen as a combination of objects thatstand in particular spatial relations to each other. In order to find desired configurations,systems must find object instances in spatial databases that satisfy the constraints definedby the spatial relations of a user request. This search of object instances is often done onthe basis of information that consists of objects stored in relational tables and organizedby thematic layers with spatial indexing methods. In these systems, queries are typicallyanswered as cascaded spatial joins [2, 26, 29-31].
This paper describes three content measures that distinguish topological relations.By defining content measures of spatial relations, this work contributes to the definitionof new mechanisms for spatial information organization and retrieval, so that queries withvariable and large number of objects, such as queries expressed by sketches [4, 16], can beefficiently solved. The proposed content measures distinguish topological relations with asimplified view of spatial objects and, therefore, they try to minimize the computationalcost of processing topological relations. Characterizing spatial relations between objectsis useful for comparing configurations, since configurations are composed of a variablenumber of objects (i.e., a variable number of relations), and configurations can be seenas an aggregation of individual relations.
The problem of comparing spatial relations is not new [8, 22, 27, 32]; however, tothe best of our knowledge, none of the previous studies have attempted to define a singlecontent measure that distinguishes topological relations, making this content measuresuitable for content-based indexing schemas that consider not only positional information,but also spatial relations [36]. Some of the previous studies combine multiple contentcomponents (e.g., angle, topology, and distance) [3, 28, 32], which may be highly sensitiveto the way these components are combined. This work uses a quantitative approach tocharacterize objects’ interrelations in terms of metric refinements of topology relations. Inthis sense, it follows closely the ideas derived from Egenhofer and Shariff’s work [37] that[Warning: Draw object ignored]
made metric refinements of topological relations; however, instead of defining measuresto refine each of the topological relations, it pursues the definition of a single contentmeasure that distinguishes topological relations.
The focus of the study are topological relations between regions [7, 10, 34, 35],since among different types of spatial relations, topological relations have been pointedout as the principal way in which people describe configurations [14]. Additionally, topo-logical relations are invariant under continuous transformations of translation, rotationand scaling, which are desirable properties of content measures that describe configu-rations expressed by visual examples [4]. This work uses the simplified and commonrepresentation of objects (i.e., MBRs) in current spatial indexing schemas of GeographicInformation Systems (GISs). Although this simplification of objects misses some details,it is broadly used and computational desirable, and it usually sufficient for finding objectsin current GISs.
The proposed content measures are evaluated with an independent framework forcomparing spatial configurations. Thus, this work makes a distinction between contentmeasures and similarity functions. While content measures characterize and can be usedfor comparing spatial relations, a similarity function compares spatial relations withoutbeing able to say anything about the type of relations between objects. We will saythat the content measures are good candidates for capturing and comparing topologicalinformation if the difference between values of content measures has a strong correla-tion with the independent similarity function. The similarity function used in this worktakes ideas from image processing and uses principles of geometric adjustment betweencorresponding objects in spatial configurations [23].
The organization of this paper is as follows. Section 2 reviews related studiesthat address the description and comparison of spatial relations. Section 3 describes thecharacterization of MBRs as one-dimensional values, and Section 4 presents the threecontent measures that are proposed in this paper. Section 5 introduces the similarityfunction that is used for comparing content measures. Subsequently, Section 6 presentsexperimental results when comparing content measures. Conclusions and future work aregiven in Section 7.
2 Related Work
Many studies in the domain of image databases have compared objects’ arrangementsbased on variations of 2D-strings. 2D-strings represent configurations with a sequentialstructure for each encoded dimension [8, 24, 25]. Query processing using this structure iscarried out as a string matching. Such string matching is possible only when users specify[Warning: Draw object ignored]
queries by the schema of relations according to which 2D-strings are built, and images arecomposed of a predefined set of objects. A different string-based representation treatstopology, orientation, and distance between objects’ MBR as interval relations in twodimensions [27]. This type of representation defines a similarity function as inverselyproportional to the number of changes that are needed to make two strings equivalent.In a similar way, a 3x3 matrix was used to determine the orientation relation as theproportional area in the quadrants defined by the orthogonal projection of a referenceobject’s MBR [22]. Similarity between orientation relations is then defined by the inversecost of transforming the matrix representation of a relation into the other matrix repre-sentation. In general, methods based on 2D-strings and their variations handle variationsin scale and translation, but they are sensitive to rotation [18].
Using an object-oriented perspective, where configurations are sets of objects andsets of these objects’ interrelations, some studies represent configurations and queries us-ing Attribute Relation Graphs (ARGs) [3, 28, 32]. In these graphs, spatial relations arerepresented quantitatively by the distance and angle between centroids of objects, andqualitatively by the symbolic representation of spatial relations, such as the topologicalrelations defined by Egenhofer and Franzosa [11, 13] or by Randell et al. [35]. For rank-ing configurations, a similarity function is defined, which depends on the representationtype of spatial relations. For quantitative representations of spatial relations, such asthe angle between MBRs, similarity is defined as the inverse of the difference betweenrepresentations [3, 32]. Another approach considers the distance within a conceptualneighborhood [28]. For example, consider Figure 1 of conceptual neighbors of topologicalrelations between regions derived from the concept of gradual change [12, 15]. Conceptualneighbors are relations connected by a line in this Figure, and they are considered to bemore similar than relations that are not directly connected in the graph.
Related to the concept of gradual change, Bruns and Egenhofer [5] comparedspatial scenes. Given two scenes (i.e., spatial configurations) of equal number of objects,they suggested that similarity could be determined by the minimum set of gradual changesthat are needed to transform one scene into the other one. Although their work presentsa sensible definition of similarity, it does not check whether or not this minimum setof changes is unique. Likewise, it does not discuss degrees of relevance that may affectdifferent types of changes. Even if relevance weights were associated with these changes,it may be difficult to obtain a systematic strategy to determine these weights.
Focusing on topological relations, one study explores metric refinements of topo-logical relations as they match with terms used in natural language, such as going throughand goes up to [17]. This study defines ten quantitative measures that characterize topo-logical relations based on metric properties, such as length, area, and distance. The
[Warning: Draw object ignored]
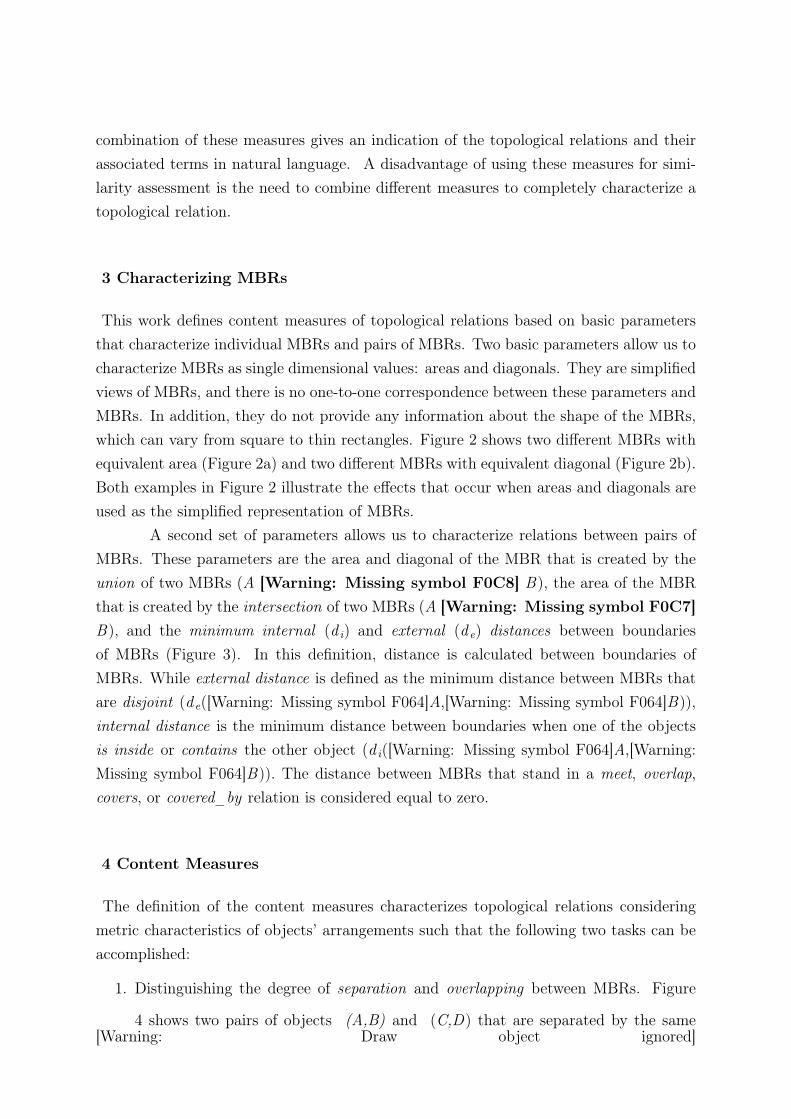
combination of these measures gives an indication of the topological relations and theirassociated terms in natural language. A disadvantage of using these measures for simi-larity assessment is the need to combine different measures to completely characterize atopological relation.
3 Characterizing MBRs
This work defines content measures of topological relations based on basic parametersthat characterize individual MBRs and pairs of MBRs. Two basic parameters allow us tocharacterize MBRs as single dimensional values: areas and diagonals. They are simplifiedviews of MBRs, and there is no one-to-one correspondence between these parameters andMBRs. In addition, they do not provide any information about the shape of the MBRs,which can vary from square to thin rectangles. Figure 2 shows two different MBRs withequivalent area (Figure 2a) and two different MBRs with equivalent diagonal (Figure 2b).Both examples in Figure 2 illustrate the effects that occur when areas and diagonals areused as the simplified representation of MBRs.
A second set of parameters allows us to characterize relations between pairs ofMBRs. These parameters are the area and diagonal of the MBR that is created by theunion of two MBRs (A [Warning: Missing symbol F0C8] B), the area of the MBRthat is created by the intersection of two MBRs (A [Warning: Missing symbol F0C7]B), and the minimum internal (d i) and external (d e) distances between boundariesof MBRs (Figure 3). In this definition, distance is calculated between boundaries ofMBRs. While external distance is defined as the minimum distance between MBRs thatare disjoint (d e([Warning: Missing symbol F064]A,[Warning: Missing symbol F064]B)),internal distance is the minimum distance between boundaries when one of the objectsis inside or contains the other object (d i([Warning: Missing symbol F064]A,[Warning:Missing symbol F064]B)). The distance between MBRs that stand in a meet, overlap,covers, or covered_by relation is considered equal to zero.
4 Content Measures
The definition of the content measures characterizes topological relations consideringmetric characteristics of objects’ arrangements such that the following two tasks can beaccomplished:
1. Distinguishing the degree of separation and overlapping between MBRs. Figure
4 shows two pairs of objects (A,B) and (C,D) that are separated by the same[Warning: Draw object ignored]
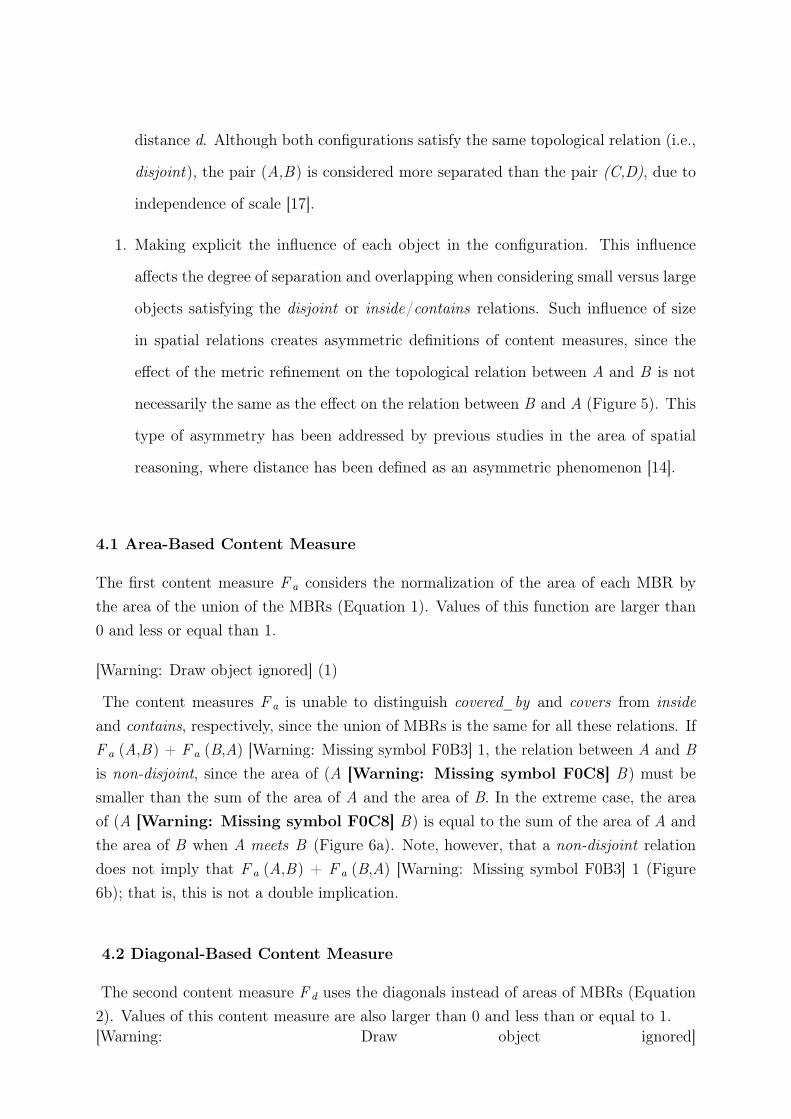
distance d. Although both configurations satisfy the same topological relation (i.e.,
disjoint), the pair (A,B) is considered more separated than the pair (C,D), due to
independence of scale [17].
1. Making explicit the influence of each object in the configuration. This influence
affects the degree of separation and overlapping when considering small versus large
objects satisfying the disjoint or inside/contains relations. Such influence of size
in spatial relations creates asymmetric definitions of content measures, since the
effect of the metric refinement on the topological relation between A and B is not
necessarily the same as the effect on the relation between B and A (Figure 5). This
type of asymmetry has been addressed by previous studies in the area of spatial
reasoning, where distance has been defined as an asymmetric phenomenon [14].
4.1 Area-Based Content Measure
The first content measure F a considers the normalization of the area of each MBR bythe area of the union of the MBRs (Equation 1). Values of this function are larger than0 and less or equal than 1.
[Warning: Draw object ignored] (1)
The content measures F a is unable to distinguish covered_by and covers from insideand contains, respectively, since the union of MBRs is the same for all these relations. IfF a (A,B) + F a (B,A) [Warning: Missing symbol F0B3] 1, the relation between A and Bis non-disjoint, since the area of (A [Warning: Missing symbol F0C8] B) must besmaller than the sum of the area of A and the area of B. In the extreme case, the areaof (A [Warning: Missing symbol F0C8] B) is equal to the sum of the area of A andthe area of B when A meets B (Figure 6a). Note, however, that a non-disjoint relationdoes not imply that F a (A,B) + F a (B,A) [Warning: Missing symbol F0B3] 1 (Figure6b); that is, this is not a double implication.
4.2 Diagonal-Based Content Measure
The second content measure F d uses the diagonals instead of areas of MBRs (Equation2). Values of this content measure are also larger than 0 and less than or equal to 1.[Warning: Draw object ignored]
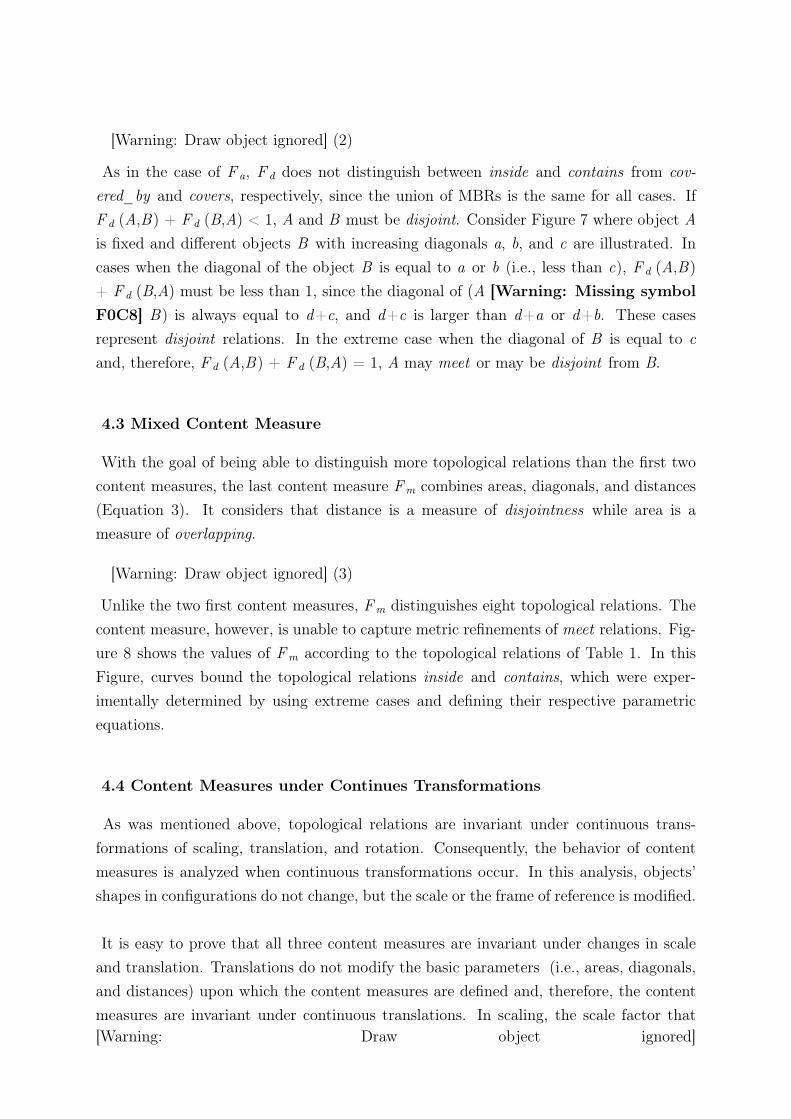
[Warning: Draw object ignored] (2)
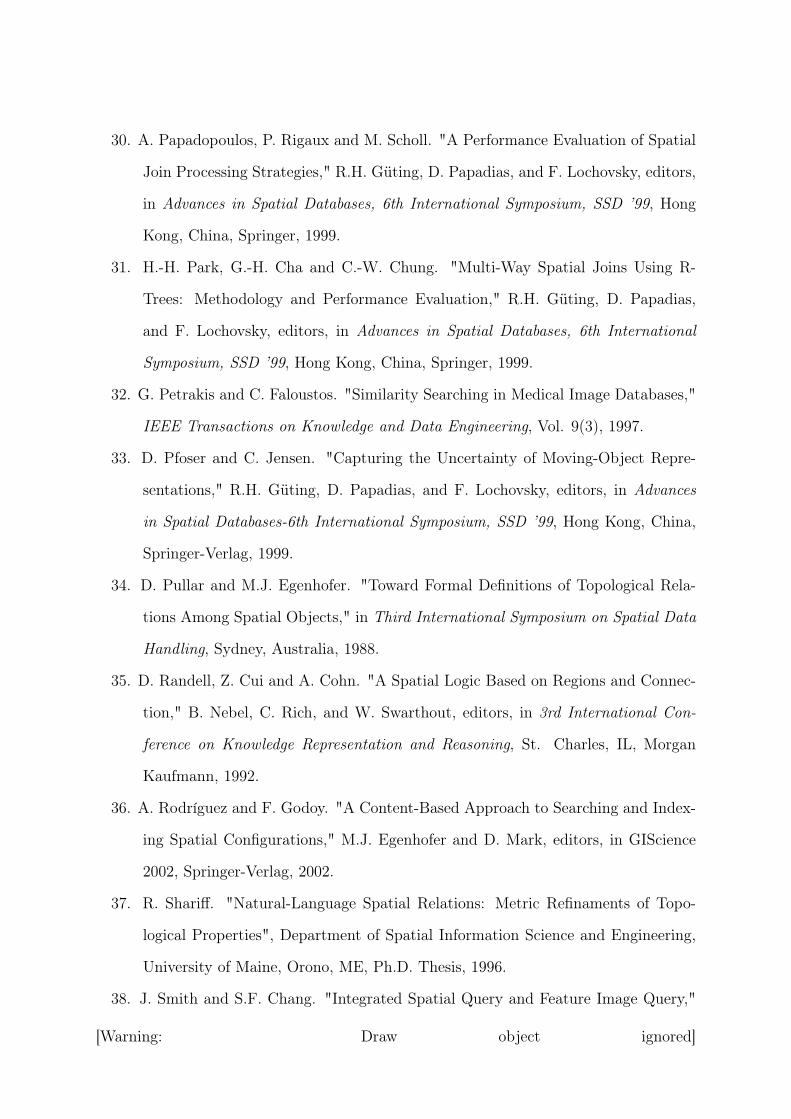
As in the case of F a, F d does not distinguish between inside and contains from cov-ered_by and covers, respectively, since the union of MBRs is the same for all cases. IfF d (A,B) + F d (B,A) < 1, A and B must be disjoint. Consider Figure 7 where object Ais fixed and different objects B with increasing diagonals a, b, and c are illustrated. Incases when the diagonal of the object B is equal to a or b (i.e., less than c), F d (A,B)+ F d (B,A) must be less than 1, since the diagonal of (A [Warning: Missing symbolF0C8] B) is always equal to d+c, and d+c is larger than d+a or d+b. These casesrepresent disjoint relations. In the extreme case when the diagonal of B is equal to cand, therefore, F d (A,B) + F d (B,A) = 1, A may meet or may be disjoint from B.
4.3 Mixed Content Measure
With the goal of being able to distinguish more topological relations than the first twocontent measures, the last content measure Fm combines areas, diagonals, and distances(Equation 3). It considers that distance is a measure of disjointness while area is ameasure of overlapping.
[Warning: Draw object ignored] (3)
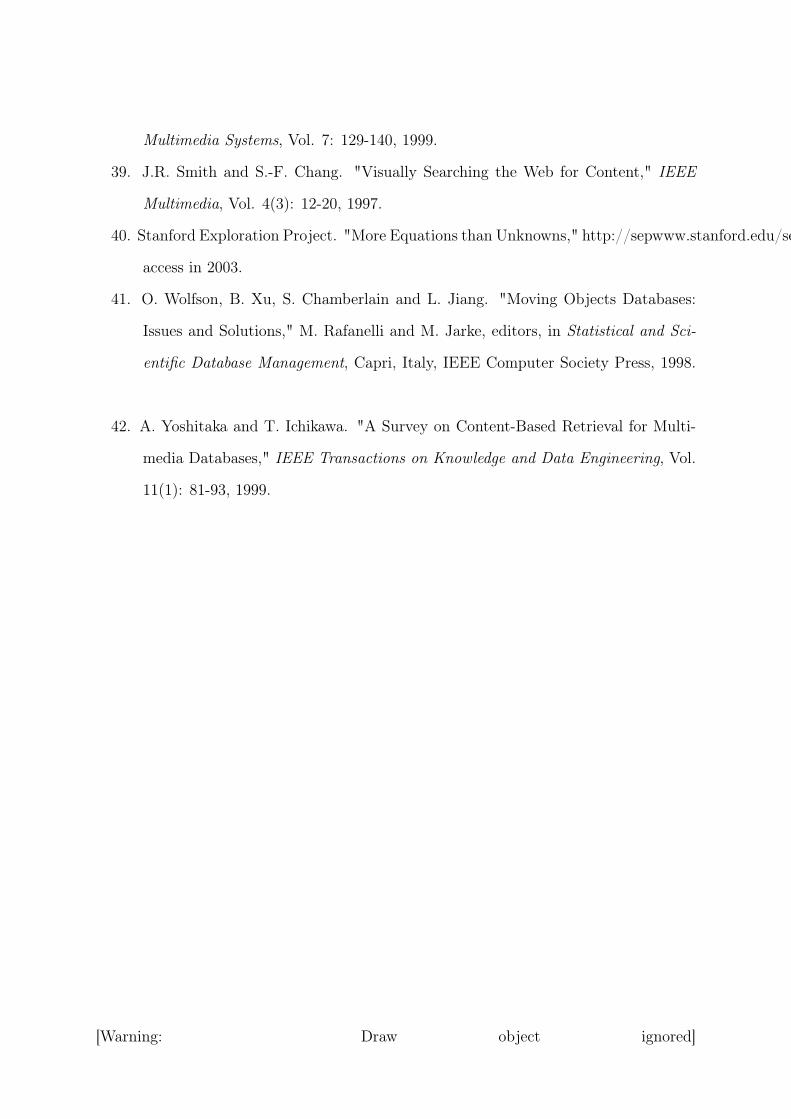
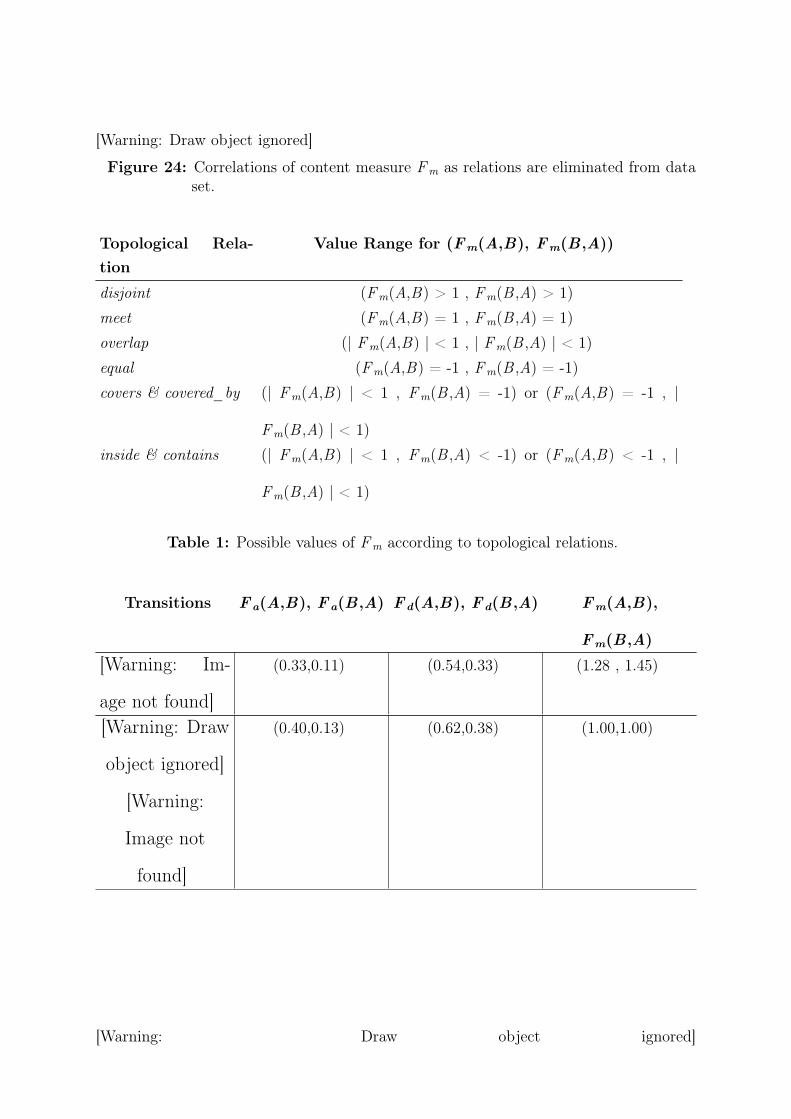
Unlike the two first content measures, Fm distinguishes eight topological relations. Thecontent measure, however, is unable to capture metric refinements of meet relations. Fig-ure 8 shows the values of Fm according to the topological relations of Table 1. In thisFigure, curves bound the topological relations inside and contains, which were exper-imentally determined by using extreme cases and defining their respective parametricequations.
4.4 Content Measures under Continues Transformations
As was mentioned above, topological relations are invariant under continuous trans-formations of scaling, translation, and rotation. Consequently, the behavior of contentmeasures is analyzed when continuous transformations occur. In this analysis, objects’shapes in configurations do not change, but the scale or the frame of reference is modified.
It is easy to prove that all three content measures are invariant under changes in scaleand translation. Translations do not modify the basic parameters (i.e., areas, diagonals,and distances) upon which the content measures are defined and, therefore, the contentmeasures are invariant under continuous translations. In scaling, the scale factor that[Warning: Draw object ignored]
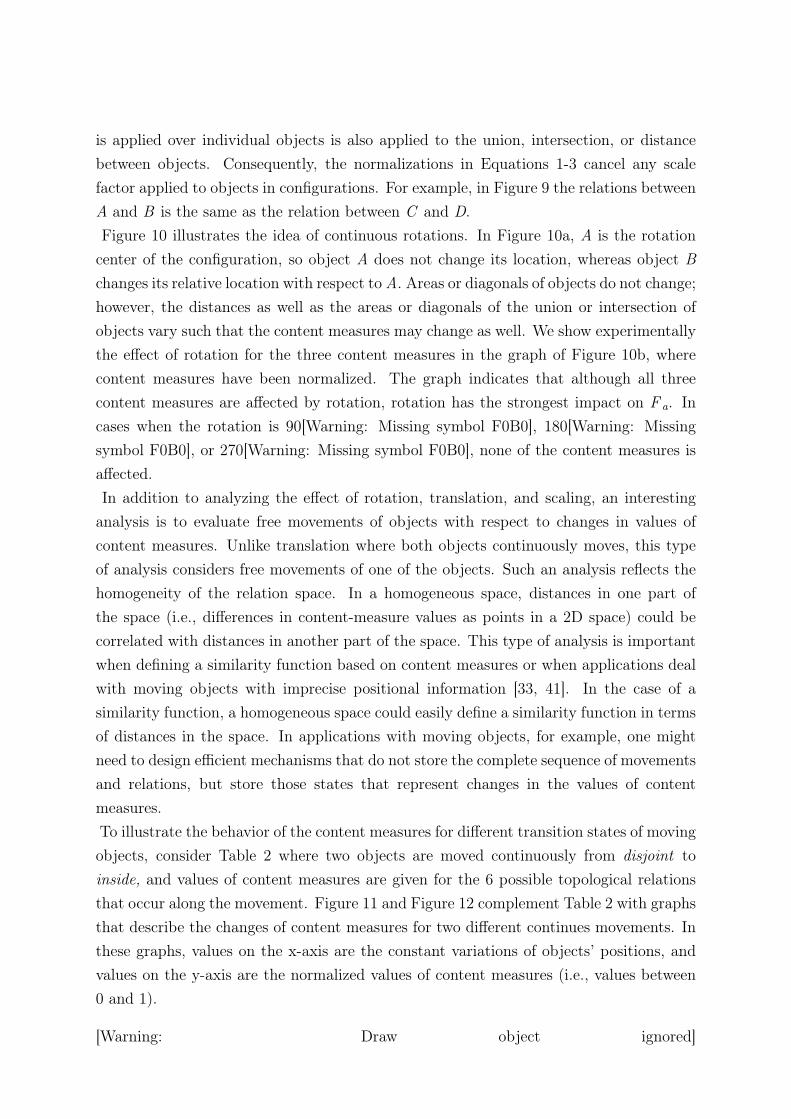
is applied over individual objects is also applied to the union, intersection, or distancebetween objects. Consequently, the normalizations in Equations 1-3 cancel any scalefactor applied to objects in configurations. For example, in Figure 9 the relations betweenA and B is the same as the relation between C and D.Figure 10 illustrates the idea of continuous rotations. In Figure 10a, A is the rotation
center of the configuration, so object A does not change its location, whereas object Bchanges its relative location with respect to A. Areas or diagonals of objects do not change;however, the distances as well as the areas or diagonals of the union or intersection ofobjects vary such that the content measures may change as well. We show experimentallythe effect of rotation for the three content measures in the graph of Figure 10b, wherecontent measures have been normalized. The graph indicates that although all threecontent measures are affected by rotation, rotation has the strongest impact on F a. Incases when the rotation is 90[Warning: Missing symbol F0B0], 180[Warning: Missingsymbol F0B0], or 270[Warning: Missing symbol F0B0], none of the content measures isaffected.In addition to analyzing the effect of rotation, translation, and scaling, an interesting
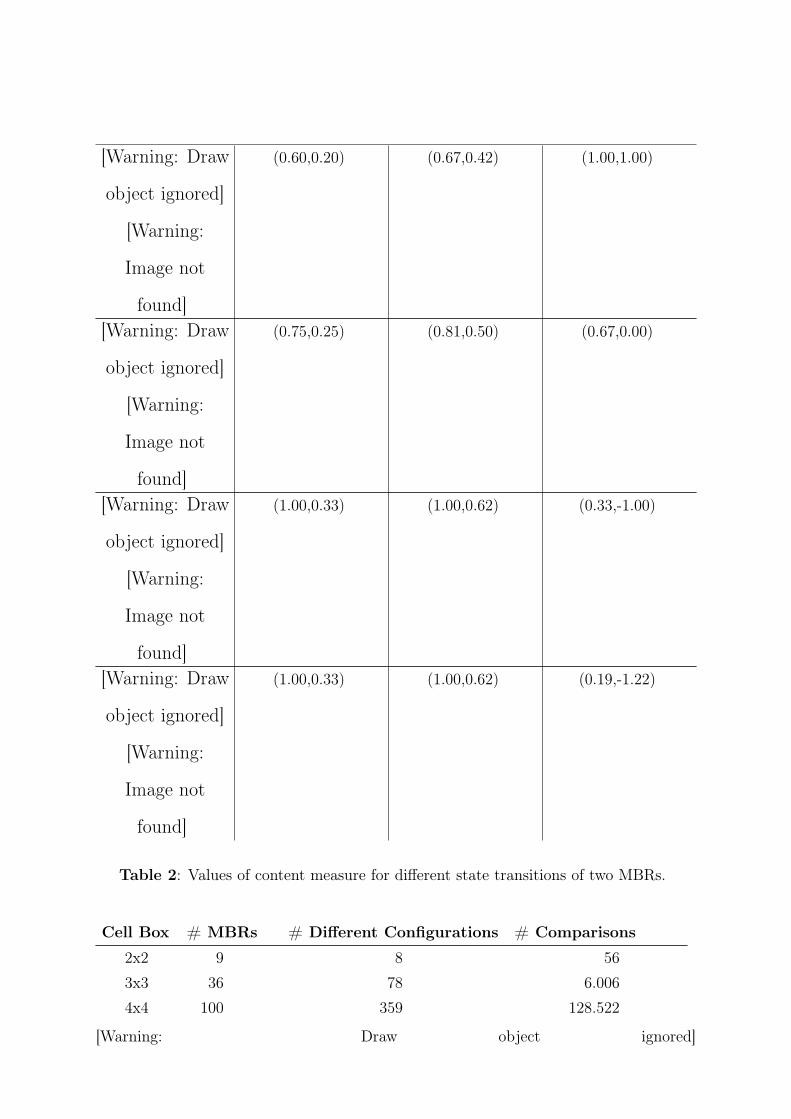
analysis is to evaluate free movements of objects with respect to changes in values ofcontent measures. Unlike translation where both objects continuously moves, this typeof analysis considers free movements of one of the objects. Such an analysis reflects thehomogeneity of the relation space. In a homogeneous space, distances in one part ofthe space (i.e., differences in content-measure values as points in a 2D space) could becorrelated with distances in another part of the space. This type of analysis is importantwhen defining a similarity function based on content measures or when applications dealwith moving objects with imprecise positional information [33, 41]. In the case of asimilarity function, a homogeneous space could easily define a similarity function in termsof distances in the space. In applications with moving objects, for example, one mightneed to design efficient mechanisms that do not store the complete sequence of movementsand relations, but store those states that represent changes in the values of contentmeasures.To illustrate the behavior of the content measures for different transition states of movingobjects, consider Table 2 where two objects are moved continuously from disjoint toinside, and values of content measures are given for the 6 possible topological relationsthat occur along the movement. Figure 11 and Figure 12 complement Table 2 with graphsthat describe the changes of content measures for two different continues movements. Inthese graphs, values on the x-axis are the constant variations of objects’ positions, andvalues on the y-axis are the normalized values of content measures (i.e., values between0 and 1).
[Warning: Draw object ignored]
The first type of movement (Figure 11a) consists in passing an object B through anotherobject A, such that the relations between A and B in sequential order are disjoint, meet,covers, contains, covers, meet, and disjoint. In Figure 11b variations of content measuresF a and F d follow quadratic curves with two break points: when the relation changesfrom overlap to covered_by and, conversely, when it changes from covered_by to overlap.While the object is covered_by or inside the other object, both content measures areconstant and equal to 1. Both quadratic curves are continuous from disjoint to overlapor from overlap to disjoint, being the curve that represents changes of F d less quadraticthan curve of F a. Changes of content measure Fm, in contrast, are lineal with 6 breakpoints: the transition from disjoint to meet, the transition from meet to covered_by, thetransition from covererd_by to inside, and their corresponding converse transitions.A second movement is presented in Figure 12. In this movement, object B approaches andpasses object A, all while maintaining a disjoint relation with A. Figure 12b shows thatcontent measures do not always change continuously when disjoint objects continuouslychange their locations. The content measure F a has different break points, whereascontent measures F d and Fm change continuously, with changes of Fm being linear withrespect to the distance between objects.
5 A Framework for Comparing Content Measures
An intuitive way to define similarity between spatial configurations is as the inverse ofthe difference between configurations. Distance is a typical measure of difference, whosemetric property of triangle inequality is useful for defining data organization and accessmethods [6, 21]. In image processing, distance can be used for evaluating the quality ofadjustment between images. Two images that are thought to represent the same spaceare considered completely adjusted if the distances between control points in an imageand control points in the other image are zero. Since images may suffer deformations,transformations of rotation, scaling, and translation are applied to the control points suchthat these points can adjust [23].This work follows the strategy of image adjustment for defining a similarity function
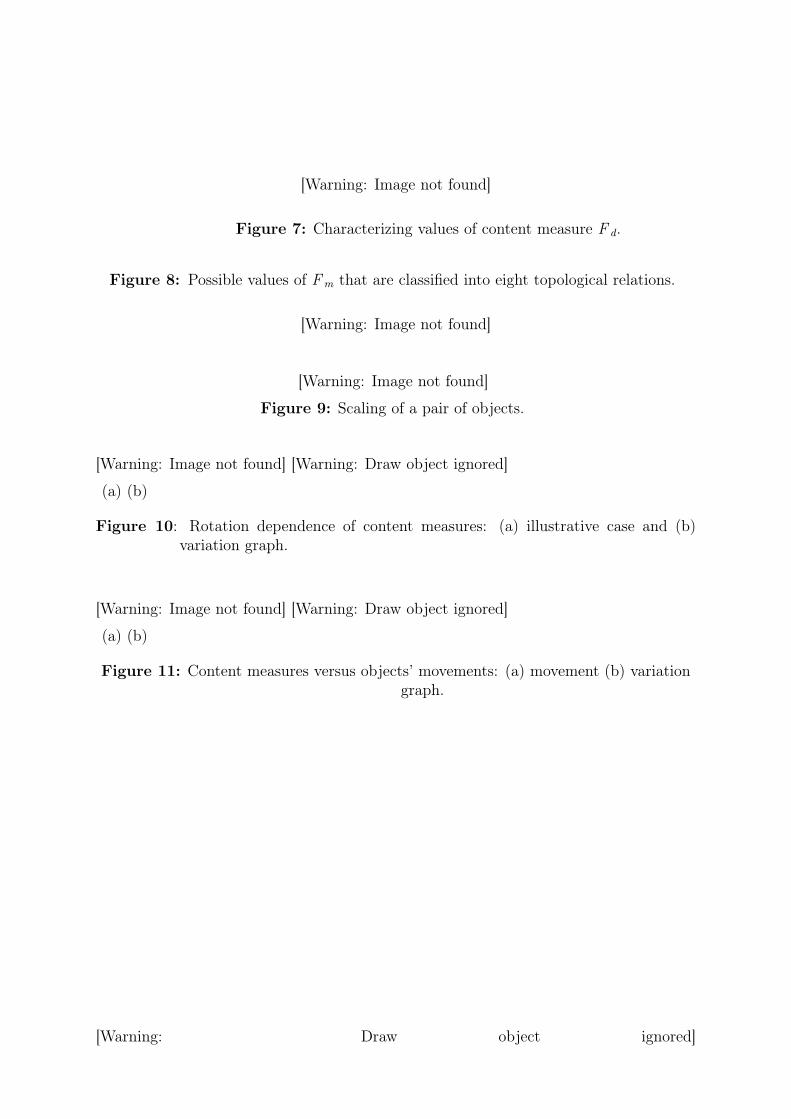
between spatial configurations. Unlike image adjustment, however, this work deals withconfigurations that are composed of spatial objects, that is, points, lines, and regions.Consequentially, this work applies transformations of rotation, translation, and scalingwhile preserving the shapes of objects and their topological interrelations. Analogous toimage adjustments, control points are used to adjust configurations. These control pointsare extracted from the geometric representation of objects’ MBRs. For example, in a firstinstance, the extreme four vertices of MBRs are the control points in a configuration.[Warning: Draw object ignored]
Figure 13 shows the graphic schema of a pair of objects in a reference system (x, y) thatis transformed into a reference system (X,Y ), and Equation 4 is the general expressionto make that this transformation consider rotation, translation, and scaling of objectswithout producing deformations.
[Warning: Draw object ignored] (4)
Equation 5 expresses Equation 4 for the eight control points (four vertices for each MBR)in a configuration like the one illustrated in Figure 13a. This Equation 5 rewrites Equation4 to handle 4 unknowns (i.e., a, b, c, d) such as a system that can be solved by theleast squares approximation of the form [A][Warning: Missing symbol F0B4][B ][Warning:Missing symbol F0BB][C ] (Equation 6) [40].
[Warning: Draw object ignored] (5)
[Warning: Draw object ignored] (6)
In this approach to adjusting configurations, points associated with an object’s verticesare made correspond to vertices of a target object. Since the right correspondence isunknown, different combinations of vertices (i.e., points) were analyzed, and the com-bination with the minimum error (i.e., distance) after the adjustment was consideredcorrect. For example, eight ways to assign vertices are possible in a configuration with 8points: four arising from a rotation of [Warning: Missing symbol F070]/2 radians (Figure14a), and four from a rotation of [Warning: Missing symbol F070]/2 radians in a mirroreffect (Figure 14b).The adjustment error is determined as a function of the position difference of correspond-ing points. This error is normalized by the sum of the diagonals of the unions of originaland target MBRs, respectively (Figure 15, Equation 7). This normalization allows us tocompare configurations of pairs of objects independently of scale.
(7)
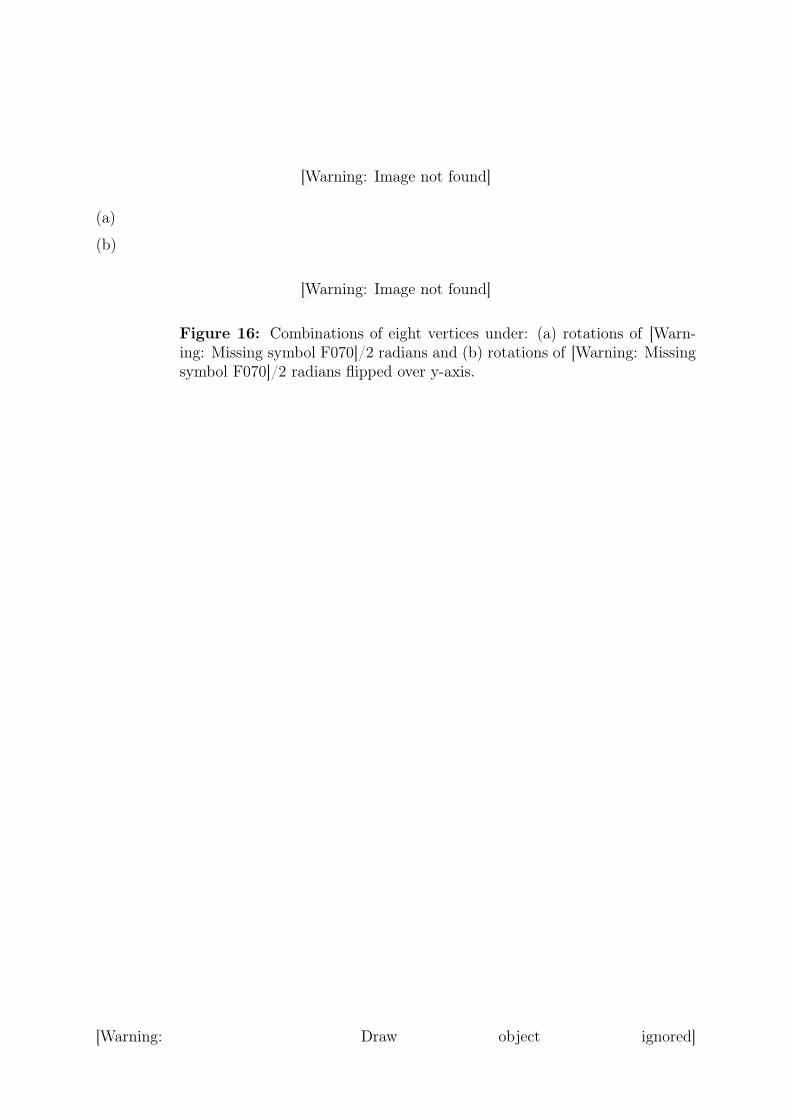
This approach to comparing configurations is sensitive to the way objects arerepresented. Therefore, MBRs’ representation with eight points was also analyzed andexperimentally compared in the next Section. A difference between using eight instead offour points per MBR is that with eight points, sixteen different correspondences of pointsneed to be checked before finding the best adjustment. These sixteen different possibil-ities arise from eight rotations of [Warning: Missing symbol F070]/4 radians and eightrotations of [Warning: Missing symbol F070]/4 radians in a mirror effect (Figure 16). Us-
[Warning: Draw object ignored]
ing eight points for MBRs’ representation overcomes problems that are presented in therepresentation with four points and rotations of [Warning: Missing symbol F070]/2 radi-ans. For example, Figure 17 illustrates the difference of an adjustment with four-pointsor eight-points representation and [Warning: Missing symbol F070]/4 radian rotation.
6 Comparing Content Measures
The analysis consists in applying the three content measures to a set of configurationsthat are composed of two MBRs (i.e., configurations with one topological relation). Then,these configurations are combined to create all possible pairs of different configurations.For such pairs of configurations, the geometric adjustment between configurations andthe distance between configurations’ content measures were determined. Finally, thecorrelation between the adjustment error and the distances of the content-measure valuesare used for comparing content measures (Figure 18).
6.1 Data Set
The experiments were carried out with a data set created with all possible MBRs thatfix in boxes of 2x2, 3x3, 4x4, 5x5, and 6x6 cells. For example, Figure 19 shows the nineMBRs derived from a 2x2 box.
For each set of MBRs, configurations composed of two different MBRs werecreated. From this set of initial configurations, the experiments considered a subset ofconfigurations, where none of these configurations are equivalent under transformationsof scaling, rotation, and translation. For example, from the nine MBRs of the 2x2 box, itis possible to create a set of 36 configurations, which is then reduced to just eight differentconfigurations (Figure 20).
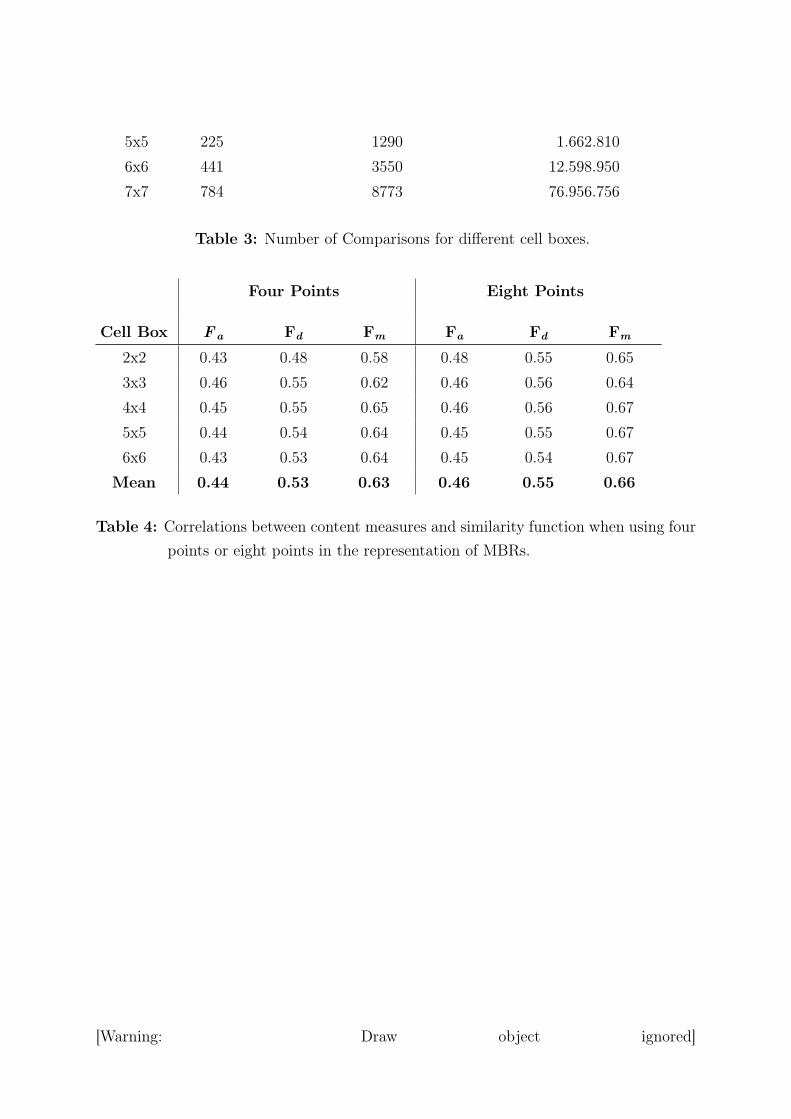
Using the final set of configurations, comparisons between different configurationswere performed. The number of comparisons depends on the number of configurationsin each set (Table 3). This table includes a cell box of 7x7, which case was not used inthe experiments for its computational cost.
6.2 ComparisonThe correlations between the distance of content-measure values and the error of the
geometric adjustment are presented in Table 4, where the geometric adjustment wasdetermined by using two representations of MBRs: (1) four points per MBR and (2)eight points per MBR. The results indicate that the correlation when using eight points
[Warning: Draw object ignored]
per MBR was better than the correlation when using four points. This tallies with the factthat a more accurate representation of objects provides more information for geometricadjustment. In all cases, the content measures Fm gives better correlations than measuresF a and F d due to its ability to distinguish more topological relations.
An analysis that tries to explain the variations of correlation among different setsof configurations considers the distribution of topological relations in the sets (Figure 21).
As the size of the cell box increases, the number of configurations as well asthe number relations disjoint, overlap, and inside&contains also increases. This typeof distribution is in agreement with situations in real geographic information systems,where the most frequent relation is disjoint [20]. In order to understand the effect ofeach relation in the three content measures, the correlation between content-measurevalues and geometric adjustments was re-calculated by eliminating topological relationsone-by-one. Given that the set of configurations in a cell box of 2x2 is small and doesnot include all types of topological relations, configurations derived from a cell box of 2x2were ignored in this analysis. Results of correlations for content measures F a, F d, andFm are shown in Figure 22, 23, and 24, respectively.
Figure 22 shows that the disjoint relation has a positive effect on the correlationbetween the content measure F a and the geometric adjustment. The relation overlap, incontrast, negatively affects the content measure, since in all cases, the correlation aftereliminating the overlap relation was larger than the correlation with this relation.
As in the case of the content measure F a, the disjoint relation positively affectsthe content measure F d. The other non-disjoint relations have a similar behavior, whichindicates an even capacity of this content measure to characterize non-disjoint relations(Figure 23).
Finally, disjoint relations also have a positive effect on the content measure Fm
(Figure 24). The highest correlation was found when eliminating relation meet, whichindicates the negative effect of these relations. As indicated in Section 3, Fm does not dis-tinguish among metric differences of the meet relations, so meet relations have a negativeeffect on this content measure.
7 Conclusions and Future Work
This paper describes the definition and comparison of three content measures for topolog-ical relations: (1) F a based on the areas of the union of MBRs and the area of individualMBRs, (2) F d based on the diagonal of the union of MBRs and the diagonal of individ-ual MBRs, and (3) Fm based on the area of the intersection of MBRs, area of individual[Warning: Draw object ignored]
MBRs, diagonal of individual MBRs, and distances between MBRs. These measures werecompared by using their correlations with the errors of the geometric adjustment betweenconfigurations. Experimental results indicate that the relation best characterized by thecontent measures is the disjoint relation. The correlation between content measures andsimilarity function shows that Fm better distinguishes topological relations, followed byF d and F a.
The possibility to compare content measures and analyze the content measures’behavior with respect to different topological relations has allowed us not only to evaluatethese defined content measures, but also to define a strategy for comparing new contentmeasures.
Left for future work is the study of how to combine content measures of topologicalrelations for comparing complex spatial configurations with more than two objects. Anissue in defining such combination is the degree of homogeneity of the relation space. Insuch a space, small differences may not be equivalent depending on the location in thespace, such that a traditional combination of distance values may not be adequate fordefining a similarity value. Another natural extension to this work is the use of volumefor defining content measures in a 3D space.
Acknowledgments
This work has been funded by Nucleus Millenium Center for Web Research, Grant
P01-029-F, Mideplan, Chile.
[Warning: Draw object ignored]
References
1. G. Amato, G. Mainetto and P. Savino. "An Approach to a Content-Based Retrieval
of Multimedia Data," Multimedia Tools and Applications, Vol. 7(1/2): 5-32, 1998.
2. L. Becker, A. Giesen, K. Hinrichs and J. Vahrenhold. "Algorithms for Performing
Polygonal Map Overlay and Spatial Join on Massive Data Sets," R.H. Güting,
D. Papadias, and F. Lochovsky, editors, in Advances in Spatial Databases, 6th
International Symposium, SSD ’99, Hong Kong, China, Springer, 1999.
3. S. Berretti, A. Del Bimbo and E. Vicario. "The Computational Aspect of Retrieval
by Spatial Arrangement," in International Conference on Pattern Recognition,
Barcelona, España, 2000.
4. A. Blaser. "Sketching Spatial Queries", Department of Spatial Information Science
and Engineering, University of Maine, Orono, ME, Ph.D. Thesis, 2000.
5. T. Bruns and M.J. Egenhofer. "Similarity of Spatial Scenes," M. Kraak and M.
Molenaar, editors, in Seventh International Symposium on Spatial Data Handling
(SDH ’96), Delft, The Netherlands, 1996.
6. E. Chávez, G. Navarro, R. Baeza-Yates and J.L. Marroquín. "Proximity Searching
in Metric Spaces," ACM Computing Surveys, Vol. 33(3): 273-321, 2001.
7. E. Clementini, J. Sharma and M.J. Egenhofer. "Modeling Topological Spatial
Relations: Strategies for Query Processing," Computers and Graphics, Vol. 18(6):
815-822, 1994.
8. G. Costagliola, G. Tortora and T. Arndt. "A Unifying Approach to Iconic Indexing
for 2-D and 3-D Scenes," IEEE Transactions on Knowledge and Data Engineering,
Vol. 4(3): 205-222, 1992.
9. C. Diamantini and M. Panti. "A Conceptual Indexing Method for Content-Based
Retrieval," in 10th International Workshop on Database & Expert Systems Appli-
cations, Firenze, Italy, IEEE Press, 1999.
10. M.J. Egenhofer. "Reasoning about Binary Topological Relations," O. Günter and[Warning: Draw object ignored]
H.-J. Schek, editors, in Second Symposium on Large Spatial Databases, Zurich,
Switzerland, Springer-Verlag, 1991.
11. M.J. Egenhofer and R. Franzosa. "Point-set topological spatial relations," Inter-
national Journal of Geographical Information Systems, Vol. 5(2): 161-174, 1991.
12. M.J. Egenhofer and K. Al-Taha. "Reasoning About Gradual Changes of Topolog-
ical Relationships," A. Frank, I. Campari, and U. Formentini, editors, in Theo-
ries and Methods of Spatio-Temporal Reasoning in Geographic Space, Pisa, Italy,
Springer-Verlag, 1992.
13. M.J. Egenhofer, E. Clementini and P. Di Felice. "Topological Relations Between
Regions with Holes," International Journal of Geographical Information Systems,
Vol. 8(2): 129-142, 1994.
14. M.J. Egenhofer and D. Mark. "Naive Geography," A. Frank and W. Kuhn, editors,
in COSIT ’95 , Semmering, Austria, Springer-Verlag, 1995.
15. M.J. Egenhofer and D. Mark. "Modeling Conceptual Neighborhoods of Topolog-
ical Line-Region Relations," International Journal of Geographical Information
Science, Vol. 9(5): 555-565, 1995.
16. M.J. Egenhofer. "Query Processing in Spatial-Query-By-Sketch," Journal of Visual
Languages and Computing, Vol. 8(4): 403-424, 1997.
17. M.J. Egenhofer and R. Shariff. "Metric Details for Natural-Language Spatial
Relations," ACM Transactions on Information Systems, Vol. 16(4): 295-321, 1998.
18. E. El-Kwae and M. Kabuka. "A Robust Framework for Content-Based retrieval
by Spatial Similarity in Image Databases," ACM Transactions on Information
Systems, Vol. 17(2): 174-198, 1999.
19. M. Flickner, H. Sawhney, W. Niblack, J. Ashley, Q. Huang, B. Dom, M. Gorkani,
J. Hafner, D. Lee, D. Petrovik, D. Steele and P. Yanker. "Query by Image and
Video Content: The QBIC System," IEEE Computer, Vol. 28(9): 23-32, 1995.
[Warning: Draw object ignored]
20. J. Florence and M.J. Egenhofer. "Distribution of Topological Relations in Geo-
graphic Datasets," in ACSM/ASPRS, Baltimore, MD, 1996.
21. V. Gaede and O. Günter. "Multidimensional Access Methods," ACM Computing
Surveys, Vol. 30(2): 170-231, 1998.
22. R. Goyal and M.J. Egenhofer. "Similarity of Direction Relations," C. Jensen, et al.,
editors, in Seventh International Symposium on Spatial and Temporal Databases,
Los Angeles ,CA, Springer-Verlag, 2001.
23. D. Hearn and M.P. Backer, Computer Graphics. Prentice Hall International Edi-
tions: 1994.
24. S.-Y. Lee and F.-J. Hsu. "Spatial Reasoning and Similarity Retrieval of Images
Using 2D C-Strings Knowledge Representation," Pattern Recognition, Vol. 25(3):
305-318, 1992.
25. S.-Y. Lee, M.-C. Yang and J.-W. Chen. "Signature File as a Spatial Filter for
Iconic Image Database," Journal of Visual Languages and Computing, Vol. 3:
373-397, 1992.
26. N. Mamoulis and D. Papadias. "Integration of Spatial Join Algorithms for Process-
ing Multiple Inputs," in ACM Conference on the Management of Data, Philadel-
phia, PA, 1999.
27. D. Papadias, D. Arkoumanis and N. Karacapilidis. "On the Retrieval of Similar
Configurations," T. Poiker and N. Chrisman, editors, in 8th International Sympo-
sium on Spatial Data Handling, SDH ’98, Vancouver, International Geographical
Union, 1998.
28. D. Papadias, N. Mamoulis and V. Delis. "Algorithms for Querying Spatial Struc-
ture," A. Gupta, O. Shmueli, and J. Widom, editors, in 24 th VLDB Conference,
New York, NY, 1998.
29. D. Papadias, N. Mamoulis and Y. Theodoridis. "Constraint-Based Processing of
Multiway Spatial Joins," Algorithmica, Vol. Special Issue on Algorithms for GIS,
2001.
[Warning: Draw object ignored]
30. A. Papadopoulos, P. Rigaux and M. Scholl. "A Performance Evaluation of Spatial
Join Processing Strategies," R.H. Güting, D. Papadias, and F. Lochovsky, editors,
in Advances in Spatial Databases, 6th International Symposium, SSD ’99, Hong
Kong, China, Springer, 1999.
31. H.-H. Park, G.-H. Cha and C.-W. Chung. "Multi-Way Spatial Joins Using R-
Trees: Methodology and Performance Evaluation," R.H. Güting, D. Papadias,
and F. Lochovsky, editors, in Advances in Spatial Databases, 6th International
Symposium, SSD ’99, Hong Kong, China, Springer, 1999.
32. G. Petrakis and C. Faloustos. "Similarity Searching in Medical Image Databases,"
IEEE Transactions on Knowledge and Data Engineering, Vol. 9(3), 1997.
33. D. Pfoser and C. Jensen. "Capturing the Uncertainty of Moving-Object Repre-
sentations," R.H. Güting, D. Papadias, and F. Lochovsky, editors, in Advances
in Spatial Databases-6th International Symposium, SSD ’99, Hong Kong, China,
Springer-Verlag, 1999.
34. D. Pullar and M.J. Egenhofer. "Toward Formal Definitions of Topological Rela-
tions Among Spatial Objects," in Third International Symposium on Spatial Data
Handling, Sydney, Australia, 1988.
35. D. Randell, Z. Cui and A. Cohn. "A Spatial Logic Based on Regions and Connec-
tion," B. Nebel, C. Rich, and W. Swarthout, editors, in 3rd International Con-
ference on Knowledge Representation and Reasoning, St. Charles, IL, Morgan
Kaufmann, 1992.
36. A. Rodríguez and F. Godoy. "A Content-Based Approach to Searching and Index-
ing Spatial Configurations," M.J. Egenhofer and D. Mark, editors, in GIScience
2002, Springer-Verlag, 2002.
37. R. Shariff. "Natural-Language Spatial Relations: Metric Refinaments of Topo-
logical Properties", Department of Spatial Information Science and Engineering,
University of Maine, Orono, ME, Ph.D. Thesis, 1996.
38. J. Smith and S.F. Chang. "Integrated Spatial Query and Feature Image Query,"
[Warning: Draw object ignored]
Multimedia Systems, Vol. 7: 129-140, 1999.
39. J.R. Smith and S.-F. Chang. "Visually Searching the Web for Content," IEEE
Multimedia, Vol. 4(3): 12-20, 1997.
40. Stanford Exploration Project. "More Equations than Unknowns," http://sepwww.stanford.edu/sep/prof/fgdp/c6/paper_html/node2.html,
access in 2003.
41. O. Wolfson, B. Xu, S. Chamberlain and L. Jiang. "Moving Objects Databases:
Issues and Solutions," M. Rafanelli and M. Jarke, editors, in Statistical and Sci-
entific Database Management, Capri, Italy, IEEE Computer Society Press, 1998.
42. A. Yoshitaka and T. Ichikawa. "A Survey on Content-Based Retrieval for Multi-
media Databases," IEEE Transactions on Knowledge and Data Engineering, Vol.
11(1): 81-93, 1999.
[Warning: Draw object ignored]

List of Figures
[Warning: Draw object ignored]

[Warning: Image not found]
Figure 5: Asymmetric property of topological relations.
[Warning: Draw object ignored]

[Warning: Image not found](a) (b)
Figure 6: Characterizing values of content measure F a: (a) meet relation when F a(A,B)+ F a(B,A) = 1 and (b) overlap relation when F a(A,B) + F a(B,A) < 1.
[Warning: Draw object ignored]
[Warning: Image not found]
Figure 7: Characterizing values of content measure F d.
Figure 8: Possible values of Fm that are classified into eight topological relations.
[Warning: Image not found]
[Warning: Image not found]
Figure 9: Scaling of a pair of objects.
[Warning: Image not found] [Warning: Draw object ignored]
(a) (b)
Figure 10: Rotation dependence of content measures: (a) illustrative case and (b)variation graph.
[Warning: Image not found] [Warning: Draw object ignored]
(a) (b)
Figure 11: Content measures versus objects’ movements: (a) movement (b) variationgraph.
[Warning: Draw object ignored]

[Warning: Image not found] [Warning: Draw object ignored]
(a) (b)
Figure 12: Content measures versus objects’ movements: (a) movement (b) variationgraph.
[Warning: Draw object ignored]
[Warning: Image not found]
(a) (b)
Figure 13: Control points: (a) original configuration and (b) targetconfiguration.
[Warning: Draw object ignored]

[Warning: Image not found](a)
[Warning: Image not found](b)
Figure 14: Combinations of four vertices under: (a) rotations of [Warning:Missing symbol F070]/2 radians and (b) rotations of [Warning: Missingsymbol F070]/2 radians flipped over the y-axis.
Figure 15: Geometric adjustment with 4 points per MBR.
[Warning: Image not found]
[Warning: Draw object ignored]
[Warning: Image not found]
(a)
(b)
[Warning: Image not found]
Figure 16: Combinations of eight vertices under: (a) rotations of [Warn-ing: Missing symbol F070]/2 radians and (b) rotations of [Warning: Missingsymbol F070]/2 radians flipped over y-axis.
[Warning: Draw object ignored]

[Warning: Image not found]
(a)
[Warning: Image not found]
(b)
Figure 17: Effect of using (a) four- or (b) eight-points for MBR representation onconfiguration adjustment.
[Warning: Draw object ignored]

[Warning: Image not found]
Figure 18: Strategy for comparing content measures: content measures versus geo-metric adjustment.
[Warning: Draw object ignored]

[Warning: Image not found]
Figure 19: Nine possible MBRs of a 2x2 Cell-Box.
[Warning: Draw object ignored]

[Warning: Image not found]
Figure 20: The eight different configurations in a box of 2x2 cells.
[Warning: Draw object ignored]
Figure 21: Distribution of topological relations in sets of configurations.
[Warning: Draw object ignored]

[Warning: Draw object ignored]
Figure 22: Correlations of content measure F a when relations are eliminated from thedata set.
[Warning: Draw object ignored]

[Warning: Draw object ignored]
Figure 23: Correlations of content measure F d as relations are eliminated from thedata set.
[Warning: Draw object ignored]
[Warning: Draw object ignored]
Figure 24: Correlations of content measure Fm as relations are eliminated from dataset.
Topological Rela-tion
Value Range for (Fm(A,B), Fm(B ,A))
disjoint (Fm(A,B) > 1 , Fm(B ,A) > 1)meet (Fm(A,B) = 1 , Fm(B ,A) = 1)overlap (| Fm(A,B) | < 1 , | Fm(B ,A) | < 1)equal (Fm(A,B) = -1 , Fm(B ,A) = -1)covers & covered_by (| Fm(A,B) | < 1 , Fm(B ,A) = -1) or (Fm(A,B) = -1 , |
Fm(B ,A) | < 1)inside & contains (| Fm(A,B) | < 1 , Fm(B ,A) < -1) or (Fm(A,B) < -1 , |
Fm(B ,A) | < 1)
Table 1: Possible values of Fm according to topological relations.
Transitions F a(A,B), F a(B ,A) F d(A,B), F d(B ,A) Fm(A,B),
Fm(B ,A)
[Warning: Im-
age not found]
(0.33,0.11) (0.54,0.33) (1.28 , 1.45)
[Warning: Draw
object ignored]
[Warning:
Image not
found]
(0.40,0.13) (0.62,0.38) (1.00,1.00)
[Warning: Draw object ignored]
[Warning: Draw
object ignored]
[Warning:
Image not
found]
(0.60,0.20) (0.67,0.42) (1.00,1.00)
[Warning: Draw
object ignored]
[Warning:
Image not
found]
(0.75,0.25) (0.81,0.50) (0.67,0.00)
[Warning: Draw
object ignored]
[Warning:
Image not
found]
(1.00,0.33) (1.00,0.62) (0.33,-1.00)
[Warning: Draw
object ignored]
[Warning:
Image not
found]
(1.00,0.33) (1.00,0.62) (0.19,-1.22)
Table 2: Values of content measure for different state transitions of two MBRs.
Cell Box # MBRs # Different Configurations # Comparisons
2x2 9 8 563x3 36 78 6.0064x4 100 359 128.522
[Warning: Draw object ignored]
5x5 225 1290 1.662.8106x6 441 3550 12.598.9507x7 784 8773 76.956.756
Table 3: Number of Comparisons for different cell boxes.
Four Points Eight Points
Cell Box F a Fd Fm Fa Fd Fm
2x2 0.43 0.48 0.58 0.48 0.55 0.653x3 0.46 0.55 0.62 0.46 0.56 0.644x4 0.45 0.55 0.65 0.46 0.56 0.675x5 0.44 0.54 0.64 0.45 0.55 0.676x6 0.43 0.53 0.64 0.45 0.54 0.67
Mean 0.44 0.53 0.63 0.46 0.55 0.66
Table 4: Correlations between content measures and similarity function when using fourpoints or eight points in the representation of MBRs.
[Warning: Draw object ignored]
Related Documents