I NS TITU T E F O R D E F E NS E A N A L Y S ES IDA Paper P-4284 Log: H 07-001653 February 2008 Defense Department Profit and Contract Finance Policies and Their Effects on Contract and Contractor Performance Scot A. Arnold, Project Leader Bruce R. Harmon Karen W. Tyson Kenton G. Fasana Christopher S. Wait Approved for public release; distribution unlimited.

Welcome message from author
This document is posted to help you gain knowledge. Please leave a comment to let me know what you think about it! Share it to your friends and learn new things together.
Transcript
I N S T I T U T E F O R D E F E N S E A N A L Y S E S
IDA Paper P-4284
Log: H 07-001653
February 2008
Defense Department Profi t and Contract Finance Policies and Their Effects on Contract and Contractor Performance
Scot A. Arnold, Project LeaderBruce R. HarmonKaren W. Tyson
Kenton G. FasanaChristopher S. Wait
Approved for public release;distribution unlimited.

This work was conducted under contract DASW01-04-C-0003,Task AH-7-2774, for the Offi ce of the Deputy Under Secretary of Defense (Industrial Policy). The publication of this IDA document does not indicate endorsement by the Department of Defense, nor should the contents be construed as refl ecting the offi cial position of that Agency.
© 2007, 2008 Institute for Defense Analyses, 4850 Mark Center Drive, Alexandria, Virginia 22311-1882 • (703) 845-2000.
This material may be reproduced by or for the U.S. Government pursuantto the copyright license under the clause at DFARS 252.227-7013 (NOV 95).
I N S T I T U T E F O R D E F E N S E A N A L Y S E S
IDA Paper P-4284
Defense Department Profi t and Contract Finance Policies and Their Effects on Contract and Contractor Performance
Scot A. Arnold, Project LeaderBruce R. HarmonKaren W. Tyson
Kenton G. FasanaChristopher S. Wait

iii
PREFACE
The Institute for Defense Analyses (IDA) prepared this paper for the Deputy Under Secretary of Defense (Industrial Policy) under a task titled “Profit Policy Research.” The task objective is to evaluate the degree to which the Office of the Secretary of Defense’s profit policy affects both performance on defense contracts and the finances of the contracting firms. This paper explores how the policy is applied in practice and how it relates to contract performance and financial results.
Thomas P. Frazier and Stanley A. Horowitz of IDA were the technical reviewers for this paper.


v
TABLE OF CONTENTS
Executive Summary .........................................................................................................S-1
A. Objective and Presentation Plan ................................................................................... 1
B. Does Practice Follow Policy? ....................................................................................... 3
1. Contract Financing.................................................................................................. 6 2. Margin Policy ......................................................................................................... 7 3. Data Analysis ........................................................................................................ 15 4. Targets versus Policy ............................................................................................ 16
C. Does Policy Influence Contract Performance? ........................................................... 23
D. Does Policy Provide Adequate Contractor Profit? ..................................................... 31
E. Synthesis of Findings and Implications ...................................................................... 46
Appendix: Target Factor Correlations ............................................................................ A-1
Abbreviations.................................................................................................................. B-1
References....................................................................................................................... C-1
LIST OF FIGURES
1. Defense Industry Capital Spending .............................................................................. 26
2. S&P 500 Defense Industrial Base Average Quarterly Price Earnings Ratio................ 41
3. Customer Advances in Excess of Incurred Costs ......................................................... 42
LIST OF TABLES
A-1. Estimated Directional Pairwise Correlations.......................................................... A-1
A-2. Estimated Directional Pairwise Correlations versus Expectation .......................... A-2

S-1
EXECUTIVE SUMMARY
This study as a whole is concerned with two questions about profit policy. First, in what respects does profit policy provide incentives or disincentives with respect to cost growth, schedule slips, and the performance features of a system eventually provided to the Department of Defense? Specifically, we are interested in whether or not profit policy can reliably and predictably be manipulated to encourage desirable outcomes on particular contracts. Second, does profit policy provide an “adequate” profit to defense contactors; that is, a profit large enough to retain those firms in the defense industries?
Each of these two questions presents several distinct issues, which IDA approached using different methods and data. Here we provide a broad overview of the study to facilitate navigation through the sections of the paper that describe these issues, methods, and data.
THE ELEMENTS OF PROFIT POLICY
“Profit policy” in its narrowest sense refers to what are called the “weighted guidelines” for establishing the fee paid to a contractor over and above the cost of the work called for in the contract. In broad terms, the weighted guidelines provide guidance to contracting officers on the amount of fee that should be paid to compensate contractors for bearing non-reimbursable expenses and various amounts and types of risk. The guidance, however, is stated in terms of several distinct elements (for example, the fee reflecting the amount that the contractor has committed to facilities). The expectation within the weighted guidelines policy is that the total fee to be paid is determined as the sum of the individual components established according to the guidelines. This point needs to be noted because the individual elements of fee may incentivize different aspects of contractors’ decisions.
The term “profit policy” as used in this study is broader than just the weighted guidelines. We include in it as well guidance on what type of contract to use in various situations (for example, during development as opposed to during production) and policy on contract financing (for example, on progress payments).
S-2
PROFIT POLICY VERSUS FEE DETERMINATION IN PRACTICE
Contract financing is of intense interest to contractors and payments on individual contracts are visible to those in the Department of Defense who are charged with monitoring contract compliance. Thus, there is little doubt that practice on contract financing is reasonably well aligned with policy. The same cannot so confidently be asserted for policy on the use of various contract types and the weighted guidelines. In each of these cases, there is more room for judgment and decisionmaking is comparatively decentralized and may be to some degree a matter of negotiation between the government and the contractor.
To the extent that practice is detached from policy, changes in profit policy will be detached from changes in incentives perceived by contractors. This is not necessarily only a theoretical possibility. In particular, some argue that fees typically are not determined, as the weight guidelines dictate, as the sum of individual elements; rather, the total fee is first determined and then the magnitudes of the individual elements are adjusted as necessary. If this were the case, the policy’s goal of offering discrete incentives and rewards for each element would be lost.
The first part of this report provides the main results of our exploration of whether observed results correspond reasonably well to what the weighted guidelines mandate. Our results are mixed. On the one hand, we found that the pattern of allowed fees on contracts that are cost plus fee (CPF) and fixed price fee (FPF) is generally in accord with expectations. We also found that the elements of fee are not so closely correlated with one another as they would be if they were adjusted to fit within a predetermined total (that is, when one element goes up, another does not predictably go down.) These two results argue that changes in guidance on the individual elements of the weighted guidelines can be used to incentivize contractors in some ways.
On the other hand, some of our results do not seem to be entirely consistent with expectations based on the weighted guidelines. First, the difference in average fees for a sample of contracts (as a percentage of anticipated cost) on CPF contracts and FPF contracts seems to be anomalously small. We found that three of the five elements of profit policy account for the bulk of the variation in fees, which implies that the weighted guidelines in practice are a more limited tool than they might seem to be from the statement of the policy.
S-3
CONTRACT OUTCOMES, CONTRACT TYPE, AND WEIGHTED GUIDELINES
It is reasonable to expect that firm-fixed-price contracts, which give contractors a strong financial incentive to control costs, would exhibit better cost performance than cost-plus contracts. Previous studies, however, have generally a found relatively weak correlation between contract type and contract outcomes. We approached the question with more recent and different data, but got basically the same result as previous studies. In our analysis, FPIF contracts (in comparison to CPIF) showed less cost growth, but only modestly less, and the result was not statistically robust. This result is not an indication that incentives on FPIF contracts are nearly the same as those on cost-based contracts; clearly they are not. Rather, it probably indicates that the effects of these incentives are masked by other factors. Unfortunately, our analysis provided no insight into what these “other factors” might be.
Our study also provides additional evidence of a previously recognized relationship between the weighted guidelines and contractors’ cumulative capital investments. More precisely, we found that contractors’ capital investment was closely coupled to the increases in the “facilities capital employed” mark-up as defined in the weighted guidelines. We found that initiatives intended to increase capital investment did in fact raise capital-to-labor ratios at defense firms, and that was the case until the policy was changed during the military drawdown following the end of the cold war. Earlier studies by IDA and others have also shown some correlation between share ratio (the degree to which contractors had direct financial incentives to control costs) and favorable cost growth outcomes.
FINANCIAL PERFORMANCE—WEIGHTED GUIDELINES AND CONTRACT FINANCING
The weighted guidelines govern fee as a percentage of cost anticipated at the time of contract award. That cost is a large element of profitability, but it is not a sufficient measure of profitability as such. The measure of profitability depends on fee in relationship to the funds that the firm has committed (including those embodied in fixed assets) and working capital. The amount of working capital that the firm requires depends (given contract type) on financing policy. At one extreme, the government pays most costs not long after they are paid out by the contractor, and the firm requires comparatively little working capital. In other cases, the government pays the contractor
S-4
only at various contract milestones, and the contractor may require substantial working capital balances. The overall policy, however, appears to reduce the working capital cost for defense contractors when compared to other capital goods firms.
We built a valuation model to examine the effect of contract financing on the financial value of a firm. This type of modeling is an essential component of understanding any proposed or current policy. In this study, we used it to show that financing through progress payments is a powerful determinant of profitability and must be included with the fees paid to contractors in assessing profitability.
We note that defense contractors sometimes point to data suggesting that these profits are inadequate. For example, one point often made is that the earnings of defense contractors as a percentage of sales are lower than those of other industries. We found that this is true. At roughly 5–10 percent of sales, earnings of defense companies are typically a lower fraction of total sales than those of firms in other industries.
Our study shows clearly, however, that the profits of the major U.S. defense contractors are above the levels required to keep them in the defense industrial base.
Return on sales and similar measures may be, in some circumstances, useful comparative indexes of profitability. But defense firms are different than typical firms in other industries for a variety of reasons, particularly in the amount of capital required for a given project. Capital requirements for defense firms are reduced by the financing effects illustrated in our valuation model and by government investments such as direct research and development payments. A measure of profitability that captures this effect is the free cash flow return on invested capital. By this measure, defense firms generally outperform those of the other industries we examined, including pharmaceuticals, software, and services, and the overall S&P 500. Top defense firms also generally achieve returns on capital that are higher than their cost of capital, a key standard of profitability.
CONCLUSIONS
The most clear cut and important conclusion of this study is that, over the 20-year period considered, the returns achieved by the set of large defense contractors examined were sufficient to retain them in the defense industries.
In addition, the study: • Demonstrates quantitatively the importance of policy on contract financing to
the profitability of defense contractors;

S-5
• Provides evidence that changes in the weighted guidelines generally can be expected to translated into changes in allowable fees;
• Adds to the evidence that contract type effects the results obtained on particular contracts; and
• Provides further evidence that the fee allowed for facilities capital employed leads defense firms to invest in greater mechanization and thereby conserve on direct labor hours.
Probably the most important question raised by this study, and on which the evidence presented is silent, is why we do not observe a stronger relationship between contract type and contract performance. There is no doubt that (at least within limits) contract terms can be structured to provide targeted financial incentives for certain outcomes. Hence, the relatively weak effects that we and others have observed seem to require that “other things” strongly influence observed outcomes, but it is not clear what these “other things” are.

1
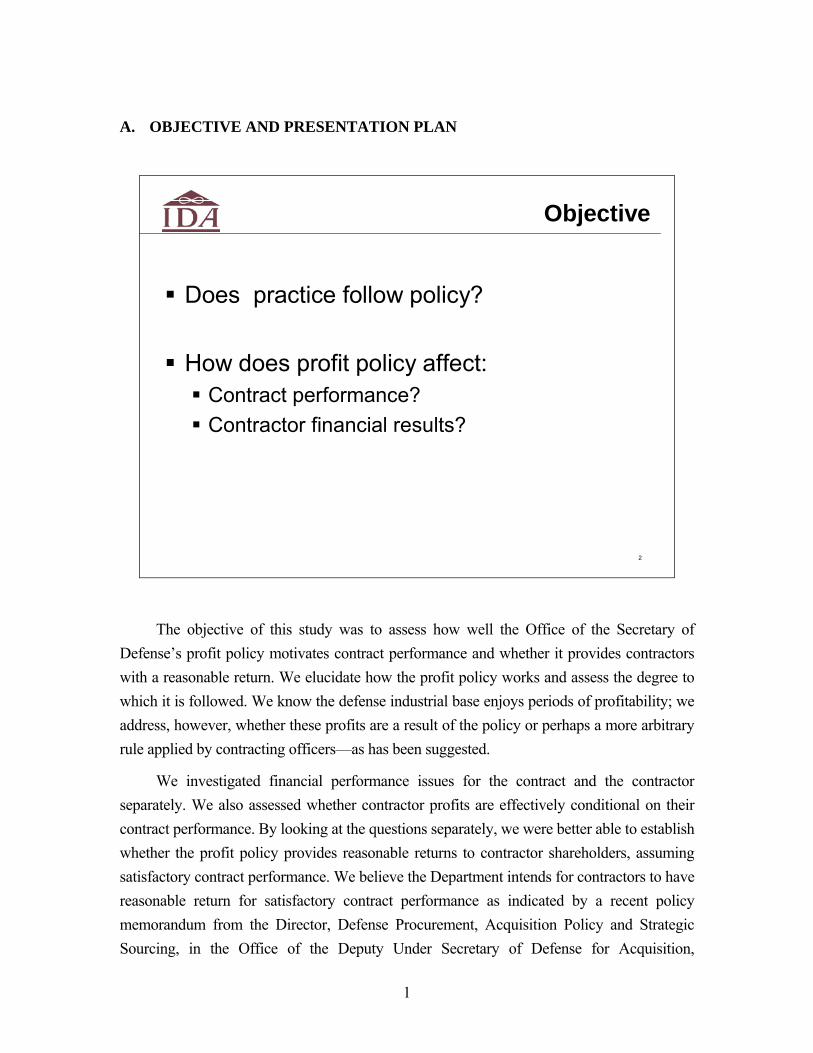
A. OBJECTIVE AND PRESENTATION PLAN
2
Objective
Does practice follow policy?
How does profit policy affect:Contract performance?Contractor financial results?
The objective of this study was to assess how well the Office of the Secretary of Defense’s profit policy motivates contract performance and whether it provides contractors with a reasonable return. We elucidate how the profit policy works and assess the degree to which it is followed. We know the defense industrial base enjoys periods of profitability; we address, however, whether these profits are a result of the policy or perhaps a more arbitrary rule applied by contracting officers—as has been suggested.
We investigated financial performance issues for the contract and the contractor separately. We also assessed whether contractor profits are effectively conditional on their contract performance. By looking at the questions separately, we were better able to establish whether the profit policy provides reasonable returns to contractor shareholders, assuming satisfactory contract performance. We believe the Department intends for contractors to have reasonable return for satisfactory contract performance as indicated by a recent policy memorandum from the Director, Defense Procurement, Acquisition Policy and Strategic Sourcing, in the Office of the Deputy Under Secretary of Defense for Acquisition,
2
Technology and Logistics.1 The memorandum calls for up to 50 percent of the award fee to be available to contractors who perform satisfactorily in the execution of the contract.
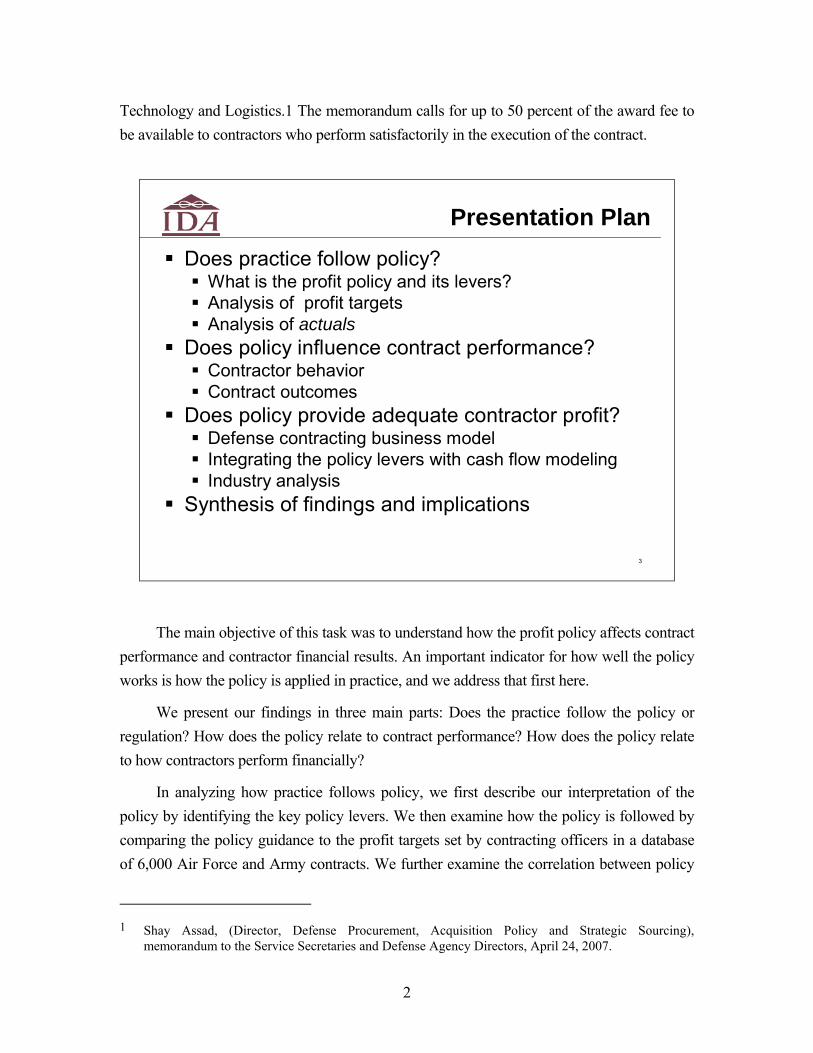
3
Presentation PlanDoes practice follow policy?
What is the profit policy and its levers?Analysis of profit targetsAnalysis of actuals
Does policy influence contract performance?Contractor behaviorContract outcomes
Does policy provide adequate contractor profit?Defense contracting business modelIntegrating the policy levers with cash flow modelingIndustry analysis
Synthesis of findings and implications
The main objective of this task was to understand how the profit policy affects contract performance and contractor financial results. An important indicator for how well the policy works is how the policy is applied in practice, and we address that first here.
We present our findings in three main parts: Does the practice follow the policy or regulation? How does the policy relate to contract performance? How does the policy relate to how contractors perform financially?
In analyzing how practice follows policy, we first describe our interpretation of the policy by identifying the key policy levers. We then examine how the policy is followed by comparing the policy guidance to the profit targets set by contracting officers in a database of 6,000 Air Force and Army contracts. We further examine the correlation between policy
1 Shay Assad, (Director, Defense Procurement, Acquisition Policy and Strategic Sourcing),
memorandum to the Service Secretaries and Defense Agency Directors, April 24, 2007.
3
and practice by actual profits from historical Contractor Cost Data Reports (DD Form 1921, Cost Data Summary Report).
We look at both earned value management data and actual cost and profit data to get an indication whether contract type has any effect on contract budget and schedule performance. Finally, we look at the effect of a specific profit lever, facilities mark-up, and show that the policy has modified contractor behavior in the past.
The last element of the three-part objective was to look at the financial effect of the policy on the industry. Since most of the industry is publicly traded, we look here at accounting profits. However, we also build up the theoretical intrinsic value of DoD contracts using an incremental profit model (i.e., a discounted cash flow analysis of a stand-alone business added to an ongoing operation). Additionally, we present our analysis of economic profits in the market valuation of major acquisitions.
We finish by summarizing our findings and suggesting possible policy implications of our research.
B. DOES PRACTICE FOLLOW POLICY?
3
Presentation PlanDoes practice follow policy?
What is the profit policy and its levers?Analysis of profit targetsAnalysis of actuals
Does policy influence contract performance?Contractor behaviorContract outcomes
Does policy provide adequate contractor profit?Defense contracting business modelIntegrating the policy levers with cash flow modelingIndustry analysis
Synthesis of findings and implications

4
4
Profit Policy and Contract Type1
The key link between contract type choice and profit policy is project risk management
Which party can manage project risks best?High technical risk (e.g. SDD) : governmentLow technical risk/high efficiency risk (e.g. production): industry
Cost plus (CP): suitable for high technical riskFixed price (FP): suitable for low technical riskIncentive layers can bridge CP/FP across a risk continuum
How to apply profit policy depends on selecting the appropriate contract type–selecting the wrong contract cannot be fixed with profit policy
Procurement Concept Contractor CompensationContract
Type Selection Contract
Profit Margin
Contract Finance
- - - - -1Selecting contract types is described in FAR 16.1. Contract financing is described in DFARS Part 232. Contract pricing is described in DFARS Part 215.4.
Profit Policy
While choosing the type of contract is not part of profit policy; the execution of profit policy depends entirely on the type contract employed since a contract forms a path that links the profit rewards to the expected contract risks. The government and the contractor must mutually determine the appropriate contract for the acquisition. Where the technical uncertainty is high, the government is best able to manage the risk, and a cost-reimbursement contract, such as a cost-plus-fixed or award-fee contract, is appropriate. When technical uncertainty is low and the need for process efficiency is high, the fixed-price-contract structure is capable of providing strong incentives to the contractor to manage the risks.
As a frame of reference, over the past decade most of the Defense Department’s acquisition expense consists of the following types of contracts:
• Fixed-price contracts—55–60 percent
• Cost-plus-fixed-fee (CPFF) contracts—11–17 percent
• Cost-plus-award-fee (CPAF) contracts—11–14 percent
• Incentive-fee contracts–6–8 percent

5
A detailed breakdown and analysis of cost by contract type is presented later in this section.
The linkage between the contract type and profit policy is even more pronounced when you consider the effect of picking the inappropriate contract for the acquisition. For example, when a fixed-price contract is used for a development program with high technical uncertainty, the profit policy has little structure to help the contractor manage cost growth risk. Should costs grow, as they frequently do in development programs, they will quickly eliminate the contractor’s profit and likely lead to substantial losses. The industrial base cannot sustain acquisition losses on a recurring basis, and more likely the government would either voluntarily allow the contract to be renegotiated or be liable to equitable readjustment litigation. At the other end, a cost-plus-fixed-fee production contract does not provide the contractor with sufficient incentives to find more efficient production methods. In both cases, the profit policy is incapable of structuring the profit incentives of the wrong type of contract for a given acquisition.
When the proper contract is chosen, the profit and contract financing policies have many levers that can be used to tailor the incentives to specific risks and uncertainties of the acquisition. Thus, the choice of contract may be thought of as a de facto profit policy lever. An analogy might be the coarse and fine adjustments on a machine tool. The contract choice is the coarse setting, which dictates first-order choices in margin levers and financing policies. Once the contract is set, the contracting office is able to fine tune specific levers and payment policies. Like most machine tools, the fine adjustment does not have enough range to correct the wrong coarse setting.

6
5
Profit Policy LeversFinancing
Progress payments/vouchersPerformance payments
Profit margin (% cost) componentsWeighted guidelinesRisk factors: technical, management, contractImputed fees: working capital, equipment, FCOM
Equipment and FCOM from net book value of assetsWorking capital from incurred costs less financing
Can be incentive: base fee + variable fee
Our concept of the profit policy includes margin levers as well as contract finance policy. To exclude the latter from the former denies the critical cash flow dynamics that distinguish the defense industrial base from other industrial sectors. We explore the defense industrial business model later (see slide 22)—this model rests on the relationship between profit margins (margin levers in the policy) and contract financing.
1. Contract Financing
The length of defense acquisition programs means the Defense Department has had to develop contract financing tools to fund contractor working capital. Ultimately we intend to evaluate the policy using discounted cash flow analysis so that the effect of both profit and contract financing policies will be considered.
Contract financing is mainly associated with monthly funding of the contractor’s working capital as a percentage of work complete. For example, for aircraft that take 3 years to build, the contractor could be receiving monthly payments of up to 80 percent of the cost of completed work. If the contract is CPFF, the contractor can receive a payment voucher that covers much more than 80 percent of the cost. Presently, the payments

7
include a portion of the fee. Upon final delivery (e.g., completing the DD Form 250, Material Inspection and Receiving Report), the government will pay the remaining unpaid balance.
Performance payments are preferred over progress payments by both contractors and the government. With performance-based payments, the contractor receives a pre-agreed payment for completing a pre-agreed milestone. The government sees two chief benefits from this type of payment: (1) the contractor has an incentive to complete its work on time (or early) since only then will it receive payment, and (2) since performance-based payments are not based on actual costs incurred, there is a lower audit load for the Defense Contract Audit Agency. Contractors prefer performance-based payments as well since they have a high degree of control over when they get paid; they do not need to be audited at the time of each payment; and performance payments cover up to 90 percent of the pre-agreed costs at the milestone instead of 80 percent with progress payments.
2. Margin Policy
Profit policy refers mainly to the levers described in the Defense Federal Acquisition Regulation Supplement (DFARS) section 215.404. These rules guide how much profit margin should be added to a contract given the types and amount of risk the contractor incurs. The main risk factors are performance and contract. Performance risk includes technical and management components. Technical risk is the amount of uncertainty related to the technology level of the acquisition. Technology level could include complexity, program maturity, stringency of tolerances or specification, schedule, warranties, and so on. The “technical” profit margin for standard technologies ranges from 3 to 7 percent of cost,2 but there is an incentive margin that could add 4 percentage points for using innovative technologies.
Management performance risk is based on the degree of management effort needed to execute the contract in such areas as cost control, source selection, complex integration, international coordination, and the like. The fee amount will also depend on the contractor’s history of contract execution quality. The technical and management performance margins are multiplied by weight factors (that add to unity) to amplify their relative importance. This is where the concept of weighted guidelines emerges. For
2 For defense contracts, profit margin refers to a percentage of cost.
8
example, if the technical and management margins are 11 percent and 7 percent, respectively, the resulting equally weighted margin would be 9 percent.
Contract risk arises from cost risk the contractor assumes as dictated by the different contract types. The contract risk fee should be thought of as compensation or provision for the risk that costs exceed the target level. For cost-plus contracts, this risk has minimal effect on the contractor except for short-term working capital since the costs are regularly and fully reimbursed using payment vouchers—the guideline range of profit for this category is between 0 percent and 1 percent. The risk is unbounded for firm-fixed-price (FFP) contracts where the guideline range is 4–6 percent.
The three imputed fees are working capital; equipment; and facilities cost of money (FCOM). The working capital profit is estimated by multiplying the total allowable contract costs times the Treasury interest rate times a length factor.3 The length factor is a look-up table in the DFARS 215.404-71-3 that yields a factor between 0.4 and 2.9 for contracts that span from 21 months or less to 76 months or more, respectively. The working capital fee is not applied to cost-plus contracts where public vouchers are employed or to other contracts that do not receive progress payments.4
If the contractor receives no contract financing (e.g., progress or performance-based payments) the contract risk margin is increased by 2 percentage points. If they receive performance-based payments, the contract risk margin is increased by 1 percentage point. It is reasonable that the working capital fee would increase with the contract length since the contractor accumulates working capital at the rate of 1 minus the progress payment rate.
The equipment and the FCOM are similarly computed fees. The equipment “mark-up” is based on the net book value of the facilities employed by the contract. (Facilities now exclude land and buildings.) Net book value is the initial cost of the asset less accumulated depreciation. The net book value is multiplied by a factor that ranges between 10–25 percent. The same basis is used to calculate the FCOM though instead of the mark-up factor, the net book value is multiplied by the Treasury rate.
Note that the FCOM is considered compensation for a cost and not a profit, though it is excluded from the allowable costs in the working capital fee. The facilities cost is
3 The Treasury rate is updated semi-annually and can be obtained from the “Treasury Direct” Web site
at http://www.treasurydirect.gov/govt/rates/tcir/tcir_opdirsemi.htm.
4 Public vouchers are a form of contract financing.
9
covered under the cost accounting standards, not DFARS 215.404. Generally, interest is an unallowable contract cost. However, FCOM was introduced in October 1976, during periods of high inflation and interest rates. We consider it a profit here since we are modeling the effect of the profit and contract financing levers on the after-tax un-levered free cash flow. This is the cash flow available to bond and stock holders after taxes and a provision for future business (i.e., capital expense) are paid.
Looking at the entire profit policy from a practical and less didactical perspective makes it difficult to exclude the FCOM from profit since it is intended to directly compensate either equity or debt holders—the Defense Department does not dictate nor anticipate capital structure. In the income statement this would fall under operating earnings or earnings before interest and taxes (EBIT).
Finally, we mention that the profit policy and contract menu merge in the use of base and variable fees. These contract structures have a minimum fee (i.e., the minimum performance fee) and a variable fee that depends either on an objective metric (incentive fee) or a subjective basis (award fee). The incentive fee is covered under DFARS 215.404 while the award fee is under separate regulations.
The contractor’s profit from an incentive fee contract follows the following formula where the desired metric is less than the target:
Profit = Base Fee + Share Ratio × (Target Metric – Actual Metric)
Additionally, the contract ceiling and maximum fee are part of the total risk-adjusted cash flow analysis. Generally in a fixed-price-incentive-fee contract, the contractor could book a loss if the actual cost greatly exceeded the target. Award fee contracts do not have an objective profit rule like incentive fees; however, the Defense Department has established the amount of fee for which a contractor is eligible based on a subjective rating: unsatisfactory (0 percent); satisfactory (≤ 50 percent); good (50–75 percent); excellent (75–90 percent); and outstanding (90–100 percent).5
5 Shay Assad memorandum, op. sit.
10
6
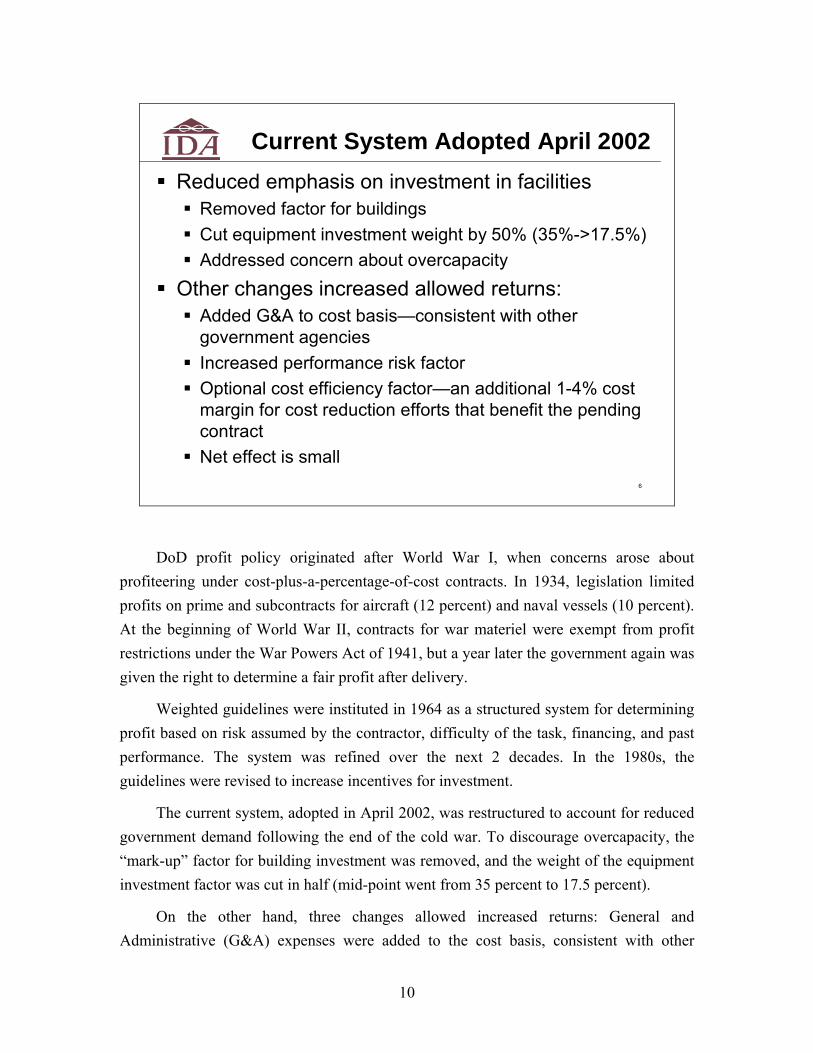
Current System Adopted April 2002Reduced emphasis on investment in facilities
Removed factor for buildings Cut equipment investment weight by 50% (35%->17.5%)Addressed concern about overcapacity
Other changes increased allowed returns:Added G&A to cost basis—consistent with other government agenciesIncreased performance risk factor Optional cost efficiency factor—an additional 1-4% cost margin for cost reduction efforts that benefit the pending contractNet effect is small
DoD profit policy originated after World War I, when concerns arose about profiteering under cost-plus-a-percentage-of-cost contracts. In 1934, legislation limited profits on prime and subcontracts for aircraft (12 percent) and naval vessels (10 percent). At the beginning of World War II, contracts for war materiel were exempt from profit restrictions under the War Powers Act of 1941, but a year later the government again was given the right to determine a fair profit after delivery.
Weighted guidelines were instituted in 1964 as a structured system for determining profit based on risk assumed by the contractor, difficulty of the task, financing, and past performance. The system was refined over the next 2 decades. In the 1980s, the guidelines were revised to increase incentives for investment.
The current system, adopted in April 2002, was restructured to account for reduced government demand following the end of the cold war. To discourage overcapacity, the “mark-up” factor for building investment was removed, and the weight of the equipment investment factor was cut in half (mid-point went from 35 percent to 17.5 percent).
On the other hand, three changes allowed increased returns: General and Administrative (G&A) expenses were added to the cost basis, consistent with other

11
government agencies; the performance risk factor was increased for technology; and the government permitted an optional cost-efficiency factor—an additional 1–4 percent cost margin for cost reduction efforts that benefit the pending contract. (As we will see, the cost efficiency factor has been little used.)
7
Profit Components vs Time1: FFP Contract2
0%
3%
6%
9%
12%
15%
Aug-
87
Aug-
88
Aug-
89
Aug-
90
Aug-
91
Aug-
92
Aug-
93
Aug-
94
Aug-
95
Aug-
96
Aug-
97
Aug-
98
Aug-
99
Aug-
00
Aug-
01
Aug-
02
Aug-
03
Aug-
04
Aug-
05
Aug-
06
Prof
it, P
erce
nt o
f Cos
t
Performance Risk
Contract Risk
Facilities Capital Mark-up
FCOM
Working Capital
- - - - -1 Efficiency factor of <4% after 2002 changes not included2 Assumptions based on historical data: facilities capital = 13.2% of cost (58% equipment, 35% buildings), contract length = 3.8 years, G&A = 9.3% of cost; historical semi-annual Treasury rates
Total % fee has changed little over past 20 years
This slide shows calculated profits, i.e., the expected policy profits, expressed as a percentage of total costs for 20 years. We tracked the policy over this period to show the effect of shifts or changes in the regulations. Changes in profit rates over time reflect changes in the weighted guidelines as well as changes in the treasury rate that affect the FCOM and working capital portions of profit. Percentages are calculated on total costs including G&A expenses but excluding FCOM. The discretionary efficiency factor instituted in 2002 is not portrayed.
To create the time series of profits shown above, it was necessary to assume representative values for several factors. Most of the input we used was averages taken from a sample of fixed-cost contract data available in Contractor Cost Data Reports (CCDRs). An estimate of G&A as a percentage of cost was needed; until the 2002 policy
12
change, G&A was not included in the base used to calculate contract and performance risk profit. The CCDR sample shows G&A averages 9.3 percent of direct costs (i.e., excluding G&A). Both FCOM and the facilities capital markup are calculated based on the book value of the facilities capital used on the contract. Given that FCOM is reported in the CCDRs, and we collected data for the corresponding contract lengths and Treasury rates, the value of facilities capital was imputed from this information. The resulting average value of facilities capital was 13.2 percent of total costs. As there were different facilities, capital mark-up rates on equipment and buildings (land was always excluded, as are buildings after 2002) we needed an estimate of the facilities components. Unfortunately, these data cannot be found in the CCDRs; instead we used information from the 1985 Defense Financial and Investment Review (DFAIR)6 as reported by William Rogerson.7 These data show percentages of 58 percent for equipment and 35 percent for buildings. The DFAIR information is also consistent with the CCDR estimate of facilities capital as a percentage of cost. Contract length is also required to calculate working capital profit—the average value for the CCDR sample is 3.8 years.
For each profit category where a range of possible values is allowed by the policy (as stated in DFARS 215.404), we used the “normal” or midpoint value in our calculations. We did not have data for contract and performance risk values prior to 1987; this is why we do not include any calculations prior to 1987.
The results show the profit percentages to be relatively stable throughout the 20-year period. The volatility in percentages for working capital and FCOM reflects changes in Treasury rates, which are reported at 6-month intervals. Some small changes in calculated working capital profits arose from changes in progress payment rates. These changes are masked in the figure by the larger changes due to interest rates. The substantial changes in policy in 2002 are shown to have offset one another in terms of total profit percentage. As noted above, this is absent the inclusion of profits based on the efficiency factor—which we will see is rarely used.
6 Michael T. Laurence, “1984 Defense Financial and Investment Review (DFAIR): Survey of Defense
Procurement Personnel Results and Findings,” Defense Manpower Data Center, December 1984.
7 William P. Rogerson, “An Economic Framework for Analyzing DoD Profit Policy,” RAND Corporation, R-3860-PA&E, 1992.
13
8
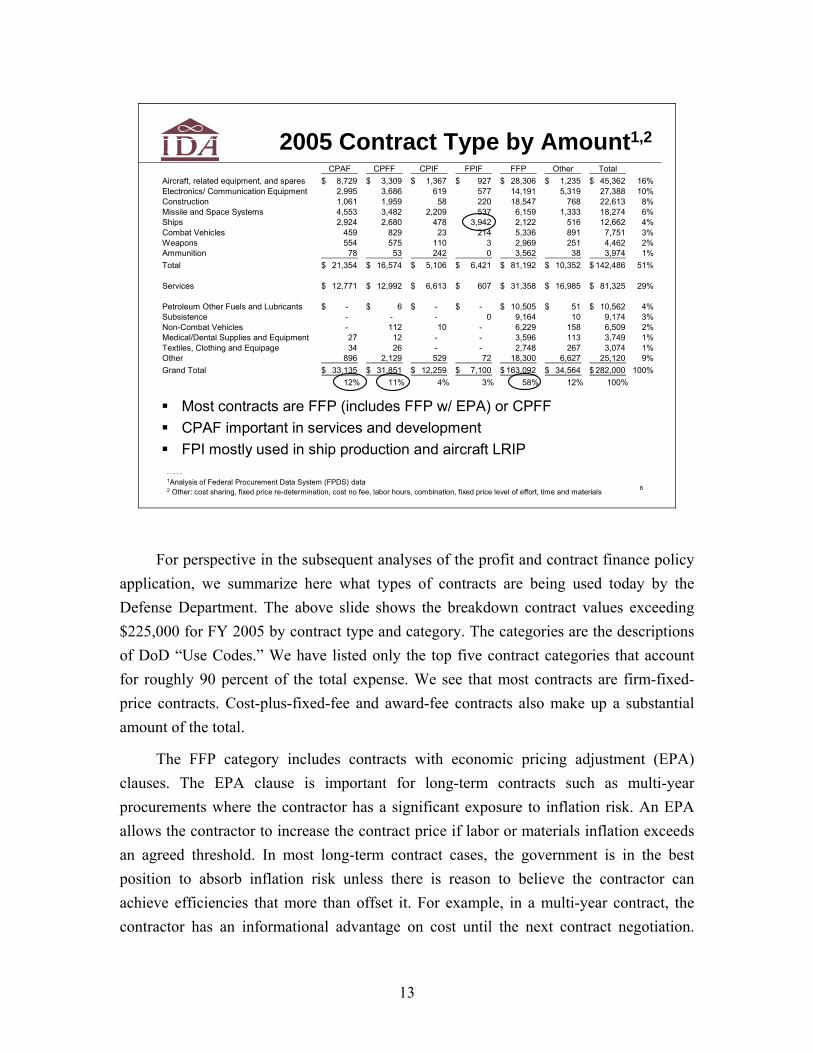
2005 Contract Type by Amount1,2
- - - - -1Analysis of Federal Procurement Data System (FPDS) data2 Other: cost sharing, fixed price re-determination, cost no fee, labor hours, combination, fixed price level of effort, time and materials
CPAF CPFF CPIF FPIF FFP Other TotalAircraft, related equipment, and spares 8,729$ 3,309$ 1,367$ 927$ 28,306$ 1,235$ 45,362$ 16%Electronics/ Communication Equipment 2,995 3,686 619 577 14,191 5,319 27,388 10%Construction 1,061 1,959 58 220 18,547 768 22,613 8%Missile and Space Systems 4,553 3,482 2,209 537 6,159 1,333 18,274 6%Ships 2,924 2,680 478 3,942 2,122 516 12,662 4%Combat Vehicles 459 829 23 214 5,336 891 7,751 3%Weapons 554 575 110 3 2,969 251 4,462 2%Ammunition 78 53 242 0 3,562 38 3,974 1%Total 21,354$ 16,574$ 5,106$ 6,421$ 81,192$ 10,352$ 142,486$ 51%
Services 12,771$ 12,992$ 6,613$ 607$ 31,358$ 16,985$ 81,325$ 29%
Petroleum Other Fuels and Lubricants -$ 6$ -$ -$ 10,505$ 51$ 10,562$ 4%Subsistence - - - 0 9,164 10 9,174 3%Non-Combat Vehicles - 112 10 - 6,229 158 6,509 2%Medical/Dental Supplies and Equipment 27 12 - - 3,596 113 3,749 1%Textiles, Clothing and Equipage 34 26 - - 2,748 267 3,074 1%Other 896 2,129 529 72 18,300 6,627 25,120 9%Grand Total 33,135$ 31,851$ 12,259$ 7,100$ 163,092$ 34,564$ 282,000$ 100%
12% 11% 4% 3% 58% 12% 100%
Most contracts are FFP (includes FFP w/ EPA) or CPFFCPAF important in services and developmentFPI mostly used in ship production and aircraft LRIP
For perspective in the subsequent analyses of the profit and contract finance policy application, we summarize here what types of contracts are being used today by the Defense Department. The above slide shows the breakdown contract values exceeding $225,000 for FY 2005 by contract type and category. The categories are the descriptions of DoD “Use Codes.” We have listed only the top five contract categories that account for roughly 90 percent of the total expense. We see that most contracts are firm-fixed-price contracts. Cost-plus-fixed-fee and award-fee contracts also make up a substantial amount of the total.
The FFP category includes contracts with economic pricing adjustment (EPA) clauses. The EPA clause is important for long-term contracts such as multi-year procurements where the contractor has a significant exposure to inflation risk. An EPA allows the contractor to increase the contract price if labor or materials inflation exceeds an agreed threshold. In most long-term contract cases, the government is in the best position to absorb inflation risk unless there is reason to believe the contractor can achieve efficiencies that more than offset it. For example, in a multi-year contract, the contractor has an informational advantage on cost until the next contract negotiation.
14
During this period the contractor should seek to increase its productivity as much as possible since it will be able to keep the profits. The government should take the inflation risk only if inflation is volatile or expected to rise substantially, or if there is little productivity gain possible. In some commercial contracts the supplier is expected to offset inflation with productivity gains.8 One problem is that the profit policy does not specifically mention that the EPA clause lowers the contractor’s risk and should therefore account for a lower contract risk margin.
The CPAF contract has become an important alternative to the CPFF for development and service contracts. It is preferred by contractors because its limits are not defined by the guidelines in DFARS 215.404 and can enable the contractor to make higher gains on development contracts. This is important to contractors as the Defense Department enters into fewer major acquisitions. Contractors state they must be able to make high profits on development in isolation from production to remain competitive with other high-technology industries. The CPAF contract is used where there are no clear objective metrics that could be used to develop an incentive fee structure. CPAF contracts are used mainly in development and services where there is either a high degree of technical uncertainty or performance is not defined with quantitative metrics.
Cost-plus and fixed-price-incentive-fee contracts are less common now than in the past. Incentive-fee contracts are appropriate for production programs where there is a residual risk of design changes, such as ships, satellites, or aircraft low-rate initial production.
8 Ford Motor Company purchasing manager, telephone conversation with Scot Arnold, 1993.
15
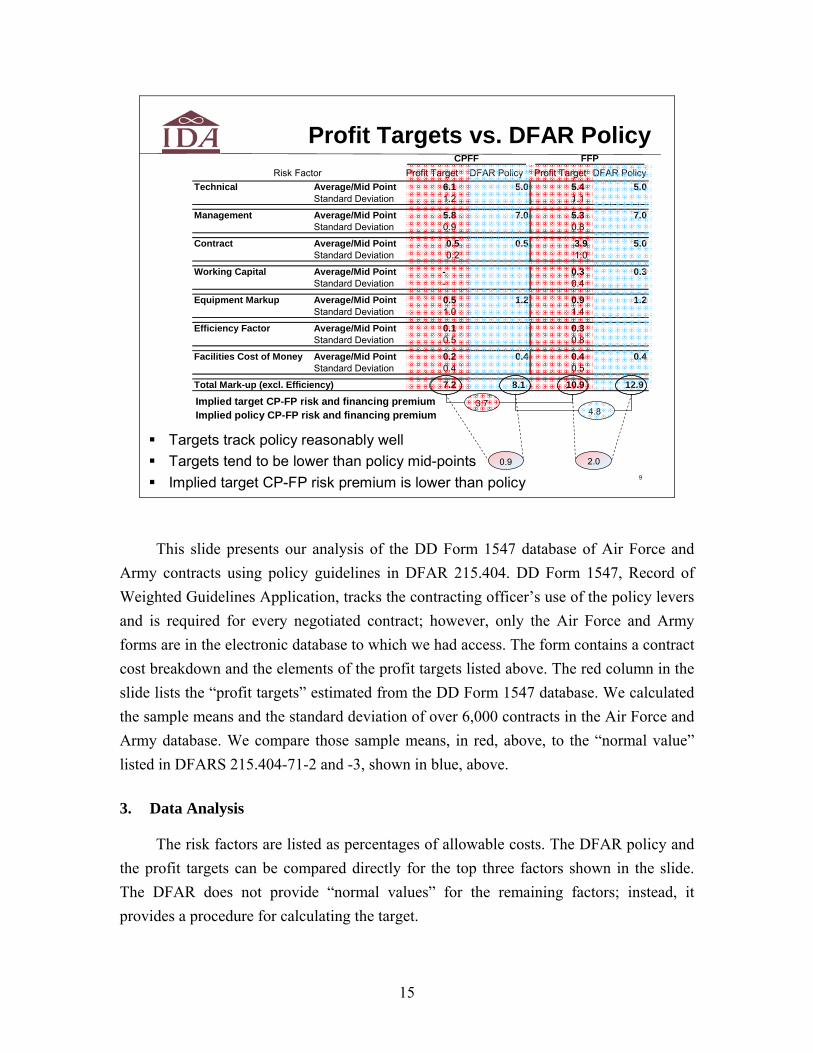
9
Targets track policy reasonably wellTargets tend to be lower than policy mid-pointsImplied target CP-FP risk premium is lower than policy
Profit Targets vs. DFAR Policy
Implied target CP-FP risk and financing premiumImplied policy CP-FP risk and financing premium
Profit Target DFAR Policy Profit Target DFAR PolicyTechnical Average/Mid Point 6.1 5.0 5.4 5.0
Standard Deviation 1.2 1.1
Management Average/Mid Point 5.8 7.0 5.3 7.0Standard Deviation 0.9 0.8
Contract Average/Mid Point 0.5 0.5 3.9 5.0Standard Deviation 0.2 1.0
Working Capital Average/Mid Point - 0.3 0.3Standard Deviation - 0.4
Equipment Markup Average/Mid Point 0.5 1.2 0.9 1.2Standard Deviation 1.0 1.4
Efficiency Factor Average/Mid Point 0.1 0.3 Standard Deviation 0.5 0.8
Facilities Cost of Money Average/Mid Point 0.2 0.4 0.4 0.4Standard Deviation 0.4 0.5
Total Mark-up (excl. Efficiency) 7.2 8.1 10.9 12.9
Risk FactorCPFF FFP
2.0
4.83.7
0.9
This slide presents our analysis of the DD Form 1547 database of Air Force and Army contracts using policy guidelines in DFAR 215.404. DD Form 1547, Record of Weighted Guidelines Application, tracks the contracting officer’s use of the policy levers and is required for every negotiated contract; however, only the Air Force and Army forms are in the electronic database to which we had access. The form contains a contract cost breakdown and the elements of the profit targets listed above. The red column in the slide lists the “profit targets” estimated from the DD Form 1547 database. We calculated the sample means and the standard deviation of over 6,000 contracts in the Air Force and Army database. We compare those sample means, in red, above, to the “normal value” listed in DFARS 215.404-71-2 and -3, shown in blue, above.
3. Data Analysis
The risk factors are listed as percentages of allowable costs. The DFAR policy and the profit targets can be compared directly for the top three factors shown in the slide. The DFAR does not provide “normal values” for the remaining factors; instead, it provides a procedure for calculating the target.
16
The efficiency factor, rarely used in the actual targets, similarly has no “normal value” for the efficiency factor given by the DFAR; it is simply not to exceed 4 percent. The lack of guidance may be a partial cause for the lack of usage for this factor.
The bottom four factors are imputed fees based either on allowable cost, contract length, or net book values unique for each contract. Thus for the working capital, equipment markup, and FCOM, the amounts in both the target and policy columns are based on the sample average allowable cost, length, and net book value from the DD Form 1547 database. While the DFARS does not provide “normal values” for these factors, it does provide a “normal value” for the equipment markup rate, 17.5 percent, which was used in our estimate of the policy amount.
4. Targets versus Policy
For all but the technical risk factor, the average target is set at or below the “normal value.” The technical policy level (blue) is the normal value for standard technical risk. For contracts with enough innovative technologies to receive the “technology incentive” designation (see slide 5), the policy would have a normal value of 9 percent in lieu of 5 percent. The implication is that since most of the targets are at or below the policy norm, the higher- than-normal technical risk factor target indicates some usage of the technology incentive. Notice that while the technical target is higher than the norm for the FFP contracts, it is only 0.4 points higher, versus 1.1 points for CPFF contracts. This small difference likely reflects less innovative (or more mature) technology in FFP contracts than CPFF contracts. Similarly, we see that the management risk factor is 0.5 points lower for FFP contracts than CPFF contracts. As with the technical risk factor, it is likely that FFP contracts require less effort to achieve performance targets and more effort on production efficiency. It then follows that the main difference between the FFP and CPFF targets is the 3.4 point spread between the contract risk factor targets. This reflects the contractor’s higher exposure to cost risk in FFP contracts.
Note that the working capital profit target appears only under the FFP contracts. This is because the contractor with a CPFF contract is fully reimbursed during the course of the contract through public vouchers. This result follows the policy exactly.
Not all contracts had targets for working capital, equipment markup, and FCOM, which lowers the sample means over what they would have been if we averaged only over the population with non-zero targets for these factors. This is also true for the

17
efficiency factor. Most contracts did not have a target for the efficiency factor, and the few that did had targets between the policy range of 1–4 percent.
While the relative position of the total CPFF and FFP targets is consistent with the policy, the implied risk premium, or difference between the two total targets, is lower than the guideline. In the next slide we examine this same trend for actual contract data.
10
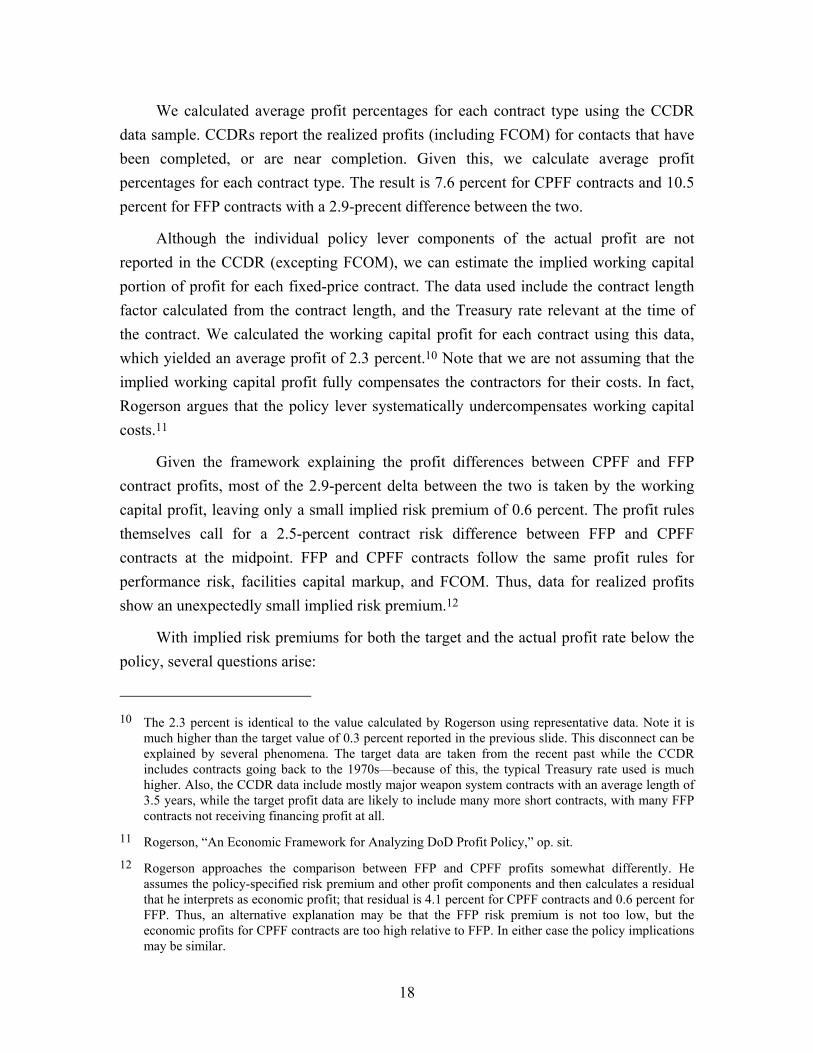
Imputed working capital profit compensates contractor for financing work-in-process not covered by progress/performance payment Working capital financing profit depends on: progress payment rate; contract length; Treasury rateImputed financing profit accounts for most of the difference between FP/CP contracts -- indicates risk premium is low
FP-CP Risk and Financing Premium
Imputed: Treas. rate, contract size/lengthMust cover performance, contract, and equipment profit
FP Higher/CP FP (Lower) han CP
Actual Profit Rates 7.6 10.5 2.9 %
Variance ExplanationWorking capital profit 2.3 %Other unexplained 0.6 Total Variance 2.9 %
1
- - - - -s1 Actual profit rates were estimated from completed contracts as reported in Contractor Cost Data Reports (CCDRs)
(Lower) than CP
Cost-plus (CP) and fixed-price (FP) contracts differ from one another in at least two important ways. In a cost-type contract most of the working capital is provided by the government, while in the fixed-price case the contractor must finance the working capital not provided by progress payments.9 In cost-type contracts (CPFF, no incentives), the government carries all risks for cost overruns, while in a firm-fixed-price contract, the risk is born by the contractor. These differences should manifest themselves in profit differences between cost-plus and fixed-price contracts.
9 CP contractors must fund minimum inter-payment working capital (as low as 1 month) and any hold-
back—presently 3 percent for income taxes.
18
We calculated average profit percentages for each contract type using the CCDR data sample. CCDRs report the realized profits (including FCOM) for contacts that have been completed, or are near completion. Given this, we calculate average profit percentages for each contract type. The result is 7.6 percent for CPFF contracts and 10.5 percent for FFP contracts with a 2.9-precent difference between the two.
Although the individual policy lever components of the actual profit are not reported in the CCDR (excepting FCOM), we can estimate the implied working capital portion of profit for each fixed-price contract. The data used include the contract length factor calculated from the contract length, and the Treasury rate relevant at the time of the contract. We calculated the working capital profit for each contract using this data, which yielded an average profit of 2.3 percent.10 Note that we are not assuming that the implied working capital profit fully compensates the contractors for their costs. In fact, Rogerson argues that the policy lever systematically undercompensates working capital costs.11
Given the framework explaining the profit differences between CPFF and FFP contract profits, most of the 2.9-percent delta between the two is taken by the working capital profit, leaving only a small implied risk premium of 0.6 percent. The profit rules themselves call for a 2.5-percent contract risk difference between FFP and CPFF contracts at the midpoint. FFP and CPFF contracts follow the same profit rules for performance risk, facilities capital markup, and FCOM. Thus, data for realized profits show an unexpectedly small implied risk premium.12
With implied risk premiums for both the target and the actual profit rate below the policy, several questions arise:
10 The 2.3 percent is identical to the value calculated by Rogerson using representative data. Note it is
much higher than the target value of 0.3 percent reported in the previous slide. This disconnect can be explained by several phenomena. The target data are taken from the recent past while the CCDR includes contracts going back to the 1970s—because of this, the typical Treasury rate used is much higher. Also, the CCDR data include mostly major weapon system contracts with an average length of 3.5 years, while the target profit data are likely to include many more short contracts, with many FFP contracts not receiving financing profit at all.
11 Rogerson, “An Economic Framework for Analyzing DoD Profit Policy,” op. sit.
12 Rogerson approaches the comparison between FFP and CPFF profits somewhat differently. He assumes the policy-specified risk premium and other profit components and then calculates a residual that he interprets as economic profit; that residual is 4.1 percent for CPFF contracts and 0.6 percent for FFP. Thus, an alternative explanation may be that the FFP risk premium is not too low, but the economic profits for CPFF contracts are too high relative to FFP. In either case the policy implications may be similar.
19
• Are FFP Contracts Priced Too Low? FFP profits are at least 2 points below the policy, which might raise concerns about the financial performance of defense firms. We later show that the defense industrial base is performing well financially. We infer that if approximately 60 percent of all DoD contracts are FFP and the industrial base is financially healthy, these contracts are reasonably profitable.
• Are CPFF Contracts Priced Too High? CPFF profits are about a half of a percentage point below the policy. With our profit model (discussed below) we find that CPFF contracts can have positive net present value with well below 7 percent profit on cost margin. There are three reasons for this: (1) the government funds almost all of the contractor’s working capital; (2) the contractor’s investment is limited to general equipment and facilities, while the government funds unique tooling and equipment; and (3) the government funds cost increases associated with technical and economic risk.
• Do Contracting Officers Consider Other Factors? If the contracting officer believes the contractor is using its superior knowledge of cost to push up the FFP proposal with risk reserves, the officer may give the contractor a lower profit margin, expecting the contractor to benefit from regulatory lag. Regulatory lag is a delay between time when prices are negotiated and when actual costs of recent prior units are known by the government. Assuming that process improvements continually lower costs, the lag results in higher negotiated prices. For example, in negotiating Lot 7 of a given aircraft program, the government has access to actual data only from Lot 4, while the contractor has some information about Lots 6 and 7 which may be in process. Contracting officers are undoubtedly aware of the information asymmetry and the effect of regulatory lag, and may discount the policy to account for “risk provisions” in the contractor’s FFP proposal.
Research suggests regulatory lag is an important incentive for innovation in defense procurement since the government eventually benefits from the lower costs when the information becomes available. Regulatory lag is a source of beneficial cost reductions when the initial cost estimate basis for the FFP contract is honest and free of reserves for cost risk.
20
11
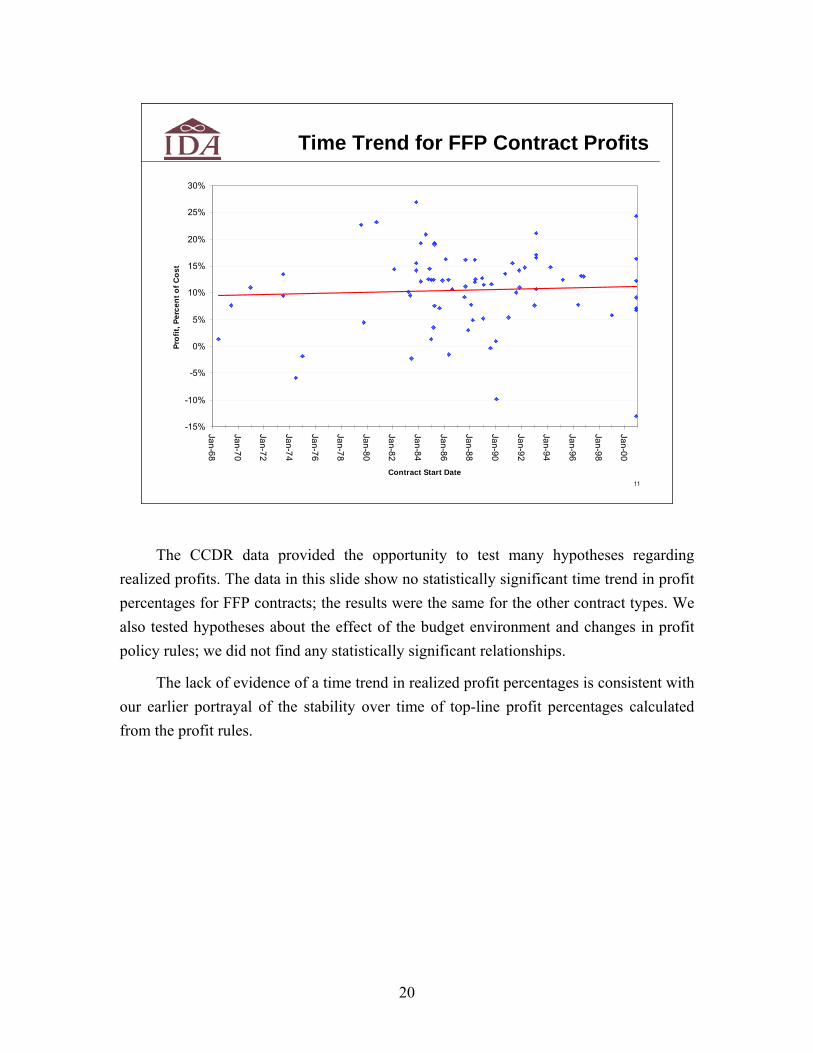
Time Trend for FFP Contract Profits
-15%
-10%
-5%
0%
5%
10%
15%
20%
25%
30%
Jan-68
Jan-70
Jan-72
Jan-74
Jan-76
Jan-78
Jan-80
Jan-82
Jan-84
Jan-86
Jan-88
Jan-90
Jan-92
Jan-94
Jan-96
Jan-98
Jan-00
Contract Start Date
Prof
it, P
erce
nt o
f Cos
t
The CCDR data provided the opportunity to test many hypotheses regarding realized profits. The data in this slide show no statistically significant time trend in profit percentages for FFP contracts; the results were the same for the other contract types. We also tested hypotheses about the effect of the budget environment and changes in profit policy rules; we did not find any statistically significant relationships.
The lack of evidence of a time trend in realized profit percentages is consistent with our earlier portrayal of the stability over time of top-line profit percentages calculated from the profit rules.
21
12
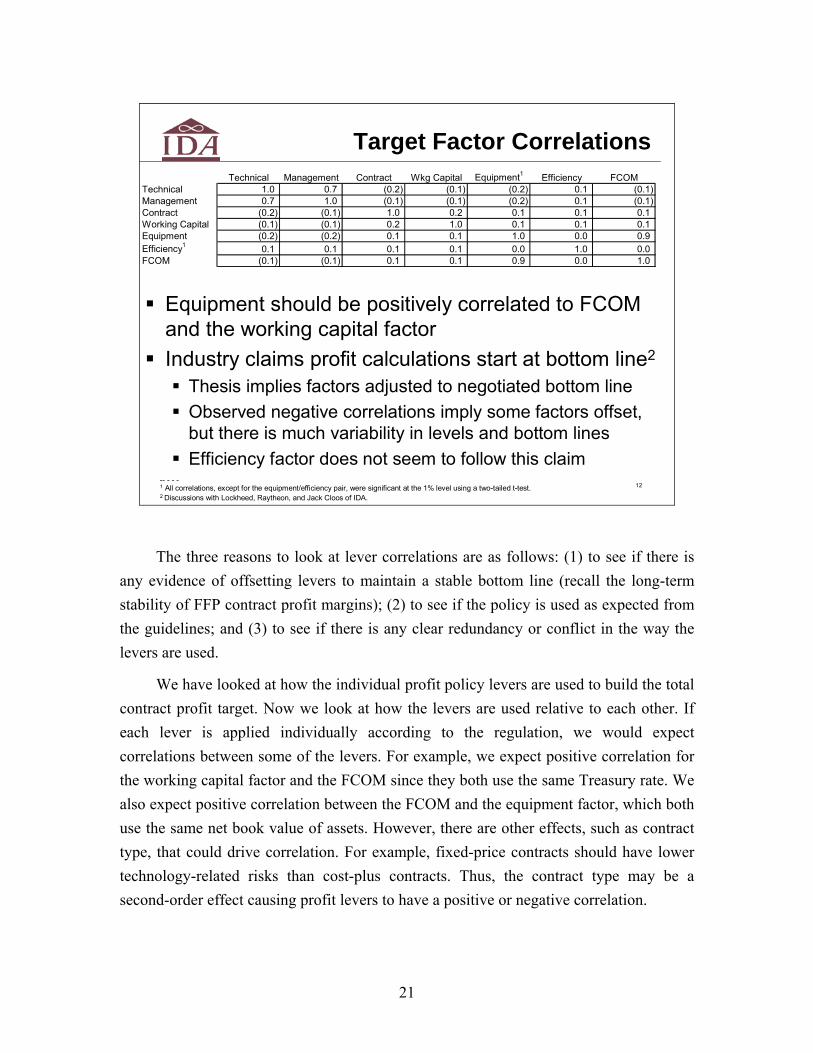
Target Factor CorrelationsTechnical Management Contract Wkg Capital Equipment1 Efficiency FCOM
Technical 1.0 0.7 (0.2) (0.1) (0.2) 0.1 (0.1) Management 0.7 1.0 (0.1) (0.1) (0.2) 0.1 (0.1) Contract (0.2) (0.1) 1.0 0.2 0.1 0.1 0.1 Working Capital (0.1) (0.1) 0.2 1.0 0.1 0.1 0.1 Equipment (0.2) (0.2) 0.1 0.1 1.0 0.0 0.9 Efficiency1 0.1 0.1 0.1 0.1 0.0 1.0 0.0 FCOM (0.1) (0.1) 0.1 0.1 0.9 0.0 1.0 - - - - 1 The equipment and efficiency correlation were the only estimates with significance level >.01
-- - - -1 All correlations, except for the equipment/efficiency pair, were significant at the 1% level using a two-tailed t-test.2 Discussions with Lockheed, Raytheon, and Jack Cloos of IDA.
Equipment should be positively correlated to FCOM and the working capital factorIndustry claims profit calculations start at bottom line2
Thesis implies factors adjusted to negotiated bottom lineObserved negative correlations imply some factors offset, but there is much variability in levels and bottom linesEfficiency factor does not seem to follow this claim
The three reasons to look at lever correlations are as follows: (1) to see if there is any evidence of offsetting levers to maintain a stable bottom line (recall the long-term stability of FFP contract profit margins); (2) to see if the policy is used as expected from the guidelines; and (3) to see if there is any clear redundancy or conflict in the way the levers are used.
We have looked at how the individual profit policy levers are used to build the total contract profit target. Now we look at how the levers are used relative to each other. If each lever is applied individually according to the regulation, we would expect correlations between some of the levers. For example, we expect positive correlation for the working capital factor and the FCOM since they both use the same Treasury rate. We also expect positive correlation between the FCOM and the equipment factor, which both use the same net book value of assets. However, there are other effects, such as contract type, that could drive correlation. For example, fixed-price contracts should have lower technology-related risks than cost-plus contracts. Thus, the contract type may be a second-order effect causing profit levers to have a positive or negative correlation.

22
While there appear to be several cases of unexpected pairwise correlation, further analysis of these coefficients did not yield any strong indication of offsetting. Furthermore, the unexpected, but small, positive correlations weigh against significant systemic offsetting. An appendix to this paper presents a more detailed description of the analysis of target factor correlations in slide 12.
13
Principal Component Analysis of Profit Targets
Seven factors collapse to threeEquipment and FCOM move togetherTechnical and management risk are weighted togetherContract risk is importantEfficiency and working capital are insignificant
Factor Matrixa
a 3 factors extracted. 8 iterations required.
Extraction Method: Un-weighted Least Squares.
-.076.437.880FCOM
.197.047.017Efficiency
-.055.327.828Equipment Markup
.277-.052.178Working Capital
.669-.190.278Contract
.158.641-.451Management
.121.677-.451Technical
321
Factor
Guidelines usage is simpler than implied policy
Based on the guidelines in the regulation, several of the levers are related or have a fine distinction. The implication may be that the guidelines are more complex than necessary and might be improved with fewer, more broadly defined levers. For example, can the goals of the contract risk and working capital levers be achieved with just one lever? Could fewer non-overlapping levers achieve the objective with less complexity?
We used factor analysis to determine if we could use fewer levers to explain the variation in the DD Form 1547 data. We do not go into the details of the data reduction technique here, but factor analysis identifies and ranks “factors” based on the correlations between the variables—in this case the profit levers. This ranking provides the researcher with a way to reduce the number of factors needed to model the system. In our case, we
23
have seven levers we suspect could be reduced in number and still yield the expected profit target per contract. Our factor analysis indicated that the DD Form 1547 profit target data could be modeled with three factors: one that captured the elements of the equipment and FCOM levers (yellow); one that captured the elements of performance risk (red); and one that captured the elements of contract risk (green). Factor three also appears to capture the effect of the working capital lever. However, the fact that the working capital and efficiency levers were not used as much as the other levers played a role in reducing their overall effectiveness in modeling the data.
Our factor analysis indicated that the profit levers could be reduced from seven to three. This is a substantial change that would require major revisions to the regulation.
C. DOES POLICY INFLUENCE CONTRACT PERFORMANCE?
3
Presentation PlanDoes practice follow policy?
What is the profit policy and its levers?Analysis of profit targetsAnalysis of actuals
Does policy influence contract performance?Contractor behaviorContract outcomes
Does policy provide adequate contractor profit?Defense contracting business modelIntegrating the policy levers with cash flow modelingIndustry analysis
Synthesis of findings and implications
24
15
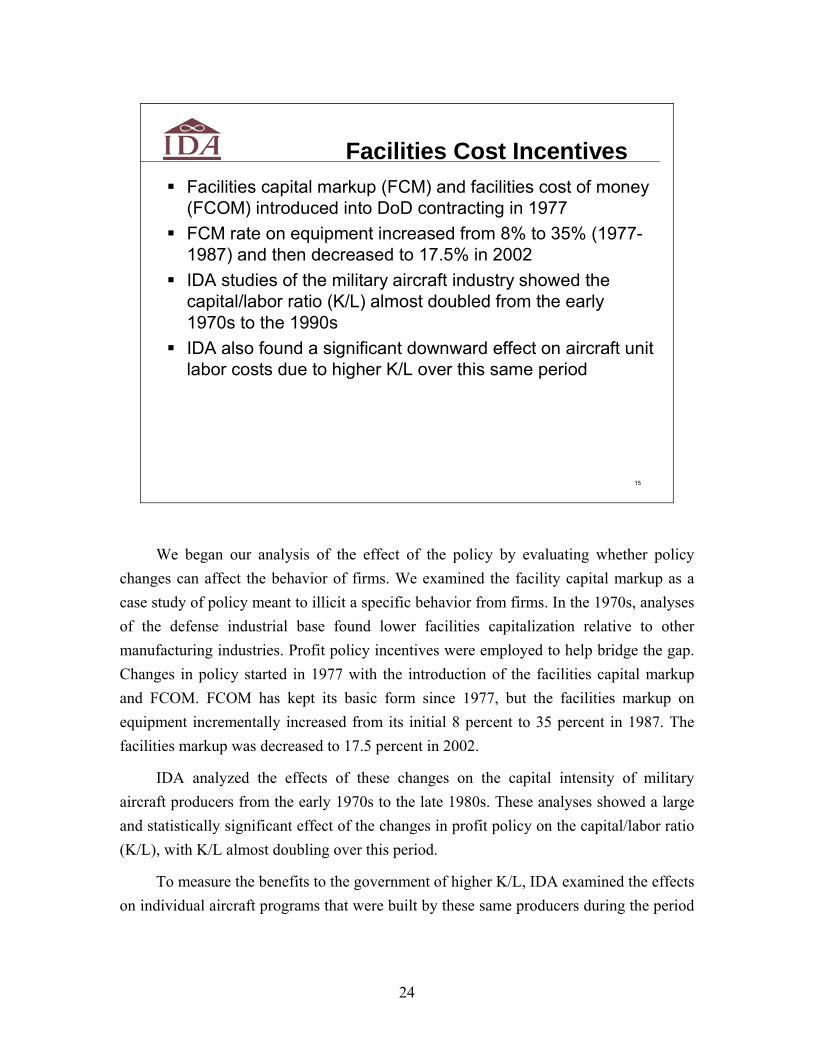
Facilities Cost IncentivesFacilities capital markup (FCM) and facilities cost of money (FCOM) introduced into DoD contracting in 1977FCM rate on equipment increased from 8% to 35% (1977-1987) and then decreased to 17.5% in 2002IDA studies of the military aircraft industry showed the capital/labor ratio (K/L) almost doubled from the early 1970s to the 1990s IDA also found a significant downward effect on aircraft unit labor costs due to higher K/L over this same period
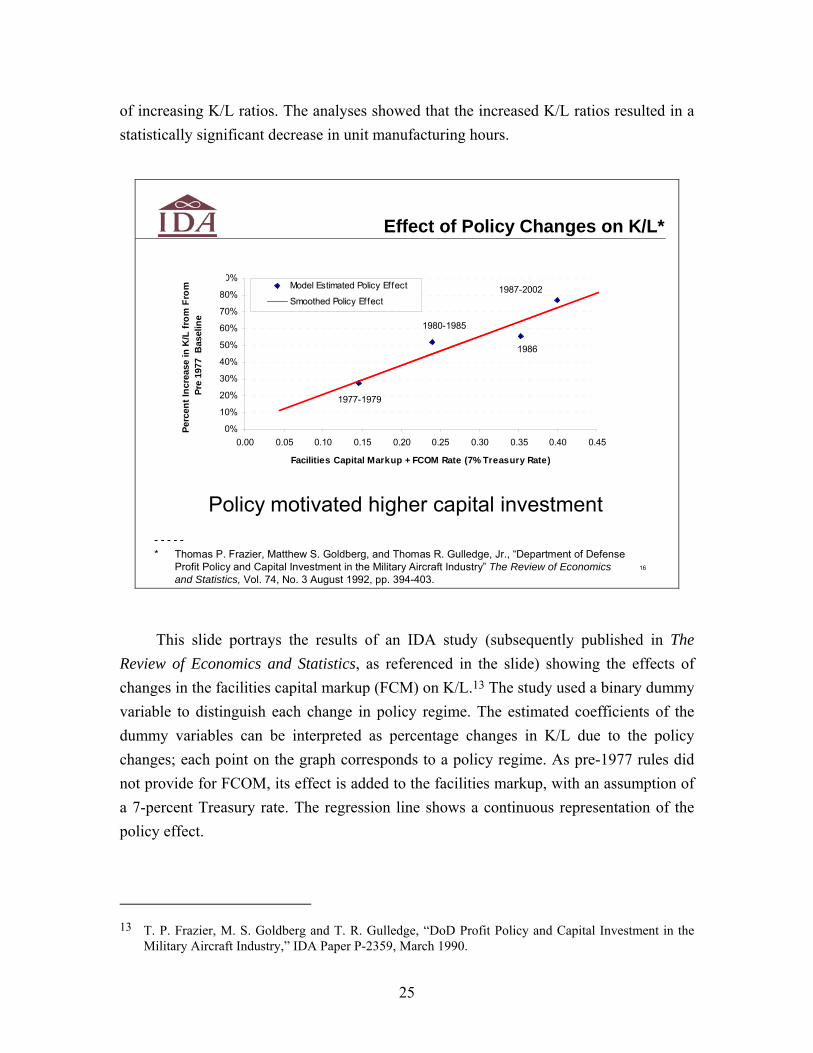
We began our analysis of the effect of the policy by evaluating whether policy changes can affect the behavior of firms. We examined the facility capital markup as a case study of policy meant to illicit a specific behavior from firms. In the 1970s, analyses of the defense industrial base found lower facilities capitalization relative to other manufacturing industries. Profit policy incentives were employed to help bridge the gap. Changes in policy started in 1977 with the introduction of the facilities capital markup and FCOM. FCOM has kept its basic form since 1977, but the facilities markup on equipment incrementally increased from its initial 8 percent to 35 percent in 1987. The facilities markup was decreased to 17.5 percent in 2002.
IDA analyzed the effects of these changes on the capital intensity of military aircraft producers from the early 1970s to the late 1980s. These analyses showed a large and statistically significant effect of the changes in profit policy on the capital/labor ratio (K/L), with K/L almost doubling over this period.
To measure the benefits to the government of higher K/L, IDA examined the effects on individual aircraft programs that were built by these same producers during the period
25
of increasing K/L ratios. The analyses showed that the increased K/L ratios resulted in a statistically significant decrease in unit manufacturing hours.
16
Effect of Policy Changes on K/L*
- - - - -* Thomas P. Frazier, Matthew S. Goldberg, and Thomas R. Gulledge, Jr., “Department of Defense
Profit Policy and Capital Investment in the Military Aircraft Industry” The Review of Economics and Statistics, Vol. 74, No. 3 August 1992, pp. 394-403.
0%
10%
20%
30%
40%
50%
60%
70%
80%
90%
0.00 0.05 0.10 0.15 0.20 0.25 0.30 0.35 0.40 0.45
Facilities Capital Markup + FCOM Rate (7% Treasury Rate)
Perc
ent I
ncre
ase
in K
/L fr
om F
rom
Pr
e 19
77 B
asel
ine
Model Estimated Policy Effect
Smoothed Policy Effect
1977-1979
1980-1985
1986
1987-2002
Policy motivated higher capital investment
This slide portrays the results of an IDA study (subsequently published in The Review of Economics and Statistics, as referenced in the slide) showing the effects of changes in the facilities capital markup (FCM) on K/L.13 The study used a binary dummy variable to distinguish each change in policy regime. The estimated coefficients of the dummy variables can be interpreted as percentage changes in K/L due to the policy changes; each point on the graph corresponds to a policy regime. As pre-1977 rules did not provide for FCOM, its effect is added to the facilities markup, with an assumption of a 7-percent Treasury rate. The regression line shows a continuous representation of the policy effect.
13 T. P. Frazier, M. S. Goldberg and T. R. Gulledge, “DoD Profit Policy and Capital Investment in the
Military Aircraft Industry,” IDA Paper P-2359, March 1990.

26
We had data only through the late 1990s, so the analysis did not extend past the latest regulation change in 2002. We can see from contractor financial reports, however, that since the end of the cold war, capital spending (Figure 1 shows net capital expense as CAPEX = capital spending – depreciation) has declined dramatically. Two factors could be at work: a direct scale-down in response to lower DoD demand, and lower spending in expectation of the facilities capital markup rule change. The rule change was apparently discussed for many years prior to implementation.14 Contractors would factor expected profitability of assets in their capital budgeting.
0%
1%
2%
3%
4%
5%
6%
1988 1990 1992 1994 1996 1998 2000 2002 2004 2006(1,500)
(1,000)
(500)
0
500
1,000
1,500
2,000
CA
PEX-
Dep
reci
atio
n ($
Mils
.)
Net CAPEX
CAPEX % Sales
CA
PEX
% S
ales
Figure 1. Defense Industry Capital Spending
14 From a conversation with Eleanor Spector, Lockheed Martin, summer 2007.

27
17
Contract Type vs. Cost Performance
Measured the Cost Performance Index (CPI) at completion for various contract typesUsed data from 860 contracts from 165 programsControlled for program size, phase, service, and presence of a re-baselineTests of Schedule Performance Index (SPI) and Composite Performance Index (SCI) yielded similar results
We used the earned value data from 860 contracts covering 165 programs to see if we could find any relationship between contract type and performance. Performance is defined as the cost performance index (CPI) at contract completion.
Our expectation was that if the profit policy was relatively ineffective, fixed-price contracts would have stronger incentives for good performance. From Rogerson, we expect good contract performance with fixed-price contracts since the contractors’ profits are at risk.15 We might expect that cost-plus contracts would constitute a higher fraction of poor performing contracts for two reasons. First, the contractors’ profits are more certain regardless of outcome. Second, cost-plus contract vehicles tend to be used for development contracts, which have greater technical uncertainty than the production contracts for which FFP vehicles are most often used.
15 Rogerson, “An Economic Framework for Analyzing DoD Profit Policy,” op. sit.

28
18
In production no significant differences between contract types (FFP is slightly better)In development, CPAF is slightly better than non-CPAF contractsData do not show a correlation between contract type and performance
Contract Type vs. CPI: Results
We found no significant differences in CPI among contract types. While in production, FFP contracts had a slight improvement over other types, but the difference was not material. Similarly, we found CPAF contracts had an advantage in development, but again the difference was not material. In general then, there appears to be no strong correlation between contract types and CPI.

29
19
Others have studied incentive contractsRAND1,2: lower cost growth but question overall savingsIDA3: higher share to contractor reduces cost growthGAO4,5: Incentives work; awards have not
IDA examined cases of large aircraft development effortsAll incentive contracts: CPAF, CPI, FPI Programs: B-1A and B, F-15A, F/A-18A and E/F, F-22A, C-17A, and C-130 AMPContract cost growth based on estimates at completion in CCDR dataCompared contract cost growth with profit earned
Case Studies of Program Outcomes
- - - - -1Irving N. Fisher, “A Reappraisal of Incentive Contracting Experience,” RAND Corporation, Memorandum RM-5700-PR, July 19682John R Hiller., and Robert D. Tollison, “Incentive Versus Cost-Plus Contracts in Defense Procurement,” Journal of Industrial Economics, Vol. 26, No. 3, March 1978, pp. 239–2483Jack Cloos, Dennis D. Kimko, and Thomas P. Frazier, “Cost Sharing Arrangements on Incentive Contracts,” briefing, December 12, 2001.4GAO, Incentive Contracts, Examination of Fixed-Price Incentive Contracts, NSIAD-88-36BR, November, 19875GAO, Defense Acquisition: DoD has Paid Billions in Award and Incentive Fees Regardless of Outcomes, GAO-06-06, December, 2005
The effects of contract type on program outcomes have been explored in previous analyses. The 2005 Government Accountability Office (GAO) study (referenced in the slide) criticizes the implementation of award-fee contracts; they argue that even contracts with large overruns and otherwise poor performance have been paid most of their award fees. The implication of their critique is that the government is creating moral hazard by rewarding poor performance. They note that incentive contracts appeared to provide better contract outcomes. However; RAND’s 1968 study (referenced first in the slide) found that incentive contracts had lower cost growth but did not appear to cost less. The implication is that contracts are negotiated to a higher price, lowering the prospect of growth. IDA found that cost growth declined the higher the incentive share ratio. The Defense Department has directed agencies and the services move towards more incentive in lieu of award fee contracts.16
We explored this issue further by comparing cost performance and profits from CCDR data for large aircraft development contracts across different incentive contract
16 Shay Assad memorandum, op. sit.

30
types, including cost plus award fee (CPAF), cost plus incentive (CPI), and fixed price incentive (FPI). The sample included the B-1A and B-1B, F-15A, F/A-18A, F/A-18E/F, C-17A, and C-130 Aircraft Modernization Program (AMP). Generally, CCDRs are provided by the contractor at 6-month intervals starting from the beginning of the program. The reports not only include expenditures to date, but also estimates at completion (EACs). In our analyses, we treated the EAC reported in the initial CCDR as the baseline cost for the contract. The EAC in the last submission was considered the final cost. The ratio of the two was the measure of cost growth. Profit percentages were also taken from the CCDRs.
20
Incentive Contract Comparisons
0%
2%
4%
6%
8%
10%
12%
14%
16%
1.00 1.20 1.40 1.60 1.80 2.00 2.20 2.40
Contract Cost Growth
Prof
it, P
erce
nt o
f Cos
t
CPIFFPICPAF
Profits are generally lower when costs grow
This slide shows the relationship between cost growth and profits for the selected aircraft contracts. The chosen cases show a diversity of outcomes for programs with clear success at cost control (cost growth < 1.2) as well as those with less success. Not surprisingly, the FPI contracts show the clearest relationship between cost growth and profits. The CPAF cases are generally consistent with the case made by the GAO, although the worst offender in terms of cost growth did receive a smaller profit
31
percentage than the other CPAF contracts. The CPI cases are more diverse; one case with cost growth received no profit, and another a respectable profit. A likely explanation for this anomaly is that the high-cost-growth contract that received profit was subject to renegotiation due to changes in government requirements.
Although these cases do not constitute a statistically meaningful sample, they are suggestive about the types of contracts that provide the closest link between cost-performance and profit.
D. DOES POLICY PROVIDE ADEQUATE CONTRACTOR PROFIT?
3
Presentation PlanDoes practice follow policy?
What is the profit policy and its levers?Analysis of profit targetsAnalysis of actuals
Does policy influence contract performance?Contractor behaviorContract outcomes
Does policy provide adequate contractor profit?Defense contracting business modelIntegrating the policy levers with cash flow modelingIndustry analysis
Synthesis of findings and implications

32
22
How To Analyze the Industry
Profit Margin = Profit/Sales: the fraction of sales that goes to creditors, IRS, ownersFree Cash Flow = After-tax profit – net CAPEX - ∆working capital: cash available to creditors and owners after adjusting for investing in ongoing and future business projectsExpect high profit margins from businesses that must fund all phases of a product life cycle (cars, drugs, software)Cash flow compares across industries even where customers pay costs up front (e.g. Defense)Free cash flow1 is the best measure of intrinsic value
Who Pays for the Major Elements of the Product Cycle Expense
Ford
Customer
R&D/SDD
Ford
Cust./Lock.
Working Capital
Unit ProfitToolingFacilities & Buildings
Pre Program/SDDProduct
CustomerFordFordFordEscape
CustomerCustomerLockheedCustomerJSF
R&D CAPEX R&D Financing Profit Margin
- - - - -1Discounted at the appropriate cost of capital
The Defense Department must ensure that the industrial base is capable of meeting defense requirements. Consequently, profit policy must consider the financial health of the firms in the industrial base. This section examines the business model of the largest of these firms.
The defense industry has a unique place among its corporate peers in other industries. It deals with high technology hardware and software, manufactures equipment and products such as aircraft, and provides services. It typically has long product cycles and does not have many retail customers. It can therefore be compared to capital goods manufacturers such as Caterpillar, automotive manufacturers such as Ford, or information technology suppliers such as IBM.
Let us compare the Joint Strike Fighter (JSF) to the Ford Escape. Both the JSF and the Escape were conceived and developed during long pre-development and system development and demonstration (SDD) programs. Although there are many technical differences, the key difference is financial: a commercial company must spend its own capital to develop products while government contractors usually receive substantial

33
revenue for both pre-SDD and SDD. Commercial companies must either raise capital through public or private markets or use retained earnings.
During product development, commercial companies must invest in their production tooling and facilities. The government typically buys unique tooling for defense production up front. The government commits to paying for unique facilities over the course of production, such that if the contract is terminated the contractor can recoup its costs. This last point does not help cash flow, but it reduces the risk of an investment.
Once production is started, most commercial companies must fund their working capital either internally or through the capital markets, while government contractors can receive progress payments. For a new product, an automotive company may not receive a single payment from a customer for many years after the product is first conceived. A defense contractor receives regular payments as the work, both development and production, is performed.
The net result is that the automobile company needs a relatively high margin on most of its products to pay a reasonable rate of return on its investment. Since the defense contractor has much less of its own money invested, it can get a much lower margin and still have a high return. The best way to value the two products equivalently is by estimating net present value (NPV) of the cash flows over their lifetime. Using this method we see how low margins early in the life of a program can have as much or more value than higher margins later.
In the analysis that follows, we examine the industry profit margin and free cash flow returns on invested capital. Profit margin is defined as the operating profit or earnings before interest and tax (EBIT) divided by revenue. Free cash flow is defined as cash flow less capital spending less the change in non-cash working capital from the prior year (non-cash working capital is accounts receivable less accounts payable). Specifically we look at unlevered free cash flow that is based on EBIT rather than net income. Unlevered free cash flow to the firm (FCFF) is cash available to bond holders and equity owners. FCFF return on invested capital (ROIC) is the FCFF divided by the average of the present and prior years’ invested capital or total liabilities plus book equity less non-debt liabilities (e.g., accounts payable). This ratio can be compared to the firm’s weighted average cost of capital (WACC). WACC is the cost of debt plus the cost of equity both weighted by the market values debt and equity, respectively. The cost of equity is estimated using the capital asset pricing model (CAPM). In the CAPM, the cost of equity equals the risk-free interest rate plus the industry beta times the equity market risk

34
premium. The risk-free rate is an interest rate that is free from credit default or other risks. Typically in the United States, we can use a Treasury bill or note with a maturity similar to the investment horizon. The industry beta is the average beta for the companies in the defense industry, where beta is the slope of the line when the monthly returns of the company or industry index are regressed against the monthly returns of the market (e.g., the S&P 500). Alternatively, beta is the covariance between the company and the market returns divided by the variance of the market returns. The market risk premium is the difference between the market rate of return and the risk-free rate. The market risk premium can be estimated from historical returns or from the rate implied in the price of the market index.
23
Modeling Policy Effect on Cash Flow
Program Valuation1
FY Cost Series
Debt RatioCost of Debt Marginal Tax Rate
Risk-Free Rate
Cost of Equity
Risk Premium Industry Beta
WACC
Technical Risk
CPFF/CPAF …. FFP/ MYP - Contract Choice (FAR 16.1)
Margin – (p = f(NBV, n, α, risk)) Payments (α) FCOM ( = f(NBV, Treasury Rate))
Assumptions/Rules
Policy Levers
Free cash flow valuation model
- - - - -1 The stated goal of the profit policy is to provide sufficient return to contractors to attract capital – i.e. the PV of contract free cash flow discounted at the weighted average cost of capital should be positive. (Armed Services Procurement Regulation (ASPR), 1947)
Contract Risk
Simulation Model
To examine the effect of profit policy on profitability, we built a model that has the program cost projections and the profit policy levers as input and NPV as output. The model starts with program cost projections, layers on the profit and contract financing policy, estimates the levered WACC as the discount rate, and finally calculates the NPV of the contract. Specific model input includes profit policy levers (including contract type); contract cost project by fiscal year; WACC input; and various business rules such
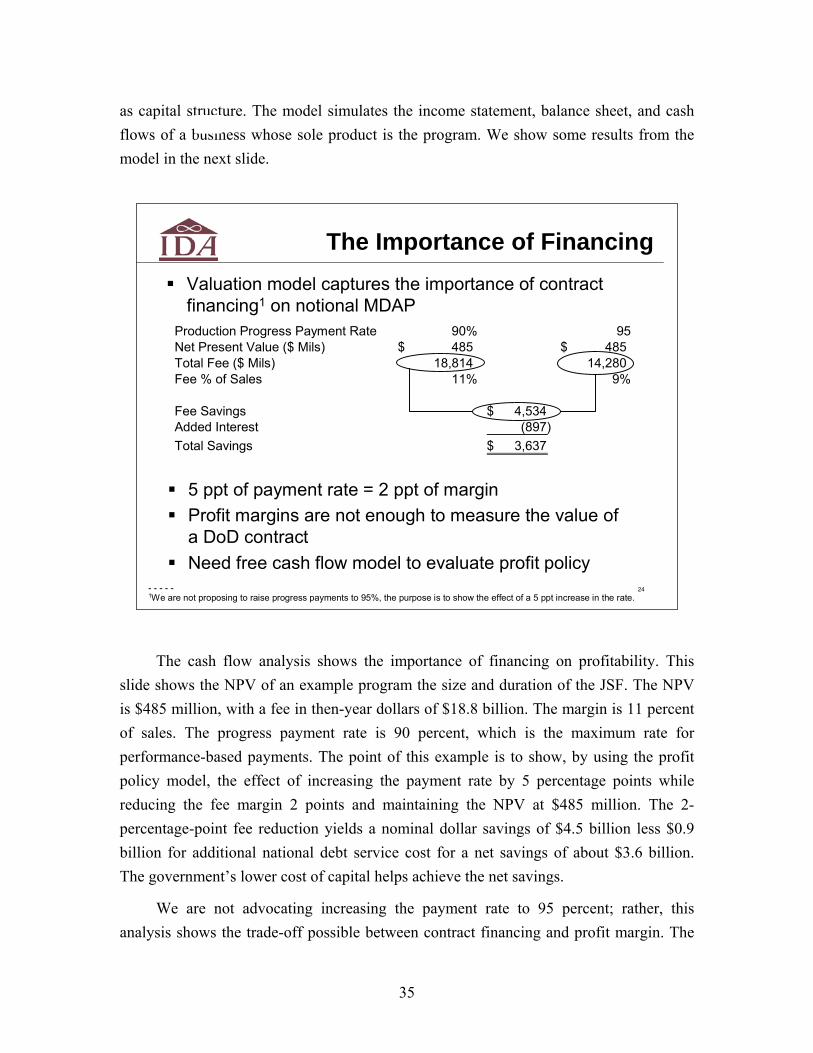
35
as capital structure. The model simulates the income statement, balance sheet, and cash flows of a business whose sole product is the program. We show some results from the model in the next slide.
24
The Importance of Financing
Production Progress Payment Rate 90% 95Net Present Value ($ Mils) 485$ 485$ Total Fee ($ Mils) 18,814 14,280 Fee % of Sales 11% 9%
Fee Savings 4,534$ Added Interest (897) Total Savings 3,637$
Valuation model captures the importance of contract financing1 on notional MDAP
5 ppt of payment rate = 2 ppt of marginProfit margins are not enough to measure the value of a DoD contractNeed free cash flow model to evaluate profit policy
- - - - -1We are not proposing to raise progress payments to 95%, the purpose is to show the effect of a 5 ppt increase in the rate.
The cash flow analysis shows the importance of financing on profitability. This slide shows the NPV of an example program the size and duration of the JSF. The NPV is $485 million, with a fee in then-year dollars of $18.8 billion. The margin is 11 percent of sales. The progress payment rate is 90 percent, which is the maximum rate for performance-based payments. The point of this example is to show, by using the profit policy model, the effect of increasing the payment rate by 5 percentage points while reducing the fee margin 2 points and maintaining the NPV at $485 million. The 2-percentage-point fee reduction yields a nominal dollar savings of $4.5 billion less $0.9 billion for additional national debt service cost for a net savings of about $3.6 billion. The government’s lower cost of capital helps achieve the net savings.
We are not advocating increasing the payment rate to 95 percent; rather, this analysis shows the trade-off possible between contract financing and profit margin. The

36
effect is far less dramatic on smaller programs. In another notional example, $1.2 billion over 6 years, with a 12.4-percent profit margin and a progress payment rate of 80 percent has an NPV of $10 million. Keeping the NPV at $10 million, we can raise the payment rate 5 percentage points to 85 percent and lower the profit rate by 3 percentage points to 9.4 percent. The gross savings from fee reduction, however, is $59 million.
25
Discussions: Industry1
Lowest profit margins of its industry peersImproved cash flow is from performance payments and investment efficienciesCash flow return2 lags—industry compares unfavorably on a growth and value basisThe trend is bad—R&D programs increasing share of DoDoutlaysReturns on R&D lag production: 14% CPAF target equals to 5-6% return-on-salesProfit policy appears to be less important to services—more competitiveContractor discussions reflected AIA comments to DPAP
- - - - -1Boeing, Raytheon, Northrop, Lockheed, AIA, and CACI2AIA uses a proprietary CFROIC metric from CS Holt
To gain an industry perspective on profit policy, we conducted interviews with representatives from Boeing, Raytheon, Northrop Grumman, Lockheed, and CACI. We also obtained a copy of an Aerospace Industries Association (AIA) briefing that described their perspective on the financial status of the defense industrial base. The AIA briefing was a basis for its submission in response to the Defense Procurement and Acquisition Policy office’s request for comments during the summer of 2007.17
The industry is not generally satisfied with the use of the weighted guidelines. Most contractors claim the contracting officer wants to negotiate the profit to a specific
17 Search for Docket I.D. DARS-2007-0044 and DARS-2007-0046 at www.regulations.gov

37
aggregate level, say 12 percent, without building it up using the guidelines. Our analysis of the Form 1547 database did not find conclusive evidence of this behavior. Representatives from one firm stated that the weighted guidelines would provide sufficient profits, but the contracting officers do not use the tool. Other contractors did not share this opinion; rather, they did not see that the guidelines provided sufficient return for development contracts. Representatives from another firm did not feel that the prospect of a production contract remained sufficient incentive to perform on a low-return development contract because sole-source procurement contracts are becoming less frequent.
All contractors saw that development needed to have good returns on its own. Several commented that low-return contracts with high-risk technologies that might be important to the government were hard to staff with their best talent. Their rationale is that top employees do not want to work on contracts that have low returns for the company; they want to work on the high-profile, high-profit programs as is the case in the commercial world. CPAF contracts are preferred by all of the contractors for development work because of the higher potential returns.
The AIA report generally portrays the defense industry as lagging behind its commercial peers both in profit margin and in cash flow ROIC. As we show later, we agree the defense industrial base lags behind its commercial peers on profit margin, but we believe it is among the leaders of cash generators and shareholder value.
Service contracts are an emerging area of increasing importance that the weighted guidelines do not address well. The major prime contractors are gaining a greater share of the defense services sector. Northrop Grumman has developed a separate corporate entity so it can target new business more competitively. This entity’s business unit has lower overhead costs than the other sectors of the company. Service contracts have a high degree of inter-contract risk for the incumbent provider. The re-compete cost and competition are high relative to the other areas of acquisition in the Defense Department. One contractor that primarily provides services saw that while the weighted guidelines did not sufficiently address services, the industry competition probably makes the guidelines irrelevant. The issue for service providers is to effectively manage the wage they pay employees and the rate paid by the government. The contractor has a risk that they will need to bring in higher-priced labor than originally expected to satisfy contract requirements.
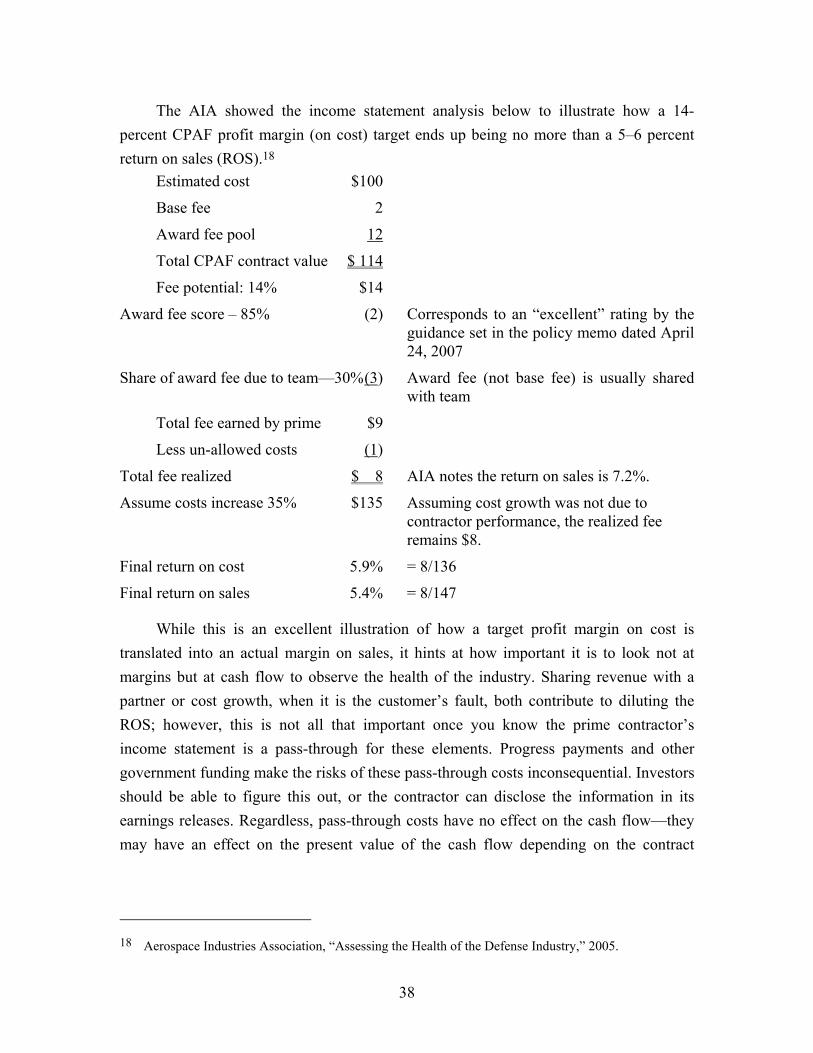
38
The AIA showed the income statement analysis below to illustrate how a 14-percent CPAF profit margin (on cost) target ends up being no more than a 5–6 percent return on sales (ROS).18
Estimated cost $100
Base fee 2
Award fee pool 12
Total CPAF contract value $ 114
Fee potential: 14% $14
Award fee score – 85% (2) Corresponds to an “excellent” rating by the guidance set in the policy memo dated April 24, 2007
Share of award fee due to team—30% (3) Award fee (not base fee) is usually shared with team
Total fee earned by prime $9
Less un-allowed costs (1)
Total fee realized $ 8 AIA notes the return on sales is 7.2%.
Assume costs increase 35% $135 Assuming cost growth was not due to contractor performance, the realized fee remains $8.
Final return on cost 5.9% = 8/136
Final return on sales 5.4% = 8/147
While this is an excellent illustration of how a target profit margin on cost is translated into an actual margin on sales, it hints at how important it is to look not at margins but at cash flow to observe the health of the industry. Sharing revenue with a partner or cost growth, when it is the customer’s fault, both contribute to diluting the ROS; however, this is not all that important once you know the prime contractor’s income statement is a pass-through for these elements. Progress payments and other government funding make the risks of these pass-through costs inconsequential. Investors should be able to figure this out, or the contractor can disclose the information in its earnings releases. Regardless, pass-through costs have no effect on the cash flow—they may have an effect on the present value of the cash flow depending on the contract
18 Aerospace Industries Association, “Assessing the Health of the Defense Industry,” 2005.

39
finance policy. Progress payments should offset any increases to working capital precipitated by the pass-throughs.
The industry focuses a great deal of attention on the low margins for defense companies—and they are lower than many industries. But as outlined in slide 22, the defense industrial base has a unique relationship with its main customers that involves a balance of contract financing and profit margins. Certainly profit margins are important, but consideration of free cash flow can make a single digit profit margin quite reasonable. Consider again the $1.2 billion contract discussed in the annotations of the previous slide. A cost-plus contract, with full reimbursement vouchers, could yield positive NPV even with profit on cost margin targets as low as 2–3 percent. Of course, this is a result from a model, but the financial relationships are intact—with the right contract financing, low margins can yield positive NPV—and since the discount rate here is the WACC, positive NPV projects cover their cost of capital and therefore contribute positively to shareholder returns.

40
26
Discussions: Wall Street AnalystsWe interviewed:
Heidi Wood, Morgan StanleyJoe Campbell, Lehman BrothersPierre Chao (formerly CSFB, now CSIS) - Contributed to industry AIA profitability analysis
They said:The industry is a strong cash generator, but must look at full cycleThe industry appears regulatedIt needs to attract the same talent as AppleNot positioned to respond nimbly in the GWOTPerformance payments have led to “negative working capital”Returning to progress payments would save billions without reducing budget authority
Also:Byron Callan (formerly Prudential Securities now Perella Weinberg) –helped develop industry analysis as consultantJack Gansler – IDA briefed DSB with preliminary industry analysis
To gain additional perspective on the financial health of the firms in the defense industrial base, we contacted several sell-side analysts from the brokers, as well as Pierre Chao of the Center for Strategic and International Studies (CSIS)19 All but one analyst agreed that the defense industry is a strong generator of cash. One analyst termed the industry a traditional favorite among value investors who prefer cash flow ROIC as a valuation metric. Lately the analyst sees that growth investors, like the ones who helped drive up the dot-coms, have invested in the industry effectively pushing the price/earnings (P/E) ratio multiples to higher levels just after the dot-com crash and 9/11. See Figure 2. We see that the defense industry generally exceeds the P/E ratio of the S&P 500 except during the technology boom period in the late 1990s when value stocks were not favored. The industrial base P/E ratio has returned to normal levels in recent years as its earnings have risen and high expectations for future growth have diminished. However, growth investors are still looking for the industry to continue growing (i.e., growth in earnings per share, EPS). As the Defense Department’s budget growth has
19 Formerly a sell-side analyst with Credit Suisse First Boston (CSFB).

41
slowed, the industrial base has increasingly had to return cash to investors as large dividends or stock repurchase programs (like many other commercial companies).
10
20
30
40
50
60
70
1989 1991 1993 1995 1997 1999 2001 2003 2005 2007
P/E
Rat
io
S&P 500 Defense CompaniesS&P 500 index
Source: S&P 500 defense industrial base index constructed with Compustat database; S&P 500 data from Robert J.
Shiller (online database: http://www.econ.yale.edu/~shiller/data.htm).
Figure 2. S&P 500 Defense Industrial Base Average Quarterly Price Earnings Ratio
Another analyst commented, before the credit crunch in the summer of 2007, that the lack of growth and the abundance of cash in the industry could reintroduce the risk of dramatic merger and acquisition deals. This risk would be driven by the same factors (i.e., post cold-war defense consolidation) as in the 1990s, though with the added advantages (to the buyers) of the leveraged buy-out (LBO). The LBO makes money for investors by using the debt capacity and excess cash of the target company for the acquisition and to pay the new owners large up-front special dividends and management fees. Defense companies have substantial excess cash and plenty of debt capacity. Fortunately, from an industrial policy workload perspective, the credit crunch of 2007 has dampened the market for the structured financial products necessary for large buy-outs.
The markets will eventually recover from the credit debacle of 2007 and the same investment principles will emerge once again to drive deals. Defense companies appear to fit the criteria for LBOs, high cash generators, once their prices become affordable. This is a risk that will emerge if and when the DoD budget stops growing at the same rates of recent history.

42
One analyst commented that the industry appeared to be in trouble because it did not spend enough on research and development (R&D) and did not have the right business proposition to attract the best and brightest talent. Like several defense companies, the analyst felt the low profit margins could not attract top talent. A recent study of the space industrial base reveals a dearth of certain levels of talent.20 However, we have not been able to get enough clarity into this issue to understand if it really is related to the profit policy. We have not seen any direct evidence that the profit policy is a barrier to attracting good talent to defense companies.
Finally, one analyst commented on the growing cash balances of prime defense contractors. This analyst linked the growing balances and negative working capital to lower oversight of the payments process since the 1980s. We speculate that some of this effect is linked to the growing use of performance-based payments since they are not directly linked to expenses. Figure 3 gives some indication on the levels of these cash balances (i.e., unearned revenue liability accounts sometimes called “customer advances in excess of costs”). However, contractors attribute these accounts to a mixture of payments, particularly international payments that require a substantial deposit.21
0
1,000
2,000
3,000
4,000
5,000
6,000
200620052004200320022001200019991998199719961995199419931992
Une
arne
d R
even
ue $
(000
,000
)
Northrop
Lockheed
Figure 3. Customer Advances in Excess of Incurred Costs
20 John l. Thurman, “National Security Space Industrial Base Study,” 39th DoD Cost Analysis
Symposium, February 2006.
21 Lockheed requires a minimum downpayment of 20 percent on foreign sales, including Foreign Military Sales; however, they did acknowledge that some of the cash accumulated in the account is due to performance-based payments (discussion with Jerry Kircher, VP Investor Relations, November 2007).

43
27
Defense vs. Peer Industries
By this measure defense looks bad
Sector Operating Margins 1990-2006
0%
5%
10%
15%
20%
25%
30%
1989 1991 1993 1995 1997 1999 2001 2003 2005
Ope
ratin
g M
argi
n (E
BIT/
Sale
s)
Pharma/Bio DefenseSP500 Capital GoodsTech HW SW/ServicesUtilities
By this measure, defense business looks unattractive…but defense is a cash-flow business…
Now we revisit the financial performance of the defense industrial base. The above slide shows the operating margin, or EBIT/revenues, for the defense industry, several of its peer industries, and the broader industry segments to which it belongs. We see that aside from 1993 and the sharp slow down after 2000, the defense industry has the lowest profit margins of the group. However, as we discussed in slide 22, profit margin is only part of the valuation equation. Not until we look at cash flow do we see the true value of the defense industry.

44
28
Defense vs. Peer Industries
By this measure, defense business is good—and it is right
Free Cash Flow ROIC 1990 to 2006
-25%
-20%
-15%
-10%
-5%
0%
5%
10%
15%
1990 1992 1994 1996 1998 2000 2002 2004 2006
Free
Cas
h Fl
ow R
OIC
Capital Goods DefensePharma/Bio SP500
SW/Services Tech HWUtilities
The financial structure of the defense prime contractors is leaner than other industrial firms due to the unique relationship between defense firms and the Defense Department. With prime contractors the Defense Department provides significant project financing and directly funds research, development, and some capital expense. Consequently prime contractors require considerably less of their own capital to generate revenue and subsequently free cash flow than commercial industrial firms. This distinction is seen in the higher free cash flow return on invested capital when comparing the top defense firms to other industrial firms.
The above slide shows the unlevered free cash flow ROIC for the defense industry, select peer industries, and the broader industry segments to which it belongs (i.e., the capital goods and S&P 500 sectors). Since the post-Gulf War (and post-cold war) recession in the early 1990s, the defense industry has been among the free cash flow ROIC leaders in the group. Note that even during the dot-com boom, while the defense sector was out of favor (along with other value stocks), the sector had strong returns.
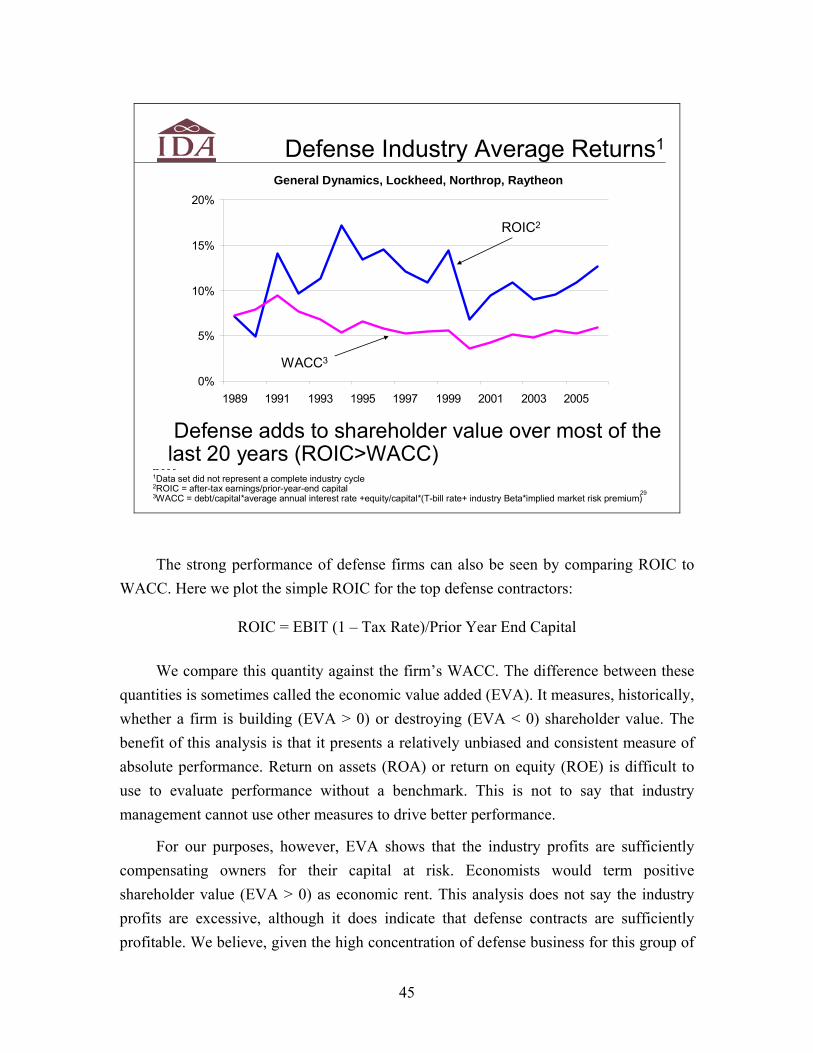
45
29
Defense Industry Average Returns1
Defense adds to shareholder value over most of the last 20 years (ROIC>WACC)
0%
5%
10%
15%
20%
1989 1991 1993 1995 1997 1999 2001 2003 2005
General Dynamics, Lockheed, Northrop, Raytheon
ROIC2
WACC3
-- - - -1Data set did not represent a complete industry cycle2ROIC = after-tax earnings/prior-year-end capital3WACC = debt/capital*average annual interest rate +equity/capital*(T-bill rate+ industry Beta*implied market risk premium)
The strong performance of defense firms can also be seen by comparing ROIC to WACC. Here we plot the simple ROIC for the top defense contractors:
ROIC = EBIT (1 – Tax Rate)/Prior Year End Capital
We compare this quantity against the firm’s WACC. The difference between these quantities is sometimes called the economic value added (EVA). It measures, historically, whether a firm is building (EVA > 0) or destroying (EVA < 0) shareholder value. The benefit of this analysis is that it presents a relatively unbiased and consistent measure of absolute performance. Return on assets (ROA) or return on equity (ROE) is difficult to use to evaluate performance without a benchmark. This is not to say that industry management cannot use other measures to drive better performance.
For our purposes, however, EVA shows that the industry profits are sufficiently compensating owners for their capital at risk. Economists would term positive shareholder value (EVA > 0) as economic rent. This analysis does not say the industry profits are excessive, although it does indicate that defense contracts are sufficiently profitable. We believe, given the high concentration of defense business for this group of
46
companies, that if the profit policy did not adequately compensate contractors, firms would not yield positive shareholder value. We cannot readily discern from this analysis if the main value driver is the margin, contract financing, or the overall acquisition strategy whereby the government provides so much of the product investment and R&D.
E. SYNTHESIS OF FINDINGS AND IMPLICATIONS
3
Presentation PlanDoes practice follow policy?
What is the profit policy and its levers?Analysis of profit targetsAnalysis of actuals
Does policy influence contract performance?Contractor behaviorContract outcomes
Does policy provide adequate contractor profit?Defense contracting business modelIntegrating the policy levers with cash flow modelingIndustry analysis
Synthesis of findings and implications
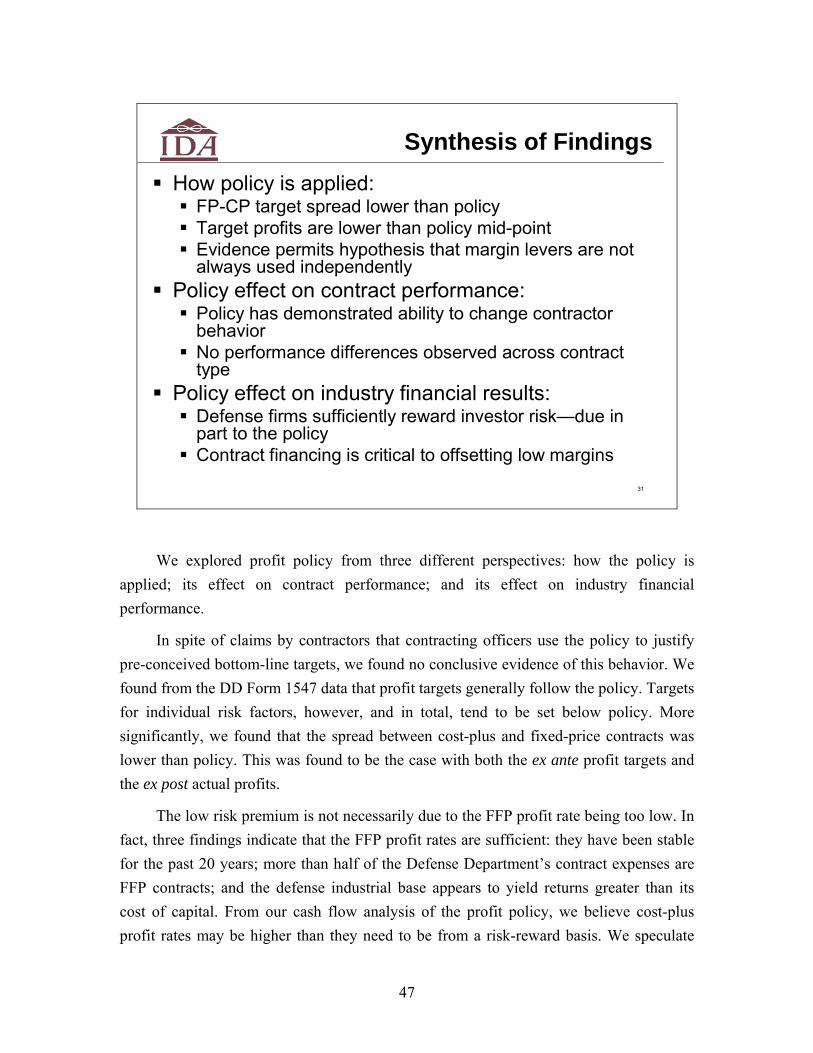
47
31
Synthesis of FindingsHow policy is applied:
FP-CP target spread lower than policyTarget profits are lower than policy mid-pointEvidence permits hypothesis that margin levers are not always used independently
Policy effect on contract performance:Policy has demonstrated ability to change contractor behaviorNo performance differences observed across contract type
Policy effect on industry financial results:Defense firms sufficiently reward investor risk—due in part to the policyContract financing is critical to offsetting low margins
We explored profit policy from three different perspectives: how the policy is applied; its effect on contract performance; and its effect on industry financial performance.
In spite of claims by contractors that contracting officers use the policy to justify pre-conceived bottom-line targets, we found no conclusive evidence of this behavior. We found from the DD Form 1547 data that profit targets generally follow the policy. Targets for individual risk factors, however, and in total, tend to be set below policy. More significantly, we found that the spread between cost-plus and fixed-price contracts was lower than policy. This was found to be the case with both the ex ante profit targets and the ex post actual profits.
The low risk premium is not necessarily due to the FFP profit rate being too low. In fact, three findings indicate that the FFP profit rates are sufficient: they have been stable for the past 20 years; more than half of the Defense Department’s contract expenses are FFP contracts; and the defense industrial base appears to yield returns greater than its cost of capital. From our cash flow analysis of the profit policy, we believe cost-plus profit rates may be higher than they need to be from a risk-reward basis. We speculate

48
that one reason profit targets deviate from policy more for FFP than CPFF contracts is the higher risk of adverse selection with the former. Experienced contracting officers learn to negotiate away risk reserves that will lurk in FFP proposals—if they cannot strike out the reserves directly they can simply give the profit target a “haircut.” Put another way, if the contracting officer knows the contractor’s cost estimate is inflated, the officer might opt to simply adjust the profit target downward. This is more likely to happen with FFP than CPFF contracts.
We found some evidence that the profit levers are not used independently. This was not necessarily inconsistent with the policy, but it suggests the battery of levers overlaps. It is possible the policy goals could be affected with fewer levers. Such a dramatic change to the policy should be studied more since it would require a major revision of the regulation.
We found evidence that profit policy has modified contractor behavior in the past. The historical changes in the capital labor ratio for aircraft production have been correlated to the facilities capital markup policy. Contractor financial reports provide some evidence that capital spending (Figure 1) has declined dramatically. Two reinforcing factors could be at work: a direct scale-down in response to lower DoD demand, and lower spending in expectation of the facilities capital markup rule change.
We found through selected case study analysis that incentive and award contracts appear to provide an incentive toward less cost growth. This finding is consistent with several other prior studies.22. However, our analysis of earned value data revealed little cost performance difference between contract types. This result indicates changing contract types may not improve contract performance; however, the earned value data analysis should be expanded to look at other potential drivers. One issue could be the low fraction of contracts that uses incentive fees relative to fixed-price and cost-plus contracts. We believe there are compelling reasons to look to incentive fees for better contract outcomes, but we cannot deny the long-term trend away from their usage.
Finally, we found that financially, the defense industrial base has performed very well for most of the past 20 years. We used Lockheed, Raytheon, Northrop Grumman,
22 Irving N. Fisher, “A Reappraisal of Incentive Contracting Experience,” RAND Corporation,
Memorandum RM-5700-PR, July 1968; John R. Hiller and Robert D. Tollison, “Incentive Versus Cost-Plus Contracts in Defense Procurement,” Journal of Industrial Economics, Vol. 26, No. 3, March 1978, pp. 239–248; and Jack Cloos, Dennis D. Kimko, and Thomas P. Frazier, “Cost Sharing Arrangements on Incentive Contracts,” briefing, December 12, 2001.

49
and General Dynamics as a proxy for the defense industrial base since they derive so much of their revenue from U.S. government contracting. There is an implicit agreement between the industrial base and the government that the beneficial trade-off against low margins is generous product and working capital financing. We also saw the effect of financing on profit with our valuation model where we could estimate the net present value effects of contract financing, such as progress payments, and specific contract margin policies, such as the capital markup. This type of modeling is an essential component of understanding any proposed or current policy.
We found some evidence that contractors are receiving generous advance billings that we believe are a result of the trend toward performance-based payments. Given the government’s comparative advantage with its low cost of capital, we believe the government ultimately benefits by paying up front with less total fee. More analysis is needed to determine whether the trade-off between profit margin and contract finance policy could be optimized toward better contractor performance.

50
32
ImplicationsPresent policy appears to be a network of overlapping leversFindings suggest two changes to profit policy:
Widen risk premium—not necessarily by raising FP ratesBetter alignment between policy mid-points and actual targets –policy may be too high
Policy changes should be stress-tested with rigorous cash flow and risk analysisTrends vs. cycles:
Strong cash generation/accumulation as cycle peaks (cyclic)Shift from product acquisition to development (trend)Diversified industrial base—less risk on one contract (trend)
Industrial base is doing well at cycle peak, but:Industry sensitivity to profit levers influenced by emerging trendsAsset intensive industry still sensitive to revenue volatility
Good time to strengthen link between outcome and reward—but mind the trends and cycles
We see from our factor analysis that the profit policy appears to have overlapping levers. The analysis of DD Form 1547 data appears to show that contracts generally follow the policy; however, it is clear that the risk premium spread between the highest and lowest risk contracts is lower than guidelines suggest.
Overlapping levers imply, on a practical level, that the guidelines could be simplified. A separate cost-benefit analysis should be performed to compare the cost of developing a new set of policy guidelines to the uncertain benefit of a simplified policy. Since it appears the policy levers are mostly used independently, having extra levers might offer flexibility when it is needed; however, contractors generally believe the guidelines are used after contracts and target profits have been negotiated.
From our analysis of contract profit margins, we found the implied risk premium to be lower than expected, particularly with the average ex post margin where we did not find sufficient spread between the CPFF and FFP contracts to account for the difference in contractor risk. We believe FFP contracts provide sufficient risk-reward benefits for two reasons: on average the profit policy provides the industry with profits that exceed their cost of capital; and about 60 percent of defense acquisitions use fixed-price
51
contracts. We suspect that if there is any slack in the risk-reward continuum it is at the CPFF end. This is reinforced by the profit model discussed on slide 23. Since cost-plus contracts are fully reimbursed, we find they can yield positive NPV even with target margins well below the 7-percent average in the DD Form 1547 database. Without further study we cannot infer margins should simply be changed; at this point we would prefer to explore a mix of changes to the margin and financing polices. For example, would the application of performance-based payments to cost-reimbursed contracts provide a more tolerable incentive to contractors than trying to force incentive fees or FFP contracts on development programs?
We propose that changes to the policy incorporate ease of implementation and flexibility against in-contract changes in the economy or threat environment. We also propose that the set of policy levers be tested using discounted cash flow. Our analysis indicates a simpler policy may be at least as effective as the present one. A simpler policy might allow contracts to better reflect the distribution of risks. For example, if a contract contains EPA clauses for materials, perhaps they should have a lower profit margin than other elements of cost where the contractor bears higher performance risk. We do not believe the government should model the cash flow of each contract; however, a cash flow valuation model can allow policy makers to better understand the relative effects of the profit levers.
The government is in a good position to investigate adjustments to the profit and financing policies that may drive better performance for three reasons. First, the defense industrial base is financially healthy. Second, our cash flow analysis shows that the profit system delivers strong cash flow value to the industrial base shareholders. Third, the industry emerged from the post-cold war consolidation wave far more concentrated (fewer companies) with greater product diversification. Product diversity in this case provides financial diversification. Lockheed, for example, presently has about 4,000 contracts, so the incremental risk of losing any one contract is far lower than when it was mostly an airplane manufacturer. From its position of strength and stability, the industrial base should be capable of accommodating policy changes aimed at strengthening the link between profits and contract outcomes.

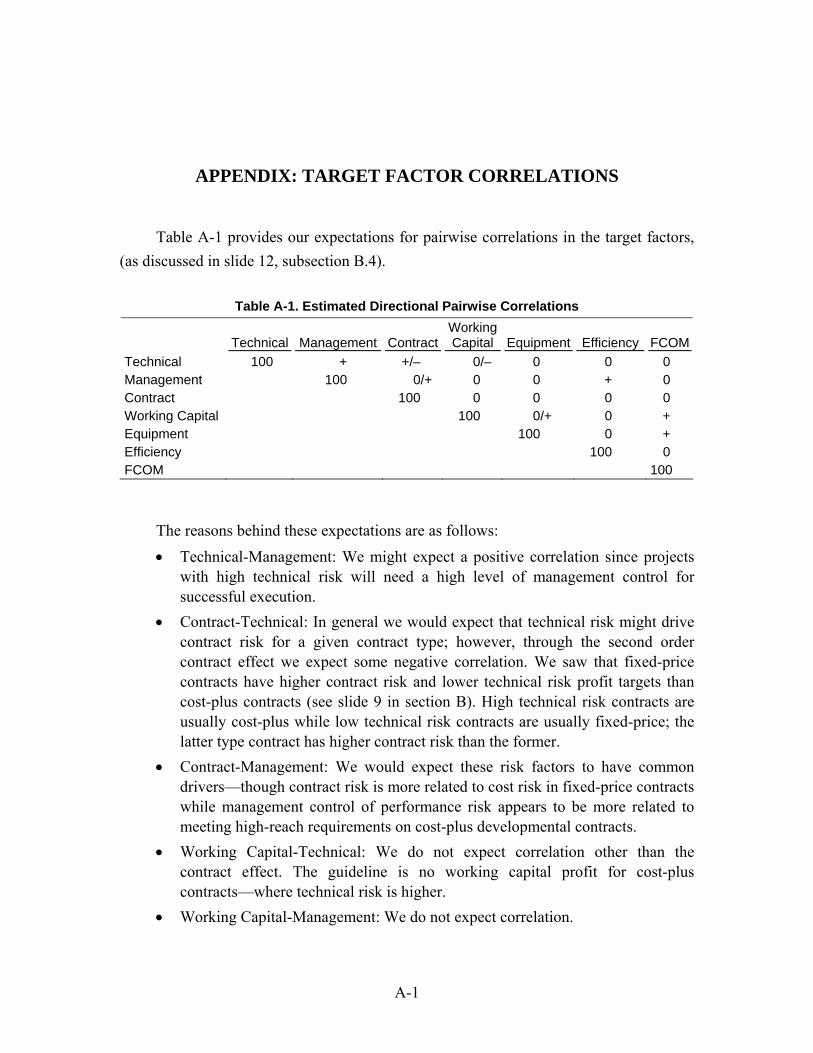
A-1
APPENDIX: TARGET FACTOR CORRELATIONS
Table A-1 provides our expectations for pairwise correlations in the target factors, (as discussed in slide 12, subsection B.4).
Table A-1. Estimated Directional Pairwise Correlations
Technical Management ContractWorking Capital Equipment Efficiency FCOM
Technical 100 + +/– 0/– 0 0 0 Management 100 0/+ 0 0 + 0 Contract 100 0 0 0 0 Working Capital 100 0/+ 0 + Equipment 100 0 + Efficiency 100 0 FCOM 100
The reasons behind these expectations are as follows: • Technical-Management: We might expect a positive correlation since projects
with high technical risk will need a high level of management control for successful execution.
• Contract-Technical: In general we would expect that technical risk might drive contract risk for a given contract type; however, through the second order contract effect we expect some negative correlation. We saw that fixed-price contracts have higher contract risk and lower technical risk profit targets than cost-plus contracts (see slide 9 in section B). High technical risk contracts are usually cost-plus while low technical risk contracts are usually fixed-price; the latter type contract has higher contract risk than the former.
• Contract-Management: We would expect these risk factors to have common drivers—though contract risk is more related to cost risk in fixed-price contracts while management control of performance risk appears to be more related to meeting high-reach requirements on cost-plus developmental contracts.
• Working Capital-Technical: We do not expect correlation other than the contract effect. The guideline is no working capital profit for cost-plus contracts—where technical risk is higher.
• Working Capital-Management: We do not expect correlation.

A-2
• Working Capital-Contract: Based on the guidelines and the contract effect, we expect some positive correlation.
• Equipment-Working Capital: We do not expect correlation other than the contract effect—working capital profit is paid mostly on fixed-price contracts with more emphasis on production where higher fixed assets are common.
• Equipment-Technical: We do not expect correlation other than from the contract effect.
• Equipment-Management: We do not expect correlation. • Equipment-Contract: We do not expect correlation. • Efficiency-Working Capital: We do not expect correlation. • Efficiency-Technical: We do not expect correlation. • Efficiency-Management: We expect some positive correlation since the skills
needed to manage performance risk should contribute to cost efficiencies. • Efficiency-Contract: We expect some positive correlation since the factors that
drive contract risk should drive the need to achieve cost efficiencies. • Efficiency-Equipment: We expect some positive correlation since capital assets
can be used to gain efficiencies. • FCOM-Technical: We do not expect correlation. • FCOM-Management: We do not expect correlation. • FCOM-Contract: We do not expect correlation. • FCOM-Working Capital: We expect positive correlation since both levers use
the Treasury rate in their calculation. • FCOM-Equipment: We expect positive correlation since both levers use the net
book value of assets in their calculation. • FCOM-Efficiency: We expect some positive correlation since capital assets can
be used to gain efficiencies.
Does the estimated correlation matrix agree with expectations? See Table A-2.
Table A-2. Estimated Directional Pairwise Correlations versus Expectation
Technical Management ContractWorking Capital Equipment Efficiency FCOM
Technical 100 Yes Yes Yes No No* No* Management 100 No* No* No No No* Contract 100 Yes No* No* No* Working Capital 100 Yes No* No Equipment 100 Yes Yes Efficiency 100 Yes FCOM 100 * Despite our expectation, small correlations exist for these pairs.

A-3
For the most part, the correlation matrix agrees with our expectation (i.e., cells in the above table with “Yes”). For cells that contain a “No” with an asterisk, we did not expect but found small (|ρ| ≤ 0.1) correlations.1 We cannot easily explain why these correlations are observed, but we do not see them signifying any material systemic behavior.
We identify the cases that merit discussion with a simple “No.” We did not expect but found enough correlation (|ρ| ≥ 0.1) to merit concern with equipment with technical, equipment with management, management with efficiency, and working capital with FCOM.
For management performance risk and efficiency, while the sign is as expected, we were surprised there is not a stronger correlation since efficiencies should only be possible through management control. We suspect the lack of contracts with any efficiency factor profit target could play into the unexpected small correlations between it and the other levers.
We expected a stronger positive correlation between working capital with FCOM since they are both dependent on the Treasury rate. While the sign of the weak correlation is as expected, we would expect the common factor for imputed profit targets to have a stronger effect. However, we do not see a conflict since the correlation between working capital and equipment is consistent in sign with the correlation between working capital and FCOM.
Finally, the contract effect may explain the case of equipment and management and technical performance risk where we expected no correlation but estimated a negative coefficient. The equipment factor would most likely be important in production contracts requiring high fixed asset levels, while the performance risk factors appear to be more dominant in cost-plus contracts.
While there appear to be several cases of unexpected correlation, pairwise analysis of these coefficients does not yield any strong indication of offsetting. Furthermore, the unexpected, but small, positive correlations weigh against significant systemic offsetting. Anecdotally, contractors claimed that this practice is common by contracting officers and yet we find no strong evidence that this is true from the data. We suspect that most of the correlations coefficients, while statistically significant, are not materially significant and can be ignored.
1 ρ| represents the absolute value of the correlation between two factors.

A-4
We see as well from the correlation estimates that the large correlations are mostly consistent with the policy (e.g., equipment with FCOM). We also see there does not appear to be substantial overlapping or conflicting use of the levers.
B-1
ABBREVIATIONS
AIA Aerospace Industry Association
AMP Avionics Modernization Program
CAPEX capital expense
CAPM capital asset pricing model
CCDR Contractor Cost Data Report
CP cost plus
CPAF cost-plus award fee
CPFF cost-plus fixed fee
CPI cost performance index
CPIF cost-plus incentive fee
CSFB Credit Suisse First Boston
CSIS Center for Strategic and International Studies
IDA Institute for Defense Analyses
IDFAIR Defense Financial and Investment Review
DFARS Defense Federal Acquisition Regulation Supplement
DoD Department of Defense
DSB Defense Science Board
EAC estimate at completion
EBIT earnings before interest and tax
EPA economic pricing adjustment
EPS earnings per share
EVA economic value added
FAR Federal Acquisition Regulation
FCFF free cash flow to the firm
FCM facilities capital markup
FCOM facilities cost of money
FFP firm fixed price

B-2
FP fixed price
FPDS Federal Procurement Data System
FPI fixed price incentive
FPIF fixed price incentive fee
G&A General and Administrative
GAO Government Accountability Office
GWOT Global war on terror
HW hardware
IDA Institute for Defense Analyses
IRS Internal Revenue Service
IT information technology
JSF Joint Strike Fighter
K/L capital/labor ratio
LBO leveraged buy-out
LRIP low-rate initial production
MDAP major defense acquisition program
MYP Multi-year program
NPV net present value
P/E price/earnings
ppt percentage point
PV present value
R&D research and development
ROA return on assets
ROE return on equity
ROIC return on invested capital
ROS return on sales
S&P Standard and Poor’s
SCI Composite Performance Index
SDD system development and demonstration
SPI Schedule Performance Index
SW software
WACC weighted average cost of capital

C-1
REFERENCES
Assad, Shay (Director, Defense Procurement, Acquisition Policy and Strategic Sourcing), memorandum to the Service Secretaries and Defense Agency Directors, April 24, 2007.
Cloos, Jack, Dennis D. Kimko, and Thomas P. Frazier, “Cost Sharing Arrangements on Incentive Contracts,” briefing, December 12, 2001.
Fisher, Irving N., “A Reappraisal of Incentive Contracting Experience,” RAND Corporation, Memorandum RM-5700-PR, July 1968.
Frazier, T. P., M. S. Goldberg and T. R. Gulledge, “DoD Profit Policy and Capital Investment in the Military Aircraft Industry,” IDA Paper P-2359, March 1990.
Frazier, Thomas P., Matthew S. Goldberg, and Thomas R. Gulledge, Jr., “Department of Defense Profit Policy and Capital Investment in the Military Aircraft Industry” The Review of Economics and Statistics, Vol. 74, No. 3 August 1992, pp. 394–403.
GAO, “Incentive Contracts, Examination of Fixed-Price Incentive Contracts,” NSIAD-88-36BR, November, 1987
GAO, “Defense Acquisition: DoD has Paid Billions in Award and Incentive Fees Regardless of Outcomes,” GAO-06-06, December, 2005
Hiller, John R., and Robert D. Tollison, “Incentive Versus Cost-Plus Contracts in Defense Procurement,” Journal of Industrial Economics, Vol. 26, No. 3, March 1978, pp. 239–248
Laurence, Michael T., “1984 Defense Financial and Investment Review (DFAIR): Survey of Defense Procurement Personnel Results and Findings,” Defense Manpower Data Center, December 1984.
Rogerson, William P., “An Economic Framework for Analyzing DoD Profit Policy,” RAND Corporation, R-3860-PA&E, 1992.
Thurman, John L., National Security Space Industrial Base Study, 39th DoD Cost Analysis Symposium, February 2006.


2. REPORT TYPE 3. DATES COVERED (From - To)
4. TITLE AND SUBTITLE 5a. CONTRACT NUMBER
6. AUTHOR(S), Last Names First
7. PERFORMING ORGANIZATION NAME(S) AND ADDRESS(ES) 8. PERFORMING ORGANIZATION REPORT NUMBER
9. SPONSORING/MONITORING AGENCY NAME(S) AND ADDRESS(ES)
11. SPONSORING/MONITORING AGENCY REPORT NUMBER
13. SUPPLEMENTARY NOTES
12. DISTRIBUTION AVAILABILITY STATEMENT
10. SPONSOR/MONITOR'S ACRONYM(S)
14. ABSTRACT
15. SUBJECT TERMS
18. NUMBER OF PAGES
19a. NAME OF RESPONSIBLE PERSON (Last Name First)
a. REPORT c. THIS PAGEb. ABSTRACT
17. LIMITATION OF ABSTRACT
REPORT DOCUMENTATION PAGE Form ApprovedOMB No. 0704-0188
Public reporting burden for this collection of information is estimated to average 1 hour per response, including the time for reviewing instructions, searching data sources,gathering and maintaining the data needed, and completing and reviewing the collection of information. Send comments regarding this burden estimate or any other aspect of this collectionof information, including suggestions for reducing this burden to Washington Headquarters Service, Directorate for Information Operations and Reports,1215 Jefferson Davis Highway, Suite 1204, Arlington, VA 22202-4302, and to the Office of Management and Budget,Paperwork Reduction Project (0704-0188) Washington, DC 20503.
Standard Form 298 (Rev. 8-98)Prescribed by ANSI-Std Z39-18
19b. TELEPONE NUMBER (Include area code)
5b. GRANT NUMBER
5c. PROGRAM ELEMENT NUMBER
5d. PROJECT NUMBER
5e. TASK NUMBER
5f. WORK UNIT NUMBER
1. REPORT DATE (DD-MM-YYYY)
16. SECURITY CLASSIFICATION OF:
PLEASE DO NOT RETURN YOUR FORM TO THE ABOVE ADDRESS.

Related Documents