Welcome message from author
This document is posted to help you gain knowledge. Please leave a comment to let me know what you think about it! Share it to your friends and learn new things together.
Transcript


DEFENCE STATISTICS (Air) PUBLICATIONS
ANNUAL COMPENDIUM OF RAF MANPOWER STATISTICS
AS AT 1 APRIL 2018
Any queries please contact the Defence Statistics (Air) Statistical Analysis Team Leader on: 01494 496217 / [email protected]

Page 2
Contents Chapter 1
Table 1 Intake to Training (ITT) and Untrained to Trained flows by Branch/Trade and Flow Type for FY17.18 Page 3
Chapter 2 Table 2a Trained Officer Paid Ranks Promotions by Branch for FY17.18 Page 7
Table 2b Trained Other Ranks Paid Rank Promotions by Trade for FY17.18 Page 8
Table 3a Trained Officer Average Total Length of Service on Paid Rank Promotion by Branch for the period 1 Apr 2015 – 31 Mar 2018 Page 10
Table 3b Trained Other Ranks Average Total Length of Service on Paid Rank Promotion by Trade for the period 1 Apr 2015 – 31 Mar 2018 Page 11
Table 4a Trained Officer Average Age on Paid Rank Promotion by Branch for the period 1 Apr 2015 – 31 Mar 2018 Page 14
Table 4b Trained Other Ranks Average Age on Paid Rank Promotion by Trade for the period 1 Apr 2015 – 31 Mar 2018 Page 15
Table 5a RAF Trained Regular Officer Strength vs Workforce Requirement by Branch and Rank as at 1 Apr 2018 Page 18
Table 5b RAF Trained Regular Non-Commissioned Aircrew Strength vs Workforce Requirement by Trade and Rank as at 1 Apr 2018 Page 22
Table 5c RAF Trained Regular Ground Trade Strength vs Workforce Requirement by Trade and Rank as at 1 Apr 2018 Page 23
Table 6a RAF Trained Regular Officer Demographics by Age, Paid Rank and Branch as at 1 Apr 2018 Page 32
Table 6b RAF Trained Regular Non-Commissioned Officer Demographics by Age, Paid Rank and Trade as at 1 Apr 2018 Page 38
Table 6c RAF Trained Regular Ground Trades Demographics by Age, Paid Rank and Trade as at 1 Apr 2018 Page 40
Table 7a RAF Trained Regular Officer Demographics by Length of Service, Paid Rank and Branch as at 1 Apr 2018 Page 50
Table 7b RAF Trained Regular Non-Commissioned Aircrew Demographics by Length of Service, Paid Rank and Trade as at 1 Apr 2018 Page 56
Table 7c RAF Trained Regular Ground Trades Demographics by Length of Service, Paid Rank and Trade as at 1 Apr 2018 Page 58
Table 8a RAF Officer Structures Ratio by Strength as at 1 Apr 2018 Page 69
Table 8b RAF Non-Commissioned Aircrew Structures Ratio by Strength as at 1 Apr 2018 Page 70
Table 8c RAF Ground Trades Structures Ratio by Strength as at 1 Apr 2018 Page 71
Table 9a RAF Officer Structures Ratio by Workforce Requirement as at 1 Apr 2018 Page 73
Table 9b RAF Non-Commissioned Aircrew Structures Ratio by Workforce Requirement as at 1 Apr 2018 Page 74
Table 9c RAF Ground Trades Structures Ratio by Workforce Requirement as at 1 Apr 2018 Page 75
Chapter 3 Table 10a RAF Officer Outflow from Trained Regular Strength Page 77
Table 10b RAF Non-Commissioned Aircrew Outflow from Trained Regular Strength Page 82
Table 10c RAF Ground Trades Outflow from Trained Regular Strength Page 83
Table 11 Outflow Numbers and Average Return of Service (RoS) by Branch/Trade Page 91

NumberAs a % of
total ITT
As a % of
average
trained
strength
NumberAs a % of
total ITT
As a % of
average
trained
strength
NumberAs a % of
total ITT
As a % of
average
trained
strength
Number
As a % of
average
trained
strength
OFFICER TOTAL 360 65.3% 5.5% 20 2.7% 0.2% 180 31.9% 2.7% 350 5.3%
PILOT 100 86.8% 6.5% ~ 2.5% 0.2% 10 10.7% 0.8% 70 4.3%WSO ~ 28.6% 0.4% - 0.0% 0.0% ~ 71.4% 1.0% ~ 0.4%AIR OPS CONTROL/SYSTEMS 80 62.0% 8.3% ~ 1.7% 0.2% 40 36.4% 4.9% 80 8.4%INT 20 59.4% 6.7% ~ 6.3% 0.7% 10 34.4% 3.9% 30 10.6%REGT 30 71.8% 8.4% ~ 2.6% 0.3% 10 25.6% 3.0% 20 6.6%PROV 10 33.3% 4.5% ~ 4.8% 0.6% 10 61.9% 8.3% 10 8.3%ENG (AS) 40 59.4% 6.0% ~ 4.3% 0.4% 20 36.2% 3.7% 30 4.4%ENG (CE) 20 47.5% 5.1% - 0.0% 0.0% 20 52.5% 5.6% 30 7.3%ENG (Unknown) ~ 75.0% N/A - 0.0% N/A ~ 25.0% N/A - N/ALOGISTICS 20 71.0% 5.1% - 0.0% 0.0% 10 29.0% 2.1% 30 6.5%PERS (SPT) 10 39.3% 2.2% ~ 7.1% 0.4% 20 53.6% 3.0% 20 5.0%PERS (TRG) 10 70.0% 3.2% - 0.0% 0.0% ~ 30.0% 1.4% 10 2.8%PERS (Unknown) - N/A N/A - N/A N/A - N/A N/A - N/AMEDICAL ~ 75.0% 1.5% - 0.0% 0.0% ~ 25.0% 0.5% ~ 2.5%MED SPT (MAINSTREAM/EHO) 10 68.8% 14.4% ~ 6.3% 1.3% ~ 25.0% 5.2% ~ 3.9%MED SPT (PHYSIO) - N/A 0.0% - N/A 0.0% - N/A 0.0% - 0.0%NURSING OFFICER ~ 60.0% 2.3% - 0.0% 0.0% ~ 40.0% 1.5% 10 5.3%DENTAL - N/A 0.0% - N/A 0.0% - N/A 0.0% ~ 2.7%CHAPLAIN ~ 100.0% 7.4% - 0.0% 0.0% - 0.0% 0.0% ~ 1.9%LEGAL ~ 100.0% 4.4% - 0.0% 0.0% - 0.0% 0.0% ~ 4.4%MUSIC - N/A 0.0% - N/A 0.0% - N/A 0.0% - 0.0%Unknown Branch - N/A N/A - N/A N/A - N/A N/A - N/A
Branch / Trade
Intake to TrainingUntrained to Trained
From Civil LifeFrom Another Service/
Assignment Type
Transfers between
Other Ranks & Officers
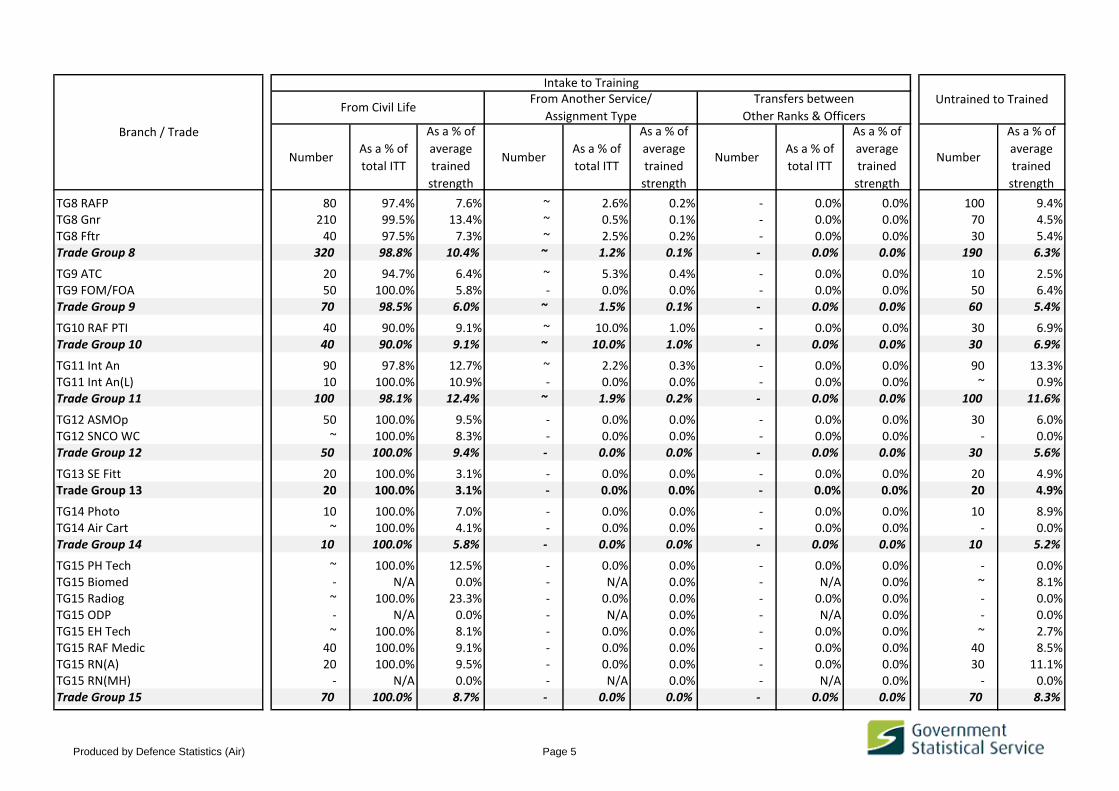
Table 1. Intake to Training1 & movements from Untrained to Trained2 strength by Branch/Trade & Flow TypeFY2017.2018
Produced by Defence Statistics (Air) Page 3

NumberAs a % of
total ITT
As a % of
average
trained
strength
NumberAs a % of
total ITT
As a % of
average
trained
strength
NumberAs a % of
total ITT
As a % of
average
trained
strength
Number
As a % of
average
trained
strength
Branch / Trade
Intake to TrainingUntrained to Trained
From Civil LifeFrom Another Service/
Assignment Type
Transfers between
Other Ranks & Officers
NCANCA TOTAL 50 100.0% 6.0% - 0.0% 0.0% - 0.0% 0.0% 20 3.3%
WSOp(A ENG)NCA WSOp(A Eng) - N/A 0.0% - N/A 0.0% - N/A 0.0% - 0.0%WSOp(CREW)NCA WSOp(Crew) - N/A 0.0% - N/A 0.0% - N/A 0.0% 20 3.2%WSOp(EW/ACC)NCA WSOp(EW/Acc) - N/A 0.0% - N/A 0.0% - N/A 0.0% ~ 1.5%WSOp(L)NCA WSOp(L) 10 100.0% 14.7% - 0.0% 0.0% - 0.0% 0.0% - 0.0%
NCA WSOp(Unknown) 40 100.0% N/A - 0.0% N/A - 0.0% N/A 10 N/A
GROUND TRADES TOTAL 1 650 99.0% 7.1% 20 1.0% 0.1% - 0.0% 0.0% 1 470 6.4%
TG1 A Eng TechTG1 A Tech AvTG1 A Tech MTG1 AMM Av 180 100.0% 43.3% - 0.0% 0.0% - 0.0% 0.0% 170 41.3%TG1 AMM M 190 100.0% 42.4% - 0.0% 0.0% - 0.0% 0.0% 170 36.5%TG1 Eng Tech W 60 100.0% 5.4% - 0.0% 0.0% - 0.0% 0.0% 70 6.2%Trade Group 1 430 100.0% 6.1% - 0.0% 0.0% - 0.0% 0.0% 410 5.8%
TG4 ICT ManTG4 ICT Tech 160 100.0% 8.8% - 0.0% 0.0% - 0.0% 0.0% 170 9.2%TG4 ICT CIT 10 100.0% 8.9% - 0.0% 0.0% - 0.0% 0.0% 10 6.3%Trade Group 4 170 100.0% 7.9% - 0.0% 0.0% - 0.0% 0.0% 180 8.1%
TG5 Gen Eng TechTG5 Gen Tech E 50 97.9% 11.7% ~ 2.1% 0.3% - 0.0% 0.0% 40 10.4%TG5 Gen Tech M 80 100.0% 11.1% - 0.0% 0.0% - 0.0% 0.0% 60 9.1%TG5 Gen Tech WS ~ 100.0% 4.6% - 0.0% 0.0% - 0.0% 0.0% 10 9.3%Trade Group 5 130 99.2% 10.2% ~ 0.8% 0.1% - 0.0% 0.0% 110 9.1%
TG6 Log(Driver) 30 97.1% 3.8% ~ 2.9% 0.1% - 0.0% 0.0% 60 6.4%Trade Group 6 30 97.1% 3.8% ~ 2.9% 0.1% - 0.0% 0.0% 60 6.4%
Produced by Defence Statistics (Air) Page 4
NumberAs a % of
total ITT
As a % of
average
trained
strength
NumberAs a % of
total ITT
As a % of
average
trained
strength
NumberAs a % of
total ITT
As a % of
average
trained
strength
Number
As a % of
average
trained
strength
Branch / Trade
Intake to TrainingUntrained to Trained
From Civil LifeFrom Another Service/
Assignment Type
Transfers between
Other Ranks & Officers
TG8 RAFP 80 97.4% 7.6% ~ 2.6% 0.2% - 0.0% 0.0% 100 9.4%TG8 Gnr 210 99.5% 13.4% ~ 0.5% 0.1% - 0.0% 0.0% 70 4.5%TG8 Fftr 40 97.5% 7.3% ~ 2.5% 0.2% - 0.0% 0.0% 30 5.4%Trade Group 8 320 98.8% 10.4% ~ 1.2% 0.1% - 0.0% 0.0% 190 6.3%
TG9 ATC 20 94.7% 6.4% ~ 5.3% 0.4% - 0.0% 0.0% 10 2.5%TG9 FOM/FOA 50 100.0% 5.8% - 0.0% 0.0% - 0.0% 0.0% 50 6.4%Trade Group 9 70 98.5% 6.0% ~ 1.5% 0.1% - 0.0% 0.0% 60 5.4%
TG10 RAF PTI 40 90.0% 9.1% ~ 10.0% 1.0% - 0.0% 0.0% 30 6.9%Trade Group 10 40 90.0% 9.1% ~ 10.0% 1.0% - 0.0% 0.0% 30 6.9%
TG11 Int An 90 97.8% 12.7% ~ 2.2% 0.3% - 0.0% 0.0% 90 13.3%TG11 Int An(L) 10 100.0% 10.9% - 0.0% 0.0% - 0.0% 0.0% ~ 0.9%Trade Group 11 100 98.1% 12.4% ~ 1.9% 0.2% - 0.0% 0.0% 100 11.6%
TG12 ASMOp 50 100.0% 9.5% - 0.0% 0.0% - 0.0% 0.0% 30 6.0%TG12 SNCO WC ~ 100.0% 8.3% - 0.0% 0.0% - 0.0% 0.0% - 0.0%Trade Group 12 50 100.0% 9.4% - 0.0% 0.0% - 0.0% 0.0% 30 5.6%
TG13 SE Fitt 20 100.0% 3.1% - 0.0% 0.0% - 0.0% 0.0% 20 4.9%Trade Group 13 20 100.0% 3.1% - 0.0% 0.0% - 0.0% 0.0% 20 4.9%
TG14 Photo 10 100.0% 7.0% - 0.0% 0.0% - 0.0% 0.0% 10 8.9%TG14 Air Cart ~ 100.0% 4.1% - 0.0% 0.0% - 0.0% 0.0% - 0.0%Trade Group 14 10 100.0% 5.8% - 0.0% 0.0% - 0.0% 0.0% 10 5.2%
TG15 PH Tech ~ 100.0% 12.5% - 0.0% 0.0% - 0.0% 0.0% - 0.0%TG15 Biomed - N/A 0.0% - N/A 0.0% - N/A 0.0% ~ 8.1%TG15 Radiog ~ 100.0% 23.3% - 0.0% 0.0% - 0.0% 0.0% - 0.0%TG15 ODP - N/A 0.0% - N/A 0.0% - N/A 0.0% - 0.0%TG15 EH Tech ~ 100.0% 8.1% - 0.0% 0.0% - 0.0% 0.0% ~ 2.7%TG15 RAF Medic 40 100.0% 9.1% - 0.0% 0.0% - 0.0% 0.0% 40 8.5%TG15 RN(A) 20 100.0% 9.5% - 0.0% 0.0% - 0.0% 0.0% 30 11.1%TG15 RN(MH) - N/A 0.0% - N/A 0.0% - N/A 0.0% - 0.0%Trade Group 15 70 100.0% 8.7% - 0.0% 0.0% - 0.0% 0.0% 70 8.3%
Produced by Defence Statistics (Air) Page 5

NumberAs a % of
total ITT
As a % of
average
trained
strength
NumberAs a % of
total ITT
As a % of
average
trained
strength
NumberAs a % of
total ITT
As a % of
average
trained
strength
Number
As a % of
average
trained
strength
Branch / Trade
Intake to TrainingUntrained to Trained
From Civil LifeFrom Another Service/
Assignment Type
Transfers between
Other Ranks & Officers
TG16 Dental Nurse 10 75.0% 9.7% ~ 25.0% 3.2% - 0.0% 0.0% 10 9.7%Trade Group 16 10 75.0% 9.7% ~ 25.0% 3.2% - 0.0% 0.0% 10 9.7%
TG17 Pers(Spt) 40 100.0% 4.0% - 0.0% 0.0% - 0.0% 0.0% 50 5.1%Trade Group 17 40 100.0% 4.0% - 0.0% 0.0% - 0.0% 0.0% 50 5.1%
TG18 Log(Mov) 40 100.0% 4.1% - 0.0% 0.0% - 0.0% 0.0% 20 2.5%TG18 Log(Sup) 60 100.0% 4.6% - 0.0% 0.0% - 0.0% 0.0% 60 4.9%Trade Group 18 100 100.0% 4.4% - 0.0% 0.0% - 0.0% 0.0% 90 3.9%
TG19 Log(AGS) 20 100.0% 6.4% - 0.0% 0.0% - 0.0% 0.0% 20 4.1%TG19 Log(Chef) 30 100.0% 6.2% - 0.0% 0.0% - 0.0% 0.0% 40 9.2%Trade Group 19 50 100.0% 6.3% - 0.0% 0.0% - 0.0% 0.0% 60 6.9%
TG21 Musn 10 87.5% 4.3% ~ 12.5% 0.6% - 0.0% 0.0% ~ 2.5%Trade Group 21 10 87.5% 4.3% ~ 12.5% 0.6% - 0.0% 0.0% ~ 2.5%
Trade Unknown ~ 100.0% N/A - 0.0% N/A - 0.0% N/A ~ N/A
TOTAL RAF 2 050 90.8% 6.7% 30 1.4% 0.1% 180 7.8% 0.6% 1 840 6.0%
1 Intake to Training is gains to untrained strength. Personnel have not been included if they have returned to the untrained strength from Long Term Absenteeism.2 Flows from untrained to trained strength occur when personnel complete Phase 2 training and their "training indicator" flag is updated on JPA. It has become apparent that late reporting has a notable
impact on this field, with flows occurring during one financial year not being accounted for until the following financial year.
Notes:a. In accordance with the Data Protection Act and our obligations in relation to the protection of confidentiality when handling personal data, data have been rounded to the nearest 10, where "-" denotes zero and "~" denotes a number less than or equal to 5.b. Due to the rounding methods used, totals may not always equal the sum of the parts. c. When rounding to the nearest 10, numbers ending in 5 have been rounded to the nearest multiple of 20 to prevent systematic bias.d. Percentages are calculated from unrounded data.
Produced by Defence Statistics (Air) Page 6

Fg/Plt Off
Number Rate 2 Number Rate 2 Number Rate 2 Number Rate 2 Number Rate 2 Number Rate 2 Number Rate 2
TOTAL - 0.0% 10 12.7% 20 8.8% 40 4.0% 120 6.1% 240 8.7% 240 58.2%
PILOT - 0.0% ~ 13.9% 10 12.4% 10 6.6% 20 7.1% 40 4.4% ~ 16.4%WSO - 0.0% ~ 15.4% ~ 2.9% ~ 3.9% 10 4.5% 10 5.6% 10 141.2%AIR OPS CONTROL/SYSTEMS - 0.0% - 0.0% - 0.0% ~ 2.4% 20 6.4% 40 9.5% 60 44.7%INT - 0.0% ~ 61.5% - 0.0% ~ 2.9% 10 8.1% 10 10.8% 30 49.9%REGT - - - 0.0% ~ 22.9% ~ 3.7% ~ 3.5% 20 12.2% 10 45.9%PROV - - - - - 0.0% ~ 8.6% ~ 4.2% 10 14.0% 10 89.7%ENG (AS) - 0.0% - 0.0% ~ 6.0% ~ 1.8% 20 6.0% 30 15.0% 40 81.1%ENG (CE) - 0.0% ~ 35.6% ~ 6.7% ~ 3.1% 10 7.4% 20 13.0% 10 48.5%LOGISTICS - - - 0.0% ~ 5.2% ~ 3.1% 10 5.4% 20 12.4% 30 66.7%PERS (SPT) - 0.0% - 0.0% ~ 18.2% ~ 7.2% 10 5.4% 10 7.7% 20 55.9%PERS (TRG) - - - 0.0% ~ 28.9% ~ 4.0% ~ 4.2% 10 8.8% 10 98.3%MEDICAL - 0.0% - 0.0% ~ 6.1% - 0.0% 10 9.1% ~ 77.4% - -MED SPT (MAINSTREAM/EHO) - - - - - 0.0% ~ 7.1% ~ 7.4% ~ 10.5% - 0.0%MED SPT (PHYSIO) - - - - - - - 0.0% ~ 11.0% ~ 14.0% - -NURSING OFFICER - - - - - 0.0% - 0.0% ~ 4.2% ~ 4.6% ~ 105.5%DENTAL - - - 0.0% - 0.0% - 0.0% - 0.0% - 0.0% - -CHAPLAIN - 0.0% - - - 0.0% ~ 14.1% ~ 7.4% 10 67.6% - -LEGAL - 0.0% ~ 109.1% ~ 29.6% ~ 7.3% ~ 9.0% ~ 27.0% - -MUSIC - - - - - - - 0.0% ~ 47.1% - 0.0% ~ 342.9%
1 Statistics concern trained regular personnel only.2 Rates have been calculated by dividing the number of paid rank promotions by the average strength of the previous rank. "-" denotes zero opening strength whilst "0.0%" indicates zero paid
rank promotions.
FG OFF/PLT OFF
BRANCHAM & ABOVE AVM AIR CDRE GP CAPT WG CDR SQN LDR FLT LT
AVM AIR CDRE GP CAPT WG CDR SQN LDR FLT LT
Table 2a. Trained Officer Paid Rank Promotions by Branch for FY2013.2014Table 2a. Trained Officer Paid Rank Promotions1 by BranchFY2017.2018
Notes:a. In accordance with the Data Protection Act and our obligations in relation to the protection of confidentiality when handling personal data, data have been rounded to the nearest 10, where "-" denotes zero and "~" denotes a number less than or equal to 5.b. Due to the rounding methods used, totals may not always equal the sum of the parts. c. When rounding to the nearest 10, numbers ending in 5 have been rounded to the nearest multiple of 20 to prevent systematic bias.d. Percentages are calculated from unrounded data.
Produced by Defence Statistics (Air) Page 7

Number Rate 2 Number Rate 2 Number Rate 2 Number Rate 2 Number Rate 2 Number Rate 2
GROUND TRADES TOTAL 140 10.4% 250 6.9% 150 9.0% 630 9.8% 880 12.0% 650 58.0%
TG1 A Eng Tech 30 13.1% 40 6.5%TG1 A Tech Av 50 8.5% 110 16.8% 80 14.9% 130 30.7%TG1 A Tech M 50 8.4% 80 10.9% 110 12.2% 180 39.3%TG1 Eng Tech W ~ 10.9% 10 10.5% 20 9.4% 50 14.5% 40 11.3% 70 64.2%
TG4 ICT Man 10 9.4% 30 5.8%TG4 ICT Tech 40 6.8% 80 15.0% 120 49.9%TG4 ICT CIT ~ 5.9% ~ 8.1%
TG5 Gen Eng Tech 10 16.4% 10 14.5%TG5 Gen Tech E 10 22.0% 10 7.5% 20 21.5% 40 56.2%TG5 Gen Tech M 10 8.6% 20 9.2% 30 13.2% 50 42.6%TG5 Gen Tech WS ~ 14.6% ~ 8.8% ~ 14.6% 10 40.9%
TG6 Log(Driver) ~ 7.6% 10 7.2% 20 6.0% 30 5.2%
TG8 Fftr ~ 20.7% ~ 4.4% 10 5.7% 20 6.8%TG8 Gnr 10 8.6% 10 6.3% 20 4.6% 40 23.6% 60 10.8%TG8 RAFP 10 11.3% 20 7.6% 20 7.5% 50 13.6%
TG9 ATC 10 11.4% 10 8.5%TG9 FOM/FOA ~ 10.9% 10 8.4% 20 8.2% 40 10.0%
TG10 RAF PTI 10 11.4% 10 6.2% 20 14.1%
TG11 Int An ~ 8.1% 10 4.0% 20 13.2% 40 13.4%TG11 Int An(L) ~ 10.0% - 0.0% ~ 15.2% ~ 12.2%
TG12 ASMOp ~ 3.7% 10 5.9% ~ 2.9% 20 10.0%TG12 SNCO WC ~ 13.6% ~ 3.8%
TG13 SE Fitt ~ 18.7% 10 11.9% 10 6.1% 30 14.9%
SAC(T) or L/CPL if GnrGROUND TRADES
WO FLT SGT CHF TECH SGT CPL
ACFLT SGT CHF TECH SGT CPL SAC(T) or L/CPL if Gnr
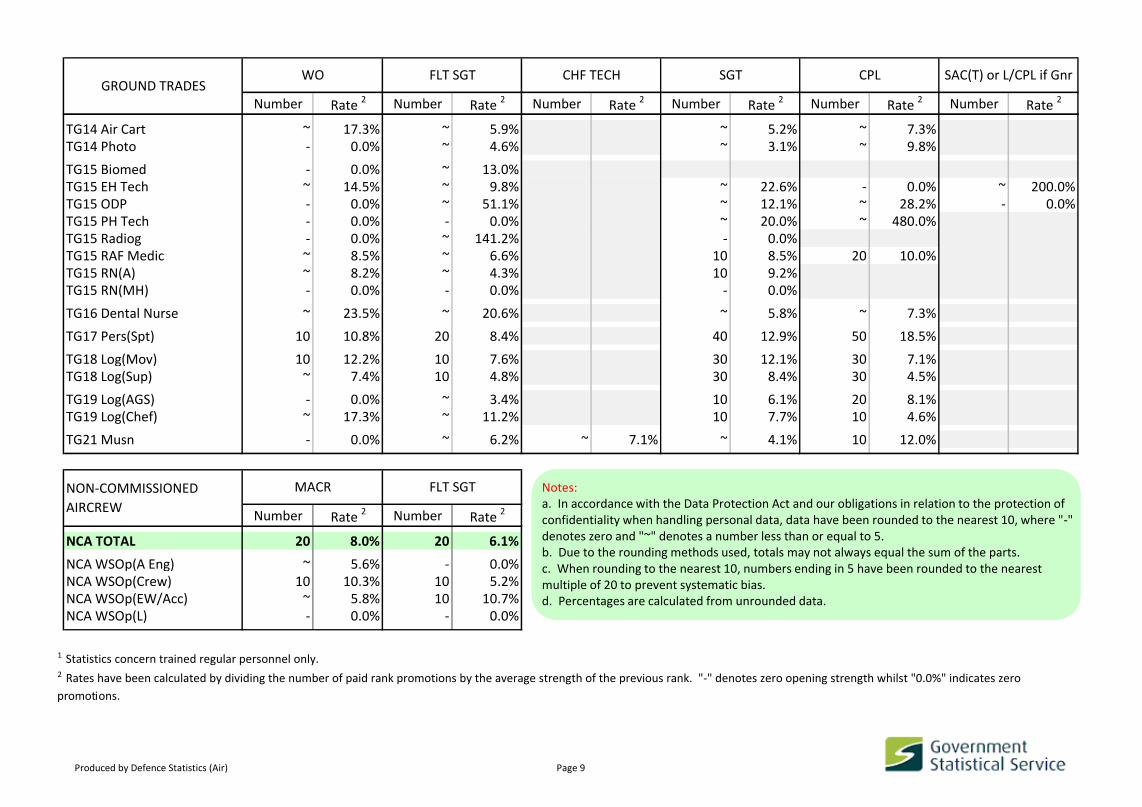
Table 2b. Trained Other Ranks Paid Rank Promotions1 by TradeFY2017.2018
Produced by Defence Statistics (Air) Page 8
Number Rate 2 Number Rate
2 Number Rate 2 Number Rate
2 Number Rate 2 Number Rate
2
SAC(T) or L/CPL if GnrGROUND TRADES
WO FLT SGT CHF TECH SGT CPL
TG14 Air Cart ~ 17.3% ~ 5.9% ~ 5.2% ~ 7.3%TG14 Photo - 0.0% ~ 4.6% ~ 3.1% ~ 9.8%
TG15 Biomed - 0.0% ~ 13.0%TG15 EH Tech ~ 14.5% ~ 9.8% ~ 22.6% - 0.0% ~ 200.0%TG15 ODP - 0.0% ~ 51.1% ~ 12.1% ~ 28.2% - 0.0%TG15 PH Tech - 0.0% - 0.0% ~ 20.0% ~ 480.0%TG15 Radiog - 0.0% ~ 141.2% - 0.0%TG15 RAF Medic ~ 8.5% ~ 6.6% 10 8.5% 20 10.0%TG15 RN(A) ~ 8.2% ~ 4.3% 10 9.2%TG15 RN(MH) - 0.0% - 0.0% - 0.0%
TG16 Dental Nurse ~ 23.5% ~ 20.6% ~ 5.8% ~ 7.3%
TG17 Pers(Spt) 10 10.8% 20 8.4% 40 12.9% 50 18.5%
TG18 Log(Mov) 10 12.2% 10 7.6% 30 12.1% 30 7.1%TG18 Log(Sup) ~ 7.4% 10 4.8% 30 8.4% 30 4.5%
TG19 Log(AGS) - 0.0% ~ 3.4% 10 6.1% 20 8.1%TG19 Log(Chef) ~ 17.3% ~ 11.2% 10 7.7% 10 4.6%
TG21 Musn - 0.0% ~ 6.2% ~ 7.1% ~ 4.1% 10 12.0%
Number Rate 2 Number Rate 2
NCA TOTAL 20 8.0% 20 6.1%
NCA WSOp(A Eng) ~ 5.6% - 0.0%NCA WSOp(Crew) 10 10.3% 10 5.2%NCA WSOp(EW/Acc) ~ 5.8% 10 10.7%NCA WSOp(L) - 0.0% - 0.0%
1 Statistics concern trained regular personnel only.2 Rates have been calculated by dividing the number of paid rank promotions by the average strength of the previous rank. "-" denotes zero opening strength whilst "0.0%" indicates zero
promotions.
FLT SGT SGT
NON-COMMISSIONED
AIRCREW
MACR FLT SGT Notes:a. In accordance with the Data Protection Act and our obligations in relation to the protection of confidentiality when handling personal data, data have been rounded to the nearest 10, where "-" denotes zero and "~" denotes a number less than or equal to 5.b. Due to the rounding methods used, totals may not always equal the sum of the parts. c. When rounding to the nearest 10, numbers ending in 5 have been rounded to the nearest multiple of 20 to prevent systematic bias.d. Percentages are calculated from unrounded data.
Produced by Defence Statistics (Air) Page 9

BRANCH AM & ABOVE AVM AIR CDRE GP CAPT WG CDR SQN LDR FLT LT
TOTAL 35 years 0 months 29 years 2 months 27 years 11 months 23 years 1 month 16 years 2 months 13 years 7 months 7 years 6 months
PILOT - 29 years 9 months 27 years 10 months 23 years 0 months 17 years 6 months 13 years 2 months 6 years 0 months
WSO - - 27 years 4 months 25 years 3 months 17 years 3 months 13 years 10 months 17 years 9 months
AIR OPS CONTROL/SYSTEMS - 27 years 5 months 17 years 5 months 13 years 11 months 7 years 3 months
INT - - - 16 years 4 months 13 years 9 months 5 years 9 months
REGT - 26 years 8 months 18 years 6 months 15 years 4 months 6 years 2 months
PROV - - 17 years 4 months 7 years 5 months
ENG (AS) - - 29 years 3 months 22 years 6 months 15 years 9 months 13 years 4 months 8 years 6 months
ENG (CE) - - 21 years 6 months 15 years 9 months 14 years 1 month 9 years 9 months
LOGISTICS - 22 years 2 months 16 years 6 months 14 years 1 month 5 years 10 months
PERS (SPT) - 27 years 8 months 22 years 8 months 16 years 5 months 15 years 1 month 8 years 0 months
PERS (TRG) - - 18 years 2 months 15 years 3 months 8 years 10 months
MEDICAL - 18 years 4 months 11 years 11 months 9 years 3 months -
MED SPT (MAINSTREAM/EHO) - 17 years 3 months 15 years 10 months 12 years 1 month
MED SPT (PHYSIO) - - -
NURSING OFFICER - 17 years 0 months 11 years 5 months 4 years 9 months
DENTAL - - 13 years 2 months 5 years 10 months
CHAPLAIN - 10 years 3 months 3 years 1 month
LEGAL - - - 10 years 7 months 4 years 10 months
MUSIC - - -
Table 3a. Trained Officer Average Total Length of Service on Paid Rank Promotion by BranchFY2015.2016 - FY2017.2018
Notes:a. Statistics concern trained regular personnel who attained a paid rank promotion during the three-year period 1 April 2015 to 31 March 2018.b. Length of Service has been calculated using entry date. There are known problems with the entry date information extracted from JPA. If personnel have transferred to the RAF from another Service, have served under an alternative assignment type (e.g. reserve forces), are re-entrants or have transferred from Other Ranks to Officers, their entry date may correspond to any of these events. The resulting LoS may reflect their current period of service, include previous service, or it may be the time that has elapsed since they first joined the Armed Forces, irrespective of any break in service. It will invariably include time spent on untrained strength.c. Small population sizes can create misleading averages. Where the actual number of promotions to paid rank by branch is less than or equal to 5 but greater than zero, average total length of service information has been suppressed and marked with a "-". Blank cells indicate no promotions have been recorded during the period.
Produced by Defence Statistics (Air) Page 10

TOTAL 28 years 11 months 22 years 4 months 20 years 3 months 14 years 6 months 7 years 11 months 3 years 8 months
TG1 A Eng Tech 32 years 1 month 26 years 5 months
TG1 A Tech Av 19 years 6 months 15 years 3 months 7 years 11 months 3 years 4 months
TG1 A Tech M 20 years 4 months 16 years 4 months 9 years 5 months 3 years 5 months
TG1 Eng Tech W 32 years 10 months 26 years 5 months 21 years 7 months 15 years 11 months 8 years 7 months 3 years 2 months
Trade Group 1 32 years 2 months 26 years 5 months 20 years 1 month 15 years 9 months 8 years 8 months 3 years 4 months
TG4 ICT Man 29 years 6 months 23 years 3 months
TG4 ICT Tech 15 years 1 month 8 years 9 months 3 years 4 months
TG4 ICT CIT 15 years 1 month 6 years 11 months
Trade Group 4 29 years 6 months 23 years 2 months 15 years 1 month 8 years 8 months 3 years 4 months
TG5 Gen Eng Tech 31 years 5 months 27 years 10 months
TG5 Gen Tech E 20 years 9 months 16 years 7 months 8 years 0 months 3 years 4 months
TG5 Gen Tech M 22 years 2 months 15 years 11 months 10 years 5 months 3 years 5 months
TG5 Gen Tech WS 23 years 0 months 15 years 4 months 9 years 5 months 3 years 4 months
Trade Group 5 31 years 5 months 27 years 10 months 21 years 9 months 16 years 1 month 9 years 3 months 3 years 5 months
TG6 Log(Driver) 28 years 8 months 24 years 6 months 16 years 2 months 9 years 0 months
Trade Group 6 28 years 8 months 24 years 6 months 16 years 2 months 9 years 0 months
TG8 Fftr 25 years 11 months 17 years 9 months 14 years 5 months 7 years 3 months
TG8 Gnr 30 years 3 months 20 years 2 months 13 years 3 months 8 years 2 months 6 years 8 months
TG8 RAFP 28 years 5 months 22 years 7 months 13 years 8 months 7 years 4 months
Trade Group 8 28 years 3 months 20 years 11 months 13 years 7 months 7 years 8 months 6 years 8 months
SAC(T) or L/CPL if GnrGROUND TRADES WO FLT SGT CHF TECH SGT CPL
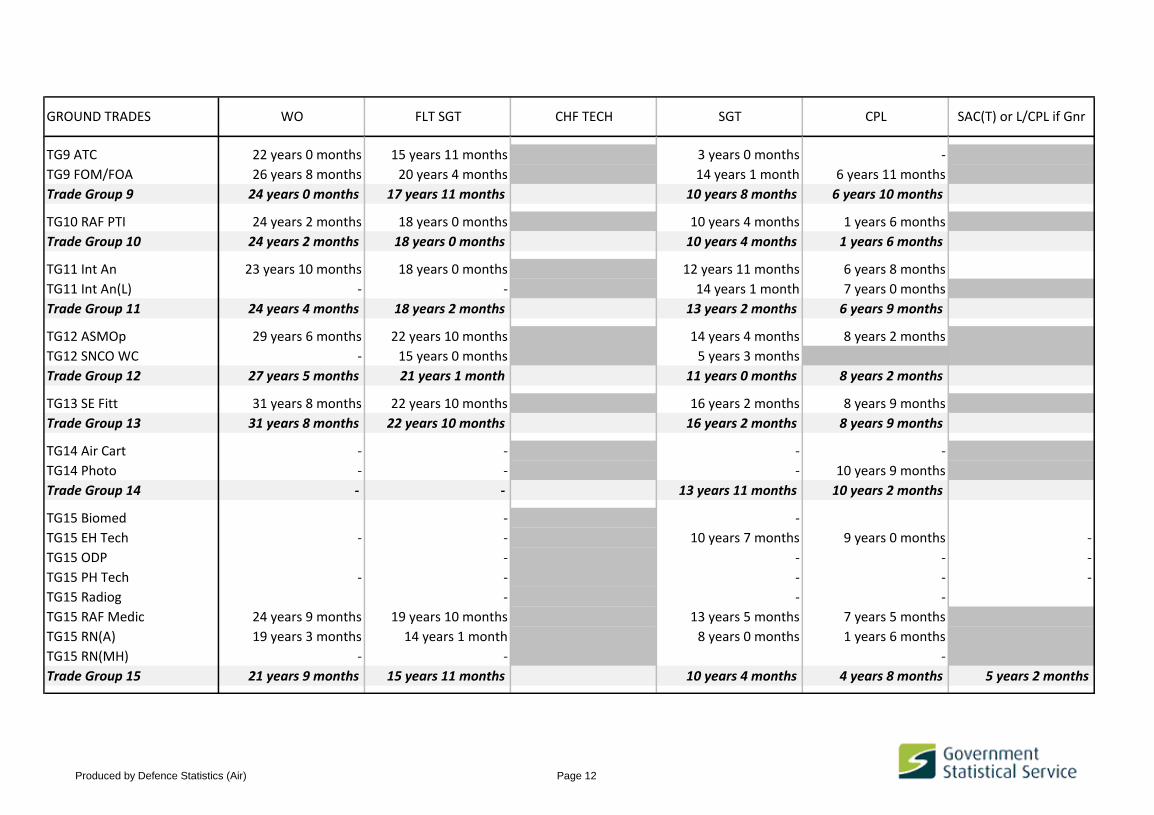
Table 3b. Trained Other Ranks Average Total Length of Service on Paid Rank Promotion by TradeFY2015.2016 - FY2017.2018
Produced by Defence Statistics (Air) Page 11
SAC(T) or L/CPL if GnrGROUND TRADES WO FLT SGT CHF TECH SGT CPL
TG9 ATC 22 years 0 months 15 years 11 months 3 years 0 months -
TG9 FOM/FOA 26 years 8 months 20 years 4 months 14 years 1 month 6 years 11 months
Trade Group 9 24 years 0 months 17 years 11 months 10 years 8 months 6 years 10 months
TG10 RAF PTI 24 years 2 months 18 years 0 months 10 years 4 months 1 years 6 months
Trade Group 10 24 years 2 months 18 years 0 months 10 years 4 months 1 years 6 months
TG11 Int An 23 years 10 months 18 years 0 months 12 years 11 months 6 years 8 months
TG11 Int An(L) - - 14 years 1 month 7 years 0 months
Trade Group 11 24 years 4 months 18 years 2 months 13 years 2 months 6 years 9 months
TG12 ASMOp 29 years 6 months 22 years 10 months 14 years 4 months 8 years 2 months
TG12 SNCO WC - 15 years 0 months 5 years 3 months
Trade Group 12 27 years 5 months 21 years 1 month 11 years 0 months 8 years 2 months
TG13 SE Fitt 31 years 8 months 22 years 10 months 16 years 2 months 8 years 9 months
Trade Group 13 31 years 8 months 22 years 10 months 16 years 2 months 8 years 9 months
TG14 Air Cart - - - -
TG14 Photo - - - 10 years 9 months
Trade Group 14 - - 13 years 11 months 10 years 2 months
TG15 Biomed - -
TG15 EH Tech - - 10 years 7 months 9 years 0 months -
TG15 ODP - - - -
TG15 PH Tech - - - - -
TG15 Radiog - - -
TG15 RAF Medic 24 years 9 months 19 years 10 months 13 years 5 months 7 years 5 months
TG15 RN(A) 19 years 3 months 14 years 1 month 8 years 0 months 1 years 6 months
TG15 RN(MH) - - -
Trade Group 15 21 years 9 months 15 years 11 months 10 years 4 months 4 years 8 months 5 years 2 months
Produced by Defence Statistics (Air) Page 12
SAC(T) or L/CPL if GnrGROUND TRADES WO FLT SGT CHF TECH SGT CPL
TG16 Dental Nurse - - - 7 years 0 months
Trade Group 16 - - - 7 years 0 months
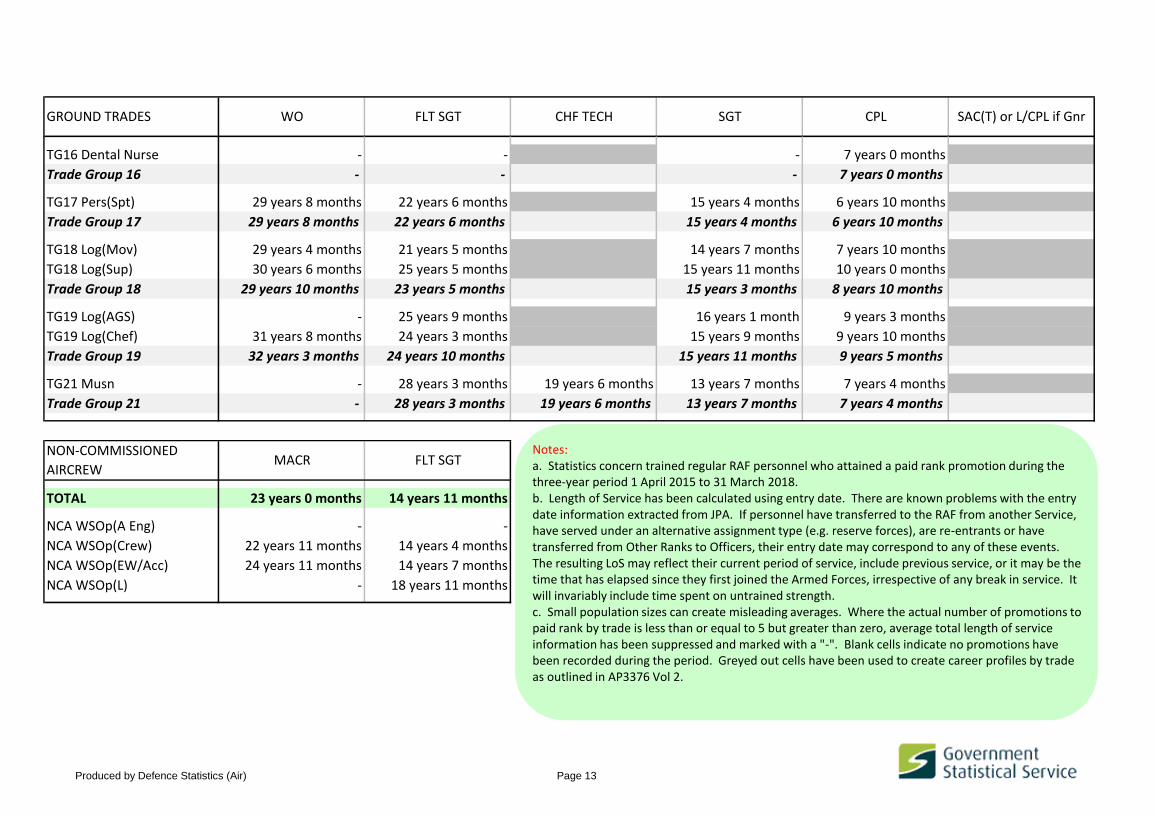
TG17 Pers(Spt) 29 years 8 months 22 years 6 months 15 years 4 months 6 years 10 months
Trade Group 17 29 years 8 months 22 years 6 months 15 years 4 months 6 years 10 months
TG18 Log(Mov) 29 years 4 months 21 years 5 months 14 years 7 months 7 years 10 months
TG18 Log(Sup) 30 years 6 months 25 years 5 months 15 years 11 months 10 years 0 months
Trade Group 18 29 years 10 months 23 years 5 months 15 years 3 months 8 years 10 months
TG19 Log(AGS) - 25 years 9 months 16 years 1 month 9 years 3 months
TG19 Log(Chef) 31 years 8 months 24 years 3 months 15 years 9 months 9 years 10 months
Trade Group 19 32 years 3 months 24 years 10 months 15 years 11 months 9 years 5 months
TG21 Musn - 28 years 3 months 19 years 6 months 13 years 7 months 7 years 4 months
Trade Group 21 - 28 years 3 months 19 years 6 months 13 years 7 months 7 years 4 months
TOTAL 23 years 0 months 14 years 11 months
NCA WSOp(A Eng) - -
NCA WSOp(Crew) 22 years 11 months 14 years 4 months
NCA WSOp(EW/Acc) 24 years 11 months 14 years 7 months
NCA WSOp(L) - 18 years 11 months
NON-COMMISSIONED
AIRCREWMACR FLT SGT
Notes:a. Statistics concern trained regular RAF personnel who attained a paid rank promotion during the three-year period 1 April 2015 to 31 March 2018.b. Length of Service has been calculated using entry date. There are known problems with the entry date information extracted from JPA. If personnel have transferred to the RAF from another Service, have served under an alternative assignment type (e.g. reserve forces), are re-entrants or have transferred from Other Ranks to Officers, their entry date may correspond to any of these events. The resulting LoS may reflect their current period of service, include previous service, or it may be the time that has elapsed since they first joined the Armed Forces, irrespective of any break in service. It will invariably include time spent on untrained strength.c. Small population sizes can create misleading averages. Where the actual number of promotions to paid rank by trade is less than or equal to 5 but greater than zero, average total length of service information has been suppressed and marked with a "-". Blank cells indicate no promotions have been recorded during the period. Greyed out cells have been used to create career profiles by trade as outlined in AP3376 Vol 2.
Produced by Defence Statistics (Air) Page 13
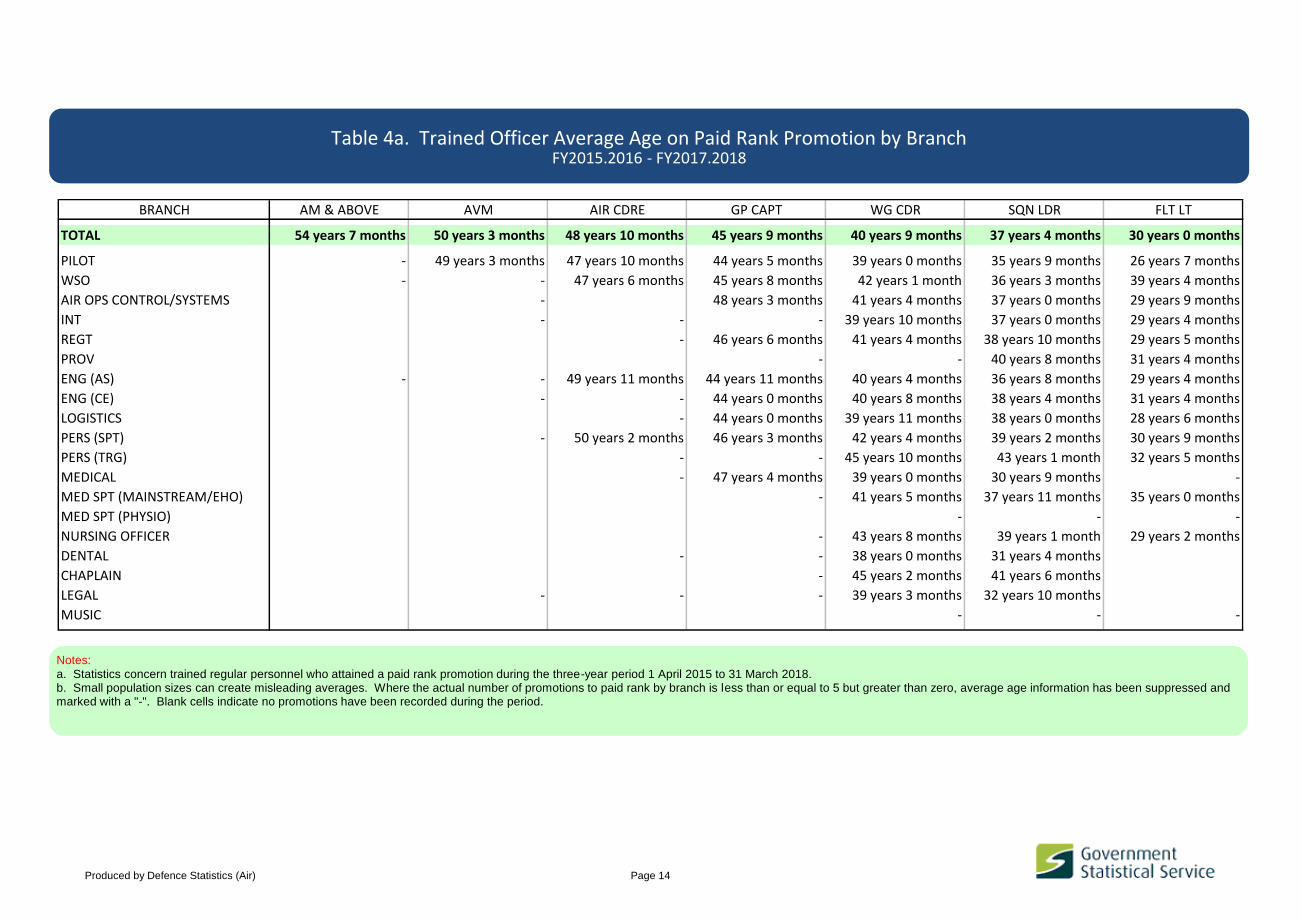
BRANCH AM & ABOVE AVM AIR CDRE GP CAPT WG CDR SQN LDR FLT LT
TOTAL 54 years 7 months 50 years 3 months 48 years 10 months 45 years 9 months 40 years 9 months 37 years 4 months 30 years 0 months
PILOT - 49 years 3 months 47 years 10 months 44 years 5 months 39 years 0 months 35 years 9 months 26 years 7 months
WSO - - 47 years 6 months 45 years 8 months 42 years 1 month 36 years 3 months 39 years 4 months
AIR OPS CONTROL/SYSTEMS - 48 years 3 months 41 years 4 months 37 years 0 months 29 years 9 months
INT - - - 39 years 10 months 37 years 0 months 29 years 4 months
REGT - 46 years 6 months 41 years 4 months 38 years 10 months 29 years 5 months
PROV - - 40 years 8 months 31 years 4 months
ENG (AS) - - 49 years 11 months 44 years 11 months 40 years 4 months 36 years 8 months 29 years 4 months
ENG (CE) - - 44 years 0 months 40 years 8 months 38 years 4 months 31 years 4 months
LOGISTICS - 44 years 0 months 39 years 11 months 38 years 0 months 28 years 6 months
PERS (SPT) - 50 years 2 months 46 years 3 months 42 years 4 months 39 years 2 months 30 years 9 months
PERS (TRG) - - 45 years 10 months 43 years 1 month 32 years 5 months
MEDICAL - 47 years 4 months 39 years 0 months 30 years 9 months -
MED SPT (MAINSTREAM/EHO) - 41 years 5 months 37 years 11 months 35 years 0 months
MED SPT (PHYSIO) - - -
NURSING OFFICER - 43 years 8 months 39 years 1 month 29 years 2 months
DENTAL - - 38 years 0 months 31 years 4 months
CHAPLAIN - 45 years 2 months 41 years 6 months
LEGAL - - - 39 years 3 months 32 years 10 months
MUSIC - - -
Table 4a. Trained Officer Average Age on Paid Rank Promotion by BranchFY2015.2016 - FY2017.2018
Notes:a. Statistics concern trained regular personnel who attained a paid rank promotion during the three-year period 1 April 2015 to 31 March 2018.b. Small population sizes can create misleading averages. Where the actual number of promotions to paid rank by branch is less than or equal to 5 but greater than zero, average age information has been suppressed and marked with a "-". Blank cells indicate no promotions have been recorded during the period.
Produced by Defence Statistics (Air) Page 14

TOTAL 47 years 11 months 42 years 5 months 40 years 6 months 35 years 1 month 29 years 1 month 24 years 9 months
TG1 A Eng Tech 50 years 4 months 45 years 6 months
TG1 A Tech Av 39 years 9 months 35 years 9 months 28 years 4 months 24 years 3 months
TG1 A Tech M 40 years 5 months 36 years 4 months 29 years 5 months 24 years 0 months
TG1 Eng Tech W 51 years 2 months 45 years 5 months 41 years 11 months 35 years 11 months 29 years 2 months 24 years 3 months
Trade Group 1 50 years 5 months 45 years 5 months 40 years 4 months 36 years 0 months 28 years 11 months 24 years 2 months
TG4 ICT Man 48 years 7 months 43 years 4 months
TG4 ICT Tech 35 years 3 months 29 years 7 months 25 years 2 months
TG4 ICT CIT 36 years 5 months 28 years 6 months
Trade Group 4 48 years 7 months 43 years 2 months 35 years 4 months 29 years 6 months 25 years 2 months
TG5 Gen Eng Tech 49 years 2 months 47 years 1 month
TG5 Gen Tech E 40 years 9 months 35 years 11 months 28 years 10 months 24 years 10 months
TG5 Gen Tech M 41 years 2 months 35 years 8 months 30 years 9 months 24 years 7 months
TG5 Gen Tech WS 44 years 7 months 36 years 2 months 30 years 1 month 24 years 1 month
Trade Group 5 49 years 2 months 47 years 1 month 41 years 6 months 35 years 9 months 29 years 11 months 24 years 8 months
TG6 Log(Driver) 46 years 7 months 43 years 10 months 36 years 2 months 29 years 4 months
Trade Group 6 46 years 7 months 43 years 10 months 36 years 2 months 29 years 4 months
TG8 Fftr 45 years 10 months 41 years 4 months 35 years 6 months 29 years 4 months
TG8 Gnr 49 years 4 months 39 years 11 months 33 years 4 months 28 years 9 months 27 years 9 months
TG8 RAFP 47 years 11 months 43 years 0 months 35 years 0 months 29 years 3 months
Trade Group 8 47 years 9 months 41 years 6 months 34 years 5 months 29 years 1 month 27 years 9 months
SAC(T) or L/CPL if GnrGROUND TRADES WO FLT SGT CHF TECH SGT CPL
Table 4b. Trained Other Ranks Average Age on Paid Rank Promotion by TradeFY2015.2016 - FY2017.2018
Produced by Defence Statistics (Air) Page 15

SAC(T) or L/CPL if GnrGROUND TRADES WO FLT SGT CHF TECH SGT CPL
TG9 ATC 42 years 5 months 36 years 5 months 26 years 1 month -
TG9 FOM/FOA 45 years 9 months 41 years 3 months 34 years 7 months 28 years 5 months
Trade Group 9 43 years 10 months 38 years 8 months 32 years 0 months 28 years 4 months
TG10 RAF PTI 44 years 7 months 38 years 10 months 32 years 8 months 25 years 3 months
Trade Group 10 44 years 7 months 38 years 10 months 32 years 8 months 25 years 3 months
TG11 Int An 43 years 2 months 39 years 11 months 34 years 3 months 30 years 1 month
TG11 Int An(L) - - 35 years 6 months 31 years 2 months
Trade Group 11 44 years 0 months 39 years 10 months 34 years 6 months 30 years 3 months
TG12 ASMOp 47 years 10 months 42 years 3 months 34 years 7 months 29 years 1 month
TG12 SNCO WC - 35 years 1 month 25 years 0 months
Trade Group 12 45 years 8 months 40 years 8 months 31 years 1 month 29 years 1 month
TG13 SE Fitt 49 years 5 months 42 years 7 months 37 years 2 months 29 years 9 months
Trade Group 13 49 years 5 months 42 years 7 months 37 years 2 months 29 years 9 months
TG14 Air Cart - - - -
TG14 Photo - - - 31 years 8 months
Trade Group 14 - - 38 years 2 months 31 years 8 months
TG15 Biomed - -
TG15 EH Tech - - 32 years 5 months 31 years 1 month -
TG15 ODP - - - -
TG15 PH Tech - - - - -
TG15 Radiog - - -
TG15 RAF Medic 44 years 5 months 39 years 4 months 34 years 5 months 29 years 6 months
TG15 RN(A) 41 years 2 months 35 years 3 months 30 years 4 months 26 years 4 months
TG15 RN(MH) - - -
Trade Group 15 43 years 5 months 36 years 10 months 32 years 0 months 28 years 1 month 27 years 7 months
Produced by Defence Statistics (Air) Page 16

SAC(T) or L/CPL if GnrGROUND TRADES WO FLT SGT CHF TECH SGT CPL
TG16 Dental Nurse - - - 28 years 10 months
Trade Group 16 - - - 28 years 10 months
TG17 Pers(Spt) 48 years 6 months 42 years 11 months 35 years 8 months 29 years 2 months
Trade Group 17 48 years 6 months 42 years 11 months 35 years 8 months 29 years 2 months
TG18 Log(Mov) 47 years 7 months 42 years 0 months 34 years 7 months 28 years 11 months
TG18 Log(Sup) 49 years 10 months 44 years 8 months 36 years 5 months 31 years 0 months
Trade Group 18 48 years 7 months 43 years 4 months 35 years 7 months 29 years 11 months
TG19 Log(AGS) - 45 years 4 months 36 years 1 month 29 years 2 months
TG19 Log(Chef) 50 years 1 month 44 years 2 months 36 years 2 months 29 years 8 months
Trade Group 19 50 years 5 months 44 years 7 months 36 years 1 month 29 years 4 months
TG21 Musn - 46 years 10 months 41 years 9 months 37 years 3 months 29 years 11 months
Trade Group 21 - 46 years 10 months 41 years 9 months 37 years 3 months 29 years 11 months
TOTAL 44 years 9 months 36 years 9 months
NCA WSOp(A Eng) - -
NCA WSOp(Crew) 43 years 8 months 35 years 9 months
NCA WSOp(EW/Acc) 45 years 11 months 37 years 7 months
NCA WSOp(L) - 40 years 4 months
NON-COMMISSIONED
AIRCREWMACR FLT SGT
Notes:a. Statistics concern trained regular RAF personnel who attained a paid rank promotion during the three-year period 1 April 2015 to 31 March 2018.b. Small population sizes can create misleading averages. Where the actual number of promotions to paid rank by trade is less than or equal to 5 but greater than zero, average age information has been suppressed and marked with a "-". Blank cells indicate no promotions have been recorded during the period. Greyed out cells have been used to create career profiles by trade as outlined in AP3376 Vol 2.
Produced by Defence Statistics (Air) Page 17

AIR CDRE &
ABOVEGP CAPT WG CDR SQN LDR JO Total
PILOT Workforce Requirement 1 50 60 200 440 1 280 2 040
Strength 40 70 180 350 960 1 600
Surplus/Deficit ~ ~ - 20 - 90 -330 -440
Surplus/Deficit % - 6.5% 7.7% - 10.9% - 20.2% - 25.4% - 21.4%
WSO Workforce Requirement 1 20 20 30 100 210 380
Strength 20 40 100 190 160 510
Surplus/Deficit ~ 20 70 90 - 40 130
Surplus/Deficit % - 11.1% 68.2% 206.3% 86.5% - 20.4% 33.2%
AIR OPS CONTROL/SYSTEMS Workforce Requirement 1 ~ 30 130 300 600 1 060
Strength ~ 20 120 240 520 910
Surplus/Deficit ~ - 10 ~ - 60 - 80 -150
Surplus/Deficit % - 80.0% - 35.7% - 3.1% - 18.5% - 13.3% - 14.4%
INT Workforce Requirement 1 ~ 10 50 110 170 340
Strength ~ 10 40 80 170 300
Surplus/Deficit - ~ - 10 - 30 ~ - 50
Surplus/Deficit % 0.0% - 22.2% - 23.9% - 30.4% 0.6% - 13.5%
REGT Workforce Requirement 1 ~ 10 50 100 190 360
Strength 10 10 50 90 170 330
Surplus/Deficit ~ - 10 - 10 - 20 - 20
Surplus/Deficit % 50.0% 0.0% 12.8% - 10.1% - 9.8% - 5.9%
PROV Workforce Requirement 1
10 30 60 90 180
Strength 10 20 50 80 160
Surplus/Deficit - - 10 ~ - 10 - 20
Surplus/Deficit % 0.0% - 24.1% - 8.9% - 14.4% - 13.7%
FLYI
NG
BR
AN
CH
GB
O e
xclu
din
g SP
ECIA
LIST
S
Table 5a. RAF Trained Regular Officer Strength vs Workforce Requirement by Branch & RankAs at 1 April 2018
Produced by Defence Statistics (Air) Page 18

AIR CDRE &
ABOVEGP CAPT WG CDR SQN LDR JO Total
ENG (AS) Workforce Requirement 1 20 30 120 280 310 760
Strength 20 30 110 250 270 680
Surplus/Deficit ~ ~ - 10 - 20 - 40 - 80
Surplus/Deficit % - 5.6% - 2.9% - 9.2% - 8.6% - 14.2% - 10.7%
ENG (CE) Workforce Requirement 1 10 20 70 150 190 440
Strength ~ 10 60 140 160 380
Surplus/Deficit ~ - 10 ~ - 20 - 30 - 60
Surplus/Deficit % - 28.6% - 36.4% - 3.0% - 10.5% - 18.0% - 14.2%
LOGISTICS Workforce Requirement 1 ~ 20 70 160 200 450
Strength ~ 20 60 150 200 430
Surplus/Deficit - ~ - 10 - 10 ~ - 20
Surplus/Deficit % 0.0% 11.1% - 8.5% - 8.6% - 1.0% - 4.4%
PERS (SPT) Workforce Requirement 1 ~ 20 80 170 220 500
Strength 10 20 70 180 220 500
Surplus/Deficit ~ ~ - 10 ~ ~ ~Surplus/Deficit % 100.0% 13.6% - 7.8% 1.7% 0.5% 1.0%
PERS (TRG) Workforce Requirement 1 - ~ 30 70 120 220
Strength ~ ~ 20 70 110 220
Surplus/Deficit ~ ~ ~ 10 - 10 ~Surplus/Deficit % - - 25.0% - 3.8% 9.0% - 5.8% - 0.9%
MEDICAL Workforce Requirement 1 10 30 120 90 10 250
Strength ~ 20 80 100 ~ 200
Surplus/Deficit ~ - 10 - 40 10 ~ - 50
Surplus/Deficit % - 16.7% - 44.4% - 37.5% 13.8% - 16.7% - 19.1%
MED SPT (MAINSTREAM/EHO) Workforce Requirement 1 ~ 10 30 40 90
Strength ~ 10 30 30 80
Surplus/Deficit ~ ~ ~ - 10 - 20
Surplus/Deficit % 50.0% - 7.7% - 15.6% - 23.3% - 16.7%
GB
O e
xclu
din
g SP
ECIA
LIST
SSP
ECIA
LIST
S
Produced by Defence Statistics (Air) Page 19

AIR CDRE &
ABOVEGP CAPT WG CDR SQN LDR JO Total
MED SPT (PHYSIO) Workforce Requirement 1 ~ 10 20 30
Strength ~ 10 20 30
Surplus/Deficit ~ ~ ~ ~
Surplus/Deficit % 200.0% - 9.1% 11.1% 10.0%
NURSING OFFICER Workforce Requirement 1 ~ 10 60 100 170
Strength ~ 10 50 70 130
Surplus/Deficit ~ ~ - 10 - 30 - 40
Surplus/Deficit % 150.0% 25.0% - 17.5% - 33.7% - 23.2%
DENTAL Workforce Requirement 1 - ~ 10 10 10 40
Strength ~ ~ 10 20 ~ 40
Surplus/Deficit ~ ~ ~ ~ ~ ~
Surplus/Deficit % - - 40.0% - 23.1% 28.6% - 16.7% - 2.6%
CHAPLAIN Workforce Requirement 1 ~ ~ 10 50 - 60
Strength ~ ~ 10 30 10 50
Surplus/Deficit - ~ 10 - 30 10 - 10
Surplus/Deficit % 0.0% 100.0% 116.7% - 50.0% - - 17.5%
LEGAL Workforce Requirement 1 ~ ~ 10 10 10 50
Strength ~ ~ 10 10 10 40
Surplus/Deficit - ~ - ~ ~ ~
Surplus/Deficit % 0.0% - 25.0% 0.0% - 7.7% - 14.3% - 8.5%
MUSIC Workforce Requirement 1 ~ - ~ ~
Strength ~ ~ ~ ~
Surplus/Deficit - ~ ~ -
Surplus/Deficit % 0.0% - - 50.0% 0.0%
SPEC
IALI
STS
Produced by Defence Statistics (Air) Page 20
AIR CDRE &
ABOVEGP CAPT WG CDR SQN LDR JO Total
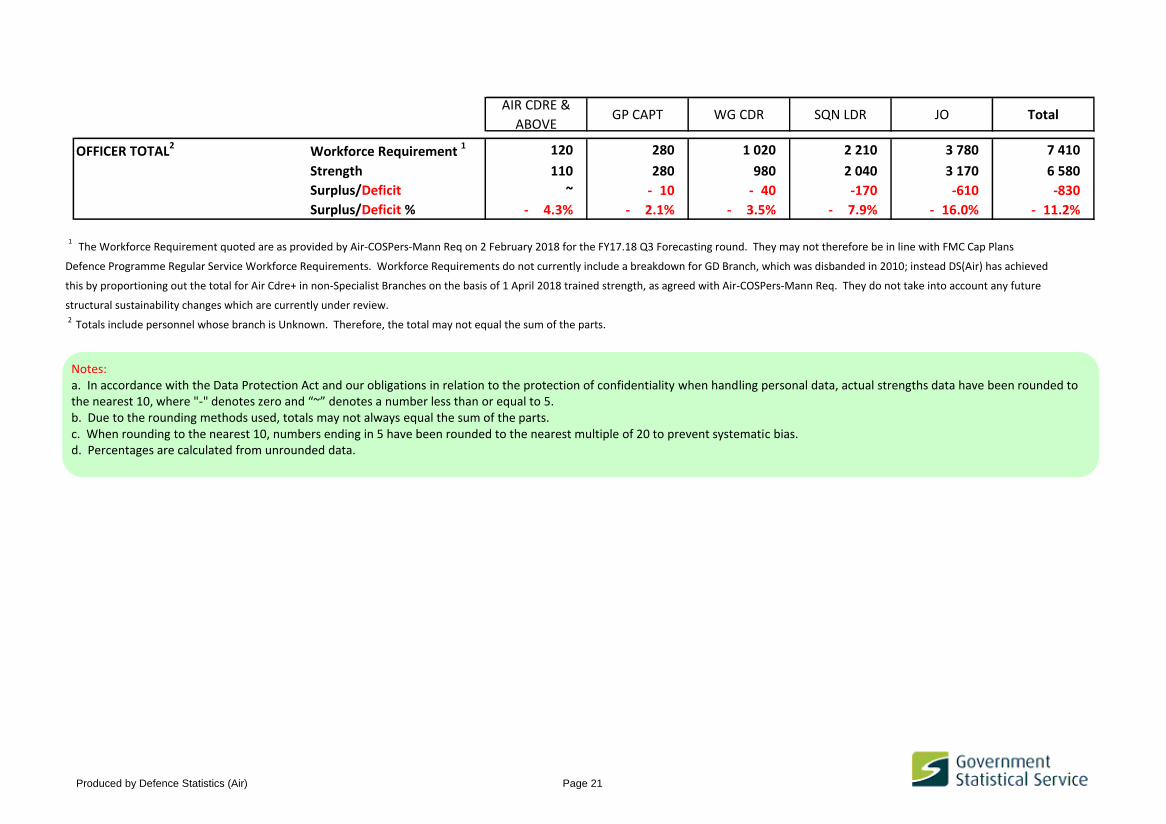
Workforce Requirement 1 120 280 1 020 2 210 3 780 7 410
Strength 110 280 980 2 040 3 170 6 580
Surplus/Deficit ~ - 10 - 40 -170 -610 -830
Surplus/Deficit % - 4.3% - 2.1% - 3.5% - 7.9% - 16.0% - 11.2%
1 The Workforce Requirement quoted are as provided by Air-COSPers-Mann Req on 2 February 2018 for the FY17.18 Q3 Forecasting round. They may not therefore be in line with FMC Cap Plans
Defence Programme Regular Service Workforce Requirements. Workforce Requirements do not currently include a breakdown for GD Branch, which was disbanded in 2010; instead DS(Air) has achieved
this by proportioning out the total for Air Cdre+ in non-Specialist Branches on the basis of 1 April 2018 trained strength, as agreed with Air-COSPers-Mann Req. They do not take into account any future
structural sustainability changes which are currently under review.2 Totals include personnel whose branch is Unknown. Therefore, the total may not equal the sum of the parts.
OFFICER TOTAL2
Notes:a. In accordance with the Data Protection Act and our obligations in relation to the protection of confidentiality when handling personal data, actual strengths data have been rounded to the nearest 10, where "-" denotes zero and “~” denotes a number less than or equal to 5. b. Due to the rounding methods used, totals may not always equal the sum of the parts. c. When rounding to the nearest 10, numbers ending in 5 have been rounded to the nearest multiple of 20 to prevent systematic bias.d. Percentages are calculated from unrounded data.
Produced by Defence Statistics (Air) Page 21

CPL
MACR FLT SGT SGT CPL & BELOW Total
Workforce Requirement 1 ~ ~ ~ 20
Strength 20 20 ~ 40
Surplus/Deficit 10 10 ~ 20
Surplus/Deficit % 240.0% 240.0% - 40.0% 146.7%
Workforce Requirement 1 80 150 230 460
Strength 90 130 250 460
Surplus/Deficit 10 - 30 20 ~
Surplus/Deficit % 8.6% - 17.1% 7.4% - 0.4%
Workforce Requirement 1 60 90 100 250
Strength 60 70 70 200
Surplus/Deficit - 10 - 20 - 30 - 50
Surplus/Deficit % - 9.8% - 17.2% - 32.7% - 21.7%
Workforce Requirement 1 20 20 40 - 80
Strength 10 10 20 ~ 40
Surplus/Deficit ~ - 10 - 20 ~ - 40
Surplus/Deficit % - 12.5% - 47.8% - 57.1% - - 44.4%
Workforce Requirement 1 160 270 380 - 810
Strength 170 230 340 20 760
Surplus/Deficit 10 - 40 - 40 20 - 50
Surplus/Deficit % 6.7% - 15.0% - 10.8% - - 6.6%
1 The Workforce Requirement quoted are as provided by Air-COSPers-Mann Req on 2 February 2018 for the FY17.18 Q3 Forecasting round. They may not therefore be in line with FMC Cap Plans Defence
Programme Regular Service Workforce Requirements. 2 Totals include personnel whose trade is Unknown. Therefore, the total may not equal the sum of the parts.
NCA WSOp(A ENG)
NCA WSOp(CREW)
NCA WSOp(EW/Acc)
NCA WSOp(L)
NCA TOTAL 2
Table 5b. RAF Trained Regular Non-Commissioned Aircrew Strength vs Workforce Requirement by Branch & RankAs at 1 April 2018
Notes:a. In accordance with the Data Protection Act and our obligations in relation to the protection of confidentiality when handling personal data, actual strengths data have been rounded to the nearest 10, where "-" denotes zero and “~” denotes a number less than or equal to 5. b. Due to the rounding methods used, totals may not always equal the sum of the parts. c. When rounding to the nearest 10, numbers ending in 5 have been rounded to the nearest multiple of 20 to prevent systematic bias.d. Percentages are calculated from unrounded data.
Produced by Defence Statistics (Air) Page 22

WO FLT SGT CHF TECH SGT CPL L/CPL AC to SAC(T) Total
TG1 A Eng Tech Workforce Requirement 1 110 220 340
Strength 130 190 320
Surplus/Deficit 20 - 30 - 20
Surplus/Deficit % 13.2% - 13.8% - 4.7%
TG1 A Tech Av Workforce Requirement 1 - 290 570 700 700 2 250
Strength 10 300 600 620 560 2 090
Surplus/Deficit 10 10 30 - 80 - 140 - 160
Surplus/Deficit % - 4.5% 4.9% - 11.0% - 19.4% - 7.3%
TG1 A Tech M Workforce Requirement 1 - 340 630 800 950 2 720
Strength ~ 320 620 770 900 2 600
Surplus/Deficit ~ - 20 - 20 - 30 - 50 - 120
Surplus/Deficit % - - 6.5% - 2.7% - 3.9% - 5.7% - 4.4%
TG1 AMM Av Workforce Requirement 1 150 150
Strength 420 420
Surplus/Deficit 270 270
Surplus/Deficit % 180.7% 180.7%
TG1 AMM M Workforce Requirement 1 220 220
Strength 450 450
Surplus/Deficit 230 230
Surplus/Deficit % 103.6% 103.6%
TG1 Eng Tech W Workforce Requirement 1 20 40 70 220 330 470 1 150
Strength 20 40 70 220 320 460 1 120
Surplus/Deficit ~ - ~ ~ - 10 - 10 - 30
Surplus/Deficit % - 4.2% 0.0% - 6.9% - 0.9% - 3.9% - 2.8% - 2.9%
TRADE GROUP 1 Workforce Requirement 1 140 260 700 1 430 1 830 2 480 6 840
Strength 150 240 690 1 440 1 710 2 780 7 000
Surplus/Deficit 10 - 20 - 10 10 - 120 300 160
Surplus/Deficit % 10.1% - 7.7% - 2.0% 0.6% - 6.6% 12.0% 2.4%
TRA
DE
GR
OU
P 1
Table 5c. RAF Trained Regular Ground Trade Strength vs Workforce Requirement by Trade & RankAs at 1 April 2018
Produced by Defence Statistics (Air) Page 23

WO FLT SGT CHF TECH SGT CPL L/CPL AC to SAC(T) Total
TG4 ICT Man Workforce Requirement 1 70 170 240
Strength 80 150 230
Surplus/Deficit 10 - 20 - 20
Surplus/Deficit % 9.7% - 14.5% - 7.3%
TG4 ICT Tech Workforce Requirement 1 500 790 830 2 120
Strength 420 660 790 1 870
Surplus/Deficit - 80 - 130 - 50 - 250
Surplus/Deficit % - 16.1% - 16.0% - 5.5% - 11.9%
TG4 ICT CIT Workforce Requirement 1 30 40 50 120
Strength 30 30 50 110
Surplus/Deficit - ~ ~ - 10
Surplus/Deficit % 0.0% - 8.6% - 7.7% - 6.0%
TRADE GROUP 4 Workforce Requirement 1 70 170 530 820 890 2 480
Strength 80 150 450 690 840 2 210
Surplus/Deficit 10 - 20 - 80 - 130 - 50 - 280
Surplus/Deficit % 9.7% - 14.5% - 15.2% - 15.7% - 5.6% - 11.2%
TG5 Gen Eng Tech Workforce Requirement 1 20 40 60
Strength 30 40 60
Surplus/Deficit ~ ~ ~
Surplus/Deficit % 12.0% - 2.6% 3.2%
TG5 Gen Tech E Workforce Requirement 1 20 50 160 210 440
Strength 20 40 140 190 400
Surplus/Deficit ~ - 10 - 10 - 30 - 40
Surplus/Deficit % 4.3% - 17.3% - 6.5% - 12.7% - 10.2%
TG5 Gen Tech M Workforce Requirement 1 40 120 220 390 770
Strength 40 100 180 370 690
Surplus/Deficit ~ - 20 - 40 - 20 - 90
Surplus/Deficit % - 10.3% - 17.7% - 16.8% - 5.9% - 11.1%
TRA
DE
GR
OU
P 4
TRA
DE
GR
OU
P 5
Produced by Defence Statistics (Air) Page 24
WO FLT SGT CHF TECH SGT CPL L/CPL AC to SAC(T) Total
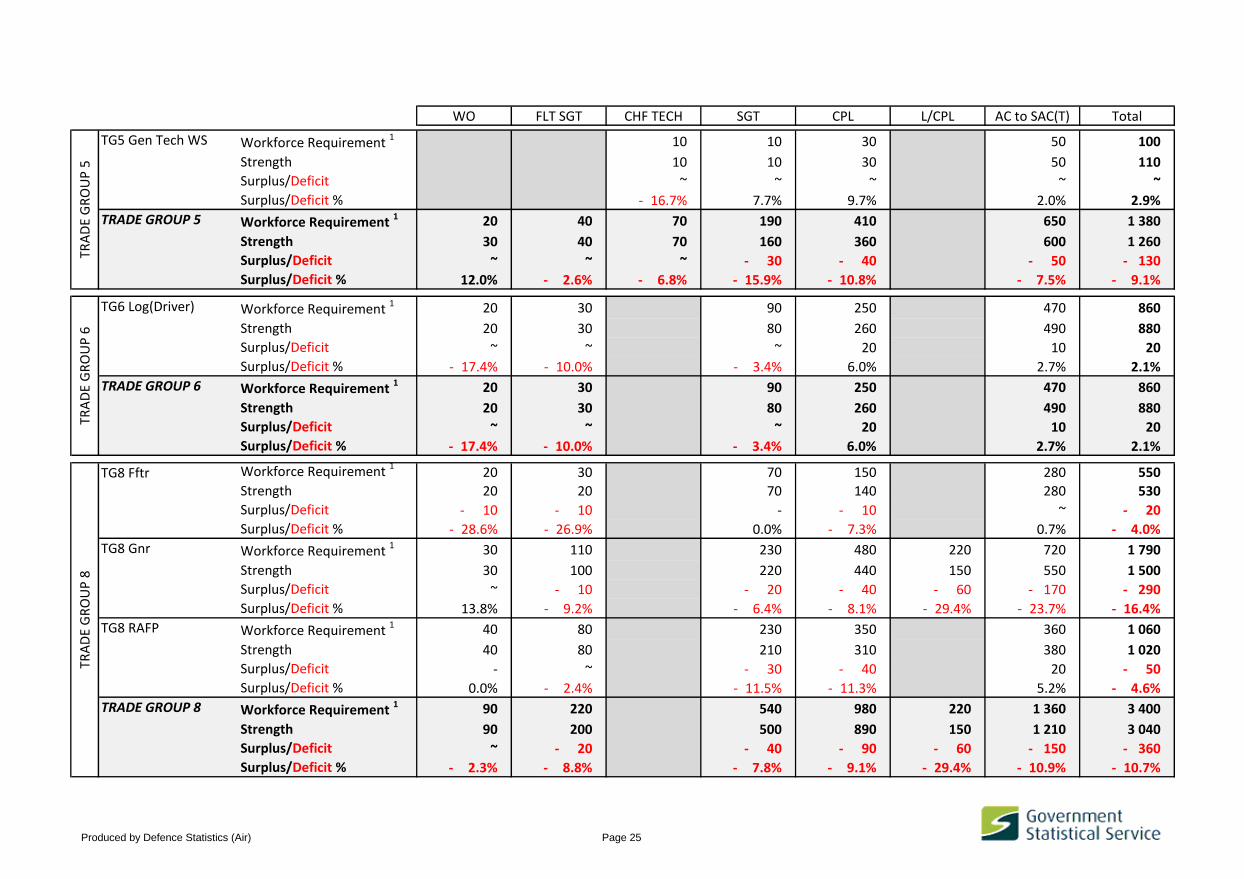
TG5 Gen Tech WS Workforce Requirement 1 10 10 30 50 100
Strength 10 10 30 50 110
Surplus/Deficit ~ ~ ~ ~ ~
Surplus/Deficit % - 16.7% 7.7% 9.7% 2.0% 2.9%
TRADE GROUP 5 Workforce Requirement 1 20 40 70 190 410 650 1 380
Strength 30 40 70 160 360 600 1 260
Surplus/Deficit ~ ~ ~ - 30 - 40 - 50 - 130
Surplus/Deficit % 12.0% - 2.6% - 6.8% - 15.9% - 10.8% - 7.5% - 9.1%
TG6 Log(Driver) Workforce Requirement 1 20 30 90 250 470 860
Strength 20 30 80 260 490 880
Surplus/Deficit ~ ~ ~ 20 10 20
Surplus/Deficit % - 17.4% - 10.0% - 3.4% 6.0% 2.7% 2.1%
TRADE GROUP 6 Workforce Requirement 1 20 30 90 250 470 860
Strength 20 30 80 260 490 880
Surplus/Deficit ~ ~ ~ 20 10 20
Surplus/Deficit % - 17.4% - 10.0% - 3.4% 6.0% 2.7% 2.1%
TG8 Fftr Workforce Requirement 1 20 30 70 150 280 550
Strength 20 20 70 140 280 530
Surplus/Deficit - 10 - 10 - - 10 ~ - 20
Surplus/Deficit % - 28.6% - 26.9% 0.0% - 7.3% 0.7% - 4.0%
TG8 Gnr Workforce Requirement 1 30 110 230 480 220 720 1 790
Strength 30 100 220 440 150 550 1 500
Surplus/Deficit ~ - 10 - 20 - 40 - 60 - 170 - 290
Surplus/Deficit % 13.8% - 9.2% - 6.4% - 8.1% - 29.4% - 23.7% - 16.4%
TG8 RAFP Workforce Requirement 1 40 80 230 350 360 1 060
Strength 40 80 210 310 380 1 020
Surplus/Deficit - ~ - 30 - 40 20 - 50
Surplus/Deficit % 0.0% - 2.4% - 11.5% - 11.3% 5.2% - 4.6%
TRADE GROUP 8 Workforce Requirement 1 90 220 540 980 220 1 360 3 400
Strength 90 200 500 890 150 1 210 3 040
Surplus/Deficit ~ - 20 - 40 - 90 - 60 - 150 - 360
Surplus/Deficit % - 2.3% - 8.8% - 7.8% - 9.1% - 29.4% - 10.9% - 10.7%
TRA
DE
GR
OU
P 5
TRA
DE
GR
OU
P 6
TRA
DE
GR
OU
P 8
Produced by Defence Statistics (Air) Page 25

WO FLT SGT CHF TECH SGT CPL L/CPL AC to SAC(T) Total
TG9 ATC Workforce Requirement 1 50 80 200 320
Strength 50 70 150 280
Surplus/Deficit ~ ~ - 40 - 50
Surplus/Deficit % 6.3% - 6.5% - 22.3% - 14.3%
TG9 FOM/FOA Workforce Requirement 1 30 50 130 230 400 840
Strength 20 50 130 230 380 810
Surplus/Deficit ~ - 10 ~ ~ - 20 - 30
Surplus/Deficit % - 3.8% - 11.3% - 2.3% - 1.7% - 4.3% - 3.7%
TRADE GROUP 9 Workforce Requirement 1 70 130 330 230 400 1 160
Strength 80 120 280 230 380 1 090
Surplus/Deficit ~ - 10 - 50 ~ - 20 - 80
Surplus/Deficit % 2.7% - 8.5% - 14.3% - 1.7% - 4.3% - 6.6%
TG10 RAF PTI Workforce Requirement 1 20 50 150 200 420
Strength 20 50 150 180 400
Surplus/Deficit ~ ~ - 10 - 20 - 20
Surplus/Deficit % 5.6% 1.9% - 3.9% - 10.7% - 5.9%
TRADE GROUP 10 Workforce Requirement 1 20 50 150 200 420
Strength 20 50 150 180 400
Surplus/Deficit ~ ~ - 10 - 20 - 20
Surplus/Deficit % 5.6% 1.9% - 3.9% - 10.7% - 5.9%
TRA
DE
GR
OU
P 9
TRA
DE
GR
OU
P 1
0
Produced by Defence Statistics (Air) Page 26
WO FLT SGT CHF TECH SGT CPL L/CPL AC to SAC(T) Total
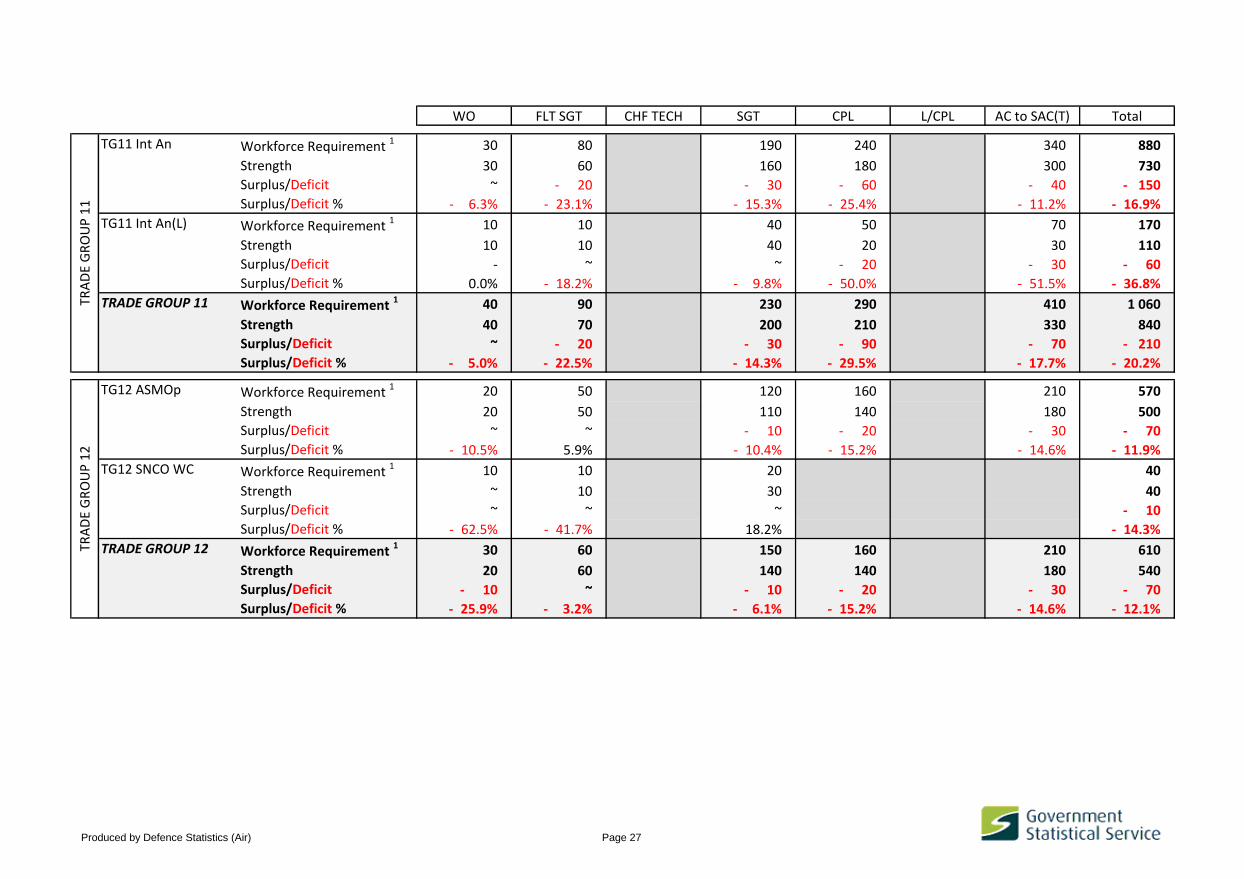
TG11 Int An Workforce Requirement 1 30 80 190 240 340 880
Strength 30 60 160 180 300 730
Surplus/Deficit ~ - 20 - 30 - 60 - 40 - 150
Surplus/Deficit % - 6.3% - 23.1% - 15.3% - 25.4% - 11.2% - 16.9%
TG11 Int An(L) Workforce Requirement 1 10 10 40 50 70 170
Strength 10 10 40 20 30 110
Surplus/Deficit - ~ ~ - 20 - 30 - 60
Surplus/Deficit % 0.0% - 18.2% - 9.8% - 50.0% - 51.5% - 36.8%
TRADE GROUP 11 Workforce Requirement 1 40 90 230 290 410 1 060
Strength 40 70 200 210 330 840
Surplus/Deficit ~ - 20 - 30 - 90 - 70 - 210
Surplus/Deficit % - 5.0% - 22.5% - 14.3% - 29.5% - 17.7% - 20.2%
TG12 ASMOp Workforce Requirement 1 20 50 120 160 210 570
Strength 20 50 110 140 180 500
Surplus/Deficit ~ ~ - 10 - 20 - 30 - 70
Surplus/Deficit % - 10.5% 5.9% - 10.4% - 15.2% - 14.6% - 11.9%
TG12 SNCO WC Workforce Requirement 1 10 10 20 40
Strength ~ 10 30 40
Surplus/Deficit ~ ~ ~ - 10
Surplus/Deficit % - 62.5% - 41.7% 18.2% - 14.3%
TRADE GROUP 12 Workforce Requirement 1 30 60 150 160 210 610
Strength 20 60 140 140 180 540
Surplus/Deficit - 10 ~ - 10 - 20 - 30 - 70
Surplus/Deficit % - 25.9% - 3.2% - 6.1% - 15.2% - 14.6% - 12.1%
TRA
DE
GR
OU
P 1
1TR
AD
E G
RO
UP
12
Produced by Defence Statistics (Air) Page 27

WO FLT SGT CHF TECH SGT CPL L/CPL AC to SAC(T) Total
TG13 SE Fitt Workforce Requirement 1 10 20 60 200 200 500
Strength 10 20 60 210 210 510
Surplus/Deficit ~ ~ ~ 10 ~ 10
Surplus/Deficit % - 15.4% 16.7% - 7.8% 5.5% 1.0% 1.8%
TRADE GROUP 13 Workforce Requirement 1 10 20 60 200 200 500
Strength 10 20 60 210 210 510
Surplus/Deficit ~ ~ ~ 10 ~ 10
Surplus/Deficit % - 15.4% 16.7% - 7.8% 5.5% 1.0% 1.8%
TG14 Air Cart Workforce Requirement 1 ~ 10 20 20 30 70
Strength ~ ~ 20 20 30 70
Surplus/Deficit ~ ~ - ~ - ~
Surplus/Deficit % 33.3% - 16.7% 0.0% 5.6% 0.0% 1.4%
TG14 Photo Workforce Requirement 1 ~ ~ 20 30 50 100
Strength ~ ~ 20 30 40 100
Surplus/Deficit - ~ ~ ~ ~ ~
Surplus/Deficit % 0.0% 33.3% 4.8% 13.3% - 8.5% 1.9%
TRADE GROUP 14 Workforce Requirement 1 ~ 10 40 50 70 170
Strength 10 10 40 50 70 180
Surplus/Deficit ~ - ~ ~ ~ ~
Surplus/Deficit % 20.0% 0.0% 2.6% 10.4% - 5.5% 1.7%
TG15 Biomed Workforce Requirement 1 ~ ~ 10 - 10
Strength ~ ~ 10 ~ 10
Surplus/Deficit - - ~ ~ ~
Surplus/Deficit % 0.0% 0.0% - 12.5% - 7.7%
TG15 EH Tech Workforce Requirement 1 ~ 10 10 20 ~ 40
Strength ~ 10 10 10 ~ 40
Surplus/Deficit - - ~ ~ ~ ~
Surplus/Deficit % 0.0% 0.0% 10.0% - 29.4% 66.7% - 5.1%
TG15 ODP Workforce Requirement 1 ~ ~ 10 10 10 20
Strength ~ ~ ~ 10 ~ 20
Surplus/Deficit - ~ ~ - ~ - 10
Surplus/Deficit % 0.0% - 33.3% - 66.7% 0.0% - 66.7% - 37.5%
TRA
DE
GR
OU
P 1
4TR
AD
E G
RO
UP
13
TRA
DE
GR
OU
P 1
5
Produced by Defence Statistics (Air) Page 28
WO FLT SGT CHF TECH SGT CPL L/CPL AC to SAC(T) Total
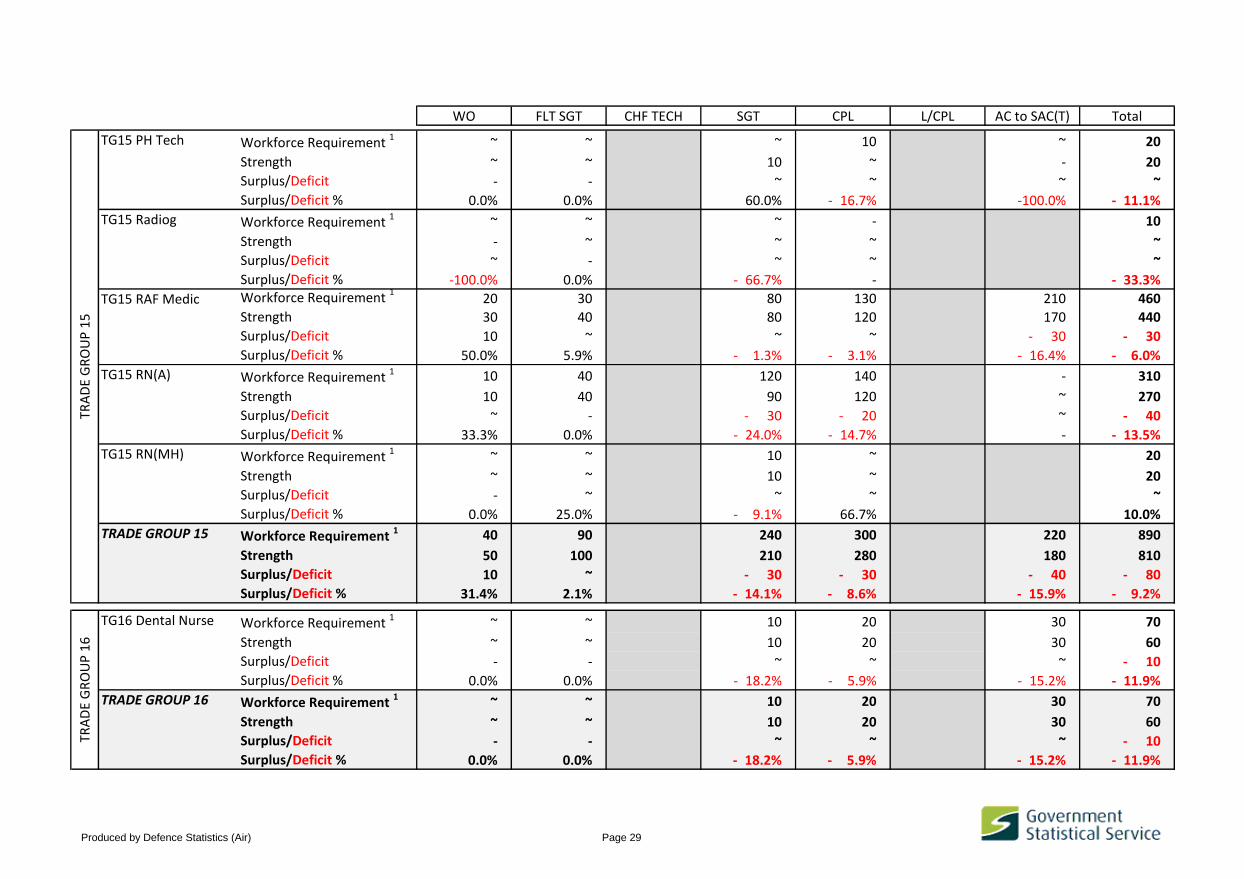
TG15 PH Tech Workforce Requirement 1 ~ ~ ~ 10 ~ 20
Strength ~ ~ 10 ~ - 20
Surplus/Deficit - - ~ ~ ~ ~
Surplus/Deficit % 0.0% 0.0% 60.0% - 16.7% -100.0% - 11.1%
TG15 Radiog Workforce Requirement 1 ~ ~ ~ - 10
Strength - ~ ~ ~ ~
Surplus/Deficit ~ - ~ ~ ~
Surplus/Deficit % -100.0% 0.0% - 66.7% - - 33.3%
TG15 RAF Medic Workforce Requirement 1 20 30 80 130 210 460
Strength 30 40 80 120 170 440
Surplus/Deficit 10 ~ ~ ~ - 30 - 30
Surplus/Deficit % 50.0% 5.9% - 1.3% - 3.1% - 16.4% - 6.0%
TG15 RN(A) Workforce Requirement 1 10 40 120 140 - 310
Strength 10 40 90 120 ~ 270
Surplus/Deficit ~ - - 30 - 20 ~ - 40
Surplus/Deficit % 33.3% 0.0% - 24.0% - 14.7% - - 13.5%
TG15 RN(MH) Workforce Requirement 1 ~ ~ 10 ~ 20
Strength ~ ~ 10 ~ 20
Surplus/Deficit - ~ ~ ~ ~
Surplus/Deficit % 0.0% 25.0% - 9.1% 66.7% 10.0%
TRADE GROUP 15 Workforce Requirement 1 40 90 240 300 220 890
Strength 50 100 210 280 180 810
Surplus/Deficit 10 ~ - 30 - 30 - 40 - 80
Surplus/Deficit % 31.4% 2.1% - 14.1% - 8.6% - 15.9% - 9.2%
TG16 Dental Nurse Workforce Requirement 1 ~ ~ 10 20 30 70
Strength ~ ~ 10 20 30 60
Surplus/Deficit - - ~ ~ ~ - 10
Surplus/Deficit % 0.0% 0.0% - 18.2% - 5.9% - 15.2% - 11.9%
TRADE GROUP 16 Workforce Requirement 1 ~ ~ 10 20 30 70
Strength ~ ~ 10 20 30 60
Surplus/Deficit - - ~ ~ ~ - 10
Surplus/Deficit % 0.0% 0.0% - 18.2% - 5.9% - 15.2% - 11.9%
TRA
DE
GR
OU
P 1
5TR
AD
E G
RO
UP
16
Produced by Defence Statistics (Air) Page 29

WO FLT SGT CHF TECH SGT CPL L/CPL AC to SAC(T) Total
TG17 Pers(Spt) Workforce Requirement 1 60 100 290 320 310 1 090
Strength 70 100 280 280 250 990
Surplus/Deficit 10 ~ - 10 - 50 - 60 - 100
Surplus/Deficit % 13.1% - 1.9% - 2.7% - 14.2% - 18.1% - 9.5%
TRADE GROUP 17 Workforce Requirement 1 60 100 290 320 310 1 090
Strength 70 100 280 280 250 990
Surplus/Deficit 10 ~ - 10 - 50 - 60 - 100
Surplus/Deficit % 13.1% - 1.9% - 2.7% - 14.2% - 18.1% - 9.5%
TG18 Log(Mov) Workforce Requirement 1 40 70 160 230 390 890
Strength 40 60 160 230 420 920
Surplus/Deficit ~ - 10 ~ 10 30 30
Surplus/Deficit % 5.3% - 8.5% 3.2% 2.7% 6.6% 3.7%
TG18 Log(Sup) Workforce Requirement 1 40 60 210 390 680 1 380
Strength 40 70 190 340 650 1 300
Surplus/Deficit ~ ~ - 20 - 40 - 30 - 80
Surplus/Deficit % 8.1% 1.5% - 7.7% - 11.1% - 4.2% - 6.1%
TRADE GROUP 18 Workforce Requirement 1 80 140 360 610 1 080 2 260
Strength 80 130 350 580 1 070 2 210
Surplus/Deficit ~ ~ - 10 - 40 ~ - 50
Surplus/Deficit % 6.7% - 3.7% - 3.0% - 6.0% - 0.3% - 2.3%
TRA
DE
GR
OU
P 1
7TR
AD
E G
RO
UP
18
Produced by Defence Statistics (Air) Page 30

WO FLT SGT CHF TECH SGT CPL L/CPL AC to SAC(T) Total
TG19 Log(AGS) Workforce Requirement 1 10 20 40 120 200 390
Strength 10 10 30 100 200 350
Surplus/Deficit ~ ~ - 10 - 20 - 10 - 40
Surplus/Deficit % - 14.3% - 23.5% - 19.4% - 14.7% - 4.4% - 10.1%
TG19 Log(Chef) Workforce Requirement 1 20 20 50 130 230 450
Strength 20 20 40 120 240 440
Surplus/Deficit ~ ~ - 10 - 10 10 - 20
Surplus/Deficit % - 11.1% - 21.7% - 15.4% - 9.4% 4.3% - 3.8%
TRADE GROUP 19 Workforce Requirement 1 30 40 90 240 440 840
Strength 30 30 70 210 440 780
Surplus/Deficit ~ - 10 - 20 - 30 ~ - 60
Surplus/Deficit % - 12.5% - 22.5% - 17.0% - 11.9% 0.2% - 6.7%
TG21 Musn Workforce Requirement 1 ~ 10 20 30 50 70 180
Strength ~ 10 20 30 50 60 160
Surplus/Deficit - ~ - ~ - - 20 - 20
Surplus/Deficit % 0.0% 14.3% 0.0% - 3.4% 0.0% - 21.1% - 8.6%
TRADE GROUP 21 Workforce Requirement 1 ~ 10 20 30 50 70 180
Strength ~ 10 20 30 50 60 160
Surplus/Deficit - ~ - ~ - - 20 - 20
Surplus/Deficit % 0.0% 14.3% 0.0% - 3.4% 0.0% - 21.1% - 8.6%
Workforce Requirement 1 730 1 460 790 4 760 6 970 220 8 930 24 230
Strength 760 1 360 770 4 440 6 360 160 9 140 22 990
Surplus/Deficit 30 - 110 - 20 - 320 - 610 - 60 220 -1 240
Surplus/Deficit % 4.2% - 7.5% - 2.4% - 6.6% - 8.8% - 28.9% 2.4% - 5.1%1
The Workforce Requirement quoted are as provided by Air-COSPers-Mann Req on
2 February 2018 for the FY17.18 Q3 Forecasting round. They may not therefore be in
line with FMC Cap Plans Defence Programme Regular Service Workforce Requirements. 2 Totals include personnel whose trade is Unknown. Therefore, the total may not
equal the sum of the parts.
TRA
DE
GR
OU
P 2
1
TOTAL 2
TRA
DE
GR
OU
P 1
9
Notes:a. In accordance with the Data Protection Act and our obligations in relation to the protection of confidentiality when handling personal data, actual strengths data have been rounded to the nearest 10, where "-" denotes zero and “~” denotes a number less than or equal to 5. b. Due to the rounding methods used, totals may not always equal the sum of the parts. c. When rounding to the nearest 10, numbers ending in 5 have been rounded to the nearest multiple of 20 to prevent systematic bias.d. Percentages are calculated from unrounded data.
Produced by Defence Statistics (Air) Page 31

ALL OFFICERS
Air Cdre & Above
Gp Capt
Wg Cdr
Sqn Ldr
JO
PILOT WSO
Key
Table 6a. RAF Trained Regular Officer Demographics by Age, Paid Rank and Branch
As at 1 April 2018
0%
10%
20%
30%
40%
19 &under
20-24 25-29 30-34 35-39 40-44 45-49 50-54 55 & over
% o
f Per
sonn
el
Age (years)
0%
5%
10%
15%
20%
25%
19 & under 20-24 25-29 30-34 35-39 40-44 45-49 50-54 55 & over
% o
f Per
sonn
el
Age (years)
0%
10%
20%
30%
40%
19 &under
20-24 25-29 30-34 35-39 40-44 45-49 50-54 55 & over
% o
f Per
sonn
el
Age (years)
Produced by Defence Statistics (Air) Page 32
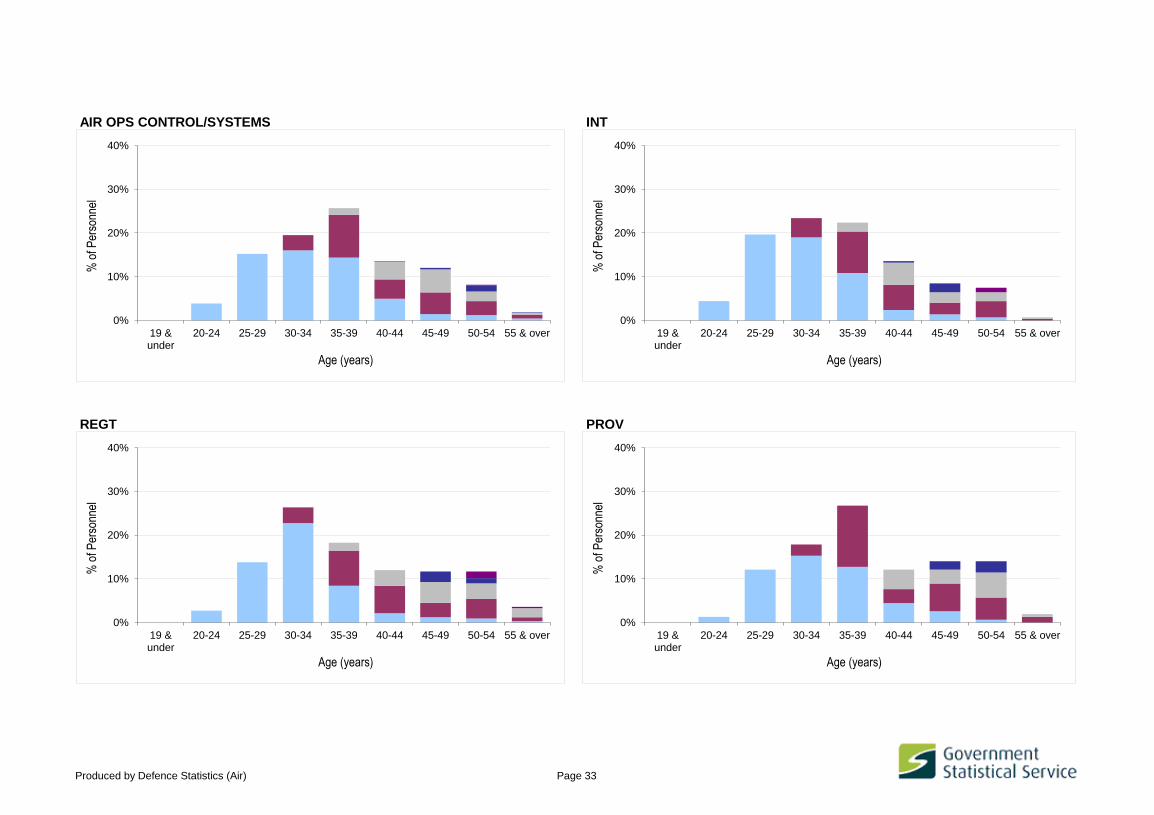
AIR OPS CONTROL/SYSTEMS INT
REGT PROV
0%
10%
20%
30%
40%
19 &under
20-24 25-29 30-34 35-39 40-44 45-49 50-54 55 & over
% o
f Per
sonn
el
Age (years)
0%
10%
20%
30%
40%
19 &under
20-24 25-29 30-34 35-39 40-44 45-49 50-54 55 & over
% o
f Per
sonn
el
Age (years)
0%
10%
20%
30%
40%
19 &under
20-24 25-29 30-34 35-39 40-44 45-49 50-54 55 & over
% o
f Per
sonn
el
Age (years)
0%
10%
20%
30%
40%
19 &under
20-24 25-29 30-34 35-39 40-44 45-49 50-54 55 & over
% o
f Per
sonn
el
Age (years)
Produced by Defence Statistics (Air) Page 33

ENG (AS) ENG (CE)
LOGISTICS PERS (SPT)
0%
10%
20%
30%
40%
19 &under
20-24 25-29 30-34 35-39 40-44 45-49 50-54 55 & over
% o
f Per
sonn
el
Age (years)
0%
10%
20%
30%
40%
19 &under
20-24 25-29 30-34 35-39 40-44 45-49 50-54 55 & over
% o
f Per
sonn
el
Age (years)
0%
10%
20%
30%
40%
19 &under
20-24 25-29 30-34 35-39 40-44 45-49 50-54 55 & over
% o
f Per
sonn
el
Age (years)
0%
10%
20%
30%
40%
19 &under
20-24 25-29 30-34 35-39 40-44 45-49 50-54 55 & over
% o
f Per
sonn
el
Age (years)
Produced by Defence Statistics (Air) Page 34

PERS (TRG) MEDICAL
MED SPT (MAINSTREAM/EHO) MED SPT (PHYSIO)
0%
10%
20%
30%
40%
19 &under
20-24 25-29 30-34 35-39 40-44 45-49 50-54 55 & over
% o
f Per
sonn
el
Age (years)
0%
10%
20%
30%
40%
50%
19 &under
20-24 25-29 30-34 35-39 40-44 45-49 50-54 55 & over
% o
f Per
sonn
el
Age (years)
0%
10%
20%
30%
40%
50%
19 &under
20-24 25-29 30-34 35-39 40-44 45-49 50-54 55 & over
% o
f Per
sonn
el
Age (years)
0%
10%
20%
30%
40%
19 &under
20-24 25-29 30-34 35-39 40-44 45-49 50-54 55 & over
% o
f Per
sonn
el
Age (years)
Produced by Defence Statistics (Air) Page 35

NURSING OFFICER DENTAL
CHAPLAIN LEGAL
0%
10%
20%
30%
40%
50%
19 &under
20-24 25-29 30-34 35-39 40-44 45-49 50-54 55 & over
% o
f Per
sonn
el
Age (years)
0%
10%
20%
30%
40%
50%
19 &under
20-24 25-29 30-34 35-39 40-44 45-49 50-54 55 & over
% o
f Per
sonn
el
Age (years)
0%
10%
20%
30%
40%
50%
19 &under
20-24 25-29 30-34 35-39 40-44 45-49 50-54 55 & over
% o
f Per
sonn
el
Age (years)
0%
10%
20%
30%
40%
50%
19 &under
20-24 25-29 30-34 35-39 40-44 45-49 50-54 55 & over
% o
f Per
sonn
el
Age (years)
Produced by Defence Statistics (Air) Page 36
MUSIC
Due to the disclosiveness of the data this graph has
been suppressed
Produced by Defence Statistics (Air) Page 37

ALL NCA (personnel whose paid rank is below Sgt are not shown but are included in the percentage calculations)
MACR
Flt Sgt
Sgt
NCA WSOp(A Eng) NCA WSOp(Crew)
Key
Table 6b. RAF Trained Regular Non-Commissioned Aircrew Demographics by Age, Paid Rank and Trade
As at 1 April 2018
0%
10%
20%
30%
40%
50%
60%
70%
19 &under
20-24 25-29 30-34 35-39 40-44 45-49 50-54 55 & over
% o
f Per
sonn
el
Age (years)
0%
10%
20%
30%
19 & under 20-24 25-29 30-34 35-39 40-44 45-49 50-54 55 & over
% o
f Per
sonn
el
Age (years)
0%
10%
20%
30%
40%
50%
19 &under
20-24 25-29 30-34 35-39 40-44 45-49 50-54 55 & over
% o
f Per
sonn
el
Age (years)
Produced by Defence Statistics (Air) Page 38
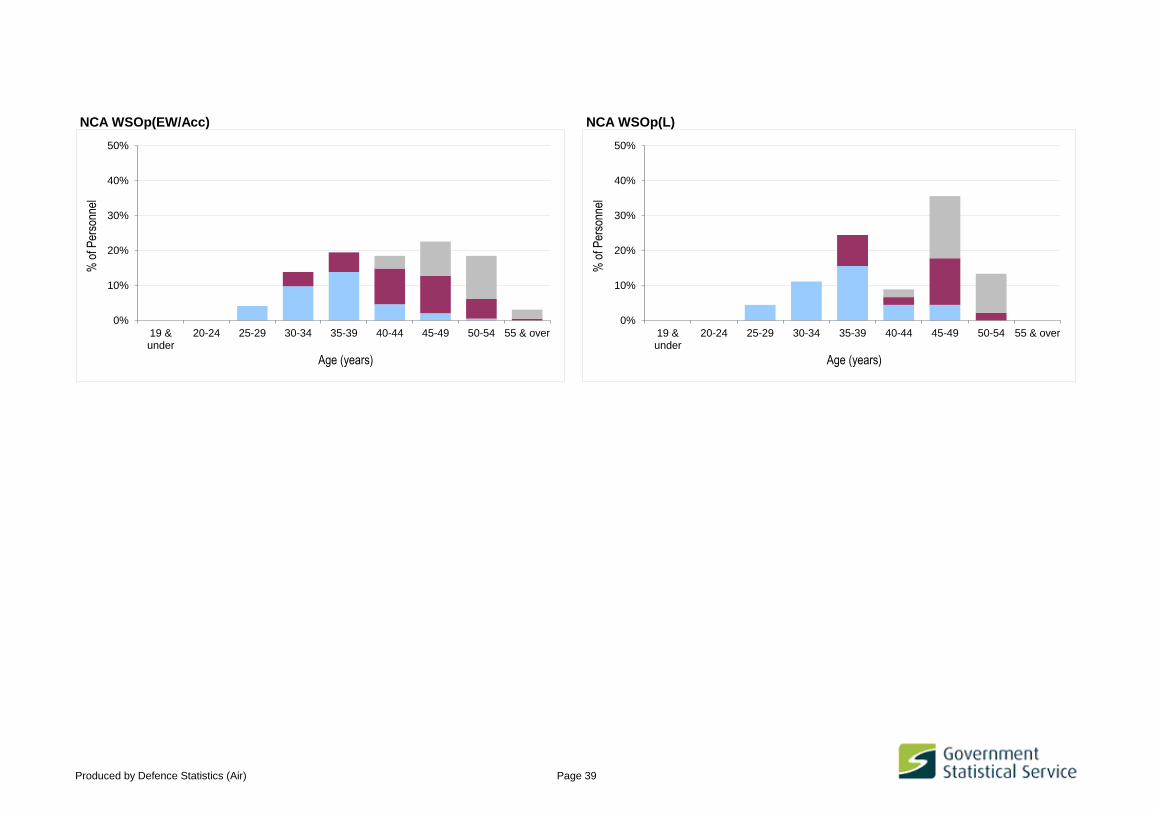
NCA WSOp(EW/Acc) NCA WSOp(L)
0%
10%
20%
30%
40%
50%
19 &under
20-24 25-29 30-34 35-39 40-44 45-49 50-54 55 & over
% o
f Per
sonn
el
Age (years)
0%
10%
20%
30%
40%
50%
19 &under
20-24 25-29 30-34 35-39 40-44 45-49 50-54 55 & over
% o
f Per
sonn
el
Age (years)
Produced by Defence Statistics (Air) Page 39
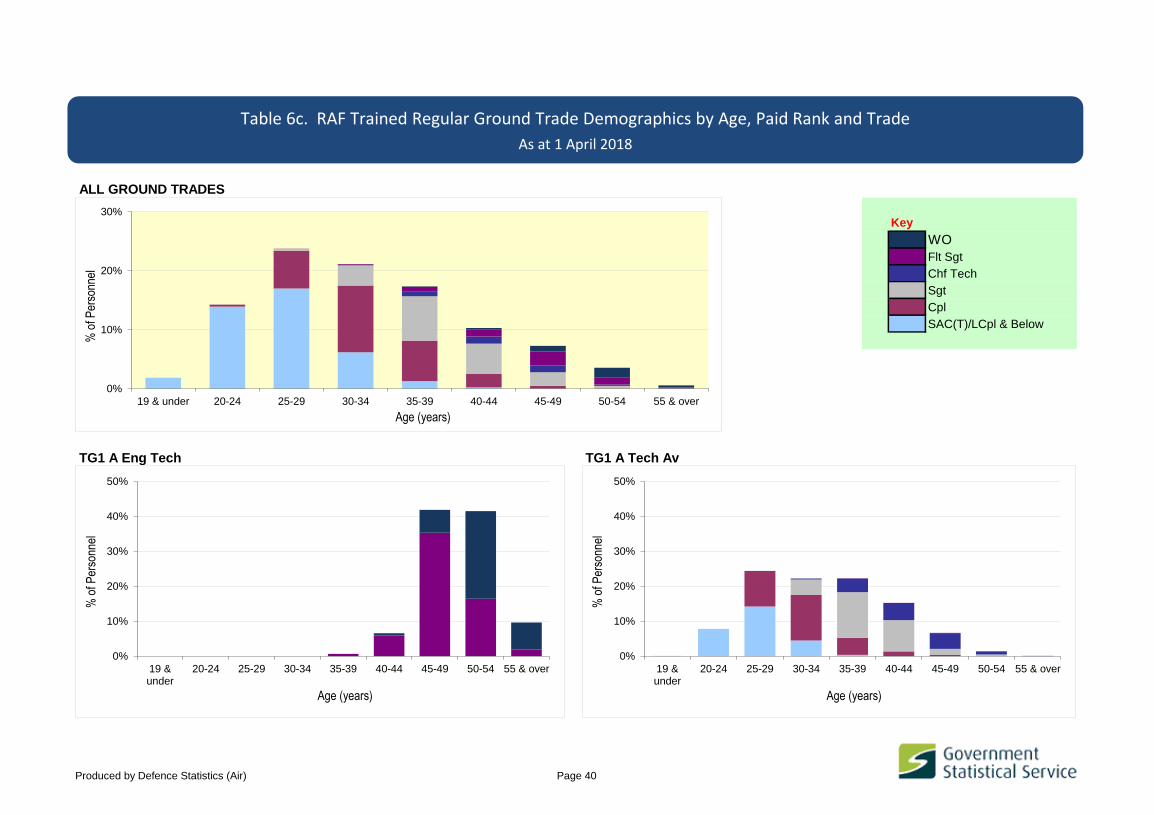
ALL GROUND TRADES
Key
WO
Flt Sgt
Chf Tech
Sgt
Cpl
SAC(T)/LCpl & Below
TG1 A Eng Tech TG1 A Tech Av
Table 6c. RAF Trained Regular Ground Trade Demographics by Age, Paid Rank and Trade
As at 1 April 2018
0%
10%
20%
30%
40%
50%
19 &under
20-24 25-29 30-34 35-39 40-44 45-49 50-54 55 & over
% o
f Per
sonn
el
Age (years)
0%
10%
20%
30%
19 & under 20-24 25-29 30-34 35-39 40-44 45-49 50-54 55 & over
% o
f Per
sonn
el
Age (years)
0%
10%
20%
30%
40%
50%
19 &under
20-24 25-29 30-34 35-39 40-44 45-49 50-54 55 & over
% o
f Per
sonn
el
Age (years)
Produced by Defence Statistics (Air) Page 40
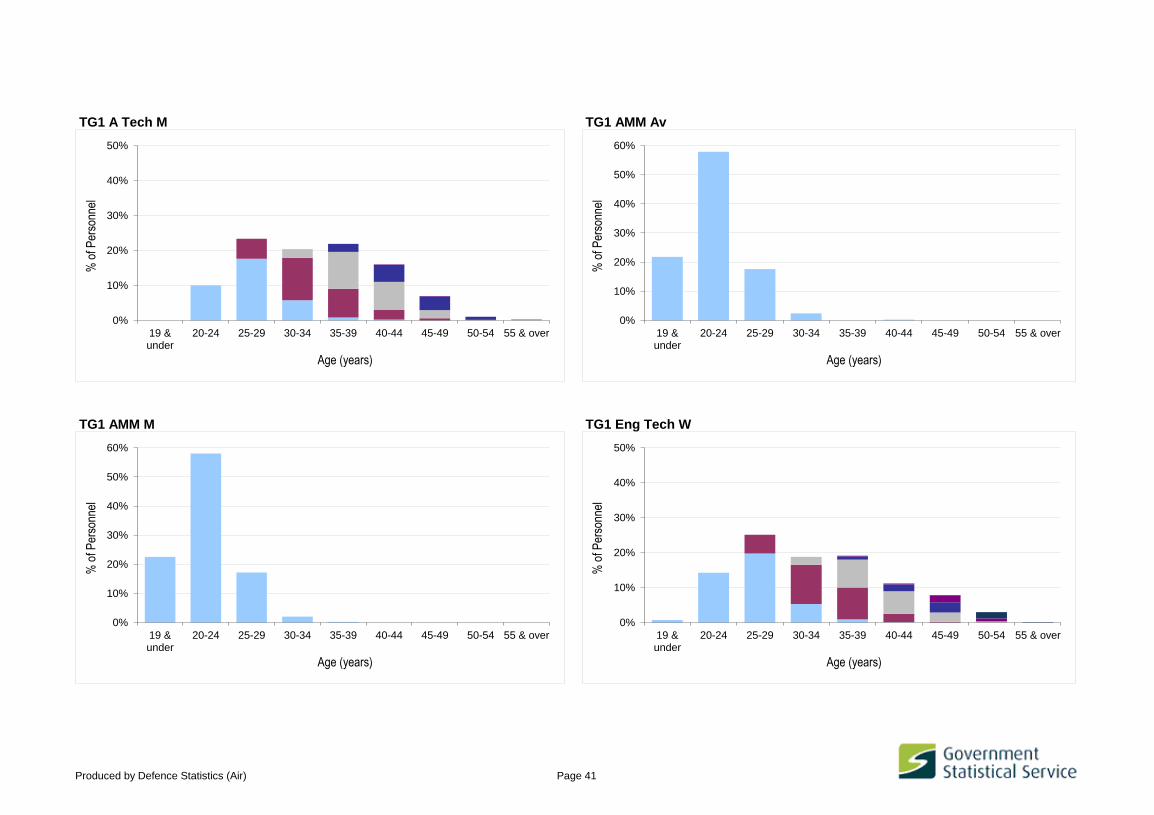
TG1 A Tech M TG1 AMM Av
TG1 AMM M TG1 Eng Tech W
0%
10%
20%
30%
40%
50%
19 &under
20-24 25-29 30-34 35-39 40-44 45-49 50-54 55 & over
% o
f Per
sonn
el
Age (years)
0%
10%
20%
30%
40%
50%
60%
19 &under
20-24 25-29 30-34 35-39 40-44 45-49 50-54 55 & over
% o
f Per
sonn
el
Age (years)
0%
10%
20%
30%
40%
50%
60%
19 &under
20-24 25-29 30-34 35-39 40-44 45-49 50-54 55 & over
% o
f Per
sonn
el
Age (years)
0%
10%
20%
30%
40%
50%
19 &under
20-24 25-29 30-34 35-39 40-44 45-49 50-54 55 & over
% o
f Per
sonn
el
Age (years)
Produced by Defence Statistics (Air) Page 41

TG4 ICT Man TG4 ICT Tech
TG4 ICT CIT TG5 Gen Eng Tech
0%
10%
20%
30%
40%
50%
19 &under
20-24 25-29 30-34 35-39 40-44 45-49 50-54 55 & over
% o
f Per
sonn
el
Age (years)
0%
10%
20%
30%
40%
50%
19 &under
20-24 25-29 30-34 35-39 40-44 45-49 50-54 55 & over
% o
f Per
sonn
el
Age (years)
0%
10%
20%
30%
40%
50%
19 &under
20-24 25-29 30-34 35-39 40-44 45-49 50-54 55 & over
% o
f Per
sonn
el
Age (years)
0%
10%
20%
30%
40%
50%
19 &under
20-24 25-29 30-34 35-39 40-44 45-49 50-54 55 & over
% o
f Per
sonn
el
Age (years)
Produced by Defence Statistics (Air) Page 42
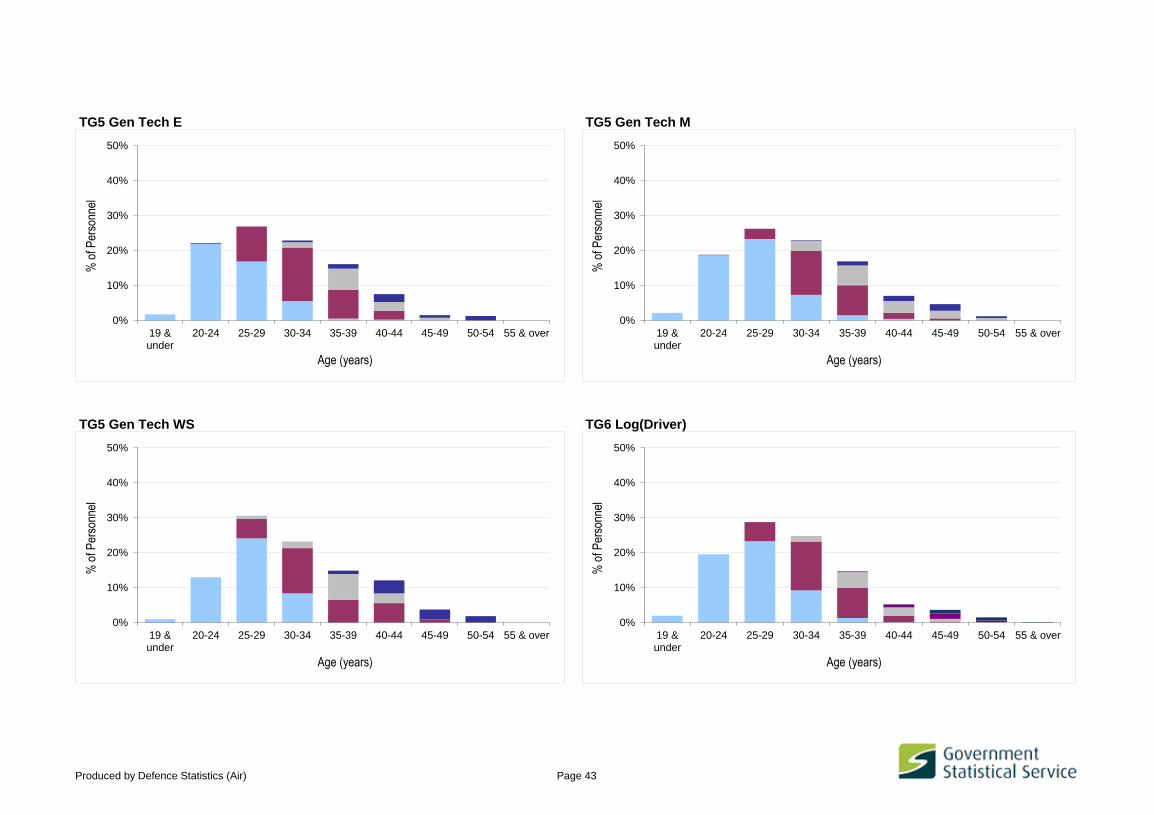
TG5 Gen Tech E TG5 Gen Tech M
TG5 Gen Tech WS TG6 Log(Driver)
0%
10%
20%
30%
40%
50%
19 &under
20-24 25-29 30-34 35-39 40-44 45-49 50-54 55 & over
% o
f Per
sonn
el
Age (years)
0%
10%
20%
30%
40%
50%
19 &under
20-24 25-29 30-34 35-39 40-44 45-49 50-54 55 & over
% o
f Per
sonn
el
Age (years)
0%
10%
20%
30%
40%
50%
19 &under
20-24 25-29 30-34 35-39 40-44 45-49 50-54 55 & over
% o
f Per
sonn
el
Age (years)
0%
10%
20%
30%
40%
50%
19 &under
20-24 25-29 30-34 35-39 40-44 45-49 50-54 55 & over
% o
f Per
sonn
el
Age (years)
Produced by Defence Statistics (Air) Page 43

TG8 Fftr TG8 Gnr
TG8 RAFP TG9 ATC
0%
10%
20%
30%
40%
50%
19 &under
20-24 25-29 30-34 35-39 40-44 45-49 50-54 55 & over
% o
f Per
sonn
el
Age (years)
0%
10%
20%
30%
40%
50%
19 &under
20-24 25-29 30-34 35-39 40-44 45-49 50-54 55 & over
% o
f Per
sonn
el
Age (years)
0%
10%
20%
30%
40%
50%
19 &under
20-24 25-29 30-34 35-39 40-44 45-49 50-54 55 & over
% o
f Per
sonn
el
Age (years)
0%
10%
20%
30%
40%
50%
19 &under
20-24 25-29 30-34 35-39 40-44 45-49 50-54 55 & over
% o
f Per
sonn
el
Age (years)
Produced by Defence Statistics (Air) Page 44

TG9 FOM/FOA TG10 RAF PTI
TG11 Int An TG11 Int An(L)
0%
10%
20%
30%
40%
50%
19 &under
20-24 25-29 30-34 35-39 40-44 45-49 50-54 55 & over
% o
f Per
sonn
el
Age (years)
0%
10%
20%
30%
40%
50%
19 &under
20-24 25-29 30-34 35-39 40-44 45-49 50-54 55 & over
% o
f Per
sonn
el
Age (years)
0%
10%
20%
30%
40%
50%
19 &under
20-24 25-29 30-34 35-39 40-44 45-49 50-54 55 & over
% o
f Per
sonn
el
Age (years)
0%
10%
20%
30%
40%
50%
19 &under
20-24 25-29 30-34 35-39 40-44 45-49 50-54 55 & over
% o
f Per
sonn
el
Age (years)
Produced by Defence Statistics (Air) Page 45

TG12 ASMOp TG12 SNCO WC
TG13 SE Fitt TG14 Air Cart
0%
10%
20%
30%
40%
50%
19 &under
20-24 25-29 30-34 35-39 40-44 45-49 50-54 55 & over
% o
f Per
sonn
el
Age (years)
0%
10%
20%
30%
40%
50%
19 &under
20-24 25-29 30-34 35-39 40-44 45-49 50-54 55 & over
% o
f Per
sonn
el
Age (years)
0%
10%
20%
30%
40%
50%
19 &under
20-24 25-29 30-34 35-39 40-44 45-49 50-54 55 & over
% o
f Per
sonn
el
Age (years)
0%
10%
20%
30%
40%
50%
19 &under
20-24 25-29 30-34 35-39 40-44 45-49 50-54 55 & over
% o
f Per
sonn
el
Age (years)
Produced by Defence Statistics (Air) Page 46
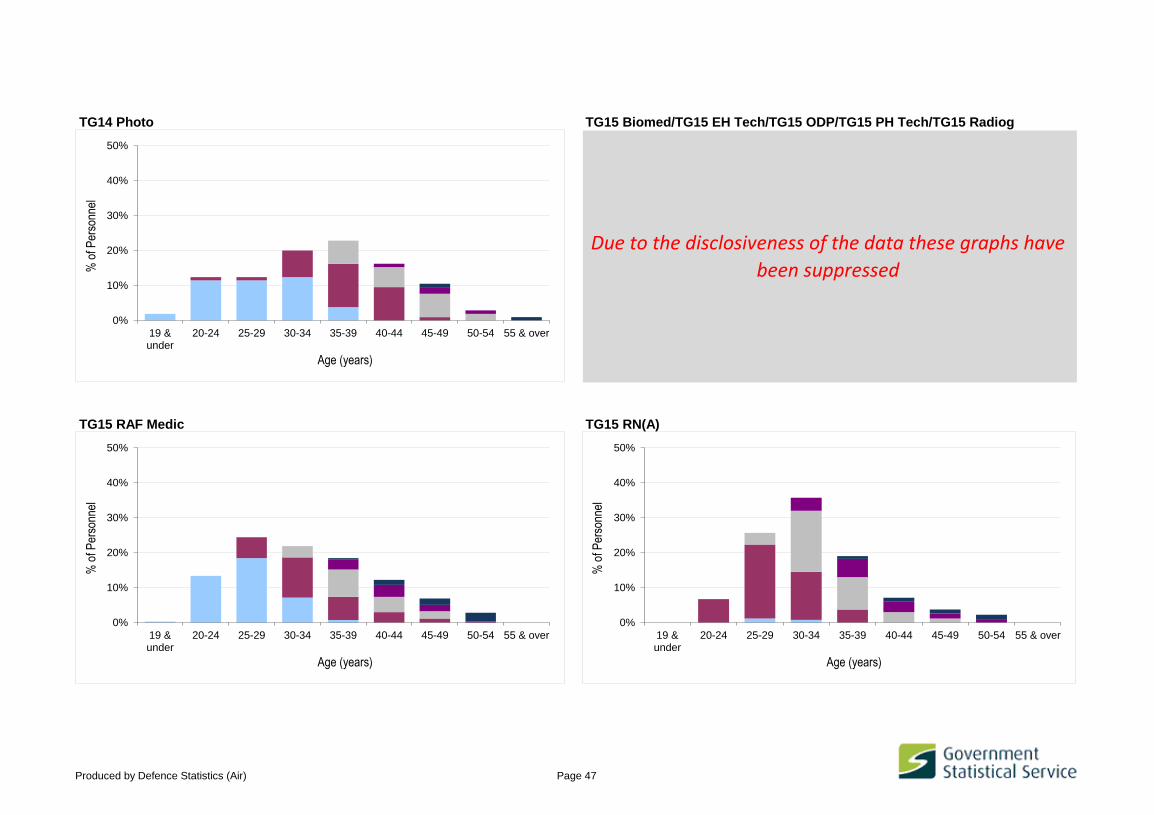
TG14 Photo TG15 Biomed/TG15 EH Tech/TG15 ODP/TG15 PH Tech/TG15 Radiog
TG15 RAF Medic TG15 RN(A)
Due to the disclosiveness of the data these graphs have
been suppressed
0%
10%
20%
30%
40%
50%
19 &under
20-24 25-29 30-34 35-39 40-44 45-49 50-54 55 & over
% o
f Per
sonn
el
Age (years)
0%
10%
20%
30%
40%
50%
19 &under
20-24 25-29 30-34 35-39 40-44 45-49 50-54 55 & over
% o
f Per
sonn
el
Age (years)
0%
10%
20%
30%
40%
50%
19 &under
20-24 25-29 30-34 35-39 40-44 45-49 50-54 55 & over
% o
f Per
sonn
el
Age (years)
Produced by Defence Statistics (Air) Page 47

TG15 RN(MH) TG16 Dental Nurse
TG17 Pers(Spt) TG18 Log(Mov)
0%
10%
20%
30%
40%
50%
19 &under
20-24 25-29 30-34 35-39 40-44 45-49 50-54 55 & over
% o
f Per
sonn
el
Age (years)
0%
10%
20%
30%
40%
50%
19 &under
20-24 25-29 30-34 35-39 40-44 45-49 50-54 55 & over
% o
f Per
sonn
el
Age (years)
0%
10%
20%
30%
40%
50%
19 &under
20-24 25-29 30-34 35-39 40-44 45-49 50-54 55 & over
% o
f Per
sonn
el
Age (years)
0%
10%
20%
30%
40%
50%
19 &under
20-24 25-29 30-34 35-39 40-44 45-49 50-54 55 & over
% o
f Per
sonn
el
Age (years)
Produced by Defence Statistics (Air) Page 48

TG18 Log(Sup) TG19 Log(AGS)
TG19 Log(Chef) TG21 Musn
0%
10%
20%
30%
40%
50%
19 &under
20-24 25-29 30-34 35-39 40-44 45-49 50-54 55 & over
% o
f Per
sonn
el
Age (years)
0%
10%
20%
30%
40%
50%
19 &under
20-24 25-29 30-34 35-39 40-44 45-49 50-54 55 & over
% o
f Per
sonn
el
Age (years)
0%
10%
20%
30%
40%
50%
19 &under
20-24 25-29 30-34 35-39 40-44 45-49 50-54 55 & over
% o
f Per
sonn
el
Age (years)
0%
10%
20%
30%
40%
50%
19 &under
20-24 25-29 30-34 35-39 40-44 45-49 50-54 55 & over
% o
f Per
sonn
el
Age (years)
Produced by Defence Statistics (Air) Page 49
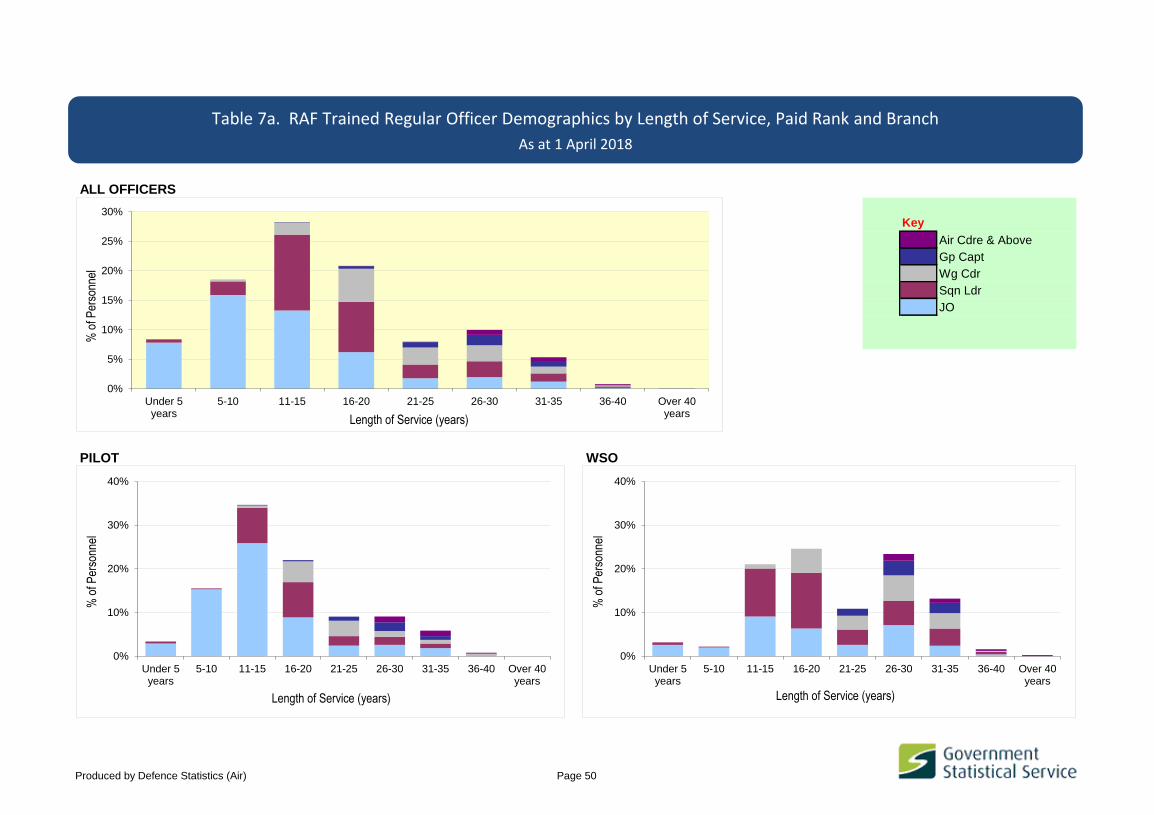
ALL OFFICERS
Key
Air Cdre & Above
Gp Capt
Wg Cdr
Sqn Ldr
JO
PILOT WSO
Table 7a. RAF Trained Regular Officer Demographics by Length of Service, Paid Rank and Branch
As at 1 April 2018
0%
10%
20%
30%
40%
Under 5years
5-10 11-15 16-20 21-25 26-30 31-35 36-40 Over 40years
% o
f Per
sonn
el
Length of Service (years)
0%
5%
10%
15%
20%
25%
30%
Under 5years
5-10 11-15 16-20 21-25 26-30 31-35 36-40 Over 40years
% o
f Per
sonn
el
Length of Service (years)
0%
10%
20%
30%
40%
Under 5years
5-10 11-15 16-20 21-25 26-30 31-35 36-40 Over 40years
% o
f Per
sonn
el
Length of Service (years)
Produced by Defence Statistics (Air) Page 50
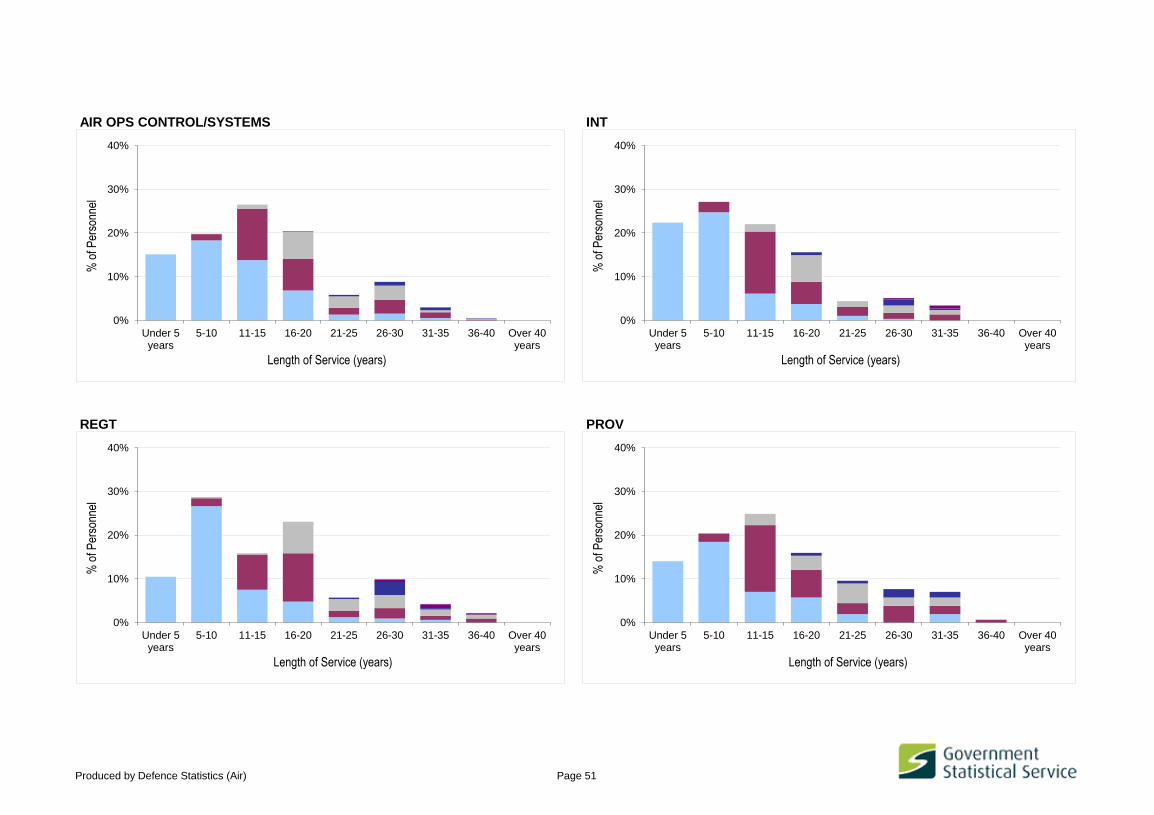
AIR OPS CONTROL/SYSTEMS INT
REGT PROV
0%
10%
20%
30%
40%
Under 5years
5-10 11-15 16-20 21-25 26-30 31-35 36-40 Over 40years
% o
f Per
sonn
el
Length of Service (years)
0%
10%
20%
30%
40%
Under 5years
5-10 11-15 16-20 21-25 26-30 31-35 36-40 Over 40years
% o
f Per
sonn
el
Length of Service (years)
0%
10%
20%
30%
40%
Under 5years
5-10 11-15 16-20 21-25 26-30 31-35 36-40 Over 40years
% o
f Per
sonn
el
Length of Service (years)
0%
10%
20%
30%
40%
Under 5years
5-10 11-15 16-20 21-25 26-30 31-35 36-40 Over 40years
% o
f Per
sonn
el
Length of Service (years)
Produced by Defence Statistics (Air) Page 51
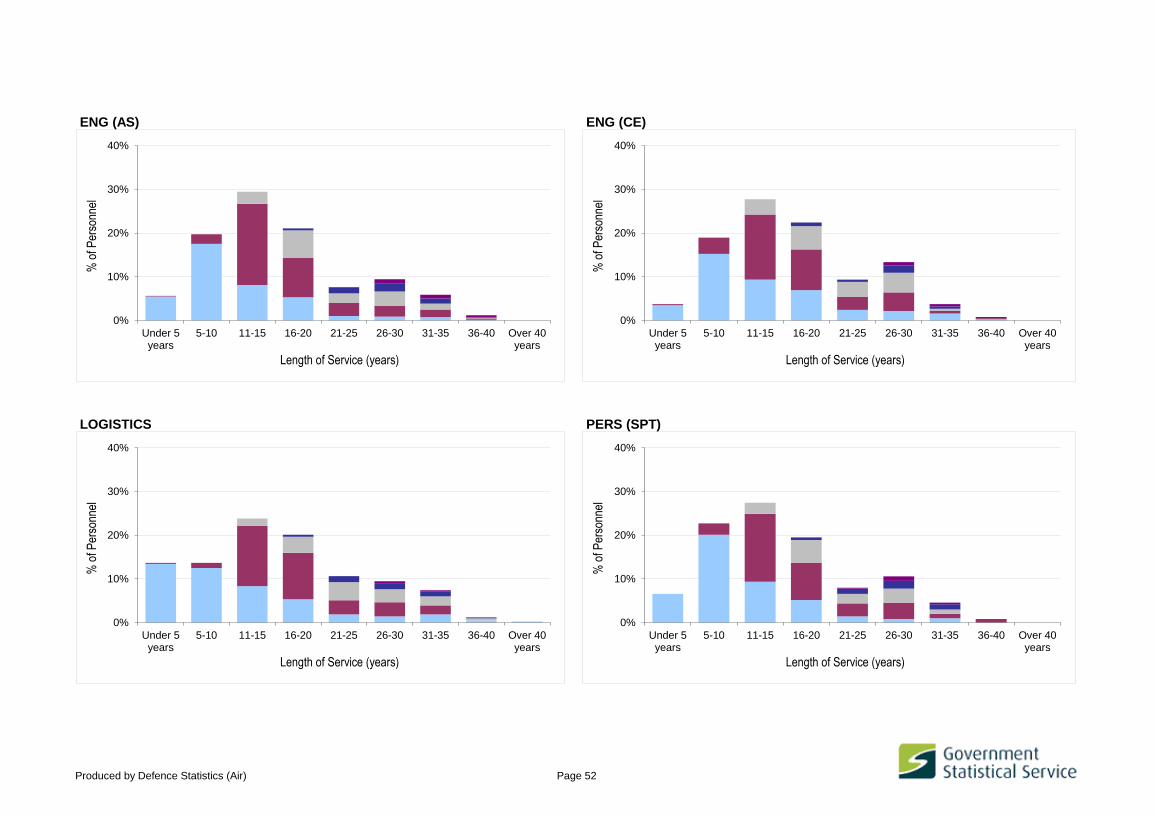
ENG (AS) ENG (CE)
LOGISTICS PERS (SPT)
0%
10%
20%
30%
40%
Under 5years
5-10 11-15 16-20 21-25 26-30 31-35 36-40 Over 40years
% o
f Per
sonn
el
Length of Service (years)
0%
10%
20%
30%
40%
Under 5years
5-10 11-15 16-20 21-25 26-30 31-35 36-40 Over 40years
% o
f Per
sonn
el
Length of Service (years)
0%
10%
20%
30%
40%
Under 5years
5-10 11-15 16-20 21-25 26-30 31-35 36-40 Over 40years
% o
f Per
sonn
el
Length of Service (years)
0%
10%
20%
30%
40%
Under 5years
5-10 11-15 16-20 21-25 26-30 31-35 36-40 Over 40years
% o
f Per
sonn
el
Length of Service (years)
Produced by Defence Statistics (Air) Page 52

PERS (TRG) MEDICAL
MED SPT (MAINSTREAM/EHO) MED SPT (PHYSIO)
0%
10%
20%
30%
40%
Under 5years
5-10 11-15 16-20 21-25 26-30 31-35 36-40 Over 40years
% o
f Per
sonn
el
Length of Service (years)
0%
10%
20%
30%
40%
50%
Under 5years
5-10 11-15 16-20 21-25 26-30 31-35 36-40 Over 40years
% o
f Per
sonn
el
Length of Service (years)
0%
10%
20%
30%
40%
50%
Under 5years
5-10 11-15 16-20 21-25 26-30 31-35 36-40 Over 40years
% o
f Per
sonn
el
Length of Service (years)
0%
10%
20%
30%
40%
50%
60%
70%
Under 5years
5-10 11-15 16-20 21-25 26-30 31-35 36-40 Over 40years
% o
f Per
sonn
el
Length of Service (years)
Produced by Defence Statistics (Air) Page 53

NURSING OFFICER DENTAL
CHAPLAIN LEGAL
0%
10%
20%
30%
40%
50%
Under 5years
5-10 11-15 16-20 21-25 26-30 31-35 36-40 Over 40years
% o
f Per
sonn
el
Length of Service (years)
0%
10%
20%
30%
40%
50%
Under 5years
5-10 11-15 16-20 21-25 26-30 31-35 36-40 Over 40years
% o
f Per
sonn
el
Length of Service (years)
0%
10%
20%
30%
40%
50%
Under 5years
5-10 11-15 16-20 21-25 26-30 31-35 36-40 Over 40years
% o
f Per
sonn
el
Length of Service (years)
0%
10%
20%
30%
40%
50%
Under 5years
5-10 11-15 16-20 21-25 26-30 31-35 36-40 Over 40years
% o
f Per
sonn
el
Length of Service (years)
Produced by Defence Statistics (Air) Page 54
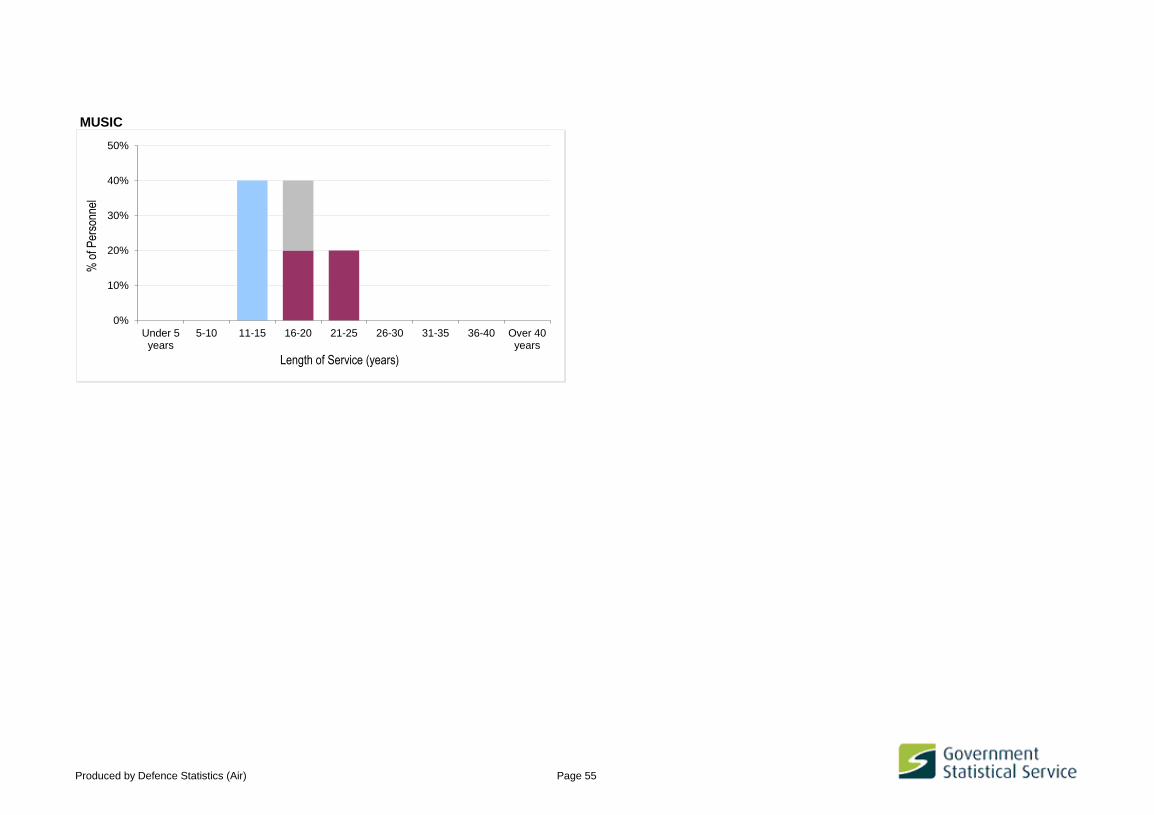
MUSIC
Due to the disclosiveness of the data this graph has
been suppressed
0%
10%
20%
30%
40%
50%
Under 5years
5-10 11-15 16-20 21-25 26-30 31-35 36-40 Over 40years
% o
f Per
sonn
el
Length of Service (years)
Produced by Defence Statistics (Air) Page 55
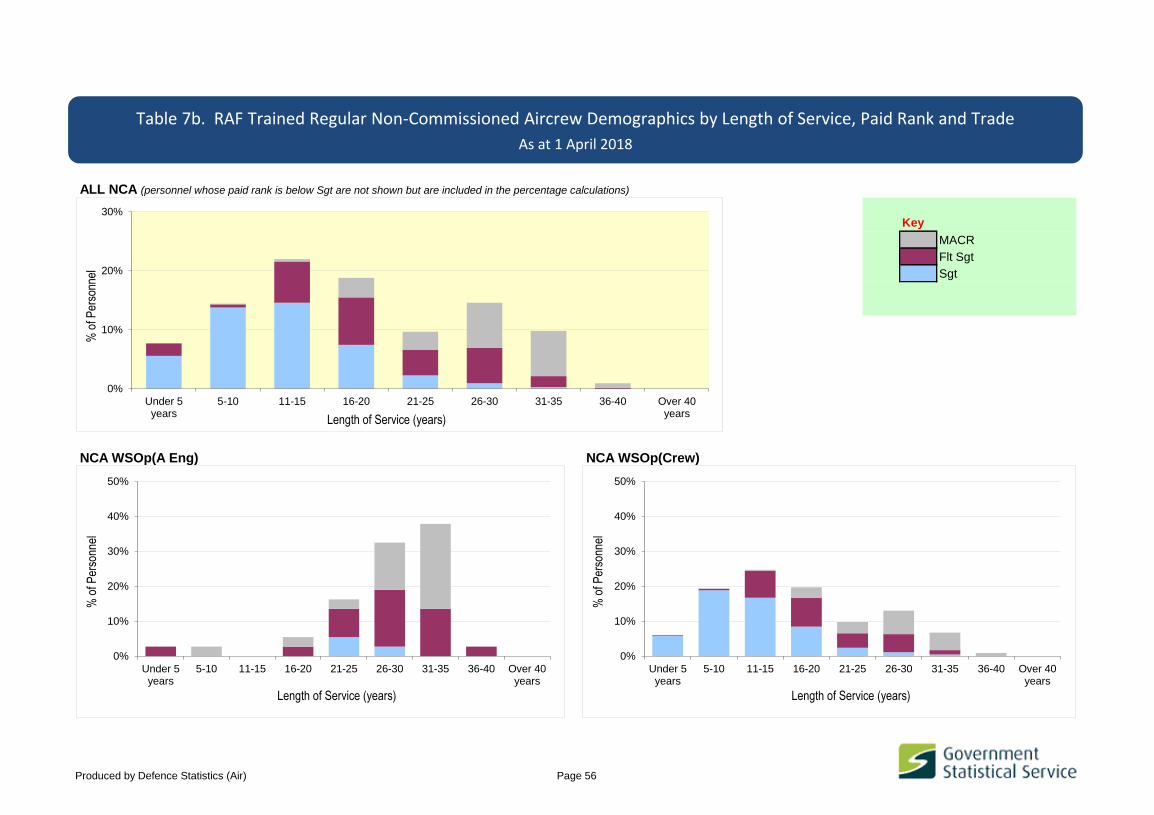
ALL NCA (personnel whose paid rank is below Sgt are not shown but are included in the percentage calculations)
Key
MACR
Flt Sgt
Sgt
NCA WSOp(A Eng) NCA WSOp(Crew)
Table 7b. RAF Trained Regular Non-Commissioned Aircrew Demographics by Length of Service, Paid Rank and Trade
As at 1 April 2018
0%
10%
20%
30%
40%
50%
Under 5years
5-10 11-15 16-20 21-25 26-30 31-35 36-40 Over 40years
% o
f Per
sonn
el
Length of Service (years)
0%
10%
20%
30%
Under 5years
5-10 11-15 16-20 21-25 26-30 31-35 36-40 Over 40years
% o
f Per
sonn
el
Length of Service (years)
0%
10%
20%
30%
40%
50%
Under 5years
5-10 11-15 16-20 21-25 26-30 31-35 36-40 Over 40years
% o
f Per
sonn
el
Length of Service (years)
Produced by Defence Statistics (Air) Page 56
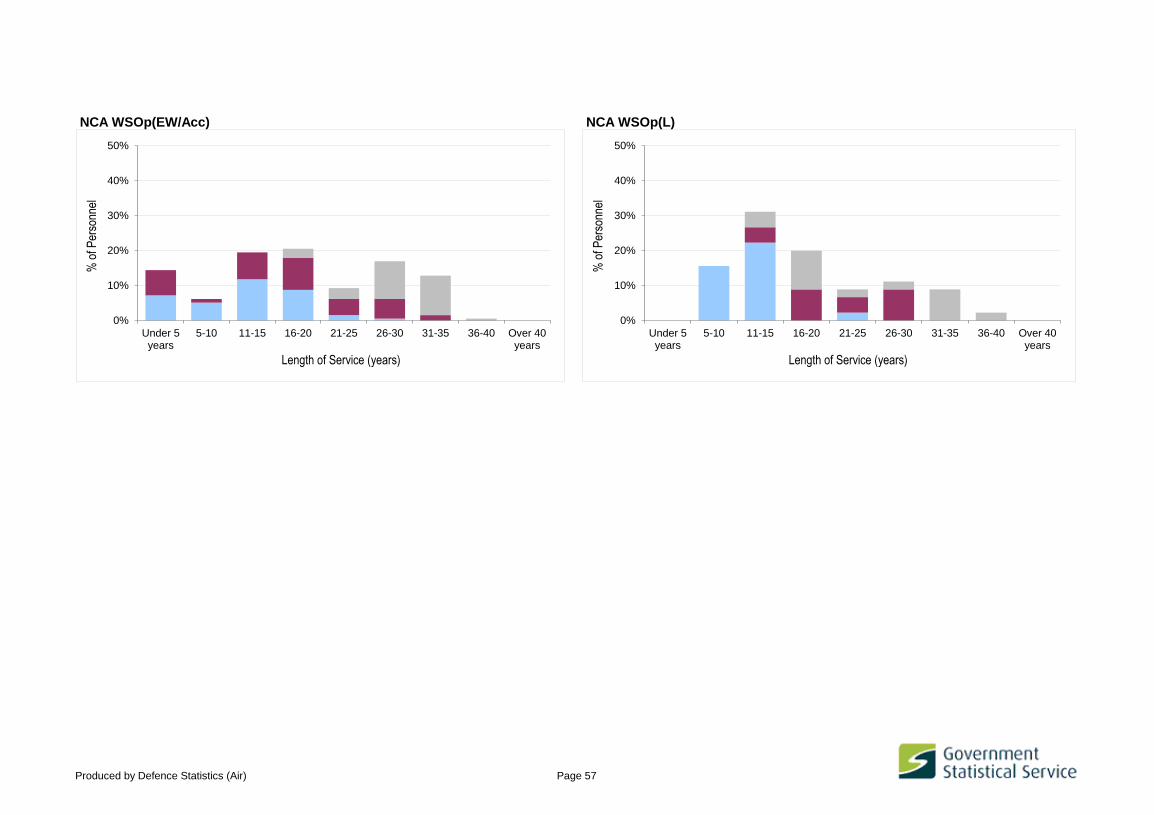
NCA WSOp(EW/Acc) NCA WSOp(L)
0%
10%
20%
30%
40%
50%
Under 5years
5-10 11-15 16-20 21-25 26-30 31-35 36-40 Over 40years
% o
f Per
sonn
el
Length of Service (years)
0%
10%
20%
30%
40%
50%
Under 5years
5-10 11-15 16-20 21-25 26-30 31-35 36-40 Over 40years
% o
f Per
sonn
el
Length of Service (years)
Produced by Defence Statistics (Air) Page 57

ALL GROUND TRADES
Key
WO
Flt Sgt
Chf Tech
Sgt
Cpl
SAC(T)/LCpl & Below
TG1 A Eng Tech TG1 A Tech Av
Table 7c. RAF Trained Regular Ground Trade Demographics by Length of Service, Paid Rank and Trade
As at 1 April 2018
0%
10%
20%
30%
40%
50%
Under 5years
5-10 11-15 16-20 21-25 26-30 31-35 36-40 Over 40years
% o
f Per
sonn
el
Length of Service (years)
0%
10%
20%
30%
Under 5years
5-10 11-15 16-20 21-25 26-30 31-35 36-40 Over 40years
% o
f Per
sonn
el
Length of Service (years)
0%
10%
20%
30%
40%
50%
Under 5years
5-10 11-15 16-20 21-25 26-30 31-35 36-40 Over 40years
% o
f Per
sonn
el
Length of Service (years)
Produced by Defence Statistics (Air) Page 58

TG1 A Tech M TG1 AMM Av
TG1 AMM M TG1 Eng Tech W
0%
10%
20%
30%
40%
50%
Under 5years
5-10 11-15 16-20 21-25 26-30 31-35 36-40 Over 40years
% o
f Per
sonn
el
Length of Service (years)
0%
10%
20%
30%
40%
50%
60%
70%
80%
90%
100%
Under 5years
5-10 11-15 16-20 21-25 26-30 31-35 36-40 Over 40years
% o
f Per
sonn
el
Length of Service (years)
0%
10%
20%
30%
40%
50%
60%
70%
80%
90%
100%
Under 5years
5-10 11-15 16-20 21-25 26-30 31-35 36-40 Over 40years
% o
f Per
sonn
el
Length of Service (years)
0%
10%
20%
30%
40%
50%
Under 5years
5-10 11-15 16-20 21-25 26-30 31-35 36-40 Over 40years
% o
f Per
sonn
el
Length of Service (years)
Produced by Defence Statistics (Air) Page 59
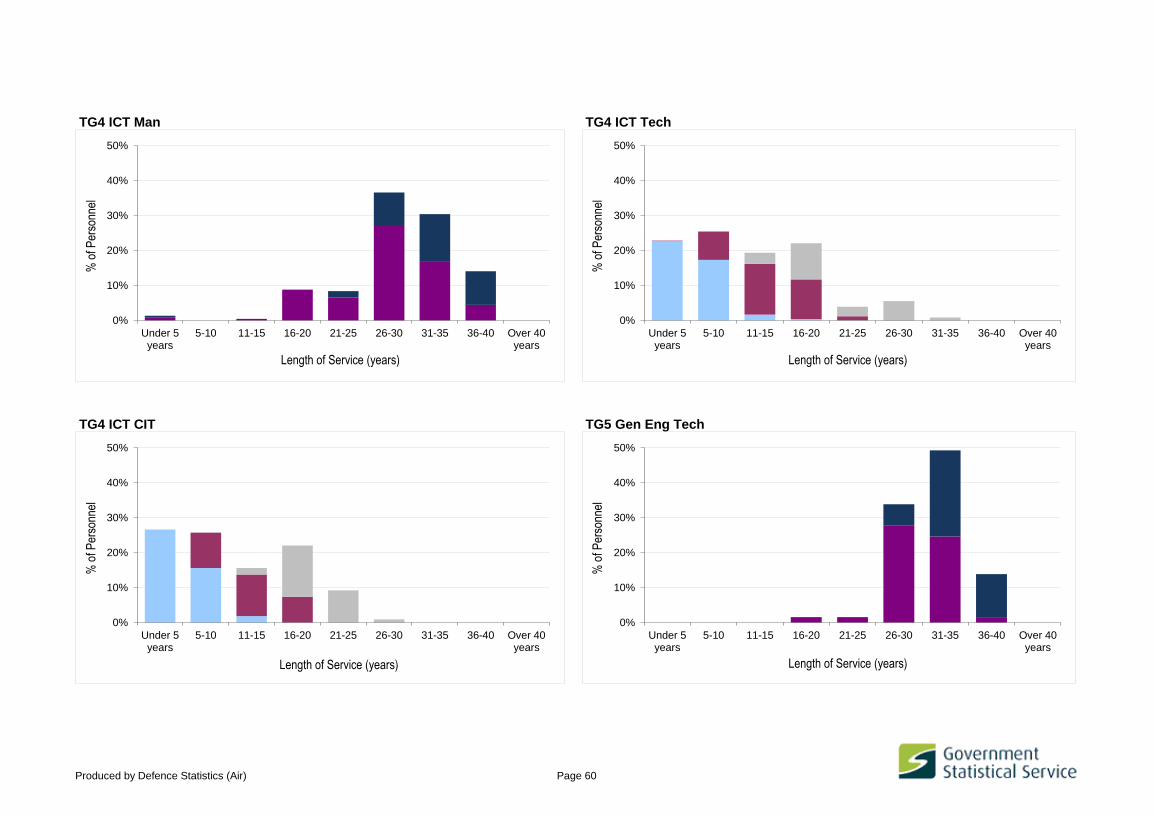
TG4 ICT Man TG4 ICT Tech
TG4 ICT CIT TG5 Gen Eng Tech
0%
10%
20%
30%
40%
50%
Under 5years
5-10 11-15 16-20 21-25 26-30 31-35 36-40 Over 40years
% o
f Per
sonn
el
Length of Service (years)
0%
10%
20%
30%
40%
50%
Under 5years
5-10 11-15 16-20 21-25 26-30 31-35 36-40 Over 40years
% o
f Per
sonn
el
Length of Service (years)
0%
10%
20%
30%
40%
50%
Under 5years
5-10 11-15 16-20 21-25 26-30 31-35 36-40 Over 40years
% o
f Per
sonn
el
Length of Service (years)
0%
10%
20%
30%
40%
50%
Under 5years
5-10 11-15 16-20 21-25 26-30 31-35 36-40 Over 40years
% o
f Per
sonn
el
Length of Service (years)
Produced by Defence Statistics (Air) Page 60

TG5 Gen Tech E TG5 Gen Tech M
TG5 Gen Tech WS TG6 Log(Driver)
0%
10%
20%
30%
40%
50%
Under 5years
5-10 11-15 16-20 21-25 26-30 31-35 36-40 Over 40years
% o
f Per
sonn
el
Length of Service (years)
0%
10%
20%
30%
40%
50%
Under 5years
5-10 11-15 16-20 21-25 26-30 31-35 36-40 Over 40years
% o
f Per
sonn
el
Length of Service (years)
0%
10%
20%
30%
40%
50%
Under 5years
5-10 11-15 16-20 21-25 26-30 31-35 36-40 Over 40years
% o
f Per
sonn
el
Length of Service (years)
0%
10%
20%
30%
40%
50%
Under 5years
5-10 11-15 16-20 21-25 26-30 31-35 36-40 Over 40years
% o
f Per
sonn
el
Length of Service (years)
Produced by Defence Statistics (Air) Page 61

TG8 Fftr TG8 Gnr
TG8 RAFP TG9 ATC
0%
10%
20%
30%
40%
50%
Under 5years
5-10 11-15 16-20 21-25 26-30 31-35 36-40 Over 40years
% o
f Per
sonn
el
Length of Service (years)
0%
10%
20%
30%
40%
50%
Under 5years
5-10 11-15 16-20 21-25 26-30 31-35 36-40 Over 40years
% o
f Per
sonn
el
Length of Service (years)
0%
10%
20%
30%
40%
50%
Under 5years
5-10 11-15 16-20 21-25 26-30 31-35 36-40 Over 40years
% o
f Per
sonn
el
Length of Service (years)
0%
10%
20%
30%
40%
50%
Under 5years
5-10 11-15 16-20 21-25 26-30 31-35 36-40 Over 40years
% o
f Per
sonn
el
Length of Service (years)
Produced by Defence Statistics (Air) Page 62

TG9 FOM/FOA TG10 RAF PTI
TG11 Int An TG11 Int An(L)
0%
10%
20%
30%
40%
50%
Under 5years
5-10 11-15 16-20 21-25 26-30 31-35 36-40 Over 40years
% o
f Per
sonn
el
Length of Service (years)
0%
10%
20%
30%
40%
50%
Under 5years
5-10 11-15 16-20 21-25 26-30 31-35 36-40 Over 40years
% o
f Per
sonn
el
Length of Service (years)
0%
10%
20%
30%
40%
50%
Under 5years
5-10 11-15 16-20 21-25 26-30 31-35 36-40 Over 40years
% o
f Per
sonn
el
Length of Service (years)
0%
10%
20%
30%
40%
50%
Under 5years
5-10 11-15 16-20 21-25 26-30 31-35 36-40 Over 40years
% o
f Per
sonn
el
Length of Service (years)
Produced by Defence Statistics (Air) Page 63

TG12 ASMOp TG12 SNCO WC
TG13 SE Fitt TG14 Air Cart
0%
10%
20%
30%
40%
50%
Under 5years
5-10 11-15 16-20 21-25 26-30 31-35 36-40 Over 40years
% o
f Per
sonn
el
Length of Service (years)
0%
10%
20%
30%
40%
50%
Under 5years
5-10 11-15 16-20 21-25 26-30 31-35 36-40 Over 40years
% o
f Per
sonn
el
Length of Service (years)
0%
10%
20%
30%
40%
50%
Under 5years
5-10 11-15 16-20 21-25 26-30 31-35 36-40 Over 40years
% o
f Per
sonn
el
Length of Service (years)
0%
10%
20%
30%
40%
50%
Under 5years
5-10 11-15 16-20 21-25 26-30 31-35 36-40 Over 40years
% o
f Per
sonn
el
Length of Service (years)
Produced by Defence Statistics (Air) Page 64
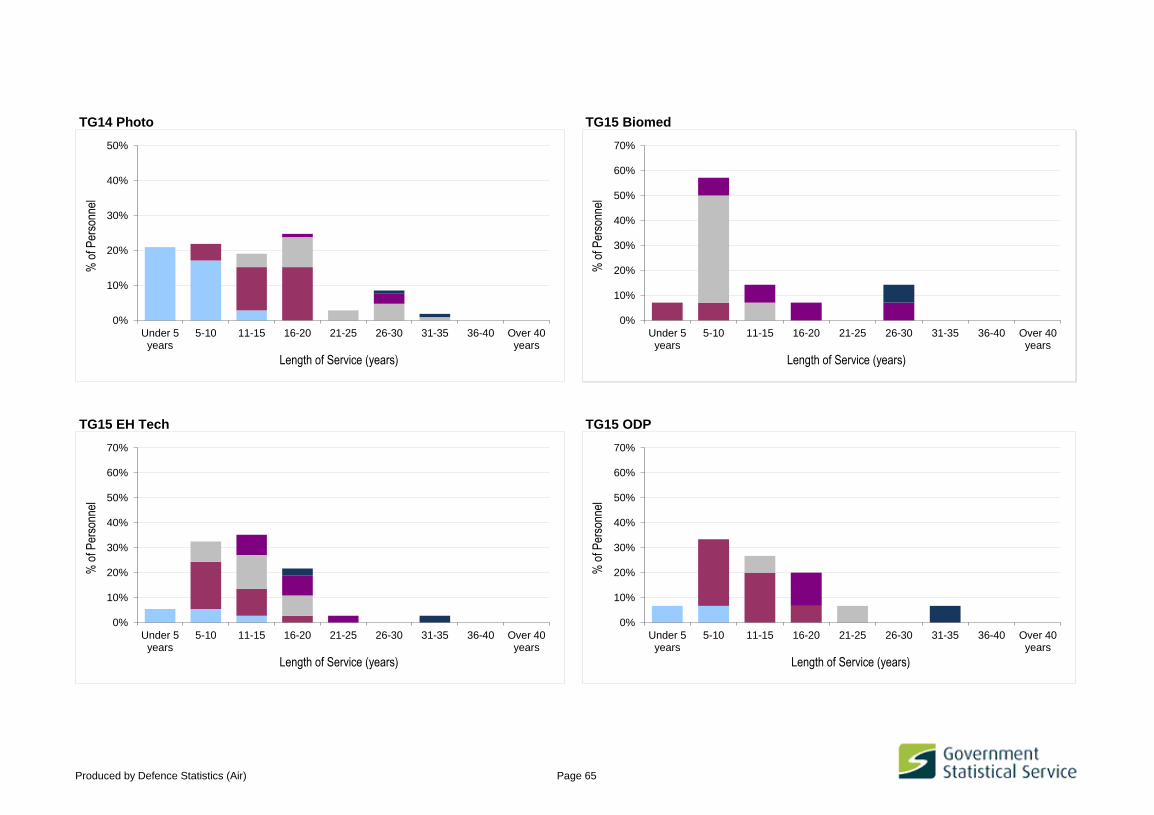
TG14 Photo TG15 Biomed
TG15 EH Tech TG15 ODP
Due to the disclosiveness of the data these graphs have
been suppressed
0%
10%
20%
30%
40%
50%
Under 5years
5-10 11-15 16-20 21-25 26-30 31-35 36-40 Over 40years
% o
f Per
sonn
el
Length of Service (years)
0%
10%
20%
30%
40%
50%
60%
70%
Under 5years
5-10 11-15 16-20 21-25 26-30 31-35 36-40 Over 40years
% o
f Per
sonn
el
Length of Service (years)
0%
10%
20%
30%
40%
50%
60%
70%
Under 5years
5-10 11-15 16-20 21-25 26-30 31-35 36-40 Over 40years
% o
f Per
sonn
el
Length of Service (years)
0%
10%
20%
30%
40%
50%
60%
70%
Under 5years
5-10 11-15 16-20 21-25 26-30 31-35 36-40 Over 40years
% o
f Per
sonn
el
Length of Service (years)
Produced by Defence Statistics (Air) Page 65
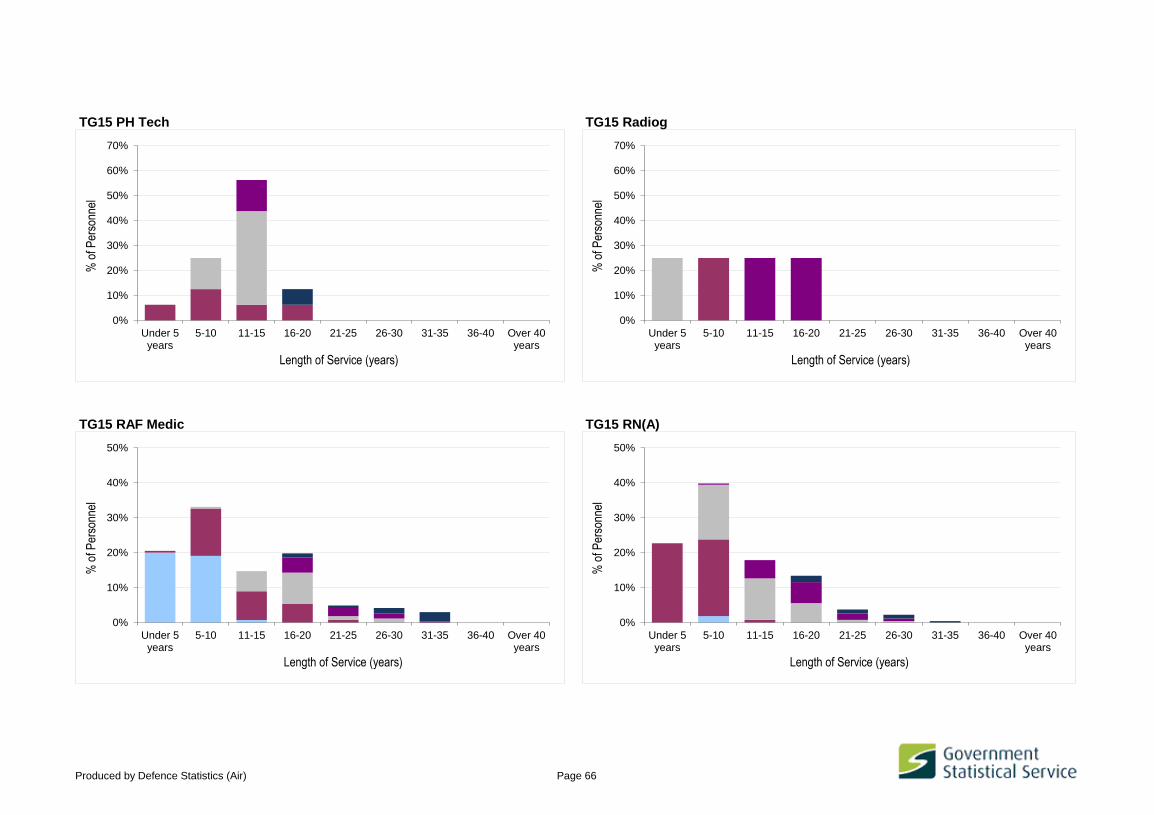
TG15 PH Tech TG15 Radiog
TG15 RAF Medic TG15 RN(A)
0%
10%
20%
30%
40%
50%
Under 5years
5-10 11-15 16-20 21-25 26-30 31-35 36-40 Over 40years
% o
f Per
sonn
el
Length of Service (years)
0%
10%
20%
30%
40%
50%
Under 5years
5-10 11-15 16-20 21-25 26-30 31-35 36-40 Over 40years
% o
f Per
sonn
el
Length of Service (years)
0%
10%
20%
30%
40%
50%
60%
70%
Under 5years
5-10 11-15 16-20 21-25 26-30 31-35 36-40 Over 40years
% o
f Per
sonn
el
Length of Service (years)
0%
10%
20%
30%
40%
50%
60%
70%
Under 5years
5-10 11-15 16-20 21-25 26-30 31-35 36-40 Over 40years
% o
f Per
sonn
el
Length of Service (years)
Produced by Defence Statistics (Air) Page 66

TG15 RN(MH) TG16 Dental Nurse
TG17 Pers(Spt) TG18 Log(Mov)
0%
10%
20%
30%
40%
50%
Under 5years
5-10 11-15 16-20 21-25 26-30 31-35 36-40 Over 40years
% o
f Per
sonn
el
Length of Service (years)
0%
10%
20%
30%
40%
50%
Under 5years
5-10 11-15 16-20 21-25 26-30 31-35 36-40 Over 40years
% o
f Per
sonn
el
Length of Service (years)
0%
10%
20%
30%
40%
50%
Under 5years
5-10 11-15 16-20 21-25 26-30 31-35 36-40 Over 40years
% o
f Per
sonn
el
Length of Service (years)
0%
10%
20%
30%
40%
50%
Under 5years
5-10 11-15 16-20 21-25 26-30 31-35 36-40 Over 40years
% o
f Per
sonn
el
Length of Service (years)
Produced by Defence Statistics (Air) Page 67

TG18 Log(Sup) TG19 Log(AGS)
TG19 Log(Chef) TG21 Musn
0%
10%
20%
30%
40%
50%
Under 5years
5-10 11-15 16-20 21-25 26-30 31-35 36-40 Over 40years
% o
f Per
sonn
el
Length of Service (years)
0%
10%
20%
30%
40%
50%
Under 5years
5-10 11-15 16-20 21-25 26-30 31-35 36-40 Over 40years
% o
f Per
sonn
el
Length of Service (years)
0%
10%
20%
30%
40%
50%
Under 5years
5-10 11-15 16-20 21-25 26-30 31-35 36-40 Over 40years
% o
f Per
sonn
el
Length of Service (years)
0%
10%
20%
30%
40%
50%
Under 5years
5-10 11-15 16-20 21-25 26-30 31-35 36-40 Over 40years
% o
f Per
sonn
el
Length of Service (years)
Produced by Defence Statistics (Air) Page 68
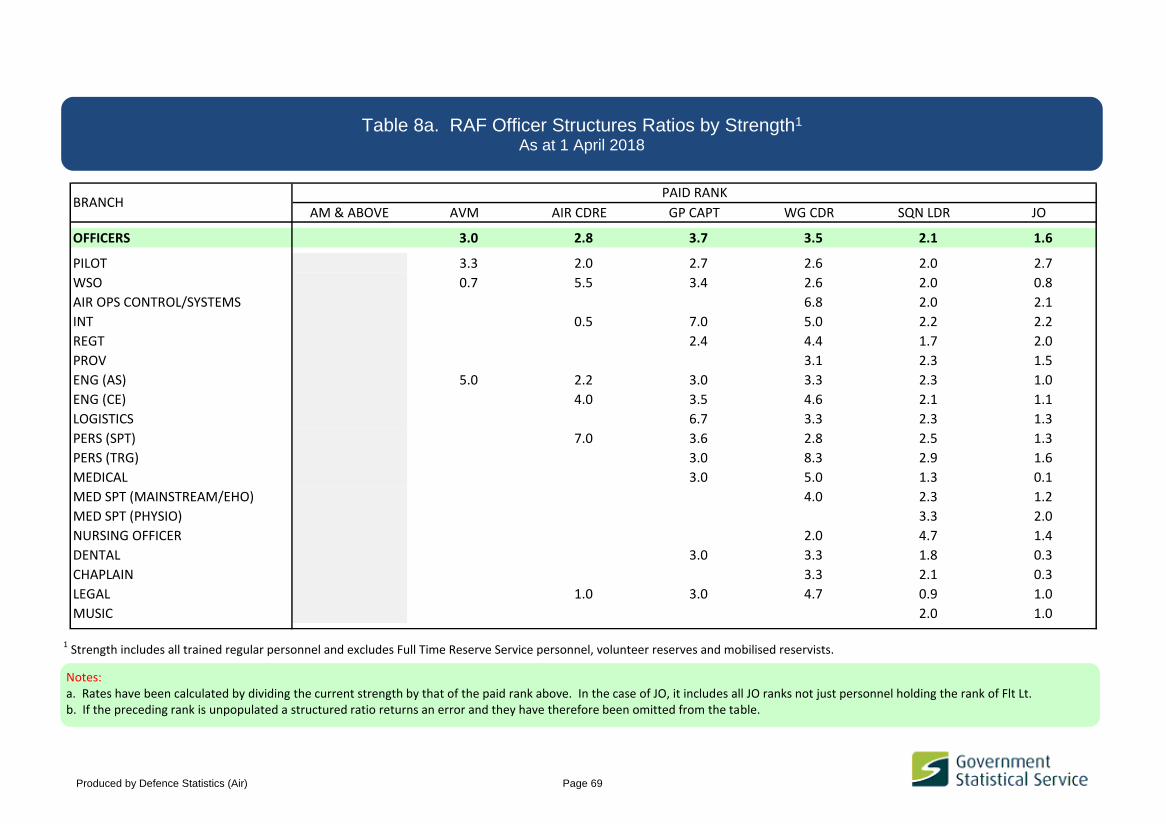
AM & ABOVE AVM AIR CDRE GP CAPT WG CDR SQN LDR JO
OFFICERS 3.0 2.8 3.7 3.5 2.1 1.6
PILOT 3.3 2.0 2.7 2.6 2.0 2.7
WSO 0.7 5.5 3.4 2.6 2.0 0.8
AIR OPS CONTROL/SYSTEMS 6.8 2.0 2.1
INT 0.5 7.0 5.0 2.2 2.2
REGT 2.4 4.4 1.7 2.0
PROV 3.1 2.3 1.5
ENG (AS) 5.0 2.2 3.0 3.3 2.3 1.0
ENG (CE) 4.0 3.5 4.6 2.1 1.1
LOGISTICS 6.7 3.3 2.3 1.3
PERS (SPT) 7.0 3.6 2.8 2.5 1.3
PERS (TRG) 3.0 8.3 2.9 1.6
MEDICAL 3.0 5.0 1.3 0.1
MED SPT (MAINSTREAM/EHO) 4.0 2.3 1.2
MED SPT (PHYSIO) 3.3 2.0
NURSING OFFICER 2.0 4.7 1.4
DENTAL 3.0 3.3 1.8 0.3
CHAPLAIN 3.3 2.1 0.3
LEGAL 1.0 3.0 4.7 0.9 1.0
MUSIC 2.0 1.0
1 Strength includes all trained regular personnel and excludes Full Time Reserve Service personnel, volunteer reserves and mobilised reservists.
BRANCHPAID RANK
Table 8a. RAF Officer Structures Ratios by Strength1
As at 1 April 2018
Notes:a. Rates have been calculated by dividing the current strength by that of the paid rank above. In the case of JO, it includes all JO ranks not just personnel holding the rank of Flt Lt.b. If the preceding rank is unpopulated a structured ratio returns an error and they have therefore been omitted from the table.
Produced by Defence Statistics (Air) Page 69

MACR FLT SGT SGT
NON-COMMISSIONED AIRCREW 1.3 1.5
NCA WSOp(A Eng) 1.0 0.2
NCA WSOp(Crew) 1.4 2.0
NCA WSOp(EW/Acc) 1.3 0.9
NCA WSOp(L) 0.9 1.5
1 Strength includes all trained regular personnel and excludes Full Time Reserve Service personnel, volunteer reserves and mobilised reservists.
PAID RANK
Table 8b. Non-Commissioned Aircrew Structures Ratios by Strength1
As at 1 April 2018
Notes:a. Rates have been calculated by dividing the current strength by that of the paid rank above. In the case of JO, it includes all JO ranks not just personnel holding the rank of Flt Lt.b. If the preceding rank is unpopulated a structured ratio returns an error and they have therefore been omitted from the table.
Produced by Defence Statistics (Air) Page 70

WO FLT SGT CHF TECH SGT CPLSAC(T) or L/Cpl if
GnrSAC AC/LAC
GROUND TRADES
TG1 A Eng Tech 1.5 3.1
TG1 A Tech Av 2.0 1.0 0.9 0.0 0.0
TG1 A Tech M 1.9 1.2 1.2 0.0 0.5
TG1 AMM Av 0.2
TG1 AMM M 0.2
TG1 Eng Tech W 1.5 1.9 3.3 1.4 1.1 0.2 0.1
TG4 ICT Man 1.9 3.1
TG4 ICT Tech 1.6 0.8 0.5 0.0
TG4 ICT CIT 1.1 1.5 0.0
TG5 Gen Eng Tech 1.3 1.9
TG5 Gen Tech E 1.8 3.4 0.8 0.6
TG5 Gen Tech M 2.9 1.8 1.4 0.4 0.0
TG5 Gen Tech WS 1.4 2.4 1.0 0.4
TG6 Log(Driver) 1.4 3.1 3.1 1.8 0.0
TG8 Fftr 1.3 3.6 2.0 1.8 0.1
TG8 Gnr 3.0 2.2 2.0 0.3 3.3 0.1
TG8 RAFP 2.1 2.6 1.5 1.1 0.1
TG9 ATC 1.4 2.1
TG9 FOM/FOA 1.9 2.7 1.8 1.5 0.1
TG10 RAF PTI 2.8 2.7 1.2 0.0
TG11 Int An 2.0 2.7 1.1 1.5 0.1
TG11 Int An(L) 1.1 4.1 0.6 0.8 0.6 0.1
TG12 ASMOp 3.2 2.1 1.3 1.2 0.1
TG12 SNCO WC 2.3 3.7
TRADE
PAID RANK
Table 8c. RAF Ground Trade Structures Ratios by Strength1
As at 1 April 2018
Produced by Defence Statistics (Air) Page 71

WO FLT SGT CHF TECH SGT CPLSAC(T) or L/Cpl if
GnrSAC AC/LAC
TRADE
PAID RANK
TG13 SE Fitt 1.9 2.8 3.6 0.9 0.0
TG14 Air Cart 1.3 3.4 1.1 1.4 0.0
TG14 Photo 2.0 5.5 1.5 1.1 0.1
TG15 Biomed 4.0 1.8 0.3
TG15 EH Tech 3.5 1.6 1.1
TG15 ODP 2.0 1.0 4.0
TG15 PH Tech 2.0 4.0 0.6 0.0 0.0
TG15 Radiog 0.5 1.0 0.0 0.0
TG15 RAF Medic 1.3 2.1 1.6 1.3
TG15 RN(A) 3.2 2.4 1.3
TG15 RN(MH) 2.5 2.0 0.5
TG16 Dental Nurse 2.0 2.3 1.8 1.5 0.2
TG17 Pers(Spt) 1.5 2.8 1.0 0.9 0.0
TG18 Log(Mov) 1.6 2.5 1.4 1.8 0.0
TG18 Log(Sup) 1.7 2.9 1.8 1.8 0.0
TG19 Log(AGS) 1.1 2.2 3.4 1.9 0.0
TG19 Log(Chef) 1.1 2.4 2.6 1.9 0.1
TG21 Musn 2.0 1.9 1.9 1.8 1.1
1 Strength includes all trained regular personnel and excludes Full Time Reserve Service personnel, volunteer reserves and mobilised reservists.
Notes:a. Rates have been calculated by dividing the current strength by that of the paid rank above. In the case of LAC/AC, it includes all personnel at these ranks, not just those holding the rank of LAC.b. If the preceding rank is unpopulated a structured ratio returns an error and they have therefore been omitted from the table.
Produced by Defence Statistics (Air) Page 72

AIR CDRE &
ABOVEGP CAPT WG CDR SQN LDR JO
OFFICERS 2.4 3.6 2.2 1.7
PILOT 1.4 3.1 2.2 2.9
WSO 1.2 1.5 3.3 2.0
AIR OPS CONTROL/SYSTEMS 5.6 4.5 2.3 2.0
INT 3.0 5.1 2.4 1.5
REGT 3.0 3.9 2.1 1.9
PROV 4.1 1.9 1.6
ENG (AS) 1.9 3.5 2.3 1.1
ENG (CE) 3.1 3.0 2.3 1.2
LOGISTICS 6.0 3.9 2.3 1.2
PERS (SPT) 5.5 3.5 2.2 1.3
PERS (TRG) 6.5 2.6 1.8
MEDICAL 4.5 4.4 0.7 0.1
MED SPT (MAINSTREAM/EHO) 6.5 2.5 1.3
MED SPT (PHYSIO) 11.0 1.6
NURSING OFFICER 4.0 7.1 1.8
DENTAL 2.6 1.1 0.4
CHAPLAIN 2.0 3.0 9.0 0.0
LEGAL 2.0 3.5 0.9 1.1
MUSIC
1 The Workforce Requirement quoted are as provided by Air-COSPers-Mann Req on 2 February 2018 for the FY17.18 Q3 Forecasting round. They may not therefore be in line with FMC Cap Plans
Defence Programme Regular Service Workforce Requirements. Workforce Requirements do not currently include a breakdown for GD Branch, which was disbanded in 2010; instead DS(Air) has achieved
this by proportioning out the total for Air Cdre+ in non-Specialist Branches on the basis of 1 April 2018 trained strength, as agreed with Air-COSPers-Mann Req. They do not take into account any future
structural sustainability changes which are currently under review.
BRANCH
PAID RANK
Table 9a. RAF Officer Structures Ratios by Workforce Requirement1
As at 1 April 2018
Notes:a. Rates have been calculated by dividing the Workforce Requirement by that of the rank aboveb. If the preceding rank is unpopulated a structured ratio returns an error and they have therefore been omitted from the table.
Produced by Defence Statistics (Air) Page 73
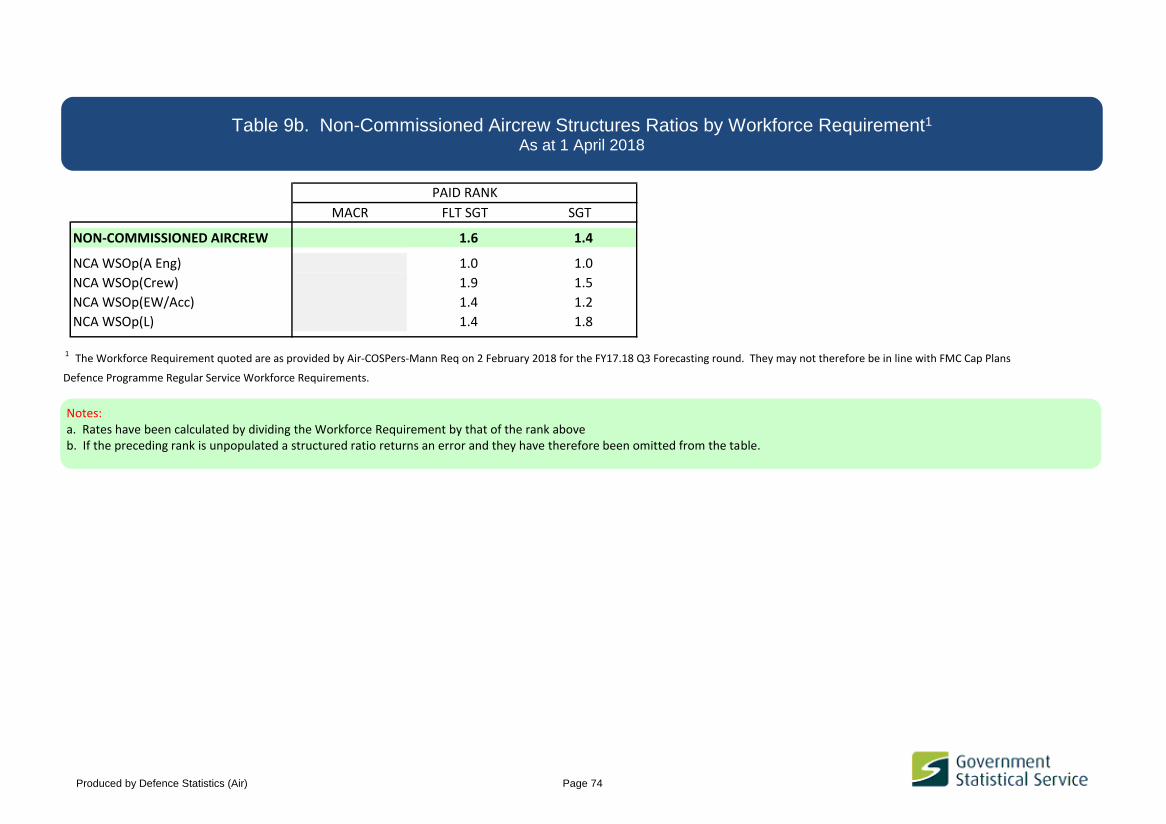
MACR FLT SGT SGT
NON-COMMISSIONED AIRCREW 1.6 1.4
NCA WSOp(A Eng) 1.0 1.0
NCA WSOp(Crew) 1.9 1.5
NCA WSOp(EW/Acc) 1.4 1.2
NCA WSOp(L) 1.4 1.8
1 The Workforce Requirement quoted are as provided by Air-COSPers-Mann Req on 2 February 2018 for the FY17.18 Q3 Forecasting round. They may not therefore be in line with FMC Cap Plans
Defence Programme Regular Service Workforce Requirements.
PAID RANK
Table 9b. Non-Commissioned Aircrew Structures Ratios by Workforce Requirement1
As at 1 April 2018
Notes:a. Rates have been calculated by dividing the Workforce Requirement by that of the rank aboveb. If the preceding rank is unpopulated a structured ratio returns an error and they have therefore been omitted from the table.
Produced by Defence Statistics (Air) Page 74

WO FLT SGT CHF TECH SGT CPL LCPL AC
GROUND TRADES
TG1 A Eng Tech 2.0 2.8
TG1 A Tech Av 2.0 1.2 1.0
TG1 A Tech M 1.9 1.3 1.2
TG1 AMM Av
TG1 AMM M
TG1 Eng Tech W 1.5 2.1 3.1 1.5 1.4
TG4 ICT Man 2.4 3.1
TG4 ICT Tech 1.6 1.1
TG4 ICT CIT 1.2 1.5
TG5 Gen Eng Tech 1.5 1.9
TG5 Gen Tech E 2.3 3.0 1.4
TG5 Gen Tech M 3.2 1.8 1.8
TG5 Gen Tech WS 1.1 2.4 1.6
TG6 Log(Driver) 1.3 2.9 2.9 1.9
TG8 Fftr 1.2 2.7 2.2 1.9
TG8 Gnr 3.8 2.1 2.1 0.5 3.3
TG8 RAFP 2.2 2.9 1.5 1.1
TG9 ATC 1.6 2.6
TG9 FOM/FOA 2.0 2.5 1.8 1.7
TG10 RAF PTI 2.9 2.9 1.3
TG11 Int An 2.4 2.4 1.3 1.4
TG11 Int An(L) 1.4 3.7 1.2 1.4
TRADEPAID RANK
Table 9c. RAF Ground Trade Structures Ratios by Workforce Requirement1
As at 1 April 2018
Produced by Defence Statistics (Air) Page 75
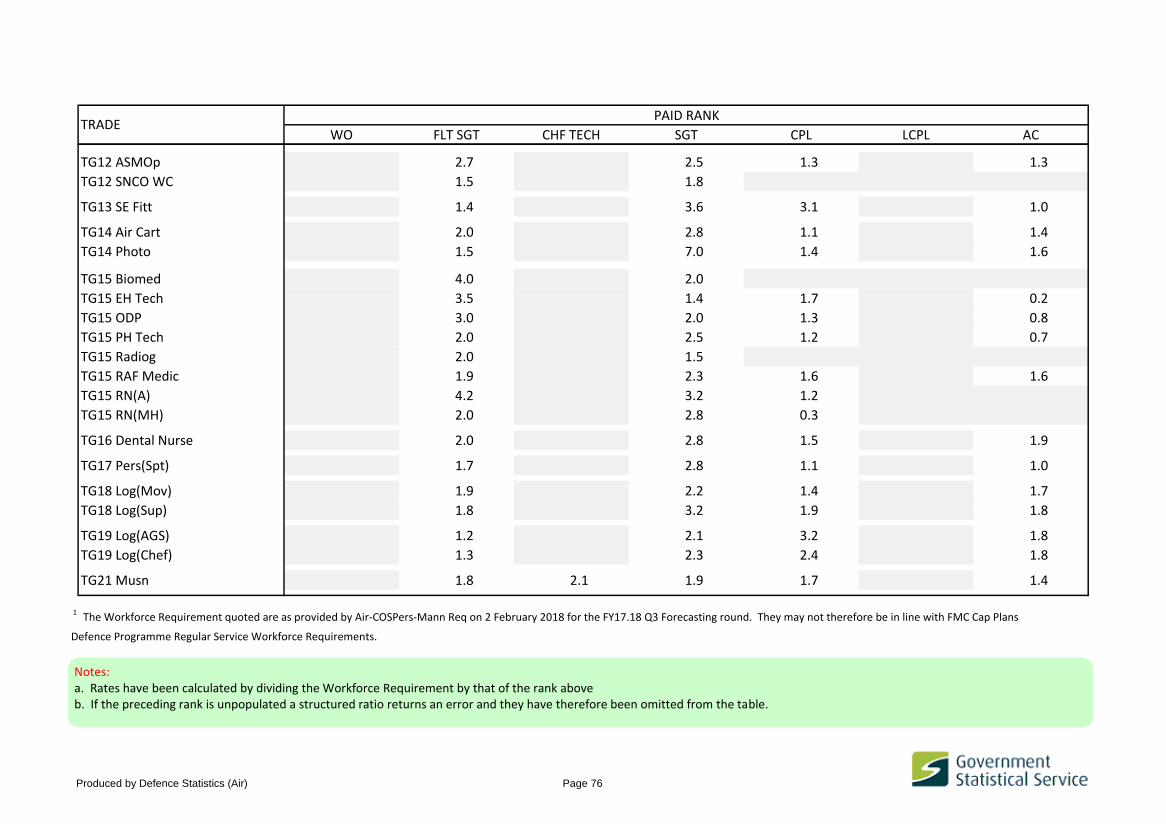
WO FLT SGT CHF TECH SGT CPL LCPL ACTRADE
PAID RANK
TG12 ASMOp 2.7 2.5 1.3 1.3
TG12 SNCO WC 1.5 1.8
TG13 SE Fitt 1.4 3.6 3.1 1.0
TG14 Air Cart 2.0 2.8 1.1 1.4
TG14 Photo 1.5 7.0 1.4 1.6
TG15 Biomed 4.0 2.0
TG15 EH Tech 3.5 1.4 1.7 0.2
TG15 ODP 3.0 2.0 1.3 0.8
TG15 PH Tech 2.0 2.5 1.2 0.7
TG15 Radiog 2.0 1.5
TG15 RAF Medic 1.9 2.3 1.6 1.6
TG15 RN(A) 4.2 3.2 1.2
TG15 RN(MH) 2.0 2.8 0.3
TG16 Dental Nurse 2.0 2.8 1.5 1.9
TG17 Pers(Spt) 1.7 2.8 1.1 1.0
TG18 Log(Mov) 1.9 2.2 1.4 1.7
TG18 Log(Sup) 1.8 3.2 1.9 1.8
TG19 Log(AGS) 1.2 2.1 3.2 1.8
TG19 Log(Chef) 1.3 2.3 2.4 1.8
TG21 Musn 1.8 2.1 1.9 1.7 1.4
1 The Workforce Requirement quoted are as provided by Air-COSPers-Mann Req on 2 February 2018 for the FY17.18 Q3 Forecasting round. They may not therefore be in line with FMC Cap Plans
Defence Programme Regular Service Workforce Requirements.
Notes:a. Rates have been calculated by dividing the Workforce Requirement by that of the rank aboveb. If the preceding rank is unpopulated a structured ratio returns an error and they have therefore been omitted from the table.
Produced by Defence Statistics (Air) Page 76
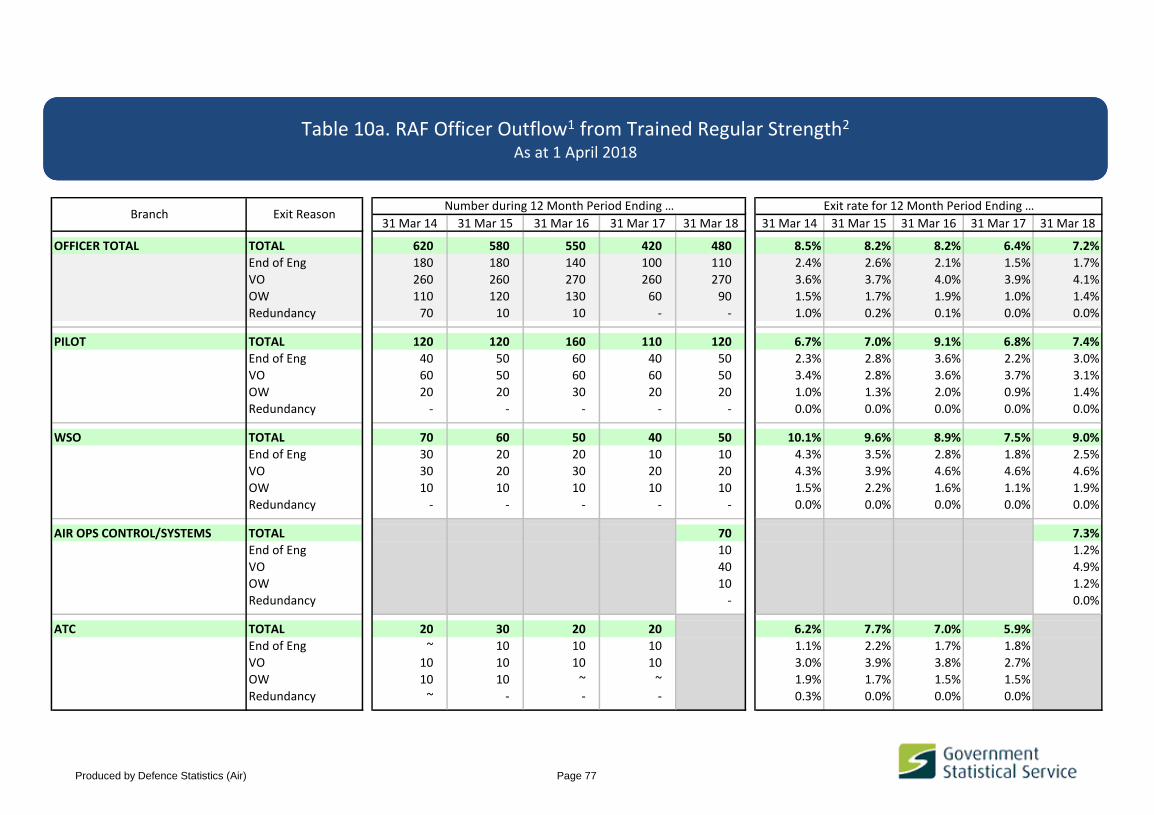
31 Mar 14 31 Mar 15 31 Mar 16 31 Mar 17 31 Mar 18 31 Mar 14 31 Mar 15 31 Mar 16 31 Mar 17 31 Mar 18
OFFICER TOTAL TOTAL 620 580 550 420 480 8.5% 8.2% 8.2% 6.4% 7.2%
End of Eng 180 180 140 100 110 2.4% 2.6% 2.1% 1.5% 1.7%
VO 260 260 270 260 270 3.6% 3.7% 4.0% 3.9% 4.1%
OW 110 120 130 60 90 1.5% 1.7% 1.9% 1.0% 1.4%
Redundancy 70 10 10 - - 1.0% 0.2% 0.1% 0.0% 0.0%
PILOT TOTAL 120 120 160 110 120 6.7% 7.0% 9.1% 6.8% 7.4%
End of Eng 40 50 60 40 50 2.3% 2.8% 3.6% 2.2% 3.0%
VO 60 50 60 60 50 3.4% 2.8% 3.6% 3.7% 3.1%
OW 20 20 30 20 20 1.0% 1.3% 2.0% 0.9% 1.4%
Redundancy - - - - - 0.0% 0.0% 0.0% 0.0% 0.0%
WSO TOTAL 70 60 50 40 50 10.1% 9.6% 8.9% 7.5% 9.0%
End of Eng 30 20 20 10 10 4.3% 3.5% 2.8% 1.8% 2.5%
VO 30 20 30 20 20 4.3% 3.9% 4.6% 4.6% 4.6%
OW 10 10 10 10 10 1.5% 2.2% 1.6% 1.1% 1.9%
Redundancy - - - - - 0.0% 0.0% 0.0% 0.0% 0.0%
AIR OPS CONTROL/SYSTEMS TOTAL 70 7.3%
End of Eng 10 1.2%
VO 40 4.9%
OW 10 1.2%
Redundancy - 0.0%
ATC TOTAL 20 30 20 20 6.2% 7.7% 7.0% 5.9%
End of Eng ~ 10 10 10 1.1% 2.2% 1.7% 1.8%
VO 10 10 10 10 3.0% 3.9% 3.8% 2.7%
OW 10 10 ~ ~ 1.9% 1.7% 1.5% 1.5%
Redundancy ~ - - - 0.3% 0.0% 0.0% 0.0%
Branch Exit ReasonNumber during 12 Month Period Ending … Exit rate for 12 Month Period Ending …
Table 9a. RAF Officer Outflow1 from Trained Regular Strength2 Table 10a. RAF Officer Outflow1 from Trained Regular Strength2
As at 1 April 2018
Produced by Defence Statistics (Air) Page 77

31 Mar 14 31 Mar 15 31 Mar 16 31 Mar 17 31 Mar 18 31 Mar 14 31 Mar 15 31 Mar 16 31 Mar 17 31 Mar 18Branch Exit Reason
Number during 12 Month Period Ending … Exit rate for 12 Month Period Ending …
ABM TOTAL 30 20 10 20 7.9% 7.6% 4.3% 6.6%
End of Eng ~ 10 ~ ~ 1.2% 2.7% 0.6% 1.2%
VO 20 10 10 10 5.3% 3.4% 1.9% 4.2%
OW ~ ~ 10 ~ 1.5% 1.5% 1.9% 1.2%
Redundancy - - - - 0.0% 0.0% 0.0% 0.0%
INT TOTAL 30 20 20 20 20 10.0% 9.0% 9.3% 6.7% 5.3%
End of Eng 10 10 ~ ~ ~ 2.2% 2.3% 1.2% 1.9% 0.4%
VO 20 10 10 10 10 5.9% 5.5% 5.1% 3.7% 2.8%
OW ~ ~ 10 ~ 10 1.9% 1.2% 3.1% 1.1% 2.1%
Redundancy - - - - - 0.0% 0.0% 0.0% 0.0% 0.0%
REGT TOTAL 20 20 20 10 20 5.3% 5.8% 6.5% 3.6% 6.0%
End of Eng ~ ~ 10 ~ 10 1.5% 1.2% 2.4% 0.3% 1.8%
VO 10 10 ~ 10 10 3.2% 2.9% 1.2% 2.4% 3.3%
OW ~ 10 10 ~ ~ 0.6% 1.7% 3.0% 0.9% 0.9%
Redundancy - - - - - 0.0% 0.0% 0.0% 0.0% 0.0%
FLT OPS TOTAL 20 20 10 10 9.6% 9.2% 3.8% 6.1%
End of Eng 10 10 - ~ 3.2% 2.9% 0.0% 1.9%
VO 10 10 10 10 2.7% 3.9% 2.9% 3.8%
OW 10 ~ ~ ~ 2.7% 2.4% 1.0% 0.5%
Redundancy ~ - - - 0.9% 0.0% 0.0% 0.0%
PROV TOTAL 10 10 20 10 10 6.0% 6.5% 10.0% 6.6% 6.4%
End of Eng ~ ~ ~ ~ ~ 0.7% 2.0% 2.7% 2.0% 0.6%
VO 10 ~ 10 10 10 4.0% 3.3% 6.6% 4.6% 5.1%
OW ~ ~ ~ - ~ 1.3% 1.3% 0.7% 0.0% 0.6%
Redundancy - - - - - 0.0% 0.0% 0.0% 0.0% 0.0%
ENG (AS) TOTAL 70 60 60 40 40 8.7% 8.9% 9.2% 5.9% 5.9%
End of Eng 20 20 10 10 10 2.5% 3.0% 1.9% 1.8% 1.2%
VO 20 30 40 20 30 3.0% 4.4% 5.7% 3.7% 4.3%
OW 10 10 10 ~ ~ 0.9% 1.5% 1.6% 0.4% 0.4%
Redundancy 20 - - - - 2.3% 0.0% 0.0% 0.0% 0.0%
Produced by Defence Statistics (Air) Page 78

31 Mar 14 31 Mar 15 31 Mar 16 31 Mar 17 31 Mar 18 31 Mar 14 31 Mar 15 31 Mar 16 31 Mar 17 31 Mar 18Branch Exit Reason
Number during 12 Month Period Ending … Exit rate for 12 Month Period Ending …
ENG (CE) TOTAL 30 30 30 40 30 7.6% 8.4% 8.0% 9.2% 7.8%
End of Eng 10 ~ ~ ~ ~ 1.9% 1.2% 0.8% 0.5% 0.8%
VO 10 20 20 30 20 3.3% 6.2% 5.1% 8.4% 5.9%
OW ~ ~ 10 ~ ~ 1.2% 1.0% 2.1% 0.3% 1.1%
Redundancy ~ - - - - 1.2% 0.0% 0.0% 0.0% 0.0%
LOGISTICS TOTAL 50 30 30 30 40 11.8% 7.9% 6.7% 6.2% 8.8%
End of Eng 20 10 10 10 10 3.3% 1.9% 1.6% 1.4% 2.1%
VO 10 20 10 10 20 3.1% 4.4% 3.2% 3.2% 4.4%
OW 10 10 10 10 10 2.2% 1.6% 1.8% 1.6% 2.3%
Redundancy 20 - - - - 3.3% 0.0% 0.0% 0.0% 0.0%
PERSONNEL TOTAL 100 70 50 12.8% 8.8% 7.2%
End of Eng 20 20 10 2.6% 2.8% 1.7%
VO 30 30 30 4.0% 3.7% 3.6%
OW 20 20 10 2.6% 2.3% 1.9%
Redundancy 30 - - 3.6% 0.0% 0.0%
PERS (SPT) TOTAL 30 40 5.7% 8.3%
End of Eng ~ 10 0.8% 1.2%
VO 20 20 3.3% 5.0%
OW 10 10 1.6% 2.2%
Redundancy - - 0.0% 0.0%
PERS (TRG) TOTAL 10 10 6.6% 4.2%
End of Eng ~ ~ 0.5% 0.9%
VO 10 10 5.2% 2.8%
OW ~ ~ 0.9% 0.5%
Redundancy - - 0.0% 0.0%
MEDICAL TOTAL 20 20 30 10 20 7.3% 8.8% 14.2% 6.2% 7.4%
End of Eng ~ ~ ~ ~ ~ 2.2% 2.2% 1.4% 1.0% 0.5%
VO 10 10 10 10 10 3.9% 3.5% 6.2% 3.8% 4.5%
OW ~ ~ 10 ~ ~ 1.3% 2.2% 2.8% 1.4% 2.5%
Redundancy - ~ 10 - - 0.0% 0.9% 3.8% 0.0% 0.0%
Produced by Defence Statistics (Air) Page 79

31 Mar 14 31 Mar 15 31 Mar 16 31 Mar 17 31 Mar 18 31 Mar 14 31 Mar 15 31 Mar 16 31 Mar 17 31 Mar 18Branch Exit Reason
Number during 12 Month Period Ending … Exit rate for 12 Month Period Ending …
MED SPT TOTAL ~ 10 10 3.3% 5.0% 5.8%
End of Eng ~ ~ ~ 1.7% 2.5% 0.8%
VO ~ ~ ~ 1.7% 1.7% 4.2%
OW - ~ ~ 0.0% 0.8% 0.8%
Redundancy - - - 0.0% 0.0% 0.0%
MED SPT (MAINSTREAM/EHO) TOTAL 10 10 7.7% 9.2%
End of Eng ~ ~ 2.6% 2.6%
VO ~ ~ 3.8% 5.2%
OW ~ ~ 1.3% 1.3%
Redundancy - - 0.0% 0.0%
MED SPT (PHYSIO) TOTAL - ~ 0.0% 3.0%
End of Eng - - 0.0% 0.0%
VO - ~ 0.0% 3.0%
OW - - 0.0% 0.0%
Redundancy - - 0.0% 0.0%
NURSING OFFICER TOTAL 10 10 10 ~ 10 7.2% 9.0% 9.6% 3.8% 7.6%
End of Eng ~ ~ ~ ~ ~ 2.0% 2.1% 1.5% 0.8% 0.8%
VO 10 ~ 10 ~ ~ 4.6% 2.1% 4.4% 1.5% 3.8%
OW ~ 10 ~ ~ ~ 0.7% 4.2% 3.7% 1.5% 3.0%
Redundancy - ~ - - - 0.0% 0.7% 0.0% 0.0% 0.0%
DENTAL TOTAL 10 10 10 ~ ~ 10.8% 24.8% 18.1% 7.9% 5.3%
End of Eng ~ ~ ~ - - 1.8% 4.1% 2.6% 0.0% 0.0%
VO ~ ~ ~ ~ ~ 3.6% 4.1% 7.8% 5.3% 5.3%
OW ~ - ~ ~ - 5.4% 0.0% 2.6% 2.6% 0.0%
Redundancy - 10 ~ - - 0.0% 16.6% 5.2% 0.0% 0.0%
CHAPLAIN TOTAL 10 10 ~ ~ ~ 12.0% 16.6% 7.6% 3.7% 7.4%
End of Eng ~ ~ ~ ~ ~ 6.8% 5.5% 1.9% 3.7% 1.9%
VO - ~ ~ - ~ 0.0% 7.4% 1.9% 0.0% 3.7%
OW ~ ~ ~ - ~ 5.1% 3.7% 3.8% 0.0% 1.9%
Redundancy - - - - - 0.0% 0.0% 0.0% 0.0% 0.0%
Produced by Defence Statistics (Air) Page 80

31 Mar 14 31 Mar 15 31 Mar 16 31 Mar 17 31 Mar 18 31 Mar 14 31 Mar 15 31 Mar 16 31 Mar 17 31 Mar 18Branch Exit Reason
Number during 12 Month Period Ending … Exit rate for 12 Month Period Ending …
LEGAL TOTAL ~ ~ ~ ~ ~ 6.9% 10.9% 7.2% 4.4% 4.4%
End of Eng ~ ~ ~ ~ - 2.3% 4.4% 2.4% 2.2% 0.0%
VO ~ ~ ~ ~ ~ 2.3% 2.2% 4.8% 2.2% 4.4%
OW ~ ~ - - - 2.3% 4.4% 0.0% 0.0% 0.0%
Redundancy - - - - - 0.0% 0.0% 0.0% 0.0% 0.0%
MUSIC TOTAL - ~ - - ~ 0.0% 17.6% 0.0% 0.0% 18.6%
End of Eng - ~ - - ~ 0.0% 17.6% 0.0% 0.0% 18.6%
VO - - - - - 0.0% 0.0% 0.0% 0.0% 0.0%
OW - - - - - 0.0% 0.0% 0.0% 0.0% 0.0%
Redundancy - - - - - 0.0% 0.0% 0.0% 0.0% 0.0%
1 Outflow has been broken down into four categories which include the following exit reasons:
a. End of Eng (End of Engagement) includes personnel whose exit reason is listed as End of Engagement;
b. VO (Voluntary Outflow) includes those whose exit reason is listed as PVR, Pregnancy or Statutory Right;
c. OW (Other Wastage) covers all other exit reasons with the exception of Redundancy.2 Strength includes all trained regular personnel and excludes Full Time Reserve Service personnel, volunteer reserves and mobilised reservists.
Notes:a. In accordance with the Data Protection Act and our obligations in relation to the protection of confidentiality when handling personal data, data have been rounded to the nearest 10, where "-" denotes zero and "~" denotes a number less than or equal to 5.b. Due to the rounding methods used, totals may not always equal the sum of the parts. c. When rounding to the nearest 10, numbers ending in 5 have been rounded to the nearest multiple of 20 to prevent systematic bias.d. Percentages have been calculated from unrounded data.
Produced by Defence Statistics (Air) Page 81

31 Mar 14 31 Mar 15 31 Mar 16 31 Mar 17 31 Mar 18 31 Mar 14 31 Mar 15 31 Mar 16 31 Mar 17 31 Mar 18
NCA TOTAL3 TOTAL 80 70 80 40 40 9.0% 7.8% 9.5% 5.7% 4.8%
End of Eng 40 20 10 10 10 3.7% 2.3% 1.2% 1.4% 1.6%VO 30 30 60 30 20 3.6% 4.0% 7.5% 3.7% 2.7%OW 10 10 10 ~ ~ 1.1% 1.5% 0.7% 0.5% 0.5%Redundancy ~ - - - - 0.5% 0.0% 0.0% 0.0% 0.0%
NCA WSOp(A Eng) TOTAL 20 10 10 10 ~ 21.3% 16.2% 12.7% 19.3% 7.4%End of Eng 10 ~ ~ ~ ~ 13.3% 6.5% 1.8% 6.4% 4.9%VO 10 ~ 10 ~ - 8.0% 6.5% 10.9% 8.6% 0.0%OW - ~ - ~ ~ 0.0% 3.2% 0.0% 4.3% 2.5%Redundancy - - - - - 0.0% 0.0% 0.0% 0.0% 0.0%
NCA WSOp(Crew) TOTAL 30 30 50 20 20 6.5% 6.6% 10.0% 4.4% 5.0%End of Eng 10 ~ 10 ~ ~ 2.3% 0.8% 1.2% 0.6% 0.9%VO 20 20 40 20 20 3.0% 4.0% 7.7% 3.4% 3.5%OW 10 10 ~ ~ ~ 1.1% 1.8% 1.0% 0.4% 0.6%Redundancy - - - - - 0.0% 0.0% 0.0% 0.0% 0.0%
NCA WSOp(EW/Acc) TOTAL 30 20 20 10 10 12.4% 9.1% 9.4% 5.1% 3.5%End of Eng 10 10 ~ ~ ~ 4.4% 5.0% 1.5% 2.6% 1.5%VO 10 10 20 ~ ~ 4.8% 3.2% 7.4% 2.6% 2.0%OW ~ ~ ~ - - 1.2% 0.9% 0.5% 0.0% 0.0%Redundancy ~ - - - - 2.0% 0.0% 0.0% 0.0% 0.0%
NCA WSOp(L) TOTAL ~ ~ ~ ~ ~ 5.1% 5.5% 5.7% 8.5% 8.4%End of Eng ~ ~ - - ~ 3.4% 1.8% 0.0% 0.0% 6.3%VO - ~ ~ ~ ~ 0.0% 3.6% 5.7% 8.5% 2.1%OW ~ - - - - 1.7% 0.0% 0.0% 0.0% 0.0%Redundancy - - - - - 0.0% 0.0% 0.0% 0.0% 0.0%
1 Outflow has been broken down into four categories which include the following exit reasons:
a. End of Eng (End of Engagement) includes personnel whose exit reason is listed as End of Engagement;
b. VO (Voluntary Outflow) includes those whose exit reason is listed as PVR, Pregnancy or Statutory Right;
c. OW (Other Wastage) covers all other exit reasons with the exception of Redundancy.2 Strength includes all trained regular personnel and excludes Full Time Reserve Service personnel, volunteer
reserves and mobilised reservists.3 Totals include any personnel whose trade, within the NCA cadre, is unknown at the point of outflow.
Branch Exit ReasonNumber during 12 Month Period Ending … Exit rate for 12 Month Period Ending …
Table 10b. RAF Non-Commissioned Aircrew Outflow1 from Trained Regular Strength2
As at 1 April 2018
Notes:a. In accordance with the Data Protection Act and our obligations in relation to the protection of confidentiality when handling personal data, data have been rounded to the nearest 10, where "-" denotes zero and "~" denotes a number less than or equal to 5.b. Due to the rounding methods used, totals may not always equal the sum of the parts. c. When rounding to the nearest 10, numbers ending in 5 have been rounded to the nearest multiple of 20 to prevent systematic bias.d. Percentages have been calculated from unrounded data.
Produced by Defence Statistics (Air) Page 82
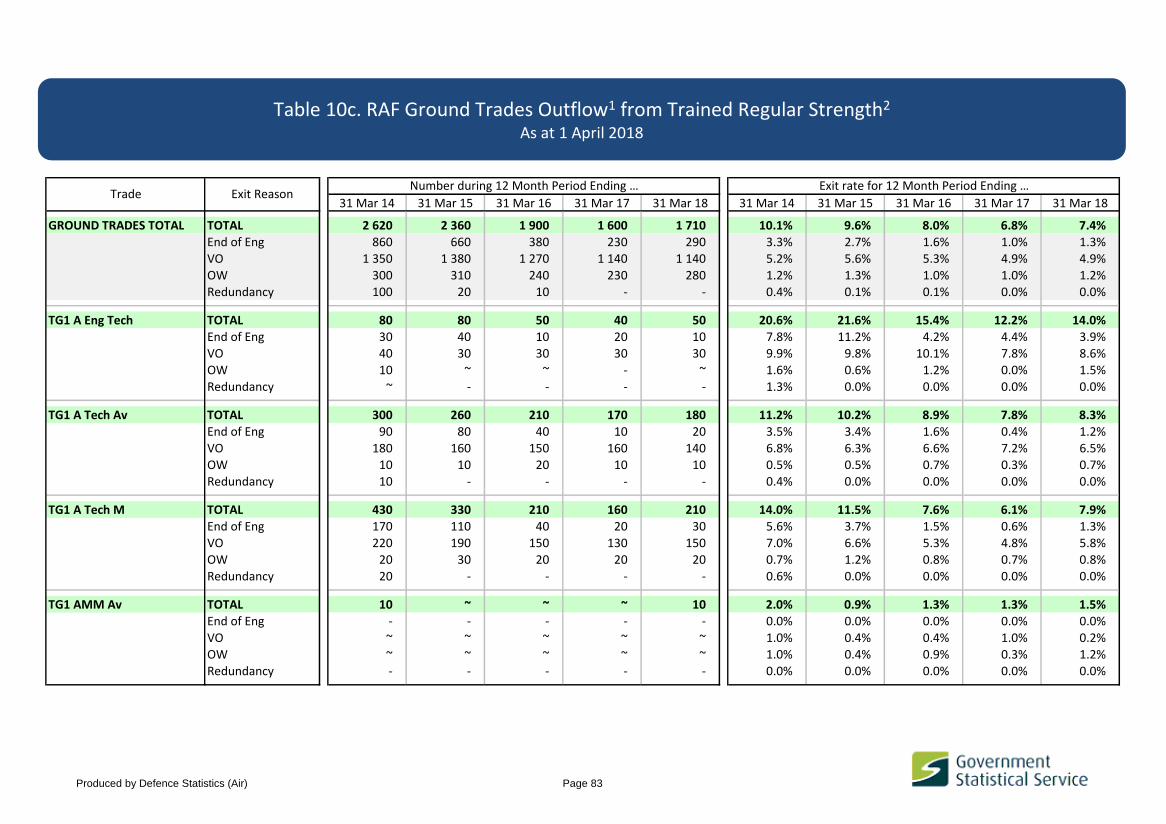
31 Mar 14 31 Mar 15 31 Mar 16 31 Mar 17 31 Mar 18 31 Mar 14 31 Mar 15 31 Mar 16 31 Mar 17 31 Mar 18
GROUND TRADES TOTAL TOTAL 2 620 2 360 1 900 1 600 1 710 10.1% 9.6% 8.0% 6.8% 7.4%
End of Eng 860 660 380 230 290 3.3% 2.7% 1.6% 1.0% 1.3%VO 1 350 1 380 1 270 1 140 1 140 5.2% 5.6% 5.3% 4.9% 4.9%
OW 300 310 240 230 280 1.2% 1.3% 1.0% 1.0% 1.2%Redundancy 100 20 10 - - 0.4% 0.1% 0.1% 0.0% 0.0%
TG1 A Eng Tech TOTAL 80 80 50 40 50 20.6% 21.6% 15.4% 12.2% 14.0%End of Eng 30 40 10 20 10 7.8% 11.2% 4.2% 4.4% 3.9%VO 40 30 30 30 30 9.9% 9.8% 10.1% 7.8% 8.6%OW 10 ~ ~ - ~ 1.6% 0.6% 1.2% 0.0% 1.5%Redundancy ~ - - - - 1.3% 0.0% 0.0% 0.0% 0.0%
TG1 A Tech Av TOTAL 300 260 210 170 180 11.2% 10.2% 8.9% 7.8% 8.3%End of Eng 90 80 40 10 20 3.5% 3.4% 1.6% 0.4% 1.2%
VO 180 160 150 160 140 6.8% 6.3% 6.6% 7.2% 6.5%OW 10 10 20 10 10 0.5% 0.5% 0.7% 0.3% 0.7%Redundancy 10 - - - - 0.4% 0.0% 0.0% 0.0% 0.0%
TG1 A Tech M TOTAL 430 330 210 160 210 14.0% 11.5% 7.6% 6.1% 7.9%End of Eng 170 110 40 20 30 5.6% 3.7% 1.5% 0.6% 1.3%
VO 220 190 150 130 150 7.0% 6.6% 5.3% 4.8% 5.8%OW 20 30 20 20 20 0.7% 1.2% 0.8% 0.7% 0.8%Redundancy 20 - - - - 0.6% 0.0% 0.0% 0.0% 0.0%
TG1 AMM Av TOTAL 10 ~ ~ ~ 10 2.0% 0.9% 1.3% 1.3% 1.5%End of Eng - - - - - 0.0% 0.0% 0.0% 0.0% 0.0%
VO ~ ~ ~ ~ ~ 1.0% 0.4% 0.4% 1.0% 0.2%OW ~ ~ ~ ~ ~ 1.0% 0.4% 0.9% 0.3% 1.2%Redundancy - - - - - 0.0% 0.0% 0.0% 0.0% 0.0%
Trade Exit ReasonNumber during 12 Month Period Ending … Exit rate for 12 Month Period Ending …
Table 10c. RAF Ground Trades Outflow1 from Trained Regular Strength2
As at 1 April 2018
Produced by Defence Statistics (Air) Page 83
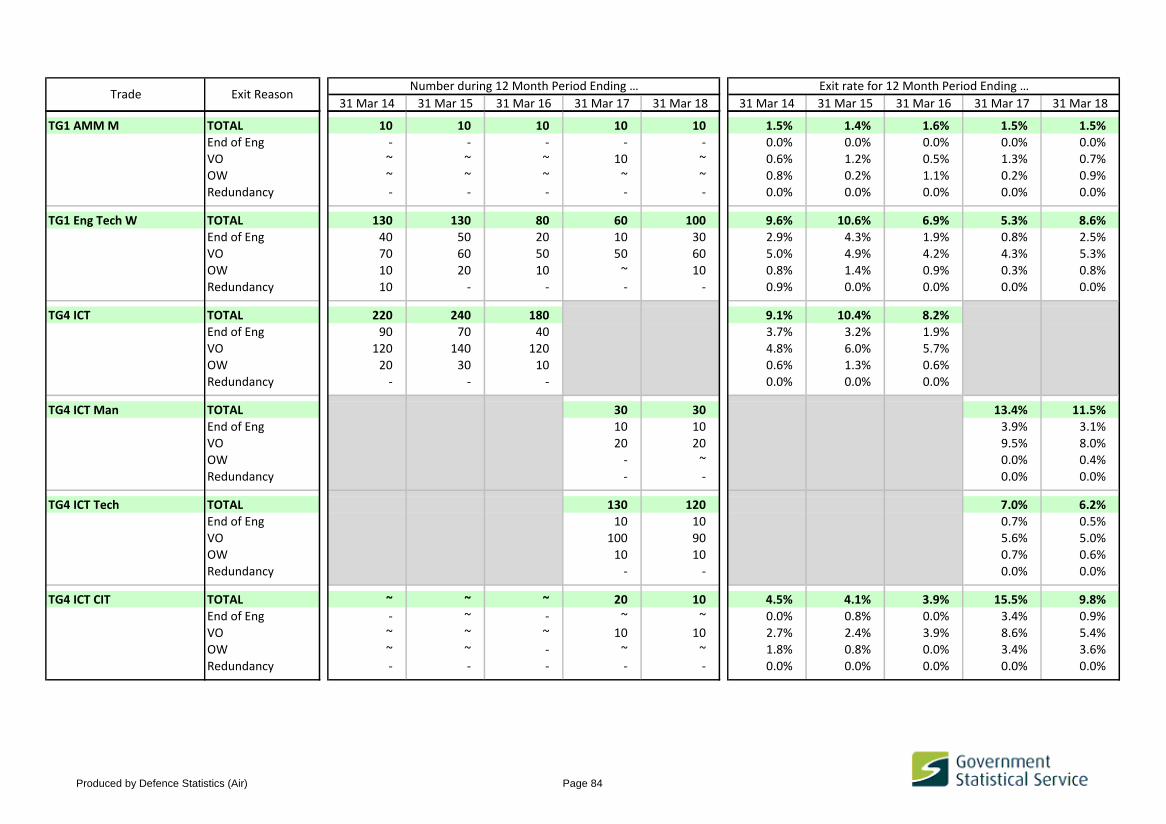
31 Mar 14 31 Mar 15 31 Mar 16 31 Mar 17 31 Mar 18 31 Mar 14 31 Mar 15 31 Mar 16 31 Mar 17 31 Mar 18Trade Exit Reason
Number during 12 Month Period Ending … Exit rate for 12 Month Period Ending …
TG1 AMM M TOTAL 10 10 10 10 10 1.5% 1.4% 1.6% 1.5% 1.5%End of Eng - - - - - 0.0% 0.0% 0.0% 0.0% 0.0%VO ~ ~ ~ 10 ~ 0.6% 1.2% 0.5% 1.3% 0.7%OW ~ ~ ~ ~ ~ 0.8% 0.2% 1.1% 0.2% 0.9%Redundancy - - - - - 0.0% 0.0% 0.0% 0.0% 0.0%
TG1 Eng Tech W TOTAL 130 130 80 60 100 9.6% 10.6% 6.9% 5.3% 8.6%End of Eng 40 50 20 10 30 2.9% 4.3% 1.9% 0.8% 2.5%VO 70 60 50 50 60 5.0% 4.9% 4.2% 4.3% 5.3%
OW 10 20 10 ~ 10 0.8% 1.4% 0.9% 0.3% 0.8%Redundancy 10 - - - - 0.9% 0.0% 0.0% 0.0% 0.0%
TG4 ICT TOTAL 220 240 180 9.1% 10.4% 8.2%End of Eng 90 70 40 3.7% 3.2% 1.9%VO 120 140 120 4.8% 6.0% 5.7%OW 20 30 10 0.6% 1.3% 0.6%Redundancy - - - 0.0% 0.0% 0.0%
TG4 ICT Man TOTAL 30 30 13.4% 11.5%End of Eng 10 10 3.9% 3.1%VO 20 20 9.5% 8.0%
OW - ~ 0.0% 0.4%Redundancy - - 0.0% 0.0%
TG4 ICT Tech TOTAL 130 120 7.0% 6.2%End of Eng 10 10 0.7% 0.5%VO 100 90 5.6% 5.0%OW 10 10 0.7% 0.6%Redundancy - - 0.0% 0.0%
TG4 ICT CIT TOTAL ~ ~ ~ 20 10 4.5% 4.1% 3.9% 15.5% 9.8%End of Eng - ~ - ~ ~ 0.0% 0.8% 0.0% 3.4% 0.9%
VO ~ ~ ~ 10 10 2.7% 2.4% 3.9% 8.6% 5.4%OW ~ ~ - ~ ~ 1.8% 0.8% 0.0% 3.4% 3.6%Redundancy - - - - - 0.0% 0.0% 0.0% 0.0% 0.0%
Produced by Defence Statistics (Air) Page 84
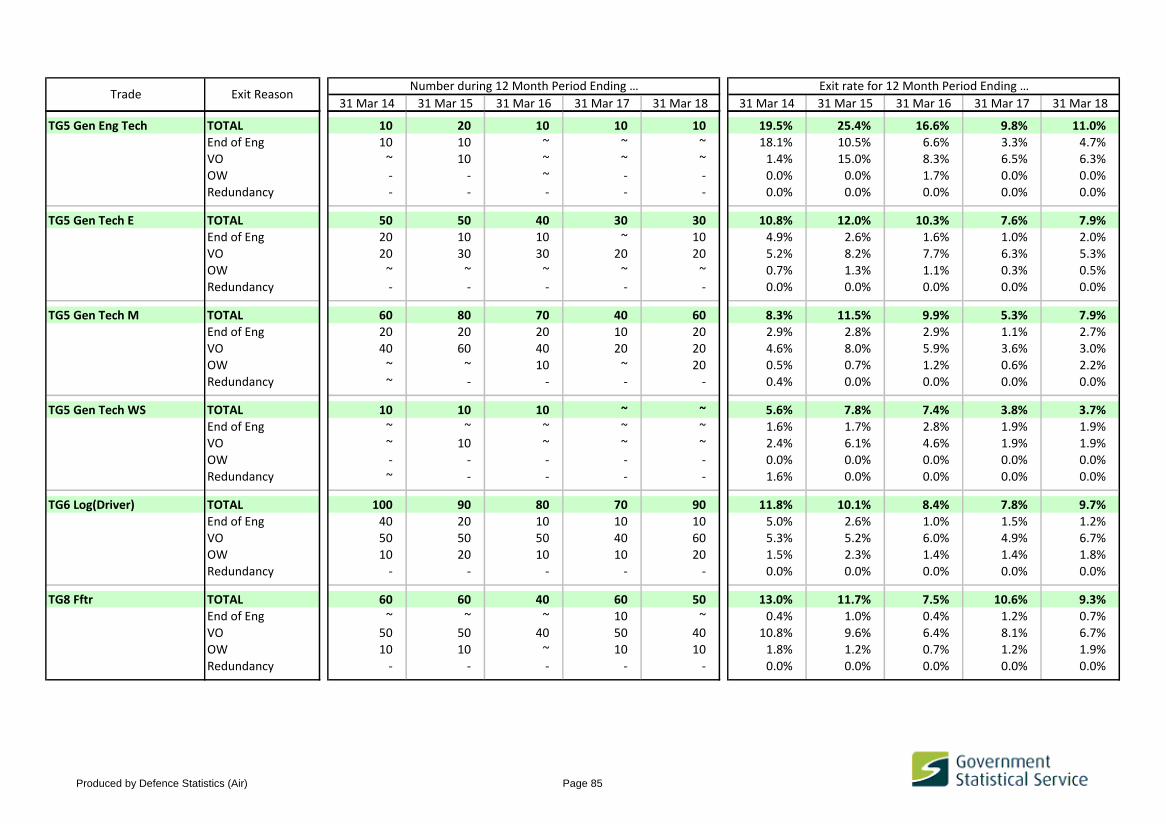
31 Mar 14 31 Mar 15 31 Mar 16 31 Mar 17 31 Mar 18 31 Mar 14 31 Mar 15 31 Mar 16 31 Mar 17 31 Mar 18Trade Exit Reason
Number during 12 Month Period Ending … Exit rate for 12 Month Period Ending …
TG5 Gen Eng Tech TOTAL 10 20 10 10 10 19.5% 25.4% 16.6% 9.8% 11.0%End of Eng 10 10 ~ ~ ~ 18.1% 10.5% 6.6% 3.3% 4.7%VO ~ 10 ~ ~ ~ 1.4% 15.0% 8.3% 6.5% 6.3%OW - - ~ - - 0.0% 0.0% 1.7% 0.0% 0.0%Redundancy - - - - - 0.0% 0.0% 0.0% 0.0% 0.0%
TG5 Gen Tech E TOTAL 50 50 40 30 30 10.8% 12.0% 10.3% 7.6% 7.9%End of Eng 20 10 10 ~ 10 4.9% 2.6% 1.6% 1.0% 2.0%VO 20 30 30 20 20 5.2% 8.2% 7.7% 6.3% 5.3%
OW ~ ~ ~ ~ ~ 0.7% 1.3% 1.1% 0.3% 0.5%Redundancy - - - - - 0.0% 0.0% 0.0% 0.0% 0.0%
TG5 Gen Tech M TOTAL 60 80 70 40 60 8.3% 11.5% 9.9% 5.3% 7.9%End of Eng 20 20 20 10 20 2.9% 2.8% 2.9% 1.1% 2.7%VO 40 60 40 20 20 4.6% 8.0% 5.9% 3.6% 3.0%OW ~ ~ 10 ~ 20 0.5% 0.7% 1.2% 0.6% 2.2%Redundancy ~ - - - - 0.4% 0.0% 0.0% 0.0% 0.0%
TG5 Gen Tech WS TOTAL 10 10 10 ~ ~ 5.6% 7.8% 7.4% 3.8% 3.7%End of Eng ~ ~ ~ ~ ~ 1.6% 1.7% 2.8% 1.9% 1.9%VO ~ 10 ~ ~ ~ 2.4% 6.1% 4.6% 1.9% 1.9%
OW - - - - - 0.0% 0.0% 0.0% 0.0% 0.0%Redundancy ~ - - - - 1.6% 0.0% 0.0% 0.0% 0.0%
TG6 Log(Driver) TOTAL 100 90 80 70 90 11.8% 10.1% 8.4% 7.8% 9.7%End of Eng 40 20 10 10 10 5.0% 2.6% 1.0% 1.5% 1.2%VO 50 50 50 40 60 5.3% 5.2% 6.0% 4.9% 6.7%OW 10 20 10 10 20 1.5% 2.3% 1.4% 1.4% 1.8%Redundancy - - - - - 0.0% 0.0% 0.0% 0.0% 0.0%
TG8 Fftr TOTAL 60 60 40 60 50 13.0% 11.7% 7.5% 10.6% 9.3%End of Eng ~ ~ ~ 10 ~ 0.4% 1.0% 0.4% 1.2% 0.7%
VO 50 50 40 50 40 10.8% 9.6% 6.4% 8.1% 6.7%OW 10 10 ~ 10 10 1.8% 1.2% 0.7% 1.2% 1.9%Redundancy - - - - - 0.0% 0.0% 0.0% 0.0% 0.0%
Produced by Defence Statistics (Air) Page 85

31 Mar 14 31 Mar 15 31 Mar 16 31 Mar 17 31 Mar 18 31 Mar 14 31 Mar 15 31 Mar 16 31 Mar 17 31 Mar 18Trade Exit Reason
Number during 12 Month Period Ending … Exit rate for 12 Month Period Ending …
TG8 Gnr TOTAL 150 200 180 130 110 8.1% 11.0% 10.8% 8.1% 7.1%End of Eng 20 20 20 10 10 0.9% 0.9% 1.1% 0.5% 0.6%VO 80 130 120 70 70 4.1% 7.3% 7.1% 4.6% 4.3%OW 60 50 40 50 40 3.1% 2.7% 2.6% 2.9% 2.3%Redundancy - - - - - 0.0% 0.0% 0.0% 0.0% 0.0%
TG8 RAFP TOTAL 110 60 60 70 80 10.7% 6.6% 6.4% 7.2% 7.5%End of Eng 30 10 10 10 ~ 2.6% 1.3% 1.1% 0.6% 0.3%VO 60 40 50 50 60 6.2% 4.4% 4.7% 5.3% 6.2%
OW 20 10 10 10 10 2.0% 0.9% 0.6% 1.3% 1.0%Redundancy - - - - - 0.0% 0.0% 0.0% 0.0% 0.0%
TG9 ATC TOTAL 20 20 20 20 20 5.7% 5.7% 6.6% 5.4% 6.0%End of Eng ~ ~ ~ 10 ~ 0.9% 0.6% 0.7% 2.0% 1.4%VO 10 20 20 10 10 3.8% 4.8% 5.3% 2.7% 3.2%OW ~ ~ ~ ~ ~ 0.9% 0.3% 0.7% 0.7% 1.4%Redundancy - - - - - 0.0% 0.0% 0.0% 0.0% 0.0%
TG9 FOM/FOA TOTAL 80 50 60 50 60 9.6% 6.5% 6.8% 5.9% 6.9%End of Eng 20 20 10 10 10 2.6% 2.4% 1.3% 0.7% 1.2%VO 50 30 30 40 40 5.7% 3.2% 4.0% 4.5% 5.1%
OW 10 10 10 10 ~ 1.4% 0.9% 1.5% 0.7% 0.6%Redundancy - - - - - 0.0% 0.0% 0.0% 0.0% 0.0%
TG10 RAF PTI TOTAL 40 30 20 20 20 9.1% 7.6% 6.7% 4.8% 4.1%End of Eng 10 10 ~ ~ - 1.9% 2.5% 1.1% 1.3% 0.0%VO 10 10 20 10 10 2.4% 3.6% 4.3% 2.6% 3.3%OW 10 10 ~ ~ ~ 1.7% 1.5% 1.3% 0.8% 0.8%Redundancy 10 - - - - 3.1% 0.0% 0.0% 0.0% 0.0%
TG11 Int An TOTAL 40 50 60 40 40 5.0% 7.2% 8.7% 6.2% 5.2%End of Eng 10 10 10 ~ ~ 1.3% 1.6% 1.6% 0.4% 0.3%
VO 30 40 50 40 30 3.5% 4.7% 7.1% 5.3% 4.5%OW ~ 10 ~ ~ ~ 0.3% 0.8% 0.1% 0.4% 0.4%Redundancy - - - - - 0.0% 0.0% 0.0% 0.0% 0.0%
Produced by Defence Statistics (Air) Page 86

31 Mar 14 31 Mar 15 31 Mar 16 31 Mar 17 31 Mar 18 31 Mar 14 31 Mar 15 31 Mar 16 31 Mar 17 31 Mar 18Trade Exit Reason
Number during 12 Month Period Ending … Exit rate for 12 Month Period Ending …
TG11 Int An(L) TOTAL 10 20 10 20 10 6.8% 10.8% 8.4% 12.5% 7.3%End of Eng ~ ~ - ~ - 1.2% 0.7% 0.0% 2.5% 0.0%VO 10 10 10 10 10 5.0% 8.8% 6.9% 8.3% 7.3%OW ~ ~ ~ ~ - 0.6% 1.3% 1.5% 1.7% 0.0%Redundancy - - - - - 0.0% 0.0% 0.0% 0.0% 0.0%
TG12 ASMOp TOTAL 50 20 30 30 30 8.5% 4.3% 5.4% 5.9% 6.6%End of Eng 20 ~ ~ ~ ~ 3.5% 0.7% 0.7% 0.4% 0.2%VO 20 20 20 30 30 4.1% 3.1% 4.0% 5.2% 5.2%
OW ~ ~ ~ ~ 10 0.9% 0.5% 0.7% 0.4% 1.2%Redundancy - - - - - 0.0% 0.0% 0.0% 0.0% 0.0%
TG12 SNCO WC TOTAL ~ - ~ ~ - 19.4% 0.0% 3.5% 6.0% 0.0%End of Eng ~ - ~ ~ - 7.8% 0.0% 3.5% 3.0% 0.0%VO ~ - - ~ - 11.6% 0.0% 0.0% 3.0% 0.0%OW - - - - - 0.0% 0.0% 0.0% 0.0% 0.0%Redundancy - - - - - 0.0% 0.0% 0.0% 0.0% 0.0%
TG13 SE Fitt TOTAL 40 40 30 20 40 8.7% 7.2% 5.3% 4.7% 8.8%End of Eng 20 10 10 10 10 3.3% 2.5% 1.7% 1.1% 2.1%VO 20 20 10 10 20 3.5% 4.3% 2.5% 1.9% 4.5%
OW 10 ~ 10 10 10 1.9% 0.4% 1.1% 1.7% 2.1%Redundancy - - - - - 0.0% 0.0% 0.0% 0.0% 0.0%
TG14 Air Cart TOTAL ~ 10 ~ ~ ~ 5.8% 8.6% 4.3% 1.4% 2.8%End of Eng ~ - - - - 1.5% 0.0% 0.0% 0.0% 0.0%VO ~ ~ ~ ~ ~ 2.9% 7.2% 4.3% 1.4% 2.8%OW ~ ~ - - - 1.5% 1.4% 0.0% 0.0% 0.0%Redundancy - - - - - 0.0% 0.0% 0.0% 0.0% 0.0%
TG14 Photo TOTAL 20 10 ~ ~ ~ 14.7% 14.0% 1.1% 5.2% 4.0%End of Eng 10 10 - - ~ 8.7% 6.0% 0.0% 0.0% 1.0%
VO ~ 10 ~ ~ ~ 2.6% 7.0% 1.1% 3.1% 3.0%OW ~ ~ - ~ - 0.9% 1.0% 0.0% 2.1% 0.0%Redundancy ~ - - - - 2.6% 0.0% 0.0% 0.0% 0.0%
Produced by Defence Statistics (Air) Page 87

31 Mar 14 31 Mar 15 31 Mar 16 31 Mar 17 31 Mar 18 31 Mar 14 31 Mar 15 31 Mar 16 31 Mar 17 31 Mar 18Trade Exit Reason
Number during 12 Month Period Ending … Exit rate for 12 Month Period Ending …
TG15 Biomed TOTAL ~ ~ ~ ~ ~ 5.6% 6.0% 13.6% 7.5% 8.1%End of Eng - - ~ - - 0.0% 0.0% 6.8% 0.0% 0.0%VO ~ - ~ ~ ~ 5.6% 0.0% 6.8% 7.5% 8.1%OW - ~ - - - 0.0% 6.0% 0.0% 0.0% 0.0%Redundancy - - - - - 0.0% 0.0% 0.0% 0.0% 0.0%
TG15 EH Tech TOTAL ~ ~ ~ 10 ~ 10.4% 8.6% 9.3% 14.6% 2.7%End of Eng ~ ~ ~ - - 2.1% 2.2% 2.3% 0.0% 0.0%VO ~ ~ ~ ~ ~ 8.3% 6.5% 6.9% 12.2% 2.7%
OW - - - ~ - 0.0% 0.0% 0.0% 2.4% 0.0%Redundancy - - - - - 0.0% 0.0% 0.0% 0.0% 0.0%
TG15 ODP TOTAL 10 ~ ~ - 10 26.5% 20.5% 18.0% 0.0% 37.9%End of Eng ~ - ~ - - 11.4% 0.0% 9.0% 0.0% 0.0%VO ~ ~ ~ - ~ 15.2% 4.1% 9.0% 0.0% 27.1%OW - ~ - - ~ 0.0% 8.2% 0.0% 0.0% 10.8%Redundancy - ~ - - - 0.0% 8.2% 0.0% 0.0% 0.0%
TG15 PH Tech TOTAL ~ ~ ~ ~ - 5.4% 12.0% 12.3% 12.4% 0.0%End of Eng - - ~ ~ - 0.0% 0.0% 6.2% 6.2% 0.0%VO - ~ ~ ~ - 0.0% 6.0% 6.2% 6.2% 0.0%
OW ~ ~ - - - 5.4% 6.0% 0.0% 0.0% 0.0%Redundancy - - - - - 0.0% 0.0% 0.0% 0.0% 0.0%
TG15 Radiog TOTAL ~ - ~ ~ ~ 24.7% 0.0% 36.9% 20.7% 23.3%End of Eng - - - - - 0.0% 0.0% 0.0% 0.0% 0.0%VO ~ - - - - 24.7% 0.0% 0.0% 0.0% 0.0%OW - - ~ ~ ~ 0.0% 0.0% 18.5% 20.7% 23.3%Redundancy - - ~ - - 0.0% 0.0% 18.5% 0.0% 0.0%
TG15 RAF Medic TOTAL 60 50 50 40 40 10.1% 9.4% 9.6% 8.6% 10.1%End of Eng 10 10 10 10 ~ 2.2% 2.1% 1.8% 1.5% 0.7%
VO 40 30 30 20 20 6.5% 5.3% 6.2% 4.6% 5.7%OW 10 10 10 10 20 1.4% 2.1% 1.6% 2.4% 3.7%Redundancy - - - - - 0.0% 0.0% 0.0% 0.0% 0.0%
Produced by Defence Statistics (Air) Page 88

31 Mar 14 31 Mar 15 31 Mar 16 31 Mar 17 31 Mar 18 31 Mar 14 31 Mar 15 31 Mar 16 31 Mar 17 31 Mar 18Trade Exit Reason
Number during 12 Month Period Ending … Exit rate for 12 Month Period Ending …
TG15 Nurses Spine TOTAL 30 30 30 8.9% 10.5% 9.8%End of Eng ~ ~ ~ 1.6% 0.7% 1.0%VO 20 20 20 5.7% 7.9% 6.8%OW ~ ~ ~ 1.6% 0.7% 1.7%Redundancy - ~ ~ 0.0% 1.3% 0.3%
TG15 RN(A) TOTAL 30 10 10.8% 5.0%End of Eng ~ - 1.2% 0.0%VO 20 10 7.3% 3.8%
OW 10 ~ 2.3% 1.1%Redundancy - - 0.0% 0.0%
TG15 RN(MH) TOTAL ~ ~ 4.7% 4.8%End of Eng - - 0.0% 0.0%VO ~ ~ 4.7% 4.8%OW - - 0.0% 0.0%Redundancy - - 0.0% 0.0%
TG16 Dent Hyg TOTAL ~ 10 10 ~ 14.1% 34.7% 232.3% 266.7%End of Eng ~ ~ ~ ~ 9.4% 11.6% 77.4% 266.7%VO ~ ~ - - 4.7% 5.8% 0.0% 0.0%
OW - - - - 0.0% 0.0% 0.0% 0.0%Redundancy - ~ 10 - 0.0% 17.3% 154.8% 0.0%
TG16 Dental Nurse TOTAL 20 30 10 ~ 10 13.9% 32.4% 16.1% 7.9% 16.2%End of Eng ~ ~ ~ ~ ~ 3.7% 3.3% 4.4% 1.6% 4.9%VO 10 20 10 ~ ~ 9.2% 19.0% 10.2% 6.3% 8.1%OW ~ ~ ~ - ~ 0.9% 1.1% 1.5% 0.0% 3.2%Redundancy - 10 - - - 0.0% 8.9% 0.0% 0.0% 0.0%
TG17 Pers(Spt) TOTAL 150 100 80 50 70 13.2% 9.4% 7.4% 4.9% 6.9%End of Eng 40 20 20 10 10 3.8% 2.4% 1.9% 0.7% 1.4%
VO 80 50 50 30 40 6.7% 5.0% 5.0% 3.1% 4.0%OW 30 20 10 10 20 2.4% 2.0% 0.6% 1.1% 1.5%Redundancy ~ - - - - 0.3% 0.0% 0.0% 0.0% 0.0%
Produced by Defence Statistics (Air) Page 89

31 Mar 14 31 Mar 15 31 Mar 16 31 Mar 17 31 Mar 18 31 Mar 14 31 Mar 15 31 Mar 16 31 Mar 17 31 Mar 18Trade Exit Reason
Number during 12 Month Period Ending … Exit rate for 12 Month Period Ending …
TG18 Log(Mov) TOTAL 60 70 50 60 50 6.9% 7.6% 5.1% 6.1% 5.6%End of Eng 20 10 10 10 10 2.1% 0.8% 0.9% 1.1% 1.4%VO 30 40 40 40 30 3.8% 4.8% 3.8% 4.3% 3.0%OW 10 20 ~ 10 10 0.9% 2.0% 0.4% 0.7% 1.2%Redundancy - - - - - 0.0% 0.0% 0.0% 0.0% 0.0%
TG18 Log(Sup) TOTAL 140 120 120 90 100 9.4% 8.7% 8.7% 6.9% 7.4%End of Eng 70 50 40 20 30 4.7% 3.4% 2.7% 1.6% 2.2%VO 60 60 60 50 50 4.1% 4.0% 4.4% 3.9% 3.9%
OW 10 20 20 20 20 0.6% 1.3% 1.5% 1.3% 1.3%Redundancy - - - - - 0.0% 0.0% 0.0% 0.0% 0.0%
TG19 Log(AGS) TOTAL 30 40 30 40 30 8.2% 9.9% 7.7% 11.8% 9.4%End of Eng 20 20 10 10 10 3.7% 4.4% 3.1% 3.7% 2.5%VO 10 20 20 20 20 3.0% 4.4% 3.8% 5.8% 5.0%OW 10 ~ ~ 10 10 1.5% 1.0% 0.8% 2.4% 1.9%Redundancy - - - - - 0.0% 0.0% 0.0% 0.0% 0.0%
TG19 Log(Chef) TOTAL 60 30 30 30 40 11.9% 7.3% 6.0% 6.2% 9.9%End of Eng 20 20 10 10 20 4.3% 4.1% 1.9% 2.1% 3.7%VO 10 10 10 10 20 2.1% 1.8% 3.0% 2.5% 3.9%
OW 10 10 ~ 10 10 1.5% 1.4% 1.2% 1.6% 2.3%Redundancy 20 - - - - 4.0% 0.0% 0.0% 0.0% 0.0%
TG21 Musn TOTAL 10 10 20 ~ ~ 5.0% 5.0% 11.0% 3.2% 2.5%End of Eng ~ ~ ~ ~ ~ 0.6% 0.6% 0.6% 0.6% 0.6%VO ~ ~ 10 ~ ~ 3.1% 3.1% 7.1% 2.5% 1.8%OW ~ ~ ~ - - 1.2% 1.2% 3.2% 0.0% 0.0%Redundancy - - - - - 0.0% 0.0% 0.0% 0.0% 0.0%
1 Outflow has been broken down into four categories which include the following exit reasons:
a. End of Eng (End of Engagement) includes personnel whose exit reason is listed as End of Engagement;
b. VO (Voluntary Outflow) includes those whose exit reason is listed as PVR, Pregnancy or Statutory Right;
c. OW (Other Wastage) covers all other exit reasons with the exception of Redundancy.2 Strength includes all trained regular personnel and excludes Full Time Reserve Service personnel,
volunteer reserves and mobilised reservists.
Notes:a. In accordance with the Data Protection Act and our obligations in relation to the protection of confidentiality when handling personal data, data have been rounded to the nearest 10, where "-" denotes zero and "~" denotes a number less than or equal to 5.b. Due to the rounding methods used, totals may not always equal the sum of the parts. c. When rounding to the nearest 10, numbers ending in 5 have been rounded to the nearest multiple of 20 to prevent systematic bias.d. Percentages have been calculated from unrounded data.
Produced by Defence Statistics (Air) Page 90

Number Average RoS Number Average RoS Number Average RoS Number Average RoS
OFFICERS 2 560 13 years 11 months 1 900 18 years 0 months 1 610 19 years 2 months 1 500 19 years 7 months
GENERAL DUTIES - - 10 32 years 1 month
PILOT 660 18 years 2 months 430 19 years 7 months 400 19 years 7 months 400 19 years 11 months
WSO 320 16 years 8 months 220 23 years 9 months 150 24 years 10 months 140 24 years 8 months
AIR OPS CONTROL/SYSTEMS 180 16 years 3 months
ATC 180 8 years 11 months 100 15 years 10 months 80 16 years 1 month
ABM 90 11 years 3 months 60 16 years 7 months 70 17 years 4 months
INT 30 8 years 10 months 50 14 years 0 months 70 14 years 10 months 60 14 years 7 months
REGT 80 7 years 5 months 60 14 years 9 months 60 19 years 2 months 60 20 years 1 month
FLT OPS 40 1 year 4 months 30 9 years 5 months 40 15 years 5 months
PROV 30 7 years 2 months 30 12 years 11 months 40 17 years 3 months 40 17 years 2 months
ENG (AS) 170 19 years 6 months 150 20 years 5 months
ENG (CE) 100 18 years 2 months 100 20 years 4 months
ENG (Unknown) 500 12 years 10 months 380 16 years 9 months ~ N/A ~ N/A
LOGISTICS 130 16 years 9 months 150 19 years 4 months 90 22 years 6 months 90 21 years 8 months
PERS (SPT) 230 13 years 3 months 160 18 years 6 months 100 20 years 5 months 110 20 years 4 months
PERS (PED) 20 9 years 2 months 20 13 years 6 months
PERS (TRG) 50 9 years 4 months 60 16 years 8 months 40 18 years 8 months 30 18 years 8 months
PERS (Unknown) 10 19 years 7 months ~ -
MEDICAL 70 15 years 5 months 50 13 years 1 month 70 16 years 4 months 60 17 years 7 months
MED SPT 20 7 years 1 month 20 14 years 8 months
MED SPT (MAINSTREAM/EHO) 20 18 years 1 month 20 22 years 0 months
MED SPT (PHYSIO) ~ - ~ -
NURSING OFFICER 20 9 years 11 months 30 12 years 7 months 30 16 years 11 months 30 16 years 6 months
DENTAL 20 14 years 0 months 10 15 years 0 months 20 16 years 4 months 10 18 years 1 month
CHAPLAIN 20 18 years 0 months 20 13 years 6 months 20 16 years 2 months 10 17 years 4 months
LEGAL ~ - 10 12 years 2 months 10 15 years 8 months 10 17 years 0 months
MUSIC ~ - ~ - ~ - ~ -
Unknown Branch 40 N/A ~ N/A ~ N/A ~ N/A
April 1997 - March 2000 April 2007 - March 2010 April 2014 - March 2017 April 2015 - March 2018
Table 11. Outflow Numbers1 and average Return of Service (RoS)2 by Branch/Trade
Produced by Defence Statistics (Air) Page 91
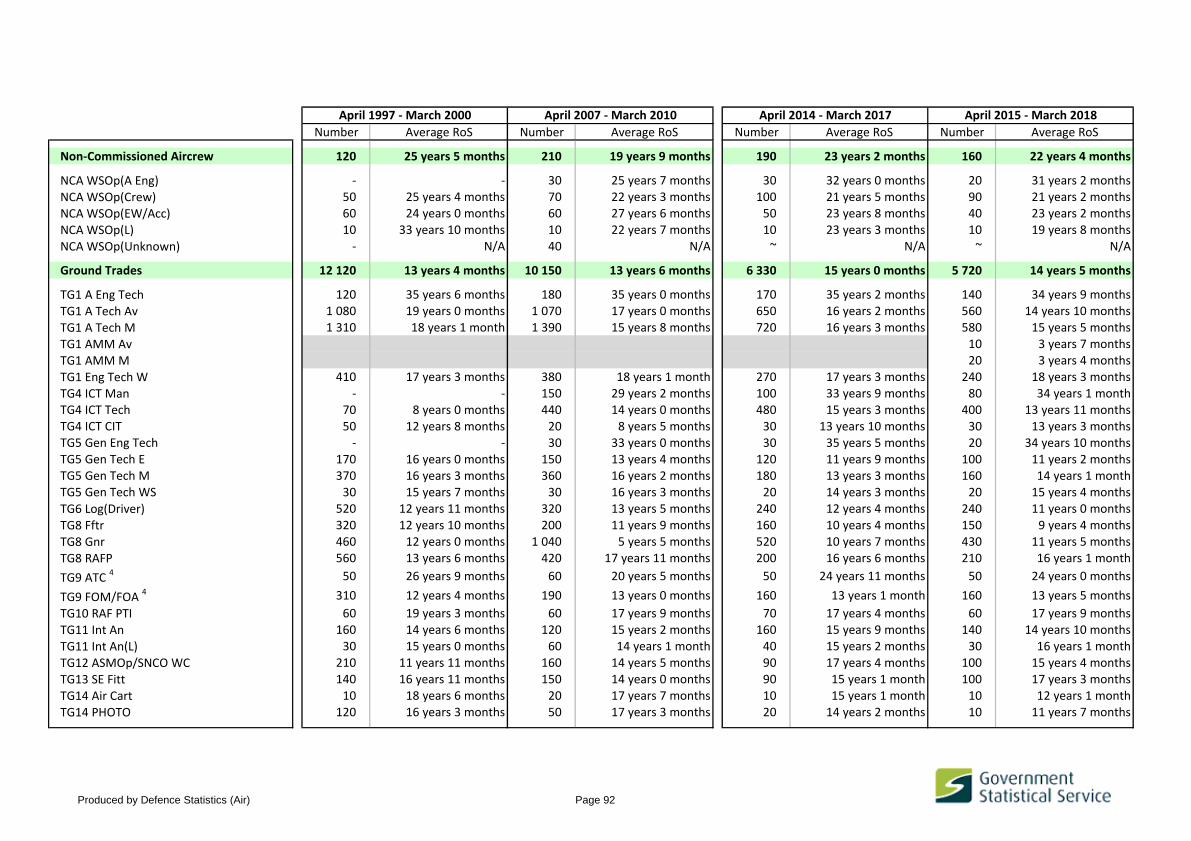
Number Average RoS Number Average RoS Number Average RoS Number Average RoS
April 1997 - March 2000 April 2007 - March 2010 April 2014 - March 2017 April 2015 - March 2018
Non-Commissioned Aircrew 120 25 years 5 months 210 19 years 9 months 190 23 years 2 months 160 22 years 4 months
NCA WSOp(A Eng) - - 30 25 years 7 months 30 32 years 0 months 20 31 years 2 months
NCA WSOp(Crew) 50 25 years 4 months 70 22 years 3 months 100 21 years 5 months 90 21 years 2 months
NCA WSOp(EW/Acc) 60 24 years 0 months 60 27 years 6 months 50 23 years 8 months 40 23 years 2 months
NCA WSOp(L) 10 33 years 10 months 10 22 years 7 months 10 23 years 3 months 10 19 years 8 months
NCA WSOp(Unknown) - N/A 40 N/A ~ N/A ~ N/A
Ground Trades 12 120 13 years 4 months 10 150 13 years 6 months 6 330 15 years 0 months 5 720 14 years 5 months
TG1 A Eng Tech 120 35 years 6 months 180 35 years 0 months 170 35 years 2 months 140 34 years 9 months
TG1 A Tech Av 1 080 19 years 0 months 1 070 17 years 0 months 650 16 years 2 months 560 14 years 10 months
TG1 A Tech M 1 310 18 years 1 month 1 390 15 years 8 months 720 16 years 3 months 580 15 years 5 months
TG1 AMM Av 10 3 years 7 months
TG1 AMM M 20 3 years 4 months
TG1 Eng Tech W 410 17 years 3 months 380 18 years 1 month 270 17 years 3 months 240 18 years 3 months
TG4 ICT Man - - 150 29 years 2 months 100 33 years 9 months 80 34 years 1 monthTG4 ICT Tech 70 8 years 0 months 440 14 years 0 months 480 15 years 3 months 400 13 years 11 monthsTG4 ICT CIT 50 12 years 8 months 20 8 years 5 months 30 13 years 10 months 30 13 years 3 monthsTG5 Gen Eng Tech - - 30 33 years 0 months 30 35 years 5 months 20 34 years 10 monthsTG5 Gen Tech E 170 16 years 0 months 150 13 years 4 months 120 11 years 9 months 100 11 years 2 monthsTG5 Gen Tech M 370 16 years 3 months 360 16 years 2 months 180 13 years 3 months 160 14 years 1 monthTG5 Gen Tech WS 30 15 years 7 months 30 16 years 3 months 20 14 years 3 months 20 15 years 4 months
TG6 Log(Driver) 520 12 years 11 months 320 13 years 5 months 240 12 years 4 months 240 11 years 0 months
TG8 Fftr 320 12 years 10 months 200 11 years 9 months 160 10 years 4 months 150 9 years 4 months
TG8 Gnr 460 12 years 0 months 1 040 5 years 5 months 520 10 years 7 months 430 11 years 5 months
TG8 RAFP 560 13 years 6 months 420 17 years 11 months 200 16 years 6 months 210 16 years 1 month
TG9 ATC 4 50 26 years 9 months 60 20 years 5 months 50 24 years 11 months 50 24 years 0 months
TG9 FOM/FOA 4 310 12 years 4 months 190 13 years 0 months 160 13 years 1 month 160 13 years 5 months
TG10 RAF PTI 60 19 years 3 months 60 17 years 9 months 70 17 years 4 months 60 17 years 9 months
TG11 Int An 160 14 years 6 months 120 15 years 2 months 160 15 years 9 months 140 14 years 10 months
TG11 Int An(L) 30 15 years 0 months 60 14 years 1 month 40 15 years 2 months 30 16 years 1 month
TG12 ASMOp/SNCO WC 210 11 years 11 months 160 14 years 5 months 90 17 years 4 months 100 15 years 4 months
TG13 SE Fitt 140 16 years 11 months 150 14 years 0 months 90 15 years 1 month 100 17 years 3 months
TG14 Air Cart 10 18 years 6 months 20 17 years 7 months 10 15 years 1 month 10 12 years 1 month
TG14 PHOTO 120 16 years 3 months 50 17 years 3 months 20 14 years 2 months 10 11 years 7 months
Produced by Defence Statistics (Air) Page 92

Number Average RoS Number Average RoS Number Average RoS Number Average RoS
April 1997 - March 2000 April 2007 - March 2010 April 2014 - March 2017 April 2015 - March 2018
TG15 Biomed ~ - ~ - ~ - ~ -
TG15 EH Tech 10 16 years 5 months 10 9 years 7 months 10 16 years 3 months 10 14 years 3 months
TG15 ODP ~ - 10 17 years 9 months 10 13 years 10 months 10 13 years 9 months
TG15 PH Tech ~ - ~ - 10 15 years 3 months ~ -
TG15 Radiog ~ - ~ - ~ - ~ -
TG15 RAF Medic 170 12 years 3 months 180 11 years 6 months 140 15 years 7 months 130 14 years 6 months
TG15 Nurses Spine 60 7 years 11 months 100 8 years 4 months
TG15 RN(A) 80 11 years 5 months 70 11 years 0 months
TG15 RN(MH) 10 12 years 6 months ~ -
TG16 Dent Hyg 20 13 years 10 months 10 11 years 7 months 20 13 years 4 months 10 13 years 10 months
TG16 Dent Tech - - 10 19 years 1 month ~ - ~ -
TG16 Dental Nurse 50 10 years 11 months 30 7 years 9 months 40 12 years 11 months 30 14 years 8 months
TG17 Pers(Spt) 500 15 years 3 months 470 18 years 10 months 220 20 years 4 months 200 20 years 6 months
TG18 Log(Mov) 170 13 years 7 months 200 13 years 3 months 180 14 years 9 months 160 16 years 1 month
TG18 Log(Sup) 800 14 years 2 months 370 16 years 2 months 340 16 years 10 months 310 16 years 2 months
TG19 Log(Cat) 260 10 years 7 months 110 9 years 3 months
TG19 Log(Cat Man) 20 27 years 1 month 20 27 years 1 month
TG19 Log(AGS) 110 16 years 0 months 110 15 years 3 months
TG19 Log(Chef) 280 13 years 10 months 120 10 years 11 months 90 15 years 3 months 100 15 years 9 months
TG21 Musn 50 13 years 10 months 20 21 years 9 months 30 19 years 11 months 30 21 years 7 months
Trade Unknown 1 820 N/A 1 120 N/A 450 N/A 470 N/A
1Based on outflow from regular strength and therefore excludes Full Time Reserve Service personnel, volunteer reserves and mobilised reservists. It includes trained & untrained personnel.
2 Return of Service has been calculated using entry date. There are known problems with the entry date information extracted from JPA. If personnel have transferred to the RAF from another Service,
have served under an alternative assignment type (e.g. reserve forces), are re-entrants or have transferred from Other Ranks to Officers, their entry date may correspond to any of these events. The
resulting RoS may reflect their current period of service, include previous service, or it may be the time that has elapsed since they first joined the Armed Forces, irrespective of any break in service. It will
invariably include time spent on untrained strength.3 Small population sizes can create misleading averages. Where the actual number of promotions to paid rank by trade is less than or equal to 5 but greater than zero, average total length of service information
has been suppressed and marked with a "-". 4 Prior to the Apr 2014 - Mar 2017 period ATCAs are grouped with the ATCs. For the Apr 2014 - Mar 2017 and Apr 2015 - Mar 2018 periods they have been grouped with FOM/FOAs.
Notes:a. In accordance with the Data Protection Act and our obligations in relation to the protection of confidentiality when handling personal data, data have been rounded to the nearest 10, where "-" denotes zero and "~" denotes a number less than or equal to 5.b. Due to the rounding methods used, totals may not always equal the sum of the parts. c. When rounding to the nearest 10, numbers ending in 5 have been rounded to the nearest multiple of 20 to prevent systematic bias.
Produced by Defence Statistics (Air) Page 93
Related Documents