DEEP LEARNING FOR PUBLIC SAFETY: FIGHTING CRIME WITH OPEN CITY DATA Alex Tellez, Michal Malohlava, and H2O.ai team

Deep Learning for Public Safety in Chicago and San Francisco
Jul 17, 2015
Welcome message from author
This document is posted to help you gain knowledge. Please leave a comment to let me know what you think about it! Share it to your friends and learn new things together.
Transcript
DEEP LEARNING FOR PUBLIC SAFETY: FIGHTING CRIME WITH OPEN CITY DATA
Alex Tellez, Michal Malohlava, and H2O.ai team
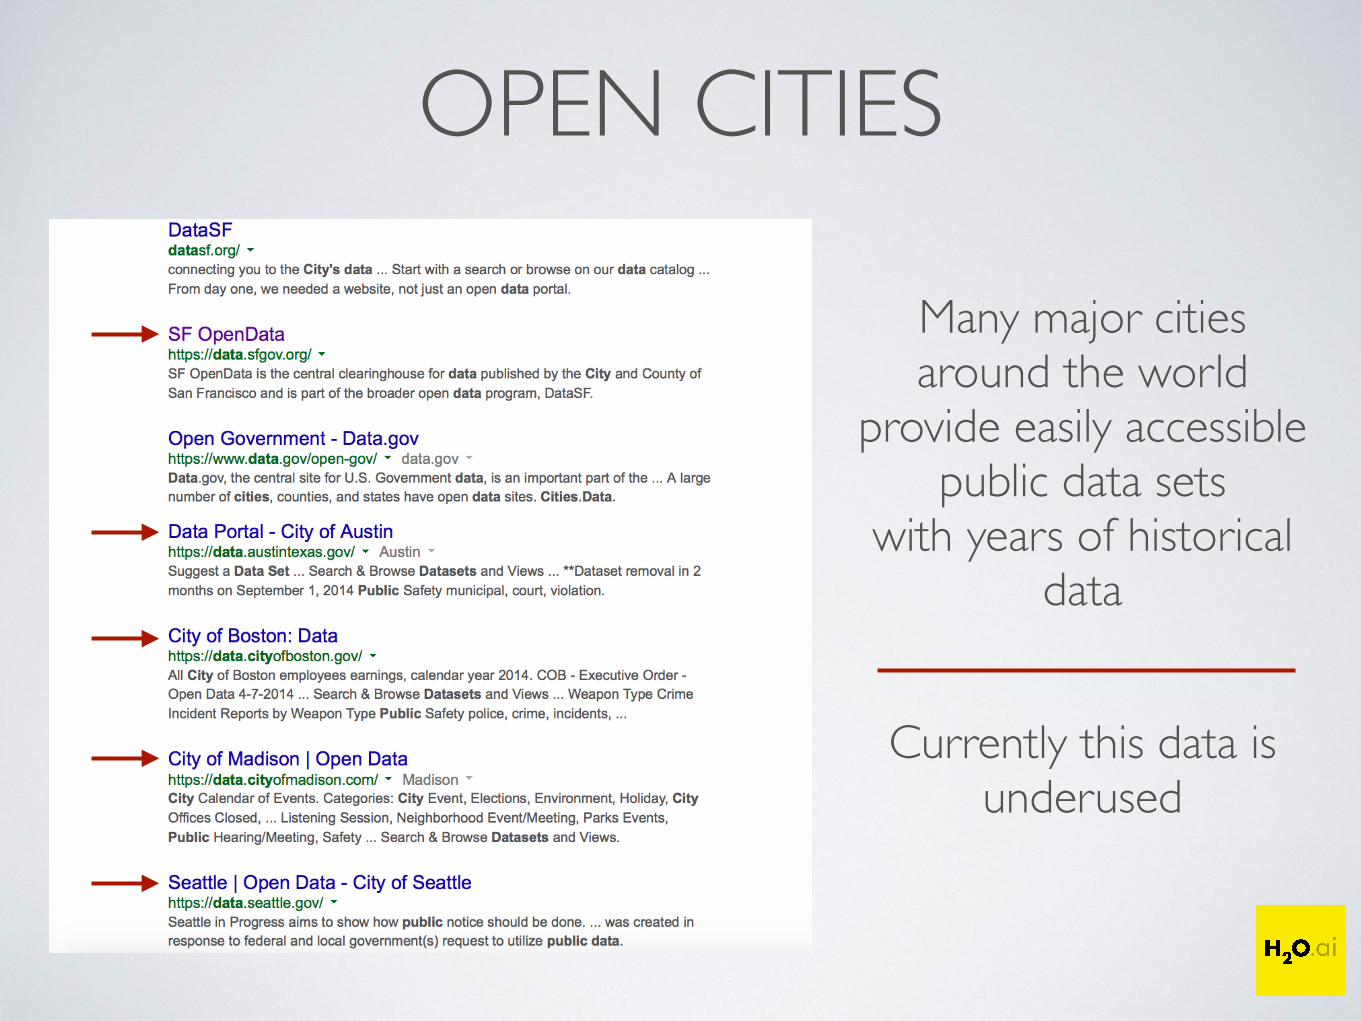
OPEN CITIES
Many major cities around the world
provide easily accessible public data sets
with years of historical data
Currently this data is underused

CHICAGO

OPEN CRIME DATA
Crime Dataset: Crimes from 2001 - Present Day~ 4.6 million crimes

THE WINDY CITY
Harvest Chicago Weather data since 2001

SOCIOECONOMIC FACTORS
Crimes segmented into Community Area IDsPercent of households below poverty, unemployed, etc.

SPARK + H2OWeather CrimesCensusWeatherWeather
Data munging
Spark SQL join
Deep Learning
Evaluate models
GOAL:For a given crime,
predict if an arrest is
more / less likely to be made!
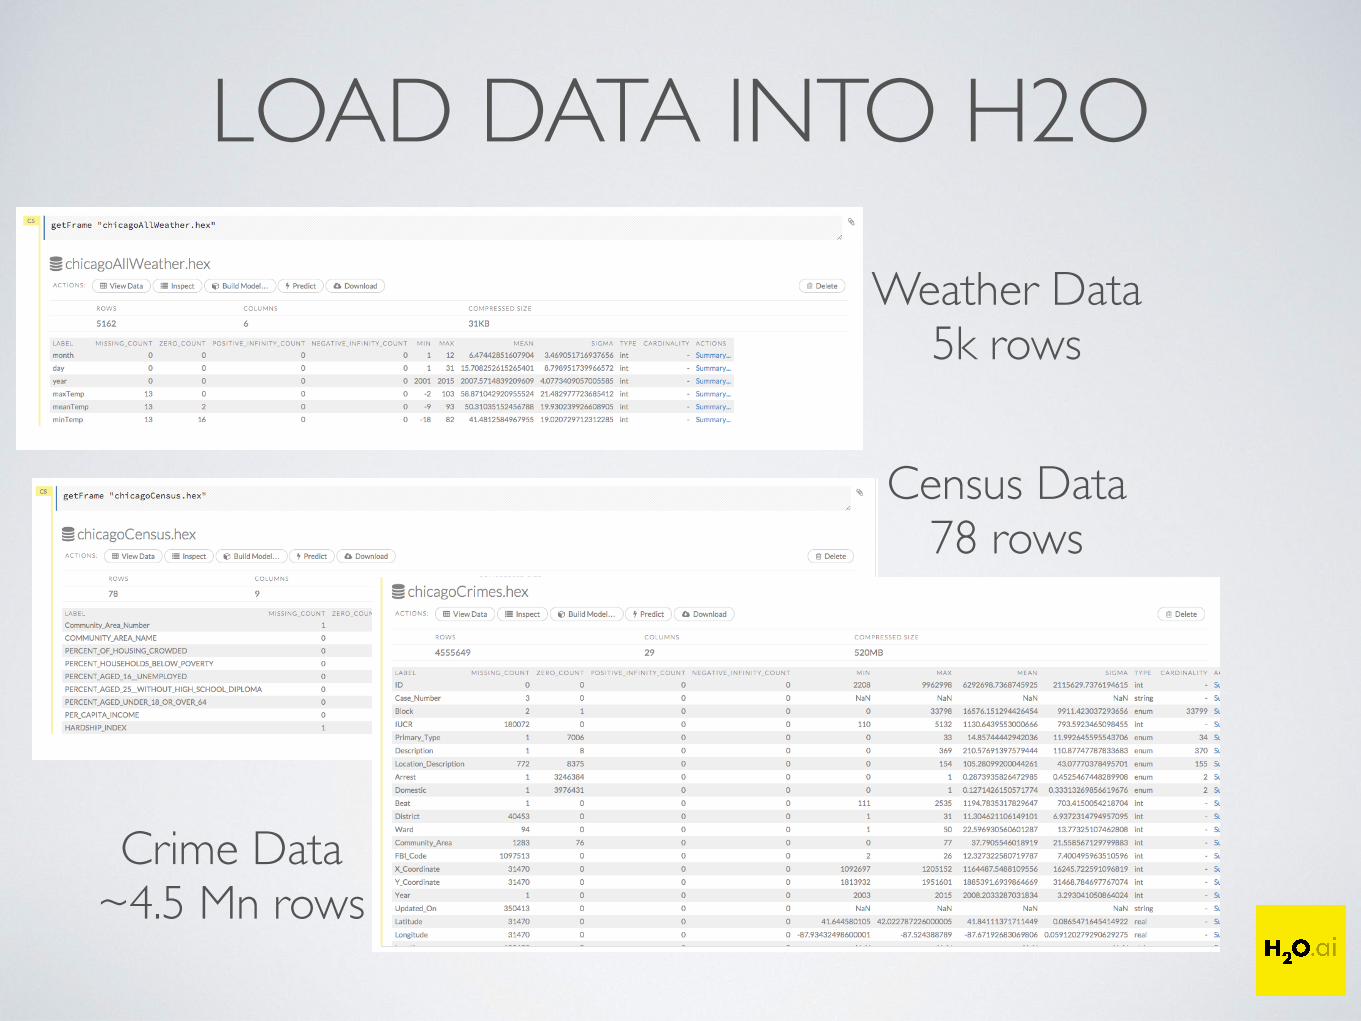
LOAD DATA INTO H2O
Weather Data5k rows
Census Data78 rows
Crime Data~4.5 Mn rows

JOIN DATASETS
crimedata
weatherdata
censusdata
Using Spark, we join 3 datasets together to make one mega dataset!
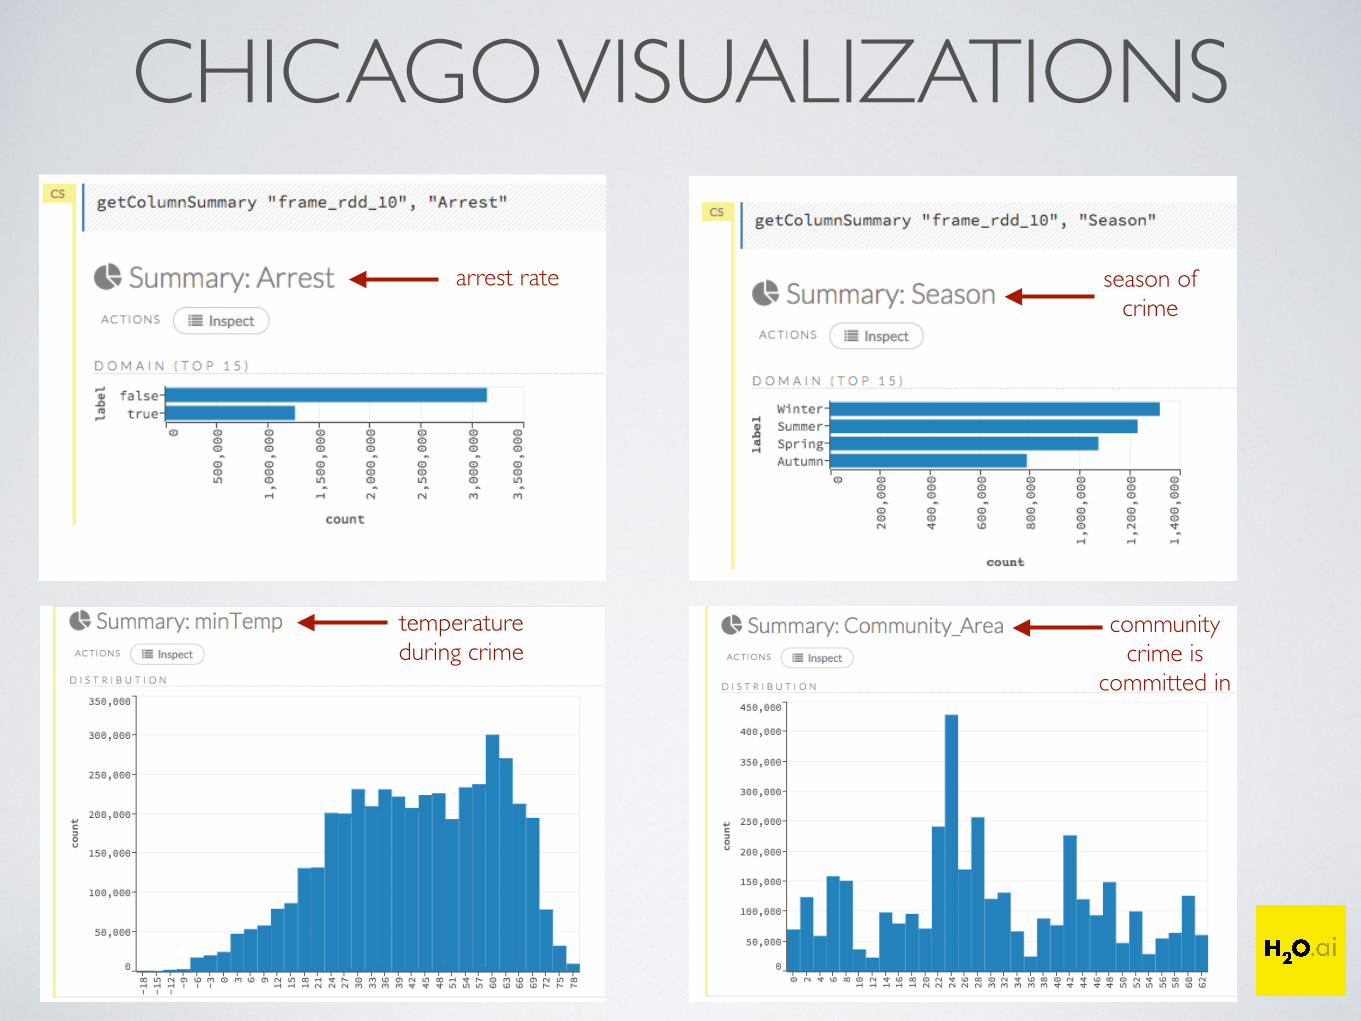
CHICAGO VISUALIZATIONS
arrest rate season of crime
temperature during crime
community crime is
committed in
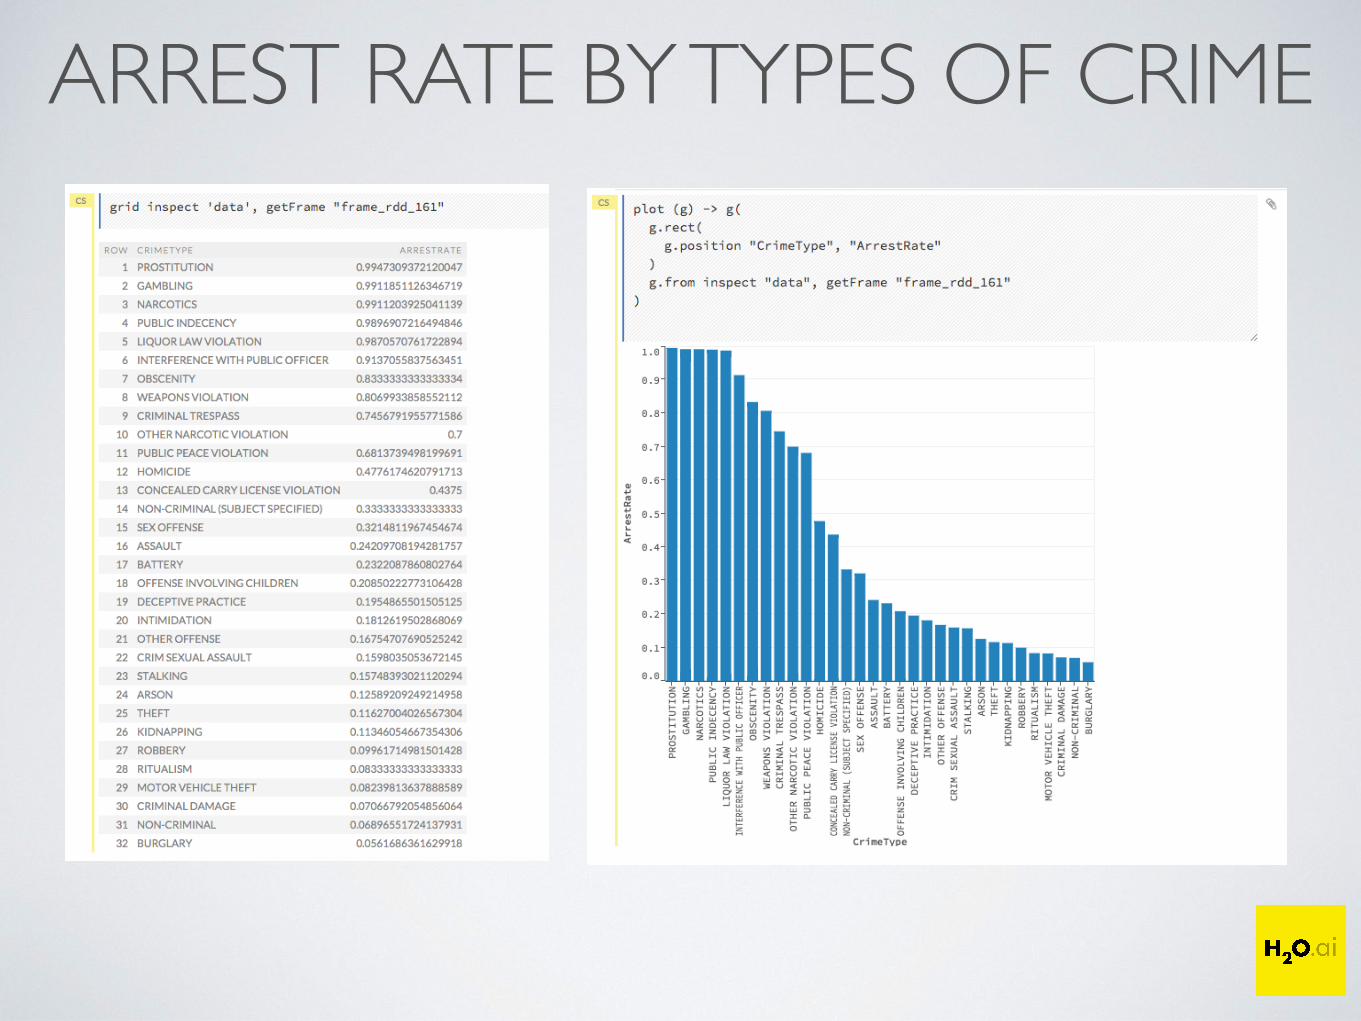
ARREST RATE BY TYPES OF CRIME

ARREST RATE VS % OF TOTAL CRIMES
Arrest Rate
% of all crimes recorded
A large proportion of crimes are thefts
Unfortunately, there is a much lower arrest rate for thefts than for less
prevalent crimes like gambling

SPLIT DATA INTO TEST/TRAIN SETS
training set arrest rate test set arrest rate
train model on this segment, 80% of data
validate the model on this segment (remaining 20%)
~40% of crimes lead to arrest
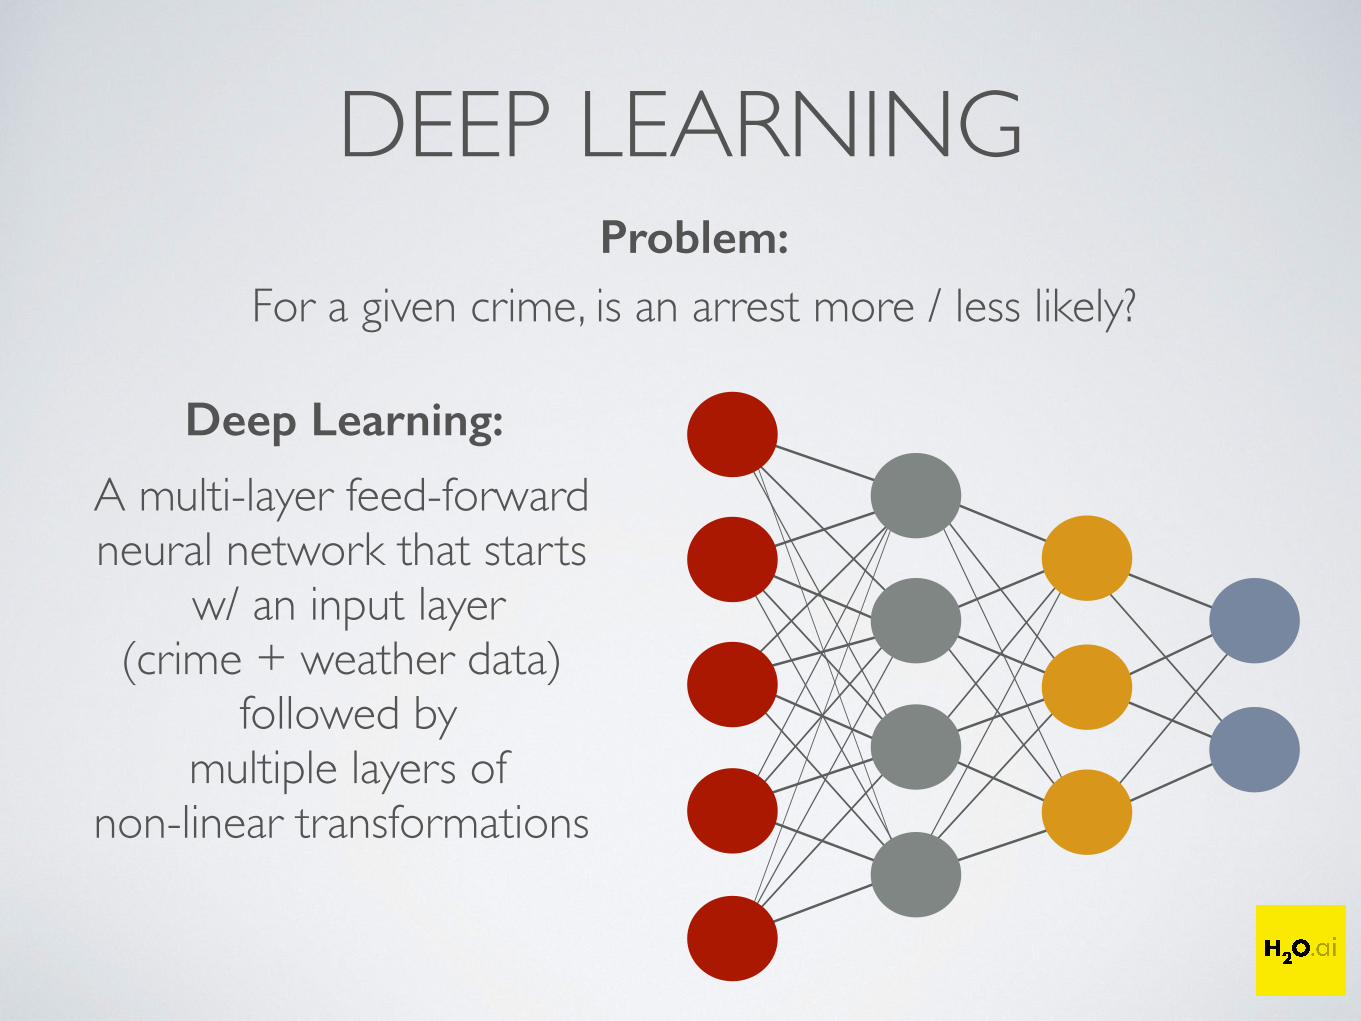
DEEP LEARNINGProblem:
For a given crime, is an arrest more / less likely?
Deep Learning:
A multi-layer feed-forward neural network that starts
w/ an input layer (crime + weather data)
followed by multiple layers of
non-linear transformations
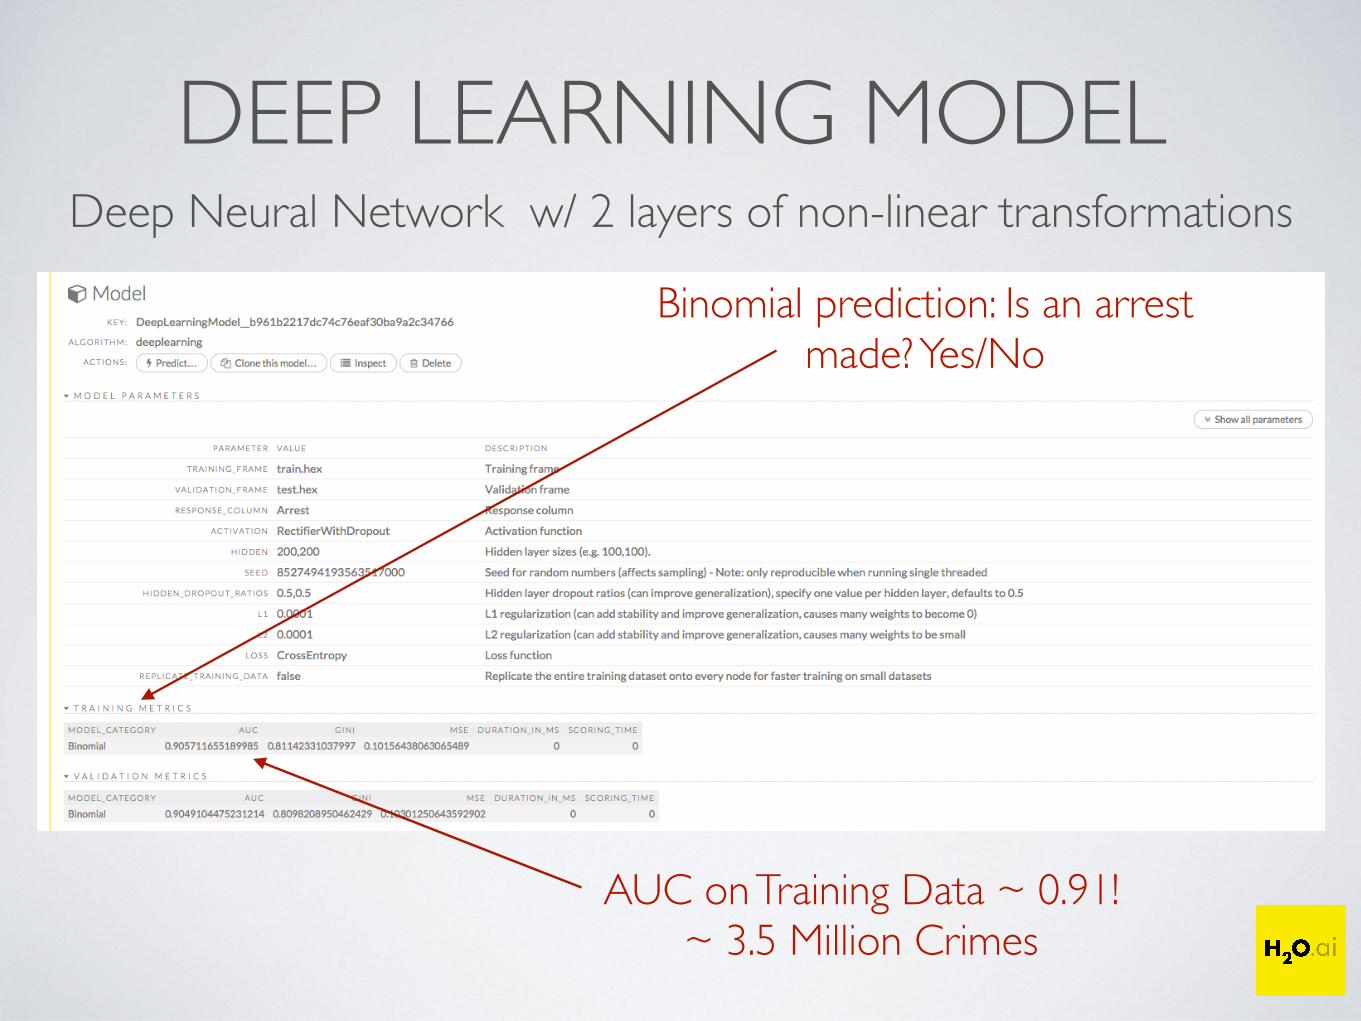
DEEP LEARNING MODELDeep Neural Network w/ 2 layers of non-linear transformations
Binomial prediction: Is an arrest made? Yes/No
AUC on Training Data ~ 0.91!~ 3.5 Million Crimes

HOW’D WE DO?Train AUC ~ 0.91 Test AUC ~ 0.91
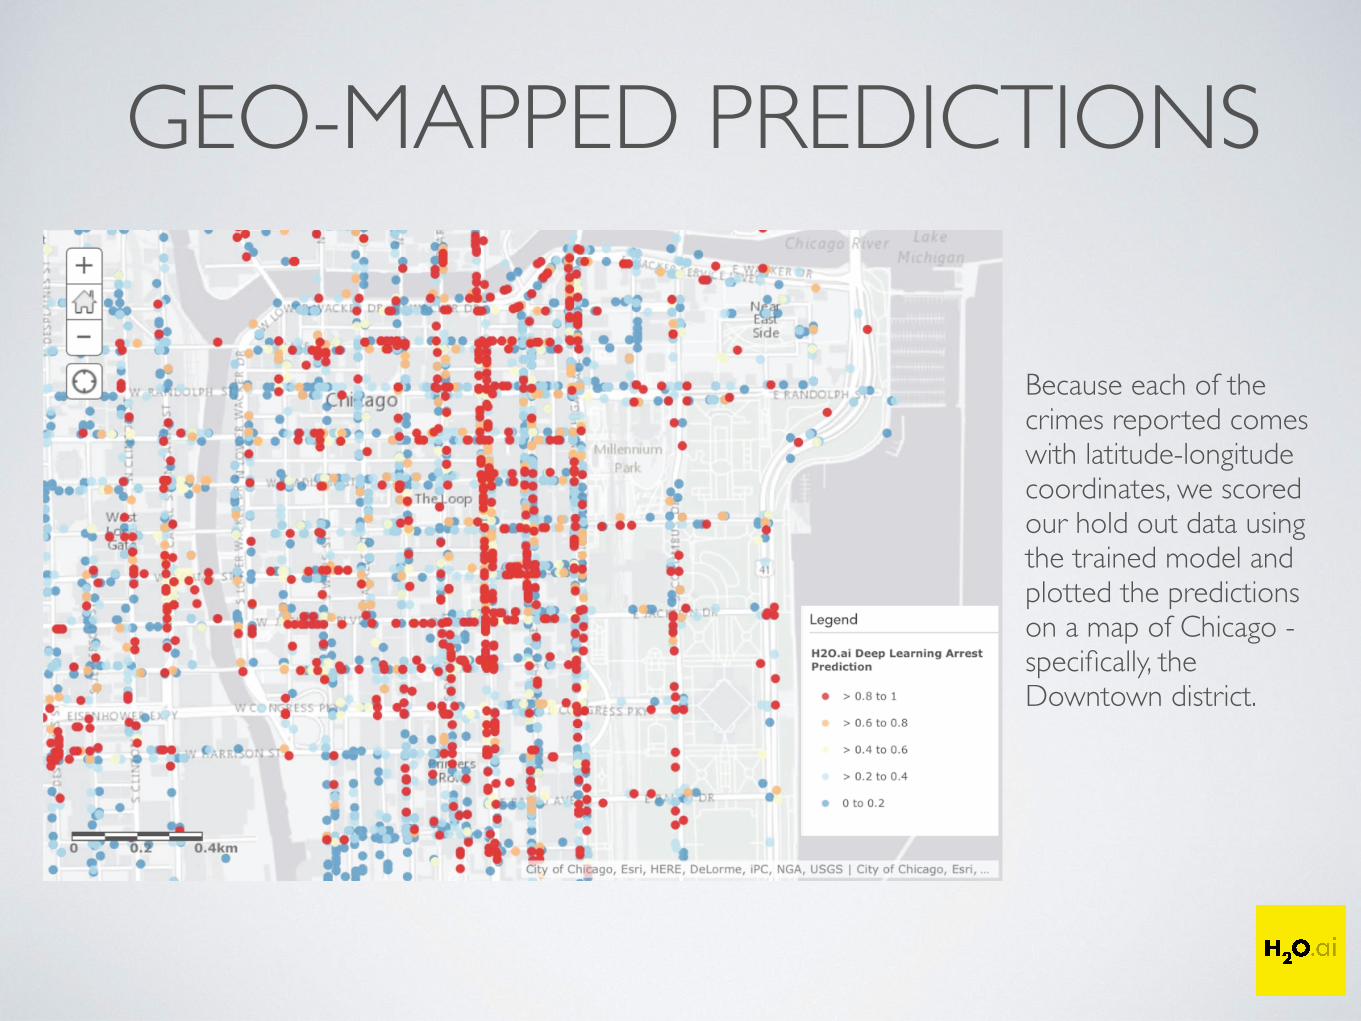
GEO-MAPPED PREDICTIONS
Because each of the crimes reported comes with latitude-longitude coordinates, we scored our hold out data using the trained model and plotted the predictions on a map of Chicago - specifically, the Downtown district.

SAN FRANCISCO
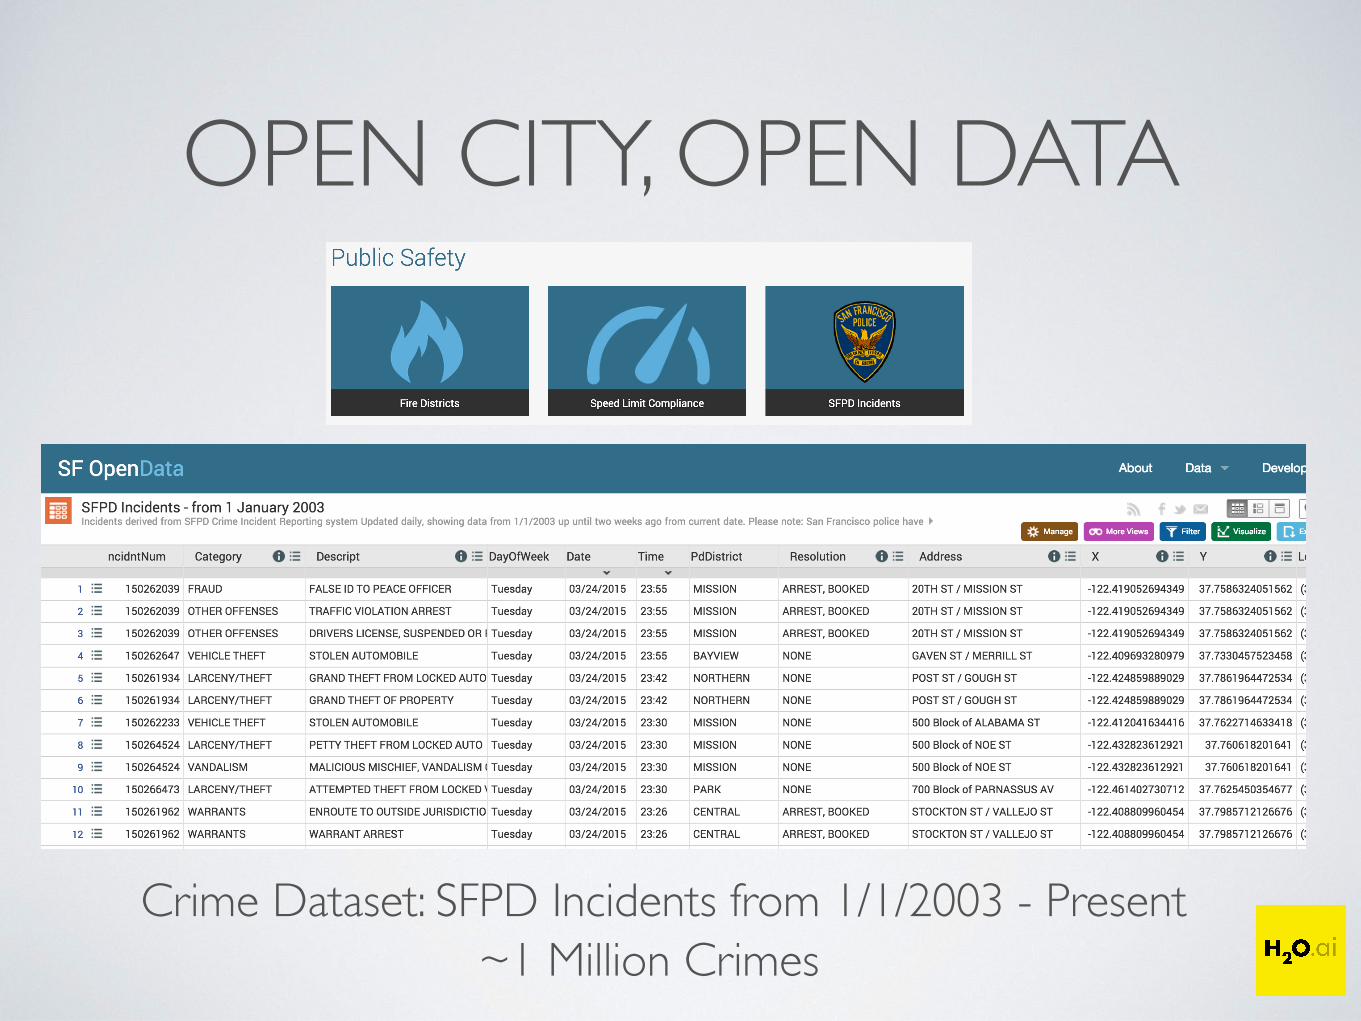
OPEN CITY, OPEN DATA
Crime Dataset: SFPD Incidents from 1/1/2003 - Present~1 Million Crimes

WEATHER ANYONE?
Harvest weather data from 1/1/2003
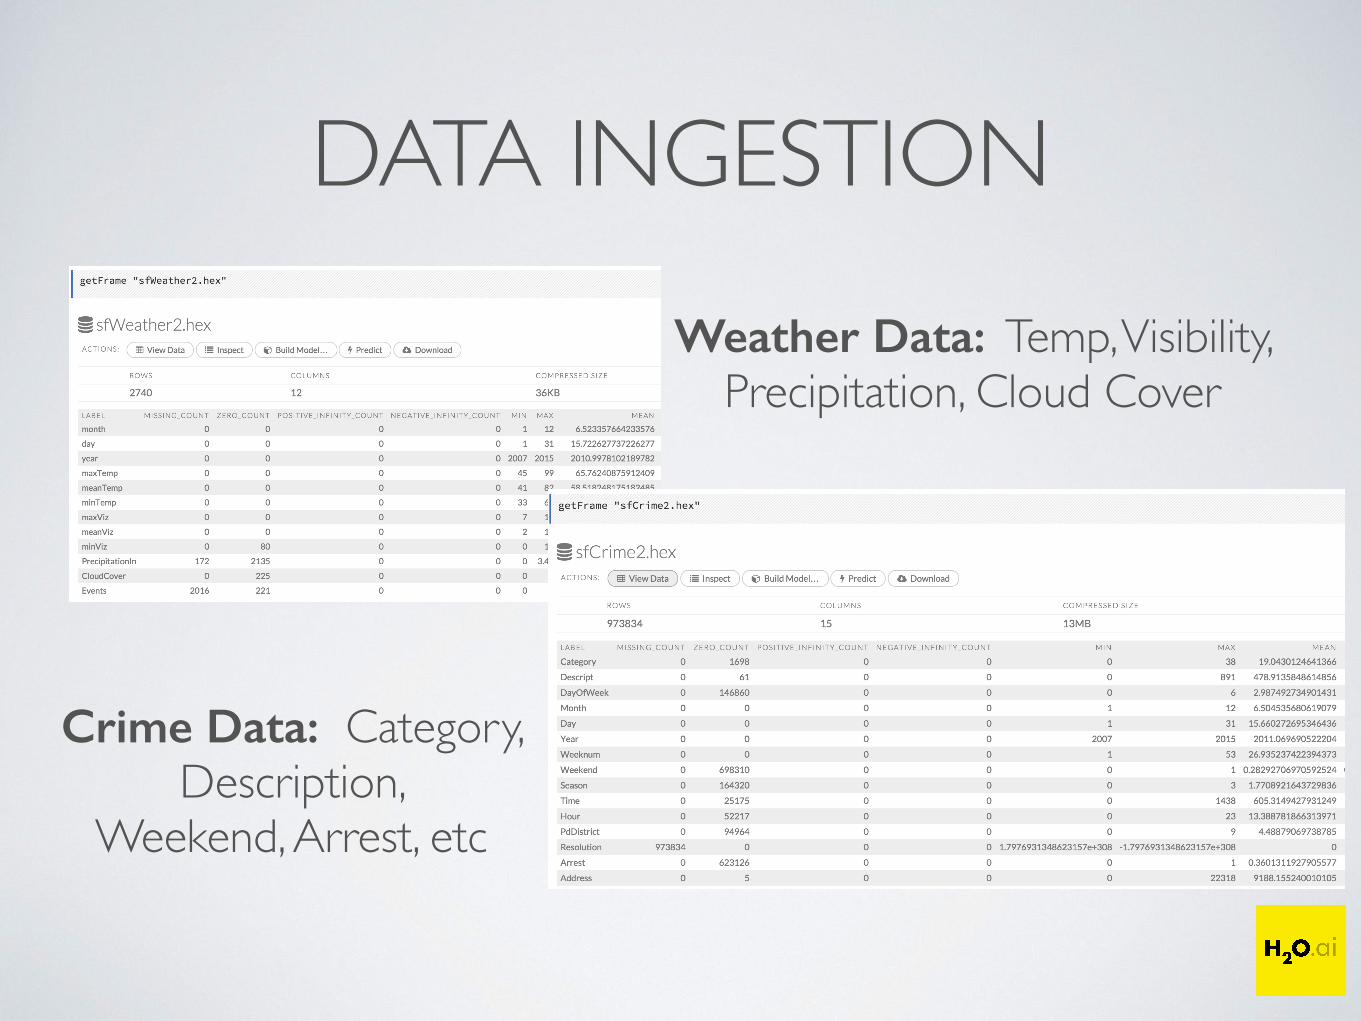
DATA INGESTION
Weather Data: Temp, Visibility, Precipitation, Cloud Cover
Crime Data: Category, Description,
Weekend, Arrest, etc

SF VISUALIZATIONSMost common crimes? When is crime happening most?
…midnight, noon, 6 PM
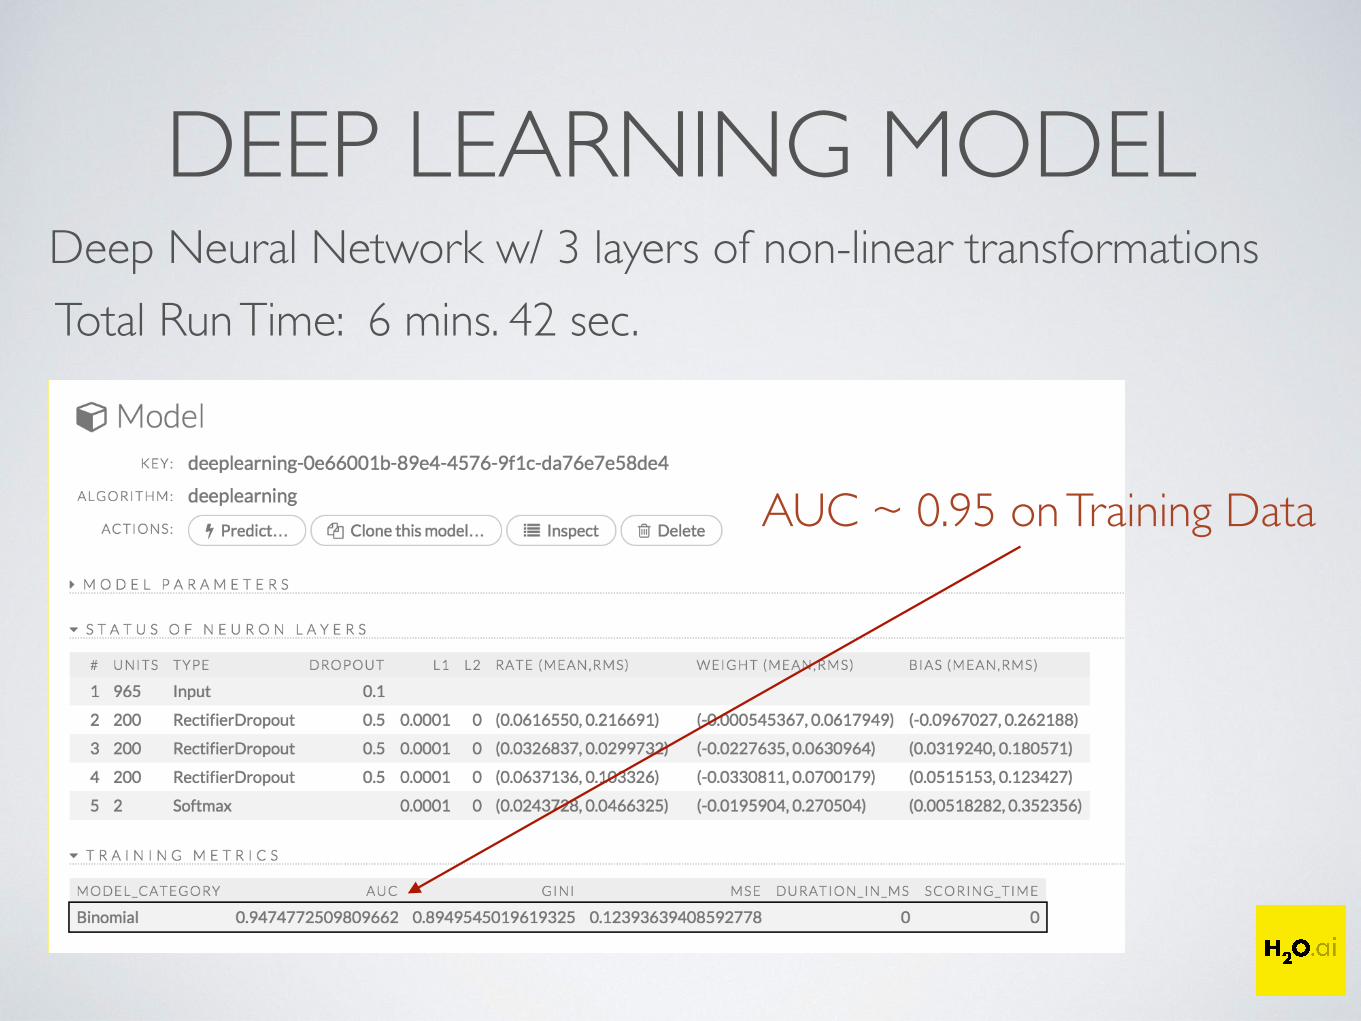
DEEP LEARNING MODELDeep Neural Network w/ 3 layers of non-linear transformationsTotal Run Time: 6 mins. 42 sec.
AUC ~ 0.95 on Training Data

VALIDATION TESTModel ‘trained’ on 80% of data, validated against remaining 20%
AUC = 0.95 on validation data
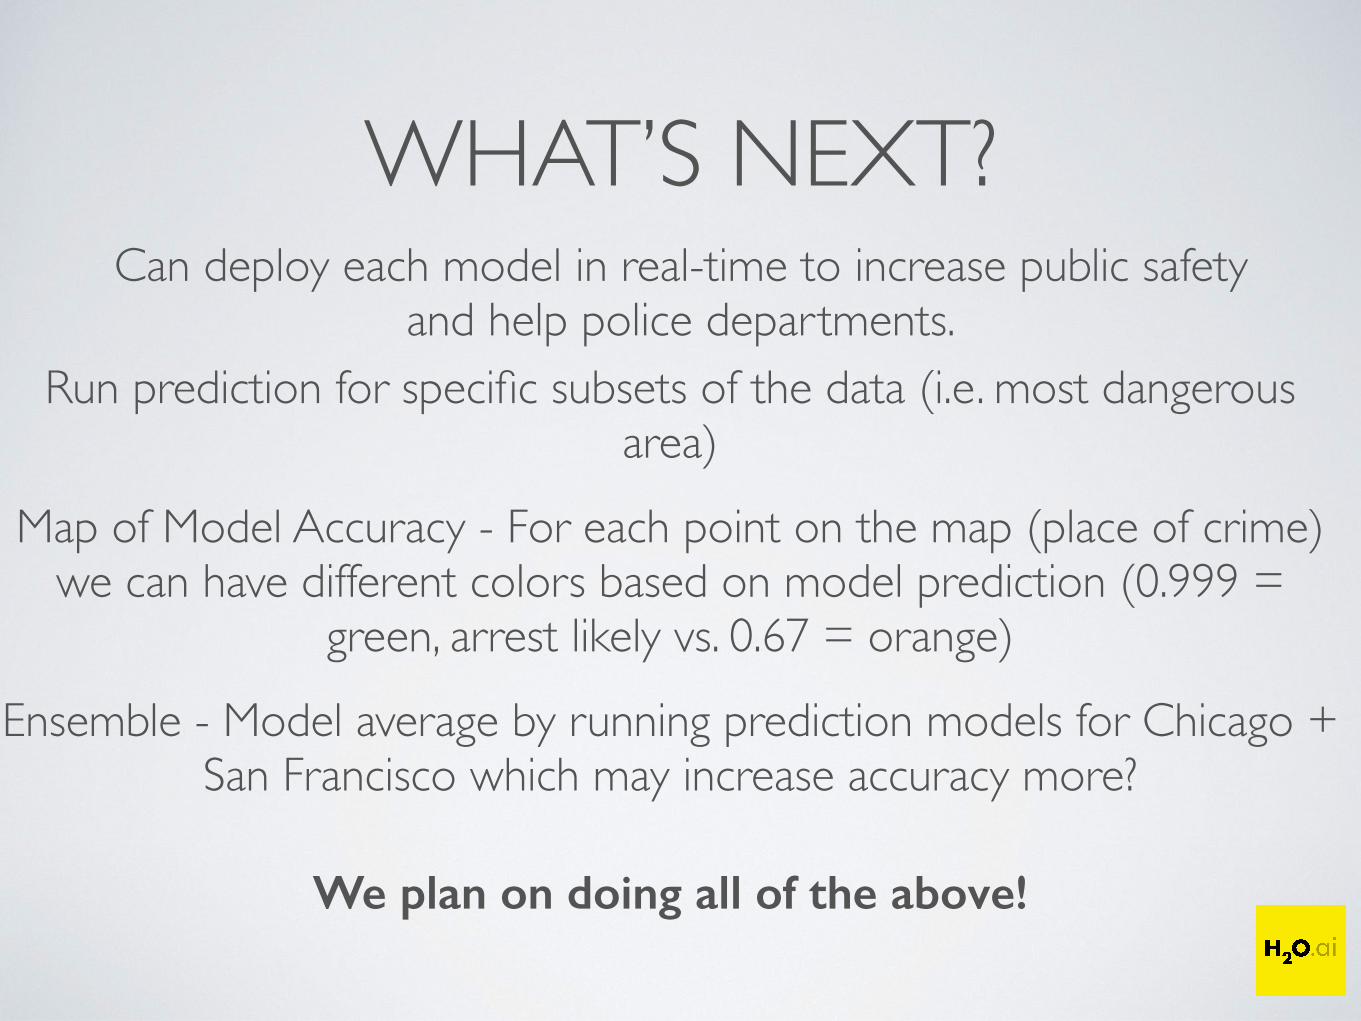
WHAT’S NEXT?Can deploy each model in real-time to increase public safety
and help police departments.
Map of Model Accuracy - For each point on the map (place of crime) we can have different colors based on model prediction (0.999 =
green, arrest likely vs. 0.67 = orange)
Run prediction for specific subsets of the data (i.e. most dangerous area)
We plan on doing all of the above!
Ensemble - Model average by running prediction models for Chicago + San Francisco which may increase accuracy more?
Related Documents


![Applications of Deep Learning to the GEOINT mission · Deep Learning Recap GEOINT applications: Imagery exploitation ... [10] Kaggle San Francisco Crime Classification Competition](https://static.cupdf.com/doc/110x72/5aca16467f8b9aa3298d5dd9/applications-of-deep-learning-to-the-geoint-learning-recap-geoint-applications.jpg)