Deep Learning-based Fault Diagnosis in Transmission Lines via Long Short Term Memory Networks by Ashok Tak A thesis submitted in conformity with the requirements for the degree of Master of Applied Science Graduate Department of Electrical and Computer Engineering University of Toronto c Copyright 2021 by Ashok Tak

Welcome message from author
This document is posted to help you gain knowledge. Please leave a comment to let me know what you think about it! Share it to your friends and learn new things together.
Transcript
Deep Learning-based Fault Diagnosis in Transmission Linesvia Long Short Term Memory Networks
by
Ashok Tak
A thesis submitted in conformity with the requirementsfor the degree of Master of Applied Science
Graduate Department of Electrical and Computer EngineeringUniversity of Toronto
c© Copyright 2021 by Ashok Tak
Abstract
Deep Learning-based Fault Diagnosis in Transmission Lines via Long Short Term
Memory Networks
Ashok Tak
Master of Applied Science
Graduate Department of Electrical and Computer Engineering
University of Toronto
2021
In electrical power systems, transmission lines are responsible for transferring power
across the grid. However, faults in these lines are abnormal conditions that can destabilize
the transmission system if sustained longer. To diagnose the faults, IEC61850 based
digital substations provide the sampled value measurements in the substation. In addition
to existing model-based techniques to diagnose the fault, machine learning techniques are
explored in the literature. In this thesis, we present a novel Long Short Term Memory
(LSTM) based fault classifier using current and voltage measurements as the input.
Compared with deep learning algorithms proposed in the literature i.e. RNN and SVM,
the proposed classifier provide improved performance in the classification of faults, tested
on data obtained from a PSRC D6 benchmark testbed. The performance of the classifier
is explained with the evaluation metrics i.e. test accuracy, precision, recall, F1 score and
confusion matrix to show the classification performance.
ii

Acknowledgements
Firstly, I am really grateful to my supervisor, Professor Deepa Kundur for giving me
this opportunity to pursue this program at the University of Toronto and for continuous
encouragement throughout the program. I would like to thank Prof. Amir Abiri Johrami
and Prof. Mohammadreza Arani for constructive criticism, support and help throughout
the program. To all the group members especially Yew Meng, I am really thankful
for your supportive and encouraging nature and for being the inspiration throughout
the highs and lows of the program. I appreciate all my classmates and friends at the
University of Toronto who helped and contributed during this wonderful journey.
Finally, I am indebted to the support of my parents, siblings and teachers who guided
me and supported me in pursuit of my dreams. I dedicate my work to all of you.
iii
Contents
1 Introduction 1
1.1 Motivation . . . . . . . . . . . . . . . . . . . . . . . . . . . . . . . . . . . 1
1.2 Contributions . . . . . . . . . . . . . . . . . . . . . . . . . . . . . . . . . 3
1.3 Overview . . . . . . . . . . . . . . . . . . . . . . . . . . . . . . . . . . . . 4
2 Problem Formulation 5
2.1 Importance of Fault Diagnosis . . . . . . . . . . . . . . . . . . . . . . . . 5
2.2 Data-Driven Fault Diagnosis in Transmission Line . . . . . . . . . . . . . 6
2.3 Scope of Fault Diagnosis Tool . . . . . . . . . . . . . . . . . . . . . . . . 8
2.3.1 Assumptions . . . . . . . . . . . . . . . . . . . . . . . . . . . . . . 9
2.3.2 Overview of the Problem . . . . . . . . . . . . . . . . . . . . . . . 9
3 Background & Previous Work 11
3.1 Protective Relay Principles . . . . . . . . . . . . . . . . . . . . . . . . . . 11
3.1.1 Protection System . . . . . . . . . . . . . . . . . . . . . . . . . . 11
3.1.2 Protection of transmission lines . . . . . . . . . . . . . . . . . . . 12
3.2 Classical Fault Analysis . . . . . . . . . . . . . . . . . . . . . . . . . . . 13
3.2.1 Classical Model-based Approaches . . . . . . . . . . . . . . . . . . 14
Symmetric Component Protective Relays . . . . . . . . . . . . . . 14
3.2.2 Classical Data-Driven Approaches . . . . . . . . . . . . . . . . . . 16
Wavelet based Approaches . . . . . . . . . . . . . . . . . . . . . . 16
Fuzzy Logic based Approaches . . . . . . . . . . . . . . . . . . . . 17
Artificial Neural Network (ANN) based Approaches . . . . . . . . 17
iv
3.2.3 Hybrid Approaches . . . . . . . . . . . . . . . . . . . . . . . . . . 18
3.3 Machine Learning based Fault Detection and Classification . . . . . . . . 19
Support Vector Machine based Approaches . . . . . . . . . . . . . 19
Decision Tree based Approaches . . . . . . . . . . . . . . . . . . . 20
Stacked Auto-encoders (SAE) . . . . . . . . . . . . . . . . . . . . 21
3.3.1 Sequential Model Approaches . . . . . . . . . . . . . . . . . . . . 21
3.3.2 Literature Gap: Extending potential of sequential models in clas-
sification task . . . . . . . . . . . . . . . . . . . . . . . . . . . . . 22
4 Proposed Sequence Learning based Fault Classifier 24
4.1 Fault Classification using Deep Learning . . . . . . . . . . . . . . . . . . 24
4.2 Sequential Learning Models for Classification . . . . . . . . . . . . . . . . 25
4.2.1 Recurrent Neural Networks . . . . . . . . . . . . . . . . . . . . . 25
4.2.2 Long Short Term Memory (LSTM) Networks . . . . . . . . . . . 27
4.3 Classification Task . . . . . . . . . . . . . . . . . . . . . . . . . . . . . . 29
4.3.1 Logistic Regression Classifier . . . . . . . . . . . . . . . . . . . . . 30
4.3.2 Softmax Classifier . . . . . . . . . . . . . . . . . . . . . . . . . . . 30
4.4 Proposed LSTM based Detector and Classifier . . . . . . . . . . . . . . . 31
4.4.1 Architecture Design Approach . . . . . . . . . . . . . . . . . . . . 31
4.4.2 Handling Overfitting in Classifier . . . . . . . . . . . . . . . . . . 33
Dropout . . . . . . . . . . . . . . . . . . . . . . . . . . . . . . . . 33
Batch Normalization . . . . . . . . . . . . . . . . . . . . . . . . . 33
4.4.3 Description of Fault Classifier . . . . . . . . . . . . . . . . . . . . 34
5 Testbed for Classifier Training 36
5.1 Transmission Line Testbed . . . . . . . . . . . . . . . . . . . . . . . . . . 36
5.2 Dataset Generation . . . . . . . . . . . . . . . . . . . . . . . . . . . . . . 37
5.3 Training Methodologies for Proposed Classifier . . . . . . . . . . . . . . . 38
5.3.1 Data Pre-Processing . . . . . . . . . . . . . . . . . . . . . . . . . 38
Data Windows Generation . . . . . . . . . . . . . . . . . . . . . . 39
Labelling of Dataset . . . . . . . . . . . . . . . . . . . . . . . . . 39
v
5.3.2 Training of the Classifier . . . . . . . . . . . . . . . . . . . . . . . 39
Summary of Classifier Architecture . . . . . . . . . . . . . . . . . 40
Data Split . . . . . . . . . . . . . . . . . . . . . . . . . . . . . . . 40
Handling imbalanced dataset . . . . . . . . . . . . . . . . . . . . 41
Training . . . . . . . . . . . . . . . . . . . . . . . . . . . . . . . . 42
6 Results and Discussion 43
6.1 Performance Evaluation of Fault Classification . . . . . . . . . . . . . . . 43
6.1.1 Performance Metrics . . . . . . . . . . . . . . . . . . . . . . . . . 45
Accuracy . . . . . . . . . . . . . . . . . . . . . . . . . . . . . . . 45
Precision, Recall and F1 Score . . . . . . . . . . . . . . . . . . . . 46
Confusion Matrix . . . . . . . . . . . . . . . . . . . . . . . . . . . 46
6.1.2 Comparison with existing models for fault classification . . . . . . 47
SVM based Classifier . . . . . . . . . . . . . . . . . . . . . . . . . 47
RNN based Classifier . . . . . . . . . . . . . . . . . . . . . . . . . 49
Comparative Performance of LSTM Classifier . . . . . . . . . . . 50
6.2 Discussion . . . . . . . . . . . . . . . . . . . . . . . . . . . . . . . . . . . 50
6.2.1 Implementation of proposed classifier . . . . . . . . . . . . . . . . 51
6.2.2 Improved Performance of Proposed Classifier . . . . . . . . . . . . 52
7 Conclusion and Future Work 54
7.1 Conclusion . . . . . . . . . . . . . . . . . . . . . . . . . . . . . . . . . . . 54
7.2 Future Work . . . . . . . . . . . . . . . . . . . . . . . . . . . . . . . . . . 55
Bibliography 57
vi
List of Tables
5.1 Labelling of Samples . . . . . . . . . . . . . . . . . . . . . . . . . . . . . 41
5.2 Summary of LSTM Model . . . . . . . . . . . . . . . . . . . . . . . . . . 41
5.3 Distribution of Samples for Training . . . . . . . . . . . . . . . . . . . . 41
6.1 Accuracy of classifier over training, validation and test sets . . . . . . . . 45
6.2 Performance of categorization . . . . . . . . . . . . . . . . . . . . . . . . 46
6.3 Performance of SVM Classifier on same distribution of datasets . . . . . 50
6.4 Summary of RNN Model . . . . . . . . . . . . . . . . . . . . . . . . . . . 50
6.5 Accuracy of classifier over training, validation and test sets . . . . . . . . 50
vii
List of Figures
2.1 Stages of fault diagnosis in transmission system . . . . . . . . . . . . . . 7
2.2 Illustration of Fault Diagnosis tool with its objectives . . . . . . . . . . 8
3.1 Overview of sub-systems of protection system . . . . . . . . . . . . . . . 12
3.2 Classification of faults in transmission lines . . . . . . . . . . . . . . . . . 14
4.1 An illustration of RNN with unrolled network [1] . . . . . . . . . . . . . 26
4.2 Working of RNN network . . . . . . . . . . . . . . . . . . . . . . . . . . 26
4.3 An illustration of LSTM network with four neural gate layers [1] . . . . . 28
4.4 Architecture of Proposed Fault Classifier with LSTM networks . . . . . . 34
5.1 Illustration of IEEE PSRC D6 Test System [2] . . . . . . . . . . . . . . . 37
5.2 A sample of data with three phase fault . . . . . . . . . . . . . . . . . . . 38
5.3 Illustration of Sample windows with classes . . . . . . . . . . . . . . . . . 40
5.4 Accuracy and Loss Plots for the training process of classifier . . . . . . . 42
6.1 Training and Testing methodologies for the fault classifier . . . . . . . . . 44
6.2 Comparison of performance in training, validation and test sets with varied
Window Size . . . . . . . . . . . . . . . . . . . . . . . . . . . . . . . . . 45
6.3 Confusion Matrix with the True and Predicted Classes . . . . . . . . . . 48
6.4 Illustration of Misclassified Samples by Classifier . . . . . . . . . . . . . . 49
6.5 Comparison of performance of proposed model with existing models . . . 51
viii

Chapter 1
Introduction
This chapter provides the introduction of the work with a brief summary of the problem,
proposed solution and methodologies used along with key contributions and an overview
of the thesis.
1.1 Motivation
The power grid is evolving with a vision of a smart grid with the bidirectional flow
of energy and data. In a smart grid, the goal of a stable and reliable operation of
the grid is important with increasing generations and demand along with time. The
transmission system in the smart grid acts as the inter-connection from the various
generations including renewable energy resources to the consumers. The protection of
the transmission system is important for the stable operation of the smart grid.
However, due to natural disasters, extreme weather as well as human-made interven-
tions, abnormal conditions i.e. faults in the transmission system arise. In order to over-
come the negative impact of faults on the dynamics and stability of this infrastructure,
the role of the protection system of the power grid is important and it needs continuous
improvements. In the protection system of transmission lines, fault diagnosis i.e. fault
detection, its classification and the location of the faults is done with the help of various
1
Chapter 1. Introduction 2
protective relays. However for the post-fault diagnosis tool using the recorded events,
have been developed using model-based as well as data-driven approaches. The goal of
fault diagnosis in the off-line implementation is to analyze the fault in terms of its type,
location and reasoning due to system disturbances. There have been data driven meth-
ods explored to provide this fault diagnosis task for the transmission line in the digital
substations.
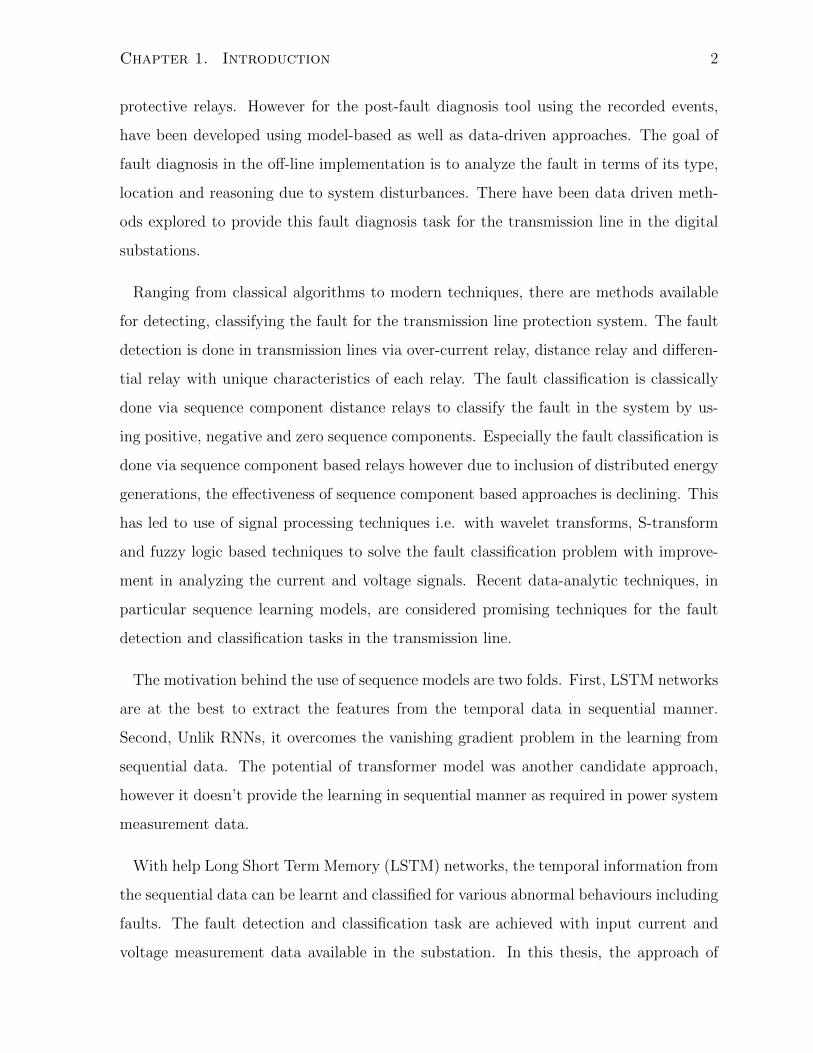
Ranging from classical algorithms to modern techniques, there are methods available
for detecting, classifying the fault for the transmission line protection system. The fault
detection is done in transmission lines via over-current relay, distance relay and differen-
tial relay with unique characteristics of each relay. The fault classification is classically
done via sequence component distance relays to classify the fault in the system by us-
ing positive, negative and zero sequence components. Especially the fault classification is
done via sequence component based relays however due to inclusion of distributed energy
generations, the effectiveness of sequence component based approaches is declining. This
has led to use of signal processing techniques i.e. with wavelet transforms, S-transform
and fuzzy logic based techniques to solve the fault classification problem with improve-
ment in analyzing the current and voltage signals. Recent data-analytic techniques, in
particular sequence learning models, are considered promising techniques for the fault
detection and classification tasks in the transmission line.
The motivation behind the use of sequence models are two folds. First, LSTM networks
are at the best to extract the features from the temporal data in sequential manner.
Second, Unlik RNNs, it overcomes the vanishing gradient problem in the learning from
sequential data. The potential of transformer model was another candidate approach,
however it doesn’t provide the learning in sequential manner as required in power system
measurement data.
With help Long Short Term Memory (LSTM) networks, the temporal information from
the sequential data can be learnt and classified for various abnormal behaviours including
faults. The fault detection and classification task are achieved with input current and
voltage measurement data available in the substation. In this thesis, the approach of
Chapter 1. Introduction 3
sequence learning models is applied to solve the fault classification problem.
The intended end-user of this LSTM based fault diagnosis tool are the manufacturers
of the digital substation devices, which are used to diagnosis the fault in off-line imple-
mentation in the IEC 61850 based substations. Since in the online fault classification,
these machine learning models are not in compliance with time-requirement of real-time
protection system. The goal is to use these data-driven tool for the off-line use for post-
fault analysis for the fault events in the substation to build a classifier based on history
of recorded measurement data.
1.2 Contributions
This thesis focuses on the task of fault detection and classification in the digital substation
connecting transmission line. It proposes a LSTM based fault classifier which classifies
type of faults by learning from the available history of data in the substation.
The novelty of this work is based on firstly, the use of adaptive LSTM based architecture
for feature extraction and secondly, development of softmax classifier for the multi-class
classification of three kinds of faults and a normal class, which is the extension and
improvement in the binary classification explored in the literature for fault detection and
classification.
With focus on developing deep learning based fault classification technique, the contri-
butions of this thesis are three-folds:
• The thesis provides an improved fault detection and classification methodology us-
ing sequential models, especially with Long Short Term Memory (LSTM) networks.
• With experiments conducted for its performance on simulated current and voltage
data shows the potential of its implementation in the post-fault analysis devices
for fault classification using deep learning.
• The goal of multi-class classification with three kinds of faults and a normal class
were identified from the test dataset along with the improved performance com-
Chapter 1. Introduction 4
pared to existing models used for binary classifications.
• The comparative study indicates the better performance of the classification task
by the proposed classifier in comparison of recent deep learning techniques for this
task.
1.3 Overview
Chapter 2 provides the motivation of the deep learning-based fault detection and clas-
sification with an approach to the problem formulation. The reasoning for choosing a
machine learning-based hypothesis and its impact is highlighted.
In Chapter 3, the required background of concepts of fault detection and classification
is covered. Literature surveys of classical and machine learning techniques used in this
subfield of power system protection are highlighted with the need for sequential learning-
based techniques.
Chapter 4 gives a background of sequential learning networks i.e. RNN and LSTMs
and proposes the LSTM network-based classifier with its architecture.
Chapter 5 focuses on a testbed of power transmission line and approach for the solution
with sections of dataset generation, model training methodologies.
In Chapter 6, the results of performance evaluation of the classifier model are provided
with performance metrics and a comparative discussion with alternative models is done.
We conclude the thesis in Chapter 7 with directions for future work in this field of
research.
Chapter 2
Problem Formulation
This chapter states the existing approaches for the fault detection and classification task
of transmission lines. Along with the challenges and limitations of the diverse techniques
used, it provides advantages of machine learning techniques assisting in detection and
classification. A brief introduction of a viable solution, i.e. Long Short Term Memory
(LSTMs) network-based fault classifier is presented at the end.
2.1 Importance of Fault Diagnosis
In power systems, transmission lines are three-phase connections between various substa-
tions which transfers power from generating stations, to the distribution system at high
voltage levels. In a transmission line system, a fault can be defined as contact between
conductors or with the ground. In the three-phased transmission line, these faults are
classified in Single Line to Ground (LG), Double Line to Ground (LLG) and Three Lines
to Ground (LLLG) among others.
In power system, a complex and critical infrastructure, the change in measurement
data i.e. voltage and current signals, is frequently experienced. Along with several
disturbances, the various system faults in power systems are caused by number of reasons
[3], out of which around 85% of them are contributed by faults in the transmission system
5
Chapter 2. Problem Formulation 6
[4]. The faults in the power systems are unavoidable considering their physical nature
e.g. in overhead transmission lines and in underground cables [5]. These faults can cause
substantial economic damage in addition to personal and equipment loss [6]. These
implications in the complex transmission line network, have highlighted the need to
diagnosis the fault in a fast and timely manner.
The fault detection is the procedure to detect the abnormal condition of the transmis-
sion line based on the data obtained by CT and VT protective relays and the status of
circuit breakers of the protective zone. The goal of fault classification is to categorize the
fault by its type i.e. which phase of the system is at fault and its nature.
One of the prominent techniques widely used in power systems is Symmetric Component-
based relays for fault classification. This technique is completely dependent on the es-
timation of the fundamental component of current and voltage signal during the fault.
In addition to the Symmetric Component Distance Relay [7], the advancement of data-
analytics and machine learning prompted increasing research in the depth and breadth
of task of fault diagnosis techniques via decisions made with the help of history of data
in the system and learning out of it.
2.2 Data-Driven Fault Diagnosis in Transmission Line
The fault diagnosis in the transmission system is defined as identifying the fault, classify-
ing its nature and identifying the location in the transmission system. The goal of fault
diagnosis in the transmission system is to detect the fault in the line, classify the type
of fault, and localize the fault for the restoration of the line. The protection system of
transmission lines is used to monitor health of the lines and isolate the line in case of the
fault. The protection systems include primarily circuit breakers to isolate the line, CT
and VT for measurement of current and voltage signals, merging units, and protective
relays.
Fault diagnosis can be divided into model-based and history data based. Model-based
techniques perform fault analysis by describing a system (or process) through quantitative
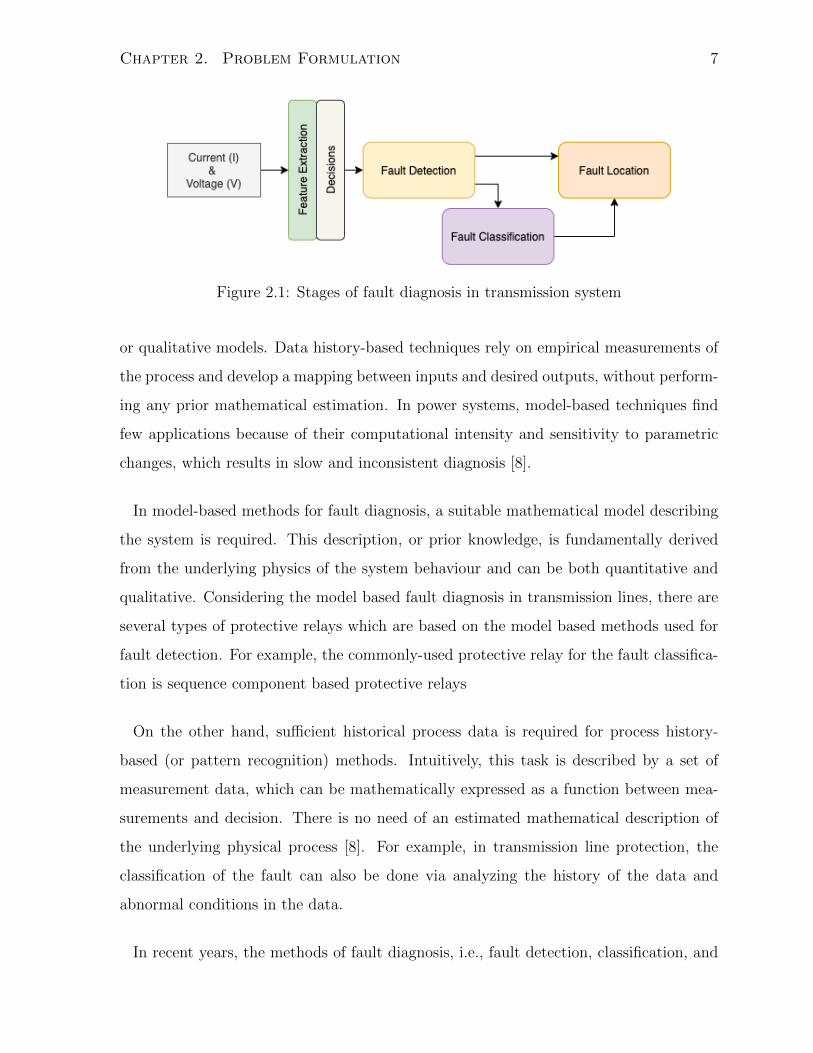
Chapter 2. Problem Formulation 7
Figure 2.1: Stages of fault diagnosis in transmission system
or qualitative models. Data history-based techniques rely on empirical measurements of
the process and develop a mapping between inputs and desired outputs, without perform-
ing any prior mathematical estimation. In power systems, model-based techniques find
few applications because of their computational intensity and sensitivity to parametric
changes, which results in slow and inconsistent diagnosis [8].
In model-based methods for fault diagnosis, a suitable mathematical model describing
the system is required. This description, or prior knowledge, is fundamentally derived
from the underlying physics of the system behaviour and can be both quantitative and
qualitative. Considering the model based fault diagnosis in transmission lines, there are
several types of protective relays which are based on the model based methods used for
fault detection. For example, the commonly-used protective relay for the fault classifica-
tion is sequence component based protective relays
On the other hand, sufficient historical process data is required for process history-
based (or pattern recognition) methods. Intuitively, this task is described by a set of
measurement data, which can be mathematically expressed as a function between mea-
surements and decision. There is no need of an estimated mathematical description of
the underlying physical process [8]. For example, in transmission line protection, the
classification of the fault can also be done via analyzing the history of the data and
abnormal conditions in the data.
In recent years, the methods of fault diagnosis, i.e., fault detection, classification, and
Chapter 2. Problem Formulation 8
location of transmission lines have been extensively explored using data-analytic tech-
niques [9] [10]. With the focus on smart grid, the importance of intelligent health mon-
itoring of transmission systems and fault diagnosis led to the development of statistical
and machine learning based methods concerning the detection and classification of types
of fault in power systems[11].
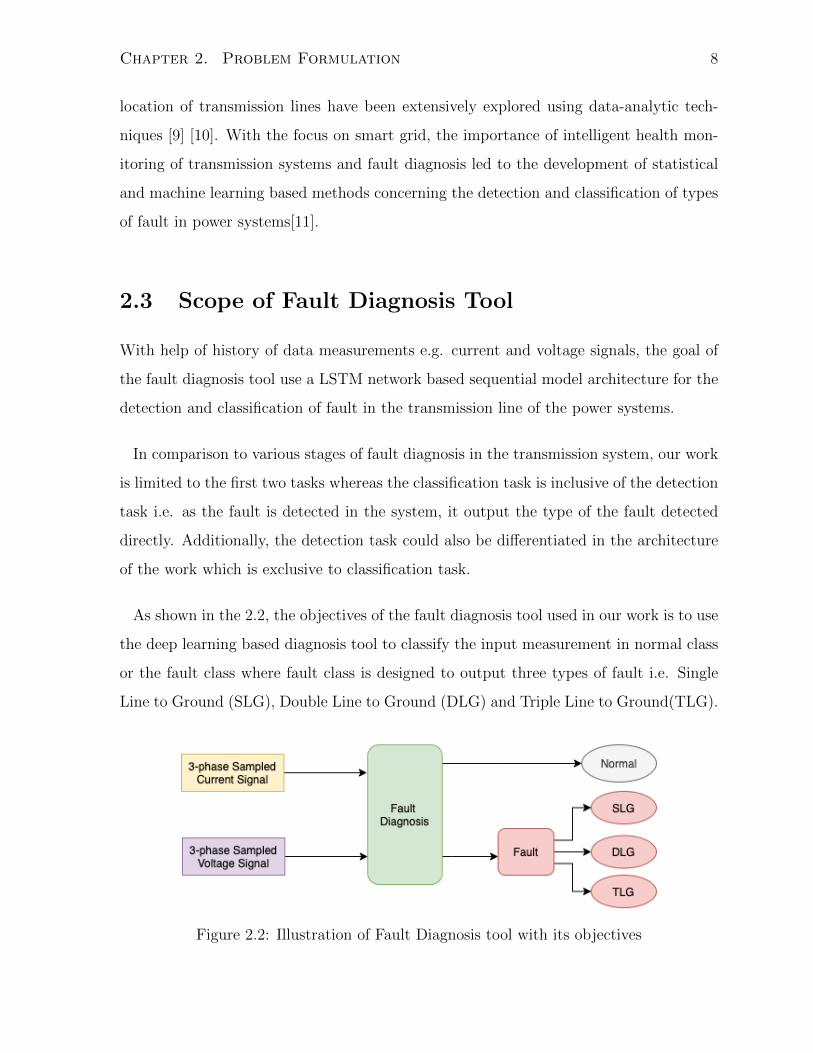
2.3 Scope of Fault Diagnosis Tool
With help of history of data measurements e.g. current and voltage signals, the goal of
the fault diagnosis tool use a LSTM network based sequential model architecture for the
detection and classification of fault in the transmission line of the power systems.
In comparison to various stages of fault diagnosis in the transmission system, our work
is limited to the first two tasks whereas the classification task is inclusive of the detection
task i.e. as the fault is detected in the system, it output the type of the fault detected
directly. Additionally, the detection task could also be differentiated in the architecture
of the work which is exclusive to classification task.
As shown in the 2.2, the objectives of the fault diagnosis tool used in our work is to use
the deep learning based diagnosis tool to classify the input measurement in normal class
or the fault class where fault class is designed to output three types of fault i.e. Single
Line to Ground (SLG), Double Line to Ground (DLG) and Triple Line to Ground(TLG).
Figure 2.2: Illustration of Fault Diagnosis tool with its objectives
Chapter 2. Problem Formulation 9
2.3.1 Assumptions
To achieve the goal of fault classifier using sequential models, we make following assump-
tions to progress towards the solution of detection and classification task in transmission
line protection.
• It is assumed that the input data i.e. current and voltage are available from the
event recording system in the substation for the particular transmission line.
• The classifier is used for fault diagnosis where it can detect the fault, classify the
fault for the post-fault analysis. It is proposed for off-line implementation. The goal
of online implementation is also a possibility however it will require high computing
and faster processing time.
• In the evaluation of the classifier, while producing the generated data from the
testbed system, it is assumed that all transmission line physical parameters are
constant and any abnormalities except the faults are neglected.
2.3.2 Overview of the Problem
In this thesis, the goal is to develop a fault classifier for the fault diagnosis in the pro-
tection system of the transmission line, using LSTM networks as feature extractor and
Softmax layer as decision layer where it utilizes the temporal nature of historical mea-
surement data and extract the feature for the improved classification of faults.
The objective of the problem statement is to achieve the classification performance of
post-fault diagnosis from a data driven approach rather a model based approach. The
use of sequential models especially LSTM networks are considered potential candidates
to learn the temporal information sequentially from the sampled current and voltage
data available from CT and VTs in digital substation via IEC61850 based standard
communication infrastructure.
Based on the formulation of the problem, the goal of the next chapters is to explain
the existing model based methods for the fault classification, data-driven methods from
Chapter 2. Problem Formulation 10
classical signal processing methods to artificial neural network methods. Furthermore,
the vanilla RNN layer and LSTM layer network will be explained along with the proposed
classifier architecture where it can exploit the temporal information of input signals via
LSTMs and produce potential results in classification task of the fault diagnosis. In the
classification task, the detection of fault is implied in this goal as the classification of
the input sample as normal condition and one of three kinds of fault conditions of the
transmission line will be considered.
Chapter 3
Background & Previous Work
This chapter focuses on providing background concepts in protective relay principles,
fault detection and classification along with an literature survey of previous work in this
field. Firstly, the classical approaches of fault classification are explained briefly and
later, machine learning and deep learning based techniques are explained.
3.1 Protective Relay Principles
3.1.1 Protection System
A protection system in power system protects the grid from detrimental effects of a
sustained fault. A fault is an abnormal system condition (in most cases, it’s a short
circuit). If a faulted power system component (e.g. in our case, a transmission line)
is not removed from the system quickly, it may lead to instability in the power system
or higher disintegration of the system by other protective devices. Thus, a protection
system must isolate the power from this faulted element from the rest of the system as
soon as possible.
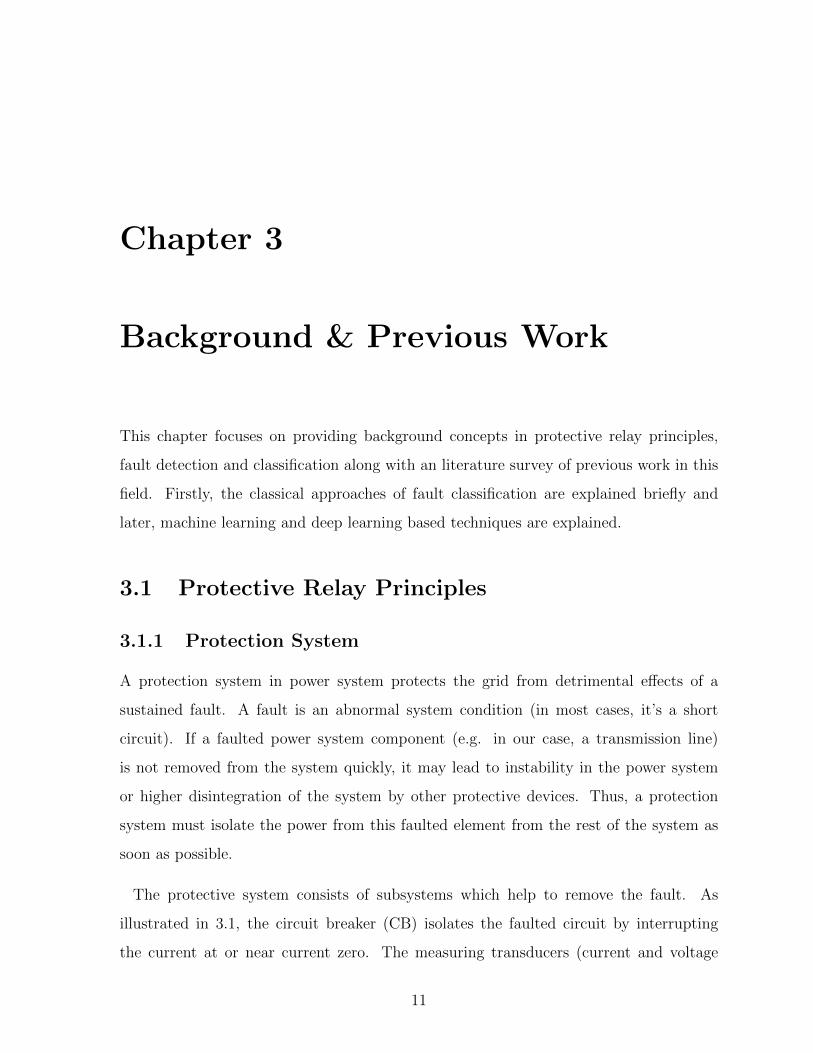
The protective system consists of subsystems which help to remove the fault. As
illustrated in 3.1, the circuit breaker (CB) isolates the faulted circuit by interrupting
the current at or near current zero. The measuring transducers (current and voltage
11
Chapter 3. Background & Previous Work 12
Figure 3.1: Overview of sub-systems of protection system
transformers) makes another major sub-system of protection system. CTs and VTs are
required to measure current and voltage signals by reducing the high magnitude of current
and voltage from primary circuit to low values in secondary circuit. The secondary circuit
values of CT and VT are standardized to 1 Amp or 5 Amp and 67 volts phase-to-neutral
respectively [12]. Thus, the relay observes scaled down versions of currents and voltages
that exist in power systems.
The most important sub-system of protection system is the protective relay. This
device takes inputs (voltage signal, current signal or contact status) in such a way that
it outputs a trip signal to CB when input conditions correspond to the faults the relay
is designed for. The relay has two requirements i.e. it is dependable and it is secure.
Dependability means that the relay will always operate for fault conditions, it is designed
to operate. Security means that the relay will not operate for other power disturbances.
3.1.2 Protection of transmission lines
In the protection system of transmission lines, the classical fault detection is done in sev-
eral relays, in order to avoid common failure modes among different protection systems.
However, all the relays can be classified as:
Chapter 3. Background & Previous Work 13
• Pick-up Relays: These relays respond to magnitude of input quantity. For example,
an over-current relay which responses if the magnitude (generally rms value) of
input current is above a set threshold, Ip.
• Directional Relays: These relays respond to phase angle between two AC inputs.
For example, a common directional relay compares the phase angle of current and
voltage signal. Another way is to compare the phase angle of one current to another
current signal.
• Ratio Relays: These relays respond to the ratio of two input signals expressed
as phasors. Since the ratio of two phasors is a complex number, the relay can
be designed to respond to the magnitude of the complex number or the complex
number itself. For example, the common ratio relays are impedance or distance
relays.
• Differential Relays: These relays respond to the magnitude of the algebraic sum of
two or more inputs. In the common form, the relays respond to the algebraic sum
of currents entering a zone of protection.
• Pilot Relays: These relays are based on utilizing the communication infrastruc-
ture between two remote substations. For example, the decision of local relay is
communicated to other terminals of the transmission line.
3.2 Classical Fault Analysis
Fault classification is important for fast and reliable operation of protective relaying in
transmission lines. Classically the faults in transmission lines can be categorized in two
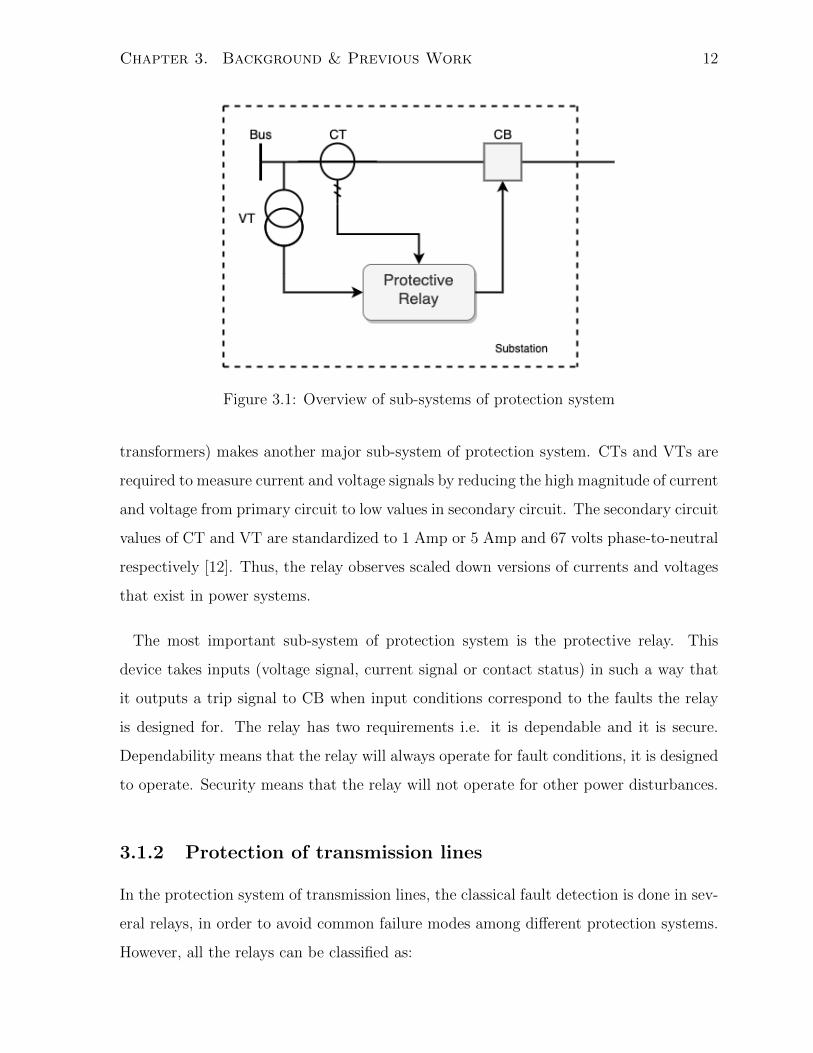
types: series (open circuit) fault or shunt (closed circuit) fault. Open circuit faults create
abnormal change in phase voltage values whereas short circuit faults can be identified
by abnormal phase current value. Short circuit faults are divided into two types, i.e.
asymmetrical faults, and symmetrical faults. Asymmetrical faults are line to ground
(LG), line to line (LL), and double line to ground (LLG), and symmetrical faults are
Chapter 3. Background & Previous Work 14
Figure 3.2: Classification of faults in transmission lines
triple line (LLL) and triple line to ground (LLLG) faults, as shown in 3.2.
The severity and frequency of these faults are briefly explained to understand the need
to identify and classify these faults accordingly. The most frequently occurring fault is
LG fault though it’s not the most severe fault. The next most frequent and severe faults
are LL and LLG. The most severe faults for the stability of power system are LLL and
LLLG faults, if occurred and not identified timely, these faults can collapse the system.
So the protection system needs to detect the fault and classify the nature of the fault
and location of the fault within less time to avoid the major adversarial impact on the
system.
3.2.1 Classical Model-based Approaches
In Model based approaches for the task of fault detection and classification in the trans-
mission line, the commonly used approaches are as follows:
Symmetric Component Protective Relays
In three-phase network of power systems, the measurement signals are obtained from
CTs and VTs at the protective relay location for example one end of a transmission
line. Under steady state and balanced network conditions, phase voltages are of equal
Chapter 3. Background & Previous Work 15
magnitude and spaced equally in 120◦ apart. This is true for the phase currents as well
considering the balanced line.
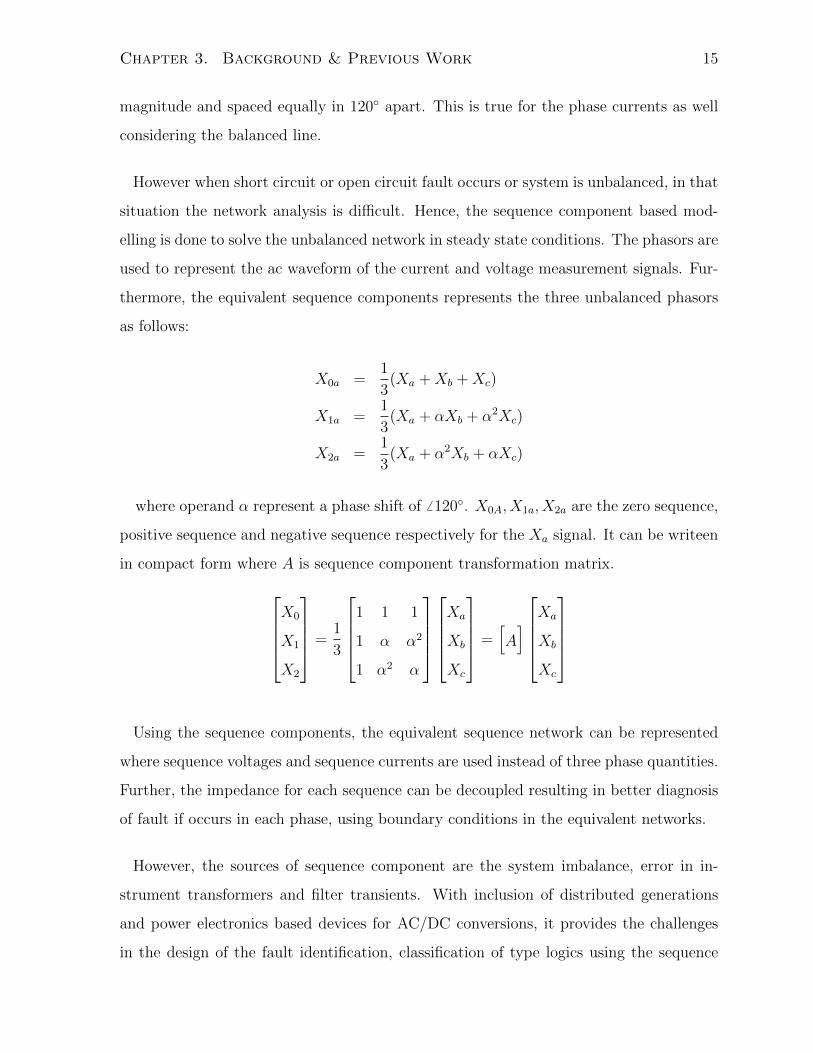
However when short circuit or open circuit fault occurs or system is unbalanced, in that
situation the network analysis is difficult. Hence, the sequence component based mod-
elling is done to solve the unbalanced network in steady state conditions. The phasors are
used to represent the ac waveform of the current and voltage measurement signals. Fur-
thermore, the equivalent sequence components represents the three unbalanced phasors
as follows:
X0a =1
3(Xa +Xb +Xc)
X1a =1
3(Xa + αXb + α2Xc)
X2a =1
3(Xa + α2Xb + αXc)
where operand α represent a phase shift of 6 120◦. X0A, X1a, X2a are the zero sequence,
positive sequence and negative sequence respectively for the Xa signal. It can be writeen
in compact form where A is sequence component transformation matrix.X0
X1
X2
=1
3
1 1 1
1 α α2
1 α2 α
Xa
Xb
Xc
=[A]
Xa
Xb
Xc
Using the sequence components, the equivalent sequence network can be represented
where sequence voltages and sequence currents are used instead of three phase quantities.
Further, the impedance for each sequence can be decoupled resulting in better diagnosis
of fault if occurs in each phase, using boundary conditions in the equivalent networks.
However, the sources of sequence component are the system imbalance, error in in-
strument transformers and filter transients. With inclusion of distributed generations
and power electronics based devices for AC/DC conversions, it provides the challenges
in the design of the fault identification, classification of type logics using the sequence
Chapter 3. Background & Previous Work 16
components [13].
To understand how fault detection and classification tasks are achieved via data-driven
methodologies in transmission lines, various classical techniques, signal processing and
analytical approaches are available with its advantages and disadvantages. To easily
understand, the available literature of fault classification is categorized in two categories,
prominent approaches (Section 3.2.1) and hybrid approaches (Section 3.2.3)[14].
3.2.2 Classical Data-Driven Approaches
These popular approaches are well-known techniques from signal conditioning point of
view, which are used in fault classification algorithms of digital relays. To further under-
stand the basis of these approaches, it is categorized in three types:
Wavelet based Approaches
These approaches are based on the fundamental concept of wavelet transformation (WT)
in signal processing to obtain fundamental components in fault transients which are
difficult to obtain using other methods including Fourier transforms. The idea is to
choose a wavelet function as “mother wavelet” carefully and afterward execute moved
and enlarged adaptations of this wavelet. Wavelets can be picked with recurrence and
time attributes when contrasted with Fourier procedures. With time and frequency data,
WT can split signals into different frequency bands with the help of multi resolution
analysis (MRA). It is used in detecting faults and to estimate the phasors of the current
and voltage signals, which are important signals for the protection of transmission lines.
For example, an approach using wavelet entropy principle was used for fault analysis in
transmission line where the distributed parameter model was used to simulate the line in
the electromagnetic transients program (EMTP) [15]. Using mexican hat and coif let as
mother wavelet, an algorithm was implemented for classifying the fault and computing
the fault distance within half cycle after the fault initiation [16]. Moreover, the fault
transients are utilized to get its wavelet coefficient energies and coefficient decomposition
to develop fault analysis [17].
Chapter 3. Background & Previous Work 17
Discrete Wavelet Transform (DWT) is also researched extensively for classification of
faults in transmission systems. In, [18] a DWT based fault classification was presented for
three-terminal transmission lines. The maximum detail coefficient, energy of signal and
energy change per phase current was calculated using DWT and classifying transmission
line faults. Whereas in [19], a wavelet based current signature analysis method is used
to classify the nature of the fault.
Fuzzy Logic based Approaches
Fuzzy logic technique has also been explored in fault classification problems since the
1990s. Fuzzy logic is a hypothesis which involves uncertainty in input information to
achieve the output. To achieve classification of faults utilizing fuzzy set methodology, [20]
calculated symmetric components in presence of harmonic components and exponential
decay of R-L model. With consideration of travelling waves, fuzzy logic method is used
to estimate frequency, fault voltage at one end of line, and to calculate the fault location
by calculating travel time by the wave [21]. Similarly in [22], fault classification for
single and double-circuit transmission lines is improved where fuzzy logic methodology
could find symmetrical and asymmetrical faults. A comparative study of fuzzy rule based
technique with s-transform and wavelet transform was made showing the effectiveness of
s-transform [23].
Artificial Neural Network (ANN) based Approaches
Earliest work on fault analysis of relaying systems in transmission lines using neural
networks is in 1995 [24] where signal conditioning and multi-layer perceptron (MLP)
model is used to classify the faults. Another neural network based technique for fault
classification and location is explored in [25] where voltage and current signals are used as
inputs. Moreover, only current signals were also used to investigate hidden features which
led to identify faults and classify the faults in [26] and in [27] where only current signals
were also used for fault classification in the double circuit overhead line. Other works
have demonstrated fault analysis of six-phase transmission lines using ANN considering
the increasing infrastructure of high-phase order transmission systems in the present day
Chapter 3. Background & Previous Work 18
scenario.
Using ANN, an adaptive protection scheme for doubly fed transmission lines demon-
strate the line-to-ground (L-G) faults in forward and reverse scenario [28]. This method-
ology uses fundamental component of voltage and current signals measured at one end
and provides fault direction after one cycle from inception of the fault. Considering
the architectural improvement in neural networks, a comparative study of fault analysis
is done with three feed-forward neural networks i.e. cascaded correlation feed forward
network, radial basis function (RBF) and back propagation network(BPN), for a double
circuit transmission line [29].
However, in most of the works, conventional feed-forward dense neural networks were
used to classify the fault in various scenarios and recurrent neural networks and Long
Short Term Memory based classification are limited.
3.2.3 Hybrid Approaches
In hybrid approaches, the integration of two or more techniques (i.e. wavelet transform,
fuzzy logic or ANN) are used to achieve the goal of identification, classification of the
faults in transmission line. The goal of the most of the work was to overcome drawbacks
of one approach while utilizing strengths of another.
A combination of fuzzy-logic and neural network which is called adaptive neuro-fuzzy
inference system (ANFIS) is utilized in [30], where sequence components and line currents
were used to detect phase faults and phase to earth faults. Another approach with
a fuzzy neural network is used for distance relaying [31]. Applications of ANFIS are
explored in detail for fault analysis in transmission lines using measurement data at one
end [32], using multiple ANFIS networks for long transmission lines [33], and for series
compensated transmission systems using WT and ANFIS [34].
With a combination of wavelet transform and neural networks, the focus of most of
the work was getting features from WT and classifying it using neural networks. A
fault classification problem was defined, where wavelet coefficients are fed to the MLP

Chapter 3. Background & Previous Work 19
network [35]. A comparative study of Fourier and WT methods with NN is done where
DWT is considered best for phase-to-ground fault whereas DFT is better in others [36].
Using wavelet entropy and neural network, a fault classification technique showed only
three levels of decomposition of voltage signal was enough, to classify symmetrical and
asymmetrical faults at varied locations [37]. In [38], probabilistic neural network and
WT based fault classification of multi-terminal series compensated lines is shown with
robustness.
Another hybrid techniques are a combination of wavelet transform and fuzzy-logic
where WT is used to decompose the voltage and current signals, which are fed to a
fuzzy-logic system to classify the fault. For example, in [39], fault classification technique
is developed using fuzzy inference system where only three line currents were used to
identify faults and it is extended to locate the faults [40]. Using DWT and fuzzy logic,
a fault classification technique is developed [41] where db4 mother wavelet is used, in
Thailand power transmission system.
3.3 Machine Learning based Fault Detection and Clas-
sification
In previous studies of fault detection of power system faults, several artificial intelligence
based techniques have been proposed including expert systems [42] [43], rough sets [44]
[45], Bayesian Networks [46], petri-nets [47] and neural networks [48], [49]. Classically,
the classification task is achieved via support vector machines and decision trees. Clas-
sification via featue extraction has been implemented via stacked autoencoders in the
literature as well.
Support Vector Machine based Approaches
One of the most used methodologies for fault classification in machine learning domain is
support vector machine (SVM) for binary classes, fault or no-fault. Originating from sta-
tistical learning theory, SVM is a computational learning method for separating function
Chapter 3. Background & Previous Work 20
in classification and estimation in regression problems. SVM based methods for fault
classification in transmission lines are explored as well where SVM acts as a classifier
once features are extracted.
Usefulness of SVM has been proved in [50] where the sensor faults were classified by
three SVM kernels and in [51] where transformer winding faults were classified with better
performance than past data-driven methods. In [52], data-driven line trip prediction is
proposed with SVM as a fault detector for a substation configuration.
A multi-class SVM based fault classification method [53] is developed where wavelet de-
composition of post-fault currents are used as input to SVM with one-verses-all and one-
verses-one kernels are used. Generalization of SVM with limited test-data was demon-
strated as an optimized classifier. A different method for location of faults is used using
fuzzy logic and SVM [54] in which comparative study shows better performance of SVM
from MLP perceptron model. In [55], a technique for real-time fault analysis was devel-
oped using SVM where phase angles among line currents were used as input. However, it
is completely dependent on the ability of separable input points with selection of nonlin-
ear kernels. Wavelet technique for feature extraction and SVM for classification is used
as well [56]. A technique for fault classification in thyristor controlled series compensated
line using SVM is presented where one SVM is trained for fault with firing angles as input
while another for section identification in the line [57].
Decision Tree based Approaches
Decision tree is a transparent and easy to follow technique, where a tree structure is
used for conditional decision making at each node. For fault classification task in power
transmission system, decision tree based methods are developed as well. For example,
using a decision tree, a fault detector is developed which can determine the fault inception
time using a travelling wave in a double circuit transmission line [58]. In another method,
a fault detector for a thyristor controlled series compensated line with unified power flow
controller is developed which uses zero-sequence voltage and current to construct the
optimal decision tree.
Chapter 3. Background & Previous Work 21
Stacked Auto-encoders (SAE)
In the research work of power system fault diagnosis, auto-encoders are also researched
for classification. For example, in [59], authors used stacked auto-encoders for classifying
reclosing failure and success faults. Moreover, stacked sparse auto-encoders are used for
detecting faults in rotating machinery.
The neural networks have been researched extensively in recent years for fault pre-
diction [60] and classification via radial basis functions [61]. However, there is large
temporal information in the transmission line system which contributes to fault detec-
tion, and those features can’t be extracted perfectly with classical feed-forward neural
networks. [52] Recurrent Neural Networks and its extension Long Short Term Memory
networks focus on temporal information in learning in time-sequence data like current
and voltage signals. Due to this, these recurrent neural networks and long short term
memory networks are called, sequential models which are discussed in next section.
3.3.1 Sequential Model Approaches
Sequential learning models i.e. recurrent neural networks and its extensions are widely
useful due to its effectiveness on learning from time-series data and predictions. These
models are shown to have capability to capture hidden features in data-centric applica-
tions e.g. in voice conversion [62] [62], natural language processing [63]. These models
also have shown better performance while dealing with faults in sequential data of fields
other than power systems [64] [65].
However, the simple RNN networks have the problem of gradient vanishing because as
the information flows from the first node to the last node, the gradient diminishes. Addi-
tionally, RNNs can’t have long-term dependencies in temporal sequences as we increase
hidden input windows. To address this, Long Short Term Memory (LSTM) Networks
[66], an improved extension of RNNs is used to solve the long-term dependencies and
vanishing gradient problem. LSTMs work better in extracting the features from long
temporal sequences due to its architecture of gate neural networks. For example, in [67],
Chapter 3. Background & Previous Work 22
LSTM network was proposed to accomplish detection and identification of faults using
available measurement signals. It was shown that the LSTM network was better than
convolutional networks. Moreover, in [68], an LSTM model is proposed to achieve fore-
casting of traffic and compared results demonstrated the better performance by LSTM
network based model.
3.3.2 Literature Gap: Extending potential of sequential models
in classification task
Existing work in machine learning based fault classification ranged from utilizing classical
techniques e.g. SVM, decision trees as well as sequence models i.e. RNN and LSTMs.
Utilizing the both kinds of algorithms, in [69], authors used SVM classifier and LSTM
based classifier to detect faults in using voltage variation in pre-fault and post-fault
prediction. Similar work [52] has used LSTM networks for feature extraction of current,
voltage, active power signals using LSTM network for predicting the binary class i.e.
fault, no-fault classification from measurement data. In this work, the LSTMs were
used to extract the features to train the binary classifier. However, the goal of fault
classification (with multiple classes) task was not achieved using the sequential models
i.e. RNNs or LSTM networks.
In general, LSTMs are better in providing detection and classification objectives in long
temporal measurement data. However data-driven fault detection, classification is still
in the beginning stages. Considering the IEC 61850 based communication infrastructure
in substations, availability of high sampled historical event data, prompt the researchers
to work on better algorithms and architecture of deep learning based classifiers with
improvement in accuracy of classification in digital substations.
Additionally, the performance of the classifier model can be improved via modification
in the architecture of LSTM networks for the feature extraction, later the Dense layers
and softmax based classification layers can achieve the goal of classification. Adaptive
architectures which can be potential solutions for implementation of off-line and online
Chapter 3. Background & Previous Work 23
fault classification in the digital substations. The feature extraction of the features and
temporal information in detection and classification of the fault is the primary function
of machine learning models, however most of the methods with high performance i.e.
with LSTM networks have used conventional architecture for the features of current and
voltage signals.
As discussed, the LSTM networks for fault classification with goal of classifying the
type of faults isn’t explored in the existing literature. Hence, the need to achieve the
task of the multi-class classification and improve the architecture of LSTM networks as
well as fault classification for a transmission line is a need of research with deep learning
techniques especially the potential network of LSTMs for feature extraction with adaptive
nature in different phases of input measurement data.
In the upcoming chapter, we propose the sequence learning models i.e. RNN and
LSTMs and the mathematical background to achieve the improved architecture of fault
classifiers for the transmission system.
Chapter 4
Proposed Sequence Learning based
Fault Classifier
In this chapter, we propose the approach of deep learning based Fault classifier and
provide a mathematical background of sequential learning models i.e. recurrent neural
networks (RNNs) and Long Short Term Memory Networks (LSTMs). Additionally, fur-
ther details about the classifier model is provided to help understand the solution for
fault detection and classification.
4.1 Fault Classification using Deep Learning
As seen in Chapter 2 and 3, the fault classification using machine learning models have
been explored from classical support vector machines to deep sequential models like
recurrent neural networks. With the goal of detecting the fault within a few cycles of
fault inception [], the performance of the sequential models have shown the potential of
usage in digital relays in modern substation.
The RNNs and LSTMs networks have been used dominantly to extract temporal fea-
tures from the time-sequence data i.e. current and voltage signals and these temporal
features in the hidden layers are used to detect, classify and locate the fault. There
24
Chapter 4. Proposed Sequence Learning based Fault Classifier 25
was little exploration in the use of different architecture and hyper-parameters for the
improved performance rather sequence models were used as a primal approach.
In the upcoming section, we provide the foundation of sequential models for classifica-
tion and in Section 4.4, the proposed classifier is proposed with architectural advantages
in temporal signals of the power system.
4.2 Sequential Learning Models for Classification
In this section, a brief overview of sequential models is presented with focus on detailed
working of recurrent neural networks and long short term memory networks. For both
models, the purpose of selection as well as mathematical description is provided.
4.2.1 Recurrent Neural Networks
A recurrent neural network (RNN) is a class of neural networks which utilizes the tempo-
ral information of input data and learns the temporal information through hidden node
connections over time steps. The unrolled architecture of RNN forms a directed graph
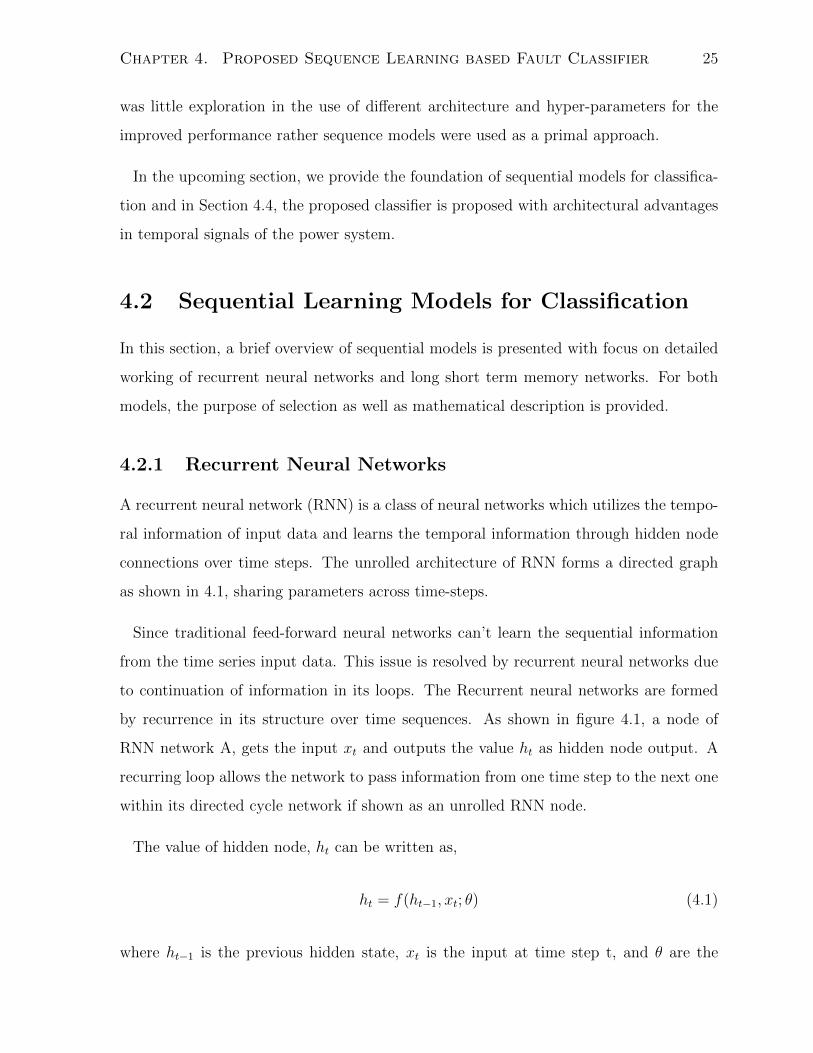
as shown in 4.1, sharing parameters across time-steps.
Since traditional feed-forward neural networks can’t learn the sequential information
from the time series input data. This issue is resolved by recurrent neural networks due
to continuation of information in its loops. The Recurrent neural networks are formed
by recurrence in its structure over time sequences. As shown in figure 4.1, a node of
RNN network A, gets the input xt and outputs the value ht as hidden node output. A
recurring loop allows the network to pass information from one time step to the next one
within its directed cycle network if shown as an unrolled RNN node.
The value of hidden node, ht can be written as,
ht = f(ht−1, xt; θ) (4.1)
where ht−1 is the previous hidden state, xt is the input at time step t, and θ are the
Chapter 4. Proposed Sequence Learning based Fault Classifier 26
Figure 4.1: An illustration of RNN with unrolled network [1]
parameters of function f .
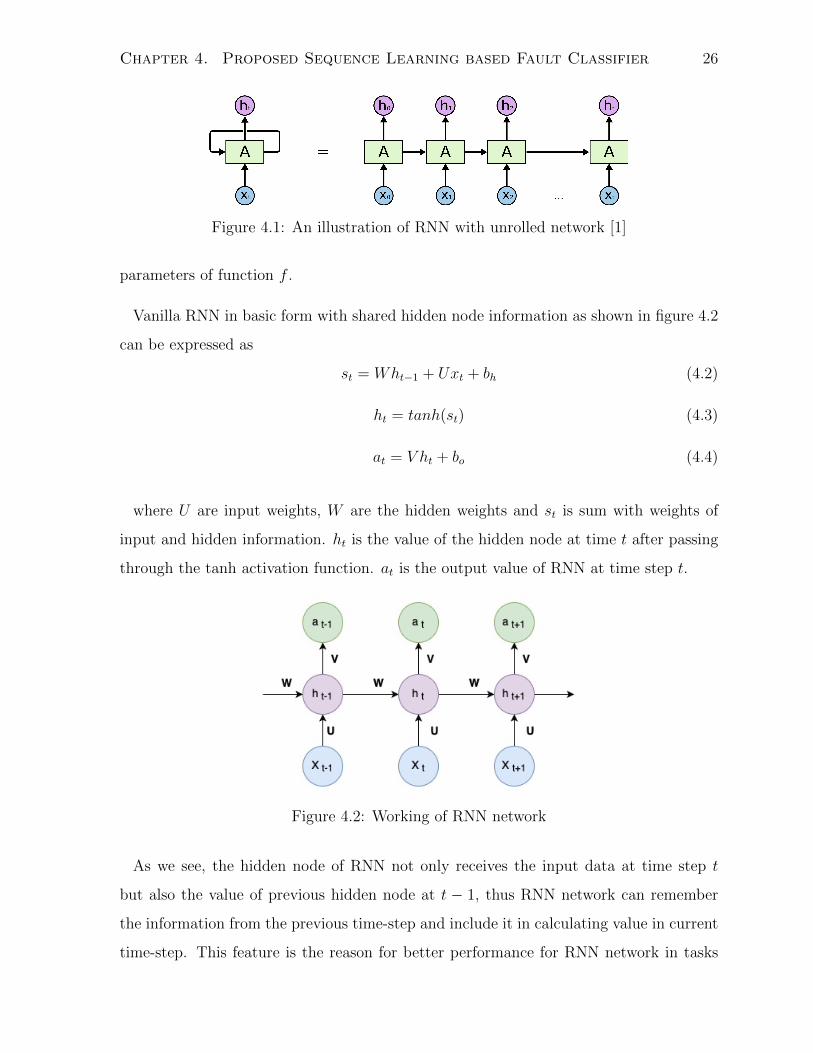
Vanilla RNN in basic form with shared hidden node information as shown in figure 4.2
can be expressed as
st = Wht−1 + Uxt + bh (4.2)
ht = tanh(st) (4.3)
at = V ht + bo (4.4)
where U are input weights, W are the hidden weights and st is sum with weights of
input and hidden information. ht is the value of the hidden node at time t after passing
through the tanh activation function. at is the output value of RNN at time step t.
Figure 4.2: Working of RNN network
As we see, the hidden node of RNN not only receives the input data at time step t
but also the value of previous hidden node at t − 1, thus RNN network can remember
the information from the previous time-step and include it in calculating value in current
time-step. This feature is the reason for better performance for RNN network in tasks
Chapter 4. Proposed Sequence Learning based Fault Classifier 27
with temporal information.
Regarding the output of RNN network and training the network with supervised learn-
ing, a backpropagation algorithm is used after checking the loss at each time-step. The
big challenge while training the RNN network is the problem of vanishing gradients. This
problem arises when the information of previous nodes decreases significantly as we move
across time steps. This challenge of long-term temporal information dependencies lead
to extension of RNN networks with a way to control the temporal information from one
time-step to another.
4.2.2 Long Short Term Memory (LSTM) Networks
Coming up as a solution to the problem of long-term dependencies and learning from
the sequential data, LSTM networks are popular with the advantage of keeping temporal
information for a long time using a memory cell in its node. Instead of having just
one neural node with non-linear function as we saw in RNN, LSTM has multiple gate
layers with the purpose of forgetting information from memory, storing new information
in memory and outputting the information as the information moves across time-step.
The LSTM node at time-step t takes three inputs, xt is the input data at current time-
step, ht−1 is the output of the hidden layer at previous time-step and Ct−1 is the memory
cell from the previous hidden layer. The node outputs its memory cell Ct and output of
the node, ht. Hence, a LSTM node at time-step t takes these inputs and generates output
while updating its memory. To have an understanding of internal information flow while
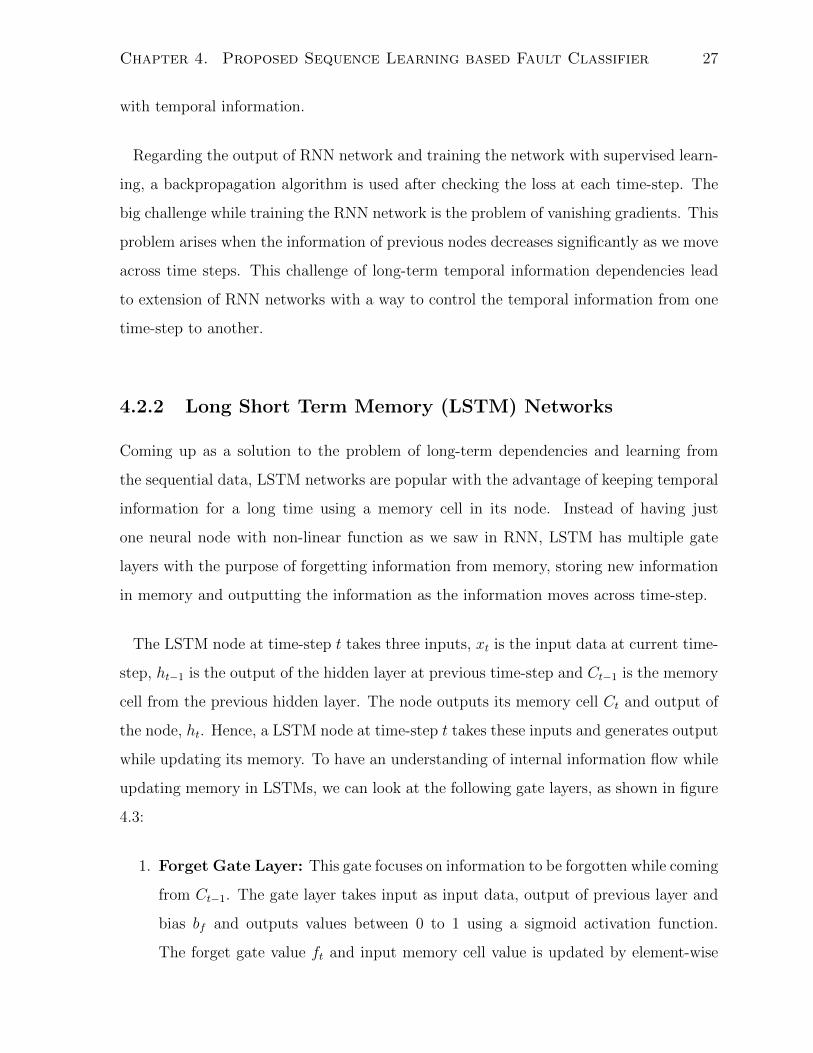
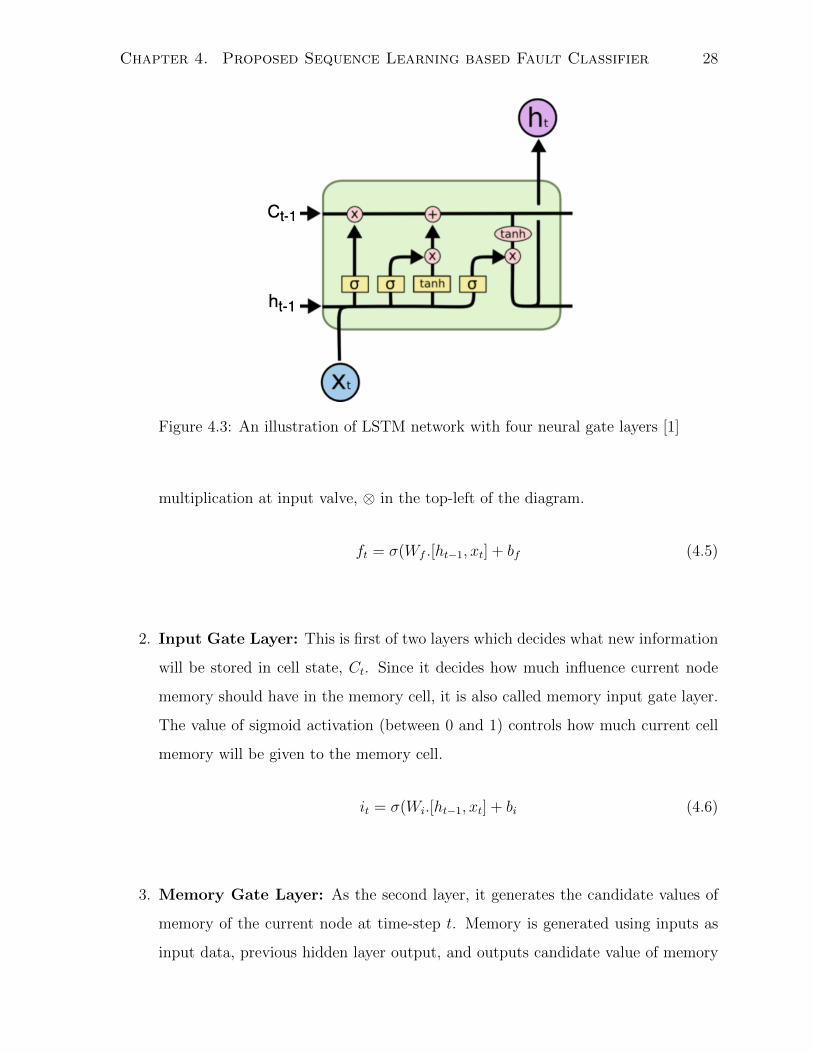
updating memory in LSTMs, we can look at the following gate layers, as shown in figure
4.3:
1. Forget Gate Layer: This gate focuses on information to be forgotten while coming
from Ct−1. The gate layer takes input as input data, output of previous layer and
bias bf and outputs values between 0 to 1 using a sigmoid activation function.
The forget gate value ft and input memory cell value is updated by element-wise
Chapter 4. Proposed Sequence Learning based Fault Classifier 28
Figure 4.3: An illustration of LSTM network with four neural gate layers [1]
multiplication at input valve, ⊗ in the top-left of the diagram.
ft = σ(Wf .[ht−1, xt] + bf (4.5)
2. Input Gate Layer: This is first of two layers which decides what new information
will be stored in cell state, Ct. Since it decides how much influence current node
memory should have in the memory cell, it is also called memory input gate layer.
The value of sigmoid activation (between 0 and 1) controls how much current cell
memory will be given to the memory cell.
it = σ(Wi.[ht−1, xt] + bi (4.6)
3. Memory Gate Layer: As the second layer, it generates the candidate values of
memory of the current node at time-step t. Memory is generated using inputs as
input data, previous hidden layer output, and outputs candidate value of memory
Chapter 4. Proposed Sequence Learning based Fault Classifier 29
as after passing through tanh activation function.
Ct = tanh(Wc.[ht−1, xt]) + bc (4.7)
Ct = ft ∗ Ct−1 + it ∗ Ct (4.8)
4. Output Gate Layer: Acting as the last gate layer, output gate layer decides
about output of information to ht, which is decided by memory cell Ct, previous
hidden layer output ht−1 and input data xt. After running the sigmoid function
over the output gate layer, and tanh function over the memory cell, the output
valve controls the output value of the current LSTM node.
Ot = σ(Wo.[ht−1, xt] + bo) (4.9)
ht = Ot ∗ tanh(Ct) (4.10)
The advantage of LSTM network for long-term dependencies and overcoming vanishing
gradient problems comes from the memory cell and the control of memory update on the
memory cell. As the memory gate layer and output layer based sigmoid functions take
value as 0, the update on memory is stopped and the value memory cell remains constant
resulting no effect on output of LSTM node at time step t. Thus while training via back-
propagation algorithms, the gradients can traverse back across time-step without going
to zero or exploding to∞. Because of this advantage of having a long short term memory
cell, the LSTM networks have the ability to learn long-term dependencies from temporal
input data and perform better than vanilla RNN networks.
4.3 Classification Task
For fault detection and especially identifying the nature of faults in the transmission
system, classification into categorizes is the key step. To understand the binary classi-
fier and then multi-class classification task, logistic classifier and softmax classifiers are
Chapter 4. Proposed Sequence Learning based Fault Classifier 30
explained, which are included in the proposed classifier.
4.3.1 Logistic Regression Classifier
The goal of logistic regression classifiers is to learn a decision boundary for the binary
classes from the training data, (xi, yi) where i ∈ [1..N ] and yi ∈ {0, 1} using a logistic
function.
Given the N training data, the hypothesis function can be expressed as,
hθ(x) =1
1 + exp(−θTx)(4.11)
where θ are the weight parameters of the classifier to be learnt from training data. The
hypothesis function provides the probabilities of the classes,
P (y = 1|x; θ) = hθ(x)
P (y = 0|x; θ) = 1− hθ(x)
Hence, using maximum likelihood estimate, the cost function for the logistic classifier
can be written as shown in eq. 4.12. Thereafter, a gradient descent algorithm or any
optimization algorithm can be used to minimize the loss function.
J(θ) = − 1
N
N∑i=1
(yi log hθ(xi) + (1− yi) log(1− hθ(xi))) (4.12)
4.3.2 Softmax Classifier
Softmax classifier is the generalization of Logistic Regression classifier with the goal of
categorizing multiple classes, using softmax function. Softmax function is an activation
function which converts numeric output of the last layer of the Dense neural network
i.e. logits into normalized probabilities for each class so that each vector adds to one.
The last layer of Dense network uses softmax function as the activation function for this
Chapter 4. Proposed Sequence Learning based Fault Classifier 31
purpose in our multi-class fault classification.
Given N training data points (xi, yi) where i ∈ [1..N ] and yi ∈ {0, 1, ..K}, after process-
ing through the layers, the input vector of z of size K can be expressed via the softmax
function,
σ(z)i =ezi∑Kj=1 e
zjfor i = 1, . . . , K and z = (z1, . . . , zK) ∈ RK
It can also be interpreted as the output probability for the ith class, given the input
vector z as input to the softmax layer.
Given the mapping from input xi to output yi, using a mapping function yi = fi(xi; θ)
the softmax classifier uses cross-entropy loss as shown in eq. 4.13 to optimize the weights
in the training.
Ji = −K∑i=1
ti log(σ(y)i) (4.13)
Here, ti are ground-truth labels and yi are estimated labels via softmax classifier.
4.4 Proposed LSTM based Detector and Classifier
4.4.1 Architecture Design Approach
Using the LSTM networks, the fault detector and classifier is proposed for the transmis-
sion line protection system using current and voltage signals from the one end of the line,
in substation. For the design and architectural preferences for the proposed Fault Clas-
sifier, the following questions were proposed to get the required architecture of classifier
model using LSTMs network:
• What are the top performing classification models in the existing literature for the
time-series data in the literature?
• How do we improve the architecture of models used for sequential data of two
Chapter 4. Proposed Sequence Learning based Fault Classifier 32
different nature of features?
• What are the needs for the classifier models for better performance?
• How can the architecture be extended for the additional features in consideration?
Given the time-series data, the top performing models explored and shown in the
literature are LSTM based classifiers primarily using RNNs but later using LSTM layers.
To create a LSTM model for feature extraction for the sequential data, utilizing different
LSTM networks for each type of feature is a better idea for the temporal dependencies
in particular nature of feature as well as investigating the parameters of the network.
Hence, LSTM networks for each phase of currents and voltages are utilized.
For the goal of better performance of fault classification model, the extracted features
of the temporal data should be classified with minimal, however effective layers of deep
learning model to obtain the categorical probabilities for each test sample. Hence, only
a single Dense layer is utilized in the proposed classifier.
For our goal, a multi-class classification is done for obtaining the fault type where a
softmax function is used for normalized probabilities for each class. To incorporate this in
the model, the last layer of the Dense neural network has activation function as softmax,
naming the layer as Softmax layer.
Lastly, to make the architecture robust for the addition of the new features in the
classifier, a new network for the new type of feature e.g. sampled reactive power or data
from phasor measurement units (PMU) etc can be incorporated in this classifier model.
With the above questions in the focus, the Classifier model architecture was chosen
with a separate LSTM network for each feature i.e. three phase currents (Ia, Ib, Ic) and
three phase voltages (Va, Vb, Vc) in the substation.
Chapter 4. Proposed Sequence Learning based Fault Classifier 33
4.4.2 Handling Overfitting in Classifier
In the proposed classifier, the overfitting is one of the issues considering the character-
istics of the fault classification and its imbalanced data in the power system. In normal
operation of transmission lines, current and voltage signals propose imbalanced dataset
for classification as occurrence of fault is rare. Hence, the training of the classifier with
imbalanced dataset may result in overfitting problems while training. To avoid the over-
fitting the classifier is equipped with a dropout layer in the classification part of the
architecture. Another option is batch-normalization layer after Dense layer. The solu-
tions of overfitting problem are discussed as follows:
Dropout
The basic idea of dropout [70] is to randomly drop neural units (along with their connec-
tions) from the Dense layer during training. To ensure its methodology, the neurons are
neglected with probability P while the forward pass of the training and backward pass
of backpropagation with random nodes in each pass. Hence, training the network with
dropout can be considered as training multiple networks averaging the output. Thus, it
provides better regularized performance in validation set and later in test-set.
Batch Normalization
Batch normalization is a technique to improve the training of the classifier by reducing
internal covariance shift among layers of deep neural networks [71] by normalizing each
layer of the network. As normalizing each layer adjust the distribution features of the
data to mean and standard deviation as 0 and 1 respectively. Thus, the training and
test data distribution is reduced to normalized distribution in each layer, reducing the
problem of overfitting as well as improving the learning rates and training time. Hence,
batch-normalization layer is important to improve the performance of the classifier by
reducing overfitting.
Chapter 4. Proposed Sequence Learning based Fault Classifier 34
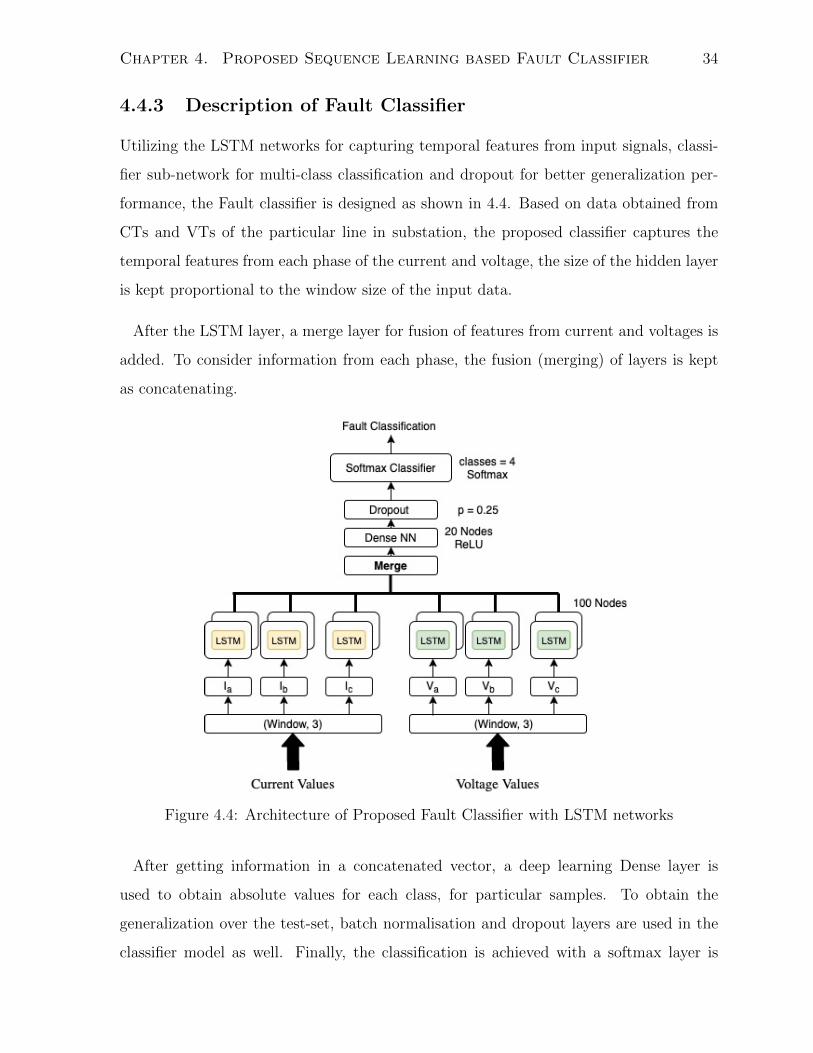
4.4.3 Description of Fault Classifier
Utilizing the LSTM networks for capturing temporal features from input signals, classi-
fier sub-network for multi-class classification and dropout for better generalization per-
formance, the Fault classifier is designed as shown in 4.4. Based on data obtained from
CTs and VTs of the particular line in substation, the proposed classifier captures the
temporal features from each phase of the current and voltage, the size of the hidden layer
is kept proportional to the window size of the input data.
After the LSTM layer, a merge layer for fusion of features from current and voltages is
added. To consider information from each phase, the fusion (merging) of layers is kept
as concatenating.
Figure 4.4: Architecture of Proposed Fault Classifier with LSTM networks
After getting information in a concatenated vector, a deep learning Dense layer is
used to obtain absolute values for each class, for particular samples. To obtain the
generalization over the test-set, batch normalisation and dropout layers are used in the
classifier model as well. Finally, the classification is achieved with a softmax layer is

Chapter 4. Proposed Sequence Learning based Fault Classifier 35
added at the end for obtaining the normalized probability for each class in the given
input sample.
In the next chapter, the training workflow of the proposed classifier will be discussed
and methodologies of data generation on benchmark testbed used will be described.
Chapter 5
Testbed for Classifier Training
This chapter introduces the benchmark testbed used for data generation and training
methodologies of classifier models.
5.1 Transmission Line Testbed
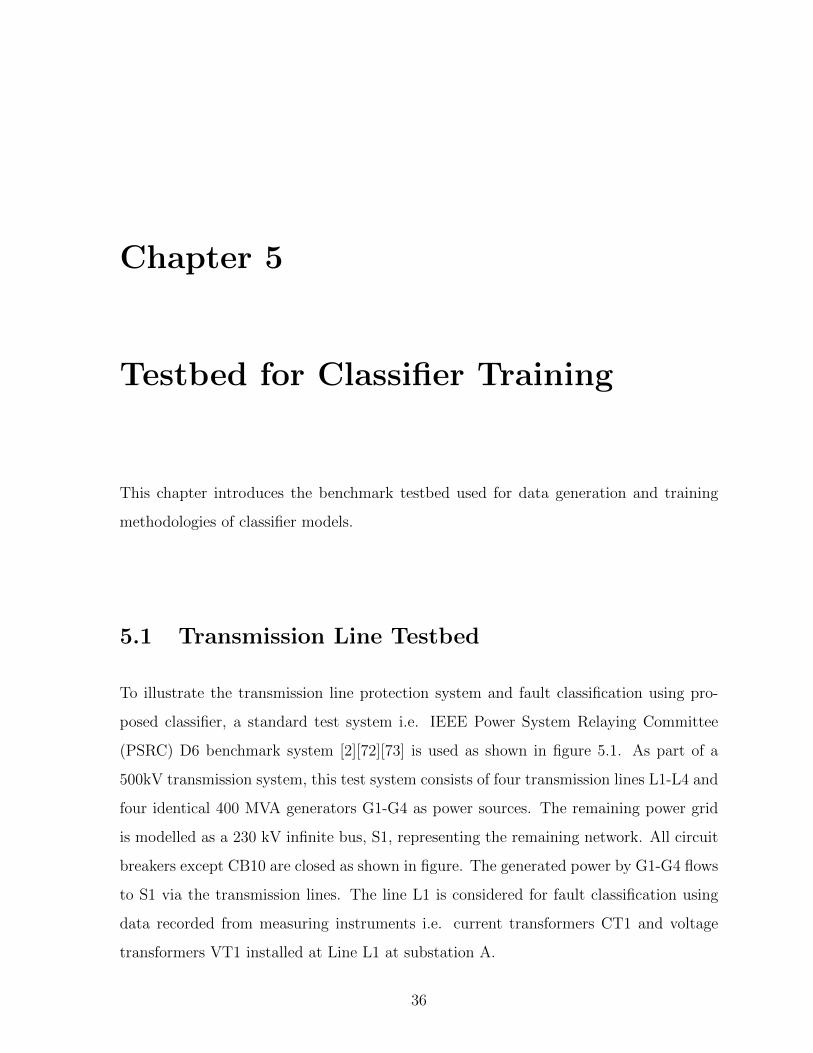
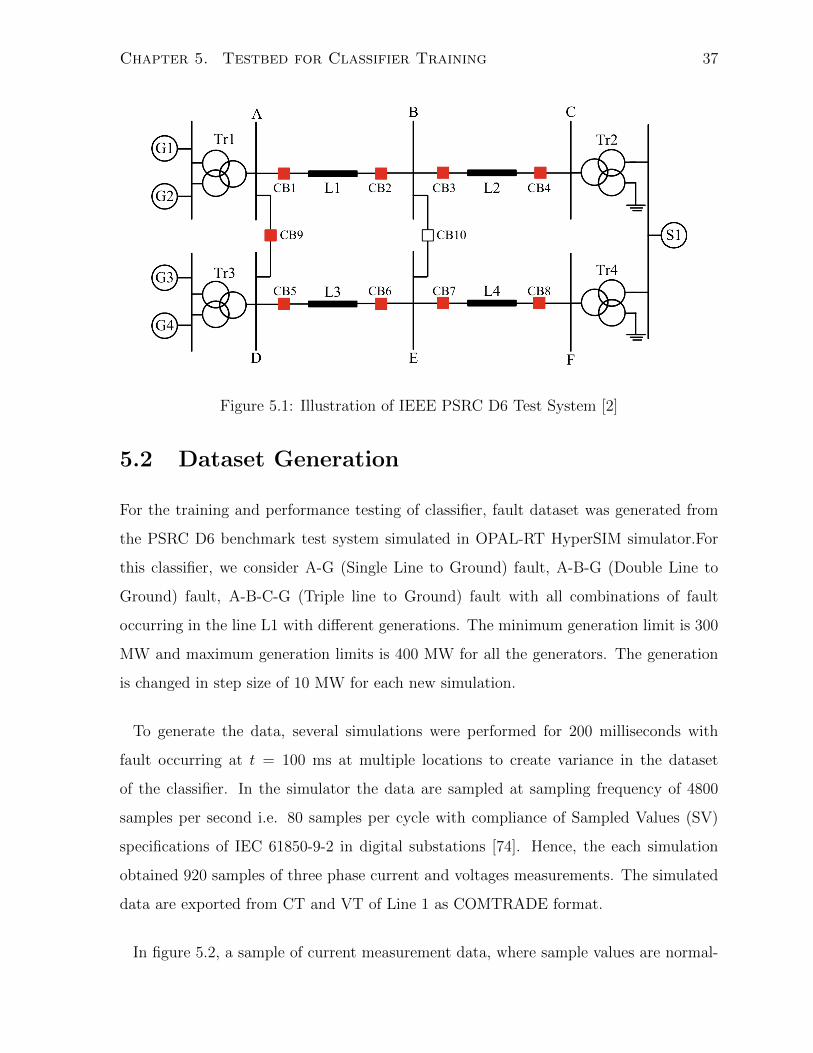
To illustrate the transmission line protection system and fault classification using pro-
posed classifier, a standard test system i.e. IEEE Power System Relaying Committee
(PSRC) D6 benchmark system [2][72][73] is used as shown in figure 5.1. As part of a
500kV transmission system, this test system consists of four transmission lines L1-L4 and
four identical 400 MVA generators G1-G4 as power sources. The remaining power grid
is modelled as a 230 kV infinite bus, S1, representing the remaining network. All circuit
breakers except CB10 are closed as shown in figure. The generated power by G1-G4 flows
to S1 via the transmission lines. The line L1 is considered for fault classification using
data recorded from measuring instruments i.e. current transformers CT1 and voltage
transformers VT1 installed at Line L1 at substation A.
36
Chapter 5. Testbed for Classifier Training 37
Figure 5.1: Illustration of IEEE PSRC D6 Test System [2]
5.2 Dataset Generation
For the training and performance testing of classifier, fault dataset was generated from
the PSRC D6 benchmark test system simulated in OPAL-RT HyperSIM simulator.For
this classifier, we consider A-G (Single Line to Ground) fault, A-B-G (Double Line to
Ground) fault, A-B-C-G (Triple line to Ground) fault with all combinations of fault
occurring in the line L1 with different generations. The minimum generation limit is 300
MW and maximum generation limits is 400 MW for all the generators. The generation
is changed in step size of 10 MW for each new simulation.
To generate the data, several simulations were performed for 200 milliseconds with
fault occurring at t = 100 ms at multiple locations to create variance in the dataset
of the classifier. In the simulator the data are sampled at sampling frequency of 4800
samples per second i.e. 80 samples per cycle with compliance of Sampled Values (SV)
specifications of IEC 61850-9-2 in digital substations [74]. Hence, the each simulation
obtained 920 samples of three phase current and voltages measurements. The simulated
data are exported from CT and VT of Line 1 as COMTRADE format.
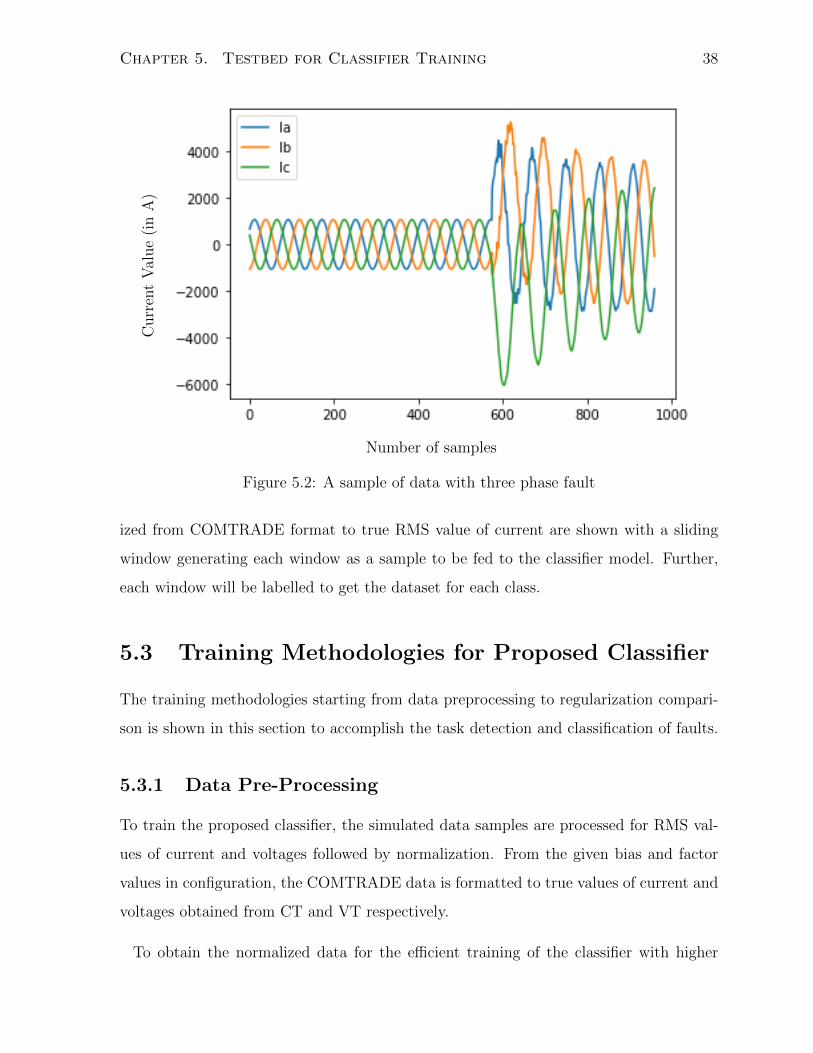
In figure 5.2, a sample of current measurement data, where sample values are normal-
Chapter 5. Testbed for Classifier Training 38
Number of samples
Curr
ent
Val
ue
(in
A)
Figure 5.2: A sample of data with three phase fault
ized from COMTRADE format to true RMS value of current are shown with a sliding
window generating each window as a sample to be fed to the classifier model. Further,
each window will be labelled to get the dataset for each class.
5.3 Training Methodologies for Proposed Classifier
The training methodologies starting from data preprocessing to regularization compari-
son is shown in this section to accomplish the task detection and classification of faults.
5.3.1 Data Pre-Processing
To train the proposed classifier, the simulated data samples are processed for RMS val-
ues of current and voltages followed by normalization. From the given bias and factor
values in configuration, the COMTRADE data is formatted to true values of current and
voltages obtained from CT and VT respectively.
To obtain the normalized data for the efficient training of the classifier with higher
Chapter 5. Testbed for Classifier Training 39
convergence rate, all the samples are scaled to mean 0 and standard deviation of 1 using
xscaled =x− xmin
xmax − xmin
where xscaled is normalized data in mean 0 and standard deviation 1 from unprocessed
data x.
Data Windows Generation
To train the classifier with a parameter of input size of data i.e. number of samples fed to
the classifier, the simulated samples are converted to windows of fixed window size with
a step size where windows are slid with a number of step size samples. This window
size parameters changes the amount of samples fed to the classifier and its computation
time at test-time. The larger the window size, the longer it takes to output the predicted
class of samples. In our training process, window size is varied as a hyperparameter and
later kept at 100 samples i.e. around 20 ms cycle with step size of 50 samples i.e. around
10 ms of step size.
Labelling of Dataset
The labelling of the training dataset is important for training the proposed supervised
learning based classifier. From the simulated data for the different kinds of faults, In our
case, the labelling is done for four classes: Normal, A-G Fault, A-B-G Fault, A-B-C-G
Fault. Firstly, each simulation data was turned into running windows with a window
size and a step size so that each window represent one of the four classes. Each running
window is labelled normal if all the samples are in no-fault scenario else to fault class
(A-G, A-B-G, or A-B-C-G) if any of the samples in the window are from fault. This
labelling is done using Python script over the dataset.
5.3.2 Training of the Classifier
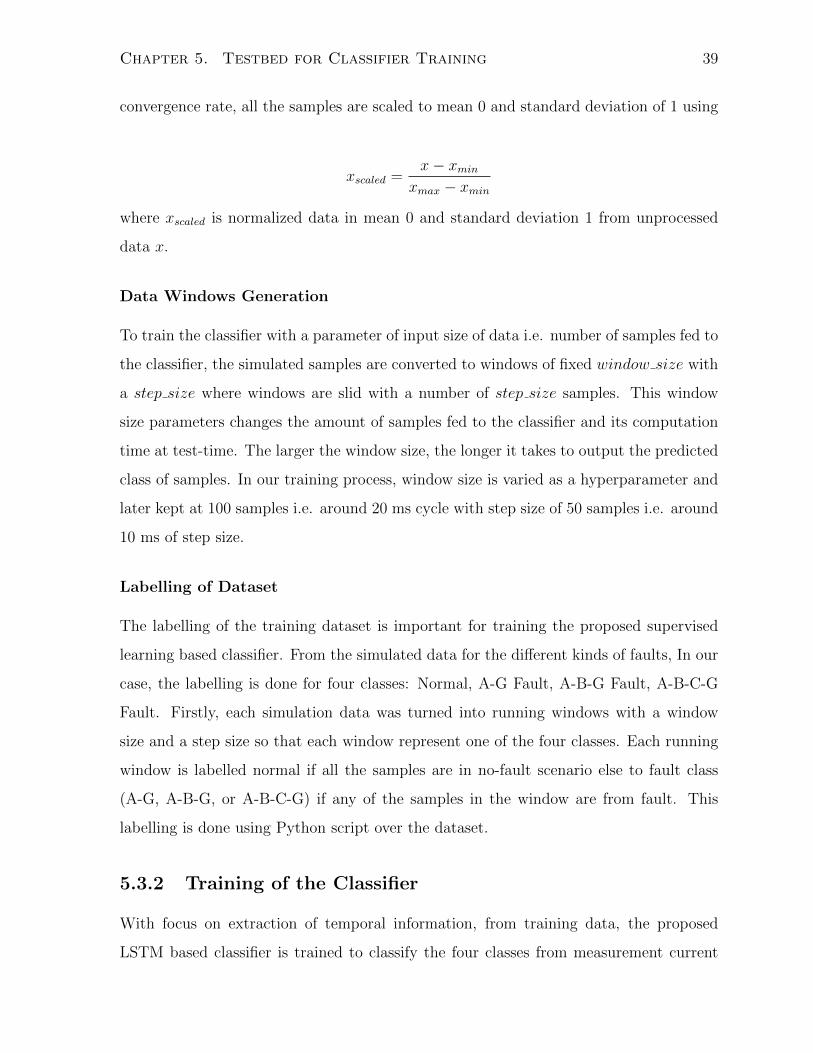
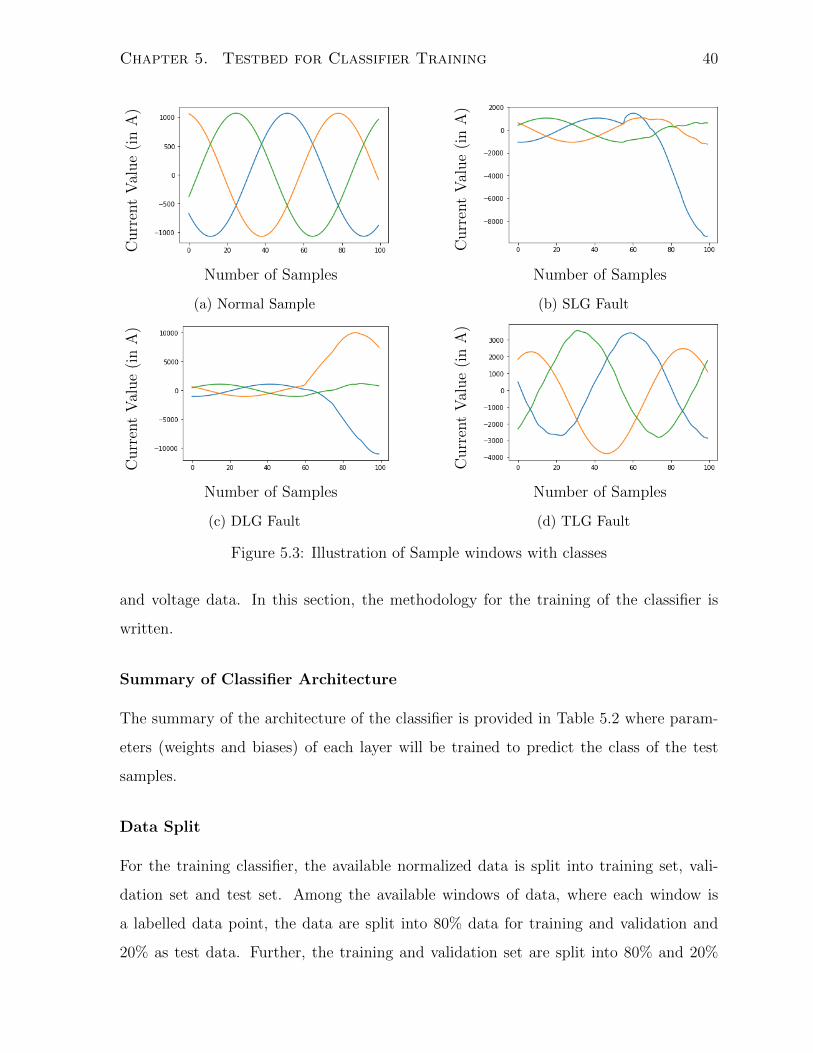
With focus on extraction of temporal information, from training data, the proposed
LSTM based classifier is trained to classify the four classes from measurement current
Chapter 5. Testbed for Classifier Training 40
Number of Samples
Curr
ent
Val
ue
(in
A)
(a) Normal Sample
Number of Samples
Curr
ent
Val
ue
(in
A)
(b) SLG Fault
Number of Samples
Curr
ent
Val
ue
(in
A)
(c) DLG Fault
Number of Samples
Curr
ent
Val
ue
(in
A)
(d) TLG Fault
Figure 5.3: Illustration of Sample windows with classes
and voltage data. In this section, the methodology for the training of the classifier is
written.
Summary of Classifier Architecture
The summary of the architecture of the classifier is provided in Table 5.2 where param-
eters (weights and biases) of each layer will be trained to predict the class of the test
samples.
Data Split
For the training classifier, the available normalized data is split into training set, vali-
dation set and test set. Among the available windows of data, where each window is
a labelled data point, the data are split into 80% data for training and validation and
20% as test data. Further, the training and validation set are split into 80% and 20%
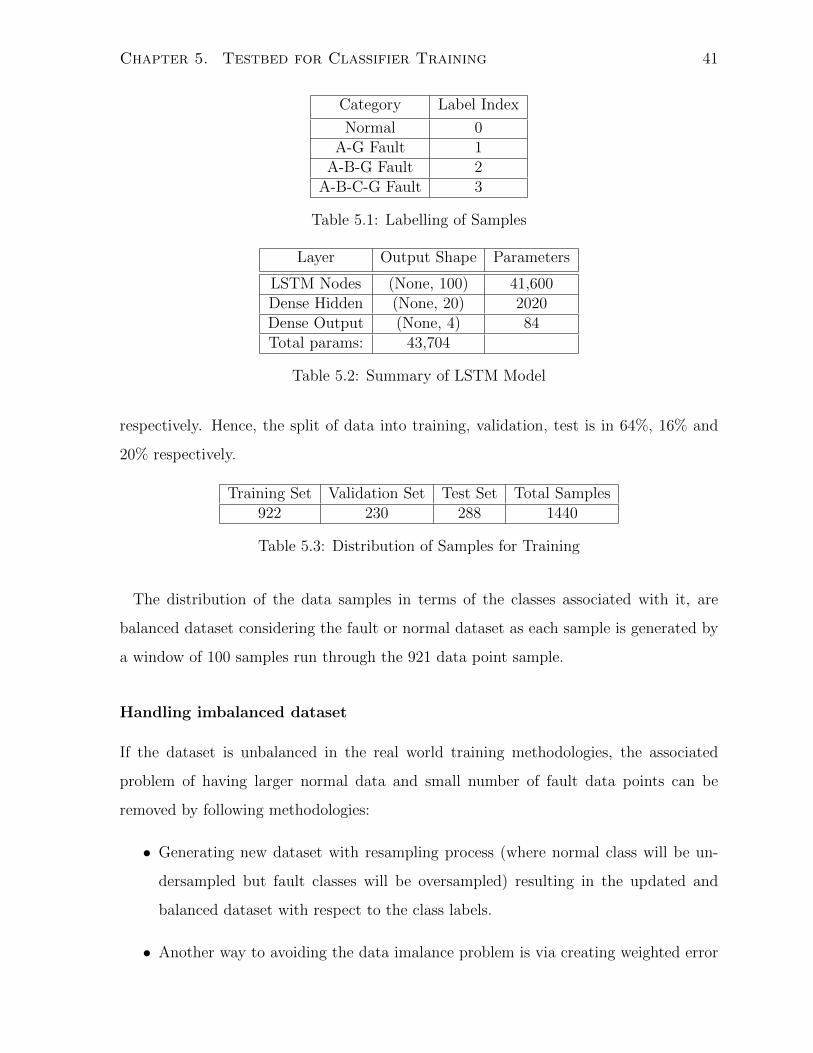
Chapter 5. Testbed for Classifier Training 41
Category Label Index
Normal 0A-G Fault 1
A-B-G Fault 2A-B-C-G Fault 3
Table 5.1: Labelling of Samples
Layer Output Shape Parameters
LSTM Nodes (None, 100) 41,600Dense Hidden (None, 20) 2020Dense Output (None, 4) 84Total params: 43,704
Table 5.2: Summary of LSTM Model
respectively. Hence, the split of data into training, validation, test is in 64%, 16% and
20% respectively.
Training Set Validation Set Test Set Total Samples922 230 288 1440
Table 5.3: Distribution of Samples for Training
The distribution of the data samples in terms of the classes associated with it, are
balanced dataset considering the fault or normal dataset as each sample is generated by
a window of 100 samples run through the 921 data point sample.
Handling imbalanced dataset
If the dataset is unbalanced in the real world training methodologies, the associated
problem of having larger normal data and small number of fault data points can be
removed by following methodologies:
• Generating new dataset with resampling process (where normal class will be un-
dersampled but fault classes will be oversampled) resulting in the updated and
balanced dataset with respect to the class labels.
• Another way to avoiding the data imalance problem is via creating weighted error
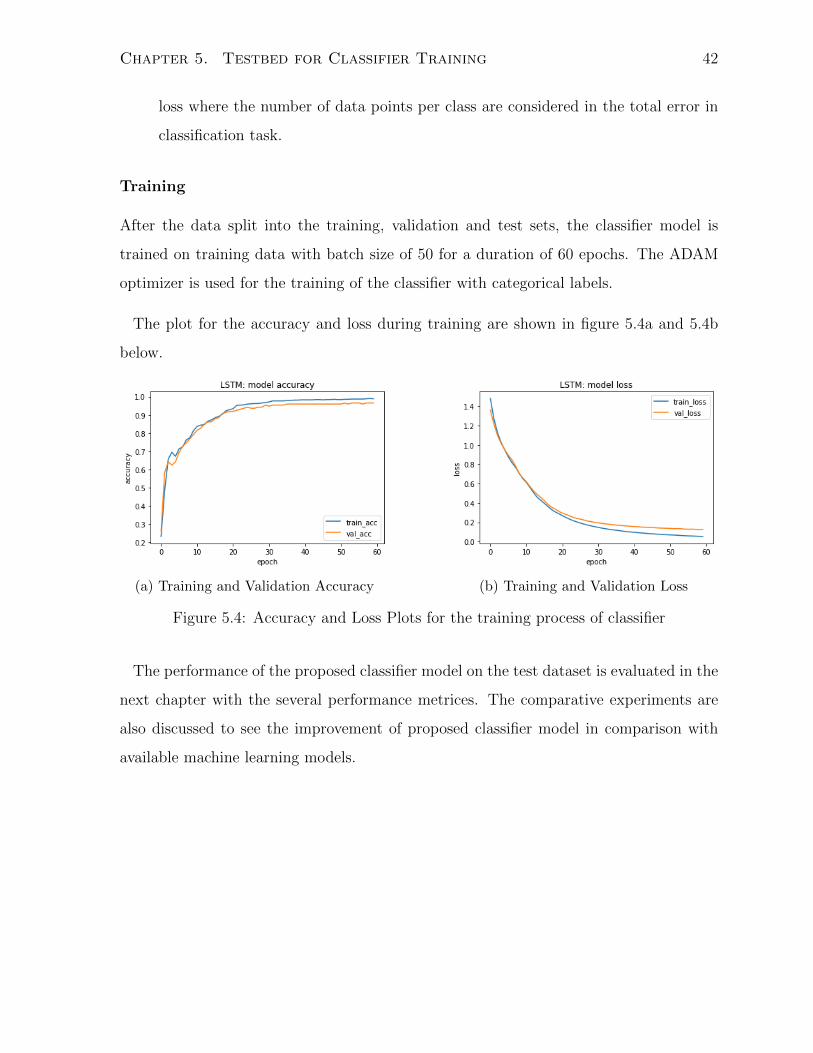
Chapter 5. Testbed for Classifier Training 42
loss where the number of data points per class are considered in the total error in
classification task.
Training
After the data split into the training, validation and test sets, the classifier model is
trained on training data with batch size of 50 for a duration of 60 epochs. The ADAM
optimizer is used for the training of the classifier with categorical labels.
The plot for the accuracy and loss during training are shown in figure 5.4a and 5.4b
below.
(a) Training and Validation Accuracy (b) Training and Validation Loss
Figure 5.4: Accuracy and Loss Plots for the training process of classifier
The performance of the proposed classifier model on the test dataset is evaluated in the
next chapter with the several performance metrices. The comparative experiments are
also discussed to see the improvement of proposed classifier model in comparison with
available machine learning models.
Chapter 6
Results and Discussion
In this chapter, results of the classifier model are presented with effectiveness in classifi-
cation of faults. A comparative study of alternative available machine learning based is
done to evaluate the test time performance.
6.1 Performance Evaluation of Fault Classification
The goal of the proposed classifier is to predict the type of the fault in the transmission
line accurately using the window on the test samples. To illustrate the training and the
test performance methodology of the classifier, a flow diagram is described in figure 6.1.
During Test performance, the sampled testing data are input from ADC of CT and
VT and normalized and sampled into windows. Each test sample is sampled in a window
sample of the window size for the classifier in the test training phase. As the trained
model is loaded in the computer relay, it can classify the type of fault or normal condition
of the input test samples. It repeats over the windows of the input test sample data.
To evaluate the performance of the classifier in correctly predicting the class of fault,
the performance metrics are chosen as shown below.
43
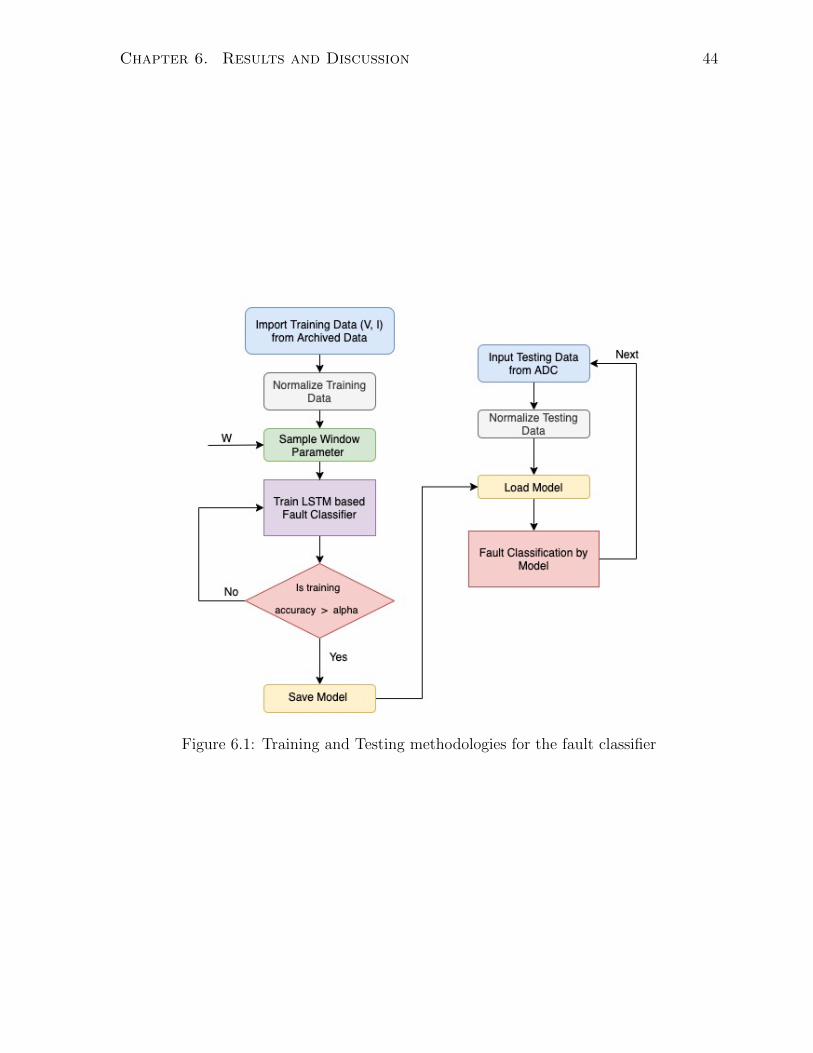
Chapter 6. Results and Discussion 44
Figure 6.1: Training and Testing methodologies for the fault classifier
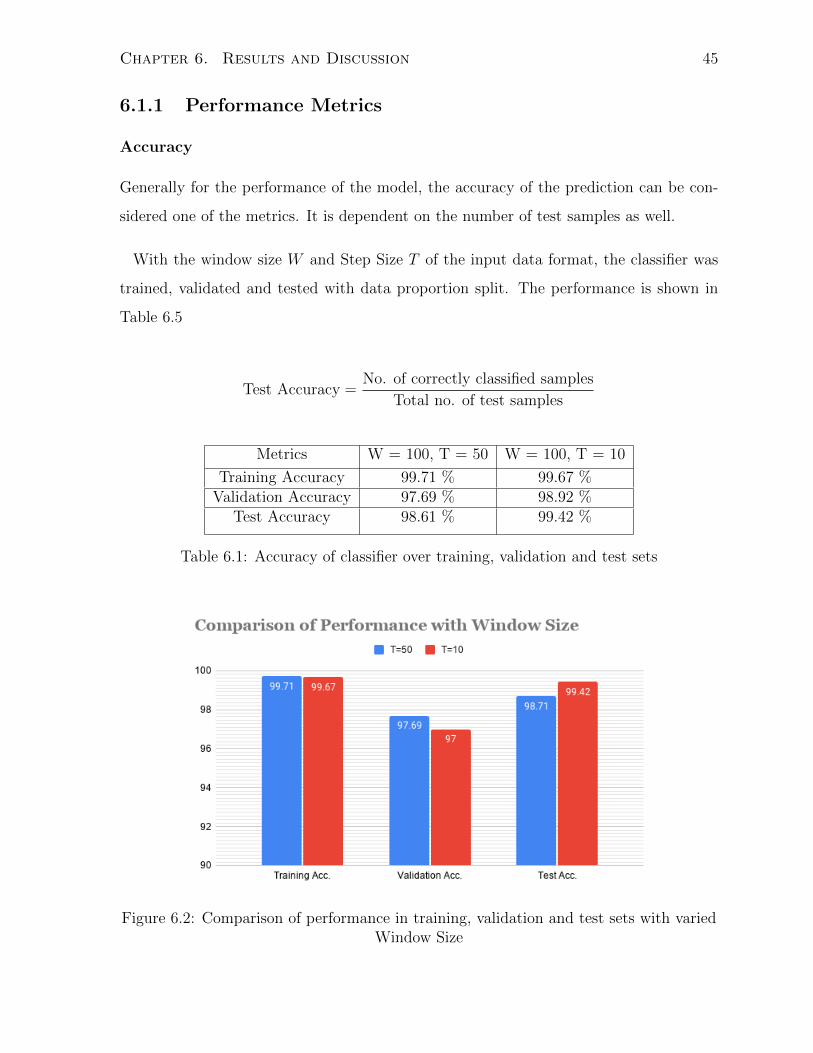
Chapter 6. Results and Discussion 45
6.1.1 Performance Metrics
Accuracy
Generally for the performance of the model, the accuracy of the prediction can be con-
sidered one of the metrics. It is dependent on the number of test samples as well.
With the window size W and Step Size T of the input data format, the classifier was
trained, validated and tested with data proportion split. The performance is shown in
Table 6.5
Test Accuracy =No. of correctly classified samples
Total no. of test samples
Metrics W = 100, T = 50 W = 100, T = 10
Training Accuracy 99.71 % 99.67 %Validation Accuracy 97.69 % 98.92 %
Test Accuracy 98.61 % 99.42 %
Table 6.1: Accuracy of classifier over training, validation and test sets
Figure 6.2: Comparison of performance in training, validation and test sets with variedWindow Size
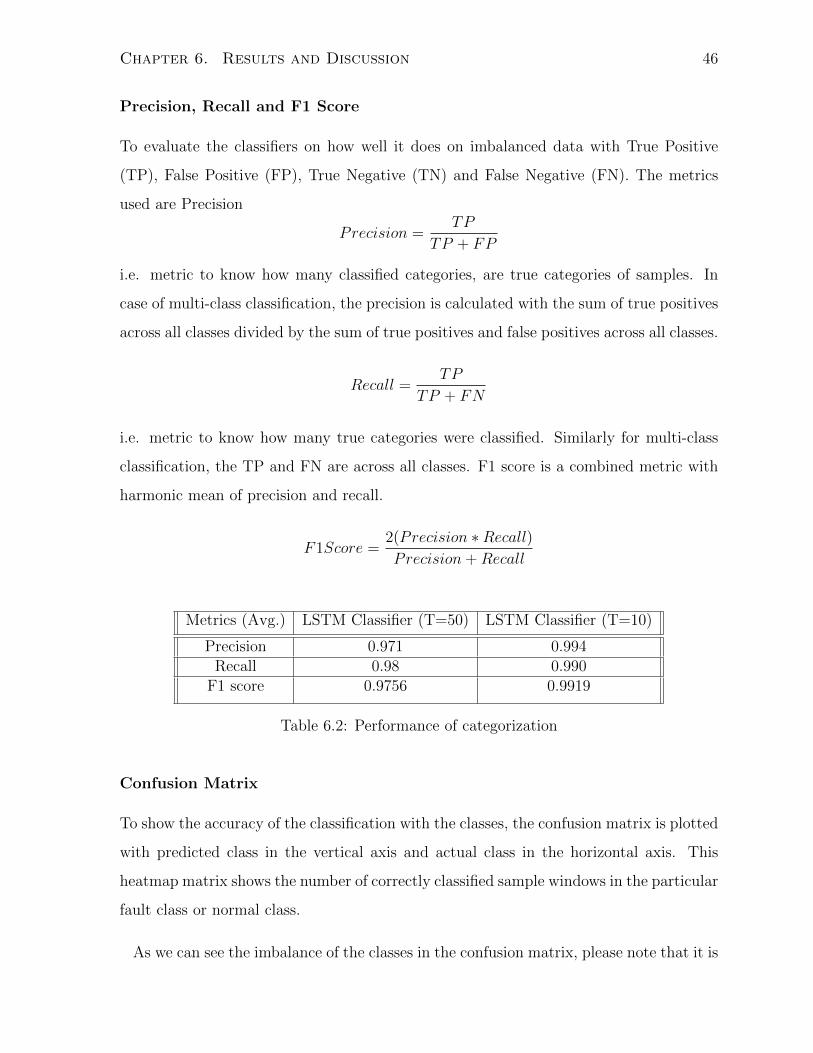
Chapter 6. Results and Discussion 46
Precision, Recall and F1 Score
To evaluate the classifiers on how well it does on imbalanced data with True Positive
(TP), False Positive (FP), True Negative (TN) and False Negative (FN). The metrics
used are Precision
Precision =TP
TP + FP
i.e. metric to know how many classified categories, are true categories of samples. In
case of multi-class classification, the precision is calculated with the sum of true positives
across all classes divided by the sum of true positives and false positives across all classes.
Recall =TP
TP + FN
i.e. metric to know how many true categories were classified. Similarly for multi-class
classification, the TP and FN are across all classes. F1 score is a combined metric with
harmonic mean of precision and recall.
F1Score =2(Precision ∗Recall)Precision+Recall
Metrics (Avg.) LSTM Classifier (T=50) LSTM Classifier (T=10)
Precision 0.971 0.994Recall 0.98 0.990
F1 score 0.9756 0.9919
Table 6.2: Performance of categorization
Confusion Matrix
To show the accuracy of the classification with the classes, the confusion matrix is plotted
with predicted class in the vertical axis and actual class in the horizontal axis. This
heatmap matrix shows the number of correctly classified sample windows in the particular
fault class or normal class.
As we can see the imbalance of the classes in the confusion matrix, please note that it is
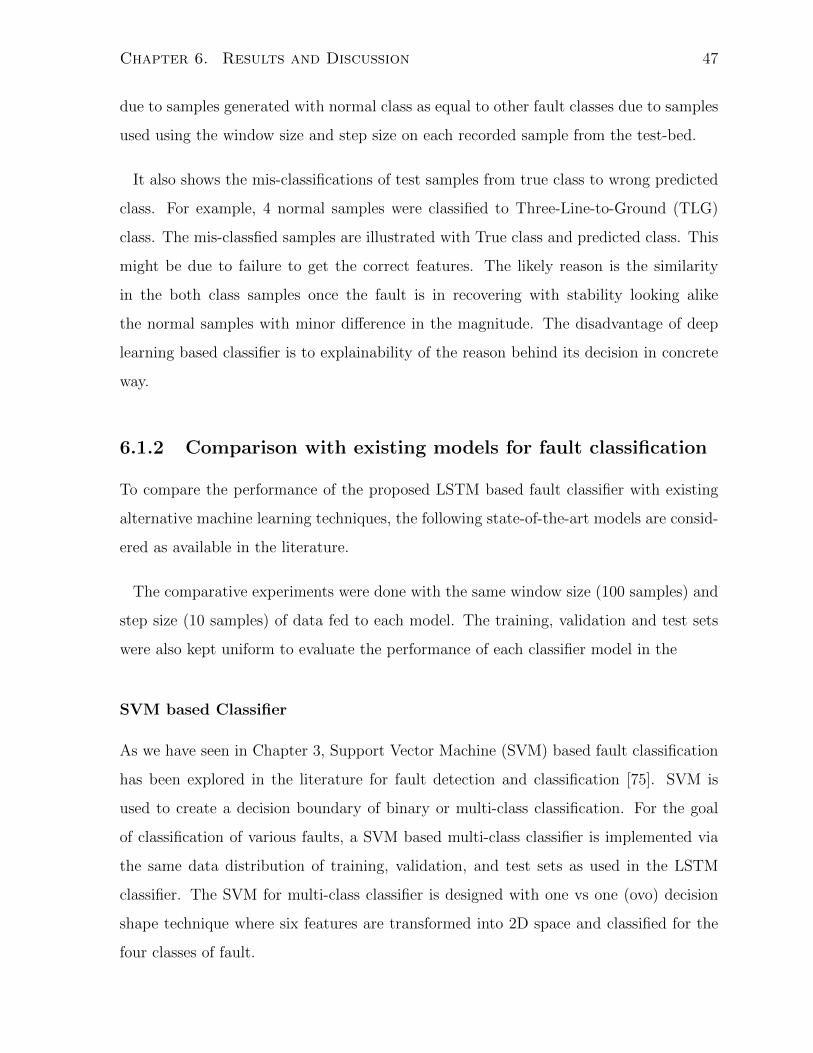
Chapter 6. Results and Discussion 47
due to samples generated with normal class as equal to other fault classes due to samples
used using the window size and step size on each recorded sample from the test-bed.
It also shows the mis-classifications of test samples from true class to wrong predicted
class. For example, 4 normal samples were classified to Three-Line-to-Ground (TLG)
class. The mis-classfied samples are illustrated with True class and predicted class. This
might be due to failure to get the correct features. The likely reason is the similarity
in the both class samples once the fault is in recovering with stability looking alike
the normal samples with minor difference in the magnitude. The disadvantage of deep
learning based classifier is to explainability of the reason behind its decision in concrete
way.
6.1.2 Comparison with existing models for fault classification
To compare the performance of the proposed LSTM based fault classifier with existing
alternative machine learning techniques, the following state-of-the-art models are consid-
ered as available in the literature.
The comparative experiments were done with the same window size (100 samples) and
step size (10 samples) of data fed to each model. The training, validation and test sets
were also kept uniform to evaluate the performance of each classifier model in the
SVM based Classifier
As we have seen in Chapter 3, Support Vector Machine (SVM) based fault classification
has been explored in the literature for fault detection and classification [75]. SVM is
used to create a decision boundary of binary or multi-class classification. For the goal
of classification of various faults, a SVM based multi-class classifier is implemented via
the same data distribution of training, validation, and test sets as used in the LSTM
classifier. The SVM for multi-class classifier is designed with one vs one (ovo) decision
shape technique where six features are transformed into 2D space and classified for the
four classes of fault.
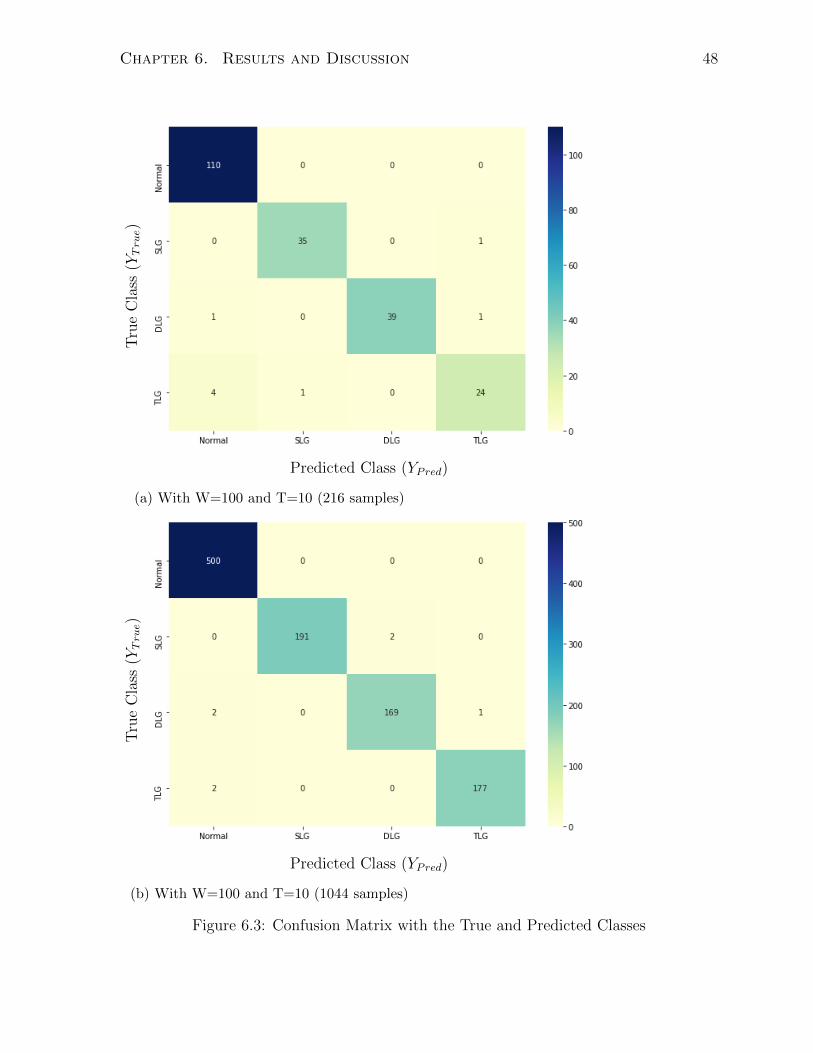
Chapter 6. Results and Discussion 48
Predicted Class (YPred)
Tru
eC
lass
(YTrue)
(a) With W=100 and T=10 (216 samples)
Predicted Class (YPred)
Tru
eC
lass
(YTrue)
(b) With W=100 and T=10 (1044 samples)
Figure 6.3: Confusion Matrix with the True and Predicted Classes
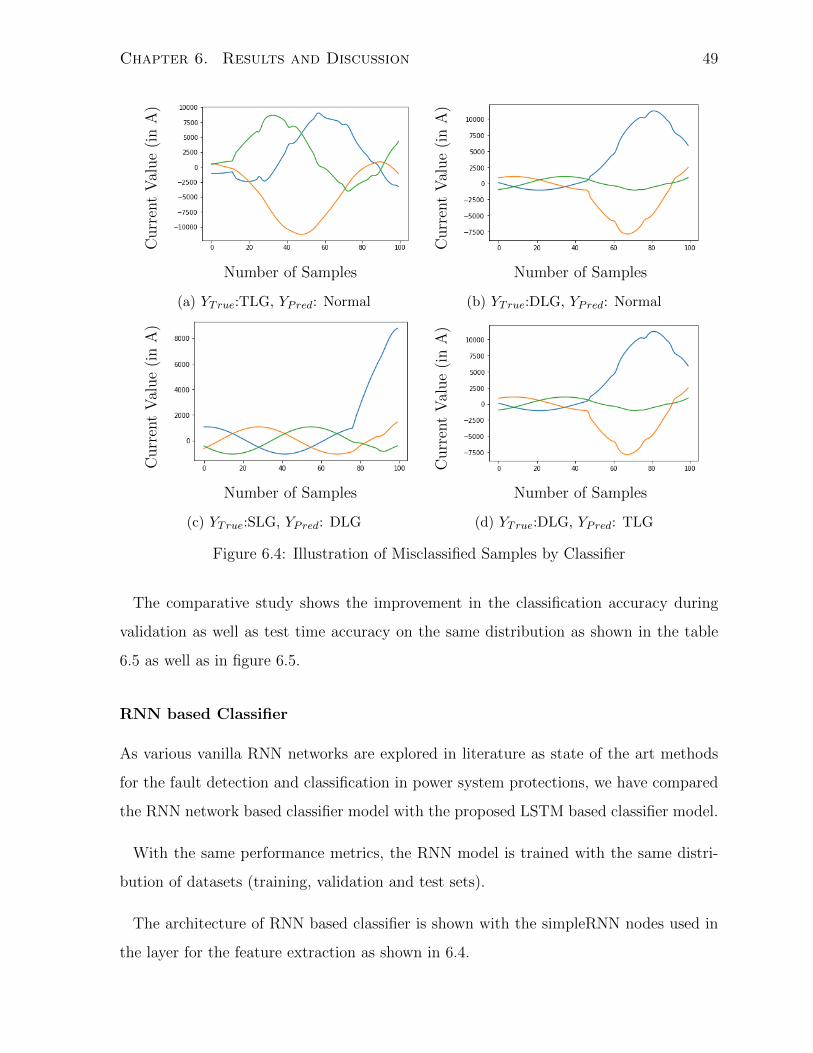
Chapter 6. Results and Discussion 49
Number of Samples
Curr
ent
Val
ue
(in
A)
(a) YTrue:TLG, YPred: Normal
Number of Samples
Curr
ent
Val
ue
(in
A)
(b) YTrue:DLG, YPred: Normal
Number of Samples
Curr
ent
Val
ue
(in
A)
(c) YTrue:SLG, YPred: DLG
Number of Samples
Curr
ent
Val
ue
(in
A)
(d) YTrue:DLG, YPred: TLG
Figure 6.4: Illustration of Misclassified Samples by Classifier
The comparative study shows the improvement in the classification accuracy during
validation as well as test time accuracy on the same distribution as shown in the table
6.5 as well as in figure 6.5.
RNN based Classifier
As various vanilla RNN networks are explored in literature as state of the art methods
for the fault detection and classification in power system protections, we have compared
the RNN network based classifier model with the proposed LSTM based classifier model.
With the same performance metrics, the RNN model is trained with the same distri-
bution of datasets (training, validation and test sets).
The architecture of RNN based classifier is shown with the simpleRNN nodes used in
the layer for the feature extraction as shown in 6.4.
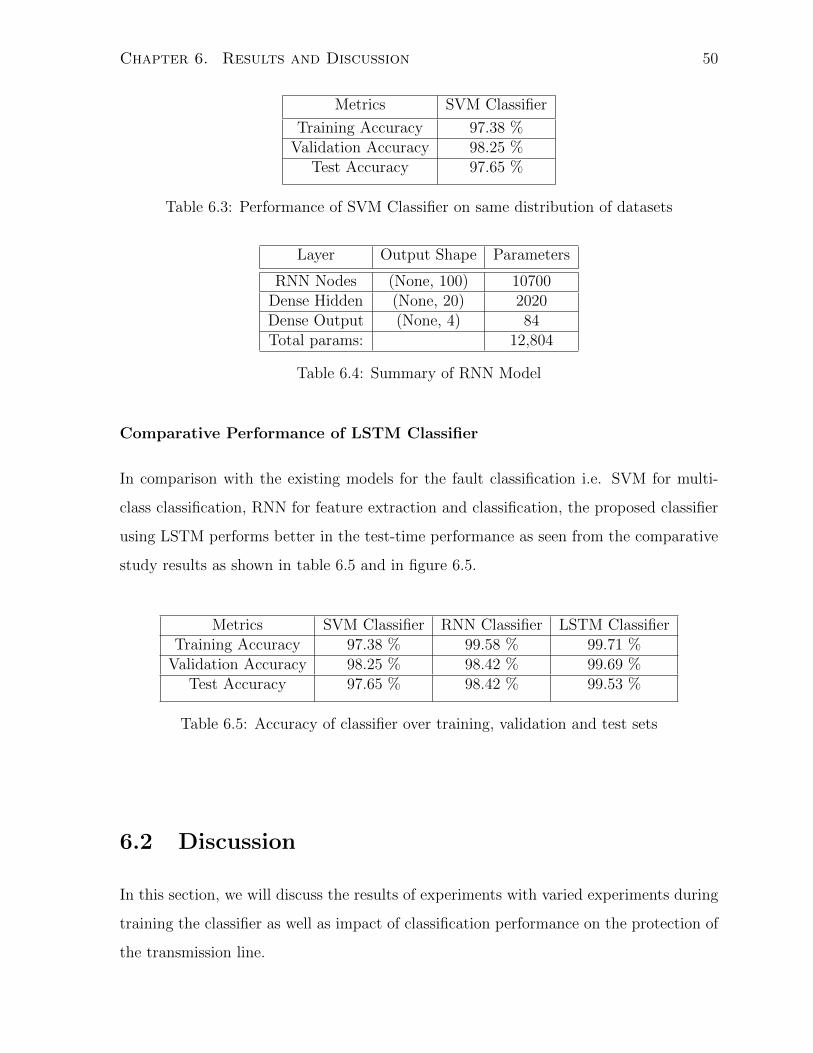
Chapter 6. Results and Discussion 50
Metrics SVM Classifier
Training Accuracy 97.38 %Validation Accuracy 98.25 %
Test Accuracy 97.65 %
Table 6.3: Performance of SVM Classifier on same distribution of datasets
Layer Output Shape Parameters
RNN Nodes (None, 100) 10700Dense Hidden (None, 20) 2020Dense Output (None, 4) 84Total params: 12,804
Table 6.4: Summary of RNN Model
Comparative Performance of LSTM Classifier
In comparison with the existing models for the fault classification i.e. SVM for multi-
class classification, RNN for feature extraction and classification, the proposed classifier
using LSTM performs better in the test-time performance as seen from the comparative
study results as shown in table 6.5 and in figure 6.5.
Metrics SVM Classifier RNN Classifier LSTM ClassifierTraining Accuracy 97.38 % 99.58 % 99.71 %
Validation Accuracy 98.25 % 98.42 % 99.69 %Test Accuracy 97.65 % 98.42 % 99.53 %
Table 6.5: Accuracy of classifier over training, validation and test sets
6.2 Discussion
In this section, we will discuss the results of experiments with varied experiments during
training the classifier as well as impact of classification performance on the protection of
the transmission line.
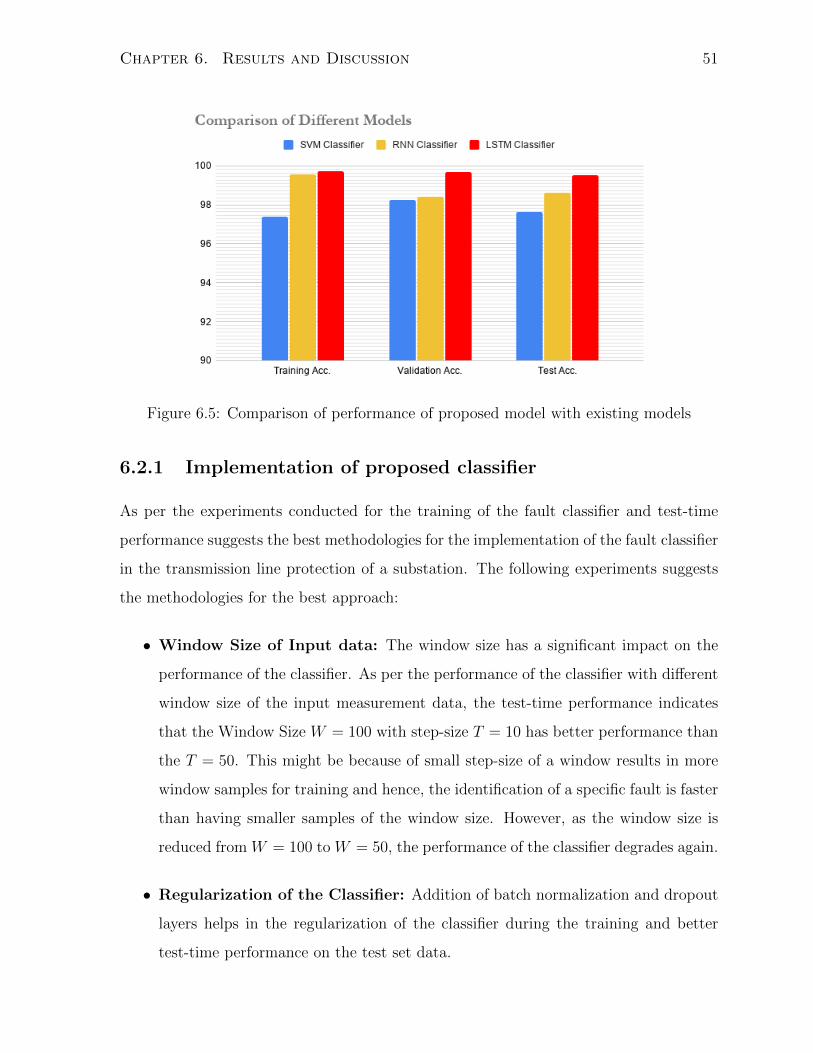
Chapter 6. Results and Discussion 51
Figure 6.5: Comparison of performance of proposed model with existing models
6.2.1 Implementation of proposed classifier
As per the experiments conducted for the training of the fault classifier and test-time
performance suggests the best methodologies for the implementation of the fault classifier
in the transmission line protection of a substation. The following experiments suggests
the methodologies for the best approach:
• Window Size of Input data: The window size has a significant impact on the
performance of the classifier. As per the performance of the classifier with different
window size of the input measurement data, the test-time performance indicates
that the Window Size W = 100 with step-size T = 10 has better performance than
the T = 50. This might be because of small step-size of a window results in more
window samples for training and hence, the identification of a specific fault is faster
than having smaller samples of the window size. However, as the window size is
reduced from W = 100 to W = 50, the performance of the classifier degrades again.
• Regularization of the Classifier: Addition of batch normalization and dropout
layers helps in the regularization of the classifier during the training and better
test-time performance on the test set data.
Chapter 6. Results and Discussion 52
• Performance of fault classifier on the multi-class classification indicates its potential
to classify the additional fault types in the transmission line as those labelled data
are included in the training of the classifier.
• With help of available recorded data of the fault events, the classifier can be trained
for specific transmission line offline and the saved model can be loaded in the relay
algorithm for the classification of the fault as illustrated in figure 6.1.
The potential of the proposed classifier and its performance suggests the classification
of the transmission line can be achieved with the available history of previous fault events.
The LSTM based classifier can be easily extended to the various kinds of the faults in
the transmission line if those labelled dataset can be obtained. Similarly, the potential
of a classifier suggests its performance in the distribution systems as well if it’s trained
on the recorded fault event datasets to classify the different kinds of faults with available
data.
6.2.2 Improved Performance of Proposed Classifier
Extending the performance of the fault classification task via sequence learning models
utilizing the temporal information, suggested the potential of LSTM based classifiers
in comparison to existing RNN models as well as classical ML techniques i.e. Support
Vector Machines for multi-class classification.
Even with the same distribution of datasets, the improved test-time performance is
credited to the extended functionality of the LSTM model to control memory while
learning the training dataset of temporal information, as explained in the Chapter 4.
The increased controlling weights in a LSTM cell improves the performance however it
is also increasing the number of parameters to be trained in the classifier.
The proposed architecture to learn the feature of each phase of current and voltage
signals, promises the implementation of this classifier for the purpose of fault diagnosis
(in off-line mode) in substation where the accuracy as well as classification metrics are
promising. Additionally, with longer training with past history datasets, the classifier

Chapter 6. Results and Discussion 53
can achieve even better test accuracy and classification accuracy making it a candi-
date solution for the real-time fault detection/classification in the protection system of
transmission line, provided the pragmatic assumption of high computing devices in the
substation of the future.
Chapter 7
Conclusion and Future Work
This chapter concludes the thesis with the summary of work done in the above chapters.
Additionally, it provides the direction of the work in the future in regards to the proposed
classifier and its robustness analysis.
7.1 Conclusion
With focus on developing a fault classifier for the protection system of a transmission line
using machine learning techniques, the temporal information of the current and voltage
signal are utilized to build a LSTM based classifier. The previous work in fault detection
and classification is explained in the Chapter 2 and Chapter 3, where the importance
of research work with machine learning based techniques especially sequence learning
models i.e. RNNs and LSTMs are highlighted.
The proposed classifier brought the improvements in performance in the fault classifi-
cation task from the measurement signals obtained from the bench-marking testbed of
the transmission system.
In conclusion, the following work is presented in this work.
• In Chapter 4, the background on LSTM models with its effectiveness in feature
54
Chapter 7. Conclusion and Future Work 55
extraction from the temporal features of the measurement signals from CT and
VTs and improvement of the architecture is illustrated.
• In chapter 5, the PSRC D6 benchmarking testbed is explained where the proposed
classifier is tested with the current and voltage measurement data of the trans-
mission system. The input data pre-processing and training methodologies are
explained with the setting up of the experiments.
• Results obtained in Chapter 6, for the classification task of the fault diagnosis is
explained with firstly, with comparison of window size, step size as well as impact
of regularization controllers on its test-time performance. Secondly, the proposed
LSTM based classifier has shown improved performance in comparison with existing
state of the art techniques e.g. RNN and SVM based classifiers trained on the same
data.
The proposed fault diagnosis and the LSTM based proposed classifier suggests the
effectiveness of its usage in the IEC61850 based automated substations where with abun-
dance of the sampled measurement data suggests the machine learning techniques with
temporal information extractions are feasible and effective in the test-time performances.
7.2 Future Work
As the fault classifier is used in the test-time performance in the substation for the
transmission line protection, there is a need to evaluate the robustness of the classifier
with various scenarios. Therefore, the future work includes:
• Robustness analysis of the classifier from the various conditions in the transmission
system as well as attack-defence paradigms.
• With the vulnerabilities of the IEC61850 based communication infrastructure in
the substations, the security evaluation of the Sampled Values (SV) measurements
using IEC 62351 standards needs to be evaluated to ensure the injected input data
are secure.

Chapter 7. Conclusion and Future Work 56
• Since machine learning based fault classifier, similar to other existing fault detec-
tion and classification approaches, are completely dependent on the measurement
data from CTs and VTs, the adversarial data attacks to classifier input can utilize
this vulnerability for the mis-classification of the classifier during normal and fault
scenarios.
.
These future work directions can be pursued to check the robustness of the classifier
model with respect to training data, input test data attacks on the classifier performance.
Bibliography
[1] C. Olah, “Understanding long short term memory networks,”
https://colah.github.io/posts/2015-08-Understanding-LSTMs/, 2015, accessed:
2020-07-30.
[2] A. A. Jahromi, A. Kemmeugne, D. Kundur, and A. Haddadi, “Cyber-Physical At-
tacks Targeting Communication-Assisted Protection Schemes,” IEEE Transactions
on Power Systems, vol. 35, no. 1, pp. 440–450, Jan. 2020, conference Name: IEEE
Transactions on Power Systems.
[3] N. Tleis, Power systems modelling and fault analysis: theory and practice. Elsevier,
2007.
[4] M. Singh, B. Panigrahi, and R. Maheshwari, “Transmission line fault detection and
classification,” in 2011 International Conference on Emerging Trends in Electrical
and Computer Technology. IEEE, 2011, pp. 15–22.
[5] I. Farhat, “Fault detection, classification and location in transmission line systems
using neural networks,” Ph.D. dissertation, Concordia University, 2003.
[6] Z. Xiangjun, W. Yuanyuan, and X. Yao, “Faults detection for power systems,” Fault
Detection, p. 71, 2010.
[7] A. G. Phadke, M. Ibrahim, and T. Hlibka, “Fundamental basis for distance relay-
ing with symmetrical components,” IEEE Transactions on Power Apparatus and
Systems, vol. 96, no. 2, pp. 635–646, 1977.
57
Bibliography 58
[8] S. A. Aleem, N. Shahid, and I. H. Naqvi, “Methodologies in power systems fault
detection and diagnosis,” Energy Systems, vol. 6, no. 1, pp. 85–108, Mar. 2015.
[Online]. Available: https://doi.org/10.1007/s12667-014-0129-1
[9] M. Jamil, S. K. Sharma, and R. Singh, “Fault detection and classification in
electrical power transmission system using artificial neural network,” SpringerPlus,
vol. 4, no. 1, p. 334, Jul. 2015. [Online]. Available: https://doi.org/10.1186/s40064-
015-1080-x
[10] O. Dag and C. Ucak, “Fault classification for power distribution systems via a com-
bined wavelet-neural approach,” in 2004 International Conference on Power System
Technology, 2004. PowerCon 2004., vol. 2, 2004, pp. 1309–1314 Vol.2.
[11] K. Chen, C. Huang, and J. He, “Fault detection, classification and location for
transmission lines and distribution systems: a review on the methods,” High Voltage,
vol. 1, no. 1, pp. 25–33, 2016.
[12] A. G. Phadke and J. S. Thorp, Computer Relaying for Power Systems. USA: John
Wiley Sons, Inc., 2009.
[13] B. Kasztenny, M. Mynam, N. Fischer, and C. Fortescue, “Sequence component
applications in protective relays - advantages, limitations, and solutions,” 03 2019.
[14] A. Prasad, J. Belwin Edward, and K. Ravi, “A review on fault classification
methodologies in power transmission systems: Part—I,” Journal of Electrical
Systems and Information Technology, vol. 5, no. 1, pp. 48–60, May 2018. [Online].
Available: http://www.sciencedirect.com/science/article/pii/S2314717217300065
[15] O. A. S. Youssef, “Fault classification based on wavelet transforms,” in 2001
IEEE/PES Transmission and Distribution Conference and Exposition. Developing
New Perspectives (Cat. No.01CH37294), vol. 1, 2001, pp. 531–536 vol.1.
[16] M. Sushama, G. T. R. Das, and A. J. Laxmi, “Detection of high-impedance faults
in transmission lines using wavelet transform,” ARPN Journal of Engineering and
Applied Sciences, vol. 4, no. 3, pp. 6–12, 2009.
Bibliography 59
[17] F. B. Costa, B. A. Souza, and N. S. D. Brito, “Real-time classification of transmission
line faults based on maximal overlap discrete wavelet transform,” in PES T D 2012,
2012, pp. 1–8.
[18] A. D. Kumar and S. R. Sagar, “Discrimination of faults and their location identi-
fication on a high voltage transmission lines using the discrete wavelet transform,”
International Journal of Education and Applied Research, vol. 4, no. 1, pp. 107–111,
2014.
[19] P. Jose and V. Bindu, “Wavelet-based transmission line fault analysis,” International
Journal of Engineering and Innovative Technology (IJEIT) Volume, vol. 3, 2014.
[20] A. Ferrero, S. Sangiovanni, and E. Zappitelli, “A fuzzy-set approach to fault-type
identification in digital relaying,” IEEE Transactions on Power Delivery, vol. 10,
no. 1, pp. 169–175, 1995.
[21] P. Kumar, M. Jamil, M. S. Thomas, and Moinuddin, “Fuzzy approach to fault
classification for transmission line protection,” in Proceedings of IEEE. IEEE Region
10 Conference. TENCON 99. ’Multimedia Technology for Asia-Pacific Information
Infrastructure’ (Cat. No.99CH37030), vol. 2, 1999, pp. 1046–1050 vol.2.
[22] C. Cecati and K. Razi, “Fuzzy-logic-based high accurate fault classification of single
and double-circuit power transmission lines,” in International Symposium on Power
Electronics Power Electronics, Electrical Drives, Automation and Motion, 2012, pp.
883–889.
[23] S. R. Samantaray, “A systematic fuzzy rule based approach for
fault classification in transmission lines,” Applied Soft Comput-
ing, vol. 13, no. 2, pp. 928 – 938, 2013. [Online]. Available:
http://www.sciencedirect.com/science/article/pii/S1568494612004309
[24] T. Dalstein and B. Kulicke, “Neural network approach to fault classification for high
speed protective relaying,” IEEE Transactions on Power Delivery, vol. 10, no. 2, pp.
1002–1011, Apr. 1995, conference Name: IEEE Transactions on Power Delivery.
Bibliography 60
[25] M. Oleskovicz, D. V. Coury, and R. K. Aggarwal, “A complete scheme for fault
detection, classification and location in transmission lines using neural networks,”
in 2001 Seventh International Conference on Developments in Power System Pro-
tection (IEE), 2001, pp. 335–338.
[26] M. Sanaye-Pasand and H. Khorashadi-Zadeh, “Transmission line fault detection &
phase selection using ann,” in International Conference on Power Systems Tran-
sients, 2003, pp. 1–6.
[27] A. Jain, A. Thoke, and R. Patel, “Fault classification of double circuit transmission
line using artificial neural network,” International Journal of Electrical Systems Sci-
ence and Engineering, vol. 1, no. 4, pp. 750–755, 2008.
[28] A. Yadav and Y. Dash, “An Overview of Transmission Line Protection
by Artificial Neural Network: Fault Detection, Fault Classification, Fault
Location, and Fault Direction Discrimination,” Dec. 2014, iSSN: 1687-7594
Pages: e230382 Publisher: Hindawi Volume: 2014. [Online]. Available:
https://www.hindawi.com/journals/aans/2014/230382/
[29] N. Saravanan and A. Rathinam, “A comparitive study on ann based fault location
and classification technique for double circuit transmission line,” in 2012 Fourth
International Conference on Computational Intelligence and Communication Net-
works, 2012, pp. 824–830.
[30] Huisheng Wang and W. W. L. Keerthipala, “Fuzzy-neuro approach to fault clas-
sification for transmission line protection,” IEEE Transactions on Power Delivery,
vol. 13, no. 4, pp. 1093–1104, 1998.
[31] B. Das and J. V. Reddy, “Fuzzy-logic-based fault classification scheme for digital
distance protection,” IEEE Transactions on Power Delivery, vol. 20, no. 2, pp. 609–
616, 2005.
[32] A. A. Elbaset and T. Hiyama, “Fault detection and classification in transmission
lines using anfis,” IEEJ Transactions on Industry Applications, vol. 129, no. 7, pp.
Bibliography 61
705–713, 2009.
[33] T. S. Kamel, M. A. M. Hassan, and A. E. Morshedy, “Advanced distance protection
scheme for long transmission lines in electric power systems using multiple classified
anfis networks,” in 2009 Fifth International Conference on Soft Computing, Com-
puting with Words and Perceptions in System Analysis, Decision and Control, 2009,
pp. 1–5.
[34] E. S. M. Tag Eldin, “Fault location for a series compensated transmission line based
on wavelet transform and an adaptive neuro-fuzzy inference system,” in Proceedings
of the 2010 Electric Power Quality and Supply Reliability Conference, 2010, pp.
229–236.
[35] F. B. Costa, K. M. Silva, B. A. Souza, K. M. C. Dantas, and N. S. D. Brito,
“A method for fault classification in transmission lines based on ann and wavelet
coefficients energy,” in The 2006 IEEE International Joint Conference on Neural
Network Proceedings, 2006, pp. 3700–3705.
[36] A. Abdollahi and S. Seyedtabaii, “Transmission line fault location estimation by
fourier wavelet transforms using ann,” in 2010 4th International Power Engineering
and Optimization Conference (PEOCO), 2010, pp. 573–578.
[37] S. Jana, S. Nath, and A. Dasgupta, “Transmission line fault classification based on
wavelet entropy and neural network,” 01 2012.
[38] P. D. Raval and A. S. Pandya, “Accurate fault classification in series compensated
multi-terminal extra high voltage transmission line using probabilistic neural net-
work,” in 2016 International Conference on Electrical, Electronics, and Optimization
Techniques (ICEEOT), 2016, pp. 1550–1554.
[39] O. A. S. Youssef, “Combined fuzzy-logic wavelet-based fault classification technique
for power system relaying,” IEEE Transactions on Power Delivery, vol. 19, no. 2,
pp. 582–589, 2004.
Bibliography 62
[40] M. J. Reddy and D. K. Mohanta, “A wavelet-fuzzy combined approach for
classification and location of transmission line faults,” International Journal of
Electrical Power & Energy Systems, vol. 29, no. 9, pp. 669 – 678, 2007. [Online].
Available: http://www.sciencedirect.com/science/article/pii/S0142061507000476
[41] A. Ngaopitakkul, C. Apisit, S. Bunjongjit, and C. Pothisarn, “Identifying
types of simultaneous fault in transmission line using discrete wavelet transform
and fuzzy logic algorithm,” International Journal of Innovative Computing,
Information and Control, vol. 9, no. 7, pp. 2701–2712, 2013, cited By
11. [Online]. Available: https://www.scopus.com/inward/record.uri?eid=2-s2.0-
84880064345partnerID=40md5=b87d0ab1ff4623a7ae0c1b3d2b9876b4
[42] Y. Sekine, Y. Akimoto, M. Kunugi, C. Fukui, and S. Fukui, “Fault diagnosis of
power systems,” Proceedings of the IEEE, vol. 80, no. 5, pp. 673–683, May 1992,
conference Name: Proceedings of the IEEE.
[43] C. Nan, F. Khan, and M. T. Iqbal, “Abnormal Process Condition Prediction (Fault
Diagnosis) Using G2 Expert System,” in 2007 Canadian Conference on Electrical
and Computer Engineering, Apr. 2007, pp. 1507–1510, iSSN: 0840-7789.
[44] X. Xu and J. Peters, “Rough set methods in power system fault classification,” in
IEEE CCECE2002. Canadian Conference on Electrical and Computer Engineering.
Conference Proceedings (Cat. No.02CH37373), vol. 1, May 2002, pp. 100–105 vol.1,
iSSN: 0840-7789.
[45] S. S. S. Rawat, V. A. Polavarapu, V. Kumar, E. Aruna, and V. Sumathi, “Anomaly
detection in smart grid using rough set theory and K cross validation,” in 2014 In-
ternational Conference on Circuits, Power and Computing Technologies [ICCPCT-
2014], Mar. 2014, pp. 479–483.
[46] Z. Yongli, H. Limin, and L. Jinling, “Bayesian networks-based approach for power
systems fault diagnosis,” IEEE Transactions on Power Delivery, vol. 21, no. 2, pp.
634–639, Apr. 2006, conference Name: IEEE Transactions on Power Delivery.
Bibliography 63
[47] A. Ashouri, A. Jalilvand, R. Noroozian, and A. Bagheri, “A new approach for fault
detection in digital relays-based power system using Petri nets,” in 2010 Joint Inter-
national Conference on Power Electronics, Drives and Energy Systems 2010 Power
India, Dec. 2010, pp. 1–8.
[48] S. Bhattacharya, “Fault detection on a ring-main type power system network using
artificial neural network and wavelet entropy method,” in Communication Automa-
tion International Conference on Computing, May 2015, pp. 1032–1037.
[49] W. Li, A. Monti, and F. Ponci, “Fault Detection and Classification in Medium
Voltage DC Shipboard Power Systems With Wavelets and Artificial Neural Net-
works,” IEEE Transactions on Instrumentation and Measurement, vol. 63, no. 11,
pp. 2651–2665, Nov. 2014, conference Name: IEEE Transactions on Instrumentation
and Measurement.
[50] S. U. Jan, Y.-D. Lee, J. Shin, and I. Koo, “Sensor fault classification based on
support vector machine and statistical time-domain features,” IEEE Access, vol. 5,
pp. 8682–8690, 2017.
[51] M. Bigdeli, M. Vakilian, and E. Rahimpour, “Transformer winding faults classifica-
tion based on transfer function analysis by support vector machine,” IET electric
power applications, vol. 6, no. 5, pp. 268–276, 2012.
[52] S. Zhang, Y. Wang, M. Liu, and Z. Bao, “Data-Based Line Trip Fault Prediction in
Power Systems Using LSTM Networks and SVM,” IEEE Access, vol. 6, pp. 7675–
7686, 2018.
[53] V. Malathi and N. S. Marimuthu, “Multi-class support vector machine approach for
fault classification in power transmission line,” in 2008 IEEE International Confer-
ence on Sustainable Energy Technologies, 2008, pp. 67–71.
[54] Zufeng Wang and Pu Zhao, “Fault location recognition in transmission lines based on
support vector machines,” in 2009 2nd IEEE International Conference on Computer
Science and Information Technology, 2009, pp. 401–404.
Bibliography 64
[55] O. A. S. Youssef, “An optimised fault classification technique based on support-
vector-machines,” in 2009 IEEE/PES Power Systems Conference and Exposition,
2009, pp. 1–8.
[56] M. Singh, B. K. Panigrahi, and R. P. Maheshwari, “Transmission line fault detec-
tion and classification,” in 2011 International Conference on Emerging Trends in
Electrical and Computer Technology, 2011, pp. 15–22.
[57] P. Tripathi, A. Sharma, G. N. Pillai, and I. Gupta, Accurate Fault Classification
and Section Identification Scheme in TCSC Compensated Transmission Line using
SVM.
[58] A. Jamehbozorg and S. M. Shahrtash, “A decision tree-based method for fault classi-
fication in double-circuit transmission lines,” IEEE Transactions on Power Delivery,
vol. 25, no. 4, pp. 2184–2189, 2010.
[59] Y. Wang, M. Liu, and Z. Bao, “Deep learning neural network for power system
fault diagnosis,” in 2016 35th Chinese control conference (CCC). IEEE, 2016, pp.
6678–6683.
[60] E. Rakhshani, I. Sariri, and K. Rouzbehi, “Application of data mining on fault
detection and prediction in boiler of power plant using artificial neural network,” in
2009 International Conference on Power Engineering, Energy and Electrical Drives,
March 2009, pp. 473–478.
[61] Y. Tao, J. Zheng, T. Wang, and Y. Hu, “A state and fault prediction method based
on rbf neural networks,” in 2016 IEEE Workshop on Advanced Robotics and its
Social Impacts (ARSO), July 2016, pp. 221–225.
[62] T. Nakashika, T. Takiguchi, and Y. Ariki, “Voice conversion using rnn pre-trained
by recurrent temporal restricted boltzmann machines,” IEEE/ACM Transactions
on Audio, Speech, and Language Processing, vol. 23, no. 3, pp. 580–587, 2015.
[63] V. Tran, K. Nguyen, and D. Bui, “A vietnamese language model based on recur-
rent neural network,” in 2016 Eighth International Conference on Knowledge and
Bibliography 65
Systems Engineering (KSE), 2016, pp. 274–278.
[64] C. Xu, G. Wang, X. Liu, D. Guo, and T. Liu, “Health status assessment and failure
prediction for hard drives with recurrent neural networks,” IEEE Transactions on
Computers, vol. 65, no. 11, pp. 3502–3508, 2016.
[65] A. I. Moustapha and R. R. Selmic, “Wireless sensor network modeling using modified
recurrent neural networks: Application to fault detection,” in 2007 IEEE Interna-
tional Conference on Networking, Sensing and Control, 2007, pp. 313–318.
[66] S. Hochreiter and J. Schmidhuber, “Long short-term memory,” Neural computation,
vol. 9, no. 8, pp. 1735–1780, 1997.
[67] T. de Bruin, K. Verbert, and R. Babuska, “Railway track circuit fault diagnosis using
recurrent neural networks,” IEEE Transactions on Neural Networks and Learning
Systems, vol. 28, no. 3, pp. 523–533, 2017.
[68] Z. Zhao, W. Chen, X. Wu, P. C. Chen, and J. Liu, “Lstm network: a deep learning
approach for short-term traffic forecast,” IET Intelligent Transport Systems, vol. 11,
no. 2, pp. 68–75, 2017.
[69] B. Bhattacharya and A. Sinha, “Intelligent Fault Analysis in Electrical Power
Grids,” in 2017 IEEE 29th International Conference on Tools with Artificial
Intelligence (ICTAI). Boston, MA: IEEE, Nov. 2017, pp. 985–990. [Online].
Available: https://ieeexplore.ieee.org/document/8372054/
[70] N. Srivastava, G. Hinton, A. Krizhevsky, I. Sutskever, and R. Salakhutdinov,
“Dropout: A simple way to prevent neural networks from overfitting,” Journal
of Machine Learning Research, vol. 15, no. 56, pp. 1929–1958, 2014. [Online].
Available: http://jmlr.org/papers/v15/srivastava14a.html
[71] S. Ioffe and C. Szegedy, “Batch normalization: Accelerating deep network training
by reducing internal covariate shift,” 2015.
Bibliography 66
[72] P. W. D6, “Power swing and out-of-step considerations on transmission lines,” Jul
2005.
[73] H. Gras, J. Mahseredjian, E. Rutovic, U. Karaagac, A. Haddadi, O. Saad, I. Kocar,
and A. El-Akoum, “A new hierarchical approach for modeling protection systems in
emt-type software,” in Proc. Int. Conf. Power Syst. Transients, 2017.
[74] “IEC 61850-9-2:2011 | IEC Webstore | cyber security, smart city, LVDC.” [Online].
Available: https://webstore.iec.ch/publication/6023
[75] B. Bhattacharya and A. Sinha, “Intelligent Fault Analysis in Electrical Power
Grids,” in 2017 IEEE 29th International Conference on Tools with Artificial
Intelligence (ICTAI). Boston, MA: IEEE, Nov. 2017, pp. 985–990. [Online].
Available: https://ieeexplore.ieee.org/document/8372054/
Related Documents