Decreased aEEG Continuity and Baseline Variability in the First 48 Hours of Life Associated With Poor Short-Term Outcome in Neonates Born Before 29 Weeks Gestation JENNIFER R. BOWEN, MARY PARADISIS, AND DHARMESH SHAH Department of Neonatology [J.R.B., M.P., D.S.], Royal North Shore Hospital, St Leonards, New South Wales 2065, Australia; Department of Neonatology [M.P.], Royal Prince Alfred Hospital, Camperdown, New South Wales 2050, Australia; Discipline of Obstetrics, Gynaecology and Neonatology [J.R.B., M.P.], Sydney Medical School, University of Sydney, New South Wales 2006, Australia ABSTRACT: Amplitude-integrated electroencephalography (aEEG) provides us with a method of assessing brain activity in critically ill neonates. In extremely premature neonates, the aEEG trace is pre- dominantly discontinuous, making it difficult to distinguish between a “normal” and “abnormal” trace. We measured aEEG activity in the first 48 h of life in neonates born before 29-wk gestation and used both visual and quantitative analysis of the aEEG data to assess differences in neonates with poor short-term outcome [death or peri/intraventricular hemorrhage (P/IVH)] compared with those who survived without P/IVH to identify features of an abnormal aEEG. On quantitative analysis, EEG continuity 80% at 10-V level was a sensitive and specific marker of poor short-term outcome. By using this marker, we identified 83% of neonates who died or developed grade 3 or 4 IVH and 60% of neonates who developed grades 1 or 2 IVH, with a positive predictive value for death or any IVH of 73% and a negative predictive value of 86%. Absence of sleep-wake cycling with baseline variability 2 V was the strongest predictor of outcome using visual analysis alone. (Pediatr Res 67: 538–544, 2010) E xtremely premature neonates have been provided with life-saving intensive care support in neonatal intensive care units (NICUs) for more than three decades. As survival rates for these infants have improved, an increasing emphasis is being placed on the quality of survival and long-term neurologic outcome in these vulnerable children (1,2). Cardiorespiratory monitoring is performed as standard care in neonatal units. Monitoring of brain function is more difficult. Electroencephalography (EEG) monitoring is a sensitive method for detection of brain injury in preterm infants (3– 6); however, the fragile nature of the extremely premature neonate makes it difficult to perform long-term monitoring using multichannel EEG recordings and is particularly difficult during the first few days of life when the neonate is often critically unwell. Limited channel amplitude-integrated EEG (aEEG) monitor- ing provides a simplified form of EEG monitoring that can be performed over prolonged periods of time in the NICU. In full-term neonates, aEEG monitoring is used in the first few days of life for neonates with encephalopathy or risk of seizures to help guide treatment and to assist with prognosis (7–15). The role of aEEG monitoring in the premature neonate is less clear. The EEG in the premature neonate is predominantly discontinuous, with bursts of activity alternating with periods of relative attenuation (6,16,17). The sleep-wake pattern seen in the aEEG recording of the mature full-term neonate is poorly developed in the preterm neonate. The general imma- turity of the EEG trace in the extremely premature neonate results in difficulty distinguishing between a “normal” and “abnormal” aEEG trace in these neonates. A number of studies have assessed aEEG recordings of premature neonates during the first few weeks of life (18 –23); however, few studies have assessed extremely premature neonates in the first 48 h after birth (24,25). Quantitative aEEG analysis has been performed in some recent studies, which have shown associations between quantitative measures and outcome (20,23,25). The aims of this study were to: 1. Identify features of a normal aEEG trace in the first 48 h of life in neonates 29-wk gestation who survived without peri/intraventricular hemorrhage (P/IVH), using visual analysis and quantitative measures. 2. Identify features of an abnormal aEEG trace, by assessing differences in the aEEG recordings between neonates who survived without P/IVH and those who died or developed P/IVH. METHODS Subjects. Neonates with gestational age 29 wk admitted to two tertiary level NICUs at Royal North Shore Hospital (RNSH) and Royal Prince Alfred Hospital (RPAH), Sydney, Australia, were recruited to this prospectively performed cohort study. The study was approved by the Human Research Ethics Committee and Clinical Trials Committee of both hospitals. Written informed parental consent was obtained for all neonates. Perinatal/neonatal factors recorded included the following: birth weight (BW), gestational age at birth (GA), sex, mode of delivery, cord blood pH, Apgar score at 1 and 5 min, mean blood pressure (BP), mechanical ventila- tion, and use of inotropes (dopamine or dobutamine), sedatives, and anticon- vulsants. Treatment with inotropes was at the discretion of the clinician but was generally given for low BP (mean BP 24 mm Hg) or clinical and cardiac ultrasound signs of poor perfusion [low cardiac output or low superior vena cava flow (26)]. Received July 31, 2009; accepted December 20, 2009. Correspondence: Jennifer Bowen, M.B.B.S., F.R.A.C.P., Department of Neonatology, Royal North Shore Hospital, St Leonards, New South Wales 2065, Australia; e-mail: [email protected] Abbreviations: aEEG, amplitude integrated electroencephalography; P/IVH, peri/intraventricular hemorrhage 0031-3998/10/6705-0538 PEDIATRIC RESEARCH Vol. 67, No. 5, 2010 Copyright © 2010 International Pediatric Research Foundation, Inc. Printed in U.S.A. 538

Welcome message from author
This document is posted to help you gain knowledge. Please leave a comment to let me know what you think about it! Share it to your friends and learn new things together.
Transcript
Decreased aEEG Continuity and Baseline Variability in the First48 Hours of Life Associated With Poor Short-Term Outcome in
Neonates Born Before 29 Weeks GestationJENNIFER R. BOWEN, MARY PARADISIS, AND DHARMESH SHAH
Department of Neonatology [J.R.B., M.P., D.S.], Royal North Shore Hospital, St Leonards, New South Wales 2065, Australia; Departmentof Neonatology [M.P.], Royal Prince Alfred Hospital, Camperdown, New South Wales 2050, Australia; Discipline of Obstetrics,Gynaecology and Neonatology [J.R.B., M.P.], Sydney Medical School, University of Sydney, New South Wales 2006, Australia
ABSTRACT: Amplitude-integrated electroencephalography (aEEG)provides us with a method of assessing brain activity in critically illneonates. In extremely premature neonates, the aEEG trace is pre-dominantly discontinuous, making it difficult to distinguish betweena “normal” and “abnormal” trace. We measured aEEG activity in thefirst 48 h of life in neonates born before 29-wk gestation and usedboth visual and quantitative analysis of the aEEG data to assessdifferences in neonates with poor short-term outcome [death orperi/intraventricular hemorrhage (P/IVH)] compared with those whosurvived without P/IVH to identify features of an abnormal aEEG.On quantitative analysis, EEG continuity �80% at 10-�V level was asensitive and specific marker of poor short-term outcome. By using thismarker, we identified 83% of neonates who died or developed grade 3or 4 IVH and 60% of neonates who developed grades 1 or 2 IVH, witha positive predictive value for death or any IVH of 73% and a negativepredictive value of 86%. Absence of sleep-wake cycling with baselinevariability �2 �V was the strongest predictor of outcome using visualanalysis alone. (Pediatr Res 67: 538–544, 2010)
Extremely premature neonates have been provided withlife-saving intensive care support in neonatal intensive
care units (NICUs) for more than three decades. As survivalrates for these infants have improved, an increasing emphasisis being placed on the quality of survival and long-termneurologic outcome in these vulnerable children (1,2).
Cardiorespiratory monitoring is performed as standard care inneonatal units. Monitoring of brain function is more difficult.Electroencephalography (EEG) monitoring is a sensitive methodfor detection of brain injury in preterm infants (3–6); however,the fragile nature of the extremely premature neonate makes itdifficult to perform long-term monitoring using multichannelEEG recordings and is particularly difficult during the first fewdays of life when the neonate is often critically unwell.
Limited channel amplitude-integrated EEG (aEEG) monitor-ing provides a simplified form of EEG monitoring that can beperformed over prolonged periods of time in the NICU. Infull-term neonates, aEEG monitoring is used in the first few daysof life for neonates with encephalopathy or risk of seizures tohelp guide treatment and to assist with prognosis (7–15).
The role of aEEG monitoring in the premature neonate isless clear. The EEG in the premature neonate is predominantlydiscontinuous, with bursts of activity alternating with periodsof relative attenuation (6,16,17). The sleep-wake pattern seenin the aEEG recording of the mature full-term neonate ispoorly developed in the preterm neonate. The general imma-turity of the EEG trace in the extremely premature neonateresults in difficulty distinguishing between a “normal” and“abnormal” aEEG trace in these neonates. A number ofstudies have assessed aEEG recordings of premature neonatesduring the first few weeks of life (18–23); however, fewstudies have assessed extremely premature neonates in thefirst 48 h after birth (24,25). Quantitative aEEG analysis hasbeen performed in some recent studies, which have shownassociations between quantitative measures and outcome(20,23,25).
The aims of this study were to:
1. Identify features of a normal aEEG trace in the first 48 h oflife in neonates �29-wk gestation who survived withoutperi/intraventricular hemorrhage (P/IVH), using visualanalysis and quantitative measures.
2. Identify features of an abnormal aEEG trace, by assessingdifferences in the aEEG recordings between neonates whosurvived without P/IVH and those who died or developedP/IVH.
METHODS
Subjects. Neonates with gestational age �29 wk admitted to two tertiarylevel NICUs at Royal North Shore Hospital (RNSH) and Royal Prince AlfredHospital (RPAH), Sydney, Australia, were recruited to this prospectivelyperformed cohort study. The study was approved by the Human ResearchEthics Committee and Clinical Trials Committee of both hospitals. Writteninformed parental consent was obtained for all neonates.
Perinatal/neonatal factors recorded included the following: birth weight(BW), gestational age at birth (GA), sex, mode of delivery, cord blood pH,Apgar score at 1 and 5 min, mean blood pressure (BP), mechanical ventila-tion, and use of inotropes (dopamine or dobutamine), sedatives, and anticon-vulsants. Treatment with inotropes was at the discretion of the clinician butwas generally given for low BP (mean BP �24 mm Hg) or clinical andcardiac ultrasound signs of poor perfusion [low cardiac output or low superiorvena cava flow (26)].
Received July 31, 2009; accepted December 20, 2009.Correspondence: Jennifer Bowen, M.B.B.S., F.R.A.C.P., Department of Neonatology,
Royal North Shore Hospital, St Leonards, New South Wales 2065, Australia; e-mail:[email protected]
Abbreviations: aEEG, amplitude integrated electroencephalography;P/IVH, peri/intraventricular hemorrhage
0031-3998/10/6705-0538PEDIATRIC RESEARCH
Vol. 67, No. 5, 2010
Copyright © 2010 International Pediatric Research Foundation, Inc.Printed in U.S.A.
538
Amplitude-integrated EEG. Two channel aEEG traces were recordedcontinuously from 10–48 h of life with the Brainz Instruments BRM2monitor (Brainz Instrument Ltd, New Zealand), using hydrogel electrodes,with standard electrode placement at C3, P3, C4, and P4 regions (International10–20 system). The transformation of the EEG signal into the amplitude-integrated trace has been described elsewhere (20,23). The EEG signal isfiltered, rectified, amplitude integrated, and compressed to display 1 h ofrecording per 6 cm. All aEEG recordings were obtained by two investigators(M.P. and D.S.).
aEEG recordings were analyzed for three 2-h epochs at 12–14 h, 24–26 h,and 46–48 h. Data were analyzed when there was at least 60 min ofsatisfactory recording within the 2-h epoch, with impedance �15 kOhm perelectrode pair. Cross-cerebral P3–P4 aEEG recordings were analyzed toprovide comparison with single-channel aEEG monitors.
Visual analysis of the aEEG. Each 2-h epoch was analyzed visually toassess background pattern and baseline variability, using criteria modifiedfrom Hellstrom-Westas et al. (27). Visual analysis was performed with theobserver blinded to quantitative analysis of the aEEG and outcome of theneonate. Periods of trace affected by seizures or obvious artifact wereexcluded from visual analysis. Background pattern was classified primarilyusing the aEEG minimum amplitude.
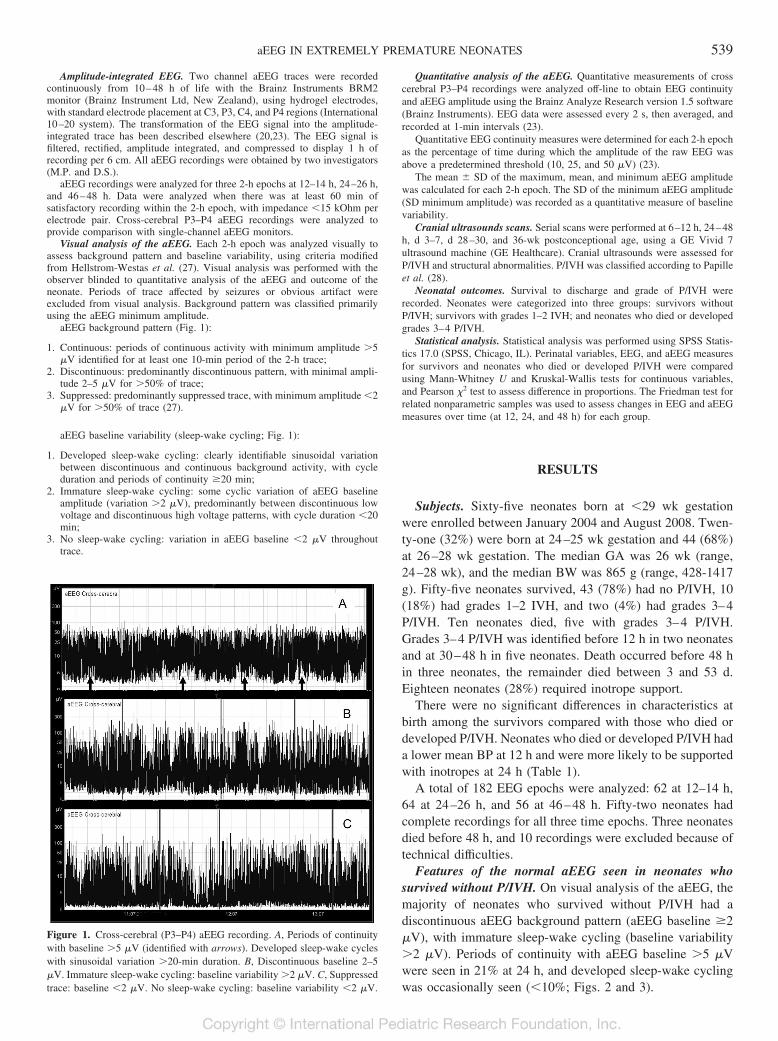
aEEG background pattern (Fig. 1):
1. Continuous: periods of continuous activity with minimum amplitude �5�V identified for at least one 10-min period of the 2-h trace;
2. Discontinuous: predominantly discontinuous pattern, with minimal ampli-tude 2–5 �V for �50% of trace;
3. Suppressed: predominantly suppressed trace, with minimum amplitude �2�V for �50% of trace (27).
aEEG baseline variability (sleep-wake cycling; Fig. 1):
1. Developed sleep-wake cycling: clearly identifiable sinusoidal variationbetween discontinuous and continuous background activity, with cycleduration and periods of continuity �20 min;
2. Immature sleep-wake cycling: some cyclic variation of aEEG baselineamplitude (variation �2 �V), predominantly between discontinuous lowvoltage and discontinuous high voltage patterns, with cycle duration �20min;
3. No sleep-wake cycling: variation in aEEG baseline �2 �V throughouttrace.
Quantitative analysis of the aEEG. Quantitative measurements of crosscerebral P3–P4 recordings were analyzed off-line to obtain EEG continuityand aEEG amplitude using the Brainz Analyze Research version 1.5 software(Brainz Instruments). EEG data were assessed every 2 s, then averaged, andrecorded at 1-min intervals (23).
Quantitative EEG continuity measures were determined for each 2-h epochas the percentage of time during which the amplitude of the raw EEG wasabove a predetermined threshold (10, 25, and 50 �V) (23).
The mean � SD of the maximum, mean, and minimum aEEG amplitudewas calculated for each 2-h epoch. The SD of the minimum aEEG amplitude(SD minimum amplitude) was recorded as a quantitative measure of baselinevariability.
Cranial ultrasounds scans. Serial scans were performed at 6–12 h, 24–48h, d 3–7, d 28–30, and 36-wk postconceptional age, using a GE Vivid 7ultrasound machine (GE Healthcare). Cranial ultrasounds were assessed forP/IVH and structural abnormalities. P/IVH was classified according to Papilleet al. (28).
Neonatal outcomes. Survival to discharge and grade of P/IVH wererecorded. Neonates were categorized into three groups: survivors withoutP/IVH; survivors with grades 1–2 IVH; and neonates who died or developedgrades 3–4 P/IVH.
Statistical analysis. Statistical analysis was performed using SPSS Statis-tics 17.0 (SPSS, Chicago, IL). Perinatal variables, EEG, and aEEG measuresfor survivors and neonates who died or developed P/IVH were comparedusing Mann-Whitney U and Kruskal-Wallis tests for continuous variables,and Pearson �2 test to assess difference in proportions. The Friedman test forrelated nonparametric samples was used to assess changes in EEG and aEEGmeasures over time (at 12, 24, and 48 h) for each group.
RESULTS
Subjects. Sixty-five neonates born at �29 wk gestationwere enrolled between January 2004 and August 2008. Twen-ty-one (32%) were born at 24–25 wk gestation and 44 (68%)at 26–28 wk gestation. The median GA was 26 wk (range,24–28 wk), and the median BW was 865 g (range, 428-1417g). Fifty-five neonates survived, 43 (78%) had no P/IVH, 10(18%) had grades 1–2 IVH, and two (4%) had grades 3–4P/IVH. Ten neonates died, five with grades 3–4 P/IVH.Grades 3–4 P/IVH was identified before 12 h in two neonatesand at 30–48 h in five neonates. Death occurred before 48 hin three neonates, the remainder died between 3 and 53 d.Eighteen neonates (28%) required inotrope support.
There were no significant differences in characteristics atbirth among the survivors compared with those who died ordeveloped P/IVH. Neonates who died or developed P/IVH hada lower mean BP at 12 h and were more likely to be supportedwith inotropes at 24 h (Table 1).
A total of 182 EEG epochs were analyzed: 62 at 12–14 h,64 at 24–26 h, and 56 at 46–48 h. Fifty-two neonates hadcomplete recordings for all three time epochs. Three neonatesdied before 48 h, and 10 recordings were excluded because oftechnical difficulties.
Features of the normal aEEG seen in neonates whosurvived without P/IVH. On visual analysis of the aEEG, themajority of neonates who survived without P/IVH had adiscontinuous aEEG background pattern (aEEG baseline �2�V), with immature sleep-wake cycling (baseline variability�2 �V). Periods of continuity with aEEG baseline �5 �Vwere seen in 21% at 24 h, and developed sleep-wake cyclingwas occasionally seen (�10%; Figs. 2 and 3).
Figure 1. Cross-cerebral (P3–P4) aEEG recording. A, Periods of continuitywith baseline �5 �V (identified with arrows). Developed sleep-wake cycleswith sinusoidal variation �20-min duration. B, Discontinuous baseline 2–5�V. Immature sleep-wake cycling: baseline variability �2 �V. C, Suppressedtrace: baseline �2 �V. No sleep-wake cycling: baseline variability �2 �V.
539aEEG IN EXTREMELY PREMATURE NEONATES
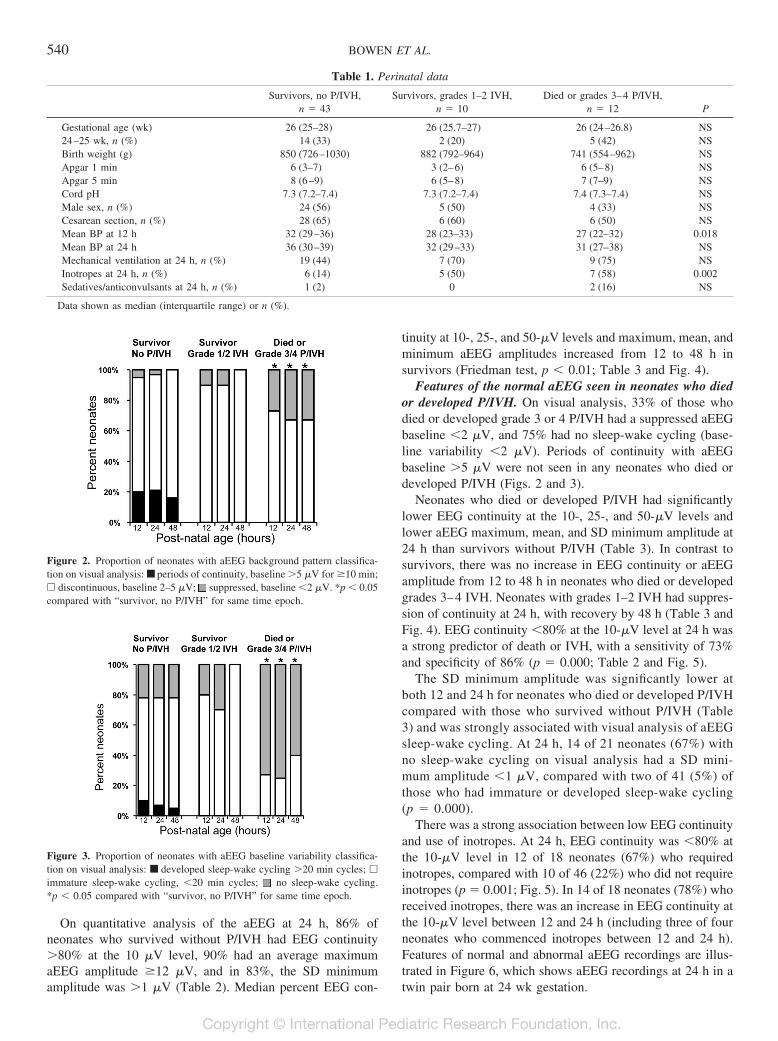
On quantitative analysis of the aEEG at 24 h, 86% ofneonates who survived without P/IVH had EEG continuity�80% at the 10 �V level, 90% had an average maximumaEEG amplitude �12 �V, and in 83%, the SD minimumamplitude was �1 �V (Table 2). Median percent EEG con-
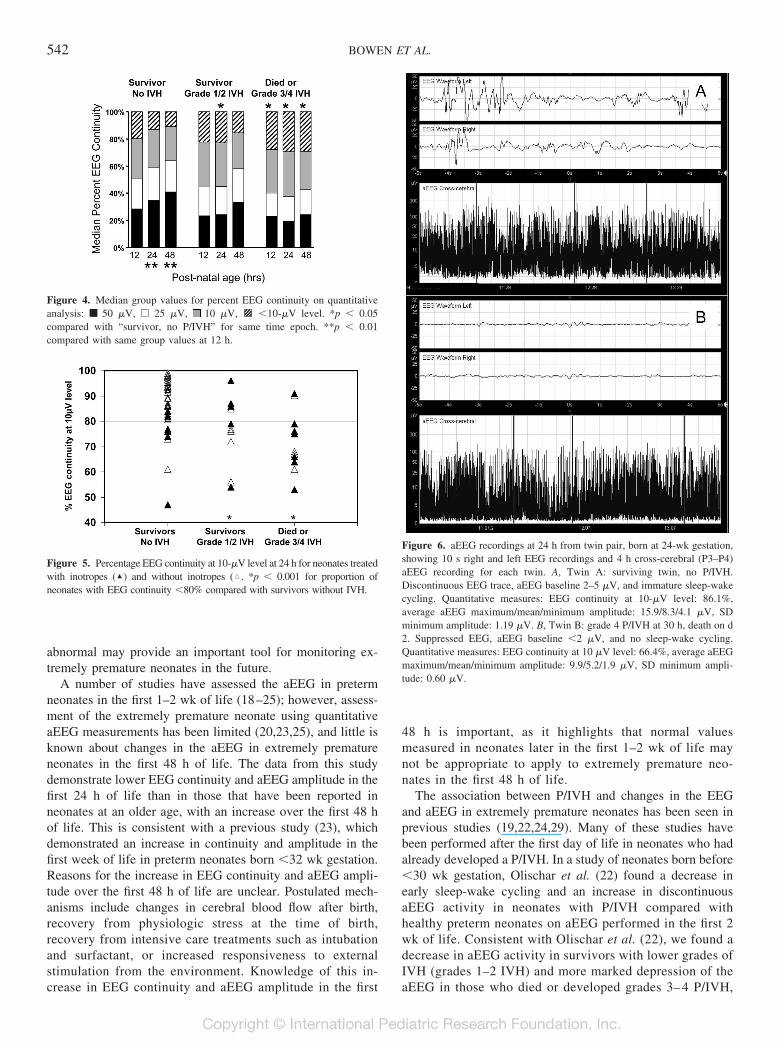
tinuity at 10-, 25-, and 50-�V levels and maximum, mean, andminimum aEEG amplitudes increased from 12 to 48 h insurvivors (Friedman test, p � 0.01; Table 3 and Fig. 4).
Features of the normal aEEG seen in neonates who diedor developed P/IVH. On visual analysis, 33% of those whodied or developed grade 3 or 4 P/IVH had a suppressed aEEGbaseline �2 �V, and 75% had no sleep-wake cycling (base-line variability �2 �V). Periods of continuity with aEEGbaseline �5 �V were not seen in any neonates who died ordeveloped P/IVH (Figs. 2 and 3).
Neonates who died or developed P/IVH had significantlylower EEG continuity at the 10-, 25-, and 50-�V levels andlower aEEG maximum, mean, and SD minimum amplitude at24 h than survivors without P/IVH (Table 3). In contrast tosurvivors, there was no increase in EEG continuity or aEEGamplitude from 12 to 48 h in neonates who died or developedgrades 3–4 IVH. Neonates with grades 1–2 IVH had suppres-sion of continuity at 24 h, with recovery by 48 h (Table 3 andFig. 4). EEG continuity �80% at the 10-�V level at 24 h wasa strong predictor of death or IVH, with a sensitivity of 73%and specificity of 86% (p � 0.000; Table 2 and Fig. 5).
The SD minimum amplitude was significantly lower atboth 12 and 24 h for neonates who died or developed P/IVHcompared with those who survived without P/IVH (Table3) and was strongly associated with visual analysis of aEEGsleep-wake cycling. At 24 h, 14 of 21 neonates (67%) withno sleep-wake cycling on visual analysis had a SD mini-mum amplitude �1 �V, compared with two of 41 (5%) ofthose who had immature or developed sleep-wake cycling(p � 0.000).
There was a strong association between low EEG continuityand use of inotropes. At 24 h, EEG continuity was �80% atthe 10-�V level in 12 of 18 neonates (67%) who requiredinotropes, compared with 10 of 46 (22%) who did not requireinotropes (p � 0.001; Fig. 5). In 14 of 18 neonates (78%) whoreceived inotropes, there was an increase in EEG continuity atthe 10-�V level between 12 and 24 h (including three of fourneonates who commenced inotropes between 12 and 24 h).Features of normal and abnormal aEEG recordings are illus-trated in Figure 6, which shows aEEG recordings at 24 h in atwin pair born at 24 wk gestation.
Figure 2. Proportion of neonates with aEEG background pattern classifica-tion on visual analysis: ■ periods of continuity, baseline �5 �V for �10 min;� discontinuous, baseline 2–5 �V; suppressed, baseline �2 �V. *p � 0.05compared with “survivor, no P/IVH” for same time epoch.
Figure 3. Proportion of neonates with aEEG baseline variability classifica-tion on visual analysis: ■ developed sleep-wake cycling �20 min cycles; �
immature sleep-wake cycling, �20 min cycles; no sleep-wake cycling.*p � 0.05 compared with “survivor, no P/IVH” for same time epoch.
Table 1. Perinatal data
Survivors, no P/IVH,n � 43
Survivors, grades 1–2 IVH,n � 10
Died or grades 3–4 P/IVH,n � 12 P
Gestational age (wk) 26 (25–28) 26 (25.7–27) 26 (24–26.8) NS24–25 wk, n (%) 14 (33) 2 (20) 5 (42) NSBirth weight (g) 850 (726–1030) 882 (792–964) 741 (554–962) NSApgar 1 min 6 (3–7) 3 (2–6) 6 (5–8) NSApgar 5 min 8 (6–9) 6 (5–8) 7 (7–9) NSCord pH 7.3 (7.2–7.4) 7.3 (7.2–7.4) 7.4 (7.3–7.4) NSMale sex, n (%) 24 (56) 5 (50) 4 (33) NSCesarean section, n (%) 28 (65) 6 (60) 6 (50) NSMean BP at 12 h 32 (29–36) 28 (23–33) 27 (22–32) 0.018Mean BP at 24 h 36 (30–39) 32 (29–33) 31 (27–38) NSMechanical ventilation at 24 h, n (%) 19 (44) 7 (70) 9 (75) NSInotropes at 24 h, n (%) 6 (14) 5 (50) 7 (58) 0.002Sedatives/anticonvulsants at 24 h, n (%) 1 (2) 0 2 (16) NS
Data shown as median (interquartile range) or n (%).
540 BOWEN ET AL.
DISCUSSION
This study provides additional information about aEEGdata in a large cohort of neonates born before 29 wk gestationand identifies quantitative values that may be used to distin-guish between a normal and abnormal aEEG in extremelypremature neonates in the first 48 h of life. On quantitativeanalysis, EEG continuity �80% at the 10-�V level was asensitive and specific marker of poor short-term outcome.By using this marker, we identified 83% of neonates whodied or developed grade 3 or 4 IVH and 60% of neonateswho developed grade 1 or 2 IVH, with a positive predictivevalue for death or any IVH of 73% and a negative predic-tive value of 86%. Absence of sleep-wake cycling withbaseline variability �2 �V was the strongest predictor of
outcome using visual analysis alone. SD minimum ampli-tude �1 �V was a useful quantitative marker of poorbaseline variability.
Assessment of the aEEG in the first few days of life inextremely premature neonates is difficult, as many of thenormal features seen in this extremely premature cohort wouldbe considered abnormal in neonates at older ages and gesta-tions. Accurate assessment of the preterm aEEG requiressubstantial experience with EEG monitoring of the prematureneonate to become familiar with normal variants and artifacts.The very discontinuous trace and low aEEG baselines seen inthis cohort make visual identification of abnormalities of thebackground trace difficult; therefore, identification of quanti-tative measures that can help to distinguish normal from
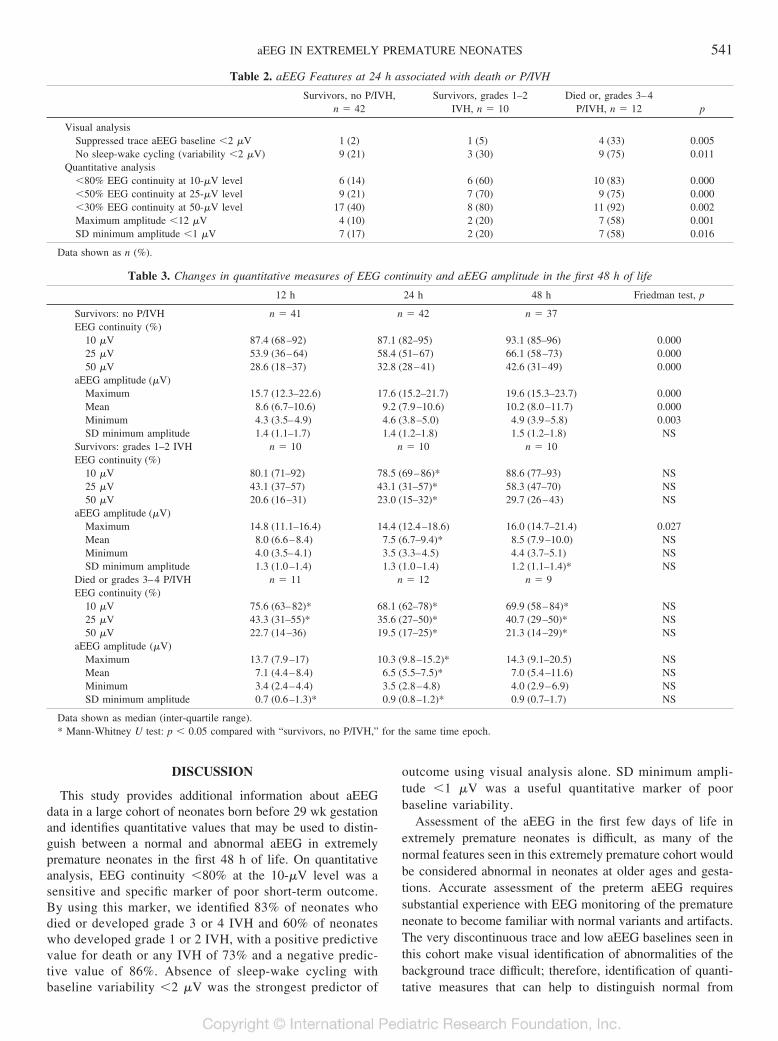
Table 2. aEEG Features at 24 h associated with death or P/IVH
Survivors, no P/IVH,n � 42
Survivors, grades 1–2IVH, n � 10
Died or, grades 3–4P/IVH, n � 12 p
Visual analysisSuppressed trace aEEG baseline �2 �V 1 (2) 1 (5) 4 (33) 0.005No sleep-wake cycling (variability �2 �V) 9 (21) 3 (30) 9 (75) 0.011
Quantitative analysis�80% EEG continuity at 10-�V level 6 (14) 6 (60) 10 (83) 0.000�50% EEG continuity at 25-�V level 9 (21) 7 (70) 9 (75) 0.000�30% EEG continuity at 50-�V level 17 (40) 8 (80) 11 (92) 0.002Maximum amplitude �12 �V 4 (10) 2 (20) 7 (58) 0.001SD minimum amplitude �1 �V 7 (17) 2 (20) 7 (58) 0.016
Data shown as n (%).
Table 3. Changes in quantitative measures of EEG continuity and aEEG amplitude in the first 48 h of life
12 h 24 h 48 h Friedman test, p
Survivors: no P/IVH n � 41 n � 42 n � 37EEG continuity (%)
10 �V 87.4 (68–92) 87.1 (82–95) 93.1 (85–96) 0.00025 �V 53.9 (36–64) 58.4 (51–67) 66.1 (58–73) 0.00050 �V 28.6 (18–37) 32.8 (28–41) 42.6 (31–49) 0.000
aEEG amplitude (�V)Maximum 15.7 (12.3–22.6) 17.6 (15.2–21.7) 19.6 (15.3–23.7) 0.000Mean 8.6 (6.7–10.6) 9.2 (7.9–10.6) 10.2 (8.0–11.7) 0.000Minimum 4.3 (3.5–4.9) 4.6 (3.8–5.0) 4.9 (3.9–5.8) 0.003SD minimum amplitude 1.4 (1.1–1.7) 1.4 (1.2–1.8) 1.5 (1.2–1.8) NS
Survivors: grades 1–2 IVH n � 10 n � 10 n � 10EEG continuity (%)
10 �V 80.1 (71–92) 78.5 (69–86)* 88.6 (77–93) NS25 �V 43.1 (37–57) 43.1 (31–57)* 58.3 (47–70) NS50 �V 20.6 (16–31) 23.0 (15–32)* 29.7 (26–43) NS
aEEG amplitude (�V)Maximum 14.8 (11.1–16.4) 14.4 (12.4–18.6) 16.0 (14.7–21.4) 0.027Mean 8.0 (6.6–8.4) 7.5 (6.7–9.4)* 8.5 (7.9–10.0) NSMinimum 4.0 (3.5–4.1) 3.5 (3.3–4.5) 4.4 (3.7–5.1) NSSD minimum amplitude 1.3 (1.0–1.4) 1.3 (1.0–1.4) 1.2 (1.1–1.4)* NS
Died or grades 3–4 P/IVH n � 11 n � 12 n � 9EEG continuity (%)
10 �V 75.6 (63–82)* 68.1 (62–78)* 69.9 (58–84)* NS25 �V 43.3 (31–55)* 35.6 (27–50)* 40.7 (29–50)* NS50 �V 22.7 (14–36) 19.5 (17–25)* 21.3 (14–29)* NS
aEEG amplitude (�V)Maximum 13.7 (7.9–17) 10.3 (9.8–15.2)* 14.3 (9.1–20.5) NSMean 7.1 (4.4–8.4) 6.5 (5.5–7.5)* 7.0 (5.4–11.6) NSMinimum 3.4 (2.4–4.4) 3.5 (2.8–4.8) 4.0 (2.9–6.9) NSSD minimum amplitude 0.7 (0.6–1.3)* 0.9 (0.8–1.2)* 0.9 (0.7–1.7) NS
Data shown as median (inter-quartile range).* Mann-Whitney U test: p � 0.05 compared with “survivors, no P/IVH,” for the same time epoch.
541aEEG IN EXTREMELY PREMATURE NEONATES
abnormal may provide an important tool for monitoring ex-tremely premature neonates in the future.
A number of studies have assessed the aEEG in pretermneonates in the first 1–2 wk of life (18–25); however, assess-ment of the extremely premature neonate using quantitativeaEEG measurements has been limited (20,23,25), and little isknown about changes in the aEEG in extremely prematureneonates in the first 48 h of life. The data from this studydemonstrate lower EEG continuity and aEEG amplitude in thefirst 24 h of life than in those that have been reported inneonates at an older age, with an increase over the first 48 hof life. This is consistent with a previous study (23), whichdemonstrated an increase in continuity and amplitude in thefirst week of life in preterm neonates born �32 wk gestation.Reasons for the increase in EEG continuity and aEEG ampli-tude over the first 48 h of life are unclear. Postulated mech-anisms include changes in cerebral blood flow after birth,recovery from physiologic stress at the time of birth,recovery from intensive care treatments such as intubationand surfactant, or increased responsiveness to externalstimulation from the environment. Knowledge of this in-crease in EEG continuity and aEEG amplitude in the first
48 h is important, as it highlights that normal valuesmeasured in neonates later in the first 1–2 wk of life maynot be appropriate to apply to extremely premature neo-nates in the first 48 h of life.
The association between P/IVH and changes in the EEGand aEEG in extremely premature neonates has been seen inprevious studies (19,22,24,29). Many of these studies havebeen performed after the first day of life in neonates who hadalready developed a P/IVH. In a study of neonates born before�30 wk gestation, Olischar et al. (22) found a decrease inearly sleep-wake cycling and an increase in discontinuousaEEG activity in neonates with P/IVH compared withhealthy preterm neonates on aEEG performed in the first 2wk of life. Consistent with Olischar et al. (22), we found adecrease in aEEG activity in survivors with lower grades ofIVH (grades 1–2 IVH) and more marked depression of theaEEG in those who died or developed grades 3– 4 P/IVH,
Figure 4. Median group values for percent EEG continuity on quantitativeanalysis: ■ 50 �V, � 25 �V, 10 �V, 3 �10-�V level. *p � 0.05compared with “survivor, no P/IVH” for same time epoch. **p � 0.01compared with same group values at 12 h.
Figure 5. Percentage EEG continuity at 10-�V level at 24 h for neonates treatedwith inotropes (‘) and without inotropes (�. *p � 0.001 for proportion ofneonates with EEG continuity �80% compared with survivors without IVH.
Figure 6. aEEG recordings at 24 h from twin pair, born at 24-wk gestation,showing 10 s right and left EEG recordings and 4 h cross-cerebral (P3–P4)aEEG recording for each twin. A, Twin A: surviving twin, no P/IVH.Discontinuous EEG trace, aEEG baseline 2–5 �V, and immature sleep-wakecycling. Quantitative measures: EEG continuity at 10-�V level: 86.1%,average aEEG maximum/mean/minimum amplitude: 15.9/8.3/4.1 �V, SDminimum amplitude: 1.19 �V. B, Twin B: grade 4 P/IVH at 30 h, death on d2. Suppressed EEG, aEEG baseline �2 �V, and no sleep-wake cycling.Quantitative measures: EEG continuity at 10 �V level: 66.4%, average aEEGmaximum/mean/minimum amplitude: 9.9/5.2/1.9 �V, SD minimum ampli-tude: 0.60 �V.
542 BOWEN ET AL.
although the more subtle changes associated with grades1–2 IVH were primarily identified in our study usingquantitative markers.
Only a few studies have assessed the EEG or aEEG beforethe onset of the P/IVH (24,29). In our study, head ultrasoundexaminations were performed on all neonates before com-mencement of the aEEG recording. Of the seven neonates whodeveloped grade 3 or 4 IVH, only two of these had evidenceof IVH before 24 h (both present on first ultrasound at 12 h).The remaining five neonates developed acute symptoms asso-ciated with head ultrasound evidence of IVH after 24 h.Despite the later appearance of these hemorrhages, the major-ity of these neonates had evidence of low EEG continuity,low amplitude, and poor aEEG baseline variability presenton aEEG monitoring before the development of the IVH.We hypothesize that these earlier aEEG changes are asso-ciated with poor cerebral perfusion or hypoxic/ischemicinjury in the period leading up to the development of theIVH (30,31).
Our finding of a strong association between low EEGcontinuity and use of inotropes supports a hypothesis that thelow EEG continuity is associated with decreased cerebralperfusion. Inotropes were given on clinical grounds to neo-nates who had evidence of low BP or clinical and cardiacultrasound signs of poor perfusion (low cardiac output or lowsuperior vena cava flow). Although we cannot exclude thepossibility that the use of inotropes may have contributed tothe low EEG continuity found in neonates who received theinotropes, the increase in continuity from 12 to 24 h in themajority of neonates who received inotropes does not supporta causative relationship between inotrope use and low conti-nuity levels. Although the use of inotropes was significantlyassociated with poor outcome, EEG continuity �80% at the10-�V level at 24 h was a more sensitive predictor of death orIVH than use of inotropes. Among neonates who died ordeveloped IVH, 73% had EEG continuity �80% at the 10-�Vlevel at 24 h, however, only 55% had received inotropes. Thisprovides some evidence that EEG continuity provides a moresensitive predictor of outcome than may be apparent fromclinical examination alone.
Studies assessing quantitative aEEG measures and outcomein extremely premature neonates are limited. Wikstrom et al.(25) identified an association between an increase in interburstinterval and a decrease in aEEG maximum and minimumamplitude in neonates with P/IVH or white matter damage inthe neonatal period and with neurodevelopmental handicap at2 y. Inder et al. (20) identified an association between cerebralwhite matter injury and spectral edge frequency in aEEGstudies performed in the first 20 d of life in neonates bornbefore 32 wk gestation. Our study identified a decrease incontinuity at the 10-, 25-, and 50-�V levels in neonates withdeath or IVH; however, low continuity at the 10-�V levelprovided greater sensitivity and specificity for identification ofpoor short-term outcome in this group of extremely prematureneonates.
In conclusion, this study has identified a number of visualand quantitative EEG features of the normal and abnormal
aEEG trace in neonates before 29-wk gestation in the first 48 hof life. EEG continuity �80% at 10-�V level was identified asa sensitive and specific marker of poor short-term outcome.By using this marker, we identified 83% of neonates who diedor developed grades 3–4 IVH and 60% of neonates whodeveloped grades 1–2 IVH, with a positive predictive valuefor death or any IVH of 73% and a negative predictive valueof 86%. Development of quantitative EEG analysis to allowits use at the bedside may provide a useful clinical tool formonitoring brain activity in extremely premature neonates inthe future.
REFERENCES
1. Doyle LW, Victorian Infant Collaborative Study Group 2004 Evaluation of neonatalintensive care for extremely low birth weight infants in Victoria over two decades.Effectiveness I. Pediatrics 113:505–509
2. Saigal S, Doyle LW 2008 Preterm Birth 3: an overview of mortality and sequelae ofpreterm birth from infancy to adulthood. Lancet 371:261–269
3. Hellstrom-Westas L, Rosen I 2005 Electroencephalography and brain damage inpreterm infants. Early Hum Dev 81:255–261
4. Benda GI, Engel RC, Zhang Y 1989 Prolonged inactive phases during the discon-tinuous pattern of prematurity in the electroencephalogram of very-low birthweightinfants. Electroencephalogr Clin Neurophysiol 72:189–197
5. Biagioni E, Bartalena L, Boldrini A, Cioni G, Giancola S, Ipata AE 1994 Back-ground EEG activity in preterm infants: correlation of outcome with selectedmaturational features. Electroencephalogr Clin Neurophysiol 91:154–162
6. Hayakawa M, Okumura A, Hayakawa F, Watanabe K, Ohshiro M, Kato Y,Takahashi R, Tauchi N 2001 Background electroencephalographic (EEG) activitiesof very preterm infants born at less than 27 weeks gestation: a study on the degreeof continuity. Arch Dis Child Fetal Neonatal Ed 84:F163–F167
7. de Vries LS, Hellstrom-Westas L 2005 Role of cerebral function monitoring in thenewborn. Arch Dis Child Fetal Neonatal Ed 90:F201–F207
8. Eken P, Toet MC, Groenendaal F, de Vries LS 1995 Predictive value of earlyneuroimaging, pulsed Doppler and neurophysiology in full term infants with hy-poxic-ischaemic encephalopathy. Arch Dis Child Fetal Neonatal Ed 73:F75–F80
9. Hellstrom-Westas L, Rosen I, Svenningsen N 1995 Predictive value of earlycontinuous amplitude integrated EEG recordings on outcome after severe birthasphyxia in full term infants. Arch Dis Child Fetal Neonatal Ed 72:F34–F38
10. Toet MC, Hellstrom-Westas L, Groenendaal F, Eken P, de Vries LS 1999 Amplitudeintegrated EEG 3 and 6 hours after birth in full term neonates with hypoxic-ischaemic encephalopathy. Arch Dis Child Fetal Neonatal Ed 81:F19–F23
11. Toet MC, van Rooij LG, de Vries LS 2008 The use of amplitude integratedelectroencephalography for assessing neonatal neurologic injury. Clin Perinatol35:665–678
12. Toet MC, Lemmers PM 2009 Brain monitoring in neonates. Early Hum Dev85:77–84
13. Spitzmiller RE, Phillips T, Meinzen-Derr J, Hoath SB 2007 Amplitude-integratedEEG is useful in predicting neurodevelopmental outcome in full-term infants withhypoxic-ischaemic encephalopathy: a meta-analysis. J Child Neurol 22:1069–1078
14. al Naqeeb N, Edwards AD, Cowan FM, Azzopardi D 1999 Assessment of neonatalencephalopathy by amplitude-integrated electroencephalography. Pediatrics103:1263–1271
15. de Vries LS, Toet MC 2006 Amplitude integrated electroencephalography in thefull-term newborn. Clin Perinatol 33:619–632
16. Selton D, Andre M, Hascoet J 2000 Normal EEG in very premature infants:reference criteria. Clin Neurophysiol 111:2116–2124
17. Vecchierini MF, Andre M, d’Allest AM 2007 Normal EEG of premature infantsborn between 24 and 30 weeks gestational age: terminology, definitions and matu-ration aspects. Neurophysiol Clin 37:311–323
18. Hellstrom-Westas L, Rosen I, Svenningsen N 1991 Cerebral function monitoring inthe first week of life in extremely small low birthweight (ESLBW) infants. Neuro-pediatrics 22:27–32
19. Hellstrom-Westas L, Klette H, Thorngren-Jerneck K, Rosen I 2001 Early predictionof outcome with aEEG in preterm infants with large intraventricular hemorrhages.Neuropediatrics 32:319–324
20. Inder TE, Buckland L, Williams CE, Spencer C, Gunning MI, Darlow BA, Volpe JJ,Gluckman PD 2003 Lowered electroencephalographic spectral edge frequencypredicts the presence of cerebral white matter injury in premature infants. Pediatrics111:27–33
21. Olischar M, Klebermass K, Kuhle S, Hulek M, Kohlhauser C, Rucklinger E, PollakA, Weninger M 2004 Reference values for amplitude-integrated electroencephalo-graphic activity in preterm infants younger than 30 weeks’ gestational age. Pediatrics113:e61–e66
22. Olischar M, Klebermass K, Waldhoer T, Pollak A, Weninger M 2007 Backgroundpatterns and sleep-wake cycles on amplitude-integrated electroencephalography inpreterms younger than 30 weeks gestational age with peri-/intraventricular haemor-rhage. Acta Paediatr 96:1743–1750
543aEEG IN EXTREMELY PREMATURE NEONATES

23. West CR, Harding JE, Williams CE, Gunning MI, Battin MR 2006 Quantitativeelectroencephalographic patterns in normal preterm infants over the first week afterbirth. Early Hum Dev 82:43–51
24. Greisen G, Hellstrom-Westas L, Lou H, Rosen I, Svenningsen N 1987 EEGdepression and germinal layer haemorrhage in the newborn. Acta Paediatr Scand76:519–525
25. Wikstrom S, Ley D, Hansen-Pupp I, Rosen I, Hellstrom-Westas L 2008 Earlyamplitude-integrated EEG correlates with cord TNF-alpha and brain injury in verypreterm infants. Acta Paediatr 97:915–919
26. Kluckow M, Evans N 2000 Superior vena cava flow in newborn infants: a novelmarker of systemic blood flow. Arch Dis Child Fetal Neonatal Ed 82:F182–F187
27. Hellstrom-Westas L, Rosen I, de Vries LS, Greisen G 2006 Amplitude-integratedEEG classification and interpretation in preterm and term infants. Neoreviews7:e76–e87
28. Papille LA, Burstein J, Burstein R, Koffler H 1978 Incidence and evolution ofsubependymal and intraventricular hemorrhage: a study of infants with birth weightsless than 1500 grams. J Pediatr 92:529–534
29. Van de Bor M, Can Dijk JG, Ven Bel F, Brouwer OF, Van Sweden B 1994 Electricalbrain activity in preterm infants at risk for intracranial hemorrhage. Acta Paediatr83:588–595
30. Kissack CM, Garr R, Wardle SP, Weindling AM 2004 Postnatal changes in cerebraloxygen extraction in the preterm infant are associated with intraventricular hemor-rhage and hemorrhagic parenchymal infarction but not periventricular leukomalacia.Pediatr Res 56:111–116
31. Kluckow M, Evans N 2000 Low superior vena cava flow and intraventricularhaemorrhage in preterm infants. Arch Dis Child Fetal Neonatal Ed 82:F188 –F194
544 BOWEN ET AL.
Related Documents