ACTA OPHTHALMOLOGICA SCANDINAVICA 1995 - Decrease of optic disc cupping and pallor of ocular hypertensives with timolol therapy Bernard Schwartzl, Philip Lavin2,Takenori Takamotol, Daniel F. Araujol and Gerard Smits2 Tufts University School of Medicine’, Harvard Medical School2, Boston, Massachusetts, and Boston Biostatistics Research Foundation, Inc. Newton Upper Falls, Massachusetts, U.S.A. ABSTRACT. Purpose: The purpose of this study was to determine whether timolol drops compared to placebo drops had a significant effect on optic disc cupping and pallor in ocular hypertensives. Methods: Thirty-seven ocular hypertensives were randomly assigned to placebo or 0.5% timolol drops to both eyes in a double masked clinical trial. Measurements of ocular pressure and photographs of the optic disc for cupping by photogrammetry and pallor by computerized image ana- lysis were made at about 3 month intervals, for 18 to 24 months offollow- UP. Results: None of the subjects developed visual field loss when tested with the Goldmann perimeter by kinetic and static means at six month inter- vals. Subjects treated with timolol developed a significant decrease in ocular pressure and a significant decrease in optic disc cupping with a smaller decrease in pallor compared to subjects treated with placebo. Multivariate analyses indicated that the decrease of optic disc cupping and pallor was not associated with the ocular pressure on treatment or the decrease in ocular pressure during the trial. Conclusion: Timolol treatment was associated with a decrease in optic disc cupping and pallor. The effect of timolol appears to be related to mechanisms other than the decrease in ocular pressure. Acta Ophthalmol. Scand. 1995: 73 (Suppl 215): 5-21 Presented in part at the Association for Research in Vision and Ophthalmology, Sarasota, Florida, April 28, 1986. One of the authors (BS) has applied for a patent for the use of timolol for maintaining or decreasing optic nerve cupping and pallor. The other authors have no proprietary interest in this study. ith the introduction of the use of ocular hypertension and glaucoma, W drops of beta-blockers such as ti- clinical trials have been designed pri- molol for decreasing ocular pressure in marily to determine the effect on pro- , gression of visual field loss [l-41. We have developed quantitativereproduc- ible methods for measurement of optic disc cupping and pallor. The purpose of this paper is to report the applica- tion of these methods to compare the effects of placebo and timolol drops on optic disc cupping and pallor in a double masked randomized clinical trial in ocular hypertensive subjects. Materials and Methods A. Subjects and Protocol Forty-one ocular hypertensive sub- jects were recruited from the practice of one of us (BS) at the New England Medical Center for this study. consent forms for this study were approved by the institution’s Human Investigation Research Committee. The subjects were enrolled between 1981 and 1985. Subjects had ocular pressures greater than or equal to 21 mmHg and less than 35 mmHg on two or more inde- pendent examinations. Normal visual fields were determined by kinetic and static means with the Goldmann per- imeter. The subjects’ discs had varying amounts of optic disc cupping and pal- lor [5]. Subjectshad no previous ocular surgery,laser treatments or other signi- ficant ocular disease. They were well acquainted with the procedures such as applanation tonometry with the 5-

Welcome message from author
This document is posted to help you gain knowledge. Please leave a comment to let me know what you think about it! Share it to your friends and learn new things together.
Transcript
ACTA OPHTHALMOLOGICA SCANDINAVICA 1995 -
Decrease of optic disc cupping and pallor of ocular hypertensives with timolol therapy Bernard Schwartzl, Philip Lavin2, Takenori Takamotol, Daniel F. Araujol and Gerard Smits2
Tufts University School of Medicine’, Harvard Medical School2, Boston, Massachusetts, and Boston Biostatistics Research Foundation, Inc. Newton Upper Falls, Massachusetts, U.S.A.
ABSTRACT. Purpose: The purpose of this study was to determine whether timolol drops compared to placebo drops had a significant effect on optic disc cupping and pallor in ocular hypertensives. Methods: Thirty-seven ocular hypertensives were randomly assigned to placebo or 0.5% timolol drops to both eyes in a double masked clinical trial. Measurements of ocular pressure and photographs of the optic disc for cupping by photogrammetry and pallor by computerized image ana- lysis were made at about 3 month intervals, for 18 to 24 months offollow- UP.
Results: None of the subjects developed visual field loss when tested with the Goldmann perimeter by kinetic and static means at six month inter- vals. Subjects treated with timolol developed a significant decrease in ocular pressure and a significant decrease in optic disc cupping with a smaller decrease in pallor compared to subjects treated with placebo. Multivariate analyses indicated that the decrease of optic disc cupping and pallor was not associated with the ocular pressure on treatment or the decrease in ocular pressure during the trial. Conclusion: Timolol treatment was associated with a decrease in optic disc cupping and pallor. The effect of timolol appears to be related to mechanisms other than the decrease in ocular pressure.
Acta Ophthalmol. Scand. 1995: 73 (Suppl 215): 5-21
Presented in part at the Association for Research in Vision and Ophthalmology, Sarasota, Florida, April 28, 1986.
One of the authors (BS) has applied for a patent for the use of timolol for maintaining or decreasing optic nerve cupping and pallor. The other authors have no proprietary interest in this study.
ith the introduction of the use of ocular hypertension and glaucoma, W drops of beta-blockers such as ti- clinical trials have been designed pri- molol for decreasing ocular pressure in marily to determine the effect on pro-
,
gression of visual field loss [l-41. We have developed quantitative reproduc- ible methods for measurement of optic disc cupping and pallor. The purpose of this paper is to report the applica- tion of these methods to compare the effects of placebo and timolol drops on optic disc cupping and pallor in a double masked randomized clinical trial in ocular hypertensive subjects.
Materials and Methods A. Subjects and Protocol Forty-one ocular hypertensive sub- jects were recruited from the practice of one of us (BS) at the New England Medical Center for this study. consent forms for this study were approved by the institution’s Human Investigation Research Committee. The subjects were enrolled between 1981 and 1985. Subjects had ocular pressures greater than or equal to 21 mmHg and less than 35 mmHg on two or more inde- pendent examinations. Normal visual fields were determined by kinetic and static means with the Goldmann per- imeter. The subjects’ discs had varying amounts of optic disc cupping and pal- lor [5] . Subjects had no previous ocular surgery, laser treatments or other signi- ficant ocular disease. They were well acquainted with the procedures such as applanation tonometry with the
5 -
- ACTA OPHTHALMOLOG~CA SCANDINAVICA 1995
Goldmann tonometer, visual field evaluation with the Goldmann per- imeter and photography of the optic discs. Subjects were selected who ap- peared willing to complete the study and from whom adequate photographs of the optic disc had been obtained previously. Subjects were excluded from the study who had a history of bronchial asthma or who had a pulse rate consistently less than 60 per minute and who were using systemic or topical medications which could affect ocular pressures, such as corticoste- roids or beta-blocker drugs. Also ex- cluded were subjects who were unreli- able on testing of the visual field who had other ocular disease including trauma and diabetic retinopathy or who had primary ocular surgery in- cluding laser trabeculoplasty.
Subjects first underwent a baseline examination consisting of measure- ment of ocular pressures with the Goldmann applanation tonometer, a determination of the visual fields by both kinetic and static means with the Goldmann perimeter, slit lamp gonios- copy, photographs of the optic discs and determination of blood pressure and pulse rate. If on slit lamp gonios- copy, pigmentation of the trabeculum was 2+ or greater [6] in at least all angels of one eye, then the subject was considered to have increased pigmen- tation of the angle. Visual fields were done with at least three isopters, one within the blind spot and two outside the blind spot. Static perimetry was done by selecting about 70 points within the central 20 degrees of the vis- ual field.
None of the subjects were on medi- cation to lower ocular pressure or on systemic beta-blockers on entrance into the study. Subjects were then placed on either placebo or timolol drops in both eyes twice a day in a double masked manner using ran- domized number tables with neither subjects or the observer knowing the identity of the drops. Subjects were re- quested to return at three month inter- vals for measurements of ocular press- ure, blood pressure and pulse rate and photographs of the optic disc for a period of 18 months. Visual fields were determined with the Goldmann per- imeter by kinetic and static means at intervals of 6 months.
The mean k standard error of the time interval between the date of the baseline photographs and the date of start of placebo or timolol drops was 2.5 f 0.8 months for the placebo group and 4.3 f 1.3 months for the timolol group. There was a borderline signifi- cant difference between these 2 groups (p = 0.0925).
Although all subjects were asked to return at three month intervals for a period of 18 months, a number of sub- jects did not keep their three-month appointments and were seen at longer intervals. Therefore, some subjects had follow-up for a period of 24 months. In order to determine whether there was any difference in effect of either placebo or timolol drops during the time of the study and also to com- pare differences in effect of these drops at various periods of the study, the study time was categorized into three periods: period 1 from 0 to 9 months; period 2 greater than 9 to less than 15 months and period 3 from 15 to 24 months. The number of visits per period varied from an average of 1.7 to 2.0. None of the subjects developed visual field loss during this study. If the ocular pressure was 36 mmHg or greater or if the pulse rate was consist- ently less than 60 per minute, the eye drops were discontinued and the code broken to determine whether the sub- ject was on timolol or placebo drops. Both eyes of all subjects were meas- ured and evaluated separately.
B) Measurement of optic disc photographs Photographs of the optic disc were ob- tained at three month intervals for measurement of cupping and pallor. For measurements of cupping, simul- taneous photographs were taken with the Donaldson stereofundus camera [7]. Three sets of stereophotographs of each eye were obtained at the same visit. For the measurement of pallor, photographs were taken with the Zeiss fundus camera using both the standard magnification (1 X) and the 2 X magni- fication. At least two photographs were obtained at each visit.
All photogrammetric measure- ments of cupping were made by one of us (TT) using a technique which we have reported previously [8]. The measurements were of the optic disc
cup volume, cup depth and the surface area of its opening (cup area). Cup depth was computed as the distance from the average depth of about 10 measured points randomly selected at the bottom of the cup in reference to a plane defined by about 40 measured points along the optic disc margin. Measurements of cup depth, cup vol- ume and cup area were expressed in re- lation to disc area. Volume profile measurements were also obtained as cross-sectional areas of the optic cup from top to bottom of the cup at inter- vals of 0.2 and 0.5 cup depth levels [9]. Depth levels are expressed as ratios to the averaged disc radius (mm). The cross-sectional cup area measure- ments of the volume profile are ex- pressed as a ratio to the disc area. In- itial evaluation of the cross-sectional area at the bottom of the cup that is at the 0.7 depth level showed many zero values indicating that the cups did not extend to this level. Therefore the ana- lysis for volume profile excluded the 0.7 depth level.
Photogrammetric measurements were made on three independent pairs of stereophotographs of the same eye taken at the same time. For measure- ment of the photographs, all the photo- graphs of one eye of each subject was selected. Photographs were masked for placebo or timolol treatment, date of the photograph and whether the photograph was a duplicate. Then all photographs were randomized within the series of photographs of each eye. Measurements were made in the ran- domized series.
Reproducibility of the measure- ment technique was determined from this randomized series of triplicate photographs and expressed as a per- cent coefficient of variation (standard deviatiodmean X 100) determined for the total cup volume. The reprodu- cibility of measurements for the ana- lysis for the quadrants of the cup are larger than that for the whole cup [8]. For both eyes for the placebo and ti- molol groups, the mean (median) per- cent coefficient of variation k standard deviation (number of measurements) for the total cup volume was 15.6 (9.3) -I 20.2 (531). The frequency distribu- tion of the percent coefficient of varia- tion was skewed to the right with 144 measurements greater than 20% thus
- 6
ACTA OPHTHALMOLOGICA SCANDINAVICA 1995 -
reflecting the frequency distribution of smaller cup volumes. There were 77 measurements of small cup volumes, of less than 8% and 23 of these were less than or equal to zero. The reprodu- cibility of the measurements becomes less exact with smaller cup volumes [9]. When the percent coefficient of varia- tion was recalculated excluding cup volume less than 8%, the mean (me- dian) +_ standard deviation (number of measurements) was 9.7 (8.3) f 7.1
Measurements of pallor were made using computerized image analysis and manually applied plan points by a technique which we have previously described [lo]. Measurements were made from duplicate photographs, that is two photographs taken inde- pendently of the same eye at the same time. All measurements of pallor were made by one of us (D.A.). Measure- ments are expressed as the area of pal- lor, in relation to the disc area. Pallor measurements, less than 5% of the area of the optic disc are not included in the analysis of the data, since they tend to have poor reproducibility [ 101. Measurements with such a small area of pallor involved 6 subjects, 4 in the ti- molol group and 2 in the placebo group. Therefore, the number of sub- jects with pallor measurements in the timolol group are less than those of the placebo group.
The mean (median) coefficient of variation f standard deviation of the duplicate measurements for percent area of pallor for the total disc was 3.0 (2.4) f 2.4 for 826 measurements.
We were not able to obtain all of the patients’ photographs with the 2 X magnification device and some meas- urements of pallor were thus made from photographs with standard mag- nification. Such photographs were di- gitized and measured at similar magni- fication as those taken with the 2 X de- vice. We have previously reported the technique for measurement of pallor and its reproducibility and determined there is little difference in reproduci- bility between the standard (1 X) and the magnified (2 X) photographs [lo].
Cupping and pallor measurements were made for the total disc as well as for its 4 quadrants - superior, inferior, temporal and nasal. The quadrants were delineated via a St. Andrew’s
(454).
Cross, by using diagonal lines at 90” in- tervals at 45” to the vertical and hori- zontal meridians. The center of the cross was the center of gravity of the disc [8,10].
C. Statistical Methods Descriptive characteristics of the sub- jects are expressed as mean f standard error (SE). For the analysis of the data by period, all values within each period were averaged. All data were analyzed separately for each eye. The change over time for each eye for each optic disc parameter was calculated also as a slope using linear regression. Standard statistical methods for univariate ana- lyses were used to analyze the data [ 11 ]. A p-value of 0.05 or less was chosen as significant and alevel greater than 0.05 to 0.10 was chosen as being borderline in significance. Only two-tailed tests were used.
The specific univariate tests in- cluded the t-test for comparing treat- ment groups for various parameters and the exact contingency table [12] was used in order to test the associ- ation between groups. The t-tests were also performed following a test for the equality of the variances using an F - m a test. Comparisons of the placebo and timolol groups during the course of the study were made by tak- ing the differences between the meas- urements at any period minus baseline, and comparing these differences using a t-test. Tests of the equality of the mean changes were used to compare change from baseline for the two treat- ments.
A multivariate random effect model was used to test for significance to re- duce variance and to control for con- founders [ 131. The use of the statistical technique of random effect models allowed the use of all observations to construct the models. Only observa- tions on treatment for periods 1,2 and 3 were used in the models, that is, ba- seline values were excluded except when indicated as a specific independ- ent variable. The optic disc parameter endpoint was the dependent variable. Results were run separately for each eye. Two types of models were de- veloped with the independent vari- ables categorized in a binary or tertiary manner, e.g., baseline ocular pressure (< 24 or 2 24 mmHg ), baseline cup
volume (<5, 15-23 or >23). Binary and tertiary groupings were selected to identify clinically appropriate settings for ocular pressure and to represent tertiles for cupping and pallor data. The first simplified models utilized the following independent variables; ba- seline ocular pressure (<24, 2 2 4 mmHg), ocular pressure on treatment (<19, 219 mmHg), treatment (placebo drops = 0, timolol drops = I), iris color (dark = 1, light = 2) and a ba- seline disc parameter corresponding to the dependent variable. For the total disc the baseline parameters were: cup volume (< 15, 15-23, >23), cup area (<41, 41-52, >51), cup depth (<17, 17-21, >21), volume profile at 0.2 depth (<0.30, 0.30-0.43, >0.43), at 0.5 depth (<0.03, 0.03-0.18, >0.18), pallor area (< 24,24-34, > 34). Similar tertiary divisions for the quadrants of the optic disc for cupping and pallor were utilized. In addition, a similar set of simplified models was constructed and evaluated by substituting change of ocular pressure (value during treat- ment minus baseline < 0 , 2 0) for ocu- lar pressure on treatment. For each of the models where ocular pressure or change of ocular pressure on treatment was not significant, there was at least 80% power to detect 0.02 units total cup volume (mm3)/disc area (mm2)/ mmHg; 0.03 units total cup area (mm’)/disc area (mm2)/mmHg; 0.02 units total cup depth (mm)/disc area (mm2)/mmHg; 0.03 units total cup area (mm2) at 0.2 depth/disc area (mm2)/mmHg; 0.04 units total cup area (mm’) at 0.5 depth/disc area (mm2)/ mmHg; 0.03 units total pallor area (mm2)/disc area (mm’) of end point effects with a 5% type I error for a two sided test.
The second complex binary and ter- tiary models included in addition as in- dependent variables: change in disc parameter ( < O , 2 0 ) , gender (fe- male = 0, male = I), baseline age (< 60, 2 60 years), baseline systolic blood pressure (mmHg) (< 140, 2 140), ba- seline diastolic blood pressure (mmHg) (< 80, 2 SO), base-line pulse (rate/min) (< 72 ,2 72), change in sys- tolic and diastolic blood pressures and pulse rate (< 0, 2 0). As with the sim- plified models change in ocular press- ure was substituted for ocular pressure on treatment.
l -
- ACTA OPHTHALMOLOGICA SCANDINAVICA 1995
Similar to the simplified models all analyses of cupping, pallor and volume profile for the complex models in- cluded baseline measurements as co- variates and all analyses of cupping and volume profile included baseline pallor as well as the baseline meas- urements for cupping and volume profiles. Subjects were considered to be a random effect. The analysis evalu- ated drug (placebo or timolol) effect in the presence of these co-variates. The additive effect of drug was evaluated alone and in combination with changes in ocular pressure, pulse, systolic and diastolic blood pressures. In this man- ner, it can be assessed if the change in the primary study endpoints i.e., change in the optic disc was due to changes in the ocular pressure, pulse and systolic and diastolic blood pres- sures or were due to the drug. A ran- dom effect test was used with the proper error term to test for drug effect as well as for co-variate effect. Type I sums of squares were used to report p-values. The order of terms in the model were patient tested within drug, change of ocular pressure, followed by relevant baseline co-variates. Follow- ing review of separate analyses within each study period, all observations across periods were included in a pooled analysis to increase the power of the analysis.
All analyses were performed using SAS (Cary, North Carolina). The re- sults of the multivariate models were evaluated to examine the frequencies and relationships of timolol signific- ance (significant, borderline signifi- cant or non-significant) with the signi- ficance of other independent variables such as, ocular pressure on treatment (placebo or timolol) or change of ocu- lar pressure on treatment. Finally, the direction of timolol significance was evaluated by comparing the frequency distributions of positive versus nega- tive relationships within the timolol significant models.
Fisher's exact test [ 121 was used to determine the significance of the asso- ciation of any independent variables with the effect of timolol on decreasing optic disc parameters using the models where timolol was a significant inde- pendent variable. The sign (positive or negative) of the independent variable together with the sign (positive or ne-
gative) of the significant timolol effect and the non-significant timolol effect were taken into account by construct- ing a 3 X 2 table for each independent variable.
The data analysis evaluated mul- tiple end points e.g., cupping and pal- lor for total disc and quadrants. Many end points were thought to be corre- lated which might lead to redundant significance testing. A principal com- ponents analysis was used to test for dependencies between all study end points. A principal components ana- lysis and a varimax rotation method were used to assess the relative inde- pendence of the multiple study end points [14]. Analyses were run separ- ately for each eye to test factor analysis consistency. Two, three and four factor solutions were performed.
A binomial test [ 151 was performed on the proportion of the tests which were significant (relative 5% being sig- nificant under a null hypothesis). The denominators of these tests were ad- justed to allow for a smaller number of independent end points. These bino- mial tests used the same proportion of tests observed to be significant, but smaller denominators were used to represent smaller numbers of inde- pendent variables. To be conservative, it was assumed that only 20% of the tests being performed were based on independent variables.
Table 1. Subject characteristics at baseline.
Results A) Baseline evaluation of subjects Forty-one ocular hypertensive subjects were recruited for the trial. However, 3 subjects were excluded during the ba- seline studies for failure to comply with follow-up examination and one subject was judged as ineligible during the ba- seline study since visual field loss was not detected on the first visual field examination. Therefore, 37 subjects were entered into the clinical trial.
Of the 20 placebo subjects, only 3 had previous therapy to lower ocular pressure. One subject was on 0.5% ti- molol drops in both eyes but this was discontinued 10 weeks prior to enter- ing the study. This same subject was also on 1% epinephrine hydrochloride drops in both eyes bid which was dis- continued 11 weeks prior to entrance into the study and was also on 50 mg methazolamide bid, which was discon- tinued 9 weeks prior to entering the study. A second subject was on 0.25% timolol drops in both eyes which was discontinued 4 months prior to enter- ing into the study. The third subject was on 2% pilocarpine drops qid in both eyes and 0.5% timolol drops bid in both eyes which was discontinued 4 months prior to entering the study. None of the subjects in the placebo group was on systemic beta-blocker therapy prior to entering into the study.
Placebo (n = 20) Timolol (n = 17)
Age (years)* 60.0 f 2.9 60.3 f 3.7 Sex (male/female) 10/10 9/8 Race (white/black) 20/0 14/3
Visual acuity*, ** O D 0.96 f0 .06 0.96 f 0.07 0s 0.94f0.07 0.95 f 0.07
Iris color (light/dark) 7/13 5/12
Refractive error* - 0.51 f 0.60 - 0.12f0.43 (diopters-spherical equivalent)
Family history of glaucoma 4 4 Blood pressure (mmHg) Systolic* Diastolic* Pulse (rate/min)*
138f3 .9 135 f 3.8 8Ok1.5 78 f 2.7 7 3 + 3 7 7 k 3
History of treated vascular hypertension 3 Diabetes mellitus 1 Exfoliation syndrome 1 Increased pigmentation of the angle 7
* Mean f standard error. ** Visual acuity determined as ratio e.g., 20/20 = 1, 20/30 = 0.67, etc.
- 8
ACTA OPHTHALMOLOGICA SCANDINAVICA 1995 -
Table 2. Ocular pressures (mmHg). Mean f standard error (No. of eyes).
Table 3. Cup area (mm*)/disc area (mm’) for total disc. Mean f standard error (No. of eyes).
OD 0s OD 0s ~ ~~~
Placebo Baseline 23.7 f 0.82 (20) 23.4 f 1.03 (20) Period 1 23.9 f 0.75 (20) 24.0 f 0.73 (20) (0 to 9 months) Period 2 23.3 f 0.73 (19) 23.7 k 0.87 (19) (> 9 to 15 months) Period 3 22.0 f 0.57 (16) 23.2 k 0.79 (16) (> 15 to 24 months)
Tirnolol Baseline 23.1 k 0.62 (17) 22.4f 1.02 (17) Period 1 18.2k0.80 (17) 18.7k0.75 (17) (0 to 9 months) Period 2 18.5 f0 .57 (12) 18.2f0.47 (12) (> 9 to 15 months) Period 3 19.7L0.61 (10) 19.3 k0.60 (10) (> 15 to 24 months)
Table 4. Cup depth (mm)/disc area (mm ’) for total disc. Mean f standard error (No. of eyes).
~~
Placebo Baseline Period 1 (0 to 9 months) Period 2 (> 9 to 15 months) Period 3 (> 15 to 24 months)
Tirnolol Baseline Period 1 (0 to 9 months) Period 2 (> 9 to 15 months) Period 3 (> 15 to 24 months)
0.445 k 0.026 (20) 0.461 f 0.021 (20)
0.455 f 0.026 (19)
0.441 f 0.028 (1 6)
0.433k 0.026 (17) 0.440 k 0.026 (1 7)
0.431 k0.035 (12)
0.446f0.038 (10)
0.457 k 0.024 (20) 0.476 k 0.024 (20)
0.494 f 0.020 (19)
0.47.5 f 0.025 (16)
0.484 f 0.025 (17) 0.486 f 0.025 (17)
0.476f0.035 (12)
0.472 k 0.039 (10)
Table 5. Cup volume (mm3)/disc area (mm’) for total disc. Mean f standard error (No. of eyes).
OD 0s OD 0s Plucebo Baseline 0.180f0.013 (20) 0.195k0.010(20) Period 1 0.186f0.015 (20) 0.190f0.013 (20) (0 to 9 months) Period 2 0.188L0.012 (19) 0.193f0.010 (19) (> 9 to 15 months) Period 3 0.178+0.014 (16) 0.190f0.012 (16) (> I 5 to 24 months)
Tiniolol Baseline 0.176k0.014 (17) 0.179f0.015 (17) Period I 0.172L0.014 (17) 0.171 f0 .013 (17) (0 to 9 months) Period 2 0.162f0.019 (12) 0.158f0.018 (12) (>9 to 15 months) Period 3 0.158k0.021 (10) 0.154k0.023 (10) (> 15 to 24 months)
Placebo Baseline 0.186 k 0.021 (20) 0.206 f 0.019 (20) Period 1 0.193 k 0.022 (20) 0.201 f 0.019 (20) (0 to 9 months) Period 2 0.193f0.019 (19) 0.203k0.017 (19) (> 9 to 15 months) Period 3 0.172k0.022(16) 0.193k0.019(16) (> 15 to 24 months)
Timolol Baseline 0.177k0.022 (17) 0.183f0.022(17) Period 1 0.171 f0 .021 (17) 0.173f0.019 (17) (0 to 9 months) Period 2 0.154f0.029 (12) 0.148f0.026 (12) (>9 to 15 months) Period 3 0.157f0.032(10) 0.151k0.034(10) (> 15 to 24 months)
Of the 17 subjects in the timolol group only 1 was on previous medica- tion to lower ocular pressure prior to entering into the study. This was 0.25% timolol drops in both eyes bid which was discontinued 6 weeks prior to en- tering into the study. A second subject was on celiprolol therapy for 1 month for vascular hypertension. This was discontinued 1 week prior to entering into the study. Thus 33 of the 37 sub- jects entering into the study had been on no previous medication to lower ocular pressure.
On entrance into the study 13 sub- jects in the placebo group and 9 in the timolol group had significant multiple
systemic diagnoses mostly requiring treatment. The major system diagnosis was vascular hypertension (placebo - 5 , timolol -5) . A number of other systemic diagnoses were present with usually one diagnosis per subject. They were: diabetes mellitus, myocardial in- farction, chronic heart failure, carotid artery insufficiency, gout, duodenal ulcer, left nephrectomy and abdominal aneurysm, right lung collapse, chronic iron deficiency anemia, depression, osteoarthritis and chronic bronchitis. Systemic medications (no. of subjects) included: hydrochlorothiazide (7), re- serpine(l), methyldopa(2), nitrogly- cerin (l), dipyridamole (l), digoxin (l),
acetylsalicylic acid (l), colchicine (l), cimetidine (l), ferrous sulfate (l), li- thium (l), naproxen (2) and amino- phylline (1). There appeared to be no difference in the type or number of drugs used between the placebo and ti- molol groups.
Table 1 gives the demographic and baseline ocular characteristics of the study sample and Tables 2 to 8 show the baseline ocular measurements of the study sample. There was no signifi- cant difference in the distribution of the visual acuity between the placebo and timolol groups. Visual acuities were 20/40 orbetter in all subjects, ex- cept 4 eyes. Two eyes had 20/50 visual
9 -
- ACTA OPHTHALMOLOGICA SCANDLNAVICA 1995
Table 6. Volume profile of optic disc cup cross-sectional area (mm?)/disc area (mm?) at 0.2 depth for total disc. Mean f standard error (No. of eyes).
Table 7. Volume profile of optic disc cup cross-sectional area (mm2)/disc area (mm’) at 0.5 depth for total disc. Mean f standard error (No. of eyes).
OD 0s Placebo Baseline 0.345 k 0.035 (20) 0.380 f 0.027 (20) Period 1 0.361 k 0.032 (20) 0.374 f 0.031 (20) (0 to 9 months) Period 2 0.356 k0.028 (19) 0.386 f 0.029 (19) (> 9 to 15 months) Period 3 0.327 f0.036 (16) 0.368 f0.030 (16) (> 15 to 24 months)
O D 0s Placebo Baseline 0.141 1- 0.028 (20) 0.142 k 0.029 (20) Period 1 0.138 f 0.029 (20) 0.132 k 0.029 (20) (0 to 9 months) Period 2 0.136 & 0.026 (1 9) 0.135 f 0.028 (1 9) (>9 to 15 months) Period 3 0.115f0.028 (16) 0.121 kO.029 (16) (> 15 to 24 months)
Timolol Baseline 0.325 f 0.038 (17) Period 1 0.322 f 0.036 (17) (0 to 9 months) Period 2 0.298 f 0.049 (12) (> 9 to 15 months) Period 3 0.316f0.059 (10) (> 15 to 24 months)
Timolol 0.362 f 0.037 (17) Baseline 0.115f0.026 (17) 0.107+0.026 (17) 0.342 f 0.037 (17) Period 1 0.088f0.025 (17) 0.084k0.021 (17)
0.319 k 0.050 (12) Period 2 0.082f0.031 (12) 0.083+0.024(12)
0.313f0.060 (10) Period 3 0.090 f 0.036 (10) 0.080 k0.030 (10)
(0 to 9 months)
(> 9 to 15 months)
(>15 to 24 months)
Table 8. Area pallor (mm ?)/disc area (mm’) for total disc. Mean f standard error (No. of eyes).
Table 9. Outcome of subjects entered into trial.
OD 0s Placebo Baseline Period 1 (0 to 9 months) Period 2 (> 9 to 15 months) Period 3 (> 15 to 24 months) Timolol Baseline Period 1 (0 to 9 months) Period 2 (> 9 to 15 months) Period 3 (> 15 to 24 months)
0.282 & 0.022 (18) 0.281 k0.023 (17)
0.277 f0.022 (18)
0.282 f 0.020 (15)
0.281 f0 .032 (15) 0.279f0.031 (15)
0.270 k 0.037 (9)
0.282 f 0.044 (8)
0.272 _+ 0.025 (19) 0.271 f 0.027 (17)
0.276 f0 .025 (18)
0.257 f 0.024 (16)
0.311 f0 .022 (15) 0.307 f 0.022 (1 5 )
0.307 k 0.027 (9)
0.300 k 0.032 (8)
Recruited for the study 41
Judged ineligible during baseline studies 1
Discontinued for various reasons before 2 years of follow-up: Placebo
Withdrew during baseline studies 3
Congestive heart failure 1
Disc hemorrhage 1 Branch vein occlusion 1
Timolol Placed on corticosteroids for ‘shingles’ 1 Red eyes 2 Bradycardia 2 Non-compliant or unavailable for follow-up: (placebo - 3, timolol- 3) 6
acuity and one had 20/400 on the basis of amblyopia.
The study characteristics of the sub- jects were essentially matched. At ba- seline, the subjects were not signifi- cantly different for age, gender, race, iris color distribution, refractive error, family history of glaucoma, blood pressures, pulse rates, history of vascu- lar hypertension and diabetes mellitus, diagnosis of exfoliation, ocular pres- sures and optic disc parameters, ex- cept for the percent area of optic disc pallor being significantly greater in the left eyes for the timolol group than the placebo groups for the temporal quad- rant (mean f SE: placebo 34.7 f 2.1%,
timolol44.1+ 2.30%, p = 0.005). The mean values for pallor for the total disc are also larger for the left eye for the ti- molol group than the placebo group.
B) Subject outcome during the study Table 9 indicates the outcome of sub- jects entered into the trial, including the reasons for subjects being disconti- nued from the study because of ad- verse reactions. Four subjects were withdrawn during the baseline studies. Fourteen subjects were discontinued during the study, 6 on placebo drops and 8 on timolol drops. The dropout of subjects by period was as follows: period 1 (0 to 9 months) - 6; period 2
(10 to less than 15 months) - 4; period 3 (15 to 24 months) - 4.
A comparison of 14 subjects who dropped out during the study with the subjects who continued in the study showed no significant differences in baseline age, gender, race, iris color, blood pressures, pulse rate, ocular pressures or optic disc parameters. None of the subjects developed glau- comatous visual field loss during the course of this study as judged by evalu- ation of the visual fields in a masked manner on at least 2 independent oc- casions.
There were relatively few changes in systemic medication during the study.
- 10
ACTA OPHTHALMOLOGICA SCANDINAVICA 1995 -
Of the placebo group 5 of the 20 sub- jects had a change in systemic medica- tion during the course of the study. One subject was placed on conjugated es- trogens for 6 months during the study for menopausal symptoms. One sub- ject was placed on spironolactone and hydrochlorothiazide for the last 2 months of the study. One subject was changed from aminophylline to theo- phylline and from naproxen to ibu- profen. One subject in the placebo group had their medication of rani- tidine hydrochloride discontinued. Another subject also in the placebo group was placed on clonidine for only 1 month. Of the timolol group only 2 of 17 subjects had a change in systemic therapy during the course of the study. One subject was changed from col- chicine to indomethacin. Another sub- ject was placed on furosemide after one year in the study.
C) Subject outcome following the study (Table 10) After discontinuance of the placebo or timolol drops for the study, most sub- jects were followed. As of March 31, 1990, the mean follow-up time k stan- dard error for the 20 subjects in the placebo group was 46.6 k 4.9 months with a range of 0 to 77 months. For the 17 subjects in the timolol group, the follow-up time was 50f7.1 months with a range from 1 to 80 months. Table 10 shows the outcome of these subjects for both the placebo and timo- lo1 groups. There were more subjects who required treatment for their ocu- lar hypertension or glaucoma in the placebo group than in the timolol group with relatively more subjects showing retinal venous abnormalities in the placebo than the timolol group. Using Fisher's exact contingency test [ 121, there was no significant difference on comparing the number of subjects requiring treatment between the placebo and timolol groups (p =
0.1663). There was a borderline signi- ficant difference (p = 0.06) comparing the number of subjects requiring treat- ment for increased ocular pressure in the placebo group compared to the ti- molol group.
D) Univariate analyses Comparison of the distribution of in- itial and final visual acuities showed no
Table 10. Subject outcome after discontinuance from study.
Placebo Treated subjects (n = 20)
Timolol Treated subjects (n = 17)
Follow-up time since last visit on study (months)
46.0 k 4.9* 50.0 k 7.1"
Subsequent treatment To lower ocular pressures
No treatment 7 No treatment 10 Treatment 12 Treatment 5 Lost to follow-up 1 Lost to follow-up 2
Increased ocular pressures 6 1 Basis for treatment
Retinal vein occlusion Branch 1 Stasis retinopathy 1 Central 1
Retinal venous hemorrhage 1 Optic disc progression 1 1 Visual field loss 2 2
12 5
* Mean f standard error.
significant differences between the placebo and timolol groups. There was also no significant difference of the days on therapy on comparison of the placebo and timolol groups: meanf standard error (no. of subjects), placebo 540 f 32 (20), timolol456 f 45 (17).
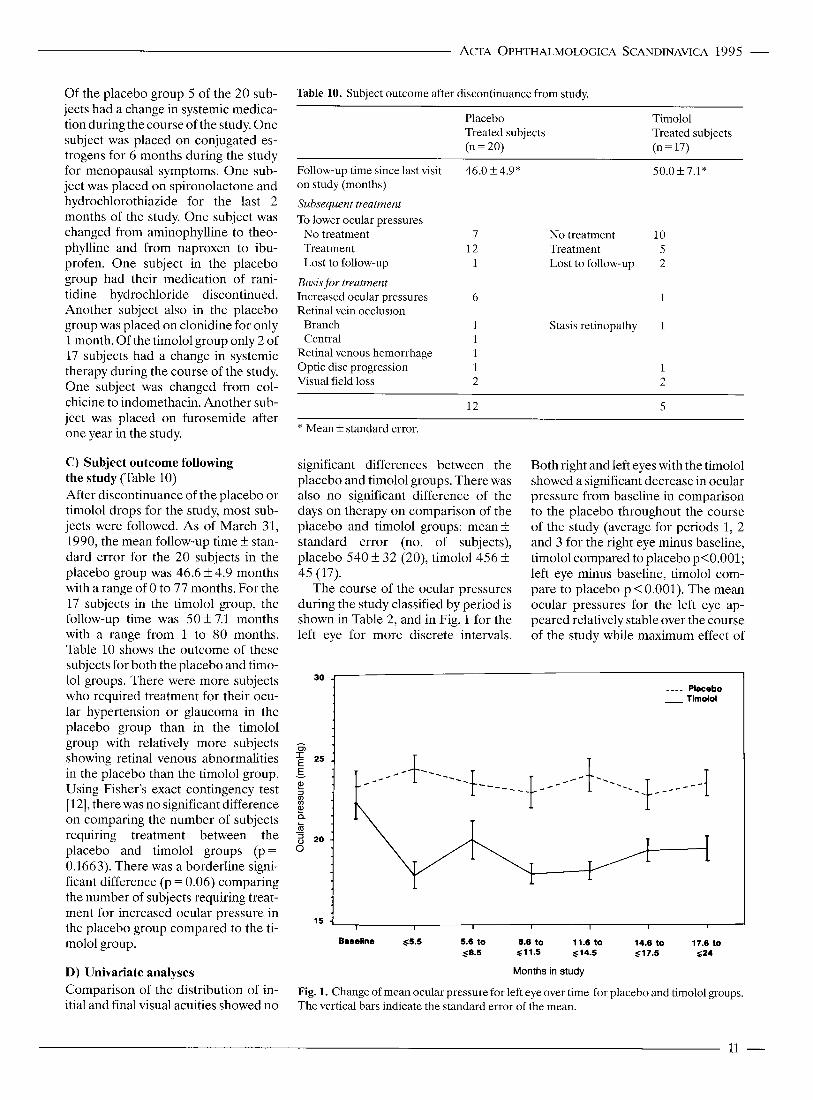
The course of the ocular pressures during the study classified by period is shown in Table 2, and in Fig. 1 for the left eye for more discrete intervals.
Both right and left eyes with the timolol showed a significant decrease in ocular pressure from baseline in comparison to the placebo throughout the course of the study (average for periods 1, 2 and 3 for the right eye minus baseline, timolol compared to placebo p<0.001; left eye minus baseline, timolol com- pare to placebo p < 0.001). The mean ocular pressures for the left eye ap- peared relatively stable over the course of the study while maximum effect of
30 -1
I I I I I 1
5.6 to 8.6 to 11.6 to 14.6 to 17.6 to ,<as 611.5 614.5 g17.5 $24
Baseline $5.5
Months in study
Fig. 1. Change of mean ocular pressure for left eye over time for placebo and timolol groups. The vertical bars indicate the standard error of the mean.
11 -
- ACTA OPHTHALMOLOGICA SCANDINAVICA 1995
0 .25 ’
Table 11. Significant (p 50.05) comparison of placebo and timolol groups for change from baseline (period minus baseline) using t-tests.
_ _ _ _ Placebo
Optic disc parameter (quadrant)
P Mean f standard error (No. of eyes)
Placebo Timolol Eye
~ ~ _ _ _ _ _ _ _ _ _ _ _ _ _ _
Period 1 Cup area-nasal 0s 4.08 f1.87 (20) - 1.46 k1.45 (17) 0.03 Superior 0s 3.50 k1.85 (20) -2.01 f1.92 (17) 0.05 Volume profile at 0.5 depth Inferior OD 0.010 f 0.02 (20) - 0.051 k 0.02 (17) 0.03 Pallor temporal 0s 0.427f0.73 (17) -2.51 +0.70 (15) 0.007 Pulse (rate/min) 0.500f2.04 (20) - 8.63 f3.05 (16) 0.02
Period 2 Pallor area superior OD 1.87 k0.67 (18) - 2.14 f1.19 (9) 0.004
Period 3 Cup depth -temporal 0s 0.43 f0.76 (16) -2.06 f0.90 (10) 0.05 Cup volume - inferior OD - 1.92 f0.91 (16) 0.49 f0.57 (10) 0.04
Average of Periods 1 ,2 ,3 Cup depth - temporal OD 1.27 k0.56 (20) - 0.43 f0 .63 (17) 0.05 Cup depth - temporal 0s 0.38 k0.39 (20) - 1.14 f0.60 (17) 0.04 0.5 Depth inferior OD - 0.003 f0.013 (20) - 0.051 k 0.019 (17) 0.04 Pallor area - temporal 0s -0.243f0.59 (19) -2.41 f0.73 (15) 0.03 Pulse (rate/min) -0.195k2.09 (20) -9.25 f3.12 (16) 0.02
Cup area = cup area (mm2)/disc area (mm’) C/O). Volume profile = cross-sectional cup area (mm2)/disc area (mm’). Pallor area = area pallor (mm*)/disc area (mm’) (“/o). Cup depth = depth (mm)/disc area (mm2) (%). Cup volume =volume (mm3)/disc area (mm’) (%).
decrease in mean ocular pressure for the timolol group is present at 5.5 months with the pressures increasing slightly at 14.6 to 17.5 months (Fig. 1).
Table 3 shows the measurements of cup area for the total disc for the 3 peri- ods. There appeared to be no trends of the mean values of the placebo and ti- molol groups over time for the total disc. On comparing the timolol group to the placebo group for differences from baseline (Table 11) significant differences using the t-test were found for change of cup area for the left eye €or the superior and nasal quadrants for period 1. The timolol group showed a decrease in cup area com- pared to the placebo group which showed an increase in cup area.
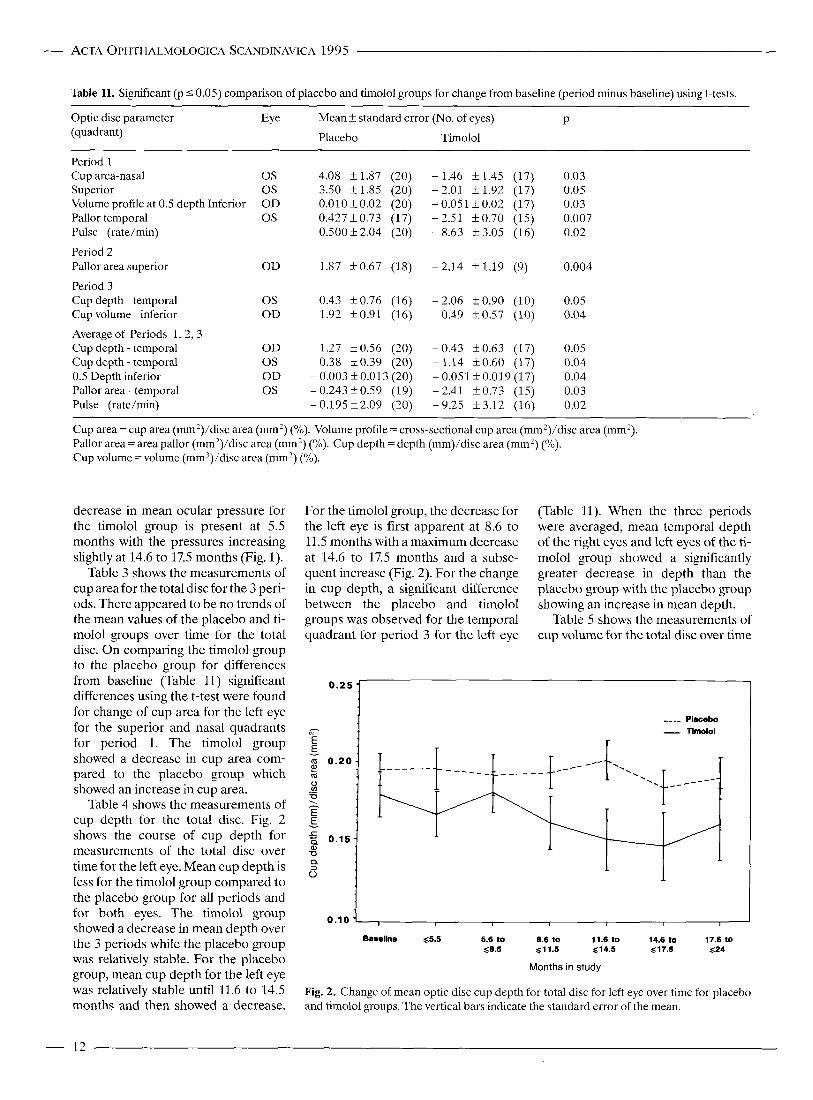
Table 4 shows the measurements of cup depth €or the total disc. Fig. 2 shows the course of cup depth for measurements of the total disc over time €or the left eye. Mean cup depth is less for the timolol group compared to the placebo group for all periods and for both eyes. The timolol group showed a decrease in mean depth over the 3 periods while the placebo group was relatively stable. For the placebo group, mean cup depth for the left eye was relatively stable until 11.6 to 14.5 months and then showed a decrease.
For the timolol group, the decrease for the left eye is first apparent at 8.6 to 11.5 months with a maximum decrease at 14.6 to 17.5 months and a subse- quent increase (Fig. 2). For the change in cup depth, a significant difference between the placebo and timolol groups was observed for the temporal quadrant for period 3 for the left eye
(Table 11). When the three periods were averaged, mean temporal depth of the right eyes and left eyes of the ti- molol group showed a significantly greater decrease in depth than the placebo group with the placebo group showing an increase in mean depth.
Table 5 shows the measurements of cup volume for the total disc over time
0.10 1 Baseline g5.5 5.6 to 8.6 to 11.6 to 14.6 to 17.6 to
Q8.5 61 1.5 $14.5 s17.5 624
Months in study
Fig. 2. Change of mean optic disc cup depth for total disc for left eye over time for placebo and timolol groups. The vertical bars indicate the standard error of the mean.
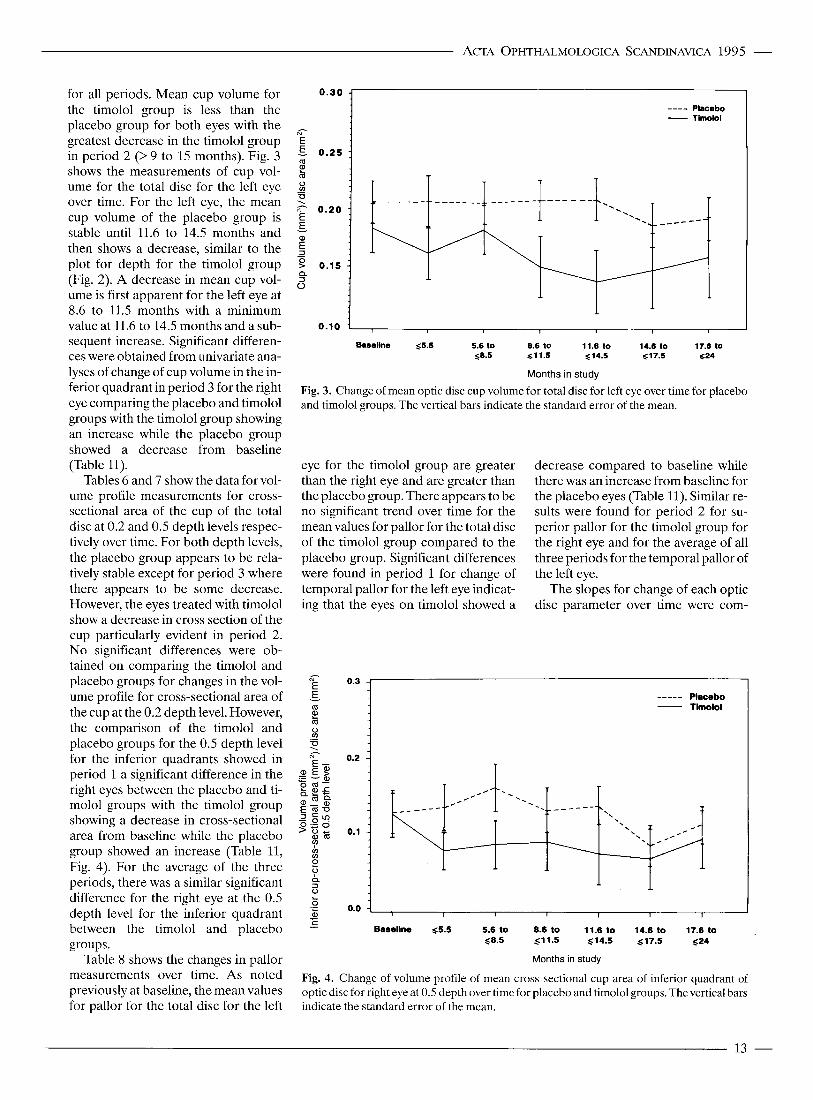
for all periods. Mean cup volume for the timolol group is less than the placebo group for both eyes with the greatest decrease in the timolol group in period 2 (> 9 to 15 months). Fig. 3 shows the measurements of cup vol- ume for the total disc for the left eye over time. For the left eye, the mean cup volume of the placebo group is stable until 11.6 to 14.5 months and then shows a decrease, similar to the plot for depth for the timolol group (Fig. 2). A decrease in mean cup vol- ume is first apparent for the left eye at 8.6 to 11.5 months with a minimum value at 11.6 to 14.5 months and a sub- sequent increase. Significant differen- ces were obtained from univariate ana- lyses of change of cup volume in the in- ferior quadrant in period 3 for the right eye comparing the placebo and timolol groups with the timolol group showing an increase while the placebo group showed a decrease from baseline (Table 11).
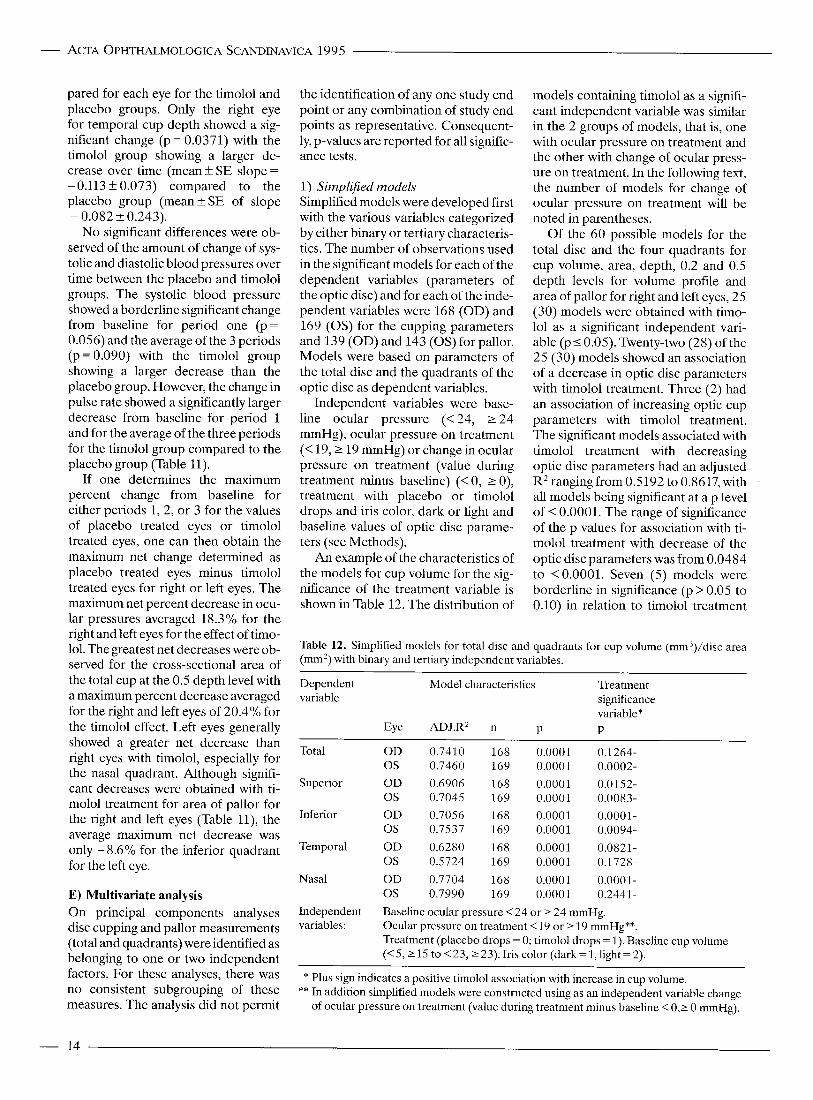
Tables 6 and 7 show the data for vol- ume profile measurements for cross- sectional area of the cup of the total disc at 0.2 and 0.5 depth levels respec- tively over time. For both depth levels, the placebo group appears to be rela- tively stable except for period 3 where there appears to be some decrease. However, the eyes treated with timolol show a decrease in cross section of the cup particularly evident in period 2. No significant differences were ob- tained on comparing the timolol and placebo groups for changes in the vol- ume profile for cross-sectional area of the cup at the 0.2 depth level. However, the comparison of the timolol and placebo groups for the 0.5 depth level for the inferior quadrants showed in period 1 a significant difference in the right eyes between the placebo and ti- molol groups with the timolol group showing a decrease in cross-sectional area from baseline while the placebo group showed an increase (Table 11, Fig. 4). For the average of the three periods, there was a similar significant difference for the right eye at the 0.5 depth level for the inferior quadrant between the timolol and placebo groups.
Table 8 shows the changes in pallor measurements over time. As noted previously at baseline, the mean values for pallor for the total disc for the left
s 0 m U ._ . m- 0 . 2 0 - E E v
a - s 9 0.15 Q
5
ACTA OPHTHALMOLOGICA SCANDINAVICA 1995 -
0 .30 j _-__ Placebo
Timolol - a- E r 0.25 8
0.10 i , I
Basellne 65.5 5.6 to 8.6 to 11.6 to 14.6 to 17.6 to 58.5 $11.5 614.5 $17.5 $24
Months in study
Fig. 3. Change of mean optic disc cup volume for total disc for left eye over time for placebo and timolol groups. The vertical bars indicate the standard error of the mean.
eye for the timolol group are greater than the right eye and are greater than the placebo group. There appears to be no significant trend over time for the mean values for pallor for the total disc of the timolol group compared to the placebo group. Significant differences were found in period 1 for change of temporal pallor for the left eye indicat- ing that the eyes on timolol showed a
a- E E -
0.3
0.2
0.1
decrease compared to baseline while there was an increase from baseline for the placebo eyes (Table 11). Similar re- sults were found for period 2 for su- perior pallor for the timolol group for the right eye and for the average of all three periods for the temporal pallor of the left eye.
The slopes for change of each optic disc parameter over time were com-
----- Placebo - Timolol
B ._ 0.0 I I I I I I I
Baseline 55.5 5.6 to 8.6 to 11.6 to 14.6 to 17.6 to c -
58.5 $11.5 514.5 517.5 ~ 2 4
Months in study
Fig. 4. Change of volume profile of mean cross-sectional cup area of inferior quadrant of optic disc for right eye at 0.5 depth over time for placebo and timolol groups. The vertical bars indicate the standard error of the mean.
13 -
- ACTA OPHTHALMOLOGICA SCANDINAVICA 1995
pared for each eye for the timolol and placebo groups. Only the right eye for temporal cup depth showed a sig- nificant change (p = 0.0371) with the timolol group showing a larger de- crease over time (mean f SE slope =
- 0.113 f 0.073) compared to the placebo group (meanfSE of slope = 0.082 f 0.243).
No significant differences were ob- served of the amount of change of sys- tolic and diastolic blood pressures over time between the placebo and timolol groups. The systolic blood pressure showed a borderline significant change from baseline for period one (p= 0.056) and the average of the 3 periods (p = 0.090) with the timolol group showing a larger decrease than the placebo group. However, the change in pulse rate showed a significantly larger decrease from baseline for period 1 and for the average of the three periods for the timolol group compared to the placebo group (Table 11).
If one determines the maximum percent change from baseline for either periods 1, 2, or 3 for the values of placebo treated eyes or timolol treated eyes, one can then obtain the maximum net change determined as placebo treated eyes minus timolol treated eyes for right or left eyes. The maximum net percent decrease in ocu- lar pressures averaged 18.3% for the right and left eyes for the effect of timo- 101. The greatest net decreases were ob- served for the cross-sectional area of the total cup at the 0.5 depth level with a maximum percent decrease averaged for the right and left eyes of 20.4% for the timolol effect. Left eyes generally showed a greater net decrease than right eyes with timolol, especially for the nasal quadrant. Although signifi- cant decreases were obtained with ti- molol treatment for area of pallor for the right and left eyes (Table l l) , the average maximum net decrease was only -8.6% for the inferior quadrant for the left eye.
E) Multivariate analysis On principal components analyses disc cupping and pallor measurements (total and quadrants) wereidentified as belonging to one or two independent factors. For these analyses, there was no consistent subgrouping of these measures. The analysis did not permit
the identification of any one study end point or any combination of study end points as representative. Consequent- ly, p-values are reported for all signific- ance tests.
1) Simplified models Simplified models were developed first with the various variables categorized by either binary or tertiary characteris- tics. The number of observations used in the significant models for each of the dependent variables (parameters of the optic disc) and for each of the inde- pendent variables were 168 (OD) and 169 (0s) for the cupping parameters and 139 (OD) and 143 (0s) for pallor. Models were based on parameters of the total disc and the quadrants of the optic disc as dependent variables.
Independent variables were base- line ocular pressure (<24, 2 2 4 mmHg), ocular pressure on treatment (< 19,2 19 mmHg) or change in ocular pressure on treatment (value during treatment minus baseline) (< 0, 2 0), treatment with placebo or timolol drops and iris color, dark or light and baseline values of optic disc parame- ters (see Methods).
An example of the characteristics of the models for cup volume for the sig- nificance of the treatment variable is shown in Table 12. The distribution of
models containing timolol as a signifi- cant independent variable was similar in the 2 groups of models, that is, one with ocular pressure on treatment and the other with change of ocular press- ure on treatment. In the following text, the number of models for change of ocular pressure on treatment will be noted in parentheses.
Of the 60 possible models for the total disc and the four quadrants for cup volume, area, depth, 0.2 and 0.5 depth levels for volume profile and area of pallor for right and left eyes, 25 (30) models were obtained with timo- lo1 as a significant independent vari- able (~10 .05 ) . Twenty-two (28) of the 25 (30) models showed an association of a decrease in optic disc parameters with timolol treatment. Three (2) had an association of increasing optic cup parameters with timolol treatment. The significant models associated with timolol treatment with decreasing optic disc parameters had an adjusted R2 rangingfrom 0.5192 to 0.8617, with all models being significant at a p level of < 0.0001. The range of significance of the p values for association with ti- molol treatment with decrease of the optic disc parameters was from 0.0484 to <0.0001. Seven (5) models were borderline in significance (p > 0.05 to 0.10) in relation to timolol treatment
Table 12. Simplified models for total disc and quadrants for cup volume (mm3)/disc area (mm') with binary and tertiary independent variables.
Dependent Model characteristics Treatment variable significance
variable* Eye ADJ.R2 n P P
Total OD 0.7410 168 0.0001 0.1264- 0s 0.7460 169 0.0001 0.0002-
Superior OD 0.6906 168 0.0001 0.0152- 0s 0.7045 169 0.0001 0.0083-
Inferior OD 0.7056 168 0.0001 0.0001- 0s 0.7537 169 0.0001 0.0094-
Temporal OD 0.6280 168 0.0001 0.0821- 0 s 0.5724 169 0.0001 0.1728-
Nasal OD 0.7704 168 0.0001 0.0001- 0s 0.7990 169 0.0001 0.2441-
Independent variables:
Baseline ocular pressure < 24 or 2 24 mmHg. Ocular pressure on treatment <19 or 2 19 mmHg"*. Treatment (placebo drops = 0; timolol drops = 1). Baseline cup volume (<S, 2 15 to < 2 3 , 2 23). Iris color (dark = 1, light = 2).
* Plus sign indicates a positive timolol association with increase in cup volume. ** In addition simplified models were constructed using as an independent variable change
of ocular pressure on treatment (value during treatment minus baseline < O , r 0 mmHg).
- 14
with 6 (3) of the 7 ( 5 ) models showing an association of a decrease in optic disc parameters with timolol treatment and one (2) showing the opposite ef- fect. Twenty-eight (25) models showed no significant effect (p > 0.10) of timo- lo1 as an independent variable.
In the simplified models the optic disc parameters that showed a predo- minance of association of timolol ther- apy with decrease in optic disc par- ameters were: cup volume significant in 6 of the 10 possiblemodels (8/10 for change in ocular pressure on treat- ment), cup depth in 7 of the possible 10 models (7/10 for change in ocular pressure on treatment) and volume profile cross sectional cup area at the 0.5 depth level, in 6 of possible 10 models (6/10 for change in ocular pressure on treatment). Parameters such as cup area, the volume profile cross sectional cup area at the 0.2 depth level and area of pallor had fewer models associated with decrease of optic disc parameters with timolol therapy.
Evaluation of the other independ- ent variables in these simplified mod- els showed that the baseline optic disc parameter was a highly significant in- dependent variable in all models irre- spective of whether timolol was signifi- cantly associated or not, so that the greater the baseline disc parameter as the independent variable during the trial, the greater the disc parameter as the dependent variable.
In one of each of the timolol signifi- cant models, both for ocular pressure and change of ocular pressure on treat- ment, the baseline ocular pressure ap- peared as a significant variable. In the first instance in the model with ocular pressure on treatment (timolol or placebo) with an increase in baseline pressure there was a decrease in the disc parameters. Secondly, in the model with change of ocular pressure on treatment with an increase in ba- seline ocular pressure there was in in- crease in the optic disc parameters. The iris color, light or dark, did not show any constant pattern in the timolol sig- nificant models. In the borderline signi- ficant and the non-significant timolol models, baseline ocular pressure, as well as iris color occurred significantly in only a few of the 35 (30) models.
Ocular pressure on treatment as a
ACTA OPHTHALMOLOGICA SCANDINAVICA 1995 -
significant independent variable oc- curred only in one of the 25 significant simplified timolol models with the greater the pressure, the greater the disc parameter.
In the timolol significant simplified models in which change of ocular pressure was substituted for ocular pressure on treatment, change of ocu- lar pressure occurred as a significant independent variable in 12 of the 30 ti- molol significant models. In ll of the 12 models its sign as an independent variable was negative indicating that a decrease in ocular pressure was associ- ated with an increase in optic disc par- ameters. Furthermore, this negative association of change of ocular press- ure with increasing optic disc parame- ters in the timolol significant models was found to be borderline in signific- ance (p = 0.066). In the borderline sig- nificant and the non-significant timolol models, ocular pressure on treatment and change in ocular pressure on treat- ment only occurred significantly in a few of the 35 (30) models.
2) Complex models In addition to the variables in the sim- plified model, additional independent variables were added to develop more complex binary and tertiary models. The number of observations for each of the dependent variables (parame- ters of the optic disc) and for each of the independent variables was 144 for the cupping parameters for each eye and 140 (OD) and 144 (0s) for pallor. The additional variables were gender, baseline age, baseline systolic and diastolic blood pressures, baseline pulse rate, change of systolic and dias- tolic blood pressures and pulse rate and change in disc parameter (see Methods).
Of the 60 possible models for the total disc and its four quadrants, 30 models for ocular pressure on treat- ment, timolol or placebo, (32 for change of ocular pressure) were asso- ciated with a change of disc parameters with timolol as an independent signifi- cant variable (p 5 0.05). For the com- plex models, the adjusted R2 for timo- lo1 as a significant independent vari- able associated with a decrease in optic disc parameters ranged from 0.7685 to 0.9510 with p values ranging form 0.0499 to < 0.001.
Of the 30 (32) models, 23 (22) were associated with a decrease in the optic disc parameters with timolol therapy and 7 (10) were associated with an in- crease of optic disc parameters. In ad- dition, 9 ( 5 ) were borderline (p>O.O5 to 0.10) with timolol as a significant in- dependent variable with 6 (4) of the 9 models showing an association of a de- crease in optic disc parameter with ti- molol treatment and 3 (1) showing the opposite effect. Twenty-one (23) mod- els were not significantly associated (p > 0.10) with timolol as an independent variable.
Similar to the simplified models, a decrease in the optic disc volume was associated in 8 of the 10 (5/10 for change in ocular pressure on treat- ment) possible models with timolol as a significant independent variable. The volume profile cross sectional cup area at 0.5 depth was associated in 7 of the 10 models (7/10 for change in ocular pressure on treatment) with timolol as an independent variable. The other optic disc parameters showed cup area 6 out of 10 (7 for change in ocular pressure on treatment), 0.2 volume profile cross sectional cup area was 2 out of 10 (4/10 for change in ocular pressure on treatment), depth was 3 out of 10 (5/10 for change in ocular pressure on treatment) and pallor was 4 out of 10 (4/10 for change in ocular pressure on treatment).
An evaluation of the other inde- pendent variables in these complex models again showed the baseline optic disc cup parameter occurring in all models so that the larger the ba- seline disc parameter as the independ- ent variable, the larger the dependent variable of the measured disc par- ameter during the trial. The baseline area of pallor also was highly associ- ated with the dependent variable in 43 (44 for the change in ocular pressure on treatment models) of the 60 models for ocular pressure on treatment.
Of the models that contained timo- lo1 as a significant independent vari- able, the baseline ocular pressure was only significant in 9 of the 30 models with ocular pressure on treatment (10/30 for change in ocular pressure on treatment) and positive in 7 (8) so that the greater the baseline ocular pressure, the larger, the dependent variable of the disc parameter and ne-
15 -
ACTA OPHTHALMOLOGICA SCANDINAVICA 1995
gative in 2 (2) so that the greater the ba- seline ocular pressure, the less the disc parameter. Six (7) of the 7 (8) positive models occurred in models where ti- molol showed a treatment effect of de- creasing optic disc parameters. The models which were borderline signifi- cant or non-significant for timolol had baseline ocular pressure as a signifi- cant variable in only 3 (5) models, 2 (4) positive and 1 (1) negative.
The distribution of baseline ocular pressure as significantly associated with the effect of timolol on decreasing optic disc parameters was borderline in significance for models with ocular pressure on treatment (p = 0.0582) as well as for models with change in ocu- lar pressureon treatment (p = 0.0784).
For the independent variable of ocular pressure on treatment in the ti- molol significant models, increased ocular pressure on timolol therapy was associated with a decrease in optic disc parameters in 3 of the 30 timolol signi- ficant models and a decreased ocular pressure was associated with an in- creased optic disc parameter in only one model. In the models in which change of ocular pressure was sub- stituted for ocular pressure on treat- ment, change of ocular pressure oc- curred as a significant independent variable in 13 of the 32 timolol signifi- cant models. In 5 of the 13 models, its sign as an independent variable was negative and in 8 of the 13 models the sign was positive, i.e., a decrease of ocular pressure was associated with a decrease in optic disc cupping. None of the distributions of ocular pressure on treatment or change of ocular press- ure on treatment were significantly as- sociated with an effect of timolol on decreasing optic disc parameters.
In the timolol borderline significant models ocular pressure on treatment did not occur as a significant inde- pendent variable in any of the 9 models for timolol significance with ocular pressure on treatment while in the models with change in ocular pressure on treatment, the variable change of ocular pressure occurred only once so that a decrease in ocular pressure was associated with an increase in optic disc parameter. In the timolol non-sig- nificant models the ocular pressure on timolol or placebo therapy occurred in only one of the 21 models as a signifi-
cant positive independent variable while in the models with change in ocu- lar pressure as an independent vari- able, this variable occurred signifi- cantly in 12 of the 23 models so that in 10 models a decrease in ocular press- ure was associated with an increase in optic disc parameter and in 2 models the opposite occurred.
None of the other independent vari- ables within the timolol significant models showed a significant associ- ation with timolol on decreasing optic disc parameters except for change in pulse rate in which 8 of the 30 signifi- cant timolol models with the models containing ocular pressure on treat- ment as an independent variable showed that a greater decrease in pulse rate was associated with a smaller optic disc parameter. In the timolol signifi- cant models with change of ocular pressure on treatment as an independ- ent variable, there were 6 out of 32 sig- nificant models which showed a similar association. The distribution for change in pulse rate in the timolol sig- nificant models as being associated with the effect of timolol on decreasing optic disc parameters was significant for the ocular pressure on treatment models (p = 0.0413) and borderline significant for the change in ocular pressure on treatment models (p= 0.07 7 2).
Another independent significant variable was change of the baseline disc parameter so that in 22 of the 30 significant timolol models with ocular pressure on treatment (22 of 32 for change of ocular pressure on treat- ment), the larger the disc parameter as a dependent variable the less the change in disc parameter. Larger measurements of the dependent disc variable were associated with smaller decreases of the disc parameter and smaller measurements of disc parame- ters were associated with larger de- creases of the disc parameter.
The multivariate models pointed to the occurrence of significance far more than would be expected by chance alone (p 5 0.05). Since correlations were expected between the end points under study, i.e., the optic disc parame- ters, a conservative adjustment is war- ranted to compensate for repetitive tests. A binomial test was used to make a calculation based on a reduced num-
ber of independent tests. For the sim- plified models (total disc and all quad- rants), if 10% of the tests were inde- pendent (considering the 60 possible end points to consist of just 6 inde- pendent end points), then the results for a decrease in these parameters with timolol treatment would still have been significant (p < 0.0006). By chance alone, if there were 6 independent tests among 60 significance tests (22 signifi- cant among 60 tests), then 6 X 0.05 = 0.3 tests would be significant by chance (in contrast to 2.2 observed tests of sig- nificance among 6 tests of signific- ance). The significance of this event (2.2 observed versus 0.3 expected) would be p = 0.0006. For both cup vol- ume and volume profile (0.5 depth), if 20% of the tests were significant, then both p-values would be 0.0006. For cup depth, the p-value would be 0.0001. Thus, significance would hold for a relatively low percentage of inde- pendent tests. Similar reasoning sup- ports the effect of timolol treatment for the complex models for total disc and all quadrants, cup volume, and volume profile (0.5 depth), and for the signific- ance of baseline area of pallor, ocular pressure, and iris color.
Discussion These results indicate that decreases of cupping and pallor in ocular hyper- tensives are associated with timolol treatment. The effect of timolol on cupping was more pronounced for cup volume and the volume profile cross sectional cup area at 0.5 depth espe- cially as shown with the multivariate analyses. The effect of timolol on pal- lor area was more consistently ob- served in the univariate analyses (Table 11). The effect of timolol on de- creasing the volume of the cup was mostly by decreasing its depth (Table 4) and the cross sectional area of the cup of 0.5 depth near the bottom of the cup (Table 7) as well as a significant larger slope for the change of temporal cup depth over time compared to the placebo group. Furthermore, we ob- served significant decreases in quad- rants of the disc both on univariate and multivariate analysis which did not occur in the total disc suggesting that localized changes were occurring in
16
the disc both for the placebo and timo- lo1 groups.
For baseline ocular pressure the as- sociation of a timolol effect with de- creasing optic disc parameters was only borderline in significance. Even though there was a consistent decrease in ocular pressure in the timolol treated group, compared to the placebo group, there was no significant association of the ocular pressure on treatment or the pressure decrease on treatment during the trial with the de- crease of the optic disc parameters. In fact, for the simplified models on uni- variate analysis the decrease in ocular pressure in the timolol significant models was associated with a border- line significant increase in optic disc parameter.
The most significant association of the parameters of the optic disc as a de- pendent variable was with the baseline or pre-study values of the optic disc as an independent variable indicating that the greater the baseline cupping and pallor, the greater the cupping and pallor during the trial. Similarly, smal- ler measurements of cupping and pal- lor as the independent variable were also associated with larger decreases of cupping and pallor. This suggests that stage of the disease as indicated by the amount of cupping and pallor may be related to the effect of timolol with a greater effect in an early stage of dis- ease where there is less cupping and pallor.
Age, gender and iris color as well as baseline systolic and diastolic blood pressure and pulse rate and changes in systolic and diastolic blood pressure were not significant independent vari-
ables in the multivariate models asso- ciating optic disc cupping and pallor with the effect of timolol. However change in pulse rate showed a signifi- cant association with the timolol effect on decreasing optic disc parameter so that a greater decrease in pulse rate was associated with a decrease in the optic disc parameter.
The analysis of a study with multiple end points can result in spurious claims of significance by chance alone. Results of principal components ana- lyses did not identify any dependent relationships among disc cupping or pallor measurements either for indi- vidual quadrants or for the total disc. Within the factors identified, end points had similar importance; conse- quently, p-values clearly reflect some dependence. To adjust for this situ- ation, a binomial test was used to allow for a small number of independent tests. For the simplified models (total disc and all quadrants, cup volume, cup depth, and 0.5 depth volume profile), if only 20% of the tests were independent (considering the 10 possible tests to consist of just 2 inde- pendent tests), then the results for a de- crease in these parameters for timolol treatment would still have been signifi- cant (p = 0.0006). Similar reasoning supports the effect of timolol treat- ment for the complex models for total disc and all quadrants, cup volume, and volume profile (0.5 depth) and for the significance of baseline area of pal- lor, ocular pressure, and iris color.
Several other clinical trials have been recently published in detail on the effect of timolol drops in the treatment of ocular hypertensives in relation to
Table 13. Criteria for inclusion of ocular hypertensive subjects in timolol trials.
Ocular pressure Visual fields
ACTA OPHTHALMOLOGICA SCANDINAVICA 1995 -
-
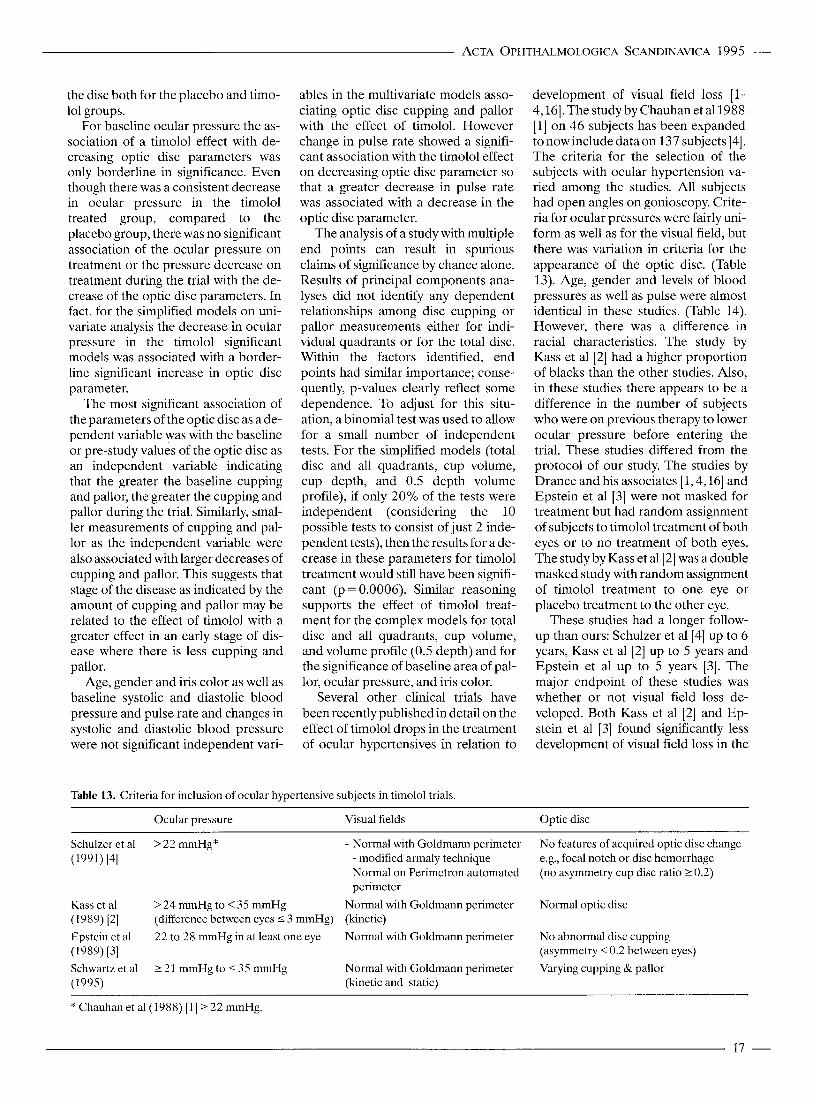
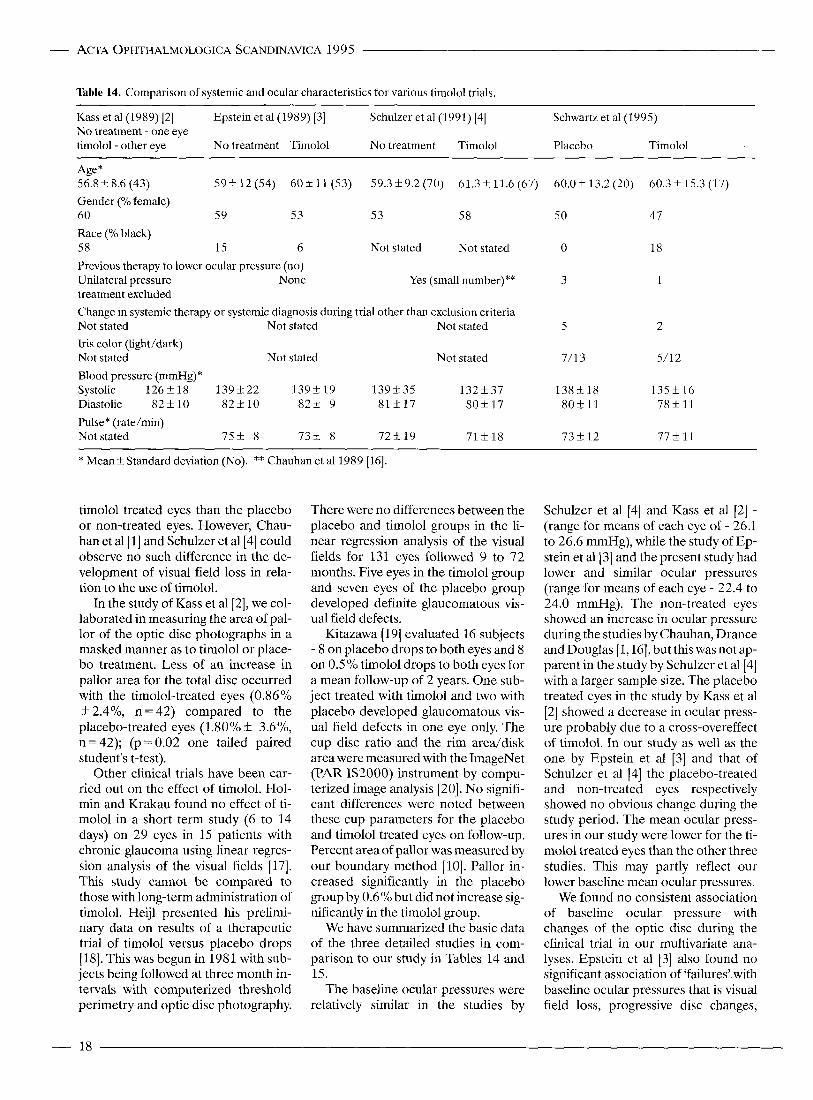
development of visual field loss [l- 4,161. The study by Chauhan et a1 1988 [l] on 46 subjects has been expanded to now include dataon 137 subjects [4]. The criteria for the selection of the subjects with ocular hypertension va- ried among the studies. All subjects had open angles on gonioscopy. Crite- ria for ocular pressures were fairly uni- form as well as for the visual field, but there was variation in criteria for the appearance of the optic disc. (Table 13). Age, gender and levels of blood pressures as well as pulse were almost identical in these studies. (Table 14). However, there was a difference in racial characteristics. The study by Kass et al [2] had a higher proportion of blacks than the other studies. Also, in these studies there appears to be a difference in the number of subjects who were on previous therapy to lower ocular pressure before entering the trial. These studies differed from the protocol of our study. The studies by Drance and his associates [ 1,4,16] and Epstein et a1 [3] were not masked for treatment but had random assignment of subjects to timolol treatment of both eyes or to no treatment of both eyes. The study by Kass et a1 [2] was a double masked study with random assignment of timolol treatment to one eye or placebo treatment to the other eye.
These studies had a longer follow- up than ours: Schulzer et al [4] up to 6 years, Kass et a1 [2] up to 5 years and Epstein et a1 up to 5 years [3]. The major endpoint of these studies was whether or not visual field loss de- veloped. Both Kass et al [2] and Ep- stein et al [3] found significantly less development of visual field loss in the
Optic disc
Schulzer et a1 (1991) [41
Kass et a1
Epstein et al
Schwartz et al (19%)
(1989) [2]
(1989) [31
> 22 mmHg* - Normal with Goldmann perimeter
- Normal on Perimetron automated
Normal with Goldmann perimeter (kinetic) Normal with Goldmann perimeter
Normal with Goldmann perimeter (kinetic and static)
No features of acquired optic disc change e.g., focal notch or disc hemorrhage (no asymmetry cup disc ratio 2 0.2)
Normal optic disc
No abnormal disc cupping (asymmetry < 0.2 between eyes) Varying cupping & pallor
- modified armaly technique
perimeter > 24 mmHg to < 35 mmHg (difference between eyes 5 3 mmHg) 22 to 28 mmHg in at least one eye
2 21 mmHg to I 3 5 mmHg
* Chauhan et a1 (1988) [l] 2 22 mmHg.
17 -
ACTA OPHTHALMOLOGICA SCANDINAWCA 1995
Table 14. Comparison of systemic and ocular characteristics for various timolol trials. ~~~
Kass et al (1989) [2] No treatment - one eye timolol- other eye No treatment Timolol No treatment Timolol Placebo Timolol
Epstein et a1 (1989) [3] Schulzer et a1 (1991) [4] Schwartz et al(1995)
Age * 56.8 f 8.6 (43) 59f12(.54) 6 0 f 1 1 (53) 59.3f9.2(70) 61.3f11.6(67) Gender (% female) 60 59 53 53 58 Race (% black) 58 15 6 Not stated Not stated Previous therapy to lower ocular pressure (no) Unilateral pressure None Yes (small number)"" treatment excluded Change in systemic therapy or systemic diagnosis during trial other than exclusion criteria Not stated Not stated Not stated Iris color (light/dark) Not stated Not stated Not stated Blood pressure (mmHg)* Systolic 1 2 6 f 1 8 1 3 9 f 2 2 139+19 139 + 35 132 f 37 Diastolic 82 f 10 82+10 82+ 9 81 + 17 8 0 f 1 7 Pulse* (rate/min) Not stated 7.5f 8 73+ 8 72+19 71 f 18
60.0 f 13.2 (20)
50
0
3
5
7/13
138k 18 80411
73 + 12
60.3f 1.5.3 (17)
47
18
1
2
5/12
135 f 16 7 8 f l 1
77+ 11
* Mean k Standard deviation (No). ** Chauhan et al 1989 1161.
timolol treated eyes than the placebo or non-treated eyes. However, Chau- han et a1 [l] and Schulzer et all41 could observe no such difference in the de- velopment of visual field loss in rela- tion to the use of timolol.
In the study of Kass et a1 [2], we col- laborated in measuring the area of pal- lor of the optic disc photographs in a masked manner as to timolol or place- bo treatment. Less of an increase in pallor area for the total disc occurred with the timolol-treated eyes (0.86 '/o
f 2.4%, n = 42) compared to the placebo-treated eyes (1.80% * 3.6%, n=42); (p=O.O2 one tailed paired student's t-test).
Other clinical trials have been car- ried out on the effect of timolol. Hol- min and Krakau found no effect of ti- molol in a short term study (6 to 14 days) on 29 eyes in 15 patients with chronic glaucoma using linear regres- sion analysis of the visual fields [17]. This study cannot be compared to those with long-term administration of timolol. Heijl presented his prelimi- nary data on results of a therapeutic trial of timolol versus placebo drops (181. This was begun in 1981 with sub- jects being followed at three month in- tervals with computerized threshold perimetry and optic disc photography.
There were no differences between the placebo and timolol groups in the li- near regression analysis of the visual fields for 131 eyes followed 9 to 72 months. Five eyes in the timolol group and seven eyes of the placebo group developed definite glaucomatous vis- ual field defects.
Kitazawa [19] evaluated 16 subjects - 8 on placebo drops to both eyes and 8 on 0.5% timolol drops to both eyes for a mean follow-up of 2 years. One sub- ject treated with timolol and two with placebo developed glaucomatous vis- ual field defects in one eye only. The cup disc ratio and the rim area/disk area were measured with the ImageNet (PAR IS2000) instrument by compu- terized image analysis [20]. No signifi- cant differences were noted between these cup parameters for the placebo and timolol treated eyes on follow-up. Percent area of pallor was measured by our boundary method [lo]. Pallor in- creased significantly in the placebo group by 0.6 '/o but did not increase sig- nificantly in the timolol group.
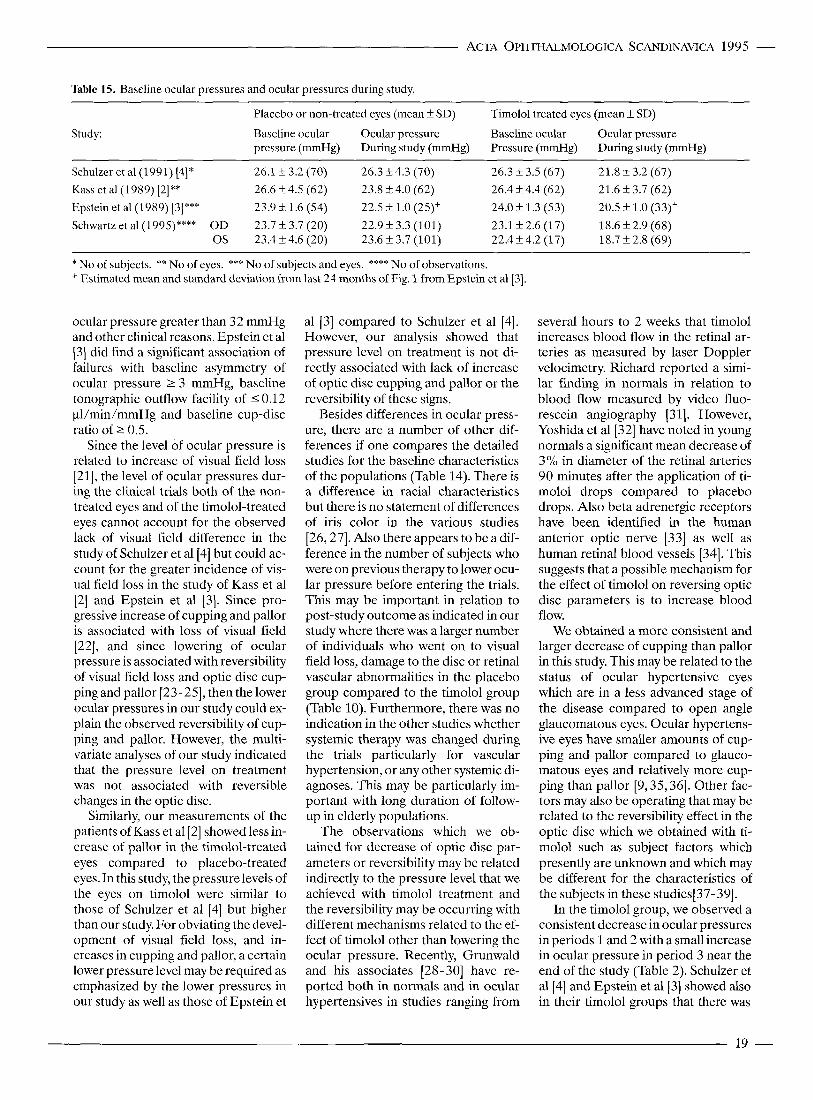
We have summarized the basic data of the three detailed studies in com- parison to our study in Tables 14 and 15.
The baseline ocular pressures were relatively similar in the studies by
Schulzer et a1 [4] and Kass et a1 [2] - (range for means of each eye of - 26.1 to 26.6 mmHg), while the study of Ep- stein et al[3] and the present study had lower and similar ocular pressures (range for means of each eye - 22.4 to 24.0 mmHg). The non-treated eyes showed an increase in ocular pressure during the studies by Chauhan, Drance and Douglas [ 1,161, but this was not ap- parent in the study by Schulzer et a1 [4] with a larger sample size. The placebo treated eyes in the study by Kass et al [2] showed a decrease in ocular press- ure probably due to a cross-overeffect of timolol. In our study as well as the one by Epstein et a1 [3] and that of Schulzer et a1 [4] the placebo-treated and non-treated eyes respectively showed no obvious change during the study period. The mean ocular press- ures in our study were lower for the ti- molol treated eyes than the other three studies. This may partly reflect our lower baseline mean ocular pressures.
We found no consistent association of baseline ocular pressure with changes of the optic disc during the clinical trial in our multivariate ana- lyses. Epstein et a1 [3] also found no significant association of 'failures' with baseline ocular pressures that is visual field loss, progressive disc changes,
- 18
ACTA OPHTHALMOLOGICA SCANDINAVICA 1995 -
Table 15. Baseline ocular pressures and ocular pressures during study.
Study:
Placebo or non-treated eyes (mean k SD)
Baseline ocular Ocular pressure Baseline ocular Ocular pressure pressure (mmHg) During study (mmHg) Pressure (mmHg) During study (mmHg)
Timolol treated eyes (mean k SD)
Schulzer et al(l991) [4]* 26.1 t 3.2 (70) 26.3 f 4.3 (70) 26.3 !L 3.5 (67) 21.8 k 3.2 (67) Kass et a1 ( 1 989) [2]** 21.6 !L 3.7 (62) Epstein et a1 (1989) (,I*** 23.9 +_ 1.6 (54) 22.5 31 1.0 (25)' 24.0f1.3 (53) 20.5 f 1.0 (33)' Schwartz et al(1995)**** O D 23.7 f 3.7 (20) 22.9 k 3.3 (101) 23.1 f 2.6 (17) 18.6 f 2.9 (68)
OS 23.4 f 4.6 (20) 23.6 f 3.7 (101) 22.4f4.2 (17) 18.7k2.8 (69)
26.6 k 4.5 (62) 23.8 f 4.0 (62) 26.4 k 4.4 (62)
* N o of subjects. ** No of eyes. *** No of subjects and eyes. **** No of observations. ' Estimated mean and standard deviation from last 24 months of Fig. 1 from Epstein et al[3]
ocular pressure greater than 32 mmHg and other clinical reasons. Epstein et a1 [ 3) did find a significant association of failures with baseline asymmetry of ocular pressure 2 3 mmHg, baseline tonographic outflow facility of 50.12 pl/min/mmHg and baseline cup-disc ratio of 2 0.5.
Since the level of ocular pressure is related to increase of visual field loss [21], the level of ocular pressures dur- ing the clinical trials both of the non- treated eyes and of the timolol-treated eyes cannot account for the observed lack of visual field difference in the study of Schulzer et a1 [4] but could ac- count for the greater incidence of vis- ual field loss in the study of Kass et a1 [2] and Epstein et a1 [3]. Since pro- gressive increase of cupping and pallor is associated with loss of visual field [22], and since lowering of ocular pressure is associated with reversibility of visual field loss and optic disc cup- ping and pallor [23-251, then the lower ocular pressures in our study could ex- plain the observed reversibility of cup- ping and pallor. However, the multi- variate analyses of our study indicated that the pressure level on treatment was not associated with reversible changes in the optic disc.
Similarly, our measurements of the patients of Kass et a1 [2] showed less in- crease of pallor in the timolol-treated eyes compared to placebo-treated eyes. In this study, the pressure levels of the eyes on timolol were similar to those of Schulzer et a1 [4] but higher than our study. For obviating the devel- opment of visual field loss, and in- creases in cupping and pallor, a certain lower pressure level may be required as emphasized by the lower pressures in our study as well as those of Epstein et
a1 131 compared to Schulzer et a1 [4]. However, our analysis showed that pressure level on treatment is not di- rectly associated with lack of increase of optic disc cupping and pallor or the reversibility of these signs.
Besides differences in ocular press- ure, there are a number of other dif- ferences if one compares the detailed studies for the baseline characteristics of the populations (Table 14). There is a difference in racial characteristics but there is no statement of differences of iris color in the various studies [26,27]. Also there appears to be a dif- ference in the number of subjects who were on previous therapy to lower ocu- lar pressure before entering the trials. This may be important in relation to post-study outcome as indicated in our study where there was a larger number of individuals who went on to visual field loss, damage to the disc or retinal vascular abnormalities in the placebo group compared to the timolol group (Table 10). Furthermore, there was no indication in the other studies whether systemic therapy was changed during the trials particularly for vascular hypertension, or any other systemic di- agnoses. This may be particularly im- portant with long duration of follow- up in elderly populations.
The observations which we ob- tained for decrease of optic disc par- ameters or reversibility may be related indirectly to the pressure level that we achieved with timolol treatment and the reversibility may be occurring with different mechanisms related to the ef- fect of timolol other than lowering the ocular pressure. Recently, Grunwald and his associates [28-301 have re- ported both in normals and in ocular hypertensives in studies ranging from
several hours to 2 weeks that timolol increases blood flow in the retinal ar- teries as measured by laser Doppler velocimetry. Richard reported a simi- lar finding in normals in relation to blood flow measured by video fluo- rescein angiography [3 11. However, Yoshida et al [32] have noted in young normals a significant mean decrease of 3% in diameter of the retinal arteries 90 minutes after the application of ti- molol drops compared to placebo drops. Also beta adrenergic receptors have been identified in the human anterior optic nerve [33] as well as human retinal blood vessels (341. This suggests that a possible mechanism for the effect of timolol on reversing optic disc parameters is to increase blood flow.
We obtained a more consistent and larger decrease of cupping than pallor in this study. This may be related to the status of ocular hypertensive eyes which are in a less advanced stage of the disease compared to open angle glaucomatous eyes. Ocular hypertens- ive eyes have smaller amounts of cup- ping and pallor compared to glauco- matous eyes and relatively more cup- ping than pallor [9,35,36]. Other fac- tors may also be operating that may be related to the reversibility effect in the optic disc which we obtained with ti- molol such as subject factors whch presently are unknown and which may be different for the characteristics of the subjects in these studies[37-39].
In the timolol group, we observed a consistent decrease in ocular pressures in periods 1 and 2 with a small increase in ocular pressure in period 3 near the end of the study (Table 2). Schulzer et al[4] and Epstein et a1 [3] showed also in their timolol groups that there was
19 -
an increase in mean ocular pressures beginning at 12 months. The increase in pressures in the timolol groups could be explained by a decrease in compliance in taking the timolol drops near the end of the study [40]. The greatest decrease of mean values of the optic disc parameters seemed to occur at about 15 months (Figs. 2 to 4) The effect of reversibility is apparently pro- gressive reaching its maximum at this time. The subsequent increase in optic disc cupping and pallor may be related to a coinciding increase in ocular pressure or lack of compliance when the subjects reach the end of the clini- cal trial as well as a decrease in the sample size or number of subjects due to dropout of the subjects. This sug- gests that in future long-term clinical trials, compliance should be moni- tored.
Of particular interest in this study, was the differences observed in post- study outcome, particularly in subjects who were on placebo therapy com- pared to timolol therapy (Table lo), with about 4 years of follow-up. The eyes on placebo therapy had a higher incidence of treatment to lower ocular pressure, primarily for increased ocu- lar pressure, as well as for various reti- nal vascular abnormalities. Although the sample sizes were small, one must consider whether the timolol therapy protected this group for the period of time in the trial compared to the placebo group who was exposed to fur- ther ocular consequences since they were not protected by the timolol ther- apy. Schulzer et a1 [4] also followed 39 of their 42 subjects from 8 months to 3 years after the clinical trial who de- veloped study end points, i.e., change in visual field or disc. Twenty-six of the 39 patients (67%) were subsequently clinically labeled as having glaucoma and presumably were treated. Sixteen were in the treatment group and 10 were in the untreated control group. However, it is difficult to compare this outcome with the outcome in our study since we obtained follow-up on almost all of our subjects.
Both the present study and the study by Epstein et a1 [3] did not find an asso- ciation of baseline ocular pressure either with a frequent decrease in cup- ping and pallor of the optic disc or number of ‘failures’ especially for vis-
ual field loss and glaucomatous disc changes. However, both studies did find that the baseline characteristics of the disc such as cupping and pallor in the present study and baseline cup disc ratio 2 0.5 in the study by Epstein et a1 [3] were associated with smaller de- creases of cupping and pallor of the disc or number of ‘failures’, respec- tively. This suggests that a better pre- dictor for the effect of timolol treat- ment on subsequent changes in the vis- ual field or optic disc would be the ba- seline disc characteristics rather than the baseline ocular pressures.
Spaeth [41] has elucidated the con- cept that the effectiveness of therapy for glaucoma can be judged by the ob- tainment of reversibility of the loss of visual field and the abnormality of the optic disc. The use of this principle suggests that timolol is an effective treatment for ocular hypertension as shown by the association of decrease of optic disc cupping and pallor in this study with treatment by timolol.
The reproducibility of our methods allows us to detect small changes in the optic disc and its quadrants which are significant and relatively consistent over time. Therefore, the application of such methods which are sensitive and reproducible to clinical trials would allow the observation of signifi- cant changes in the optic disc in a shor- ter time with fewer subjects required compared to trials needed to detect changes in the visual fields. Further- more, these methods are relatively ob- jective for evaluation of efficacy of treatment. This study limited itself to changes in the optic disc and to only one beta-blocker drug namely timolol. Whether similar changes in the optic disc occur with other beta-blockers would have to be shown with specific studies using these drugs since beta- blockers differ in many of their charac- teristics [42].
Acknowledgments Supported in part by a grant from Merck and Company, Inc., Medical and Scientific Af- fairs, Human Health Division, Clinical De- velopment, West Point, PA and by grant EY- 00936, from the National Institutes of Health, Bethesda, MD.
References 1. Chauhan BC, Drance SM, Douglas GR.
The effect of long-term intraocular pressure reduction on the differential light sensitivity in glaucoma suspects. In- vest Ophthalmol Vis Sci 1988; 29: 1478- 85.
2. Kass MA, Gordon MO, Hoff MR, et al. Topical timolol administration reduces the incidence of glaucomatous damage in ocular hypertensive individuals. A randomized, doublemasked, long-term clinical trial. Arch Ophthalmol 1989;
3. Epstein DL, Krug JH Jr, Hertzmark E, et al. A long-term clinical trial of timolol
107: 1590-8.
therapy versus no treatment in the man- agement of glaucoma suspects. Oph- thalmology 1989; 96: 1460-7.
4. Schulzer M, Drance SM, Douglas FT. A comparison of treated and untreated glaucoma suspects. Ophthalmology
5. Schwartz B. Cupping and pallor of the optic disc. Arch Ophthalmol 1973; 89:
6. Scheie HG. Width and pigmentation of the angle of the anterior chamber. A sys-
1991; 98: 301-7.
272-7.
tem of grading by gonioscopy. Arch Ophthalmol 1956; 58: 510-2.
7. Donaldson DD, Prescott R, Kennedy S. Simultaneous stereoscopic fundus camera incorporating a single optical axis. Invest Ophthalmol Vis Sci 1980;
8. Takamoto T, Schwartz B. Reproduci- 19: 289-97.
bility of photogrammetric optic disc cup measurements. Invest Ophthalmol Vis Sci 1985; 26: 814-7.
9. Takamoto T, Schwartz B. Stereo measurement of the optic disc cup shape: volume profile method. In: American Society of Photogrammetry. Technical Papers of the 50th Annual Meeting. Falls Church, VA: The Society,
10. Nagin P, Schwartz B, Nanba K. The re- producibility of computerized bound-
1984; 352-8.
ary analysis for measuring optic disc pal- lor in the normal optic disc. Ophthalmo- logy 1985; 92: 243-51.
11. Murphy EA. Biostatistics in Medicine. Baltimore: Johns Hopkins University Press, 1982.
12. Mehta CR, Patel NR, Tsiatis AA. Exact significance testing to establish treat- ment equivalence for ordered categori- cal data. Biometrics 1984; 40: 819-25.
13. Ware JH. Linear models for the analysis of longitudinal studies. Am Statist 1985;
14. Kim J-0, Mueller CW. Factor Analysis: Statistical Methods and Practical Issues. Beverly Hills, CA: Sage, 1978; 14-36.
39: 95-101.
- ACTA OPHTHALMOLOGICA SCANDINAVICA 1995
- 20
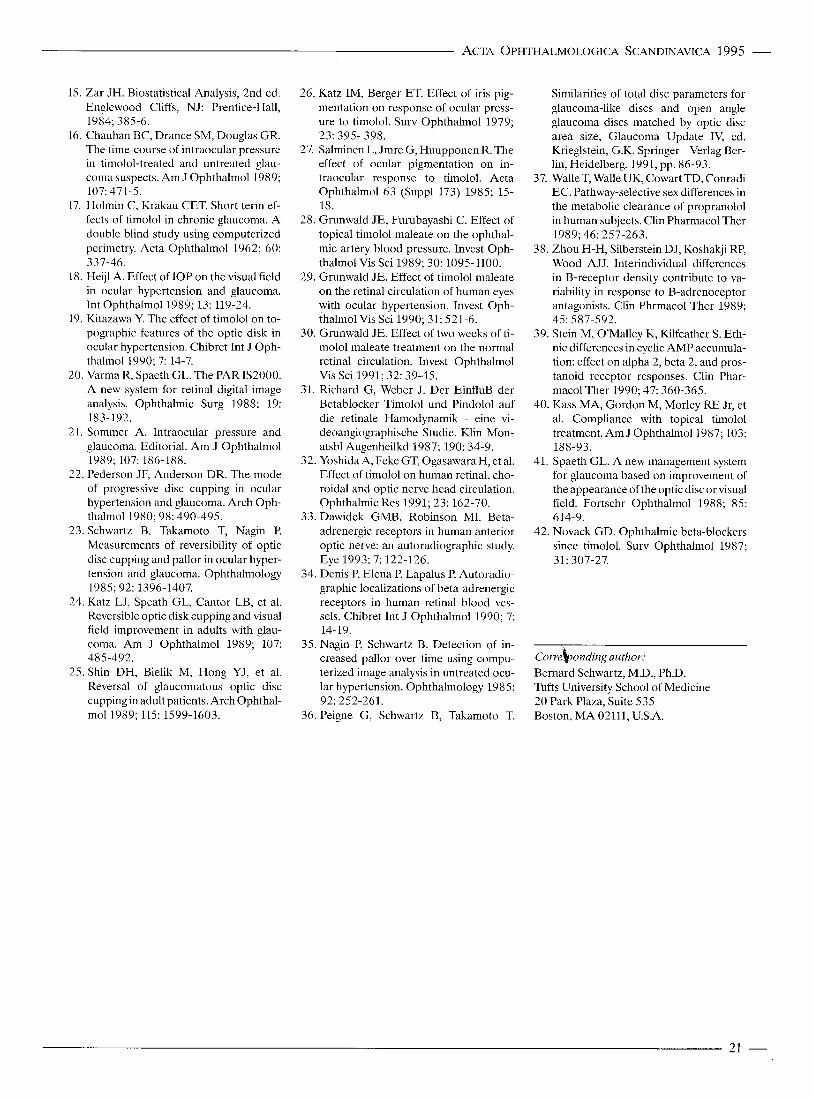
ACTA OPHTHALMOLOGICA SCANDINAVICA 1995 -
15. Zar JH. Biostatistical Analysis, 2nd ed. Englewood Cliffs, NJ: Prentice-Hall,
16. Chauhan BC, Drance SM, Douglas GR. The time-course of intraocular pressure in timolol-treated and untreated glau- coma suspects. Am J Ophthalmol 1989;
17. Holmin C, Krakau CET. Short term ef- fects of timolol in chronic glaucoma. A double blind study using computerized perimetry. Acta Ophthalmol 1962; 60:
18. Heijl A. Effect of 1OP on the visual field in ocular hypertension and glaucoma. lilt Ophthalmol 1989; 13: 119-24.
19. Kitazawa Y. The effect of timolol on to- pographic features of the optic disk in ocular hypertension. Chibret Int J Oph- thalmol 1990; 7: 14-7.
20. Varma R, Spaeth GL. The PAR IS2000. A new system for retinal digital image analysis. Ophthalmic Surg 1988; 19:
2 I . Sommer A. Intraocular pressure and glaucoma. Editorial. Am J Ophthalmol
22. Pederson JF, Anderson DR. The mode of progressive disc cupping in ocular hypertension and glaucoma. Arch Oph- thalmol 1980; 98: 490-495.
23. Schwartz B, Takamoto T, Nagin P. Measurements of reversibility of optic disc cupping and pallor in ocular hyper- tension and glaucoma. Ophthalmology
24. Katz LJ, Speath GL, Cantor LB, et al. Reversible optic disk cupping and visual field improvement in adults with glau- coma. Am J Ophthalmol 1989; 107:
25. Shin DH, Bielik M, Hong YJ, et al. Reversal of glaucomatous optic disc cupping in adult patients. Arch Ophthal- mol 1989; 115: 1599-1603.
1984; 385-6.
107: 471-5.
337-46.
183- 192.
1989; 107: 186-188.
1985; 92: 1396-1407.
485-492.
26. Katz IM, Berger ET. Effect of iris pig- mentation on response of ocular press- ure to timolol. Surv Ophthalmol 1979;
27. Salminen L, Jmre G, Huupponen R. The effect of ocular pigmentation on in- traocular response to timolol. Acta Ophthalmol 63 (Suppl 173) 1985; 15- 18.
28. Grunwald JE, Furubayashi C. Effect of topical timolol maleate on the ophthal- mic artery blood pressure. Invest Oph- thalmol Vis Sci 1989; 30: 1095-1100.
29. Grunwald JE. Effect of timolol maleate on the retinal circulation of human eyes with ocular hypertension. Invest Oph- thalmol Vis Sci 1990; 31: 521-6.
30. Grunwald JE. Effect of two weeks of ti- molol maleate treatment on the normal retinal circulation. Invest Ophthalmol Vis Sci 1991; 32: 39-45.
31. Richard G, Weber J. Der EinfluB der Betablocker Timolol und Pindolol auf die retinale Hamodynamik - eine vi- deoangiographische Studie. Klin Mon- atsbl Augenheilkd 1987; 190: 34-9.
32. Yoshida A, Feke GT, Ogasawara H, et al. Effect of timolol on human retinal, cho- roidal and optic nerve head circulation. Ophthalmic Res 1991; 23: 162-70.
33. Dawidek GMB, Robinson MI. Beta- adrenergic receptors in human anterior optic nerve: an autoradiographic study. Eye 1993; 7: 122-126.
34. Denis P, Elena P, Lapalus P. Autoradio- graphic localizations of beta-adrenergic receptors in human retinal blood ves- sels. Chibret Int J Ophthalmol 1990; 7:
35. Nagin P, Schwartz B. Detection of in- creased pallor over time using compu- terized image analysis in untreated ocu- lar hypertension. Ophthalmology 1985;
36. Peigne G, Schwartz B, Takamoto T.
23: 395- 398.
14-19.
92: 252-261.
Similarities of total disc parameters for glaucoma-like discs and open angle glaucoma discs matched by optic disc area size, Glaucoma Update IV, ed. Krieglstein, G.K. Springer - Verlag Ber- lin, Heidelberg. 1991, pp. 86-93.
37. Walle T, Walle UK, Cowart TD, Conradi EC. Pathway-selective sex differences in the metabolic clearance of propranolol in human subjects. Clin Pharmacol Ther
38. Zhou H-H, Silberstein DJ, Koshakji RP, Wood AJJ. Interindividual differences in B-receptor density contribute to va- riability in response to B-adrenoceptor antagonists. Clin Phrmacol Ther 1989;
39. Stein M, O’Malley K, Kilfeather S. Eth- nic differences in cyclic AMP accumula- tion: effect on alpha 2, beta 2, and pros- tanoid receptor responses. Clin Phar- macol Ther 1990; 47: 360-365.
40. Kass MA, Gordon M, Morley RE Jr, et al. Compliance with topical timolol treatment. Am J Ophthalmol 1987; 103:
41. Spaeth GL. A new management system for glaucoma based on improvement of the appearance of the optic disc or visual field. Fortschr Ophthalmol 1988; 85:
42. Novack GD. Ophthalmic beta-blockers since timolol. Surv Ophthalmol 1987;
1989; 46: 257-263.
45: 587-592.
188-93.
614-9.
31: 307-27.
Correbonding author: Bernard Schwartz, M.D., Ph.D. Tufts University School of Medicine 20 Park Plaza, Suite 535 Boston, MA 02111, U.S.A.
21 -
Related Documents