Decoupling claims about forest thinning, biopower, and carbon benefits Mary S. Booth, PhD Partnership for Policy Integrity September 21, 2012

Welcome message from author
This document is posted to help you gain knowledge. Please leave a comment to let me know what you think about it! Share it to your friends and learn new things together.
Transcript

Decoupling claims about forest thinning, biopower, and carbon benefits
Mary S. Booth, PhD
Partnership for Policy Integrity
September 21, 2012

August 2012: Massachusetts takes electric-only biopower out of the state’s RPS
Facility efficiency 50% efficiency to qualify for ½ REC/MWh (60% for full REC)
Only combined heat and power facilities w/ robust steam customer qualify
GHG emissions accounting Framework accounts for carbon debt of whole tree harvesting
Requires 50% reduction in GHGs over 20 yrs compared to combined cycle natural gas facility
Harvesting Sustainability Allowable biomass removals (as a percent of the forest products
harvested) depend on soil conditions
Protection old growth, steep slopes; retention of naturally down woody material
Harvest plans/fuel sourcing plans required PFPIdriven by data

Role of biomass power in CA, 2010
• Biomass power fueled by wood and “wood-derived fuels”
– 6% of renewable power
– 1.7% of California’s total power generation
– 5.87 million tons (about 10% increase) of uncounted CO2 from power sector
Source MWh Percent of total
Hydroelectric Conventional 33,430,870 57%
Wind 6,078,632 10%
Solar Thermal and Photovoltaic 769,331 1%
Wood and Wood Derived Fuels 3,550,877 6%
Geothermal 12,600,098 21%
Other Biomass 2,450,783 4%
PFPIdriven by data
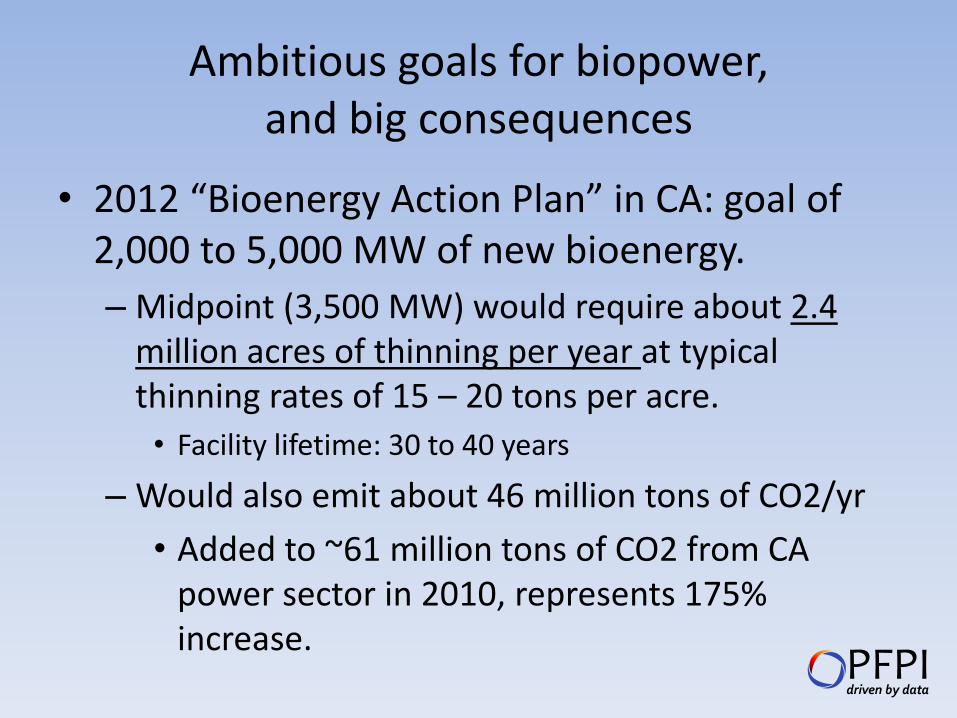
Ambitious goals for biopower, and big consequences
• 2012 “Bioenergy Action Plan” in CA: goal of 2,000 to 5,000 MW of new bioenergy.
– Midpoint (3,500 MW) would require about 2.4 million acres of thinning per year at typical thinning rates of 15 – 20 tons per acre.
• Facility lifetime: 30 to 40 years
– Would also emit about 46 million tons of CO2/yr
• Added to ~61 million tons of CO2 from CA power sector in 2010, represents 175% increase.
PFPIdriven by data

Biomass is treated as “Carbon free” under CA “Global Warming Solutions Act” (AB-32) cap and
trade program
“All agricultural crops or waste;
Wood and wood wastes identified to follow all of the
following practices:
1) Harvested pursuant to an approved timber
management plan prepared in accordance with the
Z’berg-Nejedly Forest Practice Act of 1973 or other
locally or nationally approved plan; and
2) Harvested for the purpose of forest fire fuel reduction or
forest stand improvement.”
PFPIdriven by data

How are claims of “carbon neutrality” justified?
Materials burned are “waste” and would decompose and emit CO2 anyway.
Trees are cut specifically for fuel, and forest regrowth eventually re-sequesters carbon that’s released by burning.
In California (and elsewhere): Claims that forest thinning projects combined with biopower provides a
carbon benefit.
In which category do fuels from thinning projects belong?
Does thinning drive biopower or does biopower drive thinning? PFPIdriven by data

If thinning would happen “anyway”…
Then biomass is waste and emissions need to be compared against the “anyway” fate e.g., comparison with slash-pile burning is reasonable
But: thinning advocates often claim biomass facilities are needed to monetize practice by providing a market for fuels
PFPIdriven by data
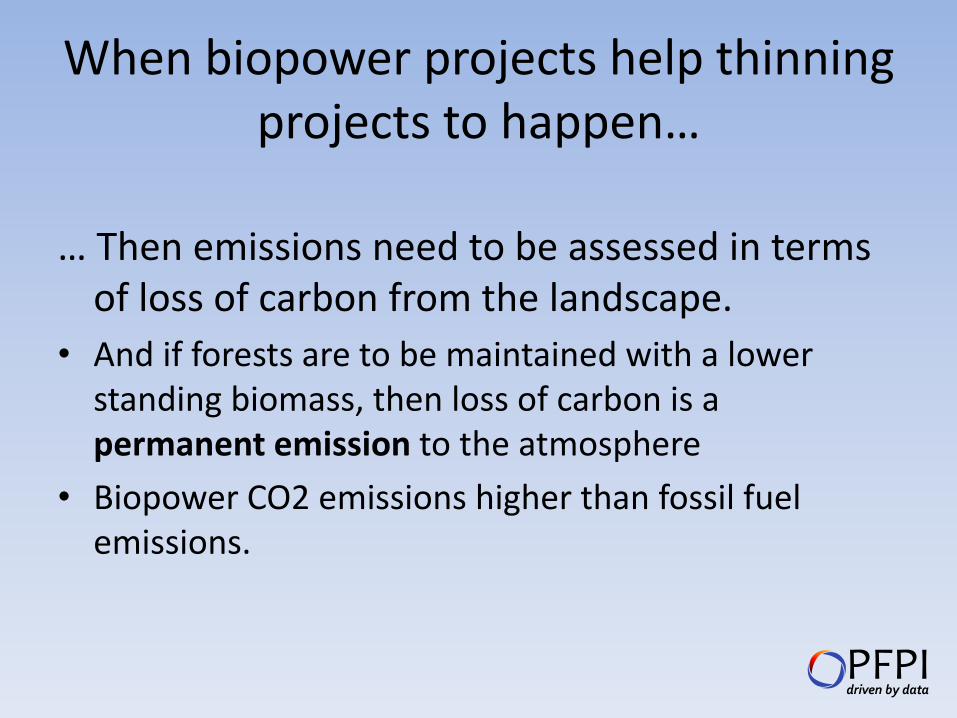
When biopower projects help thinning projects to happen…
… Then emissions need to be assessed in terms of loss of carbon from the landscape.
• And if forests are to be maintained with a lower standing biomass, then loss of carbon is a permanent emission to the atmosphere
• Biopower CO2 emissions higher than fossil fuel emissions.
PFPIdriven by data

Biomass power facilities emit substantially more CO2 per MWh than coal or gas facilities
A biomass plant emits
~150% the CO2 of a coal plant ~250% the CO2 of a gas plant ~ 340% the CO2 of a combined cycle plant
Fuel CO2 per
heat content
(lb/mmbtu)
Facility
efficiency
Fuel mmbtu
required to
generate 1 MWh Lb CO2/MWh
Gas combined cycle 117.1 0.45 7.54 883
Gas steam turbine 117.1 0.33 10.40 1,218
Coal steam turbine 205.6 0.34 10.15 2,086
Biomass steam turbine 213 0.24 14.22 3,029
Fuel CO2 per heat content data are from EIA. Efficiency for fossil fuel facilities calculated using EIA heat rate data (http://www.eia.gov/cneaf/electricity/epa/epat5p4.html); biomass efficiency value is common value for utility-scale facilities.
- 500 1,000 1,500 2,000 2,500 3,000 3,500
Biomass ST
Coal ST
Gas ST
Gas CC
lb CO2 emitted per MWh

Carbon benefit from thinning? Assumptions don’t hold up
• Winrock International thinning study (initiated by CA Energy Commission): – Probability of any area burning is low
– Regrowth takes decades
– Thinning for fuels reduction and generating biopower increases carbon emissions over the fossil fuel/no-thinning scenario
• Oregon State Study (Joshua Clark et al): – Reduction in carbon stocks from thinning lasts decades.
– Taking long-lived wood products and displaced fossil fuel emissions into account doesn’t help
Goslee, K., et al. 2010. Draft Final report on WESTCARB Fuels Management Pilot Activities in Shasta County, California. California Energy Commission, PIER.
Clark, J., et al. 2011. Impacts of thinning on carbon stores in the PNW: a plot level analysis. College of Forestry, Oregon State University, May 25, 2011.
PFPIdriven by data
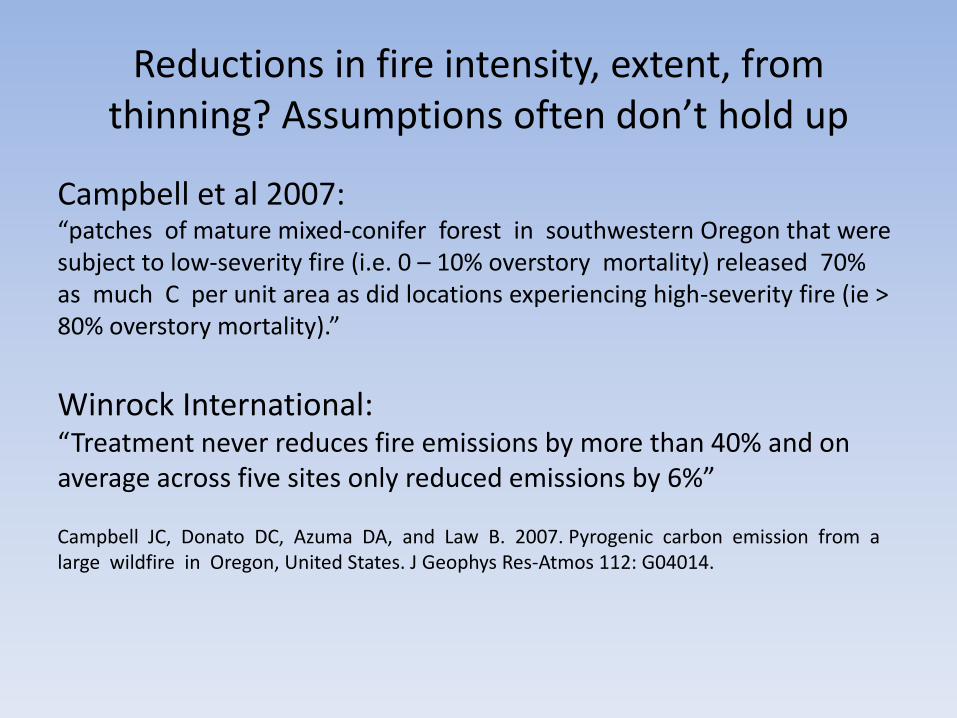
Reductions in fire intensity, extent, from thinning? Assumptions often don’t hold up
Campbell et al 2007: “patches of mature mixed-conifer forest in southwestern Oregon that were subject to low-severity fire (i.e. 0 – 10% overstory mortality) released 70% as much C per unit area as did locations experiencing high-severity fire (ie > 80% overstory mortality).”
Winrock International: “Treatment never reduces fire emissions by more than 40% and on average across five sites only reduced emissions by 6%” Campbell JC, Donato DC, Azuma DA, and Law B. 2007. Pyrogenic carbon emission from a large wildfire in Oregon, United States. J Geophys Res-Atmos 112: G04014.

Campbell et al, 2011
“To simply acknowledge the following – that (1) forest wildfires primarily consume leaves and small branches, (2) even strategic fuels management often involves treating more
area than wildfire would otherwise affect, and (3) the intrinsic trade-off between fire frequency and the amount
of biomass available for combustion functions largely as a zero-sum game –
– leaves little room for any fuel-reduction treatment to result in greater sustained biomass regardless of system parameterization.”
• Not a lot of difference in C removal between big and small fires • You have to treat 10 acres to get fire reduction benefit on 1 acre • Big, infrequent fires leave more carbon on the landscape than smaller,
more frequent fires PFPIdriven by data

Hudiberg et al, 2011
• “We studied 80 forest types in 19 ecoregions, and found that the current carbon sink in 16 of these ecoregions is sufficiently strong that it cannot be matched or exceeded through substitution of fossil fuels by forest bioenergy.
• In this study region, the current in situ net biome production in tree biomass, woody detritus and soil carbon is more beneficial in contributing to reduction of anthropogenic CO2 emissions than increasing harvest to substitute fossil fuels with bioenergy from forests.”
Letting forests grow does more to reduce emissions than thinning them and generating biopower and expecting to see a benefit from that
Tara Hudiburg, et al. 2011. Regional carbon dioxide implications of forest bioenergy production,
Nature Climate Change, doi: 10.1038/NCLIMATE1264 (2011)

Cabin Creek (2 MW gasifier north of Lake Tahoe): Issues raised by EIR
• Facility life (40 yr) exceeds forest management horizons
• May burn construction/demolition wood
• Need for transmission lines
• Air emissions (criteria pollutants and toxics) – mitigation “infeasible” (King’s Beach proposal led to ban on biopower facilities in Tahoe Basin)
• Relies on assumptions about fate of thinnings to justify low carbon claims; “netting” analysis not legal for PM, why should it be legal for CO2?

Loss of forest to homebuilding is driving calls for more thinning
US Forest Service report: California’s Forest Resources, 2001 – 2005 “… a great deal of forest land has already been affected by development. Continued WUI growth at rates seen in the 1990s are likely to place extraordinary pressure on California’s forest resources.
Effects will be especially pronounced in forested regions with rapidly expanding wildland urban interface, such as the Sierra Nevada foothills (23 percent) and Sierra Nevada mountains (12 percent).
In these regions nearly all new homes are added to intermix areas, where the pressures on forest land in terms of resource use, introduction of exotic invasives, and imperatives to reduce fire hazard are likely to be extraordinary. “
Without land use controls, strict zoning, or powerful financial counterincentives, increasing rates of conversion of forest land to developed uses are likely to greatly alter the productivity, health, and ecosystem integrity of California’s forests.

To clarify consequences of thinning and biopower:
• Stop making unsubstantiated claims about carbon benefits of thinning
• Stop making unsubstantiated claims about carbon benefits of bioenergy
• Decouple policy decisions about bioenergy and thinning.
• Consider in all policy-making that promoting thinning enables urban sprawl
• Reform AB-32 to promote only truly carbon-neutral energy
PFPIdriven by data

Mary S. Booth [email protected]
Related Documents