Decomposition of atrazine traces in water by combination of non-thermal electrical discharge and adsorption on nanofiber membrane Patrick Vanraes a,* , Gert Willems a , Nele Daels b,c , Stijn W.H. Van Hulle c , Karen De Clerck b , Pieter Surmont d , Frederic Lynen d , Jeroen Vandamme e , Jim Van Durme e , Anton Nikiforov a,f , Christophe Leys a a Department of Applied Physics, Ghent University, Sint-Pietersnieuwstraat 41 B4, 9000 Ghent, Belgium b Department of Textiles, Ghent University, Technologiepark 907, 9052 Zwijnaarde, Belgium c Department of Industrial Biological Sciences, Ghent University, Graaf Karel de Goedelaan 5, 8500 Kortrijk, Belgium d Separation Science Group, Department of Organic Chemistry, Universiteit Gent, Krijgslaan 281 S4-bis, 9000 Gent, Belgium e Research Group Molecular Odor Chemistry, Department of Microbial and Molecular Systems (M2S), KU Leuven, Technology Campus, Gebroeders De Smetstraat 1, 9000 Ghent, Belgium f Institute of Solution Chemistry RAS, Academicheskaya 1, 153012 Ivanovo, Russia article info Article history: Received 1 June 2014 Received in revised form 2 November 2014 Accepted 8 November 2014 Available online xxx Keywords: Dielectric barrier discharge Wastewater treatment Advanced oxidation processes Peroxone Energy efficiency Degradation by-products abstract In recent decades, several types of persistent substances are detected in the aquatic environment at very low concentrations. Unfortunately, conventional water treatment processes are not able to remove these micropollutants. As such, advanced treatment methods are required to meet both current and anticipated maximally allowed concen- trations. Plasma discharge in contact with water is a promising new technology, since it produces a wide spectrum of oxidizing species. In this study, a new type of reactor is tested, in which decomposition by atmospheric pulsed direct barrier discharge (pDBD) plasma is combined with micropollutant adsorption on a nanofiber polyamide membrane. Atrazine is chosen as model micropollutant with an initial concentration of 30 mg/L. While the H 2 O 2 and O 3 production in the reactor is not influenced by the presence of the mem- brane, there is a significant increase in atrazine decomposition when the membrane is added. With membrane, 85% atrazine removal can be obtained in comparison to only 61% removal without membrane, at the same experimental parameters. The by-products of atrazine decomposition identified by HPLC-MS are deethylatrazine and ammelide. For- mation of these by-products is more pronounced when the membrane is added. These results indicate the synergetic effect of plasma discharge and pollutant adsorption, which is attractive for future applications of water treatment. © 2014 Elsevier Ltd. All rights reserved. * Corresponding author. E-mail address: [email protected] (P. Vanraes). Available online at www.sciencedirect.com ScienceDirect journal homepage: www.elsevier.com/locate/watres water research xxx (2014) 1 e11 Please cite this article in press as: Vanraes, P., et al., Decomposition of atrazine traces in water by combination of non-thermal electrical discharge and adsorption on nanofiber membrane, Water Research (2014), http://dx.doi.org/10.1016/ j.watres.2014.11.009 http://dx.doi.org/10.1016/j.watres.2014.11.009 0043-1354/© 2014 Elsevier Ltd. All rights reserved.

Welcome message from author
This document is posted to help you gain knowledge. Please leave a comment to let me know what you think about it! Share it to your friends and learn new things together.
Transcript

ww.sciencedirect.com
wat e r r e s e a r c h x x x ( 2 0 1 4 ) 1e1 1
Available online at w
ScienceDirect
journal homepage: www.elsevier .com/locate/watres
Decomposition of atrazine traces in water bycombination of non-thermal electrical dischargeand adsorption on nanofiber membrane
Patrick Vanraes a,*, Gert Willems a, Nele Daels b,c, Stijn W.H. Van Hulle c,Karen De Clerck b, Pieter Surmont d, Frederic Lynen d, Jeroen Vandamme e,Jim Van Durme e, Anton Nikiforov a,f, Christophe Leys a
a Department of Applied Physics, Ghent University, Sint-Pietersnieuwstraat 41 B4, 9000 Ghent, Belgiumb Department of Textiles, Ghent University, Technologiepark 907, 9052 Zwijnaarde, Belgiumc Department of Industrial Biological Sciences, Ghent University, Graaf Karel de Goedelaan 5, 8500 Kortrijk, Belgiumd Separation Science Group, Department of Organic Chemistry, Universiteit Gent, Krijgslaan 281 S4-bis, 9000 Gent,
Belgiume Research Group Molecular Odor Chemistry, Department of Microbial and Molecular Systems (M2S), KU Leuven,
Technology Campus, Gebroeders De Smetstraat 1, 9000 Ghent, Belgiumf Institute of Solution Chemistry RAS, Academicheskaya 1, 153012 Ivanovo, Russia
a r t i c l e i n f o
Article history:
Received 1 June 2014
Received in revised form
2 November 2014
Accepted 8 November 2014
Available online xxx
Keywords:
Dielectric barrier discharge
Wastewater treatment
Advanced oxidation processes
Peroxone
Energy efficiency
Degradation by-products
* Corresponding author.E-mail address: [email protected]
Please cite this article in press as: Vanraeelectrical discharge and adsorptionj.watres.2014.11.009
http://dx.doi.org/10.1016/j.watres.2014.11.0090043-1354/© 2014 Elsevier Ltd. All rights rese
a b s t r a c t
In recent decades, several types of persistent substances are detected in the aquatic
environment at very low concentrations. Unfortunately, conventional water treatment
processes are not able to remove these micropollutants. As such, advanced treatment
methods are required to meet both current and anticipated maximally allowed concen-
trations. Plasma discharge in contact with water is a promising new technology, since it
produces a wide spectrum of oxidizing species. In this study, a new type of reactor is
tested, in which decomposition by atmospheric pulsed direct barrier discharge (pDBD)
plasma is combined with micropollutant adsorption on a nanofiber polyamide membrane.
Atrazine is chosen as model micropollutant with an initial concentration of 30 mg/L. While
the H2O2 and O3 production in the reactor is not influenced by the presence of the mem-
brane, there is a significant increase in atrazine decomposition when the membrane is
added. With membrane, 85% atrazine removal can be obtained in comparison to only 61%
removal without membrane, at the same experimental parameters. The by-products of
atrazine decomposition identified by HPLC-MS are deethylatrazine and ammelide. For-
mation of these by-products is more pronounced when the membrane is added. These
results indicate the synergetic effect of plasma discharge and pollutant adsorption, which
is attractive for future applications of water treatment.
© 2014 Elsevier Ltd. All rights reserved.
e (P. Vanraes).
s, P., et al., Decomposition of atrazine traces in water by combination of non-thermalon nanofiber membrane, Water Research (2014), http://dx.doi.org/10.1016/
rved.

wat e r r e s e a r c h x x x ( 2 0 1 4 ) 1e1 12
1. Introduction
Throughout the EU, effluents of wastewater treatment plants
deteriorate the chemical and biological status of surface wa-
ters (Schwarzenbach et al., 2006). New and largely unknown
persistent substances, including pharmaceuticals, pesticides
and compounds that disrupt the hormonal balance in
humans, appear in the aquatic environment (Bolong et al.,
2009; Ternes et al., 2004). In spite of their low concentra-
tions, they have a high impact on water quality. The European
Water Framework Directive is extending the scope of pollu-
tion control measures to protect surface water (EC, 2000). The
recent report, ‘European waters e assessment of status and
pressures’, published by the European Environment Agency
(EEA, 2012), concludes that the actual ecological status with
respect to persistent micropollutants is worse than desired.
Due to the chemical properties of some pesticides and phar-
maceuticals, their removal in wastewater treatment plants is
often incomplete (Sunka, 2001; Bruggeman and Leys, 2009;
Grymonpre et al., 2004). This causes micropollutants to find
their way into natural water and eventually drinking water.
Therefore, novel treatment technologies have to be developed
if current and anticipated criteria for effluent and drinking
water are to be met. Among the different advanced oxidation
processes (AOP) that are under investigation, the use of low
temperature plasma may prove to be a sustainable approach
(UKWIR, 2009). Within the field of applied plasma science,
electrical discharges in contact with water, in literature also
referred to as “liquid plasmas”, have received a lot of attention
during the last decade (Sunka, 2001; Bruggeman and Leys,
2009), with water treatment as one of the main possible ap-
plications. Liquid plasma is a source of oxidizing species (OH,
H2O2, O3, atomic O, singlet O2, and UV/VUV photons) that can
initiate decomposition of organic pollutants dissolved in
water (Grymonpre et al., 2004). Among various plasma reactor
concepts that have been investigated (Nikiforov and Leys,
2006; Lukes et al., 2013; Sugiarto et al., 2003), pulsed power
systems have been found to be the most efficient. By applying
high voltage pulses, non-equilibrium plasmas with a rela-
tively large active volume and a low gas temperature can be
generated in the gas phase above liquid (Lukes et al., 2005).
Despite the progress that has beenmade in the engineering
of liquid plasma systems, important research questions need
to be answered to more deeply understand and optimize the
oxidation mechanisms. First of all, up to now, only plasma
initiated decomposition of a few very simple compounds have
been studied in detail, e.g. phenol (Grabowski et al., 2006),
sulfonol (Bobkova et al., 2012) and textile dyes (Benetoli et al.,
2012). Moreover, when decomposition of common micro-
pollutants in a plasma reactor is investigated, high concen-
trations in mg/L range are used for simplicity in many cases.
Since their concentration in wastewater and natural water
typically ranges up to mg/L only,more research is required that
focusses onmicropollutant removal in this lower range, as for
example in the present study.
Secondly, degradation efficiency can be increased by
enlarging the surface of the plasmaeliquid interface by
dispersion of micro-drops in the discharge (Locke and
Thagard, 2009) or by forming a thin layer of liquid on one of
Please cite this article in press as: Vanraes, P., et al., Decompositielectrical discharge and adsorption on nanofiber membj.watres.2014.11.009
the electrodes (Dojcinovic et al., 2011; Magureanu et al., 2008).
The idea within this study is to further improve the latter
concept with an additional step of adsorption of micro-
pollutants on a nanofiber membrane placed on the electrode
surface. The extremely high surface area of the nanofiber
membrane, as described in Section 2.2, allows to reach higher
micropollutant concentration at its surface, close to the active
plasma region (Toth, 2002). There, reaction with active plasma
species can take place and remove the micropollutants. This
explains the expected synergy of plasma combined with
pollutant adsorption.
In the presentwork, the pesticide atrazine is used asmodel
micropollutant, since it is a good representative of persistent
micropollution in water and stated in EU protocol as a
dangerous pollutant. The applied concentration (30 mg/L) is
one order of magnitude higher than the maximally allowed
concentration in drinking water as defined by the United
States Environmental Protection Agency (U.S. EPA, 2007), and
the World Health Organization (WHO, 2008) and two orders of
magnitude higher than the limit defined by the European
Parliament and the Council (EC, 2006). In the first part of this
work, the kinetics of H2O2 and O3 production under plasma
action is investigated, as they are well known to be respon-
sible for atrazine oxidation in AOPs. The second part of the
paper deals with investigation of atrazine removal by the
combination of non-thermal plasma and adsorption on
nanofiber membrane and investigation of the by-products of
atrazine oxidation.
2. Materials and methods
2.1. DBD reactor for water treatment
The atrazine solution was treated in pulsed dielectric barrier
discharge (pDBD) generated above the solution. The scheme of
the setup is presented on Fig. 1. The discharge was generated
in between the high voltage electrode (HV) covered by a layer
of dielectric material with thickness of about 360 mm and a
0.3 mm thick water film formed on the surface of nanofiber
membrane. The membrane was placed on the support made
from porous Robu glass which was used to distribute water
uniformly on the membrane surface. The distance between
the HV electrode and water surface can be controlled with
micro-screw. The radius of HV electrode is 11 mm and the
radius of Robu porous glass is 20 mm. In the present study we
used HV pulse duration of 400 ns in order to generate the
discharge. The pulsed system was based on solid state switch
technology from Behlke. The HV switch was connected to
positive output of DC high voltage power supply IO BRAN-
DENBURG. The main parameters of the system are presented
in Table 1.
The voltagewasmeasuredwith a Tektronix P6015HVprobe
and the current was measured with a Pearson model 2877
current probe. The short duration of HV pulses is favorable to
generate a uniform discharge and to keep the gas temperature
low. In all our experiments the water temperature never
exceeded 35 �C which means that the pDBD plasma has a low
gas temperature and can be used for water treatment. The
discharge was generated in dry air which is continuously
on of atrazine traces in water by combination of non-thermalrane, Water Research (2014), http://dx.doi.org/10.1016/

Fig. 1 e The scheme of the pDBD reactor and diagnostics used to control the performance of the process.
wat e r r e s e a r c h x x x ( 2 0 1 4 ) 1e1 1 3
pumped through the systemat a flow rate of 0.5 SLM (Standard
Liter per Minute). The gas outlet was connected to the ozone
monitor. The water solution was pumped in a closed circuit
through thepolyamidemembrane, onwhicha thinwater layer
is formed. Atrazine, a persistent and hazardous pesticide, was
chosen as amodelmicropollutant in our experiments, with an
initial concentration of 30 mg/L. Initial conductivity was set by
addition of NaH2PO4$2H2O. The solution was pumped through
the system with a 2-channel peristaltic pump at a flow rate of
18 mL/min and 2 mL of solution is taken during the experi-
ments for analysis by means of GCeMS, HPLC-MS and to
measure H2O2 production. Additionally, emission spectra of
the discharge are measured with OceanOptics spectrometer
S1000 in the range of 250e900 nm in order to identify themain
active species produced in the pDBD.
Table 1 e The experimental parameters used in thiswork.
Experimental parameter Value/Description
Discharge voltage 23 kV
HV Polarity positive
Discharge power 1.7 W
Inter-electrode distance 2.75 mm
Pulsed frequency 300 Hz
Robu glass porosity 0.42
Porous glass thickness 3 mm
Treated volume 100 mL
Initial atrazine concentration 30 mg/L
Initial conductivity 350 mS/cm
Initial pH 5.06
Treatment time 45 min
Please cite this article in press as: Vanraes, P., et al., Decompositielectrical discharge and adsorption on nanofiber membj.watres.2014.11.009
2.2. Nanofiber membrane
The membrane is made on the setup with a scaled up multi
nozzle system, developed at Ghent University, which is
described in details by Decostere et al. (2009) and Daels et al.
(2010). Polyamide 6 (PA-6) proves to be most suitable for elec-
trospinning, since it can be electrospun under steady state
conditions. In the membrane production process, formic acid
andacetic acid in1:1 concentration ratio isusedas solventwith
16 wt% PA-6 concentration. The injection flow rate during the
electrospinning process is 2 mL/h, the applied voltage is 20 kV
and the distance between needle and collector is 10 cm. The
resulting membrane consists of nanofibres with an average
diameter of 140 nm. It has a thickness of 120 mm, a mean pore
size of 0.4 mm and a density of 10 g/m2. PA-6 mass density is
1.14 g/cm3 (Van De Velde and De Baets, 1997; Pashaei et al.,
2011), which gives a surface area of 25 m2/g, about one order
of magnitude less than surface area of activated carbon. In
previous research, the membrane was shown to have adsorp-
tive properties towards water pollution, where slightly more
adsorption occurs for thinnermembranes (Daels et al., 2014). A
typical SEM image is presented in Fig. 2. Recently, tensile
properties of themembranewere evaluated, resulting in strain
to failure of 36.6 ± 5.7%, stress at failure of 31.3 ± 3.8 MPa and
Young's modulus of 111.4 ± 5.9 MPa (De Schoenmaker, 2013).
2.3. Ozone and H2O2 measurements
Ozone in gas phase is measured with ozone monitor Envitec
model 450. The detection principle is based on absorption of
on of atrazine traces in water by combination of non-thermalrane, Water Research (2014), http://dx.doi.org/10.1016/

Fig. 2 e SEM image of nanofiber membrane of polyamide
deposited on aluminum foil.
wat e r r e s e a r c h x x x ( 2 0 1 4 ) 1e1 14
light at 253 nm in the absorption cell of the instrument. The
monitor's limit of detection is 2 ppmor 4.3 mg/Lwith error of O3
measurements not higher than 5%. The concentration of
hydrogen peroxide is determined by photometric method
with metavanadate ammonium, as described by Nogueira
et al. (2005). After adding 2.0 mL of sample to 0.8 mL of
vanadate solution in acid medium, red-orange peroxovana-
dium cation is formed:
VO�3 þ 4Hþ þH2O2/VO3þ
2 þ 3H2O (1)
The product of reaction (1) has an absorption maximum at
450 nm. Hydrogen peroxide concentration can be estimated
as:
CH2O2¼ �log10
�Isample
Itest
�V2
283V1½mol=L� (2)
where Isample and Itest are the light intensities at a wavelength
of 450 nm passing through the solution of metavanadate
ammonium with and without adding the plasma-treated
sample respectively. V1 is the volume of the aliquot used for
analysis (mL) andV2 is the final volume towhich the aliquotV1
is diluted (mL) before the absorbance measurement. The sta-
tistic error of measurements is estimated about 5% for H2O2
concentration higher than 5 mmoL/L and 10% for lower con-
centration range.
2.4. Micropollutant analysis
2.4.1. GCeMS techniqueAtrazine was extracted with an MPS-2 XYZ autosampler
equipped with a headspace-solid phase microextraction
unit (multi-PurposeSampler® or MPS®, Gerstel®, Mulheim
and der Ruhr, Germany). For extraction, 19.00 g of the
Please cite this article in press as: Vanraes, P., et al., Decompositielectrical discharge and adsorption on nanofiber membj.watres.2014.11.009
analyzed solution was hermetically sealed in 20 mL vials
and incubated for 1 min at 50 �C using agitation. Extraction
of dissolved atrazine from the water matrix was done for
60 min at 50 �C using an SPME fiber (100 mm Poly-
dimethylsiloxane (PDMS), fused silica fiber core, Supelco,
USA). Organic molecules that adsorbed onto the fiber were
separated and identified using an Agilent GCeMS (HP 6890
Series GC System, 5973 Mass Selective Detector) equipped
with a cross-linked methyl silicone column (HP-PONA,
50 m � 0.20 mm, 0.5 mm film thickness; Agilent Technology).
For qualitative and quantitative measurements, the com-
pounds were separated using Helium as the carrier gas (flow
rate 1 mL min�1). The temperature gradient was 60 �C(6 min) to 280 �C at 15 �C min�1, held 11 min. The injector
and transfer lines were maintained isothermally at 250 �Cand 280 �C, respectively. The total ion current (70 eV) was
recorded in the mass range from 40 to 250 amu (scan mode)
and an analysis time of 60 min. Volatile compounds were
identified by comparing the mass spectra obtained with the
Wiley 275 library. Calibration of the detector was made with
atrazine solutions of know concentration, from 1 to 100 mg/
L. The integrated atrazine peak was found to be linear with
atrazine concentration in this range. All samples were
measured in duplicate.
2.4.2. HPLC-MS techniqueIn order to determine the by-products of atrazine decom-
position, solution samples before and after plasma treat-
ment of 60 min were also analyzed with high-performance
liquid chromatography-coupled to diode array UV detec-
tion and time of flight mass spectrometry (HPLC-MS). Before
analysis, liquideliquid extraction of 50 mL water samples
was made in 5 mL CH2Cl2 solvent with addition of 5 mL
acetone and 1.2 g NaCl in a similar way as described by Gong
and Ye (1998). Separation of 3.2 mL was followed by evapo-
ration to end volume of 1 mL. For analysis, the procedure is
similar to the one used by Boelaert et al. (2014) with an
Agilent HPLC 1290 system consisting of a binary pump
(Agilent Technologies, Waldbronn, Germany), a diode array
detector (DAD) with a micro flow cell (volume: 1 mL, path
length: 10 mm) and a 6230 time-of-flight mass spectrometer
(TOF-MS) equipped with a Jetstream Electrospray Ionization
source (ESI). Separations were performed on a Zorbax C18
HPLC column (15 cm � 2.1 mm � 5 mm) equipped with a
2 mm C18 pre-column (SecurityGuard cartridge, Phenom-
enex). The mobile phase composition has been prepared as
follows: A: H2O þ 0.1% formic acid and B: Acetonitrile þ0.1%
formic acid. A flow rate of 200 mL/min was used whereby
initial conditions containing 2% B were held constant during
5 min, followed by a gradient up to 100% B in 50 min, a
plateau of 100% during 10 min and back to initial in 2 min. In
between analyses, the column was conditioned during
15 min.
The system was operated with the Agilent Masshunter
software for instrument control and data acquisition. UV
absorbance values were measured at 254 nm with a data
acquisition rate of 20 Hz. The injection volumewas 5 mL and all
experiments were conducted at a temperature of 20 �C. TOF-
MS detection was performed in the positive ionization
mode. Mass ranges from 50 to 1000 amu were scanned. All
on of atrazine traces in water by combination of non-thermalrane, Water Research (2014), http://dx.doi.org/10.1016/

wat e r r e s e a r c h x x x ( 2 0 1 4 ) 1e1 1 5
tests were carried out in duplicate with a regular blank solvent
analysis to ensure absence of cross contamination.
3. Experimental results and discussion
3.1. Power calculation
Typical waveforms of the applied voltage and current of the
pulsed DBD plasma are shown in Fig. 3. The applied voltage
Va and current Ion in Fig. 3 are measured during plasma
generation. The displacement current Ioff is obtained at the
same applied voltage when plasma is off. It does not
represent a current of moving charges, as it is only caused
by a time-varying electric field. Since the displacement
current does not contribute to the part of the energy dissi-
pated in the discharge, the actual discharge current Idis in
the plasma is obtained by subtracting the displacement
current Ioff from the total current Ion. In Fig. 3, a discharge
current pulse of 7 A with duration of 20 ns occurs 20 ns after
rise of the voltage to its maximum. Discharge power is
calculated asRtVaðtÞIdisðtÞdt whereas total input power of the
pulsed generator is given byRtVaðtÞIonðtÞdt. This way, applied
Fig. 3 e a) Waveform of the applied voltage Va and current
Ion in the case of plasma generation and displacement
current Ioff in the case without plasma generation. b)
Waveform of the applied voltage and discharge current Idisafter subtracting the displacement current.
Please cite this article in press as: Vanraes, P., et al., Decompositielectrical discharge and adsorption on nanofiber membj.watres.2014.11.009
power and discharged power are determined to be
2.0 ± 0.1 W and 1.7 ± 0.1 W respectively.
3.2. Spectral analysis
As seen in Fig. 4, the emission spectrum of the discharge is
dominated by radiative relaxation of excited vibrational states
of the N2 molecule, indicating the presence of metastable N2
molecules. As pointed out by Choi et al. (2006), metastable
states of N2 formed in air plasma are involved in formation of
O and O3. First, oxygen atoms are formed through the
following reactions:
N2 þ e/N�2 þ e (3)
N*2 þO2/N2 þ 2O (4)
N*2 þO2/N2OþO (5)
Next, ozone is generated from a three body reaction as:
OþO2 þM/O3 þM (6)
where M ¼ O2 or N2 is a third collision partner. Atomic oxygen
can also be generated by electron impact on an oxygen
molecule:
O2 þ e*/OþOþ e (7)
Despite the presence of atomic oxygen in the plasma,
emission lines of excited oxygen atoms are very small, such as
the OI triplet at 777.5 nm for example. The OH(A-X) (0,0) Q-
band head around 309 nm and the OH(A-X) (1,1) band around
315 nm are overlapped with the N2* bands and are therefore
not observed in the spectrum. Nevertheless, the small OH(A-
X) (0,0) R-band head around 307 nm indicates the presence
of excited OH radicals. OH radicals can be formed in plasma
throughmany reactions, which typically require the presence
of water molecules, as discussed in two recent excellent
Fig. 4 e Space and time averaged emission spectrum of the
discharge measured with resolution of 1.3 nm Dn
represents the change in quantum number n of each
radiative transition in the N2(CeB) band system. This band
system indicates the presence of metastable N2 molecules.
on of atrazine traces in water by combination of non-thermalrane, Water Research (2014), http://dx.doi.org/10.1016/

Fig. 5 e Hydrogen peroxide production in the liquid phase
in function of time with and without presence of the
nanofiber membrane.
wat e r r e s e a r c h x x x ( 2 0 1 4 ) 1e1 16
reviews by Locke and Shih (2011) and Jiang et al. (2014).
Dissociation of water by electron impact is the primary
example:
H2Oþ e/OHþHþ e (8)
Also, vibrational and rotational excitation of a water
molecule can lead to OH radical formation:
H2Oþ e/H2O� þ e (9)
H2O� þH2O/H2OþHþOH (10)
H2O� þH/H2þOH (11)
The presence of atomic oxygen boosts OH radical forma-
tion as well:
OþH2O/2OH (12)
It has to be noted that OH radicals have a lifetime in the
order of 10e100 ms in gas phase (Locke and Shih, 2011).
Therefore, only OH radicals that are generated near the water
surface can diffuse from the plasma zone into the surround-
ing water. Their lifetime in the liquid phase is in the nano-
second range, since they will react immediately with a
surrounding molecule due to their high reactivity. This way,
they can recombine to a long-lived hydrogen peroxide mole-
cule through following reactions:
OHþH2O�/H2O2 þH (13)
OHþOH/H2O2 (14)
The latter two reactions can also occur in the gas phase,
after which the hydrogen peroxide molecules can diffuse into
the surrounding water. Generation of UV photons, N2 meta-
stables, atomic O, OH radicals and O3 in gas phase indicates
that pDBD is indeed an effective source of active species for
advanced oxidation of micropollutants in water.
3.3. Ozone and H2O2 production
O3 concentration in gas phase is about 153 ppm or 327 mg/L
with nanofibermembrane in the setup and 163 ppm or 349 mg/
L without membrane. Taking into account the accuracy of the
ozone monitor, ozone production is thus independent of the
presence of themembrane. This agreeswith our expectations,
since ozone formation through reactions (3)e(7) occurs in the
gas phase, which is screened off from the membrane by the
water film under treatment.
H2O2 concentration in the liquid phase is shown in func-
tion of treatment time in Fig. 5. H2O2 production is about 5%
higher when the nanofiber membrane is added into the setup.
This difference is in the range of experimental error in mea-
surements of the discharge power which is about 5%. There-
fore, H2O2 production is considered to be independent of the
presence of the membrane as well, for similar reasons as
those for ozone production. From these results, an energy
yield for ozone generation of 5.07 g/kWh and for hydrogen
peroxide generation of 0.23 g/kWh is calculated, from 2.0 W
applied power, 0.5 SLM gas flow rate and 100 mL total solution
volume. According to the review of Locke and Shih (2011),
Please cite this article in press as: Vanraes, P., et al., Decompositielectrical discharge and adsorption on nanofiber membj.watres.2014.11.009
reactors based on discharge over a liquid surface have re-
ported H2O2 yields ranging from 0.04 to 5.0 g/kWh, with most
data falling below 1 g/kWh. The H2O2 yield for plasma systems
is limited by mass transfer and the size of the plasmaeliquid
interface, where a larger plasmaeliquid interface is an
advantage in pDBD.
3.4. Energy efficiency for atrazine removal
Efficiency of atrazine removal is measured by GCeMS
method with solideliquid extraction. According to GCeMS
analysis, 45 min of plasma treatment reduces the initial
atrazine concentration from 30.0 mg/L to 11.7 mg/L and 4.6 mg/
L, respectively in absence and in presence of the nanofiber
membrane. The increase of atrazine decomposition in the
reactor with nanofiber membrane can be explained by
adsorption of atrazine on the membrane. Adsorption in-
creases the local concentration of the pollutant near the
plasmaeliquid interface, leading to more effective reaction of
active plasma species with pollutant in the plasmaeliquid
interface. Since this effect only enhances atrazine decom-
position in the thin water film near the active plasma region
(about 0.1% of the total solution volume), the dominating
decomposition processes are taking place at the plas-
maeliquid interface.
Hijosa-Valsero et al. (2013) investigated atrazine decom-
position by DBD discharge at much higher initial concentra-
tion (5 mg/L). The authors observed an exponential decay of
atrazine concentration during treatment. This allows to
determine a first order reaction rate constant kA for atrazine
removal in our reactor from the equation.
ln
�C0
Ct
�¼ kAt (15)
where C0 and Ct are the atrazine concentration of the initial
solution and end solution respectively and t¼ 2700 s (¼45min)
is the total treatment time. Energy yield G50 in g/kWh for 50%
atrazine removal is determined from kA as (Hijosa-Valsero
et al., 2013)
on of atrazine traces in water by combination of non-thermalrane, Water Research (2014), http://dx.doi.org/10.1016/
wat e r r e s e a r c h x x x ( 2 0 1 4 ) 1e1 1 7
G50 ¼ 12kAC0VP ln 2
3:6� 106 J=kWh (16)
where V is the solution volume, P ¼ 2.0 W is the input power
and initial concentration C0 is given in g/L. Resulting values for
kA and G50 are found in Table 2.
In order to confirm that atrazine decomposition is taking
place mostly at the plasmaeliquid interface, the effect of the
dominant degradation processes in the water bulk is esti-
mated. According to the general view in literature, direct
oxidation by ozone and oxidation by the dark peroxone pro-
cess are the most dominant oxidation processes in the water
bulk in absence of UV light (Hong et al., 1996). Atrazine
degradation due to direct oxidation by ozone can be deter-
mined with the formula.
�d½A�dt
¼ kA;O3½A�½O3� (17)
where [A] and [O3] is the molar concentration of atrazine and
ozone respectively and kA;O3¼ 6.0 M�1 s�1 is the reaction rate
constant of direct oxidation of atrazine by O3. Maximal O3
concentration in water is reached in thermodynamic equi-
librium according to Henry's law. Henry's law constant H0 for
ozone in water at 20 �C is reviewed by Kuosa (2008) in function
of pH, using several values in literature and from simulation.
Based on this review, the constant is taken as
H0 ¼ 7.9 � 103 kPa M�1 at pH ¼ 5 and H0 ¼ 7.3 � 103 kPa M�1 at
pH ¼ 4, with a linear dependence on pH. For our experiments
with initial pH ¼ 5.06 and final pH ¼ 3.99, this gives an initial
and final dissolved ozone concentration [O3] of 2.03 mM and
2.19 mM respectively. This way, atrazine concentration [A] is
calculated based on Eq. (17) where pH (and thus also [O3])
changes linearly in time.
A second process responsible for atrazine decomposition
in the bulk is oxidation by peroxone. This process occurs
when hydrogen peroxide is added to ozonated water. In that
case, OH radicals are formed in liquid phase through the re-
actions (18) to (21)
H2O2#Hþ þHO�2 (18)
O3þHO�2/O�
3 þHO2 (19)
O�3#O2/O� (20)
O� þH2O/OH� þOH (21)
Since the reaction of O3 is much faster with the perhy-
droxyl anion HO�2 than with the conjugate acid H2O2,
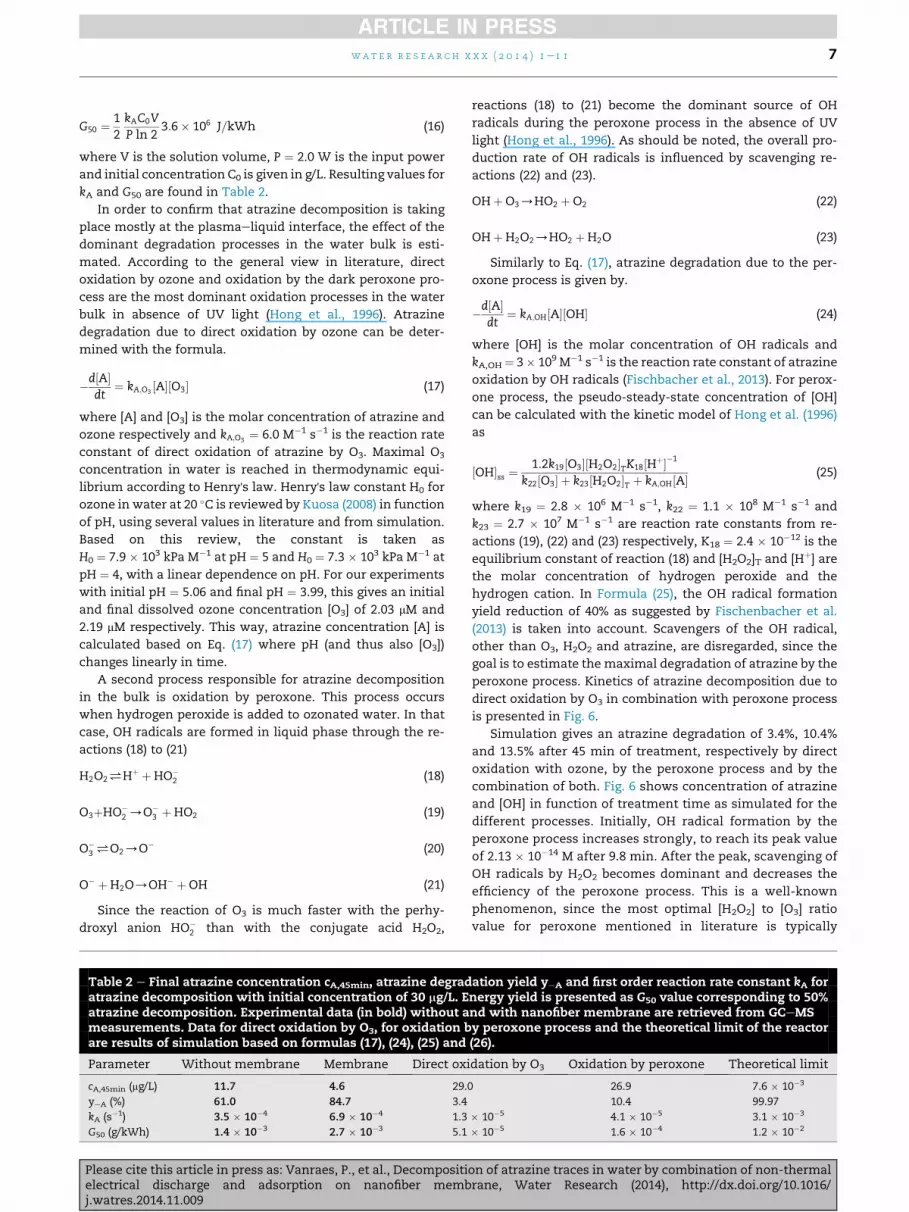
Table 2 e Final atrazine concentration cA,45min, atrazine degradatrazine decomposition with initial concentration of 30 mg/L. Eatrazine decomposition. Experimental data (in bold) without ameasurements. Data for direct oxidation by O3, for oxidation bare results of simulation based on formulas (17), (24), (25) and
Parameter Without membrane Membrane Direct oxi
cA,45min (mg/L) 11.7 4.6 29.0
yeA (%) 61.0 84.7 3.4
kA (s�1) 3.5 � 10�4 6.9 � 10�4 1.3
G50 (g/kWh) 1.4 � 10�3 2.7 � 10�3 5.1
Please cite this article in press as: Vanraes, P., et al., Decompositielectrical discharge and adsorption on nanofiber membj.watres.2014.11.009
reactions (18) to (21) become the dominant source of OH
radicals during the peroxone process in the absence of UV
light (Hong et al., 1996). As should be noted, the overall pro-
duction rate of OH radicals is influenced by scavenging re-
actions (22) and (23).
OHþO3/HO2 þO2 (22)
OHþH2O2/HO2 þH2O (23)
Similarly to Eq. (17), atrazine degradation due to the per-
oxone process is given by.
�d½A�dt
¼ kA;OH½A�½OH� (24)
where [OH] is the molar concentration of OH radicals and
kA,OH ¼ 3� 109 M�1 s�1 is the reaction rate constant of atrazine
oxidation by OH radicals (Fischbacher et al., 2013). For perox-
one process, the pseudo-steady-state concentration of [OH]
can be calculated with the kinetic model of Hong et al. (1996)
as
½OH�ss ¼1:2k19½O3�½H2O2�TK18½Hþ��1
k22½O3� þ k23½H2O2�T þ kA;OH½A� (25)
where k19 ¼ 2.8 � 106 M�1 s�1, k22 ¼ 1.1 � 108 M�1 s�1 and
k23 ¼ 2.7 � 107 M�1 s�1 are reaction rate constants from re-
actions (19), (22) and (23) respectively, K18 ¼ 2.4 � 10�12 is the
equilibrium constant of reaction (18) and [H2O2]T and [Hþ] arethe molar concentration of hydrogen peroxide and the
hydrogen cation. In Formula (25), the OH radical formation
yield reduction of 40% as suggested by Fischenbacher et al.
(2013) is taken into account. Scavengers of the OH radical,
other than O3, H2O2 and atrazine, are disregarded, since the
goal is to estimate the maximal degradation of atrazine by the
peroxone process. Kinetics of atrazine decomposition due to
direct oxidation by O3 in combination with peroxone process
is presented in Fig. 6.
Simulation gives an atrazine degradation of 3.4%, 10.4%
and 13.5% after 45 min of treatment, respectively by direct
oxidation with ozone, by the peroxone process and by the
combination of both. Fig. 6 shows concentration of atrazine
and [OH] in function of treatment time as simulated for the
different processes. Initially, OH radical formation by the
peroxone process increases strongly, to reach its peak value
of 2.13 � 10�14 M after 9.8 min. After the peak, scavenging of
OH radicals by H2O2 becomes dominant and decreases the
efficiency of the peroxone process. This is a well-known
phenomenon, since the most optimal [H2O2] to [O3] ratio
value for peroxone mentioned in literature is typically
ation yield yeA and first order reaction rate constant kA fornergy yield is presented as G50 value corresponding to 50%nd with nanofiber membrane are retrieved from GCeMSy peroxone process and the theoretical limit of the reactor(26).
dation by O3 Oxidation by peroxone Theoretical limit
26.9 7.6 � 10�3
10.4 99.97
� 10�5 4.1 � 10�5 3.1 � 10�3
� 10�5 1.6 � 10�4 1.2 � 10�2
on of atrazine traces in water by combination of non-thermalrane, Water Research (2014), http://dx.doi.org/10.1016/

Fig. 6 e Atrazine and OH radical concentration in function
of treatment time for direct oxidation with ozone (O3), for
dark peroxone process and for combination of both, as
calculated with the kinetic model of Hong et al. (1996) from
formulas (17), (24) and (25). The theoretical limit is
calculated from formula (26), while taking into account the
peroxone process with direct ozonation in the bulk
solution. The red curves are calculated from 10% to 21% of
atrazine removal at the outlet in combination with the bulk
processes and correspond with the experiments without
and with membrane respectively. Since the red curves are
much lower than the combined ozone and peroxone curve,
oxidation by ozone and peroxone only contributes to a
small part of total atrazine removal. (For interpretation of
the references to color in this figure legend, the reader is
referred to the web version of this article.)
wat e r r e s e a r c h x x x ( 2 0 1 4 ) 1e1 18
ranging from 0.3 to 1.0 (Glaze et al., 1987; Munter, 2001; Hsu
et al., 2003; De Witte et al., 2009; Kalra et al., 2011).
Table 2 presents a summary of data on atrazine decom-
position in the reactor, obtained from experiments and from
formulas (17), (24) and (25). Also, a theoretical limit of the
reactor efficiency was calculated from the Equation (26). This
formula is based on the assumptions of complete atrazine
decomposition at the outlet of the reactor chamber during
pumping and of ideal mixing of the solution at the inlet.
�d½A�dt
¼ QV½A� (26)
where Q ¼ 0.3 mL/s (¼18 mL/min) is the water flow and
V ¼ 100 mL is the total solution volume. To be complete,
atrazine degradation by peroxone and ozone in the solution
bulk is taken into account in this theoretical limit.
The atrazine removal energy yield in the experiments and
in the red curves in Fig. 6 is one order ofmagnitude lower than
the theoretical limit. More specifically, 10% and 21% of atra-
zine concentration that passes along the active plasma zone
and leaves the reactor chamber during pumping is removed
without membrane and with membrane respectively, as
determined by our simulations. As discussed before, this ef-
fect of themembrane indicates the importance of degradation
processes in the proximity of the plasmaeliquid interface.
Direct oxidation by ozone and oxidation by the peroxone
process can only explain about 20% of the observed atrazine
decomposition without membrane. This is a further
Please cite this article in press as: Vanraes, P., et al., Decompositielectrical discharge and adsorption on nanofiber membj.watres.2014.11.009
indication that oxidative processes in the thin water film play
an important role. Atrazine decomposition at the plas-
maeliquid interface is caused by multiple reactive plasma
species from the active plasma zone, such as UV photons,
radicals, ions and long-living metastables like HO2*. When
these species reach the water surface and interact with atra-
zine, oxidation takes place. Increasing the local concentration
of atrazine near the plasmaeliquid interface will increase the
chance on such collisions and thus the overall atrazine
degradation yield, which is a strong advantage of the sug-
gested method.
3.5. By-products
HPLC-MS chromatograms of the initial solution and the solu-
tion after 45 min of plasma treatment are shown in Fig. 7. In
agreement with the GCeMS results, a stronger decrease of the
atrazine peak is observed after treatment when the nanofiber
membrane is added in the setup. Due to the low initial atrazine
concentration, however, accurate detection of most by-
products by HPLC-MS is not possible. At least 4 oxidation
products have been found with monoisotopic mass 128.04 Da,
170.14 Da, 187.06 Da and 213.08 Da, which all have higher
abundancewhenthemembrane isadded in thesetup.Only two
of them are tentatively identified as deethylatrazine and
ammelide (Fig. 8). Both are commonly found amongst atrazine
by-products in advanced oxidation processes (Adams and
Randtke, 1992; Gonzalez et al., 1994). Deethylatrazine is one of
the first generation intermediates in several atrazine degrada-
tion pathwaysproposed in literature.Moreover, it is considered
to be more stable than other intermediates from the first gen-
eration, due to its persistence in natural waters and due to the
higher reactivity of the ethyl group (Adams and Randtke, 1992;
Beltr�anet al., 1996).Ammelide is oneof thefinal stableproducts
in the atrazine oxidation pathway and is considered to be less
toxic thanatrazineand itsearlier intermediates (Gonzalezetal.,
1994; Beltr�an et al., 1996; Chan et al., 2004; Khan et al., 2014; Xu
et al., 2014).The relativestabilityofboth intermediatesexplains
why they are detected in the present study despite the low
initial atrazine concentration.
To our knowledge, atrazine degradation by-products from
treatment with DBD plasma have only been reported by
Hijosa-Valsero et al. (2013). The authors used a DBD reactor
very similar to the one used in this study, but powered by AC
high voltage and with much higher initial atrazine concen-
tration of 5 mg/L Hijosa-Valsero et al. (2013) identified 3
common atrazine oxidation products, deethylatrazine, dei-
sopropylatrazine and atrazine amide, and one less common
intermediate 4-chloro-6-(ethenylamino)-1,3,5-triazin-2-yl.
After 84% of atrazine decomposition, the deethylatrazine to
atrazine relative abundance in the mass spectra was roughly
0.5, while it is 0.02 in the present study in presence of the
nanofibermembrane. Hoeben (2000) investigated degradation
of a 25 mg/L atrazine solution by corona discharge above
water and detected at least 7 oxidation products, but could
not identify them. As this suggests, the degradation pathway
of atrazine under plasma treatment is sensitive to different
experimental parameters.
The HPLC-MS results of the present study illustrate the
high potential of pDBD plasma to decompose persistent
on of atrazine traces in water by combination of non-thermalrane, Water Research (2014), http://dx.doi.org/10.1016/

Fig. 7 e Detail (from 18.7 min to 31.7 min) of HPLC-MS chromatogram of initial atrazine solution and of treated samples with
and without the presence of the nanofiber membrane. For each considered peak belonging to an oxidation by-product, the
mass spectrum is shown.
Fig. 8 e Proposed oxidation by-products of atrazine treatment with pulsed DBD.
wat e r r e s e a r c h x x x ( 2 0 1 4 ) 1e1 1 9
micropollutants. Moreover, as can be seen from the different
peaks in Fig. 7, adding the nanofiber membrane in the setup
enhances by-product generation. Cleavage of the s-triazine
ring has not yet been reported in any advanced oxidation
process (Mededovic and Locke, 2007). Pelizzetti et al. (1990)
have concluded from detailed GCeMS analysis that photo-
catalytic oxidation of aqueous atrazine cannot destroy the
triazine ring and that the final oxidation product is cyanuric
acid.
Please cite this article in press as: Vanraes, P., et al., Decompositielectrical discharge and adsorption on nanofiber membj.watres.2014.11.009
4. Conclusion
In this work, a new water treatment reactor based on at-
mospheric pulsed dielectric barrier discharge above water is
investigated. In order to increase decomposition efficiency
and to limit unwanted by-product formation, combination of
pDBD plasma with adsorption on nanofiber membrane was
proposed. Atrazine is chosen as model micropollutant with
on of atrazine traces in water by combination of non-thermalrane, Water Research (2014), http://dx.doi.org/10.1016/

wat e r r e s e a r c h x x x ( 2 0 1 4 ) 1e1 110
an initial concentration of 30 mg/L, which is one order of
magnitude higher than the maximally allowed concentra-
tion in drinking water. In the pDBD reactor, the measured
energy yield of H2O2 production in liquid phase is about
0.23 g/kWh and concentration of H2O2 is linearly dependent
on treatment time. The energy yield of O3 production is
measured to be 5.07 g/kWh. While the H2O2 and O3 produc-
tion in the reactor is not influenced by the presence of the
nanofiber membrane, there is a significant increase in atra-
zine decomposition when the membrane is added to the
setup. An atrazine removal yield of 85% can be obtained with
nanofiber membrane at 45 min of treatment where only
about 61% removal is reached with plasma alone. The
observed effect is caused by atrazine adsorption on the
membrane close to the plasma active region, leading to a
higher local atrazine concentration near the plasmaeliquid
interface. The higher local concentration increases the fre-
quency of direct and indirect oxidizing interactions of the
micropollutant with reactive species from the active plasma
region. To reinforce this explanation, the contribution of the
dominant atrazine degradation processes in the water bulk
has been estimated. According to literature, direct oxidation
by ozone and oxidation by peroxone are the dominant pro-
cesses in the water bulk in absence of UV light. Using the
kinetic model of Hong et al. (1996), the contribution of these
bulk processes to the overall atrazine degradation is calcu-
lated to be only about 20%. Therefore, the determining
oxidation reactions are occurring in the thin water layer near
the plasma active region. The main by-products of atrazine
decomposition measured by HPLC-MS are the first genera-
tion intermediate deethylatrazine and the deep oxidation
by-product ammelide. System efficiency is almost doubled
when the nanofiber membrane is placed in the plasma
reactor with deeper degradation of atrazine to the by-
products. These results show the benefits of combining
non-thermal plasma with pollutant adsorption for degrada-
tion of micropollution, a synergetic effect that yet has to
receive more attention.
r e f e r e n c e s
Adams, C.D., Randtke, S.J., 1992. Ozonation byproducts ofatrazine in synthetic and natural waters. Environ. Sci.Technol. 26 (11), 2218e2227. http://dx.doi.org/10.1021/es00035a022.
Beltr�an, F.J., Gonz�alez, M., Rivas, F.J., Alvarez, P., 1996. AqueousUV radiation and UV/H2O2 oxidation of atrazine firstdegradation products: deethylatrazine anddeisopropylatrazine. Environ. Toxicol. Chem. 15 (6), 868e872.http://dx.doi.org/10.1002/etc.5620150607.
Benetoli, L.O., Cadorin, B.M., Baldissarelli, V.Z., Geremias, R., deSouza, I.G., Debacher, N.A., 2012. Pyrite-enhanced methyleneblue degradation in non-thermal plasma water treatmentreactor. J. Hazard. Mater. 237, 55e62. http://dx.doi.org/10.1016/j.jhazmat.2012.07.067.
Bobkova, E.S., Grinevich, V.I., Ivantsova, N.A., Rybkin, V.V., 2012. Astudy of sulfonol decomposition in water solutions under theaction of dielectric barrier discharge in the presence of different
Please cite this article in press as: Vanraes, P., et al., Decompositielectrical discharge and adsorption on nanofiber membj.watres.2014.11.009
heterogeneous catalysts. Plasma Chem. Plasma Process. 32 (1),97e107. http://dx.doi.org/10.1007/s11090-011-9326-z.
Boelaert, J., t’Kindt, R., Schepers, E., Jorge, L., Glorieux, G.,Neirynck, N., Lynen, F., Sandra, K., 2014. State-of-the-art non-targeted metabolomics in the study of chronic kidney disease.Metabolomics 10 (3), 425e442. http://dx.doi.org/10.1007/s11306-013-0592-z.
Bolong, N., Ismail, A., Salim, M., Matsuura, T., 2009. A review ofthe effects of emerging contaminants in wastewater andoptions for their removal. Desalination 239 (1e3), 229e246.http://dx.doi.org/10.1016/j.desal.2008.03.020.
Bruggeman, P., Leys, C., 2009. Non-thermal plasmas in and incontact with liquids. J. Phys. D: Appl. Phys. 42 (5), 053001.http://dx.doi.org/10.1088/0022-3727/42/5/053001.
Chan, C.Y., Tao, S., Dawson, R., Wong, P.K., 2004. Treatment ofatrazine by integrating photocatalytic and biologicalprocesses. Environ. Pollut. 131 (1), 45e54. http://dx.doi.org/10.1016/j.envpol.2004.02.022.
Choi, J.H., Han, I., Baik, H.K., Lee, M.H., Han, D.-W., Park, J.-C.,Lee, I.-S., Song, K.M., Lim, Y.S., 2006. Analysis of sterilizationeffect by pulsed dielectric barrier discharge. J. Electrost. 64 (1),17e22. http://dx.doi.org/10.1016/j.elstat.2005.04.001.
Daels, N., De Vrieze, S., Decostere, B., Dejans, P., Dumoulin, A., DeClerck, K., Westbroek, P., Van Hulle, S.W.H., 2010. The use ofelectrospun flat sheet nanofibre membranes in MBRapplications. Desalination 257 (1e3), 170e176. http://dx.doi.org/10.1016/j.desal.2010.02.027.
Daels, N., Radoicic, M., Radetic, M., Van Hulle, S.W.H., DeClerck, K., 2014. Functionalisation of electrospun polymernanofibre membranes with TiO2 nanoparticles in view ofdissolved organic matter photodegradation. Sep. Purif.Technol. 133 (1), 282e290. http://dx.doi.org/10.1016/j.seppur.2014.06.040.
Decostere, B., Daels, N., De Vrieze, S., Dejans, P., Van Camp, T.,Audenaert, W., Hogie, J., Westbroek, P., De Clerck, K., VanHulle, S., 2009. Performance assessment of electrospunnanofibers for filter applications. Desalination 249 (3),942e948. http://dx.doi.org/10.1016/j.desal.2009.06.064.
De Schoenmaker, B., 2013. Electrospinning and Characterisationof Polyamide Nanofibres for Composite Applications. GhentUniversity, Department of Textiles, Ghent, Belgium, ISBN9789085786191, p. 89.
DeWitte, B., Dewulf, J., Demeestere, K., Van Langenhove, H., 2009.Ozonation and advanced oxidation by the peroxone process ofciprofloxacin in water. J. Hazard. Mater. 161 (2e3), 701e708.http://dx.doi.org/10.1016/j.jhazmat.2008.04.021.
Dojcinovic, B.P., Roglic, G.M., Obradovic, B.M., Kuraica, M.M.,Kostic, M.M., Nesic, J., Manojlovic, D.D., 2011. Decolorization ofreactive textile dyes using water falling film dielectric barrierdischarge. J. Hazard. Mater. 192 (2), 763e771. http://dx.doi.org/10.1016/j.jhazmat.2011.05.086.
EC, 2000. Directive 2000/60/EC of the European parliament and ofthe Council of 23 October 2000 establishing a framework forcommunity action in the field of water policy. CELEX-EUR Off.J. L 327, 1e72. CELEX: 32000L0060.
EC, 2006. Directive 2006/118/EC of the European parliament and ofthe Council of 12 December 2006 on the protection ofgroundwater against pollution and deterioration. Off. J. Eur.Union L 372. Annex I, p. 26, CELEX: 32006L0118.
EEA, 2012. European Waters - Assessment of Status andPressures. European Environment Agency. Report No 8/2012.
Fischbacher, A., von Sonntag, J., von Sonntag, C., Schmidt, T.C.,2013. The �OH radical yield in the H2O2 þ O3 (peroxone)reaction. Environ. Sci. Technol. 47 (17), 9959e9964. http://dx.doi.org/10.1021/es402305r.
Glaze, W.H., Kang, J.-W., Chapin, D.H., 1987. The chemistry ofwater treatment processes involving ozone, hydrogenperoxide and ultraviolet radiation. Ozone: Sci. Eng. J. Int.
on of atrazine traces in water by combination of non-thermalrane, Water Research (2014), http://dx.doi.org/10.1016/

wat e r r e s e a r c h x x x ( 2 0 1 4 ) 1e1 1 11
Ozone Assoc. 9 (4), 335e352. http://dx.doi.org/10.1080/01919518708552148.
Gong, A., Ye, C., 1998. Analysis of trace atrazine and simazine inenvironmental samples by liquidchromatographyefluorescence detection with pre-columnderivatization reaction. J. Chromatogr. A 827 (1), 57e63. http://dx.doi.org/10.1016/S0021-9673(98)00742-0.
Gonzalez, M.C., Braun, A.M., Prevot, A.B., Pelizzetti, E., 1994.Vacuum-ultraviolet (VUV) photolysis of water: mineralizationof atrazine. Chemosphere 28 (12), 2121e2127. http://dx.doi.org/10.1016/0045-6535(94)90180-5.
Grabowski, L.R., vanVeldhuizen, E.M., Pemen,A.J.M., Rutgers,W.R.,2006. Corona above water reactor for systematic study ofaqueous phenol degradation. Plasma Chem. Plasma Process. 26(1), 3e17. http://dx.doi.org/10.1007/s11090-005-8721-8.
Grymonpre, D.R., Finney, W.C., Clark, R.J., Locke, B.R., 2004.Hybrid gas-liquid electrical discharge reactors for organiccompound degradation. Ind. Eng. Chem. Res. 43 (9),1975e1989. http://dx.doi.org/10.1021/ie030620j.
Hijosa-Valsero, M., Molina, R., Schikora, H., Muller, M.,Bayona, J.M., 2013. Removal of priority pollutants from waterby means of dielectric barrier discharge atmospheric plasma.J. Hazard. Mater. 262 (1), 664e673. http://dx.doi.org/10.1016/j.jhazmat.2013.09.022.
Hoeben, W.F.L.M., 2000. Pulsed Corona-induced Degradation ofOrganic Materials in Water. Technische UniversiteitEindhoven, Eindhoven, the Netherlands, ISBN 90-386-1549-3.
Hong, A., Zappi, M., Kuo, C., Hill, D., 1996. Modeling kinetics ofilluminated and dark advanced oxidation processes. J.Environ. Eng. 122 (1), 58e62. http://dx.doi.org/10.1061/(ASCE)0733-9372(1996)122:1(58).
Hsu, Y.C., Chen, Y.F., Chen, J.H., 2003. Peroxone process for RO-16and RB-19 dye solutions treatment. J. Environ. Sci. Health PartA Toxic/Hazardous Subst. Environ. Eng. 38 (7), 1361e1376.http://dx.doi.org/10.1081/ESE-120021131.
Jiang, B., Zheng, J., Qiu, S., Wu, M., Zhang, Q., Yan, Z., Xue, Q.,2014. Review on electrical discharge plasma technology forwastewater remediation. Chem. Eng. J. 236 (1), 348e368. http://dx.doi.org/10.1016/j.cej.2013.09.090.
Kalra, S.S., Mohan, S., Sinha, A., Singh, G., 2011. Advancedoxidation processes for treatment of textile and dyewastewater: a review. In: 2nd International Conference onEnvironmental Science and Development IPCBEE, vol. 4.IACSIT Press, Singapore, pp. 271e275, 1.
Khan, J.A., He, X., Shah, N.S., Khan, H.M., Hapeshi, E., Fatta-Kassinos, D., Dionysiou, D.D., 2014. Kinetic and mechanisminvestigation on the photochemical degradation of atrazinewith activated H2O2, S2O
2�8 and HSO�
5 . Chem. Eng. J. 252 (1),393e403. http://dx.doi.org/10.1016/j.cej.2014.04.104.
Kuosa, M., 2008. Modeling Reaction Kinetics and Mass Transfer inOzonation inWater Solutions. Acta UniversitatisLappeenrantaensis331, LappeenrantaUniversityofTechnology,Lappeenranta, Finland, ISBN 978-952-214-670-0, p. 82.
Locke, B.R., Thagard, S.M., 2009. Analysis of chemical reactions ingliding-arc reactors with water spray into flowing oxygen. IEEETrans. Plasma Sci. 37 (4), 494e501. http://dx.doi.org/10.1109/TPS.2008.2011797.
Locke, B.R., Shih, K.-Y., 2011. Review of the methods to formhydrogen peroxide in electrical discharge plasma with liquidwater. Plasma Sources Sci. Technol. 20 (3), 034006e034021.http://dx.doi.org/10.1088/0963-0252/20/3/034006.
Lukes, P., Clupek, M., Babicky, V., Janda, V., Sunka, P., 2005.Generation of ozone by pulsed corona discharge over watersurface in hybrid gaseliquid electrical discharge reactor. J.Phys. D: Appl. Phys. 38 (3), 409e416. http://dx.doi.org/10.1088/0022-3727/38/3/010.
Lukes, P., Clupek, M., Babicky, V., Spetlikova, E., Sisrova, I.,Marsalkova, E., Marsalek, B., 2013. High power DC diaphragm
Please cite this article in press as: Vanraes, P., et al., Decompositielectrical discharge and adsorption on nanofiber membj.watres.2014.11.009
discharge excited in a vapor bubble for the treatment ofWater. Plasma Chem. Plasma Process. 33 (1), 83e95. http://dx.doi.org/10.1007/s11090-012-9432-6.
Magureanu, M., Piroi, D., Mandache, N.B., Parvulescu, V., 2008.Decomposition of methylene blue in water using a dielectricbarrier discharge: optimization of the operating parameters. J.Appl. Phys. 104 (10), 103306. http://dx.doi.org/10.1063/1.3021452.
Mededovic, S., Locke, B.R., 2007. Side-chain degradation ofatrazine by pulsed electrical discharge in water. Ind. Eng.Chem. Res. 46 (9), 2702e2709. http://dx.doi.org/10.1021/ie070020a.
Munter, R., 2001. Advanced oxidation processes e current statusand prospects. Proc. Est. Acad. Sci. Chem. 50 (2), 59e80. http://dx.doi.org/10.1002/chin.200141291.
Nikiforov, A., Leys, C., 2006. Surface treatment of cotton yarn byunderwater capillary electrical discharge. Plasma Chem.Plasma Process. 26 (4), 415e423. http://dx.doi.org/10.1007/s11090-006-9021-7.
Nogueira, R.F.P., Oliveira, M.C., Paterlini, W.C., 2005. Simple andfast spectrophotometric determination of H2O2 in photo-Fenton reactions using metavanadate. Talanta 66 (1), 86e91.http://dx.doi.org/10.1016/j.talanta.2004.10.001.
Pashaei, S., Siddaramaiah, Avval, M.M., Syed, A.A., 2011. Thermaldegradation kinetics of nylon6/GF/crysnano nanoclaynanocomposites by TGA. Chem. Ind. Chem. Eng. Q. 17 (2),141e151. http://dx.doi.org/10.2298/CICEQ101007064P.
Pelizzetti, E., Maurino, V., Minero, C., Carlin, V., Tosato, M.L.,Pramauro, E., Zerbinati, O., 1990. Photocatalytic degradation ofatrazine and other s-triazine herbicides. Environ. Sci. Technol.24 (10), 1559e1565. http://dx.doi.org/10.1021/es00080a016.
Schwarzenbach, R.P., Escher, B.I., Fenner, K., Hofstetter, T.B.,Johnson, C.A., von Gunten, U., Wehrli, B., 2006. The challengeof micropollutants in aquatic systems. Science 313 (5790),1072e1077. http://dx.doi.org/10.1126/science.1127291.
Sugiarto, A.T., Ito, S., Ohshima, T., Sato, M., Skalny, J.D., 2003.Oxidative decoloration of dyes by pulsed discharge plasma inwater. J. Electrost. 58 (1e2), 135e145. http://dx.doi.org/10.1016/S0304-3886(02)00203-6.
Sunka, P., 2001. Pulse electrical discharges in water and theirapplications. Phys. Plasmas 8 (5), 2587e2594. http://dx.doi.org/10.1063/1.1356742.
Ternes, T., Joss, A., Siegrist, H., 2004. Scrutinizingpharmaceuticals and personal care products in wastewatertreatment. Environ. Sci. Technol. 38 (20), 392Ae399A. http://dx.doi.org/10.1021/es040639t.
Toth, J., 2002. Adsorption: Theory, Modeling, and Analysis.Surfactant Science Series 107, first ed., ISBN 0-8247-0747-8,p. 105 Marcel Dekker AG, Basel, Switzerland.
UKWIR, 2009. Endocrine Disrupting Chemicals NationalDemonstration Programme: Assessment of the Performanceof WwTW in Removing Oestrogenic Substances (09/TX/04/16).UK Water Industry Research, ISBN 1-84057-525-5.
U.S. EPA, 2007. Atrazine. Toxicity and Exposure Assessment forChildren's Health (TEACH) Chemical Summaries (last revised24.04.07.), p. 6.
Van De Velde, F., De Baets, P., 1997. The friction and wearbehaviour of polyamide 6 sliding against steel at low velocityunder very high contact pressures. Wear 209 (1e2), 106e114.http://dx.doi.org/10.1016/S0043-1648(96)07500-X.
WHO, 2008 World Health Organisation Guidelines for Drinking-water Quality: Incorporating 1st and 2nd Addenda,Recommendations third ed., vol. 1, ISBN 978-92-4-154761-1,p. 191 Geneva, Switzerland.
Xu, L.J., Chu, W., Graham, N., 2014. Atrazine degradation usingchemical-free process of USUV: analysis of the micro-heterogeneous environments and the degradationmechanisms. J. Hazard. Mater. 275 (1), 166e174. http://dx.doi.org/10.1016/j.jhazmat.2014.05.007.
on of atrazine traces in water by combination of non-thermalrane, Water Research (2014), http://dx.doi.org/10.1016/
Related Documents