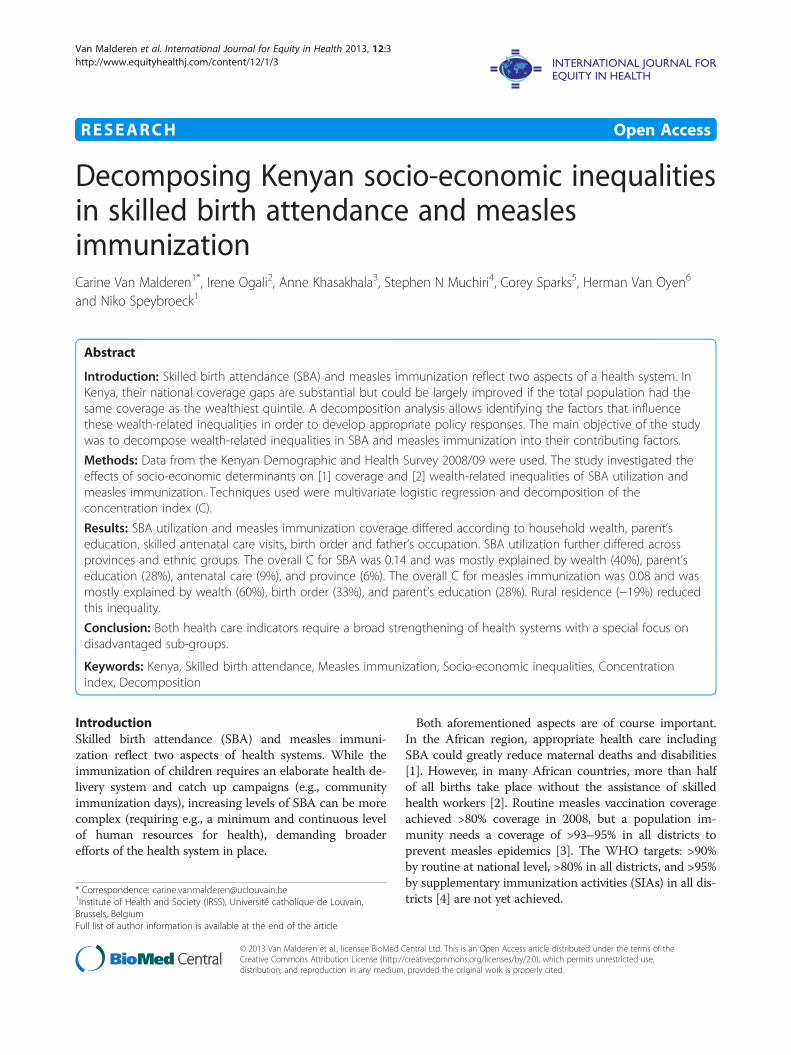
RESEARCH Open Access Decomposing Kenyan socio-economic inequalities in skilled birth attendance and measles immunization Carine Van Malderen 1* , Irene Ogali 2 , Anne Khasakhala 3 , Stephen N Muchiri 4 , Corey Sparks 5 , Herman Van Oyen 6 and Niko Speybroeck 1 Abstract Introduction: Skilled birth attendance (SBA) and measles immunization reflect two aspects of a health system. In Kenya, their national coverage gaps are substantial but could be largely improved if the total population had the same coverage as the wealthiest quintile. A decomposition analysis allows identifying the factors that influence these wealth-related inequalities in order to develop appropriate policy responses. The main objective of the study was to decompose wealth-related inequalities in SBA and measles immunization into their contributing factors. Methods: Data from the Kenyan Demographic and Health Survey 2008/09 were used. The study investigated the effects of socio-economic determinants on [1] coverage and [2] wealth-related inequalities of SBA utilization and measles immunization. Techniques used were multivariate logistic regression and decomposition of the concentration index (C). Results: SBA utilization and measles immunization coverage differed according to household wealth, parent’s education, skilled antenatal care visits, birth order and father’s occupation. SBA utilization further differed across provinces and ethnic groups. The overall C for SBA was 0.14 and was mostly explained by wealth (40%), parent’s education (28%), antenatal care (9%), and province (6%). The overall C for measles immunization was 0.08 and was mostly explained by wealth (60%), birth order (33%), and parent’s education (28%). Rural residence (-19%) reduced this inequality. Conclusion: Both health care indicators require a broad strengthening of health systems with a special focus on disadvantaged sub-groups. Keywords: Kenya, Skilled birth attendance, Measles immunization, Socio-economic inequalities, Concentration index, Decomposition Introduction Skilled birth attendance (SBA) and measles immuni- zation reflect two aspects of health systems. While the immunization of children requires an elaborate health de- livery system and catch up campaigns (e.g., community immunization days), increasing levels of SBA can be more complex (requiring e.g., a minimum and continuous level of human resources for health), demanding broader efforts of the health system in place. Both aforementioned aspects are of course important. In the African region, appropriate health care including SBA could greatly reduce maternal deaths and disabilities [1]. However, in many African countries, more than half of all births take place without the assistance of skilled health workers [2]. Routine measles vaccination coverage achieved >80% coverage in 2008, but a population im- munity needs a coverage of >93–95% in all districts to prevent measles epidemics [3]. The WHO targets: >90% by routine at national level, >80% in all districts, and >95% by supplementary immunization activities (SIAs) in all dis- tricts [4] are not yet achieved. * Correspondence: [email protected] 1 Institute of Health and Society (IRSS), Université catholique de Louvain, Brussels, Belgium Full list of author information is available at the end of the article © 2013 Van Malderen et al.; licensee BioMed Central Ltd. This is an Open Access article distributed under the terms of the Creative Commons Attribution License (http://creativecommons.org/licenses/by/2.0), which permits unrestricted use, distribution, and reproduction in any medium, provided the original work is properly cited. Van Malderen et al. International Journal for Equity in Health 2013, 12:3 http://www.equityhealthj.com/content/12/1/3

Welcome message from author
This document is posted to help you gain knowledge. Please leave a comment to let me know what you think about it! Share it to your friends and learn new things together.
Transcript
Van Malderen et al. International Journal for Equity in Health 2013, 12:3http://www.equityhealthj.com/content/12/1/3
RESEARCH Open Access
Decomposing Kenyan socio-economic inequalitiesin skilled birth attendance and measlesimmunizationCarine Van Malderen1*, Irene Ogali2, Anne Khasakhala3, Stephen N Muchiri4, Corey Sparks5, Herman Van Oyen6
and Niko Speybroeck1
Abstract
Introduction: Skilled birth attendance (SBA) and measles immunization reflect two aspects of a health system. InKenya, their national coverage gaps are substantial but could be largely improved if the total population had thesame coverage as the wealthiest quintile. A decomposition analysis allows identifying the factors that influencethese wealth-related inequalities in order to develop appropriate policy responses. The main objective of the studywas to decompose wealth-related inequalities in SBA and measles immunization into their contributing factors.
Methods: Data from the Kenyan Demographic and Health Survey 2008/09 were used. The study investigated theeffects of socio-economic determinants on [1] coverage and [2] wealth-related inequalities of SBA utilization andmeasles immunization. Techniques used were multivariate logistic regression and decomposition of theconcentration index (C).
Results: SBA utilization and measles immunization coverage differed according to household wealth, parent’seducation, skilled antenatal care visits, birth order and father’s occupation. SBA utilization further differed acrossprovinces and ethnic groups. The overall C for SBA was 0.14 and was mostly explained by wealth (40%), parent’seducation (28%), antenatal care (9%), and province (6%). The overall C for measles immunization was 0.08 and wasmostly explained by wealth (60%), birth order (33%), and parent’s education (28%). Rural residence (−19%) reducedthis inequality.
Conclusion: Both health care indicators require a broad strengthening of health systems with a special focus ondisadvantaged sub-groups.
Keywords: Kenya, Skilled birth attendance, Measles immunization, Socio-economic inequalities, Concentrationindex, Decomposition
IntroductionSkilled birth attendance (SBA) and measles immuni-zation reflect two aspects of health systems. While theimmunization of children requires an elaborate health de-livery system and catch up campaigns (e.g., communityimmunization days), increasing levels of SBA can be morecomplex (requiring e.g., a minimum and continuous levelof human resources for health), demanding broaderefforts of the health system in place.
* Correspondence: [email protected] of Health and Society (IRSS), Université catholique de Louvain,Brussels, BelgiumFull list of author information is available at the end of the article
© 2013 Van Malderen et al.; licensee BioMed CCreative Commons Attribution License (http:/distribution, and reproduction in any medium
Both aforementioned aspects are of course important.In the African region, appropriate health care includingSBA could greatly reduce maternal deaths and disabilities[1]. However, in many African countries, more than halfof all births take place without the assistance of skilledhealth workers [2]. Routine measles vaccination coverageachieved >80% coverage in 2008, but a population im-munity needs a coverage of >93–95% in all districts toprevent measles epidemics [3]. The WHO targets: >90%by routine at national level, >80% in all districts, and >95%by supplementary immunization activities (SIAs) in all dis-tricts [4] are not yet achieved.
entral Ltd. This is an Open Access article distributed under the terms of the/creativecommons.org/licenses/by/2.0), which permits unrestricted use,, provided the original work is properly cited.
Van Malderen et al. International Journal for Equity in Health 2013, 12:3 Page 2 of 13http://www.equityhealthj.com/content/12/1/3
Whereas efforts are being made to increase health carecoverage in sub-Saharan countries, reaching the margina-lized sub-populations may be the real future challenge.Indeed, socio-economic inequalities were observed in sev-eral health care indicators [5,6]. The question of whetherto choose between a whole-population approach or moretargeted interventions towards marginalized groups wasraised [6]. Addressing these socio-economic health in-equalities can be important not only from the social just-ice point of view but also from a general public healthperspective as it may be the most efficient way to improvehealth care levels. This is particularly true for measlesimmunization: not reaching specific groups brings aboutsub-optimal coverage thereby maintaining the risk of epi-demics, a risk for the whole population [7,8]. SBA andmeasles immunization are two indicators selected by theCountdown to 2015 Equity Analysis Group according to anumber of criteria such as relevance to health systemstrengths [5]. The two indicators are as such also re-presenting relevant indicators to monitor health careinequalities.In Kenya, the national coverage gap (i.e., the increase in
coverage required in order to achieve universal coverage)was 58% for SBA – among the highest compared to otherAfrican countries – and 27% for measles immunization(2008) [6]. The population attributable risk (PAR), i.e. theimprovement possible if the total population has the samecoverage as the wealthiest quintile, was 34% for SBA and15% for measles immunization [6]. These figures indicatethat the Kenyan population might benefit from a moretargeted approach. The evidence on socio-economicinequalities in health and health care has led to renewedinterest to understand the factors that influence theseinequalities in order to develop appropriate policyresponses [9-12]. Once inequalities have been observed, alogical step towards guiding interventions aimed at redu-cing inequalities is indeed to understand the observed di-fferences, e.g., why do poor women have low access tohealth care programmes? Use of specific analytical tools,such as a decomposition analysis [13], is then needed inorder to analyse the determinants of these inequalities.Such tools allow understanding how a determinant affectsinequality: through its more unequal distribution acrossthe population (e.g. illiteracy is more prevalent amongpoor mother) or through its greater association with thehealth outcome (e.g. mother’s illiteracy is associated withinfant mortality) [13,14].The main objective of this study was to decompose
wealth-related inequalities in SBA and measles immu-nization into their contributing factors, the goal being toidentify targets to lower these inequalities. The use ofboth health service indicators aims at entangling two di-fferent health service characteristics, namely SBA linkedto the need of long-range investment programs requi-
ring trained health professionals/facilities and measlesimmunization, which can be more easily addressed throughcommunity campaigns.
MethodsStudy site and populationKenya, located in the eastern part of Africa, is divided in8 provinces. There are various ethnic groups and twomain religions: Christianity and Islam. The economy ispredominantly agricultural with a strong industrial base[15]. In 2008, the Gross National Income per capita(PPP) was $1560 [16] and the Gini index was 42.5 [17].Forty% of the labour force was unemployed [17]. In2009, the population was estimated at 39 million [16,18],77% living in rural areas [16]. Adult literacy rate was87% [16]. The number of women aged 15–49 years oldwas 9.6 million and the number of live births was 1.5million. Fertility rate was estimated at 4.6 births perwoman [19]. In 2008/09, 47% of women 20–24 gavebirth before age 20 [15].
DataData from the Demographic and Health Survey (DHS)conducted in Kenya in 2008/09 were used for the study.Data from preceding Kenyan DHS: 1993, 1998 and 2003were used for a trends analysis. Data collection and pro-cessing are described in [15,20-22]. In brief, a two-stagesampling design stratified on region and place of resi-dence (urban/rural) was used. Information on SBA(self-reported) was available for 4249, 2403, 5929 and6059 children under 5 in 1993, 1998, 2003 and 2008/09respectively. Information on measles immunization(recorded on the vaccination card or self-reported if notrecorded) was available for 806, 780, 1096 and 1116 chil-dren aged 12–23 months in 1993, 1998, 2003 and 2008/09,respectively. The recall period was 5 years for both indica-tors but the measles analysis was restricted to childrenaged 12–23 months because this is the youngest cohort ofchildren who have reached the age by which they shouldbe fully vaccinated (<12 months) [15].
Data analysisData were transferred to RGui (R version 2.14.2., The Rfoundation for Statistical Computing) for analysis. Bothhealth care indicators were binary variables. SBA takes avalue of 1 if the delivery has been attended by skilledhealth personnel (doctor, nurse or midwife). Measlesimmunization takes a value of 1 if the child aged >12-23 months has been immunized against measles. Theindependent variables used in the analysis were: antenatalcare attendance, sex of the child, child’s age, birth order,mother’s age at birth, type of residence (urban/rural),province, ethnic group, religion, marital status, parents’level of education, parents’ occupation, insurance coverage
� �
Van Malderen et al. International Journal for Equity in Health 2013, 12:3 Page 3 of 13http://www.equityhealthj.com/content/12/1/3
and household wealth. The wealth index, computed byDHS, comprises household assets (type of flooring, watersupply, sanitation facilities, electricity, persons per slee-ping room, ownership of agricultural land, domestic ser-vant, and other assets).The concentration index (C) [23] was used as a measure
of socioeconomic inequality. The method is described indetails elsewhere [11-13]. Briefly, a relative concentrationcurve plots on the x-axis the cumulative percentage ofchildren ranked by household wealth and on the y-axisthe cumulative percentage of the variable of interest (SBA,measles immunization or a determinant). The relative C isdefined as twice the area between the concentration curveand the diagonal (line of equality). If the curve is belowthe diagonal, C is positive and the variable of interest ismore prevalent among the wealthier households. Giventhat the bounds of the C of a binary health indicator de-pend on the mean of this indicator, a normalized C (C*)proposed by Erreygers was computed when comparingtime periods or geographical areas [24].In order to satisfy the linearity assumption of the de-
composition method used [25], inequality in predictedSBA (ln odds SBA) and measles immunization was com-puted and decomposed into its contributing determinants[14]. For this, a multivariate logistic regression model wasused to estimate the regression coefficients of each deter-minant on the two indicators, and compute the resultingpredicted health care outcome. The C of the predictedhealth outcome can be expressed as:
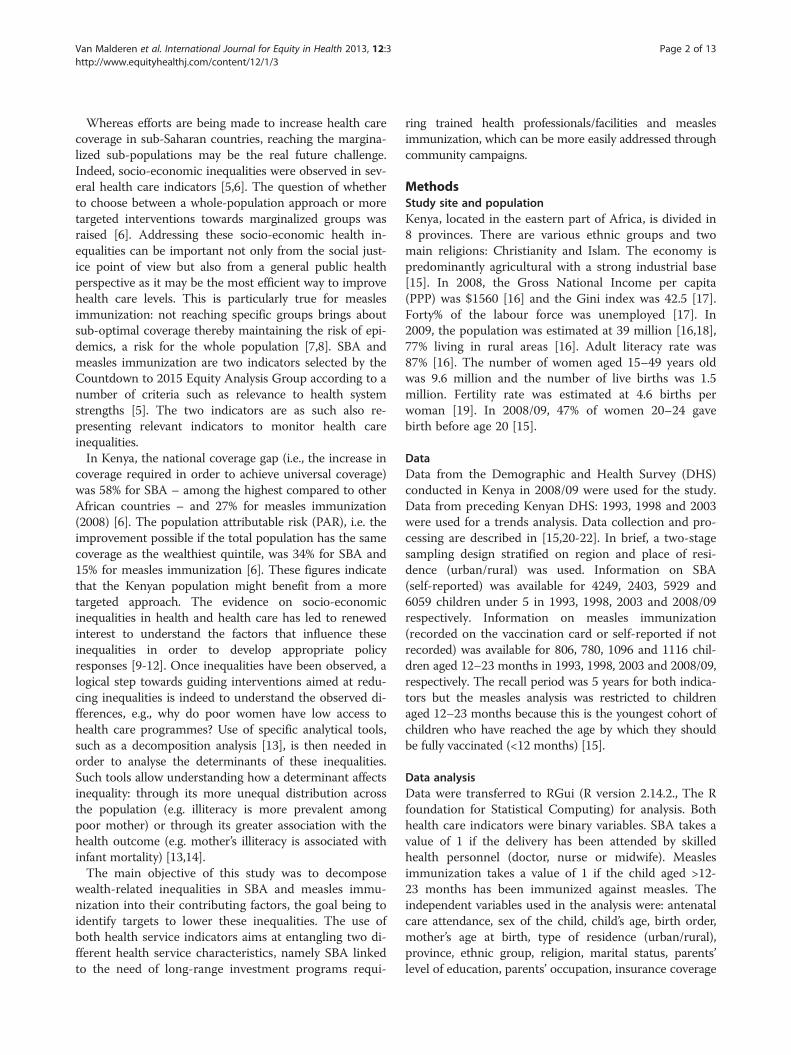
Figure 1 Proportions of skilled birth attendance and measles immuni2007–2012. * = Erreygers’ corrected concentration index [24].
C ¼X
k
βk�xkμ
Ck
the sum of contributions of the k determinants [13,25].The contribution of each determinant is a function of itsregression coefficient βk, its mean �xk , the mean of the pre-dicted health outcomeμ, and its concentration indexCk.All analyses were weighted (weights provided with the
DHS data) and adjusted for the cluster randomized sam-pling frame (with cluster as the primary sampling unitand household as the secondary sampling unit). The cri-terion for statistical significance used was α = 0.01.
ResultsComparison with other sub-Saharan African countriesHealth care indicators means and concentration indiceswere computed in 11 other African countries with DHSdata dating from 2007 to 2012 (Figure 1). Kenya wasamong countries with the lowest SBA (<50%) and thehighest inequality in SBA (C* > 0.4). However, with re-spect to measles immunization coverage, Kenya rankedsecond to Malawi with the highest coverage (85%) andhad a median position in measles coverage inequality.
SBA, measles immunization and inequality by provinceNairobi and Central provinces had the highest percen-tages of SBA deliveries among women while North
zation versus wealth-related inequality in these indicators, DHS
Van Malderen et al. International Journal for Equity in Health 2013, 12:3 Page 4 of 13http://www.equityhealthj.com/content/12/1/3
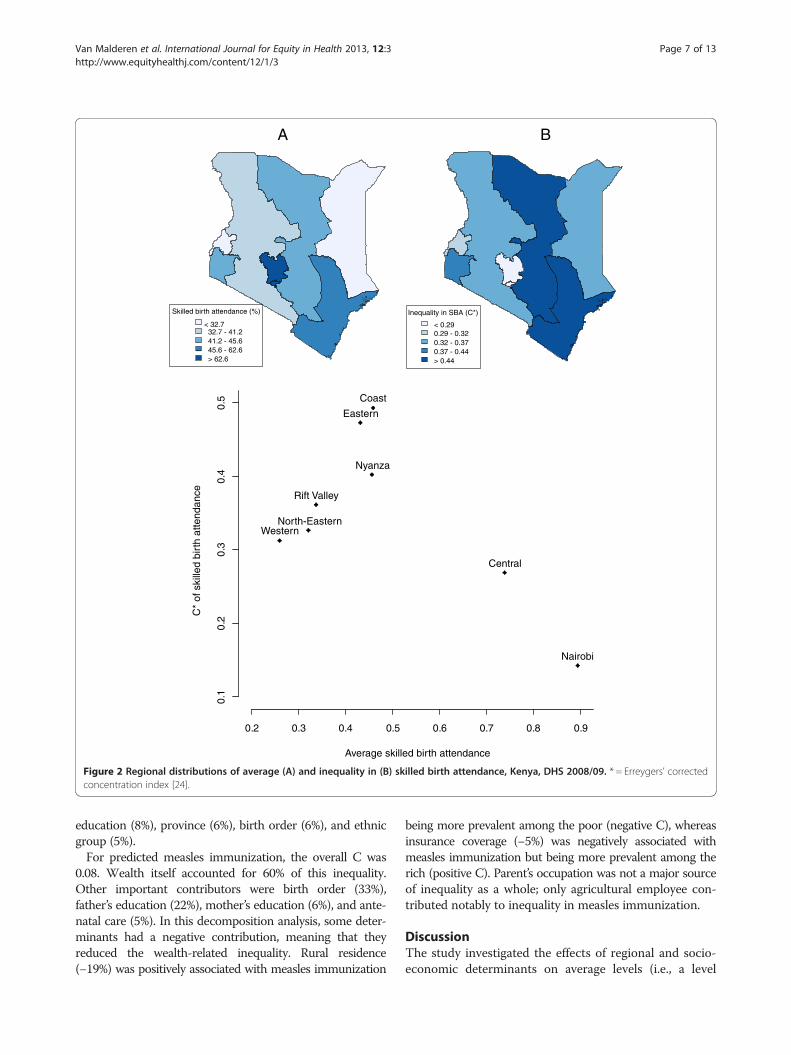
Eastern, Western and Rift Valley had the lowest (Table 1,Figure 2A). After controlling for the effect of the othervariables, Rift Valley was still negatively associated withlow uptake of SBA (Table 2). A relative normalized Cwas computed by province (Figures 2B). With the excep-tion of the Central province and Nairobi, all provincesshowed a low SBA coverage (<0.5) and a high inequalityin SBA (C* > 0.3). Among this group of provinces, apositive association between coverage and inequalitycould be observed (R2: 0.79, p = 0.02). Coast and Easternprovinces had the highest inequality. Nairobi was theprovince with the highest coverage and the lowestinequality.Rift Valley and Eastern provinces had the highest per-
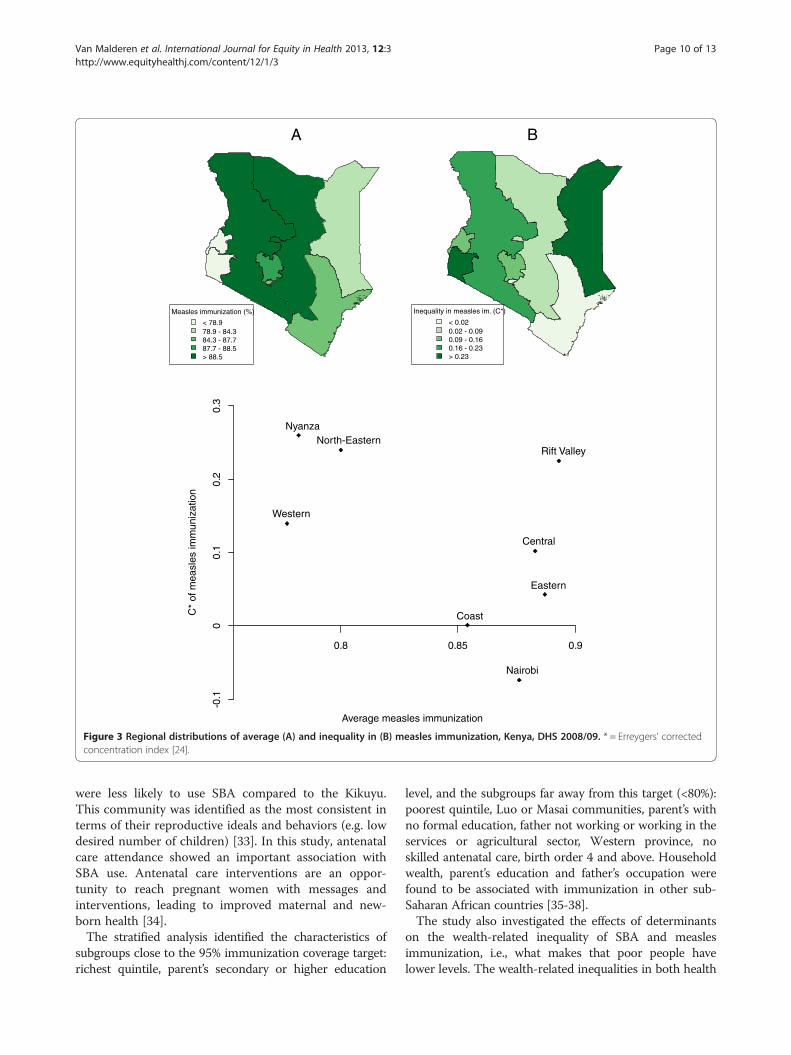
centages of measles immunization coverage, and Westernand Nyanza, the lowest (Table 1, Figure 3A). Nyanza,North Eastern and Rift Valley had the highest wealth-related inequality in measles immunization (C* > 0.2)(Figure 3B). Nairobi was the only province with a negativeC, i.e. an inequality favouring the poor. Coast, Central andEastern had a high coverage (>85%) and a low inequality(C* < 0.11).
Trends in wealth-related inequality in SBA and measlesimmunizationHealth care indicators were plotted as a function ofwealth quintiles and a normalized relative C was com-puted, by survey year, in Figure 4. The wealth-related in-equality in SBA was high in 1993 and persisted until2008/09. SBA inequality showed a “mass deprivationpattern”, i.e., the majority of the population had equiva-lent but deficient access to SBA while small privilegedgroups (quintiles 4 and 5) had better access to this ser-vice. The pattern and the relative C varied little over thesurvey years.The wealth-related inequality in measles immunization
increased until 2003 and then dropped in 2008/09. Thepattern took a “queuing” form, i.e., the general access tomeasles immunization was better than for SBA, butmiddle and richer wealth quintiles groups benefitedmost, while for the poorer groups a large proportion wasstill not vaccinated. In 2008/09, the queuing patternseems to have diminished.
Determinants of SBAThe distribution of SBA across population sub-groups isshown in Table 1, and regression coefficients from themultivariate analysis are shown in Table 2. In total, 44% ofbirths were attended by a health professional.SBA utilization increased with the household wealth
quintile and with parent’s education. SBA coverage wasfour times higher in the richest quintile than in the poor-est. Less than 20% of women with no education (13% ofwomen) delivered with skilled assistance. This figure
doubled when the mother had attained primary level edu-cation and tripled when the mother had attained secon-dary level education. SBA utilization was two times lowerin rural households; however, the effect of rural residencefaded when controlling for the other variables. Womenfrom the Kikuyu ethnic group had the highest proportionof SBA uptake. In the multivariate analysis, women fromthe Kamba, Luhya, Luo and Mijikenda ethnic communi-ties were less likely than Kikuyu to use SBA. Regardless ofthe socio-economic position of the household, SBAutilization decreased with birth order (p = 0.014), andincreased with the number of antenatal care visits. Com-pared with women who had not attended antenatal care, itwas three times greater when women had attended at leastone visit, and about five times greater when women hadattended the recommended four visits.
Determinants of measles immunizationThe distribution of measles immunization across popu-lation sub-groups is shown in Table 1, and regressioncoefficients from the multivariate analysis are shown inTable 2. Eighty-five percent of 12–23 months childrenwere vaccinated against measles. Inequalities were lessnoticeable than for SBA, but nevertheless existed. Mea-sles immunization increased with the household wealthquintile and with parent’s education. Children from therichest household wealth quintile and from parents witha secondary or higher education level were close to the95% target. Coverage was below 80% in the followingcategories: poorest wealth quintile, parents with no for-mal education, Luo or Masai communities, father notworking or working in the services or agricultural sector,Western province, no skilled antenatal care, birth order4 and above. However, with the exception of birth order,the effect of socio-economic determinants on measlesimmunization was not statistically significant in themultivariate analysis.
Decomposition of wealth-related inequality in SBA andmeasles immunizationThe relative contributions to the overall C are shown inTable 2. A determinant can contribute to wealth-relatedinequality in health care both through its associationwith the health care indicator (regression coefficient)and through its unequal distribution across wealthgroups (C). C indicates how unequally the determinantis distributed over wealth: if C > 0, the determinant ismore prevalent among the wealthier, and if C < 0, the de-terminant is more prevalent among the poorer.In 2008/09, the overall C for predicted SBA was 0.14.
The wealth quintile accounted for about 40%. Twenty% ofthis inequality was explained by mother’s education. Otherimportant contributors were antenatal care (9%), father’s
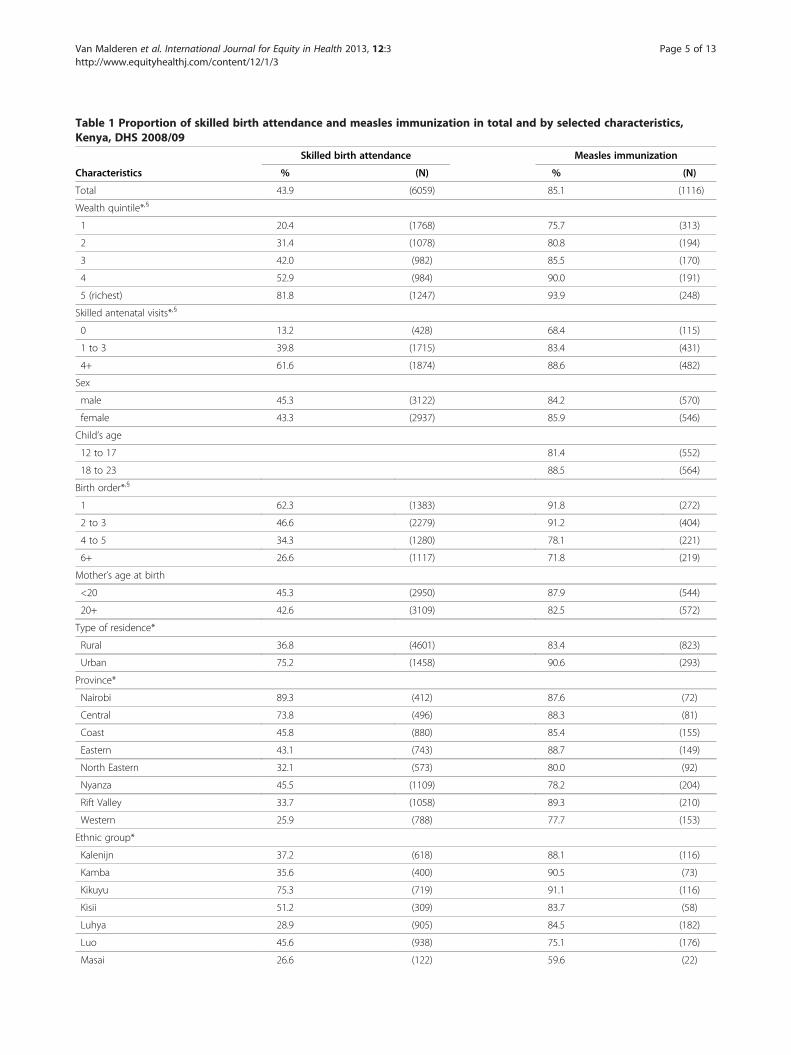
Table 1 Proportion of skilled birth attendance and measles immunization in total and by selected characteristics,Kenya, DHS 2008/09
Skilled birth attendance Measles immunization
Characteristics % (N) % (N)
Total 43.9 (6059) 85.1 (1116)
Wealth quintile*,§
1 20.4 (1768) 75.7 (313)
2 31.4 (1078) 80.8 (194)
3 42.0 (982) 85.5 (170)
4 52.9 (984) 90.0 (191)
5 (richest) 81.8 (1247) 93.9 (248)
Skilled antenatal visits*,§
0 13.2 (428) 68.4 (115)
1 to 3 39.8 (1715) 83.4 (431)
4+ 61.6 (1874) 88.6 (482)
Sex
male 45.3 (3122) 84.2 (570)
female 43.3 (2937) 85.9 (546)
Child’s age
12 to 17 81.4 (552)
18 to 23 88.5 (564)
Birth order*,§
1 62.3 (1383) 91.8 (272)
2 to 3 46.6 (2279) 91.2 (404)
4 to 5 34.3 (1280) 78.1 (221)
6+ 26.6 (1117) 71.8 (219)
Mother’s age at birth
<20 45.3 (2950) 87.9 (544)
20+ 42.6 (3109) 82.5 (572)
Type of residence*
Rural 36.8 (4601) 83.4 (823)
Urban 75.2 (1458) 90.6 (293)
Province*
Nairobi 89.3 (412) 87.6 (72)
Central 73.8 (496) 88.3 (81)
Coast 45.8 (880) 85.4 (155)
Eastern 43.1 (743) 88.7 (149)
North Eastern 32.1 (573) 80.0 (92)
Nyanza 45.5 (1109) 78.2 (204)
Rift Valley 33.7 (1058) 89.3 (210)
Western 25.9 (788) 77.7 (153)
Ethnic group*
Kalenijn 37.2 (618) 88.1 (116)
Kamba 35.6 (400) 90.5 (73)
Kikuyu 75.3 (719) 91.1 (116)
Kisii 51.2 (309) 83.7 (58)
Luhya 28.9 (905) 84.5 (182)
Luo 45.6 (938) 75.1 (176)
Masai 26.6 (122) 59.6 (22)
Van Malderen et al. International Journal for Equity in Health 2013, 12:3 Page 5 of 13http://www.equityhealthj.com/content/12/1/3
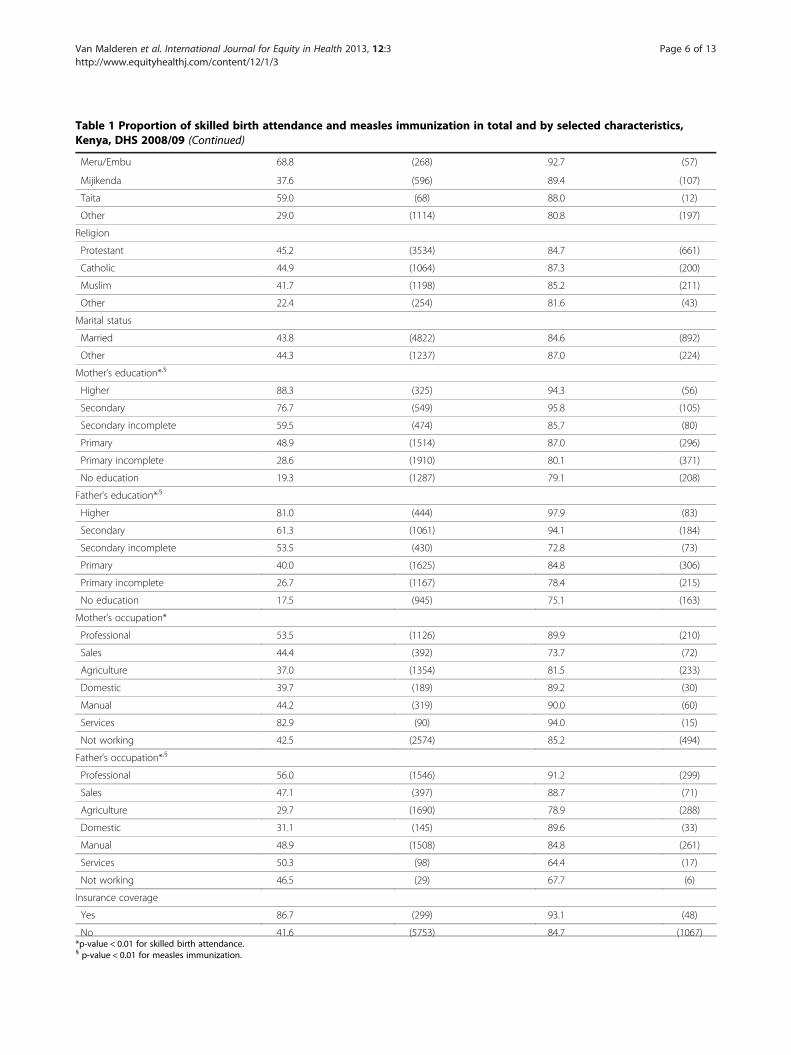
Table 1 Proportion of skilled birth attendance and measles immunization in total and by selected characteristics,Kenya, DHS 2008/09 (Continued)
Meru/Embu 68.8 (268) 92.7 (57)
Mijikenda 37.6 (596) 89.4 (107)
Taita 59.0 (68) 88.0 (12)
Other 29.0 (1114) 80.8 (197)
Religion
Protestant 45.2 (3534) 84.7 (661)
Catholic 44.9 (1064) 87.3 (200)
Muslim 41.7 (1198) 85.2 (211)
Other 22.4 (254) 81.6 (43)
Marital status
Married 43.8 (4822) 84.6 (892)
Other 44.3 (1237) 87.0 (224)
Mother’s education*,§
Higher 88.3 (325) 94.3 (56)
Secondary 76.7 (549) 95.8 (105)
Secondary incomplete 59.5 (474) 85.7 (80)
Primary 48.9 (1514) 87.0 (296)
Primary incomplete 28.6 (1910) 80.1 (371)
No education 19.3 (1287) 79.1 (208)
Father’s education*,§
Higher 81.0 (444) 97.9 (83)
Secondary 61.3 (1061) 94.1 (184)
Secondary incomplete 53.5 (430) 72.8 (73)
Primary 40.0 (1625) 84.8 (306)
Primary incomplete 26.7 (1167) 78.4 (215)
No education 17.5 (945) 75.1 (163)
Mother’s occupation*
Professional 53.5 (1126) 89.9 (210)
Sales 44.4 (392) 73.7 (72)
Agriculture 37.0 (1354) 81.5 (233)
Domestic 39.7 (189) 89.2 (30)
Manual 44.2 (319) 90.0 (60)
Services 82.9 (90) 94.0 (15)
Not working 42.5 (2574) 85.2 (494)
Father’s occupation*,§
Professional 56.0 (1546) 91.2 (299)
Sales 47.1 (397) 88.7 (71)
Agriculture 29.7 (1690) 78.9 (288)
Domestic 31.1 (145) 89.6 (33)
Manual 48.9 (1508) 84.8 (261)
Services 50.3 (98) 64.4 (17)
Not working 46.5 (29) 67.7 (6)
Insurance coverage
Yes 86.7 (299) 93.1 (48)
No 41.6 (5753) 84.7 (1067)*p-value < 0.01 for skilled birth attendance.§ p-value < 0.01 for measles immunization.
Van Malderen et al. International Journal for Equity in Health 2013, 12:3 Page 6 of 13http://www.equityhealthj.com/content/12/1/3
Skilled birth attendance (%)
< 32.732.7 - 41.241.2 - 45.645.6 - 62.6> 62.6
Inequality in SBA (C*)
< 0.290.29 - 0.320.32 - 0.370.37 - 0.44> 0.44
Average skilled birth attendance
C*
of s
kille
d bi
rth
atte
ndan
ce
0.2 0.3 0.4 0.5 0.6 0.7 0.8 0.9
0.1
0.2
0.3
0.4
0.5
Central
Coast
Eastern
Nairobi
North-Eastern
Nyanza
Rift Valley
Western
A B
Figure 2 Regional distributions of average (A) and inequality in (B) skilled birth attendance, Kenya, DHS 2008/09. * = Erreygers’ correctedconcentration index [24].
Van Malderen et al. International Journal for Equity in Health 2013, 12:3 Page 7 of 13http://www.equityhealthj.com/content/12/1/3
education (8%), province (6%), birth order (6%), and ethnicgroup (5%).For predicted measles immunization, the overall C was
0.08. Wealth itself accounted for 60% of this inequality.Other important contributors were birth order (33%),father’s education (22%), mother’s education (6%), and ante-natal care (5%). In this decomposition analysis, some deter-minants had a negative contribution, meaning that theyreduced the wealth-related inequality. Rural residence(−19%) was positively associated with measles immunization
being more prevalent among the poor (negative C), whereasinsurance coverage (−5%) was negatively associated withmeasles immunization but being more prevalent among therich (positive C). Parent’s occupation was not a major sourceof inequality as a whole; only agricultural employee con-tributed notably to inequality in measles immunization.
DiscussionThe study investigated the effects of regional and socio-economic determinants on average levels (i.e., a level
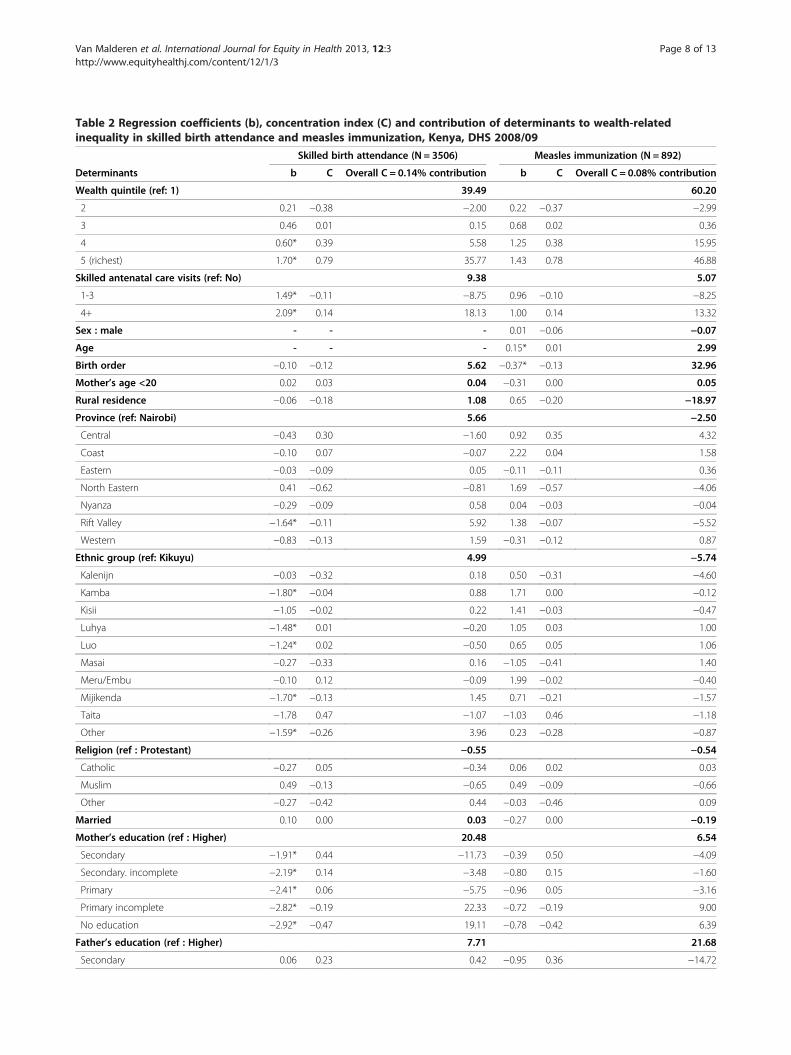
Table 2 Regression coefficients (b), concentration index (C) and contribution of determinants to wealth-relatedinequality in skilled birth attendance and measles immunization, Kenya, DHS 2008/09
Skilled birth attendance (N = 3506) Measles immunization (N = 892)
Determinants b C Overall C = 0.14% contribution b C Overall C = 0.08% contribution
Wealth quintile (ref: 1) 39.49 60.20
2 0.21 −0.38 −2.00 0.22 −0.37 −2.99
3 0.46 0.01 0.15 0.68 0.02 0.36
4 0.60* 0.39 5.58 1.25 0.38 15.95
5 (richest) 1.70* 0.79 35.77 1.43 0.78 46.88
Skilled antenatal care visits (ref: No) 9.38 5.07
1-3 1.49* −0.11 −8.75 0.96 −0.10 −8.25
4+ 2.09* 0.14 18.13 1.00 0.14 13.32
Sex : male - - - 0.01 −0.06 −0.07
Age - - - 0.15* 0.01 2.99
Birth order −0.10 −0.12 5.62 −0.37* −0.13 32.96
Mother’s age <20 0.02 0.03 0.04 −0.31 0.00 0.05
Rural residence −0.06 −0.18 1.08 0.65 −0.20 −18.97
Province (ref: Nairobi) 5.66 −2.50
Central −0.43 0.30 −1.60 0.92 0.35 4.32
Coast −0.10 0.07 −0.07 2.22 0.04 1.58
Eastern −0.03 −0.09 0.05 −0.11 −0.11 0.36
North Eastern 0.41 −0.62 −0.81 1.69 −0.57 −4.06
Nyanza −0.29 −0.09 0.58 0.04 −0.03 −0.04
Rift Valley −1.64* −0.11 5.92 1.38 −0.07 −5.52
Western −0.83 −0.13 1.59 −0.31 −0.12 0.87
Ethnic group (ref: Kikuyu) 4.99 −5.74
Kalenijn −0.03 −0.32 0.18 0.50 −0.31 −4.60
Kamba −1.80* −0.04 0.88 1.71 0.00 −0.12
Kisii −1.05 −0.02 0.22 1.41 −0.03 −0.47
Luhya −1.48* 0.01 −0.20 1.05 0.03 1.00
Luo −1.24* 0.02 −0.50 0.65 0.05 1.06
Masai −0.27 −0.33 0.16 −1.05 −0.41 1.40
Meru/Embu −0.10 0.12 −0.09 1.99 −0.02 −0.40
Mijikenda −1.70* −0.13 1.45 0.71 −0.21 −1.57
Taita −1.78 0.47 −1.07 −1.03 0.46 −1.18
Other −1.59* −0.26 3.96 0.23 −0.28 −0.87
Religion (ref : Protestant) −0.55 −0.54
Catholic −0.27 0.05 −0.34 0.06 0.02 0.03
Muslim 0.49 −0.13 −0.65 0.49 −0.09 −0.66
Other −0.27 −0.42 0.44 −0.03 −0.46 0.09
Married 0.10 0.00 0.03 −0.27 0.00 −0.19
Mother’s education (ref : Higher) 20.48 6.54
Secondary −1.91* 0.44 −11.73 −0.39 0.50 −4.09
Secondary. incomplete −2.19* 0.14 −3.48 −0.80 0.15 −1.60
Primary −2.41* 0.06 −5.75 −0.96 0.05 −3.16
Primary incomplete −2.82* −0.19 22.33 −0.72 −0.19 9.00
No education −2.92* −0.47 19.11 −0.78 −0.42 6.39
Father’s education (ref : Higher) 7.71 21.68
Secondary 0.06 0.23 0.42 −0.95 0.36 −14.72
Van Malderen et al. International Journal for Equity in Health 2013, 12:3 Page 8 of 13http://www.equityhealthj.com/content/12/1/3
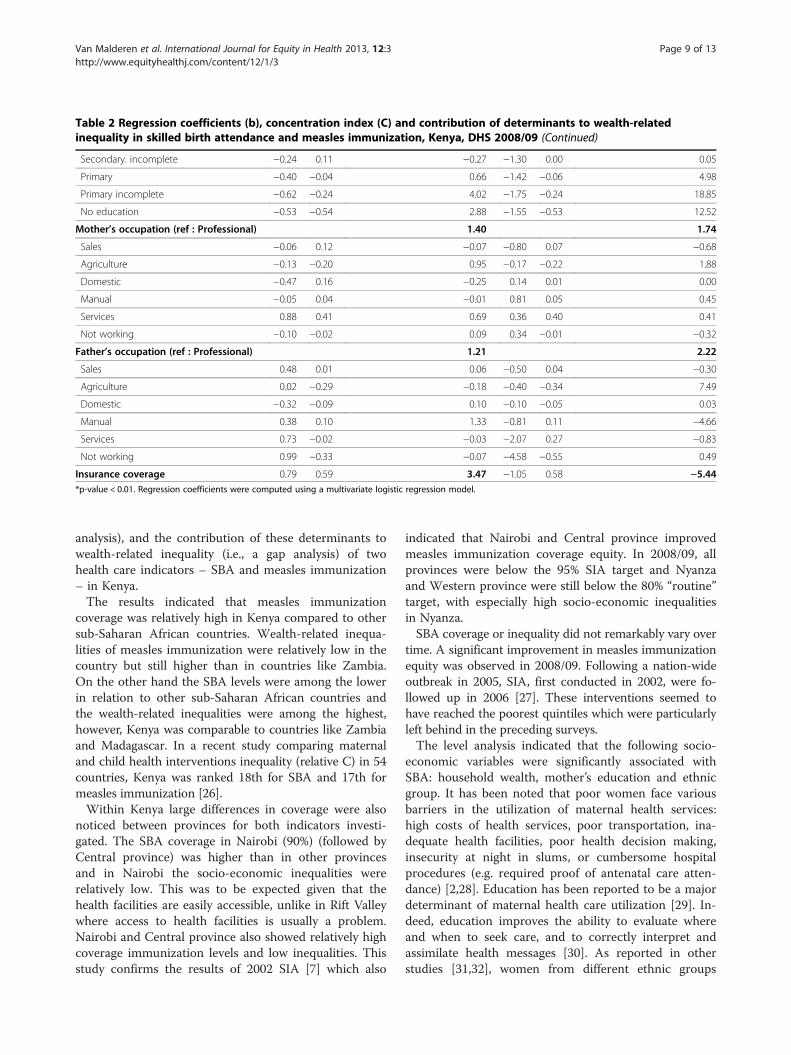
Table 2 Regression coefficients (b), concentration index (C) and contribution of determinants to wealth-relatedinequality in skilled birth attendance and measles immunization, Kenya, DHS 2008/09 (Continued)
Secondary. incomplete −0.24 0.11 −0.27 −1.30 0.00 0.05
Primary −0.40 −0.04 0.66 −1.42 −0.06 4.98
Primary incomplete −0.62 −0.24 4.02 −1.75 −0.24 18.85
No education −0.53 −0.54 2.88 −1.55 −0.53 12.52
Mother’s occupation (ref : Professional) 1.40 1.74
Sales −0.06 0.12 −0.07 −0.80 0.07 −0.68
Agriculture −0.13 −0.20 0.95 −0.17 −0.22 1.88
Domestic −0.47 0.16 −0.25 0.14 0.01 0.00
Manual −0.05 0.04 −0.01 0.81 0.05 0.45
Services 0.88 0.41 0.69 0.36 0.40 0.41
Not working −0.10 −0.02 0.09 0.34 −0.01 −0.32
Father’s occupation (ref : Professional) 1.21 2.22
Sales 0.48 0.01 0.06 −0.50 0.04 −0.30
Agriculture 0.02 −0.29 −0.18 −0.40 −0.34 7.49
Domestic −0.32 −0.09 0.10 −0.10 −0.05 0.03
Manual 0.38 0.10 1.33 −0.81 0.11 −4.66
Services 0.73 −0.02 −0.03 −2.07 0.27 −0.83
Not working 0.99 −0.33 −0.07 −4.58 −0.55 0.49
Insurance coverage 0.79 0.59 3.47 −1.05 0.58 −5.44*p-value < 0.01. Regression coefficients were computed using a multivariate logistic regression model.
Van Malderen et al. International Journal for Equity in Health 2013, 12:3 Page 9 of 13http://www.equityhealthj.com/content/12/1/3
analysis), and the contribution of these determinants towealth-related inequality (i.e., a gap analysis) of twohealth care indicators – SBA and measles immunization– in Kenya.The results indicated that measles immunization
coverage was relatively high in Kenya compared to othersub-Saharan African countries. Wealth-related inequa-lities of measles immunization were relatively low in thecountry but still higher than in countries like Zambia.On the other hand the SBA levels were among the lowerin relation to other sub-Saharan African countries andthe wealth-related inequalities were among the highest,however, Kenya was comparable to countries like Zambiaand Madagascar. In a recent study comparing maternaland child health interventions inequality (relative C) in 54countries, Kenya was ranked 18th for SBA and 17th formeasles immunization [26].Within Kenya large differences in coverage were also
noticed between provinces for both indicators investi-gated. The SBA coverage in Nairobi (90%) (followed byCentral province) was higher than in other provincesand in Nairobi the socio-economic inequalities wererelatively low. This was to be expected given that thehealth facilities are easily accessible, unlike in Rift Valleywhere access to health facilities is usually a problem.Nairobi and Central province also showed relatively highcoverage immunization levels and low inequalities. Thisstudy confirms the results of 2002 SIA [7] which also
indicated that Nairobi and Central province improvedmeasles immunization coverage equity. In 2008/09, allprovinces were below the 95% SIA target and Nyanzaand Western province were still below the 80% “routine”target, with especially high socio-economic inequalitiesin Nyanza.SBA coverage or inequality did not remarkably vary over
time. A significant improvement in measles immunizationequity was observed in 2008/09. Following a nation-wideoutbreak in 2005, SIA, first conducted in 2002, were fo-llowed up in 2006 [27]. These interventions seemed tohave reached the poorest quintiles which were particularlyleft behind in the preceding surveys.The level analysis indicated that the following socio-
economic variables were significantly associated withSBA: household wealth, mother’s education and ethnicgroup. It has been noted that poor women face variousbarriers in the utilization of maternal health services:high costs of health services, poor transportation, ina-dequate health facilities, poor health decision making,insecurity at night in slums, or cumbersome hospitalprocedures (e.g. required proof of antenatal care atten-dance) [2,28]. Education has been reported to be a majordeterminant of maternal health care utilization [29]. In-deed, education improves the ability to evaluate whereand when to seek care, and to correctly interpret andassimilate health messages [30]. As reported in otherstudies [31,32], women from different ethnic groups
Measles immunization (%)
< 78.978.9 - 84.384.3 - 87.787.7 - 88.5> 88.5
Inequality in measles im. (C*)
< 0.020.02 - 0.090.09 - 0.160.16 - 0.23> 0.23
Average measles immunization
C*
of m
easl
es im
mun
izat
ion
0.8 0.85 0.9
-0.1
00.
10.
20.
3
Central
Coast
Eastern
Nairobi
North-EasternNyanza
Rift Valley
Western
A B
Figure 3 Regional distributions of average (A) and inequality in (B) measles immunization, Kenya, DHS 2008/09. * = Erreygers’ correctedconcentration index [24].
Van Malderen et al. International Journal for Equity in Health 2013, 12:3 Page 10 of 13http://www.equityhealthj.com/content/12/1/3
were less likely to use SBA compared to the Kikuyu.This community was identified as the most consistent interms of their reproductive ideals and behaviors (e.g. lowdesired number of children) [33]. In this study, antenatalcare attendance showed an important association withSBA use. Antenatal care interventions are an oppor-tunity to reach pregnant women with messages andinterventions, leading to improved maternal and new-born health [34].The stratified analysis identified the characteristics of
subgroups close to the 95% immunization coverage target:richest quintile, parent’s secondary or higher education
level, and the subgroups far away from this target (<80%):poorest quintile, Luo or Masai communities, parent’s withno formal education, father not working or working in theservices or agricultural sector, Western province, noskilled antenatal care, birth order 4 and above. Householdwealth, parent’s education and father’s occupation werefound to be associated with immunization in other sub-Saharan African countries [35-38].The study also investigated the effects of determinants
on the wealth-related inequality of SBA and measlesimmunization, i.e., what makes that poor people havelower levels. The wealth-related inequalities in both health
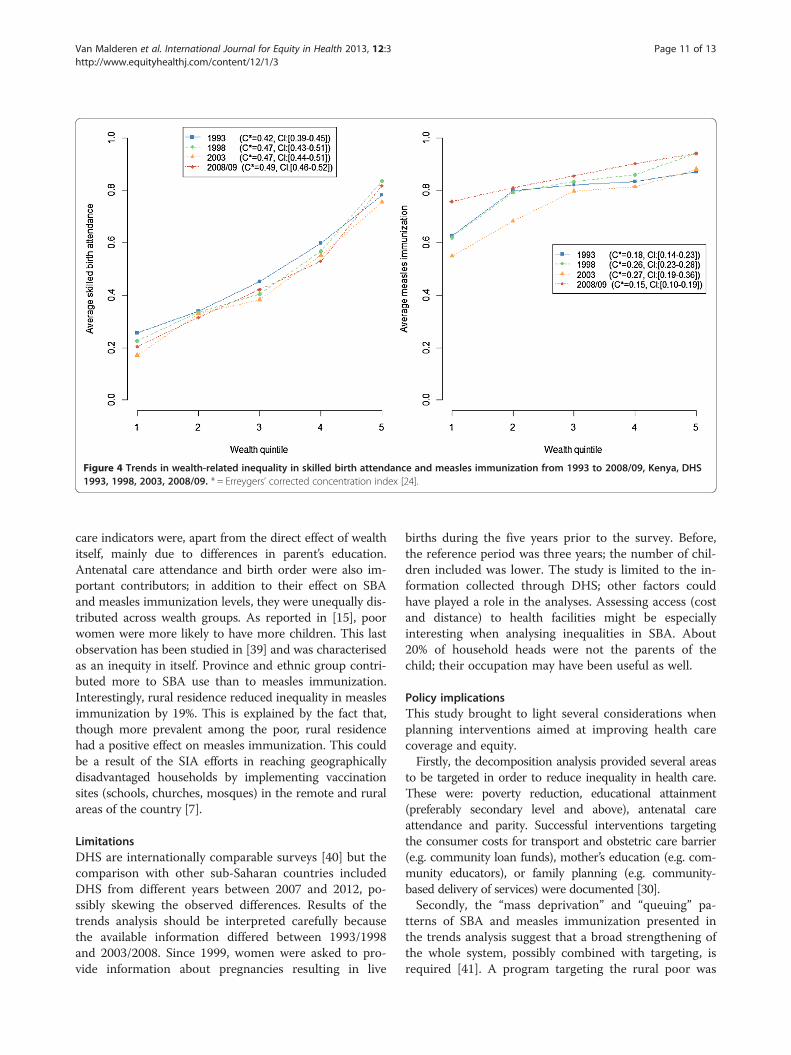
Figure 4 Trends in wealth-related inequality in skilled birth attendance and measles immunization from 1993 to 2008/09, Kenya, DHS1993, 1998, 2003, 2008/09. * = Erreygers’ corrected concentration index [24].
Van Malderen et al. International Journal for Equity in Health 2013, 12:3 Page 11 of 13http://www.equityhealthj.com/content/12/1/3
care indicators were, apart from the direct effect of wealthitself, mainly due to differences in parent’s education.Antenatal care attendance and birth order were also im-portant contributors; in addition to their effect on SBAand measles immunization levels, they were unequally dis-tributed across wealth groups. As reported in [15], poorwomen were more likely to have more children. This lastobservation has been studied in [39] and was characterisedas an inequity in itself. Province and ethnic group contri-buted more to SBA use than to measles immunization.Interestingly, rural residence reduced inequality in measlesimmunization by 19%. This is explained by the fact that,though more prevalent among the poor, rural residencehad a positive effect on measles immunization. This couldbe a result of the SIA efforts in reaching geographicallydisadvantaged households by implementing vaccinationsites (schools, churches, mosques) in the remote and ruralareas of the country [7].
LimitationsDHS are internationally comparable surveys [40] but thecomparison with other sub-Saharan countries includedDHS from different years between 2007 and 2012, po-ssibly skewing the observed differences. Results of thetrends analysis should be interpreted carefully becausethe available information differed between 1993/1998and 2003/2008. Since 1999, women were asked to pro-vide information about pregnancies resulting in live
births during the five years prior to the survey. Before,the reference period was three years; the number of chil-dren included was lower. The study is limited to the in-formation collected through DHS; other factors couldhave played a role in the analyses. Assessing access (costand distance) to health facilities might be especiallyinteresting when analysing inequalities in SBA. About20% of household heads were not the parents of thechild; their occupation may have been useful as well.
Policy implicationsThis study brought to light several considerations whenplanning interventions aimed at improving health carecoverage and equity.Firstly, the decomposition analysis provided several areas
to be targeted in order to reduce inequality in health care.These were: poverty reduction, educational attainment(preferably secondary level and above), antenatal careattendance and parity. Successful interventions targetingthe consumer costs for transport and obstetric care barrier(e.g. community loan funds), mother’s education (e.g. com-munity educators), or family planning (e.g. community-based delivery of services) were documented [30].Secondly, the “mass deprivation” and “queuing” pa-
tterns of SBA and measles immunization presented inthe trends analysis suggest that a broad strengthening ofthe whole system, possibly combined with targeting, isrequired [41]. A program targeting the rural poor was
Van Malderen et al. International Journal for Equity in Health 2013, 12:3 Page 12 of 13http://www.equityhealthj.com/content/12/1/3
already implemented for measles immunization throughthe SIA, and was initiated in two districts of Nyanza in2001 through the Skilled Care Initiative (SCI). SCI con-sists in the decentralization of routine and emergencyobstetric care.Thirdly, the analysis by province highlighted inequa-
lities between provinces and wealth-related inequalitywithin provinces. A more in-depth analysis determiningthe location of the most vulnerable sub-groups withinprovinces would help in better reaching the whole popu-lation during interventions.Finally, each intervention should be consistent with the
socioeconomic and political context which plays a pro-ximate role in the process to equity illustrated in the con-ceptual framework proposed by the Commission onSocial Determinants of Health (CSDH) [42]. The Kenyancontext seems prone to changes for more equity in health.In the last decade, many initiatives were launched by theKenyan government to improve social conditions andhealth, and some had an explicit equity goal [15]. Obser-vations resulting from the study at hand are especially inline with the National Population Policy for SustainableDevelopment goals: improvement of the standard of li-ving; health through education on how to prevent illnessand premature death among mothers and children; sus-tenance of the on-going demographic transition to furtherreduce fertility; and responsible parenthood. Moreover,Kenya, as a country partner of the CSDH, was involved inthe “Country Work Stream” aiming at turning evidenceon the social determinants of health and health equity intoeffective policies. Whereas the National ReproductiveHealth Policy that was launched in 2007 did not overtlyaddress issues of social determinants of health, theNational Reproductive Health Strategy of 2009–2015alluded to these. It was noted that the goal of reducinghealth inequities can only be achieved effectively by in-volving the population in decisions, mobilization, devolv-ing and allocation of resources. The community strategywas aimed at enhancing community access to health careso as to improve productivity, which in turn would lead toreduction in poverty, hunger, child and maternal deaths[43]. Similarly the Second National Health Sector StrategicPlan of Kenya Annual Operational Plan 6 of July 2010–June 2011 reiterated the need to address equity throughthe community strategy [44]. However the results of theabove efforts are yet to be realized.
ConclusionThe two indicators used, i.e., SBA and measles im-munization, seem to reflect two different aspects of thehealth system. Inequalities remain especially in SBA,reflecting the need of structural changes. Measles im-munization inequalities were lower than for SBA andmostly explained by wealth itself. Nevertheless, such
inequalities need to be tackled in order to achieve the>95% coverage in all districts target. Finally, both healthcare indicators require a broad strengthening with a spe-cial focus on disadvantaged sub-groups. All these issueshave been addressed in the National ReproductiveHealth Strategy of 2009 – 2015.
Competing interestsThe authors declare that they have no competing interests.
Authors’ contributionsCVM, IO and NS designed the study. CVM and IO analysed the data. NS andHVO supervised data analyses and results reporting. AK and SNM contributedto the interpretation of results and policy implications. CS contributed todata processing and creation of maps. CVM, IO and NS wrote the paper andall authors reviewed the manuscript.
Author details1Institute of Health and Society (IRSS), Université catholique de Louvain,Brussels, Belgium. 2Veterinary Research Centre, Kenya Agricultural ResearchInstitute, Kikuyu, Kenya. 3Population Studies Research Institute (PSRI),University of Nairobi, Nairobi, Kenya. 4Futures Group, Nairobi, Kenya.5Department of Demography, University of Texas, San Antonio, USA. 6Unit ofPublic Health and Surveillance, Scientific Institute of Public Health, Brussels,Belgium.
Received: 1 October 2012 Accepted: 28 December 2012Published: 7 January 2013
References1. Starrs AM: Safe motherhood initiative: 20 years and counting.
Lancet 2006, 368(9542):1130–1132.2. Essendi H, Mills S, Fotso J-C: Barriers to formal emergency obstretric care
services’ utilization. J Urban Health 2010, 88(Suppl.2):356–368.3. World Health Organization: WHO vaccine-preventable diseases: monitoring
system-2010 global summary. Geneva, Switzerland: World HealthOrganization; 2010.
4. World Health Organization: Report of the second meeting of the Africanregional measles technical advisory group (TAG), recommendations. AddisAbaba, Ethiopia: World Health Organization, Regional Office for Africa; 2008.
5. Boerma JT, Bryce J, Kinfu Y, Axelson H, Victora CG: Mind the gap: equityand trends in coverage of maternal, newborn, and child health servicesin 54 Countdown countries. Lancet 2008, 371(9620):1259–1267.
6. Hosseinpoor AR, Victora CG, Bergen N, Barros AJD, Boerma T: Towardsuniversal health coverage: the role of within-country wealth-relatedinequality in 28 countries in sub-Saharan Africa. Bull World Health Org2011, 89:881–890.
7. Vijayaraghavan M, Martin RM, Sangrujee N, Kimani GN, Oyombe S, Kalu A, et al:Measles supplemental immunization activities improve measles vaccinecoverage and equity: Evidence from Kenya, 2002. Health Policy 2007,83(1):27–36.
8. Sabbe M, Hue D, Hutse V, Goubau P: Measles resurgence in Belgium fromJanuary to mid-April 2011: a preliminary report. Euro Surveill 2011,16(16):1–5.
9. Zere E, Oluwole D, Kirigia JM, Mwikisa CN, Mbeeli T: Inequities in skilledattendance at birth in Namibia: a decomposition analysis. BMC PregnancyChildbirth 2011, 11:34.
10. Nkonki LL, Chopra M, Doherty TM, Jackson D, Robberstad B: Explaininghousehold socio-economic related child health inequalities usingmultiple methods in three diverse settings in South Africa. Int J EquityHealth 2011, 10:13.
11. Hosseinpoor AR, Van Doorslaer E, Speybroeck N, Naghavi M, Mohammad K,Majdzadeh R, et al: Decomposing socioeconomic inequality in infantmortality in Iran. Int J Epidemiol 2006, 35(5):1211–9.
12. Van de Poel E, Hosseinpoor AR, Jehu-Appiah C, Vega J, Speybroeck N:Malnutrition and the disproportional burden on the poor: the case ofGhana. Int J Equity Health 2007, 6(21):1–12.
13. Speybroeck N, Konings P, Lynch J, Harper S, Berkvens D, Lorant V, et al:Decomposing socioeconomic health inequalities. Int J Public Health 2010,55(4):347–51.
Van Malderen et al. International Journal for Equity in Health 2013, 12:3 Page 13 of 13http://www.equityhealthj.com/content/12/1/3
14. Hosseinpoor AR, Van Doorslaer E, Speybroeck N, Naghavi M, Mohammad K,Majdzadeh R, et al: Decomposing socioeconomic inequality in infantmortality in Iran. Int J Epidemiol 2006, 35(5):1211–9.
15. Kenya National Bureau of Statistics (KNBS) and ICF Macro: KenyaDemographic and Health Survey 2008–09. Calverton, Maryland: KNBS and ICFMacro; 2010.
16. The World bank: World Development Indicators. World Databank; 2012.http://databank.worldbank.org/ddp/home.do.
17. Central Intelligence Agency: The World Factbook 2012 Kenya. The WorldFactbook; 2012. https://www.cia.gov/library/publications/the-world-factbook/geos/ke.htm.
18. Kenya National Bureau of Statistics: 2009 Population housing and censusresults. Kenya: 2010. http://www.knbs.or.ke/surveys.php.
19. United States Census Bureau: International Database.: 2012. http://www.census.gov/population/international/data/idb/region.php.
20. Kenya National Bureau of Statistics (KNBS) and ICF Macro: KenyaDemographic and Health Survey 1993. Calverton, Maryland: KNBS and ICFMacro; 1994.
21. Kenya National Bureau of Statistics (KNBS) and ICF Macro: KenyaDemographic and Health Survey 1998. Calverton, Maryland: KNBS and ICFMacro; 1999.
22. Kenya National Bureau of Statistics (KNBS) and ICF Macro: KenyaDemographic and Health Survey 2003. Calverton, Maryland: KNBS and ICFMacro; 2004.
23. Kakwani N, Wagstaff A, Van Doorslaer E: Socioeconomic inequalities inhealth: Measurement, computation, and statistical inference. J Econom1997, 77(1):87–103.
24. Erreygers G: Correcting the concentration index. J Health Econom 2009, 28(2):504–15.
25. Wagstaff A, Van Doorslaer E, Watanabe N: On decomposing the causes ofhealth sector inequalities with an application to malnutrition inequalitiesin Vietnam. J Econometrics 2003, 112(1):207–23.
26. Barros AJ, Ronsmans C, Axelson H, Loaiza E, Bertoldi AD, Franca GV, et al:Equity in maternal, newborn, and child health interventions inCountdown to 2015: a retrospective review of survey data from 54countries. Lancet 2012, 379(9822):1225–33.
27. Centers for Disease Control and Prevention: Progress in Measles Control.Kenya: Morbidity and Mortality Weekly Report; 2007. 2002–2007.
28. Magadi M, Diamond I, Madise N: Analysis of factors associated withmaternal mortality in Kenyan hospitals. J Biosoc Sci 2001, 33(3):375–89.
29. Ahmed S, Creanga AA, Gillespie DG, Tsui AO: Economic status, educationand empowerment: implications for maternal health service utilization indeveloping countries. PLoS One 2010, 5(6):e11190.
30. Ensor T, Cooper S: Overcoming barriers to health service access:influencing the demand side. Health Policy Plann 2004, 19(2):69–79.
31. Ochako R, Fotso JC, Ikamari L, Khasakhala A: Utilization of maternal healthservices among young women in Kenya: insights from the KenyaDemographic and Health Survey, 2003. BMC Pregnancy Childbirth 2011, 11:1.
32. Wirth M, Sacks E, Delamonica E, Storeygard A, Minujin A, Balk D:“Delivering” on the MDGs?: equity and maternal health in Ghana,Ethiopia and Kenya. East Afr J Public Health 2008, 5(3):133–41.
33. Bauni E, Gichuhi W, Wasao S: Ethnicity and fertility in Kenya. Nairobi, Kenya:African Population and Health Research Center; 2000.
34. Ouma PO, Van Eijk AM, Hamel MJ, Sikuku ES, Odhiambo FO, Munguti KM, et al:Antenatal and delivery care in rural western Kenya: the effect of traininghealth care workers to provide “focused antenatal care”.Reprod Health 2010, 7(1):1.
35. Nankabirwa V, Tylleskar T, Tumwine JK, Sommerfelt H: Maternal educationis associated with vaccination status of infants less than 6 months inEastern Uganda: a cohort study. BMC Pediatr 2010, 10:92.
36. King R, Mann V, Boone PD: Knowledge and reported practices of menand women on maternal and child health in rural Guinea Bissau: a crosssectional survey. BMC Public Health 2010, 10:319.
37. Tadesse H, Deribew A, Woldie M: Predictors of defaulting fromcompletion of child immunization in south Ethiopia, May 2008: a casecontrol study. BMC Public Health 2009, 9:150.
38. Antai D: Inequitable childhood immunization uptake in Nigeria: amultilevel analysis of individual and contextual determinants. BMC InfectDis 2009, 9:181.
39. Gillespie D, Ahmed S, Tsui A, Radloff S: Unwanted fertility among thepoor: an inequity? Bull World Health Organ 2007, 85(2):100–7.
40. Short FM, Choi Y, Bird S: A systematic review of Demographic and HealthSurveys: data availability and utilization for research. Bull World HealthOrgan 2012, 90(8):604–12.
41. Van de Poel E, Hosseinpoor AR, Speybroeck N, Van OT, Vega J:Socioeconomic inequality in malnutrition in developing countries.Bull World Health Organ 2008, 86(4):282–91.
42. World Health Organization: A conceptual framework for action on the socialdeterminants of health. Geneva: Social Determinants of Health DiscussionPaper 2; 2010.
43. Ministry of Health and Sanitation and Ministry of Medical Services: NationalRepproductive Health Strategy 2009–2015. Nairobi: Division of ReproductiveHealth; 2009.
44. Ministry of Health and Sanitation and Ministry of Medical Services: Reversing thetrends The Second NATIONAL HEALTH SECTORS Strategic Plan of Kenya AnnualOperational Plan 6 July 2010–June 2011. Nairobi: Ministry of Health; 2010.
doi:10.1186/1475-9276-12-3Cite this article as: Van Malderen et al.: Decomposing Kenyan socio-economic inequalities in skilled birth attendance and measlesimmunization. International Journal for Equity in Health 2013 12:3.
Submit your next manuscript to BioMed Centraland take full advantage of:
• Convenient online submission
• Thorough peer review
• No space constraints or color figure charges
• Immediate publication on acceptance
• Inclusion in PubMed, CAS, Scopus and Google Scholar
• Research which is freely available for redistribution
Submit your manuscript at www.biomedcentral.com/submit
Related Documents