Decomposing Effects of Time on Task Reveals an Anteroposterior Gradient of Perceptual Decision Regions Bradley R. Buchsbaum 1 , Drew T. Erickson 2 , Andrew S. Kayser 2,3 * 1 Department of Psychology, University of Toronto, Toronto, Ontario, Canada, 2 Department of Neurology, The University of California at San Francisco, San Francisco, California, United States of America, 3 Department of Neurology, Veterans Affairs Northern California Health Care System, Martinez, California, United States of America Abstract In perceptual decision making, the selection of an appropriate action depends critically on an organism’s ability to use sensory inputs to accumulate evidence for a decision. However, differentiating decision-related processes from effects of ‘‘time on task’’ can be difficult. Here we combine the response signal paradigm, in which the experimenter rather than the subject dictates the time of the response, and independent components analysis (ICA) to search for signatures consistent with time on task and decision making, respectively, throughout the brain. Using this novel approach, we identify two such independent components from BOLD activity related to a random dot motion task: one sensitive to the main effect of stimulus duration, and one to both the main effect of motion coherence and its interaction with duration. Furthermore, we demonstrate that these two components are expressed differently throughout the brain, with activity in occipital regions most reflective of the former, activity within intraparietal sulcus modulated by both factors, and more anterior regions including the anterior insula, pre-SMA, and inferior frontal sulcus driven almost exclusively by the latter. Consistent with these ICA findings, cluster analysis identifies a posterior-to-anterior gradient that differentiates regions sensitive to time on task from regions whose activity is strongly tied to motion coherence. Together, these findings demonstrate that progressively more anterior regions are likely to participate in progressively more proximate decision-related processes. Citation: Buchsbaum BR, Erickson DT, Kayser AS (2013) Decomposing Effects of Time on Task Reveals an Anteroposterior Gradient of Perceptual Decision Regions. PLoS ONE 8(8): e72074. doi:10.1371/journal.pone.0072074 Editor: Joy J. Geng, University of California, Davis, United States of America Received February 15, 2013; Accepted July 8, 2013; Published August 19, 2013 This is an open-access article, free of all copyright, and may be freely reproduced, distributed, transmitted, modified, built upon, or otherwise used by anyone for any lawful purpose. The work is made available under the Creative Commons CC0 public domain dedication. Funding: This research was supported by funds provided by the state of California to Doctor Kayser through the Ernest Gallo Clinic and Research Center. The funder had no role in study design, data collection and analysis, decision to publish, or preparation of the manuscript. Competing Interests: The authors have declared that no competing interests exist. * E-mail: [email protected] Introduction Perceptual decision-making is a fundamental cognitive process in which sensory input guides the selection of one of many possible actions. This translation from sensation to action is thought to occur by a mechanism in which sensory evidence accumulates over time until the threshold for a decision is reached. Importantly, such a process has been observed in neurons whose firing rates increase proportionally with the strength of the sensory stimulus in regions including the lateral intraparietal cortex (LIP) [1], the frontal eye fields [2], the caudate [3], and the premotor cortex [4]. Thus, these studies suggest that many regions are involved in evidence accumulation and decision-making networks. Further defining these networks is a problem well suited to the whole-brain coverage provided by functional MRI studies. Human work has identified a number of brain regions whose activity varies with the amount of evidence available for perceptual decisions, including the middle intraparietal sulcus (the homologue of macaque LIP [5]), midline motor areas, dorsolateral frontal regions, and the anterior insula [6,7,8,9,10]. However, such studies have not always been consistent in their identification of the key areas for evidence accumulation, nor have the identified brain networks in human research always aligned with those identified in electrophysiological studies with macaques (e.g. with respect to the participation of lateral frontal areas in evidence accumulation). Why do these studies diverge? Potentially problematic for human studies are the correlated contributions of decision-related processes including evidence accumulation and what has often been referred to as ‘‘time on task’’ – i.e. the idea that a certain amount of non-specific brain activity can be attributed merely to the passage of time, or a ‘‘duty-cycle.’’ This issue arises because of the correlation between stimulus strength, the decision process, and reaction time: as the strength of the stimulus increases, evidence accumulation occurs more quickly, and reaction time decreases. For a dependent measure such as regional brain activity, the question of whether activity is correlated with a decision process such as evidence accumulation, or simply to the duration of the trial, becomes confounded. A sensory region, for example, might show activity that scales with motion coherence, but that is actually related solely to the duration of bottom-up attention captured by the stimulus on the screen. On the other hand, a region directly involved in the decision process may also show independent effects of time on task that, if not distinguished, might obscure its participation in the decision. Previous work has attempted to address the influence of time on task by exploiting variability in subjects’ reaction times. A study by Yarkoni and colleagues [11], for example, collected data from five different cognitive tasks and searched for brain regions whose activity correlated with subject reaction times across task. Similarly, Grinband and colleagues [12], as well as Weissman and Carp [13], investigated a more focused question: whether PLOS ONE | www.plosone.org 1 August 2013 | Volume 8 | Issue 8 | e72074

Welcome message from author
This document is posted to help you gain knowledge. Please leave a comment to let me know what you think about it! Share it to your friends and learn new things together.
Transcript
Decomposing Effects of Time on Task Reveals anAnteroposterior Gradient of Perceptual Decision RegionsBradley R. Buchsbaum1, Drew T. Erickson2, Andrew S. Kayser2,3*
1 Department of Psychology, University of Toronto, Toronto, Ontario, Canada, 2 Department of Neurology, The University of California at San Francisco, San Francisco,
California, United States of America, 3 Department of Neurology, Veterans Affairs Northern California Health Care System, Martinez, California, United States of America
Abstract
In perceptual decision making, the selection of an appropriate action depends critically on an organism’s ability to usesensory inputs to accumulate evidence for a decision. However, differentiating decision-related processes from effects of‘‘time on task’’ can be difficult. Here we combine the response signal paradigm, in which the experimenter rather than thesubject dictates the time of the response, and independent components analysis (ICA) to search for signatures consistentwith time on task and decision making, respectively, throughout the brain. Using this novel approach, we identify two suchindependent components from BOLD activity related to a random dot motion task: one sensitive to the main effect ofstimulus duration, and one to both the main effect of motion coherence and its interaction with duration. Furthermore, wedemonstrate that these two components are expressed differently throughout the brain, with activity in occipital regionsmost reflective of the former, activity within intraparietal sulcus modulated by both factors, and more anterior regionsincluding the anterior insula, pre-SMA, and inferior frontal sulcus driven almost exclusively by the latter. Consistent withthese ICA findings, cluster analysis identifies a posterior-to-anterior gradient that differentiates regions sensitive to time ontask from regions whose activity is strongly tied to motion coherence. Together, these findings demonstrate thatprogressively more anterior regions are likely to participate in progressively more proximate decision-related processes.
Citation: Buchsbaum BR, Erickson DT, Kayser AS (2013) Decomposing Effects of Time on Task Reveals an Anteroposterior Gradient of Perceptual DecisionRegions. PLoS ONE 8(8): e72074. doi:10.1371/journal.pone.0072074
Editor: Joy J. Geng, University of California, Davis, United States of America
Received February 15, 2013; Accepted July 8, 2013; Published August 19, 2013
This is an open-access article, free of all copyright, and may be freely reproduced, distributed, transmitted, modified, built upon, or otherwise used by anyone forany lawful purpose. The work is made available under the Creative Commons CC0 public domain dedication.
Funding: This research was supported by funds provided by the state of California to Doctor Kayser through the Ernest Gallo Clinic and Research Center. Thefunder had no role in study design, data collection and analysis, decision to publish, or preparation of the manuscript.
Competing Interests: The authors have declared that no competing interests exist.
* E-mail: [email protected]
Introduction
Perceptual decision-making is a fundamental cognitive process
in which sensory input guides the selection of one of many possible
actions. This translation from sensation to action is thought to
occur by a mechanism in which sensory evidence accumulates
over time until the threshold for a decision is reached. Importantly,
such a process has been observed in neurons whose firing rates
increase proportionally with the strength of the sensory stimulus in
regions including the lateral intraparietal cortex (LIP) [1], the
frontal eye fields [2], the caudate [3], and the premotor cortex [4].
Thus, these studies suggest that many regions are involved in
evidence accumulation and decision-making networks.
Further defining these networks is a problem well suited to the
whole-brain coverage provided by functional MRI studies.
Human work has identified a number of brain regions whose
activity varies with the amount of evidence available for perceptual
decisions, including the middle intraparietal sulcus (the homologue
of macaque LIP [5]), midline motor areas, dorsolateral frontal
regions, and the anterior insula [6,7,8,9,10]. However, such
studies have not always been consistent in their identification of
the key areas for evidence accumulation, nor have the identified
brain networks in human research always aligned with those
identified in electrophysiological studies with macaques (e.g. with
respect to the participation of lateral frontal areas in evidence
accumulation).
Why do these studies diverge? Potentially problematic for
human studies are the correlated contributions of decision-related
processes including evidence accumulation and what has often
been referred to as ‘‘time on task’’ – i.e. the idea that a certain
amount of non-specific brain activity can be attributed merely to
the passage of time, or a ‘‘duty-cycle.’’ This issue arises because of
the correlation between stimulus strength, the decision process,
and reaction time: as the strength of the stimulus increases,
evidence accumulation occurs more quickly, and reaction time
decreases. For a dependent measure such as regional brain
activity, the question of whether activity is correlated with a
decision process such as evidence accumulation, or simply to the
duration of the trial, becomes confounded. A sensory region, for
example, might show activity that scales with motion coherence,
but that is actually related solely to the duration of bottom-up
attention captured by the stimulus on the screen. On the other
hand, a region directly involved in the decision process may also
show independent effects of time on task that, if not distinguished,
might obscure its participation in the decision.
Previous work has attempted to address the influence of time on
task by exploiting variability in subjects’ reaction times. A study by
Yarkoni and colleagues [11], for example, collected data from five
different cognitive tasks and searched for brain regions whose
activity correlated with subject reaction times across task.
Similarly, Grinband and colleagues [12], as well as Weissman
and Carp [13], investigated a more focused question: whether
PLOS ONE | www.plosone.org 1 August 2013 | Volume 8 | Issue 8 | e72074
activity in the medial frontal cortex correlated more strongly with
the presence of response conflict or reaction time/time on task.
Broadly speaking, the above studies were concerned with
distinguishing activity related to the duration of cognitive
processing from activity related to specific cognitive processes. In
contrast with our approach here, however, all of these studies
focused on reaction times, rather than stimulus duration, and were
thus unable to distinguish the relative contribution of stimulus-
bound non-decision processes.
In non-human primates, regions implicated in visual perceptual
decision making have also been evaluated. Yang and Lisberger
[14] showed, for example, that responses of neurons in the motion-
sensitive region MT to dot motion stimuli adapt, but remain
robust, over stimulus durations of eight seconds. In contrast, direct
studies of the effects of stimulus duration in other brain areas are
less common. In a delayed eye movement task, a subject of
neurons in the lateral intraparietal area (LIP) of the macaque
demonstrated activity that signaled both elapsed time during the
delay and the probability that a movement signal would arrive
[15]. In areas 8 and 46 of the lateral frontal cortex, approximately
20% of neurons encoded the duration of at least one of two
temporal stimuli in a two-sample duration discrimination task
[16]. While these studies indicate that duration-sensitive neural
responses can be found in temporal, parietal, and frontal cortices,
they did not directly address the issue of stimulus duration as an
independent factor in a separate perceptual decision.
This thorny issue of time on task has led to several alternative
approaches to identifying decision-related regions in perceptual
decision making tasks in humans. Different studies have identified
potential decision-related processes by searching for a parametric
effect across levels of stimulus discriminability [10], early-trial
differences in the BOLD response between high and low
coherence stimuli [7], sensitivity to both sensory and response
factors such as errors [8], and changes in time course during
extended recognition paradigms [9], among others. None of the
above approaches, however, has explicitly varied stimulus
duration/response timing and stimulus strength to assess the
independent influence of time on task that cannot be attributed to
task difficulty per se. This manipulation is especially important
because while a decision-related region should be sensitive to both
the amount of evidence and the duration over which evidence is
accrued [17], it should not be linked solely to the duration of
stimulus presentation. In other words, when stimulus duration
effects do occur in a decision-related region, in order to influence
the decision they should be expressed through an interaction with
stimulus strength. For example, a progressively greater duration of
stimulus presentation should differentially affect accuracy and
neural activity in response to intermediate motion coherence
values (e.g. 10%) but not extreme values (e.g. 0% and 100%),
leading to a behavioral and neural interaction. More specifically,
as predicted by the diffusion model [18] progressively longer
stimulus durations differentially affect the ability of evidence-
accumulating neurons to reach threshold in response to low rather
than high motion coherence values. In contrast, a region whose
activity does not depend on motion coherence, but does depend
on stimulus duration, could not provide the basis for decisions
based on sensory evidence.
To address these hypotheses, here we pursue a novel approach
combining a response signal paradigm [19,20] that explicitly
controls time on task factors with a methodological approach,
independent components analysis, that enables us to distinguish
networks and regions sensitive to duration, motion coherence, and
their interaction. In our paradigm, response time and motion
coherence are independently manipulated to identify brain regions
whose activity covaries with the available evidence. Thus, rather
than allowing the subject to freely decide when to make a response
on each trial according to his or her own decision criteria, the
experimenter controls the timing of the response in a fashion that
varies independently of task difficulty. On each trial, the subject
awaits a ‘‘response signal’’, variably timed across trials, indicating
when a response should be made irrespective of the state of
evidence accumulation. By ensuring that subjects cannot easily
predict when the response signal will occur [15] – thus
encouraging uniform attention across each trial – this design
investigates the hypothesis that regions involved in decision-related
processes such as evidence accumulation should be sensitive to
both motion coherence and decision duration, but that regions
involved in sensory processing should be most sensitive to stimulus
duration. Moreover, following ideas derived from human lesion
studies [21,22] that anterior regions are more likely to be engaged
in decision-related processes, while posterior regions are more
likely to be engaged in stimulus perception, we directly investigate
the prediction that sensitivity to both factors defines an anterior-
posterior gradient across the brain.
Materials and Methods
Ethics StatementThis study was approved by the Committee for the Protection of
Human Subjects (CPHS) at the University of California, Berkeley.
Five subjects (ages 22–38; 3 male) participated in the study and
gave written informed consent in accordance with the Declaration
of Helsinki and CPHS approval. All subjects had normal neural
anatomy as assessed by a neurologist (A.S.K.), were right-handed,
and had normal or corrected-to-normal vision.
Task DesignBefore each scanning session, subjects were trained on the task
for a minimum of six 1-hour practice runs to reduce both the
number of invalid trials (see below) and learning effects in the
scanner. Once trained, all subjects underwent a minimum of six 1-
hour fMRI sessions, each of which consisted of six runs of 72 trials
for a total of 666672 = 2592 trials. Three subjects participated in
an additional three 1-hour fMRI sessions, resulting in a total of
966672 = 3888 trials for these three subjects.
Subjects performed a visual dot-motion task in which they
viewed a variable proportion of coherent dot motion on a
background of randomly moving dots. They were required to
identify the direction of motion (either leftward or rightward) as
quickly and accurately as possible under a time constraint that
varied on a trial-by-trial basis. At the beginning of each trial, a
bright central fixation cross was dimmed to indicate the onset of
the dot-motion stimulus. Subjects viewed the stimulus until the
response signal occurred (in this case, stimulus offset), at which
point the fixation cross brightened and turned green. Subjects
were required to make a button-press response within 350
milliseconds after the onset of the response signal. In order to
prevent subjects from predicting the timing of the response signal,
we selected a response signal probability function that equated the
hazard rate h(t) across durations t:
h(t)~f (t)
1{F (t)
where f(t) is the probability that the response signal occurs at time
t, and F(t) is the cumulative distributionÐt
0
f (x)dx from trial onset
fMRI of a Time-Limited Decision
PLOS ONE | www.plosone.org 2 August 2013 | Volume 8 | Issue 8 | e72074
to time t [15]. This function ensures that the ratio of the
probability that the trial ends at time t, f(t), to the probability that
the trial ends later, 1– F(t), is approximately constant across time.
For this purpose, we chose a gamma distribution that produced a
median stimulus duration of 0.81 seconds, with a range from 0.22
seconds to 3.3 seconds. Similarly, a gamma distribution defined
the motion coherence stimulus, which ranged from 0% to 100%
with a median of 13.1%. Both dot-motion coherence and the
direction of motion (either leftward or rightward) were consistent
within a trial and varied independently across trials. At the end of
the 350ms response interval, the central fixation cross reverted
from green to white and an interstimulus interval varying between
4000–12000 ms began. Maintenance of fixation was ensured as in
our previous studies during sessions outside the scanner [8,23].
Three subjects were trained in one or both of these previous
studies; two subjects were trained to the same eye movement
criteria for the current task during sessions prior to MRI scanning.
Eye movement data were not obtained during scanner sessions
themselves.
For fMRI sessions, the ordering of dot-motion trials was
computed using OptSeq (http://surfer.nmr.mgh.harvard.edu/
optseq/) [24]. Stimuli were programmed in Matlab in the
PsychToolbox environment [25,26], adapted from code originally
written by McKinley & Shadlen and downloaded from the
PsychToolbox website (http://psychtoolbox.org/PTB-2/). All
characteristics of the dot motion display were unchanged from
our previous studies [8,23], with the exception that the duration of
the stimulus was variable as described above.
MRI ScanningMRI scanning was conducted on a Siemens MAGNETOM
Trio 3T MR Scanner at the Henry H. Wheeler, Jr. Brain Imaging
Center at the University of California, Berkeley. Anatomical
images consisted of 160 slices acquired using a T1-weighted MP-
RAGE protocol (TR = 2300 ms, TE = 2.98 ms, FOV = 256 mm,
matrix size = 2566256, voxel size 16161 mm). Functional images
consisted of 24 slices acquired with a gradient echoplanar imaging
protocol (TR = 1370 ms, TE = 27 ms, FOV = 225 mm, matrix
size = 96696, voxel size 2.362.363.5 mm). A projector (Avotec
SV-6011, http://www.avotec.org/) was used to display the image
on a translucent screen placed within the scanner bore behind the
head coil. A mirror was used to allow the subject to see the display.
The distance from the subject’s eye to the screen was 28 cm.
fMRI PreprocessingfMRI functional images were converted to 4D NIfTI format
and corrected for slice-timing offsets using SPM5 (http://www.fil.
ion.ucl.ac.uk). Motion correction was carried out using the AFNI
program 3dvolreg with a reference volume specified as the mean
image of the first run in the series. Images were then smoothed
with a 6mm FWHM Gaussian kernel. Co-registration was
performed with the AFNI program 3dAllineate using the local
Pearson correlation cost function optimized for fMRI to structural
MRI alignment. The inverse transformation was then used to
warp the high resolution MRI to the functional image space, after
which it served as an anatomical underlay for the display of
statistical parametric maps.
fMRI Data AnalysisVoxel-wise fMRI statistical analyses were carried out for each
subject using the general linear model framework implemented in
the AFNI program 3dDeconvolve. To assess the overall effect of
motion coherence and duration, each of these factors was divided
into 10 bins containing equal numbers of trials. In total,
10610 = 100 separate condition-specific regressors were derived
by convolving a gamma probability density function (peak = 6 s)
with a vector of stimulus onsets for each of the conditions. As
expected based on the total number of trials per subject, each bin
contained 25 or more trials. Mean values for the 10 coherence bins
were 1.3, 3.9, 6.3, 8.6, 11.4, 15.2, 22.9, 40.4, 64.2, and 88.0 (in
percent coherence); mean values for the 10 duration bins were
0.26, 0.34, 0.46, 0.57, 0.72, 0.88, 1.11, 1.41, 1.90, and 2.77 (in
seconds).
The peak height for the convolved hemodynamic function was
constrained to remain constant across all task durations tested.
This approach ensured that increases in stimulus duration were
captured by the beta value, rather than within the regressor itself.
In brief, the convolution of a constant HRF with increasing
stimulus duration leads to regressors with progressively increasing
amplitudes. As a result, the effect of stimulus duration on the beta
values would be captured within the regressor time course, not by
the beta value. Therefore, in regions sensitive only to duration,
beta values might remain constant as stimulus duration increases.
To avoid spurious null results (i.e. ones in which a constant beta
was misinterpreted as a stimulus duration effect), we constrained
peak height to ensure that betas sensitive to duration would
demonstrate a parametric effect of duration in regions sensitive to
stimulus duration.
Our analyses included both correct and error trials. Although
error trials can occur for multiple reasons – e.g. transient failures
of sensory input due to eye closure or inattention, or failures of
motor output due to incorrect mappings from stimulus to response
– they are nonetheless tied to the decision and not solely to the
duration of the stimulus. Therefore, they also potentially
differentiate an independent component related to the decision
process from one related to time on task, leading to a stronger test
of our hypotheses. Furthermore, any heterogeneity in error
responses would likely only add noise to our analyses, and
removing them would add imbalance to the number of trials in
each condition. It should also be noted that subjects did not
receive performance feedback, so that subjects were rarely if ever
aware of the commission of an error, especially during the difficult
trials (less than 5% motion coherence) wherein the bulk of errors
occurred. Therefore, error trials were incorporated into the
independent components analysis.
Tests of linear trends were carried out using the contrast vectors
applied to the estimated beta coefficients in each voxel for each
motion coherence 6 duration bin. The resulting t-statistics were
spatially normalized to MNI space. The estimated beta coefficients
for each bin were then subjected to a group ICA analysis (see next
section). To avoid a selection bias in the definition of ROIs, we
used the AFNI program 3dmaxima to generate functional ROIs
from a group analysis of the main effect of task (i.e. group activity
collapsed across coherence and duration manipulations), thre-
sholded at a T statistic of 5. Regions consisted of spheres of radius
9 mm whose boundaries were separated from each other by at
least 3mm. ROI labels were defined as in our previous work [8]. In
particular, the IPS was subdivided into anterior, medial and
posterior subdivisions following the criteria of Stark and Zohary
[27]. The anterior IPS was defined as the anterior-most third of
the sulcus, the medial IPS was defined as the dorsal-most half of
the posterior portion of the IPS, and the posterior IPS was defined
as the ventral-most half of the posterior portion of the IPS.
Time courses for ROIs were estimated via the AFNI program
3dDeconvolve using a set of 8 b-spline basis functions spanning the
interval from 0 to 18 seconds post-stimulus. Because of the large
number of calculations required for time courses, the motion
coherence and duration variables were both divided into four
fMRI of a Time-Limited Decision
PLOS ONE | www.plosone.org 3 August 2013 | Volume 8 | Issue 8 | e72074
quartiles rather than 10 deciles, yielding 16 bins for which time
courses were estimated. The time courses were then averaged
within each of the ROIs and submitted to a two-way repeated
measures ANOVA to test for effects of motion, duration, and the
motion 6 duration interaction.
Independent Components AnalysisTo search for patterns of activity consistent with evidence
accumulation, we applied independent components analysis (ICA)
to the whole brain as implemented in the Melodic program
distributed with FSL. In brief, ICA attempts to separate the
additive, statistically independent, non-Gaussian sources that
together comprise the data of interest – in this case, not the raw
time series, but the beta values generated by our GLM analysis.
Unlike a voxel-wise ANOVA, this multivariate approach permits
us to identify networks of brain regions whose activity correlates
with each of the independent components derived from the data.
Thus, the 100 beta volumes (comprising the 10610 factorial
combination of duration and motion coherence conditions)
produced for each of our 5 subjects were entered into a multi-
subject ICA analysis, from which independent components
representing strongly duration-dependent and strongly motion-
coherent dependent responses were identified. Specifically, the
components that demonstrated the most significant parametric
modulation by (1) duration and (2) motion coherence were selected
for further analysis. (Of note, as indicated in Results, component 2
showed both the strongest effect of motion coherence and the
strongest interaction between motion coherence and duration.)
For each of these selected components, the statistical significance
of the whole-brain spatial map was determined using mixture
modeling and an alternative hypothesis testing approach as
implemented in Melodic [28]. As noted previously, to evaluate
how different brain regions reflected each of these independent
components, we applied the AFNI program 3dMaxima to the main
effect of task, resulting in the generation of 41 regions of interest.
For each of these ROIs, the 10 voxels demonstrating the largest
values for each component were averaged together to produce a
summary value. This approach was used in order to avoid
including voxels that were not spanned by the spatial maps
corresponding to each component, and thereby to provide
maximal sensitivity for the relative contributions of each compo-
nent (see Table 1).
Identification of Functionally Related ClustersTo identify regions performing potentially related functions, two
analyses were performed. First, the 2-dimensional space defined by
the duration and coherence-sensitive motion ICA components was
projected onto vectors spanning 360 degrees within this space. To
evaluate whether the ordering defined by this projection corre-
sponded to a neuroanatomical (specifically, anterior-posterior)
organization of these same areas, we subjected the projection to a
non-parametric correlation (Kendall’s tau) with the ordering
defined by the Y-coordinate for the centroid of each ROI within
MNI space. The strongest correlation was assessed for both
direction and statistical significance.
To quantify the relatedness of different regions within the 2-
dimensional space defined by the independent components, we
applied K-means clustering. In this method, the observations are
divided into k clusters in which each observation is assigned to the
cluster centroid to which it is closest. This approach was applied to
the data 5,000 times with random starting centroids. ROIs that
were unreliably clustered (frequency of primary cluster assignment
greater than 2 standard deviations below the mean across all
ROIs) were excluded from the final map. The number of clusters
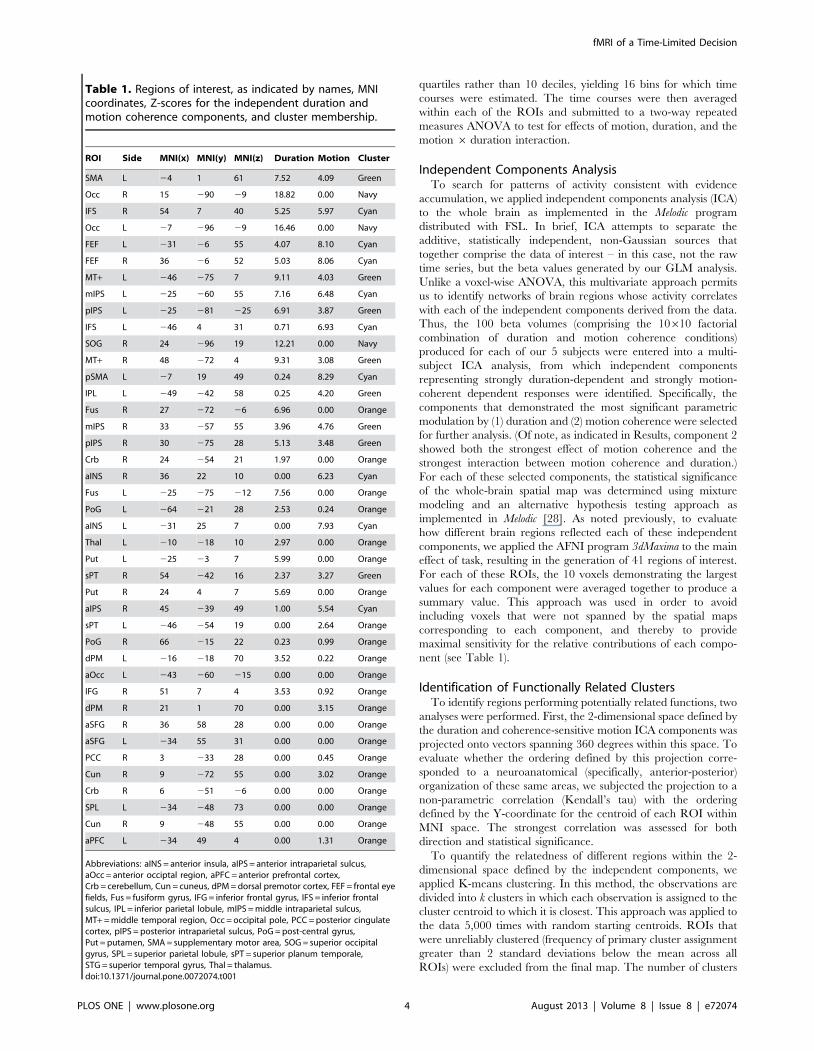
Table 1. Regions of interest, as indicated by names, MNIcoordinates, Z-scores for the independent duration andmotion coherence components, and cluster membership.
ROI Side MNI(x) MNI(y) MNI(z) Duration Motion Cluster
SMA L 24 1 61 7.52 4.09 Green
Occ R 15 290 29 18.82 0.00 Navy
IFS R 54 7 40 5.25 5.97 Cyan
Occ L 27 296 29 16.46 0.00 Navy
FEF L 231 26 55 4.07 8.10 Cyan
FEF R 36 26 52 5.03 8.06 Cyan
MT+ L 246 275 7 9.11 4.03 Green
mIPS L 225 260 55 7.16 6.48 Cyan
pIPS L 225 281 225 6.91 3.87 Green
IFS L 246 4 31 0.71 6.93 Cyan
SOG R 24 296 19 12.21 0.00 Navy
MT+ R 48 272 4 9.31 3.08 Green
pSMA L 27 19 49 0.24 8.29 Cyan
IPL L 249 242 58 0.25 4.20 Green
Fus R 27 272 26 6.96 0.00 Orange
mIPS R 33 257 55 3.96 4.76 Green
pIPS R 30 275 28 5.13 3.48 Green
Crb R 24 254 21 1.97 0.00 Orange
aINS R 36 22 10 0.00 6.23 Cyan
Fus L 225 275 212 7.56 0.00 Orange
PoG L 264 221 28 2.53 0.24 Orange
aINS L 231 25 7 0.00 7.93 Cyan
Thal L 210 218 10 2.97 0.00 Orange
Put L 225 23 7 5.99 0.00 Orange
sPT R 54 242 16 2.37 3.27 Green
Put R 24 4 7 5.69 0.00 Orange
aIPS R 45 239 49 1.00 5.54 Cyan
sPT L 246 254 19 0.00 2.64 Orange
PoG R 66 215 22 0.23 0.99 Orange
dPM L 216 218 70 3.52 0.22 Orange
aOcc L 243 260 215 0.00 0.00 Orange
IFG R 51 7 4 3.53 0.92 Orange
dPM R 21 1 70 0.00 3.15 Orange
aSFG R 36 58 28 0.00 0.00 Orange
aSFG L 234 55 31 0.00 0.00 Orange
PCC R 3 233 28 0.00 0.45 Orange
Cun R 9 272 55 0.00 3.02 Orange
Crb R 6 251 26 0.00 0.00 Orange
SPL L 234 248 73 0.00 0.00 Orange
Cun R 9 248 55 0.00 0.00 Orange
aPFC L 234 49 4 0.00 1.31 Orange
Abbreviations: aINS = anterior insula, aIPS = anterior intraparietal sulcus,aOcc = anterior occiptal region, aPFC = anterior prefrontal cortex,Crb = cerebellum, Cun = cuneus, dPM = dorsal premotor cortex, FEF = frontal eyefields, Fus = fusiform gyrus, IFG = inferior frontal gyrus, IFS = inferior frontalsulcus, IPL = inferior parietal lobule, mIPS = middle intraparietal sulcus,MT+ = middle temporal region, Occ = occipital pole, PCC = posterior cingulatecortex, pIPS = posterior intraparietal sulcus, PoG = post-central gyrus,Put = putamen, SMA = supplementary motor area, SOG = superior occipitalgyrus, SPL = superior parietal lobule, sPT = superior planum temporale,STG = superior temporal gyrus, Thal = thalamus.doi:10.1371/journal.pone.0072074.t001
fMRI of a Time-Limited Decision
PLOS ONE | www.plosone.org 4 August 2013 | Volume 8 | Issue 8 | e72074
was identified by the Bayesian Information Criterion (BIC) [29],
which balances the error of the fit with the complexity (i.e. number
of parameters) of the model. We identified the appropriate cluster
number as that number for which the change in the BIC with
addition of another cluster was less than 5%.
Results
To better understand the neural mechanisms differentiating
time on task from decision-related effects, we acquired fMRI data
from five subjects performing a response signal task requiring
discrimination of dot-motion direction. As described in Methods
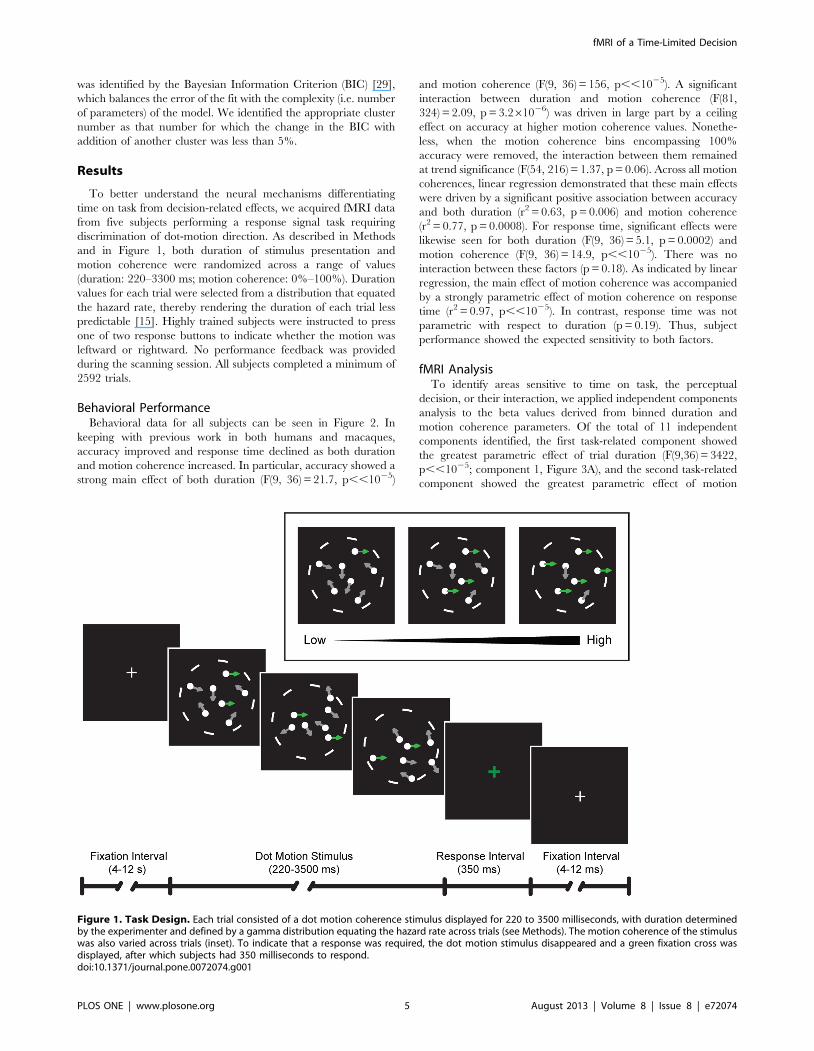
and in Figure 1, both duration of stimulus presentation and
motion coherence were randomized across a range of values
(duration: 220–3300 ms; motion coherence: 0%–100%). Duration
values for each trial were selected from a distribution that equated
the hazard rate, thereby rendering the duration of each trial less
predictable [15]. Highly trained subjects were instructed to press
one of two response buttons to indicate whether the motion was
leftward or rightward. No performance feedback was provided
during the scanning session. All subjects completed a minimum of
2592 trials.
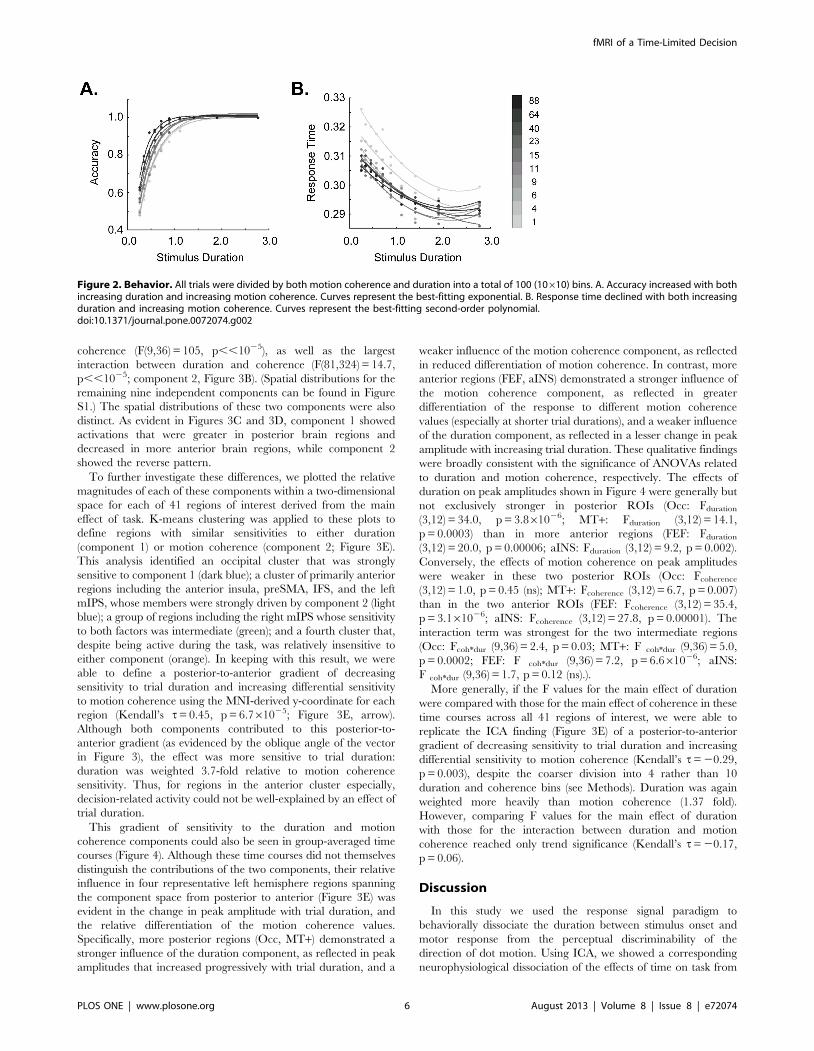
Behavioral PerformanceBehavioral data for all subjects can be seen in Figure 2. In
keeping with previous work in both humans and macaques,
accuracy improved and response time declined as both duration
and motion coherence increased. In particular, accuracy showed a
strong main effect of both duration (F(9, 36) = 21.7, p,,1025)
and motion coherence (F(9, 36) = 156, p,,1025). A significant
interaction between duration and motion coherence (F(81,
324) = 2.09, p = 3.261026) was driven in large part by a ceiling
effect on accuracy at higher motion coherence values. Nonethe-
less, when the motion coherence bins encompassing 100%
accuracy were removed, the interaction between them remained
at trend significance (F(54, 216) = 1.37, p = 0.06). Across all motion
coherences, linear regression demonstrated that these main effects
were driven by a significant positive association between accuracy
and both duration (r2 = 0.63, p = 0.006) and motion coherence
(r2 = 0.77, p = 0.0008). For response time, significant effects were
likewise seen for both duration (F(9, 36) = 5.1, p = 0.0002) and
motion coherence (F(9, 36) = 14.9, p,,1025). There was no
interaction between these factors (p = 0.18). As indicated by linear
regression, the main effect of motion coherence was accompanied
by a strongly parametric effect of motion coherence on response
time (r2 = 0.97, p,,1025). In contrast, response time was not
parametric with respect to duration (p = 0.19). Thus, subject
performance showed the expected sensitivity to both factors.
fMRI AnalysisTo identify areas sensitive to time on task, the perceptual
decision, or their interaction, we applied independent components
analysis to the beta values derived from binned duration and
motion coherence parameters. Of the total of 11 independent
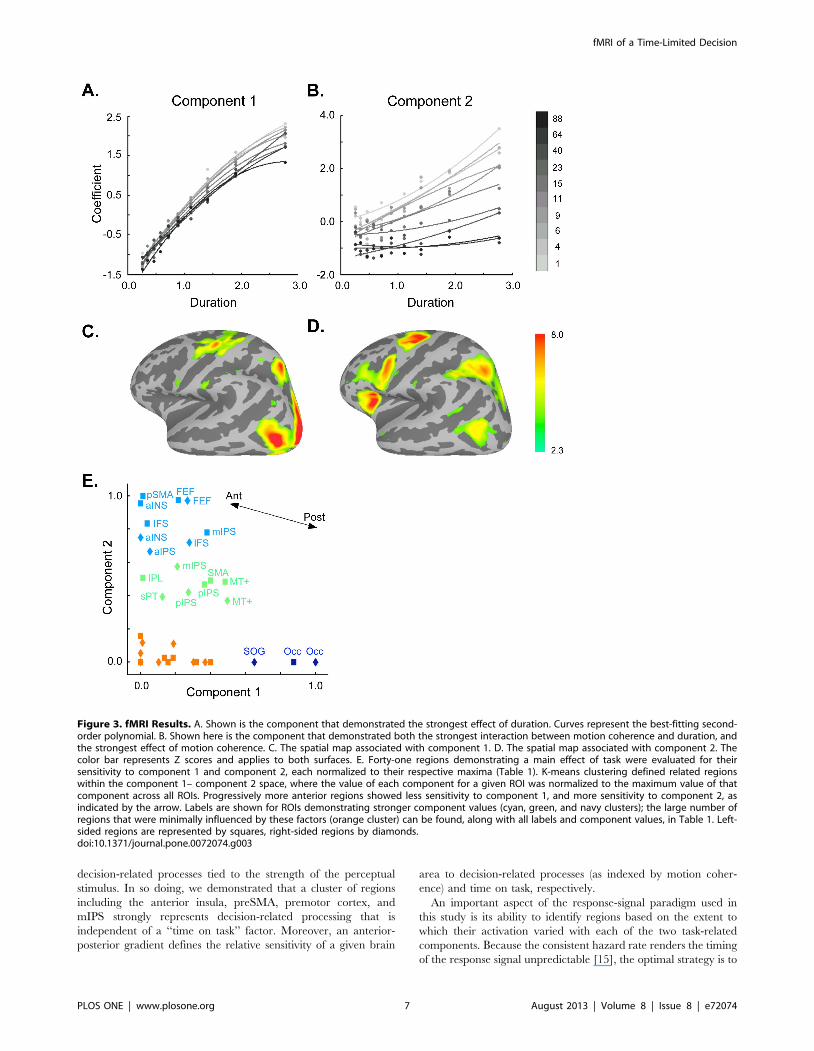
components identified, the first task-related component showed
the greatest parametric effect of trial duration (F(9,36) = 3422,
p,,1025; component 1, Figure 3A), and the second task-related
component showed the greatest parametric effect of motion
Figure 1. Task Design. Each trial consisted of a dot motion coherence stimulus displayed for 220 to 3500 milliseconds, with duration determinedby the experimenter and defined by a gamma distribution equating the hazard rate across trials (see Methods). The motion coherence of the stimuluswas also varied across trials (inset). To indicate that a response was required, the dot motion stimulus disappeared and a green fixation cross wasdisplayed, after which subjects had 350 milliseconds to respond.doi:10.1371/journal.pone.0072074.g001
fMRI of a Time-Limited Decision
PLOS ONE | www.plosone.org 5 August 2013 | Volume 8 | Issue 8 | e72074
coherence (F(9,36) = 105, p,,1025), as well as the largest
interaction between duration and coherence (F(81,324) = 14.7,
p,,1025; component 2, Figure 3B). (Spatial distributions for the
remaining nine independent components can be found in Figure
S1.) The spatial distributions of these two components were also
distinct. As evident in Figures 3C and 3D, component 1 showed
activations that were greater in posterior brain regions and
decreased in more anterior brain regions, while component 2
showed the reverse pattern.
To further investigate these differences, we plotted the relative
magnitudes of each of these components within a two-dimensional
space for each of 41 regions of interest derived from the main
effect of task. K-means clustering was applied to these plots to
define regions with similar sensitivities to either duration
(component 1) or motion coherence (component 2; Figure 3E).
This analysis identified an occipital cluster that was strongly
sensitive to component 1 (dark blue); a cluster of primarily anterior
regions including the anterior insula, preSMA, IFS, and the left
mIPS, whose members were strongly driven by component 2 (light
blue); a group of regions including the right mIPS whose sensitivity
to both factors was intermediate (green); and a fourth cluster that,
despite being active during the task, was relatively insensitive to
either component (orange). In keeping with this result, we were
able to define a posterior-to-anterior gradient of decreasing
sensitivity to trial duration and increasing differential sensitivity
to motion coherence using the MNI-derived y-coordinate for each
region (Kendall’s t= 0.45, p = 6.761025; Figure 3E, arrow).
Although both components contributed to this posterior-to-
anterior gradient (as evidenced by the oblique angle of the vector
in Figure 3), the effect was more sensitive to trial duration:
duration was weighted 3.7-fold relative to motion coherence
sensitivity. Thus, for regions in the anterior cluster especially,
decision-related activity could not be well-explained by an effect of
trial duration.
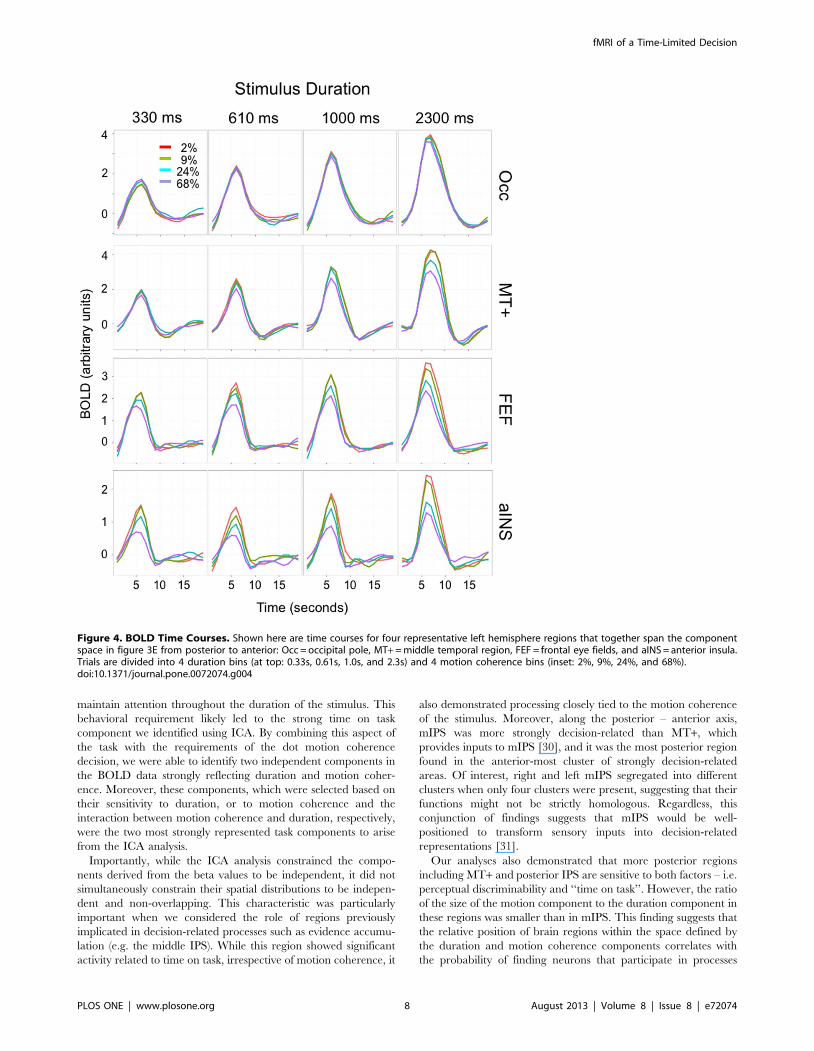
This gradient of sensitivity to the duration and motion
coherence components could also be seen in group-averaged time
courses (Figure 4). Although these time courses did not themselves
distinguish the contributions of the two components, their relative
influence in four representative left hemisphere regions spanning
the component space from posterior to anterior (Figure 3E) was
evident in the change in peak amplitude with trial duration, and
the relative differentiation of the motion coherence values.
Specifically, more posterior regions (Occ, MT+) demonstrated a
stronger influence of the duration component, as reflected in peak
amplitudes that increased progressively with trial duration, and a
weaker influence of the motion coherence component, as reflected
in reduced differentiation of motion coherence. In contrast, more
anterior regions (FEF, aINS) demonstrated a stronger influence of
the motion coherence component, as reflected in greater
differentiation of the response to different motion coherence
values (especially at shorter trial durations), and a weaker influence
of the duration component, as reflected in a lesser change in peak
amplitude with increasing trial duration. These qualitative findings
were broadly consistent with the significance of ANOVAs related
to duration and motion coherence, respectively. The effects of
duration on peak amplitudes shown in Figure 4 were generally but
not exclusively stronger in posterior ROIs (Occ: Fduration
(3,12) = 34.0, p = 3.861026; MT+: Fduration (3,12) = 14.1,
p = 0.0003) than in more anterior regions (FEF: Fduration
(3,12) = 20.0, p = 0.00006; aINS: Fduration (3,12) = 9.2, p = 0.002).
Conversely, the effects of motion coherence on peak amplitudes
were weaker in these two posterior ROIs (Occ: Fcoherence
(3,12) = 1.0, p = 0.45 (ns); MT+: Fcoherence (3,12) = 6.7, p = 0.007)
than in the two anterior ROIs (FEF: Fcoherence (3,12) = 35.4,
p = 3.161026; aINS: Fcoherence (3,12) = 27.8, p = 0.00001). The
interaction term was strongest for the two intermediate regions
(Occ: Fcoh*dur (9,36) = 2.4, p = 0.03; MT+: F coh*dur (9,36) = 5.0,
p = 0.0002; FEF: F coh*dur (9,36) = 7.2, p = 6.661026; aINS:
F coh*dur (9,36) = 1.7, p = 0.12 (ns).).
More generally, if the F values for the main effect of duration
were compared with those for the main effect of coherence in these
time courses across all 41 regions of interest, we were able to
replicate the ICA finding (Figure 3E) of a posterior-to-anterior
gradient of decreasing sensitivity to trial duration and increasing
differential sensitivity to motion coherence (Kendall’s t= 20.29,
p = 0.003), despite the coarser division into 4 rather than 10
duration and coherence bins (see Methods). Duration was again
weighted more heavily than motion coherence (1.37 fold).
However, comparing F values for the main effect of duration
with those for the interaction between duration and motion
coherence reached only trend significance (Kendall’s t= 20.17,
p = 0.06).
Discussion
In this study we used the response signal paradigm to
behaviorally dissociate the duration between stimulus onset and
motor response from the perceptual discriminability of the
direction of dot motion. Using ICA, we showed a corresponding
neurophysiological dissociation of the effects of time on task from
Figure 2. Behavior. All trials were divided by both motion coherence and duration into a total of 100 (10610) bins. A. Accuracy increased with bothincreasing duration and increasing motion coherence. Curves represent the best-fitting exponential. B. Response time declined with both increasingduration and increasing motion coherence. Curves represent the best-fitting second-order polynomial.doi:10.1371/journal.pone.0072074.g002
fMRI of a Time-Limited Decision
PLOS ONE | www.plosone.org 6 August 2013 | Volume 8 | Issue 8 | e72074
decision-related processes tied to the strength of the perceptual
stimulus. In so doing, we demonstrated that a cluster of regions
including the anterior insula, preSMA, premotor cortex, and
mIPS strongly represents decision-related processing that is
independent of a ‘‘time on task’’ factor. Moreover, an anterior-
posterior gradient defines the relative sensitivity of a given brain
area to decision-related processes (as indexed by motion coher-
ence) and time on task, respectively.
An important aspect of the response-signal paradigm used in
this study is its ability to identify regions based on the extent to
which their activation varied with each of the two task-related
components. Because the consistent hazard rate renders the timing
of the response signal unpredictable [15], the optimal strategy is to
Figure 3. fMRI Results. A. Shown is the component that demonstrated the strongest effect of duration. Curves represent the best-fitting second-order polynomial. B. Shown here is the component that demonstrated both the strongest interaction between motion coherence and duration, andthe strongest effect of motion coherence. C. The spatial map associated with component 1. D. The spatial map associated with component 2. Thecolor bar represents Z scores and applies to both surfaces. E. Forty-one regions demonstrating a main effect of task were evaluated for theirsensitivity to component 1 and component 2, each normalized to their respective maxima (Table 1). K-means clustering defined related regionswithin the component 1– component 2 space, where the value of each component for a given ROI was normalized to the maximum value of thatcomponent across all ROIs. Progressively more anterior regions showed less sensitivity to component 1, and more sensitivity to component 2, asindicated by the arrow. Labels are shown for ROIs demonstrating stronger component values (cyan, green, and navy clusters); the large number ofregions that were minimally influenced by these factors (orange cluster) can be found, along with all labels and component values, in Table 1. Left-sided regions are represented by squares, right-sided regions by diamonds.doi:10.1371/journal.pone.0072074.g003
fMRI of a Time-Limited Decision
PLOS ONE | www.plosone.org 7 August 2013 | Volume 8 | Issue 8 | e72074
maintain attention throughout the duration of the stimulus. This
behavioral requirement likely led to the strong time on task
component we identified using ICA. By combining this aspect of
the task with the requirements of the dot motion coherence
decision, we were able to identify two independent components in
the BOLD data strongly reflecting duration and motion coher-
ence. Moreover, these components, which were selected based on
their sensitivity to duration, or to motion coherence and the
interaction between motion coherence and duration, respectively,
were the two most strongly represented task components to arise
from the ICA analysis.
Importantly, while the ICA analysis constrained the compo-
nents derived from the beta values to be independent, it did not
simultaneously constrain their spatial distributions to be indepen-
dent and non-overlapping. This characteristic was particularly
important when we considered the role of regions previously
implicated in decision-related processes such as evidence accumu-
lation (e.g. the middle IPS). While this region showed significant
activity related to time on task, irrespective of motion coherence, it
also demonstrated processing closely tied to the motion coherence
of the stimulus. Moreover, along the posterior – anterior axis,
mIPS was more strongly decision-related than MT+, which
provides inputs to mIPS [30], and it was the most posterior region
found in the anterior-most cluster of strongly decision-related
areas. Of interest, right and left mIPS segregated into different
clusters when only four clusters were present, suggesting that their
functions might not be strictly homologous. Regardless, this
conjunction of findings suggests that mIPS would be well-
positioned to transform sensory inputs into decision-related
representations [31].
Our analyses also demonstrated that more posterior regions
including MT+ and posterior IPS are sensitive to both factors – i.e.
perceptual discriminability and ‘‘time on task’’. However, the ratio
of the size of the motion component to the duration component in
these regions was smaller than in mIPS. This finding suggests that
the relative position of brain regions within the space defined by
the duration and motion coherence components correlates with
the probability of finding neurons that participate in processes
Figure 4. BOLD Time Courses. Shown here are time courses for four representative left hemisphere regions that together span the componentspace in figure 3E from posterior to anterior: Occ = occipital pole, MT+ = middle temporal region, FEF = frontal eye fields, and aINS = anterior insula.Trials are divided into 4 duration bins (at top: 0.33s, 0.61s, 1.0s, and 2.3s) and 4 motion coherence bins (inset: 2%, 9%, 24%, and 68%).doi:10.1371/journal.pone.0072074.g004
fMRI of a Time-Limited Decision
PLOS ONE | www.plosone.org 8 August 2013 | Volume 8 | Issue 8 | e72074
such as evidence accumulation – specifically, that this probability
is greater when greater motion coherence-related activity is
distinguished from sensitivity to time on task. Future studies in
macaque might profitably explore a range of such regions, as
multiple regions are likely to encode the evidence for a perceptual
decision [4]. Of particular interest would be to determine the
relative percentages of cells that show selectivity for evidence
accumulation in each of these areas, as these analyses suggest that
the percentage of task-responsive neurons that do so might
decrease as both the most posterior areas (which are most sensitive
to time on task) and the most proximate motor areas (which are
furthest removed from sensory representations) are interrogated.
These data also provide evidence that the activity of more
anterior regions during the motion coherence decision cannot be
easily explained by time on task arguments linked to stimulus
duration. It has been argued, for example, that when subjects
perform a Stroop task, BOLD activity in the dorsal anterior
cingulate reflects time on task, as indexed by reaction times, rather
than response conflict or some other process [12]. Here we
provide evidence that this important consideration does not
generalize to time on task as indexed by stimulus duration. In the
anterior insula, for example, the component reflecting time on task
is weakly expressed. One would thus have to argue that the time
on task representation is limited to specific regions and specific
tasks – itself an argument against a general time on task
explanation – or, perhaps more parsimoniously, that activity in
more anterior brain regions is more likely to be decision-related, in
that it is bound to reaction time and not simply to stimulus
duration.
These possibilities also confirm the more general importance of
distinguishing time on task (or duty cycle) arguments from the
duration of decision-making processes in other task paradigms. As
we have argued previously [8], time can be a fundamental
measure of the evolution of the decision, meaning that accumu-
lator regions might be expected to show some effect of response
duration. Areas such as the mIPS might show an effect interpreted
as time on task, for example, as multiple noisy accumulators reach
threshold at different times, leading to a generally progressive
increase in BOLD. However, the strong presence of the other ICA
component in the mIPS indicates that duration effects are also
reflected in an interaction with motion coherence, as expected of a
decision-related region. These ideas have at least two consequenc-
es for other task paradigms. If time on task and decision
components remain undissociated, the presence of stimulus
duration effects cannot be used to argue that a region fails to
participate in decision-related processing. On the other hand,
using reaction time as a covariate of no interest in GLM analyses
may diminish the contributions of brain areas for which reaction
time indexes important decision-related processes. These data do
suggest that these effects will be less notable in more rostral areas,
which show almost no effect of time on task in the current study.
Consistent with the above ideas, the findings in this study accord
well with other studies that have included duration considerations.
Activity in the anterior insula in this study, for example, correlates
well with activity that defines ‘‘decision commitment regions’’ in
Ploran et al. [32] – but see also [7] – while other areas that show
stronger effects of duration (PM, IFS, mIPS) correspond more
strongly to their accumulator regions.
In the larger sense, these data also provide quantitative evidence
for the commonly held idea that perceptual decisions identify a
large-scale anterior-posterior gradient within the brain. Specifi-
cally, regions defined simply by their activity in the main effect of
task segregate by anatomical location in the ICA analysis: effects of
time on task are greater for more posterior/sensory regions, while
effects of motion coherence are greater for more anterior regions.
The strength of this gradient may depend in part on arbitrary
factors – e.g. that the primary sensory regions in a visual task are
quite posterior. It is possible, for example, that a task relying on
somatosensory inputs, and therefore on a more anterior primary
sensory area than the occipital cortex [33], may show a diminished
gradient, while one that more strongly engages executive functions
[34] may show an enhanced effect. As models of perceptual
decision making implicitly demonstrate such a gradient [35],
however, this analysis shows that such a gradient has a quantifiable
basis, and confirms, along with supportive data from lesion studies
in other paradigms [21,22], for example, that it has validity in
organizing the neurophysiological and cognitive bases for decision
making in humans.
Supporting Information
Figure S1 Shown are seven slices in radiologicalconvention (left = right) for each of the 11 independentcomponents generated by the ICA analysis. At top are the
two components demonstrating the strongest correlation with task
parameters as evaluated in the body of the paper: the component
linked to task duration (D), and the component linked to both
motion coherence and its interaction with duration (M). Below are
shown the remaining 9 ICA components. In keeping with other
applications of ICA, some of these components represent
additional networks (e.g. component 2, which overlaps with areas
in the default mode network that typically deactivate during task
performance), while others appear to represent noise (e.g.
component 4, which approximates the location of the ventricular
system).
(TIF)
Acknowledgments
The authors thank Mark D’Esposito for scanner access and the subjects for
their participation.
Author Contributions
Conceived and designed the experiments: BRB ASK. Performed the
experiments: BRB DTE ASK. Analyzed the data: BRB ASK. Contributed
reagents/materials/analysis tools: BRB DTE ASK. Wrote the paper: ASK.
Edited the manuscript: BRB ASK.
References
1. Roitman JD, Shadlen MN (2002) Response of neurons in the lateral intraparietal
area during a combined visual discrimination reaction time task. J Neurosci 22:
9475–9489.
2. Schall JD (2003) Neural correlates of decision processes: neural and mental
chronometry. Curr Opin Neurobiol 13: 182–186.
3. Ding L, Gold JI (2010) Caudate encodes multiple computations for perceptual
decisions. J Neurosci 30: 15747–15759.
4. Hernandez A, Nacher V, Luna R, Zainos A, Lemus L, et al. (2010) Decoding a
perceptual decision process across cortex. Neuron 66: 300–314.
5. Grefkes C, Fink GR (2005) The functional organization of the intraparietal
sulcus in humans and monkeys. J Anat 207: 3–17.
6. Heekeren HR, Marrett S, Ruff DA, Bandettini PA, Ungerleider LG (2006)
Involvement of human left dorsolateral prefrontal cortex in perceptual decision
making is independent of response modality. Proc Natl Acad Sci U S A 103:
10023–10028.
7. Ho TC, Brown S, Serences JT (2009) Domain general mechanisms of perceptual
decision making in human cortex. J Neurosci 29: 8675–8687.
fMRI of a Time-Limited Decision
PLOS ONE | www.plosone.org 9 August 2013 | Volume 8 | Issue 8 | e72074
8. Kayser AS, Buchsbaum BR, Erickson DT, D’Esposito M (2010) The functional
anatomy of a perceptual decision in the human brain. J Neurophysiol 103:1179–1194.
9. Ploran EJ, Tremel JJ, Nelson SM, Wheeler ME (2011) High Quality but Limited
Quantity Perceptual Evidence Produces Neural Accumulation in Frontal andParietal Cortex. Cereb Cortex.
10. Tosoni A, Galati G, Romani GL, Corbetta M (2008) Sensory-motormechanisms in human parietal cortex underlie arbitrary visual decisions. Nat
Neurosci 11: 1446–1453.
11. Yarkoni T, Barch DM, Gray JR, Conturo TE, Braver TS (2009) BOLDcorrelates of trial-by-trial reaction time variability in gray and white matter: a
multi-study fMRI analysis. PLoS One 4: e4257.12. Grinband J, Savitskaya J, Wager TD, Teichert T, Ferrera VP, et al. (2011) The
dorsal medial frontal cortex is sensitive to time on task, not response conflict orerror likelihood. Neuroimage 57: 303–311.
13. Weissman DH, Carp J (2013) The congruency effect in the posterior medial
frontal cortex is more consistent with time on task than with response conflict.PLoS One 8: e62405.
14. Yang J, Lisberger SG (2009) Relationship between adapted neural populationresponses in MT and motion adaptation in speed and direction of smooth-
pursuit eye movements. J Neurophysiol 101: 2693–2707.
15. Janssen P, Shadlen MN (2005) A representation of the hazard rate of elapsedtime in macaque area LIP. Nat Neurosci 8: 234–241.
16. Genovesio A, Tsujimoto S, Wise SP (2009) Feature- and order-based timingrepresentations in the frontal cortex. Neuron 63: 254–266.
17. Kiani R, Hanks TD, Shadlen MN (2008) Bounded integration in parietal cortexunderlies decisions even when viewing duration is dictated by the environment.
J Neurosci 28: 3017–3029.
18. Ratcliff R, McKoon G (2008) The diffusion decision model: theory and data fortwo-choice decision tasks. Neural Comput 20: 873–922.
19. Ratcliff R (2006) Modeling response signal and response time data. CognitPsychol 53: 195–237.
20. Reed AV (1973) Speed-accuracy trade-off in recognition memory. Science 181:
574–576.
21. Fellows LK (2004) The cognitive neuroscience of human decision making: a
review and conceptual framework. Behav Cogn Neurosci Rev 3: 159–172.22. Tong F (2003) Primary visual cortex and visual awareness. Nat Rev Neurosci 4:
219–229.
23. Kayser AS, Erickson DT, Buchsbaum BR, D’Esposito M (2010) Neuralrepresentations of relevant and irrelevant features in perceptual decision making.
J Neurosci 30: 15778–15789.24. Dale AM (1999) Optimal experimental design for event-related fMRI. Hum
Brain Mapp 8: 109–114.
25. Brainard DH (1997) The Psychophysics Toolbox. Spat Vis 10: 433–436.26. Pelli DG (1997) The VideoToolbox software for visual psychophysics:
transforming numbers into movies. Spat Vis 10: 437–442.27. Stark A, Zohary E (2008) Parietal mapping of visuomotor transformations
during human tool grasping. Cereb Cortex 18: 2358–2368.28. Beckmann CF, Smith SM (2005) Tensorial extensions of independent
component analysis for multisubject FMRI analysis. Neuroimage 25: 294–311.
29. Pelleg D, Moore A. (2000) X-means: Extending k-means with efficientestimation of the number of clusters; 2000; San Francisco, CA. Morgan
Kaufmann. 727–734.30. Andersen RA, Asanuma C, Essick G, Siegel RM (1990) Corticocortical
connections of anatomically and physiologically defined subdivisions within
the inferior parietal lobule. J Comp Neurol 296: 65–113.31. Erickson DT, Kayser AS (2013) The Neural Representation of Sensorimotor
Transformations in a Human Perceptual Decision Making Network. Neuro-image.
32. Ploran EJ, Tremel JJ, Nelson SM, Wheeler ME (2011) High quality but limitedquantity perceptual evidence produces neural accumulation in frontal and
parietal cortex. Cereb Cortex 21: 2650–2662.
33. Yang JN, Szeverenyi NM, Ts’o D (2008) Neural resources associated withperceptual judgment across sensory modalities. Cereb Cortex 18: 38–45.
34. Unterrainer JM, Owen AM (2006) Planning and problem solving: fromneuropsychology to functional neuroimaging. J Physiol Paris 99: 308–317.
35. Heekeren HR, Marrett S, Ungerleider LG (2008) The neural systems that
mediate human perceptual decision making. Nat Rev Neurosci 9: 467–479.
fMRI of a Time-Limited Decision
PLOS ONE | www.plosone.org 10 August 2013 | Volume 8 | Issue 8 | e72074
Related Documents