www.edureka.co/r-for-analyti Decoding the Science of Decision Trees! Learn from Experts

Decoding the science of Decision trees
Aug 13, 2015
Welcome message from author
This document is posted to help you gain knowledge. Please leave a comment to let me know what you think about it! Share it to your friends and learn new things together.
Transcript

www.edureka.co/r-for-analytics
Decoding the Science of Decision Trees! Learn from Experts
Slide 2Slide 2Slide 2 www.edureka.co/r-for-analytics
Today we will take you through the following:
The Classic Banking Challenge !!.. Have you already guessed it??
The Available Options for Solution
Why Decision Tree?
How Decision Tree Methodology Works ?
Agenda

Slide 3Slide 3Slide 3 www.edureka.co/r-for-analytics
The Classic Situation…

Slide 4Slide 4Slide 4 www.edureka.co/r-for-analytics
A bank wants to classify its future customers into two categories “Risky” and “Good” based on customer’s available attributes.
Let’s say a customer xyz has the following attributes. How will the bank know to which category this customer belong.
Undergrad Marital Status Taxable Income City
Population Work Experience
(Yrs)Urban Category
No Married 98,727 1,01,894 14 NO ????
The Problem?

Slide 5Slide 5Slide 5 www.edureka.co/r-for-analytics
# A manager has to decide whether he should hire more
human resources or not in order to optimize the work
load balance
# An individual has to make a decision such as whether
or not to undertake a capital project, or must chose
between two competing ventures
Let See Few More Cases..

Slide 6Slide 6Slide 6 www.edureka.co/r-for-analytics
The Available Solution Options…

Slide 7Slide 7Slide 7 www.edureka.co/r-for-analytics
Algorithms that can help..
Such type of problems comes under
“classification”
It is the separation or ordering of objects into
classes
There are few techniques in classification method,
like:
Decision Tree
Naïve Bayes
k-Nearest Neighbor
Support Vector Machine etc..

Slide 8Slide 8Slide 8 www.edureka.co/r-for-analytics
Why Decision Tree is Favorable..?
DT NB KNN SVM
Simple visual representation of a decision situation YES NO NO NO
Easy to interpret and explain to executives (Non-programmers)! YES NO NO NO
Illustrates a variety of decisions and also the impact of each decision if different decisions were to be taken
YES NO NO NO
Allow us to predict, explain, describe, or classify an outcome altogether YES NO NO NO
Help determine worst, best and expected values for different scenarios YES NO NO NO
Able to handle both numerical and categorical data YES NO NO NO
Advantages of Decision Tree Methodology
Decision Tree (DT)Naïve Bayes (NB)k-Nearest Neighbor (KNN)Support Vector Machine (SVM)
Slide 9Slide 9Slide 9 www.edureka.co/r-for-analytics
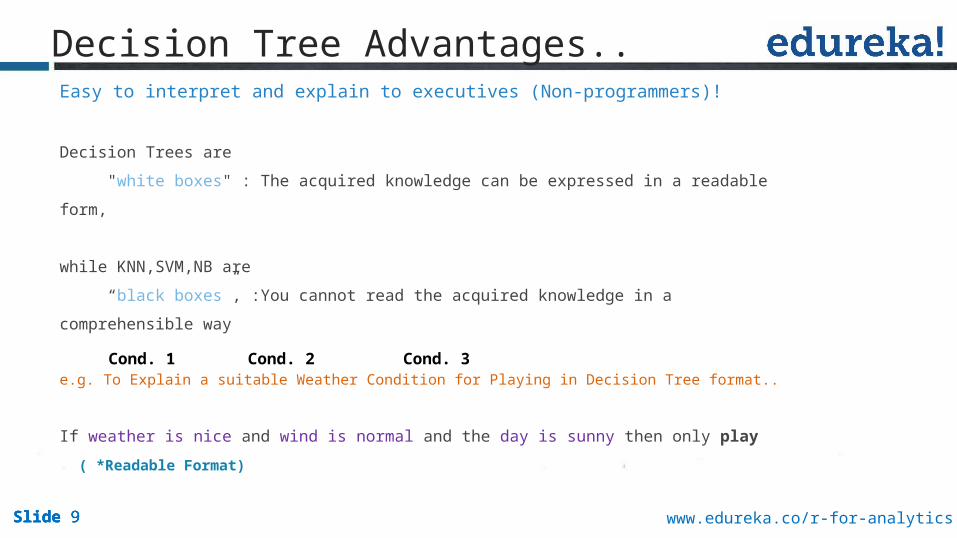
Decision Trees are
"white boxes" : The acquired knowledge can be expressed in a readable form,
while KNN,SVM,NB are
“black boxes”, :You cannot read the acquired knowledge in a comprehensible
way
e.g. To Explain a suitable Weather Condition for Playing in Decision Tree format..
If weather is nice and wind is normal and the day is sunny then only play ( *Readable
Format)
Decision Tree Advantages..Easy to interpret and explain to executives (Non-programmers)!
Cond. 1 Cond. 2 Cond. 3

Slide 10Slide 10Slide 10 www.edureka.co/r-for-analytics
If stays for 6 months with the company
If doesn’t stay for 6 months with the company
If stays for 6 months with the company
If doesn’t stay for 6 months with the company
With 50 % success, $100
With 50 % fail, -$40
With 50 % success, $90
With 50 % fail, -$20
50%($100) – 50% ($40) = $30
50%($90) – 50% ($20) = $35
Permanent
Outsourced
Manager
Illustrates a variety of decisions and also the impact of each decision if different decisions were to be taken
Decision Tree Advantages..contd
Slide 11Slide 11Slide 11 www.edureka.co/r-for-analytics
Let’s Understand it More
… What is Decision
Tree?

Slide 12Slide 12Slide 12 www.edureka.co/r-for-analytics
Decision Tree
Decision Tree is a supervised rule based
classification
* * During tree construction, attribute selection measures are used to select the attribute which best partitions the tuples into distinct classes
Classification rule
Flowchart - like tree structure
The topmost node in a tree is the root node
Each internal node denotes a test on an attribute, e.g. whether a coin flip comes up heads or tails
Each branch represents an outcome of the
test
Each leaf node holds a class label (decision taken after computing all attributes)
Paths from root to leaf represents classification rules

Slide 13Slide 13Slide 13 www.edureka.co/r-for-analytics
Under-
grad
Marital
Status
Taxable
Income
CityPopulatio
n
WorkExperienc
e
Urban Category
Yes Married 98,727 1,01,894 14 NO Risky
No Single 44,000 10,18,945 12 YES Good
No Divorced
50,000 10,15,845 14 YES Good
No Single 32,100 12,58,945 12 NO Risky
Yes Married 28,000 1,22,945 8 YES Risky
No Single 35,100 12,56,845 10 NO Good
No Divorced
38,100 18,95,945 7 NO Good
Under-
grad
MaritalStatus
Taxable
Income
CityPopulatio
n
WorkExperienc
e
Urban
Category
Yes Divorced
98,727 1,01,894 14 NO ????
DT Can Be used With Machine LearningWhen Coupled with Machine Learning, Decision Tree can be used for
Prediction

Slide 14Slide 14Slide 14 www.edureka.co/r-for-analytics
How it Works..
Let’s Build a Decision Tree Model !

Slide 15Slide 15Slide 15 www.edureka.co/r-for-analytics
Train Model (Build Tree)
Undergrad
4 Good / 3 Risky
No Yes
MaritalStatus
TaxableIncome
CityPopulation
WorkExperience
Urban
category
Single 44,000 1,01,8945
12 YES Good
Divorced
50,000 1,01,5845
14 YES Good
Single 32,100 1,25,8945
12 NO Risky
Single 35,100 1,25,6845
10 NO Good
Divorced
38,100 1,89,5945
7 NO Good
MaritalStatus
TaxableIncome
CityPopulation
WorkExperience
Urban
category
Married
98,727 1,01,894 14 NO Risky
Married
28,000 1,22,945 8 YES Risky

Slide 16Slide 16Slide 16 www.edureka.co/r-for-analytics
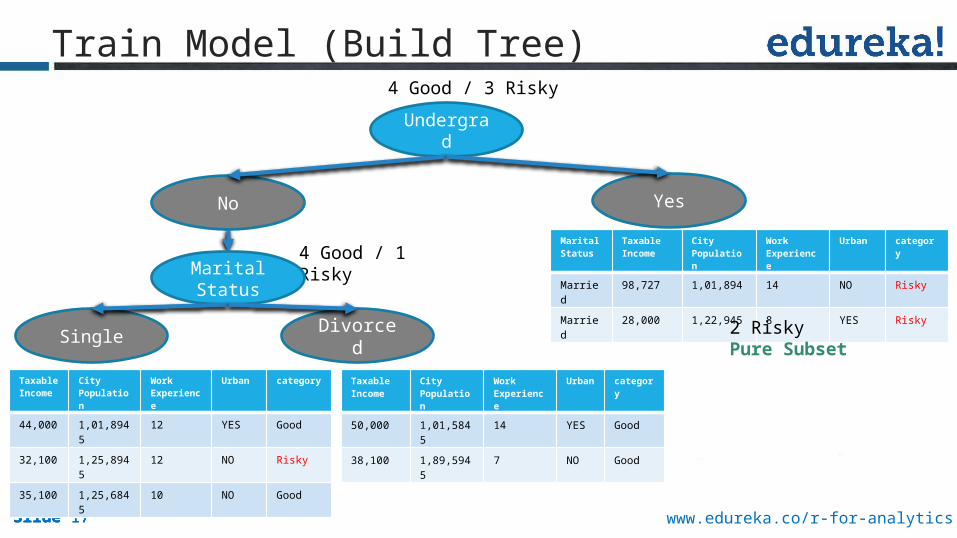
Train Model (Build Tree)
Undergrad
4 Good / 3 Risky
No Yes
MaritalStatus
TaxableIncome
CityPopulation
WorkExperience
Urban
category
Single 44,000 1,01,8945
12 YES Good
Divorced
50,000 1,01,5845
14 YES Good
Single 32,100 1,25,8945
12 NO Risky
Single 35,100 1,25,6845
10 NO Good
Divorced
38,100 1,89,5945
7 NO Good
MaritalStatus
TaxableIncome
CityPopulation
WorkExperience
Urban
category
Married
98,727 1,01,894 14 NO Risky
Married
28,000 1,22,945 8 YES Risky2 RiskyPure Subset
4 Good/1 RiskySplit Further
Slide 17Slide 17Slide 17 www.edureka.co/r-for-analytics
Train Model (Build Tree)
Undergrad
4 Good / 1 Risky
No Yes
MaritalStatus
TaxableIncome
CityPopulation
WorkExperience
Urban category
Married 98,727 1,01,894 14 NO Risky
Married 28,000 1,22,945 8 YES Risky
MaritalStatus
TaxableIncome
CityPopulation
WorkExperience
Urban
category
50,000 1,01,5845
14 YES Good
38,100 1,89,5945
7 NO Good
Single Divorced
TaxableIncome
CityPopulation
WorkExperience
Urban category
44,000 1,01,8945
12 YES Good
32,100 1,25,8945
12 NO Risky
35,100 1,25,6845
10 NO Good
4 Good / 3 Risky
2 RiskyPure Subset

Slide 18Slide 18Slide 18 www.edureka.co/r-for-analytics
Train Model (Build Tree)
Undergrad
4 Good / 1 Risky
No Yes
MaritalStatus
TaxableIncome
CityPopulation
WorkExperience
Urban category
Married 98,727 1,01,894 14 NO Risky
Married 28,000 1,22,945 8 YES Risky
MaritalStatus
TaxableIncome
CityPopulation
WorkExperience
Urban
category
50,000 1,01,5845
14 YES Good
38,100 1,89,5945
7 NO Good
Single Divorced
TaxableIncome
CityPopulation
WorkExperience
Urban category
44,000 1,01,8945
12 YES Good
32,100 1,25,8945
12 NO Risky
35,100 1,25,6845
10 NO Good2 Good/1 RiskySplit Further
4 Good / 3 Risky
2 RiskyPure Subset
2 GoodPure Subset

Slide 19Slide 19Slide 19 www.edureka.co/r-for-analytics
Train Model (Build Tree)
MaritalStatus
TaxableIncome
CityPopulation
WorkExperience
Urban
category
50,000 1,01,5845
14 YES Good
38,100 1,89,5945
7 NO Good
Single Divorced
2 GoodPure Subset
Taxable Income
< 33000 >33000
TaxableIncome
CityPopulation
WorkExperience
Urban category
32,100 1,25,8945
12 NO Risky
TaxableIncome
CityPopulation
WorkExperience
Urban category
44,000
1,01,8945 12 YES Good
35,100
1,25,6845 10 NO Good
4 Good / 1 Risky
2 Good / 1 Risky

Slide 20Slide 20Slide 20 www.edureka.co/r-for-analytics
Train Model (Build Tree)
MaritalStatus
TaxableIncome
CityPopulation
WorkExperience
Urban
category
50,000 1,01,5845
14 YES Good
38,100 1,89,5945
7 NO Good
Single Divorced
2 GoodPure Subset
Taxable Income
< 33000 >33000
TaxableIncome
CityPopulation
WorkExperience
Urban category
32,100 1,25,8945
12 NO Risky
TaxableIncome
CityPopulation
WorkExperience
Urban category
44,000
1,01,8945 12 YES Good
35,100
1,25,6845 10 NO Good2 GoodPure Subset
1 RiskyPure Subset
4 Good / 1 Risky
2 Good / 1 Risky
Slide 21Slide 21Slide 21 www.edureka.co/r-for-analytics
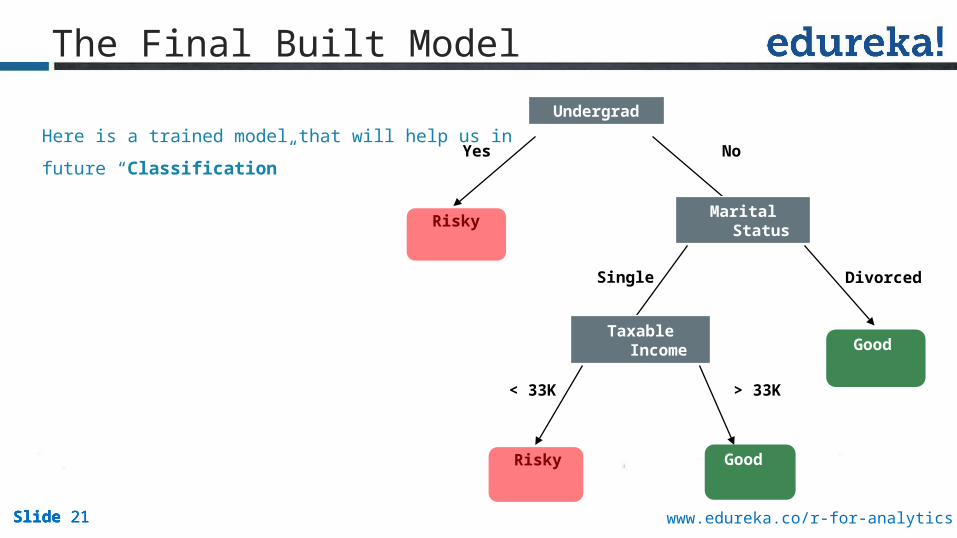
Undergrad
Marital Status
Taxable Income
GoodRisky
Risky
Good
Yes No
DivorcedSingle
< 33K > 33K
The Final Built Model
Here is a trained model that will help us in future
“Classification”

Slide 22Slide 22Slide 22 www.edureka.co/r-for-analytics
Let’s Use our Model..

Slide 23Slide 23Slide 23 www.edureka.co/r-for-analytics
Test Data
Start from the root of tree
Under-grad
MaritalStatus
TaxableIncome
CityPopulation
WorkExperience
Urban
category
No Divorced 98727 101894 14 NO ????
Undergrad
Marital Status
Taxable Income
GoodRisky
Risky
Good
Yes No
DivorcedSingle
< 33K > 33K

Slide 24Slide 24Slide 24 www.edureka.co/r-for-analytics
Test Data
How It WorksUnder-grad
MaritalStatus
TaxableIncome
CityPopulation
WorkExperience
Urban
category
No Divorced 98727 101894 14 NO ????
Undergrad

Slide 25Slide 25Slide 25 www.edureka.co/r-for-analytics
Test DataNo
How It WorksUnder-grad
MaritalStatus
TaxableIncome
CityPopulation
WorkExperience
Urban
category
No Divorced 98727 101894 14 NO ????
Undergrad

Slide 26Slide 26Slide 26 www.edureka.co/r-for-analytics
Test DataNo
How It WorksMaritalStatus
TaxableIncome
CityPopulation
WorkExperience
Urban
category
Divorced 98727 101894 14 NO ????
Undergrad
Marital Status

Slide 27Slide 27Slide 27 www.edureka.co/r-for-analytics
Test Data
How It WorksMaritalStatus
TaxableIncome
CityPopulation
WorkExperience
Urban
category
Divorced 98727 101894 14 NO ????
Divorced
No
Undergrad
Marital Status
Slide 28Slide 28Slide 28 www.edureka.co/r-for-analytics
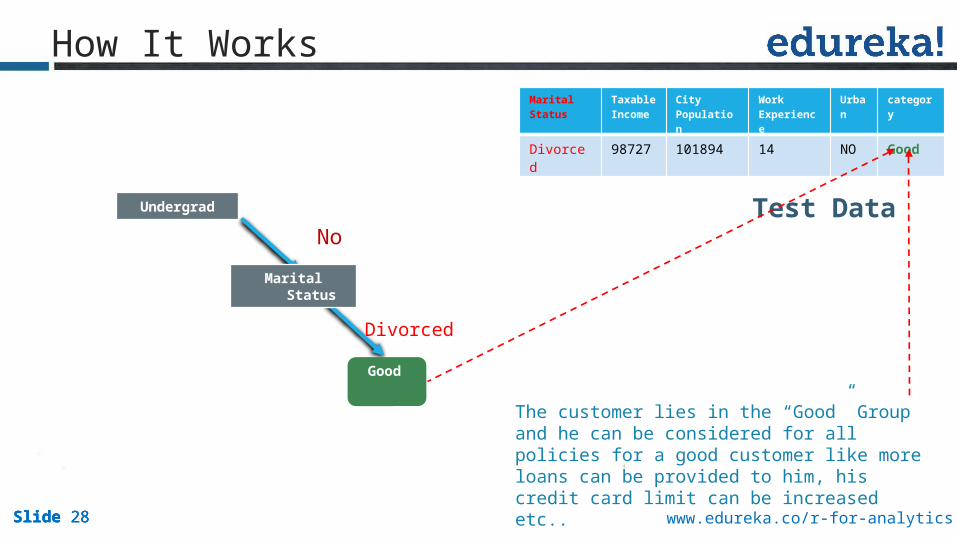
Test Data
How It WorksMaritalStatus
TaxableIncome
CityPopulation
WorkExperience
Urban
category
Divorced 98727 101894 14 NO Good
Divorced
Good
The customer lies in the “Good” Group and he can be considered for all policies for a good customer like more loans can be provided to him, his credit card limit can be increased etc..
No
Undergrad
Marital Status

Demo
Slide 30Slide 30Slide 30 www.edureka.co/r-for-analytics
Real Life Application

Slide 31Slide 31Slide 31 www.edureka.co/r-for-analytics
Predicting tumor cells as benign or malignant!
Application of Decision Trees

Slide 32Slide 32Slide 32 www.edureka.co/r-for-analytics
Banks Using For Classifying credit card transactions !
Application of Decision Trees

Slide 33Slide 33Slide 33 www.edureka.co/r-for-analytics
Categorizing news stories as finance, weather etc…
Application of Decision Trees
Questions
Slide 34

Slide 35Slide 35Slide 35 www.edureka.co/r-for-analytics
Conclusion!
When to Apply Decision Tree ??
®Whenever you are making a future complex decision
®When you have are just experimenting with the decisions and you want to
evaluate and visualize your decision and the impact
®When you want to present your decision and its comparison with other
decisions on the same problem

Slide 36
Your feedback is vital for us, be it a compliment, a suggestion or a complaint. It helps us to make your experience better!
Please spare few minutes to take the survey after the webinar.
Survey

Related Documents