Declining Return Migration from the United States to Mexico in the late-2000s Recession Michael S. Rendall*, Peter Brownell**, and Sarah Kups*** February 24, 2010 Abstract Researchers in the U.S. and Mexico have variously asserted that return migration from the U.S. to Mexico has increased substantially, remained unchanged, or declined slightly in response to the 2007-2009 U.S. recession and global financial crisis. The present study addresses this debate using microdata through mid-2009 from a large-scale, quarterly Mexican household survey, the National Survey of Occupation and Employment (ENOE), after first validating the ENOE against return migration estimates from a specialist demographic survey, the 2006 National Survey of Demographic Dynamics (ENADID). No evidence of increased return migration is found. Statistically significant declines in return migration, however, are found between the immediately pre- recession 2006/07 year and the 2008/09 recession year, and between the fourth quarter of 2007 and the fourth quarter of 2008 when the global financial crisis had just been triggered. * Senior Social Scientist; ** Associate Social Scientist, *** PhD Student, RAND Corporation, 1776 Main Street, Santa Monica CA 90407-2138. Please address correspondence to the first author at: [email protected].

Welcome message from author
This document is posted to help you gain knowledge. Please leave a comment to let me know what you think about it! Share it to your friends and learn new things together.
Transcript

Declining Return Migration from the United States to Mexico in the late-2000s Recession
Michael S. Rendall*, Peter Brownell**, and Sarah Kups***
February 24, 2010
Abstract
Researchers in the U.S. and Mexico have variously asserted that return migration from
the U.S. to Mexico has increased substantially, remained unchanged, or declined slightly
in response to the 2007-2009 U.S. recession and global financial crisis. The present
study addresses this debate using microdata through mid-2009 from a large-scale,
quarterly Mexican household survey, the National Survey of Occupation and
Employment (ENOE), after first validating the ENOE against return migration estimates
from a specialist demographic survey, the 2006 National Survey of Demographic
Dynamics (ENADID). No evidence of increased return migration is found. Statistically
significant declines in return migration, however, are found between the immediately pre-
recession 2006/07 year and the 2008/09 recession year, and between the fourth quarter of
2007 and the fourth quarter of 2008 when the global financial crisis had just been
triggered.
* Senior Social Scientist; ** Associate Social Scientist, *** PhD Student,
RAND Corporation, 1776 Main Street, Santa Monica CA 90407-2138. Please address
correspondence to the first author at: [email protected].

Acknowledgements: We gratefully acknowledge support from the National Institute of
Aging under investigator grant R21AG030170, and from the Eunice Kennedy Shriver
National Institute of Child Health and Human Development population research
infrastructure grant R24-HD050906.

INTRODUCTION
The United States entered in December 2007 what may be the deepest recession since
World War II (Federal Reserve Bank of Minneapolis, n.d.), perhaps even since the Great
Depression. With a global financial crisis additionally triggered in September 2008 by
the collapse of major U.S. investment banks, and with the not too distant memory of the
Great Depression in which over 400,000 Mexicans (and in some cases their U.S. Citizen
children) were repatriated from the U.S. to Mexico (Hoffman 1974), speculation in
Mexico turned to the potential for a “massive return.” The Mexican press began
reporting a number of anecdotal findings of large numbers of returnees to the traditional
major migrant-sending regions including Sonora and Michoacán, and to newer migrant-
sending regions including Mexico City (see Alarcón et al 2008, pp.3-4). The U.S press,
meanwhile, has continued to report large numbers of migrants departing from major
Mexican-migrant destination areas including California, Arizona, and Colorado, and also
from elsewhere in the U.S. (see Camarota and Jensenius 2009, p.2). Most recently (Los
Angeles Times 2009), declines in California’s foreign-born population were interpreted
by U.S. demographers variously as a strong response to the recession especially among
low-skilled Mexican immigrants as fewer arrive and more leave, or as no more than a
continuation of ongoing declines of immigration inflows and of moves by immigrants
away from traditional receiving states to newer ones.
With the emergence of preliminary data in Mexico on migrant flows, and in the
U.S. on changes in migrant stocks, researchers have taken opposing positions.
Examining return-migrant flow data collected in Mexico from an ongoing border survey
(the Survey of Migration at the North Border, or ‘EMIF’, CONAPO 2009) through mid-
1
2008, Bustamante (2009) argues that the already-massive levels of return migration in
recent years have increased substantially. Camarota and Jensenius (2009), applying a
residual estimation methodology to U.S. Current Population Survey (CPS) data on
changes in migrant stocks to 18 to 40 year old Mexican-born immigrants with less than a
college education, describe a “dramatic increase” (p.14) in return migration.
Alarcón et al (2008), using the same border survey data source (the EMIF) as
drawn on by Bustamante, take the contrary position that no increase in return migration
has occurred. Fix et al (2009) compare return migration in the first quarter of 2009 to the
first quarters of 2008 and 2007, using EMIF estimates from the data producer, and
conclude that “…return migration from the United States appears to have declined…”
(p.28). Passel and Cohn (2009) conclude that no overall increase in return migration of
Mexicans from the U.S. occurred through the first quarter of 2009, based on a residual
estimation methodology with the same CPS data source as Camarota and Jensenius
(2009).
The first direct estimates of return migration flows extending into 2009 were
those released by the Mexican government’s national statistical institute (INEGI 2009c).
These estimates come from Mexico’s equivalent of the CPS, the National Survey of
Occupation and Employment (ENOE). Notwithstanding the careful attention that the
Passel and Cohn (2009) and Camarota and Jensenius (2009) studies pay to the correct
treatment and adjustment of immigrant stock data, their residual methodologies rely on
estimates of components of population change that are notoriously difficult to estimate
for the highly mobile and hard-to-count Mexican immigrant population in the U.S. (e.g.,
Bean et al 2001). This makes direct estimation of returning migrant flows a very
2
attractive alternative. In this research note, we take advantage of ENOE microdata
recently made available through mid-2009 to evaluate that survey as a data source on
returning migrants from the U.S., and to draw robust conclusions about the level and
trends of return migration to Mexico across the pre-recession to recession period.
Substantively, the ENOE microdata allow us to: (1) limit our estimates to
Mexican-born, “return migrants” in place of the estimates of immigrants from all
countries of birth that constitute INEGI’s published series (2008; 2009b; 2009c), and that
are reported also by Passel and Cohn (2009); (2) alternately analyze the return migration
of all Mexican-born individuals and the return of those at the same prime labor-migration
ages 18 to 40 as analyzed by Camarota and Jensenius; and (3) alternately restrict the
ENOE’s return migrations to exclude the seasonal ‘circular’ return migrants that Passel
and Cohn claim are responsible for the higher ENOE estimates. Methodologically, the
microdata allow us to: (1) conduct tests of statistical significance between point estimates
of return migration in different years and quarters in the ENOE; and (2) evaluate the
ENOE as a data source on international migration by comparison to the better-known
National Survey of Demographic Dynamics (ENADID).
DATA AND ANALYSES
The National Survey of Occupation and Employment (ENOE) is very similar in design to
the U.S. Current Population Survey (CPS). Like the CPS, the ENOE is a quarterly
survey with a rotating panel of sampled residences (INEGI 2005; 2009a). The ENOE has
existed since 2005 when it replaced the quarterly National Employment Survey (ENE).
We use data from 2005 through to the second quarter of 2009 to construct annual and
3

quarterly estimates primarily of return migration to Mexico, and secondarily of
emigration from Mexico to the U.S. An average of 105,648 responding ENOE
households per quarter reported on 418,387 individuals who were living in the household
in that quarter or in the quarter immediately preceding it. Each ENOE residence remains
in the survey for five consecutive quarterly interviews. In each of the second through
fifth interviews, household members who were not present in the previous interview are
identified as “new residents.” Immigrant inflows are estimated quarterly from new
residents “coming from another country.” Because in any given quarter, only 4 out of 5
households are in the universe of households for which new residents since the last
quarter can be identified (the other 1 in 5 households are in their 1st interview), a factor of
5/4 is applied to the weighted ENOE sample to obtain population estimates of return
migrants. When we applied this adjustment, we were able to match very closely the
INEGI (2008; 2009b; 2009c) total emigration and immigration estimates published for
the second quarter of 2006 through first-quarter of 2009. By using the ENOE microdata,
we are also able to limit the universe to Mexican-born emigrants and immigrants, and to
extend the period from the first quarter of 2006 through to the second quarter of 2009.
Results are shown in Figure 1.
[FIGURE 1 ABOUT HERE]
Migration flows between Mexico and the U.S. are known to be seasonal (Durand,
Massey, and Zenteno 2001). A major advantage of the ENOE is its quarterly collection.
In every year emigration flows are greatest in the second quarter, while return migration
4
flows are greatest across the two winter quarters (4th quarter and 1st quarter). This
seasonal patterning continued into 2007/08 and 2008/09. The clearest change in
migration patterns from 2006 through 2009 is the ongoing large decline in emigration
flows from a 2 quarter peak of 358,464 in 2006 down to 274,341 and 201,469
respectively in the 2 quarters of 2007 and 2008. In this context, the 134,290 emigrants
in the 2 quarter of 2009 may be seen as a continuation of a pattern that preceded the
2007-2009 recession and 2008 financial crisis. This decline in emigration will have
reduced the stock of recent Mexican migrants in the U.S. when the recession and
financial crisis hit, and this can be expected to have a downward impact on return
migration flows in the 2007/08 and 2008/09 years.
nd
nd
nd
The seasonal regularity of the ENOE’s quarterly migration series is reassuring
from the perspective of the quality of the ENOE migration estimates. Both Passel and
Cohn (2009) and Camarota and Jensenius (2009) refer implicitly or explicitly to
migration estimates from the ENOE, but offer contrasting perspectives on their quality.
Passel and Cohn comment favorably on the design of the ENOE. They reproduce the
latest of INEGI’s published estimates which are based on that survey in their paper. The
INEGI estimates from the ENOE, however, are far larger than Passel and Cohn’s residual
estimates from the CPS, including approximately four times larger for the 2008/09 year.
Passel and Cohn attribute this to the ENOE’s picking up additional categories of
migrants:
“The [ENOE] provides estimates for a broader group of migrants. They include
Mexicans who come to the U.S. for short periods and may return home within
weeks or months…These ‘circular’ migrants may not appear in the CPS.”
5
(Passel and Cohn, p.3).
Camarota and Jensenius, meanwhile, note that the ENOE’s lack of any upward
trend in the return-migrant flow since 2006/07 is contrary to their finding of a “dramatic
increase” in return migration over this same period. They discount the accuracy of the
ENOE results, offering two justifications. First, they question whether the INEGI
estimates of immigration including “…people born in other countries coming to stay in
Mexico” (p.15) accurately represent Mexican migrants returning from the U.S. Second,
they question whether the ENOE captures migrants effectively, suggesting it
underestimates the immigrant inflow. We are not aware of any studies validating the
ENOE against other migration data sources, and therefore now conduct such a validation.
Validation of the ENOE against the 2006 ENADID
We compare the ENOE’s 2005/06 return migration to that in the 2006 National Survey
on Demographic Dynamics (Encuesta Nacional de la Dinámica Demográfica, ENADID,
CONAPO 2008). Earlier (1992 and 1997) ENADID surveys have been used by, among
others, Massey and Zenteno (2000) to validate migration estimates from the Mexican
Migration Project, and by Hill and Wong (2005) to supplement decennial census
estimates of U.S.-Mexico migration.
We use the 2006 ENADID to compare Mexican-born return migrant flows in the
2005/06 period between the ENADID and the ENOE. The ENADID included 35,540
responding households (CONAPO 2008, p.22). Return migrants during the 2005/06
period are identified through a question about the month and year of the most recent
return to Mexico of household members that had emigrated to the United States. In the 5
6
percent of cases in which year or month was missing we randomly imputed them based
on the distribution of years and months of last return migration in cases with those data
present. The most recent month of return reported was for May 2006, although April
2006 was the most recent month with substantial numbers. We therefore define the
ENADID 2005/06 year as beginning in May 2005. We compare return migration in this
year to return migration in the third quarter of 2005 through the second quarter of 2006.
Although the match of months is not exact, both include the season of largest return
migration (late fall and winter).
Unlike the earlier ENADID surveys of 1992 and 1997, the 2006 ENADID
identifies return migrants only from among those who emigrated to the U.S. within the
five years preceding the survey (specifically, after January 2001). This means that
returning migrants that have not lived in Mexico in the last five years will be missed,
resulting in some degree of underestimation of total return migration. A second source of
underestimation of return migration in the ENADID compared to the ENOE is the
ENADID’s missing those migrants who returned to Mexico in the 2005/06 year but
emigrated again before the 2006 survey interview. We are unable to estimate the
magnitude of the first source of ENADID underestimation of return migration. We are,
however, able to use the ENOE rotation groups to produce “ENADID-equivalent”
estimates that account for the second, “re-emigrant” source of underestimation in the
ENADID relative to the ENOE. This is achieved by deriving estimates from only those
households that would normally still be in the sample at our 2005/06 year end (the second
quarter interview of 2006) based on their rotation group (which determines the timing of
their first and last interviews). For example, in the third quarter of 2005, of households in
7
their second through fifth interviews, only households in their second interview would
normally be interviewed also in the second quarter of 2006. We are then able to remove
all return migrants who re-emigrated again by the second quarter of 2006 to produce an
“ENADID-equivalent” estimate of return migration. National estimates of return
migrants are derived by multiplying the standard weighted estimates by the inverse of the
fraction of rotation groups in a given quarter that are both in their second or later
interview and that would normally be interviewed again in the second quarter of 2006.
These fractions are respectively 1/5, 2/5, 3/5, and 4/5 for the third quarter of 2005
through the second quarter of 2006. Results comparing the ENADID and ENOE are
presented in Table 1. Statistical tests of difference included in Table 1 (and also Table 2
below) account for the ENADID and ENOE sample design effects of stratification by
state and of clustering into primary sampling units, and assume independence between
time periods.
[TABLE 1 ABOUT HERE]
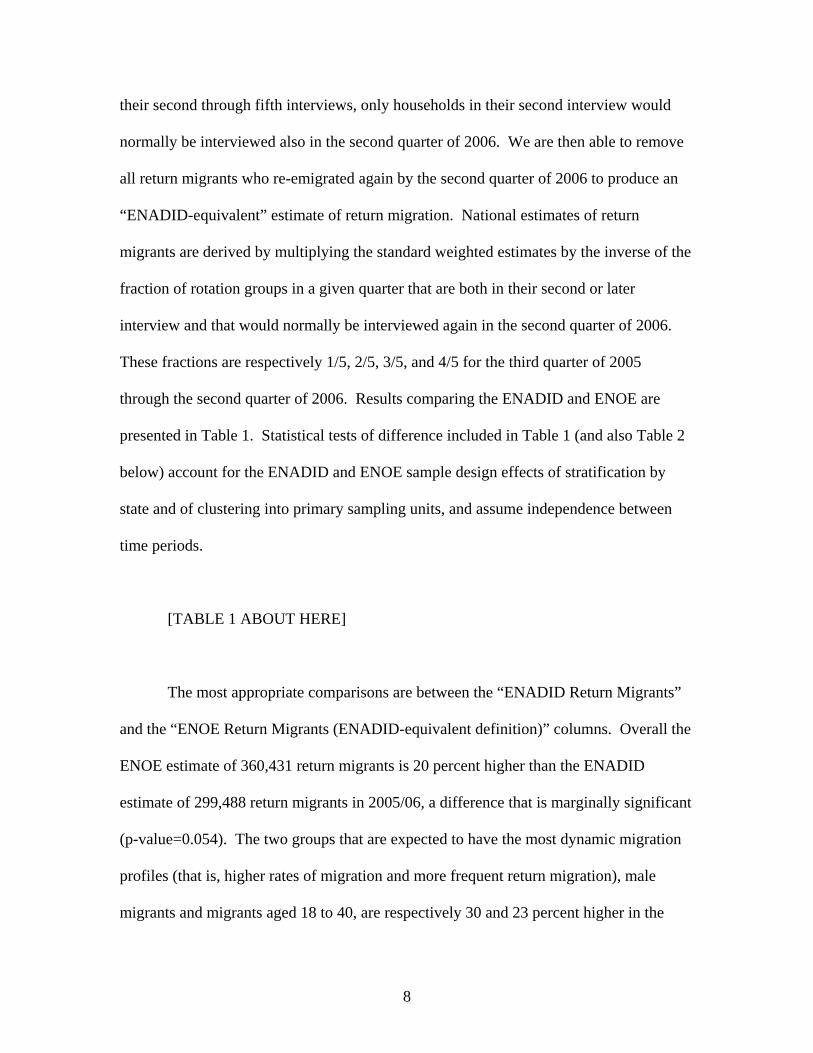
The most appropriate comparisons are between the “ENADID Return Migrants”
and the “ENOE Return Migrants (ENADID-equivalent definition)” columns. Overall the
ENOE estimate of 360,431 return migrants is 20 percent higher than the ENADID
estimate of 299,488 return migrants in 2005/06, a difference that is marginally significant
(p-value=0.054). The two groups that are expected to have the most dynamic migration
profiles (that is, higher rates of migration and more frequent return migration), male
migrants and migrants aged 18 to 40, are respectively 30 and 23 percent higher in the
8
ENOE than in the ENADID (differences that are statistically significant at the 5 percent
significance level). The female return migration estimates do not differ significantly
between the ENADID and ENOE, though are only one third as numerous as male return
migrants. Even after removing those 2005/06 ENOE return migrants that re-emigrated
by the end of the 2005/06 year, then, the ENOE estimates are mostly larger than the
ENADID estimates. These comparisons therefore reveal no evidence of the possible
undercount of migrants in the ENOE suggested by Camarota and Jensenius (2009).
Instead they suggest a more sensitive collection of migration events in the ENOE than in
the ENADID.
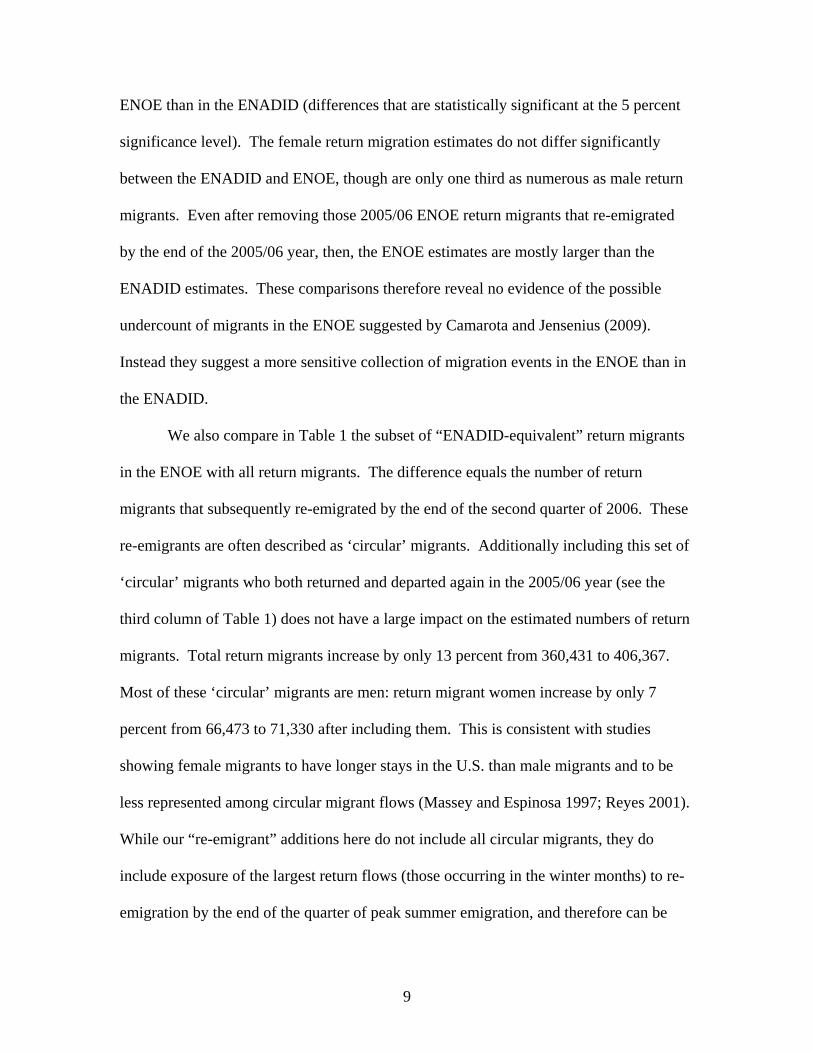
We also compare in Table 1 the subset of “ENADID-equivalent” return migrants
in the ENOE with all return migrants. The difference equals the number of return
migrants that subsequently re-emigrated by the end of the second quarter of 2006. These
re-emigrants are often described as ‘circular’ migrants. Additionally including this set of
‘circular’ migrants who both returned and departed again in the 2005/06 year (see the
third column of Table 1) does not have a large impact on the estimated numbers of return
migrants. Total return migrants increase by only 13 percent from 360,431 to 406,367.
Most of these ‘circular’ migrants are men: return migrant women increase by only 7
percent from 66,473 to 71,330 after including them. This is consistent with studies
showing female migrants to have longer stays in the U.S. than male migrants and to be
less represented among circular migrant flows (Massey and Espinosa 1997; Reyes 2001).
While our “re-emigrant” additions here do not include all circular migrants, they do
include exposure of the largest return flows (those occurring in the winter months) to re-
emigration by the end of the quarter of peak summer emigration, and therefore can be
9

considered a reasonable estimate of “seasonal” circular migrants. These results of
relatively small differences between the subset of ENOE return migrants who did not re-
emigrate and all ENOE return migrants therefore conflict with Passel and Cohn’s (2009)
claim that their CPS estimates are much lower because they miss circular migrants. In
particular, Passel and Cohn’s estimate of only 31,000 return migrants in 2005/06 is less
than 10 percent of our ENOE estimate of return migrants that excludes returning migrants
to Mexico who re-emigrated again in the same year, whereas we found that seasonal
circular migrants constitute only 11 percent of the total return migrant flow in 2005/06.
Analysis of annual and quarterly change in return migration and emigration in the
ENOE, 2005 to 2009
Having shown that the ENOE-based estimates compare reasonably to estimates from the
better-known ENADID data, we now use the ENOE to address the main question of our
study: whether return migration to Mexico increased, remained unchanged, or decreased
since the onsets of the U.S. recession beginning in late-2007 and the global financial
crisis beginning in September 2008. We derive estimates of return migration from all
households in their second through fifth interviews in a given quarter (see Table 2).
These estimates are again restricted to Mexican-born migrants.
[TABLE 2 ABOUT HERE]
The major substantive finding is that return migrant flows declined from the pre-
recession to post-recession periods. The point estimate of 362,748 return migrants in the
10
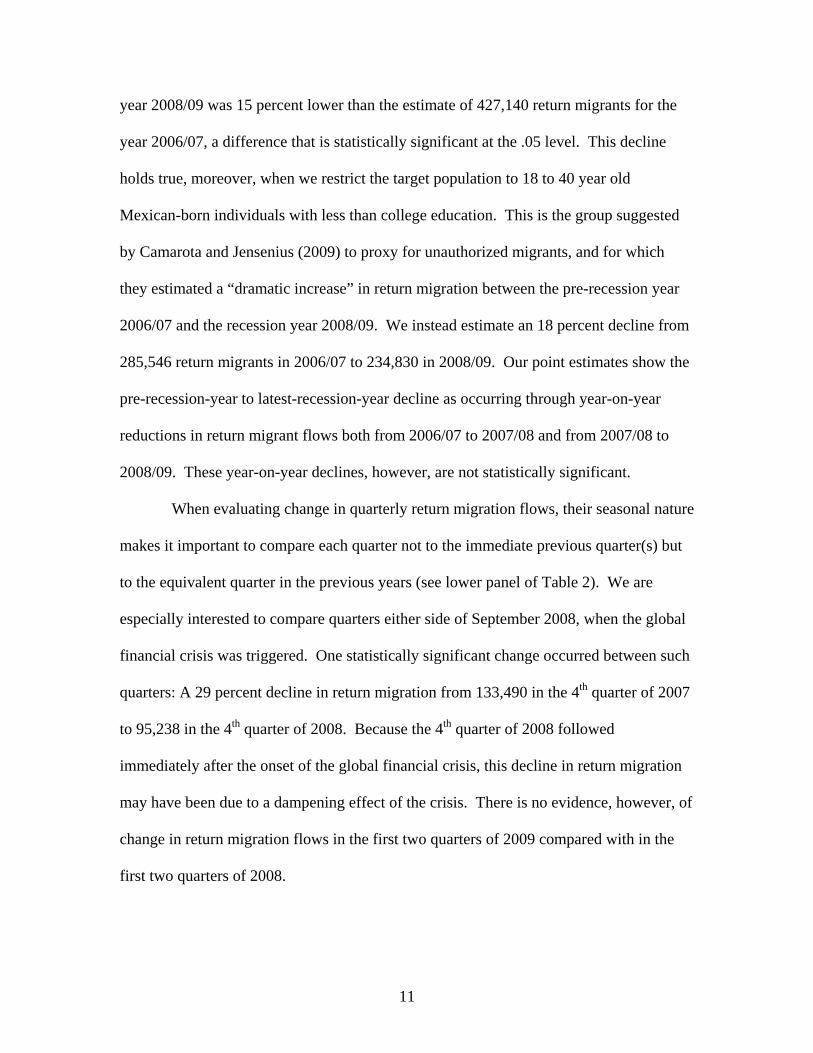
year 2008/09 was 15 percent lower than the estimate of 427,140 return migrants for the
year 2006/07, a difference that is statistically significant at the .05 level. This decline
holds true, moreover, when we restrict the target population to 18 to 40 year old
Mexican-born individuals with less than college education. This is the group suggested
by Camarota and Jensenius (2009) to proxy for unauthorized migrants, and for which
they estimated a “dramatic increase” in return migration between the pre-recession year
2006/07 and the recession year 2008/09. We instead estimate an 18 percent decline from
285,546 return migrants in 2006/07 to 234,830 in 2008/09. Our point estimates show the
pre-recession-year to latest-recession-year decline as occurring through year-on-year
reductions in return migrant flows both from 2006/07 to 2007/08 and from 2007/08 to
2008/09. These year-on-year declines, however, are not statistically significant.
When evaluating change in quarterly return migration flows, their seasonal nature
makes it important to compare each quarter not to the immediate previous quarter(s) but
to the equivalent quarter in the previous years (see lower panel of Table 2). We are
especially interested to compare quarters either side of September 2008, when the global
financial crisis was triggered. One statistically significant change occurred between such
quarters: A 29 percent decline in return migration from 133,490 in the 4th quarter of 2007
to 95,238 in the 4th quarter of 2008. Because the 4th quarter of 2008 followed
immediately after the onset of the global financial crisis, this decline in return migration
may have been due to a dampening effect of the crisis. There is no evidence, however, of
change in return migration flows in the first two quarters of 2009 compared with in the
first two quarters of 2008.
11
Reconciliation with previous findings
We are not aware of earlier peer-reviewed estimates of return migration to Mexico that
compare pre-recession and recession levels. The most authoritative estimates might then
be claimed to be those of the data producers in Mexico. These are INEGI for the ENOE
estimates and CONAPO for the EMIF estimates. Passel and Cohn (2009) reproduce
ENOE estimates provided to them directly by INEGI, while Fix et al (2009) reproduce
EMIF estimates provided to them directly by CONAPO. Neither the ENOE nor EMIF
estimates, however, include measures of sampling variability. With a little over 1,000
return migrants in the annual ENOE samples (see again Table 2) and similar annual
levels of return migrants shown in previous estimates using the EMIF (e.g., Rendall,
Aguila, Basurto, and Handcock 2009), there will clearly be substantial levels of sampling
error that may account for differences in point estimates of return migration between
different years (as in the ENOE estimates reproduced by Passel and Cohn 2009), and
especially between different quarters (as in the EMIF estimates reported by Fix et al
2009).
International migration estimates, moreover, can seldom be taken at face value
(United Nations 2002), and it is especially worrying that our estimates from the Mexican
ENOE differ so vastly from earlier residual estimates from U.S. data. Our ENOE
estimate of 362,748 return migrants in 2008/09 is 260,000 higher than Passel and Cohn’s
(2009) estimate of 93,000 total return migrants and is 183,000 lower than Camarota and
Jensenius’s (2009) estimate of 550,000 return migrants in the 18-40 group with less than
college education. If we match the period of our estimates more closely to the period of
their return migration estimates, by summing from the 2nd quarter of 2008 to the 1st
12
quarter 2009 year, our ENOE estimate of annual migration changes only by 8,000 to
370,826. What then can explain such large differences between the CPS-based residual
estimates and our direct estimates of return migration from the ENOE?
First, we address empirically Camarota and Jensenius’ (2009) suggestion that a
substantial number of immigrants in the ENOE series may not be returning migrants from
the U.S. By restricting our sample from all immigrants to Mexican-born immigrants
only, we estimate 15 percent fewer return migrants in our 2008/09 year. Of the now
excluded, non-Mexican-born immigrants, we found that more than two thirds (69
percent) were U.S.-born children under 18, typically returning with their Mexican-born
parent or parents (results not shown). We omit these children from our estimates of
“return migrants”, since demographically they are emigrants from the U.S. Their large
presence among all non-Mexican-born immigrants, however, suggests that INEGI’s
failure to distinguish immigrants’ country of birth in their published estimates does not
result in a substantive confounding of new and return migration.
Our “Mexican-born” restriction does not, however, rule out returns of Mexicans
from countries other than the U.S. While the ENOE does not identify the country from
which these Mexican-born migrants returned, other recent data allow us to infer that a
very small percentage, probably around 2 percent, will have returned from countries other
than the United States. DuMont and LeMaitre (2005) find that only 1 percent of all
expatriate Mexicans living in OECD countries at the time of the 2000 round of censuses
were living in a country other than the U.S. We examined this further in the ENOE’s
predecessor survey, the National Survey of Employment (ENE). Unlike in the ENOE, the
country the migrant returned from was identified in the ENE. We examined the
13

distribution of countries of last residence for returning Mexican migrants in the first two
quarters of 2004, being the most recent two quarters with no missing values for the
country of last residence variable, and found that only 2.1 percent of returning Mexican-
born migrants returned from a country other than the U.S. in the first half of the year
2004 (results not shown).
Both Passel and Cohn (2009) and Camarota and Jensenius’ (2009) residual
estimates of return migration between each pair of years y-1 and y are basically the sum
of two components: (1) decline in the mortality-adjusted target, Mexican-born population
between y-1 and y; and (2) immigration of the target population between y-1 and y. Both
of these components are subject to considerable uncertainty of measurement in addition
to sampling error in the CPS. Regarding the first component, both Passel and Cohn and
Camarota and Jensenius estimate a decline in their respective target populations between
2007/08 and 2008/09, while only Camarota and Jensenius estimate a decline in their
target population between 2006/07 and 2007/08. While Passel and Cohn estimate a
decline of only 96,000 in the total Mexican-born population between 2007/08 and
2008/09, Camarota and Jensenius estimate a decline of 403,000 in the Mexican-born
population aged 18-40 without any college education in the same period. We are
skeptical of such divergent estimates of the direction and magnitudes of the Mexican-
born population change, especially since 18 to 40 year olds without a college education
constitute approximately two thirds of all return migrants from the U.S. to Mexico (see
again Table 2). It seems equally plausible that the divergences in these estimates could
be due, for example, to a greater increase in undercount for the 18 to 40 year olds
between 2007/08 and 2008/09 than for the under-18 and over-40 year olds.
14

Concerning the second component that of the most recent year’s immigration
from Mexico, a fundamental problem is dependence on data for “arrival cohorts” that are
aggregated into three-year arrival periods in the CPS for confidentiality reasons. We
illustrate the consequences of this problem first for what Passel and Cohn describe (p.9)
as the “relatively straightforward” case of odd-numbered CPS years. They estimate
arrivals in the year from y-1 to y as the difference between Mexican-born individuals in
the year y CPS who arrived since year y-3 (that is, who arrived in any of years y-3, y-2,
y-1, or y) and Mexican-born individuals in the year y-1 CPS who arrived since year y-3
(that is, who arrived in any of years y-3, y-2, or y-1). The problem with this method is
that return migration between year y-1 and y of those who arrived in y-3, y-2, or y-1 will
result in downwardly biased estimation of immigration between years y-1 and y, and will
therefore also result in downwardly biased estimates of annual return migration between
y-1 and y.
Camarota and Jensenius (2009) use a different method than Passel and Cohn to
estimate the annual immigration between year y-1 and y from the CPS’s grouped year-of-
arrival data. They begin by simply dividing migrants that arrived in a given year-group
interval, as observed in year y, by the number of years (and part years) of that interval
(p.12). This assumes a uniform distribution of immigrants across the years of the
grouped-year interval. It will bias downwards migration estimated for the most recent
year of the year group because the shorter is the time that has passed since the immigrant
arrived, the shorter is the immigrant’s exposure to return migration. Unsurprisingly,
Camarota and Jensenius report that immigration in the last year appears to be
underestimated, and they make ad hoc compensatory upward adjustments that “in some
15

years are substantial” (p.22, footnote 24). These adjustments may account for some of
the difference between their residual estimates of return migration and those of Passel
and Cohn, but not in a way that gives any reassurance about the soundness of the method
by which Camarota and Jensenius derive their much larger estimates.
DISCUSSION
Researchers in the U.S. and Mexico have variously asserted that return migration from
the U.S. to Mexico has increased substantially, remained unchanged, or declined slightly
in response to the 2007-2009 U.S. recession and global financial crisis. Using data from
a nationally-representative Mexican household survey through the middle of 2009, we
find some evidence for a decrease in return migration flows, and no evidence for any
increase. We find a statistically significant decrease, from 427,140 return migrants in the
immediately pre-recession year 2006/07 to 362,748 return migrants in the recession year
2008/09. We also find that the 95,238 return migration flow in the 4th quarter of 2008,
immediately after the global financial crisis was triggered, was significantly lower than
the 133,490 of the previous year’s 4th quarter, a quarter that typically sees higher than
average levels of return migration due to the presence of seasonal returners in late-fall
and winter months. This drop suggests, therefore, an initial dampening effect of the
economic crisis on return migration.
We noted that immigrant inflows from Mexico to the U.S. declined substantially
during the recession, continuing a downward trend from the immediately pre-recession
years. If this is because the U.S. has become a less attractive option for potential
migrants in Mexico since the recession, an increase rather than a decrease in return
16
migration might have been expected, and this expectation appears to be behind the many
U.S. and Mexican press reports claiming increased return migration, as noted above in
the Introduction. To explain our findings instead of a decrease in return migration since
the recession began, we first note that a pattern of sharp declines in immigrant inflows
coincident with little or no increases in return migration outflows is the dominant finding
of previous global economic crises in the present, post-War era. When the 1973 Oil
Crisis hit Europe, two of the largest immigrant-receiving countries, Germany and France,
both responded by halting new labor migration (King 1978, 1986; Fassmann and Munz
1992; Dustmann 1996), while France offered incentives to immigrants to return to their
countries of origin. However, these incentives were largely ineffectual (Hollifield 1994).
A recent program in Spain to offer migrants a lump sum payout of unemployment
benefits if they repatriate and give up the right to return to Spain for three years has
similarly met with a tepid response from migrants (Plewa 2009).
In the Mexican-U.S. case, return migration did not increase in any consistent
manner during the U.S. recessions of the early 1970’s and again in the early 1980’s
(Massey, Durand, and Malone 2002). In particular, the probability of return among
undocumented men showed little variation across recession and non-recession periods.
Massey and Espinosa (1997) and Reyes (2004) find some evidence of faster return
migration when either the Mexican inflation rate or the Mexican real interest rate
increased, or when the U.S. dollar was stronger relative to the Mexican peso. These
seemingly counter-intuitive findings that factors that increase the value of earnings in the
U.S. also increase return migration have been explained by the “target-earner” hypothesis
(e.g., Piore 1979; Dustmann 2003). Applied to the Mexican-U.S. case, Portes and Bach
17
(1985) argue that Mexicans migrate temporarily to the U.S. to earn money for a
predetermined investment or consumption goal, and stay for as long as it takes to attain
this predetermined “target” savings amount. One prediction from the target-earner
hypothesis is that worsening economic conditions in the U.S. will keep immigrants in the
U.S. longer until they are able to reach their savings targets. Lindstrom (1996) finds
supporting evidence for this hypothesis in a positive association between state-level U.S.
unemployment rates and migrants’ durations of stay in the U.S.
In addition to economic factors, family formation and settlement migration among
Mexican immigrants in the U.S. is argued (Alarcón et al 2008) to be a major force against
return migration in the current recession. While Durand, Massey, and Zenteno (2001)
argue that the Mexican-U.S. migration process continues to be dominated by temporary,
male labor migration, others have contended that settlement migration has become
increasingly important (e.g., Marcelli and Cornelius 2001). Even Durand, Massey, and
Parrado (1999) claim that the landmark 1986 U.S. immigration reforms had a number of
unintended effects including increases in the reunification (legal and otherwise) in the
U.S. of family members with newly legalized, permanent resident Mexicans. Evidence
of a transformation towards settlement is seen in increases in female migration and in the
migration of married Mexican men whose wives may subsequently join them in the U.S.
(Donato 1993; Davila and Mora 2001), and in increases in childbearing in the U.S.
(Jonsson and Rendall 2004). Alarcón et al (2008) argue that these trends towards family-
formation in the U.S. will increase the strength of Mexican immigrant’s residential ties to
the U.S., and will consequently increase the likelihood of their “waiting out” the
recession rather than returning to Mexico in large numbers.
18

Finally, return migration flows are produced by a combination of the size and
composition of Mexican-born immigrants in the U.S. and of their propensities to return to
Mexico. Among the immigrants with the highest return propensities are those making up
the seasonal, circular-migrant group. By definition, members of this group are always
recently-arrived. Our empirical analyses showed that both emigration and return
migration has remained at least partly seasonal through the recession period: Inflows are
greatest in the spring and summer, and outflows greatest in the winter. Our analyses also
showed large year-on-year declines in immigrant inflows continuing into the recession
years 2007 to 2009. These declines imply a smaller pool of seasonal immigrants to
contribute in turn to the total return flows especially in the winters of 2007/08 and
2008/09. Even in the absence of changes in propensities to return to Mexico after the
recession and global financial crisis, then, a reduction in return migration flows over
those of the pre-recession period would have been expected. Future work exploring the
impacts of the recession and financial crisis on return-migration propensities separately
from changes in the “risk” population of Mexican-born immigrants in the U.S. would be
a welcome next step.
REFERENCES
Alarcón, R., R. Cruz, A. Díaz-Bautista, G. González-König, A. Izquierdo, G. Yrizar, and
R. Zenteno. 2008. La Crisis Financiera en Estados Unidos y su Impacto en la
Migración Mexicana. [The U.S. Financial Crisis and its Impacto on Mexican
Migration.] Tijuana, Mexico: El Colegio de la Frontera Norte, December.
www.colef.mx/coyuntura/crisisfinanciera.pdf.
19

Bean, F.D., R. Corona, R. Tuirán, and K.A. Woodrow-Lafield (2001) Circular, invisible,
and ambiguous migrants: Components of difference in estimates of the number of
unauthorized Mexican migrants in the United States Demography 38(3):411-422.
Bustamante, J.A. 2009. Desde la Frontera Norte: Crecerá el retorno. [From the north
border: Increases in returns] Reforma, March 3.
www.reforma.com/editoriales/nacional/487/973110/default.shtm.
Camarota, S.A., and Karen Jensenius. 2009. “A Shifting Tide: Recent Trends in the
Illegal Immigrant Population, Backgrounder.” Washington, DC: Center for
Immigration Studies. www.cis.org/articles/2009/shiftingtide.pdf.
CONAPO. 2008. Encuesta Nacional de la Dinámica Demográfica 2006: Informe Final
[National Survey of Demographic Dynamics: Final Report]
conapo.gob.mx/encuesta/Enadid
CONAPO. 2009. Encuesta sobre Migración en la Frontera Norte de México (EMIF)
[Survey of Migration at the Northern Border of Mexico] www.conapo.gob.mx.
Davila, A., and M.T. Mora. 2001. The marital status of recent Mexican immigrants to the
U.S. International Migration Review 35(1):506-524.
Donato, K.M. 1993. Current trends and patterns of female migration: Evidence from
Mexico. International Immigration Review 27(4):748-771.
Dumont, J-C. and G. LeMaitre. 2005. “Counting Immigrants and Expatriates in OECD
Countries: A New Perspective” OECD Social, Employment and Migration
Working Paper 25. Available at www.oecd.org.
Durand, J., D.S. Massey, and E.A. Parrado. 1999. The new era of Mexican migration to
the United States. Journal of American History 86(2):518-536.
20

Durand, J., D.S. Massey, and R.M. Zenteno. 2001. Mexican immigration to the United
States: Continuities and changes. Latin American Research Review 36(1):107-
127.
Dustmann, C. 1996. Return migration: The European experience. Economic Policy
22:214-250.
Dustmann, C. 2003. Return migration, wage differentials, and the optimal migration
duration. European Economic Review 47:353-369.
Fassmann, H., and R. Munz (1992) Patterns and trends of international migration in
Western Europe Population and Development Review 18(3):457-480.
Federal Reserve Bank of Minneapolis. n.d. “The Recession in Perspective.”
http://www.minneapolisfed.org/publications_papers/studies/recession_perspective
/index.cfm (Accessed August 29, 2009).
Fix, M., D.G. Papademetriou, J. Batalova, A. Terrazas, S.Y. Lin and M. Mittelstadt.
2009. Migration and the Global Recession Migration Policy Institute.
Hill, K., and R. Wong. 2005. Mexico-U.S. migration: Views from both sides of the
border Population and Development Review 31(1):1-18.
Hoffman, A. 1974. Unwanted Mexican Americans in the Great Depression Repatriation
Pressures, 1929-1939. Tucson: University of Arizona Press.
Hollifield, J.F. 1994. “Immigration and Republicanism in France: The Hidden
Consensus.” Pp. 143–175 in Controlling Immigration: A Global Perspective,
edited by W. Cornelius, P.L. Martin, and J.F. Hollifield. Stanford, CA: Stanford
University Press.
21

INEGI [Instituto Nacional de Estasística y Geografía] 2003. Sintesis Metodológicos de la
Encuesta Nacional de la Dinamica Demografica www.inegi.gob.mx.
__________. 2005. Encuesta Nacional de Ocupacion y Empleo – Una nueva encuesta
para México. Aguascalientes, Mexico. www.inegi.gob.mx.
__________. 2008. Ejercicio Estadístico del Inegi Confirma el Descenso en la Salida de
Mexicanos al Extranjero. Aguascalientes, Mexico, November 20.
http://www.inegi.gob.mx/inegi/contenidos/espanol/prensa/Boletines/Boletin/Com
unicados/Especiales/2008/noviembre/comunica12.pdf.
__________. 2009a. Encuesta Nacional de la Dinámica Demográfica 2006 – Diseno
Muestral. Aguascalientes, Mexico, November.
__________. 2009b. Información Sobre el Flujo Migratorio Internacional de México.
Aguascalientes, Mexico, June 2.
http://www.inegi.gob.mx/inegi/contenidos/espanol/prensa/Boletines/Boletin/Com
unicados/Especiales/2009/junio/comunica1.pdf.
__________. 2009c. La Situación Económica Mundial Podría Afectar los Patrones de
Migración Internacional de Mexicanos. Aguascalientes, Mexico, February 27.
http://www.inegi.org.mx/inegi/contenidos/espanol/prensa/Boletines/Boletin/Com
unicados/Especiales/2009/Febrero/comunica17.pdf.
Jonsson, S.H., and M.S. Rendall. 2004. The fertility contribution of Mexican immigration
to the United States. Demography 41(1):129-150.
King, R. 1978. “Return Migration: A Neglected Aspect of Population Geography.” Area
175–182.
King, R. 1986. Return Migration and Regional Economic Problems. Routledge.
22

Lindstrom, D.P. 1996. Economic opportunity in Mexico and return migration from the
United States. Demography 33(3):357-374.
Los Angeles Times. 2009. “Immigrant Population in California Declines.” September 22,
2009.
Marcelli, E and W. Cornelius. 2001. The changing profile of Mexican migrants to the
US: New evidence from California and Mexico. Latin American Research Review
36(3):105-131.
Massey, D.S., J. Durand, and N.J. Malone. 2002. Beyond Smoke and Mirrors. New York:
Russell Sage Foundation.
Massey, D.S., and K.E. Espinosa. 1997. What’s driving Mexico-U.S. migration? A
theoretical, empirical, and policy analysis. The American Journal of Sociology
102:939-999.
Massey, D.S., and R. Zenteno. 2000. A Validation of the Ethnosurvey: The Case of
Mexico-U.S. Migration. International Migration Review 34, no. 3 (Autumn): 766-
793.
Passel, J.S., and D. Cohn. 2009. Mexican Immigrants: How Many Come? How Many
Leave? Washington, DC: Pew Hispanic Center, July 22.
http://pewhispanic.org/reports/report.php?ReportID=112.
Piore, M.J. 1979. Birds of Passage: Migrant Labor and Industrial Societies. Cambridge:
Cambridge University Press.
Plewa, P. 2009. “Spain’s Voluntary Return Program: Early Mechanisms and Early
Responses.” www.age-of-migration.com/na/financialcrisis/updates/1i.pdf.
23
Portes, Alejandro, and Robert L. Bach. 1985. Latin Journey. Berkeley & Los Angeles:
University of California Press.
Rendall, M.S., E. Aguila, R. Basurto-Dávila, and M.S. Handcock. 2009. Migration
between Mexico and the U.S. estimated from a border survey. Paper presented at
the annual meeting of the Population Association of America. April 2009.
Reyes, B.I. 2001. Immigrant Trip Duration: The Case of Immigrants from Western
Mexico. International Migration Review 35 (4):1185-1204.
Reyes, B.I. 2004. Changes in trip duration for Mexican immigrants to the United States.
Population Research and Policy Review 23(3):235-257.
United Nations. 2002. “Measuring international migration: Many questions, few
answers,” in International Migration Report 2002 New York: United Nations.
24

Figure 1 Quarterly emigration from and immigration to Mexico, 2006 to 2009
0
50,000
100,000
150,000
200,000
250,000
300,000
350,000
400,000
450,000
1stquarter2006
2ndquarter2006
3rdquarter2006
4thquarter2006
1stquarter2007
2ndquarter2007
3rdquarter2007
4thquarter2007
1stquarter2008
2ndquarter2008
3rdquarter2008
4thquarter2008
1stquarter2009
2ndquarter2009
All
Mex
ican
-bor
n m
igra
nts
Immigrants
Emigrants
95% CI

ENADID Return
Migrants2
ENOE Return Migrants
(ENADID-equivalent definition)3
Return Migrants, including
re-emigrants4
All ages, both genders 299,488 360,431 * 406,367 [1.92]
Men 225,842 294,015 ** 335,093 [2.54]
Women 73,646 66,473 71,330 [-0.57]
18-40 year olds 190,647 236,162 ** 248,397 [2.02]
Unweighted return migrants, all ages, both genders 517 648 729
Notes:1. "2005/06" is defined as the 3rd quarter of 2005 to the 2nd quarter of 2006 in the ENOE, and as May 2005 to April 2006 in the ENADID.
Source: Authors' calculations from the ENOE and the ENADID
Table 1 Return migration to Mexico compared between the National Survey of Demographic Dynamics (ENADID) and the National Survey of Occupation and Employment (ENOE), 2005/061
2. ENADID Return Migrants are Mexican-born individuals who returned in the last 12 months and who are still present in the household at survey date in April/May 2006. Numbers in square brackets are Z scores for tests of difference from the ENADID. Asterisks indicate significantly different from ENADID at levels: * p<.10, ** p<.05, *** p<.01.
4. The estimate here differs from the full-sample ENOE estimates of Table 2 due to its being estimated from a sample consisting only of households whose interview number (rotation group) makes them eligible for interview up to the 2nd quarter of 2006. The estimate is scaled up to adjust for the omitted rotation groups to construct an unbiased estimator of the total return migrants in 2005/06.
3. ENOE sample consists of households whose interview number makes them eligible for interview up to the 2nd quarter of 2006. Return Migrants (ENADID equivalent) exclude those return migrants in the 3rd or 4th quarter of 2005 or 1st quarter of 2006 who emigrated again by the 2nd quarter of 2006.

Annual return migrants Total Male Female
Age 18-40, less than college
education
Total return
migrants, unweighted
2005/06 418,680 * 344,121 ** 74,559 283,330 ** 1,226 [-1.93] [-2.30] [-0.05] [-2.21]
2006/07 427,140 ** 348,726 ** 78,414 285,546 ** 1,192 [-2.24] [-2.51] [-0.36] [-2.36]
2007/08 401,324 324,245 77,079 255,440 1,212 [-1.38] [-1.57] [-0.26] [-1.05]
2008/09 362,748 288,789 73,959 234,830 1,066
Significantly different from 2008/09: * p < .10, ** p < .05, *** p < .01
Quarterly return migrants 1st quarter 2nd quarter 3rd quarter 4th quarter2005 119,574 75,254 86,935 117,719
[-0.60] [0.16] [-0.53] [-1.53]2006 132,441 81,585 103,628 * 117,120
[-1.44] [-0.29] [-1.74] [-1.44]2007 127,024 79,369 75,156 133,490 **
[-1.13] [-0.14] [0.43] [-2.34]2008 107,165 85,513 79,999 95,238
[0.21] [-0.57]2009 110,078 77,434
Significantly different from latest quarter (2008 or 2009): * p < .10, ** p < .05, *** p < .01
Table 2 Annual and Quarterly Return Migration from the U.S. to Mexico, 2005 to 2009, National Survey of Occupation and Employment (ENOE)1

Notes:
Source: Authors' calculations from the Mexican National Survey of Occupation and Employment (ENOE)
1. Return Migrants are defined as Mexican-born individuals who returned from abroad between quarters to a household in the ENOE. Annual return migration sums over the 3rd quarter of the first year to the second quarter (inclusive) of the following year. Numbers in square brackets are Z scores for tests of difference from the year 2008/09 or from the latest quarter.
2. Statistical tests of difference account for stratification by state and for clustering in primary sampling units, and assume independence between time periods.
Related Documents