Submitted Manuscript: Confidential 1 Decline of the North American Avifauna Authors: Kenneth V. Rosenberg 1,2* , Adriaan M. Dokter 1 , Peter J. Blancher 3 , John R. Sauer 4 , Adam C. Smith 5 , Paul A. Smith 3 , Jessica C. Stanton 6 , Arvind Panjabi 7 , Laura Helft 1 , Michael Parr 2 , Peter P. Marra 8,9 5 Affiliations: 1 Cornell Laboratory of Ornithology, Cornell University, Ithaca, NY 14850, USA. 2 American Bird Conservancy, Washington, DC 20008, USA. 3 National Wildlife Research Centre, Environment and Climate Change Canada, Ottawa, ON K1A 0H3, Canada. 10 4 Patuxent Wildlife Research Center, United States Geological Survey, Laurel, MD 20708-4017, USA. 5 Canadian Wildlife Service, Environment and Climate Change Canada, Ottawa, ON K1A 0H3, Canada. 6 Upper Midwest Environmental Sciences Center, United States Geological Survey, La Crosse, 15 WI, USA. 7 Bird Conservancy of the Rockies, Fort Collins, CO 80521, USA. 8 Migratory Bird Center, Smithsonian Conservation Biology Institute, National Zoological Park, PO Box 37012 MRC 5503, Washington, DC 20013-7012, USA. 9 Current Address: Department of Biology and McCourt School of Public Policy, Georgetown 20 University, 37th and O Streets NW, Washington, DC 20057, USA *Correspondence to: [email protected] Abstract: Species extinctions have defined the global biodiversity crisis, but extinction begins 25 with loss in abundance of individuals that can result in compositional and functional changes of ecosystems. Using multiple and independent monitoring networks, we report population losses across much of the North American avifauna over 48 years, including once common species and from most biomes. Integration of range-wide population trajectories and size estimates indicates a net loss approaching 3 billion birds, or 29% of 1970 abundance. A continent-wide weather 30 radar network also reveals a similarly steep decline in biomass passage of migrating birds over a recent 10-year period. This loss of bird abundance signals an urgent need to address threats to avert future avifaunal collapse and associated loss of ecosystem integrity, function and services. One Sentence Summary: Cumulative loss of nearly three billion birds since 1970, across most 35 North American biomes, signals a pervasive and ongoing avifaunal crisis.

Welcome message from author
This document is posted to help you gain knowledge. Please leave a comment to let me know what you think about it! Share it to your friends and learn new things together.
Transcript

Submitted Manuscript: Confidential
1
Decline of the North American Avifauna
Authors: Kenneth V. Rosenberg1,2*, Adriaan M. Dokter1, Peter J. Blancher3, John R. Sauer4, Adam C. Smith5, Paul A. Smith3, Jessica C. Stanton6, Arvind Panjabi7, Laura Helft1, Michael
Parr2, Peter P. Marra8,9 5
Affiliations:
1Cornell Laboratory of Ornithology, Cornell University, Ithaca, NY 14850, USA. 2American Bird Conservancy, Washington, DC 20008, USA. 3 National Wildlife Research Centre, Environment and Climate Change Canada, Ottawa, ON K1A 0H3, Canada. 10 4Patuxent Wildlife Research Center, United States Geological Survey, Laurel, MD 20708-4017, USA. 5Canadian Wildlife Service, Environment and Climate Change Canada, Ottawa, ON K1A 0H3, Canada. 6Upper Midwest Environmental Sciences Center, United States Geological Survey, La Crosse, 15 WI, USA. 7Bird Conservancy of the Rockies, Fort Collins, CO 80521, USA. 8Migratory Bird Center, Smithsonian Conservation Biology Institute, National Zoological Park, PO Box 37012 MRC 5503, Washington, DC 20013-7012, USA. 9Current Address: Department of Biology and McCourt School of Public Policy, Georgetown 20 University, 37th and O Streets NW, Washington, DC 20057, USA *Correspondence to: [email protected]
Abstract: Species extinctions have defined the global biodiversity crisis, but extinction begins 25 with loss in abundance of individuals that can result in compositional and functional changes of ecosystems. Using multiple and independent monitoring networks, we report population losses across much of the North American avifauna over 48 years, including once common species and from most biomes. Integration of range-wide population trajectories and size estimates indicates a net loss approaching 3 billion birds, or 29% of 1970 abundance. A continent-wide weather 30 radar network also reveals a similarly steep decline in biomass passage of migrating birds over a recent 10-year period. This loss of bird abundance signals an urgent need to address threats to avert future avifaunal collapse and associated loss of ecosystem integrity, function and services. One Sentence Summary: Cumulative loss of nearly three billion birds since 1970, across most 35 North American biomes, signals a pervasive and ongoing avifaunal crisis.

Submitted Manuscript: Confidential
2
Main Text:
Slowing the loss of biodiversity is one of the defining environmental challenges of the 21st century (1–5). Habitat loss, climate change, unregulated harvest, and other forms of human-caused mortality (6, 7) have contributed to a thousand-fold increase in global extinctions in the 5 Anthropocene compared to the presumed prehuman background rate, with profound effects on ecosystem functioning and services (8). The overwhelming focus on species extinctions, however, has underestimated the extent and consequences of biotic change, by ignoring the loss of abundance within still-common species and in aggregate across large species assemblages (2, 9). Declines in abundance can degrade ecosystem integrity, reducing vital ecological, 10 evolutionary, economic, and social services that organisms provide to their environment (8, 10–15). Given the current pace of global environmental change, quantifying change in species abundances is essential to assess ecosystem impacts. Evaluating the magnitude of declines requires effective long-term monitoring of population sizes and trends, data which are rarely available for most taxa. 15
Birds are excellent indicators of environmental health and ecosystem integrity (16, 17), and our ability to monitor many species over vast spatial scales far exceeds that of any other animal group. We evaluated population change for 529 species of birds in the continental United States and Canada (76% of breeding species), drawing from multiple standardized bird-monitoring datasets, some of which provide close to fifty years of population data. We integrated range-wide 20 estimates of population size and 48-year population trajectories, along with their associated uncertainty, to quantify net change in numbers of birds across the avifauna over recent decades (18). We xalso used a network 143 weather radars (NEXRAD) across the contiguous U.S. to estimate long-term changes in nocturnal migratory passage of avian biomass through the airspace in spring from 2007 to 2017. The continuous operation and broad coverage of NEXRAD provide 25 an automated and standardised monitoring tool with unrivaled temporal and spatial extent (19). Radar measures cumulative passage across all nocturnally migrating species, many of which breed in areas north of the contiguous U.S. that are poorly monitored by avian surveys. Radar thus expands the area and the proportion of the migratory avifauna that is sampled relative to ground surveys. 30
Results from long-term surveys, accounting for both increasing and declining species, reveal a net loss in total abundance of 2.9 billion (95% CI = 2.7-3.1 billion) birds across almost all biomes, a reduction of 29% (95% CI = 27-30%) since 1970 (Figure 1; Table 1). Analysis of NEXRAD data indicate a similarly steep decline in nocturnal passage of migratory biomass, a reduction of 13.6 ± 9.1% since 2007 (Figure 2A). Reduction in biomass passage occurred across 35 the eastern U.S. (Figure 2 C,D), where migration is dominated by large numbers of temperate- and boreal-breeding songbirds; we observed no consistent trend in the Central or Pacific flyway regions (Figure 2B,C,D, Table S5). Two completely different and independent monitoring techniques thus signal major population loss across the continental avifauna. Species exhibiting declines (57%, 303/529) based on long-term survey data span diverse 40 ecological and taxonomic groups. Across breeding biomes, grassland birds showed the largest magnitude of total population loss since 1970—more than 700 million breeding individuals across 31 species— and the largest proportional loss (53%); 74% of grassland species are declining. (Figure 1; Table 1). All forest biomes experienced large avian loss, with a cumulative reduction of more than 1 billion birds. Wetland birds represent the only biome to show an overall 45

Submitted Manuscript: Confidential
3
net gain in numbers (13%), led by a 56% increase in waterfowl populations (Figure 3, Table 1). Surprisingly, we also found a large net loss (63%) across 10 introduced species (Figure 3D,E, Table 1). A total of 419 native migratory species experienced a net loss of 2.5 billion individuals, whereas 100 native resident species showed a small net increase (26 million). Species overwintering in 5 temperate regions experienced the largest net reduction in abundance (1.4 billion), but proportional loss was greatest among species overwintering in coastal regions (42%), southwestern aridlands (42%), and South America (40%) (Table 1; Figure S1). Shorebirds, most of which migrate long distances to winter along coasts throughout the hemisphere, are experiencing consistent, steep population loss (37%). 10
More than 90% of the total cumulative loss can be attributed to 12 bird families (Figure 3A), including sparrows, warblers, blackbirds, and finches. Of 67 bird families surveyed, 38 showed a net loss in total abundance, whereas 29 showed gains (Figure 3B), indicating recent changes in avifaunal composition (Table S2). While not optimized for species-level analysis, our model indicates 19 widespread and abundant landbirds (including 2 introduced species) each 15 experienced population reductions of >50 million birds (Data S1). Abundant species also contribute strongly to the migratory passage detected by radar (19), and radar-derived trends provide a fully independent estimate of widespread declines of migratory birds. Our study documents a long-developing but overlooked biodiversity crisis in North America—the cumulative loss of nearly 3 billion birds across the avifauna. Population loss is not restricted 20 to rare and threatened species, but includes many widespread and common species that may be disproportionately influential components of food webs and ecosystem function. Furthermore, losses among habitat generalists and even introduced species indicate that declining species are not replaced by species that fare well in human-altered landscapes. Increases among waterfowl and a few other groups (e.g. raptors recovering after the banning of DDT) are insufficient to 25 offset large losses among abundant species (Figure 3). Importantly, our population loss estimates are conservative since we estimated loss only in breeding populations. The total loss and impact on communities and ecosystems could be even higher outside the breeding season if we consider the amplifying effect of “missing” reproductive output from these lost breeders. Extinction of the Passenger Pigeon (Ectopistes migratorius), once likely the most numerous bird 30 on the planet, provides a poignant reminder that even abundant species can go extinct rapidly. Systematic monitoring and attention paid to population declines could have alerted society to its pending extinction (20). Today, monitoring data suggest that avian declines will likely continue without targeted conservation action, triggering additional endangered species listings at tremendous financial and social cost. Moreover, because birds provide numerous benefits to 35 ecosystems (e.g., seed dispersal, pollination, pest control) and economies (47 million people spend 9.3 billion U.S. dollars per year through bird-related activities in the U.S. (21)), their population reductions and possible extinctions will have severe direct and indirect consequences (10, 22). Population declines can be reversed, as evidenced by the remarkable recovery of waterfowl populations under adaptive harvest management (23) and the associated allocation of 40 billions of dollars devoted to wetland protection and restoration, providing a model for proactive conservation in other widespread native habitats such as grasslands.

Submitted Manuscript: Confidential
4
Steep declines in North American birds parallel patterns of avian declines emerging globally (14, 15, 22, 24). In particular, depletion of native grassland bird populations in North America, driven by habitat loss and more toxic pesticide use in both breeding and wintering areas (25), mirrors loss of farmland birds throughout Europe and elsewhere (15). Even declines among introduced species match similar declines within these same species’ native ranges (26). Agricultural 5 intensification and urbanization have been similarly linked to declines in insect diversity and biomass (27), with cascading impacts on birds and other consumers (24, 28, 29). Given that birds are one of the best monitored animal groups, birds may also represent the tip of the iceberg, indicating similar or greater losses in other taxonomic groups (28, 30). Pervasiveness of avian loss across biomes and bird families suggests multiple and interacting 10 threats. Isolating spatio-temporal limiting factors for individual species and populations will require additional study, however, since migratory species with complex life histories are in contact with many threats throughout their annual cycles. A focus on breeding season biology hampers our ability to understand how seasonal interactions drive population change (31), although recent continent-wide analyses affirm the importance of events during the non-breeding 15 season (19, 32). Targeted research to identify limiting factors must be coupled with effective policies and societal change that emphasize reducing threats to breeding and non-breeding habitats and minimizing avoidable anthropogenic mortality year-round. Endangered species legislation and international treaties, such as the 1916 Migratory Bird Treaty between Canada and the United States, have prevented extinctions and promoted recovery of once-depleted bird 20 species. History shows that conservation action and legislation works. Our results signal an urgent need to address the ongoing threats of habitat loss, agricultural intensification, coastal disturbance, and direct anthropogenic mortality, all exacerbated by climate change, to avert continued biodiversity loss and potential collapse of the continental avifauna. 25
References and Notes:
1. M. C. Urban, Accelerating extinction risk from climate change. Science. 348, 571–573 (2015).
2. R. Dirzo, H. S. Young, M. Galetti, G. Ceballos, N. J. B. Isaac, B. Collen, Defaunation in the Anthropocene. Science. 345, 401–406 (2014).
3. S. L. Pimm, C. N. Jenkins, R. Abell, T. M. Brooks, J. L. Gittleman, L. N. Joppa, P. H. Raven, C. M. Roberts, J. 30 O. Sexton, The biodiversity of species and their rates of extinction, distribution, and protection. Science. 344, 1246752–1246752 (2014).
4. A. D. Barnosky, N. Matzke, S. Tomiya, G. O. U. Wogan, B. Swartz, T. B. Quental, C. Marshall, J. L. McGuire, E. L. Lindsey, K. C. Maguire, B. Mersey, E. A. Ferrer, Has the Earth’s sixth mass extinction already arrived? Nature. 471, 51–57 (2011). 35
5. W. Steffen, P. J. Crutzen, J. R. McNeill, The Anthropocene: Are Humans Now Overwhelming the Great Forces of Nature. AMBIO: A Journal of the Human Environment. 36, 614–621 (2007).
6. S. R. Loss, T. Will, P. P. Marra, Direct Mortality of Birds from Anthropogenic Causes. Annual Review of
Ecology, Evolution, and Systematics. 46, 99–120 (2015).
7. A. M. Calvert, C. A. Bishop, R. D. Elliot, E. A. Krebs, T. M. Kydd, C. S. Machtans, G. J. Robertson, A 40 Synthesis of Human-related Avian Mortality in Canada. Avian Conservation and Ecology. 8 (2013), doi:10.5751/ACE-00581-080211.

Submitted Manuscript: Confidential
5
8. D. U. Hooper, E. C. Adair, B. J. Cardinale, J. E. K. Byrnes, B. A. Hungate, K. L. Matulich, A. Gonzalez, J. E. Duffy, L. Gamfeldt, M. I. O’Connor, A global synthesis reveals biodiversity loss as a major driver of ecosystem change. Nature. 486, 105 (2012).
9. G. Ceballos, P. R. Ehrlich, R. Dirzo, Biological annihilation via the ongoing sixth mass extinction signaled by vertebrate population losses and declines. Proceedings of the National Academy of Sciences, 201704949 5 (2017).
10. C. J. Whelan, Ç. H. Şekercioğlu, D. G. Wenny, Why birds matter: from economic ornithology to ecosystem services. Journal of Ornithology. 156, 227–238 (2015).
11. M. Galetti, R. Guevara, M. C. Cortes, R. Fadini, S. Von Matter, A. B. Leite, F. Labecca, T. Ribeiro, C. S. Carvalho, R. G. Collevatti, M. M. Pires, P. R. Guimaraes, P. H. Brancalion, M. C. Ribeiro, P. Jordano, 10 Functional Extinction of Birds Drives Rapid Evolutionary Changes in Seed Size. Science. 340, 1086–1090 (2013).
12. G. C. Daily, Ed., Nature’s services: societal dependence on natural ecosystems (Island Press, Washington, DC, 1997).
13. S. Bauer, B. J. Hoye, Migratory Animals Couple Biodiversity and Ecosystem Functioning Worldwide. Science. 15 344, 1242552–1242552 (2014).
14. K. Gaston, R. Fuller, Commonness, population depletion and conservation biology. Trends in Ecology &
Evolution. 23, 14–19 (2008).
15. R. Inger, R. Gregory, J. P. Duffy, I. Stott, P. Voříšek, K. J. Gaston, Common European birds are declining rapidly while less abundant species’ numbers are rising. Ecology Letters. 18, 28–36 (2015). 20
16. M. L. Morrison, in Current Ornithology, R. F. Johnston, Ed. (Springer US, Boston, MA, 1986; http://link.springer.com/10.1007/978-1-4615-6784-4_10), pp. 429–451.
17. J. Burger, M. Gochfeld, Marine Birds as Sentinels of Environmental Pollution. EcoHealth. 1 (2004), doi:10.1007/s10393-004-0096-4.
18. Supplemental Materials. 25
19. A. M. Dokter, A. Farnsworth, D. Fink, V. Ruiz-Gutierrez, W. M. Hochachka, F. A. La Sorte, O. J. Robinson, K. V. Rosenberg, S. Kelling, Seasonal abundance and survival of North America’s migratory avifauna determined by weather radar. Nature Ecology & Evolution. 2, 1603–1609 (2018).
20. J. C. Stanton, Present-day risk assessment would have predicted the extinction of the passenger pigeon (Ectopistes migratorius). Biological Conservation. 180, 11–20 (2014). 30
21. U.S. Department of the Interior, U.S. Fish and Wildlife Service, and U.S. Department of Commerce, U.S. Census Bureau, “National Survey of Fishing, Hunting, and Wildlife-Associated Recreation.” (2016).
22. C. H. Sekercioglu, G. C. Daily, P. R. Ehrlich, Ecosystem consequences of bird declines. Proceedings of the
National Academy of Sciences. 101, 18042–18047 (2004).
23. J. D. Nichols, M. C. Runge, F. A. Johnson, B. K. Williams, Adaptive harvest management of North American 35 waterfowl populations: a brief history and future prospects. Journal of Ornithology. 148, 343–349 (2007).
24. C. A. Hallmann, R. P. B. Foppen, C. A. M. van Turnhout, H. de Kroon, E. Jongejans, Declines in insectivorous birds are associated with high neonicotinoid concentrations. Nature. 511, 341–343 (2014).

Submitted Manuscript: Confidential
6
25. R. L. Stanton, C. A. Morrissey, R. G. Clark, Analysis of trends and agricultural drivers of farmland bird declines in North America: A review. Agriculture, Ecosystems & Environment. 254, 244–254 (2018).
26. J. De Laet, J. D. Summers-Smith, The status of the urban house sparrow Passer domesticus in north-western Europe: a review. Journal of Ornithology. 148, 275–278 (2007).
27. F. Sánchez-Bayo, K. A. G. Wyckhuys, Worldwide decline of the entomofauna: A review of its drivers. 5 Biological Conservation. 232, 8–27 (2019).
28. B. C. Lister, A. Garcia, Climate-driven declines in arthropod abundance restructure a rainforest food web. Proceedings of the National Academy of Sciences, 201722477 (2018).
29. D. L. Narango, D. W. Tallamy, P. P. Marra, Nonnative plants reduce population growth of an insectivorous bird. Proceedings of the National Academy of Sciences, 201809259 (2018). 10
30. R. E. A. Almond, M. Grooten, “Living Planet Report - 2018: Aiming Higher” (WWF, Gland, Switzerland, 2018).
31. P. P. Marra, E. B. Cohen, S. R. Loss, J. E. Rutter, C. M. Tonra, A call for full annual cycle research in animal ecology. Biology Letters. 11, 20150552 (2015).
32. F. A. La Sorte, D. Fink, P. J. Blancher, A. D. Rodewald, V. Ruiz-Gutierrez, K. V. Rosenberg, W. M. 15 Hochachka, P. H. Verburg, S. Kelling, Global change and the distributional dynamics of migratory bird populations wintering in Central America. Global Change Biology. 23, 5284–5296 (2017).
33. J. R. Sauer, W. A. Link, J. E. Fallon, K. L. Pardieck, D. J. Ziolkowski, The North American Breeding Bird Survey 1966–2011: Summary Analysis and Species Accounts. North American Fauna. 79, 1–32 (2013).
34. K. V. Rosenberg, P. J. Blancher, J. C. Stanton, A. O. Panjabi, Use of North American Breeding Bird Survey 20 data in avian conservation assessments. The Condor. 119, 594–606 (2017).
35. J. C. Stanton, P. J. Blancher, K. V. Rosenberg, A. O. Panjabi, W. E. Thogmartin, Estimating uncertainty of North American landbird population sizes. Avian Conservation and Ecology. in press (2019).
36. North American Bird Conservation Initiative, The state of Canada’s birds, 2012. Environment Canada, Ottawa,
ON (2012) (available at http://www.stateofcanadasbirds.org/). 25
37. North American Bird Conservation Initiative, U.S. Committee, “The State of the Birds, United States of America” (U.S. Department of Interior, Washington, DC, 2009).
38. B. Collen, J. Loh, S. Whitmee, L. McRAE, R. Amin, J. E. Baillie, Monitoring change in vertebrate abundance: the Living Planet Index. Conservation Biology. 23, 317–327 (2009).
39. S. N. Wood, Generalized additive models: an introduction with R (Chapman and Hall/CRC, 2017). 30
40. W. A. Link, J. R. Sauer, Bayesian Cross-Validation for Model Evaluation and Selection, with Application to the North American Breeding Survey. Ecology, 15-1286.1 (2015).
41. K. Rosenberg, J. Kennedy, R. Dettmers, R. Ford, D. Reynolds, J. Alexander, C. Beardmore, P. Blancher, R. Bogart, G. Butcher, Partners in flight landbird conservation plan: 2016 revision for Canada and continental United States. Partners in Flight Science Committee (2016). 35
42. T. Rich, C. Beardmore, H. Berlanga, P. Blancher, M. Bradstreet, G. Butcher, D. Demarest, E. Dunn, W. Hunter, E. Iñigo-Elias, Partners in Flight North American landbird conservation plan. Ithaca, NY: Cornell Lab of Ornithology (2004).

Submitted Manuscript: Confidential
7
43. S. Brown, C. Hickey, B. Gill, L. Gorman, C. Gratto-Trevor, S. Haig, B. Harrington, C. Hunter, G. Morrison, G. Page, National shorebird conservation assessment: Shorebird conservation status, conservation units, population estimates, population targets, and species prioritization. Manomet Center for Conservation Sciences,
Manomet, MA (2000).
44. J. A. Kushlan, M. J. Steinkamp, K. C. Parsons, J. Capp, M. A. Cruz, M. Coulter, I. Davidson, L. Dickson, N. 5 Edelson, R. Elliot, Waterbird conservation for the Americas: the North American waterbird conservation plan, version 1 (2002).
45. North American Bird Conservation Initiative, The State of North America’s Birds 2016. Environment and
Climate Change Canada: Ottawa, Ontario (2016) (available at http://www.stateofthebirds.org/2016/).
46. Partners in Flight, Avian Conservation Assessment Database, version 2017. Available at 10 http://pif.birdconservancy.org/ACAD. Accessed on Nov 5 2018.
47. J. R. Sauer, W. A. Link, Analysis of the North American Breeding Bird Survey Using Hierarchical Models. The
Auk. 128, 87–98 (2011).
48. J. R. Sauer, D. K. Niven, K. L. Pardieck, D. J. Ziolkowski, W. A. Link, Expanding the North American Breeding Bird Survey Analysis to Include Additional Species and Regions. Journal of Fish and Wildlife 15 Management. 8, 154–172 (2017).
49. J. R. Sauer, K. L. Pardieck, D. J. Ziolkowski, A. C. Smith, M.-A. R. Hudson, V. Rodriguez, H. Berlanga, D. K. Niven, W. A. Link, The first 50 years of the North American Breeding Bird Survey. The Condor. 119, 576–593 (2017).
50. J. A. Veech, K. L. Pardieck, D. J. Ziolkowski, How well do route survey areas represent landscapes at larger 20 spatial extents? An analysis of land cover composition along Breeding Bird Survey routes. The Condor. 119, 607–615 (2017).
51. M. F. Delany, R. A. Kiltie, R. S. Butryn, Land cover along breeding bird survey routes in Florida. Florida Field
Naturalist. 42, 15–28 (2014).
52. J. A. Veech, M. F. Small, J. T. Baccus, Representativeness of land cover composition along routes of the North 25 American Breeding Bird Survey. The Auk. 129, 259–267 (2012).
53. C. M. E. Keller, J. T. Scallan, Potential Roadside Biases Due to Habitat Changes along Breeding Bird Survey Routes. The Condor. 101, 50–57 (1999).
54. J. B. C. Harris, D. G. Haskell, Land Cover Sampling Biases Associated with Roadside Bird Surveys. Avian
Conservation and Ecology. 2 (2007), doi:10.5751/ACE-00201-020212. 30
55. S. L. Van Wilgenburg, E. M. Beck, B. Obermayer, T. Joyce, B. Weddle, Biased representation of disturbance rates in the roadside sampling frame in boreal forests: implications for monitoring design. Avian Conservation
and Ecology. 10 (2015), doi:10.5751/ACE-00777-100205.
56. M. G. Betts, D. Mitchell, A. W. Diamond, J. Bêty, Uneven Rates of Landscape Change as a Source of Bias in Roadside Wildlife Surveys. Journal of Wildlife Management. 71, 2266 (2007). 35
57. C. U. Soykan, J. Sauer, J. G. Schuetz, G. S. LeBaron, K. Dale, G. M. Langham, Population trends for North American winter birds based on hierarchical models. Ecosphere. 7, e01351 (2016).
58. J. Bart, S. Brown, B. Harrington, R. I. Guy Morrison, Survey trends of North American shorebirds: population declines or shifting distributions? Journal of Avian Biology. 38, 73–82 (2007).
Submitted Manuscript: Confidential
8
59. R. K. Ross, P. A. Smith, B. Campbell, C. A. Friis, R. G. Morrison, Population trends of shorebirds in southern Ontario, 1974-2009. Waterbirds, 15–24 (2012).
60. M. E. Seamans, R.D. Rau, “American woodcock population status, 2017” (U.S. Fish and Wildlife Service, Laurel, Maryland, 2017), (available at https://www.fws.gov/birds/surveys-and-data/reports-and-publications/population-status.php). 5
61. U.S. Fish and Wildlife Service, “Waterfowl population status, 2017” (U.S. Department of the Interior, Washington, D.C. USA, 2017), (available at https://www.fws.gov/birds/surveys-and-data/reports-and-publications.php).
62. Anthony D Fox, James O Leafloor, “A global audit of the status and trends of Arctic and Northern Hemisphere goose populations” (Conservation of Arctic Flora and Fauna International Secretariat, Akureyri, Iceland, 2018). 10
63. D. J. Groves, “The 2015 North American Trumpeter Swan Survey” (U.S. Fish and Wildlife Service, Juneau Alaska, 2017), (available at https://www.fws.gov/birds/surveys-and-data/reports-and-publications.php).
64. K. V. Rosenberg, P. J. Blancher, in Bird Conservation Implementation and Integration in the Americas:
Proceedings of the Third International Partners in Flight Conference 2002 (C.J. Ralph and T.D. Rich, eds.)
PSW-GTR-191 (U.S.D.A. Forest Service, Albany, CA, 2005), vol. 191, pp. 57–67. 15
65. P. Blancher, K. Rosenberg, A. Panjabi, B. Altman, J. Bart, C. Beardmore, G. Butcher, D. Demarest, R. Dettmers, E. Dunn, Guide to the Partners in Flight Population Estimates Database. Version: North American Landbird Conservation Plan 2004. Partners in Flight Technical Series No 5. US Geological Survey Patuxent
Wildlife Research Center, Laurel, Md (2007) (available at https://www.partnersinflight.org/resources/pif-tech-series/). 20
66. P. J. Blancher, K. V. Rosenberg, A. O. Panjabi, B. Altman, A. R. Couturier, W. E. Thogmartin, Handbook to the partners in flight population estimates database, version 2.0. PIF Technical Series (2013) (available at http://pif.birdconservancy.org/PopEstimates/).
67. W. E. Thogmartin, F. P. Howe, F. C. James, D. H. Johnson, E. T. Reed, J. R. Sauer, F. R. Thompson, A review of the population estimation approach of the North American Landbird Conservation Plan. The Auk. 123, 892 25 (2006).
68. Sea Duck Joint Venture, “Recommendations for Monitoring Distribution, Abundance, and Trends for North American Sea Ducks” (U.S. Fish and Wildlife Service, Anchorage, Alaska and Canadian Wildlife Service, Sackville, New Brunswick, 2007), (available at http://seaduckjv.org).
69. B. A. Andres, P. A. Smith, R. G. Morrison, C. L. Gratto-Trevor, S. C. Brown, C. A. Friis, Population estimates 30 of North American shorebirds, 2012. Wader Study Group Bull. 119, 178–194 (2012).
70. U.S. Shorebird Conservation Partnership, “Shorebird Flyway Population Database (Accessed: 28 Feb 2018)” (2016), (available at https://www.shorebirdplan.org/science/assessment-conservation-status-shorebirds/).
71. P. G. Rodewald (Editor), The Birds of North America (Cornell Laboratory of Ornithology, Ithaca, NY, USA, 2018; https://birdsna.org). 35
72. A. O. Panjabi, P. J. Blancher, W. E. Easton, J. C. Stanton, D. W. Demarest, R. Dettmers, K. V. Rosenberg, Partners in Flight Science Committee, “The Partners in Flight handbook on species assessment Version 2017,” Partners in Flight Technical Series No. 3. Bird Conservancy of the Rockies (Partners in Flight, 2017).
73. Wetlands International, Waterbird Population Estimates (2018), (available at wpe.wetlands.org).

Submitted Manuscript: Confidential
9
74. S. Bauer, J. W. Chapman, D. R. Reynolds, J. A. Alves, A. M. Dokter, M. M. H. Menz, N. Sapir, M. Ciach, L. B. Pettersson, J. F. Kelly, H. Leijnse, J. Shamoun-Baranes, From Agricultural Benefits to Aviation Safety: Realizing the Potential of Continent-Wide Radar Networks. BioScience. 67, 912–918 (2017).
75. T. D. Crum, R. L. Alberty, The WSR-88D and the WSR-88D Operational Support Facility. Bulletin of the
American Meteorological Society. 74, 1669–1687 (1993). 5
76. A. M. Dokter, F. Liechti, H. Stark, L. Delobbe, P. Tabary, I. Holleman, Bird migration flight altitudes studied by a network of operational weather radars. Journal of The Royal Society Interface. 8, 30–43 (2011).
77. K. G. Horton, B. M. Van Doren, F. A. La Sorte, E. B. Cohen, H. L. Clipp, J. J. Buler, D. Fink, J. F. Kelly, A. Farnsworth, Holding steady: Little change in intensity or timing of bird migration over the Gulf of Mexico. Global Change Biology (2019), doi:10.1111/gcb.14540. 10
78. S. Ansari, S. Del Greco, E. Kearns, O. Brown, S. Wilkins, M. Ramamurthy, J. Weber, R. May, J. Sundwall, J. Layton, A. Gold, A. Pasch, V. Lakshmanan, Unlocking the Potential of NEXRAD Data through NOAA’s Big Data Partnership. Bulletin of the American Meteorological Society. 99, 189–204 (2018).
79. A. D. Siggia, R. E. Passarelli, in Proc. ERAD (2004), vol. 2, pp. 421–424.
80. J. N. Chrisman, C. A. Ray, in 32nd Conference on Radar Meteorology (2005). 15
81. R. L. Ice, R. D. Rhoton, D. S. Saxion, C. A. Ray, N. K. Patel, D. A. Warde, A. D. Free, O. E. Boydstun, D. S. Berkowitz, J. N. Chrisman, J. C. Hubbert, C. Kessinger, M. Dixon, S. Torres, in 23rd International Conference
on Interactive Information Processing Systems for Meteorology, Oceanography, and Hydrology (2007).
82. P. M. Stepanian, K. G. Horton, V. M. Melnikov, D. S. Zrnić, S. A. Gauthreaux, Dual-polarization radar products for biological applications. Ecosphere. 7, e01539 (2016). 20
83. A. M. Dokter, P. Desmet, J. H. Spaaks, S. van Hoey, L. Veen, L. Verlinden, C. Nilsson, G. Haase, H. Leijnse, A. Farnsworth, W. Bouten, J. Shamoun-Baranes, bioRad: biological analysis and visualization of weather radar data. Ecography (2018), doi:10.1111/ecog.04028.
84. A. M. Dokter, adokter/vol2bird: vol2bird (Version 0.4.0). Zenodo. (2019), (available at http://doi.org/10.5281/zenodo.3369999). 25
85. A. M. Dokter, S. Van Hoey, P. Desmet, adokter/bioRad: bioRad (Version 0.4.0). Zenodo. (2019), (available at http://doi.org/10.5281/zenodo.3370005).
86. R. J. Doviak, D. S. Zrnić, Doppler radar and weather observations (Dover Publications, Mineola, N.Y, 2nd ed., Dover ed., 2006).
87. T. Chen, C. Guestrin, in Proceedings of the 22nd ACM SIGKDD International Conference on Knowledge 30 Discovery and Data Mining - KDD ’16 (ACM Press, San Francisco, California, USA, 2016; http://dl.acm.org/citation.cfm?doid=2939672.2939785), pp. 785–794.
88. T. Chen, T. He, M. Benesty, V. Khotilovich, Y. Tang, xgboost: Extreme Gradient Boosting (2017; https://github.com/dmlc/xgboost).
89. J. Davis, M. Goadrich, (ACM, 2006), pp. 233–240. 35
90. C. R. Vaughn, Birds and insects as radar targets: A review. Proceedings of the IEEE. 73, 205–227 (1985).
91. E. J. Pebesma, Multivariable geostatistics in S: the gstat package. Computers & Geosciences. 30, 683–691 (2004).

Submitted Manuscript: Confidential
10
92. P. M. Stepanian, C. E. Wainwright, Ongoing changes in migration phenology and winter residency at Bracken Bat Cave. Global Change Biology. 24, 3266–3275 (2018).
93. A. L. Russell, M. P. Cox, V. A. Brown, G. F. McCracken, Population growth of Mexican free-tailed bats (Tadarida brasiliensis mexicana) predates human agricultural activity. BMC Evolutionary Biology. 11 (2011), doi:10.1186/1471-2148-11-88. 5
94. V. A. Drake, D. R. Reynolds, Radar entomology: observing insect flight and migration (Cabi, 2012).
95. S. N. Wood, Fast stable restricted maximum likelihood and marginal likelihood estimation of semiparametric generalized linear models: Estimation of Semiparametric Generalized Linear Models. Journal of the Royal
Statistical Society: Series B (Statistical Methodology). 73, 3–36 (2011).
96. Kamil Barton, “MuMIn: Multi-Model Inference” (R package version 1.42.1, 2018), (available at 10 https://CRAN.R-project.org/package=MuMIn).
97. K. P. Burnham, D. R. Anderson, Model selection and multimodel inference: a practical information-theoretic
approach (Springer, New York, NY, 2. ed., 2010).
98. D. Bates, M. Mächler, B. Bolker, S. Walker, Fitting Linear Mixed-Effects Models Using lme4. Journal of
Statistical Software. 67 (2015), doi:10.18637/jss.v067.i01. 15
99. D. W. Winkler, S. M. Billerman, I. J. Lovette, Bird families of the world: An invitation to the spectacular
diversity of birds (Lynx Edicions, 2015).
100. R. T. Chesser, K. J. Burns, C. Cicero, J. L. Dunn, A. W. Kratter, I. J. Lovette, P. C. Rasmussen, J. V. Remsen, D. F. Stotz, B. M. Winger, K. Winker, Fifty-ninth Supplement to the American Ornithological Society’s Check-list of North American Birds. The Auk. 135, 798–813 (2018). 20
Acknowledgments: This paper is a contribution of The Partners in Flight International Science Committee and the American Ornithologist Society Conservation Committee, and the study benefited from many discussions with these groups. Steve Bessinger, John Fitzpatrick, Scott Loss, T. Scott Sillett, Wesley Hochachka, Daniel Fink, Steve Kelling, Viviana Ruiz-Gutierrez, 25 Orin Robinson, Eliot Miller, Amanda Rodewald, and three anonymous reviewers made suggestions to improve the paper. Jillian Ditner and Matt Strimas-Mackey helped with figures and graphics. Tim Meehan provided an analysis of trends from National Audubon’s Christmas Bird Count. We thank the hundreds of volunteer citizen-scientists who contributed to long-term bird-monitoring programs in North America and the institutions that manage these programs. 30 Photos in Fig. 3 from Macaulay Library, Cornell Lab of Ornithology. Funding: NSF LTREB DEB1242584 to PPM; AWS Cloud Credits for Research to AMD; NSF ABI Innovation DBI-1661259. Author contributions: All authors conceived of the idea for the paper; ACS, PJB, AMD, JRS, PAS, and JCS conducted analyses; KVR, AMD and PPM primarily wrote the paper, although all 35 authors contributed to the final manuscript. Competing interests: Authors declare no competing interests. Data and materials availability: All data and software are archived and available on Zenodo (DOI 10.5281/zenodo.3218403, 10.5281/zenodo.3369999, 10.5281/zenodo.3370005), and will
Submitted Manuscript: Confidential
11
be published in future versions of the Avian Conservation Assessment Database (http://pif.birdconservancy.org/ACAD/).
Supplementary Materials:
Materials and Methods Figures S1-S7 5
Tables S1-S5
External Databases S1-S2 References (33-100)

Submitted Manuscript: Confidential
12
5
Fig. 1. Net population change in North American birds. (A) By integrating population size estimates and trajectories for 529 species (18), we show a net loss of 2.9 billion breeding birds across the continental avifauna since 1970. Gray shading represents ± 95% credible intervals around total estimated loss. Map shows color-coded breeding biomes based on Bird Conservation Regions and land cover classification (18). (B) Net loss of abundance occurred 10 across all major breeding biomes except wetlands (see Table 1). (C) Proportional net population change relative to 1970, ±95% C.I. (D) Proportion of species declining in each biome.

Submitted Manuscript: Confidential
13
Fig. 2. NEXRAD radar monitoring of nocturnal bird migration across the contiguous U.S. (A) Annual change in biomass passage for the full continental U.S. (black) and (B) the Pacific (green), Central (brown), Mississippi (yellow), and Atlantic (blue) flyways (borders indicated in 5 panel C), with percentage of total biomass passage (migration traffic) for each flyway indicated; Declines are significant only for the full U.S. and the Mississippi and Atlantic flyways (Table S3-5). (C) Single-site trends in seasonal biomass passage at 143 NEXRAD stations in spring (1 Mar – 1 Jul), estimated for the period 2007-2017. Darker red colors indicate higher declines and loss of biomass passage, while blue colors indicate biomass increase. Circle size indicates trend 10 significance, with closed circles being significant at a 95% confidence level. Only areas outside gray shading have a spatially consistent trend signal separated from background variability. (D) 10-year cumulative loss in biomass passage, estimated as the product of a spatially-explicit (generalized additive model) trend, times the surface of average cumulative spring biomass passage. 15

Submitted Manuscript: Confidential
14
Fig. 3. Gains and losses across the North American avifauna over the last half century. (A) Bird families were categorized as having a net loss (red) or gain (blue). Total loss of 3.2 billion birds occurred across 38 families; each family with losses greater than 50 million 5 individuals is shown as a proportion of total loss, including two introduced families (gray). Swallows, nightjars, and swifts together show loss within the aerial insectivore guild. (B) 29 families show a total gain of 250 million individual birds; the five families with gains greater than 15 million individuals are shown as a proportion of total gain. Four families of raptors are shown as a single group. Note that combining total gain and total loss yields a net loss of 2.9 10 billion birds across the entire avifauna. (C) For each individually represented family in B and C, proportional population change within that family is shown. See Table S2 for statistics on each individual family. (D) Left, proportion of species with declining trends and, Right, percentage population change among introduced and each of four management groups (18). A representative species from each group is shown (top to bottom, house sparrow, Passer domesticus; 15 sanderling, Calidris alba; western meadowlark, Sturnella neglecta; green heron, Butorides
virescens; and snow goose, Anser caerulescens).
Submitted Manuscript: Confidential
15
Species Group Number of Species
Net Abundance Change (Millions) & 95% CI Percent Change & 95% CIs
Proportion Species in Decline
Change LC95 UC95 Change LC95 UC95
Species Summary All N. Am. Species 529 -2,911.9 -3,097.5 -2,732.9 -28.8% -30.2% -27.3% 57.3%
All Native Species 519 -2,521.0 -2,698.5 -2,347.6 -26.5% -28.0% -24.9% 57.4%
Introduced Species 10 -391.6 -442.3 -336.6 -62.9% -66.5% -56.4% 50.0% Native Migratory Species 419 -2,547.7 -2,723.7 -2,374.5 -28.3% -29.8% -26.7% 58.2% Native Resident Species 100 26.3 7.3 46.9 5.3% 1.4% 9.6% 54.0%
Landbirds 357 -2,516.5 -2,692.2 -2,346.0 -27.1% -28.6% -25.5% 58.8%
Shorebirds 44 -17.1 -21.8 -12.6 -37.4% -45.0% -28.8% 68.2%
Waterbirds 77 -22.5 -37.8 -6.3 -21.5% -33.1% -6.2% 51.9%
Waterfowl 41 34.8 24.5 48.3 56.0% 37.9% 79.4% 43.9%
Aerial Insectivores 26 -156.8 -183.8 -127.0 -31.8% -36.4% -26.1% 73.1% Breeding Biome Grassland 31 -717.5 -763.9 -673.3 -53.3% -55.1% -51.5% 74.2%
Boreal forest 34 -500.7 -627.1 -381.0 -33.1% -38.9% -26.9% 50.0%
Forest Generalist 40 -482.2 -552.5 -413.4 -18.1% -20.4% -15.8% 40.0%
Habitat Generalist 38 -417.3 -462.1 -371.3 -23.1% -25.4% -20.7% 60.5%
Eastern Forest 63 -166.7 -185.8 -147.7 -17.4% -19.2% -15.6% 63.5%
Western forest 67 -139.7 -163.8 -116.1 -29.5% -32.8% -26.0% 64.2%
Arctic Tundra 51 -79.9 -131.2 -0.7 -23.4% -37.5% -0.2% 56.5%
Aridlands 62 -35.6 -49.7 -17.0 -17.0% -23.0% -8.1% 56.5%
Coasts 38 -6.1 -18.9 8.5 -15.0% -39.4% 21.9% 50.0%
Wetlands 95 20.6 8.3 35.3 13.0% 5.1% 23.0% 47.4% Nonbreeding Biome Temperate North America 192 -1,413.0 -1,521.5 -1,292.3 -27.4% -29.3% -25.3% 55.2%
South America 41 -537.4 -651.1 -432.6 -40.1% -45.2% -34.6% 75.6%
Southwestern Aridlands 50 -238.1 -261.2 -215.6 -41.9% -44.5% -39.2% 74.0%
Mexico-Central America 76 -155.3 -187.8 -122.0 -15.5% -18.3% -12.6% 52.6%
Widespread Neotdropical 22 -126.0 -171.2 -86.1 -26.8% -33.4% -19.3% 45.5%
Widespread 60 -31.6 -63.1 1.6 -3.7% -7.4% 0.2% 43.3%
Marine 26 -16.3 -29.7 -1.2 -30.8% -49.1% -2.5% 61.5%
Coastal 44 -11.0 -14.9 -6.7 -42.0% -51.8% -26.7% 68.2%
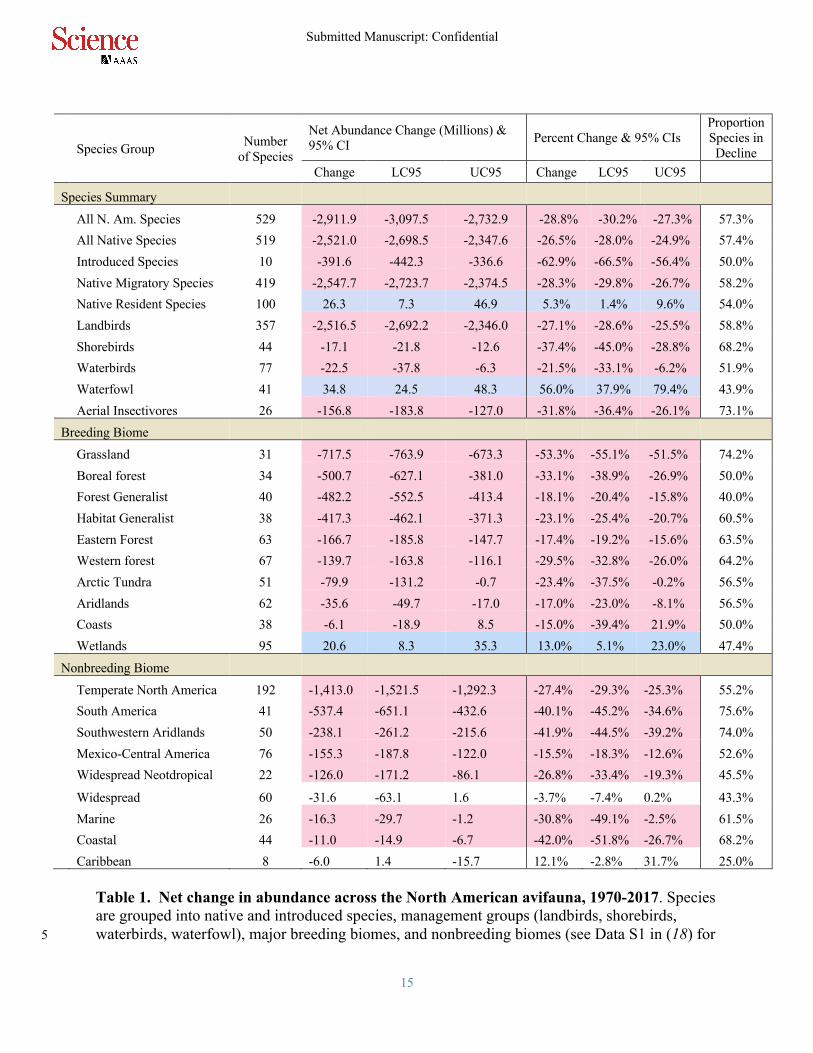
Caribbean 8 -6.0 1.4 -15.7 12.1% -2.8% 31.7% 25.0% Table 1. Net change in abundance across the North American avifauna, 1970-2017. Species are grouped into native and introduced species, management groups (landbirds, shorebirds, waterbirds, waterfowl), major breeding biomes, and nonbreeding biomes (see Data S1 in (18) for 5

Submitted Manuscript: Confidential
16
assignments and definitions of groups and biomes). Net change in abundance is expressed in millions of breeding individuals, with upper and lower 95% credible intervals (CI) shown. Percentage of species in each group with negative trend trajectories are also noted. Rows colored in red indicate declines and loss; blue rows indicate gains. 5

1
1 2
3
Supplementary Materials for 4 5
Decline of the North American Avifauna 6 7
Kenneth V. Rosenberg, Adriaan M. Dokter, Peter J. Blancher, John R. Sauer, Adam C. Smith, 8 Paul A. Smith, Jessica C. Stanton, Arvind Panjabi, Laura Helft, Michael Parr, Peter P. Marra 9
10
Correspondence to: [email protected] 11 12
13 This PDF file includes: 14 15
Materials and Methods 16 Figs. S1 to S7 17 Tables S1 to S5 18 Caption for Data S1 19 Caption for Data S2 20
21 Other Supplementary Materials for this manuscript include the following: 22 23
Data S1 24 Data S2 25
26

2
Materials and Methods 27 28
General approach to estimating long-term net population change 29 We compiled estimates of long-term population change and current population size for 30
529 species from a variety of sources (Table S1), as described below. For every species, we 31 selected the most appropriate data sources and assessed the quality of population size and change 32 estimates, based on sampling methodology, range coverage, and precision of the estimates. Our 33 primary source of population change estimates was the North American Breeding Bird Survey 34 (BBS) (33), which provides conservation assessment information for hundreds of bird species 35 (34). For our current analysis we relied on the full trajectory of population change for each 36 species, which we define as the scaled time-series of annual population indices derived from the 37 underlying trend model. Note that using the full trajectory provides much more information on 38 population change than the simple trend value (% change/yr) usually associated with survey data. 39 We used Partners in Flight’s (PIF) recently published population size estimates for North 40 American landbirds (35), and we supplemented these with data from several other surveys (Table 41 S1). Values for all U.S./Canada population size estimates, along with their sources, are provided 42 in Data S1. 43
After compiling population size and trajectory estimates for all species (Data S1), we 44 integrated these into a single hierarchical Bayesian model that estimates the full time-series 45 (1970-2017) of population sizes for each species and for the overall avifauna. Because some 46 species are better monitored than others, the precision of estimates varied greatly among species 47 (Data S1). To reduce the effects of imprecise species-level estimates on our overall estimates of 48 population change, our model included a hierarchical structure that allowed for estimation of 49 composite change based on shrinkage estimators, in which imprecise species results are shrunk 50 toward species-group means based on common ecological biomes in which they breed and 51 overwinter (see below). For summaries, estimates of net population change were computed for 52 four general management categorizations (shorebirds, landbirds, waterbirds, waterfowl), 53 taxonomic familes, and breeding and nonbreeding biomes. 54
Our hierarchical model of composite change is similar in concept to the bird-group 55 indicator models used to summarize the status of major bird groups at a national level in recent 56 State of the Birds reports in Canada and the United States (36, 37). These indicator models 57 estimate an average population trajectory with respect to a base-year, across species in a group. 58 To this basic group-level model, we added 4 major components: (1) we added a non-parametric 59 smooth to each species estimated population trajectory, accounting for the uncertainty of each 60 annual value, to emphasize the medium- and long-term changes in species populations and 61 reduce the effects of annual fluctuations; (2) we added a second layer to the hierarchical structure 62 to account for influences on each species population trajectory from across the full annual cycle 63 (both nonbreeding and breeding biome); (3) we used the species-level predictions, instead of the 64 group-level trajectories summarized for the State of the Birds reports, as improved estimates of a 65 species population trajectory; and (4) we integrated these improved species trajectories with the 66 species-level population size estimates, to sample the full posterior distribution of population 67 change estimates for each species. The model, an R-script to run it, and all of the orginal data are 68 available on GitHub (https://github.com/AdamCSmithCWS/Rosenberg_et_al). 69
Data included in the modeling were (1) species (s) population indices by year (y) and 70 associated variances (!#̂,%, &'#,%( ); (2) species population size estimates and associated variances 71 ()'#, &*+
( ); (3) year(s) in which each species population size was estimated (e.g., most PIF 72
3
population estimates represent the species mean population size in the years 2006-2015; (,# =73 10, 0# = 2006 − 2015); and (4) information regarding wintering region and breeding biome 74 associations for each species (w = wintering region, b = breeding biome). 75
76 Non-parametric smoothing of species’ trajectories, centering, and missing data 77
We used a generalized additive model (GAM) to smooth each species population 78 trajectory (!#̂,%, &'#,%( ) before including them in the main model, similar to (38). The GAM smooth 79 allowed us to accommodate the wide variation in the underlying population trajectory data and 80 models across the various datasets; for example, some species trajectories have gaps in the time-81 series when data were not available in a particular year, but were available before and after, and 82 other trajectories are derived from models that allow annual values to fluctuate completely 83 independently, leading to extreme annual fluctuations in relation to other species. Modeling each 84 species trajectory with a flexible smoother retains the most important medium- and long-term 85 patterns in the species’ population, and reconciles the level of annual variation among species. 86 We used the R-package mgcv (39) to smooth each species trajectory, using a hierarchical 87 Bayesian GAM that accounted for the uncertainty of each annual index in the trajectory to model 88 most species, and for the few species where published estimates of uncertainty were not 89 available (N = 3, Trumpeter Swan, Emperior Goose, and American Woodcock), we used a 90 simpler non-Bayesian GAM function from the same package. 91
The annual predictions from the GAM smooth (5#,%, &#,%( ) for each species and from each 92 data-source were in different units, e.g., BBS estimates are scaled to the number of birds seen on 93 a single route and CBC estimates are scaled to the number observed in an average count-circle. 94 To allow for the hierarchical structure of the model that pools information across groups of 95 species (e.g., grassland birds that winter in Mexico), each species’ trajectory was re-scaled to a 96 common base-year (1970) and log-transformed. 97
98
67#,% = ln :5#,%5#,;<=>
? 99
100 Where, 67#,% is the log-transformed standardized annual estimate for year y and species s 101
(5#,%) and represents the status of the species in year-y, as a proportion of the original estimate in 102 the base-year, 1970 (5#,;<=>). We calculated the variance of 67#,% as the log transformation of the 103 variance of a ratio of two random variables (Cochran 1977, pg. 183), making the simplifying 104 assuming that the annual estimates are independent in time. We acknowledge that this 105 assumption of independent estimates in time is certaintly invalid for adjacent years, but becomes 106 more plausible as length of the time-series increases 107
108
&@A+,B( = ln C1 +
&E+,B(
5#,%(+&E+,FGHI(
5#,;<=>( J 109
110 For 8% of species (43), population trajectories spanning 1970-2017 were not available. 111
About half have data-sources that started in the early 1970s and most of the remainder have 112 trajectories starting in the 1990s. In these cases, we assumed that the population did not change 113 during the missing years. Years with missing trajectory information at the beginning of the time-114 series (e.g., no data before 1993 for some boreal species monitored by the BBS) were given 115

4
values equal to the first year with data (i.e. a conservative assumption of no overall change) but 116 we increased the estimated variance (&@A+,B
( ) by the square of the number of years since non-117 missing data, so that these imputed data would have little overall effect on the final results. For 118 these species and years, because of the extremely high variance and the hierarchical structure of 119 the model, the modeled population trajectories and the annual number of birds were almost 120 entirely determined by the group-level mean trajectories for the other species sharing the same 121 wintering region and breeding biome. 122
123 The primary model: population trajectories accounting for nonbreeding and breeding biome 124
Each species’ estimated status in a given year (67#,%) was treated as a normal random 125 variable with mean 6#,% and a variance estimated from the species data (&@A+,B
( ). 126 127
67#,%~L M6#,%, &@A+,B( N 128
The the species status parameter 6#,%was assumed to be normally distributed, governed 129 by a hyperparameter (OP,Q,%) with year-specific variance (&RB
( ), 130
6#,%~L MOP,Q,%, &RB( N 131
132 representing mean status for all species with the same combination of wintering range 133
and breeding biome (e.g., all species that winter in South American and breed in the boreal 134 forest). This structure has the effect of shrinking each species population trajectory towards the 135 mean trajectory for species in the same nonbreeding-by-breeding group. The mean trajectories 136 for each group (OP,Q,%) were estimated using an additive sub-model that combined the effects of 137 nonbreeding and breeding biomes. The biome-level components of the additive model were 138 estimated using random-walk time-series for the effects of nonbreeding biomes (SP,%) and 139 breeding biomes (TQ,%). 140
OP,Q,% = SP,% + TQ,% 141 142
SP,% = L(SP,%W;, &XY( ) 143
SP,;<=> = 0 144 145
TQ,% = L(TQ,%W;, &[B( ) 146
TQ,;<=> = 0 147 148
149 The random-walk structure has the effect of slightly smoothing large annual fluctuations 150
in the wintering-group annual means, while also allowing for non-linear temporal changes across 151 the 48-year time series. 152 153 Integrating the population sizes and population trajectories 154
155 Each species’ population size estimate was incorporated in the model as the mean ()'#) and 156
variance (&*+( ) of a normal distribution. Random draws from those distributions ()#) allowed the 157
model to incorporate the uncertainty around each species’ population estimate. We used the 158
5
estimated population sizes and the population trajectories during the relevant years represented by 159 each species’ population estimate to calculate a scaling factor (\#) that allowed us to re-scale the 160 species estimated population trajectory (6#,%]) to an estimated number of birds in each year of the 161 time-series (^#,%). Each population estimate was related to a specific year or range of years; e.g., 162 all PIF population estimates reflect the species’ mean population size between 2006 and 2015 163 (,# = 10, 0 = 2006 − 2015). We estimated the scaling factors by averaging the ratio across the 164 relevant span of years, with ,# = 3 as a minimum in a few cases where the species’ estimated 165 population reportedly related to a single year. 166
167
\# =∑ a )#
exp( 6#,%])e%f
%]
,# 168
169 ^#,% = \# ∗ 6#,% 170
171 All precision parameters were given diffuse gamma prior distributions, with scale and 172
shape parameters set to 0.001. Formal measures of model fit are difficult to implement for complex 173 hierarchical models, and are generally not presented for analyses of complex surveys (40). We 174 used graphical comparisons between data and predictions (see additional figures available in the 175 data and code repository) to ensure there was no important lack of fit between the model and the 176 data. 177
178 Annual number of birds and overall population change 179
We calculated the overall population change by species (λ#) using the posterior distribution 180 of the difference between the estimated number of birds in 1970 and the number in 2017. We 181 calculated the estimated number of birds in the North American avifauna for each year (Ν%) using 182 the posterior distribution of the annual sums of all species estimates. We calculated the overall net 183 change in the North American avifauna using the posterior distribution of the sum of the species-184 level change estimates (Λ). Estimates of the annual number of birds (Ν%) and overall change (Λ) 185 by family, nonbreeding biome (Figure S1), breeding biome (Figure 1A), and combinations of 186 nonbreeding and breeding biome (Figure S2) were made from the posterior distribution of group-187 level summaries across all S-species in a group. 188
λ# = ^#,;<=> − ^#,(>;= 189
Ν% =k l^#,%mn
#] 190
191
Λ =k (o#)n
#] 192
193 Sources of Population Trajectories for North American Birds 194
We compiled long term population trajectories for 529 species, based on the best available 195 survey data for each species (Table S1; see Data S1 for species-specific information). We note that 196 this compilation reflects standard data sources used by North American bird conservation and 197 management (23, 36, 41–45). We are fortunate that standardized, long-term survey data exist for 198 a majority of North American bird species, perhaps the best-monitored group of organisms 199

6
globally. We used trajectory estimates based on surveys of breeding populations whenever 200 possible; however not all species are well-monitored during the breeding season, and for 18% of 201 species we relied on surveys from migration periods or winter (Table S1). In all cases, trajectories 202 and population estimates for each species were calculated from data during the same season (i.e., 203 breeding to breeding, winter to winter). We could not find credible surveys for estimation of 204 continent-scale trajectories for oceanic birds, many coastal-nesting seabirds, and other rare, 205 secretive, range-restricted or nocturnal species. However, our synthesis includes 76% of species 206 that breed regularly in the continental U.S. and Canada (46), and these species likely account for 207 95%-99% of total breeding abundance across the North American avifauna (i.e., most species 208 omitted have very small populations in the U.S. and Canada). 209
For 434 species (82% of 529 species considered) we used trajectories from BBS data, most 210 of which are updated annually and publicly available at https://www.mbr-pwrc.usgs.gov/. For 211 species surveyed by the BBS, a hierarchical model (47) was used to estimate annual indices of 212 abundance. In our hierarchical analysis, annual indices are based on regional fits within states and 213 provinces that are weighted by area and local abundance to accommodate differences in population 214 sizes among strata. For a majority of species (415) we used data from the ‘core’ BBS area from 215 1970-2017, based on road-based survey routes in the contiguous U.S. and southern Canada. For 216 19 species with restricted or northern breeding distributions (See Data S1), we used data from an 217 expanded analysis beginning in 1993, including additional BBS routes in Alaska and northern 218 Canada (48). The proportion of each species’ breeding range covered by the BBS is provided in 219 (33), and all metadata and data are available (https://www.pwrc.usgs.gov/bbs/). 220
Potential limitations or biases in BBS trends (overall rates of change across the trajectories) 221 have been extensively examined and documented (e.g., (33, 49)). In general, there is no evidence 222 to suggest that estimates of population trends from the BBS are systematically biased across large 223 spatial areas or across many species. Published studies that have examined the potential roadside 224 bias in BBS trends have found that the magnitudes of bias in the sampling of habitat-change are 225 generally small, e.g. (50–53), that potential biases vary in space (e.g., contrasting biases in the 226 regions used in (54), or in (55)), and that they vary among species (i.e., if biases exist, some 227 species’ trends may be underestimated and others overestimated, e.g., (55, 56)). Overall, BBS 228 routes survey a reasonably representative sample of the overall habitat in the landscape at the broad 229 spatial and temporal scales, for which the BBS was designed (50). 230
National Audubon Society Christmas Bird Counts (57) provided trajectory data for 58 231 species; these are primarily species that breed in northern regions not surveyed by the BBS, but 232 are encountered in CBCs because they spend the non-breeding season primarily within the U.S. 233 and southern Canada. The CBC protocols are less standardized than BBS, but annual winter-season 234 counts in fixed 15-mile diameter circles cover a large portion of the U.S. and Canada, especially 235 in coastal regions. Trajectories from CBC data were estimated using a hierarchical model that 236 controlled for effort (57). Annual indices to compute trajectories from the CBC for the 1970-2017 237 period were provided to us by Tim Meehan (National Audubon). 238
Trajectories for 20 species of long-distance migrant shorebirds came from an analysis of 239 migration monitoring surveys carried out across Canada and the United States (58, 59). The 240 shorebird migration surveys used here are part of the International Shorebird Survey, coordinated 241 by Manomet, and the Atlantic Canada and Ontario Shorebird Surveys, coordinated by 242 Environment and Climate Change Canada. Volunteers carry out surveys every 10 days in spring 243 and fall, at sites distributed across Canada and the United States but concentrated primarily in the 244 eastern half of the continent. Analyses of shorebird trajectories from fall count data, 1974-2016, 245

7
were carried out using hierarchical Bayesian models similar to those used for the BBS (47), with 246 an additional General Additive Model (GAM) component to describe variation in birds’ abundance 247 during the period of migratory passage. The model assumes that counts follow an overdispersed 248 Poisson distribution, and includes terms for a long-term, log-linear trend, year-effects and site-249 level abundance. Sites were grouped into biologically relevant regions, and trend terms within 250 each region were estimated as hierarchical random effects distributed around a mean, continental 251 trend. Methods and survey coverage are described in more detail at wildlife-252 species.canada.ca/bird-status (https://tinyurl.com/yak95ssn). For one shorebird species, American 253 Woodcock, we made use of Singing-ground Survey estimates from the 2017 American Woodcock 254 Status report (60). 255
For nine species of intensely managed waterfowl we relied on trajectory data from the U.S. 256 Fish and Wildlife Service (USFWS) (61), and trajectories for nine additional waterfowl species 257 came from other species-specific sources (see Table S1, Data S1). Trajectories for many waterfowl 258 species were computed using population estimates from Spring Breeding Ground Surveys, which 259 use a combination of aerial and ground-based counts in late spring, covering 2.0 million square 260 miles in Alaska, Canada, and the northern U.S. (Table c3 in (61)). For a small subset of species, 261 we employed other sources of trajectory information where this resulted in better coverage of 262 North American populations, and/or more current information. For all goose species we relied on 263 estimated trajectories from the same sources of information on population trends reported for 264 North American goose populations by Fox and Leafloor (62); these sources represent the most 265 appropriate survey for each species as determined by experts on goose populations. Finally, for 266 Trumpeter Swans we relied on values in the 2015 North American Trumpeter Swan Survey report 267 (63). 268
269 Sources of Population Size Estimates and Variances 270
We relied on the best available data sources and published estimates of North American 271 breeding population size and variance for all species with credible data (Table S1; Data S1). The 272 largest source of population estimates for our current analysis (65% of species) was the recently 273 published PIF estimates for 344 landbird species (35). The PIF estimates were based on 274 extrapolations from BBS count data from 2006-2015, using previously described methods (64–275 67). Averaged annual BBS counts were converted to a regional (landscape-scale) abundance 276 estimate through the application of detectability adjustment factors for time-of-day, detection 277 distance, and likelihood of both members of a pair being detected on BBS routes, and extrapolation 278 from BBS count area to area of the region. These regional estimates are calculated for each state, 279 province and territory portion of each Bird Conservation Region (BCR), and then summed across 280 regions to derive U.S.-Canada population estimates. Estimates incorporated uncertainty in the 281 estimation components, resulting in confidence bounds around the final estimates (35). Population 282 estimates are therefore adjusted for detection, account for variation in relative abundance across 283 the species’ range, and are accompanied by a measure of uncertainty. This approach to estimation 284 of total population size has been widely adopted in conservation planning (35), and is considered 285 to be conservative, likely underestimating true population size due to sampling concerns associated 286 with BBS data (67). 287
The PIF methods for estimating population size have historically been applied only to 288 landbirds (41, 42). For this analysis, we determined that the BBS also provides adequate survey 289 coverage for 46 waterbirds, and 6 waterfowl that otherwise were lacking useful population 290 estimates (see Data S1 for sources by species), and we applied the PIF approach for calculating 291

8
population size estimates to data for these species. Adjustment factors used in the estimation of 292 U.S.-Canada population sizes for the current analysis, based on BBS relative abundances, are 293 provided in Table S2. More details on the use of adjustment factors and their ranges of uncertainty 294 for landbirds can be found in (35). 295
Estimates of population size for many shorebirds and waterfowl came from published 296 sources that rely on other surveys. Estimates for 12 waterfowl species were from the 2017 USFWS 297 Waterfowl Status Report (61) (7 species from traditional area surveys, 2 from eastern survey area, 298 2 summed from traditional and eastern surveys, and 1 from western survey area) – for these 299 species, we used an average of published estimates across the last 5 years (2013-2017) to smooth 300 out annual variance in population sizes. Estimates for 14 additional waterfowl species were based 301 on a 2007 Seaduck Joint Venture Report (68). All 45 shorebird species estimates were North 302 American population estimates (69) from the Shorebird Flyway Population Database (70). 303
Other estimates of population size came from species-specific sources (Table S1; Data S1): 304 We used published estimates from Birds of North America (BNA) accounts (71) for 33 species; a 305 Conservation of Arctic Flora and Fauna (CAFF) 2018 report provided current estimates for 7 goose 306 species (62); estimates for 17 landbird species without useful BBS-based estimates were taken 307 from the Avian Conservation Assessment Database ACAD (46, 72), which itself relied on a variety 308 of sources; the 2015 North American Trumpeter Swan Survey (63) was used for Trumpeter Swan, 309 and the Waterbird Population Estimates database (WPE5) provided estimates for Arctic Tern (73). 310
Most sources of population estimates also provided estimates of variance in population 311 size, which we incorporated into our analysis. For those that did not, we estimated a range of 312 variance based on a description of methods used for population estimation. For example, we 313 applied a range 10% below and above the mean for species if estimates were based on well-314 designed surveys with good population coverage, versus 75% below and above the mean for 315 species with ballpark estimates and/or low coverage of relevant populations, with an intermediate 316 range of variance if limitations were between those two. 317
Note that our goal was to compile and use the most current estimates of breeding population 318 size for each species; i.e., the number of breeding adult individuals in the population. We did not 319 attempt to estimate the annual increase in population size due to the influences of reproductive 320 output, as this will likely vary greatly across species and years and be subject to density-dependent 321 effects. Total population size varies throughout the annual cycle, but post-breeding total population 322 could increase as much as four to five times the size of the pre-breeding population size depending 323 on recruitment success of young of the year. Estimating this annual variation for individual species 324 is currently impossible, but it is important to point out that the cumulative impact of population 325 loss on ecosystems throughout the year could be quite significant. Our estimates of population 326 change are therefore conservative. 327
328 Assigning species to management and biome categories 329
For the purpose of summarizing changes in abundance across the North American 330 avifauna, we recognize four broad species categories used for management and conservation 331 planning: Landbirds are defined by Partners in Flight (41, 42) as all birds occupying terrestrial 332 habitats and a few species from primarily terrestrial bird families that use wetland habitats (e.g., 333 Marsh Wren, Cistothorus palustris). The ACAD lists (448) native landbirds breeding in the U.S. 334 and Canada; in this paper we include 366 landbird species with adequate population size and 335 trajectory data, including 9 introduced species. Shorebirds include all sandpipers, plovers, stilts, 336 avocets, and oystercatchers that are considered under the U.S. Shorebird Conservation Partnership 337

9
(43); we had adequate data for 45 shorebird species for the current analysis. Waterfowl include all 338 ducks, geese, and swans, which are managed separately under the North American Waterfowl 339 Management Plan; most species have populations that are adaptively managed for sport hunting 340 (23). We had adequate data for 42 species in the current analysis, including 1 introduced species. 341 Other Waterbird species that are not specifically covered by the three plans above are included 342 under the Waterbird Conservation for the Americas initiative (44); these include colonial-nesting 343 seabirds, herons, beach-nesting species and secretive marshbirds. Waterbirds are most poorly 344 represented in our dataset, as many species are poorly monitored. We had adequate data for 77 345 species in the current analysis. 346
We assigned each species to a primary breeding biome and a primary nonbreeding biome, 347 using the Avian Conservation Assessment Database. The ACAD provides broad breeding-habitat 348 categories (e.g., forests, grasslands, oceans) derived from similar categories used to develop habitat 349 indicators for State of the Birds reports in the U.S. and Canada (e.g., (36, 45)), as well as more 350 descriptive sub-categories within major habitats (e.g., Temperate Eastern Forest; Desert Scrub, 351 Freshwater Marsh). All category assignments were based on literature review (primarily BNA 352 accounts) or expert knowledge and underwent extensive review as part of the ACAD process (66). 353 Species that use three or more broad habitats in similar importance were considered habitat 354 generalists. 355
For this paper, we used a combination of Primary Breeding Habitat and Breeding Habitat 356 Description sub-categories defined in the ACAD to derive a single set of unique breeding biome 357 categories across the North American avifauna (shown in Figure 1A), as follows: 358 359
• Wetlands = freshwater, inland wetlands; does not include coastal marshes or Arctic tundra. 360 • Coasts = all habitats associated with the Coastal zone, including saltmarsh, beach and tidal 361
estuary, mangroves, and rocky cliffs and islands; includes birds that forage primary in the 362 marine zone 363
• Tundra = Alpine tundra and Arctic tundra, including upland and low, seasonally wet tundra 364 • Grasslands = native grassland, prairie, pasture, and agriculture that supports grassland 365
birds 366 • Aridlands = all arid shrub-dominated communities; primarily in southwestern U.S. and 367
northwestern Mexico; includes ACAD sub-categories of sagebrush, chaparral, desert 368 scrub, barren rocky cliffs, and extensions of tropical dry forest (thornscrub) in southern 369 Texas 370
• Boreal forest = "True" boreal forest of Canada and Alaska; note that some boreal-forest 371 birds also use the boreal zone (primarily spruce-fir) of high mountains in the western and 372 northeastern U.S. 373
• Eastern forest = all temperate forest types of eastern U.S. and southeastern Canada (south 374 of the boreal), including northern hardwoods, oak-hickory, pine-oak, southern pine, and 375 bottomland hardwood associations 376
• Western forest = all temperate forest types of western U.S. and Canada (south of the boreal) 377 and extending in high mountains south into northwestern Mexico; includes Pacific 378 Northwest rainforest, all western conifer, oak-dominated, and riparian forests, pinyon-379 juniper, juniper-oak woodlands of Edward's Plateau, pine-oak and high-elevation conifer 380 forests of northwestern Mexico 381
• Forest generalist = occurs in similar abundance in two or more forest biomes as described 382 above 383

10
• Habitat Generalist = occurs in similar abundance in three or more major habitat types, 384 usually including forest and non-forest categories 385
386 The ACAD database also lists Primary Wintering Regions, in which a majority of the population 387 of each species spends the stationary nonbreeding period during the boreal winter. For this paper 388 we modified and lumped ACAD regions into broader nonbreeding biome categories, using 389 published range maps and eBird distributional data (https://ebird.org/explore), as follows: 390 391
• Temperate North America = broad region encompassing all of Canada and most of the 392 U.S., excluding arid regions in the Southwest 393
• Southwestern Aridlands = arid regions of southwestern U.S., northwestern Mexico and 394 Mexican Plateau; included species that winter in arid Chihuahuan grassland habitat 395
• Mexico-Central America = combination of ACAD regions within Mexico and Central 396 America, including Pacific Lowlands, Gulf-Caribbean Lowlands, Mexican Highlands, and 397 species from Central and South American Highlands that winter primarily in Central 398 America 399
• South America = includes South American Lowlands, species from Central and South 400 American Highlands that winter primarily in South America, and Southern Cone ACAD 401 regions 402
• Caribbean = West Indies region, including Cuba, Bahamas, Greater and Lesser Antilles 403 • Widespread Neotropical = occurs in similar numbers in two or more biome regions within 404
the Neotropics 405 • Coastal = coastline habitats throughout the western Hemisphere from Arctic to Atlantic 406
and Pacific Coasts of North, Middle, and South America; eastern Hemisphere coastlines 407 were included to incorporate the main wintering grounds of Pacific Golden-Plover 408
• Marine = littoral zone; area of oceans influenced by continental coastlines; includes bays 409 and deep estuaries (includes a few species that are largely pelagic in the nonbreeding 410 season) 411
• Widespread = occurs in similar abundance in 3 or more nonbreeding biomes, usually 412 encompassing both temperate North American and Neotropical regions 413
• Southeast Asia = overwintering region for Arctic Warbler (and additional Arctic-breeding 414 species not included in the present analysis); note that this nonbreeding biome is not 415 included in summaries presented in Table 1 and Figure S1, but data for Arctic Warbler 416 (Data S1) and included in higher level summaries of population change for all birds, 417 breeding biomes, etc. 418
419 Computing vertical profile time series of birds from NEXRAD radar data 420 While designed to monitor meteorological phenomena (e.g., precipitation, tornados, hail), 421 weather radars routinely detect migrating birds. Weather radar infrastructure represents a 422 biological monitoring tool that achieves an unprecedented spatial and temporal coverage for 423 studying bird migration (74). The NEXRAD weather radar network consists of 143 radars in the 424 contiguous US that continuously survey the airspace above the US (75). Each of these radars was 425 used to estimate vertical profiles of birds , which summarize a radar’s scans completed at a given 426 timestep into the amount, speeds, and directions of birds aloft as a function of altitude. Profile data 427 can be used to accurately estimate migratory biomass abundance and its change throughout the 428 year at comprehensive continental scales (19, 77), an approach we extended here to detect long-429

11
term change in migratory passage across the full US. We restricted our analysis to spring data only 430 (Mar 1 to Jul 1), which is the migratory period closest in time to the breeding bird surveys by BBS. 431 Also, aerial insects are far less numerous in the airspace in early spring as compared to autumn, 432 therefore the spring period allows us to obtain the cleanest bird signal from NEXRAD (see final 433 paragraph of section “Calculating biomass passage from vertical profile time series” below). 434
Data were obtained from the NOAA-nexrad-level2 public S3 bucket on Amazon Web 435 Services (78). Data were analyzed for the period 2007-2018, the period after the Open RDA 436 deployment in NEXRAD (RDA build 7.0), which was a significant upgrade to the Radar Data 437 Acquisition (RDA) functional area of the WSR-88D. In particular, it implemented Gaussian Model 438 Adaptive Processing (GMAP) (79, 80), replacing and improving over the legacy ground clutter 439 filter (81) by Doppler filtering. We did not include older potentially lower quality data in the 440 analysis to limit the possibility of legacy filter settings affecting our results. Trend analyses (see 441 following sections for details) controlled for two important data acquisition updates, the gradual 442 upgrades to superresolution (2008-2009) and dual-polarization (2010-2013). The superresolution 443 upgrade increased the azimuthal resolution from 1 to 0.5 degree and range resolution from 1 km 444 to 250 m. The dual-polarization upgrade added functionality to receive horizontally and vertically 445 polarized electromagnetic waves independently, which provided additional products that greatly 446 simplify the classification of meteorological and biological scatterers (82). 447
Night-time polar volumes (level-II data) were processed for all 143 radars in the contiguous 448 US at half-hour interval from 2007-2018 using the vol2bird algorithm (version 0.4.0) (76, 83, 84), 449 available in R-package bioRad (version 0.4.0) (83, 85). Using cloud computing with 1000 parallel 450 cores on Amazon Web Services (AWS) we reduced this computational task of ~ 4 years on a single 451 CPU to less than a day. Data were processed using the vol2bird algorithm in single-polarization 452 mode (76), which requires radial velocity and reflectivity factor information only and no dual-453 polarization data. Dual-polarization data became available only after mid-2013, and therefore 454 cannot be used for analyses involving older data. In single-polarization mode, resolution samples 455 with high reflectivity values are masked out (h above 36000 cm2/km3, i.e., 31 dBZ at S-band / 20 456 dBZ at C-band, cf. algorithm parameter ETAMAX and paragraph 3.2 in (76) ), since such high 457 reflectivities are typically associated with precipitation (76). The algorithm also identifies 458 contiguous areas of direct neighbors (in a queen’s case sense; i.e., diagonal pixels are included as 459 direct neighbors) of reflectivity above 0 dBZ, denoted as reflectivity cells. Cells with a mean 460 reflectivity above 11500 cm2/km3 (i.e., 26 dBZ at S-band / 15 dBZ at C-band, cf. algorithm 461 parameter ETACELL and Zcell in (76)) are masked from the data. Following recommendations for 462 S-band data discussed in (83), we used sd_vvp_threshold=1 m/s (cf. Eq. A2 in (76)) and 463 STDEV_CELL=1 m/s (cf. Eq. A3 in (76)) to limit masking based on radial velocity texture at S-band. 464
At S-band, single-polarization mode masks out only the strongest precipitation areas, and 465 weaker precipitation may remain (83) (see Figure S3C/E). Precipitation is generally easily 466 identifiable in vertical profiles by experts, based on high reflectivities extending over a relatively 467 large portion of the altitude column (see Figure S3D). Such precipitation cases stand out from bird 468 migration cases, which are characterized by low reflectivities that typically decrease with altitude 469 (see Figure S3A). We used machine learning to develop a full-profile classifier that automatically 470 identifies precipitation-contaminated profiles, as follows. 471
Years when dual-polarization data were available (2014-2017) were processed a second 472 time in dual-polarization mode (19, 83), which adequately removes precipitation based on high 473 correlation coefficient values (19, 82). These precipitation-free profile data were paired with the 474 single-polarization profile data. By comparing the precipitation-free reflectivity (pdualpol, cf. 475
12
Figure S3A) with the total reflectivity including precipitation (ptotal derived from reflectivity factor 476 DBZH, cf. Figure S3D), we defined a measure that indicates the range of altitudes H (m) likely 477 containing precipitation, as follows: 478 479
v = k(ifptotal,E − pdualpol,E > Δthen|layerelse0)
*layer
EÄ;
480
481 with D=50 cm2 km-3 (corresponding to 3 dBZ at S-band), and wlayer the width of a single altitude 482 layer (200 m). The value of D amounts to a fairly low threshold value for classifying potential 483 precipitation, as meteorologists typically assume weak precipitation to start at 7 dBZ (86) (133 484 cm2 km-3 at a 10 cm S-band wavelength), and therefore the vast majority of rain events will show 485 differences in reflectivity exceeding D. We labelled all single-polarization profiles in the 4-year 486 dataset with their corresponding H value. 487
Next, we used gradient boosted trees to detect rain-contaminated profiles computed in 488 single-polarization mode automatically in an unsupervised learning approach, using the H value 489 as our labeling of profiles, with higher H values indicating a wider altitudinal range containing 490 precipitation. We used the R implementation of XGBoost, a highly efficient and scalable gradient 491 boosting algorithm, which can deal with complex nonlinear interactions and collinearity among 492 predictors (87, 88). We used default hyperparameter settings of the xgboost algorithm (learning 493 rate eta=0.3, tree depth max_depth=6, min_child_weight=1, gamma=1, colsample_bytree=1, and 494 subsample=1). Full-profile classifiers were trained for each radar separately. Response variable 495 was the range of altitudes with precipitation H. Predictors included total reflectivity factor (DBZH), 496 precipitation-filtered reflectivity in single-polarization mode (eta), ground speed components 497 (u,v), all at each of the 20 profiles altitude layers, as well as day of year (1-366) and time of day 498 (UTC time). Profiles of each radar were randomly assigned to training (75%) and testing (25%) 499 datasets. 500
Finally, we determined the parameter Hmax as the value of H above which profiles are 501 removed in order to discard precipitation contaminations. The value of Hmax was determined using 502 Figure S4, showing an R-squared measure that quantifies the correspondence between the seasonal 503 migration traffic MT (see next paragraph for definition) of the single-polarization vertical profile 504 time series (with contaminated profiles removed by the full-profile classifier), and the seasonal 505 migration traffic of the reference computed in dual-polarization mode. This R-squared measure 506 amounts to the the coefficient of determination of the scatter points in Figure S5 for a given value 507 of Hmax. We choose the value of Hmax=1600 m, producing the best correspondence between the 508 dual-polarization reference and our new single-polarization method. Gaps in a radar’s profile time 509 series (after removal of rain-contaminated profiles) of less than 4 hours were filled by linearly 510 interpolating between the neighboring profiles directly before and after the gap. 511
Applying this value of Hmax and the full-profile classifier on the testing dataset, we find a 512 precision to correctly classify a profile as rain-contaminated of 99.2%, and a recall of rain-513 contaminated cases of 97.4%. Precision and recall (89) did not depend strongly on the value of the 514 Hmax threshold, e.g., for Hmax = 800 m we have a precision of 97.0 % and recall of 99.0%. Our 515 classification performance therefore did not depend critically on the adopted value of the Hmax 516 parameter. 517
518 Calculating biomass passage from vertical profile time series 519
13
Nightly reflectivity traffic (RT) (83) was calculated for the vertical profile time series of 520 each station for each night with the integrate_profile() function in bioRad (version 0.4.0) (83, 85), 521 which equals the total reflectivity crossing the radar stations per season per one kilometer transect 522 perpendicular to the ground speed direction of movement. Reflectivity traffic is closely related to 523 the amount of biomass that has passed the radar station (83). It can be converted to migration traffic 524 (MT), the number of individual birds having passed the radar station per km transect, under 525 assumption of radar cross section (RCS) per individual bird, as in MT = RT/RCS. To express RT 526 in a more intuitive unit, we report MT values in figures using a constant seasonal mean RCS = 11 527 cm2 for an individual bird. This value was determined in a calibration experiment spanning a full 528 spring and autumn migration season (76), corresponding to passerine-sized birds (10-100 g range) 529 (90), which represents the highest-abundance species group dominating our radar signals (19). As 530 additional quality control for non-avian signals, we only included altitude layers of profiles for 531 which the ground speed direction was in the northward semicircle surrounding a radar, since 532 migratory bird movements in spring are expected to fall within this semicircle. 533
Spatial interpolations across the contiguous US of nightly migration traffic were estimated 534 by ordinary kriging with a spherical variogram model, using the R package gstat (91). We clipped 535 water areas after interpolating, leaving land areas of the contiguous United States. Missing 536 estimates of nightly migration traffic (e.g., due to temporary radar down time) were imputed from 537 nightly kriging-interpolated maps of MT based on operational stations, imputing the MT value at 538 the location of the inactive radars. Parameters of the spherical variogram model were estimated 539 for each night. In cases where the variogram fit did not converge - typically during nights with 540 very limited migration - we used variogram parameters fit to the average seasonal spring migration 541 traffic (partial sill = 0.577, range = 1093 km). Radar availability was very high, therefore only a 542 small percentage of in total 2.8% of nightly MT values were imputed by this procedure. 543
Total seasonal migration traffic was calculated as the sum of nightly MT values within a 544 season from Mar 1 to Jul 1. Radar seasons were excluded from trend analysis entirely if data 545 availability dropped below 80% in the period 1 Mar – 1 Jul (4.8% of radar seasons for 143 stations 546 during 11 spring seasons). 547
While traffic rates suppress any non-migratory stationary signals, like those of non-directed 548 foraging movements of insects or bats (19), a small contribution of directed migratory movements 549 of bats or insects could remain in our data. Free-tailed bats in the south are known to show up in 550 radar (92) and have a population size estimated up to 100 million individuals (93), which amounts 551 to up to a few percent of the total migratory passage of several billion birds along the southern 552 border (19). In the North-East - where we observe strongest declines in biomass passage - several 553 migratory tree-dwelling bat species occur, but their population sizes are thought to be smaller than 554 of free-tailed bats. For the period 2013-2017 we have provided earlier a detailed quantitative 555 estimate of the upper limit to the migratory insect contribution to the migratory passage in autumn, 556 when insect abundances are highest. The estimated passage due to insects was 2.1 % (northern US 557 border) – 3.8 % (southern US border) (19). Our current study is conducted in spring when aerial 558 insect abundances are far lower (94), especially in the North East where we observe most declines, 559 and we estimate the insect contribution to the biomass passage to be on the order of a percent or 560 less. 561 562 Calculating trends from seasonal biomass passage values 563
To correct for potential radar sensitivity changes related to radar processing upgrades, we 564 determined the timing of the upgrade to super-resolution and the upgrade to dual-polarization for 565

14
each station. Radar seasons for which the upgrade fell within a migration period were excluded 566 from the analysis. The mode of operation was classified as “legacy” (before superresolution 567 upgrade), “superres” (after superresolution upgrade, before dual-polarization upgrade) or 568 “dualpol” (after dual-polarization upgrade), and stored as a factor variable ‘mode’ having three 569 factor levels to denote each mode of operation. Variable ‘mode’ was included in models to correct 570 for changes in operational mode. We also tested for the effect of dual-polarization and 571 superresolution upgrade separately. In these cases, factor variable ‘mode’ was replaced with a 572 logical explanatory variable ‘dualpol’ (true after dual-polarization upgrade, otherwise false) or 573 ‘superres’ (true after superresolution upgrade, otherwise false) in the trend models. The total model 574 candidate set thus contained 4 models, encompassing all combinations of possible corrections for 575 mode of operation, including no correction. 576
We estimated geographically varying trend patterns using a spatial GAM (95) using the 577 mgcv package in R (39). Seasonal migration traffic was standardized to each radar’s 11-year mean, 578 stored as variable ‘index’. We then modeled the spatial trend using an offset tensor product smooth 579 te(lon,lat) and a tensor smooth representing a spatially varying linear trend with year 580 te(lon,lat,by=year) on the linear predictor scale (see Table S3). We used a Gamma distribution 581 with log-link, such that our linear trend smooth term on the linear predictor scale represents a 582 spatially varying annual rate of change µtrend (with standard deviation strend) on the response scale. 583 The Gamma distribution accommodates a small right-skew in our continuous positive response 584 variable and warrants normality of deviance residuals, as inspected using QQ plots. Plots of the 585 spatial trend surfaces estimated for the models in Table S3 are shown in Figure S7. 586
Changes in seasonal migration traffic (Table S4, Figure 2D) were calculated as the GAM 587 prediction for year 2007 minus 2017 (the proportional loss over 11 years), times the 11-year 588 average seasonal migratory traffic (MT) of each station. The surface of average migratory traffic 589 was obtained from a kriging interpolation of the 11-year mean seasonal MT value for each station 590 (see Figure S6, 2). Average trends for the entire US (see main text and Table S3) were averaged 591 over all pixels of these spatially-explicit decline and loss surfaces across the contiguous US, using 592 arithmetic mean and harmonic mean for calculating mean and variance values, respectively, 593 effectively weighing the trend by passage of biomass. The trend value reported in the main text 594 refers to this biomass-weighted average trend for a model average of all GAM models in our 595 candidate set (listed in Table S3). Models were averaged using package MuMIn (96), which 596 averages models based on AIC (97). 597
We also estimated continental-wide trends in migratory passage and trends for four flyway 598 regions: Atlantic, Mississippi, Central and Western, following the definitions of the US Fish and 599 Wildlife Service, REF (cf. Figure 2B,C). We fitted generalized linear mixed models using R-600 package lme4 (98), including radar station as a random offset, and region and the interaction 601 year:region as fixed effects, see Table S4 for model structures and Table S5 for estimated model 602 parameters. Like in the GAM analysis, the candidate model set equaled for 4 models, containing 603 all combinations of possible corrections for operational mode. 604
Regional biomass passage indices (Figure 2A,B) were calculated as the yearly sum of 605 seasonal migration traffic values MT for the radars within each region, standardized by the sum of 606 seasonal migration traffic values MT for all radars in the network of the first year (2007). Values 607 of regionalized decline rates (Atlantic, Mississippi, Central and Western) in the main text are based 608 on the model average (96) of all GLMs in the candidate set. Reported errors represent standard 609 errors at a 95% confidence level. 610
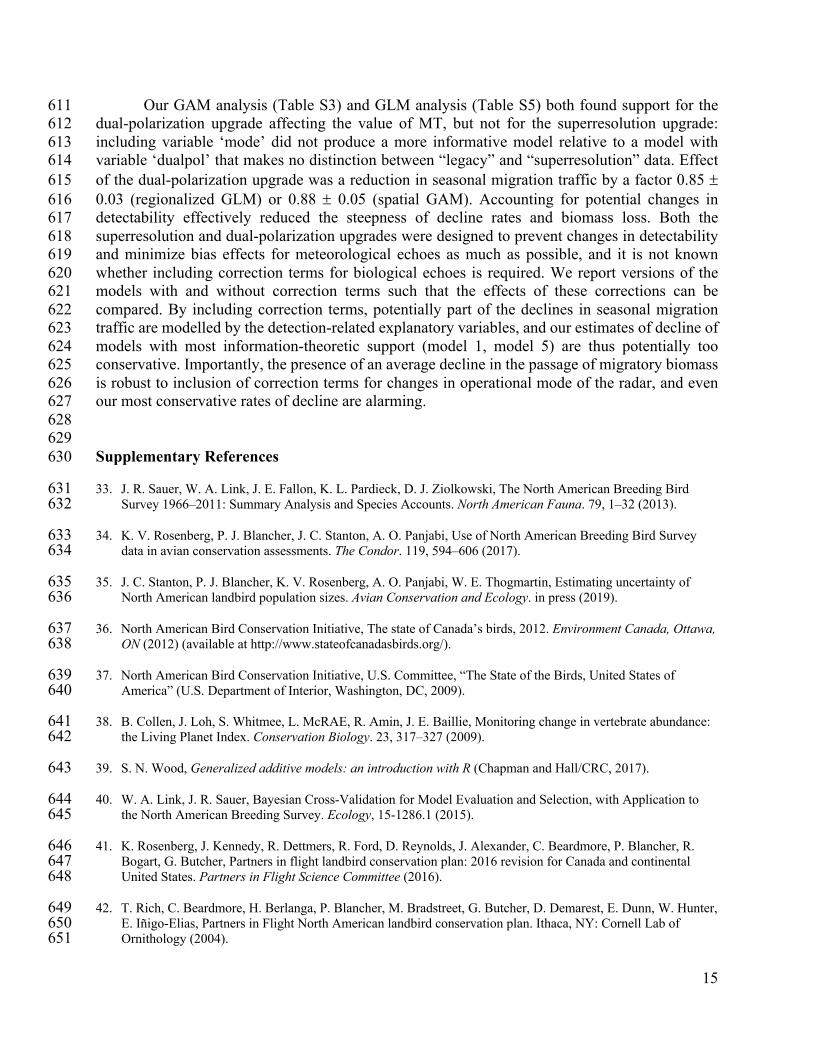
15
Our GAM analysis (Table S3) and GLM analysis (Table S5) both found support for the 611 dual-polarization upgrade affecting the value of MT, but not for the superresolution upgrade: 612 including variable ‘mode’ did not produce a more informative model relative to a model with 613 variable ‘dualpol’ that makes no distinction between “legacy” and “superresolution” data. Effect 614 of the dual-polarization upgrade was a reduction in seasonal migration traffic by a factor 0.85 ± 615 0.03 (regionalized GLM) or 0.88 ± 0.05 (spatial GAM). Accounting for potential changes in 616 detectability effectively reduced the steepness of decline rates and biomass loss. Both the 617 superresolution and dual-polarization upgrades were designed to prevent changes in detectability 618 and minimize bias effects for meteorological echoes as much as possible, and it is not known 619 whether including correction terms for biological echoes is required. We report versions of the 620 models with and without correction terms such that the effects of these corrections can be 621 compared. By including correction terms, potentially part of the declines in seasonal migration 622 traffic are modelled by the detection-related explanatory variables, and our estimates of decline of 623 models with most information-theoretic support (model 1, model 5) are thus potentially too 624 conservative. Importantly, the presence of an average decline in the passage of migratory biomass 625 is robust to inclusion of correction terms for changes in operational mode of the radar, and even 626 our most conservative rates of decline are alarming. 627
628 629
Supplementary References 630
33. J. R. Sauer, W. A. Link, J. E. Fallon, K. L. Pardieck, D. J. Ziolkowski, The North American Breeding Bird 631 Survey 1966–2011: Summary Analysis and Species Accounts. North American Fauna. 79, 1–32 (2013). 632
34. K. V. Rosenberg, P. J. Blancher, J. C. Stanton, A. O. Panjabi, Use of North American Breeding Bird Survey 633 data in avian conservation assessments. The Condor. 119, 594–606 (2017). 634
35. J. C. Stanton, P. J. Blancher, K. V. Rosenberg, A. O. Panjabi, W. E. Thogmartin, Estimating uncertainty of 635 North American landbird population sizes. Avian Conservation and Ecology. in press (2019). 636
36. North American Bird Conservation Initiative, The state of Canada’s birds, 2012. Environment Canada, Ottawa, 637 ON (2012) (available at http://www.stateofcanadasbirds.org/). 638
37. North American Bird Conservation Initiative, U.S. Committee, “The State of the Birds, United States of 639 America” (U.S. Department of Interior, Washington, DC, 2009). 640
38. B. Collen, J. Loh, S. Whitmee, L. McRAE, R. Amin, J. E. Baillie, Monitoring change in vertebrate abundance: 641 the Living Planet Index. Conservation Biology. 23, 317–327 (2009). 642
39. S. N. Wood, Generalized additive models: an introduction with R (Chapman and Hall/CRC, 2017). 643
40. W. A. Link, J. R. Sauer, Bayesian Cross-Validation for Model Evaluation and Selection, with Application to 644 the North American Breeding Survey. Ecology, 15-1286.1 (2015). 645
41. K. Rosenberg, J. Kennedy, R. Dettmers, R. Ford, D. Reynolds, J. Alexander, C. Beardmore, P. Blancher, R. 646 Bogart, G. Butcher, Partners in flight landbird conservation plan: 2016 revision for Canada and continental 647 United States. Partners in Flight Science Committee (2016). 648
42. T. Rich, C. Beardmore, H. Berlanga, P. Blancher, M. Bradstreet, G. Butcher, D. Demarest, E. Dunn, W. Hunter, 649 E. Iñigo-Elias, Partners in Flight North American landbird conservation plan. Ithaca, NY: Cornell Lab of 650 Ornithology (2004). 651

16
43. S. Brown, C. Hickey, B. Gill, L. Gorman, C. Gratto-Trevor, S. Haig, B. Harrington, C. Hunter, G. Morrison, G. 652 Page, National shorebird conservation assessment: Shorebird conservation status, conservation units, 653 population estimates, population targets, and species prioritization. Manomet Center for Conservation Sciences, 654 Manomet, MA (2000). 655
44. J. A. Kushlan, M. J. Steinkamp, K. C. Parsons, J. Capp, M. A. Cruz, M. Coulter, I. Davidson, L. Dickson, N. 656 Edelson, R. Elliot, Waterbird conservation for the Americas: the North American waterbird conservation plan, 657 version 1 (2002). 658
45. North American Bird Conservation Initiative, The State of North America’s Birds 2016. Environment and 659 Climate Change Canada: Ottawa, Ontario (2016) (available at http://www.stateofthebirds.org/2016/). 660
46. Partners in Flight, Avian Conservation Assessment Database, version 2017. Available at 661 http://pif.birdconservancy.org/ACAD. Accessed on Nov 5 2018. 662
47. J. R. Sauer, W. A. Link, Analysis of the North American Breeding Bird Survey Using Hierarchical Models. The 663 Auk. 128, 87–98 (2011). 664
48. J. R. Sauer, D. K. Niven, K. L. Pardieck, D. J. Ziolkowski, W. A. Link, Expanding the North American 665 Breeding Bird Survey Analysis to Include Additional Species and Regions. Journal of Fish and Wildlife 666 Management. 8, 154–172 (2017). 667
49. J. R. Sauer, K. L. Pardieck, D. J. Ziolkowski, A. C. Smith, M.-A. R. Hudson, V. Rodriguez, H. Berlanga, D. K. 668 Niven, W. A. Link, The first 50 years of the North American Breeding Bird Survey. The Condor. 119, 576–593 669 (2017). 670
50. J. A. Veech, K. L. Pardieck, D. J. Ziolkowski, How well do route survey areas represent landscapes at larger 671 spatial extents? An analysis of land cover composition along Breeding Bird Survey routes. The Condor. 119, 672 607–615 (2017). 673
51. M. F. Delany, R. A. Kiltie, R. S. Butryn, Land cover along breeding bird survey routes in Florida. Florida Field 674 Naturalist. 42, 15–28 (2014). 675
52. J. A. Veech, M. F. Small, J. T. Baccus, Representativeness of land cover composition along routes of the North 676 American Breeding Bird Survey. The Auk. 129, 259–267 (2012). 677
53. C. M. E. Keller, J. T. Scallan, Potential Roadside Biases Due to Habitat Changes along Breeding Bird Survey 678 Routes. The Condor. 101, 50–57 (1999). 679
54. J. B. C. Harris, D. G. Haskell, Land Cover Sampling Biases Associated with Roadside Bird Surveys. Avian 680 Conservation and Ecology. 2 (2007), doi:10.5751/ACE-00201-020212. 681
55. S. L. Van Wilgenburg, E. M. Beck, B. Obermayer, T. Joyce, B. Weddle, Biased representation of disturbance 682 rates in the roadside sampling frame in boreal forests: implications for monitoring design. Avian Conservation 683 and Ecology. 10 (2015), doi:10.5751/ACE-00777-100205. 684
56. M. G. Betts, D. Mitchell, A. W. Diamond, J. Bêty, Uneven Rates of Landscape Change as a Source of Bias in 685 Roadside Wildlife Surveys. Journal of Wildlife Management. 71, 2266 (2007). 686
57. C. U. Soykan, J. Sauer, J. G. Schuetz, G. S. LeBaron, K. Dale, G. M. Langham, Population trends for North 687 American winter birds based on hierarchical models. Ecosphere. 7, e01351 (2016). 688
58. J. Bart, S. Brown, B. Harrington, R. I. Guy Morrison, Survey trends of North American shorebirds: population 689 declines or shifting distributions? Journal of Avian Biology. 38, 73–82 (2007). 690

17
59. R. K. Ross, P. A. Smith, B. Campbell, C. A. Friis, R. G. Morrison, Population trends of shorebirds in southern 691 Ontario, 1974-2009. Waterbirds, 15–24 (2012). 692
60. M. E. Seamans, R.D. Rau, “American woodcock population status, 2017” (U.S. Fish and Wildlife Service, 693 Laurel, Maryland, 2017), (available at https://www.fws.gov/birds/surveys-and-data/reports-and-694 publications/population-status.php). 695
61. U.S. Fish and Wildlife Service, “Waterfowl population status, 2017” (U.S. Department of the Interior, 696 Washington, D.C. USA, 2017), (available at https://www.fws.gov/birds/surveys-and-data/reports-and-697 publications.php). 698
62. Anthony D Fox, James O Leafloor, “A global audit of the status and trends of Arctic and Northern Hemisphere 699 goose populations” (Conservation of Arctic Flora and Fauna International Secretariat, Akureyri, Iceland, 2018). 700
63. D. J. Groves, “The 2015 North American Trumpeter Swan Survey” (U.S. Fish and Wildlife Service, Juneau 701 Alaska, 2017), (available at https://www.fws.gov/birds/surveys-and-data/reports-and-publications.php). 702
64. K. V. Rosenberg, P. J. Blancher, in Bird Conservation Implementation and Integration in the Americas: 703 Proceedings of the Third International Partners in Flight Conference 2002 (C.J. Ralph and T.D. Rich, eds.) 704 PSW-GTR-191 (U.S.D.A. Forest Service, Albany, CA, 2005), vol. 191, pp. 57–67. 705
65. P. Blancher, K. Rosenberg, A. Panjabi, B. Altman, J. Bart, C. Beardmore, G. Butcher, D. Demarest, R. 706 Dettmers, E. Dunn, Guide to the Partners in Flight Population Estimates Database. Version: North American 707 Landbird Conservation Plan 2004. Partners in Flight Technical Series No 5. US Geological Survey Patuxent 708 Wildlife Research Center, Laurel, Md (2007) (available at https://www.partnersinflight.org/resources/pif-tech-709 series/). 710
66. P. J. Blancher, K. V. Rosenberg, A. O. Panjabi, B. Altman, A. R. Couturier, W. E. Thogmartin, Handbook to 711 the partners in flight population estimates database, version 2.0. PIF Technical Series (2013) (available at 712 http://pif.birdconservancy.org/PopEstimates/). 713
67. W. E. Thogmartin, F. P. Howe, F. C. James, D. H. Johnson, E. T. Reed, J. R. Sauer, F. R. Thompson, A review 714 of the population estimation approach of the North American Landbird Conservation Plan. The Auk. 123, 892 715 (2006). 716
68. Sea Duck Joint Venture, “Recommendations for Monitoring Distribution, Abundance, and Trends for North 717 American Sea Ducks” (U.S. Fish and Wildlife Service, Anchorage, Alaska and Canadian Wildlife Service, 718 Sackville, New Brunswick, 2007), (available at http://seaduckjv.org). 719
69. B. A. Andres, P. A. Smith, R. G. Morrison, C. L. Gratto-Trevor, S. C. Brown, C. A. Friis, Population estimates 720 of North American shorebirds, 2012. Wader Study Group Bull. 119, 178–194 (2012). 721
70. U.S. Shorebird Conservation Partnership, “Shorebird Flyway Population Database (Accessed: 28 Feb 2018)” 722 (2016), (available at https://www.shorebirdplan.org/science/assessment-conservation-status-shorebirds/). 723
71. P. G. Rodewald (Editor), The Birds of North America (Cornell Laboratory of Ornithology, Ithaca, NY, USA, 724 2018; https://birdsna.org). 725
72. A. O. Panjabi, P. J. Blancher, W. E. Easton, J. C. Stanton, D. W. Demarest, R. Dettmers, K. V. Rosenberg, 726 Partners in Flight Science Committee, “The Partners in Flight handbook on species assessment Version 2017,” 727 Partners in Flight Technical Series No. 3. Bird Conservancy of the Rockies (Partners in Flight, 2017). 728
73. Wetlands International, Waterbird Population Estimates (2018), (available at wpe.wetlands.org). 729

18
74. S. Bauer, J. W. Chapman, D. R. Reynolds, J. A. Alves, A. M. Dokter, M. M. H. Menz, N. Sapir, M. Ciach, L. 730 B. Pettersson, J. F. Kelly, H. Leijnse, J. Shamoun-Baranes, From Agricultural Benefits to Aviation Safety: 731 Realizing the Potential of Continent-Wide Radar Networks. BioScience. 67, 912–918 (2017). 732
75. T. D. Crum, R. L. Alberty, The WSR-88D and the WSR-88D Operational Support Facility. Bulletin of the 733 American Meteorological Society. 74, 1669–1687 (1993). 734
76. A. M. Dokter, F. Liechti, H. Stark, L. Delobbe, P. Tabary, I. Holleman, Bird migration flight altitudes studied 735 by a network of operational weather radars. Journal of The Royal Society Interface. 8, 30–43 (2011). 736
77. K. G. Horton, B. M. Van Doren, F. A. La Sorte, E. B. Cohen, H. L. Clipp, J. J. Buler, D. Fink, J. F. Kelly, A. 737 Farnsworth, Holding steady: Little change in intensity or timing of bird migration over the Gulf of Mexico. 738 Global Change Biology (2019), doi:10.1111/gcb.14540. 739
78. S. Ansari, S. Del Greco, E. Kearns, O. Brown, S. Wilkins, M. Ramamurthy, J. Weber, R. May, J. Sundwall, J. 740 Layton, A. Gold, A. Pasch, V. Lakshmanan, Unlocking the Potential of NEXRAD Data through NOAA’s Big 741 Data Partnership. Bulletin of the American Meteorological Society. 99, 189–204 (2018). 742
79. A. D. Siggia, R. E. Passarelli, in Proc. ERAD (2004), vol. 2, pp. 421–424. 743
80. J. N. Chrisman, C. A. Ray, in 32nd Conference on Radar Meteorology (2005). 744
81. R. L. Ice, R. D. Rhoton, D. S. Saxion, C. A. Ray, N. K. Patel, D. A. Warde, A. D. Free, O. E. Boydstun, D. S. 745 Berkowitz, J. N. Chrisman, J. C. Hubbert, C. Kessinger, M. Dixon, S. Torres, in 23rd International Conference 746 on Interactive Information Processing Systems for Meteorology, Oceanography, and Hydrology (2007). 747
82. P. M. Stepanian, K. G. Horton, V. M. Melnikov, D. S. Zrnić, S. A. Gauthreaux, Dual-polarization radar 748 products for biological applications. Ecosphere. 7, e01539 (2016). 749
83. A. M. Dokter, P. Desmet, J. H. Spaaks, S. van Hoey, L. Veen, L. Verlinden, C. Nilsson, G. Haase, H. Leijnse, 750 A. Farnsworth, W. Bouten, J. Shamoun-Baranes, bioRad: biological analysis and visualization of weather radar 751 data. Ecography (2018), doi:10.1111/ecog.04028. 752
84. A. M. Dokter, adokter/vol2bird: vol2bird (Version 0.4.0). Zenodo. (2019), (available at 753 http://doi.org/10.5281/zenodo.3369999). 754
85. A. M. Dokter, S. Van Hoey, P. Desmet, adokter/bioRad: bioRad (Version 0.4.0). Zenodo. (2019), (available at 755 http://doi.org/10.5281/zenodo.3370005). 756
86. R. J. Doviak, D. S. Zrnić, Doppler radar and weather observations (Dover Publications, Mineola, N.Y, 2nd ed., 757 Dover ed., 2006). 758
87. T. Chen, C. Guestrin, in Proceedings of the 22nd ACM SIGKDD International Conference on Knowledge 759 Discovery and Data Mining - KDD ’16 (ACM Press, San Francisco, California, USA, 2016; 760 http://dl.acm.org/citation.cfm?doid=2939672.2939785), pp. 785–794. 761
88. T. Chen, T. He, M. Benesty, V. Khotilovich, Y. Tang, xgboost: Extreme Gradient Boosting (2017; 762 https://github.com/dmlc/xgboost). 763
89. J. Davis, M. Goadrich, (ACM, 2006), pp. 233–240. 764
90. C. R. Vaughn, Birds and insects as radar targets: A review. Proceedings of the IEEE. 73, 205–227 (1985). 765
91. E. J. Pebesma, Multivariable geostatistics in S: the gstat package. Computers & Geosciences. 30, 683–691 766 (2004). 767

19
92. P. M. Stepanian, C. E. Wainwright, Ongoing changes in migration phenology and winter residency at Bracken 768 Bat Cave. Global Change Biology. 24, 3266–3275 (2018). 769
93. A. L. Russell, M. P. Cox, V. A. Brown, G. F. McCracken, Population growth of Mexican free-tailed bats 770 (Tadarida brasiliensis mexicana) predates human agricultural activity. BMC Evolutionary Biology. 11 (2011), 771 doi:10.1186/1471-2148-11-88. 772
94. V. A. Drake, D. R. Reynolds, Radar entomology: observing insect flight and migration (Cabi, 2012). 773
95. S. N. Wood, Fast stable restricted maximum likelihood and marginal likelihood estimation of semiparametric 774 generalized linear models: Estimation of Semiparametric Generalized Linear Models. Journal of the Royal 775 Statistical Society: Series B (Statistical Methodology). 73, 3–36 (2011). 776
96. Kamil Barton, “MuMIn: Multi-Model Inference” (R package version 1.42.1, 2018), (available at 777 https://CRAN.R-project.org/package=MuMIn). 778
97. K. P. Burnham, D. R. Anderson, Model selection and multimodel inference: a practical information-theoretic 779 approach (Springer, New York, NY, 2. ed., 2010). 780
98. D. Bates, M. Mächler, B. Bolker, S. Walker, Fitting Linear Mixed-Effects Models Using lme4. Journal of 781 Statistical Software. 67 (2015), doi:10.18637/jss.v067.i01. 782
99. D. W. Winkler, S. M. Billerman, I. J. Lovette, Bird families of the world: An invitation to the spectacular 783 diversity of birds (Lynx Edicions, 2015). 784
100. R. T. Chesser, K. J. Burns, C. Cicero, J. L. Dunn, A. W. Kratter, I. J. Lovette, P. C. Rasmussen, J. V. 785 Remsen, D. F. Stotz, B. M. Winger, K. Winker, Fifty-ninth Supplement to the American Ornithological 786 Society’s Check-list of North American Birds. The Auk. 135, 798–813 (2018). 787
788
789
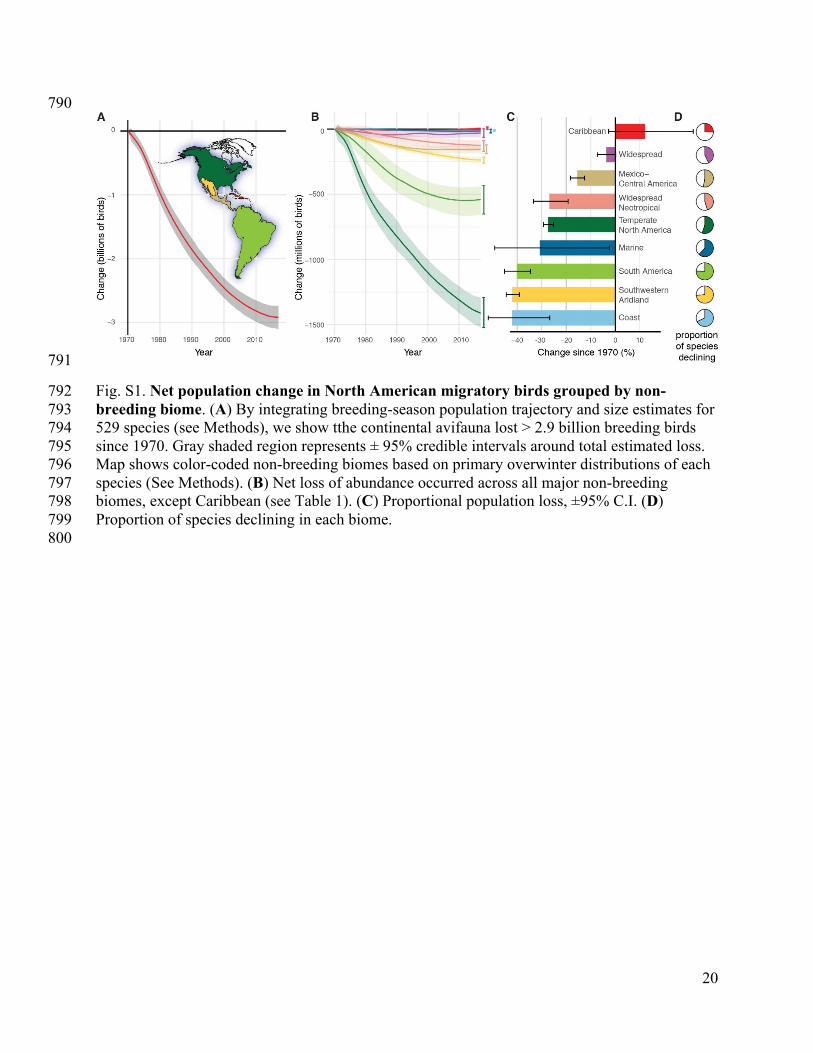
20
790
791
Fig. S1. Net population change in North American migratory birds grouped by non-792 breeding biome. (A) By integrating breeding-season population trajectory and size estimates for 793 529 species (see Methods), we show tthe continental avifauna lost > 2.9 billion breeding birds 794 since 1970. Gray shaded region represents ± 95% credible intervals around total estimated loss. 795 Map shows color-coded non-breeding biomes based on primary overwinter distributions of each 796 species (See Methods). (B) Net loss of abundance occurred across all major non-breeding 797 biomes, except Caribbean (see Table 1). (C) Proportional population loss, ±95% C.I. (D) 798 Proportion of species declining in each biome. 799 800

21
801
0.77M lost 3 species
9.2M lost 14 species
390M lost 10 species
2.8M lost 4 species
0.98M gained 22 species
6.3M lost 7 species
9.4M gained 1 species
3M lost 8 species
5.6M lost 14 species
Introduced − Introduced Marine − Arctic Tundra Marine − Coasts
Coastal − Arctic Tundra Coastal − Coasts Coastal − Wetland
Caribbean − Boreal Forest Caribbean − Eastern Forest Caribbean − Forest Generalist
1970 1980 1990 2000 2010 1970 1980 1990 2000 2010 1970 1980 1990 2000 2010
15
20
25
4
6
8
10
20
30
40
50
6
7
8
9
10
4
6
8
5
10
20
30
40
5
10
15
200
300
400
500
600
700
Milli
ons
of b
irds
in N
orth
Am
eric
an p
opul
atio
n
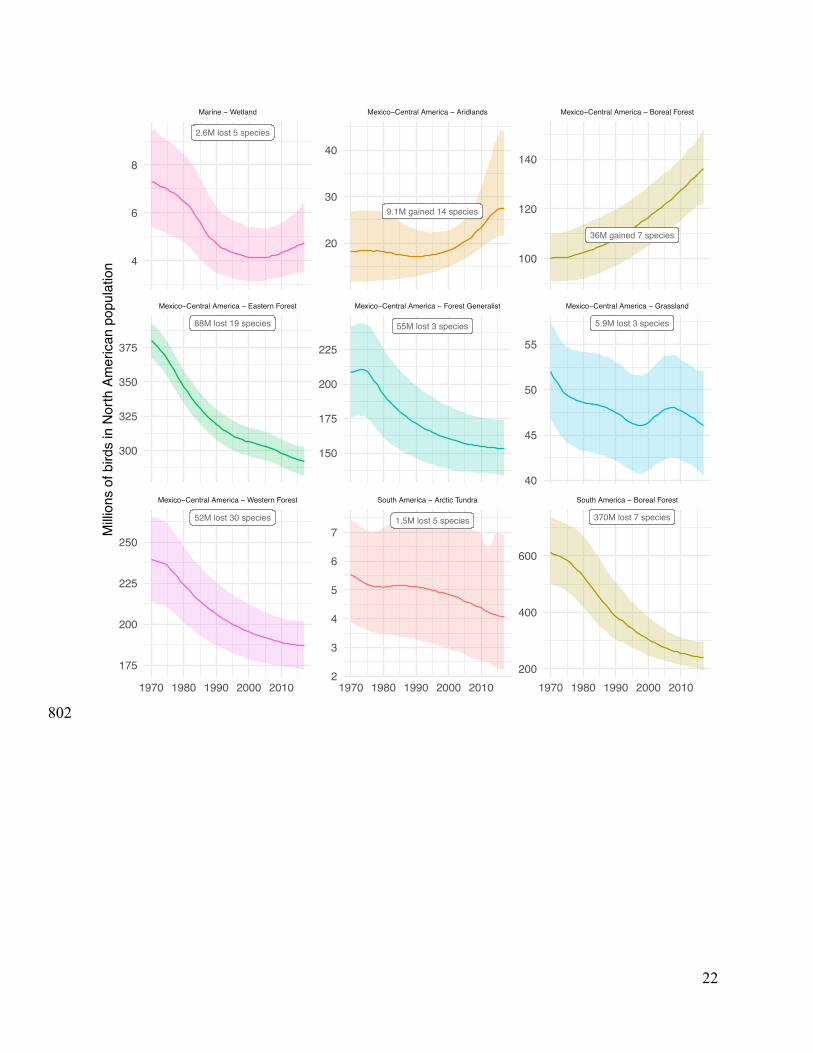
22
802
2.6M lost 5 species
88M lost 19 species
52M lost 30 species
9.1M gained 14 species
55M lost 3 species
1.5M lost 5 species
36M gained 7 species
5.9M lost 3 species
370M lost 7 species
Mexico−Central America − Western Forest South America − Arctic Tundra South America − Boreal Forest
Mexico−Central America − Eastern Forest Mexico−Central America − Forest Generalist Mexico−Central America − Grassland
Marine − Wetland Mexico−Central America − Aridlands Mexico−Central America − Boreal Forest
1970 1980 1990 2000 2010 1970 1980 1990 2000 2010 1970 1980 1990 2000 2010
100
120
140
40
45
50
55
200
400
600
20
30
40
150
175
200
225
2
3
4
5
6
7
4
6
8
300
325
350
375
175
200
225
250
Milli
ons
of b
irds
in N
orth
Am
eric
an p
opul
atio
n
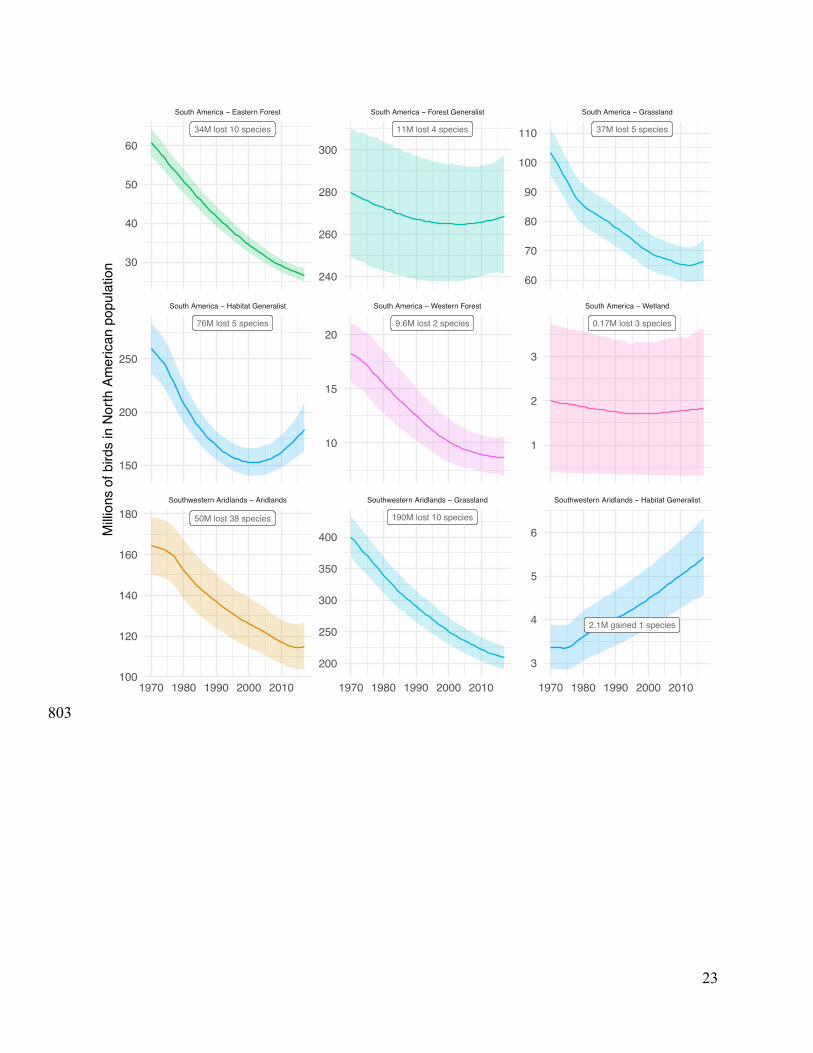
23
803
34M lost 10 species
76M lost 5 species
50M lost 38 species
11M lost 4 species
9.6M lost 2 species
190M lost 10 species
37M lost 5 species
0.17M lost 3 species
2.1M gained 1 species
Southwestern Aridlands − Aridlands Southwestern Aridlands − Grassland Southwestern Aridlands − Habitat Generalist
South America − Habitat Generalist South America − Western Forest South America − Wetland
South America − Eastern Forest South America − Forest Generalist South America − Grassland
1970 1980 1990 2000 2010 1970 1980 1990 2000 2010 1970 1980 1990 2000 2010
60
70
80
90
100
110
1
2
3
3
4
5
6
240
260
280
300
10
15
20
200
250
300
350
400
30
40
50
60
150
200
250
100
120
140
160
180
Milli
ons
of b
irds
in N
orth
Am
eric
an p
opul
atio
n

24
804
0.58M gained 1 species
92M lost 15 species
380M lost 26 species
53M lost 20 species
0.66M lost 1 species
480M lost 12 species
3.7M gained 8 species
26M lost 20 species
330M lost 13 species
Temperate North America − Forest Generalist Temperate North America − Grassland Temperate North America − Habitat Generalist
Temperate North America − Boreal Forest Temperate North America − Coasts Temperate North America − Eastern Forest
Southwestern Aridlands − Western Forest Temperate North America − Arctic Tundra Temperate North America − Aridlands
1970 1980 1990 2000 2010 1970 1980 1990 2000 2010 1970 1980 1990 2000 2010
20
25
30
300
320
340
360
600
700
800
900
1000
200
250
300
350
0
1
2
300
400
500
600
700
800
0.00
0.25
0.50
0.75
1.00
1.25
450
500
550
600
1400
1600
1800
Milli
ons
of b
irds
in N
orth
Am
eric
an p
opul
atio
n

25
805
78M lost 33 species
0.027M lost 1 species
0.0028M gained 1 species
22M gained 44 species
6.9M gained 1 species
18M lost 18 species
10M lost 5 species
14M lost 4 species
0.49M gained 1 species
Widespread − Grassland Widespread − Habitat Generalist Widespread − Western Forest
Widespread − Coasts Widespread − Eastern Forest Widespread − Forest Generalist
Temperate North America − Western Forest Temperate North America − Wetland Widespread − Arctic Tundra
1970 1980 1990 2000 2010 1970 1980 1990 2000 2010 1970 1980 1990 2000 2010
10
20
30
40
160
180
200
220
1
2
3
80
90
100
110
120
130
10
15
500
525
550
575
600
120
150
180
210
240
0.1
0.2
0.08
0.12
0.16
0.20Milli
ons
of b
irds
in N
orth
Am
eric
an p
opul
atio
n

26
806
Fig. S2. 807 Change in number of birds in North America by combined nonbreeding and breeding biomes 808 from 1970–2017. Each panel of the figure shows the 1970-2017 trajectory of summed abundance 809 across the species that share a given combination of nonbreeding and breeding biomes (e.g., the 810 first panel shows the trajectory in summed abundance across the 3 species that winter in the 811 Caribbean and breed in the boreal forest). The panel title indicates the wintering biome followed 812 by the breeding biome; labels within the plots show the estimated change in total abundance in 813 millions (M) of birds between 1970 and 2017, and the number of species included in the group. 814 Colored lines and the colored uncertainty bounds represent the median and 95% C.I. of the 815 posterior distribution from the hierarchical Bayesian model. The panels are sorted by 816 nonbreeding biome and the lines are coloured based on the breeding biome. 817
4.1M gained 29 species
23M lost 9 species
0.19M gained 6 species
0.26M gained 2 species
30M lost 2 species
75M lost 2 species
0.0035M lost 1 species
Widespread Neotropical − Wetland
Widespread Neotropical − Eastern Forest Widespread Neotropical − Forest Generalist Widespread Neotropical − Habitat Generalist
Widespread − Wetland Widespread Neotropical − Aridlands Widespread Neotropical − Boreal Forest
1970 1980 1990 2000 2010
1970 1980 1990 2000 2010 1970 1980 1990 2000 2010
100
150
200
250
0.004
0.008
0.012
0.016
3
4
5
6
80
100
120
30
35
40
45
50
55
120
130
140
150
0.1
0.2
0.3
0.4
0.5
Milli
ons
of b
irds
in N
orth
Am
eric
an p
opul
atio
n

27
818
Fig. S3. 819 Example of vertical profile time series for bird density and speed retrieved in dual polarization 820 mode (A, precipitation-free reference) and the final single-polarization product used in the study 821 (B) for the KBGM radar from 28-31 May 2017. The full-profile classifier that screens 822 precipitation uses the reflectivity product obtained in single-polarization mode (C) and the total 823 reflectivity including precipitation (D). Precipitation is characterized by high reflectivities 824 spanning a large part of the vertical air column (see D), as well by cases in which the single-825 polarization rain filter removes part (but not necessarily all) of the signal (C versus D). The final 826 single-polarization product (B) closely matches the dual-polarization mode reference (A), see 827 also E, black and blue lines closely overlapping). 828
500
1500
2500
heig
ht [m
]
1251025501002005001000
bird
den
sity
[km
-3]
500
1500
2500
heig
ht [m
]
1251025501002005001000
bird
den
sity
[km
-3]
500
1500
2500
heig
ht [m
]
1251025501002005001000
bird
den
sity
[km
-3]
500
1500
2500
heig
ht [m
]
ï�051015202530
Ref
lect
vitiy
fact
or (d
BZ)
020
0060
00
time
mig
ratio
n tra
ffic
rate
[#/k
m/h
]A. Dual polarization mode (reference)
B. Single polarization mode + classifier (final result)
C. Single polarization mode
D. Total reflectivity (DBZH)
Dual-polarization mode (reference)Single-polarization mode + classifier (final result)Single-polarization mode
E.

28
829
Fig. S4. 830 Coefficient of determination R2 between full-spring seasonal migration traffic values calculated 831 in single polarization mode (rain-filtered using full-profile classifier) and dual-polarization mode 832 reference (R2 based on n=143 stations * 4 years = 572 points), as a function of the classification 833 threshold Hmax. The value of R2 peaks at Hmax = 1600 m . 834 835
●
●
●
●
●● ● ● ● ● ● ● ● ● ● ●
● ● ● ● ● ●●
●
●
●
●
●
●
0.7
0.8
0.9
1.0
1000 2000 3000height [km]
R2

29
836
Fig. S5. Seasonal migration traffic (MT) as estimated in dual-polarization mode and in single-837 polarization mode (rain-filtered using full-profile classifier) for the years 2014-2017 (n=143 838 stations * 4 year = 572 points). Solid line equals the y=x line of perfect correspondence. This 839 figure shows MT values for Hmax = 1600 m, which achieves the best correspondence with the 840 dual-polarization reference mode (see Figure S4). 841 842
●
●●
●
●
●
●●
●
●
●
●●
●
●●
●●●
●
●
●
●
●
●
●
●
●
●
●
●
●
●
●
●
●
●
●
●●
●●
●●
●
●
●
●
●●●
●
●
●
●
●
●
●●●
●
●
●
●
●
●
●
●
●●●
●
●
●
●
●
●
●
●
●●
●●
● ●●
●●
●
●
●●
●
●
●●
●
●
●
●
●●●
●
●
●
●
●
●
●
●
●
●●
●
●
●
●
●
●
●
●
●
●
●
●
●
●●
●
●
●
●
●
●
●●
●
●
●
●●●
●
● ●
●
●
●
●
●
●
●
●
●
●
●
●
●
●● ●●
●●●
●●
●
●
●
●
●●●
●
●●●
●
●
●
●
●
●●
●
●
●
●●
●
●
● ●
●
●
●
●
●
●
●
●●●
●
●
●●
●
●
●
●
●
●
●
●
●●
●●●●
●●●●
●
●
●
●
●
●●
●
●●
●
●
●
●
●
●
●●
●
●
●
●
●●
●
●
●●
●
●
●●
● ●
●
●
●
●●●
●●
●
●
●
●
●●
●
●
●
●
●●●●
●
●
●
●
●
●
●
●
●●●
●
●
●
●
●
●
●
●
●
●
●
●
●
●
●●
●
●
●
●
●
●
●
●
●
●
●
●
● ●
●
●
●
●
●
●
●
●●
●
●
●●●
●
●
●●
●
●●
●●
●
●
●●
●
●●●
●
●●
●
●
●
●
●
●
●
●
●
●
●
●
●
●●
●
●
●
●
●
●
●●
●●
●
●
●
●
●●
●
●
●
●
●
●
●
●
●
●
●
●
●●
●
●
●
●
●
●●
●
●
●
●●
●
●
●
●
●
●
● ●
● ●●
●
●
●
●
●
●
●
●
●
●
●
●●
●
●
●
●
●
●
●●●●
●
●
●
●●
●
●●●
●
●●
●
●
●●
●
●
● ●
● ●
●
●
●
●
●●●●
●●
●●
●
●
●
●
●
●
●
●
●
●●
●
●
●
●
●
● ●
●
●
●
●
●
●
●
●●
●
●
●
●●
●●●
●
●●
●●
●
●
●●
●●
●
●
●
●●
●
●
●
●
●
●●
●
●
●
●
●
●
●
●
●
●
●
●●
●
●
●
●
●
●
●
●●
●
●●
●
●
●●
●
0e+00
1e+06
2e+06
3e+06
4e+06
5e+06
0e+00 1e+06 2e+06 3e+06 4e+06 5e+06migration traffic dual−pol [birds/km/season]
mig
ratio
n tra
ffic
sing
le−p
ol [b
irds/
km/s
easo
n]
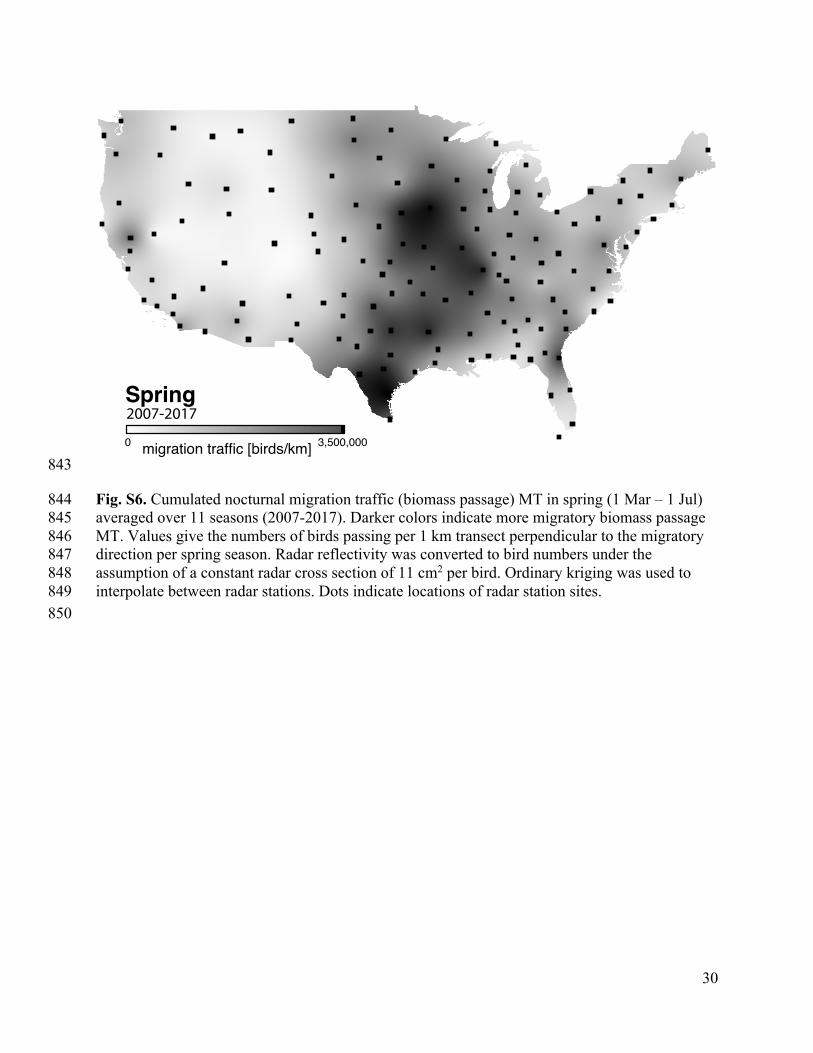
30
843
Fig. S6. Cumulated nocturnal migration traffic (biomass passage) MT in spring (1 Mar – 1 Jul) 844 averaged over 11 seasons (2007-2017). Darker colors indicate more migratory biomass passage 845 MT. Values give the numbers of birds passing per 1 km transect perpendicular to the migratory 846 direction per spring season. Radar reflectivity was converted to bird numbers under the 847 assumption of a constant radar cross section of 11 cm2 per bird. Ordinary kriging was used to 848 interpolate between radar stations. Dots indicate locations of radar station sites. 849 850
Spring
0 3,500,000migration traffic [birds/km]
2007-2017

31
851
Fig. S7. GAM spatial trend surfaces estimated for the models in Table S3 for the period 2007-852 2017. Darker red colors indicate higher declines and loss of migration traffic (biomass passage) 853 MT, while blue colors indicate migration traffic increase. Gray shaded regions have an annual 854 rate of change µtrend that is smaller than twice the standard deviation in the rate of change strend, 855 i.e. µtrend < 2*strend. Overlaid circles indicate single-site trend estimates (circle color) and their 856 significance (circle area ~ log(1/p)), with closed circles being significant at a 95% confidence 857 level. Single site trends are fits to seasonal migration traffic data of each radar site separately, 858 using a Generalized Linear Model (GLM) with a Gamma distributional family and log-link. 859 Detectability effects as estimated by the GAM were accounted for in the single-site data prior to 860 fitting the GLMs. 861 862 863 864 865 866 867

32
Table S1. 868 Data sources for population size estimates and population trajectories for 529 North American 869 bird species included in the net population change analysis for the present study. We used 870 published sources of data wherever possible, and applied published methods to calculate 871 estimates for the remaining species. Brief description of methodology, time-span, seasonal, and 872 geographic coverage of surveys and other data sources provided, along with number of species 873 for which that source was used and key citations. 874 875
Data source Years Season Methods Coverage N Spp.
Trajectory N Spp.
Pop Refs
North American Breeding Bird Survey (BBS)
1970-2017 Breeding
25-mile roadside surveys with 50 3-minute point counts
>4,100 routes in contiguous U.S., southern Canada 415 0 (33, 34,
47)
North American Breeding Bird Survey (BBS)
1993-2017 Breeding
25-mile roadside surveys with 50 3-minute point counts
Same as above, with additional routes in northern Canada and Alaska
19 0 (48)
Audubon Christmas Bird Count (CBC)
1970-2017 Winter
Non-standard counts within 15-mile diameter circles
1,500-2,000 circles in U.S. and Canada 58 0 (57)
Partners in Flight (PIF) Population Estimates
2006-2015
Breeding adults
Extrapolation from BBS and other survey count data
Same as BBS, above 0 399* (35)
Arctic goose surveys (CAFF 2018)
1975-2014 Variable
Aerial or ground surveys or mark-recapture models, depending on species
Continentwide for each species 7 7 (62)
Shorebird Migration Surveys
1974-2016
Fall migration
Volunteer-conducted surveys at pre-determined sites
Canada and U.S., concentrated in eastern portion
20 0 (58, 59)
USFWS Breeding Waterfowl Surveys
1970-2017 Breeding
Aerial surveys corrected for detectability with ground surveys
2.0 million square miles in Alaska, Canada, and northern U.S.
9 13 (61)
North American Trumpteter Swan Survey
1968-2015 Breeding Aerial surveys and
ground counts Rangewide 1 1 (63)
American Woodcock Singing Ground Survey
1968-2017 Breeding 3.6-mile roadside
routes 1,500 routes in eastern North America 1 0 (60)
2007 Seaduck Joint Venture Report
1970-2007 Variable Compilation of best
available estimates Continentwide for each species 0 14 (68)
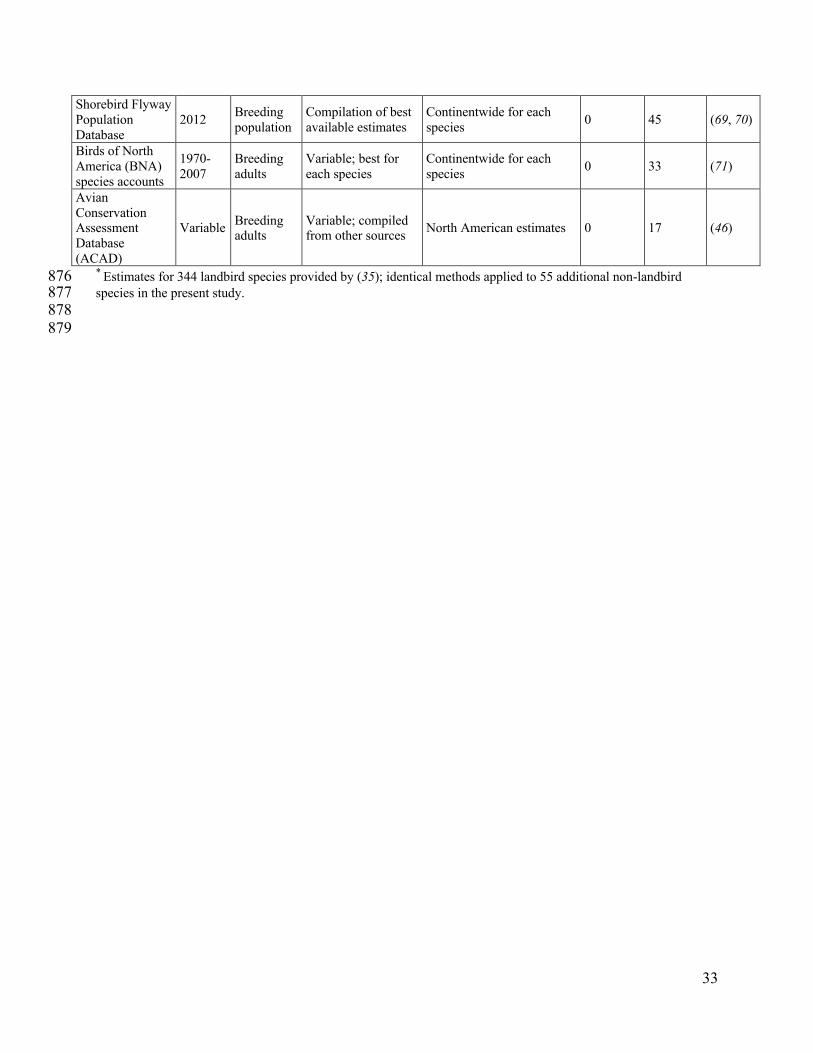
33
Shorebird Flyway Population Database
2012 Breeding population
Compilation of best available estimates
Continentwide for each species 0 45 (69, 70)
Birds of North America (BNA) species accounts
1970-2007
Breeding adults
Variable; best for each species
Continentwide for each species 0 33 (71)
Avian Conservation Assessment Database (ACAD)
Variable Breeding adults
Variable; compiled from other sources North American estimates 0 17 (46)
* Estimates for 344 landbird species provided by (35); identical methods applied to 55 additional non-landbird 876 species in the present study. 877 878 879
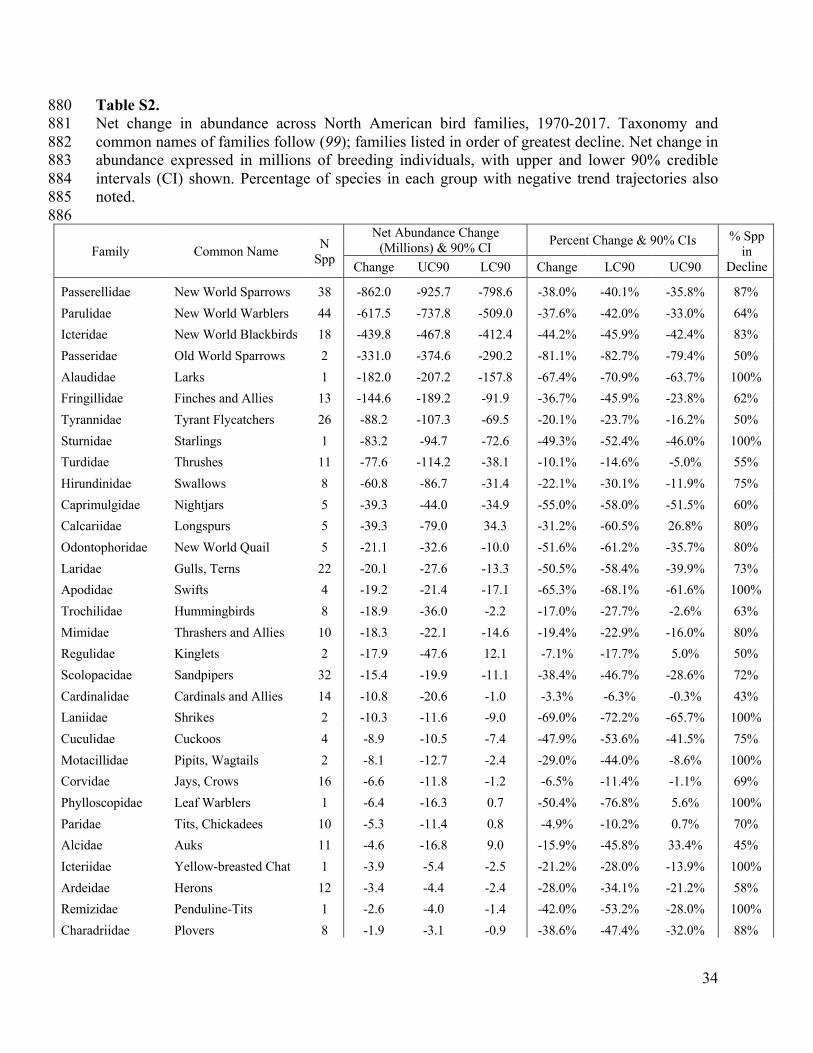
34
Table S2. 880 Net change in abundance across North American bird families, 1970-2017. Taxonomy and 881 common names of families follow (99); families listed in order of greatest decline. Net change in 882 abundance expressed in millions of breeding individuals, with upper and lower 90% credible 883 intervals (CI) shown. Percentage of species in each group with negative trend trajectories also 884 noted. 885 886
Family Common Name N Spp
Net Abundance Change (Millions) & 90% CI Percent Change & 90% CIs % Spp
in Decline Change UC90 LC90 Change LC90 UC90
Passerellidae New World Sparrows 38 -862.0 -925.7 -798.6 -38.0% -40.1% -35.8% 87% Parulidae New World Warblers 44 -617.5 -737.8 -509.0 -37.6% -42.0% -33.0% 64% Icteridae New World Blackbirds 18 -439.8 -467.8 -412.4 -44.2% -45.9% -42.4% 83% Passeridae Old World Sparrows 2 -331.0 -374.6 -290.2 -81.1% -82.7% -79.4% 50% Alaudidae Larks 1 -182.0 -207.2 -157.8 -67.4% -70.9% -63.7% 100% Fringillidae Finches and Allies 13 -144.6 -189.2 -91.9 -36.7% -45.9% -23.8% 62% Tyrannidae Tyrant Flycatchers 26 -88.2 -107.3 -69.5 -20.1% -23.7% -16.2% 50% Sturnidae Starlings 1 -83.2 -94.7 -72.6 -49.3% -52.4% -46.0% 100% Turdidae Thrushes 11 -77.6 -114.2 -38.1 -10.1% -14.6% -5.0% 55% Hirundinidae Swallows 8 -60.8 -86.7 -31.4 -22.1% -30.1% -11.9% 75% Caprimulgidae Nightjars 5 -39.3 -44.0 -34.9 -55.0% -58.0% -51.5% 60% Calcariidae Longspurs 5 -39.3 -79.0 34.3 -31.2% -60.5% 26.8% 80% Odontophoridae New World Quail 5 -21.1 -32.6 -10.0 -51.6% -61.2% -35.7% 80% Laridae Gulls, Terns 22 -20.1 -27.6 -13.3 -50.5% -58.4% -39.9% 73% Apodidae Swifts 4 -19.2 -21.4 -17.1 -65.3% -68.1% -61.6% 100% Trochilidae Hummingbirds 8 -18.9 -36.0 -2.2 -17.0% -27.7% -2.6% 63% Mimidae Thrashers and Allies 10 -18.3 -22.1 -14.6 -19.4% -22.9% -16.0% 80% Regulidae Kinglets 2 -17.9 -47.6 12.1 -7.1% -17.7% 5.0% 50% Scolopacidae Sandpipers 32 -15.4 -19.9 -11.1 -38.4% -46.7% -28.6% 72% Cardinalidae Cardinals and Allies 14 -10.8 -20.6 -1.0 -3.3% -6.3% -0.3% 43% Laniidae Shrikes 2 -10.3 -11.6 -9.0 -69.0% -72.2% -65.7% 100% Cuculidae Cuckoos 4 -8.9 -10.5 -7.4 -47.9% -53.6% -41.5% 75% Motacillidae Pipits, Wagtails 2 -8.1 -12.7 -2.4 -29.0% -44.0% -8.6% 100% Corvidae Jays, Crows 16 -6.6 -11.8 -1.2 -6.5% -11.4% -1.1% 69% Phylloscopidae Leaf Warblers 1 -6.4 -16.3 0.7 -50.4% -76.8% 5.6% 100% Paridae Tits, Chickadees 10 -5.3 -11.4 0.8 -4.9% -10.2% 0.7% 70% Alcidae Auks 11 -4.6 -16.8 9.0 -15.9% -45.8% 33.4% 45% Icteriidae Yellow-breasted Chat 1 -3.9 -5.4 -2.5 -21.2% -28.0% -13.9% 100% Ardeidae Herons 12 -3.4 -4.4 -2.4 -28.0% -34.1% -21.2% 58% Remizidae Penduline-Tits 1 -2.6 -4.0 -1.4 -42.0% -53.2% -28.0% 100% Charadriidae Plovers 8 -1.9 -3.1 -0.9 -38.6% -47.4% -32.0% 88%

35
Alcedinidae Kingfishers 1 -1.6 -1.9 -1.3 -47.8% -51.5% -44.0% 100% Procellariidae Petrels 1 -1.0 -3.8 3.7 -33.8% -79.3% 104.4% 100% Aegithalidae Long-tailed Tits 1 -0.9 -1.4 -0.3 -28.4% -42.5% -10.7% 100% Podicipedidae Grebes 6 -0.7 -2.6 1.9 -10.9% -35.8% 35.7% 50% Sylviidae Sylviid Warblers 1 -0.6 -1.1 -0.3 -27.7% -38.0% -15.4% 100% Cinclidae Dippers 1 -0.03 -0.05 0.00 -15.5% -27.2% -2.0% 100% Aramidae Limpkin 1 0.00 -0.02 0.02 -15.0% -62.1% 89.0% 100% Ciconiidae Storks 1 0.01 0.00 0.02 77.6% 18.3% 166.9% 0% Haematopodidae Oystercatchers 2 0.01 0.01 0.02 123.7% 59.5% 218.0% 0% Falconidae Falcons, Caracaras 6 0.03 -0.49 0.63 0.5% -9.3% 12.6% 33% Anhingidae Anhingas 1 0.03 0.02 0.04 109.1% 66.3% 164.5% 0% Psittacidae Parrots 1 0.1 0.0 0.3 >1000% >1000% >1000% 0% Tytonidae Barn Owls 1 0.1 0.1 0.2 211.6% 132.6% 317.8% 0% Recurvirostridae Avocets, Stilts 2 0.2 0.0 0.5 57.5% 16.2% 174.6% 0% Ptiliogonatidae Silky Flycatchers 1 0.3 0.0 0.7 26.4% -3.8% 65.2% 0% Sulidae Boobies 1 0.4 0.2 0.7 988.6% 497.0% 1891.7% 0% Gaviidae Loons 3 0.4 0.1 0.8 32.6% 11.7% 60.7% 33% Pandionidae Osprey 1 0.4 0.3 0.5 304.4% 248.4% 370.3% 0% Rallidae Rails, Coots 7 0.6 -1.9 4.2 6.2% -18.1% 40.5% 57% Gruidae Cranes 1 0.7 0.5 0.9 914.5% 743.0% 1119.1% 0% Pelecanidae Pelicans 2 0.7 0.5 1.2 810.4% 534.6% 1214.2% 0% Phalacrocoracidae Cormorants 4 0.8 0.4 1.3 152.3% 73.1% 267.3% 50% Strigidae Owls 11 1.7 0.5 3.4 15.9% 4.6% 30.1% 64% Certhiidae Treecreepers 1 2.5 1.5 3.7 33.6% 20.8% 47.9% 0% Threskiornithidae Ibises, Spoonbills 4 2.9 1.4 6.3 332.8% 167.3% 639.4% 0% Columbidae Doves, Pigeons 7 3.6 -17.4 43.3 1.9% -9.0% 23.1% 57% Accipitridae Hawks 16 5.5 5.0 6.0 78.9% 71.8% 86.4% 19% Bombycillidae Waxwings 2 8.0 2.1 14.6 13.8% 3.6% 25.0% 50% Cathartidae New World Vultures 2 9.4 8.3 10.6 265.3% 238.7% 293.6% 0% Troglodytidae Wrens 10 13.3 6.5 20.7 13.8% 6.8% 21.5% 40% Picidae Woodpeckers 21 13.6 10.2 17.2 18.5% 13.9% 23.4% 33% Sittidae Nuthatches 4 14.4 11.0 18.4 66.6% 50.5% 85.0% 50% Phasianidae Grouse and Allies 12 15.2 2.9 36.6 24.3% 4.5% 56.4% 33% Polioptilidae Gnatcatchers 2 31.9 12.7 54.5 15.6% 6.2% 26.3% 0% Anatidae Waterfowl 42 34.8 24.5 48.3 56.1% 37.9% 79.5% 43% Vireonidae Vireos 12 89.9 78.6 102.1 53.6% 46.7% 60.7% 17%
887

36
Table S3. 888 GAM spatial trend analysis and model comparison. AIC gives Akaike’s An Information Criterion. 889 df gives degrees of freedom. Models significantly different according to a Chi-squared likelihood 890 ratio test are labelled by different letters (a,b). Change in biomass traffic was calculated as a spatial 891 mean of the multiplication of spatial trend and kriging-interpolated biomass passage. Changes in 892 biomass traffic are based on spatial averages of the GAM predictions over the contiguous US, as 893 detailed in the text. From left to right: % / yr = annual rate of decline in seasonal migration traffic, 894 % = decline over the period 2007-2017, loss in seasonal migration traffic, p = significance of the 895 te(lon,lat):year trend term. See Figure S7 for plots of the estimated smoothed spatial trend. 896 897 change in biomass traffic 2007-2017 Model* Formula AIC df % / yr % 105 birds/km p 1 index ~ te(lon,lat) +
te(lon,lat):year + dualpol†
337 10 a -1.2 ± 0.7 -11.6 ± 5.9 -1.4 ± 1.7 <0.0001
2 index ~ te(lon,lat) + te(lon,lat):year + mode‡
338 11 a -1.6 ± 0.8 -14.8 ± 7.2 -1.8 ± 1.9 <0.0001
3 Index ~ te(lon,lat) + te(lon,lat):year + superres§
342 10 b -2.9 ± 0.5 -25.6 ± 4.2 -3.2 ± 2.8 <0.0001
4 index ~ te(lon,lat) + te(lon,lat):year
360 9 c -3.3 ± 0.6 -28.7 ± 4.1 -3.7 ± 3.1 <0.0001
1-4 (model average) -1.5 ± 1.0 -13.6 ± 9.1 -1.7 ± 1.8 *Family=Gamma(link=log) 898 ‡mode is a factor variable with levels “legacy”, “superres” and “dualpol”, distinguishing the three time periods in 899 which the radar acquired legacy, super-resolution and dual-polarization data. Note that the dual-polarization upgrade 900 occurred after the super-resolution upgrade, and dual-polarization data includes super-resolution. 901 †dualpol is a logical variable that is true after the dual-polarization upgrade, and false before 902 §superres is a logical variable that is true after the superresolution upgrade, and false before 903 904 905 906

37
Table S4. 907 Model comparison of regionalized generalized mixed models, differentiating in four geographic 908 flyway regions: Atlantic, Mississippi, Central and Western (see Fig. XXX). AIC gives Akaike’s 909 An Information Criterion, df degrees of freedom. Models significantly different according to a 910 Chi-squared likelihood ratio test are labelled by different letters (a,b). We found support for an 911 effect of dual-polarization upgrade on detected biomass passage (cf. model 5), but not for 912 additional correction for the superresolution upgrade (model 6 did not improve over model 5). See 913 Table S5 for fixed effect estimates. 914
915 Model* Formula AIC df 5 index ~ region + year:flyway + (1 | radar) + dualpol† 338 11 a 6 index ~ region + year:flyway + (1 | radar) + mode‡ 340 12 a 7 Index ~ region + year:flyway + (1 | radar) + superres 343 11 b 8 Index ~ region + year:flyway + (1 | radar) 361 10 c
*Family=Gamma(link=log) 916 ‡mode is a factor variable with levels “legacy”, “superres” and “dualpol”, distinguishing the three time periods in 917 which the radar acquired legacy, super-resolution and dual-polarization data. Note that the dual-polarization upgrade 918 occurred after the super-resolution upgrade, and dual-polarization data includes super-resolution. 919 †dualpol is a logical variable that is true after the dual-polarization upgrade, and false before 920 §superres is a logical variable that is true after the superresolution upgrade, and false before 921 922 923

38
Table S5. 924 Parameter estimates of temporal and detection-related fixed effects, based on generalized mixed 925 models differentiating in three geographic regions: west (lon < -105°), central (-105° < lon < -95°) 926 and east (lon> -95°). Estimates of change in migratory biomass traffic are expressed as percentages 927 change per year. Explanatory variable year was scaled to zero at 2007. Significant model terms are 928 highlighted in bold. See Table S4 for model comparisons. 929 930 Model Fixed effect Estimate Unit t p 5 year:flyway_Atlantic -3.0 ± 0.6 %/yr -4.7 <0.0001 5 year:flyway_Mississippi -2.7 ± 0.6 %/yr -4.5 <0.0001 5 year:flyway_Central 0.6 ± 0.6 %/yr 1.0 0.3 5 year:flyway_Pacific 0.2 ± 0.6 %/yr 0.3 0.8 5 dualpol=TRUE -16 ± 3 % -5.0 <0.0001 6 year:flyway_Atlantic -3.4 ± 0.7 %/yr -4.5 <0.0001 6 year:flyway_Mississippi -3.0 ± 0.7 %/yr -4.2 <0.0001 6 year:flyway_Central 0.2 ± 0.7 %/yr 0.3 0.7 6 year:flyway_Pacific 0.1 ± 0.8 %/yr -0.2 0.9 6 mode=”superres” 25 ± 27 % 0.9 0.4 6 mode=”dualpol” -12 ± 5 % -2.4 0.02 7 year:flyway_Atlantic -4.7 ± 0.5 %/yr -9.9 <0.0001 7 year:flyway_Mississippi -4.4 ± 0.4 %/yr -10.2 <0.0001 7 year:flyway_Central -1.2 ± 0.4 %/yr -2.7 0.007 7 year:flyway_Pacific -1.5 ± 0.5 %/yr -3.0 0.003 7 superres=TRUE 8 ± 2 % 4.4 <0.0001 8 year:flyway_Atlantic -5.2 ± 0.5 %/yr -10.9 <0.0001 8 year:flyway_Mississippi -4.8 ± 0.4 %/yr -11.3 <0.0001 8 year:flyway_Central -1.5 ± 0.4 %/yr -3.5 0.0004 8 year:flyway_Pacific -1.9 ± 0.5 %/yr -3.8 0.0001 5-8 (average) † year:flyway_Atlantic -3.2 ± 0.8 %/yr 4.1* <0.0001 5-8 (average) † year:flyway_Mississippi -2.9 ± 0.7 %/yr 3.9* 0.0001 5-8 (average) † year:flyway_Central 0.4 ± 0.8 %/yr 0.5* 0.6 5-8 (average) † year:flyway_Pacific 0.3 ± 0.8 %/yr 0.0* 1.0
*z value instead of t value 931 †showing full model-averaged coefficients for temporal fixed effects only 932 933 934 935

39
936
Data S1. (separate file) 937 Species-specific data and results for analysis of net population change in the North American 938 avifauna. Included are 529 species with common and scientific names, taxonomic sort number 939 (100), bird family, species group and biome assignments, absolute and proportional changes in 940 abundance with associated variance, start and end-year population estimates with variance, and 941 source data for population size estimates and population trajectories for each species. A separate 942 worksheet in the same file contains definitions of each column header. 943 944
Data S2. (separate file) 945 Species-specific adjustment factors used in the calculation of Partners in Flight (PIF) 946 population size estimates based on BBS count data. Included are 399 species, including 344 947 landbird species previously published in (35), and 55 additional non-landbird species for which 948 we estimated population size using identical methods. Unrounded population size estimates 949 (PopUsCa) ate the same as in Data S1, and are provided here for easy reference. Adjustment factors 950 are further defined and described in (35). 951 952 953 954

species sci_name sort Breeding.BiomeWinter.BiomeFamily bird.group Migrate AI native popest popestlci popestuci first_year_popestlast_year_popestPop.source Trajectory_data_sourceTrajectory_firstyearTrajectory_lastyearLoss_med Loss_lci Loss_uci Loss_lqrt Loss_uqrtAbert's Towhee Melozone aberti 1817 Aridlands Southwestern AridlandsPasserellidaelandbird R other native 890243 429538 1469410 2006 2015 PIF0615 BBS7017 1970 2017 -271177 -726620 -26148.4 -399159 -168279Acadian Flycatcher Empidonax virescens1303 Eastern ForestMexico-Central AmericaTyrannidae landbird M other native 5227271 4728009 5829898 2006 2015 PIF0615 BBS7017 1970 2017 470107.7 -30583.6 944779.1 302529.3 631900.5Acorn Woodpecker Melanerpes formicivorus939 Western ForestWidespreadPicidae landbird R other native 2226303 1452256 3390813 2006 2015 PIF0615 BBS7017 1970 2017 -472997 -1177341 -37943.2 -676790 -308044Alder Flycatcher Empidonax alnorum1304 Boreal ForestSouth AmericaTyrannidae landbird M other native 1.18E+08 99384651 1.41E+08 2006 2015 PIF0615 BBS7017 1970 2017 43413071 28809038 59401956 38418052 48719058Allen's HummingbirdSelasphorus sasin 342 Aridlands Mexico-Central AmericaTrochilidae landbird M other native 1484682 348049 4475111 2006 2015 PIF0615 BBS7017 1970 2017 4605856 3.023885 11266872 2347939 6907417American Avocet Recurvirostra americana444 Wetland WidespreadRecurvirostridaeshorebird M other native 450000 180000 1125000 2011 2013 Shoreb12 BBS7017 1970 2017 -85487.1 -322752 3663.752 -148701 -38619.4American Bittern Botaurus lentiginosus727 Wetland Temperate North AmericaArdeidae waterbird M other native 2507797 2005616 3117498 2006 2015 PIF0615 BBS7017 1970 2017 715897.4 173483.1 1234861 529610.2 894811.8American Black DuckAnas rubripes 49 Wetland Temperate North AmericaAnatidae waterfowl M other native 583500 500200 666800 2013 2017 FWS1317 BBS7017 1970 2017 340512.1 177868.2 505661.6 285368.6 396500.9American Coot Fulica americana 435 Wetland WidespreadRallidae waterbird M other native 5517522 4109506 7381712 2006 2015 PIF0615 BBS7017 1970 2017 -181609 -3237243 1759719 -1047916 543020.1American Crow Corvus brachyrhynchos1395 Habitat GeneralistTemperate North AmericaCorvidae landbird M other native 28047630 26447403 29639378 2006 2015 PIF0615 BBS7017 1970 2017 -837553 -2431116 734755.6 -1392338 -310653American Dipper Cinclus mexicanus1514 Wetland Temperate North AmericaCinclidae landbird R other native 151919 114060 200186 2006 2015 PIF0615 BBS7017 1970 2017 27183.93 2510.775 52532.67 18845.9 35727.05American Golden-PloverPluvialis dominica452 Arctic TundraSouth AmericaCharadriidaeshorebird M other native 500000 294200 705800 2011 2013 Shoreb12 Mig7416 1974 2016 478098.1 204909.9 827569.8 377772.4 587140.6American GoldfinchSpinus tristis 1771 Forest GeneralistTemperate North AmericaFringillidae landbird M other native 44092850 41554624 46767583 2006 2015 PIF0615 BBS7017 1970 2017 2743107 -883054 6269189 1499409 3953985American Kestrel Falco sparverius 998 Habitat GeneralistWidespreadFalconidae landbird M other native 2827776 2564206 3116508 2006 2015 PIF0615 BBS7017 1970 2017 1878754 1595457 2174950 1781703 1978651American OystercatcherHaematopus palliatus446 Coasts Coastal Haematopodidaeshorebird M other native 11000 10700 11300 2011 2013 Shoreb12 CBC7017 1970 2017 -3624.98 -10115.3 363.068 -5490.83 -2030.91American Pipit Anthus rubescens1678 Arctic TundraTemperate North AmericaMotacillidaelandbird M other native 18034890 17874051 18354686 2006 2015 PIF0615 CBC7017 1970 2017 4465486 -1215829 8819001 2742905 6050415American Redstart Setophaga ruticilla1983 Eastern ForestWidespread NeotropicalParulidae landbird M other native 42464674 37027311 48475245 2006 2015 PIF0615 BBS7017 1970 2017 4242063 -423721 8951280 2703869 5863376American Robin Turdus migratorius1603 Forest GeneralistTemperate North AmericaTurdidae landbird M other native 3.66E+08 3.37E+08 3.93E+08 2006 2015 PIF0615 BBS7017 1970 2017 -2E+07 -3.7E+07 -3750046 -2.6E+07 -1.4E+07American Three-toed WoodpeckerPicoides dorsalis 958 Boreal ForestTemperate North AmericaPicidae landbird R other native 1564320 1108671 2160148 2006 2015 PIF0615 BBS7017 1970 2017 -1574551 -2608131 -875172 -1887474 -1298197American Tree SparrowSpizelloides arborea1828 Arctic TundraTemperate North AmericaPasserellidaelandbird M other native 26412817 19492087 36200474 2006 2015 PIF0615 CBC7017 1970 2017 29847392 19971565 40527844 26299536 33469530American White PelicanPelecanus erythrorhynchos724 Wetland Temperate North AmericaPelecanidaewaterbird M other native 414730 299521 546711 2006 2015 PIF0615 BBS7017 1970 2017 -598682 -1038608 -340170 -722401 -492236American Wigeon Mareca americana 44 Wetland Temperate North AmericaAnatidae waterfowl M other native 2997300 2640100 3354500 2013 2017 FWS1317 FWS7017 1970 2017 211210 -578048 900440 -51414.6 455778.9American WoodcockScolopax minor 512 Eastern ForestTemperate North AmericaScolopacidaeshorebird M other native 3500000 3000000 4000000 2011 2013 Shoreb12 SGS6817 1970 2017 1664212 1325504 2031493 1544191 1785860Ancient Murrelet Synthliboramphus antiquus555 Coasts Marine Alcidae waterbird M other native 1000000 500000 1500000 1990 1992 BNA2010 CBC7017 1970 2017 -1739879 -4634318 -487306 -2480741 -1191479Anhinga Anhinga anhinga 723 Wetland Widespread NeotropicalAnhingidae waterbird M other native 27000 20000 34000 1978 1980 BNA2000 BBS7017 1970 2017 -27796.8 -44385 -16120.8 -33010.8 -23330.6Anna's HummingbirdCalypte anna 336 Aridlands Temperate North AmericaTrochilidae landbird M other native 8772569 4880026 16549527 2006 2015 PIF0615 BBS7017 1970 2017 -6791952 -1.2E+07 -2325109 -8504644 -5231861Arctic Tern Sterna paradisaea 615 Arctic TundraCoastal Laridae waterbird M other native 1000000 250000 1750000 2004 2006 WPE5 BBS9317 1993 2017 494844.8 45941.65 1169517 317837 698859.4Arctic Warbler Phylloscopus borealis1526 Arctic TundraWidespreadPhylloscopidaelandbird M other native 8201201 2638973 16439186 2006 2015 PIF0615 BBS9317 1993 2017 6128758 -474299 15763298 3440842 9088913Ash-throated FlycatcherMyiarchus cinerascens1247 Aridlands Mexico-Central AmericaTyrannidae landbird M other native 6847348 5661743 8193398 2006 2015 PIF0615 BBS7017 1970 2017 -2577423 -3580302 -1747999 -2909963 -2271995Atlantic Puffin Fratercula arctica 562 Coasts Marine Alcidae waterbird M other native 375000 350000 400000 1998 2000 BNA2002 CBC7017 1970 2017 -509047 -1397635 -122553 -738613 -334345Bachman's SparrowPeucaea aestivalis1825 Eastern ForestTemperate North AmericaPasserellidaelandbird R other native 167964 102917 256160 2006 2015 PIF0615 BBS7017 1970 2017 453787.5 242709.4 667229.6 379020.5 526336.1Baird's Sandpiper Calidris bairdii 500 Arctic TundraSouth AmericaScolopacidaeshorebird M other native 300000 120000 750000 2011 2013 Shoreb12 Mig7416 1974 2016 -73534 -338993 21388.27 -138017 -26211.9Baird's Sparrow Centronyx bairdii1844 Grassland Southwestern AridlandsPasserellidaelandbird M other native 3440174 2322349 4825893 2006 2015 PIF0615 BBS7017 1970 2017 5962461 3593246 8610544 5113821 6841097Bald Eagle Haliaeetus leucocephalus795 Wetland Temperate North AmericaAccipitridaelandbird M other native 200000 100000 300000 2015 2017 ACAD BBS7017 1970 2017 -199325 -312190 -96947.8 -236329 -162465Baltimore Oriole Icterus galbula 1922 Eastern ForestWidespread NeotropicalIcteridae landbird M other native 11806532 10808329 12963225 2006 2015 PIF0615 BBS7017 1970 2017 8601411 7298291 10020637 8136466 9067441Band-tailed Pigeon Patagioenas fasciata156 Western ForestMexico-Central AmericaColumbidaelandbird M other native 1455144 1049053 1990079 2006 2015 PIF0615 BBS7017 1970 2017 1428395 877056.2 2065349 1221243 1641593Bank Swallow Riparia riparia 1430 Habitat GeneralistSouth AmericaHirundinidaelandbird M AI native 7940368 6125188 10752527 2006 2015 PIF0615 BBS7017 1970 2017 56359017 39379185 73792279 50452682 62176291Barn Owl Tyto alba 828 Habitat GeneralistWidespreadTytonidae landbird R other native 130751 81975 193386 2006 2015 PIF0615 BBS7017 1970 2017 -108515 -190380 -54157.3 -132808 -87354Barn Swallow Hirundo rustica 1433 Habitat GeneralistSouth AmericaHirundinidaelandbird M AI native 46855476 43409178 50012099 2006 2015 PIF0615 BBS7017 1970 2017 26205491 22382615 30335589 24893553 27584463Barred Owl Strix varia 860 Forest GeneralistTemperate North AmericaStrigidae landbird R other native 3458782 3024086 3952819 2006 2015 PIF0615 BBS7017 1970 2017 -2129260 -2605653 -1721838 -2288824 -1980560Barrow's GoldeneyeBucephala islandica74 Wetland Temperate North AmericaAnatidae waterfowl M other native 204250 102125 306375 2004 2006 SeDu07 BBS7017 1970 2017 127372.1 44650.67 234717.3 96082.26 161048.1Bay-breasted WarblerSetophaga castanea1990 Boreal ForestMexico-Central AmericaParulidae landbird M other native 9892605 6894711 13872180 2006 2015 PIF0615 BBS7017 1970 2017 1601578 -1778854 4546113 553700.7 2583102Bell's Sparrow Artemisiospiza belli1840 Aridlands Southwestern AridlandsPasserellidaelandbird M other native 214853 89930 390058 2006 2015 PIF0615 BBS7017 1970 2017 15185.27 -51467.5 83358.42 -2835.01 35778.58Bell's Vireo Vireo bellii 1349 Aridlands Mexico-Central AmericaVireonidae landbird M other native 4599734 3593221 5764813 2006 2015 PIF0615 BBS7017 1970 2017 -1778207 -3052932 -840648 -2172755 -1425545Belted Kingfisher Megaceryle alcyon907 Wetland WidespreadAlcedinidaelandbird M other native 1843798 1568548 2159306 2006 2015 PIF0615 BBS7017 1970 2017 1557332 1271728 1866622 1456772 1659761Bendire's Thrasher Toxostoma bendirei1625 Aridlands Southwestern AridlandsMimidae landbird M other native 56338 30887 93302 2006 2015 PIF0615 BBS7017 1970 2017 272275.9 120411.9 429938.8 219764.2 327550.5Bewick's Wren Thryomanes bewickii1472 Aridlands Temperate North AmericaTroglodytidaelandbird R other native 4567446 3627322 5765670 2006 2015 PIF0615 BBS7017 1970 2017 1857632 1120961 2657191 1606426 2124605Black-and-white WarblerMniotilta varia 1954 Eastern ForestWidespread NeotropicalParulidae landbird M other native 17709569 15812133 19681290 2006 2015 PIF0615 BBS7017 1970 2017 6751218 4395734 9215736 5924929 7567140Black-backed WoodpeckerPicoides arcticus 959 Boreal ForestTemperate North AmericaPicidae landbird R other native 1734181 1251409 2296411 2006 2015 PIF0615 BBS7017 1970 2017 -1291984 -2079847 -753337 -1530952 -1085538Black-bellied PloverPluvialis squatarola450 Arctic TundraCoastal Charadriidaeshorebird M other native 362700 200667 541500 2011 2013 Shoreb12 Mig7416 1974 2016 301896.5 128695.1 534467.2 237408.7 376120Black-billed CuckooCoccyzus erythropthalmus209 Eastern ForestSouth AmericaCuculidae landbird M other native 875781 735134 1051851 2006 2015 PIF0615 BBS7017 1970 2017 1473177 1066337 1901169 1329195 1619382Black-billed MagpiePica hudsonia 1391 Habitat GeneralistTemperate North AmericaCorvidae landbird R other native 6023555 5190448 7003608 2006 2015 PIF0615 BBS7017 1970 2017 1709069 1086576 2358396 1493302 1925879Black-capped ChickadeePoecile atricapillus1436 Forest GeneralistTemperate North AmericaParidae landbird R other native 43031705 39633241 46269089 2006 2015 PIF0615 BBS7017 1970 2017 -1.2E+07 -1.5E+07 -8230942 -1.3E+07 -1E+07Black-chinned HummingbirdArchilochus alexandri333 Western ForestMexico-Central AmericaTrochilidae landbird M other native 8179118 5809219 10961926 2006 2015 PIF0615 BBS7017 1970 2017 -3057487 -4839297 -1704018 -3623597 -2532567Black-chinned SparrowSpizella atrogularis1834 Aridlands Southwestern AridlandsPasserellidaelandbird M other native 293554 150962 524619 2006 2015 PIF0615 BBS7017 1970 2017 355805.5 119241.2 643166.6 268128 449698.8Black-crested TitmouseBaeolophus atricristatus1446 Aridlands Temperate North AmericaParidae landbird R other native 642491 414558 1018349 2006 2015 PIF0615 BBS7017 1970 2017 209499.5 35062.53 418974.3 145156.6 275685.7Black-crowned Night-HeronNycticorax nycticorax754 Wetland WidespreadArdeidae waterbird M other native 419820 292104 595456 2006 2015 PIF0615 BBS7017 1970 2017 73103.29 -10707.7 162084.8 45729.67 101405.2Black-headed GrosbeakPheucticus melanocephalus2052 Western ForestMexico-Central AmericaCardinalidaelandbird M other native 12185173 10701801 13695616 2006 2015 PIF0615 BBS7017 1970 2017 -2853073 -4296573 -1584113 -3336660 -2386265Black-legged KittiwakeRissa tridactyla 566 Coasts Marine Laridae waterbird M other native 1550000 1162500 1937500 2006 2008 BNA2009 CBC7017 1970 2017 1509438 167534.5 2876618 1096247 1947205Black-necked Stilt Himantopus mexicanus443 Wetland WidespreadRecurvirostridaeshorebird M other native 177100 70840 442750 2011 2013 Shoreb12 BBS7017 1970 2017 -128074 -308251 -0.88997 -183658 -78187.1Black-tailed GnatcatcherPolioptila melanura1509 Aridlands Southwestern AridlandsPolioptilidaelandbird R other native 6527338 4101720 10094127 2006 2015 PIF0615 BBS7017 1970 2017 -494178 -3156823 1296528 -1239887 142717.1Black-throated Blue WarblerSetophaga caerulescens1995 Boreal ForestCaribbean Parulidae landbird M other native 2415903 2069260 2822969 2006 2015 PIF0615 BBS7017 1970 2017 -1420318 -1886049 -1028556 -1577242 -1276479Black-throated Gray WarblerSetophaga nigrescens2008 Western ForestMexico-Central AmericaParulidae landbird M other native 3130246 2558225 3733825 2006 2015 PIF0615 BBS7017 1970 2017 2084363 1376458 2839442 1835279 2340499Black-throated Green WarblerSetophaga virens2012 Boreal ForestMexico-Central AmericaParulidae landbird M other native 9177716 7924382 10581319 2006 2015 PIF0615 BBS7017 1970 2017 -1641064 -3228729 -305009 -2161892 -1163480Black-throated SparrowAmphispiza bilineata1838 Aridlands Southwestern AridlandsPasserellidaelandbird M other native 31040032 26228164 36813986 2006 2015 PIF0615 BBS7017 1970 2017 20074030 13326489 27205271 17811405 22457575Black-whiskered VireoVireo altiloquus 1362 Eastern ForestSouth AmericaVireonidae landbird M other native 84242 1998 207072 2006 2015 PIF0615 BBS9317 1993 2017 18907.21 -71426.6 108500.8 0.474938 44810.37Black Guillemot Cepphus grylle 547 Coasts Marine Alcidae waterbird M other native 500000 250000 750000 1984 1986 BNA2002 CBC7017 1970 2017 -890911 -2926060 -135680 -1390601 -539480Black OystercatcherHaematopus bachmani447 Coasts Coastal Haematopodidaeshorebird R other native 10000 6667 15000 2011 2013 Shoreb12 CBC7017 1970 2017 -8978.13 -18664.6 -3868.68 -11620.4 -6890.41Black Phoebe Sayornis nigricans1317 Wetland Temperate North AmericaTyrannidae landbird M other native 1170291 816450 1641836 2006 2015 PIF0615 BBS7017 1970 2017 -948257 -1439790 -567119 -1102771 -806415Black Scoter Melanitta americana70 Arctic TundraMarine Anatidae waterfowl M other native 350000 262500 437500 2004 2006 SeDu07 CBC7017 1970 2017 400731.4 44419.98 788547.2 290132.9 518006.8Black Skimmer Rynchops niger 621 Coasts Coastal Laridae waterbird M other native 60000 48000 72000 1975 1977 BNA1994 BBS7017 1970 2017 39418.8 20845.33 55142.13 33712.45 44751.63Black Swift Cypseloides niger 253 Western ForestSouth AmericaApodidae landbird M AI native 88506 34390 198559 2006 2015 PIF0615 BBS7017 1970 2017 661817.6 46956.59 1325405 450347.6 880641.5Black Tern Chlidonias niger 610 Wetland Marine Laridae waterbird M other native 2331116 1695896 3119894 2006 2015 PIF0615 BBS7017 1970 2017 2809048 1433388 4459359 2310919 3327047Black Turnstone Arenaria melanocephala483 Coasts Coastal Scolopacidaeshorebird M other native 95000 76000 114000 2011 2013 Shoreb12 CBC7017 1970 2017 14548.31 -16263 40849.72 5146.065 23421.02Black Vulture Coragyps atratus 765 Habitat GeneralistWidespreadCathartidaelandbird R other native 1864137 1555779 2249923 2006 2015 PIF0615 BBS7017 1970 2017 -2326573 -2932660 -1796159 -2525527 -2132346Blackburnian WarblerSetophaga fusca 1991 Boreal ForestSouth AmericaParulidae landbird M other native 13271149 10865077 16109037 2006 2015 PIF0615 BBS7017 1970 2017 -1387357 -3305716 266365.9 -1988294 -807793Blackpoll Warbler Setophaga striata1994 Boreal ForestSouth AmericaParulidae landbird M other native 59716232 45066327 76124820 2006 2015 PIF0615 BBS7017 1970 2017 3.07E+08 2.15E+08 4.16E+08 2.75E+08 3.42E+08Blue-gray GnatcatcherPolioptila caerulea1506 Habitat GeneralistWidespreadPolioptilidaelandbird M other native 2.29E+08 1.95E+08 2.67E+08 2006 2015 PIF0615 BBS7017 1970 2017 -3.2E+07 -5.3E+07 -1.3E+07 -3.9E+07 -2.5E+07Blue-headed Vireo Vireo solitarius 1355 Boreal ForestMexico-Central AmericaVireonidae landbird M other native 12765014 11050138 14721085 2006 2015 PIF0615 BBS7017 1970 2017 -1.1E+07 -1.5E+07 -8859233 -1.2E+07 -1E+07Blue-winged Teal Spatula discors 38 Wetland WidespreadAnatidae waterfowl M other native 7879800 7110600 8648900 2013 2017 FWS1317 FWS7017 1970 2017 -3302788 -5390736 -1650457 -3986128 -2699642Blue-winged WarblerVermivora cyanoptera1953 Eastern ForestMexico-Central AmericaParulidae landbird M other native 684415 578230 803348 2006 2015 PIF0615 BBS7017 1970 2017 379078.1 273839 490287.7 342495.4 416588.7Blue Grosbeak Passerina caerulea2058 Forest GeneralistMexico-Central AmericaCardinalidaelandbird M other native 20938581 19404702 22644996 2006 2015 PIF0615 BBS7017 1970 2017 -7109707 -8727595 -5611959 -7644864 -6582229Blue Jay Cyanocitta cristata1382 Eastern ForestTemperate North AmericaCorvidae landbird M other native 17238587 15864197 18715069 2006 2015 PIF0615 BBS7017 1970 2017 5391960 4456773 6381627 5057991 5726875Boat-tailed Grackle Quiscalus major 1940 Wetland Temperate North AmericaIcteridae landbird R other native 2156489 1297665 3550285 2006 2015 PIF0615 BBS7017 1970 2017 923304.9 316543.3 1743162 688421.4 1175833Bobolink Dolichonyx oryzivorus1887 Grassland South AmericaIcteridae landbird M other native 10195298 8796086 11917384 2006 2015 PIF0615 BBS7017 1970 2017 15777561 12973015 18704343 14817756 16756540Bohemian WaxwingBombycilla garrulus1637 Boreal ForestTemperate North AmericaBombycillidaelandbird M other native 2507863 1641840 3491482 2006 2015 PIF0615 BBS9317 1993 2017 2730215 1473152 4121367 2284316 3200383Bonaparte's Gull Chroicocephalus philadelphia570 Wetland Coastal Laridae waterbird M other native 785266 442937 1198079 2006 2015 PIF0615 BBS9317 1993 2017 96980.37 -319527 416338.2 -17181.7 203100.6Boreal Chickadee Poecile hudsonicus1440 Boreal ForestTemperate North AmericaParidae landbird R other native 13208240 10477170 16444759 2006 2015 PIF0615 BBS7017 1970 2017 1562983 -1080801 3946003 682398 2385224Brandt's CormorantPhalacrocorax penicillatus717 Coasts Coastal Phalacrocoracidaewaterbird M other native 125000 81250 168750 1989 1991 BNA1998 CBC7017 1970 2017 -307415 -534912 -165555 -375580 -250293Brant Branta bernicla 20 Arctic TundraCoastal Anatidae waterfowl M other native 403482 363134 443830 2013 2015 CAFF18 CAFF 2000 2016 284384.7 171166.4 400741.2 246733 323198.2Brewer's Blackbird Euphagus cyanocephalus1938 Habitat GeneralistTemperate North AmericaIcteridae landbird M other native 23324285 20136678 27110785 2006 2015 PIF0615 BBS7017 1970 2017 33853363 28211780 39805600 31910053 35809392Brewer's Sparrow Spizella breweri 1831 Aridlands Southwestern AridlandsPasserellidaelandbird M other native 16834981 13155782 21238196 2006 2015 PIF0615 BBS7017 1970 2017 10528151 6697274 14897547 9183193 12007943Bridled Titmouse Baeolophus wollweberi1442 Western ForestMexico-Central AmericaParidae landbird R other native 69340 22843 147260 2006 2015 PIF0615 BBS9317 1993 2017 3148.158 -91899.3 58845.03 -14364.8 20085.11Broad-tailed HummingbirdSelasphorus platycercus340 Western ForestMexico-Central AmericaTrochilidae landbird M other native 8804795 5880867 12313443 2006 2015 PIF0615 BBS7017 1970 2017 9073828 5572515 12990766 7818108 10348963Broad-winged HawkButeo platypterus 820 Forest GeneralistWidespread NeotropicalAccipitridaelandbird M other native 1804126 1598612 2029385 2006 2015 PIF0615 BBS7017 1970 2017 -605922 -807666 -436703 -672008 -545128Bronzed Cowbird Molothrus aeneus1932 Aridlands Widespread NeotropicalIcteridae landbird M other native 816191 439751 1339476 2006 2015 PIF0615 BBS7017 1970 2017 -105811 -402373 83878.67 -190751 -37287.6Brown-crested FlycatcherMyiarchus tyrannulus1250 Aridlands Mexico-Central AmericaTyrannidae landbird M other native 1032206 639470 1584755 2006 2015 PIF0615 BBS7017 1970 2017 -1031626 -1692682 -515610 -1240980 -844175Brown-headed CowbirdMolothrus ater 1933 Habitat GeneralistTemperate North AmericaIcteridae landbird M other native 1.27E+08 1.18E+08 1.36E+08 2006 2015 PIF0615 BBS7017 1970 2017 40902527 32324567 49507922 38026025 43814928Brown-headed NuthatchSitta pusilla 1452 Eastern ForestTemperate North AmericaSittidae landbird R other native 1578602 1352620 1826550 2006 2015 PIF0615 BBS7017 1970 2017 286339.8 109394.4 461233.7 225573.9 348194.8Brown Creeper Certhia americana1453 Forest GeneralistTemperate North AmericaCerthiidae landbird M other native 9484338 7757209 11639138 2006 2015 PIF0615 BBS7017 1970 2017 -2487358 -3722358 -1494289 -2881264 -2113948Brown Pelican Pelecanus occidentalis725 Coasts Coastal Pelecanidaewaterbird M other native 100000 90000 110000 1998 2000 BNA2014 BBS7017 1970 2017 -127274 -279306 -49554.7 -168357 -94738.7Brown Thrasher Toxostoma rufum1622 Eastern ForestTemperate North AmericaMimidae landbird M other native 6168180 5625720 6771313 2006 2015 PIF0615 BBS7017 1970 2017 3614005 3148641 4104648 3456274 3781074Buff-breasted SandpiperCalidris subruficollis504 Arctic TundraSouth AmericaScolopacidaeshorebird M other native 56000 35000 78000 2011 2013 Shoreb12 Mig7416 1974 2016 -18592.1 -68339.2 4769.784 -31791.3 -8843.8Bufflehead Bucephala albeola 72 Wetland Temperate North AmericaAnatidae waterfowl M other native 1400000 1050000 1750000 2004 2006 SeDu07 BBS7017 1970 2017 -1699058 -2504845 -1102931 -1950290 -1469745Bullock's Oriole Icterus bullockii 1916 Western ForestMexico-Central AmericaIcteridae landbird M other native 6949229 6086900 7839504 2006 2015 PIF0615 BBS7017 1970 2017 2378753 1638170 3156935 2119069 2638434Burrowing Owl Athene cunicularia856 Grassland Temperate North AmericaStrigidae landbird M other native 987921 625174 1537376 2006 2015 PIF0615 BBS7017 1970 2017 308476.1 110350.6 565890.7 234925.9 389962.4Bushtit Psaltriparus minimus1448 Western ForestTemperate North AmericaAegithalidaelandbird R other native 2310447 1807618 2949870 2006 2015 PIF0615 BBS7017 1970 2017 877862.2 360451.8 1433075 698217.5 1060235Cackling Goose Branta hutchinsii 22 Arctic TundraTemperate North AmericaAnatidae waterfowl M other native 4510202 4059182 4961222 2013 2015 CAFF18 CAFF 1975 2016 -4026866 -6623053 -2405365 -4797162 -3378340Cactus Wren Campylorhynchus brunneicapillus1482 Aridlands Southwestern AridlandsTroglodytidaelandbird R other native 3034276 2268727 4012714 2006 2015 PIF0615 BBS7017 1970 2017 4351025 3013705 5833059 3862837 4851696California Gull Larus californicus 585 Wetland Temperate North AmericaLaridae waterbird M other native 1065791 658357 1567466 2006 2015 PIF0615 BBS7017 1970 2017 785816.2 139858.6 1473702 569412.5 1013140California Quail Callipepla californica104 Aridlands Temperate North AmericaOdontophoridaelandbird R other native 3358401 2374290 4473991 2006 2015 PIF0615 BBS7017 1970 2017 -1259923 -2116262 -646222 -1524560 -1025116California Scrub-JayAphelocoma californica1385 Western ForestTemperate North AmericaCorvidae landbird R other native 1346997 859873 2030181 2006 2015 PIF0615 BBS7017 1970 2017 135601 -19700.4 316679.9 83643.41 193982.6California Thrasher Toxostoma redivivum1627 Aridlands Temperate North AmericaMimidae landbird R other native 155226 77498 274331 2006 2015 PIF0615 BBS7017 1970 2017 123963.2 42671.75 215923.7 95698.15 153536.6California Towhee Melozone crissalis1816 Aridlands Temperate North AmericaPasserellidaelandbird R other native 5247688 3750592 7222092 2006 2015 PIF0615 BBS7017 1970 2017 992530 64954.17 1969980 683326.6 1313120Calliope HummingbirdSelasphorus calliope346 Western ForestMexico-Central AmericaTrochilidae landbird M other native 4463289 2652793 7024258 2006 2015 PIF0615 BBS7017 1970 2017 844514.3 -28772.5 1954856 545079.5 1188922Canada Goose Branta canadensis 23 Wetland Temperate North AmericaAnatidae waterfowl M other native 6919635 6227672 7611599 2014 2016 CAFF18 CBC7017 1970 2017 -7011283 -1.8E+07 -2540856 -9781978 -5017736Canada Jay Perisoreus canadensis1364 Boreal ForestTemperate North AmericaCorvidae landbird R other native 26652111 23501504 30178807 2006 2015 PIF0615 BBS7017 1970 2017 3548942 -1362305 7730558 1994763 4996020Canada Warbler Cardellina canadensis2022 Boreal ForestSouth AmericaParulidae landbird M other native 2597361 2028500 3242734 2006 2015 PIF0615 BBS7017 1970 2017 4205252 3134019 5321449 3820760 4572029Canvasback Aythya valisineria 54 Wetland Temperate North AmericaAnatidae waterfowl M other native 739700 621300 858100 2013 2017 FWS1317 FWS7017 1970 2017 -217374 -394999 -74753 -272563 -164047Canyon Towhee Melozone fusca 1814 Aridlands Southwestern AridlandsPasserellidaelandbird R other native 2792820 2085096 3605781 2006 2015 PIF0615 BBS7017 1970 2017 2778772 1741746 3992604 2399291 3173874Canyon Wren Catherpes mexicanus1457 Aridlands Southwestern AridlandsTroglodytidaelandbird R other native 423956 325189 554507 2006 2015 PIF0615 BBS7017 1970 2017 -4671.56 -80642.9 62796.82 -29268.6 17507.88Cape May Warbler Setophaga tigrina1985 Boreal ForestCaribbean Parulidae landbird M other native 7043668 4900702 9894881 2006 2015 PIF0615 BBS7017 1970 2017 2947236 -483293 6354693 1858626 4051865Carolina Chickadee Poecile carolinensis1435 Eastern ForestTemperate North AmericaParidae landbird R other native 13179980 12174905 14399165 2006 2015 PIF0615 BBS7017 1970 2017 3057030 2152186 3947359 2744236 3361944Carolina Wren Thryothorus ludovicianus1471 Eastern ForestTemperate North AmericaTroglodytidaelandbird R other native 17733395 15969003 19620346 2006 2015 PIF0615 BBS7017 1970 2017 -6141404 -9569560 -3307512 -7228508 -5116236

Caspian Tern Hydroprogne caspia608 Wetland Coastal Laridae waterbird M other native 78325 41255 130130 2006 2015 PIF0615 BBS7017 1970 2017 -26345.6 -67560.4 -4025.23 -38047.5 -16984.3Cassin's Auklet Ptychoramphus aleuticus556 Coasts Marine Alcidae waterbird M other native 3200000 2400000 4000000 2007 2009 BNA2011 CBC7017 1970 2017 769955.6 -4784197 3699968 -510120 1793990Cassin's Finch Haemorhous cassinii1751 Western ForestTemperate North AmericaFringillidae landbird M other native 3191950 2521299 4034402 2006 2015 PIF0615 BBS7017 1970 2017 4177144 3053576 5448139 3783289 4600123Cassin's Kingbird Tyrannus vociferans1275 Western ForestMexico-Central AmericaTyrannidae landbird M AI native 2480328 1833328 3291825 2006 2015 PIF0615 BBS7017 1970 2017 -240693 -888876 251999.8 -439888 -63998.3Cassin's Sparrow Peucaea cassinii 1824 Grassland Southwestern AridlandsPasserellidaelandbird M other native 9598748 7485112 12176616 2006 2015 PIF0615 BBS7017 1970 2017 3972623 1421435 6563651 3143413 4860056Cassin's Vireo Vireo cassinii 1354 Western ForestMexico-Central AmericaVireonidae landbird M other native 4560260 3775193 5412799 2006 2015 PIF0615 BBS7017 1970 2017 -1670336 -2604824 -958422 -1957280 -1404222Cattle Egret Bubulcus ibis 748 Wetland WidespreadArdeidae waterbird M other native 2804856 2196814 3562031 2006 2015 PIF0615 BBS7017 1970 2017 2329124 1636274 3125673 2083580 2591015Cave Swallow Petrochelidon fulva1432 Aridlands Mexico-Central AmericaHirundinidaelandbird M AI native 2769841 1680817 4407644 2006 2015 PIF0615 BBS7017 1970 2017 -5303540 -2.2E+07 -1299690 -8684163 -3260894Cedar Waxwing Bombycilla cedrorum1638 Forest GeneralistTemperate North AmericaBombycillidaelandbird M other native 63975308 58030057 70240507 2006 2015 PIF0615 BBS7017 1970 2017 -1.1E+07 -1.7E+07 -5082236 -1.3E+07 -8817489Cerulean Warbler Setophaga cerulea1986 Eastern ForestSouth AmericaParulidae landbird M other native 528920 363210 714480 2006 2015 PIF0615 BBS7017 1970 2017 1161090 765897.8 1565903 1020376 1295156Chestnut-backed ChickadeePoecile rufescens1439 Western ForestTemperate North AmericaParidae landbird R other native 12062509 8656467 16306921 2006 2015 PIF0615 BBS7017 1970 2017 9484580 6134406 13432190 8258732 10803610Chestnut-collared LongspurCalcarius ornatus1774 Grassland Southwestern AridlandsCalcariidae landbird M other native 3095825 2101824 4336047 2006 2015 PIF0615 BBS7017 1970 2017 16283043 10349767 22493605 14189570 18417090Chestnut-sided WarblerSetophaga pensylvanica1993 Eastern ForestMexico-Central AmericaParulidae landbird M other native 18265512 16119410 20584431 2006 2015 PIF0615 BBS7017 1970 2017 11944485 9323966 14756127 10993907 12889520Chihuahuan Raven Corvus cryptoleucus1406 Aridlands Southwestern AridlandsCorvidae landbird M other native 277286 193193 390354 2006 2015 PIF0615 BBS7017 1970 2017 32909.66 -38935.5 101245.3 10182.1 55850.88Chimney Swift Chaetura pelagica 260 Eastern ForestSouth AmericaApodidae landbird M AI native 8808551 8013311 9665731 2006 2015 PIF0615 BBS7017 1970 2017 17811323 15899653 19800343 17135664 18491796Chipping Sparrow Spizella passerina1829 Forest GeneralistTemperate North AmericaPasserellidaelandbird M other native 2.31E+08 2.13E+08 2.5E+08 2006 2015 PIF0615 BBS7017 1970 2017 79503437 60736278 98183880 72857129 86031360Chuck-will's-widowAntrostomus carolinensis236 Eastern ForestMexico-Central AmericaCaprimulgidaelandbird M AI native 5642111 4800407 6606314 2006 2015 PIF0615 BBS7017 1970 2017 9545319 7869201 11235616 8976951 10121135Chukar Alectoris chukar 114 Introduced Introduced Phasianidaeother Introduced other Introduced 392143 227755 612200 2006 2015 PIF0615 BBS7017 1970 2017 -188483 -429208 -51072.9 -256748 -131675Cinnamon Teal Spatula cyanoptera 39 Wetland Temperate North AmericaAnatidae waterfowl M other native 442510 275337 674629 2006 2015 PIF0615 BBS7017 1970 2017 617237.2 328128.2 934033.2 515432.3 721892.7Clapper Rail Rallus crepitans 409 Coasts Coastal Rallidae waterbird R other native 170587 85438 286396 2006 2015 PIF0615 BBS7017 1970 2017 58537.63 -2026.51 139222.7 36192.04 83942.73Clark's Grebe Aechmophorus clarkii147 Wetland Temperate North AmericaPodicipedidaewaterbird M other native 71737 18009 161501 2006 2015 PIF0615 CBC7017 1970 2017 145485.8 98.41409 298343.6 94134.45 197216.1Clark's Nutcracker Nucifraga columbiana1390 Western ForestTemperate North AmericaCorvidae landbird R other native 290441 227717 363870 2006 2015 PIF0615 BBS7017 1970 2017 4313.497 -69708.9 65170.23 -17589 26032.34Clay-colored SparrowSpizella pallida 1830 Grassland Southwestern AridlandsPasserellidaelandbird M other native 60149306 51415968 69884231 2006 2015 PIF0615 BBS7017 1970 2017 43211619 33500569 54023773 39720474 46764935Cliff Swallow Petrochelidon pyrrhonota1431 Habitat GeneralistSouth AmericaHirundinidaelandbird M AI native 77981069 67646472 89137460 2006 2015 PIF0615 BBS7017 1970 2017 -3.6E+07 -5.5E+07 -2E+07 -4.2E+07 -3E+07Common Eider Somateria mollissima64 Coasts Coastal Anatidae waterfowl M other native 1264000 948000 1580000 2004 2006 SeDu07 CBC7017 1970 2017 -408544 -3419333 592056.6 -1082415 21895.41Common Gallinule Gallinula galeata 431 Wetland WidespreadRallidae waterbird M other native 500214 251427 938525 2006 2015 PIF0615 BBS7017 1970 2017 288652.9 83999.12 557797.6 209968.4 372618.9Common GoldeneyeBucephala clangula 73 Wetland Temperate North AmericaAnatidae waterfowl M other native 1300000 975000 1625000 2004 2006 SeDu07 BBS7017 1970 2017 -406337 -782874 -132805 -523462 -302446Common Grackle Quiscalus quiscula1939 Habitat GeneralistTemperate North AmericaIcteridae landbird M other native 67132986 61123537 74085853 2006 2015 PIF0615 BBS7017 1970 2017 82979126 73933519 92454560 79756716 86273630Common Ground-DoveColumbina passerina170 Aridlands Southwestern AridlandsColumbidaelandbird R other native 1989124 1585896 2440861 2006 2015 PIF0615 BBS7017 1970 2017 674901.6 312107 1051247 555725.6 798884.8Common Loon Gavia immer 629 Wetland Temperate North AmericaGaviidae waterbird M other native 1108865 941048 1319057 2006 2015 PIF0615 BBS7017 1970 2017 -333381 -531502 -175052 -396892 -275644Common MerganserMergus merganser 77 Wetland Temperate North AmericaAnatidae waterfowl M other native 1200000 600000 1800000 2004 2006 SeDu07 BBS7017 1970 2017 200412.6 -48845.5 491983.3 114195.7 292200.7Common Murre Uria aalge 543 Coasts Marine Alcidae waterbird M other native 7400000 5550000 9250000 2000 2002 BNA2002 CBC7017 1970 2017 568368 -9265601 5644138 -1867886 2468045Common NighthawkChordeiles minor 227 Habitat GeneralistSouth AmericaCaprimulgidaelandbird M AI native 21789605 19345867 24683737 2006 2015 PIF0615 BBS7017 1970 2017 25989826 22044493 30281368 24582541 27422670Common Poorwill Phalaenoptilus nuttallii230 Aridlands Southwestern AridlandsCaprimulgidaelandbird M AI native 1333400 965383 1769426 2006 2015 PIF0615 BBS7017 1970 2017 -202807 -480452 10986.41 -289595 -125091Common Raven Corvus corax 1407 Habitat GeneralistWidespreadCorvidae landbird R other native 8250632 7605338 8984942 2006 2015 PIF0615 BBS7017 1970 2017 -6686854 -8000479 -5501274 -7108395 -6265039Common Redpoll Acanthis flammea1754 Arctic TundraTemperate North AmericaFringillidae landbird M other native 39008853 30299103 49713410 2006 2015 PIF0615 BBS9317 1993 2017 28960270 8989946 46984894 22622273 35253245Common Tern Sterna hirundo 614 Wetland Coastal Laridae waterbird M other native 468971 175901 985601 2006 2015 PIF0615 BBS7017 1970 2017 617624.6 90869.32 1234947 422917.6 821831.4Common YellowthroatGeothlypis trichas1976 Habitat GeneralistWidespreadParulidae landbird M other native 75588462 70946562 80532206 2006 2015 PIF0615 BBS7017 1970 2017 35511230 29832666 41334660 33528491 37463004Connecticut WarblerOporornis agilis 1966 Boreal ForestSouth AmericaParulidae landbird M other native 1751333 970368 2676400 2006 2015 PIF0615 BBS7017 1970 2017 2197716 1102707 3439947 1806168 2609499Cooper's Hawk Accipiter cooperii 790 Forest GeneralistWidespreadAccipitridaelandbird M other native 844899 770821 925643 2006 2015 PIF0615 BBS7017 1970 2017 -797391 -923902 -681504 -838337 -756988Cordilleran FlycatcherEmpidonax occidentalis1313 Western ForestMexico-Central AmericaTyrannidae landbird M other native 1966693 1283176 2953557 2006 2015 PIF0615 BBS7017 1970 2017 243687.4 -60237.4 594898.6 142953.5 356938.8Costa's HummingbirdCalypte costae 337 Aridlands Southwestern AridlandsTrochilidae landbird M other native 1583926 611798 3182531 2006 2015 PIF0615 BBS7017 1970 2017 56114.03 -672530 672698.3 -113632 239452.4Couch's Kingbird Tyrannus couchii1274 Aridlands Mexico-Central AmericaTyrannidae landbird R AI native 250613 133762 447501 2006 2015 PIF0615 BBS7017 1970 2017 -427145 -825298 -148229 -542206 -324956Crested Caracara Caracara cheriway994 Aridlands Southwestern AridlandsFalconidae landbird R other native 124568 87260 172735 2006 2015 PIF0615 BBS7017 1970 2017 -171252 -254350 -105082 -197860 -146735Crissal Thrasher Toxostoma crissale1629 Aridlands Southwestern AridlandsMimidae landbird R other native 82115 48009 124579 2006 2015 PIF0615 BBS7017 1970 2017 16571.07 -5673.59 41029.61 8892.936 24405.59Curve-billed ThrasherToxostoma curvirostre1620 Aridlands Southwestern AridlandsMimidae landbird R other native 1026123 728790 1467368 2006 2015 PIF0615 BBS7017 1970 2017 268031.1 78700.3 494623.1 200493.7 340084Dark-eyed Junco Junco hyemalis 1861 Forest GeneralistTemperate North AmericaPasserellidaelandbird M other native 2.24E+08 1.96E+08 2.54E+08 2006 2015 PIF0615 BBS7017 1970 2017 1.68E+08 1.37E+08 2.03E+08 1.57E+08 1.8E+08Dickcissel Spiza americana 2065 Grassland South AmericaCardinalidaelandbird M other native 27896722 23981764 32368972 2006 2015 PIF0615 BBS7017 1970 2017 4127773 -655746 8530709 2569466 5667241Double-crested CormorantPhalacrocorax auritus719 Wetland Temperate North AmericaPhalacrocoracidaewaterbird M other native 557887 365672 827251 2006 2015 PIF0615 BBS7017 1970 2017 -653515 -1142889 -339097 -801521 -528934Dovekie Alle alle 542 Coasts Marine Alcidae waterbird M other native 1500 1125 1875 2001 2003 BNA2002 CBC7017 1970 2017 823.52 -713.022 1951.908 451.7559 1182.934Downy WoodpeckerDryobates pubescens961 Forest GeneralistTemperate North AmericaPicidae landbird R other native 13422111 12764602 14141250 2006 2015 PIF0615 BBS7017 1970 2017 -272580 -1113824 535941.2 -557746 3753.167Dunlin Calidris alpina 497 Arctic TundraWidespreadScolopacidaeshorebird M other native 1500000 744700 2750300 2011 2013 Shoreb12 Mig7416 1974 2016 2372383 766911.7 4447176 1780872 3007260Dusky Flycatcher Empidonax oberholseri1310 Western ForestMexico-Central AmericaTyrannidae landbird M other native 8797209 7024376 10767331 2006 2015 PIF0615 BBS7017 1970 2017 2698638 968664.3 4396337 2118981 3266369Dusky Grouse Dendragapus obscurus132 Western ForestTemperate North AmericaPhasianidaelandbird R other native 300000 75000 525000 2008 2010 ACAD BBS7017 1970 2017 -150968 -379067 -28650.6 -215621 -99912.4Eared Grebe Podiceps nigricollis145 Wetland Temperate North AmericaPodicipedidaewaterbird M other native 1950442 943872 3659128 2006 2015 PIF0615 BBS7017 1970 2017 -955391 -2870067 -118235 -1457020 -573178Eastern Bluebird Sialia sialis 1557 Eastern ForestTemperate North AmericaTurdidae landbird M other native 21439020 20142880 22957637 2006 2015 PIF0615 BBS7017 1970 2017 -1.1E+07 -1.4E+07 -8273353 -1.2E+07 -9892270Eastern Kingbird Tyrannus tyrannus1278 Grassland South AmericaTyrannidae landbird M AI native 25924168 24123810 27704273 2006 2015 PIF0615 BBS7017 1970 2017 17516040 15312357 19904184 16740969 18314826Eastern MeadowlarkSturnella magna 1888 Grassland Temperate North AmericaIcteridae landbird M other native 24431724 21928274 27309341 2006 2015 PIF0615 BBS7017 1970 2017 73964321 65250234 83087759 70911711 76898314Eastern Phoebe Sayornis phoebe 1318 Eastern ForestTemperate North AmericaTyrannidae landbird M other native 34684436 32601625 37210378 2006 2015 PIF0615 BBS7017 1970 2017 -6237995 -1.2E+07 -1599972 -7929945 -4557282Eastern Screech-OwlMegascops asio 833 Eastern ForestTemperate North AmericaStrigidae landbird R other native 496240 378219 645235 2006 2015 PIF0615 BBS7017 1970 2017 218413.2 124949.8 323159.3 184260 253383Eastern Towhee Pipilo erythrophthalmus1806 Eastern ForestTemperate North AmericaPasserellidaelandbird M other native 29338492 27153590 31703146 2006 2015 PIF0615 BBS7017 1970 2017 23885938 21115304 26746899 22944887 24854887Eastern Whip-poor-willAntrostomus vociferus242 Eastern ForestMexico-Central AmericaCaprimulgidaelandbird M AI native 1829892 1442373 2231099 2006 2015 PIF0615 BBS7017 1970 2017 4073303 3167559 5043395 3755960 4396910Eastern Wood-PeweeContopus virens 1296 Eastern ForestSouth AmericaTyrannidae landbird M AI native 6454082 5897588 7036229 2006 2015 PIF0615 BBS7017 1970 2017 5199068 4563751 5878005 4979383 5432503Emperor Goose Anser canagicus 11 Coasts Coastal Anatidae waterfowl M other native 97953 88158 107748 2013 2015 CAFF18 CAFF 1985 2016 31579.55 -11384.5 65940.25 18246.44 43950.03Eurasian Collared-DoveStreptopelia decaocto165 Introduced Introduced Columbidaeother Introduced other Introduced 8716074 7657339 10020862 2006 2015 PIF0615 BBS7017 1970 2017 -3.4E+07 -6.8E+07 -1.7E+07 -4.3E+07 -2.7E+07Eurasian Tree SparrowPasser montanus1669 Introduced Introduced Passeridae other Introduced other Introduced 147064 83601 235172 2006 2015 PIF0615 BBS7017 1970 2017 -197693 -388822 -84320.5 -252023 -152979European Starling Sturnus vulgaris 1635 Introduced Introduced Sturnidae other Introduced other Introduced 93371907 85941592 1.02E+08 2006 2015 PIF0615 BBS7017 1970 2017 83350978 72594865 94770107 79563582 87124509Evening Grosbeak Coccothraustes vespertinus1701 Boreal ForestTemperate North AmericaFringillidae landbird M other native 3783375 2963915 4803280 2006 2015 PIF0615 BBS7017 1970 2017 26672914 19981619 33803178 24325378 29043776Ferruginous Hawk Buteo regalis 827 Grassland Temperate North AmericaAccipitridaelandbird M other native 109004 86288 135921 2006 2015 PIF0615 BBS7017 1970 2017 -39894.1 -59899.3 -24127.5 -46332.4 -33978Field Sparrow Spizella pusilla 1832 Eastern ForestTemperate North AmericaPasserellidaelandbird M other native 9333611 8343751 10393211 2006 2015 PIF0615 BBS7017 1970 2017 16311719 14318723 18466928 15619988 17003536Fish Crow Corvus ossifragus1404 Habitat GeneralistTemperate North AmericaCorvidae landbird R other native 466887 400029 541005 2006 2015 PIF0615 BBS7017 1970 2017 -109419 -173270 -55358.1 -130300 -90037.7Forster's Tern Sterna forsteri 616 Wetland Temperate North AmericaLaridae waterbird M other native 127120 72306 202189 2006 2015 PIF0615 BBS7017 1970 2017 86601.04 29816.92 157355.8 65652.43 109707.1Fox Sparrow Passerella iliaca 1851 Forest GeneralistTemperate North AmericaPasserellidaelandbird M other native 34605524 27334565 44390905 2006 2015 PIF0615 BBS7017 1970 2017 23716178 13604342 34601773 20208675 27345234Franklin's Gull Leucophaeus pipixcan577 Wetland Coastal Laridae waterbird M other native 2329478 1604153 3238650 2006 2015 PIF0615 BBS7017 1970 2017 2656170 896974.9 4489454 2072585 3258320Fulvous Whistling-DuckDendrocygna bicolor10 Wetland Widespread NeotropicalAnatidae waterfowl M other native 44000 24000 64000 1989 1991 BNA2001 BBS7017 1970 2017 -124767 -275932 -50542.7 -165983 -92707.5Gadwall Mareca strepera 41 Wetland Temperate North AmericaAnatidae waterfowl M other native 3777700 3371500 4183900 2013 2017 FWS1317 FWS7017 1970 2017 -2473106 -3362634 -1762073 -2756928 -2206186Gambel's Quail Callipepla gambelii105 Aridlands Southwestern AridlandsOdontophoridaelandbird R other native 5196496 3616310 7051087 2006 2015 PIF0615 BBS7017 1970 2017 636185.7 -851622 1966400 178313.7 1073599Gila Woodpecker Melanerpes uropygialis948 Aridlands Southwestern AridlandsPicidae landbird R other native 589899 288218 1038427 2006 2015 PIF0615 BBS7017 1970 2017 110027.1 -68511.3 324338 51630.98 175616.7Gilded Flicker Colaptes chrysoides978 Aridlands Southwestern AridlandsPicidae landbird R other native 192377 84549 358522 2006 2015 PIF0615 BBS7017 1970 2017 82140.44 3810.685 196093.7 50985.81 118051.9Glaucous-winged GullLarus glaucescens 591 Coasts Coastal Laridae waterbird M other native 436461 249983 673385 2006 2015 PIF0615 BBS7017 1970 2017 79742.35 -168383 282258.3 9367.937 148088.2Glaucous Gull Larus hyperboreus592 Coasts Temperate North AmericaLaridae waterbird M other native 510000 170000 850000 2011 2013 BNA2012 CBC7017 1970 2017 606820.9 58856.1 1429784 398847.9 844057.6Glossy Ibis Plegadis falcinellus759 Wetland WidespreadThreskiornithidaewaterbird M other native 36394 13092 71380 2006 2015 PIF0615 BBS7017 1970 2017 -45944 -146708 -7697.4 -70421.7 -28914.5Golden-crowned KingletRegulus satrapa 1517 Forest GeneralistTemperate North AmericaRegulidae landbird M other native 1.33E+08 1.03E+08 1.68E+08 2006 2015 PIF0615 BBS7017 1970 2017 38271559 14916976 63120062 30184745 46830724Golden-crowned SparrowZonotrichia atricapilla1859 Arctic TundraTemperate North AmericaPasserellidaelandbird M other native 7502564 4149449 12855995 2006 2015 PIF0615 BBS9317 1993 2017 1693048 -3053782 5782064 411981.6 3016929Golden-fronted WoodpeckerMelanerpes aurifrons950 Aridlands Mexico-Central AmericaPicidae landbird R other native 805604 554852 1125322 2006 2015 PIF0615 BBS7017 1970 2017 370883.7 199258.4 580882.9 306812.9 440437.7Golden-winged WarblerVermivora chrysoptera1952 Eastern ForestSouth AmericaParulidae landbird M other native 393305 273065 539488 2006 2015 PIF0615 BBS7017 1970 2017 753363.8 492307.4 1042482 659197.4 849497.8Golden Eagle Aquila chrysaetos 778 Habitat GeneralistTemperate North AmericaAccipitridaelandbird M other native 146673 125252 171932 2006 2015 PIF0615 BBS7017 1970 2017 -6234.26 -21307.2 7307.245 -11283.3 -1251.73Grace's Warbler Setophaga graciae2007 Western ForestMexico-Central AmericaParulidae landbird M other native 1513808 887803 2350028 2006 2015 PIF0615 BBS7017 1970 2017 3307198 1659551 5143991 2723602 3920912Grasshopper SparrowAmmodramus savannarum1843 Grassland Temperate North AmericaPasserellidaelandbird M other native 33439280 29662396 37709841 2006 2015 PIF0615 BBS7017 1970 2017 69889205 60136528 80105313 66499968 73402227Gray-cheeked ThrushCatharus minimus1581 Boreal ForestSouth AmericaTurdidae landbird M other native 41722960 27552192 60727662 2006 2015 PIF0615 BBS9317 1993 2017 3316972 -2.6E+07 22281109 -4624736 10040474Gray Catbird Dumetella carolinensis1614 Eastern ForestMexico-Central AmericaMimidae landbird M other native 28700211 26885945 30804790 2006 2015 PIF0615 BBS7017 1970 2017 -748542 -2385991 805912.2 -1308626 -201773Gray Flycatcher Empidonax wrightii1309 Western ForestMexico-Central AmericaTyrannidae landbird M other native 2897568 2057762 4045062 2006 2015 PIF0615 BBS7017 1970 2017 -2053173 -3203016 -1195986 -2413585 -1720821Gray Kingbird Tyrannus dominicensis1279 Eastern ForestSouth AmericaTyrannidae landbird M AI native 23009 3657 62695 2006 2015 PIF0615 BBS9317 1993 2017 0.230916 -25094.2 15604.87 -4175.7 3815.377Gray Partridge Perdix perdix 119 Introduced Introduced Phasianidaeother Introduced other Introduced 823861 635590 1041588 2006 2015 PIF0615 BBS7017 1970 2017 452582.9 209172.7 711547.2 368022 538971.7Gray Vireo Vireo vicinior 1350 Western ForestSouthwestern AridlandsVireonidae landbird M other native 548027 294748 855433 2006 2015 PIF0615 BBS7017 1970 2017 -581621 -1089068 -254797 -728253 -456576Great-tailed GrackleQuiscalus mexicanus1941 Habitat GeneralistWidespreadIcteridae landbird R other native 8242011 5511749 11832954 2006 2015 PIF0615 BBS7017 1970 2017 -6413203 -1.1E+07 -3402130 -7748679 -5239712Great Black-backed GullLarus marinus 593 Wetland Temperate North AmericaLaridae waterbird M other native 145361 70184 251320 2006 2015 PIF0615 BBS7017 1970 2017 241808 82441.38 437609.7 182080.5 303818.2Great Blue Heron Ardea herodias 734 Wetland WidespreadArdeidae waterbird M other native 618606 552453 698624 2006 2015 PIF0615 BBS7017 1970 2017 -163987 -212822 -119758 -179757 -147949Great Crested FlycatcherMyiarchus crinitus1249 Eastern ForestMexico-Central AmericaTyrannidae landbird M other native 8799301 7950620 9769449 2006 2015 PIF0615 BBS7017 1970 2017 -62367.6 -526727 384674.3 -216835 93743.71Great Egret Ardea alba 738 Wetland WidespreadArdeidae waterbird M other native 712641 580603 863838 2006 2015 PIF0615 BBS7017 1970 2017 -581015 -806365 -409754 -651764 -520434Great Gray Owl Strix nebulosa 862 Boreal ForestTemperate North AmericaStrigidae landbird R other native 71240 34370 122631 2006 2015 PIF0615 BBS9317 1993 2017 -33627.4 -86602.9 -7149.85 -48326.8 -21904.9Great Horned Owl Bubo virginianus 845 Habitat GeneralistWidespreadStrigidae landbird R other native 3784896 3310994 4288285 2006 2015 PIF0615 BBS7017 1970 2017 527838.4 169392.7 873174.2 407990.6 644859Greater Prairie-ChickenTympanuchus cupido135 Grassland Temperate North AmericaPhasianidaelandbird R other native 360504 197651 635645 2006 2015 PIF0615 BBS7017 1970 2017 -356167 -1171618 -66792 -549123 -220815Greater RoadrunnerGeococcyx californianus220 Aridlands Southwestern AridlandsCuculidae landbird R other native 841270 686699 1023445 2006 2015 PIF0615 BBS7017 1970 2017 -318713 -591516 -122277 -401047 -244024Greater Sage-GrouseCentrocercus urophasianus126 Aridlands Temperate North AmericaPhasianidaelandbird R other native 430000 215000 645000 2015 2017 ACAD BBS7017 1970 2017 629099.6 252813.1 1154736 479159.8 785551.1Greater Scaup Aythya marila 59 Arctic TundraTemperate North AmericaAnatidae waterfowl M other native 1606158 513593 3551089 2006 2015 PIF0615 CBC7017 1970 2017 952624.5 -34935.5 2679129 518099.6 1490622Greater White-fronted GooseAnser albifrons 15 Arctic TundraTemperate North AmericaAnatidae waterfowl M other native 3429375 3086438 3772313 2013 2015 CAFF18 CAFF 1975 2016 -1002744 -2.3E+07 3008978 -4218404 633096.7Greater Yellowlegs Tringa melanoleuca528 Wetland WidespreadScolopacidaeshorebird M other native 137000 54800 342500 2011 2013 Shoreb12 Mig7416 1974 2016 -21424 -102596 11180.54 -41828.7 -6810.04Green-tailed TowheePipilo chlorurus 1804 Aridlands Southwestern AridlandsPasserellidaelandbird M other native 4766829 3664896 6155067 2006 2015 PIF0615 BBS7017 1970 2017 918749.2 127862.6 1755432 649450 1191264Green-winged Teal Anas crecca 53 Wetland Temperate North AmericaAnatidae waterfowl M other native 3929100 3362500 4495600 2013 2017 FWS1317 FWS7017 1970 2017 -2029082 -2984342 -1285685 -2327413 -1757825Green Heron Butorides virescens750 Wetland WidespreadArdeidae waterbird M other native 772671 689060 862103 2006 2015 PIF0615 BBS7017 1970 2017 941979 817552.8 1070627 898655 985896.3Green Jay Cyanocorax yncas1375 Aridlands Mexico-Central AmericaCorvidae landbird R other native 56639 30791 92979 2006 2015 PIF0615 BBS7017 1970 2017 -90734.2 -189944 -34317.5 -118555 -68491.1Groove-billed Ani Crotophaga sulcirostris224 Habitat GeneralistWidespread NeotropicalCuculidae landbird R other native 5000 1250 8750 2015 2017 ACAD BBS7017 1970 2017 3155.065 295.7967 8122.665 1943.596 4631.679Gull-billed Tern Gelochelidon nilotica607 Coasts Coastal Laridae waterbird M other native 8000 7200 8800 2001 2003 BNA2014 BBS7017 1970 2017 -3049.07 -12660.3 1617.565 -5579.3 -1146.33Gyrfalcon Falco rusticolus 1005 Arctic TundraTemperate North AmericaFalconidae landbird M other native 41722 33772 57859 2006 2015 PIF0615 CBC7017 1970 2017 13863.45 1469.757 25928.91 9684.636 17887.65Hairy Woodpecker Dryobates villosus965 Forest GeneralistTemperate North AmericaPicidae landbird R other native 8681068 7874994 9508689 2006 2015 PIF0615 BBS7017 1970 2017 -3096167 -3779136 -2478797 -3329311 -2872675Hammond's FlycatcherEmpidonax hammondii1308 Western ForestMexico-Central AmericaTyrannidae landbird M other native 20160045 16231089 24518510 2006 2015 PIF0615 BBS7017 1970 2017 -4669056 -8610735 -1641291 -5918496 -3524201Harlequin Duck Histrionicus histrionicus65 Wetland Marine Anatidae waterfowl M other native 214000 107000 321000 2004 2006 SeDu07 CBC7017 1970 2017 37724.55 -115286 155781.1 -3818.27 76055.91Harris's Hawk Parabuteo unicinctus812 Aridlands Southwestern AridlandsAccipitridaelandbird R other native 51689 29505 86815 2006 2015 PIF0615 BBS7017 1970 2017 46573.71 19452.61 78602.7 36779.27 56963.78Harris's Sparrow Zonotrichia querula1857 Arctic TundraTemperate North AmericaPasserellidaelandbird M other native 2000000 500000 3500000 2015 2017 ACAD CBC7017 1970 2017 2537435 597616.7 4783561 1849030 3251391Henslow's Sparrow Centronyx henslowii1845 Grassland Temperate North AmericaPasserellidaelandbird M other native 408187 290235 547708 2006 2015 PIF0615 BBS7017 1970 2017 173828.4 13302.12 327631 121409.9 226459.1Hepatic Tanager Piranga flava 2032 Western ForestMexico-Central AmericaCardinalidaelandbird M other native 411228 263215 591940 2006 2015 PIF0615 BBS7017 1970 2017 -370234 -627399 -196646 -447404 -301623Hermit Thrush Catharus guttatus1584 Forest GeneralistTemperate North AmericaTurdidae landbird M other native 71726125 54075176 95680929 2006 2015 PIF0615 BBS7017 1970 2017 -9234986 -2E+07 -654531 -1.3E+07 -6079111Hermit Warbler Setophaga occidentalis2010 Western ForestMexico-Central AmericaParulidae landbird M other native 2525603 1808648 3357140 2006 2015 PIF0615 BBS7017 1970 2017 313766.7 -252048 857568.1 131331.1 491442.1Herring Gull Larus argentatus 586 Wetland Temperate North AmericaLaridae waterbird M other native 2891313 1563414 4831139 2009 2011 BNA2017 BBS7017 1970 2017 10362885 4307707 17229497 8259843 12630212

Hoary Redpoll Acanthis hornemanni1756 Arctic TundraTemperate North AmericaFringillidae landbird M other native 12815104 12474111 13252214 2006 2015 PIF0615 CBC7017 1970 2017 -8412361 -3E+07 694118.2 -1.4E+07 -4425774Hooded Merganser Lophodytes cucullatus76 Wetland Temperate North AmericaAnatidae waterfowl M other native 485000 363750 606250 2004 2006 SeDu07 BBS7017 1970 2017 -745843 -1096337 -488242 -855318 -645439Hooded Oriole Icterus cucullatus1910 Aridlands Mexico-Central AmericaIcteridae landbird M other native 350616 236805 494427 2006 2015 PIF0615 BBS7017 1970 2017 -175616 -326439 -79101.2 -220080 -137726Hooded Warbler Setophaga citrina1982 Eastern ForestMexico-Central AmericaParulidae landbird M other native 5185197 4523541 5902847 2006 2015 PIF0615 BBS7017 1970 2017 -2623094 -3451278 -1911138 -2882650 -2363169Horned Grebe Podiceps auritus 143 Wetland Temperate North AmericaPodicipedidaewaterbird M other native 246553 159574 364503 2006 2015 PIF0615 BBS7017 1970 2017 202267 98469.34 325658.7 164744.7 242551.8Horned Lark Eremophila alpestris1412 Grassland Temperate North AmericaAlaudidae landbird M other native 1.01E+08 90290833 1.13E+08 2006 2015 PIF0615 BBS7017 1970 2017 1.82E+08 1.58E+08 2.07E+08 1.74E+08 1.91E+08House Finch Haemorhous mexicanus1749 Habitat GeneralistWidespreadFringillidae landbird R other native 33246130 29546633 37992529 2006 2015 PIF0615 BBS7017 1970 2017 -2183694 -6518744 1624152 -3574124 -819800House Sparrow Passer domesticus1668 Introduced Introduced Passeridae other Introduced other Introduced 92842101 83703006 1.04E+08 2006 2015 PIF0615 BBS7017 1970 2017 3.31E+08 2.89E+08 3.75E+08 3.16E+08 3.46E+08House Wren Troglodytes aedon1461 Forest GeneralistTemperate North AmericaTroglodytidaelandbird M other native 43318358 39758949 47473572 2006 2015 PIF0615 BBS7017 1970 2017 -6013779 -1E+07 -2356280 -7353318 -4734260Hudsonian Godwit Limosa haemastica480 Wetland South AmericaScolopacidaeshorebird M other native 77000 56424 107100 2011 2013 Shoreb12 Mig7416 1974 2016 120479.9 43346.02 218544.8 93566.59 150717.5Hutton's Vireo Vireo huttoni 1351 Western ForestTemperate North AmericaVireonidae landbird R other native 964653 744358 1213151 2006 2015 PIF0615 BBS7017 1970 2017 -380352 -594853 -216543 -446999 -318451Inca Dove Columbina inca 169 Aridlands Southwestern AridlandsColumbidaelandbird R other native 619057 491301 765612 2006 2015 PIF0615 BBS7017 1970 2017 -318794 -535573 -173030 -384240 -262939Indigo Bunting Passerina cyanea 2060 Eastern ForestMexico-Central AmericaCardinalidaelandbird M other native 77494167 73235841 82041052 2006 2015 PIF0615 BBS7017 1970 2017 31485546 26846872 36179744 29841978 33097888Juniper Titmouse Baeolophus ridgwayi1444 Western ForestTemperate North AmericaParidae landbird R other native 291637 201086 392881 2006 2015 PIF0615 BBS7017 1970 2017 -74868.8 -152099 -19345.6 -98465.7 -53567.6Kentucky Warbler Geothlypis formosa1970 Eastern ForestMexico-Central AmericaParulidae landbird M other native 2595606 2284175 2937212 2006 2015 PIF0615 BBS7017 1970 2017 1206007 881477.7 1543746 1091370 1321873Killdeer Charadrius vociferus463 Habitat GeneralistWidespreadCharadriidaeshorebird M other native 2000000 800000 5000000 2011 2013 Shoreb12 BBS7017 1970 2017 1040697 0.561577 2162057 666955 1415029King Eider Somateria spectabilis63 Arctic TundraMarine Anatidae waterfowl M other native 560000 280000 840000 2004 2006 SeDu07 CBC7017 1970 2017 2802961 1118325 6116162 2120670 3704472King Rail Rallus elegans 412 Wetland Temperate North AmericaRallidae waterbird M other native 63219 26563 122039 2006 2015 PIF0615 BBS7017 1970 2017 327812.4 85077.59 589958.9 244392.6 416435.6Ladder-backed WoodpeckerDryobates scalaris 963 Aridlands Southwestern AridlandsPicidae landbird R other native 2377162 1983369 2827402 2006 2015 PIF0615 BBS7017 1970 2017 -296494 -586888 -49055.9 -389432 -208196Lapland Longspur Calcarius lapponicus1773 Arctic TundraTemperate North AmericaCalcariidae landbird M other native 68032536 60265772 80590222 2006 2015 PIF0615 BBS9317 1993 2017 8825957 -6.1E+07 44827435 -9904095 22951779Lark Bunting Calamospiza melanocorys1841 Grassland Southwestern AridlandsPasserellidaelandbird M other native 11992598 9194389 15233830 2006 2015 PIF0615 BBS7017 1970 2017 31580727 22361174 41720574 28384489 34870009Lark Sparrow Chondestes grammacus1836 Grassland Mexico-Central AmericaPasserellidaelandbird M other native 10638361 9078588 12343951 2006 2015 PIF0615 BBS7017 1970 2017 4346085 3006262 5781341 3885549 4843317Laughing Gull Leucophaeus atricilla576 Coasts Coastal Laridae waterbird M other native 684463 425116 997966 2006 2015 PIF0615 BBS7017 1970 2017 -405504 -985363 -109418 -558616 -279569Lawrence's GoldfinchSpinus lawrencei 1770 Aridlands Southwestern AridlandsFringillidae landbird M other native 347128 188186 574120 2006 2015 PIF0615 BBS7017 1970 2017 107567.7 -27113.4 259904.2 63032.14 154452.6Lazuli Bunting Passerina amoena2059 Western ForestMexico-Central AmericaCardinalidaelandbird M other native 6453834 5417754 7643998 2006 2015 PIF0615 BBS7017 1970 2017 -1172392 -2156594 -378723 -1470958 -874565Least Bittern Ixobrychus exilis 729 Wetland WidespreadArdeidae waterbird M other native 131773 66196 217720 2006 2015 PIF0615 BBS7017 1970 2017 -33842.4 -88287.4 -2668.34 -49909.5 -20955.6Least Flycatcher Empidonax minimus1307 Eastern ForestMexico-Central AmericaTyrannidae landbird M other native 27244220 24465739 30286260 2006 2015 PIF0615 BBS7017 1970 2017 31461126 27285889 36051548 30008697 32967791Least Sandpiper Calidris minutilla 502 Wetland WidespreadScolopacidaeshorebird M other native 700000 466667 1050000 2011 2013 Shoreb12 Mig7416 1974 2016 58506.84 -373069 367605.2 -56614.6 165289.9Least Tern Sternula antillarum604 Coasts Coastal Laridae waterbird M other native 51692 21444 97858 2006 2015 PIF0615 BBS7017 1970 2017 153306.4 38913.78 285908.5 113274 196866.9LeConte's Sparrow Ammospiza leconteii1846 Grassland Temperate North AmericaPasserellidaelandbird M other native 5128134 4121245 6262076 2006 2015 PIF0615 BBS7017 1970 2017 8054350 6093973 10297745 7351113 8798764LeConte's Thrasher Toxostoma lecontei1628 Aridlands Southwestern AridlandsMimidae landbird R other native 45644 15853 93422 2006 2015 PIF0615 BBS7017 1970 2017 60320.87 9103.802 119780.6 42057.64 79644.42Lesser Goldfinch Spinus psaltria 1769 Western ForestTemperate North AmericaFringillidae landbird M other native 5723877 4542330 7132984 2006 2015 PIF0615 BBS7017 1970 2017 -2154906 -3396582 -1211644 -2545780 -1791371Lesser Nighthawk Chordeiles acutipennis226 Aridlands Widespread NeotropicalCaprimulgidaelandbird M AI native 3801395 2399615 5545863 2006 2015 PIF0615 BBS7017 1970 2017 -150010 -1143791 649061.2 -449756 123724Lesser Scaup Aythya affinis 60 Wetland WidespreadAnatidae waterfowl M other native 2626619 1903177 3511659 2006 2015 PIF0615 BBS7017 1970 2017 1242205 37686.19 2332715 875378 1609688Lesser Yellowlegs Tringa flavipes 524 Wetland WidespreadScolopacidaeshorebird M other native 660000 264000 1650000 2011 2013 Shoreb12 Mig7416 1974 2016 1066078 1.929816 2399662 665628.9 1498627Lewis's WoodpeckerMelanerpes lewis 935 Western ForestTemperate North AmericaPicidae landbird M other native 81507 52913 119611 2006 2015 PIF0615 BBS7017 1970 2017 107348.7 60489.74 162086.4 90527.13 125402Limpkin Aramus guarauna 437 Wetland Widespread NeotropicalAramidae waterbird R other native 9000 6000 12000 1993 1995 BNA2002 CBC7017 1970 2017 1940.927 -22315.1 14961.01 -3965.7 6634.087Lincoln's Sparrow Melospiza lincolnii1853 Boreal ForestTemperate North AmericaPasserellidaelandbird M other native 88078735 78262006 98782691 2006 2015 PIF0615 BBS7017 1970 2017 2035820 -1.6E+07 17153735 -3912516 7653536Little Blue Heron Egretta caerulea 745 Wetland WidespreadArdeidae waterbird M other native 270582 191382 368199 2006 2015 PIF0615 BBS7017 1970 2017 223015.8 143146.1 315468.7 194465.2 253252.2Loggerhead Shrike Lanius ludovicianus1325 Grassland Temperate North AmericaLaniidae landbird M other native 4557457 4080246 5094115 2006 2015 PIF0615 BBS7017 1970 2017 10195978 8901422 11512725 9746170 10638184Long-billed Curlew Numenius americanus474 Grassland WidespreadScolopacidaeshorebird M other native 140000 98000 198000 2011 2013 Shoreb12 BBS7017 1970 2017 -3443.98 -32314.4 20209.34 -12270.4 4495.726Long-billed DowitcherLimnodromus scolopaceus509 Arctic TundraWidespreadScolopacidaeshorebird M other native 500000 333333 750000 2011 2013 Shoreb12 Mig7416 1974 2016 -39506.1 -1036346 248319.4 -221625 66896.05Long-billed ThrasherToxostoma longirostre1623 Aridlands Mexico-Central AmericaMimidae landbird R other native 95573 53639 153900 2006 2015 PIF0615 BBS7017 1970 2017 -125260 -217240 -56871 -153318 -100220Long-eared Owl Asio otus 863 Forest GeneralistTemperate North AmericaStrigidae landbird M other native 37707 15671 68758 2006 2015 PIF0615 CBC7017 1970 2017 55291.04 16281.04 99923.41 41268.74 70079.11Long-tailed Duck Clangula hyemalis 71 Arctic TundraMarine Anatidae waterfowl M other native 1000000 500000 1500000 2004 2006 SeDu07 CBC7017 1970 2017 1890498 463889.9 4335005 1352052 2543619Louisiana WaterthrushParkesia motacilla1949 Eastern ForestWidespread NeotropicalParulidae landbird M other native 446545 377921 529134 2006 2015 PIF0615 BBS7017 1970 2017 -148890 -209781 -99305.1 -168863 -130753Lucy's Warbler Oreothlypis luciae1962 Aridlands Mexico-Central AmericaParulidae landbird M other native 2829708 1620023 4473592 2006 2015 PIF0615 BBS7017 1970 2017 -1092282 -2483918 -305531 -1498202 -767328MacGillivray's WarblerGeothlypis tolmiei1968 Western ForestMexico-Central AmericaParulidae landbird M other native 11191876 9091713 13546236 2006 2015 PIF0615 BBS7017 1970 2017 5797877 4017441 7818029 5158532 6457462Magnolia Warbler Setophaga magnolia1989 Boreal ForestMexico-Central AmericaParulidae landbird M other native 38757259 33706369 44351863 2006 2015 PIF0615 BBS7017 1970 2017 -9625430 -1.7E+07 -3953675 -1.2E+07 -7556024Mallard Anas platyrhynchos48 Wetland WidespreadAnatidae waterfowl M other native 11477600 10557400 12397900 2013 2017 FWS1317 FWS7017 1970 2017 -2031438 -4193861 -96565.8 -2737642 -1342687Marbled Godwit Limosa fedoa 481 Wetland Coastal Scolopacidaeshorebird M other native 174000 116000 261000 2011 2013 Shoreb12 BBS7017 1970 2017 62862.13 28780.59 108748.7 49981 77361.86Marbled Murrelet Brachyramphus marmoratus550 Coasts Marine Alcidae waterbird M other native 545550 256600 834500 1994 1996 BNA1997 CBC7017 1970 2017 53095.45 -303376 321934.4 -37325.9 141989.4Marsh Wren Cistothorus palustris1470 Wetland Temperate North AmericaTroglodytidaelandbird M other native 10846904 8009975 14414465 2006 2015 PIF0615 BBS7017 1970 2017 -7736662 -1.2E+07 -4705167 -8982393 -6603144McCown's LongspurRhynchophanes mccownii1776 Grassland Southwestern AridlandsCalcariidae landbird M other native 844821 487327 1322335 2006 2015 PIF0615 BBS7017 1970 2017 3888683 1957915 6169425 3203015 4639636Merlin Falco columbarius1000 Habitat GeneralistWidespreadFalconidae landbird M other native 1620998 1325156 1975531 2006 2015 PIF0615 BBS7017 1970 2017 -1612792 -2138265 -1189028 -1781364 -1462658Mew Gull Larus canus 581 Wetland Temperate North AmericaLaridae waterbird M other native 1286450 659195 2419626 2006 2015 PIF0615 BBS9317 1993 2017 1821392 569413.5 3228198 1370506 2286999Mexican Jay Aphelocoma wollweberi1388 Western ForestMexico-Central AmericaCorvidae landbird R other native 142059 31219 355566 2006 2015 PIF0615 BBS9317 1993 2017 3873.173 -167669 111852.1 -23083.1 35303.46Mississippi Kite Ictinia mississippiensis798 Eastern ForestSouth AmericaAccipitridaelandbird M other native 695177 537854 881937 2006 2015 PIF0615 BBS7017 1970 2017 -301595 -580603 -108736 -386194 -226066Monk Parakeet Myiopsitta monachus1010 Introduced Introduced Psittacidae other Introduced other Introduced 59268 1094 158202 2006 2015 PIF0615 CBC7017 1970 2017 -64435.8 -313924 -0.99289 -118027 -30533.9Mottled Duck Anas fulvigula 50 Wetland Temperate North AmericaAnatidae waterfowl M other native 238785 148277 355630 2006 2015 PIF0615 BBS7017 1970 2017 427891.9 233584.8 643483 360360.5 500409.3Mountain Bluebird Sialia currucoides1559 Western ForestTemperate North AmericaTurdidae landbird M other native 5568751 4615920 6673385 2006 2015 PIF0615 BBS7017 1970 2017 1039371 347961.7 1760562 804174.6 1271889Mountain ChickadeePoecile gambeli 1437 Western ForestTemperate North AmericaParidae landbird R other native 7855197 6597745 9279875 2006 2015 PIF0615 BBS7017 1970 2017 7054024 5510211 8801690 6505060 7646174Mountain Plover Charadrius montanus465 Grassland Southwestern AridlandsCharadriidaeshorebird M other native 20000 13333 30000 2011 2013 Shoreb12 BBS7017 1970 2017 49755.24 27432.87 78529.69 41718.1 58828.68Mountain Quail Oreortyx pictus 94 Western ForestTemperate North AmericaOdontophoridaelandbird R other native 250825 174335 348548 2006 2015 PIF0615 BBS7017 1970 2017 69792.51 11881.85 133017.8 49616.46 90872.55Mourning Dove Zenaida macroura 198 Habitat GeneralistWidespreadColumbidaelandbird M other native 1.33E+08 1.23E+08 1.43E+08 2006 2015 PIF0615 BBS7017 1970 2017 22343284 13783136 31436580 19386865 25298364Mourning Warbler Geothlypis philadelphia1969 Boreal ForestSouth AmericaParulidae landbird M other native 13827473 11375932 16818340 2006 2015 PIF0615 BBS7017 1970 2017 10581352 7589476 13954068 9514445 11692061Mute Swan Cygnus olor 25 Introduced Introduced Anatidae other Introduced other Introduced 12000 9000 15000 1992 1994 BNA1997 BBS7017 1970 2017 -22470.7 -44877.7 -10649.1 -28667.8 -17614.2Nashville Warbler Oreothlypis ruficapilla1963 Boreal ForestMexico-Central AmericaParulidae landbird M other native 39717135 34046329 46021851 2006 2015 PIF0615 BBS7017 1970 2017 -947001 -6564073 4105630 -2777841 869582.6Nelson's Sparrow Ammospiza nelsoni1848 Wetland Coastal Passerellidaelandbird M other native 1012433 860211 1182894 2006 2015 PIF0615 BBS7017 1970 2017 -750892 -1177019 -444523 -881076 -634526Northern BobwhiteColinus virginianus 99 Eastern ForestTemperate North AmericaOdontophoridaelandbird R other native 5800000 2900000 8700000 2008 2010 ACAD BBS7017 1970 2017 20999410 10585392 31967593 17377761 24700104Northern Cardinal Cardinalis cardinalis2047 Eastern ForestTemperate North AmericaCardinalidaelandbird R other native 1.18E+08 1.08E+08 1.29E+08 2006 2015 PIF0615 BBS7017 1970 2017 -1.2E+07 -1.8E+07 -5578104 -1.4E+07 -9435179Northern Flicker Colaptes auratus 977 Forest GeneralistWidespreadPicidae landbird M other native 10997056 10030079 12029437 2006 2015 PIF0615 BBS7017 1970 2017 7961296 6849654 9122472 7572993 8352821Northern Fulmar Fulmarus glacialis 660 Coasts Marine Procellariidaewaterbird M other native 2200000 1650000 2750000 2009 2011 BNA2012 CBC7017 1970 2017 1005941 -3530905 3510282 83124.65 1774800Northern Gannet Morus bassanus 716 Coasts Marine Sulidae waterbird M other native 144596 130136 159056 1998 2000 BNA2002 CBC7017 1970 2017 -349416 -718953 -162712 -449623 -272497Northern Goshawk Accipiter gentilis 793 Forest GeneralistTemperate North AmericaAccipitridaelandbird M other native 205103 144935 279609 2006 2015 PIF0615 BBS7017 1970 2017 -48108.8 -93351.6 -16110.1 -61842 -35855.6Northern Harrier Circus hudsonius 783 Habitat GeneralistTemperate North AmericaAccipitridaelandbird M other native 822326 731377 921329 2006 2015 PIF0615 BBS7017 1970 2017 344624.2 261367.8 431566.3 315474.3 374139.9Northern MockingbirdMimus polyglottos1634 Habitat GeneralistTemperate North AmericaMimidae landbird M other native 33748673 30589410 37047818 2006 2015 PIF0615 BBS7017 1970 2017 10508038 7913823 13219746 9603651 11437382Northern Parula Setophaga americana1987 Forest GeneralistCaribbean Parulidae landbird M other native 18173930 16508547 19946040 2006 2015 PIF0615 BBS7017 1970 2017 -9336990 -1.2E+07 -7147782 -1E+07 -8553133Northern Pintail Anas acuta 52 Wetland Temperate North AmericaAnatidae waterfowl M other native 3021200 2644500 3397900 2013 2017 FWS1317 FWS7017 1970 2017 2958537 1832624 4093474 2569665 3342651Northern Pygmy-OwlGlaucidium gnoma848 Western ForestTemperate North AmericaStrigidae landbird R other native 129397 77555 214434 2006 2015 PIF0615 BBS7017 1970 2017 -31537.5 -69141.7 -8545.25 -42769.6 -22129.3Northern Rough-winged SwallowStelgidopteryx serripennis1428 Habitat GeneralistWidespreadHirundinidaelandbird M AI native 19956056 15363114 26977637 2006 2015 PIF0615 BBS7017 1970 2017 3927099 1950256 6264862 3220706 4694797Northern Saw-whet OwlAegolius acadicus 869 Forest GeneralistTemperate North AmericaStrigidae landbird M other native 2000000 500000 3500000 2007 2009 ACAD CBC7017 1970 2017 -1351855 -2943058 -316622 -1804763 -957153Northern Shoveler Spatula clypeata 40 Wetland Temperate North AmericaAnatidae waterfowl M other native 4548300 4125700 4970800 2013 2017 FWS1317 FWS7017 1970 2017 -2429073 -3700153 -1483874 -2817194 -2076330Northern Shrike Lanius borealis 1326 Arctic TundraTemperate North AmericaLaniidae landbird M other native 400000 100000 700000 2003 2005 ACAD CBC7017 1970 2017 96025.32 21605.74 198496.7 67838.14 127428.9Northern WaterthrushParkesia noveboracensis1950 Boreal ForestWidespread NeotropicalParulidae landbird M other native 17166584 14259921 20524318 2006 2015 PIF0615 BBS7017 1970 2017 -6228102 -9085386 -3916686 -7138821 -5378017Northwestern CrowCorvus caurinus 1396 Western ForestTemperate North AmericaCorvidae landbird R other native 701805 421865 1111796 2006 2015 PIF0615 BBS7017 1970 2017 -45148.4 -278049 117427.8 -109414 11107.21Nuttall's WoodpeckerDryobates nuttallii962 Western ForestTemperate North AmericaPicidae landbird R other native 752044 500760 1076906 2006 2015 PIF0615 BBS7017 1970 2017 -307140 -515157 -160996 -372602 -250457Oak Titmouse Baeolophus inornatus1443 Western ForestTemperate North AmericaParidae landbird R other native 706717 407725 1196605 2006 2015 PIF0615 BBS7017 1970 2017 576678.4 249663.9 966838.6 459377.8 701327.8Olive-sided FlycatcherContopus cooperi1291 Forest GeneralistSouth AmericaTyrannidae landbird M AI native 1916763 1576589 2322865 2006 2015 PIF0615 BBS7017 1970 2017 4943195 3934613 5997448 4592708 5299625Olive Sparrow Arremonops rufivirgatus1798 Aridlands Mexico-Central AmericaPasserellidaelandbird R other native 829024 486176 1252969 2006 2015 PIF0615 BBS7017 1970 2017 -792427 -1467900 -372448 -994307 -625849Orange-crowned WarblerOreothlypis celata1960 Forest GeneralistTemperate North AmericaParulidae landbird M other native 81919229 69421324 95720231 2006 2015 PIF0615 BBS7017 1970 2017 39613137 26495091 53864624 34983046 44251139Orchard Oriole Icterus spurius 1909 Eastern ForestMexico-Central AmericaIcteridae landbird M other native 10894813 9896563 11930180 2006 2015 PIF0615 BBS7017 1970 2017 4551646 3494193 5651655 4182953 4923404Osprey Pandion haliaetus 770 Wetland WidespreadPandionidaelandbird M other native 399228 328092 483403 2006 2015 PIF0615 BBS7017 1970 2017 -389022 -508103 -291572 -427427 -352897Ovenbird Seiurus aurocapilla1947 Eastern ForestWidespread NeotropicalParulidae landbird M other native 26312390 22777813 30231156 2006 2015 PIF0615 BBS7017 1970 2017 -345928 -2803805 1985590 -1188935 449536.2Pacific-slope FlycatcherEmpidonax difficilis1312 Western ForestMexico-Central AmericaTyrannidae landbird M other native 8585203 6751118 10839307 2006 2015 PIF0615 BBS7017 1970 2017 1109050 -282197 2431693 658484.9 1558167Pacific Golden-PloverPluvialis fulva 453 Arctic TundraCoastal Charadriidaeshorebird M other native 42500 35000 50000 2011 2013 Shoreb12 BBS9317 1993 2017 20160.66 -31041.2 52636.71 7375.194 31258.61Pacific Wren Troglodytes pacificus1466 Western ForestTemperate North AmericaTroglodytidaelandbird M other native 7528567 5392359 10095516 2006 2015 PIF0615 BBS7017 1970 2017 2061937 273466.3 3883182 1457687 2657056Painted Bunting Passerina ciris 2064 Eastern ForestMexico-Central AmericaCardinalidaelandbird M other native 12778114 10848520 14991104 2006 2015 PIF0615 BBS7017 1970 2017 2607566 511527.7 4581434 1926235 3291078Palm Warbler Setophaga palmarum1996 Boreal ForestCaribbean Parulidae landbird M other native 13172938 9852145 17350184 2006 2015 PIF0615 BBS7017 1970 2017 -782087 -9788947 5294725 -3374767 1428649Pectoral Sandpiper Calidris melanotos505 Arctic TundraSouth AmericaScolopacidaeshorebird M other native 1600000 1129600 2070400 2011 2013 Shoreb12 Mig7416 1974 2016 1529641 674489.6 2536008 1233412 1852677Pelagic Cormorant Phalacrocorax pelagicus722 Coasts Coastal Phalacrocoracidaewaterbird M other native 135000 67500 202500 1989 1991 BNA2013 BBS7017 1970 2017 92128.62 10935.61 188538.1 64387.72 121662.8Peregrine Falcon Falco peregrinus 1006 Habitat GeneralistWidespreadFalconidae landbird M other native 40000 20000 60000 2001 2003 ACAD BBS7017 1970 2017 -86746.2 -149705 -41177.2 -106188 -69942.9Phainopepla Phainopepla nitens1647 Aridlands Southwestern AridlandsPtiliogonatidaelandbird M other native 1285683 905747 1775051 2006 2015 PIF0615 BBS7017 1970 2017 -271987 -742194 46381.36 -410086 -151340Philadelphia Vireo Vireo philadelphicus1357 Boreal ForestMexico-Central AmericaVireonidae landbird M other native 3968582 3039944 5019728 2006 2015 PIF0615 BBS7017 1970 2017 -2863408 -5379097 -1284149 -3591843 -2235425Pied-billed Grebe Podilymbus podiceps141 Wetland WidespreadPodicipedidaewaterbird M other native 1138963 905996 1412585 2006 2015 PIF0615 BBS7017 1970 2017 -316528 -723216 -30089.9 -444442 -209271Pigeon Guillemot Cepphus columba 548 Coasts Marine Alcidae waterbird R other native 235100 117550 352650 1992 1994 BNA1993 CBC7017 1970 2017 -71649.2 -301829 44983.16 -131360 -26962.8Pileated WoodpeckerDryocopus pileatus983 Eastern ForestTemperate North AmericaPicidae landbird R other native 2648713 2398947 2931122 2006 2015 PIF0615 BBS7017 1970 2017 -1558515 -1813506 -1320917 -1645356 -1475255Pine Grosbeak Pinicola enucleator1743 Boreal ForestTemperate North AmericaFringillidae landbird M other native 5530332 4039601 7262401 2006 2015 PIF0615 BBS7017 1970 2017 2342110 -7059236 6902691 182822.2 3957376Pine Siskin Spinus pinus 1763 Forest GeneralistTemperate North AmericaFringillidae landbird M other native 44719558 37972998 52314211 2006 2015 PIF0615 BBS7017 1970 2017 1.2E+08 95152611 1.47E+08 1.11E+08 1.29E+08Pine Warbler Setophaga pinus 1998 Eastern ForestTemperate North AmericaParulidae landbird M other native 13108682 11923661 14327429 2006 2015 PIF0615 BBS7017 1970 2017 -4543752 -6379468 -2950226 -5134315 -4003254Pinyon Jay Gymnorhinus cyanocephalus1380 Western ForestTemperate North AmericaCorvidae landbird R other native 755415 525819 1068774 2006 2015 PIF0615 BBS7017 1970 2017 2327893 1479402 3233357 2034879 2624569Plumbeous Vireo Vireo plumbeus 1356 Western ForestMexico-Central AmericaVireonidae landbird M other native 2999048 2194985 3986302 2006 2015 PIF0615 BBS7017 1970 2017 1053041 35627.83 2023725 724575.8 1380595Prairie Falcon Falco mexicanus 1007 Aridlands Southwestern AridlandsFalconidae landbird M other native 97855 76690 121492 2006 2015 PIF0615 BBS7017 1970 2017 -46807.6 -67473.9 -30746.6 -53300.2 -40920.6Prairie Warbler Setophaga discolor2003 Eastern ForestCaribbean Parulidae landbird M other native 3555356 3156416 4009433 2006 2015 PIF0615 BBS7017 1970 2017 3786988 3087786 4542322 3542900 4042205Prothonotary WarblerProtonotaria citrea1955 Eastern ForestMexico-Central AmericaParulidae landbird M other native 2069931 1633108 2645686 2006 2015 PIF0615 BBS7017 1970 2017 1278490 891442.2 1711154 1141925 1420549Purple Finch Haemorhous purpureus1750 Forest GeneralistTemperate North AmericaFringillidae landbird M other native 6539107 5746681 7363210 2006 2015 PIF0615 BBS7017 1970 2017 4739732 3785766 5747048 4414121 5072598Purple Gallinule Porphyrio martinicus428 Wetland Widespread NeotropicalRallidae waterbird M other native 19522 9167 33564 2006 2015 PIF0615 BBS7017 1970 2017 20343.05 5846.802 38866.73 14847.97 26228.36Purple Martin Progne subis 1413 Habitat GeneralistSouth AmericaHirundinidaelandbird M AI native 8728591 7776376 9841533 2006 2015 PIF0615 BBS7017 1970 2017 3333177 2384600 4331774 3007908 3670224Purple Sandpiper Calidris maritima 499 Arctic TundraCoastal Scolopacidaeshorebird M other native 25000 16667 37500 2011 2013 Shoreb12 CBC7017 1970 2017 13316.62 -799.684 28389.12 8549.64 18268.98Pygmy Nuthatch Sitta pygmaea 1451 Western ForestTemperate North AmericaSittidae landbird R other native 3103791 2051268 4410534 2006 2015 PIF0615 BBS7017 1970 2017 603600 -352646 1522363 307763.9 909903.8Pyrrhuloxia Cardinalis sinuatus2048 Aridlands Southwestern AridlandsCardinalidaelandbird R other native 1578426 1076870 2208564 2006 2015 PIF0615 BBS7017 1970 2017 1398061 851520.3 2036087 1200046 1609156Razorbill Alca torda 545 Coasts Marine Alcidae waterbird M other native 76000 38000 114000 2000 2002 BNA2009 CBC7017 1970 2017 -535979 -2742829 -95542.3 -940918 -299403Red-bellied WoodpeckerMelanerpes carolinus951 Eastern ForestTemperate North AmericaPicidae landbird R other native 15518241 14095781 16973039 2006 2015 PIF0615 BBS7017 1970 2017 -6477117 -7555176 -5469825 -6835596 -6122244Red-breasted MerganserMergus serrator 78 Arctic TundraMarine Anatidae waterfowl M other native 350000 175000 525000 2004 2006 SeDu07 BBS7017 1970 2017 646173.1 245269.4 1255038 489864.3 825656.5Red-breasted NuthatchSitta canadensis 1449 Forest GeneralistTemperate North AmericaSittidae landbird M other native 19689413 17772520 21658078 2006 2015 PIF0615 BBS7017 1970 2017 -8767892 -1.3E+07 -5695489 -9961004 -7667907

Red-breasted SapsuckerSphyrapicus ruber956 Western ForestTemperate North AmericaPicidae landbird M other native 2755899 1872219 3799342 2006 2015 PIF0615 BBS7017 1970 2017 -1326732 -2228692 -716471 -1603251 -1086480Red-cockaded WoodpeckerDryobates borealis964 Eastern ForestTemperate North AmericaPicidae landbird R other native 15000 11250 18750 2005 2007 ACAD BBS7017 1970 2017 20336.79 10164.08 31614.46 16789.21 23994.21Red-eyed Vireo Vireo olivaceus 1360 Forest GeneralistSouth AmericaVireonidae landbird M other native 1.31E+08 1.21E+08 1.41E+08 2006 2015 PIF0615 BBS7017 1970 2017 -4.4E+07 -5.4E+07 -3.5E+07 -4.7E+07 -4.1E+07Red-faced CormorantPhalacrocorax urile721 Coasts Coastal Phalacrocoracidaewaterbird R other native 84500 42250 126750 1992 1994 BNA2002 CBC7017 1970 2017 83285.86 6664.472 177944.2 57961.77 110021.3Red-faced Warbler Cardellina rubrifrons2024 Western ForestMexico-Central AmericaParulidae landbird M other native 252600 70739 503841 2006 2015 PIF0615 BBS9317 1993 2017 78611.38 -123124 286046.9 22482.27 141427.8Red-headed WoodpeckerMelanerpes erythrocephalus938 Eastern ForestTemperate North AmericaPicidae landbird M other native 1802639 1587954 2066531 2006 2015 PIF0615 BBS7017 1970 2017 2438936 2062909 2843254 2303393 2577544Red-naped SapsuckerSphyrapicus nuchalis955 Western ForestTemperate North AmericaPicidae landbird M other native 1974818 1596661 2425112 2006 2015 PIF0615 BBS7017 1970 2017 -831754 -1287221 -480910 -975677 -697846Red-necked Grebe Podiceps grisegena144 Wetland Marine Podicipedidaewaterbird M other native 737518 482463 1054730 2006 2015 PIF0615 BBS7017 1970 2017 -298300 -669475 -57923.6 -406750 -203238Red-shouldered HawkButeo lineatus 818 Forest GeneralistTemperate North AmericaAccipitridaelandbird M other native 1827010 1607481 2085341 2006 2015 PIF0615 BBS7017 1970 2017 -1675497 -1969607 -1411910 -1771469 -1583843Red-tailed Hawk Buteo jamaicensis 825 Habitat GeneralistWidespreadAccipitridaelandbird M other native 2808115 2579824 3052334 2006 2015 PIF0615 BBS7017 1970 2017 -1649718 -1868102 -1451142 -1724720 -1577264Red-throated Loon Gavia stellata 626 Arctic TundraMarine Gaviidae waterbird M other native 358396 96811 792502 2006 2015 PIF0615 BBS9317 1993 2017 -64174.8 -471009 101679 -160451 -4466.97Red-winged BlackbirdAgelaius phoeniceus1926 Habitat GeneralistTemperate North AmericaIcteridae landbird M other native 1.73E+08 1.55E+08 1.97E+08 2006 2015 PIF0615 BBS7017 1970 2017 92754828 77318657 1.09E+08 87286802 98222647Red Crossbill Loxia curvirostra1757 Forest GeneralistTemperate North AmericaFringillidae landbird M other native 9585953 7856459 11542746 2006 2015 PIF0615 BBS7017 1970 2017 -521052 -3406695 1659049 -1430356 262580.4Red Knot Calidris canutus 485 Arctic TundraCoastal Scolopacidaeshorebird M other native 139000 107715 196500 2011 2013 Shoreb12 Mig7416 1974 2016 786817 451716.6 1320313 658298.1 947035.5Reddish Egret Egretta rufescens 747 Coasts Coastal Ardeidae waterbird M other native 4000 3600 4400 1995 1997 BNA2002 CBC7017 1970 2017 -2169.74 -3844.42 -978.25 -2672.08 -1724.88Redhead Aythya americana 55 Wetland Temperate North AmericaAnatidae waterfowl M other native 1216200 1022900 1409500 2013 2017 FWS1317 FWS7017 1970 2017 -614728 -915837 -384342 -708527 -528118Rhinoceros Auklet Cerorhinca monocerata561 Coasts Marine Alcidae waterbird M other native 900000 450000 1350000 1997 1999 BNA1993 CBC7017 1970 2017 -704894 -1937159 -153527 -1017267 -462626Ring-billed Gull Larus delawarensis582 Wetland Temperate North AmericaLaridae waterbird M other native 3740458 2828976 4916343 2006 2015 PIF0615 BBS7017 1970 2017 -2040795 -3250218 -1163597 -2416011 -1706859Ring-necked Duck Aythya collaris 57 Wetland Temperate North AmericaAnatidae waterfowl M other native 527400 370400 684300 2013 2017 FWS1317 BBS7017 1970 2017 -438992 -716450 -254973 -520050 -365060Ring-necked PheasantPhasianus colchicus123 Introduced Introduced Phasianidaeother Introduced other Introduced 16642331 14252196 19372599 2006 2015 PIF0615 BBS7017 1970 2017 4081809 1458413 6850717 3189837 5015259Rock Pigeon Columba livia 149 Introduced Introduced Columbidaeother Introduced other Introduced 16195053 14584425 17988593 2006 2015 PIF0615 BBS7017 1970 2017 9716674 7473179 12160766 8923917 10507280Rock Sandpiper Calidris ptilocnemis498 Arctic TundraCoastal Scolopacidaeshorebird M other native 144800 67900 334400 2011 2013 Shoreb12 CBC7017 1970 2017 157006.2 -27577.1 476867.3 83253.48 249097.8Rock Wren Salpinctes obsoletus1454 Aridlands Southwestern AridlandsTroglodytidaelandbird M other native 3362014 2744880 4115789 2006 2015 PIF0615 BBS7017 1970 2017 2470864 1818269 3217035 2232387 2719110Rose-breasted GrosbeakPheucticus ludovicianus2051 Eastern ForestWidespread NeotropicalCardinalidaelandbird M other native 4715733 4058034 5474743 2006 2015 PIF0615 BBS7017 1970 2017 1965605 1416636 2584608 1774278 2162243Roseate Spoonbill Platalea ajaja 764 Wetland Widespread NeotropicalThreskiornithidaewaterbird M other native 11000 8250 13750 1997 1999 BNA2000 BBS7017 1970 2017 -46069.7 -81166 -25815.2 -55900 -37477Ross's Goose Anser rossii 13 Arctic TundraTemperate North AmericaAnatidae waterfowl M other native 2122006 1909805 2334207 2013 2015 CAFF18 CAFF 1989 2016 -1839191 -6621366 -442546 -2907504 -1154893Rough-legged HawkButeo lagopus 826 Arctic TundraTemperate North AmericaAccipitridaelandbird M other native 296141 248433 370060 2006 2015 PIF0615 CBC7017 1970 2017 -11203.7 -64564.2 34041.65 -28323.8 5101.117Royal Tern Thalasseus maximus617 Coasts Coastal Laridae waterbird M other native 35206 10179 70873 2006 2015 PIF0615 BBS7017 1970 2017 -2120.6 -39981.1 18352.05 -10540.9 3782.684Ruby-crowned KingletRegulus calendula1518 Boreal ForestTemperate North AmericaRegulidae landbird M other native 99900936 90024695 1.11E+08 2006 2015 PIF0615 BBS7017 1970 2017 -2E+07 -3.7E+07 -4867386 -2.5E+07 -1.4E+07Ruby-throated HummingbirdArchilochus colubris332 Eastern ForestMexico-Central AmericaTrochilidae landbird M other native 35777111 31236693 40921667 2006 2015 PIF0615 BBS7017 1970 2017 -1.7E+07 -2.1E+07 -1.4E+07 -1.8E+07 -1.6E+07Ruddy Duck Oxyura jamaicensis 80 Wetland WidespreadAnatidae waterfowl M other native 1334697 970409 1802652 2006 2015 PIF0615 BBS7017 1970 2017 -777078 -1362991 -383815 -952700 -616257Ruddy Turnstone Arenaria interpres 482 Arctic TundraCoastal Scolopacidaeshorebird M other native 245000 163333 367500 2011 2013 Shoreb12 Mig7416 1974 2016 1096850 608565.1 1756909 915241.9 1296343Ruffed Grouse Bonasa umbellus 125 Forest GeneralistTemperate North AmericaPhasianidaelandbird R other native 16500000 8250000 24750000 2004 2006 ACAD BBS7017 1970 2017 -2277000 -6333563 376825.4 -3502130 -1228649Rufous-crowned SparrowAimophila ruficeps1808 Aridlands Southwestern AridlandsPasserellidaelandbird R other native 601135 407380 851057 2006 2015 PIF0615 BBS7017 1970 2017 222458.5 77386.16 399516 168728.2 279873.7Rufous HummingbirdSelasphorus rufus 341 Western ForestMexico-Central AmericaTrochilidae landbird M other native 21694644 13724171 32781297 2006 2015 PIF0615 BBS7017 1970 2017 31516706 17402886 45836612 26540140 36517788Rusty Blackbird Euphagus carolinus1937 Boreal ForestTemperate North AmericaIcteridae landbird M other native 6804603 4919111 9459126 2006 2015 PIF0615 BBS7017 1970 2017 23805588 15151219 33203095 20793996 26957828Sage Thrasher Oreoscoptes montanus1630 Aridlands Southwestern AridlandsMimidae landbird M other native 6362519 4673219 8479429 2006 2015 PIF0615 BBS7017 1970 2017 4306712 2678704 6236332 3712433 4930130Sagebrush Sparrow Artemisiospiza nevadensis1839 Aridlands Southwestern AridlandsPasserellidaelandbird M other native 5386123 3477545 8199885 2006 2015 PIF0615 BBS7017 1970 2017 396872.7 -1315488 1911859 -105161 890716.3Sanderling Calidris alba 496 Arctic TundraCoastal Scolopacidaeshorebird M other native 300000 120000 750000 2011 2013 Shoreb12 Mig7416 1974 2016 773200.7 3.045663 1696297 492589.6 1072115Sandhill Crane Antigone canadensis438 Wetland WidespreadGruidae waterbird M other native 500000 450000 550000 2009 2011 BNA2014 BBS7017 1970 2017 -693633 -877673 -549334 -751478 -640981Sandwich Tern Thalasseus sandvicensis619 Coasts Coastal Laridae waterbird M other native 93890 70418 117363 1984 1986 BNA2016 CBC7017 1970 2017 -56071.2 -117368 -14729.6 -74403.6 -40020.7Savannah Sparrow Passerculus sandwichensis1842 Grassland Temperate North AmericaPasserellidaelandbird M other native 1.69E+08 1.44E+08 1.95E+08 2006 2015 PIF0615 BBS7017 1970 2017 1.4E+08 1.14E+08 1.69E+08 1.31E+08 1.5E+08Say's Phoebe Sayornis saya 1319 Habitat GeneralistSouthwestern AridlandsTyrannidae landbird M other native 5044646 4348767 5764857 2006 2015 PIF0615 BBS7017 1970 2017 -2048911 -2653374 -1524270 -2253522 -1858591Scaled Quail Callipepla squamata102 Aridlands Southwestern AridlandsOdontophoridaelandbird R other native 2393345 1766520 3168001 2006 2015 PIF0615 BBS7017 1970 2017 1219606 -1903248 3266030 348096.3 1981454Scarlet Tanager Piranga olivacea 2034 Eastern ForestSouth AmericaCardinalidaelandbird M other native 2574915 2256623 2956329 2006 2015 PIF0615 BBS7017 1970 2017 301716.3 117878.6 497516.1 236828.3 368151.9Scissor-tailed FlycatcherTyrannus forficatus1282 Grassland Mexico-Central AmericaTyrannidae landbird M AI native 7914013 6502356 9635329 2006 2015 PIF0615 BBS7017 1970 2017 2308550 1308705 3387566 1963949 2676523Scott's Oriole Icterus parisorum1924 Western ForestMexico-Central AmericaIcteridae landbird M other native 1721724 1332821 2134384 2006 2015 PIF0615 BBS7017 1970 2017 773869.9 439813 1148394 654043.9 894665.1Seaside Sparrow Ammospiza maritima1847 Coasts Coastal Passerellidaelandbird M other native 196782 32213 523319 2006 2015 PIF0615 BBS7017 1970 2017 -102593 -432238 -0.39529 -186331 -45587.7Sedge Wren Cistothorus platensis1469 Grassland Temperate North AmericaTroglodytidaelandbird M other native 5017990 4252225 5954334 2006 2015 PIF0615 BBS7017 1970 2017 -1826942 -3145970 -829929 -2241364 -1454877Semipalmated PloverCharadrius semipalmatus460 Arctic TundraCoastal Charadriidaeshorebird M other native 200000 80000 500000 2011 2013 Shoreb12 Mig7416 1974 2016 25352.83 -38834.1 121400.4 4909.987 52077.8Semipalmated SandpiperCalidris pusilla 506 Arctic TundraCoastal Scolopacidaeshorebird M other native 2260000 1728400 2791600 2011 2013 Shoreb12 Mig7416 1974 2016 4759231 2633540 7463647 3998809 5598012Sharp-shinned HawkAccipiter striatus 789 Forest GeneralistWidespreadAccipitridaelandbird M other native 405947 303414 524274 2006 2015 PIF0615 BBS7017 1970 2017 -183725 -261125 -121987 -208631 -160915Sharp-tailed GrouseTympanuchus phasianellus134 Grassland Temperate North AmericaPhasianidaelandbird R other native 761942 569936 975726 2006 2015 PIF0615 BBS7017 1970 2017 -258040 -494499 -90047.8 -331274 -192635Short-billed DowitcherLimnodromus griseus508 Wetland Coastal Scolopacidaeshorebird M other native 153000 61200 382500 2011 2013 Shoreb12 Mig7416 1974 2016 160634.6 0.59968 478349.9 84331.32 251938.1Short-eared Owl Asio flammeus 865 Habitat GeneralistTemperate North AmericaStrigidae landbird M other native 602353 485388 747895 2006 2015 PIF0615 BBS7017 1970 2017 563323.3 309857.8 806621.3 479243.1 647091.4Smith's Longspur Calcarius pictus 1775 Arctic TundraTemperate North AmericaCalcariidae landbird M other native 75000 18750 131250 1992 1994 ACAD CBC7017 1970 2017 -20469.5 -167427 32203.01 -53020.7 -670.689Snow Bunting Plectrophenax nivalis1777 Arctic TundraTemperate North AmericaCalcariidae landbird M other native 14267309 14267309 14267309 2006 2015 PIF0615 CBC7017 1970 2017 12024394 1236737 19124710 9047340 14706712Snow Goose Anser caerulescens 12 Arctic TundraTemperate North AmericaAnatidae waterfowl M other native 15305450 13774905 16835995 2013 2015 CAFF18 CAFF 1970 2016 -1.3E+07 -1.9E+07 -8399855 -1.5E+07 -1.1E+07Snowy Egret Egretta thula 744 Wetland WidespreadArdeidae waterbird M other native 215935 152524 300633 2006 2015 PIF0615 BBS7017 1970 2017 -155729 -262335 -84327.9 -187901 -128165Snowy Owl Bubo scandiacus 846 Arctic TundraTemperate North AmericaStrigidae landbird M other native 14000 7000 21000 2011 2013 ACAD CBC7017 1970 2017 12142.51 4842.862 21414.12 9368.028 15129.86Snowy Plover Charadrius nivosus457 Coasts Coastal Charadriidaeshorebird M other native 31350 23840 41225 2011 2013 Shoreb12 CBC7017 1970 2017 -4768.37 -18300.8 4278.074 -8803.72 -1335.52Solitary Sandpiper Tringa solitaria 521 Wetland South AmericaScolopacidaeshorebird M other native 189000 75600 472500 2011 2013 Shoreb12 BBS7017 1970 2017 -41584 -160961 2407.353 -73025.6 -18254Song Sparrow Melospiza melodia1852 Habitat GeneralistTemperate North AmericaPasserellidaelandbird M other native 1.26E+08 1.19E+08 1.34E+08 2006 2015 PIF0615 BBS7017 1970 2017 55082452 44568049 65846626 51610368 58699961Sooty Grouse Dendragapus fuliginosus133 Western ForestTemperate North AmericaPhasianidaelandbird R other native 2000000 1000000 3000000 2008 2010 ACAD BBS7017 1970 2017 1145824 465286 2070626 885899.9 1435444Sora Porzana carolina 419 Wetland Temperate North AmericaRallidae waterbird M other native 4428137 3481892 5601019 2006 2015 PIF0615 BBS7017 1970 2017 -895239 -3035397 512670.7 -1551785 -353288Spotted Sandpiper Actitis macularius 519 Wetland WidespreadScolopacidaeshorebird M other native 660000 264000 1650000 2011 2013 Shoreb12 BBS7017 1970 2017 582634.1 0.954427 1223862 368898.5 803089Spotted Towhee Pipilo maculatus1805 Western ForestTemperate North AmericaPasserellidaelandbird M other native 35271543 31027431 39773372 2006 2015 PIF0615 BBS7017 1970 2017 2711186 -2132430 7092111 1136179 4285534Sprague's Pipit Anthus spragueii 1680 Grassland Southwestern AridlandsMotacillidaelandbird M other native 1394136 936560 2009643 2006 2015 PIF0615 BBS7017 1970 2017 3882885 2344143 5539403 3329344 4434187Spruce Grouse Falcipennis canadensis128 Boreal ForestTemperate North AmericaPhasianidaelandbird R other native 11000000 5500000 16500000 2007 2009 ACAD CBC7017 1970 2017 -5250276 -1.8E+07 141256.8 -8480635 -2861758Steller's Eider Polysticta stelleri 61 Arctic TundraMarine Anatidae waterfowl M other native 181000 135750 226250 2004 2006 SeDu07 CBC7017 1970 2017 307339.5 36831.06 675018.3 222462.7 404786Steller's Jay Cyanocitta stelleri1381 Western ForestTemperate North AmericaCorvidae landbird R other native 2705843 2239068 3237856 2006 2015 PIF0615 BBS7017 1970 2017 343052.4 85551.84 604762.9 255702.2 431977.5Stilt Sandpiper Calidris himantopus490 Arctic TundraWidespreadScolopacidaeshorebird M other native 1243700 418800 2068600 2011 2013 Shoreb12 Mig7416 1974 2016 737399 -154531 1850642 432578.8 1069449Summer Tanager Piranga rubra 2033 Eastern ForestWidespread NeotropicalCardinalidaelandbird M other native 11302422 10343397 12384415 2006 2015 PIF0615 BBS7017 1970 2017 -1526407 -2389738 -709811 -1819119 -1241058Surf Scoter Melanitta perspicillata67 Wetland Marine Anatidae waterfowl M other native 600000 450000 750000 2004 2006 SeDu07 CBC7017 1970 2017 -59228.6 -263419 103813.3 -121422 -1192.87Surfbird Calidris virgata 486 Arctic TundraCoastal Scolopacidaeshorebird M other native 70000 46667 105000 2011 2013 Shoreb12 CBC7017 1970 2017 60758.09 19526.15 114455.7 45593.92 77309.53Swainson's Hawk Buteo swainsoni 823 Grassland South AmericaAccipitridaelandbird M other native 822598 714482 956228 2006 2015 PIF0615 BBS7017 1970 2017 -336424 -440947 -247854 -370365 -304007Swainson's Thrush Catharus ustulatus1583 Forest GeneralistSouth AmericaTurdidae landbird M other native 1.22E+08 1.02E+08 1.44E+08 2006 2015 PIF0615 BBS7017 1970 2017 42700637 27254661 59294664 37301135 48201576Swainson's WarblerLimnothlypis swainsonii1956 Eastern ForestCaribbean Parulidae landbird M other native 156081 99540 235309 2006 2015 PIF0615 BBS7017 1970 2017 -112647 -184019 -59362 -135304 -92571.9Swallow-tailed Kite Elanoides forficatus775 Eastern ForestWidespread NeotropicalAccipitridaelandbird M other native 7500 3750 11250 2015 2017 ACAD BBS7017 1970 2017 -7282.7 -11486.9 -3572.39 -8612.62 -5956.78Swamp Sparrow Melospiza georgiana1854 Wetland Temperate North AmericaPasserellidaelandbird M other native 23261464 20193095 26315495 2006 2015 PIF0615 BBS7017 1970 2017 -1E+07 -1.4E+07 -6799244 -1.2E+07 -9009436Tennessee Warbler Oreothlypis peregrina1959 Boreal ForestWidespread NeotropicalParulidae landbird M other native 1.11E+08 80906890 1.49E+08 2006 2015 PIF0615 BBS7017 1970 2017 78836370 41615592 1.22E+08 65547365 93499168Thick-billed Murre Uria lomvia 544 Coasts Marine Alcidae waterbird M other native 8000000 4000000 12000000 1997 1999 BNA2000 CBC7017 1970 2017 7659125 1134189 17289832 5397067 10382089Townsend's SolitaireMyadestes townsendi1560 Western ForestTemperate North AmericaTurdidae landbird M other native 1050595 834475 1298011 2006 2015 PIF0615 BBS7017 1970 2017 -160780 -330078 -26726.1 -215607 -110946Townsend's WarblerSetophaga townsendi2009 Western ForestMexico-Central AmericaParulidae landbird M other native 21262275 16792636 26233697 2006 2015 PIF0615 BBS7017 1970 2017 8275273 3515713 13077119 6709572 9889692Tree Swallow Tachycineta bicolor1420 Habitat GeneralistWidespreadHirundinidaelandbird M AI native 18581775 16732180 20563777 2006 2015 PIF0615 BBS7017 1970 2017 12732185 10394535 15211118 11947497 13571232Tricolored BlackbirdAgelaius tricolor 1928 Wetland Temperate North AmericaIcteridae landbird M other native 394858 296144 493573 2007 2009 ACAD BBS7017 1970 2017 34673.92 -566433 314292.4 -103217 137561.6Tricolored Heron Egretta tricolor 746 Wetland WidespreadArdeidae waterbird M other native 57579 34376 88724 2006 2015 PIF0615 BBS7017 1970 2017 11966.02 -1594.2 27353.02 7253.648 16856.08Trumpeter Swan Cygnus buccinator 26 Wetland Temperate North AmericaAnatidae waterfowl M other native 63016 56714 69318 2014 2016 NATSS15 NATS6815 1970 2015 -55452.6 -86169.9 -35157.5 -64440.9 -47470Tufted Titmouse Baeolophus bicolor1445 Eastern ForestTemperate North AmericaParidae landbird R other native 11970837 10921948 13128862 2006 2015 PIF0615 BBS7017 1970 2017 -4964573 -6276239 -3808195 -5403184 -4555522Tundra Swan Cygnus columbianus27 Arctic TundraTemperate North AmericaAnatidae waterfowl M other native 183000 129200 236900 2013 2017 FWS1317 CBC7017 1970 2017 -7037.89 -124840 77042.73 -40764.8 22247.23Turkey Vulture Cathartes aura 766 Habitat GeneralistWidespreadCathartidaelandbird M other native 8418387 7705474 9163886 2006 2015 PIF0615 BBS7017 1970 2017 -7063505 -8098500 -6085736 -7422215 -6721785Upland Sandpiper Bartramia longicauda469 Grassland South AmericaScolopacidaeshorebird M other native 750000 500000 1125000 2011 2013 Shoreb12 BBS7017 1970 2017 -155246 -284443 -65306.6 -196445 -119942Varied Bunting Passerina versicolor2063 Aridlands Mexico-Central AmericaCardinalidaelandbird M other native 69313 27061 135722 2006 2015 PIF0615 BBS9317 1993 2017 -23240 -77309.2 -87.1145 -37523.6 -12813.4Varied Thrush Ixoreus naevius 1609 Western ForestTemperate North AmericaTurdidae landbird M other native 34514221 26180031 44500981 2006 2015 PIF0615 BBS7017 1970 2017 52090538 37456216 67858346 46836755 57404178Vaux's Swift Chaetura vauxi 261 Western ForestMexico-Central AmericaApodidae landbird M AI native 418576 284294 607235 2006 2015 PIF0615 BBS7017 1970 2017 253429 137094.1 399483.1 210648.5 301133.1Veery Catharus fuscescens1580 Forest GeneralistSouth AmericaTurdidae landbird M other native 11186101 9451271 13166545 2006 2015 PIF0615 BBS7017 1970 2017 6970872 5334514 8781439 6398073 7560335Verdin Auriparus flaviceps1447 Aridlands Southwestern AridlandsRemizidae landbird R other native 3810209 2615935 5392903 2006 2015 PIF0615 BBS7017 1970 2017 2577465 1406286 4010112 2150899 3039045Vermilion FlycatcherPyrocephalus rubinus1320 Aridlands Mexico-Central AmericaTyrannidae landbird M other native 538032 324197 798482 2006 2015 PIF0615 BBS7017 1970 2017 -242817 -454180 -106091 -306005 -188311Vesper Sparrow Pooecetes gramineus1835 Grassland Southwestern AridlandsPasserellidaelandbird M other native 35053955 30378748 40800937 2006 2015 PIF0615 BBS7017 1970 2017 17080117 12836817 21808631 15583249 18631978Violet-green SwallowTachycineta thalassina1423 Western ForestMexico-Central AmericaHirundinidaelandbird M AI native 6724535 5560970 8017545 2006 2015 PIF0615 BBS7017 1970 2017 2631578 1644027 3714568 2290794 2998080Virginia's Warbler Oreothlypis virginiae1964 Western ForestMexico-Central AmericaParulidae landbird M other native 904013 567681 1360062 2006 2015 PIF0615 BBS7017 1970 2017 1216334 643208.9 1886995 1004733 1433329Virginia Rail Rallus limicola 413 Wetland Temperate North AmericaRallidae waterbird M other native 232547 160326 321031 2006 2015 PIF0615 BBS7017 1970 2017 -125520 -212324 -64428.4 -151928 -101401Wandering Tattler Tringa incana 523 Arctic TundraCoastal Scolopacidaeshorebird M other native 17500 10000 25000 2011 2013 Shoreb12 CBC7017 1970 2017 92835.54 51361.36 144484.1 77898.28 109097.8Warbling Vireo Vireo gilvus 1358 Forest GeneralistMexico-Central AmericaVireonidae landbird M other native 52333042 46022570 58752802 2006 2015 PIF0615 BBS7017 1970 2017 -1.9E+07 -2.4E+07 -1.4E+07 -2.1E+07 -1.7E+07Western Bluebird Sialia mexicana 1558 Western ForestTemperate North AmericaTurdidae landbird M other native 5661189 4392144 7058744 2006 2015 PIF0615 BBS7017 1970 2017 -1879407 -3002560 -1049029 -2226141 -1562686Western Grebe Aechmophorus occidentalis146 Wetland Temperate North AmericaPodicipedidaewaterbird M other native 989858 425689 1889334 2006 2015 PIF0615 CBC7017 1970 2017 1980131 522348.4 3602622 1468003 2498605Western Gull Larus occidentalis 583 Coasts Coastal Laridae waterbird M other native 44003 11262 90819 2006 2015 PIF0615 BBS7017 1970 2017 23789.38 -22868.8 77000.51 9680.538 40009.37Western Kingbird Tyrannus verticalis1277 Grassland Mexico-Central AmericaTyrannidae landbird M AI native 28830127 24939575 33543450 2006 2015 PIF0615 BBS7017 1970 2017 -812844 -3997120 1979095 -1866827 186957.4Western MeadowlarkSturnella neglecta1889 Grassland Southwestern AridlandsIcteridae landbird M other native 95124368 83326234 1.07E+08 2006 2015 PIF0615 BBS7017 1970 2017 65058633 52952201 78157580 60737088 69506571Western Sandpiper Calidris mauri 507 Arctic TundraWidespreadScolopacidaeshorebird M other native 3500000 2333333 5250000 2011 2013 Shoreb12 CBC7017 1970 2017 342805.2 -1502034 1720787 -164838 799659.4Western Screech-OwlMegascops kennicottii832 Western ForestTemperate North AmericaStrigidae landbird R other native 240461 121691 401313 2006 2015 PIF0615 BBS7017 1970 2017 129693.9 42585.88 245805.5 95237.63 166223.4Western Tanager Piranga ludoviciana2035 Western ForestMexico-Central AmericaCardinalidaelandbird M other native 15020244 12899162 17361777 2006 2015 PIF0615 BBS7017 1970 2017 -6266666 -8347561 -4541531 -6974160 -5622433Western Wood-PeweeContopus sordidulus1295 Western ForestSouth AmericaTyrannidae landbird M AI native 8845348 7660907 10112663 2006 2015 PIF0615 BBS7017 1970 2017 8929257 7026400 10979669 8268680 9623264Whimbrel Numenius phaeopus471 Arctic TundraCoastal Scolopacidaeshorebird M other native 80000 53333 120000 2011 2013 Shoreb12 Mig7416 1974 2016 89253.9 35075.98 162338.6 69327.17 111649.6White-breasted NuthatchSitta carolinensis1450 Forest GeneralistTemperate North AmericaSittidae landbird R other native 10035072 9249484 10873200 2006 2015 PIF0615 BBS7017 1970 2017 -6484091 -7543641 -5519823 -6829647 -6151025White-crowned SparrowZonotrichia leucophrys1858 Habitat GeneralistTemperate North AmericaPasserellidaelandbird M other native 79258794 63587655 97291972 2006 2015 PIF0615 BBS7017 1970 2017 9065231 -7840055 24340230 3645958 14271568White-eyed Vireo Vireo griseus 1340 Eastern ForestMexico-Central AmericaVireonidae landbird M other native 22090753 20223913 24179468 2006 2015 PIF0615 BBS7017 1970 2017 -7065591 -8978314 -5239991 -7727956 -6425969White-faced Ibis Plegadis chihi 760 Wetland WidespreadThreskiornithidaewaterbird M other native 1332908 700651 2146390 2006 2015 PIF0615 BBS7017 1970 2017 -1266738 -4226088 -187354 -1971669 -754582White-headed WoodpeckerDryobates albolarvatus966 Western ForestTemperate North AmericaPicidae landbird R other native 243113 168463 340504 2006 2015 PIF0615 BBS7017 1970 2017 -86051.6 -151841 -39968.4 -105659 -67784.4White-rumped SandpiperCalidris fuscicollis 503 Arctic TundraSouth AmericaScolopacidaeshorebird M other native 1694000 560100 3827900 2011 2013 Shoreb12 Mig7416 1974 2016 -400222 -2180658 223590.8 -816447 -122982White-tailed Kite Elanus leucurus 772 Habitat GeneralistWidespreadAccipitridaelandbird R other native 15718 8293 26310 2006 2015 PIF0615 BBS7017 1970 2017 12125.57 4778.759 20864.42 9470.142 14941.45White-throated SparrowZonotrichia albicollis1856 Boreal ForestTemperate North AmericaPasserellidaelandbird M other native 1.63E+08 1.39E+08 1.89E+08 2006 2015 PIF0615 BBS7017 1970 2017 93507759 71792609 1.18E+08 85735347 1.02E+08White-throated SwiftAeronautes saxatalis274 Aridlands Southwestern AridlandsApodidae landbird M AI native 2382771 1600983 3298803 2006 2015 PIF0615 BBS7017 1970 2017 482917 -167050 1129058 277767.2 693358.5White-winged CrossbillLoxia leucoptera 1760 Boreal ForestTemperate North AmericaFringillidae landbird M other native 39691698 30030233 51497702 2006 2015 PIF0615 BBS7017 1970 2017 -3E+07 -6.8E+07 -1.1E+07 -4.1E+07 -2.2E+07White-winged DoveZenaida asiatica 195 Aridlands Southwestern AridlandsColumbidaelandbird M other native 5159586 3579714 7462483 2006 2015 PIF0615 BBS7017 1970 2017 -2448746 -4592524 -1053151 -3109395 -1888045

White-winged ScoterMelanitta fusca 68 Wetland Marine Anatidae waterfowl M other native 400000 200000 600000 2004 2006 SeDu07 CBC7017 1970 2017 41189.93 -350756 288668.4 -56350.2 121532.4White Ibis Eudocimus albus 757 Wetland WidespreadThreskiornithidaewaterbird M other native 1170987 807222 1696093 2006 2015 PIF0615 BBS7017 1970 2017 -1394174 -2587259 -682714 -1723512 -1106709Wild Turkey Meleagris gallopavo137 Forest GeneralistTemperate North AmericaPhasianidaelandbird R other native 6750000 6075000 7425000 2008 2010 BNA2014 BBS7017 1970 2017 -1.1E+07 -1.5E+07 -8873202 -1.2E+07 -1E+07Willet Tringa semipalmata525 Wetland Coastal Scolopacidaeshorebird M other native 250000 100000 625000 2011 2013 Shoreb12 BBS7017 1970 2017 66334.26 0.361178 166538.2 39646.7 96933.03Williamson's SapsuckerSphyrapicus thyroideus953 Western ForestTemperate North AmericaPicidae landbird M other native 294829 209789 398019 2006 2015 PIF0615 BBS7017 1970 2017 -32100.3 -109782 23124.9 -55295.1 -11888.6Willow Flycatcher Empidonax traillii1305 Eastern ForestWidespread NeotropicalTyrannidae landbird M other native 8095093 6902363 9486416 2006 2015 PIF0615 BBS7017 1970 2017 2940723 1949424 4016124 2588135 3308646Willow Ptarmigan Lagopus lagopus 129 Arctic TundraTemperate North AmericaPhasianidaelandbird M other native 12784429 7232901 21298386 2006 2015 PIF0615 BBS9317 1993 2017 -306805 -1.9E+07 8120169 -4398420 2794435Wilson's Phalarope Phalaropus tricolor532 Wetland South AmericaScolopacidaeshorebird M other native 1500000 600000 3750000 2011 2013 Shoreb12 BBS7017 1970 2017 65525.64 -346015 559622.5 -20112.5 198928.8Wilson's Plover Charadrius wilsonia458 Coasts Coastal Charadriidaeshorebird M other native 8600 5733 12900 2011 2013 Shoreb12 CBC7017 1970 2017 7902.019 -454.683 16313.62 5246.921 10574.41Wilson's Snipe Gallinago delicata 516 Wetland WidespreadScolopacidaeshorebird M other native 2000000 800000 5000000 2011 2013 Shoreb12 BBS7017 1970 2017 -356660 -1014232 -0.24069 -545459 -197857Wilson's Warbler Cardellina pusilla2023 Forest GeneralistMexico-Central AmericaParulidae landbird M other native 81271984 65743361 98288305 2006 2015 PIF0615 BBS7017 1970 2017 81257567 61964991 1.02E+08 74336542 88378279Winter Wren Troglodytes hiemalis1467 Boreal ForestTemperate North AmericaTroglodytidaelandbird M other native 11140437 9052643 13798379 2006 2015 PIF0615 BBS7017 1970 2017 -2182791 -5115623 23901.2 -3121130 -1350791Wood Duck Aix sponsa 35 Wetland Temperate North AmericaAnatidae waterfowl M other native 2148806 1930697 2371212 2006 2015 PIF0615 BBS7017 1970 2017 -1382266 -1651781 -1141445 -1472195 -1297891Wood Stork Mycteria americana706 Wetland Widespread NeotropicalCiconiidae waterbird M other native 15700 12560 18840 1994 1996 BNA1999 BBS7017 1970 2017 -9686.47 -23040.5 -1877.7 -13538.1 -6586.39Wood Thrush Hylocichla mustelina1585 Eastern ForestMexico-Central AmericaTurdidae landbird M other native 12191387 10959424 13589692 2006 2015 PIF0615 BBS7017 1970 2017 15227071 13130268 17436955 14500401 15967893Woodhouse's Scrub-JayAphelocoma woodhouseii1386 Western ForestTemperate North AmericaCorvidae landbird R other native 692935 476075 1023759 2006 2015 PIF0615 BBS7017 1970 2017 71987.24 -8413.72 167626.1 44321.77 101466.8Worm-eating WarblerHelmitheros vermivorum1948 Eastern ForestCaribbean Parulidae landbird M other native 784060 608710 988276 2006 2015 PIF0615 BBS7017 1970 2017 -145853 -276841 -41141.2 -188245 -108293Wrentit Chamaea fasciata1530 Aridlands Temperate North AmericaSylviidae landbird R other native 1753863 1095353 2807164 2006 2015 PIF0615 BBS7017 1970 2017 612755.7 257008.7 1078014 475683.6 758666.6Yellow-bellied FlycatcherEmpidonax flaviventris1302 Boreal ForestMexico-Central AmericaTyrannidae landbird M other native 13047639 10169586 16383394 2006 2015 PIF0615 BBS7017 1970 2017 -1.1E+07 -1.7E+07 -6379784 -1.3E+07 -9032267Yellow-bellied SapsuckerSphyrapicus varius954 Eastern ForestWidespreadPicidae landbird M other native 13523418 11628336 15891341 2006 2015 PIF0615 BBS7017 1970 2017 -6852842 -9680783 -4632455 -7769014 -6048174Yellow-billed CuckooCoccyzus americanus205 Eastern ForestSouth AmericaCuculidae landbird M other native 8358126 7571171 9214892 2006 2015 PIF0615 BBS7017 1970 2017 7765674 6309631 9265539 7259180 8257018Yellow-billed Loon Gavia adamsii 630 Arctic TundraMarine Gaviidae waterbird M other native 12000 8000 16000 2013 2017 FWS2014 CBC7017 1970 2017 37697.22 21594.63 59920.24 31547.6 44723.16Yellow-billed MagpiePica nuttalli 1392 Western ForestTemperate North AmericaCorvidae landbird R other native 396399 319891 491206 2007 2009 BNA2009 BBS7017 1970 2017 686814.7 501752 903559.9 619190.7 756379.6Yellow-breasted ChatIcteria virens 1885 Eastern ForestMexico-Central AmericaIcteriidae landbird M other native 15066335 13315869 16929873 2006 2015 PIF0615 BBS7017 1970 2017 3913521 2390558 5420511 3402197 4429401Yellow-crowned Night-HeronNyctanassa violacea755 Coasts WidespreadArdeidae waterbird M other native 129442 72714 233481 2006 2015 PIF0615 BBS7017 1970 2017 23953.77 -5471.65 63560.05 13397.82 36092.5Yellow-headed BlackbirdXanthocephalus xanthocephalus1886 Wetland Temperate North AmericaIcteridae landbird M other native 11338466 8566820 14826716 2006 2015 PIF0615 BBS7017 1970 2017 976561 -1180430 2942683 292291.1 1642615Yellow-rumped WarblerSetophaga coronata1999 Forest GeneralistWidespreadParulidae landbird M other native 1.74E+08 1.56E+08 1.91E+08 2006 2015 PIF0615 BBS7017 1970 2017 7197191 -1.1E+07 24453427 927860.6 13250777Yellow-throated VireoVireo flavifrons 1352 Eastern ForestMexico-Central AmericaVireonidae landbird M other native 4705278 4250092 5161482 2006 2015 PIF0615 BBS7017 1970 2017 -2146791 -2589822 -1745190 -2293583 -2002721Yellow-throated WarblerSetophaga dominica2000 Eastern ForestCaribbean Parulidae landbird M other native 2039116 1732805 2359505 2006 2015 PIF0615 BBS7017 1970 2017 -768608 -1121737 -462950 -880751 -658077Yellow Warbler Setophaga petechia1992 Forest GeneralistWidespread NeotropicalParulidae landbird M other native 92640979 83231903 1.03E+08 2006 2015 PIF0615 BBS7017 1970 2017 30516333 22777261 38840680 27767231 33373984

Column Name Meaning
species
English Name, according to 59th supplement of AOS checklist - this spreadsheet contains species that occur regularly in the
USA and/or Canada, AND that have population estimates and trends
sci_name Scientific Name, from AOS 59th supplement
sort taxonomic sort order, based on AOS 59th supplement, for each species
Breeding.Biome Breeding biome categories assigned to each species, used to summarize loss results across species groups
Winter.Biome Non-breeding Region categories assigned to each species, used to summarize loss results across species groups
Family Taxonomic Family, as assigned in the 59th supplement of the AOS checklist
bird.group assignment to 1 of 4 bird groups: landbird, shorebird, waterbird, waterfowl
Migrate
Migration category, assigned to each species: "R" - year-round resident; "M" - migrant: includes partial migrants
(substantial overlap of breeding and winter ranges, but some parts of range occupied only seasonally) and full migrants
(little or no overlap of breeding and winter ranges)
AI identifies species in the "Aerial Insectivore" group, birds that capture flying insects while in flight
native identifies native and introduced species across U.S./Canada (from AOS 59th supplement)
popest Estimated North American population during range of years between first_year_popest and last_year_popest
popestlciLower bound estimated North American population during range of years between first_year_popest and last_year_popest
popestuciUpper bound estimated North American population during range of years between first_year_popest and last_year_popest
first_year_popest
beginning of the time-period to which the estimated population applies. Note for species where this first_year - last_year
spans 3 years, the published estimate was reported to apply to the single year in the middle of the range, but for analysis
purposes we averaged across a minimum of 3 years
last_year_popest
end of the time-period to which the estimated population applies. Note for species where this first_year - last_year spans 3
years, the published estimate was reported to apply to the single year in the middle of the range, but for analysis purposes
we averaged across a minimum of 3 years
Pop.source
Source of recent population size estimates and variances for North America, as follows:
ACAD - Avian Conservation Assessment Database
BNA - Birds of North American accounts, various years
CAFF18 - Conservation of Arctic Flora and Fauna 2018 report
FWS1317 - average of 2013 to 2017 estimates from the 2017 USFWS Waterfowl Status Report
FWS2014 - USFWS report on Yellow-billed Loon
NATSS15 - North American Trumpeter Swan Survey, 2015
PIF0615 - Partners in Flight (PIF) calculated estimate, based mainly on BBS data from the years 2006-2015, as described by
Stanton et al. 2019
SeDu07 - 2007 Seaduck Joint Venture Report
Shoreb12 - Shorebird Flyway Population Database
WPE5 - Waterbird Population Estimates Database
see Supplemental Methods text for details
Trajectory_data_source
source of population trajectory for individual species in this analysis, as follows:
BBS7017 - North American Breeding Bird Survey, 1970 to 2017
BBS9317 - North American Breeding Bird Survey, 1993 to 2017
CAFF - trends based on population change in CAFF 2018 report (Fox and Leafloor 2018); numbers after "CAFF" indicate start
year and end year of estimates for each species, from which trend was estimated
CBC7017 - Audubon Christmas Bird Count, 1970 to 2017
FWS7017 - US Fish & Wildlife Service waterfowl survey trends, 1970 to 2017
Mig7416 - Migration Monitoring of Shorebirds, 1974 to 2016
NATS6815 - Trumpeter Swan Survey trends, 1968-2015
SGS6817 - American Woodcock Singing Ground Survey trends, 1968 to 2017
see Supplemental Methods text for details
Trajectory_firstyearfirst year of available estimates for the population trajectory
Trajectory_lastyear first year of available estimates for the population trajectory
Loss_med
Estimated change in number of breeding individuals over the trend period (usually 1970-2017), based on a combination of
current population estimates and long-term trajectories. Median of the posterior distribution from the hierarchical
Bayesian model
Loss_lci
Lower bound (2.5 percentile of the posterior distribution) on the estimated change in number of breeding individuals over
the trend period (usually 1970-2017), based on a combination of current population estimates and long-term trajectories.
Median of the posterior distribution from the hierarchical Bayesian model
Loss_uci
Upper bound (97.5 percentile of the posterior distribution) on the estimated change in number of breeding individuals over
the trend period (usually 1970-2017), based on a combination of current population estimates and long-term trajectories.
Median of the posterior distribution from the hierarchical Bayesian model
Loss_lqrt
Lower quartile (25 percentile of the posterior distribution) on the estimated change in number of breeding individuals over
the trend period (usually 1970-2017), based on a combination of current population estimates and long-term trajectories.
Median of the posterior distribution from the hierarchical Bayesian model
Loss_uqrt
Upper quartile (75 percentile of the posterior distribution) on the estimated change in number of breeding individuals over
the trend period (usually 1970-2017), based on a combination of current population estimates and long-term trajectories.
Median of the posterior distribution from the hierarchical Bayesian model

see "Definitions" worksheet for meaning of column headersSpecies sci_name sort group PopUsCa PopLC95 PopUC95 TimeAdj.meanlog TimeAdj.sdlog Distance Adj. Pair Adj.
Abert's Towhee Melozone aberti 1817 landbird 890,243 429,538 1,469,410 0.926068294 0.03279521 125 2Acadian Flycatcher Empidonax virescens 1303 landbird 5,227,271 4,728,009 5,829,898 0.219216886 0.007581933 125 2Acorn Woodpecker Melanerpes formicivorus 939 landbird 2,226,303 1,452,256 3,390,813 0.261513967 0.032915038 200 1.75Alder Flycatcher Empidonax alnorum 1304 landbird 117,998,630 99,384,651 141,184,247 0.279321986 0.014289896 125 2Allen's Hummingbird Selasphorus sasin 342 landbird 1,484,682 348,049 4,475,111 0.291735312 0.022923659 50 1.25American Crow Corvus brachyrhynchos 1395 landbird 28,047,630 26,447,403 29,639,378 0.509424135 0.035825627 400 1.75American Dipper Cinclus mexicanus 1514 landbird 151,919 114,060 200,186 0.120627704 0.002232302 125 1.75American Goldfinch Spinus tristis 1771 landbird 44,092,850 41,554,624 46,767,583 0.311311237 0.018869851 125 1.25American Kestrel Falco sparverius 998 landbird 2,827,776 2,564,206 3,116,508 0.290453514 0.006693885 200 1.25American Pipit Anthus rubescens 1678 landbird 18,034,890 17,874,051 18,354,686 0.331264898 0.018339887 200 2American Redstart Setophaga ruticilla 1983 landbird 42,464,674 37,027,311 48,475,245 0.081164913 0.00961596 100 2American Robin Turdus migratorius 1603 landbird 366,076,928 337,429,985 392,723,825 0.816820459 0.040591642 200 2American Three-toed Woodpecker Picoides dorsalis 958 landbird 1,564,320 1,108,671 2,160,148 0.231914705 0.005639455 125 1.5American Tree Sparrow Spizelloides arborea 1828 landbird 26,412,817 19,492,087 36,200,474 0.48677923 0.263794299 200 2Anna's Hummingbird Calypte anna 336 landbird 8,772,569 4,880,026 16,549,527 0.188295714 0.007918482 50 2Arctic Warbler Phylloscopus borealis 1526 landbird 8,201,201 2,638,973 16,439,186 0.336241881 0.212251379 125 2Ash-throated Flycatcher Myiarchus cinerascens 1247 landbird 6,847,348 5,661,743 8,193,398 0.285893654 0.012720806 200 1.5Bachman's Sparrow Peucaea aestivalis 1825 landbird 167,964 102,917 256,160 0.353020961 0.010014486 200 2Baird's Sparrow Centronyx bairdii 1844 landbird 3,440,174 2,322,349 4,825,893 0.347885573 0.018872062 125 2Baltimore Oriole Icterus galbula 1922 landbird 11,806,532 10,808,329 12,963,225 0.141448158 0.008339067 125 1.75Band-tailed Pigeon Patagioenas fasciata 156 landbird 1,455,144 1,049,053 1,990,079 0.445606274 0.021296333 200 1.75Bank Swallow Riparia riparia 1430 landbird 7,940,368 6,125,188 10,752,527 0.642518351 0.054160354 200 1Barn Owl Tyto alba 828 landbird 130,751 81,975 193,386 1.639980926 0.005870793 200 2Barn Swallow Hirundo rustica 1433 landbird 46,855,476 43,409,178 50,012,099 0.288208703 0.028063207 200 1.5Barred Owl Strix varia 860 landbird 3,458,782 3,024,086 3,952,819 2.246063781 0.003138642 200 2Bay-breasted Warbler Setophaga castanea 1990 landbird 9,892,605 6,894,711 13,872,180 0.153659869 0.007650575 80 2Bell's Sparrow Artemisiospiza belli 1840 landbird 214,853 89,930 390,058 0.356608677 0.06387064 200 2Bell's Vireo Vireo bellii 1349 landbird 4,599,734 3,593,221 5,764,813 0.180378292 0.007557468 125 2Belted Kingfisher Megaceryle alcyon 907 landbird 1,843,798 1,568,548 2,159,306 0.290382383 0.001070783 200 2Bendire's Thrasher Toxostoma bendirei 1625 landbird 56,338 30,887 93,302 0.151208587 0.03780064 200 2Bewick's Wren Thryomanes bewickii 1472 landbird 4,567,446 3,627,322 5,765,670 0.263952086 0.012017096 200 1.75Black Phoebe Sayornis nigricans 1317 landbird 1,170,291 816,450 1,641,836 0.490597113 0.0123837 125 1.5Black Swift Cypseloides niger 253 landbird 88,506 34,390 198,559 0.419278592 0.342734085 200 1.25Black Vulture Coragyps atratus 765 landbird 1,864,137 1,555,779 2,249,923 1.046186196 0.034351103 400 1.5Black-and-white Warbler Mniotilta varia 1954 landbird 17,709,569 15,812,133 19,681,290 0.152823762 0.008002952 100 2Black-backed Woodpecker Picoides arcticus 959 landbird 1,734,181 1,251,409 2,296,411 0.427240724 0.004502838 125 1.5Black-billed Cuckoo Coccyzus erythropthalmus 209 landbird 875,781 735,134 1,051,851 0.283172906 0.005624163 200 2Black-billed Magpie Pica hudsonia 1391 landbird 6,023,555 5,190,448 7,003,608 0.235896152 0.020103119 300 1.75Black-capped Chickadee Poecile atricapillus 1436 landbird 43,031,705 39,633,241 46,269,089 0.378610362 0.015744777 125 2Black-chinned Hummingbird Archilochus alexandri 333 landbird 8,179,118 5,809,219 10,961,926 0.261764193 0.005802987 50 1.5Black-chinned Sparrow Spizella atrogularis 1834 landbird 293,554 150,962 524,619 0.48677923 0.263794299 200 1.75Black-crested Titmouse Baeolophus atricristatus 1446 landbird 642,491 414,558 1,018,349 0.167287607 0.015324212 200 1.25Black-headed Grosbeak Pheucticus melanocephalus 2052 landbird 12,185,173 10,701,801 13,695,616 0.35677819 0.014358481 125 2Black-tailed Gnatcatcher Polioptila melanura 1509 landbird 6,527,338 4,101,720 10,094,127 0.507418109 0.013481356 80 1.75Black-throated Blue Warbler Setophaga caerulescens 1995 landbird 2,415,903 2,069,260 2,822,969 0.123733234 0.007484617 125 2Black-throated Gray Warbler Setophaga nigrescens 2008 landbird 3,130,246 2,558,225 3,733,825 0.234857209 0.011166783 125 2Black-throated Green Warbler Setophaga virens 2012 landbird 9,177,716 7,924,382 10,581,319 0.123030348 0.008231303 125 2Black-throated Sparrow Amphispiza bilineata 1838 landbird 31,040,032 26,228,164 36,813,986 0.536376292 0.030266055 125 2Black-whiskered Vireo Vireo altiloquus 1362 landbird 84,242 1,998 207,072 0.252790135 0.052592429 125 2Blackburnian Warbler Setophaga fusca 1991 landbird 13,271,149 10,865,077 16,109,037 0.191437754 0.009454552 80 2Blackpoll Warbler Setophaga striata 1994 landbird 59,716,232 45,066,327 76,124,820 0.036936066 0.007389098 80 2Blue Grosbeak Passerina caerulea 2058 landbird 20,938,581 19,404,702 22,644,996 0.425252098 0.010625576 125 2Blue Jay Cyanocitta cristata 1382 landbird 17,238,587 15,864,197 18,715,069 0.196211491 0.011653135 200 1.25Blue-gray Gnatcatcher Polioptila caerulea 1506 landbird 229,194,394 195,048,713 266,969,269 0.507549726 0.013481573 50 1.75Blue-headed Vireo Vireo solitarius 1355 landbird 12,765,014 11,050,138 14,721,085 0.191732584 0.009143537 125 2Blue-winged Warbler Vermivora cyanoptera 1953 landbird 684,415 578,230 803,348 0.245414125 0.00681225 125 2Boat-tailed Grackle Quiscalus major 1940 landbird 2,156,489 1,297,665 3,550,285 0.627797265 0.044839671 200 1.25Bobolink Dolichonyx oryzivorus 1887 landbird 10,195,298 8,796,086 11,917,384 0.240408992 0.018723365 200 1.75Bohemian Waxwing Bombycilla garrulus 1637 landbird 2,507,863 1,641,840 3,491,482 0.251637205 0.021000969 125 1.75Boreal Chickadee Poecile hudsonicus 1440 landbird 13,208,240 10,477,170 16,444,759 0.123606521 0.006154629 80 1.25Brewer's Blackbird Euphagus cyanocephalus 1938 landbird 23,324,285 20,136,678 27,110,785 0.285067694 0.042310849 200 1.25Brewer's Sparrow Spizella breweri 1831 landbird 16,834,981 13,155,782 21,238,196 0.554371096 0.03152307 200 2Bridled Titmouse Baeolophus wollweberi 1442 landbird 69,340 22,843 147,260 0.167287607 0.015324212 200 1.75Broad-tailed Hummingbird Selasphorus platycercus 340 landbird 8,804,795 5,880,867 12,313,443 0.270066821 0.013827063 80 1.75Broad-winged Hawk Buteo platypterus 820 landbird 1,804,126 1,598,612 2,029,385 0.923824468 0.001843574 125 2Bronzed Cowbird Molothrus aeneus 1932 landbird 816,191 439,751 1,339,476 0.196381735 0.015392618 125 1.25Brown Creeper Certhia americana 1453 landbird 9,484,338 7,757,209 11,639,138 0.327781306 0.007039325 80 2Brown Thrasher Toxostoma rufum 1622 landbird 6,168,180 5,625,720 6,771,313 0.141308812 0.007605114 200 1.5Brown-crested Flycatcher Myiarchus tyrannulus 1250 landbird 1,032,206 639,470 1,584,755 0.236362278 0.026662982 200 2Brown-headed Cowbird Molothrus ater 1933 landbird 126,705,388 117,868,557 135,950,409 0.196359385 0.015316476 125 1.75Brown-headed Nuthatch Sitta pusilla 1452 landbird 1,578,602 1,352,620 1,826,550 0.193256417 0.011315643 125 1.5Bullock's Oriole Icterus bullockii 1916 landbird 6,949,229 6,086,900 7,839,504 0.171626668 0.013381537 125 1.75Burrowing Owl Athene cunicularia 856 landbird 987,921 625,174 1,537,376 0.248559878 0.013839293 200 1.75Bushtit Psaltriparus minimus 1448 landbird 2,310,447 1,807,618 2,949,870 0.180014259 0.016575529 125 1.5Cactus Wren Campylorhynchus brunneicapillus 1482 landbird 3,034,276 2,268,727 4,012,714 0.38994346 0.015947778 200 1.5California Quail Callipepla californica 104 landbird 3,358,401 2,374,290 4,473,991 0.386160727 0.019277203 200 1.5California Scrub-Jay Aphelocoma californica 1385 landbird 1,346,997 859,873 2,030,181 0.162746 0.013553 200 1.25California Thrasher Toxostoma redivivum 1627 landbird 155,226 77,498 274,331 0.151208587 0.03780064 200 1.75California Towhee Melozone crissalis 1816 landbird 5,247,688 3,750,592 7,222,092 0.953116186 0.024293546 125 2Calliope Hummingbird Selasphorus calliope 346 landbird 4,463,289 2,652,793 7,024,258 0.222786696 0.005361244 50 2Canada Jay Perisoreus canadensis 1364 landbird 26,652,111 23,501,504 30,178,807 0.206075389 0.008834811 125 1Canada Warbler Cardellina canadensis 2022 landbird 2,597,361 2,028,500 3,242,734 0.144498738 0.005886014 100 2Canyon Towhee Melozone fusca 1814 landbird 2,792,820 2,085,096 3,605,781 0.901022212 0.013820457 125 2Canyon Wren Catherpes mexicanus 1457 landbird 423,956 325,189 554,507 0.627107745 0.00823747 200 2Cape May Warbler Setophaga tigrina 1985 landbird 7,043,668 4,900,702 9,894,881 0.325792288 0.005702945 80 2
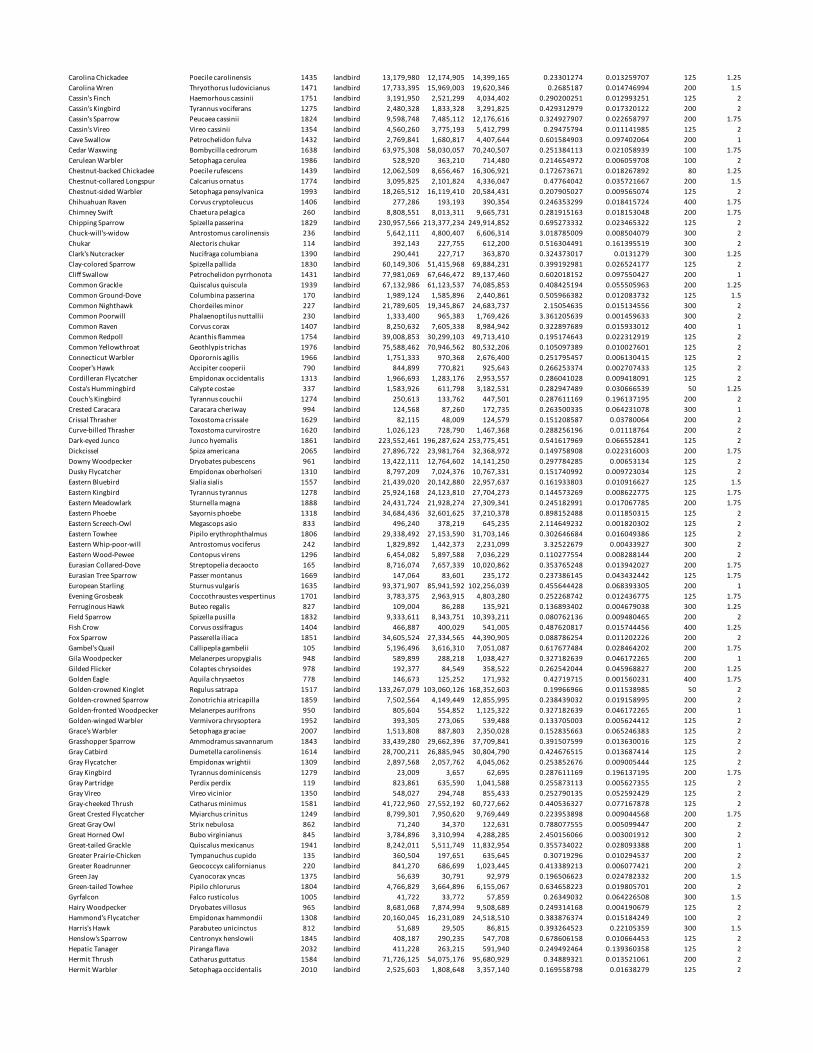
Carolina Chickadee Poecile carolinensis 1435 landbird 13,179,980 12,174,905 14,399,165 0.23301274 0.013259707 125 1.25Carolina Wren Thryothorus ludovicianus 1471 landbird 17,733,395 15,969,003 19,620,346 0.2685187 0.014746994 200 1.5Cassin's Finch Haemorhous cassinii 1751 landbird 3,191,950 2,521,299 4,034,402 0.290200251 0.012993251 125 2Cassin's Kingbird Tyrannus vociferans 1275 landbird 2,480,328 1,833,328 3,291,825 0.429312979 0.017320122 200 2Cassin's Sparrow Peucaea cassinii 1824 landbird 9,598,748 7,485,112 12,176,616 0.324927907 0.022658797 200 1.75Cassin's Vireo Vireo cassinii 1354 landbird 4,560,260 3,775,193 5,412,799 0.29475794 0.011141985 125 2Cave Swallow Petrochelidon fulva 1432 landbird 2,769,841 1,680,817 4,407,644 0.601584903 0.097402064 200 1Cedar Waxwing Bombycilla cedrorum 1638 landbird 63,975,308 58,030,057 70,240,507 0.251384113 0.021058939 100 1.75Cerulean Warbler Setophaga cerulea 1986 landbird 528,920 363,210 714,480 0.214654972 0.006059708 100 2Chestnut-backed Chickadee Poecile rufescens 1439 landbird 12,062,509 8,656,467 16,306,921 0.172673671 0.018267892 80 1.25Chestnut-collared Longspur Calcarius ornatus 1774 landbird 3,095,825 2,101,824 4,336,047 0.47764042 0.035721667 200 1.5Chestnut-sided Warbler Setophaga pensylvanica 1993 landbird 18,265,512 16,119,410 20,584,431 0.207905027 0.009565074 125 2Chihuahuan Raven Corvus cryptoleucus 1406 landbird 277,286 193,193 390,354 0.246353299 0.018415724 400 1.75Chimney Swift Chaetura pelagica 260 landbird 8,808,551 8,013,311 9,665,731 0.281915163 0.018153048 200 1.75Chipping Sparrow Spizella passerina 1829 landbird 230,957,566 213,377,234 249,914,852 0.695273332 0.023465322 125 2Chuck-will's-widow Antrostomus carolinensis 236 landbird 5,642,111 4,800,407 6,606,314 3.018785009 0.008504079 300 2Chukar Alectoris chukar 114 landbird 392,143 227,755 612,200 0.516304491 0.161395519 300 2Clark's Nutcracker Nucifraga columbiana 1390 landbird 290,441 227,717 363,870 0.324373017 0.0131279 300 1.25Clay-colored Sparrow Spizella pallida 1830 landbird 60,149,306 51,415,968 69,884,231 0.399192981 0.026524177 125 2Cliff Swallow Petrochelidon pyrrhonota 1431 landbird 77,981,069 67,646,472 89,137,460 0.602018152 0.097550427 200 1Common Grackle Quiscalus quiscula 1939 landbird 67,132,986 61,123,537 74,085,853 0.408425194 0.055505963 200 1.25Common Ground-Dove Columbina passerina 170 landbird 1,989,124 1,585,896 2,440,861 0.505966382 0.012083732 125 1.5Common Nighthawk Chordeiles minor 227 landbird 21,789,605 19,345,867 24,683,737 2.15054635 0.015134556 300 2Common Poorwill Phalaenoptilus nuttallii 230 landbird 1,333,400 965,383 1,769,426 3.361205639 0.001459633 300 2Common Raven Corvus corax 1407 landbird 8,250,632 7,605,338 8,984,942 0.322897689 0.015933012 400 1Common Redpoll Acanthis flammea 1754 landbird 39,008,853 30,299,103 49,713,410 0.195174643 0.022312919 125 2Common Yellowthroat Geothlypis trichas 1976 landbird 75,588,462 70,946,562 80,532,206 0.105097389 0.010027601 125 2Connecticut Warbler Oporornis agilis 1966 landbird 1,751,333 970,368 2,676,400 0.251795457 0.006130415 125 2Cooper's Hawk Accipiter cooperii 790 landbird 844,899 770,821 925,643 0.266253374 0.002707433 125 2Cordilleran Flycatcher Empidonax occidentalis 1313 landbird 1,966,693 1,283,176 2,953,557 0.286041028 0.009418091 125 2Costa's Hummingbird Calypte costae 337 landbird 1,583,926 611,798 3,182,531 0.282947489 0.030666539 50 1.25Couch's Kingbird Tyrannus couchii 1274 landbird 250,613 133,762 447,501 0.287611169 0.196137195 200 2Crested Caracara Caracara cheriway 994 landbird 124,568 87,260 172,735 0.263500335 0.064231078 300 1Crissal Thrasher Toxostoma crissale 1629 landbird 82,115 48,009 124,579 0.151208587 0.03780064 200 2Curve-billed Thrasher Toxostoma curvirostre 1620 landbird 1,026,123 728,790 1,467,368 0.288256196 0.01118764 200 2Dark-eyed Junco Junco hyemalis 1861 landbird 223,552,461 196,287,624 253,775,451 0.541617969 0.066552841 125 2Dickcissel Spiza americana 2065 landbird 27,896,722 23,981,764 32,368,972 0.149758908 0.022316003 200 1.75Downy Woodpecker Dryobates pubescens 961 landbird 13,422,111 12,764,602 14,141,250 0.297784285 0.00653134 125 2Dusky Flycatcher Empidonax oberholseri 1310 landbird 8,797,209 7,024,376 10,767,331 0.151740992 0.009723034 125 2Eastern Bluebird Sialia sialis 1557 landbird 21,439,020 20,142,880 22,957,637 0.161933803 0.010916627 125 1.5Eastern Kingbird Tyrannus tyrannus 1278 landbird 25,924,168 24,123,810 27,704,273 0.144573269 0.008622775 125 1.75Eastern Meadowlark Sturnella magna 1888 landbird 24,431,724 21,928,274 27,309,341 0.245182991 0.017067785 200 1.75Eastern Phoebe Sayornis phoebe 1318 landbird 34,684,436 32,601,625 37,210,378 0.898152488 0.011850315 125 2Eastern Screech-Owl Megascops asio 833 landbird 496,240 378,219 645,235 2.114649232 0.001820302 125 2Eastern Towhee Pipilo erythrophthalmus 1806 landbird 29,338,492 27,153,590 31,703,146 0.302646684 0.016049386 125 2Eastern Whip-poor-will Antrostomus vociferus 242 landbird 1,829,892 1,442,373 2,231,099 3.32522679 0.00433927 300 2Eastern Wood-Pewee Contopus virens 1296 landbird 6,454,082 5,897,588 7,036,229 0.110277554 0.008288144 200 2Eurasian Collared-Dove Streptopelia decaocto 165 landbird 8,716,074 7,657,339 10,020,862 0.353765248 0.013942027 200 1.75Eurasian Tree Sparrow Passer montanus 1669 landbird 147,064 83,601 235,172 0.237386145 0.043432442 125 1.75European Starling Sturnus vulgaris 1635 landbird 93,371,907 85,941,592 102,256,039 0.455644428 0.068393305 200 1Evening Grosbeak Coccothraustes vespertinus 1701 landbird 3,783,375 2,963,915 4,803,280 0.252268742 0.012436775 125 1.75Ferruginous Hawk Buteo regalis 827 landbird 109,004 86,288 135,921 0.136893402 0.004679038 300 1.25Field Sparrow Spizella pusilla 1832 landbird 9,333,611 8,343,751 10,393,211 0.080762136 0.009480465 200 2Fish Crow Corvus ossifragus 1404 landbird 466,887 400,029 541,005 0.487620817 0.015744456 400 1.25Fox Sparrow Passerella iliaca 1851 landbird 34,605,524 27,334,565 44,390,905 0.088786254 0.011202226 200 2Gambel's Quail Callipepla gambelii 105 landbird 5,196,496 3,616,310 7,051,087 0.617677484 0.028464202 200 1.75Gila Woodpecker Melanerpes uropygialis 948 landbird 589,899 288,218 1,038,427 0.327182639 0.046172265 200 1Gilded Flicker Colaptes chrysoides 978 landbird 192,377 84,549 358,522 0.262542044 0.045968827 200 1.25Golden Eagle Aquila chrysaetos 778 landbird 146,673 125,252 171,932 0.42719715 0.001560231 400 1.75Golden-crowned Kinglet Regulus satrapa 1517 landbird 133,267,079 103,060,126 168,352,603 0.19966966 0.011538985 50 2Golden-crowned Sparrow Zonotrichia atricapilla 1859 landbird 7,502,564 4,149,449 12,855,995 0.238439032 0.019158995 200 2Golden-fronted Woodpecker Melanerpes aurifrons 950 landbird 805,604 554,852 1,125,322 0.327182639 0.046172265 200 1Golden-winged Warbler Vermivora chrysoptera 1952 landbird 393,305 273,065 539,488 0.133705003 0.005624412 125 2Grace's Warbler Setophaga graciae 2007 landbird 1,513,808 887,803 2,350,028 0.152835663 0.065246383 125 2Grasshopper Sparrow Ammodramus savannarum 1843 landbird 33,439,280 29,662,396 37,709,841 0.391507599 0.013630016 125 2Gray Catbird Dumetella carolinensis 1614 landbird 28,700,211 26,885,945 30,804,790 0.424676515 0.013687414 125 2Gray Flycatcher Empidonax wrightii 1309 landbird 2,897,568 2,057,762 4,045,062 0.253852676 0.009005444 125 2Gray Kingbird Tyrannus dominicensis 1279 landbird 23,009 3,657 62,695 0.287611169 0.196137195 200 1.75Gray Partridge Perdix perdix 119 landbird 823,861 635,590 1,041,588 0.255873113 0.005627355 125 2Gray Vireo Vireo vicinior 1350 landbird 548,027 294,748 855,433 0.252790135 0.052592429 125 2Gray-cheeked Thrush Catharus minimus 1581 landbird 41,722,960 27,552,192 60,727,662 0.440536327 0.077167878 125 2Great Crested Flycatcher Myiarchus crinitus 1249 landbird 8,799,301 7,950,620 9,769,449 0.223953898 0.009044568 200 1.75Great Gray Owl Strix nebulosa 862 landbird 71,240 34,370 122,631 0.788077555 0.005099447 200 2Great Horned Owl Bubo virginianus 845 landbird 3,784,896 3,310,994 4,288,285 2.450156066 0.003001912 300 2Great-tailed Grackle Quiscalus mexicanus 1941 landbird 8,242,011 5,511,749 11,832,954 0.355734022 0.028093388 200 1Greater Prairie-Chicken Tympanuchus cupido 135 landbird 360,504 197,651 635,645 0.30719296 0.010294537 200 2Greater Roadrunner Geococcyx californianus 220 landbird 841,270 686,699 1,023,445 0.413389213 0.006077421 200 2Green Jay Cyanocorax yncas 1375 landbird 56,639 30,791 92,979 0.196506623 0.024782332 200 1.5Green-tailed Towhee Pipilo chlorurus 1804 landbird 4,766,829 3,664,896 6,155,067 0.634658223 0.019805701 200 2Gyrfalcon Falco rusticolus 1005 landbird 41,722 33,772 57,859 0.26349032 0.064226508 300 1.5Hairy Woodpecker Dryobates villosus 965 landbird 8,681,068 7,874,994 9,508,689 0.249314168 0.004190679 125 2Hammond's Flycatcher Empidonax hammondii 1308 landbird 20,160,045 16,231,089 24,518,510 0.383876374 0.015184249 100 2Harris's Hawk Parabuteo unicinctus 812 landbird 51,689 29,505 86,815 0.393264523 0.22105359 300 1.5Henslow's Sparrow Centronyx henslowii 1845 landbird 408,187 290,235 547,708 0.678606158 0.010664453 125 2Hepatic Tanager Piranga flava 2032 landbird 411,228 263,215 591,940 0.249492464 0.139360358 125 2Hermit Thrush Catharus guttatus 1584 landbird 71,726,125 54,075,176 95,680,929 0.34889321 0.013521061 200 2Hermit Warbler Setophaga occidentalis 2010 landbird 2,525,603 1,808,648 3,357,140 0.169558798 0.01638279 125 2

Hoary Redpoll Acanthis hornemanni 1756 landbird 12,815,104 12,474,111 13,252,214 0.195275926 0.022255784 125 2Hooded Oriole Icterus cucullatus 1910 landbird 350,616 236,805 494,427 0.134838091 0.034837138 125 1.75Hooded Warbler Setophaga citrina 1982 landbird 5,185,197 4,523,541 5,902,847 0.165781479 0.006677477 125 2Horned Lark Eremophila alpestris 1412 landbird 100,607,831 90,290,833 112,734,630 0.319579262 0.038106901 200 2House Finch Haemorhous mexicanus 1749 landbird 33,246,130 29,546,633 37,992,529 0.106257564 0.012699766 125 1.75House Sparrow Passer domesticus 1668 landbird 92,842,101 83,703,006 104,203,385 0.23727539 0.043700479 125 1House Wren Troglodytes aedon 1461 landbird 43,318,358 39,758,949 47,473,572 0.157442539 0.010356315 125 2Hutton's Vireo Vireo huttoni 1351 landbird 964,653 744,358 1,213,151 0.412118002 0.007851349 125 2Inca Dove Columbina inca 169 landbird 619,057 491,301 765,612 0.259561594 0.009810166 125 1.25Indigo Bunting Passerina cyanea 2060 landbird 77,494,167 73,235,841 82,041,052 0.334016374 0.015511967 125 2Juniper Titmouse Baeolophus ridgwayi 1444 landbird 291,637 201,086 392,881 0.161396989 0.009527298 200 1.25Kentucky Warbler Geothlypis formosa 1970 landbird 2,595,606 2,284,175 2,937,212 0.165429467 0.007695189 125 2Ladder-backed Woodpecker Dryobates scalaris 963 landbird 2,377,162 1,983,369 2,827,402 0.335269007 0.009487836 125 2Lapland Longspur Calcarius lapponicus 1773 landbird 68,032,536 60,265,772 80,590,222 0.479198426 0.03584308 200 1.75Lark Bunting Calamospiza melanocorys 1841 landbird 11,992,598 9,194,389 15,233,830 0.286366646 0.05170139 200 1Lark Sparrow Chondestes grammacus 1836 landbird 10,638,361 9,078,588 12,343,951 0.14314708 0.013175516 200 1.5Lawrence's Goldfinch Spinus lawrencei 1770 landbird 347,128 188,186 574,120 0.312388451 0.021341133 125 1.75Lazuli Bunting Passerina amoena 2059 landbird 6,453,834 5,417,754 7,643,998 0.253922015 0.011113142 125 2Least Flycatcher Empidonax minimus 1307 landbird 27,244,220 24,465,739 30,286,260 0.087097838 0.009253083 125 2LeConte's Sparrow Ammospiza leconteii 1846 landbird 5,128,134 4,121,245 6,262,076 0.705896323 0.014200509 125 2LeConte's Thrasher Toxostoma lecontei 1628 landbird 45,644 15,853 93,422 0.151208587 0.03780064 200 1.75Lesser Goldfinch Spinus psaltria 1769 landbird 5,723,877 4,542,330 7,132,984 0.300588294 0.01824926 125 1.75Lesser Nighthawk Chordeiles acutipennis 226 landbird 3,801,395 2,399,615 5,545,863 2.125465631 0.019269463 300 2Lewis's Woodpecker Melanerpes lewis 935 landbird 81,507 52,913 119,611 0.327182639 0.046172265 200 1.5Lincoln's Sparrow Melospiza lincolnii 1853 landbird 88,078,735 78,262,006 98,782,691 0.650857783 0.015359268 125 2Loggerhead Shrike Lanius ludovicianus 1325 landbird 4,557,457 4,080,246 5,094,115 0.257515395 0.008301429 125 1.25Long-billed Thrasher Toxostoma longirostre 1623 landbird 95,573 53,639 153,900 0.151208587 0.03780064 200 2Long-eared Owl Asio otus 863 landbird 37,707 15,671 68,758 0.950630863 0.005753235 125 2Louisiana Waterthrush Parkesia motacilla 1949 landbird 446,545 377,921 529,134 0.327908312 0.00514556 200 2Lucy's Warbler Oreothlypis luciae 1962 landbird 2,829,708 1,620,023 4,473,592 0.213627285 0.029472214 125 2MacGillivray's Warbler Geothlypis tolmiei 1968 landbird 11,191,876 9,091,713 13,546,236 0.154940761 0.008899679 125 2Magnolia Warbler Setophaga magnolia 1989 landbird 38,757,259 33,706,369 44,351,863 0.128230092 0.011292731 125 2Marsh Wren Cistothorus palustris 1470 landbird 10,846,904 8,009,975 14,414,465 0.865362685 0.017776852 125 2McCown's Longspur Rhynchophanes mccownii 1776 landbird 844,821 487,327 1,322,335 0.477568371 0.036353088 200 1.5Merlin Falco columbarius 1000 landbird 1,620,998 1,325,156 1,975,531 0.136416034 0.001135255 125 2Mexican Jay Aphelocoma wollweberi 1388 landbird 142,059 31,219 355,566 0.162911473 0.013297024 200 1.25Mississippi Kite Ictinia mississippiensis 798 landbird 695,177 537,854 881,937 1.03847348 0.012618132 300 1.75Monk Parakeet Myiopsitta monachus 1010 landbird 59,268 1,094 158,202 0.336241881 0.212251379 125 1.5Mountain Bluebird Sialia currucoides 1559 landbird 5,568,751 4,615,920 6,673,385 0.561682314 0.019043058 200 2Mountain Chickadee Poecile gambeli 1437 landbird 7,855,197 6,597,745 9,279,875 0.281720767 0.014457926 125 1.25Mountain Quail Oreortyx pictus 94 landbird 250,825 174,335 348,548 0.40626839 0.014460376 300 2Mourning Dove Zenaida macroura 198 landbird 133,072,464 123,233,806 143,006,188 0.316423592 0.022409558 200 1.75Mourning Warbler Geothlypis philadelphia 1969 landbird 13,827,473 11,375,932 16,818,340 0.259959923 0.011418499 125 2Nashville Warbler Oreothlypis ruficapilla 1963 landbird 39,717,135 34,046,329 46,021,851 0.213572778 0.014052851 125 2Nelson's Sparrow Ammospiza nelsoni 1848 landbird 1,012,433 860,211 1,182,894 0.571305714 0.009063602 125 2Northern Cardinal Cardinalis cardinalis 2047 landbird 118,228,958 107,977,674 129,207,132 0.866690425 0.028147857 200 2Northern Flicker Colaptes auratus 977 landbird 10,997,056 10,030,079 12,029,437 0.263105839 0.045989788 200 1.25Northern Goshawk Accipiter gentilis 793 landbird 205,103 144,935 279,609 0.350349154 0.002368837 125 2Northern Harrier Circus hudsonius 783 landbird 822,326 731,377 921,329 0.222768112 0.005077001 300 2Northern Mockingbird Mimus polyglottos 1634 landbird 33,748,673 30,589,410 37,047,818 0.099038838 0.013748544 200 1.5Northern Parula Setophaga americana 1987 landbird 18,173,930 16,508,547 19,946,040 0.165653455 0.008870983 100 2Northern Pygmy-Owl Glaucidium gnoma 848 landbird 129,397 77,555 214,434 1.056103865 0.003481108 200 2Northern Rough-winged Swallow Stelgidopteryx serripennis 1428 landbird 19,956,056 15,363,114 26,977,637 0.303402591 0.013563681 125 1.75Northern Waterthrush Parkesia noveboracensis 1950 landbird 17,166,584 14,259,921 20,524,318 0.108962749 0.006741665 200 2Northwestern Crow Corvus caurinus 1396 landbird 701,805 421,865 1,111,796 0.438962554 0.094806648 400 1.5Nuttall's Woodpecker Dryobates nuttallii 962 landbird 752,044 500,760 1,076,906 0.27959732 0.034920096 125 1.5Oak Titmouse Baeolophus inornatus 1443 landbird 706,717 407,725 1,196,605 0.203429085 0.015921436 200 1.25Olive Sparrow Arremonops rufivirgatus 1798 landbird 829,024 486,176 1,252,969 0.709359899 0.020977793 200 1.75Olive-sided Flycatcher Contopus cooperi 1291 landbird 1,916,763 1,576,589 2,322,865 0.109373062 0.006610393 300 2Orange-crowned Warbler Oreothlypis celata 1960 landbird 81,919,229 69,421,324 95,720,231 0.237215061 0.013613313 125 2Orchard Oriole Icterus spurius 1909 landbird 10,894,813 9,896,563 11,930,180 0.099898312 0.00769728 125 1.75Osprey Pandion haliaetus 770 landbird 399,228 328,092 483,403 0.49973566 0.00742224 300 1.25Ovenbird Seiurus aurocapilla 1947 landbird 26,312,390 22,777,813 30,231,156 0.214366322 0.014149396 200 2Pacific Wren Troglodytes pacificus 1466 landbird 7,528,567 5,392,359 10,095,516 0.513974173 0.013003866 200 1.75Pacific-slope Flycatcher Empidonax difficilis 1312 landbird 8,585,203 6,751,118 10,839,307 0.141806818 0.01059711 125 2Painted Bunting Passerina ciris 2064 landbird 12,778,114 10,848,520 14,991,104 0.219191714 0.013373231 125 1.75Palm Warbler Setophaga palmarum 1996 landbird 13,172,938 9,852,145 17,350,184 0.265520256 0.008448309 125 2Phainopepla Phainopepla nitens 1647 landbird 1,285,683 905,747 1,775,051 0.318642933 0.0145247 125 1.5Philadelphia Vireo Vireo philadelphicus 1357 landbird 3,968,582 3,039,944 5,019,728 0.179034235 0.008993391 125 2Pileated Woodpecker Dryocopus pileatus 983 landbird 2,648,713 2,398,947 2,931,122 0.531071086 0.007285076 300 2Pine Grosbeak Pinicola enucleator 1743 landbird 5,530,332 4,039,601 7,262,401 0.194545309 0.00688874 125 2Pine Siskin Spinus pinus 1763 landbird 44,719,558 37,972,998 52,314,211 0.320507011 0.025718467 100 1.5Pine Warbler Setophaga pinus 1998 landbird 13,108,682 11,923,661 14,327,429 0.092765876 0.010964286 125 2Pinyon Jay Gymnorhinus cyanocephalus 1380 landbird 755,415 525,819 1,068,774 0.276028144 0.039592912 300 1.25Plumbeous Vireo Vireo plumbeus 1356 landbird 2,999,048 2,194,985 3,986,302 0.328010835 0.012195375 125 2Prairie Falcon Falco mexicanus 1007 landbird 97,855 76,690 121,492 0.347099863 0.003094445 300 2Prairie Warbler Setophaga discolor 2003 landbird 3,555,356 3,156,416 4,009,433 0.199783094 0.00775599 125 2Prothonotary Warbler Protonotaria citrea 1955 landbird 2,069,931 1,633,108 2,645,686 0.170661673 0.007759922 125 2Purple Finch Haemorhous purpureus 1750 landbird 6,539,107 5,746,681 7,363,210 0.208481863 0.010983563 125 2Purple Martin Progne subis 1413 landbird 8,728,591 7,776,376 9,841,533 0.24446211 0.028144531 200 1.25Pygmy Nuthatch Sitta pygmaea 1451 landbird 3,103,791 2,051,268 4,410,534 0.462447564 0.023220006 125 1.75Pyrrhuloxia Cardinalis sinuatus 2048 landbird 1,578,426 1,076,870 2,208,564 0.172854465 0.013073557 200 1.75Red Crossbill Loxia curvirostra 1757 landbird 9,585,953 7,856,459 11,542,746 0.337778176 0.023354528 125 1.5Red-bellied Woodpecker Melanerpes carolinus 951 landbird 15,518,241 14,095,781 16,973,039 0.364972699 0.012239403 200 1.75Red-breasted Nuthatch Sitta canadensis 1449 landbird 19,689,413 17,772,520 21,658,078 0.218424232 0.008984852 125 1.75Red-breasted Sapsucker Sphyrapicus ruber 956 landbird 2,755,899 1,872,219 3,799,342 0.221030989 0.007558361 125 1.5Red-eyed Vireo Vireo olivaceus 1360 landbird 130,756,817 121,405,110 141,235,333 0.250511261 0.017879662 125 2

Red-faced Warbler Cardellina rubrifrons 2024 landbird 252,600 70,739 503,841 0.148410299 0.009848297 125 2Red-headed Woodpecker Melanerpes erythrocephalus 938 landbird 1,802,639 1,587,954 2,066,531 0.27695727 0.007585097 200 1.25Red-naped Sapsucker Sphyrapicus nuchalis 955 landbird 1,974,818 1,596,661 2,425,112 0.203846865 0.008044308 125 2Red-shouldered Hawk Buteo lineatus 818 landbird 1,827,010 1,607,481 2,085,341 0.310636921 0.00749664 200 2Red-tailed Hawk Buteo jamaicensis 825 landbird 2,808,115 2,579,824 3,052,334 0.437107989 0.008314715 300 1.25Red-winged Blackbird Agelaius phoeniceus 1926 landbird 172,973,570 154,908,749 196,698,929 0.294722634 0.048341194 200 1.25Ring-necked Pheasant Phasianus colchicus 123 landbird 16,642,331 14,252,196 19,372,599 0.748822706 0.0176056 300 2Rock Pigeon Columba livia 149 landbird 16,195,053 14,584,425 17,988,593 0.541589606 0.032519759 200 1Rock Wren Salpinctes obsoletus 1454 landbird 3,362,014 2,744,880 4,115,789 0.245743709 0.009882728 200 2Rose-breasted Grosbeak Pheucticus ludovicianus 2051 landbird 4,715,733 4,058,034 5,474,743 0.152079089 0.007135443 200 2Rough-legged Hawk Buteo lagopus 826 landbird 296,141 248,433 370,060 0.429513809 0.219098555 300 2Ruby-crowned Kinglet Regulus calendula 1518 landbird 99,900,936 90,024,695 110,791,661 0.135844836 0.011392073 125 2Ruby-throated Hummingbird Archilochus colubris 332 landbird 35,777,111 31,236,693 40,921,667 0.296114683 0.004821445 50 2Rufous Hummingbird Selasphorus rufus 341 landbird 21,694,644 13,724,171 32,781,297 0.310051644 0.008407568 50 1.5Rufous-crowned Sparrow Aimophila ruficeps 1808 landbird 601,135 407,380 851,057 0.35990617 0.014617059 200 2Rusty Blackbird Euphagus carolinus 1937 landbird 6,804,603 4,919,111 9,459,126 0.355534902 0.008725154 125 1.75Sage Thrasher Oreoscoptes montanus 1630 landbird 6,362,519 4,673,219 8,479,429 0.1967526 0.015607969 200 2Sagebrush Sparrow Artemisiospiza nevadensis 1839 landbird 5,386,123 3,477,545 8,199,885 0.358413472 0.061624713 200 2Savannah Sparrow Passerculus sandwichensis 1842 landbird 168,676,799 144,322,771 195,333,538 0.357062427 0.025102403 125 2Say's Phoebe Sayornis saya 1319 landbird 5,044,646 4,348,767 5,764,857 0.942517033 0.009950062 200 2Scaled Quail Callipepla squamata 102 landbird 2,393,345 1,766,520 3,168,001 0.533186089 0.016925686 200 1.75Scarlet Tanager Piranga olivacea 2034 landbird 2,574,915 2,256,623 2,956,329 0.101735649 0.006773229 200 2Scissor-tailed Flycatcher Tyrannus forficatus 1282 landbird 7,914,013 6,502,356 9,635,329 0.27142701 0.021457588 200 2Scott's Oriole Icterus parisorum 1924 landbird 1,721,724 1,332,821 2,134,384 0.238065553 0.008735328 125 1.75Seaside Sparrow Ammospiza maritima 1847 landbird 196,782 32,213 523,319 0.457471505 0.125282849 125 1.25Sedge Wren Cistothorus platensis 1469 landbird 5,017,990 4,252,225 5,954,334 0.459508553 0.012025593 125 2Sharp-shinned Hawk Accipiter striatus 789 landbird 405,947 303,414 524,274 0.19572212 0.001721087 125 2Sharp-tailed Grouse Tympanuchus phasianellus 134 landbird 761,942 569,936 975,726 0.307188253 0.010358181 200 2Short-eared Owl Asio flammeus 865 landbird 602,353 485,388 747,895 0.381400506 0.008177428 200 1.75Snow Bunting Plectrophenax nivalis 1777 landbird 14,267,309 14,267,309 14,267,309 0.477568371 0.036353088 200 1.75Song Sparrow Melospiza melodia 1852 landbird 126,053,605 118,934,257 133,938,545 0.377871011 0.025177923 125 2Spotted Towhee Pipilo maculatus 1805 landbird 35,271,543 31,027,431 39,773,372 0.808232166 0.02023887 125 2Sprague's Pipit Anthus spragueii 1680 landbird 1,394,136 936,560 2,009,643 0.329678876 0.01811783 200 2Steller's Jay Cyanocitta stelleri 1381 landbird 2,705,843 2,239,068 3,237,856 0.183671434 0.011063169 200 1.25Summer Tanager Piranga rubra 2033 landbird 11,302,422 10,343,397 12,384,415 0.278798745 0.012069164 125 2Swainson's Hawk Buteo swainsoni 823 landbird 822,598 714,482 956,228 0.14557514 0.006763745 300 1.5Swainson's Thrush Catharus ustulatus 1583 landbird 121,704,609 102,456,492 144,203,885 0.516449016 0.025017579 200 2Swainson's Warbler Limnothlypis swainsonii 1956 landbird 156,081 99,540 235,309 0.334319283 0.004325713 200 2Swamp Sparrow Melospiza georgiana 1854 landbird 23,261,464 20,193,095 26,315,495 0.505455805 0.013070146 125 2Tennessee Warbler Oreothlypis peregrina 1959 landbird 111,454,361 80,906,890 149,074,619 0.19793209 0.016972245 125 2Townsend's Solitaire Myadestes townsendi 1560 landbird 1,050,595 834,475 1,298,011 0.117084632 0.005982225 200 2Townsend's Warbler Setophaga townsendi 2009 landbird 21,262,275 16,792,636 26,233,697 0.194158878 0.013715638 100 2Tree Swallow Tachycineta bicolor 1420 landbird 18,581,775 16,732,180 20,563,777 0.136023938 0.016419183 200 1.75Tufted Titmouse Baeolophus bicolor 1445 landbird 11,970,837 10,921,948 13,128,862 0.165596732 0.012740487 200 1.25Turkey Vulture Cathartes aura 766 landbird 8,418,387 7,705,474 9,163,886 1.094905764 0.02839236 400 1.75Varied Bunting Passerina versicolor 2063 landbird 69,313 27,061 135,722 0.342755297 0.067921347 125 1.75Varied Thrush Ixoreus naevius 1609 landbird 34,514,221 26,180,031 44,500,981 0.836969707 0.023621132 200 2Vaux's Swift Chaetura vauxi 261 landbird 418,576 284,294 607,235 0.81044058 0.01750757 200 1.75Veery Catharus fuscescens 1580 landbird 11,186,101 9,451,271 13,166,545 0.483652865 0.014851972 200 2Verdin Auriparus flaviceps 1447 landbird 3,810,209 2,615,935 5,392,903 0.216241891 0.01368995 125 1.5Vermilion Flycatcher Pyrocephalus rubinus 1320 landbird 538,032 324,197 798,482 0.309093639 0.270946381 125 2Vesper Sparrow Pooecetes gramineus 1835 landbird 35,053,955 30,378,748 40,800,937 0.395480333 0.023570974 200 2Violet-green Swallow Tachycineta thalassina 1423 landbird 6,724,535 5,560,970 8,017,545 0.195622727 0.024180882 200 1.5Virginia's Warbler Oreothlypis virginiae 1964 landbird 904,013 567,681 1,360,062 0.123544103 0.007611996 125 2Warbling Vireo Vireo gilvus 1358 landbird 52,333,042 46,022,570 58,752,802 0.230417562 0.011166342 125 2Western Bluebird Sialia mexicana 1558 landbird 5,661,189 4,392,144 7,058,744 0.696104544 0.017579858 125 2Western Kingbird Tyrannus verticalis 1277 landbird 28,830,127 24,939,575 33,543,450 0.592717171 0.021322477 200 2Western Meadowlark Sturnella neglecta 1889 landbird 95,124,368 83,326,234 107,339,715 0.27317075 0.029996622 200 1.5Western Screech-Owl Megascops kennicottii 832 landbird 240,461 121,691 401,313 2.687968772 0.002995476 125 2Western Tanager Piranga ludoviciana 2035 landbird 15,020,244 12,899,162 17,361,777 0.447457356 0.014480276 200 2Western Wood-Pewee Contopus sordidulus 1295 landbird 8,845,348 7,660,907 10,112,663 0.114093527 0.013682786 200 2White-breasted Nuthatch Sitta carolinensis 1450 landbird 10,035,072 9,249,484 10,873,200 0.300171347 0.007606023 125 1.5White-crowned Sparrow Zonotrichia leucophrys 1858 landbird 79,258,794 63,587,655 97,291,972 0.735826366 0.024616882 200 2White-eyed Vireo Vireo griseus 1340 landbird 22,090,753 20,223,913 24,179,468 0.345526823 0.014272054 125 2White-headed Woodpecker Dryobates albolarvatus 966 landbird 243,113 168,463 340,504 0.27959732 0.034920096 125 2White-tailed Kite Elanus leucurus 772 landbird 15,718 8,293 26,310 0.393264523 0.22105359 300 1.5White-throated Sparrow Zonotrichia albicollis 1856 landbird 162,847,702 138,867,549 189,194,261 0.810191169 0.028959236 200 2White-throated Swift Aeronautes saxatalis 274 landbird 2,382,771 1,600,983 3,298,803 1.44612641 0.03742553 200 1.25White-winged Crossbill Loxia leucoptera 1760 landbird 39,691,698 30,030,233 51,497,702 0.315993228 0.034746756 125 1.25White-winged Dove Zenaida asiatica 195 landbird 5,159,586 3,579,714 7,462,483 0.154560911 0.01908313 200 1.5Williamson's Sapsucker Sphyrapicus thyroideus 953 landbird 294,829 209,789 398,019 0.129722328 0.00726301 125 1.5Willow Flycatcher Empidonax traillii 1305 landbird 8,095,093 6,902,363 9,486,416 0.192252001 0.007418508 125 2Willow Ptarmigan Lagopus lagopus 129 landbird 12,784,429 7,232,901 21,298,386 0.516304491 0.161395519 125 2Wilson's Warbler Cardellina pusilla 2023 landbird 81,271,984 65,743,361 98,288,305 0.150728497 0.010994367 100 2Winter Wren Troglodytes hiemalis 1467 landbird 11,140,437 9,052,643 13,798,379 0.450595909 0.010210473 200 1.75Wood Thrush Hylocichla mustelina 1585 landbird 12,191,387 10,959,424 13,589,692 0.841982739 0.014786107 200 2Woodhouse's Scrub-Jay Aphelocoma woodhouseii 1386 landbird 692,935 476,075 1,023,759 0.162746 0.013553 200 1.25Worm-eating Warbler Helmitheros vermivorum 1948 landbird 784,060 608,710 988,276 0.308009094 0.006566743 125 2Wrentit Chamaea fasciata 1530 landbird 1,753,863 1,095,353 2,807,164 0.568239126 0.018344846 200 2Yellow Warbler Setophaga petechia 1992 landbird 92,640,979 83,231,903 102,629,283 0.100828316 0.012896374 125 2Yellow-bellied Flycatcher Empidonax flaviventris 1302 landbird 13,047,639 10,169,586 16,383,394 0.180646794 0.007272063 125 2Yellow-bellied Sapsucker Sphyrapicus varius 954 landbird 13,523,418 11,628,336 15,891,341 0.505398175 0.010805358 125 1.5Yellow-billed Cuckoo Coccyzus americanus 205 landbird 8,358,126 7,571,171 9,214,892 0.322683865 0.010071364 200 2Yellow-breasted Chat Icteria virens 1885 landbird 15,066,335 13,315,869 16,929,873 0.530142376 0.016546429 200 2Yellow-headed Blackbird Xanthocephalus xanthocephalus 1886 landbird 11,338,466 8,566,820 14,826,716 0.352608969 0.031402487 200 1Yellow-rumped Warbler Setophaga coronata 1999 landbird 173,685,250 155,879,524 190,742,853 0.260143255 0.050020994 125 2Yellow-throated Vireo Vireo flavifrons 1352 landbird 4,705,278 4,250,092 5,161,482 0.234056711 0.007699809 125 2
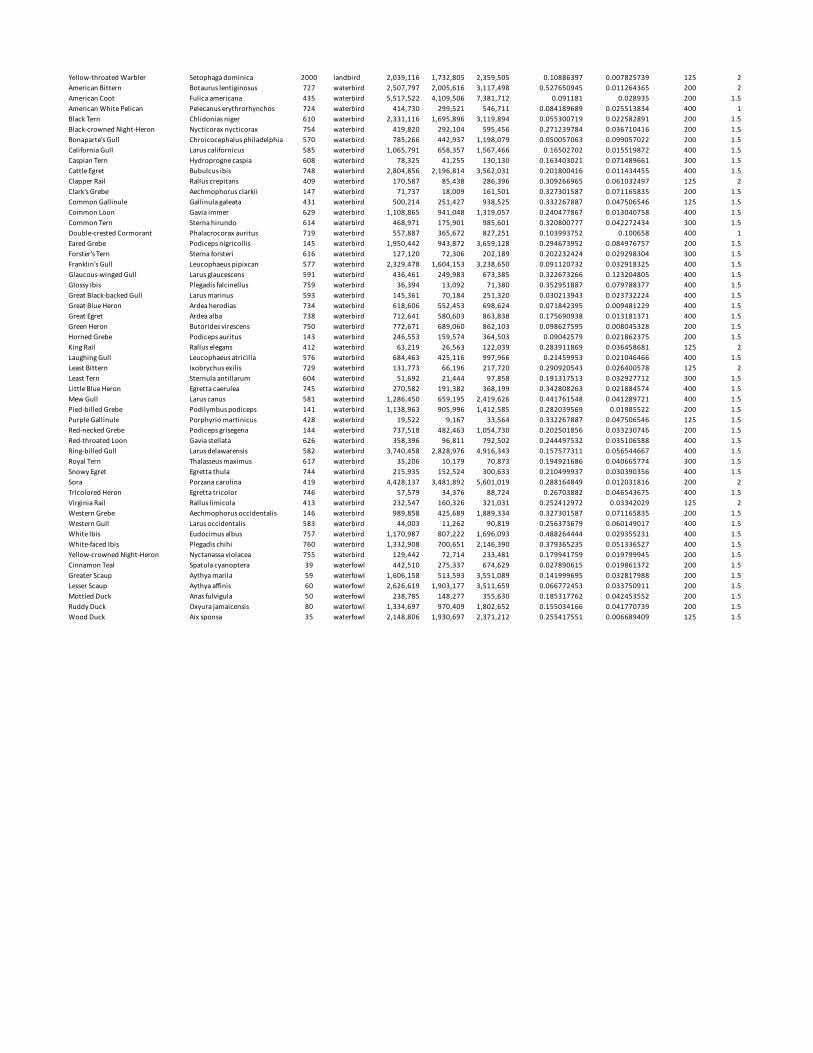
Yellow-throated Warbler Setophaga dominica 2000 landbird 2,039,116 1,732,805 2,359,505 0.10886397 0.007825739 125 2American Bittern Botaurus lentiginosus 727 waterbird 2,507,797 2,005,616 3,117,498 0.527650945 0.011264365 200 2American Coot Fulica americana 435 waterbird 5,517,522 4,109,506 7,381,712 0.091181 0.028935 200 1.5American White Pelican Pelecanus erythrorhynchos 724 waterbird 414,730 299,521 546,711 0.084189689 0.025513834 400 1Black Tern Chlidonias niger 610 waterbird 2,331,116 1,695,896 3,119,894 0.055300719 0.022582891 200 1.5Black-crowned Night-Heron Nycticorax nycticorax 754 waterbird 419,820 292,104 595,456 0.271239784 0.036710416 200 1.5Bonaparte's Gull Chroicocephalus philadelphia 570 waterbird 785,266 442,937 1,198,079 0.050057063 0.099057022 200 1.5California Gull Larus californicus 585 waterbird 1,065,791 658,357 1,567,466 0.16502702 0.015519872 400 1.5Caspian Tern Hydroprogne caspia 608 waterbird 78,325 41,255 130,130 0.163403021 0.071489661 300 1.5Cattle Egret Bubulcus ibis 748 waterbird 2,804,856 2,196,814 3,562,031 0.201800416 0.011434455 400 1.5Clapper Rail Rallus crepitans 409 waterbird 170,587 85,438 286,396 0.309266965 0.061032497 125 2Clark's Grebe Aechmophorus clarkii 147 waterbird 71,737 18,009 161,501 0.327301587 0.071165835 200 1.5Common Gallinule Gallinula galeata 431 waterbird 500,214 251,427 938,525 0.332267887 0.047506546 125 1.5Common Loon Gavia immer 629 waterbird 1,108,865 941,048 1,319,057 0.240477867 0.013040758 400 1.5Common Tern Sterna hirundo 614 waterbird 468,971 175,901 985,601 0.320800777 0.042272434 300 1.5Double-crested Cormorant Phalacrocorax auritus 719 waterbird 557,887 365,672 827,251 0.103993752 0.100658 400 1Eared Grebe Podiceps nigricollis 145 waterbird 1,950,442 943,872 3,659,128 0.294673952 0.084976757 200 1.5Forster's Tern Sterna forsteri 616 waterbird 127,120 72,306 202,189 0.202232424 0.029298304 300 1.5Franklin's Gull Leucophaeus pipixcan 577 waterbird 2,329,478 1,604,153 3,238,650 0.091120732 0.032918325 400 1.5Glaucous-winged Gull Larus glaucescens 591 waterbird 436,461 249,983 673,385 0.322673266 0.123204805 400 1.5Glossy Ibis Plegadis falcinellus 759 waterbird 36,394 13,092 71,380 0.352951887 0.079788377 400 1.5Great Black-backed Gull Larus marinus 593 waterbird 145,361 70,184 251,320 0.030213943 0.023732224 400 1.5Great Blue Heron Ardea herodias 734 waterbird 618,606 552,453 698,624 0.071842395 0.009481229 400 1.5Great Egret Ardea alba 738 waterbird 712,641 580,603 863,838 0.175690938 0.013181371 400 1.5Green Heron Butorides virescens 750 waterbird 772,671 689,060 862,103 0.098627595 0.008045328 200 1.5Horned Grebe Podiceps auritus 143 waterbird 246,553 159,574 364,503 0.09042579 0.021862375 200 1.5King Rail Rallus elegans 412 waterbird 63,219 26,563 122,039 0.283911869 0.036458681 125 2Laughing Gull Leucophaeus atricilla 576 waterbird 684,463 425,116 997,966 0.21459953 0.021046466 400 1.5Least Bittern Ixobrychus exilis 729 waterbird 131,773 66,196 217,720 0.290920543 0.026400578 125 2Least Tern Sternula antillarum 604 waterbird 51,692 21,444 97,858 0.191317513 0.032927712 300 1.5Little Blue Heron Egretta caerulea 745 waterbird 270,582 191,382 368,199 0.342808263 0.021884574 400 1.5Mew Gull Larus canus 581 waterbird 1,286,450 659,195 2,419,626 0.441761548 0.041289721 400 1.5Pied-billed Grebe Podilymbus podiceps 141 waterbird 1,138,963 905,996 1,412,585 0.282039569 0.01985522 200 1.5Purple Gallinule Porphyrio martinicus 428 waterbird 19,522 9,167 33,564 0.332267887 0.047506546 125 1.5Red-necked Grebe Podiceps grisegena 144 waterbird 737,518 482,463 1,054,730 0.202501856 0.033230746 200 1.5Red-throated Loon Gavia stellata 626 waterbird 358,396 96,811 792,502 0.244497532 0.035106588 400 1.5Ring-billed Gull Larus delawarensis 582 waterbird 3,740,458 2,828,976 4,916,343 0.157577311 0.056544667 400 1.5Royal Tern Thalasseus maximus 617 waterbird 35,206 10,179 70,873 0.194921686 0.040665774 300 1.5Snowy Egret Egretta thula 744 waterbird 215,935 152,524 300,633 0.210499937 0.030390356 400 1.5Sora Porzana carolina 419 waterbird 4,428,137 3,481,892 5,601,019 0.288164849 0.012031816 200 2Tricolored Heron Egretta tricolor 746 waterbird 57,579 34,376 88,724 0.26703882 0.046543675 400 1.5Virginia Rail Rallus limicola 413 waterbird 232,547 160,326 321,031 0.252412972 0.03342029 125 2Western Grebe Aechmophorus occidentalis 146 waterbird 989,858 425,689 1,889,334 0.327301587 0.071165835 200 1.5Western Gull Larus occidentalis 583 waterbird 44,003 11,262 90,819 0.256373679 0.060149017 400 1.5White Ibis Eudocimus albus 757 waterbird 1,170,987 807,222 1,696,093 0.488264444 0.029355231 400 1.5White-faced Ibis Plegadis chihi 760 waterbird 1,332,908 700,651 2,146,390 0.379365235 0.051336527 400 1.5Yellow-crowned Night-Heron Nyctanassa violacea 755 waterbird 129,442 72,714 233,481 0.179941759 0.019799945 200 1.5Cinnamon Teal Spatula cyanoptera 39 waterfowl 442,510 275,337 674,629 0.027890615 0.019861372 200 1.5Greater Scaup Aythya marila 59 waterfowl 1,606,158 513,593 3,551,089 0.141999695 0.032817988 200 1.5Lesser Scaup Aythya affinis 60 waterfowl 2,626,619 1,903,177 3,511,659 0.066772453 0.033750911 200 1.5Mottled Duck Anas fulvigula 50 waterfowl 238,785 148,277 355,630 0.185317762 0.042453552 200 1.5Ruddy Duck Oxyura jamaicensis 80 waterfowl 1,334,697 970,409 1,802,652 0.155034166 0.041770739 200 1.5Wood Duck Aix sponsa 35 waterfowl 2,148,806 1,930,697 2,371,212 0.255417551 0.006689409 125 1.5
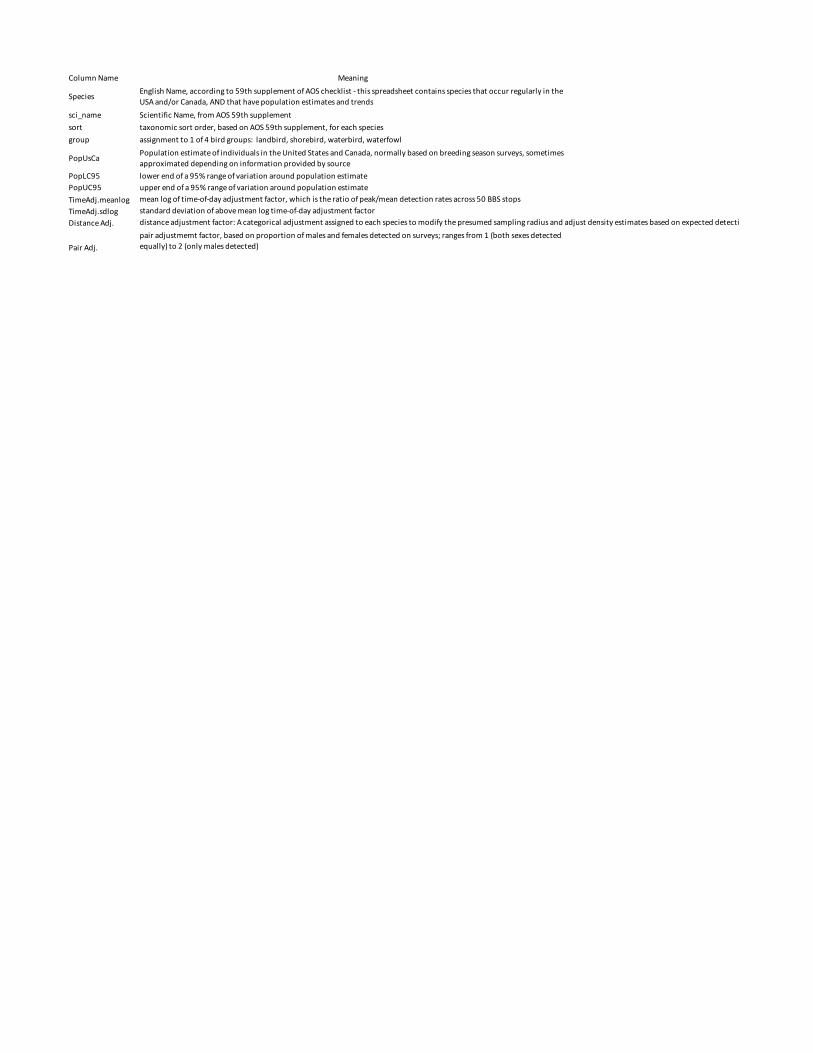
Column Name Meaning
Species English Name, according to 59th supplement of AOS checklist - this spreadsheet contains species that occur regularly in the USA and/or Canada, AND that have population estimates and trends
sci_name Scientific Name, from AOS 59th supplementsort taxonomic sort order, based on AOS 59th supplement, for each speciesgroup assignment to 1 of 4 bird groups: landbird, shorebird, waterbird, waterfowl
PopUsCa Population estimate of individuals in the United States and Canada, normally based on breeding season surveys, sometimes approximated depending on information provided by source
PopLC95 lower end of a 95% range of variation around population estimatePopUC95 upper end of a 95% range of variation around population estimateTimeAdj.meanlog mean log of time-of-day adjustment factor, which is the ratio of peak/mean detection rates across 50 BBS stopsTimeAdj.sdlog standard deviation of above mean log time-of-day adjustment factorDistance Adj. distance adjustment factor: A categorical adjustment assigned to each species to modify the presumed sampling radius and adjust density estimates based on expected detection distance
Pair Adj.pair adjustmemt factor, based on proportion of males and females detected on surveys; ranges from 1 (both sexes detected equally) to 2 (only males detected)
Related Documents