Decisions in Business Areas Copyright 1994-1996 by Jerry Post Chapter 9

Decisions in Business Areas Copyright 1994-1996 by Jerry Post Chapter 9.
Dec 21, 2015
Welcome message from author
This document is posted to help you gain knowledge. Please leave a comment to let me know what you think about it! Share it to your friends and learn new things together.
Transcript

Decisions in Business Areas
Copyright 1994-1996 by Jerry Post
Chapter 9
Decisions inFunctional Areas
Fin
ance
Mod
els
Acc
ount
ing
Mod
els
Pro
duct
ion
Mod
els
Mar
ketin
g M
odel
s
Hum
an R
esou
rce
Mod
els
Strategy
TacticalDecisions
Operations
Company
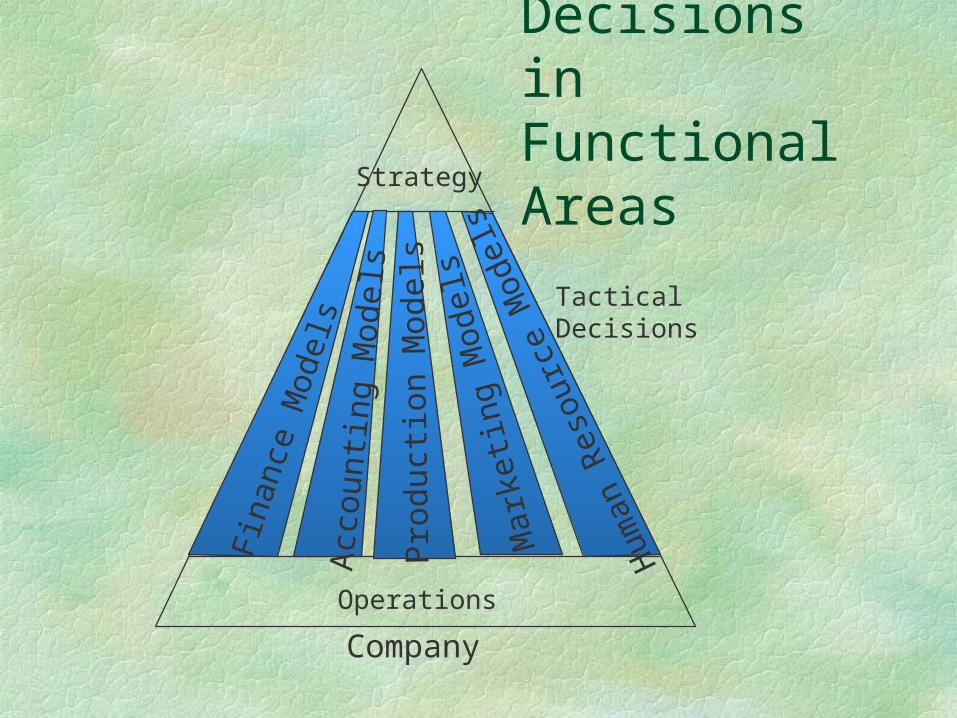
Models as ObjectsModel Attributes
Inputs Outputs Problem Characterization
Model Methods Optimization Prediction Simulation Analysis

Accounting
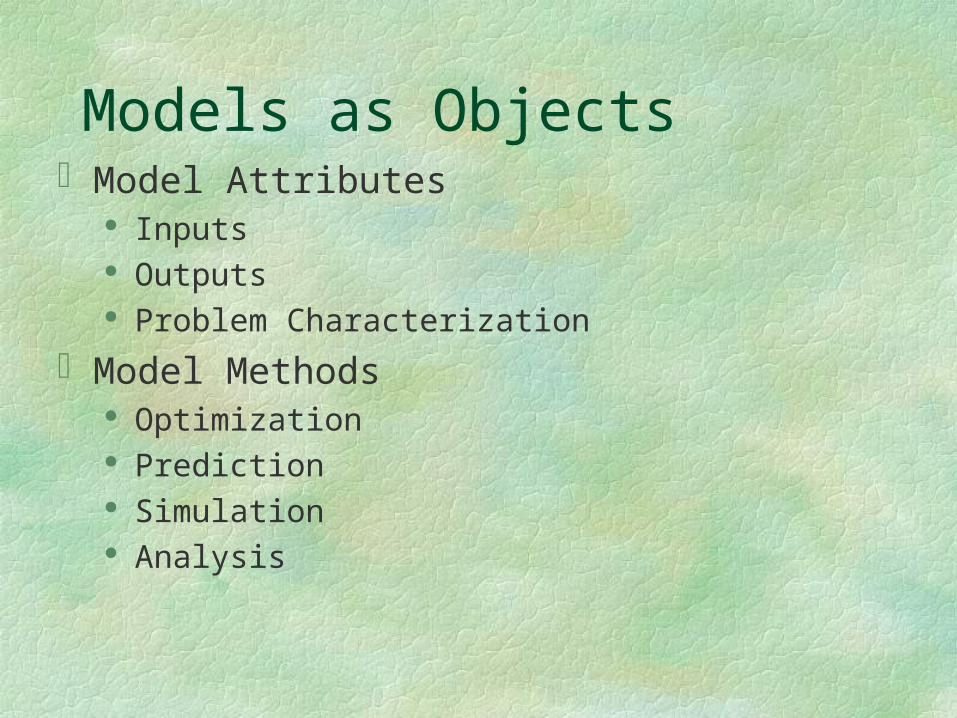
Accounting Models Transaction Processing & Tactics
Accounting systems are models Standards for reports Decisions & Data
Control Systems Accuracy Fraud
Strategic Support Information Customization
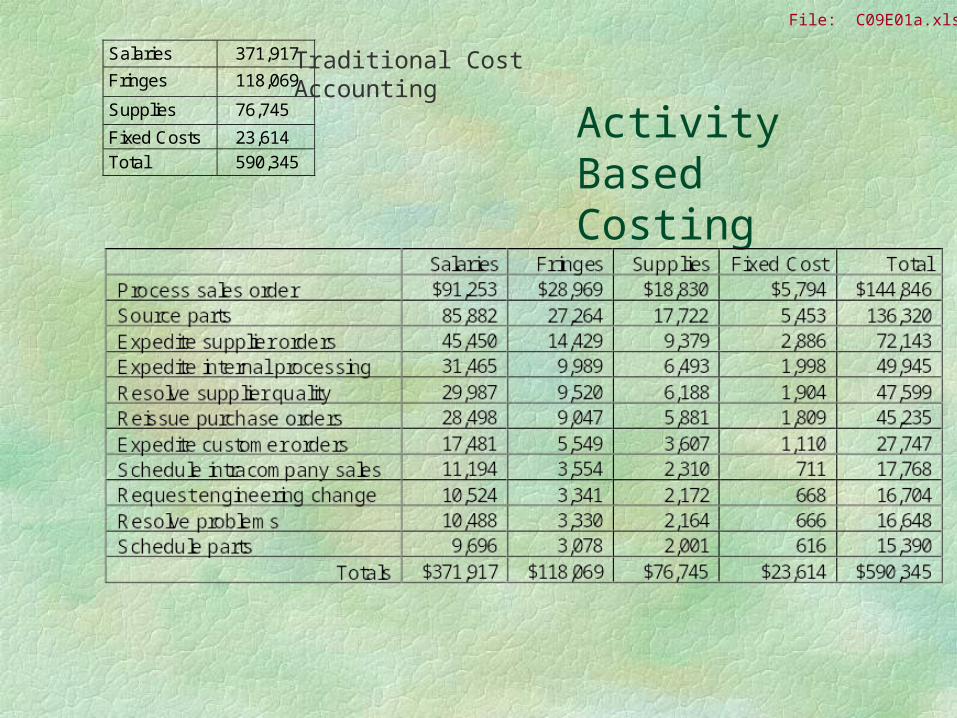
Activity Based Costing
Salaries 371,917
Fringes 118,069
Supplies 76,745
Fixed Costs 23,614
Total 590,345
Traditional Cost Accounting
File: C09E01a.xls
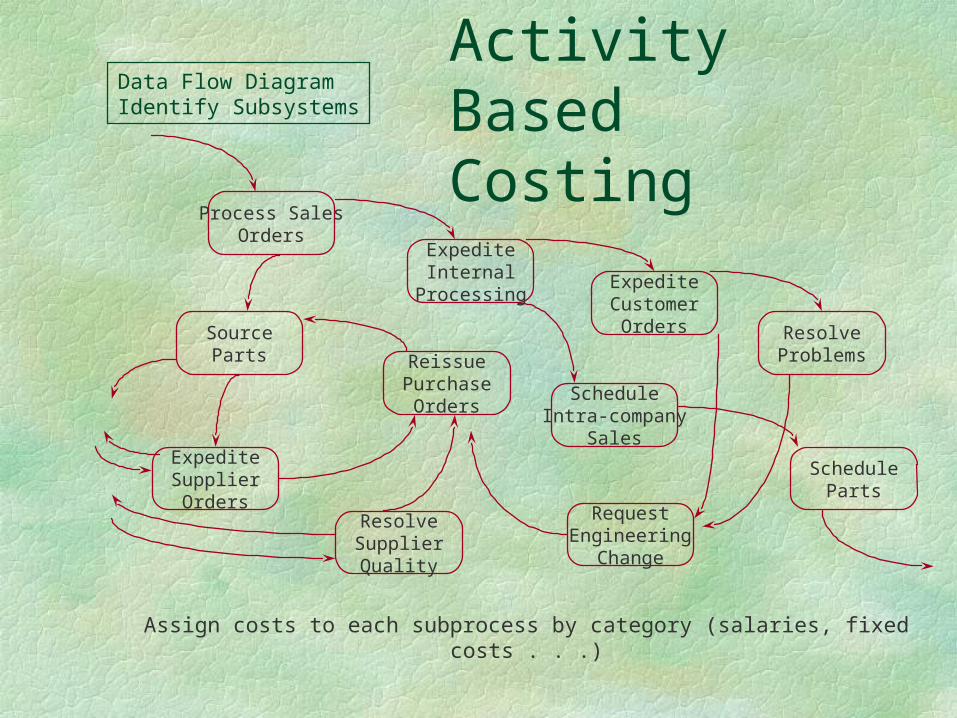
Activity Based Costing
Process SalesOrders
SourceParts
ExpediteSupplierOrders
ExpediteInternal
Processing
ResolveSupplierQuality
ReissuePurchase
Orders
ExpediteCustomer
Orders
ScheduleIntra-company
Sales
RequestEngineering
Change
ScheduleParts
ResolveProblems
Data Flow DiagramIdentify Subsystems
Assign costs to each subprocess by category (salaries, fixed costs . . .)

Finance
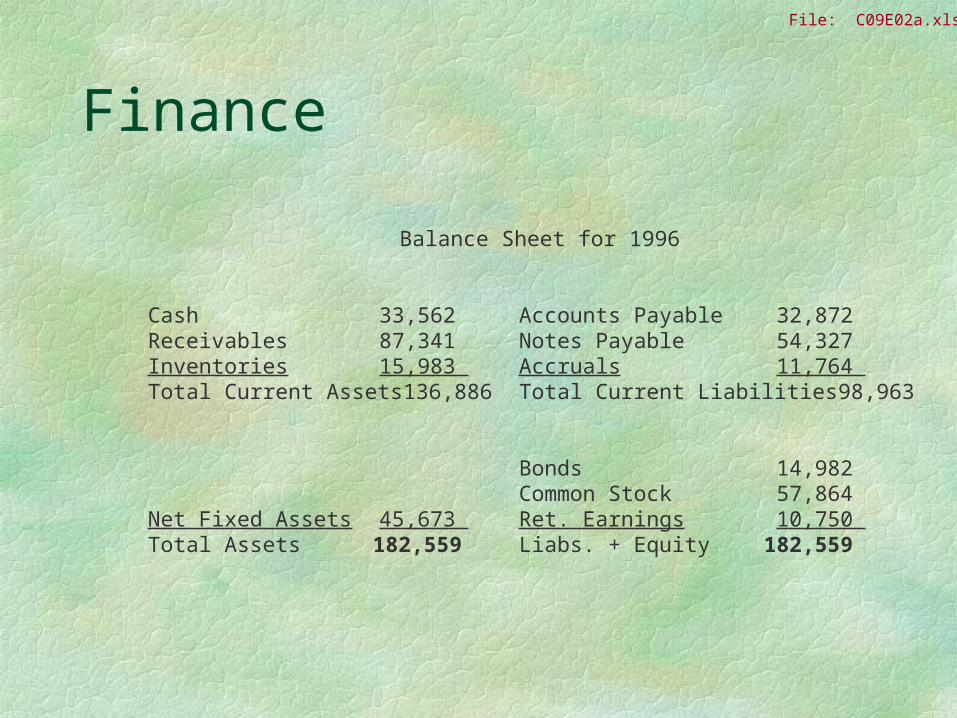
Finance
Balance Sheet for 1996
Cash 33,562 Accounts Payable 32,872 Receivables 87,341 Notes Payable 54,327 Inventories 15,983 Accruals 11,764 Total Current Assets 136,886 Total Current Liabilities 98,963
Bonds 14,982 Common Stock 57,864
Net Fixed Assets 45,673 Ret. Earnings 10,750 Total Assets 182,559 Liabs. + Equity 182,559
File: C09E02a.xls
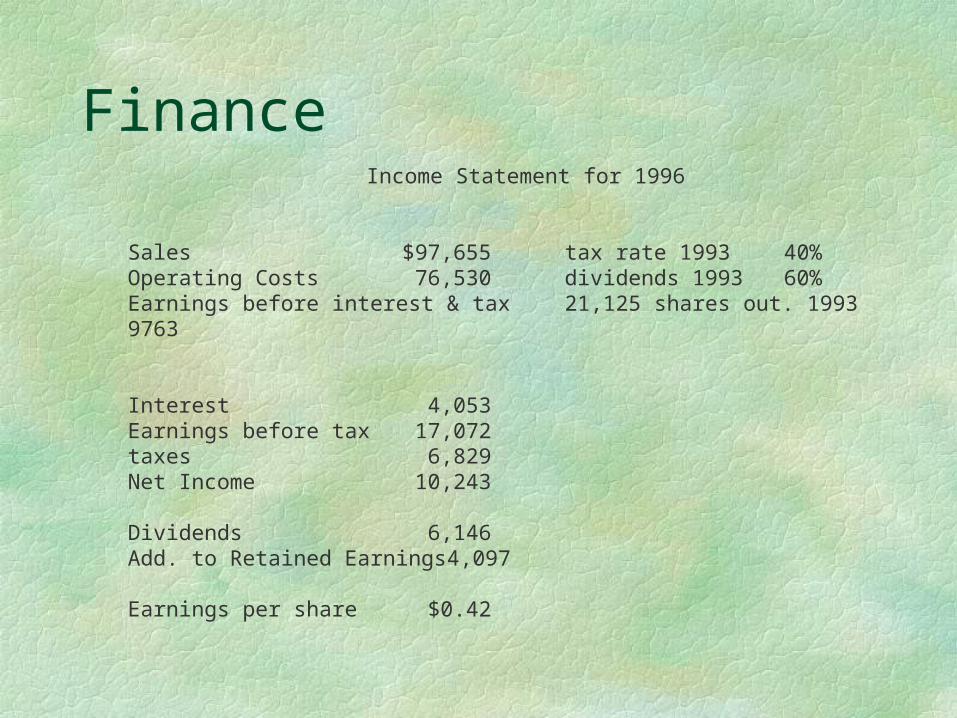
FinanceIncome Statement for 1996
Sales $97,655 tax rate 1993 40%Operating Costs 76,530 dividends 1993 60%Earnings before interest & tax 21,125 shares out. 1993 9763
Interest 4,053 Earnings before tax 17,072 taxes 6,829 Net Income 10,243
Dividends 6,146 Add. to Retained Earnings 4,097
Earnings per share $0.42
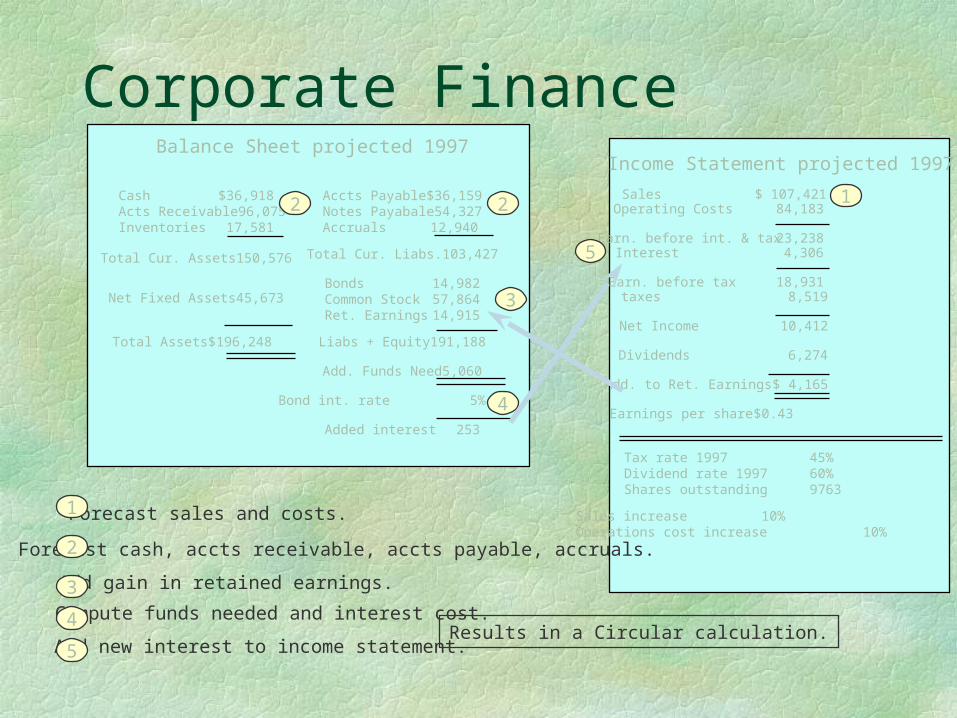
Corporate Finance
Results in a Circular calculation.
Cash $36,918Acts Receivable 96,075Inventories 17,581
Net Fixed Assets 45,673
Total Assets $196,248
Accts Payable $36,159Notes Payabale 54,327Accruals 12,940
Total Cur. Liabs. 103,427
Bonds 14,982Common Stock 57,864Ret. Earnings 14,915
Liabs + Equity 191,188
Add. Funds Need 5,060
Bond int. rate 5%
Added interest 253
Balance Sheet projected 1997Income Statement projected 1997
Sales $ 107,421Operating Costs 84,183
Earn. before int. & tax 23,238Interest 4,306
Earn. before tax 18,931taxes 8,519
Net Income 10,412
Dividends 6,274
Add. to Ret. Earnings $ 4,165
Earnings per share $0.43
Tax rate 1997 45%Dividend rate 1997 60%Shares outstanding 9763
Sales increase 10%Operations cost increase 10%
Forecast sales and costs.
Forecast cash, accts receivable, accts payable, accruals.
Add gain in retained earnings.
Compute funds needed and interest cost.
Add new interest to income statement.
1
2
3
4
5
12
4
2
3
5Total Cur. Assets 150,576

Marketing
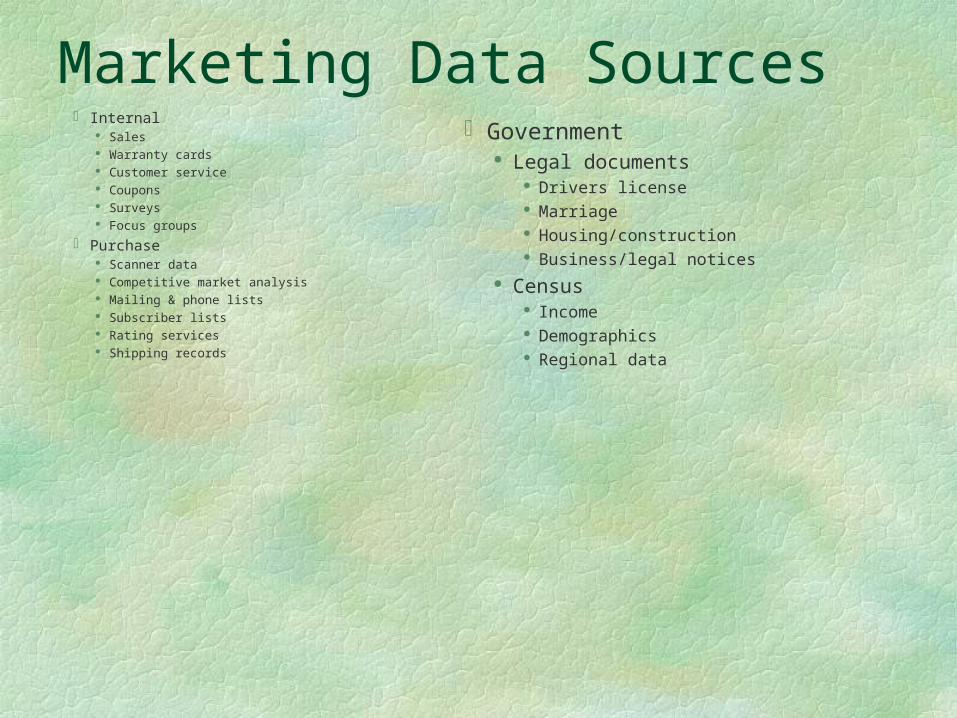
Marketing Data Sources Internal
Sales Warranty cards Customer service Coupons Surveys Focus groups
Purchase Scanner data Competitive market analysis Mailing & phone lists Subscriber lists Rating services Shipping records
Government Legal documents
Drivers license Marriage Housing/construction Business/legal notices
Census Income Demographics Regional data
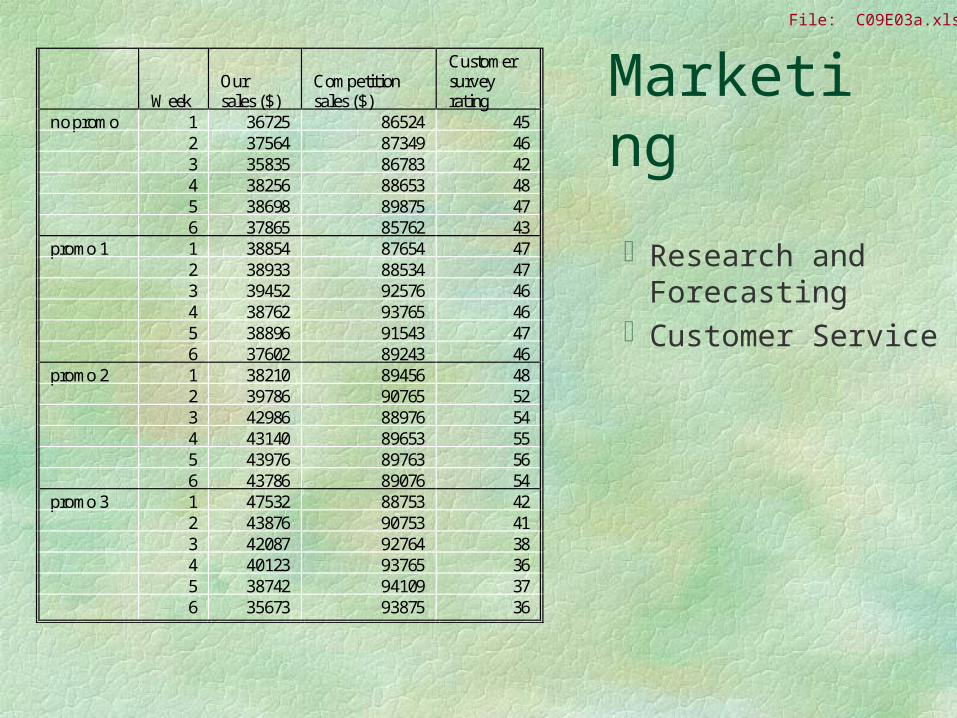
WeekOursales ($)
Competitionsales ($)
Customersurveyrating
no promo 1 36725 86524 452 37564 87349 463 35835 86783 424 38256 88653 485 38698 89875 476 37865 85762 43
promo 1 1 38854 87654 472 38933 88534 473 39452 92576 464 38762 93765 465 38896 91543 476 37602 89243 46
promo 2 1 38210 89456 482 39786 90765 523 42986 88976 544 43140 89653 555 43976 89763 566 43786 89076 54
promo 3 1 47532 88753 422 43876 90753 413 42087 92764 384 40123 93765 365 38742 94109 376 35673 93875 36
Marketing
Research and Forecasting
Customer Service
File: C09E03a.xls
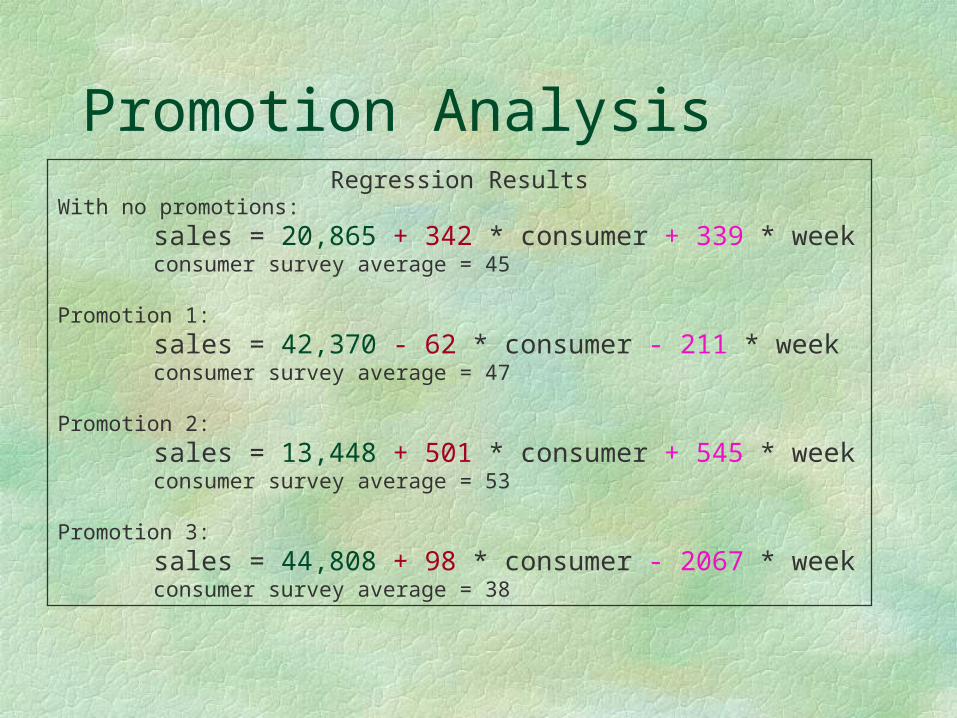
Promotion AnalysisRegression Results
With no promotions:
sales = 20,865 + 342 * consumer + 339 * weekconsumer survey average = 45
Promotion 1:
sales = 42,370 - 62 * consumer - 211 * weekconsumer survey average = 47
Promotion 2:
sales = 13,448 + 501 * consumer + 545 * weekconsumer survey average = 53
Promotion 3:
sales = 44,808 + 98 * consumer - 2067 * weekconsumer survey average = 38
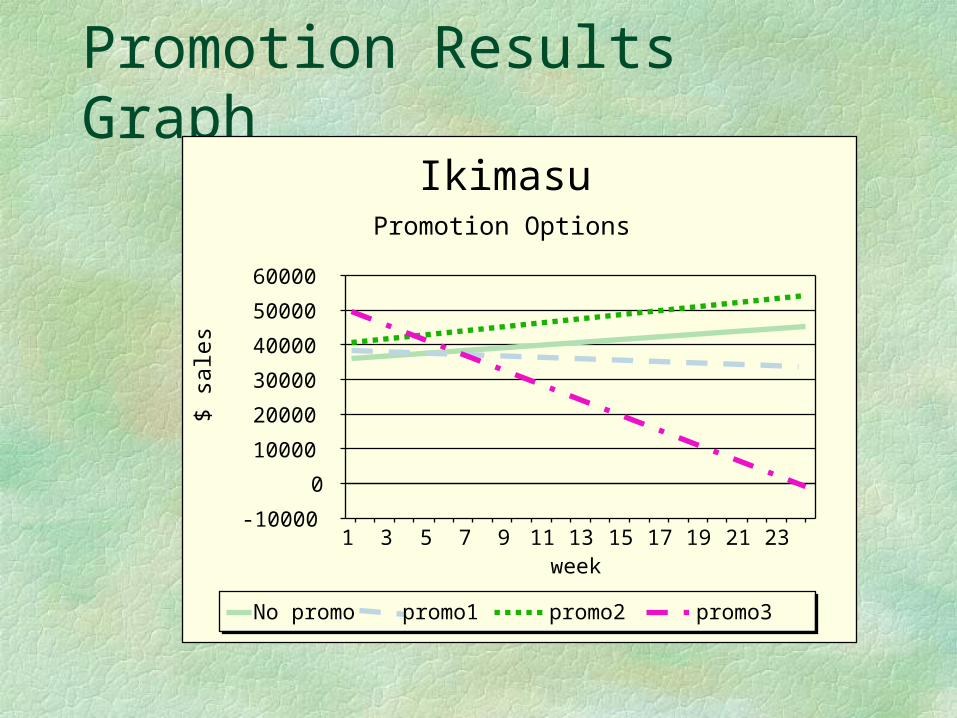
Promotion Results Graph
-10000
0
10000
20000
30000
40000
50000
60000
$ sa
les
1 3 5 7 9 11 13 15 17 19 21 23 week
No promo promo1 promo2 promo3
IkimasuPromotion Options
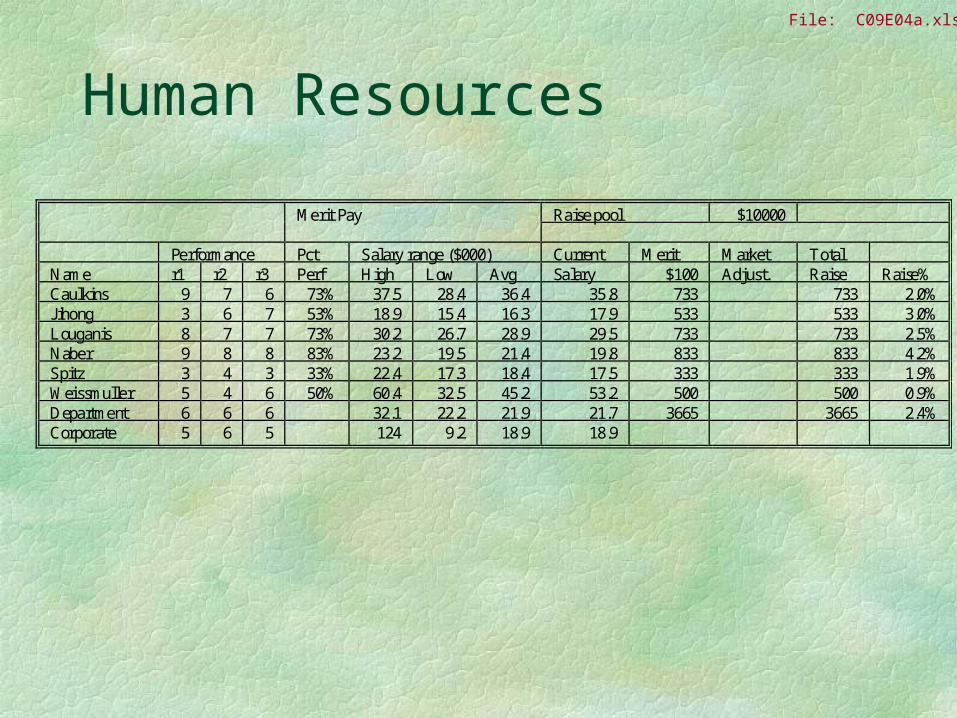
Human Resources
File: C09E04a.xls
Merit Pay Raise pool $10000
Performance Pct Salary range ($000) Current Merit Market TotalName r1 r2 r3 Perf High Low Avg Salary $100 Adjust. Raise Raise%Caulkins 9 7 6 73% 37.5 28.4 36.4 35.8 733 733 2.0%Jihong 3 6 7 53% 18.9 15.4 16.3 17.9 533 533 3.0%Louganis 8 7 7 73% 30.2 26.7 28.9 29.5 733 733 2.5%Naber 9 8 8 83% 23.2 19.5 21.4 19.8 833 833 4.2%Spitz 3 4 3 33% 22.4 17.3 18.4 17.5 333 333 1.9%Weissmuller 5 4 6 50% 60.4 32.5 45.2 53.2 500 500 0.9%Department 6 6 6 32.1 22.2 21.9 21.7 3665 3665 2.4%Corporate 5 6 5 124 9.2 18.9 18.9
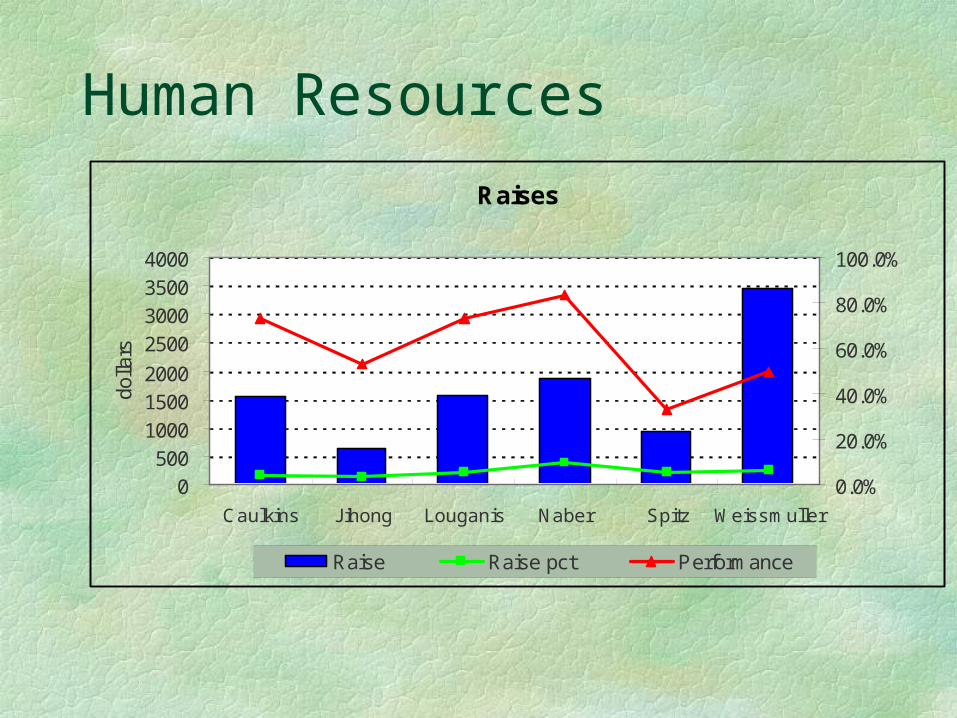
Human Resources
Raises
0500
100015002000
2500300035004000
Caulkins Jihong Louganis Naber Spitz Weissmuller
dolla
rs
0.0%
20.0%
40.0%
60.0%
80.0%
100.0%
Raise Raise pct Performance

Production
Production ModelsProcess ControlInventories, MRPComputer Integrated ManufacturingProduct Design
Computers are used to track inventory levels, receipts, and shipments. Sophisticated warehouse information systems automatically route boxes to storage and switch conveyor systems to send packages to trucks waiting at the loading docks.
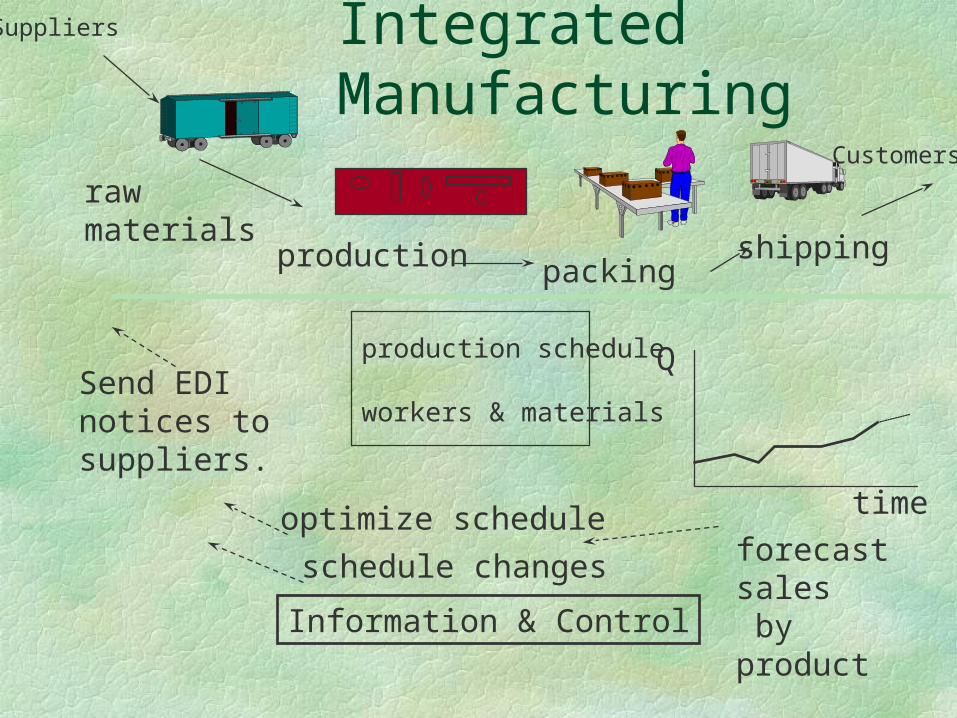
Integrated Manufacturing
shippingpackingproduction
rawmaterials
time
Q
forecast sales by product
production schedule
workers & materials
optimize schedule
Send EDInotices tosuppliers.
schedule changes
Information & Control
Suppliers
Customers
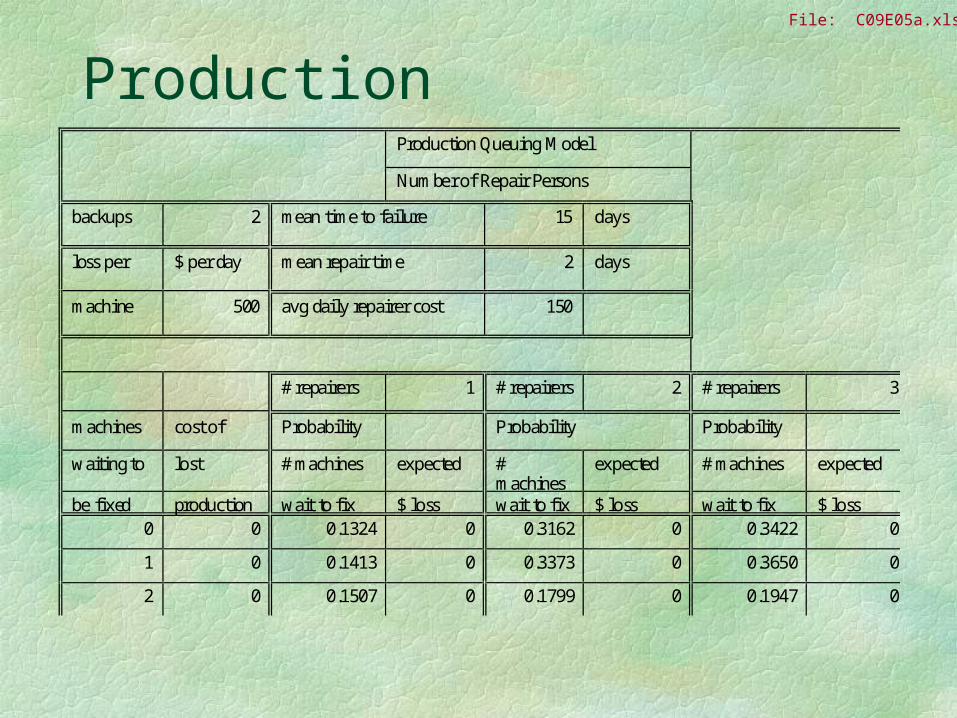
ProductionFile: C09E05a.xls
Production Queuing Model
Number of Repair Persons
backups 2 mean time to failure 15 days
loss per $ per day mean repair time 2 days
machine 500 avg daily repairer cost 150
# repairers 1 # repairers 2 # repairers 3
machines cost of Probability Probability Probability
waiting to lost # machines expected #machines
expected # machines expected
be fixed production wait to fix $ loss wait to fix $ loss wait to fix $ loss0 0 0.1324 0 0.3162 0 0.3422 0
1 0 0.1413 0 0.3373 0 0.3650 0
2 0 0.1507 0 0.1799 0 0.1947 0
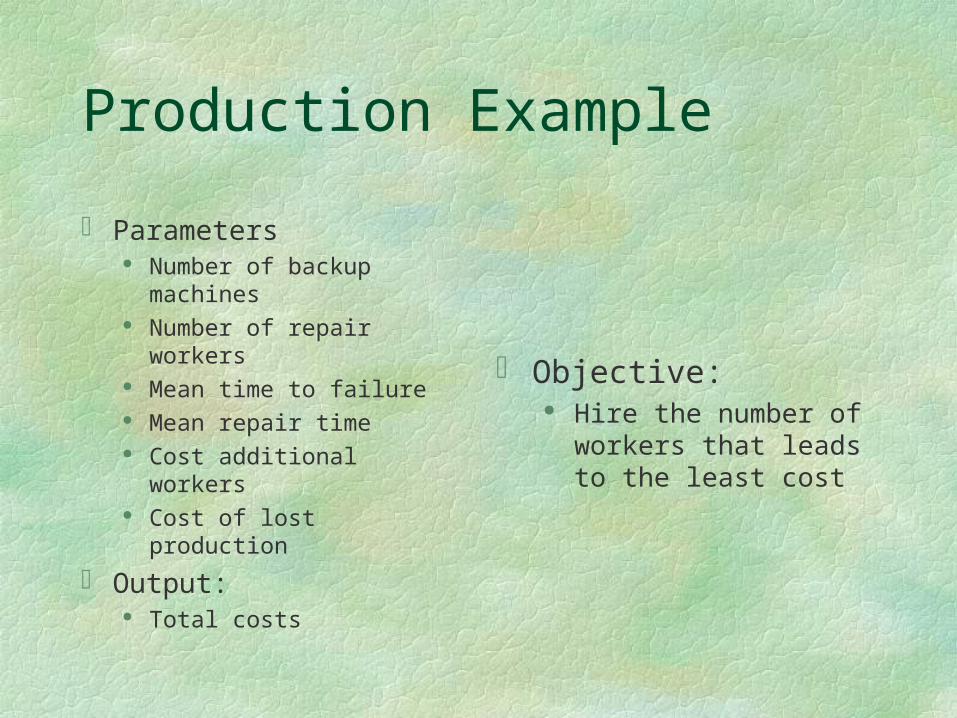
Production Example
Parameters Number of backup
machines Number of repair workers Mean time to failure Mean repair time Cost additional workers Cost of lost production
Output: Total costs
Objective: Hire the number of workers
that leads to the least cost
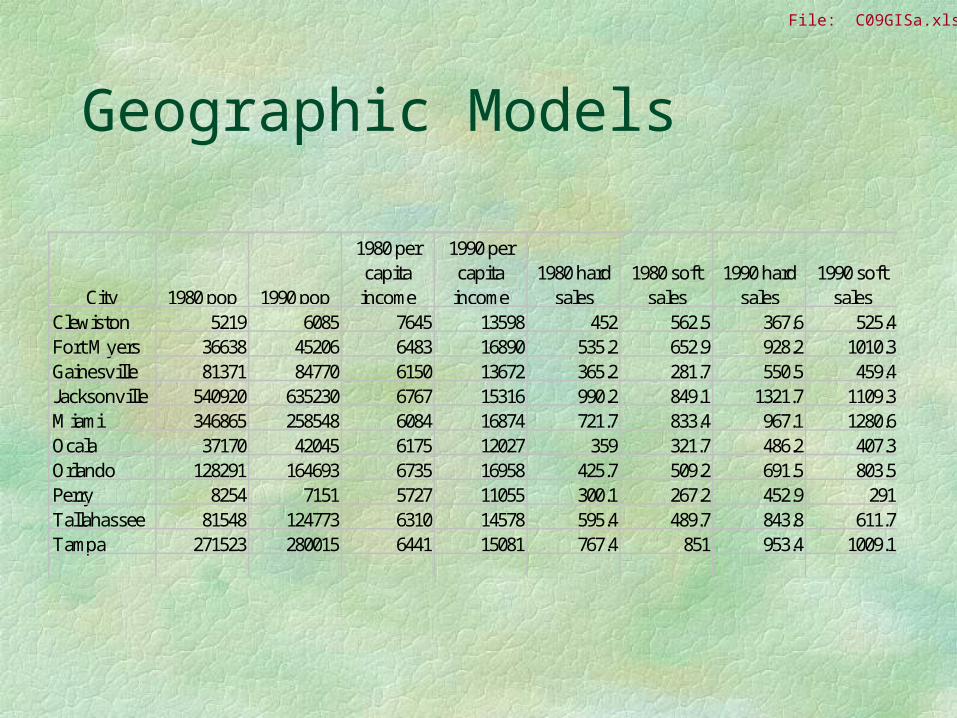
Geographic Models
City 1980 pop 1990 pop
1980 per capita income
1990 per capita income
1980 hard sales
1980 soft sales
1990 hard sales
1990 soft sales
Clewiston 5219 6085 7645 13598 452 562.5 367.6 525.4Fort Myers 36638 45206 6483 16890 535.2 652.9 928.2 1010.3Gainesville 81371 84770 6150 13672 365.2 281.7 550.5 459.4Jacksonville 540920 635230 6767 15316 990.2 849.1 1321.7 1109.3Miami 346865 258548 6084 16874 721.7 833.4 967.1 1280.6Ocala 37170 42045 6175 12027 359 321.7 486.2 407.3Orlando 128291 164693 6735 16958 425.7 509.2 691.5 803.5Perry 8254 7151 5727 11055 300.1 267.2 452.9 291Tallahassee 81548 124773 6310 14578 595.4 489.7 843.8 611.7Tampa 271523 280015 6441 15081 767.4 851 953.4 1009.1
File: C09GISa.xls
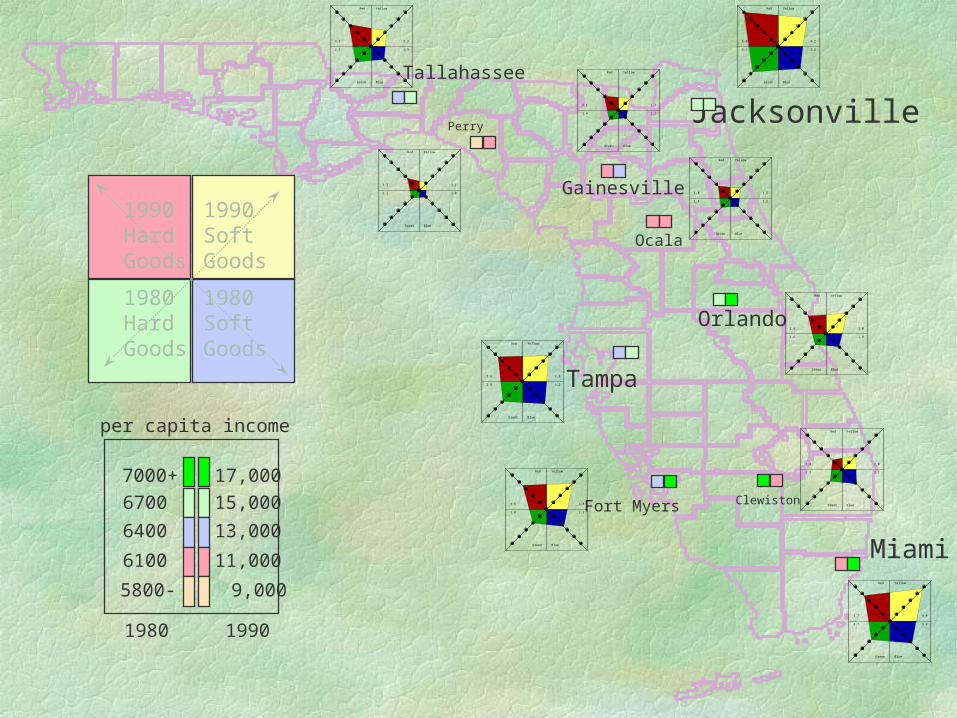
Tampa
Miami
Fort Myers
JacksonvilleTallahassee
Gainesville
Ocala
Orlando
Clewiston
Perry
7000+
6700
6400
6100
5800-
1980 1990
17,000
15,000
13,000
11,000
9,000
per capita income
Red
3.2
Yellow
2.3
Blue
1.9
Green
2.3
Red
1.7
Yellow
1.1
Blue
1.0
Green
1.1
Red
2.1
Yellow
1.7
Blue
1.1
Green
1.4
Red
5.0
Yellow
4.2
Blue
3.2
Green
3.7
Red
1.8
Yellow
1.5
Blue
1.2
Green
1.4
Red
2.6
Yellow
3.0
Blue
1.9
Green
1.6
Red
3.6
Yellow
3.8
Blue
3.2
Green
2.9
Red
3.5
Yellow
3.8
Blue
2.5
Green
2.0
Red
1.4
Yellow
2.0
Blue
2.1
Green
1.7
Red
3.7
Yellow
4.8
Blue
3.2
Green
2.7
1990HardGoods
1990SoftGoods
1980HardGoods
1980SoftGoods
Related Documents