Decision Trees built in Hadoop plus more Big Data Analytics with Revolution R Enterprise All Rights Reserved, Revolution Analytics 2014 Mario Inchiosa, US Chief Scientist [email protected] Revolution Webinar – April 17, 2014

Decision trees in hadoop
Sep 10, 2014
Fully featured, commercially supported machine learning suites that can build Decision Trees in Hadoop are few and far between. Addressing this gap, Revolution Analytics recently enhanced its entire scalable analytics suite to run in Hadoop. In this talk, I will explain how our Decision Tree implementation exploits recent research reducing the computational complexity of decision tree estimation, allowing linear scalability with data size and number of nodes. This streaming algorithm processes data in chunks, allowing scaling unconstrained by aggregate cluster memory. The implementation supports both classification and regression and is fully integrated with the R statistical language and the rest of our advanced analytics and machine learning algorithms, as well as our interactive Decision Tree visualizer.
Welcome message from author
This document is posted to help you gain knowledge. Please leave a comment to let me know what you think about it! Share it to your friends and learn new things together.
Transcript

All Rights Reserved, Revolution Analytics 2014
Decision Trees built in Hadoop plus more Big Data Analytics with Revolution R Enterprise
Mario Inchiosa, US Chief [email protected]
Revolution Webinar – April 17, 2014

2
OUR COMPANY
The leading providerof advanced analytics software and services
based on open source R, since 2007
OUR SOFTWARE
The only Big Data, Big Analytics software platform based on the data science
language R
SOME KUDOS
VisionaryGartner Magic Quadrantfor Advanced Analytics
Platforms, 2014

Typical Challenges our Customers Face
Big Data Many new data sources Data variety & velocity Data movement, memory limits
3
Production Efficiency Shorter model shelf life Volume of Models Long end-to-end cycle time Pace of decision accelerated
Enterprise Readiness Heterogeneous landscape Write once, deploy anywhere Skill shortage Production support
Complex Computation Mathematically sophisticated Parallelization Experimentation Ensemble models Many small models Simulation

Polling Question: What is your current analytics software platform?
– Please select one• R/RRE• SAS• SPSS• Tibco/Spotfire• KXEN• Other

OPEN SOURCE R

What is R?
Most widely used data analysis software• Used by 2M+ data scientists, statisticians and analysts
Most powerful statistical programming language• Flexible, extensible and comprehensive for productivity
Create beautiful and unique data visualizations• As seen in New York Times, Twitter and Flowing Data
Thriving open-source community• Leading edge of analytics research
Fills the talent gap• New graduates prefer R R is Hot
bit.ly/r-is-hot
WHITE PAPER

Exploding growth and demand for R R is the highest paid IT skill
– Dice.com, Jan 2014 R most-used data science language after SQL
– O’Reilly, Jan 2014 R is used by 70% of data miners
– Rexer, Sep 2013 R is #15 of all programming languages
– RedMonk, Jan 2014 R growing faster than any other data science
language– KDnuggets, Aug 2013
More than 2 million users worldwide
R Usage GrowthRexer Data Miner Survey, 2007-2013
70% of data miners report using R
R is the first choice of moredata miners than any other software
Source: www.rexeranalytics.com

REVOLUTION R
ENTERPRISE
THE BIG DATA BIG ANALYTICS PLATFORM

Revolution R Enterprise
High Performance, Scalable Analytics Portable Across Enterprise Platforms Easier to Build & Deploy Analytics
is….the only big data big analytics platform based on open source R
9

10
Big Data In-memory bound Hybrid memory & disk scalability
Operates on bigger volumes & factors
Speed of Analysis
Single threaded Parallel threading Shrinks analysis time
Enterprise Readiness
Community support Commercial support Delivers full service production support
Analytic Breadth & Depth
5000+ innovative analytic packages
Leverage open source packages plus Big Data ready packages
Supercharges R
R is open source and drives analytic innovation but….has some limitations for Enterprises

All of Open Source R plus: Big Data scalability High-performance analytics Development and deployment
tools Data source connectivity Application integration framework Multi-platform architecture Support, Training and Services
11
is the Big Data Big Analytics Platform

R+C
RA
NDistributedR
ScaleR
ConnectR
R+CRAN• Open source R interpreter
• UPDATED R 3.0.2• Freely-available R algorithms• Algorithms callable by RevoR• Embeddable in R scripts• 100% Compatible with existing
R scripts, functions and packages
RevoR• Performance enhanced R interpreter• Based on open source R• Adds high-performance math
Available On:• IBM® Platform LSFTM Clusters• Microsoft® HPC Clusters• Windows® & Linux Servers• Windows® & Linux Workstations• NEW Cloudera® Hadoop• NEW Hortonworks® Hadoop• NEW Teradata® Database• Intel® Hadoop• IBM® BigInsightsTM
• IBM® PureDataTM for Analytics, powered by Netezza technology
Rev
oR
DevelopR DeployR
12
The Platform Step by Step:R Capabilities

Revolution R Enterprise RevoRPerformance Enhanced R
OpenSource R
Revolution R Enterprise
Computation (4-core laptop) Open Source R Revolution R Speedup
Linear Algebra1
Matrix Multiply 176 sec 9.3 sec 18x
Cholesky Factorization 25.5 sec 1.3 sec 19x
Linear Discriminant Analysis 189 sec 74 sec 3x
General R Benchmarks2
R Benchmarks (Matrix Functions) 22 sec 3.5 sec 5x
R Benchmarks (Program Control) 5.6 sec 5.4 sec Not appreciable
1. http://www.revolutionanalytics.com/why-revolution-r/benchmarks.php2. http://r.research.att.com/benchmarks/
Customers report 3-50x performance improvements
compared to Open Source R — without changing any code
13

DistributedR• Distributed computing framework• Delivers portability across platforms
Rev
oR
DevelopR DeployR
R+C
RA
NDistributedR
ScaleR
ConnectR
ConnectR• High-speed data import/export
Available for:• High-performance XDF• SAS, SPSS, delimited & fixed format
text data files• Hadoop HDFS (text & XDF)• Teradata Database TPT• ODBC (incl. Vertica, Oracle, Pivotal,
Aster, SybaseIQ, DB2, MySQL)
ScaleR• Ready-to-Use high-performance
big data big analytics • Fully-parallelized analytics• Data prep & data distillation• Descriptive statistics & statistical
tests• Correlation & covariance matrices• Predictive Models – linear, logistic,
GLM• Machine learning• Monte Carlo simulation• NEW Tools for distributing
customized algorithms across nodes
DistributedR available on:• Windows Servers• Red Hat and NEW SuSE Linux Servers• IBM Platform LSF Linux Clusters• Microsoft HPC Clusters• NEW Cloudera Hadoop• NEW Hortonworks Hadoop• NEW Teradata Database 14
The Platform Step by Step:Parallelization & Data Sourcing

Rev
oR
R+C
RA
NDistributedR
ScaleR
ConnectR
DeployR• Web services software
development kit for integration analytics via Java, JavaScript or .NET APIs
• Integrates R Into application infrastructures
Capabilities:• Invokes R Scripts from
web services calls• RESTful interface for
easy integration• Works with web & mobile apps,
leading BI & Visualization tools and business rules engines
DevelopR• Integrated development
environment for R• Visual ‘step-into’ debugger
Available on:• Windows
DevelopR DeployR
15
The Platform Step by Step:Tools & Deployment

16
Scalable and Parallelized across Cores and Nodes
0010
COMPUTE NODE
COMPUTE NODE
MULTICORE PROCESSOR4, 8, 16+ CORES
EvaluateCOMPUTE NODE
COMPUTE NODE
0101
0010
1110
1100
01010
DATAPARTITION
BIG DATA
010101010010101001010010010010100101010101 011010
SHARED MEMORY
100101
101001
111000
01010101001001010011100100100101001010101010101010100100
Combine Intermediate
Results
MASTER NODE
CORE0THREAD 0
CORE01THREAD 1
CORE02THREAD 2
CORE03THREAD N
17
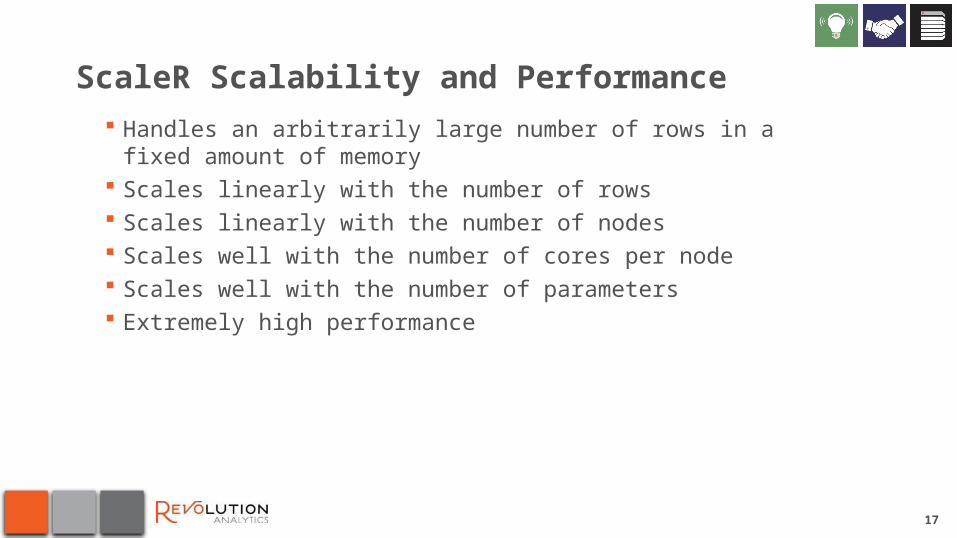
ScaleR Scalability and Performance Handles an arbitrarily large number of rows in a fixed amount of memory Scales linearly with the number of rows Scales linearly with the number of nodes Scales well with the number of cores per node Scales well with the number of parameters Extremely high performance

18
Unique PEMAs: Parallel, external-memory algorithms
High-performance, scalable replacements for R/SAS analytic functions
Parallel/distributed processing eliminates CPU bottleneck
Data streaming eliminates memory size limitations
Works with in-memory and disk-based architectures
Eliminates Performance and Capacity Limits of Open Source R and Legacy SAS


Rows of data 1 billion 1 billionParameters “just a few” 7
Time 80 seconds 44 secondsData location In memory On disk
Nodes 32 5Cores 384 20RAM 1,536 GB 80 GB
Revolution R is faster on the same amount of data, despite using approximately a 20 th as many cores, a 20th as much RAM, a 6th as many nodes, and not pre-loading data into RAM.
*As published by SAS in HPCwire, April 21, 2011See Revolution white paper for additional benchmarks.
Logistic Regression:
20
Revolution R Enterprise ScaleR Outperforms SAS HPA at a Fraction of the Cost

Specific speed-related factors Efficient computational algorithms Efficient memory management – minimize data copying and data
conversion Heavy use of C++ templates; optimal code Efficient data file format; fast access by row and column Models are pre-analyzed to detect and remove duplicate computations
and points of failure (singularities) Handle categorical variables efficiently
Revolution R Enterprise 21

Scalability and portability of Revolution Analytics “Parallel External Memory Algorithms” (PEMAs)
Anatomy of a PEMA: 1) Initialize, 2) Process Chunk,3) Aggregate, 4) Finalize
Process a chunk of data at a time, giving linear scalability Process an unlimited number of rows of data in a fixed
amount of RAM Independent of the “compute context” (number of cores,
computers, distributed computing platform), giving portability across these dimensions
Independent of where the data is coming from, giving portability with respect to data sources
Revolution R Enterprise 22

Simplified ScaleR Internal Architecture
Revolution R Enterprise 23
Analytics EnginePEMA’s are implemented here
(Scalable, Parallelized, Threaded, Distributable)
Inter-process CommunicationMPI, RPC, Sockets, Files, UDFs
Data SourcesHDFS, Teradata, ODBC, SAS, SPSS,
CSV, Fixed, XDF
R+C
RA
N
Rev
oR
DistributedR
ScaleR
ConnectR
DeployRDevelopR
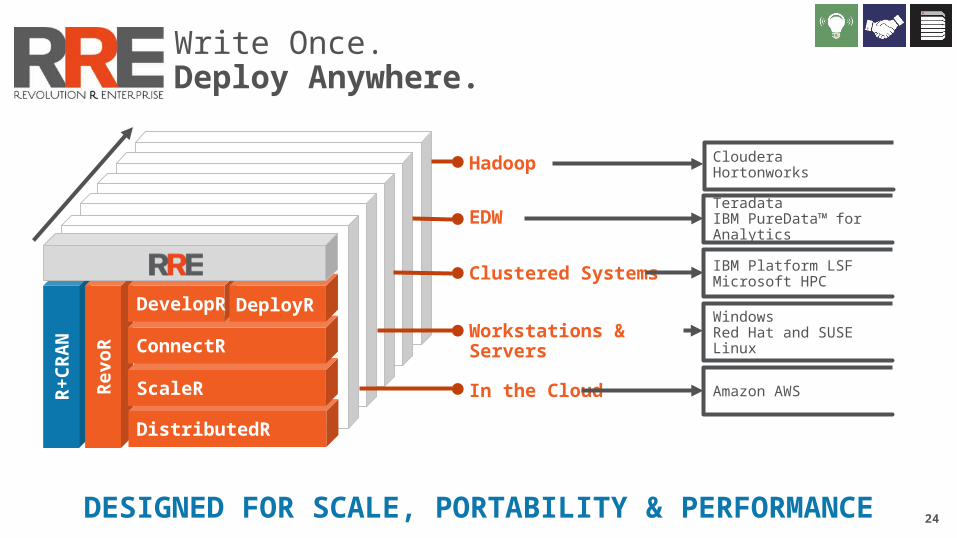
DESIGNED FOR SCALE, PORTABILITY & PERFORMANCE
In the Cloud Amazon AWS
Workstations & Servers WindowsRed Hat and SUSE Linux
Clustered Systems IBM Platform LSFMicrosoft HPC
EDW Teradata IBM PureData™ for Analytics
Hadoop Cloudera Hortonworks
24
Write Once.Deploy Anywhere.

Decision Trees– Easy-to-interpret models – Widely used in a variety of disciplines. For example,
Predicting which patient characteristics are associated with high risk of, for example, heart attack.
Deciding whether or not to offer a loan to an individual based on individual characteristics.
Predicting the rate of return of various investment strategiesRetail target marketing
Can handle multi-level factor response easily Useful in identifying important interactions
Revolution R Enterprise 25

Decision Tree Types Classification tree: predict what ‘class’ or ‘group’ an
observation belongs to (dependent variable is a factor) Regression tree: predict the value of a continuous
dependent variable
Revolution R Enterprise 26

27
Polling Question: What is your “go-to” tree algorithm for predictions in your work?
– Please select one answer• Single Trees • Random Forests• It Depends• Neither

Classification Example: Marketing ResponseData set containing the following information: Response: Was response to a phone call, email, or mailing? Age Income Marital status Attended college?
Revolution R Enterprise 28

Estimating the modeltreeOut <- rxDTree(response ~ age + income + college + marital,data = rdata)
Revolution R Enterprise 29

Simple Example: Text Output– Information on the split, the number of observations in the node,
the “loss”, the predicted value, and the probabilities
1) root 10000 4069 Email (0.33260000 0.59310000 0.07430000)
2) college=No College 5074 2378 Phone (0.53133622 0.38943634 0.07922743)
4) age>=39.5 2518 330 Phone (0.86894361 0.00000000 0.13105639)
8) age< 64.5 2256 77 Phone (0.96586879 0.00000000 0.03413121) *
9) age>=64.5 262 9 Mail (0.03435115 0.00000000 0.96564885) *
5) age< 39.5 2556 580 Email (0.19874804 0.77308294 0.02816901)
10) marital=Single 835 371 Phone (0.55568862 0.40958084 0.03473054)
20) income>=29.5 472 14 Phone(0.97033898 0.00000000 0.02966102) *
21) income< 29.5 363 21 Email(0.01652893 0.94214876 0.04132231) *
11) marital=Married 1721 87 Email(0.02556653 0.9494480 .02498547) *
3) college=College 4926 971 Email (0.12789281 0.80288266 0.06922452) …
Revolution R Enterprise 30

Interactive HTML Graphics
Revolution R Enterprise 31

The ‘Big Data’ Decision Tree Algorithm Classical algorithms for building a decision tree sort all
continuous variables in order to decide where to split the data. This sorting step becomes prohibitive when dealing with large
data. rxDTree bins the data rather than sorting, computing
histograms to create empirical distribution functions of the data rxDTree partitions the data “horizontally”, processing in parallel
different subsets of the observations The accuracy of the parallel tree approximately equals that of
the serial tree (Ben-Haim & Tom-Tov, 2010)
Revolution R Enterprise 32

Useful rxDTree Arguments for Big Data maxDepth: maximum tree depth minBucket: minimum number of observations in a terminal node
minSplit: minimum number of observations needed to split cp: minimum fit improvement needed to accept a split
maxNumBins: maximum number of bins used to bin numeric data
Revolution R Enterprise 33

34
Related Decision Tree Functions prune.rxDTree – model simplification rxDTreeBestCp – optimizes pruning rxAddInheritance – makes rxDTree compatible with rpart for printing
and plotting createTreeView – interactive HTML graphics rxPredict.rxDTree – scores new data using rxDTree model
rxDForest – Ensembles of Decision Trees – big data alternative to randomForest package
rxVarImpPlot – plots variable importance as measured by rxDForest rxPredict.rxDForest – scores new data using rxDForest model

Sample code for Decision Trees on workstation
# Specify local data sourceairData <- myLocalDataSource
# Specify model formula and parametersrxDTree( ArrDelay ~ Origin + Year + Month + DayOfWeek + UniqueCarrier + CRSDepTime, data=airData )
35

Sample code for Decision Trees on Hadoop# Change the “compute context”rxSetComputeContext(myHadoopCluster)
# Change the data source if necessaryairData <- myHadoopDataSource
# Otherwise, the code is the samerxDTree( ArrDelay ~ Origin + Year + Month + DayOfWeek + UniqueCarrier + CRSDepTime, data=airData )
36

Write Once Deploy Anywhere
rxSetComputeContext("local") # DEFAULT
rxSetComputeContext(RxHadoopMR(<data, server environment arguments>))
# Summarize and calculate descriptive statisticsadsSummary <- rxSummary(~ArrDelay+CRSDepTime+DayOfWeek, data = airDS)
# Fit Linear Model arrDelayLm1 <- rxLinMod(ArrDelay ~ DayOfWeek, data = airDS)
rxSetComputeContext(RxHpcServer(<data, server environment arguments>))
rxSetComputeContext(RxLsfCluster(<data, server environment arguments>))
Same code to be run anywhere …..
Local System
Set the desired compute context for data analytics execution…..
rxSetComputeContext(RxInTeradata(<data, server environment arguments>))

38
Polling Question: What platforms are you most interested in running tree models on your
data?– Please select all that apply
• Server• Grid• Hadoop• Teradata• Other

Revolution R Enterprise ScaleR: High Performance Big Data Analytics
Data Prep, Distillation & Descriptive Analytics
R Data Step DescriptiveStatistics
StatisticalTests Sampling
Data import – Delimited, Fixed, SAS, SPSS, ODBC
Variable creation & transformation using any R functions and packages
Recode variables Factor variables Missing value handling Sort Merge Split Aggregate by category (means,
sums)
Min / Max Mean Median (approx.) Quantiles (approx.) Standard Deviation Variance Correlation Covariance Sum of Squares (cross product
matrix for set variables) Pairwise Cross tabs Risk Ratio & Odds Ratio Cross-Tabulation of Data
(standard tables & long form) Marginal Summaries of Cross
Tabulations
Chi Square Test Kendall Rank Correlation Fisher’s Exact Test Student’s t-Test
Subsample (observations & variables)
Random Sampling

Revolution R Enterprise ScaleR (continued)
Statistical Modeling Machine Learning
PredictiveModels
Covariance/Correlation/Sum of Squares/Cross-product Matrix
Multiple Linear Regression Logistic Regression Generalized Linear Models (GLM)
- All exponential family distributions: binomial, Gaussian, inverse Gaussian, Poisson, Tweedie. Standard link functions including: cauchit, identity, log, logit, probit. - User defined distributions & link functions.
Classification & Regression Trees and Forests
Residuals for all models
Histogram ROC Curves (actual data and
predicted values) Lorenz Curve Line and Scatter Plots NEW Tree Visualization
DataVisualization
VariableSelection
Stepwise Regression Linear NEW logistic NEW GLM
Monte Carlo Run open source R
functions and packages across cores and nodes
ClusterAnalysis K-Means
Classification
Decision Trees NEW Decision Forests
Prediction (scoring) NEW PMML Export
Simulationand HPC
Deployment

41
Resources For You Big Data Decision Trees with R
– http://www.revolutionanalytics.com/whitepaper/big-data-decision-trees-r Advanced, Big Data Analytics with R and Hadoop
– http://www.revolutionanalytics.com/whitepaper/advanced-big-data-analytics-r-and-hadoop
Revolution R Enterprise: Faster than SAS– http://
www.revolutionanalytics.com/whitepaper/revolution-r-enterprise-faster-sas May 13, 2014 – Webinar presenting the results of our RRE vs. SAS
benchmarking To Get RRE for yourself, please visit:
– http://www.revolutionanalytics.com/get-revolution-r-enterprise

42

Thank youRevolution Analytics is the leading commercial provider of software and support for the popular open source R statistics language.
mario.inchiosa@revolutionanalytics.comwww.revolutionanalytics.com, 1.855.GET.REVO, Twitter: @RevolutionR
43
Related Documents