Decision tree approach for classification of remotely sensed satellite data using open source support Richa Sharma, Aniruddha Ghosh and P K Joshi ∗ Department of Natural Resources, TERI University, New Delhi 110 070, India. ∗ Corresponding author. e-mail: [email protected] In this study, an attempt has been made to develop a decision tree classification (DTC) algorithm for classification of remotely sensed satellite data (Landsat TM) using open source support. The decision tree is constructed by recursively partitioning the spectral distribution of the training dataset using WEKA, open source data mining software. The classified image is compared with the image classified using classical ISODATA clustering and Maximum Likelihood Classifier (MLC) algorithms. Classification result based on DTC method provided better visual depiction than results produced by ISODATA clustering or by MLC algorithms. The overall accuracy was found to be 90% (kappa = 0.88) using the DTC, 76.67% (kappa = 0.72) using the Maximum Likelihoodand 57.5% (kappa = 0.49) using ISODATA clustering method. Based on the overall accuracy and kappa statistics, DTC was found to be more preferred classification approach than others. 1. Introduction Research using remotely sensed satellite data has attracted attention on image classification because classification results are basis for interpretation, analysis and modelling for various environmen- tal and socio-economic applications (Jensen and Cowen 1999). Researchers have made efforts in developing and applying various classification approaches and techniques (Lu and Weng 2007) with the objectives of identifying representative spectral values (Shaw and Burke 2003; Jensen 2005), mapping more number of classes like (Anderson et al. 1976; Gregorio and Jansen 2000) represent- ing real-time land use land cover (LULC) map and improving classification accuracy (Aguirre-Guti´ errez et al. 2012) and others. Still, classification of remotely sensed satellite data into a thematic map remains a challenge. This is attributed to many factors including geometry of satellite and source of illumination, terrain characteristics (Dorren et al. 2003; Balthazar et al. 2012), time and season of image capture (Moody and Strahler 1994) and many others. Satellite data classification is a method by which labels or class identifiers are attached to individ- ual pixels on the basis of their spectral charac- teristics in various bands. Traditional classification procedures like maximum likelihood classifier (MLC) are generally based on statistical parame- ters such as mean and standard deviation. These classifiers are generally characterized by having an explicit underlying probability model, which pro- vides a probability measure of any pixel in each class rather than simply a class value. Some of the other common classification algorithm include the nearest neighbours (NN or kNN), minimum dis- tance to means, ISODATA (Mather 2004; Lillesand Keywords. Remote sensing; image classification; decision tree classifier (DTC); maximum likelihood classifier (MLC); ISODATA. J. Earth Syst. Sci. 122, No. 5, October 2013, pp. 1237–1247 c Indian Academy of Sciences 1237

Welcome message from author
This document is posted to help you gain knowledge. Please leave a comment to let me know what you think about it! Share it to your friends and learn new things together.
Transcript
Decision tree approach for classification of remotelysensed satellite data using open source support
Richa Sharma, Aniruddha Ghosh and P K Joshi∗
Department of Natural Resources, TERI University, New Delhi 110 070, India.∗Corresponding author. e-mail: [email protected]
In this study, an attempt has been made to develop a decision tree classification (DTC) algorithm forclassification of remotely sensed satellite data (Landsat TM) using open source support. The decisiontree is constructed by recursively partitioning the spectral distribution of the training dataset usingWEKA, open source data mining software. The classified image is compared with the image classifiedusing classical ISODATA clustering and Maximum Likelihood Classifier (MLC) algorithms. Classificationresult based on DTC method provided better visual depiction than results produced by ISODATAclustering or by MLC algorithms. The overall accuracy was found to be 90% (kappa = 0.88) using theDTC, 76.67% (kappa = 0.72) using the Maximum Likelihood and 57.5% (kappa = 0.49) using ISODATAclustering method. Based on the overall accuracy and kappa statistics, DTC was found to be morepreferred classification approach than others.
1. Introduction
Research using remotely sensed satellite data hasattracted attention on image classification becauseclassification results are basis for interpretation,analysis and modelling for various environmen-tal and socio-economic applications (Jensen andCowen 1999). Researchers have made efforts indeveloping and applying various classificationapproaches and techniques (Lu and Weng 2007)with the objectives of identifying representativespectral values (Shaw and Burke 2003; Jensen 2005),mapping more number of classes like (Andersonet al. 1976; Gregorio and Jansen 2000) represent-ing real-time land use land cover (LULC) map andimproving classification accuracy (Aguirre-Gutierrezet al. 2012) and others. Still, classification ofremotely sensed satellite data into a thematic mapremains a challenge. This is attributed to many
factors including geometry of satellite and sourceof illumination, terrain characteristics (Dorrenet al. 2003; Balthazar et al. 2012), time and seasonof image capture (Moody and Strahler 1994) andmany others.
Satellite data classification is a method by whichlabels or class identifiers are attached to individ-ual pixels on the basis of their spectral charac-teristics in various bands. Traditional classificationprocedures like maximum likelihood classifier(MLC) are generally based on statistical parame-ters such as mean and standard deviation. Theseclassifiers are generally characterized by having anexplicit underlying probability model, which pro-vides a probability measure of any pixel in eachclass rather than simply a class value. Some of theother common classification algorithm include thenearest neighbours (NN or kNN), minimum dis-tance to means, ISODATA (Mather 2004; Lillesand
Keywords. Remote sensing; image classification; decision tree classifier (DTC); maximum likelihood classifier (MLC);
ISODATA.
J. Earth Syst. Sci. 122, No. 5, October 2013, pp. 1237–1247c© Indian Academy of Sciences 1237
1238 Richa Sharma et al.
et al. 2007). The performance of this type of cla-ssifier depends on how well the data matchthe pre-defined model (Jensen). These modelsgenerally fail to give the desired output if the dataare complex. In order to overcome such problems,more advanced classifiers like artificial neural net-works (Pu et al. 2008), fuzzy classifier (Feitosaet al. 2009; Thapa and Murayama 2009), imagesegmentation (Gamanya et al. 2007, 2009), expertclassification (Stefanov et al. 2001; Wentz et al.2008), support vector machines (Carraa et al.2008) and many others are increasingly beingused. Most of these techniques do not make anya priori assumption about the data distribution,hence are essentially non-parametric in nature.Decision Tree classification (DTC) is one such tech-nique which is very effective and useful for theremote sensing community for LULC classifica-tion (Punia et al. 2011). This is intuitive, simple,flexible, and efficient in computing (Friedman1977) non-normal, non-homogenous and noisy dataas well as non-linear relation between featuresand classes, missing value, and both numeric andcategorical inputs (Quinlan 1993). This has ledto increased acceptance (Quinlan 1993; Pal andMather 2003).
Otukei and Blaschke (2010) advocated the use ofopen source data mining software, such as WEKA,for creating the decision boundaries instead ofapplying expert human knowledge. They alsoargued that use of automated data mining sys-tem can overcome the problem of disagreementbetween the decision boundaries proposed by vari-ous experts. In this study, open source remote sens-ing datasets and data mining software support forLULC classification have been explored. The mainobjectives pursued are: (1) to develop a DTC algo-rithm for remotely sensed satellite data using opensource datasets, (2) to compare the performanceof the DTC, ISODATA and MLC using standardmeasures of accuracy assessment.
2. Decision tree classifier
The idea of using decision trees to identify andclassify objects was first reported by Hunt et al.(1996). It was inspired by Automatic InteractionDetection (AID) program (Morgan and Sonquist1963) and successfully followed by the Chi -squaredAutomatic Interaction Detector (CHAID) (Morganand Messenger 1973). Later, induction of DecisionTree (ID3) software package (Quinlan 1975), Clas-sification and Regression Trees (CART) (Breimanet al. 1984), C4.5 (Quinlan 1993), and ObliqueClassifier (OC1) package (Murthy et al. 1994) weredeveloped. These are non-parametric classifiers.
Decision tree classification techniques have beenused successfully for a wide range of classifica-tion problems, but only recently been tested indetail by the remote sensing community (Friedland Brodley 1997; Pal and Mather 2003; Kandrikaand Roy 2008; Wen et al. 2008). Several studieshave compared DTC methods with other classi-fiers. Otukei and Blaschke (2010) compared deci-sion tree, maximum likelihood and support vectormachine based techniques for land cover changeassessment using Landsat TM and ETM+ dataand found decision tree based methods performedbetter than others. Punia et al. (2011) used C5.0based decision tree classifiers to classify IRS-P6AWiFS data and reported very high accuracy. Duroet al. (2012) compared decision tree, support vec-tor and random forest methods for the classifica-tion of agricultural landscapes using SPOT-5 HRGimagery in both pixel and object oriented domainand found for the specific case study, all the algo-rithms equally performed. Many of the studies con-centrated on improving the accuracy of DTC usingadvanced algorithms and incorporating ancillarydatasets. Evrendilek and Gulbeyaz (2011) usedboosted decision tree classifications for mappingLULC from MODIS satellite images, climate andtopographic data. Possibility of incorporating var-ious types of data sources under a single classi-fier framework has proved to be advantageous inusing DTC. Researchers have used DTC for conti-nental to global land cover classification problemswith improved accuracy (Friedl et al. 1999; Hansenet al. 2000).
The construction of decision tree requires super-vised training; therefore it is necessary to havea training dataset consisting of response andexplanatory variables. In classification problemsinvolving remote sensing dataset, the response vari-ables are generally LULC classes and explanatoryvariables are spectral bands or information derivedfrom these. The classification structure defined by adecision tree is estimated from training data usinga statistical procedure. The ‘tree’ is made of a rootnode, internal nodes and leaves. Nodes are wheretrees branch or split the dataset; terminal nodesare called leaves which contain most homogeneousclasses. If in a training set T , there is k number ofclasses (C) and a total of |T | cases, the expectedinformation from such a system is,
info (T ) = −K∑
j−1
freq (Cj, T )|T | log2
(freq (Cj, T )
|T |
)
where, freq(Cj,T )
|T | is the probability of occurrence ofclass Cj in training set T . If we partition the train-ing set T in accordance with any response variableX (e.g., NDVI), there may be ‘n’ number of cases.
Decision tree approach for classification of remotely sensed satellite data 1239
The expected information after this partition isweighted sum over the subsets as:
infox (T ) = −n∑
i=1
|Ti||T | info (Ti).
The information gain by portioning training setfollowing variable X (NDVI) is
gain (T ) = info (T ) − infox (T ) .
The gain criterion selects a test (on the basis ofthe explanatory variables) to maximize the infor-mation gain. But this has a strong bias, favouringthe tests with many outcomes. This is rectified byintroducing gain ratio (X), defined as:
gain ratio (X) = gain (X)/split info (X)
where, split info (X) is the potential informationgenerated by dividing T into n subsets, which isnot relevant to classification and is given by:
split info (X) = −n∑
i=1
|Ti||T | log2
(|Ti||T |
).
Gain ratio represents the proportion of usefulinformation for classification created due to thesplit. The experiment (on the basis of explanatoryvariables) which maximizes the ratio, subject tothe constraint of large information gain is selected.Training samples (root node) are partitioned fol-lowing the mentioned condition to create branches.At some node, sample distribution in each groupbecomes uniform, i.e., only one type of LULC classis present in each group and hence information con-tent is largest. These are defined as ‘leaves’ (pureclasses). Additional details can be found in Quinlan(1993). In this study, an open source Java imple-mentation of the C4.5 algorithm in the WEKAdata mining tool, known as J48 was used.
3. Materials and methods
3.1 Study area
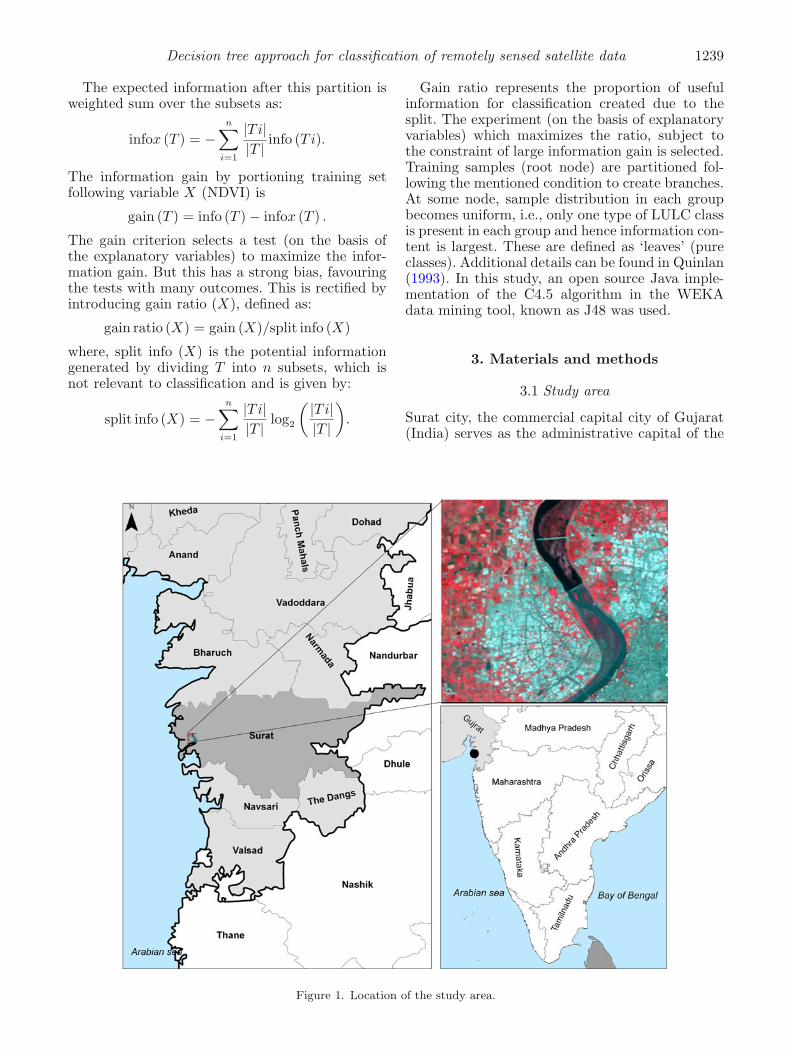
Surat city, the commercial capital city of Gujarat(India) serves as the administrative capital of the
Figure 1. Location of the study area.
1240 Richa Sharma et al.
Surat district. The city is also called the ‘Dia-mond City’, and is situated on the banks of Tapiriver which perennially flows northeast to south-west finally joining the Arabian Sea. The city islocated at 21.25◦N and 72.87◦E (figure 1). Theregion experiences hot summers with tempera-tures ranging from 38◦ to 45◦C. Winters are mildwith temperature in the month of January vary-ing between 10◦ and 15.5◦C. The average annualrainfall is 1143 mm (www.suratmunicipal.gov.in).Being a commercial hub, the region has witnessedtremendous urbanization over past few decades.It ranks 36th in the list of world’s largest citieswith population over 2.5 million (population den-sity of 1376 persons/km2) (Census of India 2011)and third cleanest metropolitan region in India.Surat has immense business and job opportuni-ties that trigger high immigration rates to the cityresulting in increased population. The study areaextends spatially from 21.29◦–21.12◦N to 72.74◦–72.94◦E, spanning across 386.28 km2 covering thecity (city limits of 326 km2) and the peripheralagricultural fields along with part of the Tapi river.The study area mainly falls in the Chorasi talukof Surat district but also covers parts of adjoin-ing taluks of Olpad in north, Kamrej in east andPalsana in south-east.
3.2 Remote sensing data
Landsat5 Thematic Mapper (TM) sensor systemwas launched on March 1, 1984. It operates in fourspectral bands in VNIR region; Band1 (blue, 0.45–0.52 μm), Band2 (green, 0.52–0.60 μm), Band3(red, 0.63–0.69 μm), Band4 (NIR, 0.76–0.90 μm))and two bands in MIR (Band5, 1.55–1.75 μm andBand7, 2.08–2.35 μm) and one band is thermal(Band6, 10.4–12.5 μm). With a GIFOV of 30 m ×30 m for bands 1 through 5 and 7 and 120 m ×120 m for band 6, Landsat TM provides tempo-ral resolution of 16 days. The USGS offers nearlycloud free ortho-rectified data in GeoTIFF for-mat. TM satellite image (Path/Row: 148/45) dated
23 October 2009 (figures 1 and 4a) was used forthe study. The geometrically and radiometricallycorrected image rectified to a common UniverseTransverse Mercator (UTM) was procured fromthe USGS Earth Resource Observation Systems(EROS) Data Center.
3.3 Classification
Classification of remotely sensed data is one of theprimary steps for information extraction. This isdone using various classification techniques thatcould be parametric, or non-parametric, hard orsoft. These techniques are used to assign one ofthe various classes to each pixel based on its spec-tral response. In this paper three classificationmethods were used; ISODATA (Iterative Self-Organizing Data Analysis) Clustering, MLC andDTC to map out six classes based on classificationscheme (table 1) using each technique.
The satellite data was clustered into 50 classesusing ISODATA with six iterations and 0.95convergence threshold. These clusters were thenassigned to one of the six land use categories iden-tified and were merged to achieve unsupervisedclassification.
Another classification technique applied wassupervised classification using MLC. This methodcalculates the probability of a pixel belonging toeach of the classes under consideration. Basedon the maximum probability, the pixel is thenassigned a class. The probability that x will fallunder a particular class w, is given by:
p (x|wi) =1(
σi
√2π
) exp[−(x − μi)2/(2σ)2i ].
The decision tree classification was performedusing WEKA. The image was converted into ASCIIformat and was then used to perform DT classi-fication. An important step of DT classification isrules, generation which is explained in the follow-ing section. Decision rule set was generated using
Table 1. Classification scheme.
Land use class Description
Built-up (dense) Area with high density of built-up land use.
Built-up (sparse) Areas with relatively less density of built-up, could be
interspersed by vegetation or open area or other land use.
Agriculture Land under cropping, also includes plantation areas.
Fallow Agricultural land but is currently fallow due to harvest.
Water (deep) Water bodies that are natural like river or ponds;
or artificial water storage tanks etc.
Water (shallow) Land that is under water but is shallow or highly turbid,
also river beds that are submerged under shallow water.
Decision tree approach for classification of remotely sensed satellite data 1241
training sets in WEKA J48 classifier. WEKA is anopen source data mining software that has a collec-tion of machine learning algorithms for data miningtasks. The algorithms can either be applied directlyto a dataset or can be called from a Java code.It has various tools for data pre-processing, clas-sification, regression, clustering, association rules,and visualization. The J48 decision tree algorithmavailable with WEKA has been used for train-ing the Landsat TM dataset (Quinlan 1993). Theoutput rule sets along with the trial classificationresults were examined for their confidence levelsand accuracies. Based on these results, the trainingsites were modified wherever necessary till reliabletraining sets are obtained, and good classificationaccuracies (based on Kappa statistics and overallaccuracy) were achieved. The rule set with high-est accuracy was used to classify entire dataset inWEKA using J48 classifier. The image was classi-fied into six land use classes using training fromsignature dataset consisting of 644 training pix-els of which 8% were for deep water, 9% werefor shallow water, 11% were for sparse and densebuilt-up each, 19% for agriculture and rest 42% forfallow land.
3.3.1 Classification performance analysis
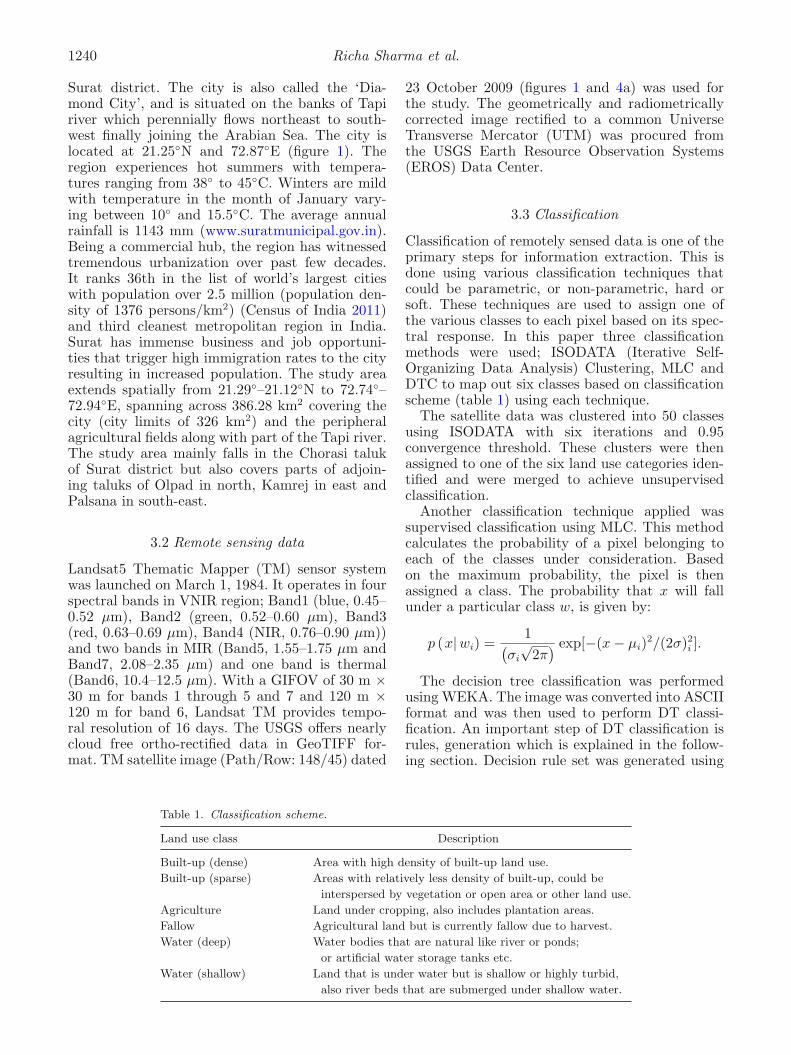
Classification performance is dependent upon fourcrucial factors; class separability, training samplesize, dimensionality and classifier type. Class sep-arability was studied using the Transform Diver-gence (TD) test. The test works by assigningexponentially decreasing weight to increasing dis-tance between the classes. The results range from0 to 2000. Classes exhibit good separability, if TDtest value is greater than 1900, if value is between1700 and 1900 the separation is fair and it ispoor for values below 1700. Additionally featurespace plot was analysed to evaluate the trainingsets.
Accuracy assessment measures the classifica-tion performance based on different classifiers.Independent ground sample points, uniformly dis-tributed throughout the study area, were collectedfrom satellite data and fine resolution Google
Earth images. Statistically valid sampling strategywas adopted to assess commission, omission andoverall accuracy (Stehman 1996). A set of LULCinformation collected in this method was used foraccuracy assessment. Cover type information ofthese locations was compared with the classified map.
4. Results and discussion
4.1 Class separability
Class separability was performed through TD testand feature space plot. TD test was performed inERDAS and the results show that classes are highlyseparable with each pair showing TD test value of2000 which is the maximum value (table 2).
The feature space plot (figure 2) was constructedto further analyse the separability of classes. Thefeature plot further complemented the observationthat most of the classes could be separated fromeach other. But feature plot also demonstrated that
Figure 2. Feature space plot NIR vs. red band.
Table 2. Transformed divergence test results among different class pairs.
Sparse Deep Shallow
built-up Agriculture Fallow water water
Dense built-up 2000 2000 2000 2000 2000
Sparse built-up 2000 2000 2000 2000
Agriculture 2000 2000 2000
Fallow 2000 2000
Deep water 2000
1242 Richa Sharma et al.
major overlap exists for shallow water and fallowclass, and some overlap was observed betweensparse and dense built-up classes.
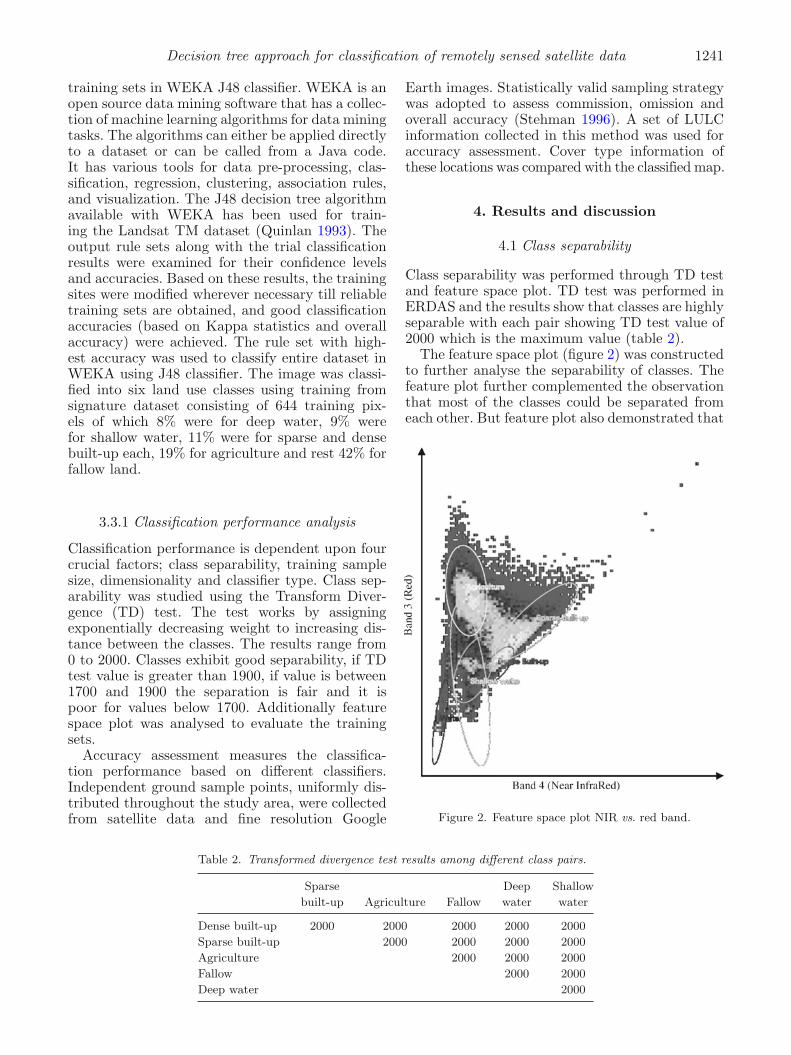
4.2 Decision tree
Decision tree generated using WEKA J48 classifi-cation algorithm is shown in figure 3. The impor-tant parameters of the algorithm along with theirstatus in this study are described in table 3.The pruned tree is modelled in 0.17 seconds with
97.82% correctly classified instances. The decisiontree classifies water (deep and shallow), built-up(sparse and dense), agricultural area and fallowlands.
B4 (NIR) is the band used for initial binary split-ting of the image, which is subsequently supportedby B2 (green). In the first node, B4 (NIR) and B2(green) are used to segregate agriculture and densebuilt-up from other classes. The second node usesB1 (blue), B4 (NIR), and B7 (mid-IR) to segre-gate water (deep), fallow and sparse built-up (or
Figure 3. The pruned decision tree generated in WEKA.
Table 3. Explanation of WEKA J48 parameters.
Parameter Description Status
Binary splits Whether to use binary splits at each node to built Used
the decision tree
Confidence factor The confidence factor used for pruning; smaller 0.25
confidence factor implies more pruning; the default
value is 0.25
Number of objects Minimum number of instances (sample) per leaf; 5
if less number of samples are present in one leaf
than the assigned value, the leaf will not be
considered as a class
Number of folds Determines the amount of data used for reduced Value set to 6;
error pruning; one fold is used for pruning, rest is 1 fold is used
used for growing the tree for pruning and 5
fold is used for
growing the tree
Size of tree Number of nodes 25
Number of leaves This is same as number of rules 13
Decision tree approach for classification of remotely sensed satellite data 1243
less dense). B1 (blue), B2 (green) and B4 (NIR) arefound useful in extracting shallow water class. B5(mid-IR) was not found significant to differentiateamong the classes.
4.3 Evaluation of training sets
Evaluation of sample pixels is crucial as trainingdata is found to significantly influence classifica-tion performance. Accuracy of decision rules forinstance is influenced by accuracy of training sitecharacteristics. Too few or too many training pixelsfor a particular class may result in over- or under-estimation of that particular class in final outputs.Differences in training strategies can result in dif-ferential classification accuracies and results (Chenand Stow 2002). Thus, sample data evaluation isdone using WEKA.
Table 4. Evaluation parameters for classification.
Parameter Value
Correctly classified instances 97.82%
Incorrectly classified instances 2.18%
Kappa statistic 0.97
Mean absolute error 0.01
Root mean squared error 0.07
Relative absolute error 4.82%
Root relative squared error 21.95%
Coverage of cases (0.95 level) 99.53%
Mean rel. region size (0.95 level) 17.98
Tables 4–6 provide evaluation of the trainingdata for the rule generation and details of rulesgenerated and rules used for classification. Sam-pling accuracy is 97.82% with a kappa of 0.97(table 4).
Table 5 is the confusion matrix for classified sam-ple data, representing a measure of accuracy foreach class. All classes except deep water and fallowshow 100% accuracy. Producer accuracy for fallowis 99.3% and that for deep water is 76.1%. Whilethe training data for two classes show user accuracyof 96% and 95.6% respectively.
Since, overall sampling accuracy has disadvan-tage of not being sensitive to class distribution,ROC area or AUC (Area Under Curve) is oftencited as more important criteria to judge the accu-racy of training datasets. ROC area for this studyfor each class is observed to be high ranging from0.98 to 1 (table 6).
4.4 Classification results
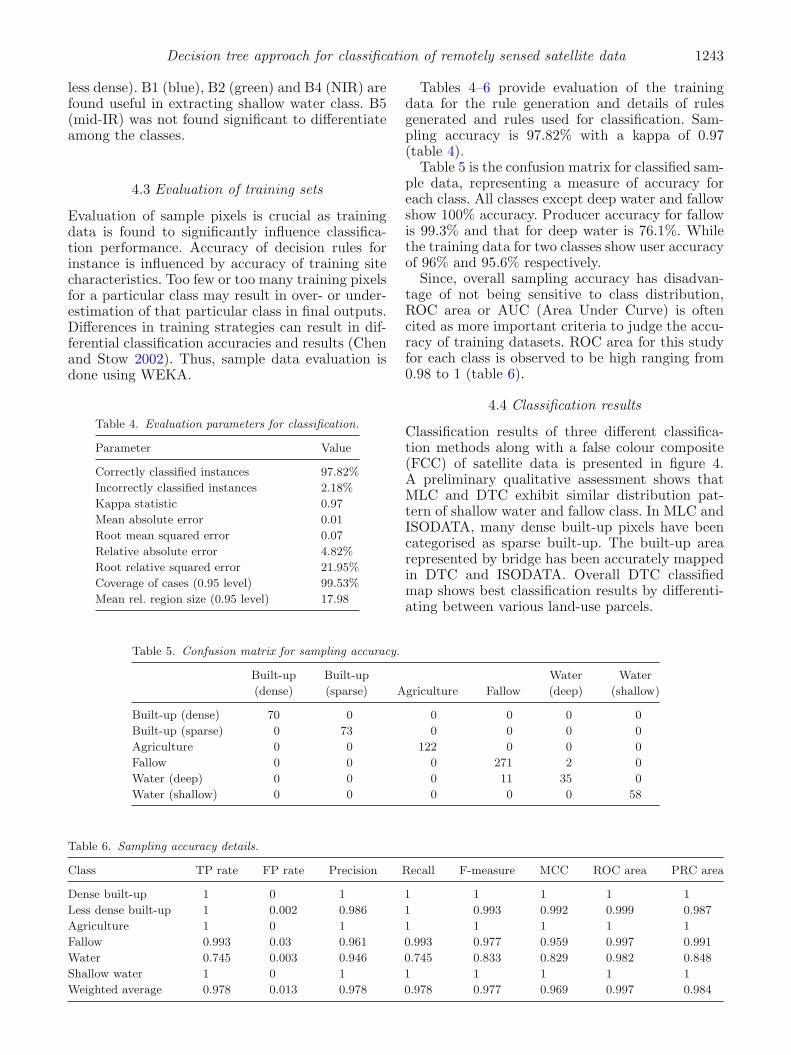
Classification results of three different classifica-tion methods along with a false colour composite(FCC) of satellite data is presented in figure 4.A preliminary qualitative assessment shows thatMLC and DTC exhibit similar distribution pat-tern of shallow water and fallow class. In MLC andISODATA, many dense built-up pixels have beencategorised as sparse built-up. The built-up arearepresented by bridge has been accurately mappedin DTC and ISODATA. Overall DTC classifiedmap shows best classification results by differenti-ating between various land-use parcels.
Table 5. Confusion matrix for sampling accuracy.
Built-up Built-up Water Water
(dense) (sparse) Agriculture Fallow (deep) (shallow)
Built-up (dense) 70 0 0 0 0 0
Built-up (sparse) 0 73 0 0 0 0
Agriculture 0 0 122 0 0 0
Fallow 0 0 0 271 2 0
Water (deep) 0 0 0 11 35 0
Water (shallow) 0 0 0 0 0 58
Table 6. Sampling accuracy details.
Class TP rate FP rate Precision Recall F-measure MCC ROC area PRC area
Dense built-up 1 0 1 1 1 1 1 1
Less dense built-up 1 0.002 0.986 1 0.993 0.992 0.999 0.987
Agriculture 1 0 1 1 1 1 1 1
Fallow 0.993 0.03 0.961 0.993 0.977 0.959 0.997 0.991
Water 0.745 0.003 0.946 0.745 0.833 0.829 0.982 0.848
Shallow water 1 0 1 1 1 1 1 1
Weighted average 0.978 0.013 0.978 0.978 0.977 0.969 0.997 0.984
1244 Richa Sharma et al.
Figure 4. (a) Landsat TM standard false colour composite, (b) LULC map using unsupervised classification, (c) LULCmap using supervised classification and (d) LULC map using decision tree classification.
0
10
20
30
40
50
Unsupervised Supervised Decision Tree
Are
a (i
n sq
km)
Classification methods
Built-up (Dense)
Built-up (Sparse)
Agriculture
Fallow
Water (Shallow)
Water (Deep)
Figure 5. Area distribution in different classification schemes.
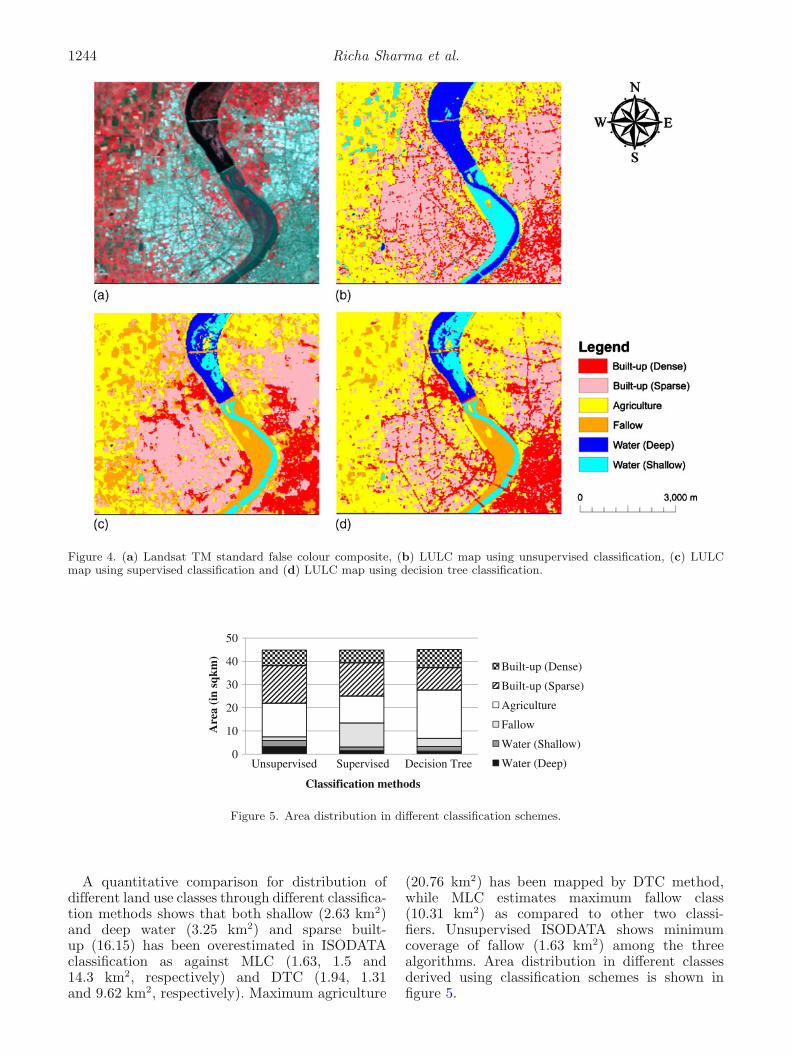
A quantitative comparison for distribution ofdifferent land use classes through different classifica-tion methods shows that both shallow (2.63 km2)and deep water (3.25 km2) and sparse built-up (16.15) has been overestimated in ISODATAclassification as against MLC (1.63, 1.5 and14.3 km2, respectively) and DTC (1.94, 1.31and 9.62 km2, respectively). Maximum agriculture
(20.76 km2) has been mapped by DTC method,while MLC estimates maximum fallow class(10.31 km2) as compared to other two classi-fiers. Unsupervised ISODATA shows minimumcoverage of fallow (1.63 km2) among the threealgorithms. Area distribution in different classesderived using classification schemes is shown infigure 5.
Decision tree approach for classification of remotely sensed satellite data 1245
Table 7. Classification accuracies for three classification algorithms.
ISODATA MLC DTC
Class PA UA PA UA PA UA
Built-up (dense) 47.22 60.71 61.11 84.62 97.22 87.5
Built-up (sparse) 86.36 62.3 77.27 64.15 81.82 90
Agriculture 83.87 74.29 74.19 79.31 96.77 75
Fallow 4.17 100 81.25 72.22 79.17 95
Water (shallow) 2.33 3.23 69.77 96.77 93.02 100
Water (deep) 100 46.34 94.74 78.26 97.37 92.5
OA=50.8 K=0.41 OA=76.67 K=0.72 OA=90 K=0.88
PA: Producer’s accuracy, UA: User’s accuracy, OA: Overall accuracy, K: Kappa statistics.
4.5 Accuracy assessment
For quantitative analysis of classification perfor-mance by three classifiers, accuracy assessment isperformed. A confusion matrix was generated afteroverlaying the reference locations on the classi-fied map. Classification using the DTC gave bestoverall accuracy of 90% and kappa as 0.88. It isfollowed by supervised classification giving overallaccuracy of 76.67% and kappa of 0.7186. Overallaccuracy for classification using ISODATA 50 clus-ters merged into eight classes gave overall accuracyas 50.83% and overall kappa as 0.4134. Classifi-cation accuracy for ISODATA ranges from 2.33%(PA for shallow water) to 100% (PA for deep waterand UA for fallow). MLC accuracy varies from61.1% (PA for dense built-up) to 96.8% (UA forshallow water). In comparison to other two classi-fiers, DTC exhibit highest accuracy range of 75%(UA for agriculture) to 100% (UA for shallowwater) (table 7).
5. Conclusion
The study demonstrated use of open source remotesensing datasets and data mining software supportfor LULC classification. Open source data min-ing software WEKA was used to develop a DTCalgorithm for remotely sensed satellite data. DTCoutcomes were compared with outputs of ISO-DATA clustering and MLC classifier. The compar-ison of the classification algorithms shows DTC tobe superior to the other two. Work by Otukei andBlaschke (2010) also shows that DTC performedbetter than both MLC and SVMs for similarkind of studies using Landsat data.
The DTC produced consistently higher classifi-cation accuracies than ISODATA and MLC. Bet-ter performance of the DTC is attributed to itsability to adapt to the noisy and non-linear rela-tions often observed between the land use classesin the urban dominated landscapes and irregular
patterns. Being a non-parametric, it can easilyignore distribution properties of input data. Aunique strength of DTC lies in their flexibilityand simplicity for partitioning datasets as a func-tion of the input feature space. At the same time,it employs differentiation among the linear fea-ture interspersed with unlike classes while definingboundaries between classes. Examination of theclass-specific classification accuracies provided byeach of the candidate classifiers illustrates sev-eral important points. Most importantly, decisiontree algorithms often optimize for maximum over-all classification accuracy at the expense of smallerclasses. However, this also depends on the cell orpixel size of the satellite data.
Open source data mining software use attributesof a pixel in different bands to construct a decisiontree. These softwares have additional advantage oftheir ease to adapt and implement the classificationalgorithms. This is not possible using decision treetools in proprietary software packages. Anotheradded advantage of open source data mining soft-ware is faster processing and advantage of flexi-ble customization based on background knowledge.These are also easy to procure and give satisfactoryresults for majority of applications.
The study has witnessed some of the limitationsdue to the nature of software and the data itself.WEKA has a huge limitation in handling largedatasets. Thus, the methodology could be imple-mented only for smaller area. In addition to this,the spatial resolution of the data is not sufficientfor analyzing finer details. The study also lacks inground data collection.
The study attempts to highlight the advantagesof DTC over conventional classification methods.DTC requires much less effort on part of user toprepare data for building decision trees. Being non-parametric in nature, the classifier is not sensitiveto outliers as splitting is based upon proportionof samples within spilt ranges and not on abso-lute values. Additionally, DTC is much easier toimplement and understand.
1246 Richa Sharma et al.
Acknowledgements
RS and PKJ acknowledge Department of Scienceand Technology (DST), Ministry of Science andTechnology, Government of India. AG acknowl-edges Council of Scientific and Industrial Research(CSIR), Government of India for support. Theexperimental and computational facilities of TERIUniversity have been used; support to this researchis greatly acknowledged by authors. Authors alsoacknowledge anonymous reviewers for constructivecomments and suggestions to improve quality ofmanuscript.
References
Aguirre-Gutierrez J, Seijmonsbergen A C and Duiven-voorden J F 2012 Optimizing land cover classificationaccuracy for change detection, a combined pixel-basedand object-based approach in a mountainous area inMexico; Appl. Geogr. 34 29–37.
Anderson James R, Hardy E E, Roach J T and Witmer R E1976 A Land Use and Land Cover Classification Sys-tem for use with Remote Sensor Data; USGS ProfessionalPaper 964. A revision of the land use classification systemas presented in the USGS Circular 671.
Balthazar V, Vanacker V and Lambin E F 2012 Evaluationand parameterization of ATCOR3 topographic correctionmethod for forest cover mapping in mountain areas; Int.J. Appl. Earth Obs. Geoinf. 18 436–450.
Breiman L, Freidman J H, Olshen R A and Stone CJ 1984 Classification and regression trees; Wadsworth,Belmonth CA.
Carraa H, Goncalves P and Caetano M 2008 Contributionof multispectral and multitemporal information fromMODIS images to land cover classification; Remote Sens.Environ. 112 986–997.
Census of India 2011 Government of India, New Delhi.Chen D and Stow D A 2002 The effect of training strate-
gies on supervised classification at different spatial resolu-tions; Photogram. Eng. Remote Sens. 68(11) 1155–1161.
Dorren L K A, Maier B and Seijmonsbergen A C 2003Improved Landsat-based forest mapping in steep moun-tainous terrain using object-based classification; ForestEcol. Manag. 183 31–46.
Duro D C, Franklin S E and Dube M G 2012 A compari-son of pixel-based and object-based image analysis withselected machine learning algorithms for the classificationof agricultural landscapes using SPOT-5 HRG imagery;Remote Sens. Environ. 118 259–272.
Evrendilek F and Gulbeyaz O 2011 Boosted decision treeclassifications of land cover over Turkey integratingMODIS, climate and topographic data. Int. J. RemoteSens. 32(12) 3461–3483.
Feitosa R Q, Costa G A O P, Mota G L A, Pakzad K andCosta M C O 2009 Cascade multitemporal classificationbased on fuzzy Markov changes; ISPRS J. Photogram.Remote Sens. 64 159–170.
Friedl M A and Brodley C E 1997 Decision tree classificationof land cover from remotely sensed data; Remote Sens.Environ. 61 399–409.
Friedl M A, Brodley C E and Strahler A H 1999 Maximizingland cover classification accuracies produced by decisiontrees at continental to global scales; IEEE Trans. Geosci.Remote Sens. 37(2) 969–977.
Friedman J H 1977 A recursive partitioning decision rule fornonparametric classification; IEEE Trans. Comput. C-26404–408.
Gamanya R, Maeyer P D and Dapper M D 2007 An auto-mated satellite image classification design using objectoriented segmentation algorithms: A move towards stan-dardization; Expert Syst. Appl. 32 616–624.
Gamanya R, Maeyer P D and Dapper M D 2009 Object ori-ented change detection for the city of Harare, Zimbabwe;Expert Syst. Appl. 36 571–588.
Gregorio A D and Jansen L J M 2000 Land Cover Classifi-cation System (LCCS): Classification Concepts and UserManual ; FAO, Rome, Italy.
Hansen M C, DeFries R S, Townshend J R G and Sohlberg R2000 Global land cover classification at 1 km spatial reso-lution using a classification tree approach; Int. J. RemoteSens. 21 1331–1364.
Hunt E B, Marin J and Stone P T 1996 Experiments inInduction; Academic Press, New York.
Jensen J R 2005 Introductory Digital Image Processing:A Remote Sensing Perspective; Pearson Prentice Hall:Upper Saddle River.
Jensen J R and Cowen D J 1999 Remote sensing of urban/suburban infrastructure and socio-economic attributes;Photogram. Eng. Remote Sens. 65 611–622.
Kandrika S and Roy P S 2008 Land use land cover clas-sification of Orissa using multi-temporal IRS-P6 AWiFSdata: A decision tree approach; Int. J. Appl. Earth Obs.Geoinf. 10(2) 186–193.
Lillesand T M, Kiefer R W and Chipman J 2007 RemoteSensing and Image Interpretation; 6th edn, Wiley & Sons,New York.
Lu D and Weng Q 2007 A survey of image classifica-tion methods and techniques for improving classificationperformance; Int. J. Remote Sens. 28 823.
Mather P M 2004 Computer Processing of Remotely-SensedImages: An Introduction; 3rd edn, Chichester, UK: JohnWiley & Sons Ltd.
Moody A and Strahler A H 1994 Characteristics of com-posited AVHRR data and problems in their classification;Int. J. Remote Sens. 15(17) 3473–3491.
Morgan J N and Messenger R C 1973 THAID a sequentialanalysis program for analysis of nominal scale dependentvariables; Survey Research Center, Institute for SocialResearch, University of Michigan, Ann Arbor.
Morgan J N and Sonquist J A 1963 Problems in the analysisof survey data, and a proposal; J. Am. Stat. Assoc. 58415–434.
Murthy Sreerama K, Kasif S and Salzberg S 1994 A systemfor induction of oblique decision trees; J. Artif. Intell.Res. 2 1–33.
Otukei J R and Blaschke T 2010 Land cover change assess-ment using decision trees, support vector machines andmaximum likelihood classification algorithms; Int. J.Appl. Earth Obs. Geoinf. 12 S27–S31.
Pal M and Mather P M 2003 An assessment of the effective-ness of decision tree methods for land cover classification;Remote Sens. Environ. 86 554–565.
Pu R, Gong P, Michishta R and Sasgawa R 2008 Spectralmixture analysis for mapping abundance of urban surfacecomponents from the Terra/ASTER data; Remote Sens.Environ. 112 939–954.
Punia M, Joshi P K and Porwal M C 2011 Decision treeclassification of land use land cover for Delhi, India usingIRS-P6 AWiFS data; Expert Syst. Appl. 38(5) 5577–5583.
Quinlan J R 1975 Machine Learning ; Vol 1(1), University ofSydney.
Quinlan J R 1993 C4.5: Programs for machine learning ; SanMateo, California: Morgan Kauffmann Publishers.
Decision tree approach for classification of remotely sensed satellite data 1247
Shaw G A and Burke H K 2003 Spectral imaging for remotesensing; Lincoln Lab. J. 14(1) 3–28.
Stefanov W L, Ramsey M S and Christensen P R 2001Monitoring urban land cover change: An expert sys-tem approach to land cover classification of semi-arid to arid urban centers; Remote Sens. Environ. 77173–185.
Stehman S V 1996 Estimation of Kappa coefficient and itsvariance using stratified random sampling; Photogram.Eng. Remote Sens. 26 401–407.
Thapa R B and Murayama Y 2009 Urban mapping, accu-racy and image classification: A comparison of multiple
approaches in Tsukuba city, Japan; Appl. Geogr. 29135–144.
Wen X, Hu G and Yang X 2008 CBERS-02 remote sens-ing data mining using decision tree algorithm; Int. Conf.on Forensic Applications and Techniques in Telecommu-nications, Information, and Multimedia and Workshop,Article No. 58.
Wentz E A, Nelson D, Rahman A, Stefanov W L and RoyS S 2008 Expert system classification of urban land use/cover for Delhi, India; Int. J. Remote Sens. 29(15–16)4405–4427.
www.suratmunicipal.gov.in
MS received 21 November 2012; revised 15 February 2013; accepted 25 February 2013
Related Documents