Decision support for dam release during floods using a distributed biosphere hydrological model driven by quantitative precipitation forecasts Oliver C. Saavedra Valeriano, 1,2,3 Toshio Koike, 1 Kun Yang, 4 Tobias Graf, 5 Xin Li, 6 Lei Wang, 1 and Xujun Han 6 Received 29 April 2010; accepted 24 May 2010; published 30 October 2010. [1] This study proposes a decision support system for real‐time dam operation during heavy rainfall. It uses an operational mesoscale quantitative precipitation forecast (QPF) to force a hydrological model and considers the forecast error from the previous time step, which is introduced as a perturbation range applied to the most recent QPF. A weighting module accounts for the location, intensity, and extent of the error. Missing precipitation intensities within contributing areas and information from surrounding areas can both be considered. Forecast error is defined as the ratio of QPF to the observed precipitation within an evaluation zone (sub‐basin, basin, buffer, or total domain). An objective function is established to minimize the flood volume at control points downstream and to maximize reservoir storage. The decision variables are the dam releases, which are constrained to the ensemble streamflow’s information. A prototype was applied to one of the most important river basins in Japan, the Tone reservoir system. The efficiency of the approach was evident in reduced flood peaks downstream and increased water storage. The results from three events indicate that the developed decision support system is feasible for real‐life dam operation. Citation: Saavedra Valeriano, O. C., T. Koike, K. Yang, T. Graf, X. Li, L. Wang, and X. Han (2010), Decision support for dam release during floods using a distributed biosphere hydrological model driven by quantitative precipitation forecasts, Water Resour. Res., 46, W10544, doi:10.1029/2010WR009502. 1. Introduction [2] Heavy precipitation events are very likely to continue and become more frequent as a result of global warming [Intergovernmental Panel on Climate Change (IPCC), 2007]. These events can be attributed to large variations of the water cycle at global [e.g., Huntington, 2006] and regional scales [e.g., Kyselý and Beranová, 2009], while flood damage oc- curs at the basin scale [Kojiri et al., 2008]. Actually, the frequency of these events has increased over most land areas, which is consistent with increases in land surface tempera- ture. This is particularly evident in humid regions affected by tropical cyclones, such as Southeast Asia. These typhoons often bring heavy rainfall but can cause severe flooding. To reduce flood damage caused by heavy rainfall, a system is needed to support reservoir operators in flood management using real‐time observations and weather forecast data. [3] The accuracy of weather forecasting at the basin scale has improved in the last few years as a result of more reliable numerical weather prediction models. Precipitation is one of the most difficult weather variables to predict because the atmosphere is highly unstable. However, advanced tech- niques have enabled reasonable predictions at the regional scale [e.g., Golding, 2000; Krzysztofowicz and Collier, 2004; Honda et al., 2005]. Because precipitation makes up the main input data for hydrological models, the accuracy of a quantitative precipitation forecast (QPF) is reflected in the streamflow forecast. Recent works [Jasper et al., 2002; Collischonn et al., 2005; Saavedra et al., 2009] have shown the feasibility of forcing distributed hydrological models (DHMs) with mesoscale QPFs. [4] A flood peak can be reduced by appropriate dam operation, assuming the dam has sufficient storage capacity. The application of preestablished rule curves is limited during extreme flood events [Chang and Chang, 2001]. Optimal release systems using hydrological models to assist dam operators have been reviewed [e.g., Yeh, 1985; Labadie, 2004]. It is noted that, because of the increase in computa- tional power and real‐time data availability, simulation approaches have become feasible and attractive [e.g., Wurbs, 1993]. Some of these studies focused on the optimization of operating rules for multireservoir systems taking advantage 1 Department of Civil Engineering, University of Tokyo, Tokyo, Japan. 2 Now at Department of Civil Engineering, Tokyo Institute of Technology, Tokyo, Japan. 3 Also at Energy Resources and Environmental Engineering Program, Egypt-Japan University of Science and Technology, New Borg El-Arab, Egypt. 4 TEL, Institute of Tibetan Plateau Research, Chinese Academy of Sciences, Beijing, China. 5 GAF, AG, Arnu, Munich, Germany. 6 Cold and Arid Regions Environmental and Engineering Research Institute, Chinese Academy of Sciences, Gansu, China. Copyright 2010 by the American Geophysical Union. 0043‐1397/10/2010WR009502 WATER RESOURCES RESEARCH, VOL. 46, W10544, doi:10.1029/2010WR009502, 2010 W10544 1 of 13

Welcome message from author
This document is posted to help you gain knowledge. Please leave a comment to let me know what you think about it! Share it to your friends and learn new things together.
Transcript
Decision support for dam release during floods using a distributedbiosphere hydrological model driven by quantitativeprecipitation forecasts
Oliver C. Saavedra Valeriano,1,2,3 Toshio Koike,1 Kun Yang,4 Tobias Graf,5 Xin Li,6
Lei Wang,1 and Xujun Han6
Received 29 April 2010; accepted 24 May 2010; published 30 October 2010.
[1] This study proposes a decision support system for real‐time dam operation during heavyrainfall. It uses an operational mesoscale quantitative precipitation forecast (QPF) to force ahydrological model and considers the forecast error from the previous time step, whichis introduced as a perturbation range applied to the most recent QPF. A weighting moduleaccounts for the location, intensity, and extent of the error. Missing precipitation intensitieswithin contributing areas and information from surrounding areas can both be considered.Forecast error is defined as the ratio of QPF to the observed precipitation within anevaluation zone (sub‐basin, basin, buffer, or total domain). An objective function isestablished to minimize the flood volume at control points downstream and to maximizereservoir storage. The decision variables are the dam releases, which are constrained to theensemble streamflow’s information. A prototype was applied to one of the most importantriver basins in Japan, the Tone reservoir system. The efficiency of the approach wasevident in reduced flood peaks downstream and increased water storage. The results fromthree events indicate that the developed decision support system is feasible for real‐life damoperation.
Citation: Saavedra Valeriano, O. C., T. Koike, K. Yang, T. Graf, X. Li, L. Wang, and X. Han (2010), Decision support for damrelease during floods using a distributed biosphere hydrological model driven by quantitative precipitation forecasts, WaterResour. Res., 46, W10544, doi:10.1029/2010WR009502.
1. Introduction
[2] Heavy precipitation events are very likely to continueand become more frequent as a result of global warming[Intergovernmental Panel on Climate Change (IPCC), 2007].These events can be attributed to large variations of the watercycle at global [e.g., Huntington, 2006] and regional scales[e.g., Kyselý and Beranová, 2009], while flood damage oc-curs at the basin scale [Kojiri et al., 2008]. Actually, thefrequency of these events has increased over most land areas,which is consistent with increases in land surface tempera-ture. This is particularly evident in humid regions affected bytropical cyclones, such as Southeast Asia. These typhoonsoften bring heavy rainfall but can cause severe flooding. To
reduce flood damage caused by heavy rainfall, a system isneeded to support reservoir operators in flood managementusing real‐time observations and weather forecast data.[3] The accuracy of weather forecasting at the basin scale
has improved in the last few years as a result of more reliablenumerical weather prediction models. Precipitation is one ofthe most difficult weather variables to predict because theatmosphere is highly unstable. However, advanced tech-niques have enabled reasonable predictions at the regionalscale [e.g.,Golding, 2000; Krzysztofowicz and Collier, 2004;Honda et al., 2005]. Because precipitation makes up themain input data for hydrological models, the accuracy of aquantitative precipitation forecast (QPF) is reflected in thestreamflow forecast. Recent works [Jasper et al., 2002;Collischonn et al., 2005; Saavedra et al., 2009] have shownthe feasibility of forcing distributed hydrological models(DHMs) with mesoscale QPFs.[4] A flood peak can be reduced by appropriate dam
operation, assuming the dam has sufficient storage capacity.The application of preestablished rule curves is limited duringextreme flood events [Chang and Chang, 2001]. Optimalrelease systems using hydrological models to assist damoperators have been reviewed [e.g., Yeh, 1985; Labadie,2004]. It is noted that, because of the increase in computa-tional power and real‐time data availability, simulationapproaches have become feasible and attractive [e.g.,Wurbs,1993]. Some of these studies focused on the optimization ofoperating rules for multireservoir systems taking advantage
1Department of Civil Engineering, University of Tokyo, Tokyo,Japan.
2Now at Department of Civil Engineering, Tokyo Institute ofTechnology, Tokyo, Japan.
3Also at Energy Resources and Environmental EngineeringProgram, Egypt-Japan University of Science and Technology, NewBorg El-Arab, Egypt.
4TEL, Institute of Tibetan Plateau Research, Chinese Academy ofSciences, Beijing, China.
5GAF, AG, Arnu, Munich, Germany.6Cold and Arid Regions Environmental and Engineering Research
Institute, Chinese Academy of Sciences, Gansu, China.
Copyright 2010 by the American Geophysical Union.0043‐1397/10/2010WR009502
WATER RESOURCES RESEARCH, VOL. 46, W10544, doi:10.1029/2010WR009502, 2010
W10544 1 of 13
of real‐coded genetic algorithms [e.g., Oliveira and Loucks,1997; Chen, 2003; Chang, 2008]. Works on areas affectedby typhoons in Southeast Asia, such as Hoa Binh dam inVietnam [Ngo et al., 2007], have focused on the optimal rulecurves. A customized geographical information system wascreated to support dam release decisions in Korea [Shim et al.,2002]. Studies in Taiwan targeted real‐time forecasting forflood control in Taiwan [e.g.,Hsu and Wei, 2007; Chang andChang, 2009, Wei and Hsu, 2009]. However, no recentstudies have spatially evaluated QPFs at previous steps in realtime or included them in near‐future dam release decisions.[5] The present system employs a distributed biosphere
hydrological model (DBiHM) with an embedded dam oper-ation module coupled to a heuristic algorithm for supportingrelease instructions. This comprehensive model solves theenergy budget explicitly and can simulate the initial soilmoisture properly, which might be critical for flood fore-casting [Wang et al., 2009a]. In normal runs, the model isforced by real‐time observed radar products calibrated with ahigh‐density rain gauge telemetry network. The radar cali-bration is based on a dynamic window, yielding a high‐quality product almost free of shadows at high spatial andtemporal resolutions. During heavy rainfall the model isdriven by an operational nonhydrostatic mesoscale QPF. Thestudy has four distinctive features: (1) forecast error weighting
using a relatively wide domain according to location, inten-sity, and extent; (2) generation of ensemble flood forecastsusing the evaluation of previous forecast errors; (3) use of aDBiHM forced by output from a nonhydrostatic mesoscalemodel; and (4) use of a heuristic algorithm for multireservoiroperations with a multiobjective approach.
2. System Description
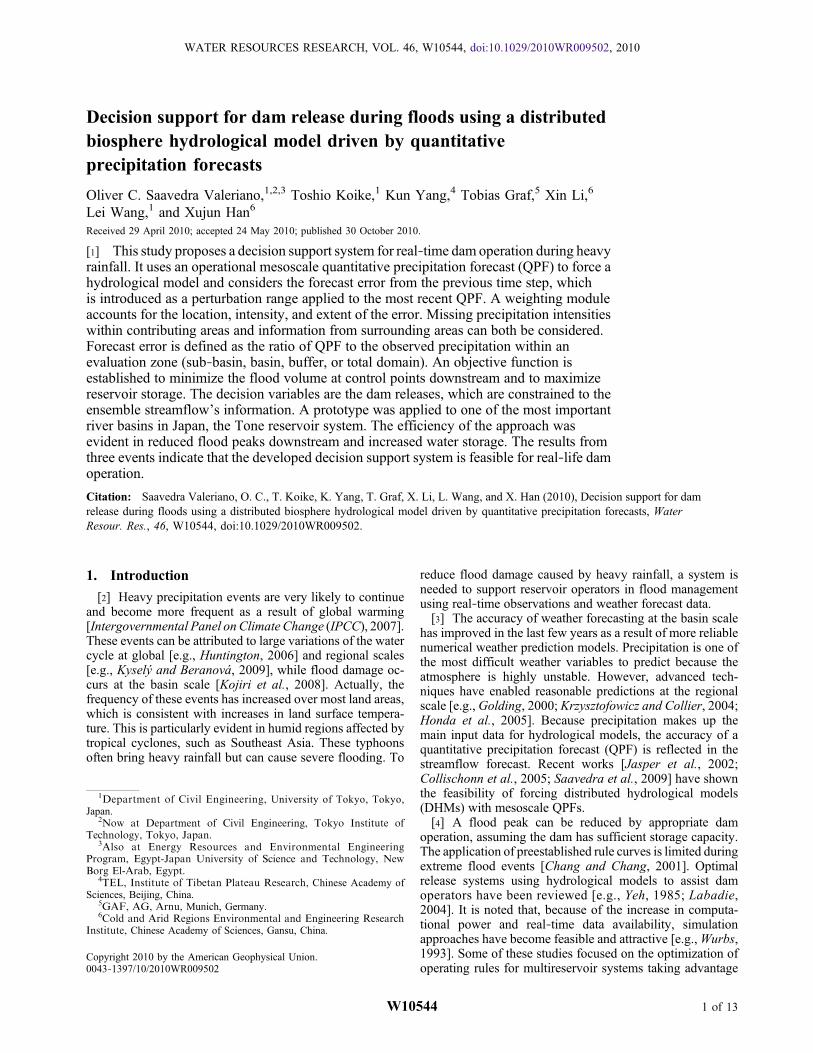
[6] The prototype dam release support system (DRESS) issummarized in Figure 1. The DBiHM runs in normal modeforced by observed precipitation data until a heavy precipi-tation event is detected. At that point, the forecast error isevaluated. Recent observed precipitation and QPFs arecompared over the previous time step window in terms oflocation, intensity, and extent. Next, a weighting method isused to calculate the weights in each zone. These weightsdefine the amplitude of QPF perturbation to generateensemble precipitation members over the total lead time, asshown in Figure 2. Then the DBiHM model is run to obtainthe ensemble streamflow forecast. For special dam opera-tions, a priori dam release is calculated for each ensemblemember. Once the suggested optimal dam release schedule isdetermined using the QPF signal, the efficiency is evaluatedusing the observed precipitation.
Figure 1. Steps of the dam decision support system DRESS for flood control under extreme events.
SAAVEDRA VALERIANO ET AL.: REAL‐TIME DAM OPERATION USING QPF PRECIPITATION W10544W10544
2 of 13
2.1. Evaluation of the Forecast Error Over PreviousTime Steps
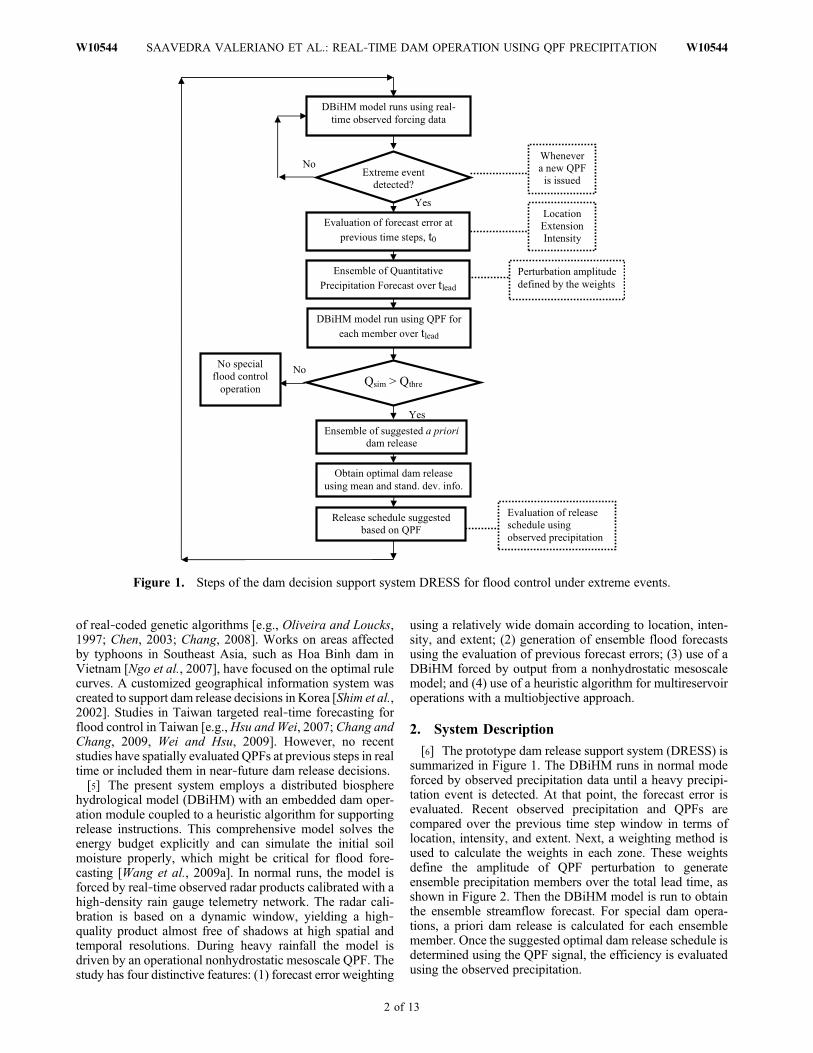
[7] To account for QPF errors in terms of intensity anddisplacement of the main pattern, Ebert and McBride [2000]proposed contiguous rain areas. However, it would also behelpful to locate these areas with respect to the targeted basin.Actually, underestimated or overestimated intensities of theforecast precipitation could occur in areas surrounding thebasin. DRESS applies an evaluation module to differentzones. The inputs are QPF and real‐time observed precipi-tation, as illustrated in Figure 2. The outputs are the pertur-bation weights to be used over the total lead‐time forecast togenerate the ensemble precipitation members.[8] Because the forecast error bias might fluctuate con-
siderably, the error is defined as the ratio of the forecast to theobserved precipitation within the proposed zones. At the firstlevel, the zones are defined by the drainage areas of the damsas sub‐basins. At the second level, the total basin area isdelineated down to the control point. At lower levels, anumber of circular buffers are proposed on the basis of thewatershed’s center of mass. The total domain is defined as arectangle that covers the basin and buffers.
2.2. Weighting According to Location, Intensity,and Extent
[9] Ebert and McBride [2000] proposed a contingencytable for rain events to evaluate the QPF signal. Theyexpressed the forecast intensity versus the displacementof the rain pattern qualitatively. We propose a perturbation
weighting scheme based on that concept but we express itquantitatively. The forecast error is defined as the averagedvalue of the high and mean intensity ratio,
FEi; j ¼ 0:5� HIi;QPFHIi;OBS
� �þ MIi;QPF
MIi;OBS
� �� �; ð1Þ
where HI represents high intensity and MI represents meanintensity. The subscripts i and j denote the zone and theevaluated time step window, respectively; QPF indicatesforecast values, and OBS indicates observations. The meanintensity ratio term accounts for the error extent because it isaveraged over the zones (sub‐basins, basin, buffers, and totaldomain). Thus, the intensity and extent are considered in oneterm, allowing two‐dimensionality in further analysis againstthe zones. If the forecast error is close to 1, a very accu-rate forecast is assumed. Values higher than 1 indicateoverestimation in the QPF; values between 0 and 1 indicateunderestimation.[10] This study assigns weights using a lookup table. For
example, a very good forecast in terms of intensity, location,and extent would receive the minimumweight for a particularzone. In that case, the QPF requires almost no perturbation,indicating low uncertainty at the previous time step. How-ever, overestimation or underestimation is penalized withhigher weights according to the total ratio and location. Agood pattern match within a sub‐basin is rewarded with aweight close to zero. However, for a good match in widerareas, the minimum weight increases gradually.
2.3. Ensemble Precipitation Forecast
[11] Direct compensation for forecast errors in the pre-vious step might not always be correct, because shiftsfrom overestimation to underestimation and vice versa arepossible. Therefore, a range is applied to the current QPFaccording to its performance over the previous time step. TheQPF’s signal can then be perturbed to generate ensembleprecipitation members by underestimation and overestima-tion. The amplitude of perturbation is defined by the weightsreflecting previous QPF performance and a noise perturbationwith a Gaussian or normal distribution [Goovaerts, 1997]. Anensemble precipitation forecast is generated without assimi-lation, which is a kind of Monte Carlo simulation [Heuvelink,1998].[12] We follow the approach suggested by Turner et al.
[2008] to attempt an appropriate ensemble spread. Semiran-dom numbers are generated assuming a normal distributionwith zero mean and a standard deviation of unity, N (0, 1).Precipitation is considered a semirestricted data field becausethe lower boundary is constrained to zero. The generatedprecipitation at each grid (x, y) for each lead time step k is thendefined as
GP x; yð Þk ¼ max QPF x; yð Þ 1þ A"N 0; 1ð Þwisubffþ B"N 0; 1ð Þwitot½ �g; 0g; ð2Þ
where " is 0.33, meaning an exceedence probability of 0.0014[Turner et al., 2008]. The terms wisub and witot denote theperturbation weights directly within the dam’s subbasinsand the average for the entire basin, buffers, and widerdomain (“total”), respectively. Different weights are proposedfor each time step k within the total QPF lead time. Finally,
Figure 2. Error evaluation window t0 when an extremeevent is detected using recent issued QPF; otherwise, the sys-tem continues running with observed precipitation.
SAAVEDRA VALERIANO ET AL.: REAL‐TIME DAM OPERATION USING QPF PRECIPITATION W10544W10544
3 of 13
A and B are the priority weights, which sum to unity. Forexample, values of 0.6 and 0.4 indicate that 60% priority isgiven to dam sub‐basins and 40% to wider zones.
2.4. Distributed Biosphere Hydrological Model
[13] DHMs can assimilate rainfall patterns and estimatefluxes such as a streamflow at selected points. Moreover, theyprovide the spatial distributions of soil moisture content,evaporation, and transpiration. However, detailed energyexchange between the land surface and lower atmosphere isneglected in most DHMs [e.g., Yang et al., 2001]. Thus,combining hydrological and land surface models (LSMs)improves the representation of the water and energy cycleswithin a basin. The simple biosphere model (SiB2) [Sellerset al., 1996], a well‐known LSM, has been embedded intoa geomorphology‐based hydrological model (GBHM) [Yanget al., 2002] to produce a water‐ and energy‐budget‐basedDHM (WEB‐DHM) [Wang et al., 2009a].[14] DRESS employs WEB‐DHM validated in humid
areas [Wang et al., 2009b], which can predict the evolution ofland surface temperature and soil moisture. The SiB2 sub-model calculates turbulent fluxes between the lower atmo-sphere and land surface independently. It then updatesthe surface runoff and subsurface flow, which become thelateral inflow to the main river channel. Next, the GBHMsubmodel simulates water flowwithin the river network usingone‐dimensional kinematic wave equations solved by finitedifference approximation. This simulation sequence is per-formed for each sub‐basin using the Pfafstetter scheme[Verdin and Verdin, 1999]. Moreover, every sub‐basin isdivided into a number of flow intervals based on the flowdistance to the outlet. The flow intervals are linked by theriver network according to the geomorphology. The flowdownstream might be affected by the operation of upstreamdams. A dam function based on the mass balance approachwas used to express the change in volume. Inflows to thedams are simulated by the GBHM submodel.
2.5. A Priori Dam Release for Selected Members
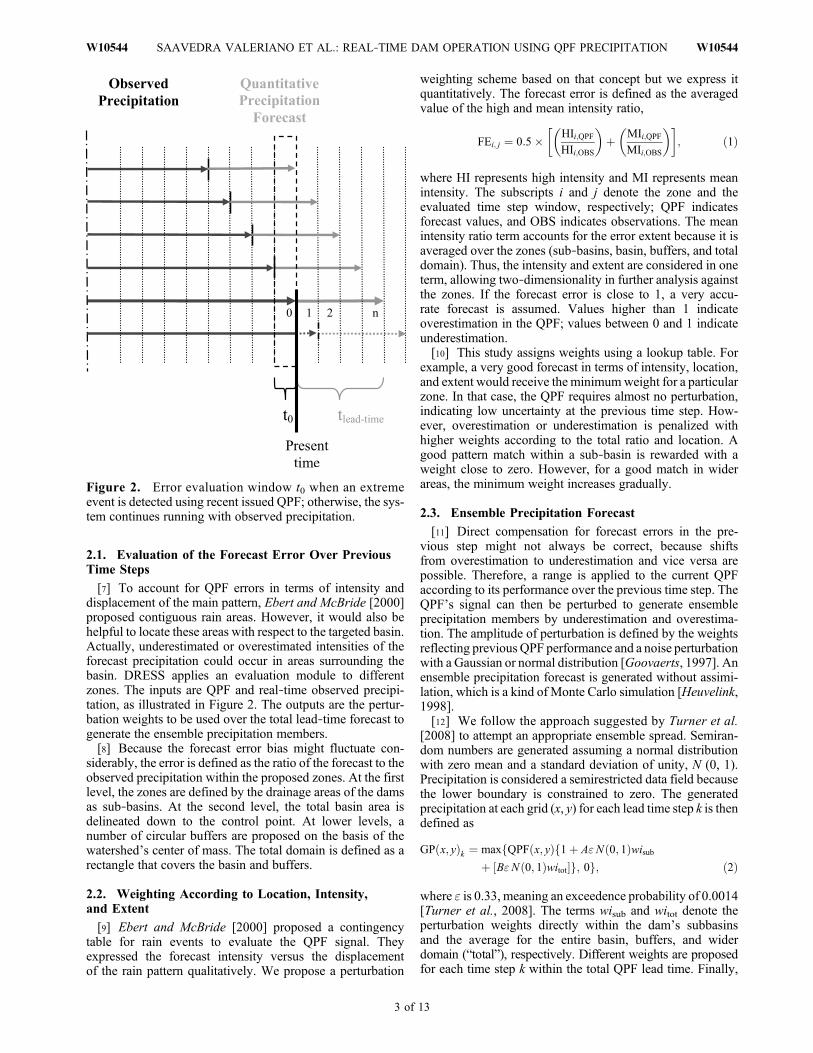
[15] The ensemble streamflow is calculated using WEB‐DHM at a selected control point downstream. The system isactivated only when the simulated streamflow with unregu-lated releases surpasses the threshold flow. This flow isdefined as the average of the observed values exceeding themean annual discharge at the control point [Saavedra et al.,2010]. The simulated streamflow with closed gates is thencalculated to check the effect downstream. The integrated
value between the two simulations over time is the potentialflood volume (PFV) for a specific dam, as shown in Figure 3.This procedure shows the effect of inflow at the control pointaccording to dam capacity. The system defines a priori releaseQ from n dams based on the PFV at the control point over thepresent time step. Thus, the release implicitly becomes afunction of inflow.[16] For the rest of the total lead‐time forecast, the gates are
assumed to be totally closed to replenish the reservoirs tolevels comparable to initial levels [Saavedra et al., 2010].Essentially, the system releases only a water volume thatcould be re‐stored after the event according to the QPF. Thispreventive measure reduces flood volumes directly andreduces flood peaks as a consequence. Themean and standarddeviation of dam release for the participating members arethen calculated to express the uncertainty. They are used asthe initial guess and boundary condition for the decisionvariables in the optimization, respectively.
2.6. Optimization of Dam Release
[17] Defining a proper objective function is crucial tooptimal dam operation. We propose to extend the applicationof shuffled complex evolution (SCE) [Duan et al., 1992] inmultireservoir operation using the QPF during heavy rainfall.2.6.1. Objective[18] The flood peak should be minimized at control points
downstream and the available free volume at dams should bereduced (i.e., water storage should be encouraged).2.6.2. Strategy[19] A trade‐off is made between water allocation at the
control point, which might result in flood damage, and storedwater at the reservoirs for potential water use.2.6.3. Objective Function[20] Minimize Z, which is defined as
Z ¼Xni¼1
PFVi þXni¼1
RFVi; ð3Þ
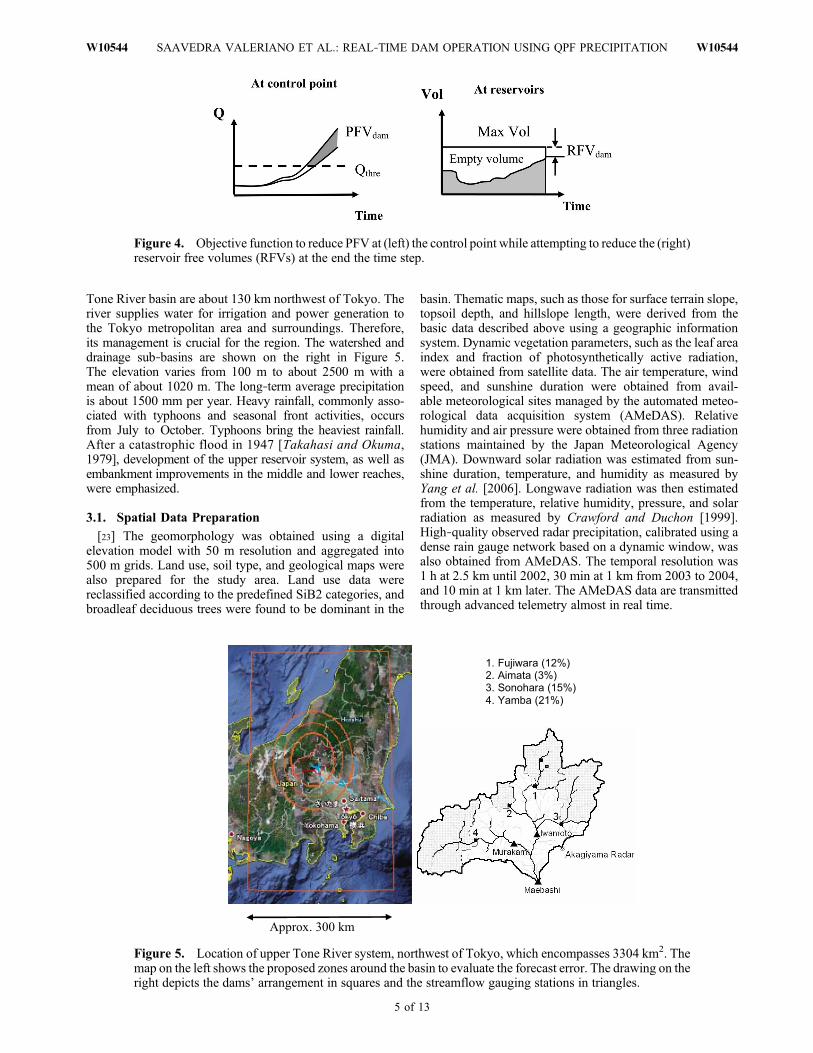
where PFVi and RFVi are the potential flood and reservoirfree volumes for n reservoirs, represented on the left and right,respectively, in Figure 4. PFVi was calculated as shown inequation (3); RFVi can be estimated as
Xni¼1
RFVi ¼Xni¼1
MXVi � SVið Þ; ð4Þ
where MXVi is the maximum storage and SVi is the simu-lated volume.2.6.4. Optimization[21] The decision variables are the dam releases. Their
initial values are the mean a priori dam release obtainedpreviously. Their upper and lower boundaries are the meanplus and minus one standard deviation, respectively. Theheuristic algorithm SCE drives WEB‐DHM, seeding differ-ent combinations of decision variables until the objectivefunction is fulfilled.
3. Application of the System to the Upper ToneRiver
[22] To validate DRESS, it was applied to the upper Tonereservoir system in Japan. The northern headwaters of the
Figure 3. Potential flood volume (PFV) reduced by multi-reservoir operation at control point downstream. PFV is theintegrated simulated stream flowQsim that exceeds the thresh-old Qthre.
SAAVEDRA VALERIANO ET AL.: REAL‐TIME DAM OPERATION USING QPF PRECIPITATION W10544W10544
4 of 13
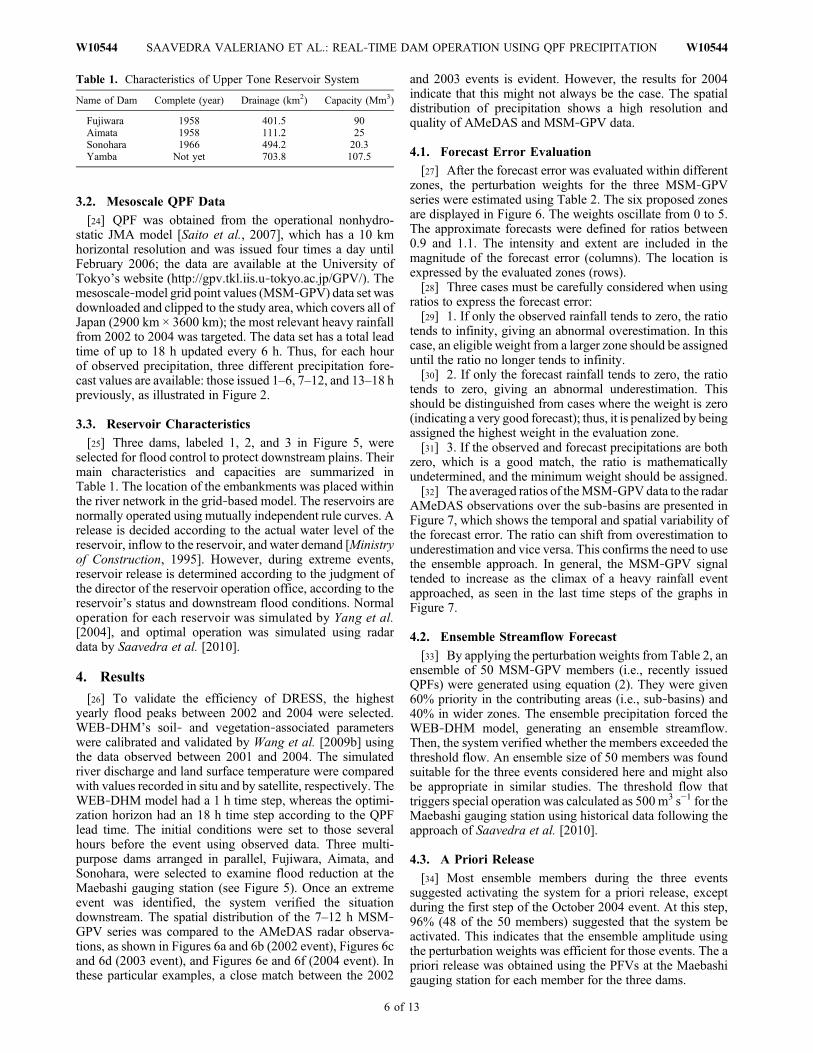
Tone River basin are about 130 km northwest of Tokyo. Theriver supplies water for irrigation and power generation tothe Tokyo metropolitan area and surroundings. Therefore,its management is crucial for the region. The watershed anddrainage sub‐basins are shown on the right in Figure 5.The elevation varies from 100 m to about 2500 m with amean of about 1020 m. The long‐term average precipitationis about 1500 mm per year. Heavy rainfall, commonly asso-ciated with typhoons and seasonal front activities, occursfrom July to October. Typhoons bring the heaviest rainfall.After a catastrophic flood in 1947 [Takahasi and Okuma,1979], development of the upper reservoir system, as well asembankment improvements in the middle and lower reaches,were emphasized.
3.1. Spatial Data Preparation
[23] The geomorphology was obtained using a digitalelevation model with 50 m resolution and aggregated into500 m grids. Land use, soil type, and geological maps werealso prepared for the study area. Land use data werereclassified according to the predefined SiB2 categories, andbroadleaf deciduous trees were found to be dominant in the
basin. Thematic maps, such as those for surface terrain slope,topsoil depth, and hillslope length, were derived from thebasic data described above using a geographic informationsystem. Dynamic vegetation parameters, such as the leaf areaindex and fraction of photosynthetically active radiation,were obtained from satellite data. The air temperature, windspeed, and sunshine duration were obtained from avail-able meteorological sites managed by the automated meteo-rological data acquisition system (AMeDAS). Relativehumidity and air pressure were obtained from three radiationstations maintained by the Japan Meteorological Agency(JMA). Downward solar radiation was estimated from sun-shine duration, temperature, and humidity as measured byYang et al. [2006]. Longwave radiation was then estimatedfrom the temperature, relative humidity, pressure, and solarradiation as measured by Crawford and Duchon [1999].High‐quality observed radar precipitation, calibrated using adense rain gauge network based on a dynamic window, wasalso obtained from AMeDAS. The temporal resolution was1 h at 2.5 km until 2002, 30 min at 1 km from 2003 to 2004,and 10 min at 1 km later. The AMeDAS data are transmittedthrough advanced telemetry almost in real time.
Figure 4. Objective function to reduce PFV at (left) the control point while attempting to reduce the (right)reservoir free volumes (RFVs) at the end the time step.
Figure 5. Location of upper Tone River system, northwest of Tokyo, which encompasses 3304 km2. Themap on the left shows the proposed zones around the basin to evaluate the forecast error. The drawing on theright depicts the dams’ arrangement in squares and the streamflow gauging stations in triangles.
SAAVEDRA VALERIANO ET AL.: REAL‐TIME DAM OPERATION USING QPF PRECIPITATION W10544W10544
5 of 13
3.2. Mesoscale QPF Data
[24] QPF was obtained from the operational nonhydro-static JMA model [Saito et al., 2007], which has a 10 kmhorizontal resolution and was issued four times a day untilFebruary 2006; the data are available at the University ofTokyo’s website (http://gpv.tkl.iis.u‐tokyo.ac.jp/GPV/). Themesoscale‐model grid point values (MSM‐GPV) data set wasdownloaded and clipped to the study area, which covers all ofJapan (2900 km × 3600 km); the most relevant heavy rainfallfrom 2002 to 2004 was targeted. The data set has a total leadtime of up to 18 h updated every 6 h. Thus, for each hourof observed precipitation, three different precipitation fore-cast values are available: those issued 1–6, 7–12, and 13–18 hpreviously, as illustrated in Figure 2.
3.3. Reservoir Characteristics
[25] Three dams, labeled 1, 2, and 3 in Figure 5, wereselected for flood control to protect downstream plains. Theirmain characteristics and capacities are summarized inTable 1. The location of the embankments was placed withinthe river network in the grid‐based model. The reservoirs arenormally operated using mutually independent rule curves. Arelease is decided according to the actual water level of thereservoir, inflow to the reservoir, and water demand [Ministryof Construction, 1995]. However, during extreme events,reservoir release is determined according to the judgment ofthe director of the reservoir operation office, according to thereservoir’s status and downstream flood conditions. Normaloperation for each reservoir was simulated by Yang et al.[2004], and optimal operation was simulated using radardata by Saavedra et al. [2010].
4. Results
[26] To validate the efficiency of DRESS, the highestyearly flood peaks between 2002 and 2004 were selected.WEB‐DHM’s soil‐ and vegetation‐associated parameterswere calibrated and validated by Wang et al. [2009b] usingthe data observed between 2001 and 2004. The simulatedriver discharge and land surface temperature were comparedwith values recorded in situ and by satellite, respectively. TheWEB‐DHM model had a 1 h time step, whereas the optimi-zation horizon had an 18 h time step according to the QPFlead time. The initial conditions were set to those severalhours before the event using observed data. Three multi-purpose dams arranged in parallel, Fujiwara, Aimata, andSonohara, were selected to examine flood reduction at theMaebashi gauging station (see Figure 5). Once an extremeevent was identified, the system verified the situationdownstream. The spatial distribution of the 7–12 h MSM‐GPV series was compared to the AMeDAS radar observa-tions, as shown in Figures 6a and 6b (2002 event), Figures 6cand 6d (2003 event), and Figures 6e and 6f (2004 event). Inthese particular examples, a close match between the 2002
and 2003 events is evident. However, the results for 2004indicate that this might not always be the case. The spatialdistribution of precipitation shows a high resolution andquality of AMeDAS and MSM‐GPV data.
4.1. Forecast Error Evaluation
[27] After the forecast error was evaluated within differentzones, the perturbation weights for the three MSM‐GPVseries were estimated using Table 2. The six proposed zonesare displayed in Figure 6. The weights oscillate from 0 to 5.The approximate forecasts were defined for ratios between0.9 and 1.1. The intensity and extent are included in themagnitude of the forecast error (columns). The location isexpressed by the evaluated zones (rows).[28] Three cases must be carefully considered when using
ratios to express the forecast error:[29] 1. If only the observed rainfall tends to zero, the ratio
tends to infinity, giving an abnormal overestimation. In thiscase, an eligible weight from a larger zone should be assigneduntil the ratio no longer tends to infinity.[30] 2. If only the forecast rainfall tends to zero, the ratio
tends to zero, giving an abnormal underestimation. Thisshould be distinguished from cases where the weight is zero(indicating a very good forecast); thus, it is penalized by beingassigned the highest weight in the evaluation zone.[31] 3. If the observed and forecast precipitations are both
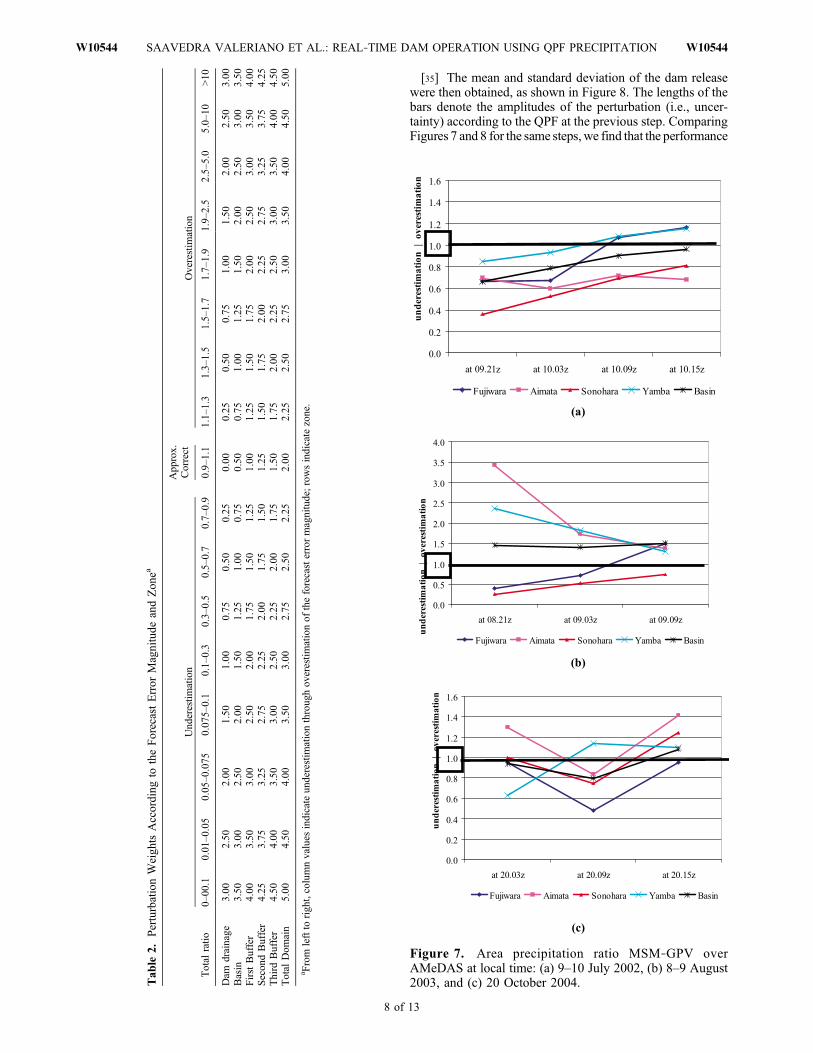
zero, which is a good match, the ratio is mathematicallyundetermined, and the minimum weight should be assigned.[32] The averaged ratios of theMSM‐GPVdata to the radar
AMeDAS observations over the sub‐basins are presented inFigure 7, which shows the temporal and spatial variability ofthe forecast error. The ratio can shift from overestimation tounderestimation and vice versa. This confirms the need to usethe ensemble approach. In general, the MSM‐GPV signaltended to increase as the climax of a heavy rainfall eventapproached, as seen in the last time steps of the graphs inFigure 7.
4.2. Ensemble Streamflow Forecast
[33] By applying the perturbation weights from Table 2, anensemble of 50 MSM‐GPV members (i.e., recently issuedQPFs) were generated using equation (2). They were given60% priority in the contributing areas (i.e., sub‐basins) and40% in wider zones. The ensemble precipitation forced theWEB‐DHM model, generating an ensemble streamflow.Then, the system verified whether the members exceeded thethreshold flow. An ensemble size of 50 members was foundsuitable for the three events considered here and might alsobe appropriate in similar studies. The threshold flow thattriggers special operation was calculated as 500 m3 s−1 for theMaebashi gauging station using historical data following theapproach of Saavedra et al. [2010].
4.3. A Priori Release
[34] Most ensemble members during the three eventssuggested activating the system for a priori release, exceptduring the first step of the October 2004 event. At this step,96% (48 of the 50 members) suggested that the system beactivated. This indicates that the ensemble amplitude usingthe perturbation weights was efficient for those events. The apriori release was obtained using the PFVs at the Maebashigauging station for each member for the three dams.
Table 1. Characteristics of Upper Tone Reservoir System
Name of Dam Complete (year) Drainage (km2) Capacity (Mm3)
Fujiwara 1958 401.5 90Aimata 1958 111.2 25Sonohara 1966 494.2 20.3Yamba Not yet 703.8 107.5
SAAVEDRA VALERIANO ET AL.: REAL‐TIME DAM OPERATION USING QPF PRECIPITATION W10544W10544
6 of 13
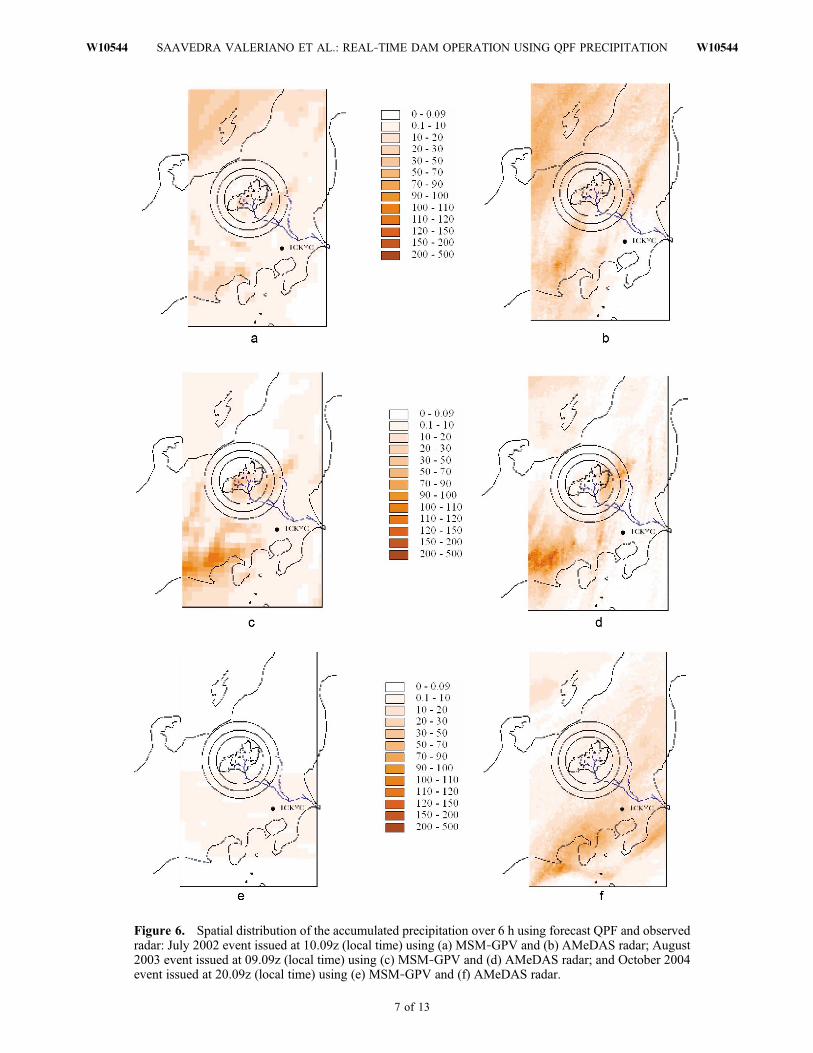
Figure 6. Spatial distribution of the accumulated precipitation over 6 h using forecast QPF and observedradar: July 2002 event issued at 10.09z (local time) using (a) MSM‐GPV and (b) AMeDAS radar; August2003 event issued at 09.09z (local time) using (c) MSM‐GPV and (d) AMeDAS radar; and October 2004event issued at 20.09z (local time) using (e) MSM‐GPV and (f) AMeDAS radar.
SAAVEDRA VALERIANO ET AL.: REAL‐TIME DAM OPERATION USING QPF PRECIPITATION W10544W10544
7 of 13
[35] The mean and standard deviation of the dam releasewere then obtained, as shown in Figure 8. The lengths of thebars denote the amplitudes of the perturbation (i.e., uncer-tainty) according to the QPF at the previous step. ComparingFigures 7 and 8 for the same steps,we find that the performance
Tab
le2.
PerturbationWeigh
tsAccording
totheForecastError
Magnitude
andZon
ea
Total
ratio
Und
erestim
ation
App
rox.
Correct
Overestim
ation
0–00
.10.01–0.05
0.05–0.075
0.07
5–0.1
0.1–0.3
0.3–0.5
0.5–0.7
0.7–0.9
0.9–1.1
1.1–1.3
1.3–1.5
1.5–1.7
1.7–1.9
1.9–2.5
2.5–5.0
5.0–10
>10
Dam
drainage
3.00
2.50
2.00
1.50
1.00
0.75
0.50
0.25
0.00
0.25
0.50
0.75
1.00
1.50
2.00
2.50
3.00
Basin
3.50
3.00
2.50
2.00
1.50
1.25
1.00
0.75
0.50
0.75
1.00
1.25
1.50
2.00
2.50
3.00
3.50
FirstBuffer
4.00
3.50
3.00
2.50
2.00
1.75
1.50
1.25
1.00
1.25
1.50
1.75
2.00
2.50
3.00
3.50
4.00
Secon
dBuffer
4.25
3.75
3.25
2.75
2.25
2.00
1.75
1.50
1.25
1.50
1.75
2.00
2.25
2.75
3.25
3.75
4.25
Third
Buffer
4.50
4.00
3.50
3.00
2.50
2.25
2.00
1.75
1.50
1.75
2.00
2.25
2.50
3.00
3.50
4.00
4.50
Total
Dom
ain
5.00
4.50
4.00
3.50
3.00
2.75
2.50
2.25
2.00
2.25
2.50
2.75
3.00
3.50
4.00
4.50
5.00
a From
leftto
righ
t,columnvalues
indicateun
derestim
ationthroug
hov
erestim
ationof
theforecasterrormagnitude;rowsindicatezone.
Figure 7. Area precipitation ratio MSM‐GPV overAMeDAS at local time: (a) 9–10 July 2002, (b) 8–9 August2003, and (c) 20 October 2004.
SAAVEDRA VALERIANO ET AL.: REAL‐TIME DAM OPERATION USING QPF PRECIPITATION W10544W10544
8 of 13
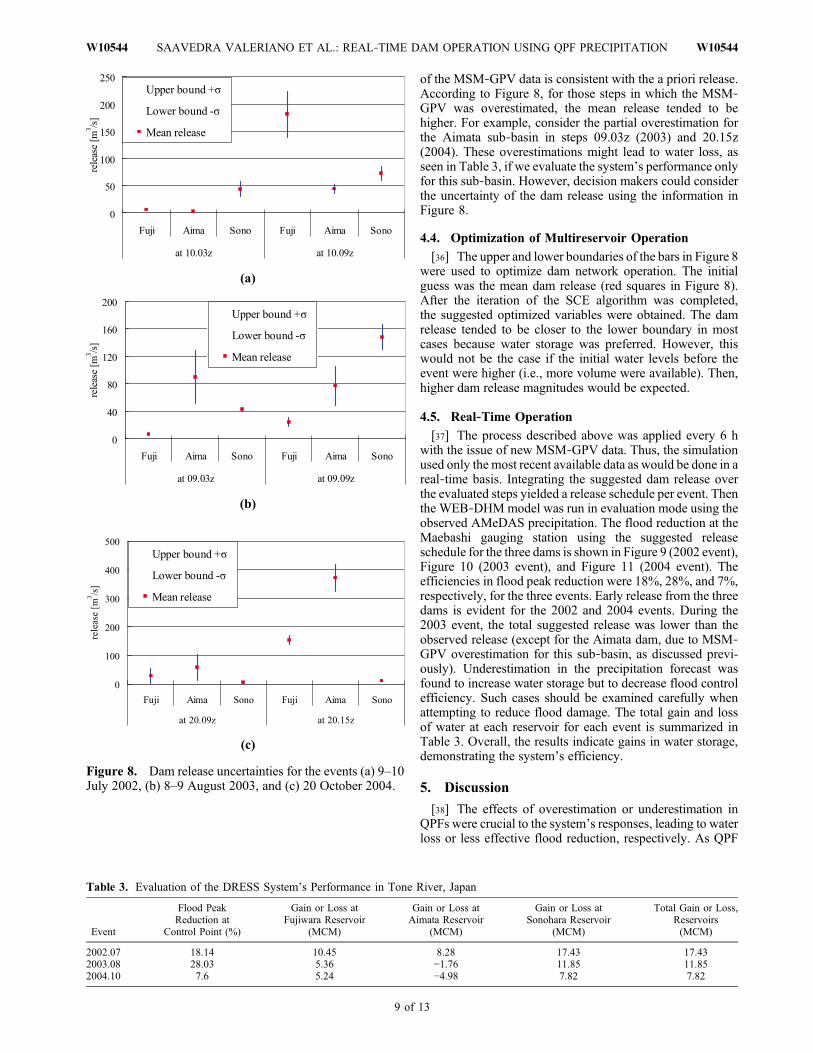
of the MSM‐GPV data is consistent with the a priori release.According to Figure 8, for those steps in which the MSM‐GPV was overestimated, the mean release tended to behigher. For example, consider the partial overestimation forthe Aimata sub‐basin in steps 09.03z (2003) and 20.15z(2004). These overestimations might lead to water loss, asseen in Table 3, if we evaluate the system’s performance onlyfor this sub‐basin. However, decision makers could considerthe uncertainty of the dam release using the information inFigure 8.
4.4. Optimization of Multireservoir Operation
[36] The upper and lower boundaries of the bars in Figure 8were used to optimize dam network operation. The initialguess was the mean dam release (red squares in Figure 8).After the iteration of the SCE algorithm was completed,the suggested optimized variables were obtained. The damrelease tended to be closer to the lower boundary in mostcases because water storage was preferred. However, thiswould not be the case if the initial water levels before theevent were higher (i.e., more volume were available). Then,higher dam release magnitudes would be expected.
4.5. Real‐Time Operation
[37] The process described above was applied every 6 hwith the issue of new MSM‐GPV data. Thus, the simulationused only the most recent available data as would be done in areal‐time basis. Integrating the suggested dam release overthe evaluated steps yielded a release schedule per event. Thenthe WEB‐DHMmodel was run in evaluation mode using theobserved AMeDAS precipitation. The flood reduction at theMaebashi gauging station using the suggested releaseschedule for the three dams is shown in Figure 9 (2002 event),Figure 10 (2003 event), and Figure 11 (2004 event). Theefficiencies in flood peak reduction were 18%, 28%, and 7%,respectively, for the three events. Early release from the threedams is evident for the 2002 and 2004 events. During the2003 event, the total suggested release was lower than theobserved release (except for the Aimata dam, due to MSM‐GPV overestimation for this sub‐basin, as discussed previ-ously). Underestimation in the precipitation forecast wasfound to increase water storage but to decrease flood controlefficiency. Such cases should be examined carefully whenattempting to reduce flood damage. The total gain and lossof water at each reservoir for each event is summarized inTable 3. Overall, the results indicate gains in water storage,demonstrating the system’s efficiency.
5. Discussion
[38] The effects of overestimation or underestimation inQPFs were crucial to the system’s responses, leading to waterloss or less effective flood reduction, respectively. As QPF
Figure 8. Dam release uncertainties for the events (a) 9–10July 2002, (b) 8–9 August 2003, and (c) 20 October 2004.
Table 3. Evaluation of the DRESS System’s Performance in Tone River, Japan
Event
Flood PeakReduction at
Control Point (%)
Gain or Loss atFujiwara Reservoir
(MCM)
Gain or Loss atAimata Reservoir
(MCM)
Gain or Loss atSonohara Reservoir
(MCM)
Total Gain or Loss,Reservoirs(MCM)
2002.07 18.14 10.45 8.28 17.43 17.432003.08 28.03 5.36 −1.76 11.85 11.852004.10 7.6 5.24 −4.98 7.82 7.82
SAAVEDRA VALERIANO ET AL.: REAL‐TIME DAM OPERATION USING QPF PRECIPITATION W10544W10544
9 of 13
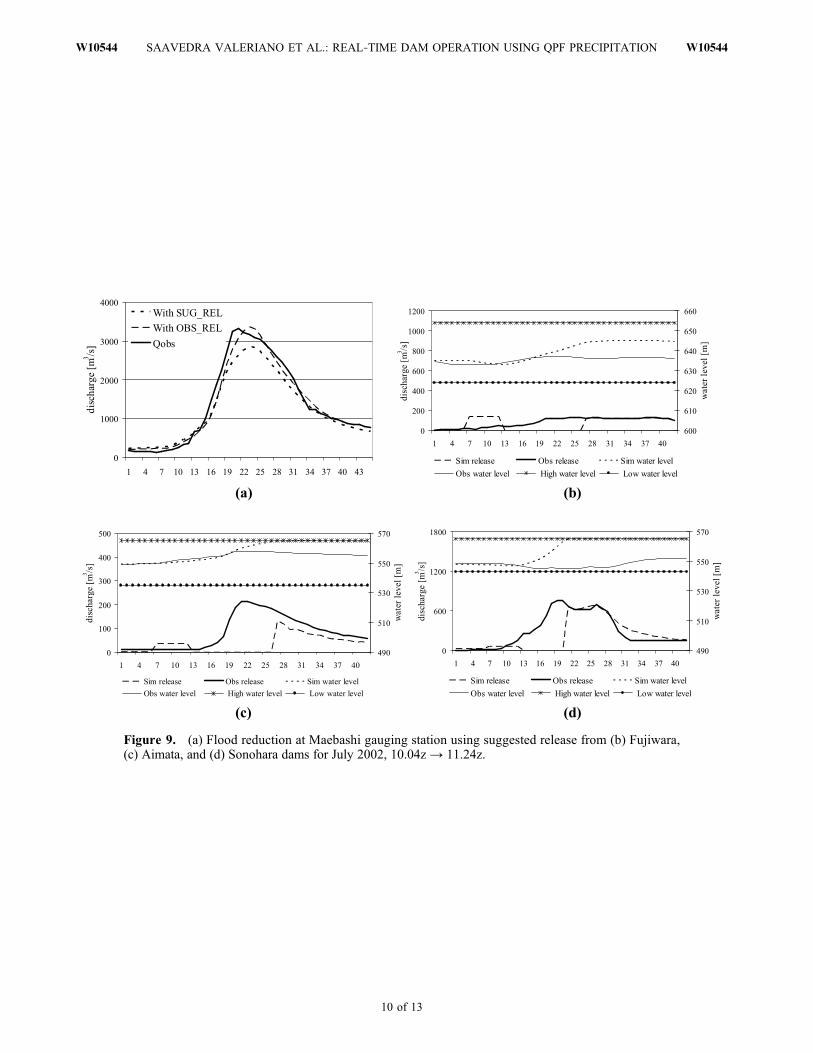
Figure 9. (a) Flood reduction at Maebashi gauging station using suggested release from (b) Fujiwara,(c) Aimata, and (d) Sonohara dams for July 2002, 10.04z → 11.24z.
SAAVEDRA VALERIANO ET AL.: REAL‐TIME DAM OPERATION USING QPF PRECIPITATION W10544W10544
10 of 13
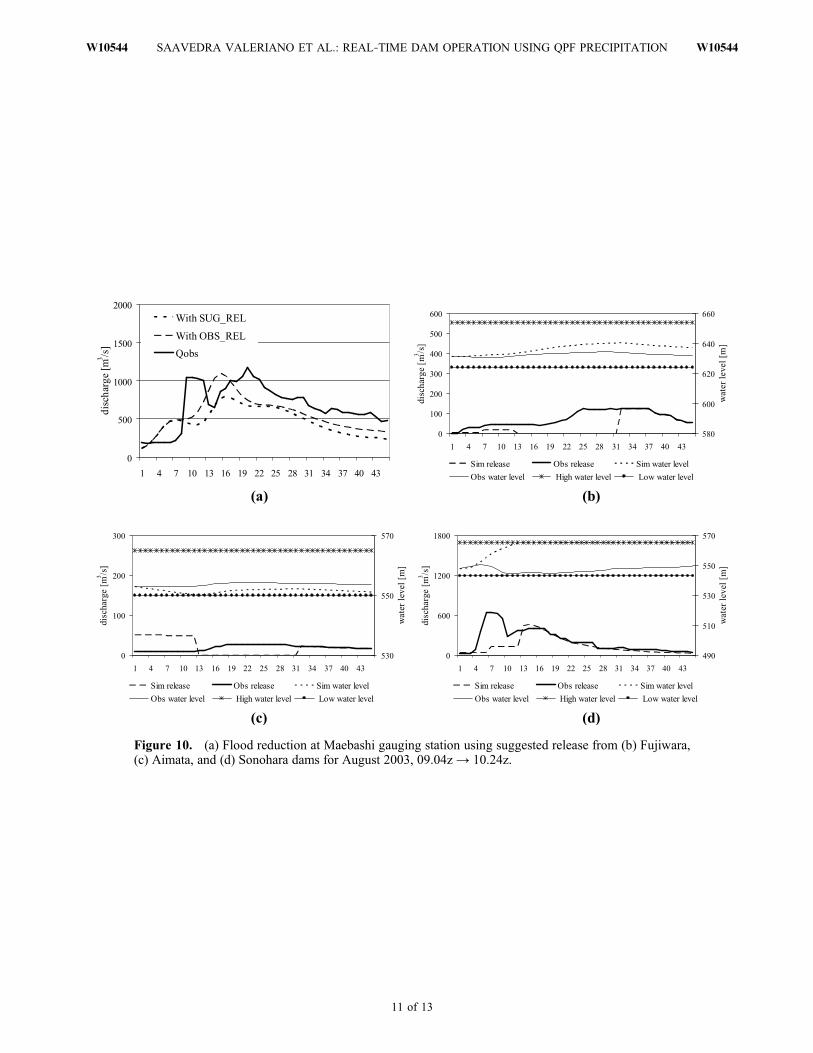
Figure 10. (a) Flood reduction at Maebashi gauging station using suggested release from (b) Fujiwara,(c) Aimata, and (d) Sonohara dams for August 2003, 09.04z → 10.24z.
SAAVEDRA VALERIANO ET AL.: REAL‐TIME DAM OPERATION USING QPF PRECIPITATION W10544W10544
11 of 13
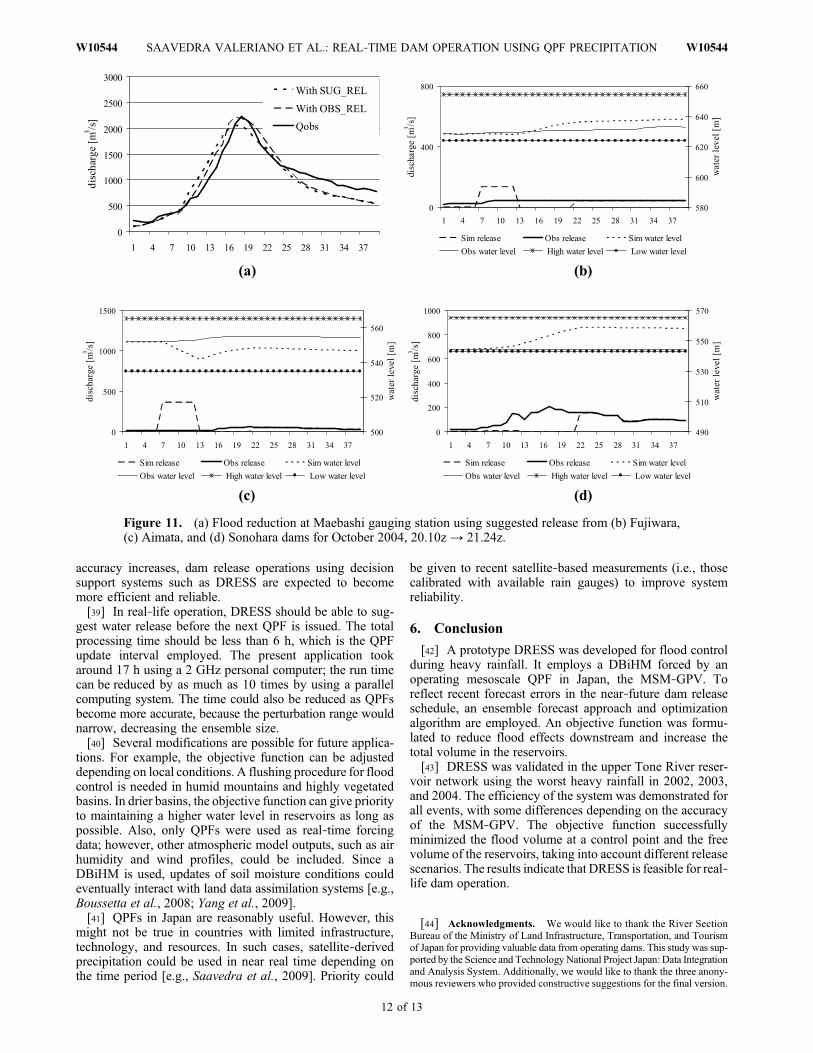
accuracy increases, dam release operations using decisionsupport systems such as DRESS are expected to becomemore efficient and reliable.[39] In real‐life operation, DRESS should be able to sug-
gest water release before the next QPF is issued. The totalprocessing time should be less than 6 h, which is the QPFupdate interval employed. The present application tookaround 17 h using a 2 GHz personal computer; the run timecan be reduced by as much as 10 times by using a parallelcomputing system. The time could also be reduced as QPFsbecome more accurate, because the perturbation range wouldnarrow, decreasing the ensemble size.[40] Several modifications are possible for future applica-
tions. For example, the objective function can be adjusteddepending on local conditions. A flushing procedure for floodcontrol is needed in humid mountains and highly vegetatedbasins. In drier basins, the objective function can give priorityto maintaining a higher water level in reservoirs as long aspossible. Also, only QPFs were used as real‐time forcingdata; however, other atmospheric model outputs, such as airhumidity and wind profiles, could be included. Since aDBiHM is used, updates of soil moisture conditions couldeventually interact with land data assimilation systems [e.g.,Boussetta et al., 2008; Yang et al., 2009].[41] QPFs in Japan are reasonably useful. However, this
might not be true in countries with limited infrastructure,technology, and resources. In such cases, satellite‐derivedprecipitation could be used in near real time depending onthe time period [e.g., Saavedra et al., 2009]. Priority could
be given to recent satellite‐based measurements (i.e., thosecalibrated with available rain gauges) to improve systemreliability.
6. Conclusion
[42] A prototype DRESS was developed for flood controlduring heavy rainfall. It employs a DBiHM forced by anoperating mesoscale QPF in Japan, the MSM‐GPV. Toreflect recent forecast errors in the near‐future dam releaseschedule, an ensemble forecast approach and optimizationalgorithm are employed. An objective function was formu-lated to reduce flood effects downstream and increase thetotal volume in the reservoirs.[43] DRESS was validated in the upper Tone River reser-
voir network using the worst heavy rainfall in 2002, 2003,and 2004. The efficiency of the system was demonstrated forall events, with some differences depending on the accuracyof the MSM‐GPV. The objective function successfullyminimized the flood volume at a control point and the freevolume of the reservoirs, taking into account different releasescenarios. The results indicate that DRESS is feasible for real‐life dam operation.
[44] Acknowledgments. We would like to thank the River SectionBureau of the Ministry of Land Infrastructure, Transportation, and Tourismof Japan for providing valuable data from operating dams. This study was sup-ported by the Science and Technology National Project Japan: Data Integrationand Analysis System. Additionally, we would like to thank the three anony-mous reviewers who provided constructive suggestions for the final version.
Figure 11. (a) Flood reduction at Maebashi gauging station using suggested release from (b) Fujiwara,(c) Aimata, and (d) Sonohara dams for October 2004, 20.10z → 21.24z.
SAAVEDRA VALERIANO ET AL.: REAL‐TIME DAM OPERATION USING QPF PRECIPITATION W10544W10544
12 of 13
ReferencesBoussetta, S., T. Koike, K. Yang, T. Graf, and M. Pathmathevan (2008),
Development of a coupled land–atmosphere satellite data assimilationsystem for improved local atmospheric simulations, Remote Sens. Envi-ron., 112, 720–734.
Chang, L.‐C. (2008), Guiding rational reservoir flood operation usingpenalty‐type genetic algorithm, J. Hydrol., 354, 65–74.
Chang, L.‐C., and F.‐J. Chang (2001), Intelligent control for modeling ofreal‐time reservoir operation, Hydrol. Processes, 15, 1621–1634.
Chang, L.‐C., and F.‐J. Chang (2009), Multi‐objective evolutionary algo-rithm for operating parallel reservoir system, J. Hydrol., 377, 12–20.
Chen, L. (2003), Real coded genetic algorithm optimization of long termreservoir operation, J. Am. Water Resour. Assoc., 39(5), 1157–1165.
Collischonn, W., R. Hass, I. Andreolli, and C. E. Morelli Tucci (2005),Forecasting River Uruguay flow using rainfall forecasts from a regionalweather‐prediction model, J. Hydrol., 305, 87–98.
Crawford, T. M., and C. E. Duchon (1999), An improved parameterizationfor estimating effective atmospheric emissivity for use in calculatingdaytime downwelling long‐wave radiation, J. Appl. Meteorol., 38,474–480.
Duan, Q., S. Sorooshian, and V. K. Gupta (1992), Effective and efficientglobal optimization for conceptual rainfall‐runoff models, Water Resour.Res., 28(4), 1015–1031.
Ebert, E. E., and L. L. McBride (2000), Verification of precipitation inweather systems: Determination of systematic errors, J. Hydrol., 239,179–202.
Golding, B. W. (2000), Quantitative precipitation forecasting in the UK,J. Hydrol., 239, 286–305.
Goovaerts, P. (1997), Geostatistics for Natural Resources Evaluation,483 pp., Oxford Univ. Press, New York.
Heuvelink, G. B. M. (1998), Error Propagation in Environmental Model-ling with GIS, 127 pp., Taylor & Francis, London.
Honda, Y., M. Nishijima, K. Koizumi, Y. Ohta, K. Tamiya, T. Kawabata,and T. Tsuyuki (2005), A pre‐operational variational data assimilationsystem for a non‐hydrostatic model at the Japan Meteorological Agency:Formulation and preliminary results, Q. J. R. Meteorol. Soc., 131,3465–3475.
Hsu, N.‐S., and C.‐C. Wei (2007), A multipurpose reservoir real‐time oper-ation model for flood control during typhoon invasion, J. Hydrol., 336,282–293.
Huntington, T. G. (2006), Evidence for intensification of the global watercycle: Review and synthesis, J. Hydrol., 319, 83–95.
Intergovernmental Panel on Climate Change (IPCC) (2007), ClimateChange 2007: The Physical Science Basis, 996 pp., Cambridge Univ.Press, Cambridge, U. K.
Jasper, K., J. Gurtz, and H. Lang (2002), Advanced flood forecasting inAlpine watersheds by coupling meteorological observations and fore-casts with a distributed hydrological model, J. Hydrol., 267, 40–52.
Kojiri, T., T. Hamaguchi, and M. Ode (2008), Assessment of global warmingimpacts on water resources and ecology of a river basin in Japan, J. HydroEnviron. Res., 1, 164–175.
Krzysztofowicz, R., and C. G. Collier (Eds.) (2004), Quantitative precipi-tation forecasting II, J. Hydrol., 288(1–2).
Kyselý, J., and R. Beranová (2009), Climate‐change effects on extremeprecipitation in central Europe: Uncertainties of scenarios based onregional climate models, Theor. Appl. Climatol., 95, 361–374.
Labadie, J. W. (2004), Optimal operation of multireservoir systems state‐of‐the‐art review, J. Water Resour. Plann. Manage., 130(2), 93–111.
Ministry of Construction (1995), Reservoir operation manuals for theupper Tone River basin (in Japanese), Reservoir Manage. Off. of theUpper Tone River Basin, Kanto Bur., Minist. of Construction, Japan.
Ngo, L. L., H. Madsen, D. Rosbjerg (2007), Simulation and optimisationmodelling approach for operation of the Hoa Binh reservoir, Vietnam,J. Hydrol., 336, 269–281.
Oliveira, R., and D. Loucks (1997), Operating rules for multireservoir sys-tems, Water Resour. Res., 33(4), 839–852.
Saavedra, O., T. Koike, K. Yang, D. Yang, C. T. Nyunt, D. V. Khanh, andL.C. Chau (2009), Flood simulation using different sources of rainfall inthe Huong River, Vietnam, Hydrol. Sci. J., 54(5), 909–917.
Saavedra, O., T. Koike, K. Yang, and D. Yang (2010), Optimal dam oper-ation during flood season using a distributed hydrological model and aheuristic algorithm, J. Hydrol. Eng., 15(7), 580–586, doi:10.1061/(ASCE)HE.1943-5584.0000212.
Saito, K., J. I. Ishida, K. Aranami, T. Hara, T. Segawa, M. Narita, and Y.Honda (2007), Nonhydrostatic atmospheric models and operationaldevelopment at JMA, J. Meteorol. Soc. Jpn., 85B, 271–304.
Sellers, P. J., D. A. Randall, G. J. Collatz, J. A. Berry, C. B. Field, D. A.Dazlich, C. Zhang, G. D. Collelo, and L. Bounoua (1996), A revisedland surface parameterization (SiB2) for atmospheric GCMs, Part I:Model formulation, J. Clim., 9, 676–705.
Shim, K.‐C., D. G. Fontane, and J. W. Labadie (2002), Spatial decisionsupport system for integrated river basin flood control, J. Water Resour.Plann. Manage., 128(3), 190–201.
Takahasi, Y., and T. Okuma (1979), Historical review of floods and theirdamage in the Tone River basin, J. Nat. Disaster Sci., 1, 35–50.
Turner, M. R. J., J. P. Walker, and P. R. Oke (2008), Ensemble membergeneration for sequential data assimilation, Remote Sens. Environ.,112, 1421–1433.
Verdin, K. L., and J. P. Verdin (1999), A topological system for delineationand codification of the Earth’s river basins, J. Hydrol., 218, 1–12.
Wang, L., T. Koike, K. Yang, T. K. Jackson, R. Bindlish, and D. Yang(2009a), Development of a distributed biosphere hydrological modeland its evaluation with the Southern Great Plains Experiments(SGP97 and SGP99), J. Geophys. Res., 114, D08107, doi:10.1029/2008JD010800.
Wang, L., T. Koike, K. Yang, and P. J.‐F. Yeh (2009b), Assessment of adistributed biosphere hydrological model against streamflow andMODIS land surface temperature in the upper Tone River Basin,J. Hydrol., 377, 21–34.
Wei, C.‐C., and N.‐S. Hsu (2009), Optimal tree‐based release rules forreal‐time flood control operations on a multipurpose multireservoir sys-tem, J. Hydrol., 365(3–4), 213–224.
Wurbs, R. A. (1993), Reservoir‐system simulation and optimization mod-els, J. Water Res. Plann. Manage., 119(4), 455–472.
Yang, D., S. Herath, T. Oki, and K. Musiake (2001), Application of a dis-tributed hydrological model in the Asian monsoon tropic region with aperspective of coupling with atmospheric models, J. Meteorol. Soc.Jpn., 79(1B), 373–385.
Yang, D., S. Herath, and K. Musiake (2002), Hillslope‐based hydrolog-ical model using catchment area and width functions, Hydrol. Sci. J.,47, 49–65.
Yang, D., T. Koike, and H. Tanizawa (2004), Application of a distributedhydrological model and weather radar observations for flood manage-ment, Hydrol. Processes, 18, 3119–3132.
Yang, K., T. Koike, and B. Ye (2006) Improving estimation of hourly,daily, and monthly downward shortwave radiation by importing globaldata sets, Agric. For. Meteorol., 137, 43–55.
Yang, K., T. Koike, I. Kaihotsu, and Q. Jun (2009), Validation of a dual‐pass microwave land data assimilation system for estimating surface soilmoisture in semiarid regions, J. Hydrometeorol., 10(3), 780–793.
Yeh, W. W.‐G. (1985), Reservoir management and operation models: Astate‐of‐the‐art review, Water Resour. Res., 21(12), 1797–1818.
T. Graf, GAF, AG, Arnulfstr. 197, D‐80634 Munich, Germany.X. Han and X. Li, Cold and Arid Regions Environmental and
Engineering Research Institute, Chinese Academy of Sciences, Lanzhou,Gansu 730000, China.T. Koike and L. Wang, Department of Civil Engineering, University of
Tokyo, Bunkyo‐ku, Tokyo 113‐8656, Japan.O. C. Saavedra Valeriano, Department of Civil Engineering, Tokyo
Institute of Technology, Meguro‐ku, Tokyo 152‐8552, Japan. ([email protected])K. Yang, TEL, Institute of Tibetan Plateau Research, Chinese Academy
of Sciences, Beijing 100085, China.
SAAVEDRA VALERIANO ET AL.: REAL‐TIME DAM OPERATION USING QPF PRECIPITATION W10544W10544
13 of 13
Related Documents