Decision making for Small and Medium-Sized Enterprises International conference on May 04 - 05, 2017 Ostrava, Czech Republic go.slu.cz/demsme Conference Proceedings

Welcome message from author
This document is posted to help you gain knowledge. Please leave a comment to let me know what you think about it! Share it to your friends and learn new things together.
Transcript

Decision making for Small and Medium-Sized
Enterprises
International conference on
May 04 - 05, 2017Ostrava, Czech Republic
go.slu.cz/demsme
Conference Proceedings
International conference on Decision making for Small and Medium-Sized Enterprises
DEMSME 2017
Conference Proceedings
Ostrava, Czech Republic May 4-5, 2017
International conference on Decision making for small and medium-sized enterprises 2017 is organized by the Silesian University in Opava, School of Business Administration in Karviná. Programme Committee Joanna Ejdys, Bialystok University of Technology, Poland HaiCheng Eric Chu, National Taichung University of Education (NTCU), Taiwan Miroslav Hučka, VŠB - Technical University of Ostrava, Czech Republic Martin Lukeš, University of Economics in Prague, Czech Republic Mercedes Carmona Martínez, Universidad Católica San Antonio de Murcia, Spain Miroslav Plevný, University of West Bohemia in Plzeň, Czech Republic Jaroslav Ramík, Silesian University in Opava, Czech Republic Włodzimierz Sroka, University Of Dąbrowa Górnicza, Poland Ovidiu Stoica, Alexandru Ioan Cuza University of Iasi, Romania Petr Suchánek (Executive Co-Chair), Silesian University in Opava, Czech Republic Roman Šperka (Executive Co-Chair), Silesian University in Opava, Czech Republic Tadeusz Trzaskalik, University of Economy in Katowice, Poland Milan Turčáni, University of Konstantin Filozof in Nitra, Slovak Republic Milan Vlach, Charles University in Prague, Czech Republic Title: International conference on Decision making for Small and Medium-Sized Enterprises. Conference Proceedings Editors: Petr Suchánek, Roman Šperka, Šárka Čemerková, Radim Dolák Publisher: Silesian University in Opava, School of Business Administration in Karviná Number of pages: 269 Number of copies: 50 Printing Office: X-MEDIA servis s.r.o., Ostrava Karviná 2017 ISBN 978-80-7510-243-0
All papers passed a double-blind review process.
Suggested citation: Author, A., 2017. “Title of the paper”. In: Suchánek, P., R. Šperka, Š. Čemerková and R. Dolák (eds.), 2017. International conference on Decision making for Small and Medium-Sized Enterprises. Conference Proceedings. Karviná: Silesian University in Opava, School of Business Administration in Karviná, pp. XXX-XXX. ISBN 978-80-7510-243-0

Dear reader,
you are reading proceedings from the 1st year of the conference Decision Making for Small
and Medium-sized Enterprises 2017 (DEMSME 2017) that took place in the Czech Republic,
town Ostrava at the Mercure Hotel in May 2017. The 2-day conference was organized by
Department of Business Economics and Management and Department of Informatics and
Mathematics of Silesian University in Opava, School of Business Administration in Karvina.
DEMSME 2017 is a meeting of experts from universities and businesses interested in the
theory and application of decision-making in research using the knowledge of computer
science, mathematics, enterprise economics, management and marketing approaches in the
practice of Small and Medium-sized enterprises (SMEs).
We are very pleased that we have selected a total amount of 33 original contributions after
rigorous double-blind review process. The authors gathered from 5 countries, namely the
Czech Republic, Slovakia, Poland, Denmark and Lithuania. Total number of papers from
herein above mentioned areas indicates that these areas are very interesting from
a scientific point of view and in general, there is a number of problems that require a specific
scientific approach to solving them.
The papers link scientific activities with up-to-date practice dedicated to SMEs and beyond.
The emphasis was given, e.g., to the business excellence and technology acceptance models,
knowledge management, internet services, online marketing and CRM studies, customer
services, ICT tools and techniques, mathematical models, international trade and product
introduction, start-ups, profit accumulation, employees quality and performance
management. Most of the papers came up with innovative case studies, which could be
helpful in realizing particular methods immediately into SMEs practice.
Great thanks to the program committee of the conference, its organizers and, last but not
least, its partners and sponsors, alongside the Silesian University in Opava, School of
Business Administration in Karvina, also Veolia company, city of Karvina, IT Cluster of
Moravia-Silesian Region and European Council for Small Business and Entrepreneurship
(ECSB). We consider the first year of the DEMSME 2017 conference to be very successful and
we look forward to its repetition in two-year cycles and thus to its inclusion in the traditional
conferences organized at the Silesian University in Opava, School of Business Administration
in Karvina.
CONTENTS 1| THE DECISION MAKING ON STRATEGY IN THE CONTEXT OF BUSINESS EXCELLENCE
MODELS: THE PERFORMANCE AND STRATEGY Pavel Adámek, Radka Bauerová, Jana Kadlubcová, Šárka Zapletalová
10| TECHNOLOGY ACCEPTANCE MODEL IN ONLINE SHOPPING: A LITERATURE REVIEW
Radka Bauerová 19| KNOWLEDGE MANAGEMENT IN SME SECTOR COMPANIES PARTICIPATING IN THE PUBLIC
PROCUREMENT MARKET IN THE LIGHT OF EMPIRICAL RESEARCH Arkadiusz Borowiec
26| MONETIZATION OF INTERNET SERVICES FOR THE SEGMENT OF SMALL AND MEDIUM
BUSINESSES Josef Botlík, Martin Nováček
36| THE CONCEPT 5C OF TACTICAL MARKETING IN FINANCIAL SERVICES
Veronika Braciníková, Kateřina Matušínská 48| DECISION-MAKING PROCESSES IN DEALING WITH PROBLEMS IN CUSTOMER SERVICE
AREA Šárka Čemerková, Daniel Kvíčala
57| BPMS OPEN SOURCE TOOLS AND BASIC APPROACH FOR ITS COMPARISON
Radim Dolák, Josef Botlík 65| ELEMENTS OF ONLINE ADVERTISING INFLUENCING CONSUMER BEHAVIOR: THEORETICAL
INSIGHTS Viktorija Grigaliūnaitė, Lina Pilelienė
75| PEOPLE AND COMMUNICATION IN CRM PROCESS IN SMALL AND MEDIUM SIZED CZECH
ENTERPRISES Adéla Chromčáková, Halina Starzyczná, Michal Stoklasa
84| DECISION-MAKING BARRIERS AND OPTIMIZATION IN THE DEVELOPMENT OF CRM
APPLICATIONS Milena Janakova
93| EMPLOYEE EVALUATION – CASE STUDY USING EIGENVECTOR METHOD
Zuzana Kiszová
99| SOCIAL MEDIA MARKETING IN THE CZECH REPUBLIC: SYSTEMATIC LITERATURE REVIEW OF THE CURRENT ACADEMIC RESEARCH Martin Klepek
107| DECISION PROCESS AND TOTAL VALUE ADDED TAX DUE OPTIMISATION IN SMALL AND
MEDIUM SIZED ENTERPRISES Angelika Kútna, Norbert Gyurian
116| PROSPECTS FOR INCREASING INTERNATIONAL TRADE VOLUMES OF MICRO AND SMALL ENTERPRISES IN SELECTED SECTORS IN POLAND Teresa Łuczka, Joanna Małecka
126| DECISION- MAKING SUPPORT INTRODUCTION OF A NEW PRODUCT FOR THE CONSUMER
MARKET - A REVIEW OF APPROACHES Ievgenii Maistrenko
132| BEHAVIOUR PATTERNS OF POLISH START-UPS
Joanna Małecka, Teresa Łuczka 138| DECISION MAKING SOFTWARE FOR SMALL AND MEDIUM ENTERPRISES
Jiří Mazurek 145| DEPENDENCE OF SME EMPLOYMENT ON MACROECONOMIC FACTORS
Elena Mielcová 154| THE IMPORTANCE OF CONSTRUCTIVE CRITICAL ANALYSIS OF PROFIT CREATION AND
QUANTIFICATION FOR A DECISION-MAKING ON ITS ALLOCATION Renáta Pakšiová
164| IMPACT OF COLOR TEMPERATURE ON THE EFFECTIVENESS OF ADVERTISING
SPOKESPERSON Lina Pilelienė, Viktorija Grigaliūnaitė
171| PAIRWISE COMPARISON MATRIX AND ITS APPLICATION TO RANKING ALTERNATIVES
Jaroslav Ramík 180| WHY MANAGERS MAKE UNETHICAL MANAGERIAL DECISIONS
Ján Rudy 185| COUNTERFACTUAL IMPACT EVALUATION IN INTERNAL ENVIRONMENT OF ENTERPRISES
Žaneta Rylková, Karel Stelmach, Petr Vlček
191| THE INCENTIVES FOR THE RATIONAL USE OF THE HEALTH CARE SYSTEM RESOURCES MANAGING THE NONCOMMUNICABLE DISEASES Rimantas Stašys, Arnoldas Jurgutis, Arvydas Martinkėnas, Kristupas Žegunis
197| THE RELATIONSHIP BETWEEN LABOUR PRODUCTIVITY OF SMES IN EUROZONE AND
GOVERNMENT SPENDING ON RESEARCH AND DEVELOPMENT Radmila Stoklasová
205| LOYALTY TO TWO BRANDS OF BEER OF THE SAME PRODUCER
František Sudzina 211| PERFORMANCE ASSESSMENT AS A BASELINE FOR DECISION MAKING IN SOCIAL GOAL-
ORIENTED ORGANIZATIONS Jarmila Šebestová, Zuzana Palová
220| THE IMPLEMENTATION OF AGILE PROCESS SIMULATION IN THE ENTERPRISES PRACTICE Dalibor Šimek, Roman Šperka
231| THE IMPACT OF ADVERTISING ON COMPANY KPIS AND CUSTOMER BEHAVIOR IN MAREA SIMULATION MODEL Roman Šperka, Michal Halaška
240| MARKETING COMMUNICATION IN AN ONLINE ENVIRONMENT IN B2B MARKETS
Filip Štroch
246| RESEARCH IN CUSTOMER PREFERENCES SELECTING INSURANCE SERVICES: A CASE STUDY OF LITHUANIA Vilma Tamulienė, Vytautas Pilipavičius
253| THE DECISION MAKING OF SMALL AND MEDIUM-SIZED ENTERPRISES TO ENTER FOREIGN MARKETS Šárka Zapletalová
262| THE LEGITIMACY OF THE IMPLEMENTATION OF THE REQUIREMENTS OF ISO 9001: 2015
IN SMALL AND MEDIUM-SIZED ORGANIZATIONS Dominik Zimon, Teresa Gajewska
1
THE DECISION MAKING ON STRATEGY IN THE CONTEXT OF BUSINESS EXCELLENCE MODELS: THE PERFORMANCE AND STRATEGY Pavel Adámek, Radka Bauerová, Jana Kadlubcová, Šárka Zapletalová Silesian University in Opava School of Business Administration in Karviná, Department of Business Economics and Management Univerzitní nám. 1934/3 Karviná, 733 40 Czech Republic e-mail: [email protected], [email protected], [email protected], [email protected] Abstract The growing interest in total quality management as strategic support to obtain a sustainable competitive advantage is enabling organizations to achieve superior performance. The critical factors of business excellence models are management value, principles, and techniques necessary to yield the desired effects on the company´s performance. The paper focuses on decision making on a strategy of Czech SMEs in the context of business excellence models. The objective of the paper is to specify the relationship between strategy and performance (improvements) of Czech SMEs in the context of business excellence models. The enterprises included in the study are those enterprises that are incorporated in the Czech Republic. A total of 490 enterprises participated in the study, and the main primary data collection instrument was a questionnaire-interview. The findings of the statistical analysis show the influence of selected internal variables on the decision-making the process of Czech SMEs on strategy and relationship between strategy and performance. Keywords: business excellence model, decision making, performance, strategy JEL codes: F23, M16 1. Introduction
Organizations everywhere, of all types and sizes, are under constant pressure to improve their business performance. It can be used to assess and improve any aspect of an organization, including leadership, strategy and planning, people, information and knowledge and other aspects. To help in this process, many are turning to business excellence models, such as the EFQM Excellence Model. The business excellence models can be used as a business-wide framework in a holistic, focused and practical way. Business excellence models are frameworks that when applied within an organization can help to focus thought and action in a more systematic and structured way that should lead to increased performance. The models are holistic in that they focus on all areas and dimensions of an organization, and in particular, factors that drive performance. These models are internationally recognized as both providing a framework to assist the adoption of business excellence principles, and an effective way of measuring how thoroughly this adoption has been incorporated. One of the fundamental questions in the field of business performance is how companies achieve and sustain competitive advantages and pursue business excellence. The company chooses markets and strategies that maximize its core competencies. It makes choices between competing opportunities based on knowledge of the market and the business environment in which it operates, now and into the future. The internationalization of entrepreneurship activities ranks among long-lasting strategic decisions; these decisions result in significant changes, running the company being the most relevant. Company strategy is an effective tool in improving company performance not only in the domestic market but also in foreign markets. The strategy is a process that can allow an organization to concentrate its resources on the optimal opportunities with the objectives of increasing sales and achieving a sustainable competitive advantage (Kotler, 2012). If the market in which the company operates is foreign, its business strategy will be an international business strategy that defines the way to compete across the word (Lasserre, 2007).
Various empirical studies have been done to investigate the relationship between strategy and company performance with varied conclusions. The objective of this paper is to determine the relationship between business strategy and international performance of Czech small and medium-sized enterprises in international markets. In this research study, strategy and other internal factors (managers´ abilities, resources, company size, company age, industry) were investigated as factors influencing the success of
2
international activities. The study is based on primary data collected from a recent survey of Czech SMEs. The relationships are analyzed using relevant regression techniques. The paper is organized into three parts. The first part of the paper outlines selected theories dealing with the business strategy and international performance, and business excellence models. The second part of the paper aims to present and then interpret results of the survey carried out among Czech SMEs. Finally, the last section provides the conclusion of the research and offers a discussion of the most important implications. The results of the analysis are discussed, and further recommendations are provided for managers in the last section.
This paper offers several contributions to international business research and attempts to answer calls for studies that span across the disciplines. In particular, the paper pays attention to the key role of selected factors for the development of international activities. Therefore we extend international entrepreneurship studies by suggesting that the international performance is depending not only on their investment in research and development but also on strategy and other factors. Although we use a single small country, the Czech Republic, as a laboratory to test our theoretical propositions, our study is clearly situated within the domain of business studies, since its focus is on the effects of strategy on the success of international activities. We offer a new angle on a business theory by focusing on the effects of the company strategy on the performance of international activities in international markets. Our study helps to advance the theoretical development of the role of company strategy in international activities. 2. Theoretical Framework and Research Hypotheses
Truly excellent organizations are those organizations that strive to satisfy their owners by what they achieve, the way they achieve it, as well as by what they can reach, and by the certainty that the obtained results will be maintained in the future. To achieve business excellence, equal importance should be attributed both to the non-financial and financial measuring of success, instead of focusing on the financial perspective only. Generally speaking, excellence means that what we are doing well today should be done even better and more wisely tomorrow, especially compared to the competition, to fully satisfy all interest groups. Business excellence frameworks can be described as an integrated set of proven business practices designed to increase business performance across a broad range of organizations (Gloet and Samson, 2017). Certainly, the concept of business excellence has, for at least three decades, been at the center stage of management theory and practices. Business Excellence is defined as a high level of maturity of a company/organization regarding management and result achievement (Zdrilić and Dulčić, 2016). Business excellence is about developing and strengthening the management systems and processes of an organization to improve performance and create value for stakeholders. Business Excellence is much more than having a quality system in place. It is about achieving excellence in everything that an organization does (including leadership, strategy, customer focus, information management, people, and processes) and most importantly achieving superior business results. Business Excellence is often described as outstanding practices in managing the organization and achieving results, all based on a set of fundamental concepts or values.
According to Bandyopadhyay and Nair (2015), the findings suggested organizations that successfully implement business excellence develop the ability to respond to change, a capability that was becoming more critical as the pace of change increases. This capability leads to benefits for many of the organization’s stakeholders. For an organization, excellence should mean clear dedication of leaders and managers to continuous improvement of all key processes, creativity and innovation, work conditions, teamwork, motivation level and general organizational culture (Zdrilić and Dulčić, 2016). At the employee level, excellence starts with their commitment to achieving results without re-work, readiness to take on responsibility, continuous learning, improvement, and simplicity in everything they do. The fundamental thought, underlying business excellence is the idea that quality should not be focused only on products and services produced by the organization (Evans, 2008). It should be actually embedded in the practice of organization management, or, in other words, quality should be the fundamental value of the organization’s management. If good management principles are designed and implemented, the consequence should be good results. This idea leads us to the term of performance excellence that can be considered a synonym for business excellence. Performance excellence is associated with the integrated approach to management of organizational performances resulting in the delivery of continuously improved values to customers and stakeholders, thus contributing to organizational sustainability, increase in the overall organizational efficiency and capacity, as well as organizational and personal learning.
There are different views on how to measure organizational performance. According to Kanji (2007) understanding that excellence refers to organizational outcomes and achievements, whereas TQM is a set of principles and practices that guide the organization. Viewed through this lens, quality enables or drives organizational excellence and organizational excellence results – at least in part – from quality. Excellence
3
comes from habit, not singular events or activities. The key is defining the habits that support continual growth and development instead of a particular set of performance metrics. These habits include (and you may have others to add): strategy, structure, processes, people, recognized, results, customer loyalty, and leadership. Successful organizations can make judgments about the ‘balance’ of outcomes to be achieved across their key stakeholder groups and reflect that balance in developing and monitoring the value delivered by their corporate strategies.
The organization sets effective strategies by considering where the organization has come from, what it has learned, and where it is going. This includes consideration of the context in which it operates, knowledge of customer groups and market segments, past performance, discharge of legal responsibilities and minimisation of harm. Companies practically apply the strategy seriously as a tool that can be utilized to fast track their performances. The strategy is a process that can allow an organization to concentrate its resources on the optimal opportunities with the objectives of increasing sales and achieving a sustainable competitive advantage (Kotler, 2012). Greenley (1986) noted that strategic planning has potential advantages and intrinsic values that eventually, translate into improved company performance. According to Kotter (1996), the strategy can be used as a means of repositioning and transforming the organization. The essence of optimal strategy making is to build a market position strong enough and an organization capable enough to produce successful performance despite potent competition and internal difficulties. Porter (1996) has defined strategy as a creation of a unique and vulnerable position of trade-offs in competing, involving a set of activities that neatly fit together, that are simply consistent, reinforce each other and ensure optimization of effort. Company performance refers to the metrics relating to how a particular request is handled, or the act of performing; of doing something successfully; using knowledge as distinguished from merely possessing it. It is the outcome of all of the company´s operations and strategies (Aaltonen and Ikåvalko, 2002).
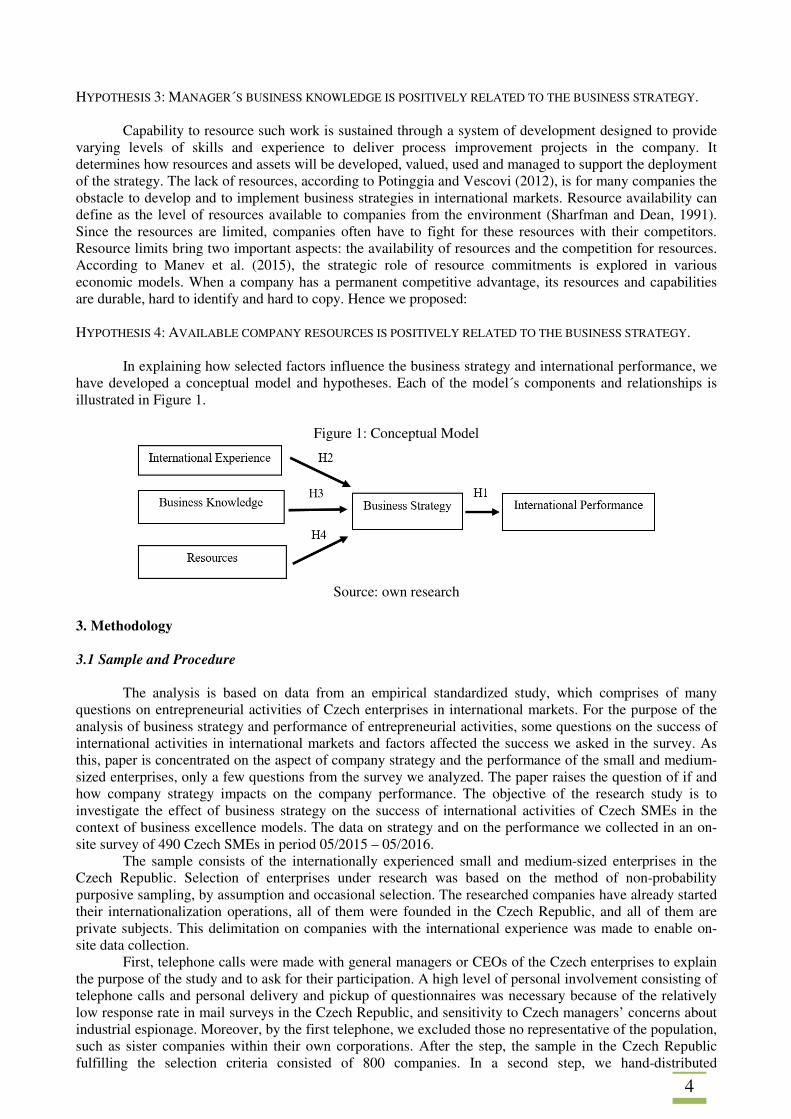
If the company operates internationally, the corporate strategy will be an international corporate strategy which will incorporate the choice of regions and countries in the company portfolio (Lasserre, 2007). A business strategy is then used as an umbrella term to denote the broad range of strategic options open to the company, including both organizational and functional management strategy, product/market strategies, and diversification strategies (Barringer and Greening, 1998). It consists of integrated decisions, actions or plans that will help to achieve target goals. Thus, the following hypothesis is formulated. HYPOTHESIS 1: BUSINESS STRATEGY IS POSITIVELY RELATED TO THE INTERNATIONAL PERFORMANCE.
Knowledge transfer in a company can define as the process by which one unit of knowledge is influenced by the experience. Experience are built through shared hands-on experience amongst the members of the organization and between the members of the organization and its customers, suppliers and affiliated companies. Skills and know-how are acquired and accumulated by individuals through experience at work. International experience makes necessary resources for enhancing the international competitiveness of companies. International experiences are important resources for enhancing the international competitiveness of companies. Experiences are built through shared hands-on experience amongst the members of the organization. Skills and know-how are acquired and accumulated by individuals through experiences at work. Filatotchev et al. (2009) proved that international performance depends significantly on managers´ international experience. This international business experience may have involved working in multinational companies, or previous involvement in the business strategy of the local company (Filatotchev et al. 2009). Hence: HYPOTHESIS 2: MANAGER´S INTERNATIONAL EXPERIENCE IS POSITIVELY RELATED TO THE BUSINESS STRATEGY.
Company throughout the world strive to develop and retain high caliber staff who drives companies
performance to greater heights.The importance of human resources has thus got the central position in the strategy of the company. The company maximizes its strategic advantage by harnessing the knowledge and expertise of its people (particularly managers) and the knowledge embedded in the organizational systems. According to North and Kumta (2014), the knowledge retains rationalization potentials (through the transfer best practices) and differentiation potentials (through the combination knowledge). International activities may require specific knowledge of the internationalization process. Managers with previous experiences, capabilities, knowledge and learning may lead to the creation, discovery, and exploitation of opportunities in international markets, and thus positively affect international performance. Hence we proposed:
4
HYPOTHESIS 3: MANAGER´S BUSINESS KNOWLEDGE IS POSITIVELY RELATED TO THE BUSINESS STRATEGY. Capability to resource such work is sustained through a system of development designed to provide
varying levels of skills and experience to deliver process improvement projects in the company. It determines how resources and assets will be developed, valued, used and managed to support the deployment of the strategy. The lack of resources, according to Potinggia and Vescovi (2012), is for many companies the obstacle to develop and to implement business strategies in international markets. Resource availability can define as the level of resources available to companies from the environment (Sharfman and Dean, 1991). Since the resources are limited, companies often have to fight for these resources with their competitors. Resource limits bring two important aspects: the availability of resources and the competition for resources. According to Manev et al. (2015), the strategic role of resource commitments is explored in various economic models. When a company has a permanent competitive advantage, its resources and capabilities are durable, hard to identify and hard to copy. Hence we proposed: HYPOTHESIS 4: AVAILABLE COMPANY RESOURCES IS POSITIVELY RELATED TO THE BUSINESS STRATEGY.
In explaining how selected factors influence the business strategy and international performance, we have developed a conceptual model and hypotheses. Each of the model´s components and relationships is illustrated in Figure 1.
Figure 1: Conceptual Model
Source: own research
3. Methodology 3.1 Sample and Procedure
The analysis is based on data from an empirical standardized study, which comprises of many
questions on entrepreneurial activities of Czech enterprises in international markets. For the purpose of the analysis of business strategy and performance of entrepreneurial activities, some questions on the success of international activities in international markets and factors affected the success we asked in the survey. As this, paper is concentrated on the aspect of company strategy and the performance of the small and medium-sized enterprises, only a few questions from the survey we analyzed. The paper raises the question of if and how company strategy impacts on the company performance. The objective of the research study is to investigate the effect of business strategy on the success of international activities of Czech SMEs in the context of business excellence models. The data on strategy and on the performance we collected in an on-site survey of 490 Czech SMEs in period 05/2015 – 05/2016.
The sample consists of the internationally experienced small and medium-sized enterprises in the Czech Republic. Selection of enterprises under research was based on the method of non-probability purposive sampling, by assumption and occasional selection. The researched companies have already started their internationalization operations, all of them were founded in the Czech Republic, and all of them are private subjects. This delimitation on companies with the international experience was made to enable on-site data collection.
First, telephone calls were made with general managers or CEOs of the Czech enterprises to explain the purpose of the study and to ask for their participation. A high level of personal involvement consisting of telephone calls and personal delivery and pickup of questionnaires was necessary because of the relatively low response rate in mail surveys in the Czech Republic, and sensitivity to Czech managers’ concerns about industrial espionage. Moreover, by the first telephone, we excluded those no representative of the population, such as sister companies within their own corporations. After the step, the sample in the Czech Republic fulfilling the selection criteria consisted of 800 companies. In a second step, we hand-distributed
5
questionnaires to the top managers and CEOs. Trained research assistants helped the top managers and CEOs complete the questionnaire, and explained any items that the respondents wished to have clarified. This procedure resulted in 600 matched questionnaires, out of which 110 we eliminated due to the incompleteness of responses. Thus 490 (a response rate of 81.7%) questionnaires were used in the subsequent data analysis and statistical processing. The final sample consisted of companies with an average age of 22 years (minimum one; maximum 188), an average size of 54 employees (minimum one; maximum 27000). The sample comes from a variety of industries: about 57.2% in manufacturing, and 60.3% in services.
The method of the oral questioning and a questionnaire as the principal instrument applied for researching the relationship between strategy and performance of entrepreneurial activities. The instrument used in the survey, a structured questionnaire, contains five fields of varying degrees of complexity relating to the area of entrepreneurial activities. The questionnaire consists of closed, semi-closed and opened questions. The questions were designed while based on the information gained from experts from business and universities and previous research. In some questions, particularly those related to the entry mode choice and market choice, simple and complex scales were used, mostly the Likert-type scale (5 = strongly agree to 1 = strongly disagree). Also, the questionnaire also included four questions related to the company background (the type of a business sector; the size of the company measured by the number of employees; the year of company foundation;). The questionnaire was pre-tested for the instrument validity by 20 managers. In interviews, the managers were asked to respond to the items measuring the theoretical construct. They were also asked to identify any ambiguities revealed in the questionnaire draft. Based on the feedback some minor changes of wording were made. 3.2 Variables and Measurement
DEPENDENT VARIABLES
The international performance and business strategy are our dependent variables. International PERFORMANCE comprises traditional measures of the money-making activities of the company. Consistent with previous research (e.g. Uhlenbruck and DeCastro 2000; Wales et al. 2013; Keupp and Gassmann 2009; Onkelinx et al. 2016) we used as the indicator of the international performance financial indicator. As the financial indicator of the performance of international activities, we used foreign turnover (as the proportion of turnover outside of the Czech Republic in the company´s total turnover). The interviewed CEOs were asked to state their foreign turnover to total turnover of the previous year. In a comparison of different measures, Weinzimmer et al. (1998) recommend this as the most appropriate indicator. We can see, in Table 1, that the mean foreign turnover is 51.63 percent. Business strategies can be classified according to their level and types. There are various business strategy typologies. This research study focuses on Porter's typology of business strategies.A business STRATEGY is a set of fundamental choices which define its long-term objectives, its value proposition to the market, how it intends to build and sustain a competitive business system and how it organizes itself. These competitive advantages lead to three generic competitive strategies: cost leadership strategy, differentiation strategy, and focus strategy. Interviewers presented to respondents a list of nine possible strategic approaches to establishing the business strategy in international markets. Respondents indicated their approach used. Questions on business strategy were presented in the form of five-point scales (5 = strongly agree, 4 = agree, 3 = neutral, 2 = disagree, and 1 = strongly disagree) to ensure maximal respondent specificity. All multi-item measures achieved superior or adequate reliability scores in tests using Cronbach´s alpha. The alpha values range from 0.73 to 0.80.The majority of respondents used the strategic differentiation approach.
INDEPENDENT VARIABLES
Our explanatory variables are managers´ abilities (international experience and business knowledge), strategy, and resources. The selected areas were modified based on interviews to reflect the context of family businesses. International EXPERIENCE with international activities we measured at the company level using of prior work international experiences (by years), in keeping with prior management research (Beckman and Burton, 2008; Walske and Zacharakis, 2009). International experience includes prior work in a company with international entrepreneurial activities. The average rate of international experience as measured by the number of years was seven years (minimum 0 years, maximum 60 years). Business KNOWLEDGE measures knowledge of international markets and knowledge of practices in international markets by company management. The knowledge of international markets plays in the process of the realization of international entrepreneurial activities key role. Knowledge contributes to increased
6
competitiveness of entrepreneurial subjects in international markets. Questions on business knowledge of managers were presented in the form of five-point scales (5 = strongly agree, 4 = agree, 3 = neutral, 2 = disagree, and 1 = strongly disagree) to ensure maximal respondent specificity. All multi-item measures achieved superior or adequate reliability scores in tests using Cronbach´s alpha. The alpha values range from 0.74 to 0.82. RESOURCES were measured via the list of eight the most significant available resources (tangible and intangible resources) for international activities. Respondents indicated the most valuable resources that have been available for international activities. Most of the resources among sampled companies was international contacts and specialized knowledge. Questions on company resources were presented in the form of five-point scales (5 = strongly agree, 4 = agree, 3 = neutral, 2 = disagree, and 1 = strongly disagree) to ensure maximal respondent specificity. All multi-item measures achieved superior or adequate reliability scores in tests using Cronbach´s alpha. The alpha values range from 0.80 to 0.84.
CONTROL VARIABLES
Guided by previous literature and empirical evidence, we have included several control variables.
Among the company-level determinants of company performance, the company´s size and company age are the two widely used demographic characteristics of companies. Therefore, we include company SIZE (natural logarithm of the number of employees) and company AGE (in years). In addition to the company-level determinants, we also include INDUSTRY level of the company: whether the company operates in the manufacturing or service sector. We included a dummy variable for industry level, as Acquaah and Yasai-Ardekani (2007), did because the distinction between manufacturing and services obviously has a considerable effect on company performance. 3.3 Data Analysis
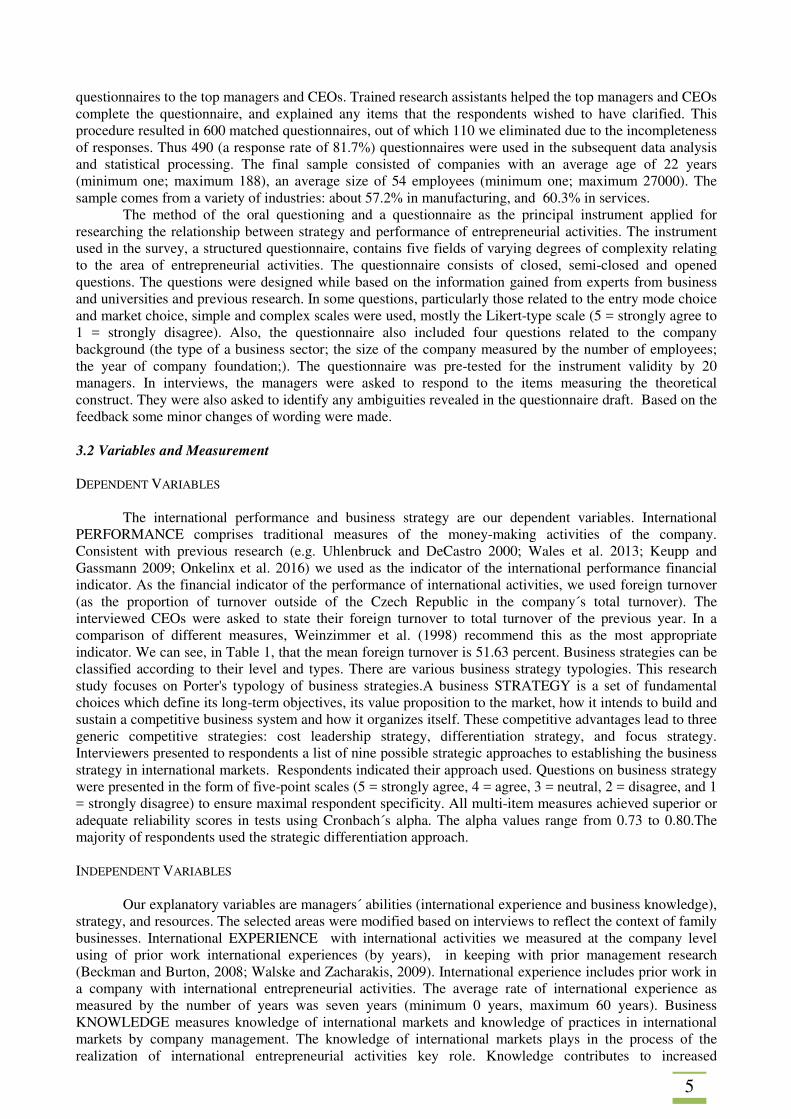
To test the theoretically derived model, the data we processed in the SPSS. The descriptive statistics we described in Table 1. Table 1 illustrated the intercorrelations among the variables were obtained from the Pearson Correlations Matrix. The values indicating intercorrelations among the predictor's variables were low, ranging from 0.19 to 0.38 (p < 0.01), thus indicating the independence of the variables used for measuring the predictors. As the descriptive data revealed a promising variation as well as correlation among the variables included in the model, we have reason to believe that it would find support for the hypotheses.
Table 1: Descriptive Statistics and Pearson Correlation Mean SD 1 2 3 4 5 6 7 8 Performance 51.63 28.52 1 Strategy 2.38 0.78 -0.023 1 Size 53.98 60.53 0.272** -0.109* 1 Age 21.53 27.86 0.326** 0.064 0.388** 1 Industry 2.26 1.64 -0.209** -0.050 -0.121* -0.106* 1 Experience 6.40 8.54 0.186** 0.062 0.091 0.074 -0.021 1 Knowledge 3.88 0.86 0.373** -0.039 0.305** 0.187** -0.064 0.161** 1 Resources 2.21 0.46 0.057 -0.035 0.065 -0.036 0.028 -0.031 0.107* 1
Significance level: *p<0.05; **p<0.01 Source: own research
We used hierarchical moderated regression analysis (ordinary least-square OLS regression
techniques) to test hypotheses. Before testing the hypotheses, multicollinearity in the dataset we controlled. For this purpose, the VIF values for the independent variables we calculated. In our analysis, the VIF values were all below 1.4, which is a relatively low and acceptable level. Consequently, there is no reason to believe that there is any major multicollinearity in the regression that could lead to misinterpreting or overestimating the final model and its predictive ability. Table 2 present results. 4. Results
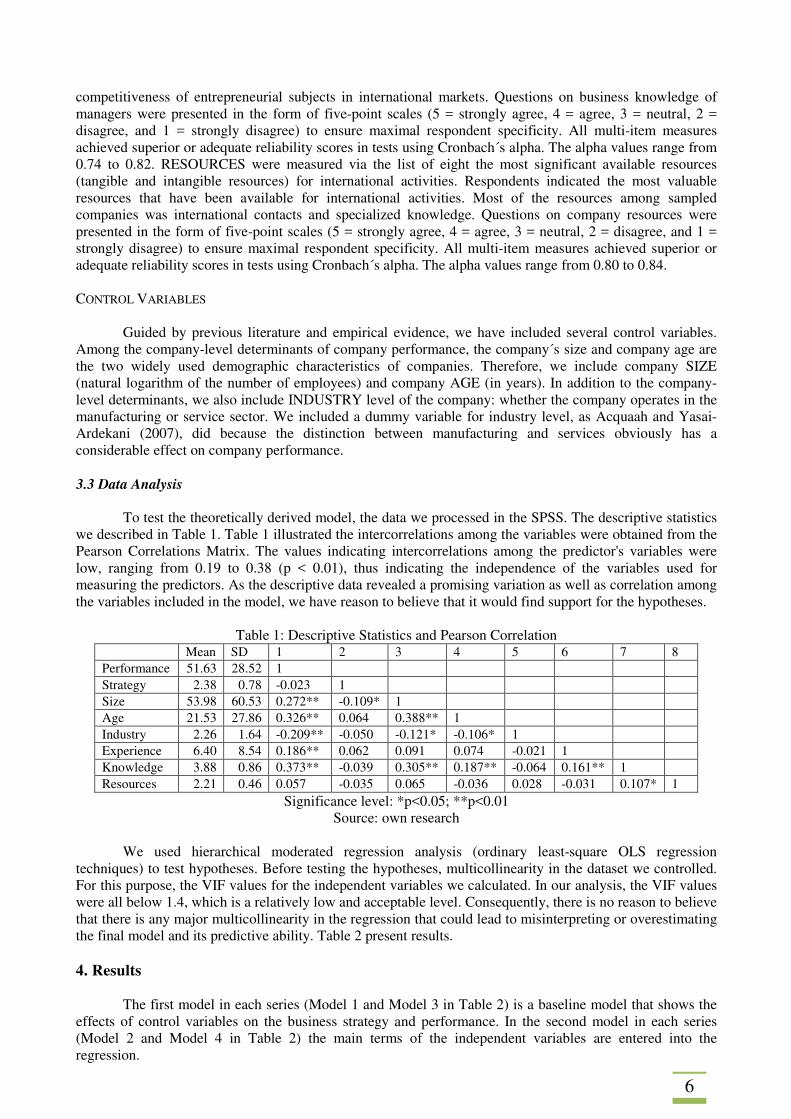
The first model in each series (Model 1 and Model 3 in Table 2) is a baseline model that shows the effects of control variables on the business strategy and performance. In the second model in each series (Model 2 and Model 4 in Table 2) the main terms of the independent variables are entered into the regression.
7
Table 2: Determinants of Business Strategy Determinants of Business Strategy
Dependent Variables (standardized regression coefficients)
Effects of Business Strategy on Performance Dependent Variables
(standardized regression coefficients) Model 1 Model 2 Model 3 Model 4 Size 0.168** 0.110* 0.156** 0.141** Age -0.025 -0.032 0.248** 0.250** Industry 0.001 0.002 -0.164** -0.164** Strategy H1 0.094* Experience H2 -0.054 Knowledge H3 0.198** Resources H4 0.094* R2 0.26 0.74 0.16 0.17 Δ R2 0.17 0.58 0.15 0.16 Adj. R2 0.26 0.48 0.16 0.01 F 3.076* 4.609** 21.85 17.41
Significance level: *p<0.05; **p<0.01 Source: own research
Overall, the control variables explain little of the variance. Model 1 and Model 2 indicate that SIZE
has a positive and significant effect on the business strategy, while AGE and INDUSTRY has an insignificant effect on business strategy.
International EXPERIENCE in Model 2 has a negative and insignificant effect on business strategy. The Hypothesis 2 is not supported. The business KNOWLEDGE variable as indicates the Model 2 has a positive and significance effect on business strategy, in line with Hypothesis 3. The variable RESOURCES in Model 2 is positive and significant; Hypothesis 4 is supported.
Model 3 and Model 4 shows that SIZE, AGE and INDUSTRY have a significant effect on the performance. As indicated in Model 4, business strategy positive influenced performance, supporting Hypothesis 1.
3. Conclusion
Internationalization is the most complex strategy that any company can undertake. This strategy is likely to become increasingly necessary.There is no single set of criteria that defines excellence for the individual or business. Business excellence models represent a systematic, integrated and more permanent approach to improvement, i.e. an integrated strategy for gradual achievement of business excellence (Zdrilić and Dulčić, 2016). They make it possible to objectively determine the position of a company on the scale of excellence, but also to reveal the company’s weaknesses or strengths. The discovered weaknesses are a precious potential for improvement, and this should be used as a driving force for the next level of organization advancement. In the business strategy framework, a successful business is one which sustains an attractive relative position for the company. The success of the process of internationalization of company depends in large part on the formulation and implementation of the business strategy.
This paper examines the effects of business strategy on the performance of international activities of Czech SMEs. The primary objective of the paper was to investigate the effect business strategy on the performance of international activities of Czech small and medium-sized enterprises, namely the effect of international experience, business knowledge of managers, and resources on business strategy. The results show that the business knowledge of managers (Hypothesis 3), and company resources (Hypothesis 4) are significantly associated with the business strategy of Czech SMEs in international markets. Also, the results show that the business strategy of Czech enterprises in international markets (Hypothesis 1) has positively effect on the performance of companies in international markets. All business strategies in themselves appear to be sensible, logical and coherent, highlighting the advantages and benefits that a company could gain by using either approach.
This study has some contributions, including theoretical contributions and managerial implications. This study has provided some theoretical contributions as follows: It gives additional insight into the relationship between business strategy and performance of international activities. Furthermore, we also provide some implications for managers and owners of Czech enterprises. This study helps the managers to understand how the business strategy affect the performance of international activities. Managers and owners should give more attention to the development of business knowledge and international experience of own managers and employees.
8
This study also has some limitations. First, this study has been conducted only in one small country, in the Czech Republic. Indeed, this will affect the generalizability issue. This study only examined the relationship between selected characteristics of business strategy and performance of international activities. Hence, the researcher cannot justify it as a generalization for all European countries. Due to time and cost limitations, this study employed a cross-sectional study. Thus, it only portrays the phenomena at a single point in time, and it will not be able to reflect the long-term effects of the change.
This research study suggests several recommendations for future study. The study might be extended to multiple countries in Europe. The future study might use the longitudinal study which describes phenomena in the long-term. The longitudinal study may lead practitioners and academicians to understand the causal relationship between business strategy and performance of international activities. Acknowledgement
The paper is the outcome of the Project Organizational Excellence - Resources and Dynamic Capabilities in Models of "Business Excellence" in the Context of Sustainability Performance Improvement. This project and the paper was supported by the Ministry of Education, Youth and the Sports Czech Republic within the Institutional Support for Long-term Development of a Research Organization in 2017. References AALTONEN, P., IKÅVALKO, H. (2002). Implementing Strategies Successfully. Integrated Manufacturing Systems, vol. 13, no.6, pp.415-18. BANDYOPADHYAY, P. K., NAIR, S. (2015). Impact of Business Excellence Model on Firm's Business Results (Findings from Literature Survey and Research Agenda). International Journal of Economy, Management and Social Sciences, vol. 4, no. 2, February, pp. 233-236. BARRINGER, B. R., GREENING, D. W. (1998). Small Business Growth through Geographic Expansion: A Comparative Case Study. Journal of Business Venturing, no. 13, pp. 467-492. EVANS, J. R. (2008). Quality & Performance Excellence: Management, Organization and Strategy. 5th Ed. Mason, OH: Thomson South Western. FILATOTCHEV, I., LIU, X., BUCK, T., WRIGHT, M. (2009). The Export Orientation and Export Performance of High-Technology SMEs in Emerging Markets: The Effects of Knowledge Transfer by Returnee Entrepreneurs. Journal of International Business Studies, no. 40, pp. 1005-1021. GLOET, M., SAMSON, D. (2017). Linking Knowledge Management, Business Excellence, and Innovation Performance. In Proceedings of the 50th Hawaii International Conference on System Sciences. Hawaii, Waikoloa: University of Hawaii at Manoa, pp. 4536-4545. GREENLEY, G. (1986). Does Strategic Planning Improve Company Performance? Long Range Planning, vol. 19, no. 2, April, pp. 101-109. KANJI, G. K. (2002). Measuring Business Excellence. London/New York: Routledge. KANJI, G. K. (2007). Performance Measurement: A System Approach for Excellence. In Proceedings of the 51st EOQ Congress. Prague: European Organization for Quality. [online]. Available from: http://www.eoq.org/fileadmin/user_upload/Documents/Congress_proceedings/Prague_2007/Proceedings/047_EOQ_FP_-_Kanji_Gopal_-_C2.pdf. KNIGHT, G. (2000). Entrepreneurship and Marketing Strategy: The SME Under Globalization. Journal of International Marketing, vol. 8, no. 2, pp. 12-32. KOTLER, P. (2012). Kotler on Marketing. New York: Simon & Schuster. KOTTER, J. P. (1996). Leading Change. Boston Mass: Harvard Business School Press.
9
LASSERRE, P. (2007). Global Strategic Management” 2nd ed. New York: Palgrave MacMillan. MANEV, I. M., MANOLOVA, T. S., HARKINS, J. A., GYOSHEV, B. S. (2015). Are Pure or Hybrid Strategies Right for New Ventures in Transition Economies? International Small Business Journal, vol. 33, no. 8, pp. 951-973. NORTH, K., KUMTA, G. (2014). Knowledge Management: Value Creation Through Organizational Learning. London, UK: Springer International Publishing Switzerland. PONTIGGIA, A., VESCOVI, T. (2012) When Size Does Matter. Trends of SMEs Internationalization Strategies in Chinese Economy. [online]. Available from: http://papers.ssrn.com/sol3/papers.cfm? abstract_id=2182486. PORTER, M. E. (1996). What is strategy? Harvard Business Review, vol. 74, no. 6, pp. 61-75. SHARFMAN, M. P., DEAN, J. W. (1991). Conceptualizing and Measuring the Organizational Environment: A Multidimensional Approach. Journal of Management, vol. 17, no. 4, pp. 681-700. TALWAR, B. (2011). Comparative Study of Framework, Criteria and Criterion Weighting of Excellence Models. Measuring Business Excellence, vol. 15, no. 1, pp. 49-65. ZDRILIĆ, Ž. DULČIĆ. (2016). Business Excellence as a Success Factor for the Performance of Large Croatian Enterprises. Management, vol. 21, no. 1, pp. 145-162.
10
TECHNOLOGY ACCEPTANCE MODEL IN ONLINE SHOPPING: A LITERATURE REVIEW Radka Bauerová Silesian University in Opava School of Business Administration in Karviná Department of Business Economics and Management Univerzitní náměstí 1934/3 Karviná, 733 40 Czech Republic E-mail: [email protected]
Abstract
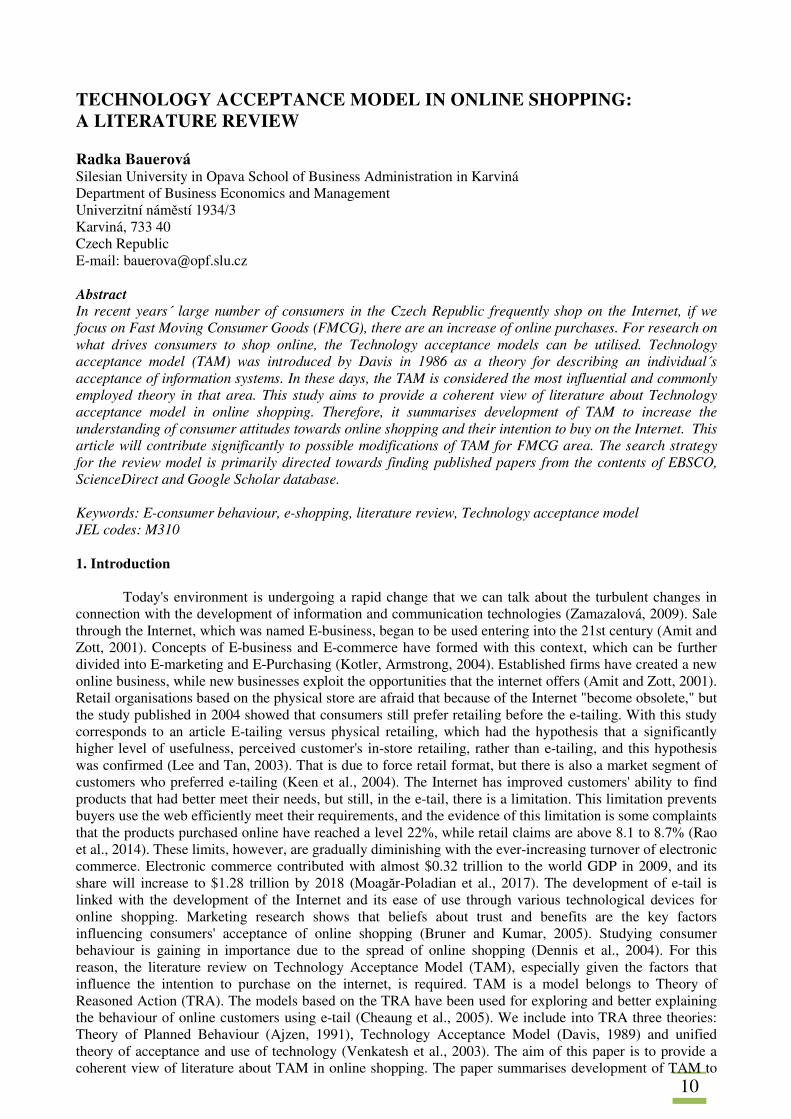
In recent years´ large number of consumers in the Czech Republic frequently shop on the Internet, if we focus on Fast Moving Consumer Goods (FMCG), there are an increase of online purchases. For research on what drives consumers to shop online, the Technology acceptance models can be utilised. Technology acceptance model (TAM) was introduced by Davis in 1986 as a theory for describing an individual´s acceptance of information systems. In these days, the TAM is considered the most influential and commonly employed theory in that area. This study aims to provide a coherent view of literature about Technology acceptance model in online shopping. Therefore, it summarises development of TAM to increase the understanding of consumer attitudes towards online shopping and their intention to buy on the Internet. This article will contribute significantly to possible modifications of TAM for FMCG area. The search strategy for the review model is primarily directed towards finding published papers from the contents of EBSCO, ScienceDirect and Google Scholar database. Keywords: E-consumer behaviour, e-shopping, literature review, Technology acceptance model JEL codes: M310 1. Introduction
Today's environment is undergoing a rapid change that we can talk about the turbulent changes in connection with the development of information and communication technologies (Zamazalová, 2009). Sale through the Internet, which was named E-business, began to be used entering into the 21st century (Amit and Zott, 2001). Concepts of E-business and E-commerce have formed with this context, which can be further divided into E-marketing and E-Purchasing (Kotler, Armstrong, 2004). Established firms have created a new online business, while new businesses exploit the opportunities that the internet offers (Amit and Zott, 2001). Retail organisations based on the physical store are afraid that because of the Internet "become obsolete," but the study published in 2004 showed that consumers still prefer retailing before the e-tailing. With this study corresponds to an article E-tailing versus physical retailing, which had the hypothesis that a significantly higher level of usefulness, perceived customer's in-store retailing, rather than e-tailing, and this hypothesis was confirmed (Lee and Tan, 2003). That is due to force retail format, but there is also a market segment of customers who preferred e-tailing (Keen et al., 2004). The Internet has improved customers' ability to find products that had better meet their needs, but still, in the e-tail, there is a limitation. This limitation prevents buyers use the web efficiently meet their requirements, and the evidence of this limitation is some complaints that the products purchased online have reached a level 22%, while retail claims are above 8.1 to 8.7% (Rao et al., 2014). These limits, however, are gradually diminishing with the ever-increasing turnover of electronic commerce. Electronic commerce contributed with almost $0.32 trillion to the world GDP in 2009, and its share will increase to $1.28 trillion by 2018 (Moagăr-Poladian et al., 2017). The development of e-tail is linked with the development of the Internet and its ease of use through various technological devices for online shopping. Marketing research shows that beliefs about trust and benefits are the key factors influencing consumers' acceptance of online shopping (Bruner and Kumar, 2005). Studying consumer behaviour is gaining in importance due to the spread of online shopping (Dennis et al., 2004). For this reason, the literature review on Technology Acceptance Model (TAM), especially given the factors that influence the intention to purchase on the internet, is required. TAM is a model belongs to Theory of Reasoned Action (TRA). The models based on the TRA have been used for exploring and better explaining the behaviour of online customers using e-tail (Cheaung et al., 2005). We include into TRA three theories: Theory of Planned Behaviour (Ajzen, 1991), Technology Acceptance Model (Davis, 1989) and unified theory of acceptance and use of technology (Venkatesh et al., 2003). The aim of this paper is to provide a coherent view of literature about TAM in online shopping. The paper summarises development of TAM to
11
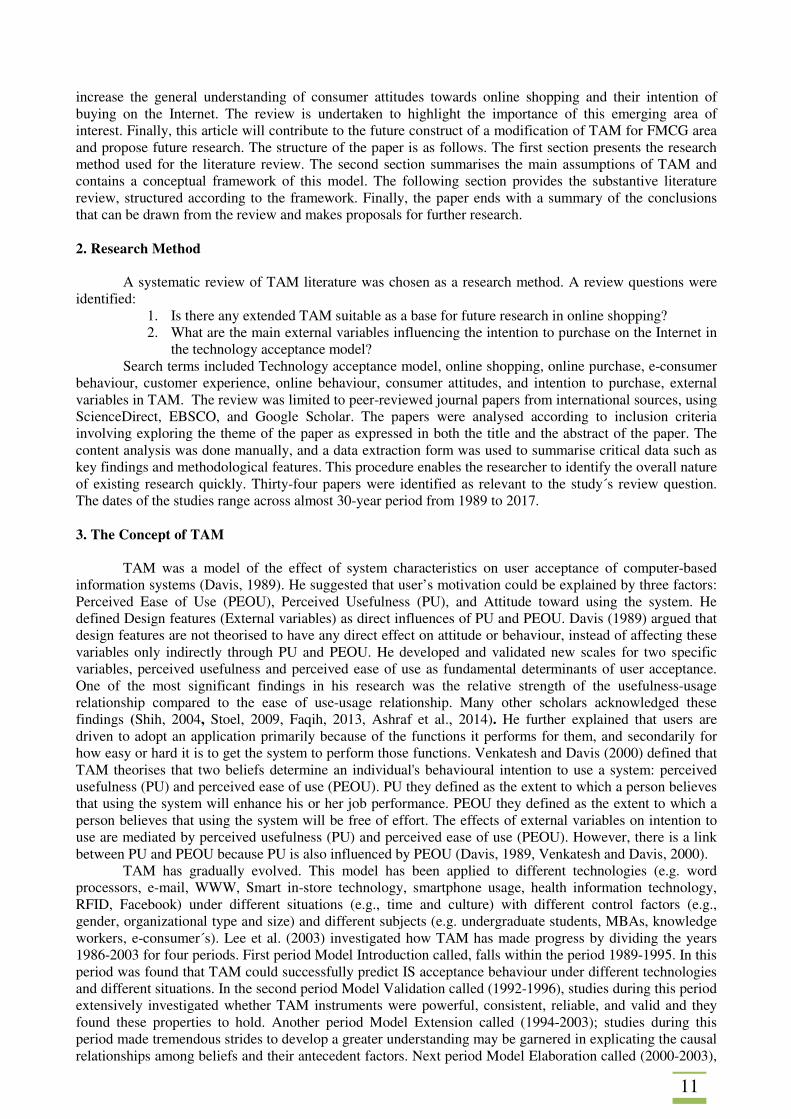
increase the general understanding of consumer attitudes towards online shopping and their intention of buying on the Internet. The review is undertaken to highlight the importance of this emerging area of interest. Finally, this article will contribute to the future construct of a modification of TAM for FMCG area and propose future research. The structure of the paper is as follows. The first section presents the research method used for the literature review. The second section summarises the main assumptions of TAM and contains a conceptual framework of this model. The following section provides the substantive literature review, structured according to the framework. Finally, the paper ends with a summary of the conclusions that can be drawn from the review and makes proposals for further research. 2. Research Method
A systematic review of TAM literature was chosen as a research method. A review questions were identified:
1. Is there any extended TAM suitable as a base for future research in online shopping? 2. What are the main external variables influencing the intention to purchase on the Internet in
the technology acceptance model? Search terms included Technology acceptance model, online shopping, online purchase, e-consumer
behaviour, customer experience, online behaviour, consumer attitudes, and intention to purchase, external variables in TAM. The review was limited to peer-reviewed journal papers from international sources, using ScienceDirect, EBSCO, and Google Scholar. The papers were analysed according to inclusion criteria involving exploring the theme of the paper as expressed in both the title and the abstract of the paper. The content analysis was done manually, and a data extraction form was used to summarise critical data such as key findings and methodological features. This procedure enables the researcher to identify the overall nature of existing research quickly. Thirty-four papers were identified as relevant to the study´s review question. The dates of the studies range across almost 30-year period from 1989 to 2017. 3. The Concept of TAM
TAM was a model of the effect of system characteristics on user acceptance of computer-based information systems (Davis, 1989). He suggested that user’s motivation could be explained by three factors: Perceived Ease of Use (PEOU), Perceived Usefulness (PU), and Attitude toward using the system. He defined Design features (External variables) as direct influences of PU and PEOU. Davis (1989) argued that design features are not theorised to have any direct effect on attitude or behaviour, instead of affecting these variables only indirectly through PU and PEOU. He developed and validated new scales for two specific variables, perceived usefulness and perceived ease of use as fundamental determinants of user acceptance. One of the most significant findings in his research was the relative strength of the usefulness-usage relationship compared to the ease of use-usage relationship. Many other scholars acknowledged these findings (Shih, 2004, Stoel, 2009, Faqih, 2013, Ashraf et al., 2014). He further explained that users are driven to adopt an application primarily because of the functions it performs for them, and secondarily for how easy or hard it is to get the system to perform those functions. Venkatesh and Davis (2000) defined that TAM theorises that two beliefs determine an individual's behavioural intention to use a system: perceived usefulness (PU) and perceived ease of use (PEOU). PU they defined as the extent to which a person believes that using the system will enhance his or her job performance. PEOU they defined as the extent to which a person believes that using the system will be free of effort. The effects of external variables on intention to use are mediated by perceived usefulness (PU) and perceived ease of use (PEOU). However, there is a link between PU and PEOU because PU is also influenced by PEOU (Davis, 1989, Venkatesh and Davis, 2000).
TAM has gradually evolved. This model has been applied to different technologies (e.g. word processors, e-mail, WWW, Smart in-store technology, smartphone usage, health information technology, RFID, Facebook) under different situations (e.g., time and culture) with different control factors (e.g., gender, organizational type and size) and different subjects (e.g. undergraduate students, MBAs, knowledge workers, e-consumer´s). Lee et al. (2003) investigated how TAM has made progress by dividing the years 1986-2003 for four periods. First period Model Introduction called, falls within the period 1989-1995. In this period was found that TAM could successfully predict IS acceptance behaviour under different technologies and different situations. In the second period Model Validation called (1992-1996), studies during this period extensively investigated whether TAM instruments were powerful, consistent, reliable, and valid and they found these properties to hold. Another period Model Extension called (1994-2003); studies during this period made tremendous strides to develop a greater understanding may be garnered in explicating the causal relationships among beliefs and their antecedent factors. Next period Model Elaboration called (2000-2003),
12
was characterised as the elaboration of TAM in two key ways. The first way is to develop the next generation TAM that synthesises the previous effects and second way is to resolve the limitations raised by previous studies. In this period was created a TAM2 that identifying and theorising about the general determinants of perceived usefulness (Venkatesh and Davis, 2000). This period is still ongoing and has been proposed and investigated many modifications of TAM such as:
• TAM3 – combine TAM2 and the model of the determinants of perceived ease of use, and develop an integrated model of technology acceptance. TAM3 in presents a complete nomological network of the determinants of individual´s IT adoption and use. (Venkatesh and Bala, 2008)
• Model of TAM extension and antecedents – study integrates e-shopping quality, enjoyment, and trust into a technology acceptance model to understand consumer acceptance of e-shopping. (Ha and Stoel, 2009)
• Extending the TAM to explore the factors that affect Intention to Use an Online Learning Community – extend the external variables as online Course Design, User Interface Design, and Previous Online Learning Experience. (Liu et al., 2010)
• An integrated model of TAM for smartphone usage – study integrates motivation for ritualised use and motivation for instrumental use. (Joo and Sang, 2013)
• An extended TAM – the moderating effect of individual-level cultural values on user´s acceptance of E-learning in developing countries. Extend TAM include subjective norms and quality of work life and four cultural dimensions. (Tarhini et al., 2017)
4. Technology Acceptance Model in Online Shopping
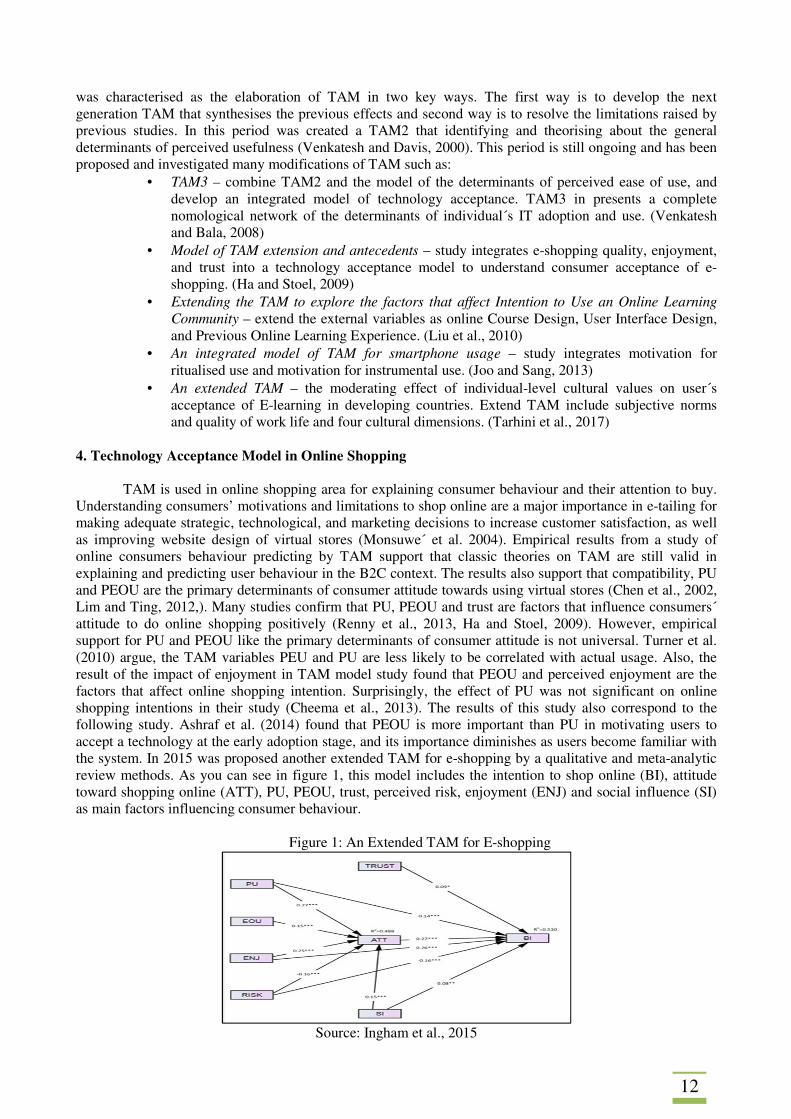
TAM is used in online shopping area for explaining consumer behaviour and their attention to buy. Understanding consumers’ motivations and limitations to shop online are a major importance in e-tailing for making adequate strategic, technological, and marketing decisions to increase customer satisfaction, as well as improving website design of virtual stores (Monsuwe´ et al. 2004). Empirical results from a study of online consumers behaviour predicting by TAM support that classic theories on TAM are still valid in explaining and predicting user behaviour in the B2C context. The results also support that compatibility, PU and PEOU are the primary determinants of consumer attitude towards using virtual stores (Chen et al., 2002, Lim and Ting, 2012,). Many studies confirm that PU, PEOU and trust are factors that influence consumers´ attitude to do online shopping positively (Renny et al., 2013, Ha and Stoel, 2009). However, empirical support for PU and PEOU like the primary determinants of consumer attitude is not universal. Turner et al. (2010) argue, the TAM variables PEU and PU are less likely to be correlated with actual usage. Also, the result of the impact of enjoyment in TAM model study found that PEOU and perceived enjoyment are the factors that affect online shopping intention. Surprisingly, the effect of PU was not significant on online shopping intentions in their study (Cheema et al., 2013). The results of this study also correspond to the following study. Ashraf et al. (2014) found that PEOU is more important than PU in motivating users to accept a technology at the early adoption stage, and its importance diminishes as users become familiar with the system. In 2015 was proposed another extended TAM for e-shopping by a qualitative and meta-analytic review methods. As you can see in figure 1, this model includes the intention to shop online (BI), attitude toward shopping online (ATT), PU, PEOU, trust, perceived risk, enjoyment (ENJ) and social influence (SI) as main factors influencing consumer behaviour.
Figure 1: An Extended TAM for E-shopping
Source: Ingham et al., 2015
13
Scholars suggest that TAM with attitude is preferable to basic TAM when studying e-shopping because TAM with attitude explains 45% of the variation in e-shopping intention, which is almost 9% higher than for basic TAM. They believe that their extended version of TAM that includes trust, perceived risk, enjoyment (PE), and social influence may serve as a good intermediate dispositional model between the properties of the web platform for buying online, of the customer and the e-merchant and the other online purchase behaviour (Ingham et al., 2015). With this study corresponding a conclusion of the online shopping behaviour model integrating personality traits, perceived risk and technology acceptance study. Scholars in this study tested an integrated model and found that both attitude and trust acted as significant mediators (Wann-Yih and Ching-Ching, 2015). Scholars also focused on the link between e-satisfaction and e-trust and found that e-satisfaction has a more significant impact on repeat online shopper´s loyalty (Moriuchi and Takahashi, 2016). In contrast to these views, other researchers think that perceived enjoyment is overlooked in many contexts especially the lack of presence of alternatives justified this disregard of the importance of enjoyment. For example, Shamy and Hassanein (2017) support that higher PE will positively influence behavioural intention (BI) to use technology, but their hypothesis about the stronger relation between PE and BI for conventional technologies was not confirmed. In corresponding with this view, it is very important to understand the behaviour of the customer making purchases online. A well-chosen modification of the TAM can be useful for understanding customer needs and then overall positive consumer rating. 4.1. The Main External Variables Influencing E-consumer Behaviour in TAM Elaboration Period
The following studies include consumer-oriented research examines psychological characteristics, and technology-focused research has explored the technical specifications of the internet business. The study on what drives consumers to shop online claims that there should be exogenous factors in TAM framework (Monsuwe´ et al., 2004). That study shows that attitude toward online shopping and intention to shop online are not only affected by ease of use, usefulness and enjoyment, but also by exogenous factors like “consumer traits”, “situational factors”, “product characteristics”, “previous online shopping experiences”, and “trust in online shopping” (Gefen et al., 2003, Monsuwe´ et al., 2004, Wu, 2013). Empirical results from consumer traits classifies as demographic factors – “age”, “gender”, “education”, and “income” (Burke, 2002) and as personality characteristics – “expertise” (Ratchford et al., 2001), “self-efficacy” (Eastin and LaRose, 2000, Faqih, 2013) and “need for interaction” (Dabholkar and Bagozzi, 2002). In contrast to these views, Hernandez et al. (2011) analysed whether individuals´ socioeconomic characteristics (age, gender and income) influence their online shopping behaviour. They analysed individuals who often make purchases on the internet. The results of their research show that socioeconomic variables moderate neither the influence of the previous use of the internet nor the perceptions of e-commerce. Deductive research state “time pressure”, “lack of mobility”, “geographical distance”, “need for special items” and “attractiveness of alternatives” as situational factors (Monsuwe´ et al. 2004). In addition, the other study suggests that “website quality” (consists of four dimensions: “website design”, “customer service”, “privacy/security”, and “atmospheric/experiential”) is another variable factor (Ha and Stoel, 2009). They by modifying TAM found that the most important factor influencing the customer's behaviour is a website design. Their study provides important implications for e-tailers whose website developers must keep in mind that customers are not only web users with trust/safety and information needs, but also shoppers with service and experiential needs. Most scholars acknowledge that usefulness and ease of use significantly determine individual attitudes toward e-shopping (Ha and Stoel, 2009, Yulihasri et al., 2011, Shih, 2004, Monsuwe´ et al., 2004). The result of Factors that Influence Customer´s Buying Intention on Shopping Online (FICBISO) study claims that compatibility and security are other important factors toward attitude in online shopping (Yulihasri et al., 2011). Empirical results from consumer acceptance of e-shopping in Turkey added other factors influencing PEOU that has an impact on consumer behaviour in TAM. They added “perceived information quality”, “perceived service quality” and “perceived system quality” as e-quality-related factors (Çelik and Yilmaz, 2011). Study of exploring the influence of “perceived risk” as another external variable and “internet self-efficacy” on consumer online shopping intentions. The study demonstrated that perceived risk negatively influences the behavioural intention to use online shopping for purchase in Jordan and internet self-efficacy has a positive influence on PEOU and PU (Faqih, 2013). However, this study has empirically revealed that perceived risk does not influence both PEOU to shop online and PU toward online shopping. The next study examined the blog reader´s trusting belief in the blogger is significant about the perceived usefulness of the blogger´s recommendations and how the blog reader´s perceptions influence his/her attitude and purchasing behaviour online. Researchers found that PU of “blogger´s recommendations and trust” had a significant influential effect on blog users´ attitude towards and intention to shop online (Chin‐Lung et al., 2013). We can add another external factor (blogger´s recommendations and trust) affecting customer behaviour based
14
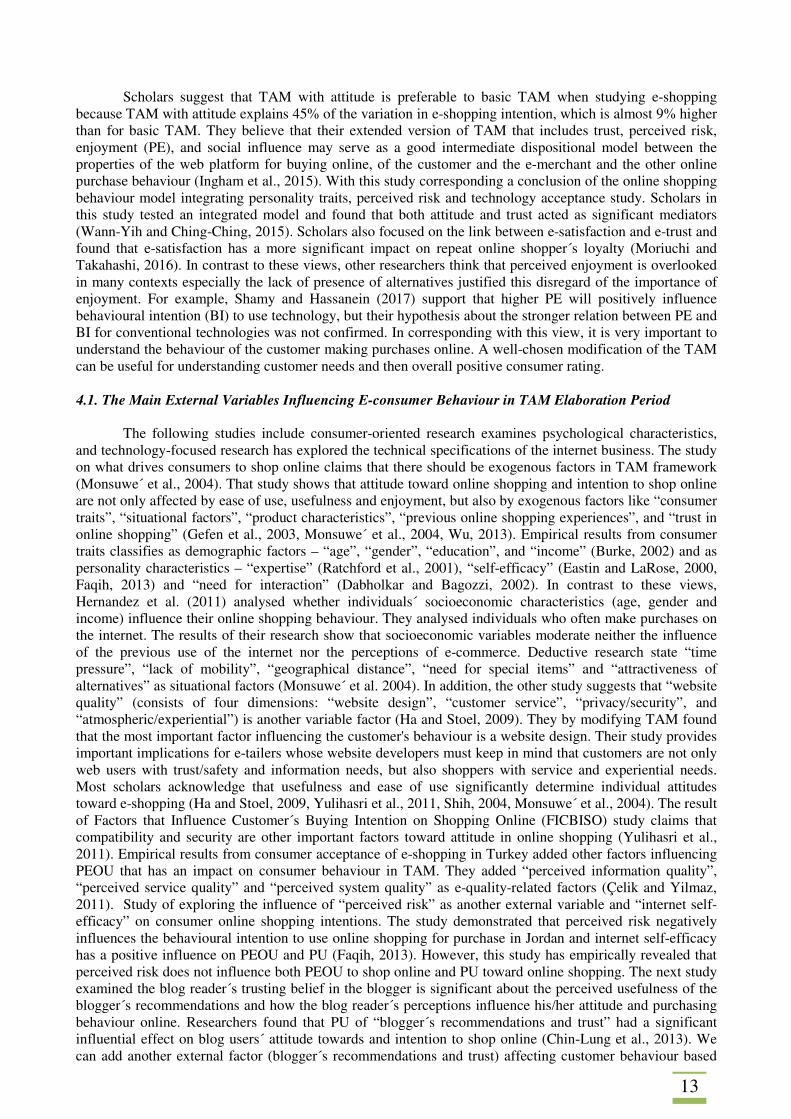
on the results of this study. In 2016 was tested seven types of perceived risks in online shopping, including the following: “social risk”, “financial risk”, privacy risk”, “supply risk”, “quality risk”, “health risk” and “after sale risk” (Almatarneh, 2016). The study acknowledges that all types of perceived risks influence the consumers purchasing behaviour negatively. The main external variables discussed, and their effects are listed in Table 1.
Table 1: The Main External Variables
Source: author´s summary
5. Conclusions
This paper provides a coherent view of technology acceptance model from the past to present focused on online shopping area. The review helps researchers understand which modification of TAM is adequate to choose as well as which external factors are good to choose for creating extended TAM in the online shopping area. If we choose a modification of TAM and external variables well, then it can be useful for prediction of e-consumer behaviour, knowing what drives consumers to shop online, understanding e-consumer needs and customising the online interface. This research is especially helpful to those researchers who want to apply TAM in their research. It has been found that in the models under consideration in the online shopping area, the results of the significance of basic factors (PU, PEOU) are different. Some studies state that PU and PEOU do not have such a meaning in influencing customer attitudes. These suggest the importance of looking for other factors that are significant in influencing customer attitudes online. Of course, there are also studies in which the influence of PU and PEOU as the basic determinants has been confirmed. The demographic structure (Hwang and Lee, 2012, Ashraf et al., 2014) of the respondents, as well as the technological maturity or the geographical and cultural aspects, can influence the differences in the results of the individual models. Another reason for the different results can be the structure of respondents surveyed. Most of the studies in the online shopping area examined a homogeneous group as students. In contrast to this view, King and He (2006) confirmed the value of using students as surrogates for professionals in some TAM studies. However, selecting only one customer segment may affect the results of the examined models.
One of the questions asked was to find out if there is any extended TAM suitable as a base for future research in online shopping. There is a lot of research about TAM in online shopping, but in 2015 was proposed extended TAM for online shopping. This extended TAM is suitable as a basis for future research in online shopping. This model differs from the original Technology Acceptance Model by focusing on the specifics of online trading and the added attitude factor. Due to the attitude factor, the model´s ability to increase by 9%. Variable factors (risk, enjoyment, social influence and trust) have been added to the model,
15
which has delayed researcher´s significant influence on behaviour and purchasing decisions. However, these variables are not the only ones found in the research.
The second question was to find the main external variables influencing the intention to purchase on the Internet in the Technology Acceptance Model. Main variables have been identified that statistically significantly affect the attitude of the behaviour of the customer. These variable factors are characterised by a certain homogeneity and can thus be divided into three groups. The first group consumer traits called include demographic factors (age, gender, education, income) and personality characteristics (expertise, self-efficacy, the degree of influencing by blogger´s recommendations and trust, need for interaction). The second group, called situational factors (time pressure, lack of mobility, geographical distance, need for special items and attractiveness of alternatives), is characterised by focusing on the facts that are associated with the benefits of making online purchases. The last group includes factors (product characteristics, previous online shopping experiences, perceived information, perceived service quality and system quality) which are related to the technological aspects of online purchasing and the product itself.
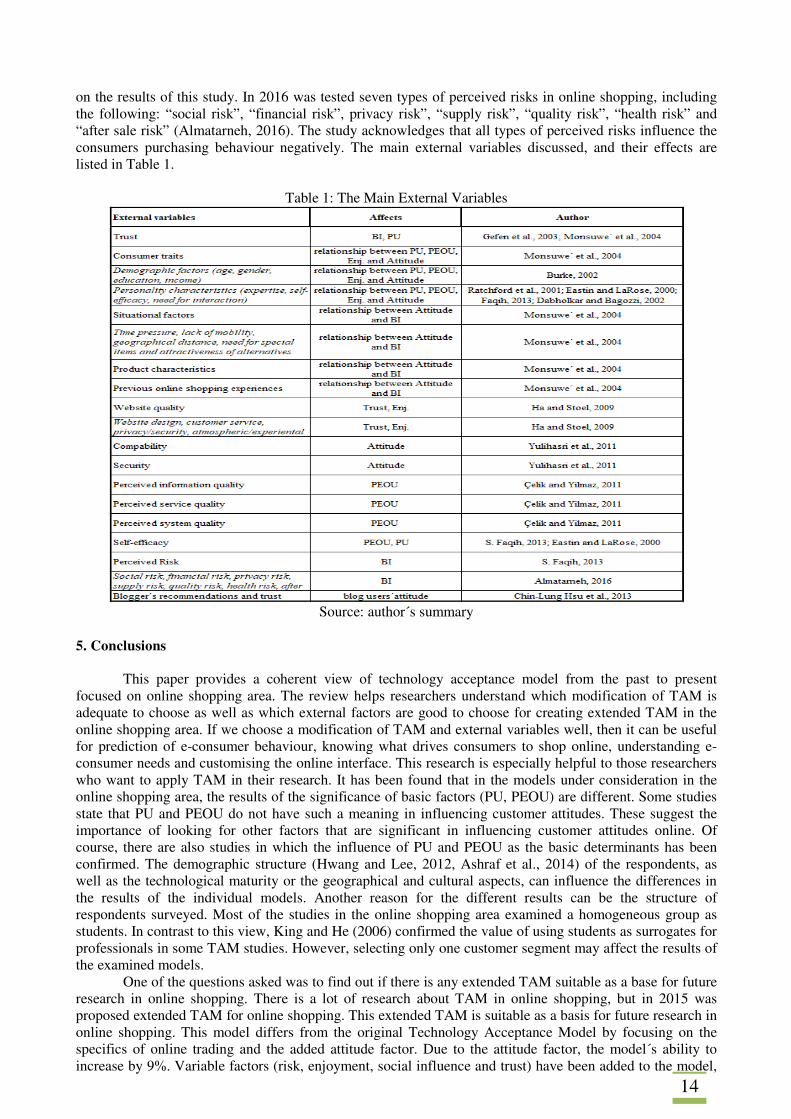
Regarding further research, we think that we can add appropriately selected external variables to this extended TAM for e-shopping with attitude to construct a suitable TAM modification for the Fast Moving Consumer Goods (FMCG) area. This area is specific both to the goods themselves (products are sold quickly, at a low price, have a limited consumption time and are quickly consumed) and to the perception of the online purchase of these goods. Therefore, quality of information, quality of services and website design could be added as variable factors influencing the attitude of the customer. The quality of the information factor has been chosen because it is important for the customer to know about this product type, for example, when it is the date of consumption of the purchased product, product composition, possible allergens, weight, and other important information needed to make a purchase decision. The quality of information is important given that the customer can not physically view the goods before buying and so it is important that the goods can bring the customer closer enough to minimise this disadvantage. Service quality has been chosen because it is very important for this type of product to store and logistics because it can have a great impact on durability of the product itself. Quality of service is also an important factor in the claim system, which can be very demanding and costly for this type of product when selling goods online. As FMCG are often purchased repeatedly, the quality of services is also important regarding saving marketing costs for acquiring new customers. Website quality has been selected because FMCG is a huge variety of product variations that need to be broken down so that customers can quickly navigate and switch to the products they need. On the basis of the above, a proposal for modifying the technology acceptance model for FMCG has been prepared. The graphical visualisation of the proposed model is shown in Figure 2.
Figure 2: Modification of TAM for FMCG
Source: author's proposal
The model will be tested by exploratory factor analysis to determine the group of variables behind
the common factor (latent variable). Confirmatory factor analysis will then be used for verification. Based on these two analyses should be TAM for FMCG accepted as a statistically significant model for explaining consumer behaviour and their attention to buy, or rejected. Acknowledgement
This paper was supported by the Student grant competition project SGS/7/2017: “Acceptance of technology from the perspective of marketing tools.”
16
References ALMATARNEH, N. (2016). Online Shopping Risks and Effect on Consumers Purchasing Behavior. International Journal of Online Marketing Research, vol. 2, no. 1, pp. 62–69. AMIT, R., ZOTT, C. (2001). Value creation in E-business. Strategic Management Journal, vol. 22, no. 6/7, pp. 493–520. ASHRAF, A., THONGPAPANL, N., AUH, S. (2014). The Application of the Technology Acceptance Model Under Different Cultural Contexts: The Case of Online Shopping Adoption. Journal of International Marketing, vol. 22, no. 3, pp. 68–93. BRUNER G., KUMAR, A. (2005). Explaining consumer acceptance of handheld Internet devices. Journal of Business Research, vol. 58, no. 5, pp. 553-558. BURKE, R. (2002). “Technology and the customer interface: what consumers want in the physical and virtual store”, Journal of the Academy of Marketing Science, vol. 30, no. 4, pp. 411-32. ÇELIK, H., YILMAZ, V. (2011). Extending the Technology Acceptance Model for Adoption of E-Shopping by Consumers in Turkey. Journal of Electronic Commerce Research, vol. 12, no. 2, p. 152-164. CHEEMA, U., RIZWAN, M., ALAL, R., DURRANI, F., SOHAIL, N. (2013). The Trend of Online Shopping in 21st Century: Impact of Enjoyment in Tam Model. Asian Journal of Empirical Research, vol. 3, no. 2, pp. 131–141. CHEN, L., GILLENSON, M., SHERRELL, L. (2002). Enticing online consumers: an extended technology acceptance perspective. Information & Management, vol. 39, no. 8, pp. 705–719. CHIN‐LUNG, H., LIN, J., CHIANG, H. (2013). The effects of blogger recommendations on customers’ online shopping intentions. Internet Research, vol. 23, no. 1, pp. 69–88. DABHOLKAR, P., BAGOZZI, R. (2002). An Attitudinal Model of Technology-Based Self-Service: Moderating Effects of Consumer Traits and Situational Factors. Journal of the Academy of Marketing Science, vol. 30, no. 3, pp. 184–201. DAVIS, F. (1989). Perceived usefulness, perceived ease of use, and user acceptance of information technology. MIS Quarterly, vol. 13, no. 3, pp. 319–339. DENNIS, C., FENECH, T., MERRILEES, B. (2004). E-retailing, New York: Routledge EASTIN, M., LAROSE, R. (2000). Internet Self-Efficacy and the Psychology of the Digital Divide. Journal of Computer-Mediated Communication, vol. 6, no. 1, pp. 0–0. FAQIH, K. (2013). Exploring the Influence of Perceived Risk and Internet Self-Efficacy on Consumer Online Shopping Intentions: Perspective of Technology Acceptance Model. International Management Review, vol. 9, no. 1, pp. 67-77. GEFEN, D., KARAHANNA, E., STRAUB, D.W. (2003). Trust and TAM in Online Shopping: An Integrated Model. MIS Quarterly, vol. 27, no. 1, pp. 51–90. HA, S., STOEL, L. (2009). Consumer e-shopping acceptance: Antecedents in a technology acceptance model. Journal of Business Research, Current Issues in Retailing: Relationships and Emerging Opportunities, vol. 62, no. 5, pp. 565–571. HERNÁNDEZ B., JIMÉNEZ, J., MARTÍN, M. (2011). Age, gender and income: do they really moderate online shopping behaviour? Online Information Review, vol. 35, no. 1, pp. 113–133.

17
HWANG, Y., LEE, K. (2012). Investigating the moderating role of uncertainty avoidance cultural values on multidimensional online trust. Information & Management, vol. 49, no. 3, pp. 171–176. INGHAM, J., CADIEUX, J., BERRADA, A. (2015). e-Shopping acceptance: A qualitative and meta-analytic review. Information & Management, vol. 52, no. 1, pp. 44–60. JOO, J., SANG, Y. (2013). Exploring Koreans’ smartphone usage: An integrated model of the technology acceptance model and uses and gratifications theory. Computers in Human Behavior, vol. 29, no. 6, pp. 2512–2518. KEEN, C., WETZELS, M., FEINBERG, R. (2004). E-tailers versus retailers: Which factors determine consumer preferences. Journal of Business Research, vol. 57, no. 7, pp. 685–695. KING, W., HE, J. (2006). A meta-analysis of the technology acceptance model. Information & Management, vol. 43, no. 6, pp. 740–755. KOTLER, P., ARMSTRONG, G. (2004). Marketing. Prague: Grada Publishing. LEE, K., TAN, S. (2003). E-retailing versus physical retailing: A theoretical model and empirical test of consumer choice. Journal of Business Research, vol. 56, no. 11, pp. 877–885. LEE, Y., KOZAR, K., LARSEN, K. (2003). The Technology Acceptance Model: Past, Present, and Future. Communications of the Association for information systems, vol. 12, no. 1, pp. 752-780. LIM, W., TING, D. (2012). E-shopping: an Analysis of the Technology Acceptance Model. Modern Applied Science, vol. 6, no. 4, pp. 49-62. LIU, I., CHEN, M., SUN, Y., WIBLE, D., KUO, CH. (2010). Extending the TAM model to explore the factors that affect Intention to Use an Online Learning Community. Computers & Education, vol. 54, no. 2, pp. 600–610. MOAGĂR-POLADIAN, S., Dumitrescu, G., TĂNASE, I. (2017). “Retail e-Commerce (E-tail) – evolution, characteristics and perspectives in China, the USA and Europe”. Global Economic Observer, vol. 5, no. 1, pp. 167-178. MONSUWÉ T., BENEDICT, G., RUYTER, D. (2004). What drives consumers to shop online? A literature review. International Journal of Service Industry Management, vol. 15, no. 1, pp. 102–121. MORIUCHI, E., TAKAHASHI, I. (2016). Satisfaction trust and loyalty of repeat online consumer within the Japanese online supermarket trade. Australasian Marketing Journal (AMJ), vol. 24, no. 2, pp. 146–156. RAO, S., RABINOVICH, E., RAJU, D. (2014). The role of physical distribution services as determinants of product returns in Internet retailing. Journal of Operations Management, vol. 32, no. 6, pp. 295–312. RATCHFORD, B., TALUKDAR, D., LEE. M. (2001). A Model of Consumer Choice of the Internet as an Information Source. International Journal of Electronic Commerce, vol. 5, no. 3, pp. 7–21. SHAMY N., HASSANEIN. K. (2017). A Meta-Analysis of Enjoyment Effect on Technology Acceptance: The Moderating Role of Technology Conventionality. In Proceedings of the 50th Hawaii International Conference on System Sciences. Honolulu: University of Hawai´i at M ānoa, pp. 4139-4147. SHIH, H. (2004). An empirical study on predicting user acceptance of e-shopping on the Web. Information & Management, vol. 41, no. 3, pp. 351–368. TARHINI, A., HONE, K., LIU, X., TARHINI, T. (2017). Examining the moderating effect of individual-level cultural values on users’ acceptance of E-learning in developing countries: a structural equation modeling of an extended technology acceptance model. Interactive Learning Environments, vol. 25, no.3, pp. 306–328.

18
TURNER, M., KITCHENHAM, B., BRERETON, P., CHARTERS, S. (2010). Does the technology acceptance model predict actual use? A systematic literature review. Information and Software Technology, vol. 52, no. 5, pp. 463–479. VENKATESH, V., BALA, H. (2008). Technology Acceptance Model 3 and a Research Agenda on Interventions. Decision Sciences, vol. 39, no. 2, pp. 273–315. VENKATESH, V., DAVIS, F.D. (2000). A Theoretical Extension of the Technology Acceptance Model: Four Longitudinal Field Studies. Management Science, vol. 46, no. 2, pp. 186–204. VENKATESH, V., MORRIS, M., DAVIS, G., DAVIS, F. (2003). User acceptance of information technology: towards a unified view, MIS Quarterly, vol. 27, no. 3, pp. 425-478. WANN-YIH W., CHING-CHING, K. (2015). An Online Shopping Behavior Model Integrating Personality Traits, Perceived Risk, and Technology Acceptance. Social Behavior & Personality: an international journal, vol. 43, no. 1, pp. 85–97. WU, I. (2013). The antecedents of customer satisfaction and its link to complaint intentions in online shopping: An integration of justice, technology, and trust. International Journal of Information Management, vol. 33, no. 1, pp. 166–176. YULIHASRI E., ISLAM, A., AMIR, K. (2011). Factors that Influence Customers’ Buying Intention on Shopping Online. International Journal of Marketing Studies, vol. 3, no. 1, pp. 128-139. ZAMAZALOVÁ, M. (2009). Marketing obchodní firmy. Prague: Grada Publishing.
19
KNOWLEDGE MANAGEMENT IN SME SECTOR COMPANIES PARTICIPATING IN THE PUBLIC PROCUREMENT MARKET IN THE LIGHT OF EMPIRICAL RESEARCH Arkadiusz Borowiec Poznan University of Technology Faculty of Engineering Management 11 Strzelecka Str. Poznan, 60-965 Poland e-mail: [email protected] Abstract
Knowledge is one of the basic resources of modern enterprises operating in a competitive market. Thanks to knowledge an enterprise can quickly adapt to changes in the environment, improve its market position or the level of product innovativeness. The article attempts to explore how and with what tools SME enterprises participating in a very competitive market of public procurement manage their knowledge. The results were obtained based on a questionnaire conducted electronically among 270 entities of various industries located in Poland, and which have participated in tender procedures at least once. The scope of the study covered the second half of 2016. The analysis of the results indicates underutilization of the opportunities stemming from knowledge management in SMEs participating in the public procurement market. It also points to the possibility of developing recommendations for business entities in order to effectively navigate the public procurement market and to improve statistics on acquiring orders in this manner. Keywords: management of knowledge, public procurement, small and medium companies JEL codes: D83, K00, K29 1. Introduction
In 2015 there were 117990 public procurement notices (UZP, 2016) published in the Polish Public Procurement Bulletin. The value of the public procurement market reached PLN 116.3M1, making it one of the largest markets in Poland's national economy. This trend is consistent with the size of the EU’s procurement market where it is currently estimated to be worth EUR 2100 billion, representing 19% of the Community's GDP (EC, 2014).
This market is governed by a series of laws and procedures. Companies acting as contractors and public bodies awarding public contracts shall be familiar with them. Moreover, the rules governing this area are among the most frequently revised legal norms2. It is enough to emphasize that the Polish public procurement system in 2015, apart from the Act on Public Procurement Law, also consisted of the following: 20 executive acts, 18 ordinances and 13 legal acts at Community level.
Being up to date with these rules requires business owners to keep acquiring knowledge constantly and keep improving their skills in this field. This is especially important for SMEs, where quantitative and qualitative features can make this process more difficult. According to Kozioł, M. the factors hindering the development of companies include, among others, a limited access to business information, inability to acquire, collect and use information from the environment, low level Internet resources utilization, gaps in qualification potential due to low employee competency and low ability and willingness to learn (Kozioł, 2013).
These facts indicate a need for a proper management of knowledge about public procurement market, in particular regarding SMEs, which participate in contracting procedures or intend to do so. Both foreign and domestic literature on the subject is full of knowledge on management in enterprises of the SME sector. A similar conclusion concerns publications on public procurement. In this case, however, the legal developments concerning the presentation or interpretation of existing legislation are predominant. Therefore, it is difficult to come across publications that would combine knowledge management with public procurement.
1 1 EURO amounts to approximately 4.2 PLN (as of 1.05.2017) 2 In 2015 they were amended four times.
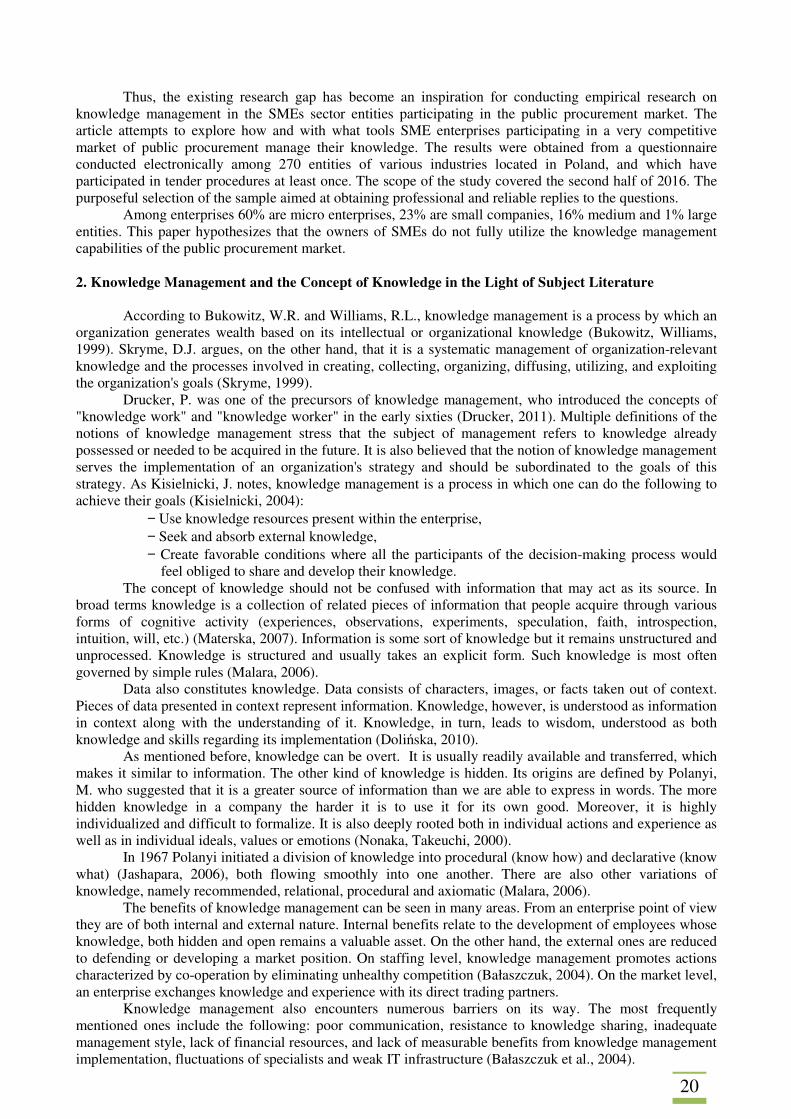
20
Thus, the existing research gap has become an inspiration for conducting empirical research on knowledge management in the SMEs sector entities participating in the public procurement market. The article attempts to explore how and with what tools SME enterprises participating in a very competitive market of public procurement manage their knowledge. The results were obtained from a questionnaire conducted electronically among 270 entities of various industries located in Poland, and which have participated in tender procedures at least once. The scope of the study covered the second half of 2016. The purposeful selection of the sample aimed at obtaining professional and reliable replies to the questions.
Among enterprises 60% are micro enterprises, 23% are small companies, 16% medium and 1% large entities. This paper hypothesizes that the owners of SMEs do not fully utilize the knowledge management capabilities of the public procurement market. 2. Knowledge Management and the Concept of Knowledge in the Light of Subject Literature
According to Bukowitz, W.R. and Williams, R.L., knowledge management is a process by which an organization generates wealth based on its intellectual or organizational knowledge (Bukowitz, Williams, 1999). Skryme, D.J. argues, on the other hand, that it is a systematic management of organization-relevant knowledge and the processes involved in creating, collecting, organizing, diffusing, utilizing, and exploiting the organization's goals (Skryme, 1999).
Drucker, P. was one of the precursors of knowledge management, who introduced the concepts of "knowledge work" and "knowledge worker" in the early sixties (Drucker, 2011). Multiple definitions of the notions of knowledge management stress that the subject of management refers to knowledge already possessed or needed to be acquired in the future. It is also believed that the notion of knowledge management serves the implementation of an organization's strategy and should be subordinated to the goals of this strategy. As Kisielnicki, J. notes, knowledge management is a process in which one can do the following to achieve their goals (Kisielnicki, 2004):
− Use knowledge resources present within the enterprise, − Seek and absorb external knowledge, − Create favorable conditions where all the participants of the decision-making process would
feel obliged to share and develop their knowledge. The concept of knowledge should not be confused with information that may act as its source. In
broad terms knowledge is a collection of related pieces of information that people acquire through various forms of cognitive activity (experiences, observations, experiments, speculation, faith, introspection, intuition, will, etc.) (Materska, 2007). Information is some sort of knowledge but it remains unstructured and unprocessed. Knowledge is structured and usually takes an explicit form. Such knowledge is most often governed by simple rules (Malara, 2006).
Data also constitutes knowledge. Data consists of characters, images, or facts taken out of context. Pieces of data presented in context represent information. Knowledge, however, is understood as information in context along with the understanding of it. Knowledge, in turn, leads to wisdom, understood as both knowledge and skills regarding its implementation (Dolińska, 2010).
As mentioned before, knowledge can be overt. It is usually readily available and transferred, which makes it similar to information. The other kind of knowledge is hidden. Its origins are defined by Polanyi, M. who suggested that it is a greater source of information than we are able to express in words. The more hidden knowledge in a company the harder it is to use it for its own good. Moreover, it is highly individualized and difficult to formalize. It is also deeply rooted both in individual actions and experience as well as in individual ideals, values or emotions (Nonaka, Takeuchi, 2000).
In 1967 Polanyi initiated a division of knowledge into procedural (know how) and declarative (know what) (Jashapara, 2006), both flowing smoothly into one another. There are also other variations of knowledge, namely recommended, relational, procedural and axiomatic (Malara, 2006).
The benefits of knowledge management can be seen in many areas. From an enterprise point of view they are of both internal and external nature. Internal benefits relate to the development of employees whose knowledge, both hidden and open remains a valuable asset. On the other hand, the external ones are reduced to defending or developing a market position. On staffing level, knowledge management promotes actions characterized by co-operation by eliminating unhealthy competition (Bałaszczuk, 2004). On the market level, an enterprise exchanges knowledge and experience with its direct trading partners.
Knowledge management also encounters numerous barriers on its way. The most frequently mentioned ones include the following: poor communication, resistance to knowledge sharing, inadequate management style, lack of financial resources, and lack of measurable benefits from knowledge management implementation, fluctuations of specialists and weak IT infrastructure (Bałaszczuk et al., 2004).
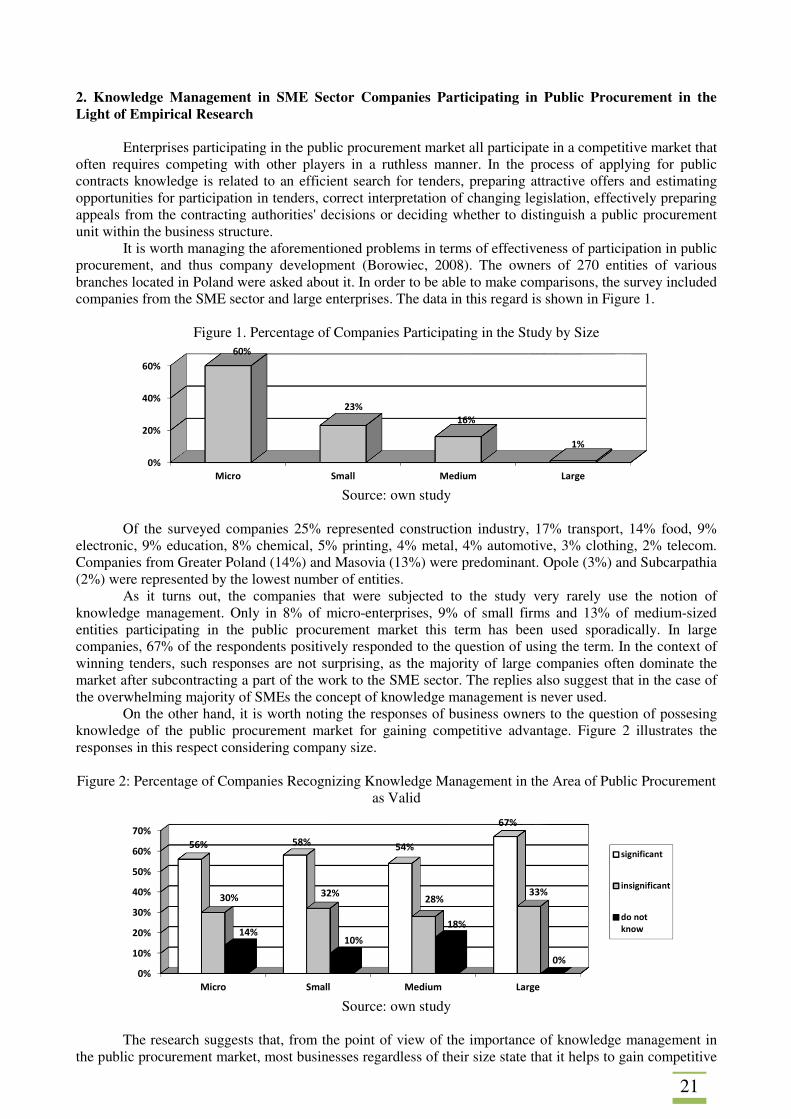
21
2. Knowledge Management in SME Sector Companies Participating in Public Procurement in the Light of Empirical Research
Enterprises participating in the public procurement market all participate in a competitive market that often requires competing with other players in a ruthless manner. In the process of applying for public contracts knowledge is related to an efficient search for tenders, preparing attractive offers and estimating opportunities for participation in tenders, correct interpretation of changing legislation, effectively preparing appeals from the contracting authorities' decisions or deciding whether to distinguish a public procurement unit within the business structure.
It is worth managing the aforementioned problems in terms of effectiveness of participation in public procurement, and thus company development (Borowiec, 2008). The owners of 270 entities of various branches located in Poland were asked about it. In order to be able to make comparisons, the survey included companies from the SME sector and large enterprises. The data in this regard is shown in Figure 1.
Figure 1. Percentage of Companies Participating in the Study by Size
Source: own study
Of the surveyed companies 25% represented construction industry, 17% transport, 14% food, 9%
electronic, 9% education, 8% chemical, 5% printing, 4% metal, 4% automotive, 3% clothing, 2% telecom. Companies from Greater Poland (14%) and Masovia (13%) were predominant. Opole (3%) and Subcarpathia (2%) were represented by the lowest number of entities.
As it turns out, the companies that were subjected to the study very rarely use the notion of knowledge management. Only in 8% of micro-enterprises, 9% of small firms and 13% of medium-sized entities participating in the public procurement market this term has been used sporadically. In large companies, 67% of the respondents positively responded to the question of using the term. In the context of winning tenders, such responses are not surprising, as the majority of large companies often dominate the market after subcontracting a part of the work to the SME sector. The replies also suggest that in the case of the overwhelming majority of SMEs the concept of knowledge management is never used.
On the other hand, it is worth noting the responses of business owners to the question of possesing knowledge of the public procurement market for gaining competitive advantage. Figure 2 illustrates the responses in this respect considering company size.
Figure 2: Percentage of Companies Recognizing Knowledge Management in the Area of Public Procurement
as Valid
Source: own study
The research suggests that, from the point of view of the importance of knowledge management in
the public procurement market, most businesses regardless of their size state that it helps to gain competitive
0%
20%
40%
60%
Micro Small Medium Large
60%
23%
16%
1%
0%
10%
20%
30%
40%
50%
60%
70%
Micro Small Medium Large
56% 58%54%
67%
30%32%
28%33%
14%10%
18%
0%
significant
insignificant
do not
know
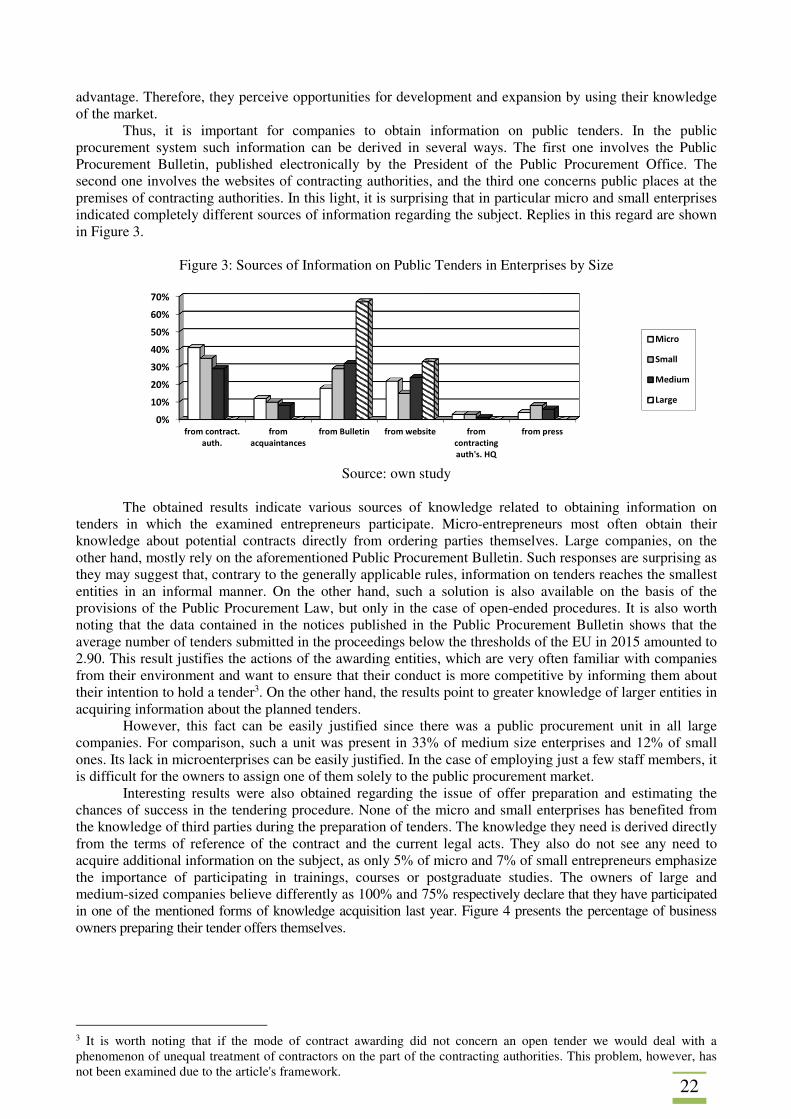
22
advantage. Therefore, they perceive opportunities for development and expansion by using their knowledge of the market.
Thus, it is important for companies to obtain information on public tenders. In the public procurement system such information can be derived in several ways. The first one involves the Public Procurement Bulletin, published electronically by the President of the Public Procurement Office. The second one involves the websites of contracting authorities, and the third one concerns public places at the premises of contracting authorities. In this light, it is surprising that in particular micro and small enterprises indicated completely different sources of information regarding the subject. Replies in this regard are shown in Figure 3.
Figure 3: Sources of Information on Public Tenders in Enterprises by Size
Source: own study
The obtained results indicate various sources of knowledge related to obtaining information on tenders in which the examined entrepreneurs participate. Micro-entrepreneurs most often obtain their knowledge about potential contracts directly from ordering parties themselves. Large companies, on the other hand, mostly rely on the aforementioned Public Procurement Bulletin. Such responses are surprising as they may suggest that, contrary to the generally applicable rules, information on tenders reaches the smallest entities in an informal manner. On the other hand, such a solution is also available on the basis of the provisions of the Public Procurement Law, but only in the case of open-ended procedures. It is also worth noting that the data contained in the notices published in the Public Procurement Bulletin shows that the average number of tenders submitted in the proceedings below the thresholds of the EU in 2015 amounted to 2.90. This result justifies the actions of the awarding entities, which are very often familiar with companies from their environment and want to ensure that their conduct is more competitive by informing them about their intention to hold a tender3. On the other hand, the results point to greater knowledge of larger entities in acquiring information about the planned tenders.
However, this fact can be easily justified since there was a public procurement unit in all large companies. For comparison, such a unit was present in 33% of medium size enterprises and 12% of small ones. Its lack in microenterprises can be easily justified. In the case of employing just a few staff members, it is difficult for the owners to assign one of them solely to the public procurement market.
Interesting results were also obtained regarding the issue of offer preparation and estimating the chances of success in the tendering procedure. None of the micro and small enterprises has benefited from the knowledge of third parties during the preparation of tenders. The knowledge they need is derived directly from the terms of reference of the contract and the current legal acts. They also do not see any need to acquire additional information on the subject, as only 5% of micro and 7% of small entrepreneurs emphasize the importance of participating in trainings, courses or postgraduate studies. The owners of large and medium-sized companies believe differently as 100% and 75% respectively declare that they have participated in one of the mentioned forms of knowledge acquisition last year. Figure 4 presents the percentage of business owners preparing their tender offers themselves.
3 It is worth noting that if the mode of contract awarding did not concern an open tender we would deal with a phenomenon of unequal treatment of contractors on the part of the contracting authorities. This problem, however, has not been examined due to the article's framework.
0%
10%
20%
30%
40%
50%
60%
70%
from contract.
auth.
from
acquaintances
from Bulletin from website from
contracting
auth's. HQ
from press
Micro
Small
Medium
Large
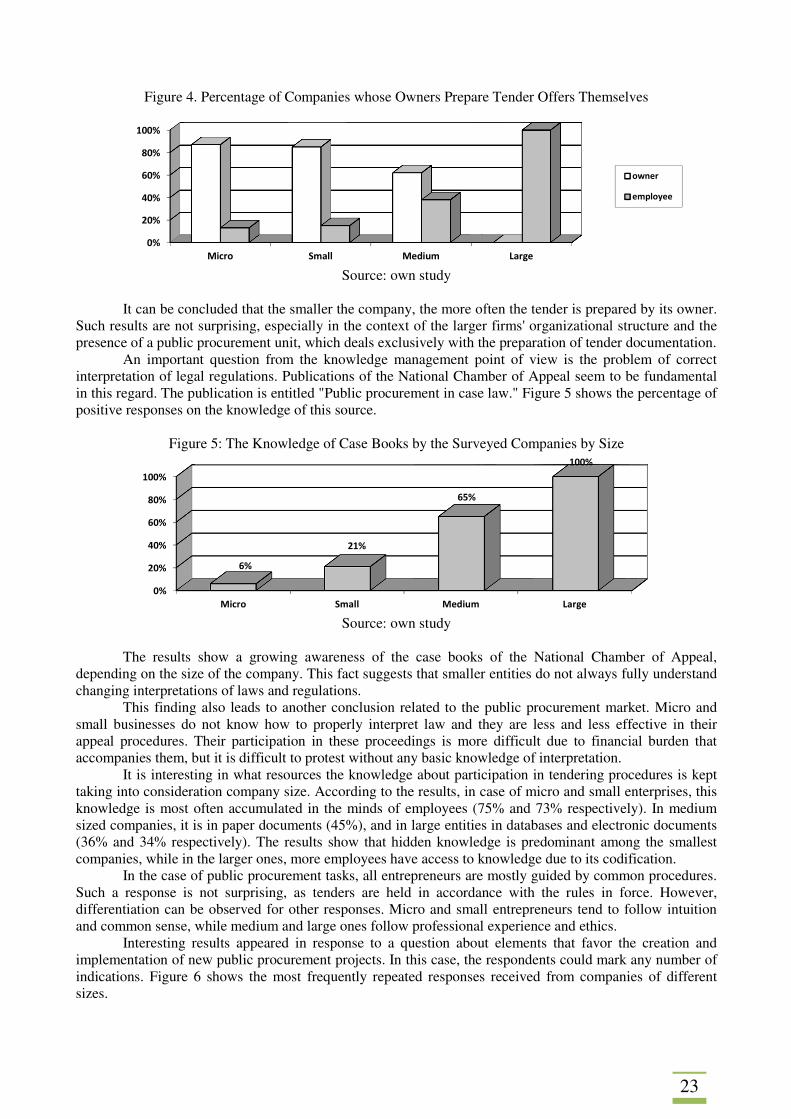
23
Figure 4. Percentage of Companies whose Owners Prepare Tender Offers Themselves
Source: own study
It can be concluded that the smaller the company, the more often the tender is prepared by its owner.
Such results are not surprising, especially in the context of the larger firms' organizational structure and the presence of a public procurement unit, which deals exclusively with the preparation of tender documentation.
An important question from the knowledge management point of view is the problem of correct interpretation of legal regulations. Publications of the National Chamber of Appeal seem to be fundamental in this regard. The publication is entitled "Public procurement in case law." Figure 5 shows the percentage of positive responses on the knowledge of this source.
Figure 5: The Knowledge of Case Books by the Surveyed Companies by Size
Source: own study
The results show a growing awareness of the case books of the National Chamber of Appeal,
depending on the size of the company. This fact suggests that smaller entities do not always fully understand changing interpretations of laws and regulations.
This finding also leads to another conclusion related to the public procurement market. Micro and small businesses do not know how to properly interpret law and they are less and less effective in their appeal procedures. Their participation in these proceedings is more difficult due to financial burden that accompanies them, but it is difficult to protest without any basic knowledge of interpretation.
It is interesting in what resources the knowledge about participation in tendering procedures is kept taking into consideration company size. According to the results, in case of micro and small enterprises, this knowledge is most often accumulated in the minds of employees (75% and 73% respectively). In medium sized companies, it is in paper documents (45%), and in large entities in databases and electronic documents (36% and 34% respectively). The results show that hidden knowledge is predominant among the smallest companies, while in the larger ones, more employees have access to knowledge due to its codification.
In the case of public procurement tasks, all entrepreneurs are mostly guided by common procedures. Such a response is not surprising, as tenders are held in accordance with the rules in force. However, differentiation can be observed for other responses. Micro and small entrepreneurs tend to follow intuition and common sense, while medium and large ones follow professional experience and ethics.
Interesting results appeared in response to a question about elements that favor the creation and implementation of new public procurement projects. In this case, the respondents could mark any number of indications. Figure 6 shows the most frequently repeated responses received from companies of different sizes.
0%
20%
40%
60%
80%
100%
Micro Small Medium Large
owner
employee
0%
20%
40%
60%
80%
100%
Micro Small Medium Large
6%
21%
65%
100%
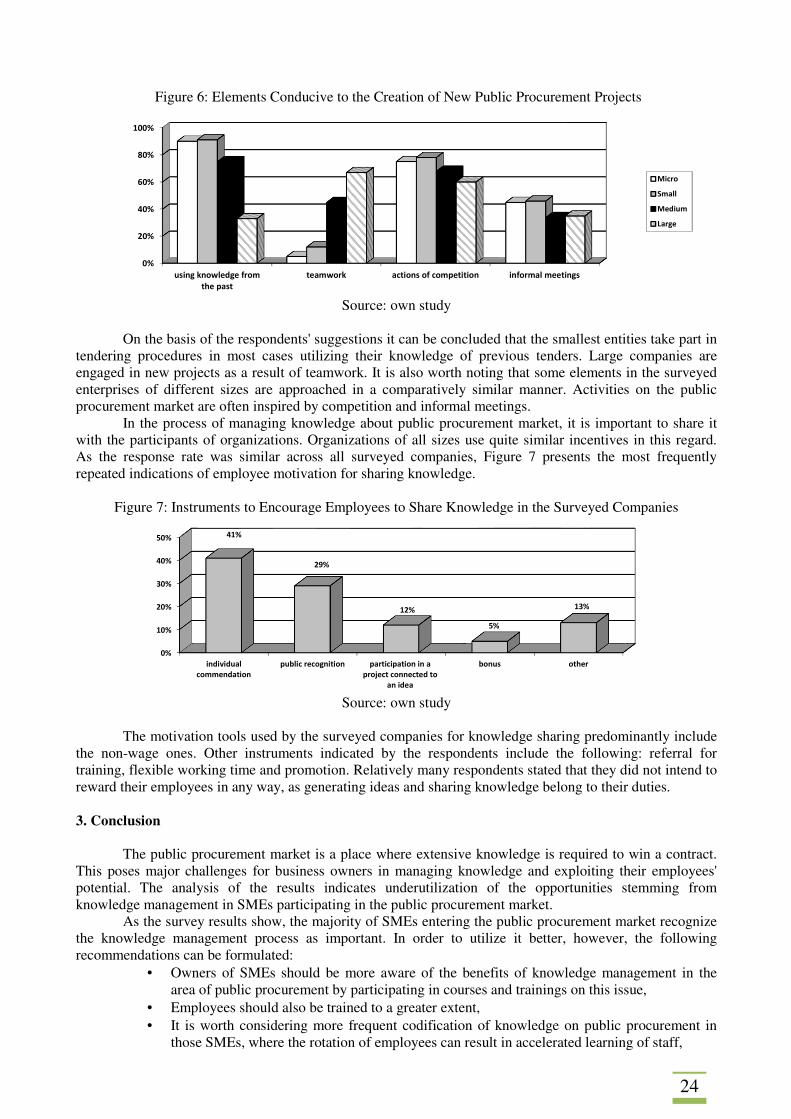
24
Figure 6: Elements Conducive to the Creation of New Public Procurement Projects
Source: own study
On the basis of the respondents' suggestions it can be concluded that the smallest entities take part in tendering procedures in most cases utilizing their knowledge of previous tenders. Large companies are engaged in new projects as a result of teamwork. It is also worth noting that some elements in the surveyed enterprises of different sizes are approached in a comparatively similar manner. Activities on the public procurement market are often inspired by competition and informal meetings.
In the process of managing knowledge about public procurement market, it is important to share it with the participants of organizations. Organizations of all sizes use quite similar incentives in this regard. As the response rate was similar across all surveyed companies, Figure 7 presents the most frequently repeated indications of employee motivation for sharing knowledge.
Figure 7: Instruments to Encourage Employees to Share Knowledge in the Surveyed Companies
Source: own study
The motivation tools used by the surveyed companies for knowledge sharing predominantly include the non-wage ones. Other instruments indicated by the respondents include the following: referral for training, flexible working time and promotion. Relatively many respondents stated that they did not intend to reward their employees in any way, as generating ideas and sharing knowledge belong to their duties. 3. Conclusion
The public procurement market is a place where extensive knowledge is required to win a contract. This poses major challenges for business owners in managing knowledge and exploiting their employees' potential. The analysis of the results indicates underutilization of the opportunities stemming from knowledge management in SMEs participating in the public procurement market.
As the survey results show, the majority of SMEs entering the public procurement market recognize the knowledge management process as important. In order to utilize it better, however, the following recommendations can be formulated:
• Owners of SMEs should be more aware of the benefits of knowledge management in the area of public procurement by participating in courses and trainings on this issue,
• Employees should also be trained to a greater extent, • It is worth considering more frequent codification of knowledge on public procurement in
those SMEs, where the rotation of employees can result in accelerated learning of staff,
0%
20%
40%
60%
80%
100%
using knowledge from
the past
teamwork actions of competition informal meetings
Micro
Small
Medium
Large
0%
10%
20%
30%
40%
50%
individual
commendation
public recognition participation in a
project connected to
an idea
bonus other
41%
29%
12%
5%
13%
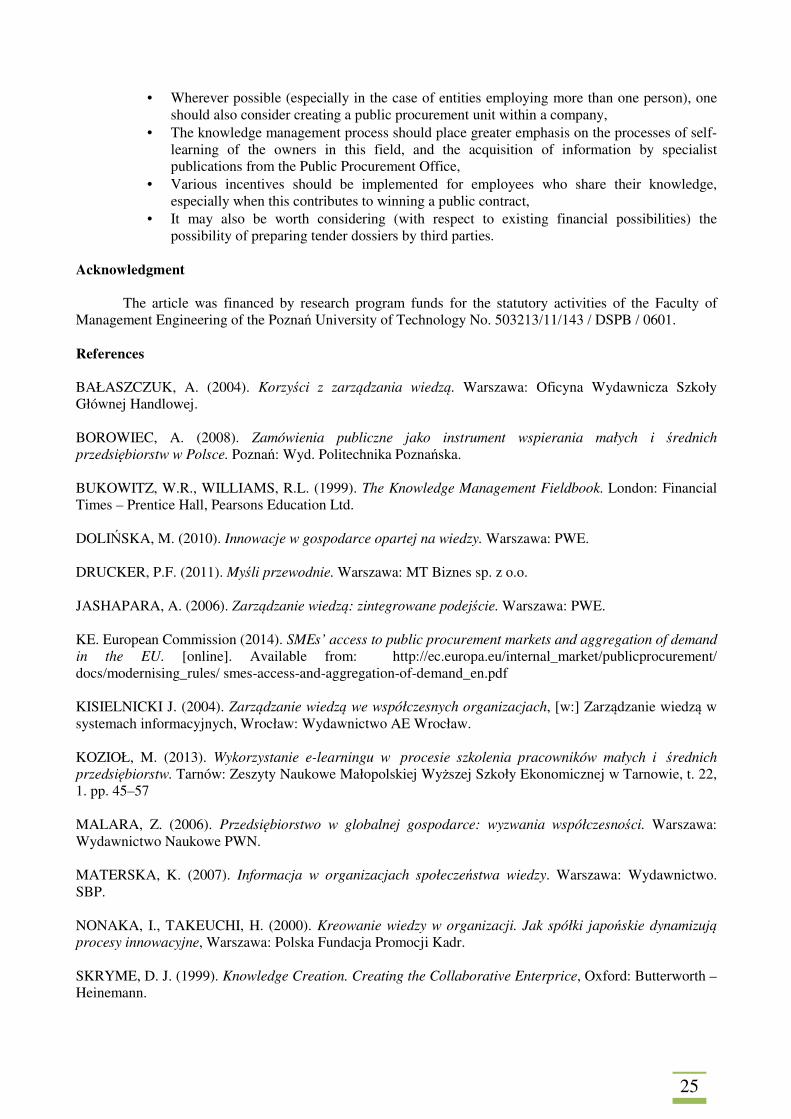
25
• Wherever possible (especially in the case of entities employing more than one person), one should also consider creating a public procurement unit within a company,
• The knowledge management process should place greater emphasis on the processes of self-learning of the owners in this field, and the acquisition of information by specialist publications from the Public Procurement Office,
• Various incentives should be implemented for employees who share their knowledge, especially when this contributes to winning a public contract,
• It may also be worth considering (with respect to existing financial possibilities) the possibility of preparing tender dossiers by third parties.
Acknowledgment
The article was financed by research program funds for the statutory activities of the Faculty of Management Engineering of the Poznań University of Technology No. 503213/11/143 / DSPB / 0601. References BAŁASZCZUK, A. (2004). Korzyści z zarządzania wiedzą. Warszawa: Oficyna Wydawnicza Szkoły Głównej Handlowej. BOROWIEC, A. (2008). Zamówienia publiczne jako instrument wspierania małych i średnich przedsiębiorstw w Polsce. Poznań: Wyd. Politechnika Poznańska. BUKOWITZ, W.R., WILLIAMS, R.L. (1999). The Knowledge Management Fieldbook. London: Financial Times – Prentice Hall, Pearsons Education Ltd. DOLIŃSKA, M. (2010). Innowacje w gospodarce opartej na wiedzy. Warszawa: PWE. DRUCKER, P.F. (2011). Myśli przewodnie. Warszawa: MT Biznes sp. z o.o. JASHAPARA, A. (2006). Zarządzanie wiedzą: zintegrowane podejście. Warszawa: PWE. KE. European Commission (2014). SMEs’ access to public procurement markets and aggregation of demand in the EU. [online]. Available from: http://ec.europa.eu/internal_market/publicprocurement/ docs/modernising_rules/ smes-access-and-aggregation-of-demand_en.pdf KISIELNICKI J. (2004). Zarządzanie wiedzą we współczesnych organizacjach, [w:] Zarządzanie wiedzą w systemach informacyjnych, Wrocław: Wydawnictwo AE Wrocław. KOZIOŁ, M. (2013). Wykorzystanie e-learningu w procesie szkolenia pracowników małych i średnich przedsiębiorstw. Tarnów: Zeszyty Naukowe Małopolskiej Wyższej Szkoły Ekonomicznej w Tarnowie, t. 22, 1. pp. 45–57 MALARA, Z. (2006). Przedsiębiorstwo w globalnej gospodarce: wyzwania współczesności. Warszawa: Wydawnictwo Naukowe PWN. MATERSKA, K. (2007). Informacja w organizacjach społeczeństwa wiedzy. Warszawa: Wydawnictwo. SBP. NONAKA, I., TAKEUCHI, H. (2000). Kreowanie wiedzy w organizacji. Jak spółki japońskie dynamizują procesy innowacyjne, Warszawa: Polska Fundacja Promocji Kadr. SKRYME, D. J. (1999). Knowledge Creation. Creating the Collaborative Enterprice, Oxford: Butterworth – Heinemann.
26
MONETIZATION OF INTERNET SERVICES FOR THE SEGMENT OF SMALL AND MEDIUM BUSINESSES
Josef Botlík, Martin Nováček Silesian University in Opava School of Business Administration in Karviná, department of Informatics and Mathematics Univerzitní nám. 1934/3 Karviná, 733 40 Czech Republic e-mail: [email protected], [email protected] Abstract Companies in small and medium segment practically cannot exist without the intensive support of Internet services nowadays. These services offer a variety of options how to use content on the Internet to increase profits. We can use for monetization of content a variety of methods and models, including various options of paywall, sale of advertising or so-called rotators which are intentionally directing the selected pages. Not all methods are suitable for monetization company website. It can be stated that during the process of creating business strategies related to the Internet environment it is necessary to think in this area on profitability. The aim of this paper is to summarize knowledge about monetizing of the website, analyze which tools are appropriate for small and medium business and recommend specific procedures. Keywords: internet services, monetization, small and medium enterprises JEL codes: G17, G32, E51, L86, M39 1. Introduction
New technologies and digital systems in interface of internet services create business channels which both support and provide new forms of information and content monetization. Due to mass usage of mobile information technologies, we can definitely notice the increase of provided paid services and more importantly, the forming of brand new categories which probably would not exist without the whole monetization model. Original tools of monetization (e-shops, ad revenue) are gradually changing into less obvious forms based on trading user data (there are many forms including users’ behavioral analysis). At the same time, we can notice the inevitable transition of information streams into digital, mostly internet form. Miguel and Abarca (2016) even mention the “…new contextual paradigm of the Periodismo”.
Another affected category are payment methods – ranging from classic physical currency for product exchange to personal information exchange, microtransactions and payment forms like crypto currency which should bring up more security and variety. With no need of registration or paying for services, users can simply agree with microtransactions (Karame et al, 2014). With the whole process of internet monetization, new terms like “e-marketplace” have been defined (Ghose, Yang, 2009). E-marketplaces are not just about trading like the general e-business idea but they also include sponsored process of searching among them. Primitive forms of empirical analysis of advertisement have evolved into empirical analysis of user needs and user data as sourcesof monetization. Last but not least, it is important to mention targeted advertising based on content relevancy for the audience (target group)1.
In relation to the mentioned “evolution” of monetization, some basic metrics like clickthrough rate, conversion rate and cost per click have started to show up. Perspective of data and information is being further changed by continuous social network development where a term “monetization of User-Generated Content” was created (Zajc, 2015).
All of these facts combined together with dynamic development of the internet services2 show us wide range of possibilities in the monetization field but also the new forms of business in relation to personal data of clients using these services which are most definitely useful in the environment of small and medium business.
Because the scope of the paper is limited, pictures and tables are placed on www pages http://pracres.eu/?page_id=277.
1 Google AdSense program provides “target oriented” advertisement to registered users based upon characteristic keywords for the website. Currently, there are almost 50 certified partners [online]. [vid 1. 4. 2017]. Available: https://www.google.com/adsense. 2 Mostly services provided on application layer of TCP/IP protocol
27
2. Methodology and Theoretical Framework
There were used two different methods for the research – the description and the comparison of basic monetization methods including direct and indirect forms. Both terms monetization and monetization of the internet (services) do not have an exact definition and are mostly based on the basic methodology of monetization with some specifics. Probably, the most general definition would be “transformation process of anything into the legal currency or the right of acquisition of finance for any values3 respectively”. Another definition would be “process which makes the activity earning, prospering4”
Regarding internet, monetization is understood as a value of the internet project, e-shop, web or domain expressed in some form of currency. So, monetization is a process which should create profitable internet project or web5. Simplified, it is a state of converting non-profitable websites into profitable ones. According to a comprehensive study of Sdružení pro internetový rozvoj (SPIR) titled “Monetizace obsahu na internetu” from 2014, the dominant model of monetizing online services in the Czech Republic is still selling the ad space. There are always some exceptions (e.g. Motejlek.com, Patria Online) but generally, advertising is the only way to have stable income for complete financing of medial projects6. The study also shows an asymmetry of the digital market where most of the money goes to big non-medial players like Google, Seznam or Facebook which forces smaller digital subjects to find another source of income like direct content selling. 3. Theory, Metrics, Description
Even though it is possible to acquire the metrics in the theory of monetization, it is important to stress out that the metrics will not always be sufficient and accepted. Croll, Yoskovitz (2016) recommend to differentiate the initial metric versus performance, qualitative versus quantitative, predictive versus reactive etc. They also do not strongly recommend using metrics like “total number of registered users7”, “number of accessed clients”, “page view count”, “like count”, “download count”, “mail count” etc. especially because they are all more quantitative than qualitative. There is a standard metrics used for the purpose of this paper which may be against the principles of the characteristics mentioned above (like the clickthrough rate, number of visits etc.)8. 3.1 Monetization
Monetization is process of converting internet services into (ideally) substantial revenue. All related activities must be, of course, legal. We can classify two types of monetization:
• direct, • indirect.
3.2 Direct Monetization
By direct monetization we understand that users always have to pay money (in most cases upfront) in order to start using the service or application. Typical forms of indirect monetization are:
• selling digital content, • premium membership, • microtransactions.
Using combinations of annual, upfront or other type of discounts may often lead to extra income generation. Advantages of direct monetization are that people can earn money by themselves and do not have to depend on anyone. Disadvantages of this are that many possible customers may automatically be discouraged due to need of paying for something. 3 Meaning of a word. [online]. [vid 1. 4. 2017]. Available: http://www.vyznam-slova.com/Monetizace 4 Meaning of a word. [online]. [vid 1. 4. 2017]. Available:http://www.vyznam-slova.com/Monetizace 5 Actual net. [online]. [vid 1. 4. 2017], Available:http://www.actual-net.cz/seo-slovnik/ 6 Monetizace obsahu na internetu – studie [online]. 07- 2014 [vid 1. 4. 2017], Available: http://www.monetizaceobsahu.cz/studie.pdf 7 They recommend using total number of active users or percentage of active users instead 8 Croll, Yoskovitz (2016) cover even more not-recommanded metrics, commonly used in monetization of Internet content such as "number of accesses", "pageviews," "traffic, number of „likes“ ", "number of downloads", "number of mails", etc. These metrics are based on quantitative rather than qualitative character of information.
28
3.2.1 Digital Content
Digital content is basically any content existing in form of data – meaning it has a huge area of possible business opportunities. Digital content may by classified in two categories:
• directly selling or reselling digital products, • licensing.
DIRECTLY SELLING OR RESELLING DIGITAL PRODUCTS
There are many products or services which can be sold or resold. As typical examples, we can imagine e-books, music, art (like digital pictures) etc. LICENSING
In terms of internet services, licensing is the most common form of generating revenue from digital content.
Software as a service (SaaS) is cloud-based solution giving users choice not to purchase software as usual (paying for lifetime license) and instead just buy license for whatever they need for chosen period of time. Currently working paid solution is for instance Microsoft Office 365 – office bundle accessed from any modern internet browser. Not only it does not take any space on a hard drive but also can be accessed from operating systems without direct Microsoft support. Software as a Service opens a lot of new opportunities for content creators without need of optimization for different operating systems. 3.2.2 Premium Membership
Premium membership or also paid membership is a form of direct monetization where users have to pay subscription fee in order to see the “unique” content behind a paywall – content which normally cannot be accessed from the same website or application. Premium membership is often offered for free 30-day trial, but usage of credit card is necessary to prevent users from creating multiple email addresses and abusing the system. A lot of premium membership websites charge new clients immediately after trial period ends unless manually.
Many online newspaper companies including Wall Street Journal have been successfully using a paywall. It is also very popular model in academic purposes – users are paying fee to see research papers which helps their authors to passively earn money. Another good example is Netflix – one of the biggest online media streaming companies providing audiovisual content of all kinds. The company buys streaming rights from content providers which allows them to legally distribute the content among millions of users (estimated count of subscribers in 2016 was 80 million).
As a last crucial step of this solution is uniqueness of the content and/or constant updates – they are necessary to maintain the clients and ideally keep getting new ones. 3.2.3 Microtransactions
Microtransactions are part of the freemium model – which is combination of words free and premium. Users do not have to pay any money but the actual content may be limited and can start forcing users to pay. One of the biggest advantages is that the model itself has very indirect feeling from users’ perspectives when balanced right. According to Mureta (2012) “It’s easy to act on impulse if instant gratification is only 99 cents and five-second download away”. Microtransactions can be used in:
• mobile applications, • PC or console games, • websites.
MICROTRANSACTIONS IN MOBILE APPLICATIONS
Many application developers are using lite or trial versions of applications instead of directly offering paid solution. There are many reasons to do so and one of the biggest is that users would not probably pay for something they cannot at least try using with certain limitations.

29
According to recode.com – in 2014 freemium applications represented 92 % of Apple’s App Store and 98 % of Google’s Play Store. Total revenue of both stores for year 2016 is estimated at 36 billion dollars. MICROTRANSACTIONS IN PC OR CONSOLE GAMES
Usage of microtransactions in pc or console free-to-play games is usually classified by two types. Game affecting special items and premium content which often leads to pay-to-win situation and overall disappointment or users. And the second type – skins or “vanity” items which are not affecting gameplay and do only visual changes. MICROTRANSACTIONS IN WEBSITES
Using Microtransactions on websites is not that popular yet but we might see this strategy more often in future. Twitch.tv owned by Amazon has recently deployed a feature called “Cheering” where viewers can purchase “bits” (virtual currency) and can send them in a form of donation message to the streamer they would like to support. 3.3 Indirect Monetization
By indirect monetization we understand that people are paying in forms other than money. Typical forms of indirect monetization are:
• display advertising, • affiliate marketing, • link building.
Advantages of this solution are that it basically does not cost anything other than website and domain fees. Disadvantages are that it is harder to target right customers and excessive ad space may discourage users from revising the content. 3.3.1 Display Advertising
Display advertising includes basically every website of application containing ads in banner form. While the normal user is somewhere in between, terms advertiser and publisher should be explained. The person who pays for ad space is called advertiser and his strategy is ROI (return on investment) by selling the advertised product. The person who sells ad space is called publisher. There are two ways of renting out advertising space:
• via another company, • by direct deal.
RENTING OUT AD SPACE VIA ANOTHER COMPANY
Renting out ad space via another company is easier since publisher does not need to keep looking for someone interested in displaying their ads. Companies such as Google with their AdSense program or OpenX are providing user-friendly interface where you can monitor how many people clicked on the ad etc. Another disadvantage is that each of this “middlemen” companies take their cut which is somehow balanced by the service they offer. RENTING OUT AD SPACE BY DIRECT DEAL
As a direct deal, we can imagine some advertiser – person or company in need of propagation of their product directly dealing with publisher without any third party as described in section 0.
This solution typically brings up smaller revenue for publisher but the ad may be much more relevant compared to first solution leading to better customer relationship and long term success (for instance having a website about cars and placing ads for BMW car parts is much more relevant than placing ads for homemade cookies. The example is, of course, exaggerated since specialized companies are using their algorithms to place ads fitting the content but by direct deal with a company you only display exactly what you agreed on).
30
REVENUE MODELS OF DISPLAY ADVERTISING
Depending on website or application traffic and interface, both publishers and advertisers can choose the revenue model which determines their total income. Most popular revenue calculation methods are:
• Cost per click (CPC) – publisher gets paid certain amount of money every time someone clicks on the ad.
• Cost per mille (CPM) – also called cost per thousand impressions (CPI), is a model mostly used for ads in videos and live streams (like YouTube and Twitch.tv) where Publisher gets revenue for 1000 estimated views.
• Cost per action (CPA) – is a type of model often used in mobile apps and websites for surveys, polls etc.
3.3.2 Affiliate Marketing
Affiliate marketing is similar to display advertising with one key difference – publisher getsa cut from sold product via advert placed on his website or application rather than only for clicking or visiting. This type of indirect monetization is used by many companies including Amazon offering up to 10 % of product price which opens possible revenue for small and medium businesses. 3.3.3 Link Building
Type of advertising for increasing website traffic and ranking. By ranking we understand the position the website is shown in one of the search engines like Google, Yahoo etc.
The whole model works by placing links on other websites leading back to the original site. This basically does two things at once. By increasing traffic on website, ranking goes higher and at the same time, thanks to the link leading from another website, relevance of the content also increases which is one of the ranking criteria so after proper implementation the ranking is increased even more. 3.3.4 Ad Blocking
Ad blocking definitely affects indirect monetization. Companies are able to know whether the user saw the ad or not, therefore the actions with ad block do not count towards content creator’s revenue. On the other hand, ad blocking prevents users from being tracked and visiting malicious content meaning applications and websites are less likely to track users’ activity or infect their device. That is why it is still very controversial topic and it is very hard to pick a side to completely agree with. Fortunately, there is a feature in all modern ad blocking software called whitelisting where users can turn off blocking for content they actually want to support. The ad blocking process in 2009-2016 shows the Figure 1 (placed on www pages http://pracres.eu/?page_id=277).
4. Comparison
For the comparison of monetization tools, multiple web projects dealing with the monetization of the web content were compared. Specific projects were chosen based on SEO9 and the ranking in search engines (Google, Seznam, Bing) with the phrases “Monetization of the Internet”, “Web site monetization”, “Content monetization”, “Monetization of Internet content”. Based on the results from the top 20 links, it was necessary to exclude 9 of them since they were mostly about statistics.
Table 1 (placed on www pages http://pracres.eu/?page_id=277 too) shows the frequency of recommendation for the used monetizing tools. Rows show each one of the tools and columns the compatibility with the websites 1-11 (their links are shown in Table 2, placed on www pages http://pracres.eu/?page_id=277).
9 Search Engine Optimization, optimization for search engines or in different words optimization for automatized processing v in search engines.
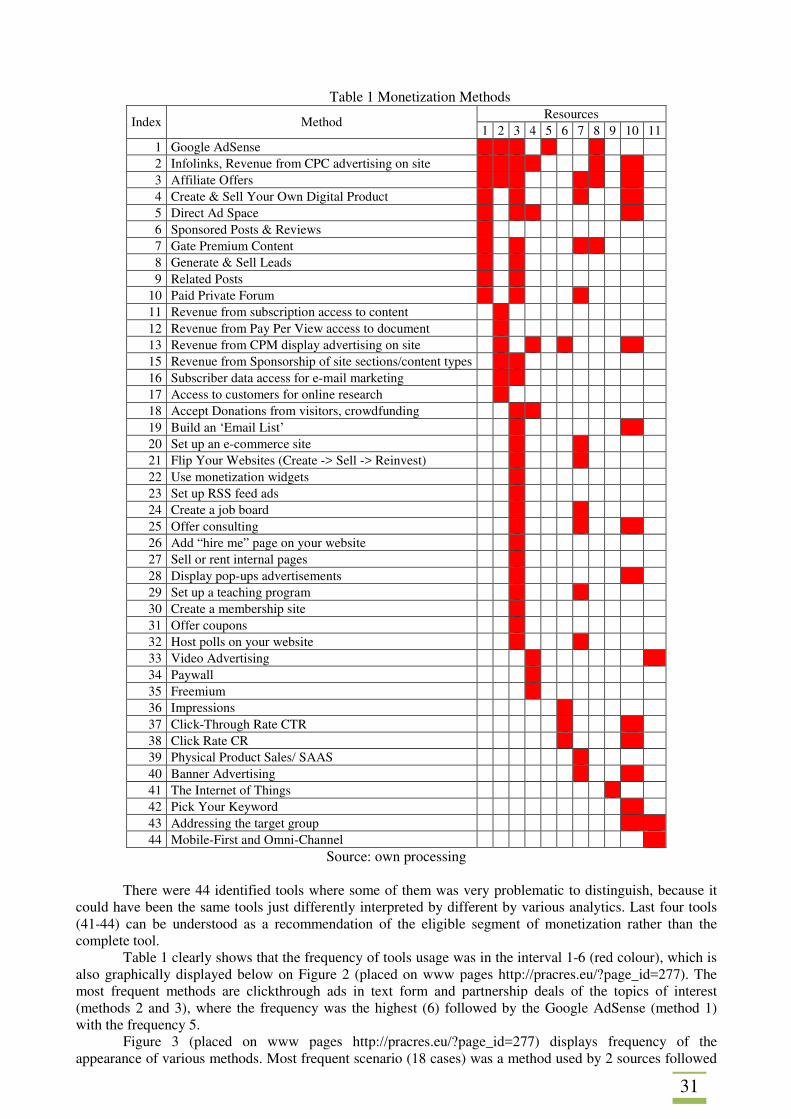
31
Table 1 Monetization Methods
Index Method Resources
1 2 3 4 5 6 7 8 9 10 11 1 Google AdSense 1 1 1 1 1 2 Infolinks, Revenue from CPC advertising on site 1 1 1 1 1 1 3 Affiliate Offers 1 1 1 1 1 1 4 Create & Sell Your Own Digital Product 1 1 1 1 5 Direct Ad Space 1 1 1 1 6 Sponsored Posts & Reviews 1 7 Gate Premium Content 1 1 1 1 8 Generate & Sell Leads 1 1 9 Related Posts 1 1
10 Paid Private Forum 1 1 1 11 Revenue from subscription access to content 1 12 Revenue from Pay Per View access to document 1 13 Revenue from CPM display advertising on site 1 1 1 1 15 Revenue from Sponsorship of site sections/content types 1 1 16 Subscriber data access for e-mail marketing 1 1 17 Access to customers for online research 1 18 Accept Donations from visitors, crowdfunding 1 1 19 Build an ‘Email List’ 1 1 20 Set up an e-commerce site 1 1 21 Flip Your Websites (Create -> Sell -> Reinvest) 1 1 22 Use monetization widgets 1 23 Set up RSS feed ads 1 24 Create a job board 1 1 25 Offer consulting 1 1 1 26 Add “hire me” page on your website 1 27 Sell or rent internal pages 1 28 Display pop-ups advertisements 1 1 29 Set up a teaching program 1 1 30 Create a membership site 1 31 Offer coupons 1 32 Host polls on your website 1 1 33 Video Advertising 1 1 34 Paywall 1 35 Freemium 1 36 Impressions 1 37 Click-Through Rate CTR 1 1 38 Click Rate CR 1 1 39 Physical Product Sales/ SAAS 1 40 Banner Advertising 1 1 41 The Internet of Things 1 42 Pick Your Keyword 1 43 Addressing the target group 1 1 44 Mobile-First and Omni-Channel 1
Source: own processing
There were 44 identified tools where some of them was very problematic to distinguish, because it could have been the same tools just differently interpreted by different by various analytics. Last four tools (41-44) can be understood as a recommendation of the eligible segment of monetization rather than the complete tool.
Table 1 clearly shows that the frequency of tools usage was in the interval 1-6 (red colour), which is also graphically displayed below on Figure 2 (placed on www pages http://pracres.eu/?page_id=277). The most frequent methods are clickthrough ads in text form and partnership deals of the topics of interest (methods 2 and 3), where the frequency was the highest (6) followed by the Google AdSense (method 1) with the frequency 5.
Figure 3 (placed on www pages http://pracres.eu/?page_id=277) displays frequency of the appearance of various methods. Most frequent scenario (18 cases) was a method used by 2 sources followed

32
by 17 cases used only for 1 source. Average is 7, median 3 – implying that the different sources take different approach and do not use and indicate the methods the same way. By comparing the frequency of the links with all sources, which is displayed on the Figure 4 (placed on www pages http://pracres.eu/?page_id=277) below, the most of the methods are used by source 3 (16 methods). Average is 8, median 7.
Acquired tools were statistically compared with business models recommended on website called “Blog o podnikání na internetu”. According to Kvasnicová’s analysis (2015) displayed on the websites, basic business models are:
1. Franchise (MC Donald’s etc.), 2. distribution of the one free or cheap product with the other expensive complementary
products (Gillette, Canon, HP – cheap printers with expensive toners), 3. advertising formats – banners, PPC, news portals, 4. brokerage/marketplace model – e.g. App Store – percentage cut of sales, eBay – selling
products; 5. AirBnB – accommodations, Apple store – selling digital content with no shipping, 6. multilevel marketing – converting part of the customers to the manufacturer – Oriflame,
Avon, Tupperware, FM Cosmetics, Lyoness; 7. service providing – physical or virtual, direct sales or wholesale; 8. distribution of goods and services – retail chains (Tesco, Lidl, Kaufland), targeting specific
segment – DM drug store, private shopping clubs (Big Brands, Fashion Days), 9. renting out physical goods, services or virtual goods – hotels, music, books, Spotify, Scribd; 10. providing free services – with the paid premium additions, freemium models for userbase, 11. selling user data to the third parties – target oriented ads on Facebook, 12. win-win-win or Groupon models – traffic for provider, sales for user; 13. crowd funding model – Kickstarter etc.; 14. in-app commerce – paid plugins, motives etc.; 15. payments for boosting the ranking or ad space, 16. paywall – Piano, 17. open Source systems – free but for instance helpdesk will cost money, 18. no-frills models – very cheap flights (Ryanair), 19. feels for certification or verification – e.g. www.nakupujbezpecne.sk, 20. affiliate marketing – provision for services, 21. subscription based model – Windows Azure.
It is possible to identify the similarity between basic business model and monetization model based
on the comparison. Table 3 (placed on www pages http://pracres.eu/?page_id=277) displays the crosswise comparison of monetization methods (columns) and general models (rows), similarity is display by value “1”. Due to subjective understanding and evaluating of monetization methods by different sources, this table is also partially affected and subjective. For example, the distribution of one product for low price or for free, and existence of other complementary product for high price can be understood as a premium content on www but also as income from the “pre-paid” access to the content. Individual access to comparison is open to discussion.
The subjectivity is also being reflected by the sums in the Table 3 (placed on www pages http://pracres.eu/?page_id=277) where some of the general methods do not have any similar monetization method, and some of them have more than 1 method to be compared with. The most of the variants are offered by “service providing”, “production of physical or virtual content” which alternatively has 9 monetization methods. On the contrary, “a premium content” as a monetization method may be understood as a distribution of one free product with another complementary expensive one, as a providing functional service for free but with some missing, premium paid functions, as In-app commerce or as “unlocking” the content via subscription (monthly fee).
Because of the reasons mentioned above and relatively large dependencies on the subject rating, the recommendations for the monetization models are reduced and simplified (some of the methods are used above in most popular revenue calculation methods):
1. cost per action (CPA), 2. cost per like (CPL), 3. cost per impression (CPI), 4. cost per click (CPL), 5. cost per visit (CPV),
33
6. cost per certain period of time, 7. cost per sent email, 8. cost for position (rank), 9. cost for reading email, 10. cost for enlisting, 11. cost per views10.
5. Discussion
Monetization of internet services is a process, which hides many risk factors. One of the main
problems is access to client data. From this perspective, most important for the provider is marginal utility rate given by the ratio of usage of the client personal data in the process of monetization to the amount of provided services. In this sense, monetization could be viewed from two different perspectives – provider and client. Those two sides can may find themselves in directly or indirectly proportional relations. Directly proportional context maximizes utility for the client while provider maximizes revenue. Indirect proportion leads to maximizing of provider’s revenue at the expense of the client who might be secretly or forcibly led to personal information11 abuse which of course causes client dissatisfaction, followed by leaving the whole service and less revenue for the provider. The magnitude of this effect is being analyzed in many studies including the one from Bondia-Barcelo et al. (2016) – analyzing sensitive data theft based on records in forms12 and requests of web search engines (WSE) 13 and then trading/selling them. Those companies offering WSE are selling the personal data even further to earn more money.
There is also appearance of concepts of the heterogenous channels of content (Li Yung-Ming, 2012) where monetization is realized asymmetrically by separating of the data and specifications of the different structures of ownership of the channel and content. This principle opens possibility of monetizing user data and their parallel distributions, which restricts or even prevents the user control over the spreading of sensitive data.
Current state of computing resources, technologies and development of very powerful analytics tools in field of “Big Data” processing opens up new possibilities of advanced analysis regarding dislocation, social interaction and user behavior. Study of Cao et al. (2014) published in IBM’s Journal of research and development describes algorithms and technologies for Data Mining of users using social networks and analysis of usage of mobile technologies.
While discussing monetization, it is necessary to mention its development predictions – according to Bowden (2014) some authors predict that the future development of online monetization will be connected more and more with internet of things (IoT). This will provide new strategies and opportunities of monetization, especially business intelligence mapping, online diversification of sources of income etc.
The orientation on mobile information and communication technologies is also very popular last few years, which confirms for example Nielsen company study14 which specifies following areas of monetization:
• communications, • shopping/commerce, • news/info, • productivity/function, • entertainment, • games, social.
We cannot forget to mention the massive segment of online video games and applications. 6. Conclusion
Sometimes it might be very hard to find a fitting model because every company offers different service or product and attracts different groups of consumers that is why there is not a global solution that we 10 Association for Internet Development, source: http://www.spir.cz/obchodni-modely 11 E.g. Google and their agreement with data collection and processing unfavorable to users 12 This type of data is mostly being used for “improving user experience” by adapting the results of the search, automatic finishing words or grammatical repairs. 13 Google has approximately 40 000 queries per second (Bondia-Barcelo, 2016) 14 How Smartphones are Changing Consumers’ Daily Routines Around the Globe, [online]. 2014 [vid 1. 4. 2017], Available:http://www.nielsen.com/content/corporate/us/en/insights/news/2014/how-smartphones-are-changing-consumers-daily-routines-around-the-globe.html
34
could apply to every single website, application or service. However, there are some general advice. Using banner ads and affiliate marketing is the easiest way since it does not basically cost any money but unless the website or application has very big number of daily users, the generated revenue would not be that big.
As highlighted in section 0, mobile apps and games have generated over 90 % of both Apple’s App Store and Google’s Play store revenue, so generally, using Microtransactions for this type of business is a way to go.
According to Cox’s research (2014) in relationship with online news and journal companies “the significance of the paywall in present era as well as the future must not be missed”. But there is one really important thing – the content must be worth paying from users’ perspective which includes being one of the first to publish current events while maintaining high reliability.
Using combination of both direct and indirect methods of monetization also possible, in fact, it is effective and safe solution. If a small company sells e-books on their website, there is not any barrier of placing decent amount of ads. Another good example are Free applications with Microtransactions. They can also contain ads, meaning even a regular user still generates money. However, ads should be removed for customer who has already paid.
To sum up – for a long-term success, the website or application must contain high quality content, even the best monetization model with poor quality content would not be successful. However, combination of too many ads and signs of monetization despite high quality content may cause the same effect. And as the last step I would definitely recommend using combination of at least two different forms (for example Display advertising with Link building) in case one them, for some reason, did not work out.
It is possible to tell that the next recommendations can be also confronted with the results of the SPIR where was noted that the key to the success of the paid project are three factors in particular:
• high specialization (very specific target group), • unique content, • focusing on activities with non-existent competition.
Based on performed description and comparison, final recommendations for the segment of small and medium businesses can be finally made: prioritizing segment of mobile and communication technologies, purposefully using metadata, user data and data mining, definitely consider focusing on data mining in internet of things segment and increasing the potential of monetizing gaming platforms even further with as lowest negative impact on the gameplay itself as possible. Acknowledgement
The work was supported by SGS/19/2016 project called “Advanced mining methods and simulation techniques in business process domain”. References BONDIA-BARCELO, J., CASTELLA-ROCA, J., VIEJO, A. (2016). Building Privacy-Preserving Search Engine Query Logs for Data Monetization. In 13th IEEE Int Conf on Ubiquitous Intelligence and Comp. Toulouse, France: University Toulouse, pp. 390-397. BOWDEN, J. (2014). Monetization Strategies For The Internet of Things. [online]. Available from: http://www.business2community.com/strategy/monetization-strategies-internet-things-01036208#6bclpL4xy2o52zWC.97. CAO, H. et al. (2014). SoLoMo analytics for telco Big Data monetization. Ibm Journal Of Research And Development, vol. 58, no. 5-6, Article Number 9. COX, J. (2014). Newspapers in transition: American dailies confront the digital age. McFarland, NC: Jefferson. CROLL, A., YOSKOVITZ, B. (2016). Lean analýza. Brno: BizBooks, Albatros Media a.s GHOSE, A., YANG, S. (2009). An Empirical Analysis of Search Engine Advertising: Sponsored Search in Electronic Markets. Management Science. vol. 55, no. 10, pp. 1605-1622.
35
KARAME, G.O. et al. (2014). Microcomputations as Micropayments in Web-based Services. ACM Transactions on Internet Technology, vol. 13, no. 3, Article Number 8. KVASNICOVÁ, J., (2015). Monetizace – strategie zpeněžování online projektů. [online]. Available from: http://blog.byznysweb.cz/2015/06/monetizace-strategie-zpenezovani-online-projektu/. LI, Y.M., FANG, Y., JIN, B.H. (2012). Analyzing Monetization Models for the Digital Content Services: Channel Ownership and Royalty Contracts. Lecture Notes in Business Information Processing, vol. 14, no. 2, pp. 329-352. MIGUEL, F.P., ABARCA, J.P.M. (2016). Promotion and monetization in publishing mobile applications. Revista Icono 14-Revista Cientifica De Comunicacion Y Tecnologias, vol. 108, pp. 195-201. MURETA, C. (2012). Make millions with apps: simple steps to turn your app idea into profit. Hoboken, NJ: Wiley. ZAJC, M. (2015). The Social Media Dispositive and Monetization of User-Generated Content. Information Society, vol. 31, no. 1, pp. 61-67.
36
THE CONCEPT 5C OF TACTICAL MARKETING IN FINANCIAL SERVICES Veronika Braciníková, Kateřina Matušínská Silesian University Opava School of Business Administration in Karviná Univerzitní náměstí 1934/3 Karviná, 733 40 The Czech Republic e-mail: [email protected], [email protected] Abstract
In today's consumer times, marketing is not focused just on marketing issues, but it is part of wider context of enterprises and strategic, tactical and operational management of companies, regions and other organizations. Marketing has basis in many models, starting with marketing mix. The traditional approach of seeing the marketing mix from the producer point of view has now changed to the customer´s perspective. There is a need of customer oriented marketing mix to satisfy the customers. So, the aim of this paper is to investigate impact of tactical marketing in the concept of 5C on consumer perceptions and behaviour. The analysis of primary marketing research data was based on the number of 412 respondents. The consumers were questioned about their behaviour within the topic of customer value, costs to the customer, convenience, communication and customer approach. When deciding about the selection of financial institutions and financial products as fundamental criteria are said to be costs to the customer - pricing policy, convenience - physical availability of branches and their physical evidence. Keywords: financial services, marketing, marketing mix “5C”, primary marketing research JEL codes: M31 1. Introduction
Nowadays, companies are faced with scientific, technological, social, cultural and variations
changes. Beyond these, efficient and successful comapnies are those who can predict the future risks and degradations to redirect these changes to the desired condition and make future better, besides their adaption to today’s changes. But, changes occur in comapnies can be discriminated from changes which company members plan. (Mansouri et al., 2015)
Today's successful companies at all levels have one thing in common: They have a strong customer focus and seriously believe to marketing. They have a high sense of commitment in understanding customers' needs and their situation. They know the target market very well. In such companies, each person is encouraged to provide higher value to the customer and seeks customer satisfaction. Marketing more than anything else is dealing with customers. Understanding of what is valuable to customers and generates and delivers it to the customer and keeping him/her satisfied is right at the heart of marketing. Attaining the objective of the marketing that is delivering value to the customer with profitability can be achieved with marketing management that means establish and maintain beneficial exchanges with target buyers with the aim of achieving the company's objectives. Thus marketing management includes demand management which in turn is customer relationship management. When a company decides that be higher than their competitors to be successful should have marketing appropriate tools. Speaking of marketing tools a company getting ready to plan the details of the marketing mix that is a set of elements and tactics controlled and a company by combining them responds to a target market wants. (Gilaninia, Taleghani and Azizi, 2013) The aim of this paper is to investigate impact of tactical marketing in the concept of 5C on consumer perceptions and behaviour.
The classic marketing mix in the form of “4P” is based on the philosophy of selling the already produced goods rather than how to produce the desired goods. Shortly after the 2. World War, demand exceeded or equaled supply, and it was not a problem to sell almost anything. No internet, no free trade, no informed customer - from today's point of view the ideal environment. But current marketing needs to be more and more involved in what the customer wants. The task of marketing is thus to identify the individual needs of each customer and to present products or services that are as specific as possible to his or her needs. The so-called customization, or adaptation to individual needs, also plays a major role. These new conditions are based on the “4C” concept that was created by Bob Lauterborn, professor of advertising at the University of North Carolina. The essence of the 4C philosophy is: 1) Not the product but the value for the customer 2)
37
The price is not as the price 3) Promotion or communication with the customer? 4) Distribution or comfort for customer? There is the fifth “C” added in the area of services which means people as personal and human contact and attitude to the customer. 2. Tools of Financial Services Marketing
The competition among companies has been shifted from local to global with the globalization that quick development caused at communication technology. Companies have been using the last technology and marketing applications to reach the consumers. Companies try to direct the consumers towards their own products and brands with the advertising messages. (Geçti and Gümüş, 2013) 2.1 General Approach to Marketing Mix
One of the main areas focused on organisations is how to satisfy customers, because of the organizational benefit of customer satisfaction. Customer satisfaction is linked to customer loyalty (Fornell, 1992). Customer satisfaction is also associated with building and maintaining strong customer relationship (Blattberg, Malthouse and Neslin, 2009). Customer satisfaction can be viewed as a relationship of perceived value of service and the expected value by customers. If the perceived value of services matches customer perceived expected value, then customer is said to be satisfied. (Mohammad, 2015) The traditional approach of seeing the marketing mix from the producer point of view has now changed to the customer´s perspective (Nezakati, Abu and Toh, 2011). There is a need of customer oriented marketing mix to satisfy the customers (Paul, 2014). Lauterborn (1990) suggested that the marketers should think in terms of 4Cs concept rather than 4Ps i.e. – customer solution (instead of product), customer cost (instead of price), customer convenience (instead of place) and customer communication (instead of promotion). Thus, the 4C concept is reformation of traditional marketing mix (4P) which is more relevant in the current scenario. (Paul, 2014)
Establishing, developing and maintaining buyer/seller relationships has been central to marketing theory and practice and to corporate strategy (Lopez et al., 2006). Customer loyalty is important, particularly in the service sector, because it results in increased profits through repeat patronage, lower price sensitivity and positive word of mouth (Foscht et al., 2009). (Lymperopoulos, Chaniotakis and Soureli, 2013) Particularly in the highly complex and dynamic environment of the banking industry, customer loyalty has become an important goal of retail banks. Fostering meaningful long-term relationships with customers promotes competitiveness, provides sustainable success and offers reliable sources of funding through core deposits (Mertayak, 2012). In fact, never before than today, has it been so crucial for retail banks to concentrate loyalty building exercises on customers that count and prevent attrition (Ernst and Young, 2010). Customer orientation has replaced the traditional product orientation, as a result of the radical changes in the market, with respect to consumer behaviour and a lack of differentiation between financial products and services (Beerli et al., 2004). Customers become more price-sensitive and less loyal, encouraged by the price transparency provided by the internet (Low, 2012). In addition to this, the financial crisis appears to have raised customers’ demands in relation to banks’ performance across several variables such as relationship services, value-added services and product innovation (Lassignardie, 2012). Customers are taking control of their banking relationships and ask for more power, showing an increasing desire to make their own, informed decisions about products and pricing (Ernst and Young, 2010). Customers’ information seeking behaviour, which has been extremely facilitated by the clarity demanded by regulators and investors, has been stimulated, with customers actively searching for the best rate from various sources of information (Ernst and Young, 2010). (Lymperopoulos, Chaniotakis and Soureli, 2013)
Following this, bank executives worry about losing customers to another bank (Lees et al., 2007) and have to seek alternatives that yield competitive advantages (Foscht et al., 2009). They must develop customer-oriented strategies in order to compete successfully in the globalised retail banking environment, retain their customers, and maximise the associated revenues and cost savings (Clemes et al., 2010). 2.2 Marketing Mix in Financial Services
Marketing mix elements are means to an end, they pave way for marketing managers to achieve organizational goals and objectives through proper planning. McCarthy (1964) defined marketing mix as controllable variables used by organisations to satisfy target market. Kotler and Armstrong (1989) define marketing mix as “the set of controllable marketing variables that the company blends to produce the response of wants in the target market.” The two definitions above are closely related. They both agreed marketing mix are controllable tools that should be used towards satisfying target market. The major
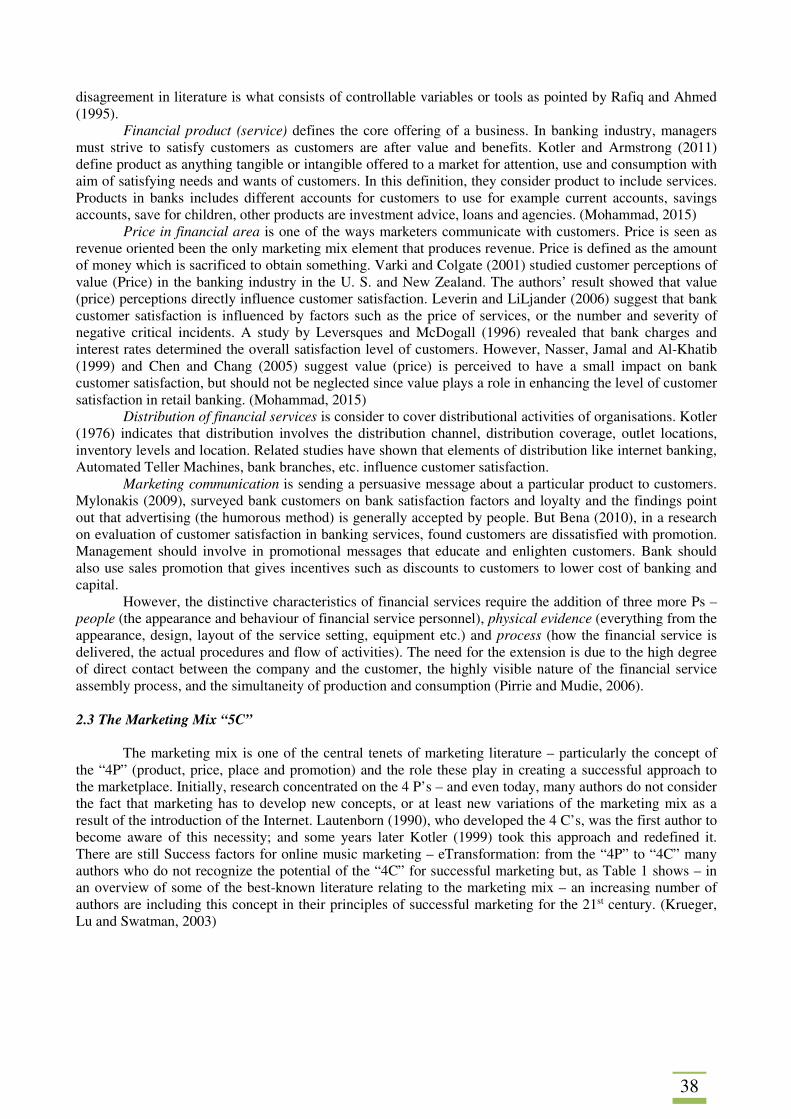
38
disagreement in literature is what consists of controllable variables or tools as pointed by Rafiq and Ahmed (1995).
Financial product (service) defines the core offering of a business. In banking industry, managers must strive to satisfy customers as customers are after value and benefits. Kotler and Armstrong (2011) define product as anything tangible or intangible offered to a market for attention, use and consumption with aim of satisfying needs and wants of customers. In this definition, they consider product to include services. Products in banks includes different accounts for customers to use for example current accounts, savings accounts, save for children, other products are investment advice, loans and agencies. (Mohammad, 2015)
Price in financial area is one of the ways marketers communicate with customers. Price is seen as revenue oriented been the only marketing mix element that produces revenue. Price is defined as the amount of money which is sacrificed to obtain something. Varki and Colgate (2001) studied customer perceptions of value (Price) in the banking industry in the U. S. and New Zealand. The authors’ result showed that value (price) perceptions directly influence customer satisfaction. Leverin and LiLjander (2006) suggest that bank customer satisfaction is influenced by factors such as the price of services, or the number and severity of negative critical incidents. A study by Leversques and McDogall (1996) revealed that bank charges and interest rates determined the overall satisfaction level of customers. However, Nasser, Jamal and Al-Khatib (1999) and Chen and Chang (2005) suggest value (price) is perceived to have a small impact on bank customer satisfaction, but should not be neglected since value plays a role in enhancing the level of customer satisfaction in retail banking. (Mohammad, 2015)
Distribution of financial services is consider to cover distributional activities of organisations. Kotler (1976) indicates that distribution involves the distribution channel, distribution coverage, outlet locations, inventory levels and location. Related studies have shown that elements of distribution like internet banking, Automated Teller Machines, bank branches, etc. influence customer satisfaction.
Marketing communication is sending a persuasive message about a particular product to customers. Mylonakis (2009), surveyed bank customers on bank satisfaction factors and loyalty and the findings point out that advertising (the humorous method) is generally accepted by people. But Bena (2010), in a research on evaluation of customer satisfaction in banking services, found customers are dissatisfied with promotion. Management should involve in promotional messages that educate and enlighten customers. Bank should also use sales promotion that gives incentives such as discounts to customers to lower cost of banking and capital.
However, the distinctive characteristics of financial services require the addition of three more Ps – people (the appearance and behaviour of financial service personnel), physical evidence (everything from the appearance, design, layout of the service setting, equipment etc.) and process (how the financial service is delivered, the actual procedures and flow of activities). The need for the extension is due to the high degree of direct contact between the company and the customer, the highly visible nature of the financial service assembly process, and the simultaneity of production and consumption (Pirrie and Mudie, 2006).
2.3 The Marketing Mix “5C”
The marketing mix is one of the central tenets of marketing literature – particularly the concept of
the “4P” (product, price, place and promotion) and the role these play in creating a successful approach to the marketplace. Initially, research concentrated on the 4 P’s – and even today, many authors do not consider the fact that marketing has to develop new concepts, or at least new variations of the marketing mix as a result of the introduction of the Internet. Lautenborn (1990), who developed the 4 C’s, was the first author to become aware of this necessity; and some years later Kotler (1999) took this approach and redefined it. There are still Success factors for online music marketing – eTransformation: from the “4P” to “4C” many authors who do not recognize the potential of the “4C” for successful marketing but, as Table 1 shows – in an overview of some of the best-known literature relating to the marketing mix – an increasing number of authors are including this concept in their principles of successful marketing for the 21st century. (Krueger, Lu and Swatman, 2003)
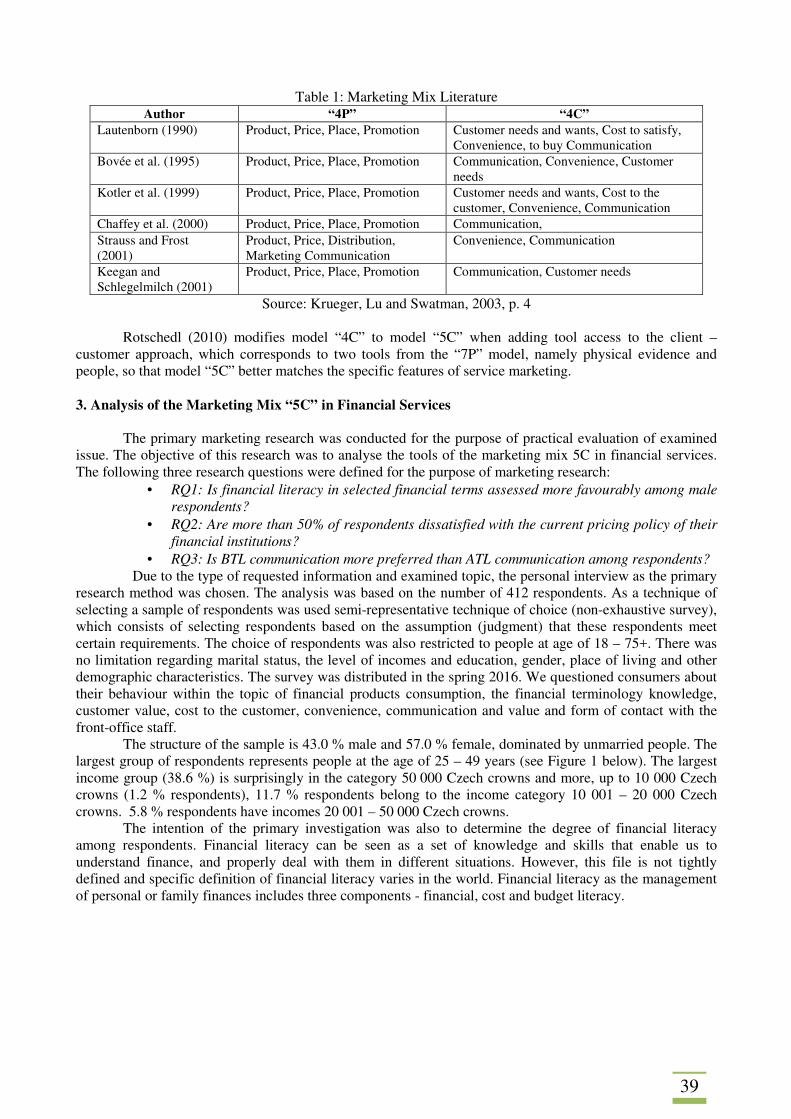
39
Table 1: Marketing Mix Literature Author “4P” “4C”
Lautenborn (1990) Product, Price, Place, Promotion Customer needs and wants, Cost to satisfy, Convenience, to buy Communication
Bovée et al. (1995) Product, Price, Place, Promotion Communication, Convenience, Customer needs
Kotler et al. (1999) Product, Price, Place, Promotion Customer needs and wants, Cost to the customer, Convenience, Communication
Chaffey et al. (2000) Product, Price, Place, Promotion Communication, Strauss and Frost (2001)
Product, Price, Distribution, Marketing Communication
Convenience, Communication
Keegan and Schlegelmilch (2001)
Product, Price, Place, Promotion Communication, Customer needs
Source: Krueger, Lu and Swatman, 2003, p. 4
Rotschedl (2010) modifies model “4C” to model “5C” when adding tool access to the client – customer approach, which corresponds to two tools from the “7P” model, namely physical evidence and people, so that model “5C” better matches the specific features of service marketing. 3. Analysis of the Marketing Mix “5C” in Financial Services
The primary marketing research was conducted for the purpose of practical evaluation of examined
issue. The objective of this research was to analyse the tools of the marketing mix 5C in financial services. The following three research questions were defined for the purpose of marketing research:
• RQ1: Is financial literacy in selected financial terms assessed more favourably among male respondents?
• RQ2: Are more than 50% of respondents dissatisfied with the current pricing policy of their financial institutions?
• RQ3: Is BTL communication more preferred than ATL communication among respondents? Due to the type of requested information and examined topic, the personal interview as the primary
research method was chosen. The analysis was based on the number of 412 respondents. As a technique of selecting a sample of respondents was used semi-representative technique of choice (non-exhaustive survey), which consists of selecting respondents based on the assumption (judgment) that these respondents meet certain requirements. The choice of respondents was also restricted to people at age of 18 – 75+. There was no limitation regarding marital status, the level of incomes and education, gender, place of living and other demographic characteristics. The survey was distributed in the spring 2016. We questioned consumers about their behaviour within the topic of financial products consumption, the financial terminology knowledge, customer value, cost to the customer, convenience, communication and value and form of contact with the front-office staff.
The structure of the sample is 43.0 % male and 57.0 % female, dominated by unmarried people. The largest group of respondents represents people at the age of 25 – 49 years (see Figure 1 below). The largest income group (38.6 %) is surprisingly in the category 50 000 Czech crowns and more, up to 10 000 Czech crowns (1.2 % respondents), 11.7 % respondents belong to the income category 10 001 – 20 000 Czech crowns. 5.8 % respondents have incomes 20 001 – 50 000 Czech crowns.
The intention of the primary investigation was also to determine the degree of financial literacy among respondents. Financial literacy can be seen as a set of knowledge and skills that enable us to understand finance, and properly deal with them in different situations. However, this file is not tightly defined and specific definition of financial literacy varies in the world. Financial literacy as the management of personal or family finances includes three components - financial, cost and budget literacy.
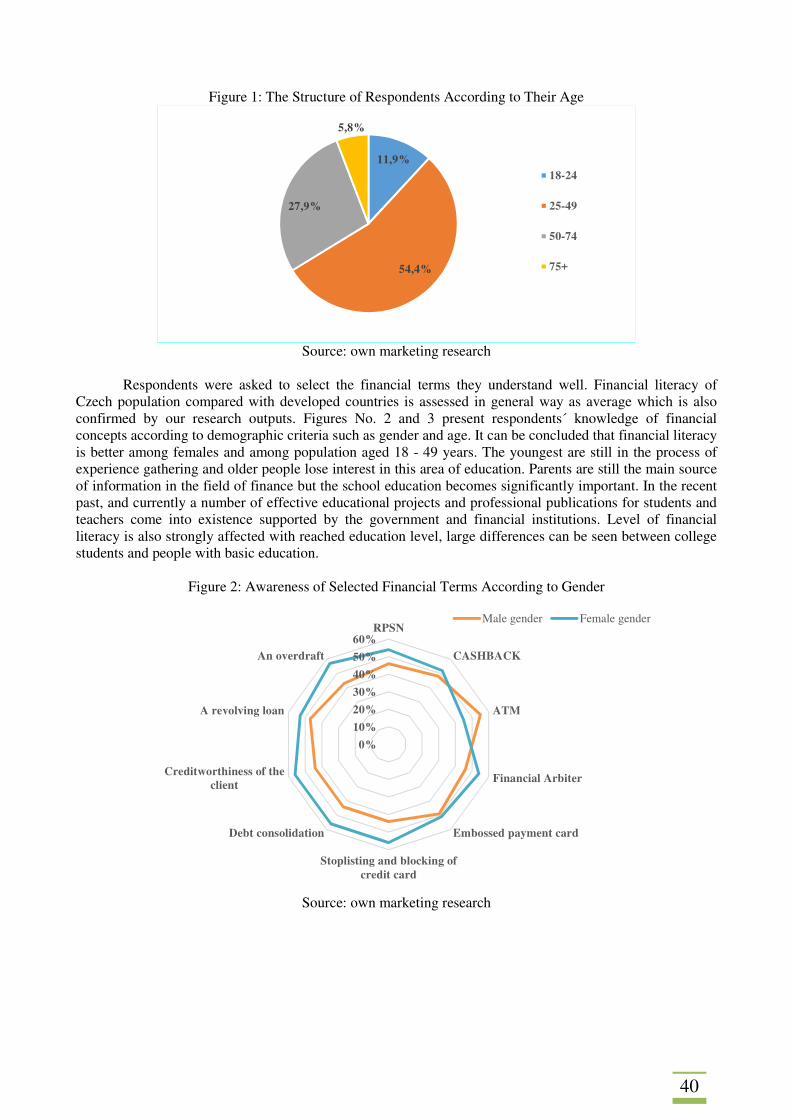
40
Figure 1: The Structure of Respondents According to Their Age
Source: own marketing research
Respondents were asked to select the financial terms they understand well. Financial literacy of
Czech population compared with developed countries is assessed in general way as average which is also confirmed by our research outputs. Figures No. 2 and 3 present respondents´ knowledge of financial concepts according to demographic criteria such as gender and age. It can be concluded that financial literacy is better among females and among population aged 18 - 49 years. The youngest are still in the process of experience gathering and older people lose interest in this area of education. Parents are still the main source of information in the field of finance but the school education becomes significantly important. In the recent past, and currently a number of effective educational projects and professional publications for students and teachers come into existence supported by the government and financial institutions. Level of financial literacy is also strongly affected with reached education level, large differences can be seen between college students and people with basic education.
Figure 2: Awareness of Selected Financial Terms According to Gender
Source: own marketing research
11,9%
54,4%
27,9%
5,8%
18-24
25-49
50-74
75+
0%
10%
20%
30%
40%
50%
60%RPSN
CASHBACK
ATM
Financial Arbiter
Embossed payment card
Stoplisting and blocking ofcredit card
Debt consolidation
Creditworthiness of theclient
A revolving loan
An overdraft
Male gender Female gender
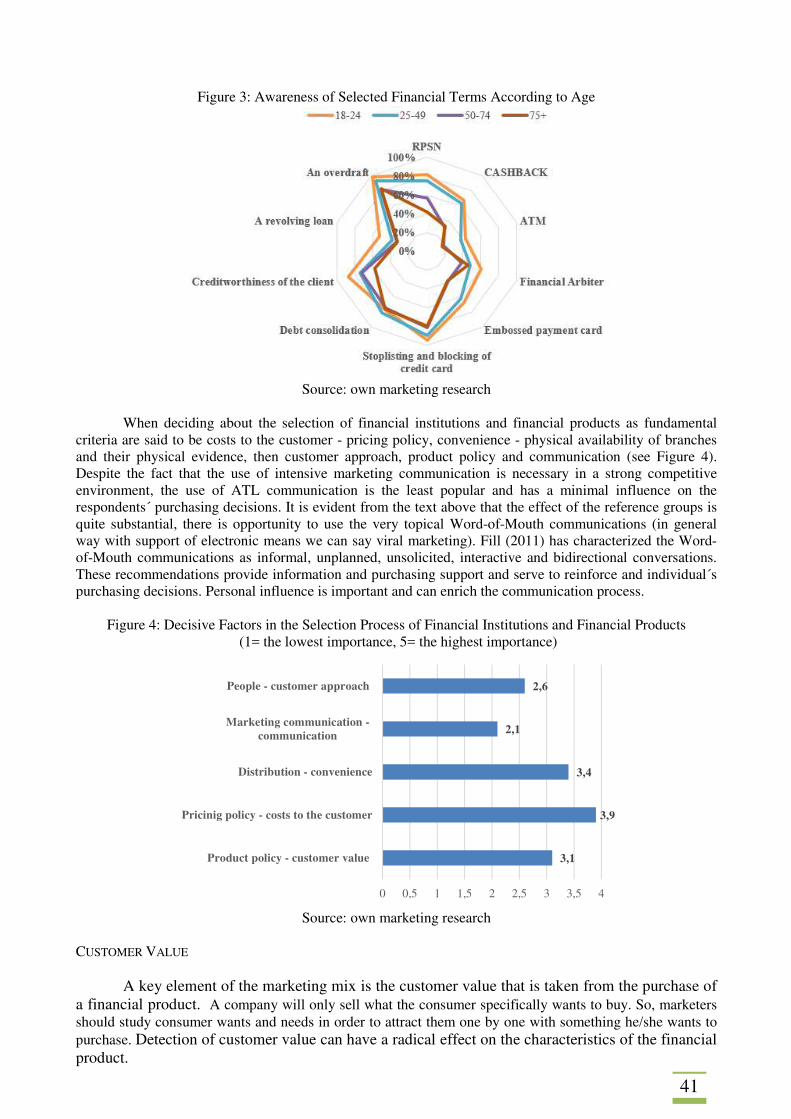
41
Figure 3: Awareness of Selected Financial Terms According to Age
Source: own marketing research
When deciding about the selection of financial institutions and financial products as fundamental
criteria are said to be costs to the customer - pricing policy, convenience - physical availability of branches and their physical evidence, then customer approach, product policy and communication (see Figure 4). Despite the fact that the use of intensive marketing communication is necessary in a strong competitive environment, the use of ATL communication is the least popular and has a minimal influence on the respondents´ purchasing decisions. It is evident from the text above that the effect of the reference groups is quite substantial, there is opportunity to use the very topical Word-of-Mouth communications (in general way with support of electronic means we can say viral marketing). Fill (2011) has characterized the Word-of-Mouth communications as informal, unplanned, unsolicited, interactive and bidirectional conversations. These recommendations provide information and purchasing support and serve to reinforce and individual´s purchasing decisions. Personal influence is important and can enrich the communication process.
Figure 4: Decisive Factors in the Selection Process of Financial Institutions and Financial Products (1= the lowest importance, 5= the highest importance)
Source: own marketing research
CUSTOMER VALUE
A key element of the marketing mix is the customer value that is taken from the purchase of a financial product. A company will only sell what the consumer specifically wants to buy. So, marketers should study consumer wants and needs in order to attract them one by one with something he/she wants to purchase. Detection of customer value can have a radical effect on the characteristics of the financial product.
3,1
3,9
3,4
2,1
2,6
0 0,5 1 1,5 2 2,5 3 3,5 4
Product policy - customer value
Pricinig policy - costs to the customer
Distribution - convenience
Marketing communication -communication
People - customer approach
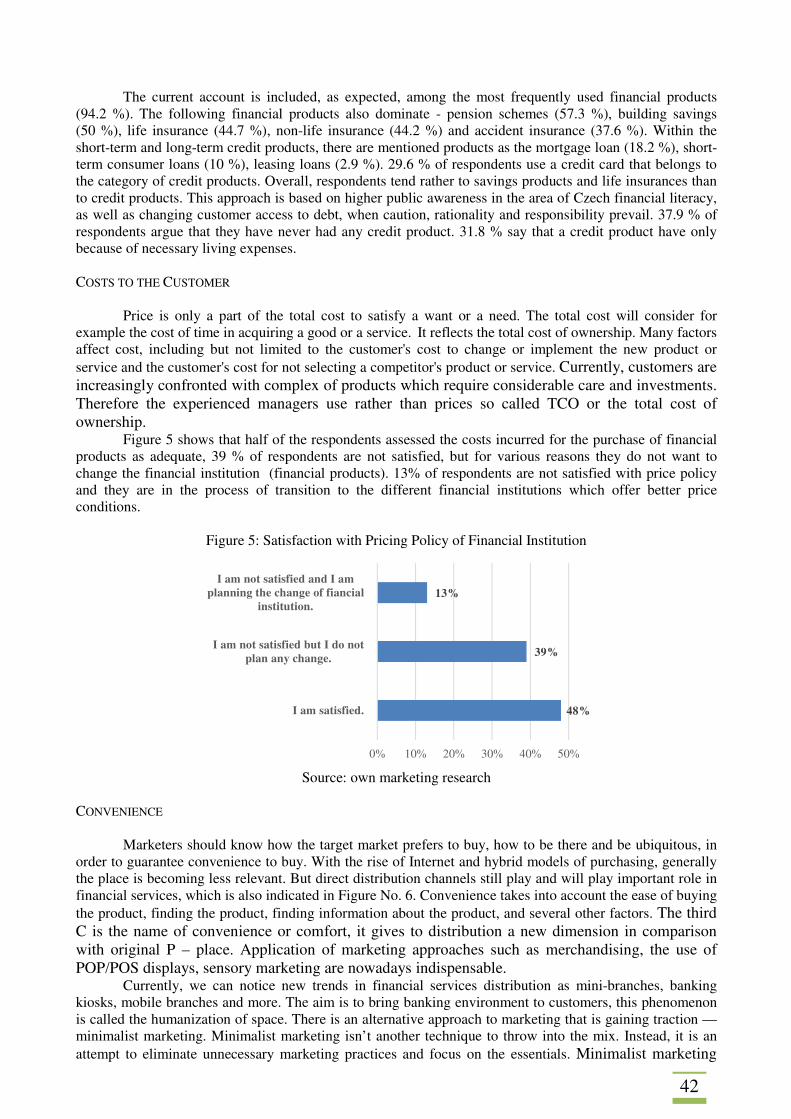
42
The current account is included, as expected, among the most frequently used financial products (94.2 %). The following financial products also dominate - pension schemes (57.3 %), building savings (50 %), life insurance (44.7 %), non-life insurance (44.2 %) and accident insurance (37.6 %). Within the short-term and long-term credit products, there are mentioned products as the mortgage loan (18.2 %), short-term consumer loans (10 %), leasing loans (2.9 %). 29.6 % of respondents use a credit card that belongs to the category of credit products. Overall, respondents tend rather to savings products and life insurances than to credit products. This approach is based on higher public awareness in the area of Czech financial literacy, as well as changing customer access to debt, when caution, rationality and responsibility prevail. 37.9 % of respondents argue that they have never had any credit product. 31.8 % say that a credit product have only because of necessary living expenses. COSTS TO THE CUSTOMER
Price is only a part of the total cost to satisfy a want or a need. The total cost will consider for example the cost of time in acquiring a good or a service. It reflects the total cost of ownership. Many factors affect cost, including but not limited to the customer's cost to change or implement the new product or service and the customer's cost for not selecting a competitor's product or service. Currently, customers are increasingly confronted with complex of products which require considerable care and investments. Therefore the experienced managers use rather than prices so called TCO or the total cost of ownership.
Figure 5 shows that half of the respondents assessed the costs incurred for the purchase of financial products as adequate, 39 % of respondents are not satisfied, but for various reasons they do not want to change the financial institution (financial products). 13% of respondents are not satisfied with price policy and they are in the process of transition to the different financial institutions which offer better price conditions.
Figure 5: Satisfaction with Pricing Policy of Financial Institution
Source: own marketing research
CONVENIENCE
Marketers should know how the target market prefers to buy, how to be there and be ubiquitous, in order to guarantee convenience to buy. With the rise of Internet and hybrid models of purchasing, generally the place is becoming less relevant. But direct distribution channels still play and will play important role in financial services, which is also indicated in Figure No. 6. Convenience takes into account the ease of buying the product, finding the product, finding information about the product, and several other factors. The third C is the name of convenience or comfort, it gives to distribution a new dimension in comparison with original P – place. Application of marketing approaches such as merchandising, the use of POP/POS displays, sensory marketing are nowadays indispensable.
Currently, we can notice new trends in financial services distribution as mini-branches, banking kiosks, mobile branches and more. The aim is to bring banking environment to customers, this phenomenon is called the humanization of space. There is an alternative approach to marketing that is gaining traction — minimalist marketing. Minimalist marketing isn’t another technique to throw into the mix. Instead, it is an attempt to eliminate unnecessary marketing practices and focus on the essentials. Minimalist marketing
48%
39%
13%
0% 10% 20% 30% 40% 50%
I am satisfied.
I am not satisfied but I do notplan any change.
I am not satisfied and I amplanning the change of fiancial
institution.
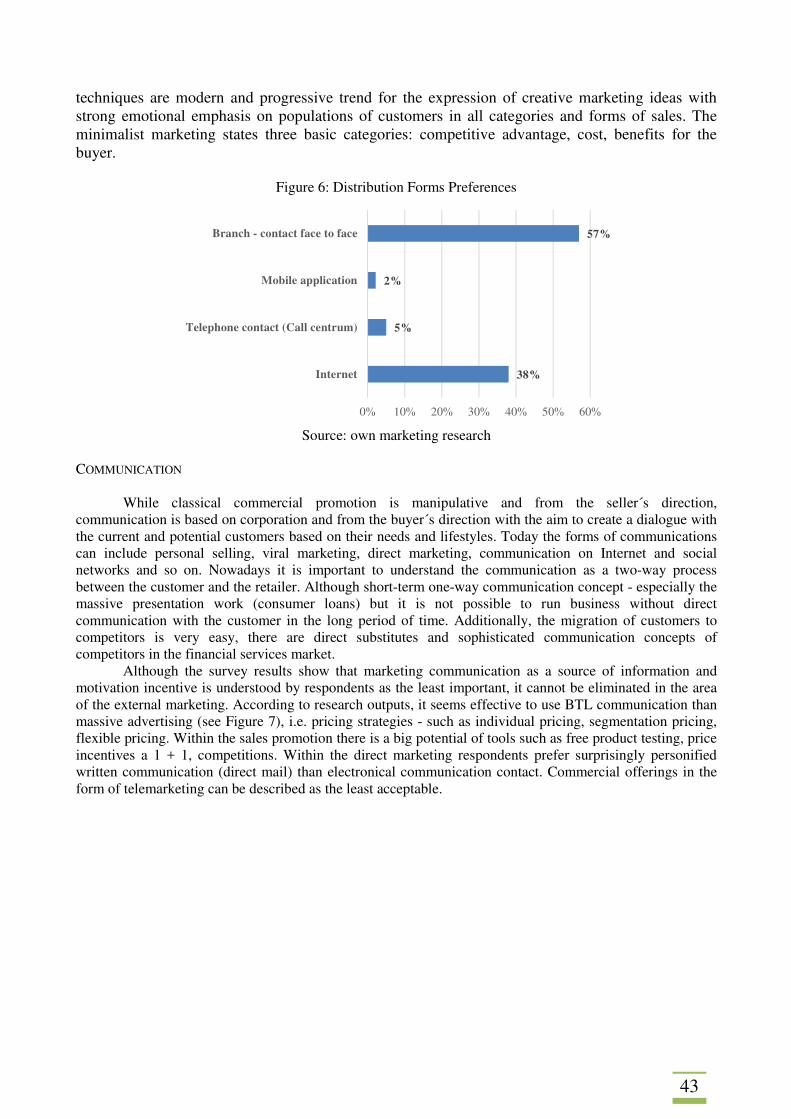
43
techniques are modern and progressive trend for the expression of creative marketing ideas with strong emotional emphasis on populations of customers in all categories and forms of sales. The minimalist marketing states three basic categories: competitive advantage, cost, benefits for the buyer.
Figure 6: Distribution Forms Preferences
Source: own marketing research
COMMUNICATION
While classical commercial promotion is manipulative and from the seller´s direction, communication is based on corporation and from the buyer´s direction with the aim to create a dialogue with the current and potential customers based on their needs and lifestyles. Today the forms of communications can include personal selling, viral marketing, direct marketing, communication on Internet and social networks and so on. Nowadays it is important to understand the communication as a two-way process between the customer and the retailer. Although short-term one-way communication concept - especially the massive presentation work (consumer loans) but it is not possible to run business without direct communication with the customer in the long period of time. Additionally, the migration of customers to competitors is very easy, there are direct substitutes and sophisticated communication concepts of competitors in the financial services market.
Although the survey results show that marketing communication as a source of information and motivation incentive is understood by respondents as the least important, it cannot be eliminated in the area of the external marketing. According to research outputs, it seems effective to use BTL communication than massive advertising (see Figure 7), i.e. pricing strategies - such as individual pricing, segmentation pricing, flexible pricing. Within the sales promotion there is a big potential of tools such as free product testing, price incentives a 1 + 1, competitions. Within the direct marketing respondents prefer surprisingly personified written communication (direct mail) than electronical communication contact. Commercial offerings in the form of telemarketing can be described as the least acceptable.
38%
5%
2%
57%
0% 10% 20% 30% 40% 50% 60%
Internet
Telephone contact (Call centrum)
Mobile application
Branch - contact face to face
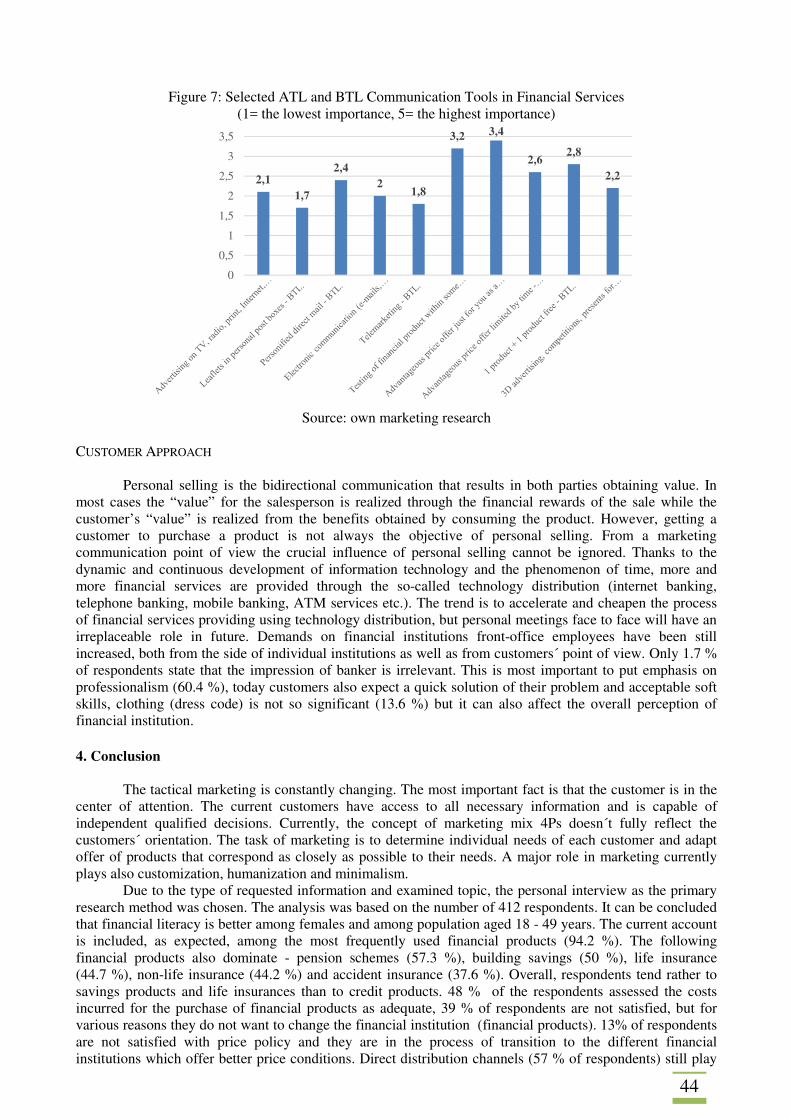
44
Figure 7: Selected ATL and BTL Communication Tools in Financial Services (1= the lowest importance, 5= the highest importance)
Source: own marketing research
CUSTOMER APPROACH
Personal selling is the bidirectional communication that results in both parties obtaining value. In most cases the “value” for the salesperson is realized through the financial rewards of the sale while the customer’s “value” is realized from the benefits obtained by consuming the product. However, getting a customer to purchase a product is not always the objective of personal selling. From a marketing communication point of view the crucial influence of personal selling cannot be ignored. Thanks to the dynamic and continuous development of information technology and the phenomenon of time, more and more financial services are provided through the so-called technology distribution (internet banking, telephone banking, mobile banking, ATM services etc.). The trend is to accelerate and cheapen the process of financial services providing using technology distribution, but personal meetings face to face will have an irreplaceable role in future. Demands on financial institutions front-office employees have been still increased, both from the side of individual institutions as well as from customers´ point of view. Only 1.7 % of respondents state that the impression of banker is irrelevant. This is most important to put emphasis on professionalism (60.4 %), today customers also expect a quick solution of their problem and acceptable soft skills, clothing (dress code) is not so significant (13.6 %) but it can also affect the overall perception of financial institution. 4. Conclusion
The tactical marketing is constantly changing. The most important fact is that the customer is in the center of attention. The current customers have access to all necessary information and is capable of independent qualified decisions. Currently, the concept of marketing mix 4Ps doesn´t fully reflect the customers´ orientation. The task of marketing is to determine individual needs of each customer and adapt offer of products that correspond as closely as possible to their needs. A major role in marketing currently plays also customization, humanization and minimalism.
Due to the type of requested information and examined topic, the personal interview as the primary research method was chosen. The analysis was based on the number of 412 respondents. It can be concluded that financial literacy is better among females and among population aged 18 - 49 years. The current account is included, as expected, among the most frequently used financial products (94.2 %). The following financial products also dominate - pension schemes (57.3 %), building savings (50 %), life insurance (44.7 %), non-life insurance (44.2 %) and accident insurance (37.6 %). Overall, respondents tend rather to savings products and life insurances than to credit products. 48 % of the respondents assessed the costs incurred for the purchase of financial products as adequate, 39 % of respondents are not satisfied, but for various reasons they do not want to change the financial institution (financial products). 13% of respondents are not satisfied with price policy and they are in the process of transition to the different financial institutions which offer better price conditions. Direct distribution channels (57 % of respondents) still play
2,11,7
2,42
1,8
3,2 3,4
2,62,8
2,2
0
0,5
1
1,5
2
2,5
3
3,5
45
and will play important role in financial services. According to research outputs, it seems effective to use BTL communication than massive advertising, i.e. pricing strategies - such as individual pricing, segmentation pricing, flexible pricing. Within the sales promotion there is a big potential of tools such as free product testing, price incentives a 1 + 1, competitions. Demands on financial institutions front-office employees have been still increased, both from the side of individual institutions as well as from customers´ point of view. Only 1.7 % of respondents state that the impression of banker is irrelevant. This is most important to put emphasis on professionalism (60.4 %), today customers also expect a quick solution of their problem and acceptable soft skills, clothing (dress code) is not so significant (13.6 %) but it can also affect the overall perception of financial institution.
Three research questions have been established in the preparatory phase of the primary marketing investigation. The research question No. 1 is answered in the negative because better financial literacy in the framework of selected financial terms can be stated among female respondents. Research question No. 2 has a positive response because 52% of respondents are fully dissatisfied with the pricing policy of their own financial institutions. The last research question No. 3 can be confirmed because BTL communications of financial services is more positively perceived by the respondents than ATL communications.
From the practical point of view, a significant synergy effect can be achieved by linking customer and company marketing mix and looking at both from the position of the company (what it can, it knows, it wants to produce) and also from the customer point of view (what he/she can, she/he wants to buy). Today, focus is no longer on business itself, but on customers. When selling different products, company needs to concentrate itself on communication that allows it to estimate the settings of other mixes. When selling the same products, then comfort can be decided as important as the communication. Companies that create strategies based on a customer-oriented “5C” model achieve much greater success on the markets. Acknowledgement
This paper was supported by the Student grant competition project SGS/7/2017: “Acceptance of technology from the perspective of marketing tools.” References BEERLI, A., MARTÍN, J. D., QUINTANA, A. (2004). A model of customer loyalty in the retail banking market. European Journal of Marketing, vol. 38, no. ½, pp. 253-275. BENA, I. (2010). Evaluating Customer Satisfaction in Banking Services. Management and Marketing, vol. 5, no. 2, pp. 143-150. BLATTBERG, R. C., MALTHOUSE, E. C., NESLIN, S. A. (2009). Customer Lifetime Value: Empirical Generalizations and Some Conceptual Questions. Journal of Interactive Marketing, vol. 23, pp. 157–168. CLEMES, M. D., GAN, C., ZHANG, D. (2010). Customer switching behaviour in the Chinese retail banking industry. International Journal of Bank Marketing, vol. 28, no. 7, pp. 519-546. ERNST and YOUNG, 2010. Understanding consumer behaviour in retail banking – the impact of the credit crisis across Europe [online]. Available from: http://www.ey.com/ Publication/vwLUAssets/Understanding_customer_behavior_in_retail_bababan_-_February_2010/ $FILE/EY_Understanding_customer_behavior_in_retail_banking_-_February_2010.pdf. FORNELL, C. (1992). A National customer satisfaction Barometer. The Swedish Experience. Journal of Marketing, vol. 55, pp. 1-21. FOSCHT, T., SCHLOFFER, J., MALOLES, C., CHIA, S. L. (2009). Assessing the outcomes of generation-y customers’ loyalty. International Journal of Bank Marketing, vol. 27, no. 3, pp. 218-241. GEÇTI, F., GÜMÜŞ, N. (2013). Examining the Attitudes Towards Mobile Advertising Messages: A Field Research on Turkish Consumers. China-USA Business Review, vol. 12, no. 2, pp. 204-2010. GILANINIA, S., TALEGHANI, M., AZIZI, N. (2013). Marketing Mix And Consumer Behavior. Kuwait Chapter of Arabian Journal of Business and Management Review, vol. 2, no. 12, pp. 53-58.
46
CHEN, P. L., CHANG, H. S. (2005). Price brand cues and banking customer value. The International Journal of Bank Marketing, vol. 23, no. 2/3, pp. 273-286. KOTLER, P. (1976). Marketing Management. 3rd ed. New Jersey: Prentice-Hall. KOTLER, P., ARMSTRONG, G. (1989). Principles of Marketing. 4th ed. New Jersey: Prentice-Hall. KOTLER, P., ARMSTRONG, G. (2011). Principles of Marketing. 14th ed. New Jersey: Prentice Hall. KRUEGER, C. C., LU, N., SWATMAN, P. M. C. (2003). Success Factors for Online Music Marketing – eTransformation: From the four P’s to the four C’s1. The Proceedings of CollECTeR Latin America, Santiago, Chile. LASSIGNARDIE, J. (2012). Strategies for success. EFMA Journal, vol. 233, pp. 15-18. LAUTERBORN, B. (1990). Niw Marketing Litany: Four Ps Passe: C- Wors Take Over. Avertising Age, vol. 61, no. 41, pp. 26. LEES, G., GARLAND, R., WRIGHT, M. (2007). Switching banks: old bank gone but not forgotten. Journal of Financial Services Marketing, vol. 12, no. 2, pp. 146-156. LEVERIN, A., LILJANDER, V. (2006). Does relationship marketing improve customer relationship satisfaction and loyalty? International Journal of Bank marketing, vol. 24, no. 4, pp. 232-251. LOPEZ, J. P. M., POLO, R. Y., OLIVAN, F. J. S. (2006). The impact of customer relationship characteristics on customer switching behavior differences between switchers and Stayers. Managing Service Quality, vol. 16, no. 6, pp. 556-574. LOW, S. (2012). Room for improvement. EFMA Journal, vol. 233, pp. 58-61. LYMPEROPOULOS, C., CHANIOTAKIS, I. E., SOURELI, M. (2013). The role of price satisfaction in managing customer relationships: the case of financial service. Marketing Intelligence & Planning, vol. 31, no. 3, pp. 216-228. MANSOURI, H., MEHRANI, H., NARGESIAN, A., GHOLI, T. H., BEKR, S. (2015). Designing Marketing Mix Strategy (4C&A) by Using Strategic Reference Points: a case study in PSP Industrial. International Journal Of Humanities And Cultural Studies, pp. 144-162. MCCARTHY, E. J. (1964). Basic Marketing. IL: Richard D. Irwin. MERTAYAK, S., 2012. A new approach. EFMA Journal. (233), pp69-70. MOHAMMAD, H. I. (2015). 7ps marketing mix and retail bank customer satisfaction in northeast Nigeria. British Journal of Marketing Studies, vol. 3, no. 3, pp. 71-88. MYLONAKIS, J. (2009). Bank satisfaction factors and loyalty: a survey of the Greek bank customer. Innovative Marketing, vol. 5, no. 1, pp. 16-25. NEZAKATI, H., ABU, M. L., TOH, C. (2011). Exploring Hierarchy Situation of 4A Marketing Mix on Malyasia's Fast Foo Restaurant. World Applied Sciences Journal, vol. 15, no. 8, pp. 1157-1167. [online]. Available from: https://www.idosi.org/wasj/wasj15(8)11/16.pdf. PAUL, T. (2014). Customer Communication Dimension of Marketing Mix- A Review of Gap between Mutual Fund Investors’ Expectation and Experience. Scholars Journal of Economics, Business and Management, vol. 1, no. 5, pp. 197-202. PAUL, T. (2014). Customer Experience Driven Expectations - A Cognitive Process. Indian Journal of Applied Research, vol. 4, no. 4, pp. 304-305.

47
PIRRIE, A., MUDDIE, P. (2006). Services Marketing Management. Elsevier: Oxford. RAFIQ, M., AHMED, P. K. (1995). Using the 7Ps as a Generic Marketing Mix: an Exploratory Survey of UK and European Marketing Academics. Marketing Intelligence & Planning, vol. 13, no. 9, pp. 4-15. ROTSCHEDL, J. (2010). Modely marketingových mixů [online]. Available from: http://www.rotschedl.com/news/modely-marketingovych-mixu1/. VARKI, S., COLGATE, M. (2001). The role of price perceptions in an integrated model of behavioral intentions. Journal of Service Research, vol. 3, no. 2, pp. 232-40.
48
DECISION-MAKING PROCESSES IN DEALING WITH PROBLEMS IN CUSTOMER SERVICE AREA Šárka Čemerková, Daniel Kvíčala Silesian University in Opava School of Business Administration in Karviná, Department of Business Economics and Management Univerzitní náměstí 1934/3 Karviná, 733 40 Czech Republic e-mail: [email protected], [email protected] Abstract
The goods blocked in virtual shopping cart in an online shop may cause a few complications. On one hand, the goods become unavailable for other customers and on the other, it may cause loss of interest in finishing a deal and the damage of the company’s brand. Leading a customer in putting the goods into the cart creates the costs, which may be unnecessary if the purchase is not finished. To arrange better quality of customer service, companies must keep more stored goods, which again brings increasing the costs. The aim of the article is to propose a decision-making model, which the company should follow in case of blocking the goods in the shopping cart in an online shop. The article is divided into two main parts. The first part deals with the research of available literature in this field. In the second part, a process map of the decision-making process will be created, based on experience from a real company. This map can serve as general instructions to follow in case of blocking the goods in the cart and it can reduce negative effects of company’s decisions in dealing with the particular problem. Keywords: customer service, decision making, processes, blocked goods, costs JEL codes: L26, M10, M21, M31 1. Introduction
The current period is characterized by turbulent hyper-competitive environment. Many businesses offer similar or even the same products in terms of utility, quality and price. Even promotional activities of the competition can be easily imitated. But there are differences in customer service that can bring a significant competitive edge over the business (Saruc et al., 2013.) Thanks to their customer service, the business can be different, exceptional in the eyes of customers.
The level of service provided to external customers determines whether an organization will keep its current customers and how many new customers it attracts because the level of service it provides to its customers has a direct impact on its market share, its overall logistics costs and ultimately to its profitability(Lambert, 2000), (Sixta and Mačát, 2005). More and more companies are aware of this fact and pay due attention to the correct setting of the provided customer service.
Determining the level of stocks of finished products and their exhaustion in continuity of customer responses is one of the basic pillars of development of customer service strategy (Pernica, 2005). In today's electronic era, customers are optimistic of access to all information related to their order, and pay increased attention to all issues related to delivery.
The aim of the article is to propose a decision-making model, which the company should follow in case of blocking the goods in the shopping, cart in an online shop. To formulate and then solve the problem connected with blocked goods during the customer journey in e-shop data from a real small business have been used. The chosen company is international small size enterprise (25 -30 employees) focused on production and distribution of men and women clothing. The distribution their products is realized by shops and internet e-shops. Company's turnover is about 20 million CZK per year with circa 70 000 units of sold goods (20 000 through the internet e-shop). 2. Importance of Customer Service
Customer service can be defined as the process between buyer, seller and third party. The result of this process is the benefit that increases the value of the product or service that is subject to shift. This benefit needs to be provided in a cost-effective way (Lamber, 2000). Customer service can be divided into 3 basic groups:
49
• Pre-sales activities. • Sales activities, • After-sales activities,
Pre-sales activities must be formulated and available to customers before the business begins to realize sales activities. This includes, among other things, the determination of the standards and benchmarks by which the service will be assessed and the determination of the way by witch the customer should proceed in the event that the expected customer service level is not respected by the company.
Sales items include accurate customer information about warehouse status, delivery date and order status. Ease of ordering through user-friendly interfaces is one of the factors on witch customers are during purchase very sensitive. Information quality and service quality are important antecedents of customer satisfaction (Bačík et al., 2014).
After-sales items provide support for a product or service after the customer has already purchased it. In other words, customer service is the support you offer your customers – both before and during and after they buy your product.
Well-delivered customer service is a prerequisite for customer satisfaction. It is a key link between marketing and logistics and plays an important role in creating and maintaining of customer loyalty.
Nowadays, the marketing costs of getting a new customer are extremely high. Keeping existing customers by providing of quality customer service is for businesses much less expensive. In addition, negative promotion due to unfulfilled expectations means the loss of not only this unsatisfied customer, but also a whole host of others.
In terms of customer service quality, supplies play a key role. Sufficient inventory level reduces the probability of exhaustion due to demand variability. Increased inventory level means higher inventory availability for the customer and thus a higher level of customer service, as this increases the order fulfillment rate, i.e. the percentage of units available to the customer at the time they are requested. Availability is a comprehensive statement of the nature of the problem (Horáková and Kubát, 1999). Perceived performance on logistics attributes significantly affects customer satisfaction (Leuschner et al., 2012).
On the other hand, stocks are very problematic (Emmet, 2008). It is a large and costly investment that eventually does not have to be meaningfully used (Drahotský and Řezníček, 2003). Excluding funds for the acquisition of inventories, the enterprise spends more money on storing and eventually liquidating them if the stocks are out of date and customers are no longer interested in them. Although all organizations keep inventories (Müller, 2011), setting the right level of inventory is a great skill.
High-quality inventory management is an important task for all types of businesses, including e-shops. These types of shops show an increase in sales volume each year. More and more customers, whose purchasing decisions depend not only on the price, but also on the overall sales experience, which is conditioned by the availability of the product, visit their website. If the product is not in the stock, few customers are willing to wait. In such a situation, the customer buys goods at the competition. There is a waste of many costs. The task of remarketing is then to get customers back, but this again represents additional costs for making a sale.
Customers usually buy multiple items in the e-shop, which they are gradually loading and unloading from the shopping cart. With this their activity, a number of logistics operations are linked in the e-shop (Lukoszová, 2004). The key is to connect the customer with the product, i.e. blocking it for other customers.
In case of dissatisfaction, customers who try to correct the situation give the seller the opportunity to solve the problem. The major factor that determines why some dissatisfied consumers seek redress and give the seller a chance to remedy the problem, while others exit and engage in negative word‐of‐mouth behavior, is the perceived likelihood of success. Results also show that, once a dissatisfied customer seeks redress, that person expects to receive a fair settlement but, more importantly, to be treated with courtesy and respect (Blodgett et al., 1995). Nowadays, when products can be buy through the online store and there are no barriers in purchase, customer loyalty is the key factor in market share preservation (Gavurová et al., 2014), (Užík and Šoltés, 2009).
Customer-oriented behavior of firms has directly effect on consumer quality perceptions, customer satisfaction and service value (Brady and Cronin, 2001). Holders of e-shop have those to gather the consumer’s desires and preferences from his interactions and the data resulting from the sales process (Perner and Fiss, 2002). Customer service has become part of the product itself.
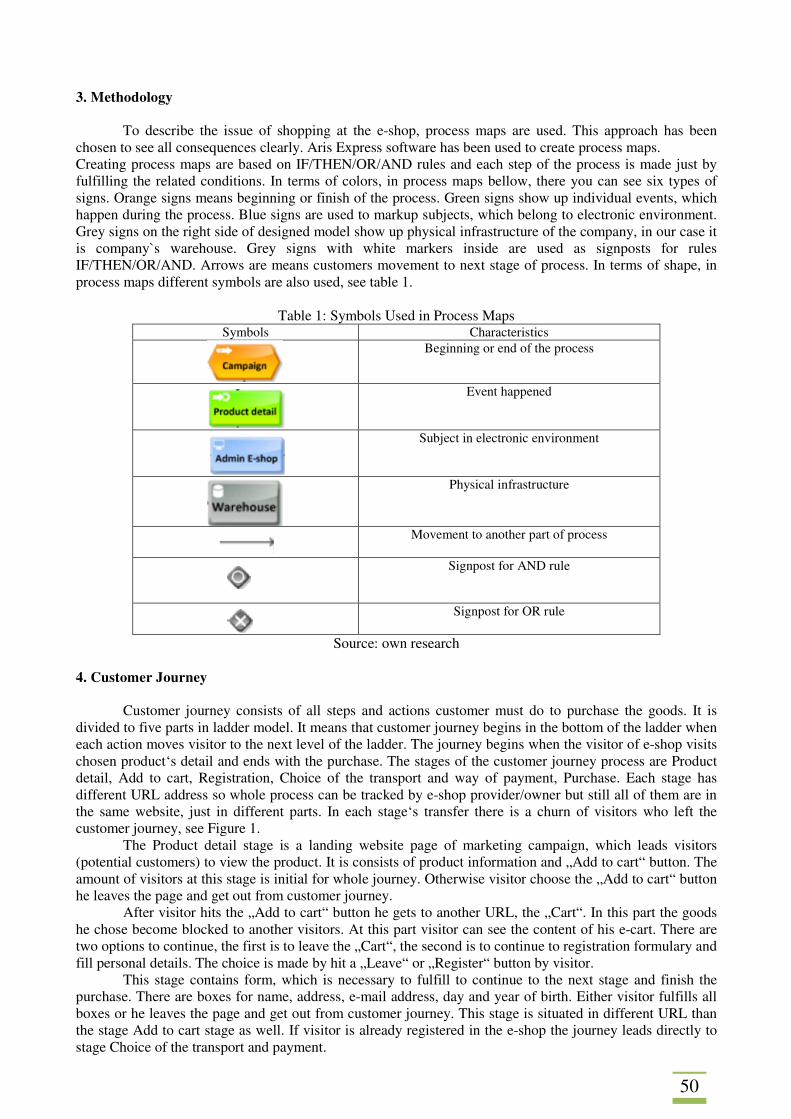
50
3. Methodology
To describe the issue of shopping at the e-shop, process maps are used. This approach has been chosen to see all consequences clearly. Aris Express software has been used to create process maps. Creating process maps are based on IF/THEN/OR/AND rules and each step of the process is made just by fulfilling the related conditions. In terms of colors, in process maps bellow, there you can see six types of signs. Orange signs means beginning or finish of the process. Green signs show up individual events, which happen during the process. Blue signs are used to markup subjects, which belong to electronic environment. Grey signs on the right side of designed model show up physical infrastructure of the company, in our case it is company`s warehouse. Grey signs with white markers inside are used as signposts for rules IF/THEN/OR/AND. Arrows are means customers movement to next stage of process. In terms of shape, in process maps different symbols are also used, see table 1.
Table 1: Symbols Used in Process Maps Symbols Characteristics
Beginning or end of the process
Event happened
Subject in electronic environment
Physical infrastructure
Movement to another part of process
Signpost for AND rule
Signpost for OR rule
Source: own research 4. Customer Journey
Customer journey consists of all steps and actions customer must do to purchase the goods. It is divided to five parts in ladder model. It means that customer journey begins in the bottom of the ladder when each action moves visitor to the next level of the ladder. The journey begins when the visitor of e-shop visits chosen product‘s detail and ends with the purchase. The stages of the customer journey process are Product detail, Add to cart, Registration, Choice of the transport and way of payment, Purchase. Each stage has different URL address so whole process can be tracked by e-shop provider/owner but still all of them are in the same website, just in different parts. In each stage‘s transfer there is a churn of visitors who left the customer journey, see Figure 1.
The Product detail stage is a landing website page of marketing campaign, which leads visitors (potential customers) to view the product. It is consists of product information and „Add to cart“ button. The amount of visitors at this stage is initial for whole journey. Otherwise visitor choose the „Add to cart“ button he leaves the page and get out from customer journey.
After visitor hits the „Add to cart“ button he gets to another URL, the „Cart“. In this part the goods he chose become blocked to another visitors. At this part visitor can see the content of his e-cart. There are two options to continue, the first is to leave the „Cart“, the second is to continue to registration formulary and fill personal details. The choice is made by hit a „Leave“ or „Register“ button by visitor.
This stage contains form, which is necessary to fulfill to continue to the next stage and finish the purchase. There are boxes for name, address, e-mail address, day and year of birth. Either visitor fulfills all boxes or he leaves the page and get out from customer journey. This stage is situated in different URL than the stage Add to cart stage as well. If visitor is already registered in the e-shop the journey leads directly to stage Choice of the transport and payment.
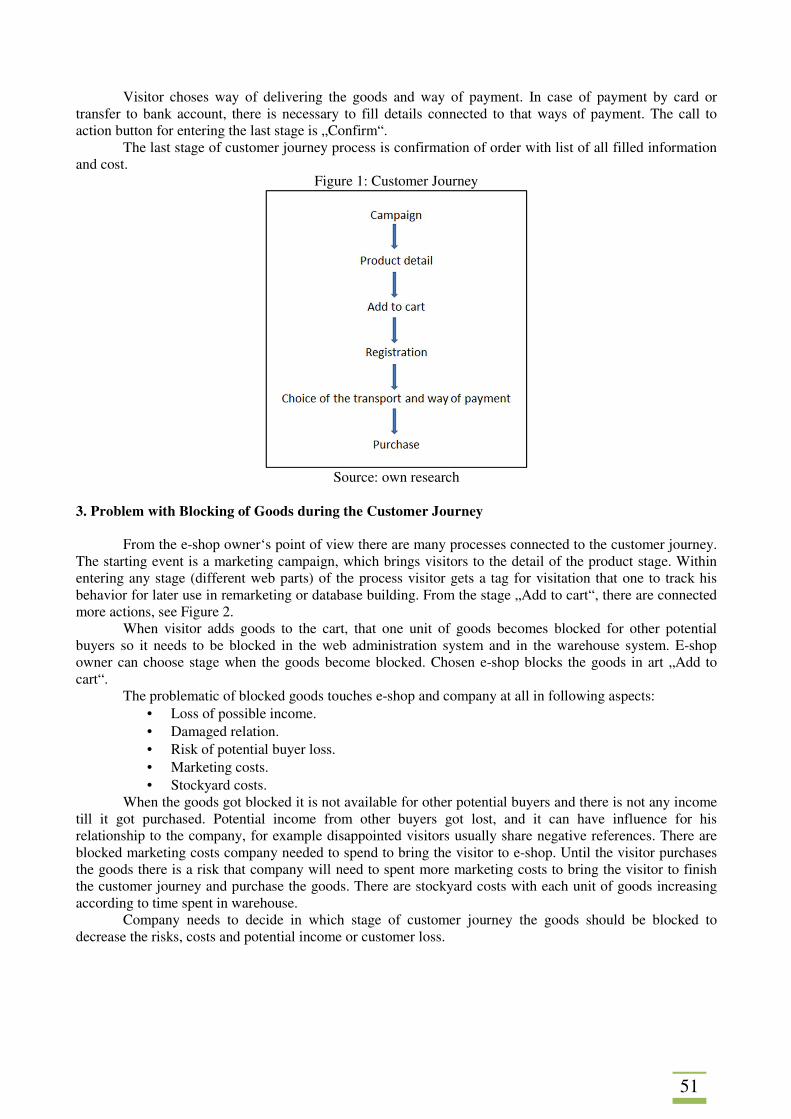
51
Visitor choses way of delivering the goods and way of payment. In case of payment by card or transfer to bank account, there is necessary to fill details connected to that ways of payment. The call to action button for entering the last stage is „Confirm“.
The last stage of customer journey process is confirmation of order with list of all filled information and cost.
Figure 1: Customer Journey
Source: own research
3. Problem with Blocking of Goods during the Customer Journey
From the e-shop owner‘s point of view there are many processes connected to the customer journey. The starting event is a marketing campaign, which brings visitors to the detail of the product stage. Within entering any stage (different web parts) of the process visitor gets a tag for visitation that one to track his behavior for later use in remarketing or database building. From the stage „Add to cart“, there are connected more actions, see Figure 2.
When visitor adds goods to the cart, that one unit of goods becomes blocked for other potential buyers so it needs to be blocked in the web administration system and in the warehouse system. E-shop owner can choose stage when the goods become blocked. Chosen e-shop blocks the goods in art „Add to cart“.
The problematic of blocked goods touches e-shop and company at all in following aspects: • Loss of possible income. • Damaged relation. • Risk of potential buyer loss. • Marketing costs. • Stockyard costs.
When the goods got blocked it is not available for other potential buyers and there is not any income till it got purchased. Potential income from other buyers got lost, and it can have influence for his relationship to the company, for example disappointed visitors usually share negative references. There are blocked marketing costs company needed to spend to bring the visitor to e-shop. Until the visitor purchases the goods there is a risk that company will need to spent more marketing costs to bring the visitor to finish the customer journey and purchase the goods. There are stockyard costs with each unit of goods increasing according to time spent in warehouse.
Company needs to decide in which stage of customer journey the goods should be blocked to decrease the risks, costs and potential income or customer loss.
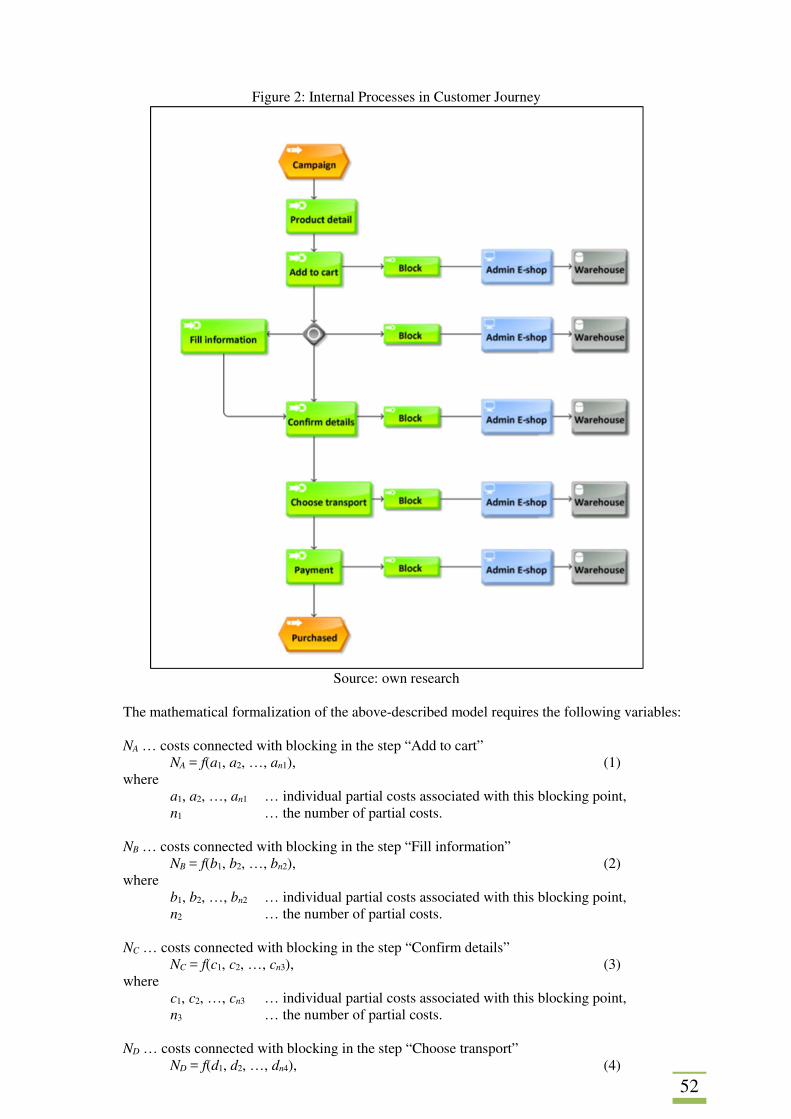
52
Figure 2: Internal Processes in Customer Journey
Source: own research
The mathematical formalization of the above-described model requires the following variables: NA … costs connected with blocking in the step “Add to cart”
NA = f(a1, a2, …, an1), (1) where
a1, a2, …, an1 … individual partial costs associated with this blocking point, n1 … the number of partial costs.
NB … costs connected with blocking in the step “Fill information”
NB = f(b1, b2, …, bn2), (2) where
b1, b2, …, bn2 … individual partial costs associated with this blocking point, n2 … the number of partial costs.
NC … costs connected with blocking in the step “Confirm details”
NC = f(c1, c2, …, cn3), (3) where
c1, c2, …, cn3 … individual partial costs associated with this blocking point, n3 … the number of partial costs.
ND … costs connected with blocking in the step “Choose transport” ND = f(d1, d2, …, dn4), (4)
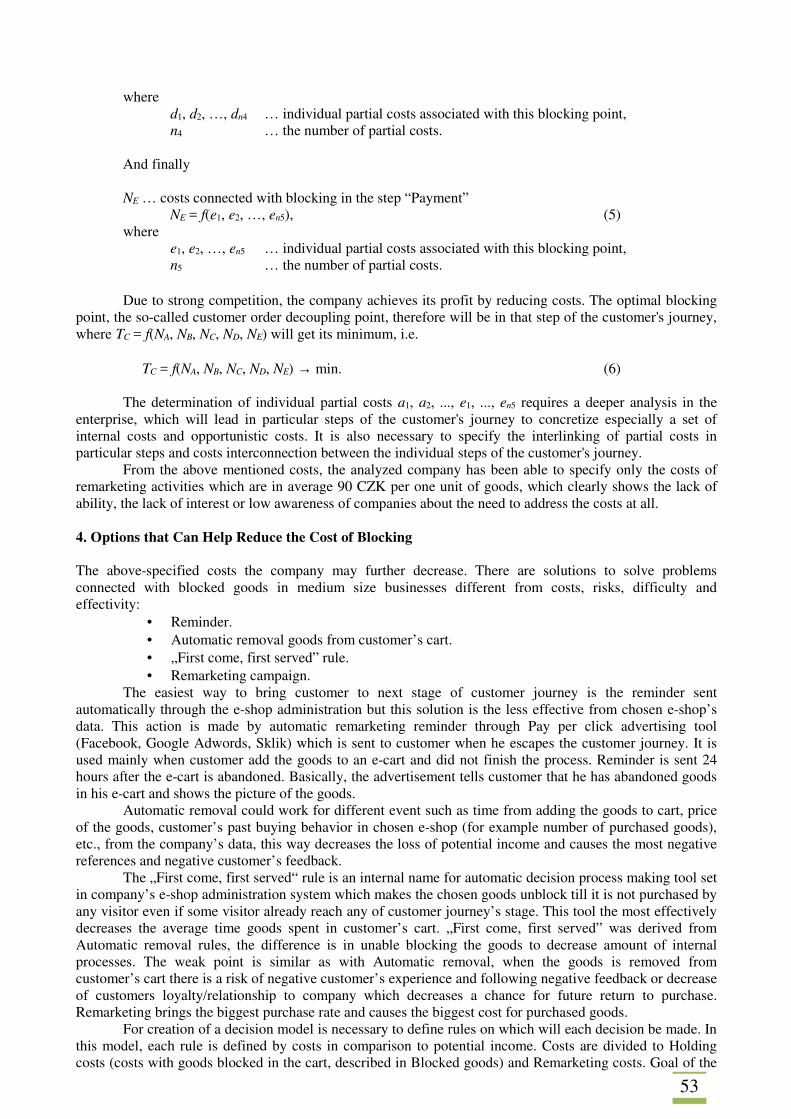
53
where d1, d2, …, dn4 … individual partial costs associated with this blocking point, n4 … the number of partial costs.
And finally NE … costs connected with blocking in the step “Payment”
NE = f(e1, e2, …, en5), (5) where
e1, e2, …, en5 … individual partial costs associated with this blocking point, n5 … the number of partial costs.
Due to strong competition, the company achieves its profit by reducing costs. The optimal blocking
point, the so-called customer order decoupling point, therefore will be in that step of the customer's journey, where TC = f(NA, NB, NC, ND, NE) will get its minimum, i.e.
TC = f(NA, NB, NC, ND, NE) → min. (6)
The determination of individual partial costs a1, a2, ..., e1, ..., en5 requires a deeper analysis in the enterprise, which will lead in particular steps of the customer's journey to concretize especially a set of internal costs and opportunistic costs. It is also necessary to specify the interlinking of partial costs in particular steps and costs interconnection between the individual steps of the customer's journey.
From the above mentioned costs, the analyzed company has been able to specify only the costs of remarketing activities which are in average 90 CZK per one unit of goods, which clearly shows the lack of ability, the lack of interest or low awareness of companies about the need to address the costs at all.
4. Options that Can Help Reduce the Cost of Blocking The above-specified costs the company may further decrease. There are solutions to solve problems connected with blocked goods in medium size businesses different from costs, risks, difficulty and effectivity:
• Reminder. • Automatic removal goods from customer’s cart. • „First come, first served” rule. • Remarketing campaign.
The easiest way to bring customer to next stage of customer journey is the reminder sent automatically through the e-shop administration but this solution is the less effective from chosen e-shop’s data. This action is made by automatic remarketing reminder through Pay per click advertising tool (Facebook, Google Adwords, Sklik) which is sent to customer when he escapes the customer journey. It is used mainly when customer add the goods to an e-cart and did not finish the process. Reminder is sent 24 hours after the e-cart is abandoned. Basically, the advertisement tells customer that he has abandoned goods in his e-cart and shows the picture of the goods.
Automatic removal could work for different event such as time from adding the goods to cart, price of the goods, customer’s past buying behavior in chosen e-shop (for example number of purchased goods), etc., from the company’s data, this way decreases the loss of potential income and causes the most negative references and negative customer’s feedback.
The „First come, first served“ rule is an internal name for automatic decision process making tool set in company’s e-shop administration system which makes the chosen goods unblock till it is not purchased by any visitor even if some visitor already reach any of customer journey’s stage. This tool the most effectively decreases the average time goods spent in customer’s cart. „First come, first served” was derived from Automatic removal rules, the difference is in unable blocking the goods to decrease amount of internal processes. The weak point is similar as with Automatic removal, when the goods is removed from customer’s cart there is a risk of negative customer’s experience and following negative feedback or decrease of customers loyalty/relationship to company which decreases a chance for future return to purchase. Remarketing brings the biggest purchase rate and causes the biggest cost for purchased goods.
For creation of a decision model is necessary to define rules on which will each decision be made. In this model, each rule is defined by costs in comparison to potential income. Costs are divided to Holding costs (costs with goods blocked in the cart, described in Blocked goods) and Remarketing costs. Goal of the
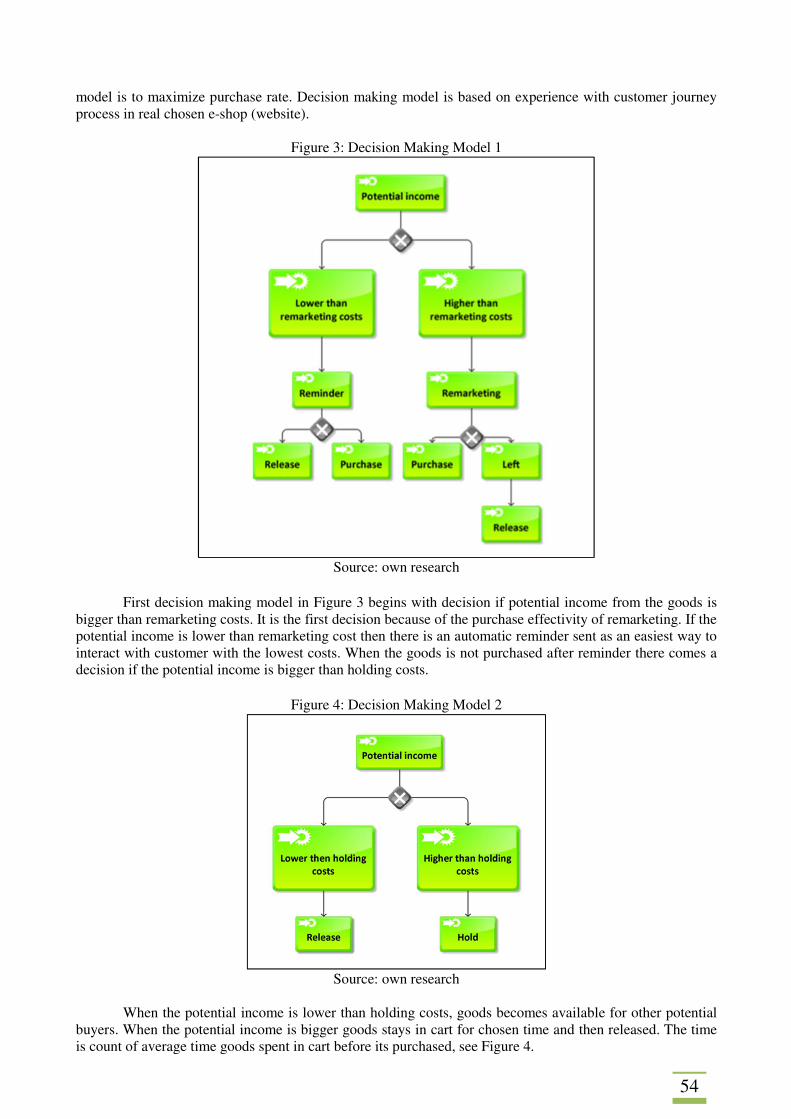
54
model is to maximize purchase rate. Decision making model is based on experience with customer journey process in real chosen e-shop (website).
Figure 3: Decision Making Model 1
Source: own research
First decision making model in Figure 3 begins with decision if potential income from the goods is
bigger than remarketing costs. It is the first decision because of the purchase effectivity of remarketing. If the potential income is lower than remarketing cost then there is an automatic reminder sent as an easiest way to interact with customer with the lowest costs. When the goods is not purchased after reminder there comes a decision if the potential income is bigger than holding costs.
Figure 4: Decision Making Model 2
Source: own research
When the potential income is lower than holding costs, goods becomes available for other potential
buyers. When the potential income is bigger goods stays in cart for chosen time and then released. The time is count of average time goods spent in cart before its purchased, see Figure 4.
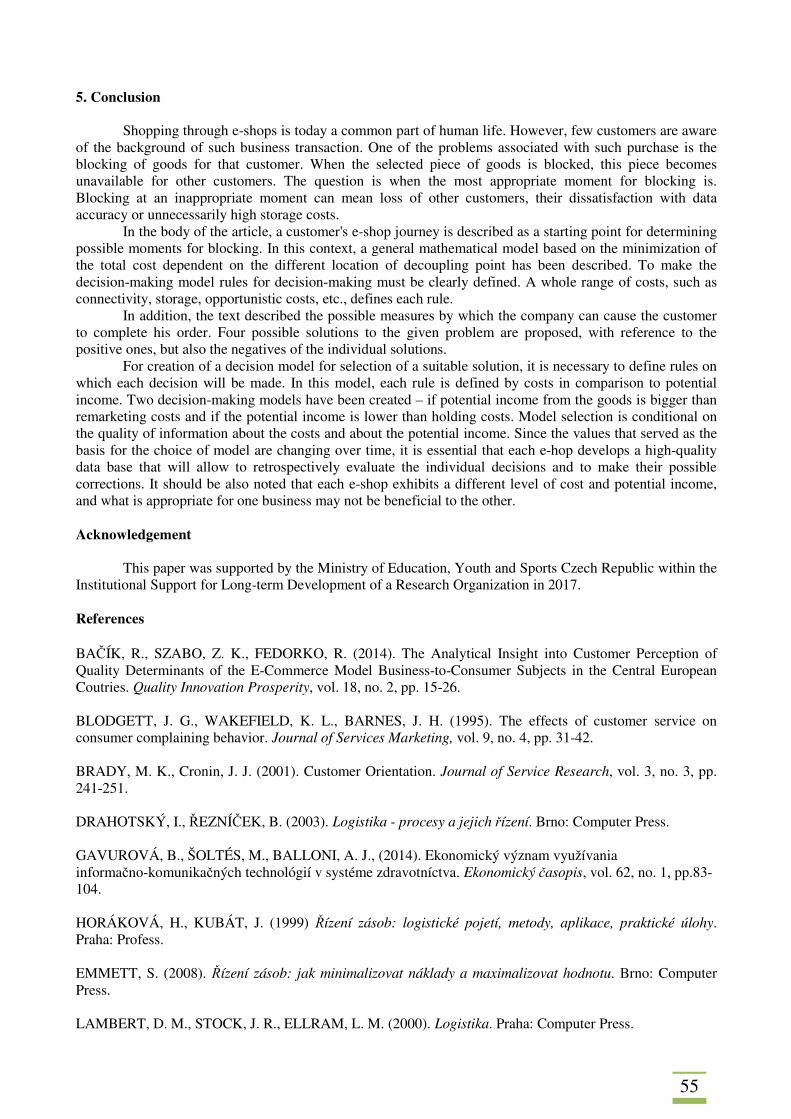
55
5. Conclusion
Shopping through e-shops is today a common part of human life. However, few customers are aware of the background of such business transaction. One of the problems associated with such purchase is the blocking of goods for that customer. When the selected piece of goods is blocked, this piece becomes unavailable for other customers. The question is when the most appropriate moment for blocking is. Blocking at an inappropriate moment can mean loss of other customers, their dissatisfaction with data accuracy or unnecessarily high storage costs.
In the body of the article, a customer's e-shop journey is described as a starting point for determining possible moments for blocking. In this context, a general mathematical model based on the minimization of the total cost dependent on the different location of decoupling point has been described. To make the decision-making model rules for decision-making must be clearly defined. A whole range of costs, such as connectivity, storage, opportunistic costs, etc., defines each rule.
In addition, the text described the possible measures by which the company can cause the customer to complete his order. Four possible solutions to the given problem are proposed, with reference to the positive ones, but also the negatives of the individual solutions.
For creation of a decision model for selection of a suitable solution, it is necessary to define rules on which each decision will be made. In this model, each rule is defined by costs in comparison to potential income. Two decision-making models have been created – if potential income from the goods is bigger than remarketing costs and if the potential income is lower than holding costs. Model selection is conditional on the quality of information about the costs and about the potential income. Since the values that served as the basis for the choice of model are changing over time, it is essential that each e-hop develops a high-quality data base that will allow to retrospectively evaluate the individual decisions and to make their possible corrections. It should be also noted that each e-shop exhibits a different level of cost and potential income, and what is appropriate for one business may not be beneficial to the other.
Acknowledgement
This paper was supported by the Ministry of Education, Youth and Sports Czech Republic within the Institutional Support for Long-term Development of a Research Organization in 2017. References BAČÍK, R., SZABO, Z. K., FEDORKO, R. (2014). The Analytical Insight into Customer Perception of Quality Determinants of the E-Commerce Model Business-to-Consumer Subjects in the Central European Coutries. Quality Innovation Prosperity, vol. 18, no. 2, pp. 15-26. BLODGETT, J. G., WAKEFIELD, K. L., BARNES, J. H. (1995). The effects of customer service on consumer complaining behavior. Journal of Services Marketing, vol. 9, no. 4, pp. 31-42. BRADY, M. K., Cronin, J. J. (2001). Customer Orientation. Journal of Service Research, vol. 3, no. 3, pp. 241-251. DRAHOTSKÝ, I., ŘEZNÍČEK, B. (2003). Logistika - procesy a jejich řízení. Brno: Computer Press. GAVUROVÁ, B., ŠOLTÉS, M., BALLONI, A. J., (2014). Ekonomický význam využívania informačno-komunikačných technológií v systéme zdravotníctva. Ekonomický časopis, vol. 62, no. 1, pp.83-104. HORÁKOVÁ, H., KUBÁT, J. (1999) Řízení zásob: logistické pojetí, metody, aplikace, praktické úlohy. Praha: Profess. EMMETT, S. (2008). Řízení zásob: jak minimalizovat náklady a maximalizovat hodnotu. Brno: Computer Press. LAMBERT, D. M., STOCK, J. R., ELLRAM, L. M. (2000). Logistika. Praha: Computer Press.

56
LEUSCHNER, R., LAMBERT, D. M., KNEMEYER, A. M. (2012). Logistics performance, customer satisfaction, and share of business: a comparison of primary and secondary suppliers. Journal of Business Logistics, vol. 33, no. 3, pp. 210-226. LUKOSZOVÁ, X., 2004. Nákup a jeho řízení. Brno: Computer Press. MÜLLER, M (2011). Essentials of inventory management. 2nd edition. New York: American Management Association. PERNER, P., FISS, G. (2002). Intelligent E-marketing with Web Mining, Personalization, and User-Adapted Interfaces. In PERNER, P. (ed.) Advances in Data Mining, Applications in E-Commerce, Medicine, and Knowledge Management. Springer International Publishing AG, pp. 37 -52. PERNICA, P. (2005). Logistika (supply chain management) pro 21. století. Praha: Radix. SARUC, N. T., DORČÁK, P. and F. POLLÁK, 2013. E-business and its Application in Conditions of Central European Market. Quality Innovation Prosperity, vol. 17, no. 1, pp. 9-15. SIXTA, J. and V. MAČÁT, 2005. Logistika: teorie a praxe. Brno: Computer Press. UŽÍK, M., ŠOLTÉS, V. (2009). The Effect of Rating Changes on the Value of a Company Listed in the Capital Market. E + M Ekonomie a management, vol. 12, no. 1, pp. 49-55.
57
BPMS OPEN SOURCE TOOLS AND BASIC APPROACH FOR ITS COMPARISON Radim Dolák, Josef Botlík Silesian University in Opava School of Business Administration in Karvina Department of Informatics and Mathematics Univerzitni namesti 1934/3 Karvina, 733 40 Czech Republic e-mail: [email protected], [email protected] Abstract Business Process Management (BPM) is an integrated approach which is used for improving corporate performance managing and optimizing of the most important business processes. BPM covers the full lifecycle of business processes such as identification, modeling, monitoring, and automation. This complex life cycle of business processes is supported by Business Process Management Suites (BPMS). Due to the availability of BPMS is much easier for managers to design, analyze, build, modify and discuss business processes. The main purpose of this paper is to describe advantages, current trends and segmentation of BPMS, introduce the most known BPMS open source tools and provide its basic comparison based on four categories such as technical specification, use in practice/quality, installation, and support. Keywords: BPM, BPMS, iBPMS, open source JEL codes: L22, M1, O3 1. Introduction
Business process management is a modern approach with emphasis on improvement of the productivity and efficiency of business processes. Business process management (BPM) can be defined according to Gartner (Gartner BPM, 2016) as a discipline that uses various methods to discover, model, analyze, measure, improve, and optimize business processes. A business process coordinates the behavior of people, systems, information, and things to produce business outcomes in support of a business strategy. BPM philosophy can be simply defined as a business optimization process. BPM enables organizations to be more efficient, more effective and more capable of change. The main task of business process managers is to apply strategies and tactics for improving the most important business processes. Managers often use special tools for modeling, monitoring, measuring and improving business processes. These special tools are generally called as Business process management systems (BPMS).
BPM tools are used according to Appian (Appian, 2016) for automating, measuring and optimizing business processes. BPM tools use workflow and collaboration to provide meaningful metrics to business leaders. BPM suites allow users to model and execute different business processes and flows such as information flows, resources flows etc. BPM suites include necessary tools for working with information processes, human resources, enterprise applications, business rules, collaboration inside (teamwork) and outside of the company (outsourcing, supply chains).
The main purpose of this paper is to describe advantages, current trends and segmentation of BPMS, introduce the most known BPMS open source tools and provide its basic comparison based on four categories such as technical specification, use in practice/quality, installation, and support.
2. Related Work
Related work can be divided into comparing and evaluations of Business Process Management Suites and describing of Business Process Management Suites architecture and features.
There are several approaches for comparison Business Process Management Suite. There is a little bit complicated terminology about solutions which are used for implementing business process management concept in organizations. A software suite which enables to implement business process management solutions is called Business Process Management Suite (BPMS). There is also according to a Gartner concept of the next generation of BPMS which is called as Intelligent BPMS (iBPMS). The term has been defined by Garter in their brochure “Magic Quadrant for iBPMS 2012”. These iBPMS are BPM suites which include intelligent features such as adaptive analytics, mobility, social collaboration and cloud deployment.
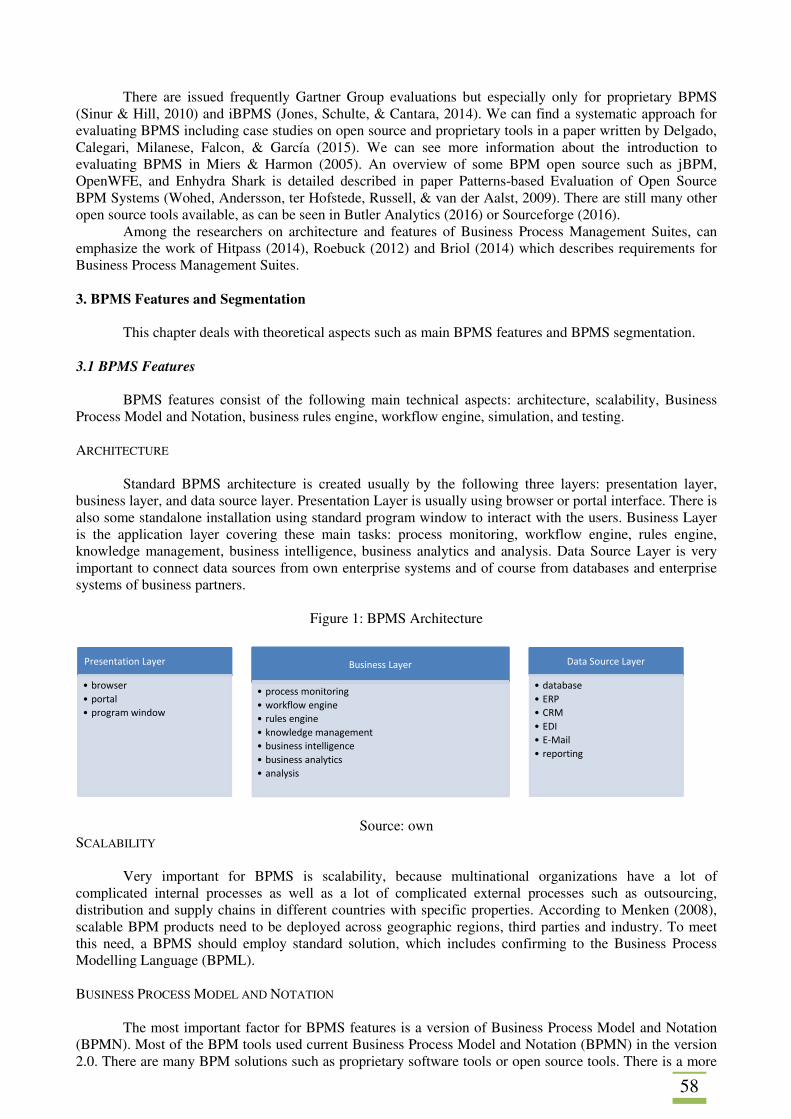
58
There are issued frequently Gartner Group evaluations but especially only for proprietary BPMS (Sinur & Hill, 2010) and iBPMS (Jones, Schulte, & Cantara, 2014). We can find a systematic approach for evaluating BPMS including case studies on open source and proprietary tools in a paper written by Delgado, Calegari, Milanese, Falcon, & García (2015). We can see more information about the introduction to evaluating BPMS in Miers & Harmon (2005). An overview of some BPM open source such as jBPM, OpenWFE, and Enhydra Shark is detailed described in paper Patterns-based Evaluation of Open Source BPM Systems (Wohed, Andersson, ter Hofstede, Russell, & van der Aalst, 2009). There are still many other open source tools available, as can be seen in Butler Analytics (2016) or Sourceforge (2016).
Among the researchers on architecture and features of Business Process Management Suites, can emphasize the work of Hitpass (2014), Roebuck (2012) and Briol (2014) which describes requirements for Business Process Management Suites.
3. BPMS Features and Segmentation
This chapter deals with theoretical aspects such as main BPMS features and BPMS segmentation.
3.1 BPMS Features
BPMS features consist of the following main technical aspects: architecture, scalability, Business Process Model and Notation, business rules engine, workflow engine, simulation, and testing.
ARCHITECTURE
Standard BPMS architecture is created usually by the following three layers: presentation layer, business layer, and data source layer. Presentation Layer is usually using browser or portal interface. There is also some standalone installation using standard program window to interact with the users. Business Layer is the application layer covering these main tasks: process monitoring, workflow engine, rules engine, knowledge management, business intelligence, business analytics and analysis. Data Source Layer is very important to connect data sources from own enterprise systems and of course from databases and enterprise systems of business partners.
Figure 1: BPMS Architecture
Source: own
SCALABILITY
Very important for BPMS is scalability, because multinational organizations have a lot of complicated internal processes as well as a lot of complicated external processes such as outsourcing, distribution and supply chains in different countries with specific properties. According to Menken (2008), scalable BPM products need to be deployed across geographic regions, third parties and industry. To meet this need, a BPMS should employ standard solution, which includes confirming to the Business Process Modelling Language (BPML).
BUSINESS PROCESS MODEL AND NOTATION
The most important factor for BPMS features is a version of Business Process Model and Notation (BPMN). Most of the BPM tools used current Business Process Model and Notation (BPMN) in the version 2.0. There are many BPM solutions such as proprietary software tools or open source tools. There is a more
Presentation Layer
• browser
• portal
• program window
Business Layer
• process monitoring
• workflow engine
• rules engine
• knowledge management
• business intelligence
• business analytics
• analysis
Data Source Layer
• database
• ERP
• CRM
• EDI
• reporting
59
important aspect that licensing of BPMS, segmentation by use and support. According to Hammer (2014) is contemporary BPMS principally used for two groups of purposes:
• to create descriptions of processes, which can be used to support process analysis, simulation, and design efforts,
• to generate executable code that supports the performance of a process, by automating certain process steps, integrating systems and databases used by the process and managing the workflow of documents and other forms passing through the process.
BUSINESS RULES ENGINE
A business rules engine can be described as a software component that allows managing business logic in a business process management system. Business logic is used in BPMS for describing the sequence of operations which are connected with data manipulation using defined rules. Standard business rule system enables to define specific company policies contains the possibility of defining, testing and executing own rules.
WORKFLOW ENGINE
A workflow engine is a basic software application for managing business processes. It is used for monitoring, verification, determining and executing of different types of flows such as the flow of information, tasks or events.
SIMULATION AND TESTING
Almost of BMPS tools have process simulation capabilities to validate the business process designs. In order for a simulation to be executed (Chang, 2006), the business process model needs to be enhanced with attributes for the probability distribution, resource availabilities, queues, and event generators. With these attributes, the simulation engine can generate events and compute how the business process will be performed according to the attributes assigned to the business process model.
We can define a lot of benefits of Business Process Simulation such as saving costs, optimization, and support for making a decision in choice of future improvements variants.
3.2 BPMS Segmentation
BPMS tools provide infrastructure to support an enterprise implementing a BPM discipline in many processes such as lifecycle process including for example modeling, simulating, building, monitoring, analyzing and optimizing; all process types including for example collaboration, integration or making a decision; business process including business process analysis, business managing. According to Hitpass (2014), the BPM tool market can be segmented as follows:
• tools that support the analysis processes and Corporate Governance (Governance BPM) called BPA platforms (Business Process Analysis) or EA (Enterprise Architecture Tools) as well,
• tools that support the technical implementation or process automation called BPMS, • tools that support the business rules administration and execution, independently of the
systems they use, called Rules Engines or BRMS (Business Rules Management Systems), • tools that together with processes enable to implement the management control indicators in
real time, called BAM (Business Activity Monitoring), • tools that enable the services orchestration between BPMS and type of system, mainly those
from the back office, called SOA Suite, • tools to analyze historical data from processes implemented to detect deviations from the
desired or discover new patterns. These analytical environments are called Process Mining Tools
4. BPMS Open Source Software
We can find BPMS open source software at famous website Sourceforge (2016) in a category called
Business & Enterprise/Enterprise/Business Process Management or at Open source guide website (2016). There are a basic introduction and description of BPMS open source software in the next subsections of this
60
paper. The most downloaded and discussed tools from this category were selected. List of open source software which is described in this paper is following: Bonita BPM, jBPM, Activity, Imixs-Workflow, Camunda BPM, Orchestra, and Stardust.
4.1 List of BPMS Open Source Software BONITA BPM
Bonita BPM is one of the most widespread business process management open source suite in the world. Bonita BPM is using an ultra-scalable Java engine. Bhat (2013) describes Bonita BPM as an open source BPM and workflow suite that is suited for creating high-tech workflows. It can be used for complex workflows, such as Supply Chain Management, Human Resources, Contract Management, and e-Government.
Bonita BPM includes tools for graphically designing process diagrams, a special portal for end-user interaction and also web forms for business application development. Bonita BPM (Sourceforge – Bonita, 2016) is the only open-source product that meets Gartner's definition of a BPMS. The main features are the following:
• Bonita BPM Studio - Graphical BPMN 2.0 Workflow Designer • Bonita BPM Portal - End User Interface for Interacting with Processes Apps • Bonita BPM Engine - Scalable Java Execution • Web Forms Designer • Multiple API and Connection Points
JBPM
jBPM is a business process management system with light-weight, embeddable engine which can execute native BPMN2 like others modern BPMS open source tools. This solution offers also eclipse-based and web-based tools for developers and business users which are used for creating, monitoring and managing business processes (Sourceforge – jBPM, 2016).
This solution makes the bridge between business analysts, developers and end users, by offering process management features and tools in a way that both business users and developers like it (jBPM, 2015). There is good support for this tool such as discussion forum, literature, and manuals. It can mention from recent literature for example following books: (De Maio, Salatino, & Aliverti, 2014) and (Fiorini & Gopalakrishnan, 2015).
ACTIVITY
Activity (Activity, 2016) is a light-weight workflow and Business Process Management (BPM) Platform targeted at business people, developers, and system admins. Its core is a super-fast and rock-solid BPMN 2.0 process engine for Java. Activity runs in any Java application, on a server, on a cluster or in the cloud.
IMIXS-WORKFLOW
Imixs-Workflow (Imixs Workflow, 2016) is a workflow engine for human-centric business applications. It is based on the BPMN 2.0 Standard, so applications can be developed faster and designed more flexible. The project is based on the Java Enterprise Architecture (JEE). Key features are for example graphical process modeler, technical business models, collaborative process modeling and reporting tool.
CAMUNDA BPM
Camunda (Camunda, 2016) is an open source platform for workflow and business process management. Is it possible modeling and executing of BPMN 2.0, CMMN 1.1 and DMN 1.1. Typical examples of using Camunda BPM are following activities (Camunda BPM, 2016): straight through processing (STP), human workflow management, case management or business rule automation.
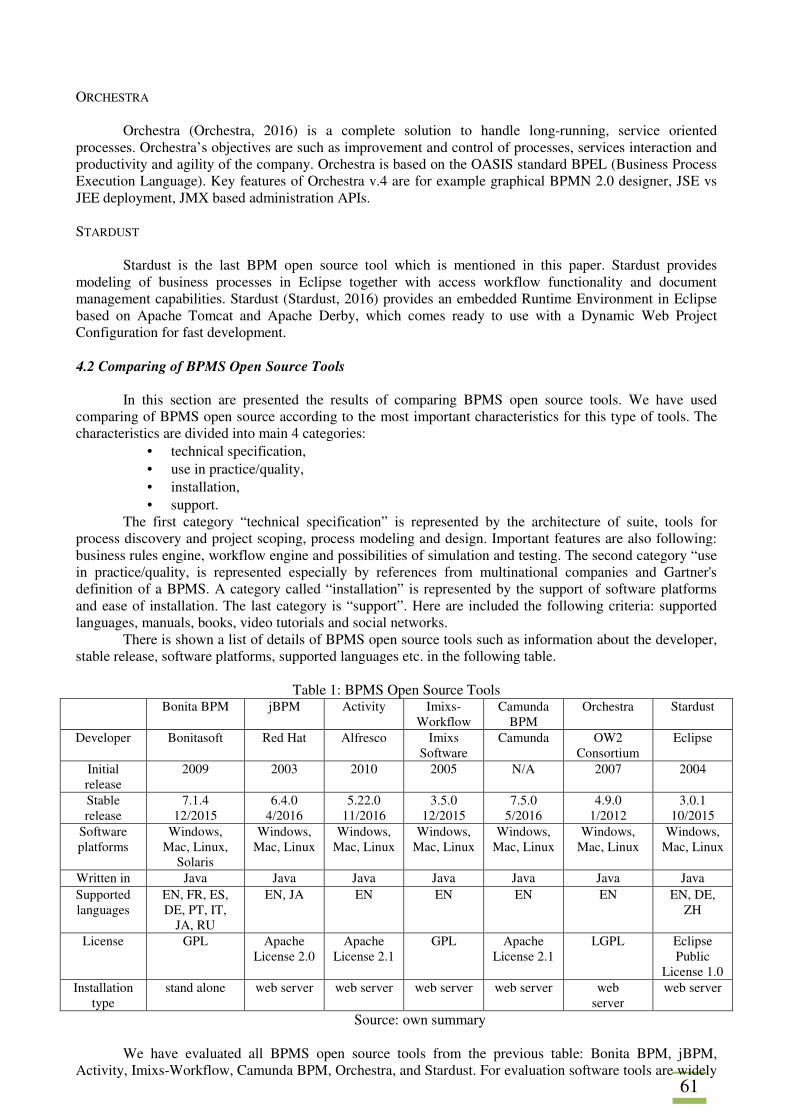
61
ORCHESTRA
Orchestra (Orchestra, 2016) is a complete solution to handle long-running, service oriented processes. Orchestra’s objectives are such as improvement and control of processes, services interaction and productivity and agility of the company. Orchestra is based on the OASIS standard BPEL (Business Process Execution Language). Key features of Orchestra v.4 are for example graphical BPMN 2.0 designer, JSE vs JEE deployment, JMX based administration APIs.
STARDUST
Stardust is the last BPM open source tool which is mentioned in this paper. Stardust provides modeling of business processes in Eclipse together with access workflow functionality and document management capabilities. Stardust (Stardust, 2016) provides an embedded Runtime Environment in Eclipse based on Apache Tomcat and Apache Derby, which comes ready to use with a Dynamic Web Project Configuration for fast development. 4.2 Comparing of BPMS Open Source Tools
In this section are presented the results of comparing BPMS open source tools. We have used comparing of BPMS open source according to the most important characteristics for this type of tools. The characteristics are divided into main 4 categories:
• technical specification, • use in practice/quality, • installation, • support.
The first category “technical specification” is represented by the architecture of suite, tools for process discovery and project scoping, process modeling and design. Important features are also following: business rules engine, workflow engine and possibilities of simulation and testing. The second category “use in practice/quality, is represented especially by references from multinational companies and Gartner's definition of a BPMS. A category called “installation” is represented by the support of software platforms and ease of installation. The last category is “support”. Here are included the following criteria: supported languages, manuals, books, video tutorials and social networks.
There is shown a list of details of BPMS open source tools such as information about the developer, stable release, software platforms, supported languages etc. in the following table.
Table 1: BPMS Open Source Tools
Bonita BPM jBPM Activity Imixs-Workflow
Camunda BPM
Orchestra Stardust
Developer Bonitasoft Red Hat Alfresco Imixs Software
Camunda OW2 Consortium
Eclipse
Initial release
2009 2003 2010 2005 N/A 2007 2004
Stable release
7.1.4 12/2015
6.4.0 4/2016
5.22.0 11/2016
3.5.0 12/2015
7.5.0 5/2016
4.9.0 1/2012
3.0.1 10/2015
Software platforms
Windows, Mac, Linux,
Solaris
Windows, Mac, Linux
Windows, Mac, Linux
Windows, Mac, Linux
Windows, Mac, Linux
Windows, Mac, Linux
Windows, Mac, Linux
Written in Java Java Java Java Java Java Java Supported languages
EN, FR, ES, DE, PT, IT,
JA, RU
EN, JA
EN
EN
EN
EN EN, DE, ZH
License GPL Apache License 2.0
Apache License 2.1
GPL Apache License 2.1
LGPL Eclipse Public
License 1.0 Installation
type stand alone web server web server web server web server web
server web server
Source: own summary We have evaluated all BPMS open source tools from the previous table: Bonita BPM, jBPM,
Activity, Imixs-Workflow, Camunda BPM, Orchestra, and Stardust. For evaluation software tools are widely
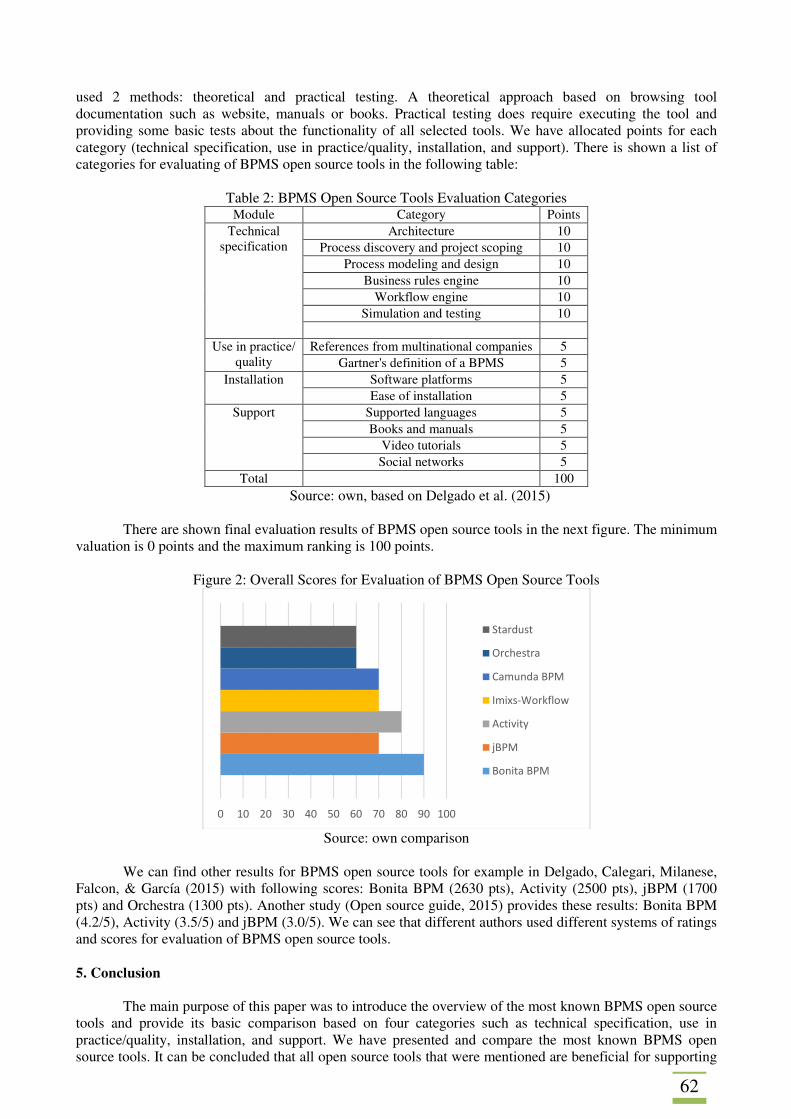
62
used 2 methods: theoretical and practical testing. A theoretical approach based on browsing tool documentation such as website, manuals or books. Practical testing does require executing the tool and providing some basic tests about the functionality of all selected tools. We have allocated points for each category (technical specification, use in practice/quality, installation, and support). There is shown a list of categories for evaluating of BPMS open source tools in the following table:
Table 2: BPMS Open Source Tools Evaluation Categories
Module Category Points Technical
specification Architecture 10
Process discovery and project scoping 10 Process modeling and design 10
Business rules engine 10 Workflow engine 10
Simulation and testing 10
Use in practice/ quality
References from multinational companies 5 Gartner's definition of a BPMS 5
Installation Software platforms 5 Ease of installation 5
Support Supported languages 5 Books and manuals 5
Video tutorials 5 Social networks 5
Total 100 Source: own, based on Delgado et al. (2015)
There are shown final evaluation results of BPMS open source tools in the next figure. The minimum
valuation is 0 points and the maximum ranking is 100 points.
Figure 2: Overall Scores for Evaluation of BPMS Open Source Tools
Source: own comparison
We can find other results for BPMS open source tools for example in Delgado, Calegari, Milanese,
Falcon, & García (2015) with following scores: Bonita BPM (2630 pts), Activity (2500 pts), jBPM (1700 pts) and Orchestra (1300 pts). Another study (Open source guide, 2015) provides these results: Bonita BPM (4.2/5), Activity (3.5/5) and jBPM (3.0/5). We can see that different authors used different systems of ratings and scores for evaluation of BPMS open source tools.
5. Conclusion
The main purpose of this paper was to introduce the overview of the most known BPMS open source tools and provide its basic comparison based on four categories such as technical specification, use in practice/quality, installation, and support. We have presented and compare the most known BPMS open source tools. It can be concluded that all open source tools that were mentioned are beneficial for supporting
0 10 20 30 40 50 60 70 80 90 100
Stardust
Orchestra
Camunda BPM
Imixs-Workflow
Activity
jBPM
Bonita BPM
63
BPM. The best in the evaluation was Bonita BPM with 90 points, following by Activity with 80 points. The worst was Stardust and Orchestra with score 60 points for both. The use and improving BPMS open source software brings new opportunities for both open source developers and the user community. These tools should bring profit also for small and middle companies because they can use modern BPMS tools with relative very low cost. There are usually zero cost licenses but the most important factor is the training of effective work with these tools. Some open source solutions such as Bonita BPM, jBPM, Imixs-Workflow, Stardust etc. are constantly improving for more than 6 years and brings to thousands of users opportunities in different phases of the BPM lifecycle. Acknowledgement
The work was supported by SGS/19/2016 project called “Advanced mining methods and simulation techniques in business process domain”. References ACTIVITY. (2016). Activiti BPM Platform. [online]. Available from: http://www.activiti.org/ APPIAN. (2016). About BPM Tools. [online]. Available from: http://www.appian.com/about-bpm BHAT, R. (2013). Bonita Open Solution 5.x Essentials. Birmingham: Packt Publishing Ltd. BRIOL, P. (2014). Business Process Automation with BPMS. Lulu.com. BUTLER ANALYTICS. (2016). 10+ Free Open Source BPM Platforms. [online]. Available from: http://www.butleranalytics.com/10-free-open-source-bpm-platforms/ CAMUNDA. (2016). BPMN Workflow Engine. [online]. Available from: https://camunda.org/ CAMUNDA BPM. (2016). Camunda BPM platform – Overview. [online]. Available from: http://camunda.com/bpm/features/ CHANG, J.F. (2016). Business Process Management Systems: Strategy and Implementation. Boca Raton: Auerbach Publications. DELGADO, A., CALEGARI, D., MILANESE, P., FALCON, R., GARCÍA, E. (2015). A systematic Approach for Evaluating BPM Systems: Case Studies on Open Source and Proprietary Tools. In DAMIANI, E., FRATI, F., RIEHLE, D., WASSERMAN, A. I. (Ed.), Open Source Systems: Adoption and Impact. Berlin Heidelberg: Springer-Verlag, pp. 81-90. FIORINI, S., GOPALAKRISHNAN, A. V. (2015). Mastering jBPM6: Design, build, and deploy business process-centric applications using the cutting-edge jBPM technology stack. Birmingham: Packt Publishing Ltd. GARTNER BPM. (2016). Business process management (BPM). [online]. Available from: http://blogs.gartner.com/it-glossary/business-process-management-bpm/ HAMMER, M. (2014). What is Business Process Management? Handbook on Business Process Management 1: Introduction, Methods, and Information Systems. In: VOM BROCKE, J., ROSEMANN, M. (Ed.), International Handbooks on Information System. Berlin Heidelberg: Springer-Verlag, pp 3-16. HITPASS, B. (2014). Business Process Management (BPM): Concepts, and How to Apply and Integrate it with IT. Santiago de Chile: BHH Ltda. IMIXS WORKFLOW. (2016). Imixs Workflow Project - Open Source Java Workflow Engine for BPMN 2.0. [online]. Available from: http://www.imixs.org/
64
JBPM. (2016). jBPM - Open Source Business Process Management - Process engine. [online]. Available from: http://www.jbpm.org/ JONES, T., SCHULTE, R. W., CANTARA, M. (2014). Magic Quadrant for Intelligent Business Process Management Suites. Gartner Inc. OPEN SOURCE GUIDE. (2016). BPM / Workflow / Open Source Guide. [online]. Available from: http://www.open-source-guide.com/en/Solutions/Development-and-intermediate-layers/Bpm-workflow ORCHESTRA. (2016). Orchestra: Open Source BPEL/BPM Solution - Orchestra: The Open Source BPEL solution. [online]. Available from: http://orchestra.ow2.org/xwiki/bin/view/Main/WebHome ROEBUCK, K. (2012). BPM System or Suite (BPMS): High-impact Strategies - What You Need to Know: Definitions, Adoptions, Impact, Benefits, Maturity, Vendors. London: Emereo Publishing. DE MAIO, M. N., SALATINO, M., ALIVERTI, E. (2014). jBPM6 Developer Guide. Birmingham: Packt Publishing Ltd. MENKEN, I. (2008). BPM Business Process Management Best Practices Design, Streamline and Manage Guide - Lead with business processes that coordinate People, Applications and Services. London: Emereo Publishing. MIERS, D., HARMON, P. (2005). Introduction to Evaluating BPMS Suites. BPTrends Associates. SINUR, J., HILL, J. (2010). Magic Quadrant for Business Process Management Suites. Gartner Inc. SOFTWARE FOR ENTERPRISE. (2016). 55+ List of top open source BPM / workflow solution. [online]. Available from: http://www.softwareforenterprise.us/list-of-top-open-source-bpm-workflow-solution/ SOURCEFORGE. (2016). SourceForge - Download, Develop and Publish Free Open Source Software. [online]. Available from: http://sourceforge.net/ SOURCEFORGE – BONITA. (2016). Bonita BPM / SourceForge.net. [online]. Available from: http://sourceforge.net/projects/bonita/ SOURCEFORGE – JBPM. (2016). jBPM / SourceForge.net. [online]. Available from: http://sourceforge.net/projects/jbpm SOURCEFORGE - IMIXS WORKFLOW. (2016). Imixs Workflow / SourceForge.net. [online]. Available from: http://sourceforge.net/projects/imixs-ix/ STARDUST. (2016). Stardust Home. [online]. Available from: https://www.eclipse.org/stardust WOHED, P., ANDERSSON, B., TER HOFSTEDE, A. H. M., RUSSELL, N., VAN DER AALST, W. P. M. (2009). Patterns-based Evaluation of Open Source BPM Systems: The Cases of jBPM, OpenWFE, and Enhydra Shark. Information and Software Technology, vol. 51, no. 8, pp. 1187-1216.
65
ELEMENTS OF ONLINE ADVERTISING INFLUENCING CONSUMER BEHAVIOR: THEORETICAL INSIGHTS Viktorija Grigaliūnaitė, Lina Pilelienė Vytautas Magnus University Faculty of Economics and Management, Marketing Department S. Daukanto Kaunas, LT-44299 Lithuania e-mail: [email protected] Abstract
The research systematically reviews the literature, aiming to provide a holistic approach to elements of online advertising that influence consumer behavior. The analysis and synthesis of scientific literature as well as eye tracking experiment are applied for the analysis. As a result, the theoretical model of advertising elements that influence consumer behavior is elaborated. Moreover, as the position of the advertisement is considered as context-related element influencing consumer behavior, most attention-grabbing position of the advertisement in the context of the internet is presented. Consequently, this research makes a major contribution to research on online advertising effectiveness by demonstrating the main elements that influence consumer response and serves as a basis for holistic empirical research of online advertising effectiveness. Keywords: advertising elements, consumer behavior, eye tracking, online advertising JEL codes: M31, M37 1. Introduction
In information society internet is a key instrument for creation, distribution, and manipulation of information. Accordingly, internet has emerged as powerful channel for marketing communication leading to the concept of online advertising becoming central to the entire discipline of marketing. As online advertising challenges the dominance of traditional advertising media (e.g., newspapers, television) (Belanche et al., 2017), a considerable literature has grown up around the theme of its effectiveness and debate continues about the best online advertising strategies. Estrada-Jiménez et al. (2017) consider online advertising as the pillar of the “free” content on the Web, stating that it has revolutionized the marketing business in recent years by creating a myriad of new opportunities for advertisers to reach potential customers. Moreover, according to Kireyev et al. (2016), firms increasingly rely on online media to acquire consumers. Therefore, to avoid the common mistakes the research is needed to determine and substantiate online advertising usage patterns.
To date, there are many studies that have investigated the influence of the context of internet on the online advertising effectiveness. Such approaches, however, have failed to address no context-dependent advertising message-related factors. By taking systems approach, the assumption could be made that all of the online advertising elements, that are message-related as well as context-related factors can have impact on online advertising effectiveness by influencing consumer behavior. Achieving to contribute to scientific discussion on advertising effectiveness, the research aims to provide a holistic approach to elements of online advertising that influence consumer behavior by analyzing context-related element – position of the advertisement. The study integrates results from previous researches, emphasizing the differences of contextual impact on consumer reactions to message-related factors. Based on the theoretical analysis, eye tracking experiment is presented in order to substantiate the influence of the context-related elements on consumer behavior.
Achieving to provide a substantial theoretical background for further studies on online advertising effectiveness and antecedents, theoretical analysis and synthesis are provided. Moreover, comparative analysis of previous researches is performed to substantiate the different impact of advertising contexts on the performance of message-related factors.
In order to reach the aim of the research, the article is organized as follows. Theoretical substantiation of the model is provided in Chapter 2: achieving to provide a substantial theoretical background, previous research on advertising structure, its elements and parts affecting the effectiveness is analyzed. Based on the analysis and synthesis of scientific literature, online advertising element lacking theoretical substantiation regarding its effectiveness is revealed and methodology for the research of latter
66
element is provided in Chapter 3. Research results are explained and the model of online advertising elements that influence consumer behavior is elaborated in Chapter 4. Finally, conclusions are provided in Chapter 5.
2. Theoretical Substantiation
The evolution of electronic media and the increasing role of online advertising within marketing strategies have created space for both researchers and practitioners to explore new areas (Jankowski et al., 2016). According to Estrada-Jiménez et al. (2017), the advent of the Internet and the Web has created a myriad of new opportunities for advertisers to target billions of people almost effortlessly.
Communication effectiveness depends on the goals of the campaign and the specific advertisement (Belanche et al., 2017). According to McGuire (1976) the consumer information-processing starts with exposure which causes attention, perception and only then it come to comprehension, leading to purchase. Therefore, in a framework of any communicational goal, it can be stated that the effectiveness of advertising highly depends on factors that attract consumers’ attention, elicit advertising recall and recognition. According to Tackx et al. (2017), the traditional view to advertising goes as follows: a company takes an action (creates and releases advertising) that has an impact on the customer (changes the perception of needs and/or expectation), such that he or she takes a subsequent action (purchases an advertised object) that modifies the firm’s position in the market. However, analyzing advertising interactivity, Jankowski et al. (2016) come to conclude that online advertising differs from traditional in its outcomes, e.g. the focus placed on maximizing user engagement in online advertising negatively affects the user experience because of advertising clutter and increasing intrusiveness. Therefore, the specific features and influences of this marketing tool demand further consideration (Belanche et al., 2017).
Many factors influencing attention to advertising and its effectiveness have been analyzed in scientific literature. The most basic categorization of those factors might be their division into external and internal. External factors are context-specific factors depending on advertising media, e.g. television, outdoor, etc. the other category – internal factors are further classified into personal factors (laying a background for consumer segmentation) and advertising message-related factors (Walliser, 1997; Franch et al., 2013). Whereas external context-related factors are harder to control, the advertising message-related factors are the ones that marketers can gain advantage from. Therefore, advertising message-related factors are gaining their attention in scientific research (Pieters et al., 2002; Pieters and Wedel, 2004; Boerman et al., 2011).
Previous research on advertising effectiveness (see Pilelienė et al., 2015) enabled the determination of advertising message-related factors that have to be considered achieving to gain better effectiveness:
• different advertising layouts; • visual and textual elements; • advertising complexity level; • advertising source.
In a context of static advertising, all its components can be classified into visual and textual. Both groups mixed together compose advertising layout (see Figure 1). Moreover, the composition of the elements (i.e. visual and textual) in a layout determines the level of its complexity.
Previous research (see Grigaliūnaitė et al., 2016) led to the conclusion that scientific research regarding the influence of message-related factors on the effectiveness of advertising is scarce; the most discussed message-related factors were found to be the headline, dominating elements, and the number of elements. Therefore, the eye-tracking procedure was performed and compositions of message-related factors influencing the effectiveness of advertising were determined:
• headline larger than the body text, • a large number of elements with dominating textual elements, and • the emphasised brand.
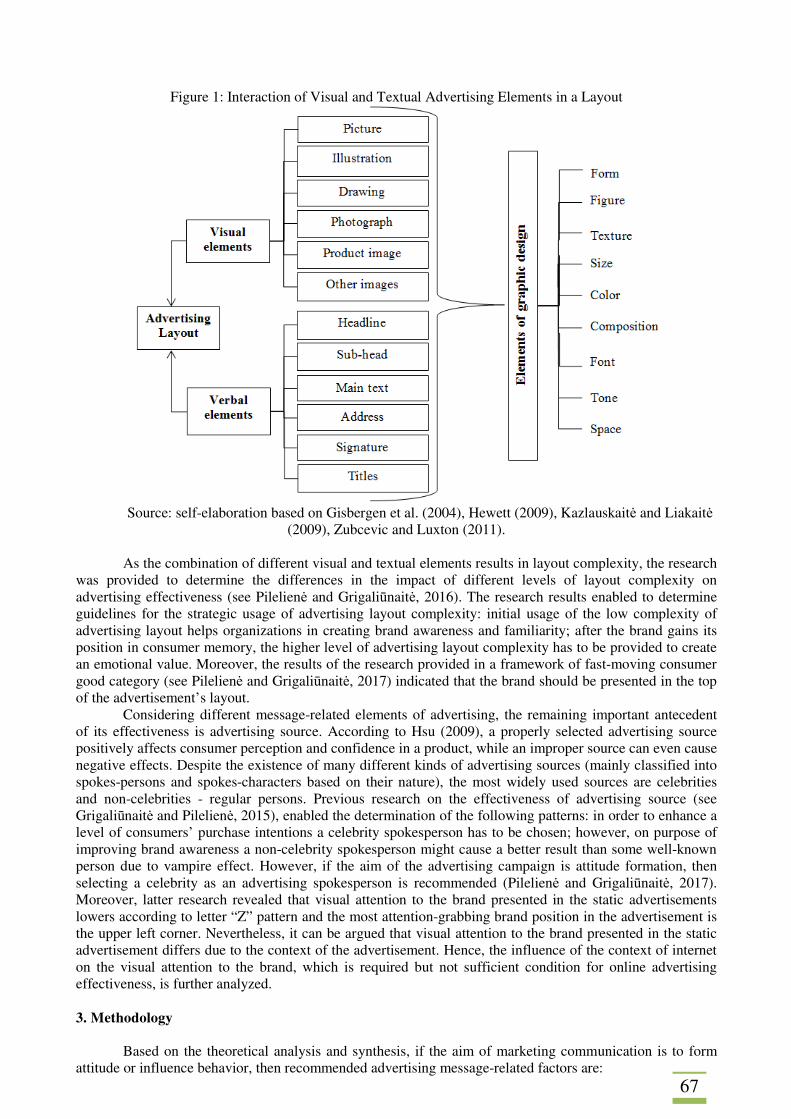
67
Figure 1: Interaction of Visual and Textual Advertising Elements in a Layout
Source: self-elaboration based on Gisbergen et al. (2004), Hewett (2009), Kazlauskaitė and Liakaitė
(2009), Zubcevic and Luxton (2011). As the combination of different visual and textual elements results in layout complexity, the research
was provided to determine the differences in the impact of different levels of layout complexity on advertising effectiveness (see Pilelienė and Grigaliūnaitė, 2016). The research results enabled to determine guidelines for the strategic usage of advertising layout complexity: initial usage of the low complexity of advertising layout helps organizations in creating brand awareness and familiarity; after the brand gains its position in consumer memory, the higher level of advertising layout complexity has to be provided to create an emotional value. Moreover, the results of the research provided in a framework of fast-moving consumer good category (see Pilelienė and Grigaliūnaitė, 2017) indicated that the brand should be presented in the top of the advertisement’s layout.
Considering different message-related elements of advertising, the remaining important antecedent of its effectiveness is advertising source. According to Hsu (2009), a properly selected advertising source positively affects consumer perception and confidence in a product, while an improper source can even cause negative effects. Despite the existence of many different kinds of advertising sources (mainly classified into spokes-persons and spokes-characters based on their nature), the most widely used sources are celebrities and non-celebrities - regular persons. Previous research on the effectiveness of advertising source (see Grigaliūnaitė and Pilelienė, 2015), enabled the determination of the following patterns: in order to enhance a level of consumers’ purchase intentions a celebrity spokesperson has to be chosen; however, on purpose of improving brand awareness a non-celebrity spokesperson might cause a better result than some well-known person due to vampire effect. However, if the aim of the advertising campaign is attitude formation, then selecting a celebrity as an advertising spokesperson is recommended (Pilelienė and Grigaliūnaitė, 2017). Moreover, latter research revealed that visual attention to the brand presented in the static advertisements lowers according to letter “Z” pattern and the most attention-grabbing brand position in the advertisement is the upper left corner. Nevertheless, it can be argued that visual attention to the brand presented in the static advertisement differs due to the context of the advertisement. Hence, the influence of the context of internet on the visual attention to the brand, which is required but not sufficient condition for online advertising effectiveness, is further analyzed.
3. Methodology
Based on the theoretical analysis and synthesis, if the aim of marketing communication is to form
attitude or influence behavior, then recommended advertising message-related factors are:
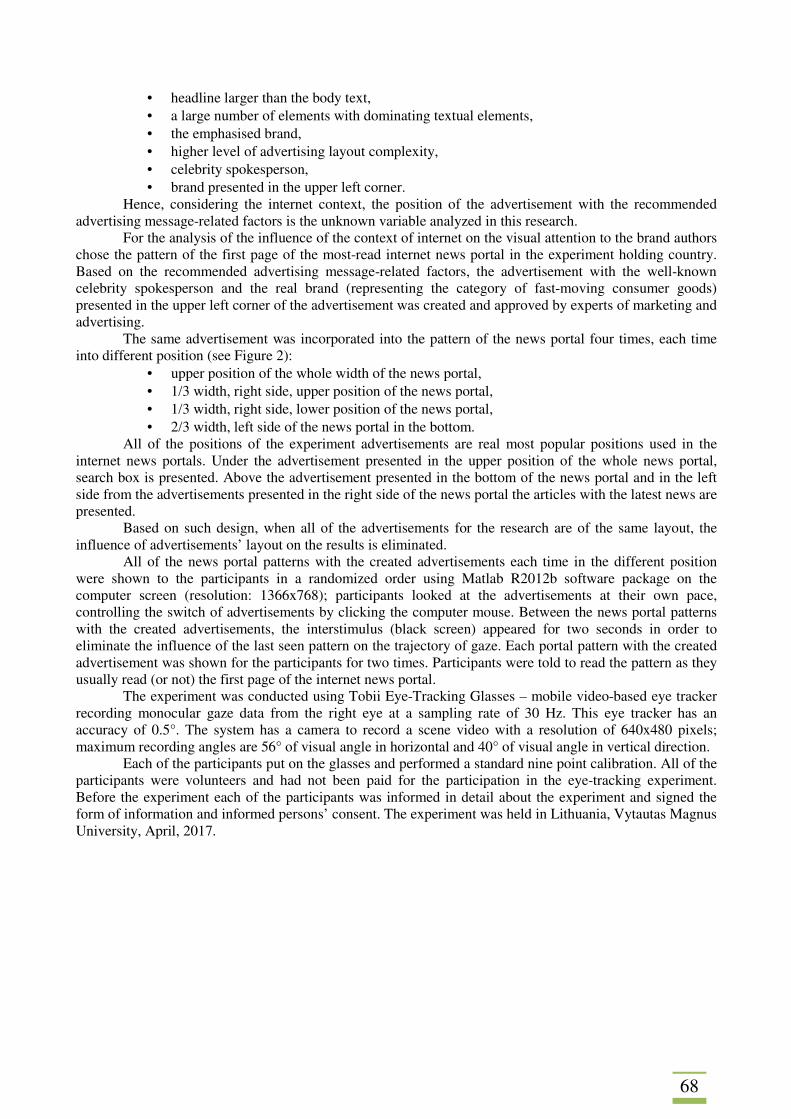
68
• headline larger than the body text, • a large number of elements with dominating textual elements, • the emphasised brand, • higher level of advertising layout complexity, • celebrity spokesperson, • brand presented in the upper left corner.
Hence, considering the internet context, the position of the advertisement with the recommended advertising message-related factors is the unknown variable analyzed in this research.
For the analysis of the influence of the context of internet on the visual attention to the brand authors chose the pattern of the first page of the most-read internet news portal in the experiment holding country. Based on the recommended advertising message-related factors, the advertisement with the well-known celebrity spokesperson and the real brand (representing the category of fast-moving consumer goods) presented in the upper left corner of the advertisement was created and approved by experts of marketing and advertising.
The same advertisement was incorporated into the pattern of the news portal four times, each time into different position (see Figure 2):
• upper position of the whole width of the news portal, • 1/3 width, right side, upper position of the news portal, • 1/3 width, right side, lower position of the news portal, • 2/3 width, left side of the news portal in the bottom.
All of the positions of the experiment advertisements are real most popular positions used in the internet news portals. Under the advertisement presented in the upper position of the whole news portal, search box is presented. Above the advertisement presented in the bottom of the news portal and in the left side from the advertisements presented in the right side of the news portal the articles with the latest news are presented.
Based on such design, when all of the advertisements for the research are of the same layout, the influence of advertisements’ layout on the results is eliminated.
All of the news portal patterns with the created advertisements each time in the different position were shown to the participants in a randomized order using Matlab R2012b software package on the computer screen (resolution: 1366x768); participants looked at the advertisements at their own pace, controlling the switch of advertisements by clicking the computer mouse. Between the news portal patterns with the created advertisements, the interstimulus (black screen) appeared for two seconds in order to eliminate the influence of the last seen pattern on the trajectory of gaze. Each portal pattern with the created advertisement was shown for the participants for two times. Participants were told to read the pattern as they usually read (or not) the first page of the internet news portal.
The experiment was conducted using Tobii Eye-Tracking Glasses – mobile video-based eye tracker recording monocular gaze data from the right eye at a sampling rate of 30 Hz. This eye tracker has an accuracy of 0.5°. The system has a camera to record a scene video with a resolution of 640x480 pixels; maximum recording angles are 56° of visual angle in horizontal and 40° of visual angle in vertical direction.
Each of the participants put on the glasses and performed a standard nine point calibration. All of the participants were volunteers and had not been paid for the participation in the eye-tracking experiment. Before the experiment each of the participants was informed in detail about the experiment and signed the form of information and informed persons’ consent. The experiment was held in Lithuania, Vytautas Magnus University, April, 2017.
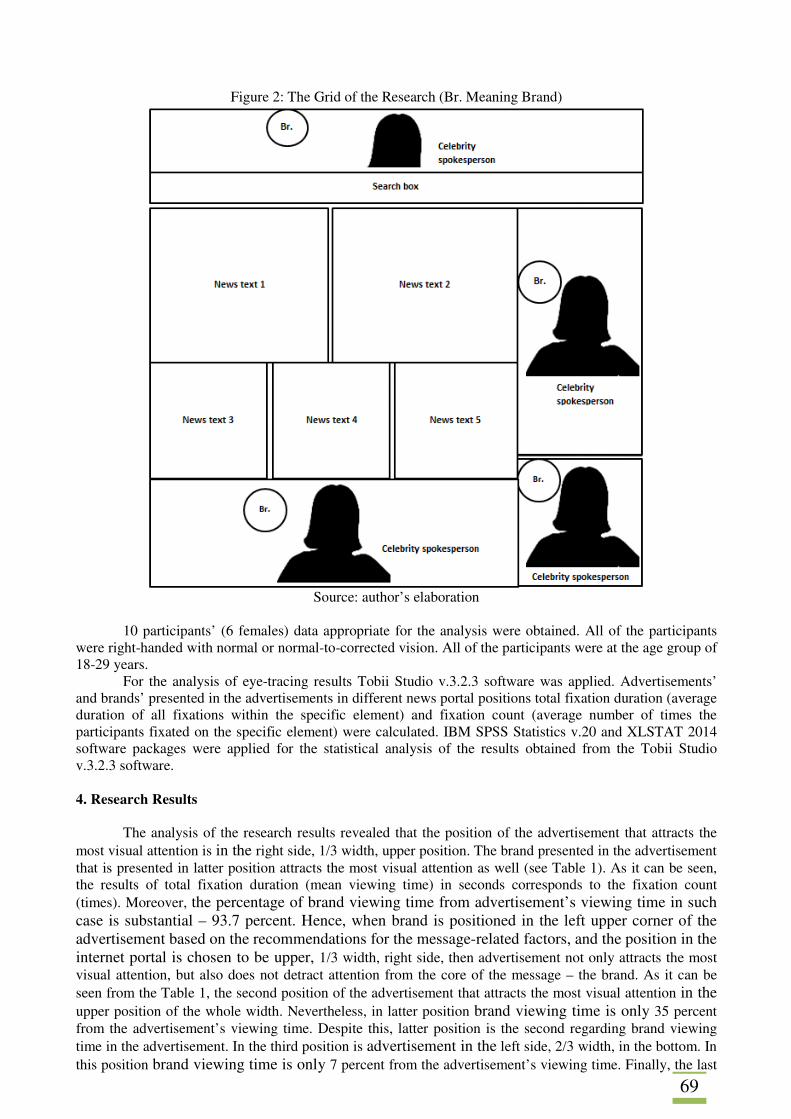
69
Figure 2: The Grid of the Research (Br. Meaning Brand)
Source: author’s elaboration
10 participants’ (6 females) data appropriate for the analysis were obtained. All of the participants
were right-handed with normal or normal-to-corrected vision. All of the participants were at the age group of 18-29 years.
For the analysis of eye-tracing results Tobii Studio v.3.2.3 software was applied. Advertisements’ and brands’ presented in the advertisements in different news portal positions total fixation duration (average duration of all fixations within the specific element) and fixation count (average number of times the participants fixated on the specific element) were calculated. IBM SPSS Statistics v.20 and XLSTAT 2014 software packages were applied for the statistical analysis of the results obtained from the Tobii Studio v.3.2.3 software.
4. Research Results
The analysis of the research results revealed that the position of the advertisement that attracts the
most visual attention is in the right side, 1/3 width, upper position. The brand presented in the advertisement that is presented in latter position attracts the most visual attention as well (see Table 1). As it can be seen, the results of total fixation duration (mean viewing time) in seconds corresponds to the fixation count (times). Moreover, the percentage of brand viewing time from advertisement’s viewing time in such case is substantial – 93.7 percent. Hence, when brand is positioned in the left upper corner of the advertisement based on the recommendations for the message-related factors, and the position in the internet portal is chosen to be upper, 1/3 width, right side, then advertisement not only attracts the most visual attention, but also does not detract attention from the core of the message – the brand. As it can be seen from the Table 1, the second position of the advertisement that attracts the most visual attention in the upper position of the whole width. Nevertheless, in latter position brand viewing time is only 35 percent from the advertisement’s viewing time. Despite this, latter position is the second regarding brand viewing time in the advertisement. In the third position is advertisement in the left side, 2/3 width, in the bottom. In this position brand viewing time is only 7 percent from the advertisement’s viewing time. Finally, the last
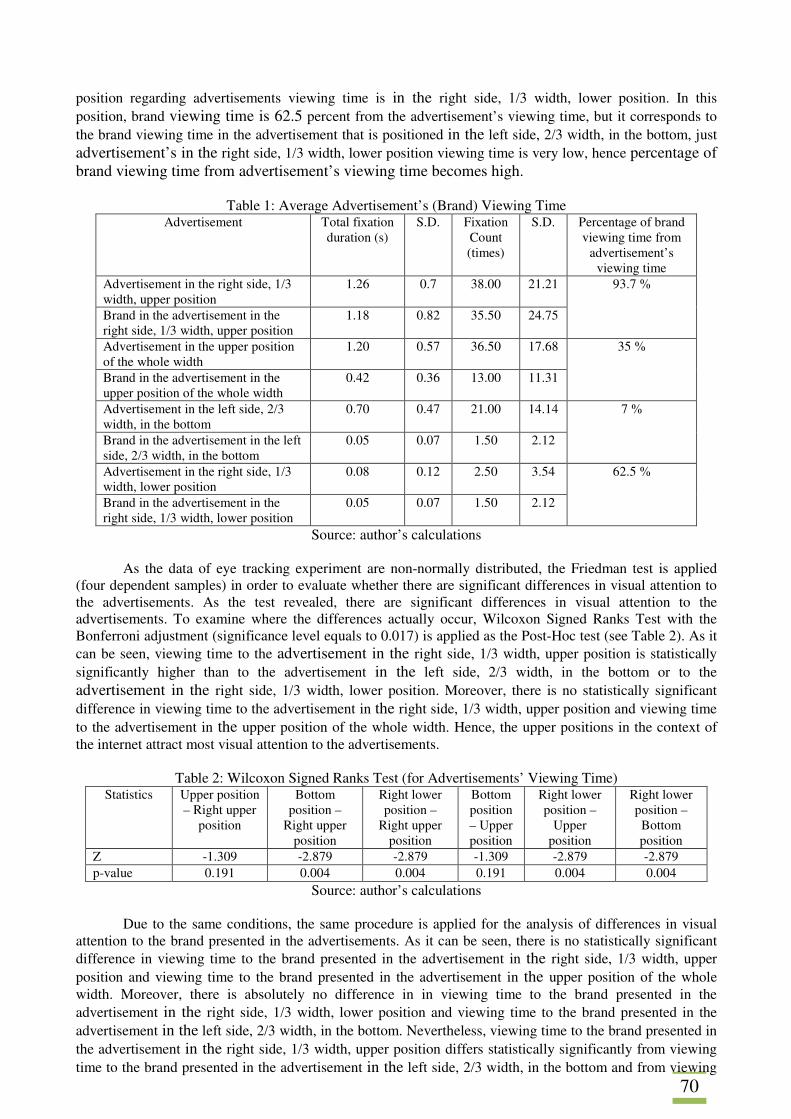
70
position regarding advertisements viewing time is in the right side, 1/3 width, lower position. In this position, brand viewing time is 62.5 percent from the advertisement’s viewing time, but it corresponds to the brand viewing time in the advertisement that is positioned in the left side, 2/3 width, in the bottom, just advertisement’s in the right side, 1/3 width, lower position viewing time is very low, hence percentage of brand viewing time from advertisement’s viewing time becomes high.
Table 1: Average Advertisement’s (Brand) Viewing Time
Advertisement Total fixation duration (s)
S.D. Fixation Count (times)
S.D. Percentage of brand viewing time from
advertisement’s viewing time
Advertisement in the right side, 1/3 width, upper position
1.26 0.7 38.00 21.21 93.7 %
Brand in the advertisement in the right side, 1/3 width, upper position
1.18 0.82 35.50 24.75
Advertisement in the upper position of the whole width
1.20 0.57 36.50 17.68 35 %
Brand in the advertisement in the upper position of the whole width
0.42 0.36 13.00 11.31
Advertisement in the left side, 2/3 width, in the bottom
0.70 0.47 21.00 14.14 7 %
Brand in the advertisement in the left side, 2/3 width, in the bottom
0.05 0.07 1.50 2.12
Advertisement in the right side, 1/3 width, lower position
0.08 0.12 2.50 3.54 62.5 %
Brand in the advertisement in the right side, 1/3 width, lower position
0.05 0.07 1.50 2.12
Source: author’s calculations
As the data of eye tracking experiment are non-normally distributed, the Friedman test is applied (four dependent samples) in order to evaluate whether there are significant differences in visual attention to the advertisements. As the test revealed, there are significant differences in visual attention to the advertisements. To examine where the differences actually occur, Wilcoxon Signed Ranks Test with the Bonferroni adjustment (significance level equals to 0.017) is applied as the Post-Hoc test (see Table 2). As it can be seen, viewing time to the advertisement in the right side, 1/3 width, upper position is statistically significantly higher than to the advertisement in the left side, 2/3 width, in the bottom or to the advertisement in the right side, 1/3 width, lower position. Moreover, there is no statistically significant difference in viewing time to the advertisement in the right side, 1/3 width, upper position and viewing time to the advertisement in the upper position of the whole width. Hence, the upper positions in the context of the internet attract most visual attention to the advertisements.
Table 2: Wilcoxon Signed Ranks Test (for Advertisements’ Viewing Time) Statistics Upper position
– Right upper position
Bottom position –
Right upper position
Right lower position –
Right upper position
Bottom position – Upper position
Right lower position –
Upper position
Right lower position – Bottom position
Z -1.309 -2.879 -2.879 -1.309 -2.879 -2.879 p-value 0.191 0.004 0.004 0.191 0.004 0.004
Source: author’s calculations
Due to the same conditions, the same procedure is applied for the analysis of differences in visual attention to the brand presented in the advertisements. As it can be seen, there is no statistically significant difference in viewing time to the brand presented in the advertisement in the right side, 1/3 width, upper position and viewing time to the brand presented in the advertisement in the upper position of the whole width. Moreover, there is absolutely no difference in in viewing time to the brand presented in the advertisement in the right side, 1/3 width, lower position and viewing time to the brand presented in the advertisement in the left side, 2/3 width, in the bottom. Nevertheless, viewing time to the brand presented in the advertisement in the right side, 1/3 width, upper position differs statistically significantly from viewing time to the brand presented in the advertisement in the left side, 2/3 width, in the bottom and from viewing
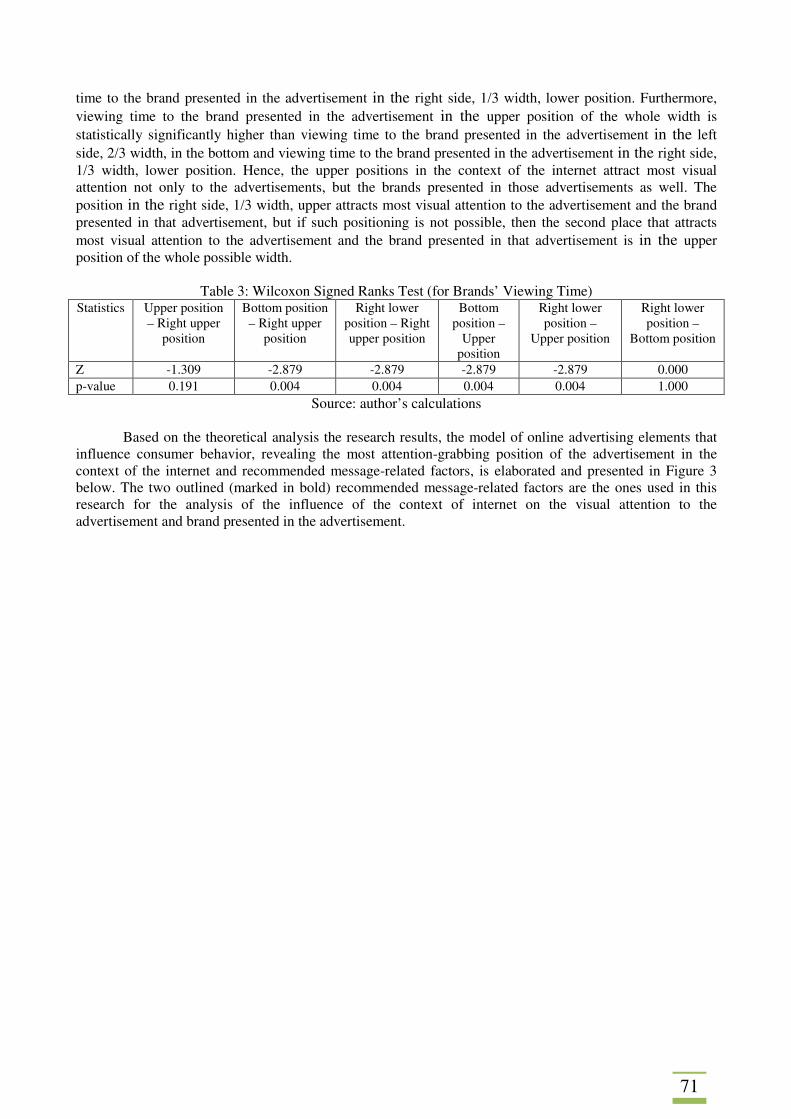
71
time to the brand presented in the advertisement in the right side, 1/3 width, lower position. Furthermore, viewing time to the brand presented in the advertisement in the upper position of the whole width is statistically significantly higher than viewing time to the brand presented in the advertisement in the left side, 2/3 width, in the bottom and viewing time to the brand presented in the advertisement in the right side, 1/3 width, lower position. Hence, the upper positions in the context of the internet attract most visual attention not only to the advertisements, but the brands presented in those advertisements as well. The position in the right side, 1/3 width, upper attracts most visual attention to the advertisement and the brand presented in that advertisement, but if such positioning is not possible, then the second place that attracts most visual attention to the advertisement and the brand presented in that advertisement is in the upper position of the whole possible width.
Table 3: Wilcoxon Signed Ranks Test (for Brands’ Viewing Time)
Statistics Upper position – Right upper
position
Bottom position – Right upper
position
Right lower position – Right upper position
Bottom position –
Upper position
Right lower position –
Upper position
Right lower position –
Bottom position
Z -1.309 -2.879 -2.879 -2.879 -2.879 0.000 p-value 0.191 0.004 0.004 0.004 0.004 1.000
Source: author’s calculations
Based on the theoretical analysis the research results, the model of online advertising elements that influence consumer behavior, revealing the most attention-grabbing position of the advertisement in the context of the internet and recommended message-related factors, is elaborated and presented in Figure 3 below. The two outlined (marked in bold) recommended message-related factors are the ones used in this research for the analysis of the influence of the context of internet on the visual attention to the advertisement and brand presented in the advertisement.
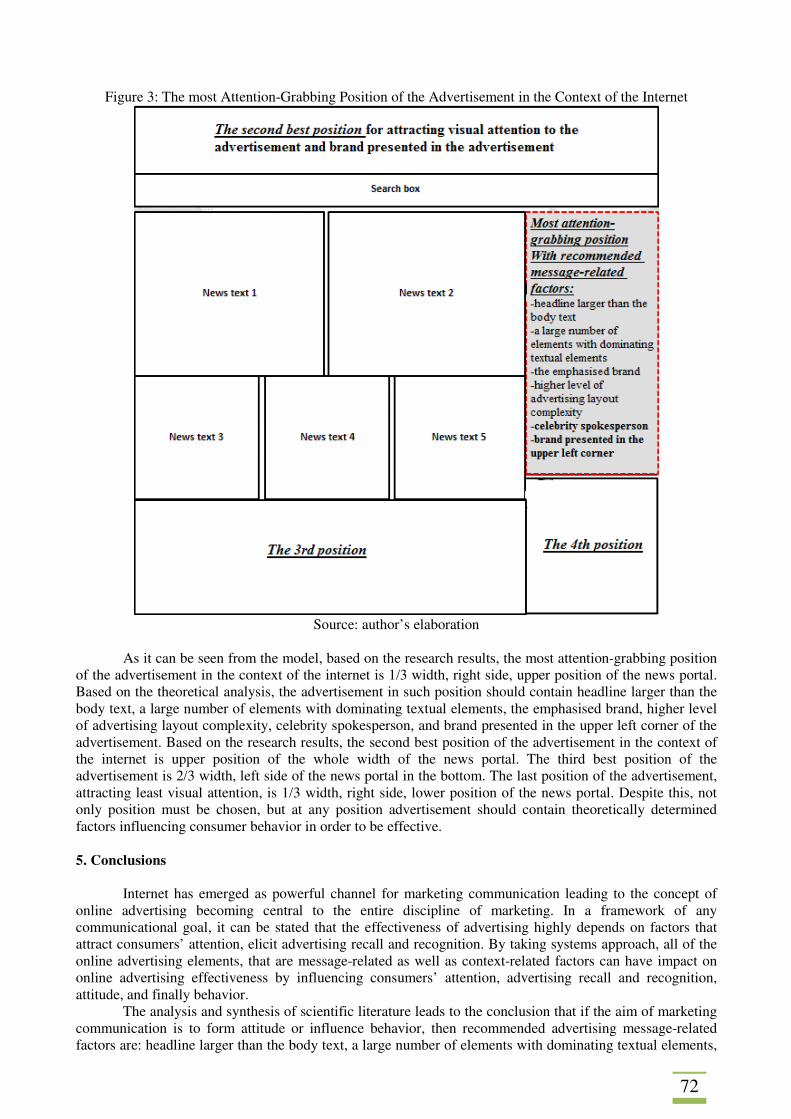
72
Figure 3: The most Attention-Grabbing Position of the Advertisement in the Context of the Internet
Source: author’s elaboration
As it can be seen from the model, based on the research results, the most attention-grabbing position
of the advertisement in the context of the internet is 1/3 width, right side, upper position of the news portal. Based on the theoretical analysis, the advertisement in such position should contain headline larger than the body text, a large number of elements with dominating textual elements, the emphasised brand, higher level of advertising layout complexity, celebrity spokesperson, and brand presented in the upper left corner of the advertisement. Based on the research results, the second best position of the advertisement in the context of the internet is upper position of the whole width of the news portal. The third best position of the advertisement is 2/3 width, left side of the news portal in the bottom. The last position of the advertisement, attracting least visual attention, is 1/3 width, right side, lower position of the news portal. Despite this, not only position must be chosen, but at any position advertisement should contain theoretically determined factors influencing consumer behavior in order to be effective.
5. Conclusions
Internet has emerged as powerful channel for marketing communication leading to the concept of online advertising becoming central to the entire discipline of marketing. In a framework of any communicational goal, it can be stated that the effectiveness of advertising highly depends on factors that attract consumers’ attention, elicit advertising recall and recognition. By taking systems approach, all of the online advertising elements, that are message-related as well as context-related factors can have impact on online advertising effectiveness by influencing consumers’ attention, advertising recall and recognition, attitude, and finally behavior.
The analysis and synthesis of scientific literature leads to the conclusion that if the aim of marketing communication is to form attitude or influence behavior, then recommended advertising message-related factors are: headline larger than the body text, a large number of elements with dominating textual elements,
73
the emphasised brand, higher level of advertising layout complexity, celebrity spokesperson, and brand presented in the upper left corner of the advertisement.
The analysis of research results allows substantiating the theoretical assumption that message-related as well as context-related factors together can have impact on online advertising effectiveness. Research results leads to the conclusion that the most attention-grabbing position of the advertisement and the brand presented in the advertisement in the context of the internet is 1/3 width, right side, upper position of the news portal. The second best position of the advertisement in the context of the internet is upper position of the whole width of the news portal. Nevertheless, advertisements in such positions should contain well managed message-related factors in order to improve the possibility to create effective advertising campaigns influencing consumer behavior. References BELANCHE, D., FLAVIÁN, C., PÉREZ-RUEDA, A. (2017). Understanding Interactive Online Advertising: Congruence and Product Involvement in Highly and Lowly Arousing, Skippable Video Ads. Journal of Interactive Marketing, vol. 37, pp. 75-88. BOERMAN, S. C., SMIT, E. G., van MEURS, L. (2011). Attention Battle; the Abilities of Brand, Visual, and Text Characteristics of the Ad to Draw Attention versus the Diverting Power of the Direct Magazine Context. Advances in Advertising Research, vol. 2, pp. 295-310. ESTRADA-JIMÉNEZ, J., PARRA-ARNAU, J., RODRÍGUEZ-HOYOS, A., FORNÉ, J. (2017). Online advertising: Analysis of privacy threats and protection approaches. Computer Communications, vol. 100, pp. 32-51. FRANCH, E. B., ALBIOL, C. B., RUTHERFORD, (2013). Messages with Impact: Creativity in Traditional Outdoor Advertising Platforms in Castellón (Spain) and Warrington (UK). Online Journal of Communication and Media Technologies, vol. 3, iss. 2, pp. 94-111. GISBERGEN, M. S., KETELAAR, P. E., BEENTJES, J. (2004). Changes in advertising language? A content analysis of magazine advertisements in 1980 and 2000. In NEIJENS, P., Hess, C., van den Putte, B., Smit, E. (eds.) Content and Media Factors in Advertising. Amsterdam: Spinhuis Publishers, pp. 22-37. GRIGALIŪNAITĖ, V., PILELIENĖ, L. (2015). Determination of the impact of spokesperson on advertising effectiveness. International journal of management, accounting and economics, vol. 2, iss. 8, pp. 810-822. GRIGALIŪNAITĖ, V., PILELIENĖ, L., BAKANAUSKAS, A. P. (2016). The analysis of the influence of internal factors on outdoor advertising effectiveness. In Research for rural development 2016: annual 22nd international scientific conference proceedings. Jelgava: Latvia University of Agriculture, vol. 2, pp. 166-173. HEWETT, G. (2009). Advertising & Promotions. South Africa: Pearson education. JANKOWSKI, J., HSU, P.F. (2009). Evaluation of Advertising Spokespersons via the ANP-GRA Selection Model. Journal of Grey System, vol. 21, no.1, 35-48. KAZIENKO, P., WĄTRÓBSKI, J., LEWANDOWSKA, A., ZIEMBA, P., ZIOŁO, M. (2016). Fuzzy Multi-Objective Modeling of Effectiveness and User Experience in Online Advertising. Expert Systems with Applications, vol. 65, pp. 315-331. KAZLAUSKAITĖ, R., LIAKAITĖ, R. (2009). Vaizdiniai reklamos elementai: pragmatinis tyrimas. Žmogus ir žodis, vol. 1, pp. 35-44. KIREYEV, P., PAUWELS, K., GUPTA, S. (2016). Do Display Ads Influence Search? Attribution and Dynamics in Online Advertising. International Journal of Research in Marketing, vol. 33, iss. 3, pp. 475-490. McGUIRE, W. J. (1976). Some Internal Psychological Factors Influencing Consumer Choice. Journal of Consumer Research, vol. 2, no. 4, pp. 302-319.
74
PIETERS, R., WARLOP, L., WEDEL, M. (2002). Breaking Through the Clutter: Benefits of Advertisement Originality and Familiarity for Brand Attention and Memory. Management Science, vol. 48, iss. 6., pp. 765-781. PIETERS, R., WEDEL, M. (2004). Attention Capture and Transfer in Advertising: Brand, Pictorial, and Text-Size Effects. Journal of Marketing, vol. 68, pp. 36-50. PILELIENĖ, L., GRIGALIŪNAITĖ, V., BAKANAUSKAS, A. P. (2015). Spausdintos reklamos efektyvumo vertinimo metodika. Kaunas: Vytauto Didžiojo universitetas. PILELIENĖ, L., GRIGALIŪNAITĖ, V. (2016). Effect of visual advertising complexity on consumers’ attention. International journal of management, accounting and economics, vol. 3, iss. 8, pp. 489-501. PILELIENĖ, L., GRIGALIŪNAITĖ, L. (2017). The effect of female celebrity spokesperson in FMCG advertising: neuromarketing approach. Journal of Consumer Marketing, vol. 34, iss. 3. TACKX, K., ROTHENBERGER, S., VERDIN, P. (2017). Is Advertising for Losers? An Empirical Study from a Value Creation and Value Capturing Perspective. European Management Journal, vol. 35, iss. 3, pp. 327-335. WALLISER, B. (1997). A Comparison of the Effectiveness of Perimeter and Outdoor Advertising: What Sponsorship can Learn from Outdoor Advertising. Asia-Australia Marketing Journal, vol. 5, iss. 1, pp. 21-31. ZUBCEVIC, N., LUXTON, S. (2011). A Comparison of Print Ads from Australia and Croatia. Australasian Marketing Journal, vol. 19, no. 2, pp. 131-136.
75
PEOPLE AND COMMUNICATION IN CRM PROCESS IN SMALL AND MEDIUM SIZED CZECH ENTERPRISES
Adéla Chromčáková, Halina Starzyczná, Michal Stoklasa Silesian University in Opava, School of Business Administration in Karviná Univerzitní náměstí 1934/3 733 40 Karviná Czech Republic [email protected], [email protected], [email protected] Abstract
This article aims to present selected problems of CRM focused on people, their knowledge of CRM, communication with customers and activities in process of CRM in the Czech SMEs. Customer relationship management is not possible without these elements. 736 respondents were addressed. Awareness of CRM increases, the level of contact is changing in favour of a complete evaluation and creation of databases, which favors communication. Differentiated is carrying out tasks to ensure the CRM process. Some activities are carried out regularly, some occasionally. But there are many activities that SMEs do not carry out at all. SMEs prefer personal contact with customers over electronic. The latest research results are, if possible, compared with results from 2005, 2010, or 2012. The hypotheses were verified at the end, which express the relationship among the size of SMEs and responses. Keywords: communication with customer, CRM knowledge, CRM processes, level of contact JEL codes: M3 1. Introduction
SMEs have a specific position on the market. They represent a competitive element. SMEs create jobs and absorb employees who were dismissed from large companies (Wágnerová, Marková et al., 2003, p. 9). They provide a social stability and freedom of entrepreneurship. They help to reduce the negative consequences of structural changes. Small and medium-sized enterprises quickly adapt to the market demands and changes. Customer relationship management is developing. The level of contacts is constantly improving.
These enterprises do not have easy position on the market, because the current market trends are characterized by continued concentration and the market dominance of large companies and the globalization on the sides of supply and demand. Can SMEs deal with this situation? Can they still succeed on the market and satisfy their customers to keep them? Strong competition is another feature of globalization. SMEs must respond to this situation, better understand their strategy and their customer relations. The potential of SMEs, not only in retails or services, can be in close relationships that need to be constantly built (Stoklasa, Starzyczná, Heczková, Pellešová, 2013). And CRM can contribute to this.
However, proper implementation and operation of CRM is not simple. An important role play the specific CRM processes, people and communication with customers, and used technology. In the CRM process, the regularity of major marketing activities is important. The level of communication with the customers is related to the overall level of company marketing communication.
The aim of this article is to present selected problems of CRM focused on people, their knowledge about CRM, communication with customers and activities in the process of CRM in Czech SMEs. The starting point is a brief theoretical review. The latest research results from 2015 have been compared with results from 2005, 2010 or 2012. In conclusion, 3 hypothesis have been tested to evaluate the relationship between the SME size and responses. 2. Customer Relationship Management (CRM)
CRM based on quality information and customer relationships enables companies to identify and predict the behaviour of consumers’ needs, and then meet them. However, it is generally known that this king of CRM is mainly used in large companies. These companies possess sufficient resources and expertise to effectively work with the CRM system. However, it is also necessary not to forget SMEs, which are an important part of business. According to Alshawiho et al., (2015) there are different results of success of SMEs introducing CRM solutions. The main problem are the organizational and technical factors and data
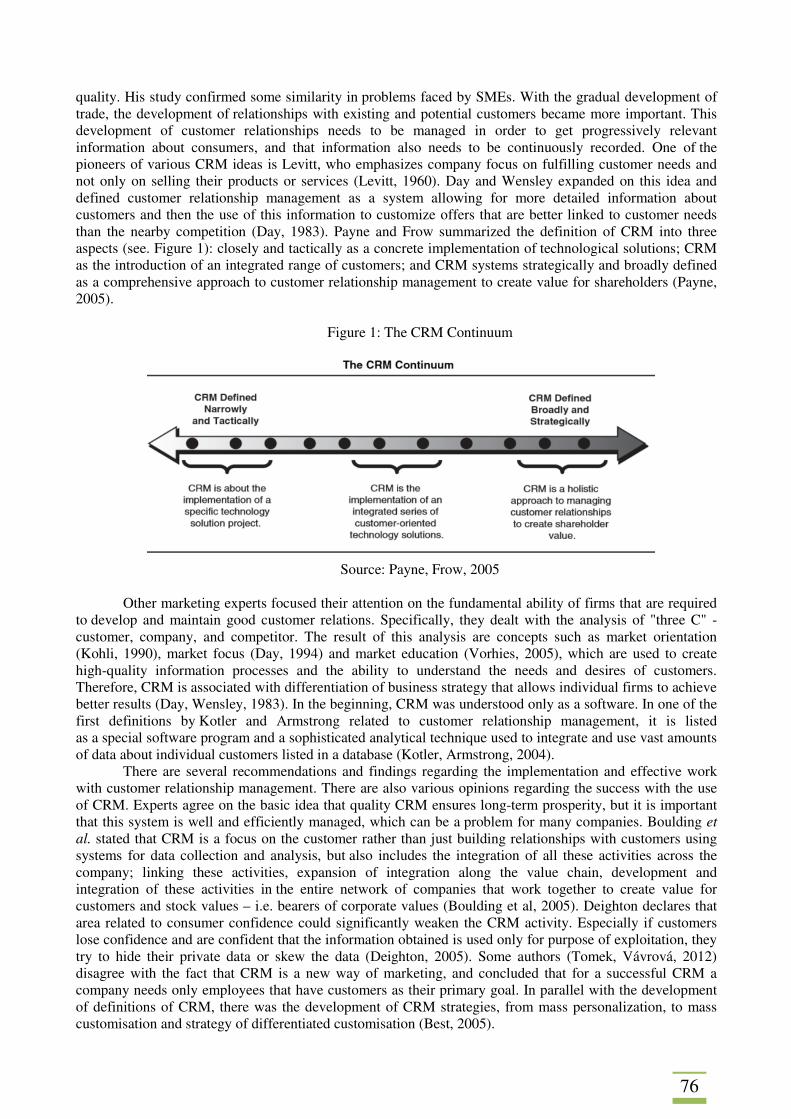
76
quality. His study confirmed some similarity in problems faced by SMEs. With the gradual development of trade, the development of relationships with existing and potential customers became more important. This development of customer relationships needs to be managed in order to get progressively relevant information about consumers, and that information also needs to be continuously recorded. One of the pioneers of various CRM ideas is Levitt, who emphasizes company focus on fulfilling customer needs and not only on selling their products or services (Levitt, 1960). Day and Wensley expanded on this idea and defined customer relationship management as a system allowing for more detailed information about customers and then the use of this information to customize offers that are better linked to customer needs than the nearby competition (Day, 1983). Payne and Frow summarized the definition of CRM into three aspects (see. Figure 1): closely and tactically as a concrete implementation of technological solutions; CRM as the introduction of an integrated range of customers; and CRM systems strategically and broadly defined as a comprehensive approach to customer relationship management to create value for shareholders (Payne, 2005).
Figure 1: The CRM Continuum
Source: Payne, Frow, 2005
Other marketing experts focused their attention on the fundamental ability of firms that are required to develop and maintain good customer relations. Specifically, they dealt with the analysis of "three C" - customer, company, and competitor. The result of this analysis are concepts such as market orientation (Kohli, 1990), market focus (Day, 1994) and market education (Vorhies, 2005), which are used to create high-quality information processes and the ability to understand the needs and desires of customers. Therefore, CRM is associated with differentiation of business strategy that allows individual firms to achieve better results (Day, Wensley, 1983). In the beginning, CRM was understood only as a software. In one of the first definitions by Kotler and Armstrong related to customer relationship management, it is listed as a special software program and a sophisticated analytical technique used to integrate and use vast amounts of data about individual customers listed in a database (Kotler, Armstrong, 2004).
There are several recommendations and findings regarding the implementation and effective work with customer relationship management. There are also various opinions regarding the success with the use of CRM. Experts agree on the basic idea that quality CRM ensures long-term prosperity, but it is important that this system is well and efficiently managed, which can be a problem for many companies. Boulding et al. stated that CRM is a focus on the customer rather than just building relationships with customers using systems for data collection and analysis, but also includes the integration of all these activities across the company; linking these activities, expansion of integration along the value chain, development and integration of these activities in the entire network of companies that work together to create value for customers and stock values – i.e. bearers of corporate values (Boulding et al, 2005). Deighton declares that area related to consumer confidence could significantly weaken the CRM activity. Especially if customers lose confidence and are confident that the information obtained is used only for purpose of exploitation, they try to hide their private data or skew the data (Deighton, 2005). Some authors (Tomek, Vávrová, 2012) disagree with the fact that CRM is a new way of marketing, and concluded that for a successful CRM a company needs only employees that have customers as their primary goal. In parallel with the development of definitions of CRM, there was the development of CRM strategies, from mass personalization, to mass customisation and strategy of differentiated customisation (Best, 2005).
77
2.1 CRM Processes, People, and Communication
CRM includes four process parts, namely strategic, analytical, operational, and collaborative.
All of CRM parts are ensured by people that have the necessary technological means, according to the possibilities of a specific company. Among the most needed qualities of people in management process in general, as well as in the CRM, include: rigorous concentration on customer needs, competition, motivation and will, decisiveness, ability to improvise, teamwork and the ability to lead teams (Dohnal, 2002). All processes aim at understanding customers and their goal is a satisfied customer. Workers evaluate successful and unsuccessful sales and key customer groups. The basis of good sophisticated CRM system is the correct choice of workers who act on behalf of the company with the customer (Kozák, 2011). Kotler and Keller believe that providing high customer value affects their satisfaction and loyalty (Kotler, Keller, 2013). Important is the idea regarding the status of CRM workers in SMEs. SMEs mostly prefer personal contact with customers instead of other communication channels (Čemerková, 2016).
The strategic part of CRM is aimed to evaluate the profitability of the customer and define short, medium, and long-term customer goals. If this part is being used well by the company, it can divide its customers into different segments; calculate the income, profits and overall profitability of segments and individual customers, and simulate the future behaviour of customers (Curry, 2000). Analytical CRM corresponds to the integration and processing of the obtained data and processing them into useful information, important for building relationships with customers and their possible improvements. Analytical part contains the accumulated data on consumers, obtained from processes at the level of operational CRM and other applications. Objectives of the analytical CRM are focused on customer segmentation, their preferences and analysis of their behaviour to support purchasing decisions, preparation and execution of marketing campaigns, recording and evaluation of new relations established with customers and profitability analysis, customer and financial forecasts (Dohnal, 2002, Reicher, Szeghegyi, 2015). Operative part supports the operation of all communication channels within the company that are used for customer contact. In this part, the customer is in direct contact with the CRM system and the people who provide it. Operational CRM mainly supports actual customer contact with employees, led by first-line (front office), and general automation of business processes, including sales of products, services, and marketing. All communication with the customer is tracked and stored in a database, and if necessary, is effectively provided to users, or employees (Dohnal, 2002). People build relationships with customers and make contacts with them (Lehtinen, 2007). These relationships are part of marketing communications. The level of communication with the customer is affected by the behaviour of employees who directly represent the company brand. Relationships between staff and customers have a significant impact on positive word of mouth communication. One of the key indicators of employee-customer relationship is trust. Three aspects of human relations gain confidence: a close relationship of employees and customers, personalized employee approach to customer, and care manifested by the employees. WOM communication between a loyal and a potential customer is often a guarantee of high-quality support for the brand, so it's important to pay enough attention to the interest and attitude of employees in communication with customers (Dwayne, 2001). Motivated employees, who are constantly trained and motivated for personal development, have significant positive impact on the overall functioning of the CRM system.
Another part of CRM is known as collaborative CRM and is very closely linked to the operational part. Collaborative part uses the services and infrastructure and creates relationships between businesses, employees, and customers Payne, (2007). This collaboration improves cooperation with suppliers, partners, and customers, with the aim to improve processes and meet customer needs. Collaborative CRM extends the communication with clients via all marketing channels (Heytel, 2004). 3 Applied Research Methods
The research was conducted mostly on the Moravian-Silesian Region in 2015 via questionnaire. Students of OPF Karvina collaborated on the primary research stage of collecting information. The choice of a sample used was a random choice. Respondent sample consisted of 736 respondents. Most were micro-enterprises with 301 (40.9%), small businesses with 230 (31.3%), medium with 201 (27.9%). The structure of the questionnaire had a wider scope than the thematic orientation of this article. According to the content focus of the article, we have selected essential respondents' answers concerning the people's awareness in companies on CRM, customer contact, activity in the process to ensure CRM, the most important component of collaborative CRM in customer communication.
To evaluate research results, we have applied descriptive and causal research. Individual issues were assessed using both absolute and relative frequencies, hypotheses were formulated, and dependencies
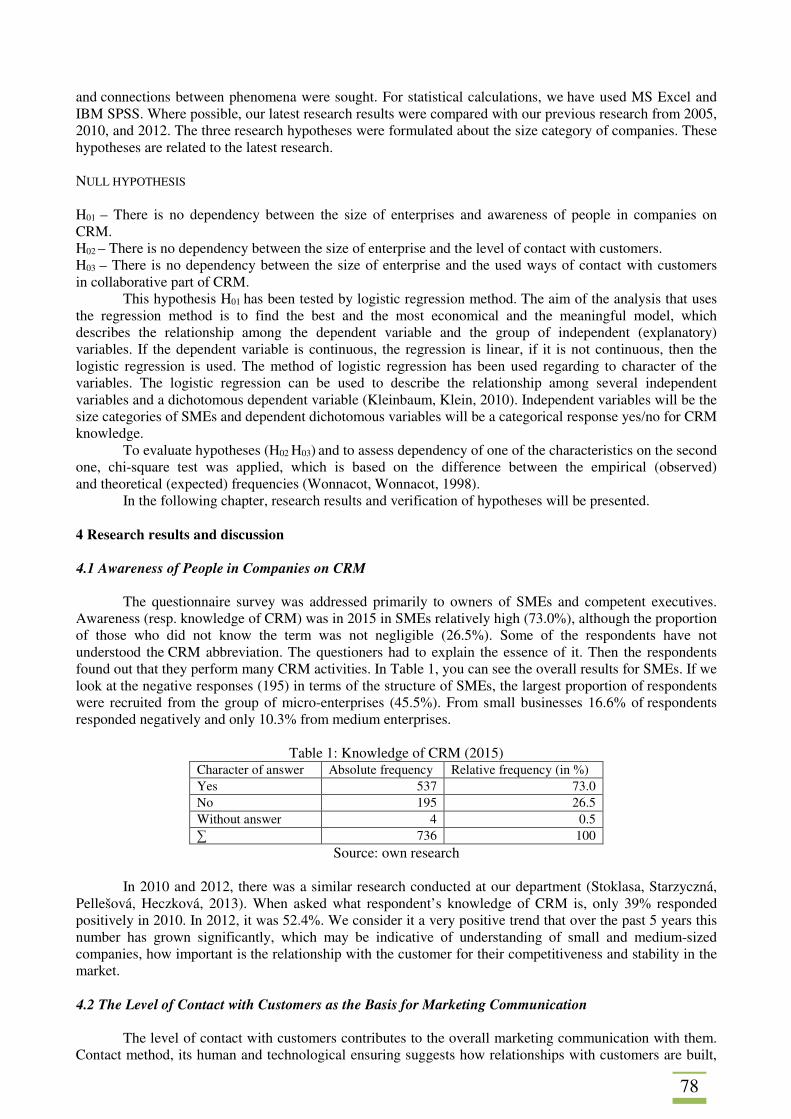
78
and connections between phenomena were sought. For statistical calculations, we have used MS Excel and IBM SPSS. Where possible, our latest research results were compared with our previous research from 2005, 2010, and 2012. The three research hypotheses were formulated about the size category of companies. These hypotheses are related to the latest research. NULL HYPOTHESIS H01 – There is no dependency between the size of enterprises and awareness of people in companies on CRM. H02 – There is no dependency between the size of enterprise and the level of contact with customers. H03 – There is no dependency between the size of enterprise and the used ways of contact with customers in collaborative part of CRM.
This hypothesis H01 has been tested by logistic regression method. The aim of the analysis that uses the regression method is to find the best and the most economical and the meaningful model, which describes the relationship among the dependent variable and the group of independent (explanatory) variables. If the dependent variable is continuous, the regression is linear, if it is not continuous, then the logistic regression is used. The method of logistic regression has been used regarding to character of the variables. The logistic regression can be used to describe the relationship among several independent variables and a dichotomous dependent variable (Kleinbaum, Klein, 2010). Independent variables will be the size categories of SMEs and dependent dichotomous variables will be a categorical response yes/no for CRM knowledge.
To evaluate hypotheses (H02 H03) and to assess dependency of one of the characteristics on the second one, chi-square test was applied, which is based on the difference between the empirical (observed) and theoretical (expected) frequencies (Wonnacot, Wonnacot, 1998).
In the following chapter, research results and verification of hypotheses will be presented. 4 Research results and discussion
4.1 Awareness of People in Companies on CRM
The questionnaire survey was addressed primarily to owners of SMEs and competent executives. Awareness (resp. knowledge of CRM) was in 2015 in SMEs relatively high (73.0%), although the proportion of those who did not know the term was not negligible (26.5%). Some of the respondents have not understood the CRM abbreviation. The questioners had to explain the essence of it. Then the respondents found out that they perform many CRM activities. In Table 1, you can see the overall results for SMEs. If we look at the negative responses (195) in terms of the structure of SMEs, the largest proportion of respondents were recruited from the group of micro-enterprises (45.5%). From small businesses 16.6% of respondents responded negatively and only 10.3% from medium enterprises.
Table 1: Knowledge of CRM (2015) Character of answer Absolute frequency Relative frequency (in %) Yes 537 73.0 No 195 26.5 Without answer 4 0.5 ∑ 736 100
Source: own research
In 2010 and 2012, there was a similar research conducted at our department (Stoklasa, Starzyczná, Pellešová, Heczková, 2013). When asked what respondent’s knowledge of CRM is, only 39% responded positively in 2010. In 2012, it was 52.4%. We consider it a very positive trend that over the past 5 years this number has grown significantly, which may be indicative of understanding of small and medium-sized companies, how important is the relationship with the customer for their competitiveness and stability in the market. 4.2 The Level of Contact with Customers as the Basis for Marketing Communication
The level of contact with customers contributes to the overall marketing communication with them.
Contact method, its human and technological ensuring suggests how relationships with customers are built,
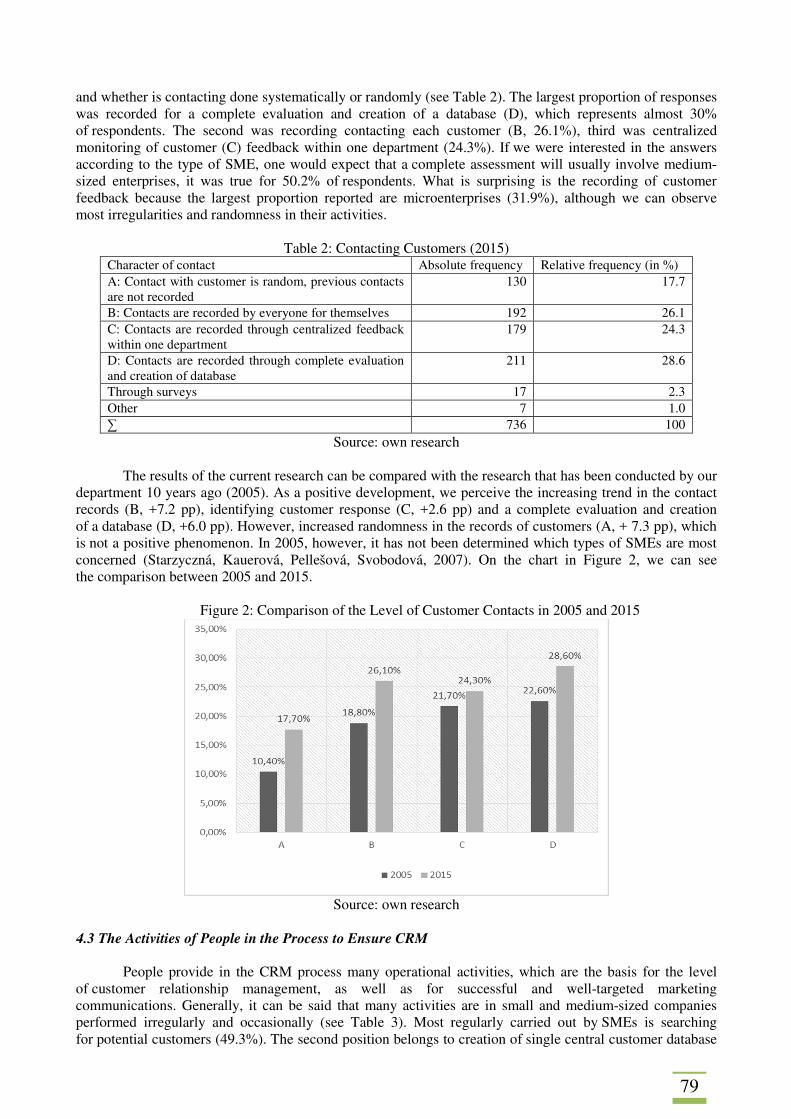
79
and whether is contacting done systematically or randomly (see Table 2). The largest proportion of responses was recorded for a complete evaluation and creation of a database (D), which represents almost 30% of respondents. The second was recording contacting each customer (B, 26.1%), third was centralized monitoring of customer (C) feedback within one department (24.3%). If we were interested in the answers according to the type of SME, one would expect that a complete assessment will usually involve medium-sized enterprises, it was true for 50.2% of respondents. What is surprising is the recording of customer feedback because the largest proportion reported are microenterprises (31.9%), although we can observe most irregularities and randomness in their activities.
Table 2: Contacting Customers (2015)
Character of contact Absolute frequency Relative frequency (in %) A: Contact with customer is random, previous contacts are not recorded
130 17.7
B: Contacts are recorded by everyone for themselves 192 26.1 C: Contacts are recorded through centralized feedback within one department
179 24.3
D: Contacts are recorded through complete evaluation and creation of database
211 28.6
Through surveys 17 2.3 Other 7 1.0 ∑ 736 100
Source: own research
The results of the current research can be compared with the research that has been conducted by our department 10 years ago (2005). As a positive development, we perceive the increasing trend in the contact records (B, +7.2 pp), identifying customer response (C, +2.6 pp) and a complete evaluation and creation of a database (D, +6.0 pp). However, increased randomness in the records of customers (A, + 7.3 pp), which is not a positive phenomenon. In 2005, however, it has not been determined which types of SMEs are most concerned (Starzyczná, Kauerová, Pellešová, Svobodová, 2007). On the chart in Figure 2, we can see the comparison between 2005 and 2015.
Figure 2: Comparison of the Level of Customer Contacts in 2005 and 2015
Source: own research
4.3 The Activities of People in the Process to Ensure CRM
People provide in the CRM process many operational activities, which are the basis for the level
of customer relationship management, as well as for successful and well-targeted marketing communications. Generally, it can be said that many activities are in small and medium-sized companies performed irregularly and occasionally (see Table 3). Most regularly carried out by SMEs is searching for potential customers (49.3%). The second position belongs to creation of single central customer database
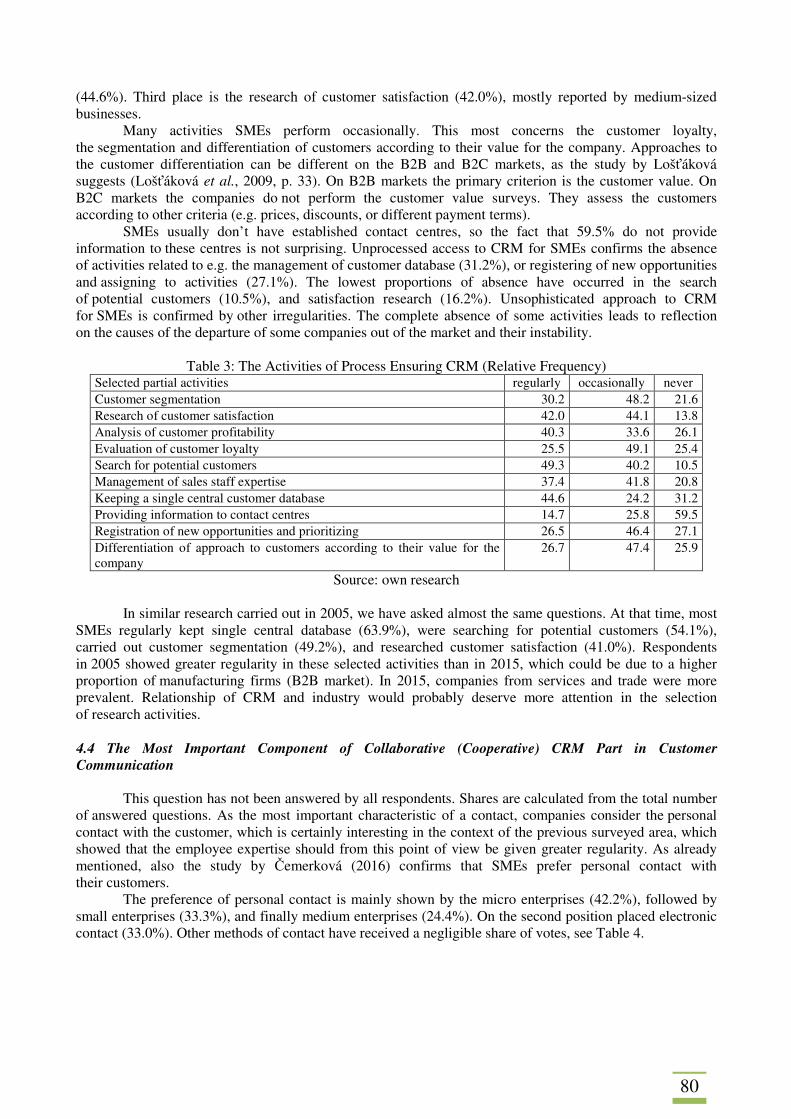
80
(44.6%). Third place is the research of customer satisfaction (42.0%), mostly reported by medium-sized businesses.
Many activities SMEs perform occasionally. This most concerns the customer loyalty, the segmentation and differentiation of customers according to their value for the company. Approaches to the customer differentiation can be different on the B2B and B2C markets, as the study by Lošťáková suggests (Lošťáková et al., 2009, p. 33). On B2B markets the primary criterion is the customer value. On B2C markets the companies do not perform the customer value surveys. They assess the customers according to other criteria (e.g. prices, discounts, or different payment terms).
SMEs usually don’t have established contact centres, so the fact that 59.5% do not provide information to these centres is not surprising. Unprocessed access to CRM for SMEs confirms the absence of activities related to e.g. the management of customer database (31.2%), or registering of new opportunities and assigning to activities (27.1%). The lowest proportions of absence have occurred in the search of potential customers (10.5%), and satisfaction research (16.2%). Unsophisticated approach to CRM for SMEs is confirmed by other irregularities. The complete absence of some activities leads to reflection on the causes of the departure of some companies out of the market and their instability.
Table 3: The Activities of Process Ensuring CRM (Relative Frequency) Selected partial activities regularly occasionally never Customer segmentation 30.2 48.2 21.6 Research of customer satisfaction 42.0 44.1 13.8 Analysis of customer profitability 40.3 33.6 26.1 Evaluation of customer loyalty 25.5 49.1 25.4 Search for potential customers 49.3 40.2 10.5 Management of sales staff expertise 37.4 41.8 20.8 Keeping a single central customer database 44.6 24.2 31.2 Providing information to contact centres 14.7 25.8 59.5 Registration of new opportunities and prioritizing 26.5 46.4 27.1 Differentiation of approach to customers according to their value for the company
26.7 47.4 25.9
Source: own research
In similar research carried out in 2005, we have asked almost the same questions. At that time, most SMEs regularly kept single central database (63.9%), were searching for potential customers (54.1%), carried out customer segmentation (49.2%), and researched customer satisfaction (41.0%). Respondents in 2005 showed greater regularity in these selected activities than in 2015, which could be due to a higher proportion of manufacturing firms (B2B market). In 2015, companies from services and trade were more prevalent. Relationship of CRM and industry would probably deserve more attention in the selection of research activities. 4.4 The Most Important Component of Collaborative (Cooperative) CRM Part in Customer
Communication
This question has not been answered by all respondents. Shares are calculated from the total number of answered questions. As the most important characteristic of a contact, companies consider the personal contact with the customer, which is certainly interesting in the context of the previous surveyed area, which showed that the employee expertise should from this point of view be given greater regularity. As already mentioned, also the study by Čemerková (2016) confirms that SMEs prefer personal contact with their customers.
The preference of personal contact is mainly shown by the micro enterprises (42.2%), followed by small enterprises (33.3%), and finally medium enterprises (24.4%). On the second position placed electronic contact (33.0%). Other methods of contact have received a negligible share of votes, see Table 4.
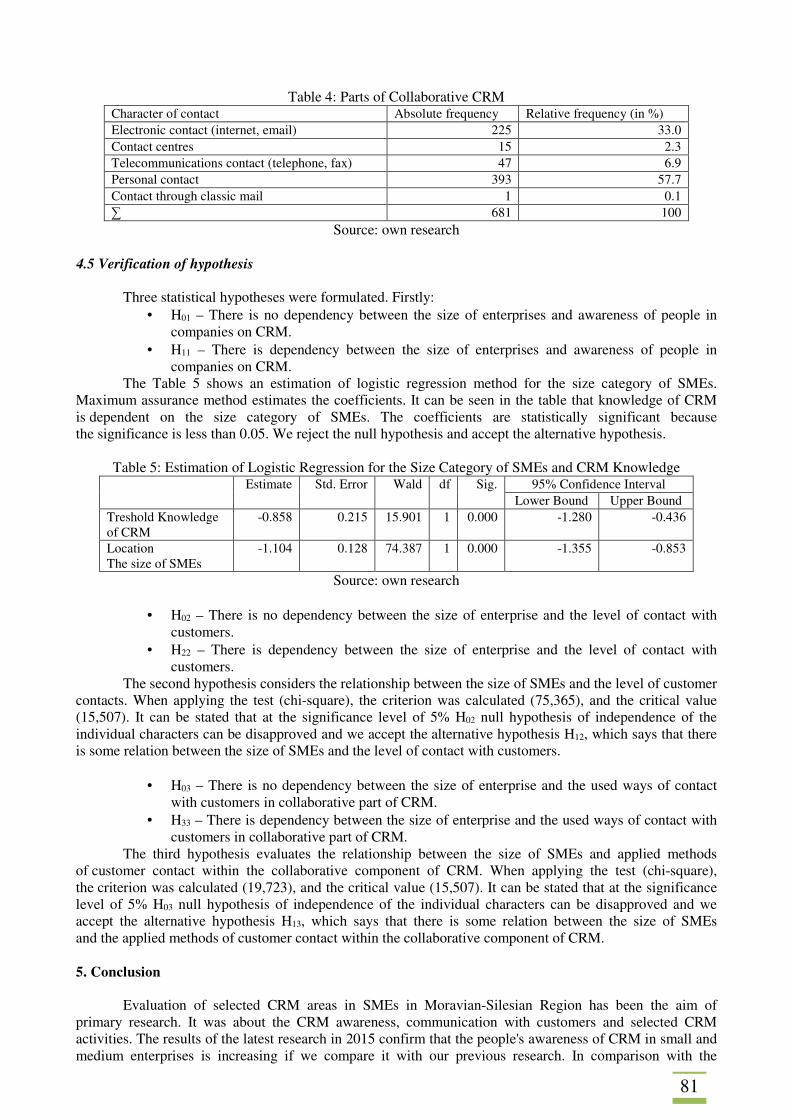
81
Table 4: Parts of Collaborative CRM Character of contact Absolute frequency Relative frequency (in %) Electronic contact (internet, email) 225 33.0 Contact centres 15 2.3 Telecommunications contact (telephone, fax) 47 6.9 Personal contact 393 57.7 Contact through classic mail 1 0.1 ∑ 681 100
Source: own research 4.5 Verification of hypothesis
Three statistical hypotheses were formulated. Firstly: • H01 – There is no dependency between the size of enterprises and awareness of people in
companies on CRM. • H11 – There is dependency between the size of enterprises and awareness of people in
companies on CRM. The Table 5 shows an estimation of logistic regression method for the size category of SMEs.
Maximum assurance method estimates the coefficients. It can be seen in the table that knowledge of CRM is dependent on the size category of SMEs. The coefficients are statistically significant because the significance is less than 0.05. We reject the null hypothesis and accept the alternative hypothesis.
Table 5: Estimation of Logistic Regression for the Size Category of SMEs and CRM Knowledge Estimate Std. Error Wald
df Sig. 95% Confidence Interval
Lower Bound Upper Bound Treshold Knowledge of CRM
-0.858 0.215 15.901 1 0.000 -1.280 -0.436
Location The size of SMEs
-1.104 0.128 74.387 1 0.000 -1.355 -0.853
Source: own research
• H02 – There is no dependency between the size of enterprise and the level of contact with customers.
• H22 – There is dependency between the size of enterprise and the level of contact with customers.
The second hypothesis considers the relationship between the size of SMEs and the level of customer contacts. When applying the test (chi-square), the criterion was calculated (75,365), and the critical value (15,507). It can be stated that at the significance level of 5% H02 null hypothesis of independence of the individual characters can be disapproved and we accept the alternative hypothesis H12, which says that there is some relation between the size of SMEs and the level of contact with customers.
• H03 – There is no dependency between the size of enterprise and the used ways of contact
with customers in collaborative part of CRM. • H33 – There is dependency between the size of enterprise and the used ways of contact with
customers in collaborative part of CRM. The third hypothesis evaluates the relationship between the size of SMEs and applied methods
of customer contact within the collaborative component of CRM. When applying the test (chi-square), the criterion was calculated (19,723), and the critical value (15,507). It can be stated that at the significance level of 5% H03 null hypothesis of independence of the individual characters can be disapproved and we accept the alternative hypothesis H13, which says that there is some relation between the size of SMEs and the applied methods of customer contact within the collaborative component of CRM. 5. Conclusion
Evaluation of selected CRM areas in SMEs in Moravian-Silesian Region has been the aim of primary research. It was about the CRM awareness, communication with customers and selected CRM activities. The results of the latest research in 2015 confirm that the people's awareness of CRM in small and medium enterprises is increasing if we compare it with our previous research. In comparison with the
82
previous research in 2010, only 39 % of respondents answered positively, in 2012 it was 52, 4 %. This positive trend may carry over into improving customer contacts and consequently the level of communication with them. The largest share of respondents (28, 6 %) confirmed the complete customer evaluation and database creation. However, there were respondents who admitted the randomness in customer evidence (+7, 3 pp in 2015). People play an important role in ensuring the CRM process. The most regular activity was the search for new potential customers (49, 3%). Equipped with the necessary technology, they also carry out a series of operational analytical activities. Here, the results in terms of trend did not evolve clearly positively, but it must be said that the samples were different, which could have an effect on the differences in the regularity of selected CRM activities. Important position of people in SMEs in the CRM process is confirmed by the popularity of personal contact with customers (57, 7 %), which even today with globally interconnected computer networks surpassed electronic contact. Thoughtful communication and personal contact with customers can be a competitive advantage for small and medium-sized enterprises. If SMEs want to use the CRM as a competitive advantage, they have to build the long-term relationship with customers. Verification of statistical hypotheses has shown us that there is some relation between the size of SMEs and knowledge of CRM, the level of contact and applied methods of customer contact, which was also indicated by the relative frequencies of respondents' answers.
In communication, important role is played by person. Employees make a significant contribution to customer satisfaction and loyalty as confirm the studies by Long et al. (2013). SMEs can have closer relationship with their customers. It is their competitive advantage which they should use for developing and improving their market position. Growing awareness of CRM and implementation of CRM process into the company system can make a significant contribution.
Acknowledgement
The article was prepared based on research conducted in the context of ensuring the sustainability of the project OP VK Reg. č. CZ.1.07/2.3.00/20.0016 "Targeted research in the field of small and medium businesses to achieve a competitive knowledge economy” and it was supported by the Student grant competition project SGS/7/2017: “Acceptance of technology from the perspective of marketing tools.” References: ALSHAWI et al. (2015). Organisational, technical and data quality factors in CRM adoption — SMEs perspective. Industrial Marketing management, vol. 40, no 3, pp. 376-383. BOULDING, W., STAELIN, R., EHRET, M., JOHNSTON, W. J. (2005). A customer relationship management roadmap: what is known, potential pitfalls, and where to go. Journal of Marketing, vol. 69, no. 4, pp. 155-166. CURRY, J., CURRY, A. (2000). The Customer Marketing Method: How to implement and profit from customer relationship management. London: The Free Press. ČEMERKOVÁ, Š. (2016). Analysis of Logistics Communication of SMEs with their Environs in the Region NUTS II: Case Study for Moravian Silesian Region. In: Proceedings of the 3rd International Conference on European Integration. Ostrava: VŠB - Technical University of Ostrava, pp.125-132. DAY, G. S., WENSLEY, R. (1983). Marketing theory with strategic orientation. Wensley, R. Journal of Marketing, vol. 47. pp. 79–89. DOI: 10.1108/03090569810243712. DAY, G. S. (1994). The Capabilities of Market-Driven Organizations. Journal of Marketing, vol. 58, no. 4. pp. 37–52. DOI: 10.2307/1251915. DEIGHTON, J. (2005). Privacy and Customer Management, Customer Management. MSI conference summary. Cambridge, MA: Marketing Science Institute, pp. 17–19. DOHNAL, J. (2002). Řízení vztahů se zákazníky: procesy, pracovníci, technologie. Praha: Grada.
83
DWAYNE, D. G., GWINNER, K. P., BROWN, S. W. (2001). Generating a positive word-of-mouth communication through customer-employee management. International Journal of Service Industry Management, vol. 12, no. 1, pp. 44-59. HETYEI, J. (2004). ERP systems in Hungary XXI. Century. Budapest: Computerbooks, KOHLI, A. K., JAWORSKI, B. J. (1990). Market Orienta-tion: The Construct, Research Propositions, and Managerial Implications. Journal of Marketing, vol. 54, no. 4, pp. 1–18. KOTLER, P., ARMSTRONG, G. (2004). Marketing. Praha: Grada Publishing. KOTLER, P., KELLER, K. L. (2013). Marketing management. Praha: Grada Publishing. KOZÁK, V. (2011). Budování vztahů se zákazníky v teorii a praxi. Zlín: Radim Bačuvčík - VeRBuM. LEHTINEN, J. (2007). Aktivní CRM: řízení vztahů se zákazníky. Praha: Grada. LEVITT, T. (1960). Marketing Myopia. Harvard Business Review, pp.45–60. LONG et al. (2013). Impact of CRM Factors on Customer Satisfaction and Loyalty. Asian Social Science, vol. 9, no. 10, pp.247-253. PAYNE, A. (2005). A Strategic Framework for Customer Relationship Management. Pennie Frow. Journal of Marketing, vol. 69, no. 4, pp. 167-176. PAYNE, A. (2007). CRM handbook, customer relations on high level. Budapest: HVG Publisher Ltd. PUGH, S. D. (2001). Service with a Smile: Emotional Contagion in the Service Encounter. Academy of Management Journal, vol. 44, no. 5, pp. 1018-1027. REICHER, R., SZEGHEGYI, Á., (2015). Factors Affecting the Selection and Implementation of a Customer Relationship Management (CRM) Process. Acta Polytechnica Hungarica, vol. 12, no. 4, pp. 183-200. STARZYCZNÁ, H., KAUEROVÁ, L., PELLEŠOVÁ, P., SVOBODOVÁ, H. et al. (2007). Metodologie marketingu vztahů a její postavení v rámci strategického marketingu a řízení vztahů se zákazníkem (CRM) - praktické využití. Karviná: SU OPF, GAČR 402/05/0140. STOKLASA, M., STARZYCZNÁ, H., HECZKOVÁ, M., PELLEŠOVÁ, P. (2013). Využití vztahového marketingu v podnikání malých a středních firem. Karviná: SU OPF, pp. 43-56. TOMEK, G., VÁVROVÁ, V. (2012). Vize tržního úspěchu: aneb 10 otázek a odpovědí, jak chápat marketing budoucnosti. Praha: Professional Publishing. VORHIES, D., W. (2005). Benchmarking Marketing Capabilities for Sustainable Competitive Advantage. Neil A. Morgan. Journal of Marketing, vol. 69, pp. 80–94. WONNACOT, T., H., WONNACOT, R., J. (1998). Statistika pro obchod a hospodářství. Praha: Victoria Publishing.
84
DECISION-MAKING BARRIERS AND OPTIMIZATION IN THE DEVELOPMENT OF CRM APPLICATIONS Milena Janakova Silesian University in Opava School of Business Administration in Karvina, Department of Informatics and Mathematics Univerzitni namesti 1934/3, Karvina, 733 40 Czech Republic e-mail: [email protected] Abstract This paper is focused on the search and elimination of existing decision making barriers in the field of developing CRM (Customer Relationship Management) applications. There is a large volume of available CRM applications for the support of customer relationship service activities. These services are the center of interest for all companies whether they are big or small. The question is which items of application must be available so that it is optimal for small business. The focus is placed upon contact and lead management. Realized works are based on the actual view of available software in the CRM field, description of needed metrics, and items for evaluating adopted solutions. Recommended specifications of needed items bring the generalized solution for optimal solution in comparison to one from the best products from the actual 2017 review, Sugar CRM. Keywords: applications, communication, decision-making, information and knowledge, simulation 1. Introduction
Information technology offers important support for everyday activities in various fields of human activities. There are great benefits from such support, but IT (information technology) users also have difficulties with applications and other software. Optimal interest must also be focused on software design and subsequent implementation. (Peng, 2014) Focus on verified design is important from the view of software quality. In the modern and global society, implementation speed is also very important. One must also remember the support given by teamwork and communication. From a general point of view, IT development also has many barriers and there is a need for decision-making optimization in this area.
The volume of available software is amazing regardless of the number of barriers for implementation and application design, and other IT products. One easy way is to design the application according to the requirements of individual IT users. The benefit is the very close links to the needs of IT users, but the weakness is higher budget demands. This software creation method is only one of many. There is a large volume of freely accessible software via the Internet. Many companies try to offer their own IT products without payment so that IT users may become more familiar with products.
The situation is similar in the field of CRM. CRM is oriented around customer relationship management. The aim is to care for customers so that required services could be offered at a higher quality according to customer needs. (Bandaru et al., 2015) Interest is focused on process support of realized activities, active help, appropriate tools, and of course, also on the best CRM application. What is the best application in the field of CRM? It is a natural and important question for all companies, big or small. This paper will focus on finding the needed specification of items for contacts and leads that such IT products must offer in order to be optimal IT products in today’s modern global society.
For this purpose, the paper is divided into three main chapters in addition to the introduction and conclusion with references. The second chapter is dedicated to the actual view of available software in the CRM field with links to the top products. The third chapter contains a description of used methods for the evaluation of adopted solutions with needed metrics. The fourth chapter is focused on specifying needed items for contacts and leads that CRM applications must obtain to bring the optimal services for management of contacts and leads. This design is compared with one from the best CRM applications from available 2017 reviews.
2. Actual View of Available Software in the CRM Field
The actual spectrum of available software is wide in the CRM field. A positive benefit is that one may select from various IT products from commercial to open-source according to the preferences and options of IT users. Here is a list of only a fragment of available IT products: AllProWebTools, Buddy CRM,
85
Commence, GoldMine, Hubspot CRM, Insightly, LeadMaster, Microsoft Dynamics CRM, NetSuite CRM, OnContact, Pipedrive, Salesforce, SAP Digital CRM, Sugar CRM, TeamWox, Vtiger, Workbooks, and Zoho CRM.
The aim is not to describe all above-mentioned applications here in detail. Needed information is available via websites. In summary, there are many integrated menus, where some are available at a common level but some are only included in individual applications. Processes are focused on the management of customer relationships that constitute the foundation. The focus is placed upon contact and lead management. There are also requests on order management, commission management, sales forecasting and e-commerce. (Nasir, 2015) Some IT users also prefer to have a larger CRM application and they expect support through email marketing, project management, reporting, and document management. This customer communication lifecycle has an important influence on customer satisfaction. (Kostojohn et al., 2011) In other applications, there is necessary space for price changes, renewals to boost sales and maintain customer loyalty, support for a sales call or meeting, opportunities for up- and cross-selling. (Kimla, 2013) An integrated part of such services is also sales lead-management tools that track, analyze and communicate with links to marketing and customer-support needs as well as sales, all to boost a business' growth. (Ahmed et al., 2016) Interesting results create processes that integrate sales, marketing and employee tracking. And one must think about sales automation and forecasting, as well as order fulfillment in order to streamline sales processing. (Holcomb, 2015)
Today’s modern global information society needs more. A great of interest rests on business intelligence (Gharaibeh, 2015) and support analyses for campaign management via viewing the sales cycle and monitoring KPIs. (List of the Best Marketing Metrics and KPIs, 2016) Management is vital in task administration and team management in many applications as well. Another integrated part of a CRM application is very often support of marketing tasks. From the many options, there are comprehensive sales and marketing solutions, automated marketing systems, marketing with links to ROI, and needed timecards and calendars. (Gardner, 2016)
From external sources, links to email, websites and e-commerce hosting are rated well by IT users. Perhaps all applications offer support connection with phone calls, emails, and social media. There are also solutions with robust collaboration capabilities and service desks. Automation has a place here just like automated data logging and syncing from different sources and reports. (Goldenberg, 2002) Regardless of the large spectrum of various sources, IT users request easy access via free mobile access, web-based interface, and support of cloud solutions. Such access has an important place in contact center capabilities and incident tracking, or call-center automation. (Slater, 2012)
A user-friendly interface creates good support for quick work with an application. There are various solutions such as dashboards for data organization and visual platforms with fast navigation. Some solutions offer basic and advanced capabilities, unlimited customizations, a step-by-step wizard, users can manage the software themselves, free versions, and free online support. (O'Rourke, 2017)
It is only a small fragment of available menus and submenus in individual applications. The volume of solutions is extensive and orientation is difficult. Some SMEs (Small and medium-sized enterprises) select an application based on comparison with competitors and, of course, with links to available sources. Focus is usually placed on the following metrics:
• Automation capabilities. • User-friendliness. • Employee-tracking capabilities. • Cost. • Contact-management features. • Customer service. • Customization options. • Lead-generation tools. • Mobile access. • Reporting and analytics. • Sales and marketing tools. • Service limitations. • Third-party integration. (Angeles, 2017)
Every year, analyses and surveys are conducted that try to order available CRM applications according to specified metrics. From many of them, examples of analyses from 2017 are mentioned here:
• Best CRM Software 2017 (Angeles, 2017) The top application is Salesforce for small business, Insightly for very small business, and Zoho
CRM as representative of the best free CRM software.
86
• Top CRM Software (Capterra, 2017) The most popular are Salesforce, Zoho, Act!, Microsoft Dynamics, Hubspot, SAP, Maximizer,
Infusionsoft, Oracle, and Sage. The most affordable are Apptivo CRM, HubSpot CRM, Zoho CRM, InStream, ProsperWorks CRM, vtiger CRM, Nutshell, bpm'online CRM, amoCRM, and Really Simple Systems CRM. The most user-friendly are Teamgate, Less Annoying CRM, Close.io, Pipedrive, Base, Nimble, SalesforceIQ, HubSpot CRM, amoCRM, and ProsperWorks CRM.
• CRM Software (Borowski, 2017) The evaluated application are show according to rating, recommendation, reviews, or alphabetically.
Infusionsoft, ProsperWorks CRM, Salesforce.com, or Base are among the well-known applications. • Gartner’s 2017 Magic Quadrant for the CRM (Gartner, 2017)
The leaders are Salesforce, Pegasystems, Microsoft, Oracle, and Zendesk. From these analyses, it is visible that interest is oriented toward managing customer relationships,
sales forecasting and e-commerce, customer lifecycles, support analyses via business intelligence and KPIs, marketing solutions, time cards and calendar, links to external sources, automation and streamlining of realized processes, user-friendly interfaces, and free versions. One of the best CRM applications is Sugar CRM because it holds first place in many analyses in 2017. (The Top 10 Open Source CRM Systems) This application will be used for comparison with the generalized design solution recommended for CRM applications based on the realized comparison. 3. Used Method and Metrics for the Evaluation of Adopted Solutions
The used method and specification of needed metrics are selected with regard to the defined aim of the paper, which is to specify optimal items for contact management and leads that a CRM application must have to be an optimal IT product. There is not one unique solution and IT users may select from many available applications. This work uses the following method:
• Overview of available solutions. • Specification of selected metrics. • Monitoring of adopted items for contact management and leads in selected CRM
applications (Insightly CRM, NetSuite CRM, SalesForce CRM, and Zoho CRM). • Specification of an optimal solution for available items of contact management and leads. • Comparison of this designed solution with the best application such as Sugar CRM.
The first work is focused on the actual view of available software in the field of CRM. This overview is realized based on available information from the Internet, scientific journals and books. This information serves for monitoring actual options and possibilities that bring information technology into CRM. The required interest is also oriented on realized analyses and surveys that bring information about the best products from the CRM field. The used metrics bring along positive inspiration for optimal evaluation in these analyses and surveys. The next work is focused on the specification of metrics for evaluating CRM applications from the information technology development point of view. The reason is examining CRM applications from the view of information technology possibilities with the elimination of existing barriers in decision making for the development of CRM. These metrics were designed for:
• User-friendly interface. • Contact-management and lead-generation features. • Knowledge analytics with links to intelligences such as business. • Automation capabilities based on wizards and menus. • Remembering the best solution for use in others cases. • Security features based on a request to secure own data.
The assumption is that these metrics should respect every product that wishes to be the optimal CRM application for SMEs. The fulfillment of these metrics will be monitored via available items for contact management and leads in selected applications such as Insightly CRM (Insightly CRM, 2017), NetSuite CRM (NetSuite CRM, 2017), SalesForce CRM (SalesForce CRM, 2017) and Zoho. (Zoho CRM, 2017) The final part of the realized work is focused on specifying an optimal set of items for contact management and leads in CRM applications that such applications should have in order to be the optimal. There is also a place for comparison with one from the best CRM applications from the 2017 analyses. This application is Sugar CRM.
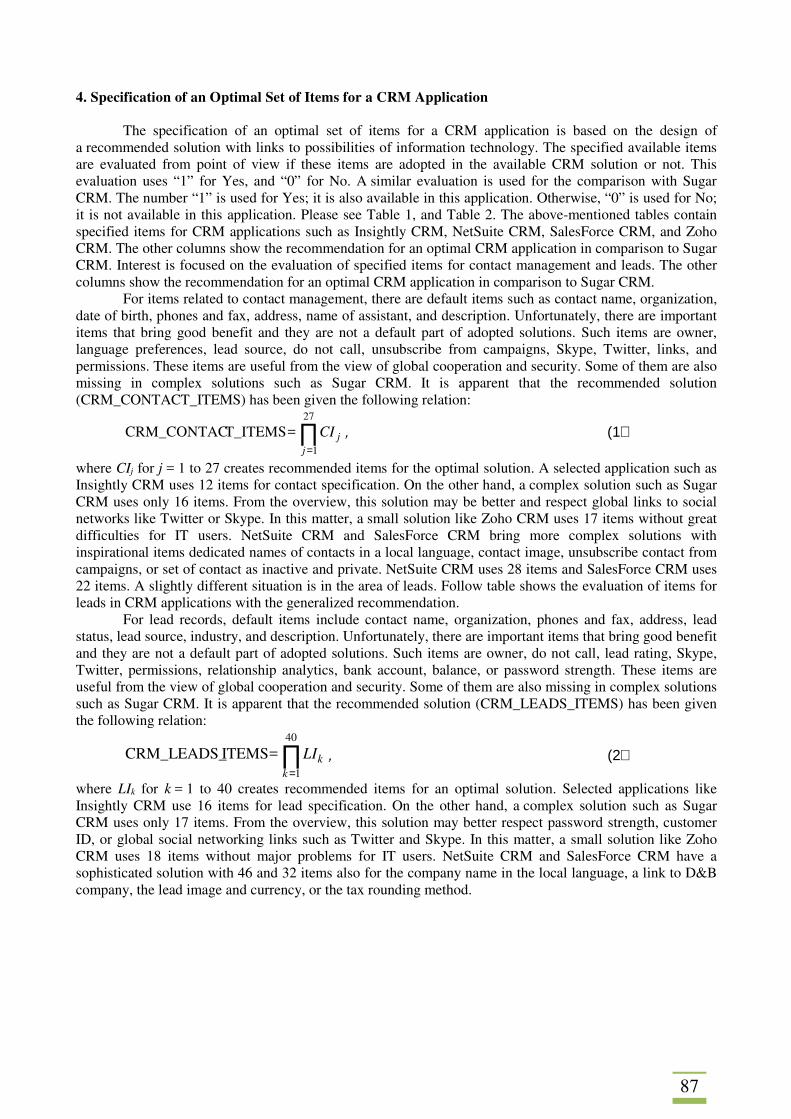
87
4. Specification of an Optimal Set of Items for a CRM Application
The specification of an optimal set of items for a CRM application is based on the design of a recommended solution with links to possibilities of information technology. The specified available items are evaluated from point of view if these items are adopted in the available CRM solution or not. This evaluation uses “1” for Yes, and “0” for No. A similar evaluation is used for the comparison with Sugar CRM. The number “1” is used for Yes; it is also available in this application. Otherwise, “0” is used for No; it is not available in this application. Please see Table 1, and Table 2. The above-mentioned tables contain specified items for CRM applications such as Insightly CRM, NetSuite CRM, SalesForce CRM, and Zoho CRM. The other columns show the recommendation for an optimal CRM application in comparison to Sugar CRM. Interest is focused on the evaluation of specified items for contact management and leads. The other columns show the recommendation for an optimal CRM application in comparison to Sugar CRM.
For items related to contact management, there are default items such as contact name, organization, date of birth, phones and fax, address, name of assistant, and description. Unfortunately, there are important items that bring good benefit and they are not a default part of adopted solutions. Such items are owner, language preferences, lead source, do not call, unsubscribe from campaigns, Skype, Twitter, links, and permissions. These items are useful from the view of global cooperation and security. Some of them are also missing in complex solutions such as Sugar CRM. It is apparent that the recommended solution (CRM_CONTACT_ITEMS) has been given the following relation:
∏=
27
1
T_ITEMSCRM_CONTACj
jCI= , (1)
where CIj for j = 1 to 27 creates recommended items for the optimal solution. A selected application such as Insightly CRM uses 12 items for contact specification. On the other hand, a complex solution such as Sugar CRM uses only 16 items. From the overview, this solution may be better and respect global links to social networks like Twitter or Skype. In this matter, a small solution like Zoho CRM uses 17 items without great difficulties for IT users. NetSuite CRM and SalesForce CRM bring more complex solutions with inspirational items dedicated names of contacts in a local language, contact image, unsubscribe contact from campaigns, or set of contact as inactive and private. NetSuite CRM uses 28 items and SalesForce CRM uses 22 items. A slightly different situation is in the area of leads. Follow table shows the evaluation of items for leads in CRM applications with the generalized recommendation.
For lead records, default items include contact name, organization, phones and fax, address, lead status, lead source, industry, and description. Unfortunately, there are important items that bring good benefit and they are not a default part of adopted solutions. Such items are owner, do not call, lead rating, Skype, Twitter, permissions, relationship analytics, bank account, balance, or password strength. These items are useful from the view of global cooperation and security. Some of them are also missing in complex solutions such as Sugar CRM. It is apparent that the recommended solution (CRM_LEADS_ITEMS) has been given the following relation:
∏=
40
1
ITEMSCRM_LEADS_k
kLI= , (2)
where LIk for k = 1 to 40 creates recommended items for an optimal solution. Selected applications like Insightly CRM use 16 items for lead specification. On the other hand, a complex solution such as Sugar CRM uses only 17 items. From the overview, this solution may better respect password strength, customer ID, or global social networking links such as Twitter and Skype. In this matter, a small solution like Zoho CRM uses 18 items without major problems for IT users. NetSuite CRM and SalesForce CRM have a sophisticated solution with 46 and 32 items also for the company name in the local language, a link to D&B company, the lead image and currency, or the tax rounding method.
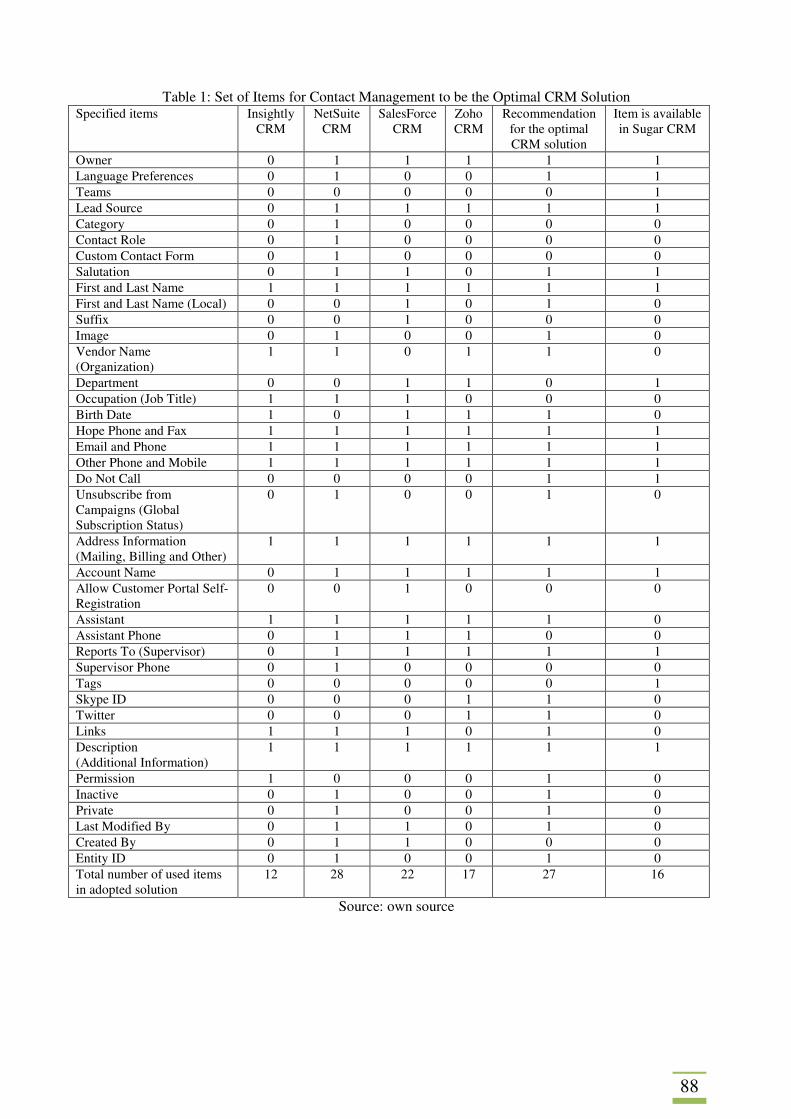
88
Table 1: Set of Items for Contact Management to be the Optimal CRM Solution Specified items Insightly
CRM NetSuite
CRM SalesForce
CRM Zoho CRM
Recommendation for the optimal CRM solution
Item is available in Sugar CRM
Owner 0 1 1 1 1 1 Language Preferences 0 1 0 0 1 1 Teams 0 0 0 0 0 1 Lead Source 0 1 1 1 1 1 Category 0 1 0 0 0 0 Contact Role 0 1 0 0 0 0 Custom Contact Form 0 1 0 0 0 0 Salutation 0 1 1 0 1 1 First and Last Name 1 1 1 1 1 1 First and Last Name (Local) 0 0 1 0 1 0 Suffix 0 0 1 0 0 0 Image 0 1 0 0 1 0 Vendor Name (Organization)
1 1 0 1 1 0
Department 0 0 1 1 0 1 Occupation (Job Title) 1 1 1 0 0 0 Birth Date 1 0 1 1 1 0 Hope Phone and Fax 1 1 1 1 1 1 Email and Phone 1 1 1 1 1 1 Other Phone and Mobile 1 1 1 1 1 1 Do Not Call 0 0 0 0 1 1 Unsubscribe from Campaigns (Global Subscription Status)
0 1 0 0 1 0
Address Information (Mailing, Billing and Other)
1 1 1 1 1 1
Account Name 0 1 1 1 1 1 Allow Customer Portal Self-Registration
0 0 1 0 0 0
Assistant 1 1 1 1 1 0 Assistant Phone 0 1 1 1 0 0 Reports To (Supervisor) 0 1 1 1 1 1 Supervisor Phone 0 1 0 0 0 0 Tags 0 0 0 0 0 1 Skype ID 0 0 0 1 1 0 Twitter 0 0 0 1 1 0 Links 1 1 1 0 1 0 Description (Additional Information)
1 1 1 1 1 1
Permission 1 0 0 0 1 0 Inactive 0 1 0 0 1 0 Private 0 1 0 0 1 0 Last Modified By 0 1 1 0 1 0 Created By 0 1 1 0 0 0 Entity ID 0 1 0 0 1 0 Total number of used items in adopted solution
12 28 22 17 27 16
Source: own source
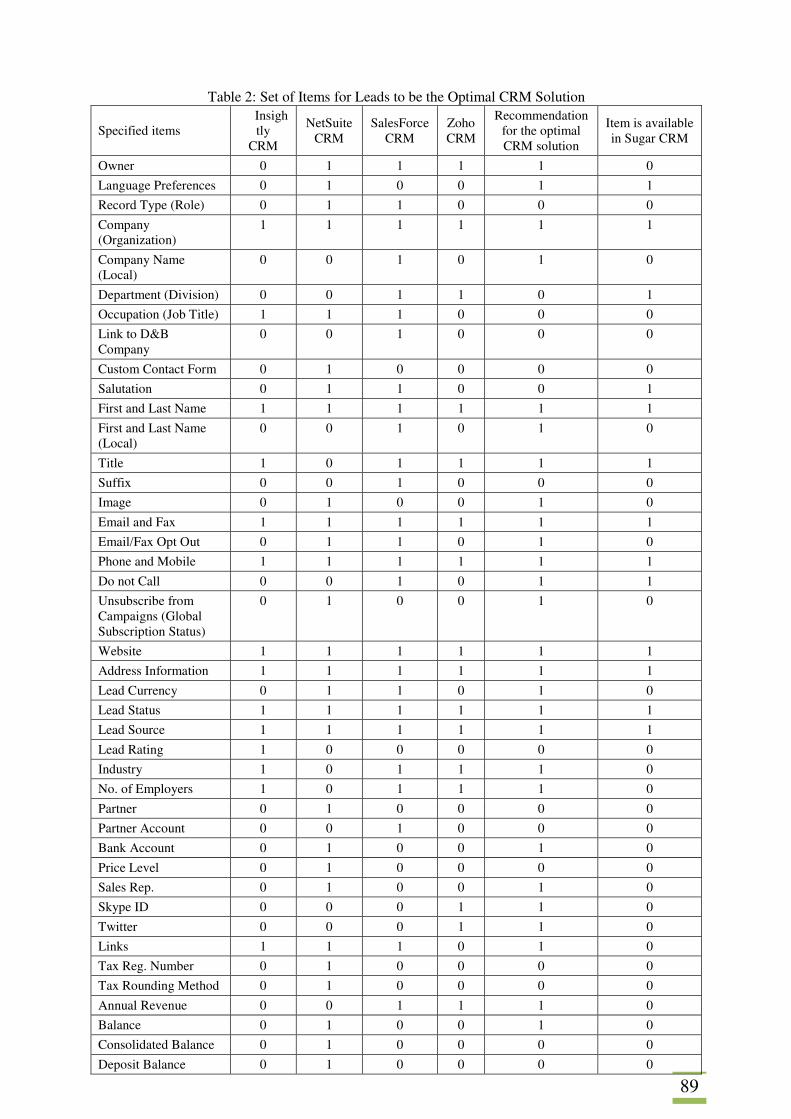
89
Table 2: Set of Items for Leads to be the Optimal CRM Solution
Specified items Insightly
CRM
NetSuite CRM
SalesForce CRM
Zoho CRM
Recommendation for the optimal CRM solution
Item is available in Sugar CRM
Owner 0 1 1 1 1 0
Language Preferences 0 1 0 0 1 1
Record Type (Role) 0 1 1 0 0 0
Company (Organization)
1 1 1 1 1 1
Company Name (Local)
0 0 1 0 1 0
Department (Division) 0 0 1 1 0 1
Occupation (Job Title) 1 1 1 0 0 0
Link to D&B Company
0 0 1 0 0 0
Custom Contact Form 0 1 0 0 0 0
Salutation 0 1 1 0 0 1
First and Last Name 1 1 1 1 1 1
First and Last Name (Local)
0 0 1 0 1 0
Title 1 0 1 1 1 1
Suffix 0 0 1 0 0 0
Image 0 1 0 0 1 0
Email and Fax 1 1 1 1 1 1
Email/Fax Opt Out 0 1 1 0 1 0
Phone and Mobile 1 1 1 1 1 1
Do not Call 0 0 1 0 1 1
Unsubscribe from Campaigns (Global Subscription Status)
0 1 0 0 1 0
Website 1 1 1 1 1 1
Address Information 1 1 1 1 1 1
Lead Currency 0 1 1 0 1 0
Lead Status 1 1 1 1 1 1
Lead Source 1 1 1 1 1 1
Lead Rating 1 0 0 0 0 0
Industry 1 0 1 1 1 0
No. of Employers 1 0 1 1 1 0
Partner 0 1 0 0 0 0
Partner Account 0 0 1 0 0 0
Bank Account 0 1 0 0 1 0
Price Level 0 1 0 0 0 0
Sales Rep. 0 1 0 0 1 0
Skype ID 0 0 0 1 1 0
Twitter 0 0 0 1 1 0
Links 1 1 1 0 1 0
Tax Reg. Number 0 1 0 0 0 0
Tax Rounding Method 0 1 0 0 0 0
Annual Revenue 0 0 1 1 1 0
Balance 0 1 0 0 1 0
Consolidated Balance 0 1 0 0 0 0
Deposit Balance 0 1 0 0 0 0
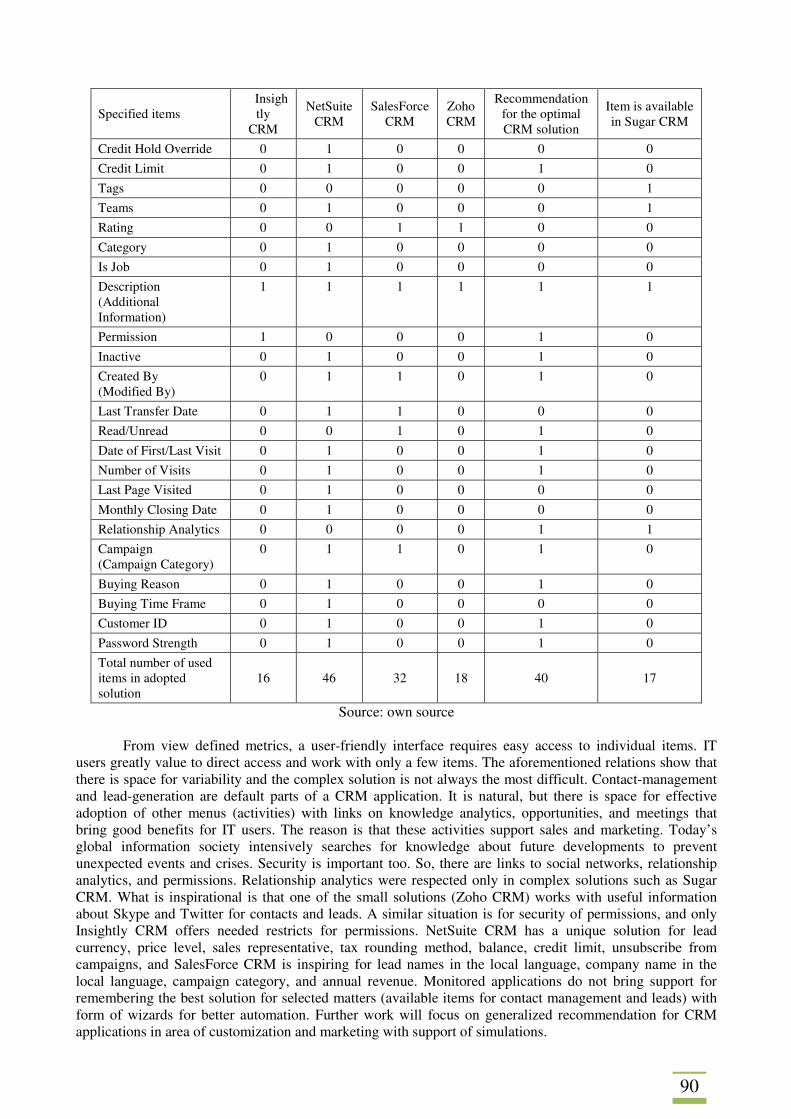
90
Specified items Insightly
CRM
NetSuite CRM
SalesForce CRM
Zoho CRM
Recommendation for the optimal CRM solution
Item is available in Sugar CRM
Credit Hold Override 0 1 0 0 0 0
Credit Limit 0 1 0 0 1 0
Tags 0 0 0 0 0 1
Teams 0 1 0 0 0 1
Rating 0 0 1 1 0 0
Category 0 1 0 0 0 0
Is Job 0 1 0 0 0 0
Description (Additional Information)
1 1 1 1 1 1
Permission 1 0 0 0 1 0
Inactive 0 1 0 0 1 0
Created By (Modified By)
0 1 1 0 1 0
Last Transfer Date 0 1 1 0 0 0
Read/Unread 0 0 1 0 1 0
Date of First/Last Visit 0 1 0 0 1 0
Number of Visits 0 1 0 0 1 0
Last Page Visited 0 1 0 0 0 0
Monthly Closing Date 0 1 0 0 0 0
Relationship Analytics 0 0 0 0 1 1
Campaign (Campaign Category)
0 1 1 0 1 0
Buying Reason 0 1 0 0 1 0
Buying Time Frame 0 1 0 0 0 0
Customer ID 0 1 0 0 1 0
Password Strength 0 1 0 0 1 0
Total number of used items in adopted solution
16 46 32 18 40 17
Source: own source From view defined metrics, a user-friendly interface requires easy access to individual items. IT
users greatly value to direct access and work with only a few items. The aforementioned relations show that there is space for variability and the complex solution is not always the most difficult. Contact-management and lead-generation are default parts of a CRM application. It is natural, but there is space for effective adoption of other menus (activities) with links on knowledge analytics, opportunities, and meetings that bring good benefits for IT users. The reason is that these activities support sales and marketing. Today’s global information society intensively searches for knowledge about future developments to prevent unexpected events and crises. Security is important too. So, there are links to social networks, relationship analytics, and permissions. Relationship analytics were respected only in complex solutions such as Sugar CRM. What is inspirational is that one of the small solutions (Zoho CRM) works with useful information about Skype and Twitter for contacts and leads. A similar situation is for security of permissions, and only Insightly CRM offers needed restricts for permissions. NetSuite CRM has a unique solution for lead currency, price level, sales representative, tax rounding method, balance, credit limit, unsubscribe from campaigns, and SalesForce CRM is inspiring for lead names in the local language, company name in the local language, campaign category, and annual revenue. Monitored applications do not bring support for remembering the best solution for selected matters (available items for contact management and leads) with form of wizards for better automation. Further work will focus on generalized recommendation for CRM applications in area of customization and marketing with support of simulations.
91
5. Conclusion
CRM applications are the focus of this paper. The volume of available software is amazing regardless of the number of barriers in implementation. In this paper, a specified optimal and generalized solution for CRM applications – in the area of available items that describe contacts and leads – is established. The realized work is based on a method that uses an overview of available solutions, specification of metrics with monitoring adopted items for Insightly CRM, NetSuite CRM, SalesForce CRM, and Zoho CRM. The designed optimal solution is compared with Sugar CRM as one of the best and complex CRM applications. This work shows that there is variability in adopted solutions. Some activities are default for CRM applications such as contact management and leads. It is the same for needed items. The unexpected result is that a complex solution is not always that complex. In the global information society, there is a lack of links to social networks and security. Sugar CRM brings benefits since there are implemented items such as do not call and relationship analytics. However, Zoho brings a unique inspiration that works with information from Skype ID and Twitter accounts for contact management and leads. NetSuite CRM and SalesForce CRM are more difficult solutions with an impact on accounting, balance, billing, and tax. Acknowledgement
The work presented in this paper has been supported by the SGS/19/2016. Special acknowledgement is for Insightly CRM, SalesForce CRM, Sugar CRM, and Zoho CRM for making the application available for testing. References AHMED, B., AMROUSH, F, BEN MAATI, M. L. (2016). The implementation Trends of Intelligence E-CRM in Business process. In Book Series: Colloquium in Information Science and Technology. ANGELES, S. (2017). Best CRM Software 2017. [online]. Available from: http://www.business newsdaily.com/7839-best-crm-software.html. BANDARU, S., GAUR, A., DEB, K., KHARE, V., CHOUGULE, R., BANDYOPADHYAY, P. (2015). Development, analysis and applications of a quantitative methodology for assessing customer satisfaction using evolutionary optimization. Applied Soft Computing, vol. 30, pp. 265-278. BOROWSKI, C. (2017). Software advice. [online]. Available from: http://www.software advice.com/crm/#buyers-guide. CAPTERRA (2017). Top CRM Software. [online]. Available from: http://www.capterra.com/customer-relationship-management-software/. GARDNER, B. K. (2016). ROI from CRM: It's about sales process, not just technology. USA: Gale Media. GARTNER’S 2017 MAGIC QUADRANT FOR THE CRM. (2017). [online]. Available from: https://www.zendesk.com/resources/gartner-magic-quadrant-crm/. GOLDENBERG, B. J. (2002). CRM Automation. USA: Prentice Hall. GHARAIBEH, N. K. (2015). Enhancing CRM Business Intelligence Applications by Web User Experience Model. International Journal of Advanced Computer Science and Applications, vol. 6, no. 7, pp. 1-6 HOLCOMB, G. (2015). CRM Book of Secrets: 16 Things You Need to Know. ASIN B014GJNMPU. INSIGHTLY CRM. (2017). [online]. Available from: https://www.insightly.com/. KIMLA, N. (2013) The Changing Role of CRM. Nikolaus Kimla. ASIN B00GCR6NEC. KOSTOJOHN, S. PAULEN, B. JOHNSON, M. (2011). CRM Fundamentals. USA: Apress.
92
LIST OF THE BEST MARKETING METRICS AND KPIS. (2016). The KPI Examples Review. NASIR, S. (2015). Customer Relationship Management Strategies in the Digital Era. USA: IGI-Global. NETSUITE CRM. (2017). [online]. Available from: http://www.netsuite.com/portal/products/crm.shtml. O'ROURKE, A. (2017). The insider’s guide to choosing the best sales CRM. Amazon Digital Services LLC. ASIN B06XSZY3QC. PENG, X. (2014). Design and Implementation of CRM System Based on AMS Cloud Platform. In Proceedings of the 5th International Conference on Intelligent Systems Design and Engineering Applications, Zhangjiajie, China, pp. 330-333. SALESFORCE CRM. (2017). [online]. Available from: https://www.salesforce.com/eu/. SLATER, G. (2012). How To Implement A CRM System for Maximum Profit. Slater Trading Pty Ltd. ASIN B00CAEDFOM. THE TOP 10 OPEN SOURCE CRM SYSTEMS. [online]. Available from: http://www.crmsearch.com/top-10-open-source-crm-systems.php. ZOHO CRM. (2017). [online]. Available from: https://www.zoho.eu/ .
93
EMPLOYEE EVALUATION – CASE STUDY USING EIGENVECTOR METHOD Zuzana Kiszová Silesian University in Opava School of Business Administration in Karviná, Department of Informatics and Mathematics Univerzitní nám. 1934/3 Karviná, 733 40 Czech Republic e-mail: [email protected] Abstract
The employee evaluation is one of the key activities of human resources management in organizations. The result of this process influences career, motivation and rewarding. Management by objectives, behaviorally anchored rating scales, comparative methods or assessment centre are methods used in employee evaluation in organizations. Some supplementary methods can be applied. The aim of this paper is to introduce employee evaluation, the analytic hierarchy process and the eigenvector method briefly and to apply this method in a case study. The case study demonstrates employee evaluation process in one medium-sized enterprise focused on high-tech. The usual way of determining results applied in the selected company is total sum of points. Modification of this procedure by eigenvector method is suggested in this paper. This modification takes different priorities of factors in consideration. Results gained by both methods are compared. Keywords: eigenvector method, employee evaluation, priorities JEL codes: C44, O15 1. Introduction
Human capital is significant source of competitive advantage. The employee evaluation is one of the key activities of human resources management in organizations. The result of this process influences career, motivation and rewarding. Numerous methods are described in science books and used in practical human resources management. These methods are more or less of mathematical character.
The analytic hierarchy process is multicriteria decision-making method. Its part – the eigenvector method – is used to derive unknown/undetermined priorities of factors or objects. This may be advantage in unclear situation especially.
The aim of this paper is to introduce employee evaluation, the analytic hierarchy process and the eigenvector method briefly and to apply this method in a case study.
Brief section about employee evaluation is presented. Explanation of analytic hierarchy process and its part – the eigenvector method – follows. Application of this multicriteria decision-making method is suggested to derive undetermined weights of significant factors in particular employee evaluation problem.
2. Employee Evaluation
Evaluation in context of the human resources management may be connected to the job or to the
employees. Armstrong (2006, p. 660) defines job evaluation as “a systematic process for defining the relative worth or size of jobs within an organization in order to establish internal relativities”. Hroník (2006) is concerned with employee evaluation which is understood as evaluation of their performance. Some studies of evaluation in HRM presented e.g. Turnley et al. (2003), Latham et al. (2005), Buchner (2007) or Gruman and Saks (2011). Case study focused on allocation of bonuses to employees solved on the basis of pairwise comparisons published e.g. Kalinovska and Trzaskalik (2014).
Methods applied for employee evaluation are management by objectives, behaviorally anchored rating scales, assessment centre, comparative methods or scale method. We focus on the last mentioned one.
In the scale method the employee behavior or performance is expressed by corresponding level of the scale. Two to ten levels are usual. In general, scales are composed of even or odd number of levels, which may be expressed verbally, numerically or graphically (Dvořáková, 2007). There is one disadvantage when using odd number of levels: such a scale contains one neutral level which enables to refrain from clear attitude.
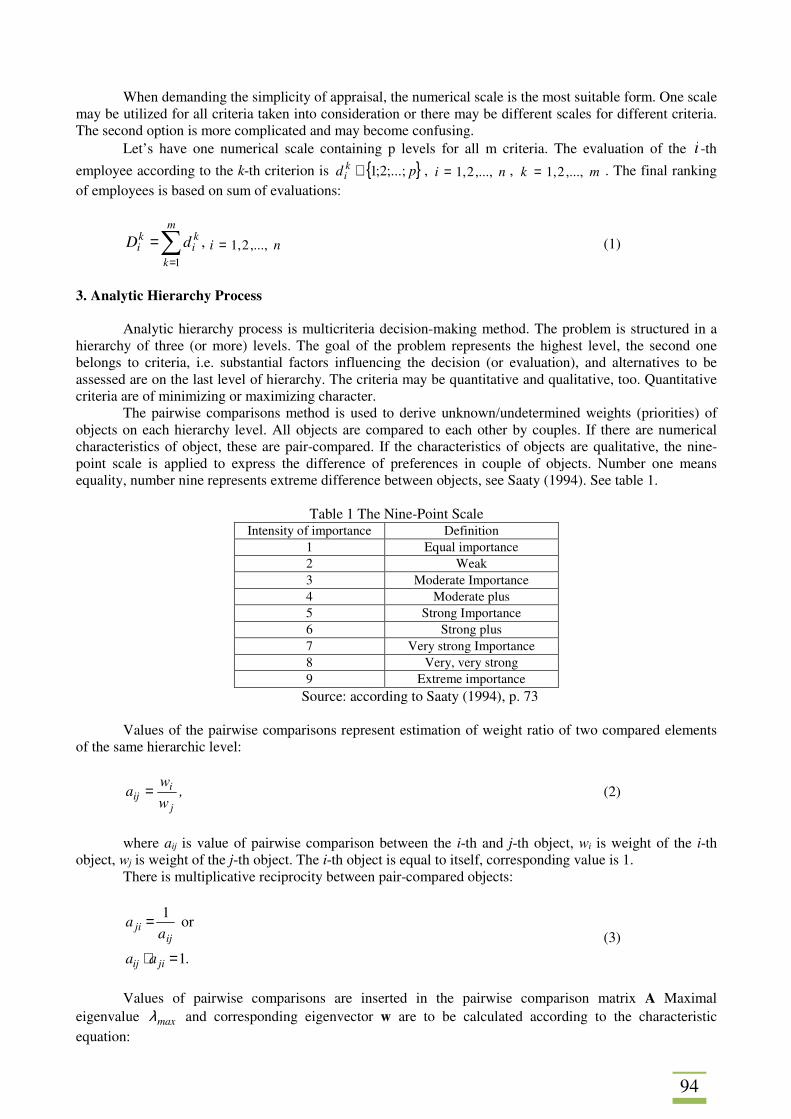
94
When demanding the simplicity of appraisal, the numerical scale is the most suitable form. One scale may be utilized for all criteria taken into consideration or there may be different scales for different criteria. The second option is more complicated and may become confusing.
Let’s have one numerical scale containing p levels for all m criteria. The evaluation of the i -th
employee according to the k-th criterion is { }pd ki ;...;2;1∈ , ni ,...,2,1= , mk ,...,2,1= . The final ranking
of employees is based on sum of evaluations:
,1∑
=
=m
k
ki
ki dD ni ,...,2,1= (1)
3. Analytic Hierarchy Process
Analytic hierarchy process is multicriteria decision-making method. The problem is structured in a
hierarchy of three (or more) levels. The goal of the problem represents the highest level, the second one belongs to criteria, i.e. substantial factors influencing the decision (or evaluation), and alternatives to be assessed are on the last level of hierarchy. The criteria may be quantitative and qualitative, too. Quantitative criteria are of minimizing or maximizing character.
The pairwise comparisons method is used to derive unknown/undetermined weights (priorities) of objects on each hierarchy level. All objects are compared to each other by couples. If there are numerical characteristics of object, these are pair-compared. If the characteristics of objects are qualitative, the nine-point scale is applied to express the difference of preferences in couple of objects. Number one means equality, number nine represents extreme difference between objects, see Saaty (1994). See table 1.
Table 1 The Nine-Point Scale
Intensity of importance Definition 1 Equal importance 2 Weak 3 Moderate Importance 4 Moderate plus 5 Strong Importance 6 Strong plus 7 Very strong Importance 8 Very, very strong 9 Extreme importance
Source: according to Saaty (1994), p. 73 Values of the pairwise comparisons represent estimation of weight ratio of two compared elements
of the same hierarchic level:
,w
wa
j
iij = (2)
where aij is value of pairwise comparison between the i-th and j-th object, wi is weight of the i-th
object, wj is weight of the j-th object. The i-th object is equal to itself, corresponding value is 1. There is multiplicative reciprocity between pair-compared objects:
.aa
aa
jiij
ijji
1
or 1
=⋅
= (3)
Values of pairwise comparisons are inserted in the pairwise comparison matrix A Maximal
eigenvalue maxλ and corresponding eigenvector w are to be calculated according to the characteristic equation:
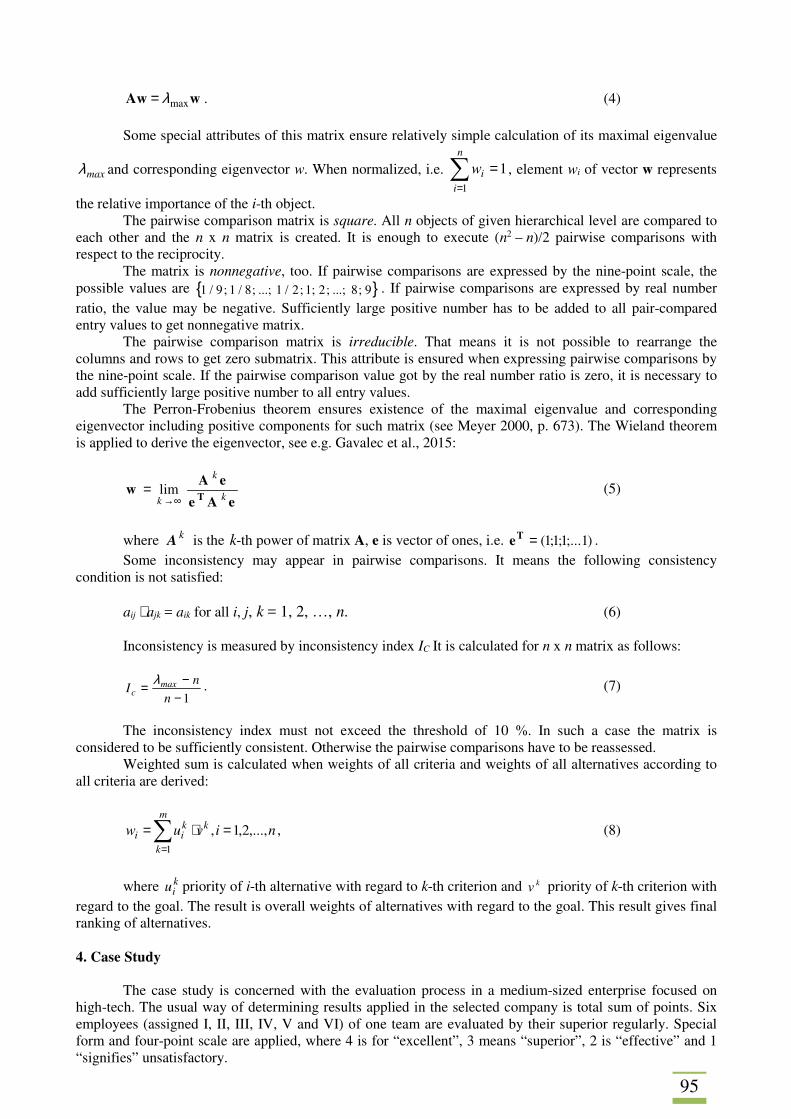
95
wAw maxλ= . (4) Some special attributes of this matrix ensure relatively simple calculation of its maximal eigenvalue
maxλ and corresponding eigenvector w. When normalized, i.e. ∑=
=n
iiw
1
1 , element wi of vector w represents
the relative importance of the i-th object. The pairwise comparison matrix is square. All n objects of given hierarchical level are compared to
each other and the n x n matrix is created. It is enough to execute (n2 – n)/2 pairwise comparisons with respect to the reciprocity.
The matrix is nonnegative, too. If pairwise comparisons are expressed by the nine-point scale, the possible values are { }9 ;8 ...; ;2 ;1 ;2/1 ...; ;8/1 ;9/1 . If pairwise comparisons are expressed by real number ratio, the value may be negative. Sufficiently large positive number has to be added to all pair-compared entry values to get nonnegative matrix.
The pairwise comparison matrix is irreducible. That means it is not possible to rearrange the columns and rows to get zero submatrix. This attribute is ensured when expressing pairwise comparisons by the nine-point scale. If the pairwise comparison value got by the real number ratio is zero, it is necessary to add sufficiently large positive number to all entry values.
The Perron-Frobenius theorem ensures existence of the maximal eigenvalue and corresponding eigenvector including positive components for such matrix (see Meyer 2000, p. 673). The Wieland theorem is applied to derive the eigenvector, see e.g. Gavalec et al., 2015:
eAe
eAw
T k
k
k →∞= lim (5)
where kA is the k-th power of matrix A, e is vector of ones, i.e. )1;...1;1;1(=Te .
Some inconsistency may appear in pairwise comparisons. It means the following consistency condition is not satisfied:
aij ⋅ ajk = aik for all i, j, k = 1, 2, …, n. (6) Inconsistency is measured by inconsistency index IC It is calculated for n x n matrix as follows:
1−−=
n
nI max
cλ . (7)
The inconsistency index must not exceed the threshold of 10 %. In such a case the matrix is
considered to be sufficiently consistent. Otherwise the pairwise comparisons have to be reassessed. Weighted sum is calculated when weights of all criteria and weights of all alternatives according to
all criteria are derived:
nivuwm
k
kkii ,...,2,1,
1
=⋅=∑=
, (8)
where kiu priority of i-th alternative with regard to k-th criterion and kv priority of k-th criterion with
regard to the goal. The result is overall weights of alternatives with regard to the goal. This result gives final ranking of alternatives.
4. Case Study
The case study is concerned with the evaluation process in a medium-sized enterprise focused on
high-tech. The usual way of determining results applied in the selected company is total sum of points. Six employees (assigned I, II, III, IV, V and VI) of one team are evaluated by their superior regularly. Special form and four-point scale are applied, where 4 is for “excellent”, 3 means “superior”, 2 is “effective” and 1 “signifies” unsatisfactory.
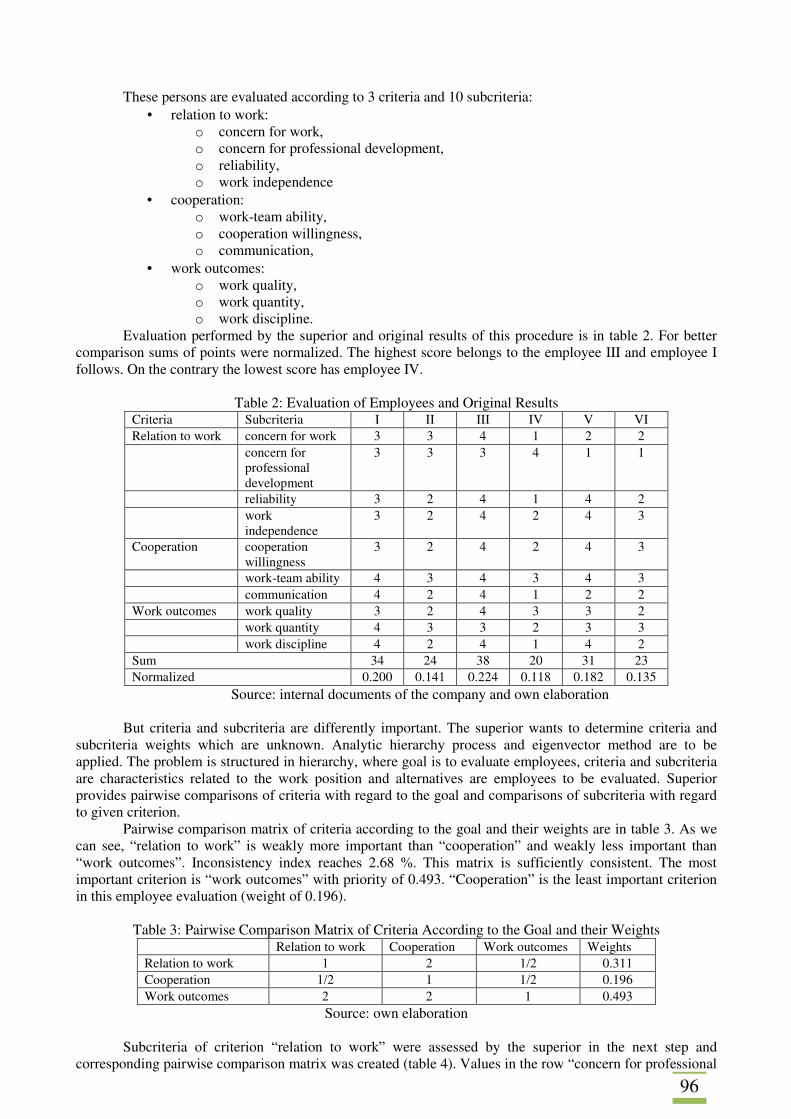
96
These persons are evaluated according to 3 criteria and 10 subcriteria: • relation to work:
o concern for work, o concern for professional development, o reliability, o work independence
• cooperation: o work-team ability, o cooperation willingness, o communication,
• work outcomes: o work quality, o work quantity, o work discipline.
Evaluation performed by the superior and original results of this procedure is in table 2. For better comparison sums of points were normalized. The highest score belongs to the employee III and employee I follows. On the contrary the lowest score has employee IV.
Table 2: Evaluation of Employees and Original Results
Criteria Subcriteria I II III IV V VI Relation to work concern for work 3 3 4 1 2 2 concern for
professional development
3 3 3 4 1 1
reliability 3 2 4 1 4 2 work
independence 3 2 4 2 4 3
Cooperation cooperation willingness
3 2 4 2 4 3
work-team ability 4 3 4 3 4 3 communication 4 2 4 1 2 2 Work outcomes work quality 3 2 4 3 3 2 work quantity 4 3 3 2 3 3 work discipline 4 2 4 1 4 2 Sum 34 24 38 20 31 23 Normalized 0.200 0.141 0.224 0.118 0.182 0.135
Source: internal documents of the company and own elaboration But criteria and subcriteria are differently important. The superior wants to determine criteria and
subcriteria weights which are unknown. Analytic hierarchy process and eigenvector method are to be applied. The problem is structured in hierarchy, where goal is to evaluate employees, criteria and subcriteria are characteristics related to the work position and alternatives are employees to be evaluated. Superior provides pairwise comparisons of criteria with regard to the goal and comparisons of subcriteria with regard to given criterion.
Pairwise comparison matrix of criteria according to the goal and their weights are in table 3. As we can see, “relation to work” is weakly more important than “cooperation” and weakly less important than “work outcomes”. Inconsistency index reaches 2.68 %. This matrix is sufficiently consistent. The most important criterion is “work outcomes” with priority of 0.493. “Cooperation” is the least important criterion in this employee evaluation (weight of 0.196).
Table 3: Pairwise Comparison Matrix of Criteria According to the Goal and their Weights
Relation to work Cooperation Work outcomes Weights Relation to work 1 2 1/2 0.311 Cooperation 1/2 1 1/2 0.196 Work outcomes 2 2 1 0.493
Source: own elaboration Subcriteria of criterion “relation to work” were assessed by the superior in the next step and
corresponding pairwise comparison matrix was created (table 4). Values in the row “concern for professional
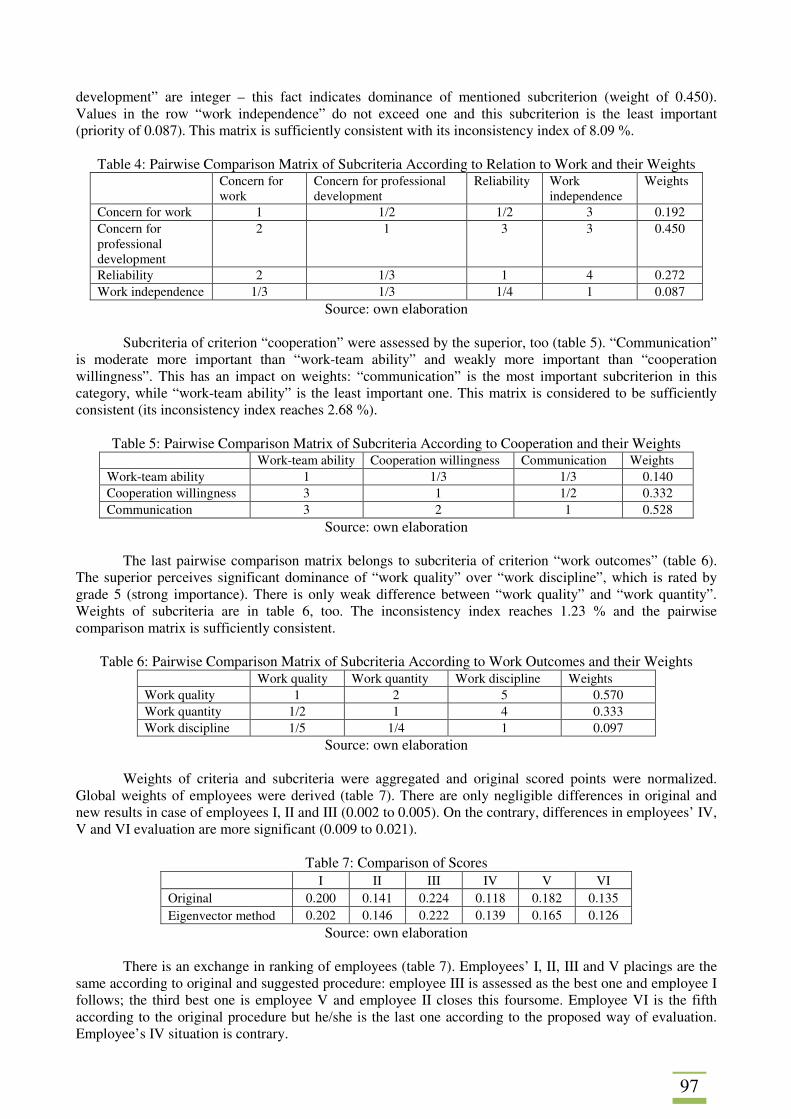
97
development” are integer – this fact indicates dominance of mentioned subcriterion (weight of 0.450). Values in the row “work independence” do not exceed one and this subcriterion is the least important (priority of 0.087). This matrix is sufficiently consistent with its inconsistency index of 8.09 %.
Table 4: Pairwise Comparison Matrix of Subcriteria According to Relation to Work and their Weights Concern for
work Concern for professional development
Reliability Work independence
Weights
Concern for work 1 1/2 1/2 3 0.192 Concern for professional development
2 1 3 3 0.450
Reliability 2 1/3 1 4 0.272 Work independence 1/3 1/3 1/4 1 0.087
Source: own elaboration Subcriteria of criterion “cooperation” were assessed by the superior, too (table 5). “Communication”
is moderate more important than “work-team ability” and weakly more important than “cooperation willingness”. This has an impact on weights: “communication” is the most important subcriterion in this category, while “work-team ability” is the least important one. This matrix is considered to be sufficiently consistent (its inconsistency index reaches 2.68 %).
Table 5: Pairwise Comparison Matrix of Subcriteria According to Cooperation and their Weights
Work-team ability Cooperation willingness Communication Weights Work-team ability 1 1/3 1/3 0.140 Cooperation willingness 3 1 1/2 0.332 Communication 3 2 1 0.528
Source: own elaboration
The last pairwise comparison matrix belongs to subcriteria of criterion “work outcomes” (table 6). The superior perceives significant dominance of “work quality” over “work discipline”, which is rated by grade 5 (strong importance). There is only weak difference between “work quality” and “work quantity”. Weights of subcriteria are in table 6, too. The inconsistency index reaches 1.23 % and the pairwise comparison matrix is sufficiently consistent.
Table 6: Pairwise Comparison Matrix of Subcriteria According to Work Outcomes and their Weights
Work quality Work quantity Work discipline Weights Work quality 1 2 5 0.570 Work quantity 1/2 1 4 0.333 Work discipline 1/5 1/4 1 0.097
Source: own elaboration Weights of criteria and subcriteria were aggregated and original scored points were normalized.
Global weights of employees were derived (table 7). There are only negligible differences in original and new results in case of employees I, II and III (0.002 to 0.005). On the contrary, differences in employees’ IV, V and VI evaluation are more significant (0.009 to 0.021).
Table 7: Comparison of Scores
I II III IV V VI
Original 0.200 0.141 0.224 0.118 0.182 0.135 Eigenvector method 0.202 0.146 0.222 0.139 0.165 0.126
Source: own elaboration There is an exchange in ranking of employees (table 7). Employees’ I, II, III and V placings are the
same according to original and suggested procedure: employee III is assessed as the best one and employee I follows; the third best one is employee V and employee II closes this foursome. Employee VI is the fifth according to the original procedure but he/she is the last one according to the proposed way of evaluation. Employee’s IV situation is contrary.
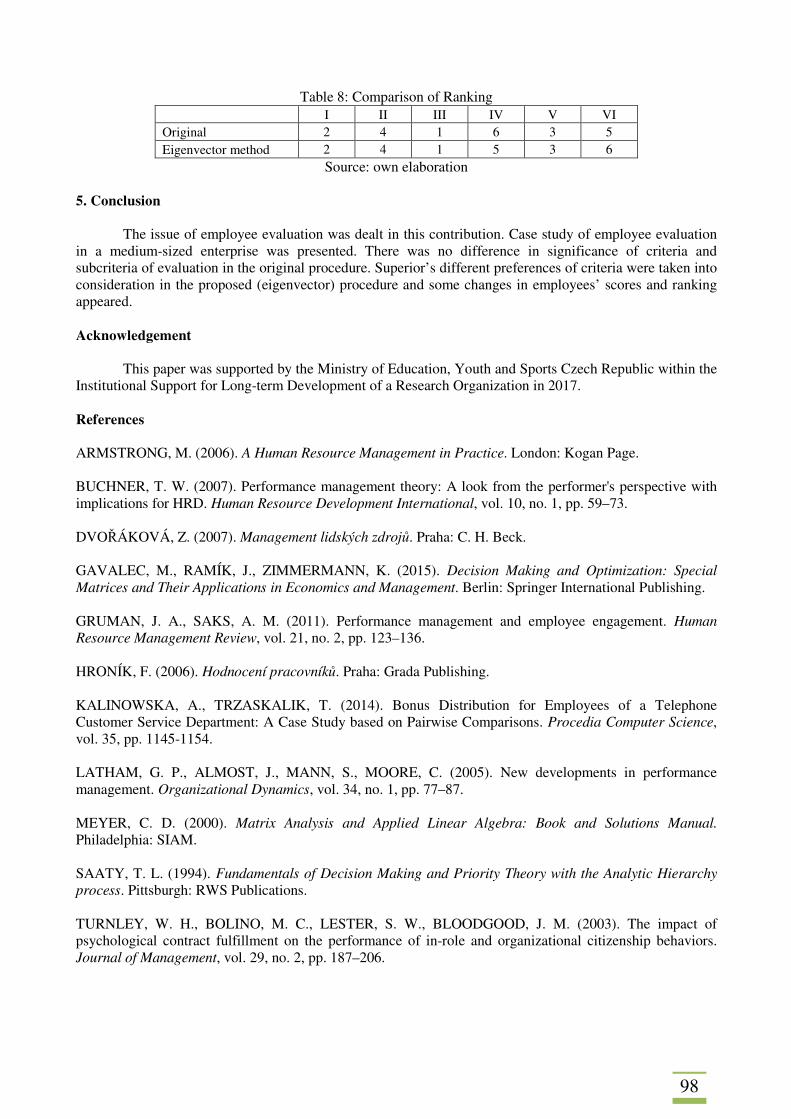
98
Table 8: Comparison of Ranking
I II III IV V VI
Original 2 4 1 6 3 5 Eigenvector method 2 4 1 5 3 6
Source: own elaboration
5. Conclusion The issue of employee evaluation was dealt in this contribution. Case study of employee evaluation
in a medium-sized enterprise was presented. There was no difference in significance of criteria and subcriteria of evaluation in the original procedure. Superior’s different preferences of criteria were taken into consideration in the proposed (eigenvector) procedure and some changes in employees’ scores and ranking appeared.
Acknowledgement
This paper was supported by the Ministry of Education, Youth and Sports Czech Republic within the
Institutional Support for Long-term Development of a Research Organization in 2017.
References ARMSTRONG, M. (2006). A Human Resource Management in Practice. London: Kogan Page. BUCHNER, T. W. (2007). Performance management theory: A look from the performer's perspective with implications for HRD. Human Resource Development International, vol. 10, no. 1, pp. 59–73. DVOŘÁKOVÁ, Z. (2007). Management lidských zdrojů. Praha: C. H. Beck. GAVALEC, M., RAMÍK, J., ZIMMERMANN, K. (2015). Decision Making and Optimization: Special Matrices and Their Applications in Economics and Management. Berlin: Springer International Publishing. GRUMAN, J. A., SAKS, A. M. (2011). Performance management and employee engagement. Human Resource Management Review, vol. 21, no. 2, pp. 123–136. HRONÍK, F. (2006). Hodnocení pracovníků. Praha: Grada Publishing. KALINOWSKA, A., TRZASKALIK, T. (2014). Bonus Distribution for Employees of a Telephone Customer Service Department: A Case Study based on Pairwise Comparisons. Procedia Computer Science, vol. 35, pp. 1145-1154. LATHAM, G. P., ALMOST, J., MANN, S., MOORE, C. (2005). New developments in performance management. Organizational Dynamics, vol. 34, no. 1, pp. 77–87. MEYER, C. D. (2000). Matrix Analysis and Applied Linear Algebra: Book and Solutions Manual. Philadelphia: SIAM. SAATY, T. L. (1994). Fundamentals of Decision Making and Priority Theory with the Analytic Hierarchy process. Pittsburgh: RWS Publications. TURNLEY, W. H., BOLINO, M. C., LESTER, S. W., BLOODGOOD, J. M. (2003). The impact of psychological contract fulfillment on the performance of in-role and organizational citizenship behaviors. Journal of Management, vol. 29, no. 2, pp. 187–206.
99
SOCIAL MEDIA MARKETING IN THE CZECH REPUBLIC: SYSTEMATIC LITERATURE REVIEW OF THE CURRENT ACADEMIC RESEARCH Martin Klepek Silesian University in Opava School of Business Administration in Karvina, Department of Business Economics and Management Univerzitní nám. 1934/3 733 40 Karviná Czech Republic Europe e-mail: [email protected] Abstract
Social media and social networks particularly receive substantial attention from companies in the Czech Republic. Since many of these companies are entering the social media landscape, the need for clear marketing management understanding rises steadily. However, the current state of knowledge about social media marketing is characterised by underdeveloped theories, knowledge gaps and many theoretical inconsistencies. There is only a few complex studies with a strong theoretical grounding in highly cited literature as well as the lack of studies build on contemporary business practices. This paper aims to highlight important articles in a body of academic literature affiliated to Czech universities on the topic of social media. Adopting a systematic approach to reviewing the literature, the paper combines different quantitative methods like content and frequency analysis to review papers published in major business and management journals as well as thematic conferences from 2006 to 2016. On the basis of these analyses, suggestions for future research that can help to promote future theory development are proposed. Moreover, this paper can provide relevant reading material for managers and executives looking for influential and impactful papers within the area of marketing. Keywords: Communication, Literature review, Marketing, Social media, Social networks JEL codes: M30, M31 1. Introduction
Given the growing adoption rates of social media and more specifically of social networking sites such as Facebook, Twitter or Instagram across the globe, practitioners and academics need to understand the role of social media in a small and medium business. Understanding the consumer-brand relationship building process and the differences in comparison with traditional communication schemes where the brand is a sender and the consumer is a passive receiver of the message is of utmost importance. Research should minimise risks connected with social media adoption in small and medium enterprises within the Czech Republic. The question is, are the academicians following pace with which the area of marketing is changing?
Defined by Moriarty et al. (2011, p. 405) "social media sites open up a new environment of conversation-based marketing communication, creating opportunities for entirely different forms of nearly instantaneous customer connections." The term social media marketing is commonly used in business practice. Within its range, we can include blogs, social networks and online communities as the tools to be utilised to build relationships with customers. This leads to demand for a new job position in marketing departments and completely new set of skills required from an employee or entrepreneur. Therefore, the academia should provide a set of skills and knowledge to students so they succeed in today’s dynamic business world.
The companies must know clearly the consumer’s attitudes and expectations towards this form of communication in order to communicate with them via social media. Firstly, the permission marketing approach has to be utilised since the consumers choose what they want to see, share, comment and like. Secondly, the media itself has established rules of communication to provide the best experience for its users. Therefore, the power shifted from a company to the consumers. In the context of technological development, the consumers also expect changes in the communication of brands (Killian and McManus, 2015). In this regard, the pace of research lags far behind the rapid pace of development of new technologies. Many new possible ways of interaction complicate an adaptation of social media and social networks into businesses practice (Yadav and Pavlou, 2014).
100
2. Social Media Research Need in Business and Management Field Pierce and Garven (1995) provided an explanation for pressure to publish research findings in
scholarly journals. Major sources are tenure and promotion process, which offers job security and enhance professional status. Furthermore, university collective publication record is an important element of obtaining or retaining accreditation (Hult et al., 1997). Specifically, in the new research area of social media where by default the academicians are all newcomers, it is important to act fast and develop outputs which enable academicians to establish new subjects or study programs devoted to these areas of interests. Guarantors relevant publications in the field are essential for the development of current curriculum for future marketers and other business administration graduates.
This paper aims to highlight important articles in a body of academic literature affiliated to Czech universities on the topic of social media. For academicians in the business and management field is vital to stay up to date with technology development and provide quality research for managers and entrepreneurs in small and medium-sized enterprises. Thus, the research question is: How efficiently are Czech marketing academicians following the shift in social media landscape? 3. Methods
To answer the research question, the systematic approach to reviewing the body of literature was chosen following Denyer and Tranfield (2011) five step process. This search strategy is described in the following text in greater detail. Systematic reviews, originating from medical sciences, differ from traditional narrative reviews by adopting a replicable, scientific and transparent process, in other words a detailed technology, that aims to minimize bias through exhaustive literature searches of published and unpublished studies and by providing an audit trail of the reviewer decisions, procedures and conclusions (Cook et al., 1997). For example, in the systematic review, the researcher is required to set prespecified relevance and quality criteria for the selection of studies and to make such criteria transparent to readers (Denyer and Tranfield, 2011). This paper is consistent with the recommendations for strengthening rigour of reviews in economic field by Tranfield et al. (2003) by using a quantitative approach to analyse a body of knowledge generated by authors affiliated to Czech universities and research institutions. Secondary quantitative data from databases were used to map the social media marketing landscape with emphasis on descriptive techniques and data interpretation.
3.1 Step 1: Review Question Formulation
The question guides the review by defining which studies will be included, what the search strategy
to identify the relevant primary studies should be, and which data need to be extracted from each study (Counsell, 1997). Since this review is serving the very narrow purpose the review question was formed by the author alone and not the group of stakeholders as Petticrew (2001) advised. Review questions are connected to the research question: How efficiently are Czech marketing academicians following the shift in social media landscape? By decomposition of the word efficiently, the four main areas are proposed to build the needed answer. Efficiency will be measured by following indicators typical for determining research quality. First is a number of publications and its trend, second is a number of citations, third is the average number of citations per paper and last but not least the structure of research design used in papers. Measures will be compared to other countries and interpreted in broader context.
Review question no. 1: Is there a growing number (positive trend) of publications from authors from Czech universities within the social media marketing area? Review question no. 2: Is there a reasonable amount of citations of these papers? Review question no. 3: Do we have a reasonable amount of average citations per paper? Review question no. 4: What is typical research design in studies conducted within the social media marketing area. These review questions provide a solid grounding for answering the main research question by a
description of current nature of the body of literature researched. 3.2 Step 2: Locating Studies
In conducting stage, research focused on the secondary data collection. For the collection, today's
two most prestigious databases were used. First one is the Web of Science and the second is Scopus. These databases are fundamental in the process of research quality evaluation at Czech universities hence we can
101
conclude that every marketing academician should produce research which will be indexed within journals or conferences in these particular databases. Since the paper aims to assess the meaningful impact of Czech academicians within the theme of social media marketing, only these two databases were taken into account.
The keyword social media was searched first without any limitations in Web of Science to ensure Tranfield et al. (2003) recommendation for cross-disciplinary perspectives and alternative ways in which a research topic has previously been tackled. Simple operator “_” was used between social and media to filter only relevant sources. Search was performed for “topic” which includes title, keywords and abstract within one search. The results were limited by the timespan from 2006 to 2016. With the first search 18 278 articles, conference proceedings, books, reviews, editorial material etc. in the whole database were found from various research areas. The most represented were Computer science (5 584), Engineering (2 158), Business Economics (2 001), Communication (1 723) and Educational research (1 260). 3.3 Step 3: Study Selection and Evaluation
Following the requirement for transparency of process, systematic reviews use a set of explicit
selection criteria to assess the relevance of each study found to see if it actually does address the review question (Denyer and Tranfield, 2 011). The author chooses to limit the review to the reviewed journal articles and conference papers only since these can be considered validated knowledge and are likely to have the highest impact in the field. Then the second criterium was to refine the results by research area. Business economics was chosen and 2 001 entries were found. It is 10.95% of all records with social media topic on Web of Science. Last filtering step was to pick only records affiliated to Czech universities. This procedure led to the identification of 38 papers which is 0.21% of all records. Selected studies were then amended with Scopus indexed papers and proceedings. The same procedure described was applied in the second databases. Since some of the papers were indexed in both databases, only 4 papers were added to the final sample. Finally, 42 abstracts of research articles and proceeding papers were manually reviewed and the connection to marketing topic of interest was assessed. The rule was to have at least two of following words present in the abstract, title or keyword: marketing, brand, image, communication, social network, Facebook, engagement. Surprisingly all of the reviewed papers had at least small connection to marketing topic and therefore were kept in the final sample. 3.4 Step 4: Analysis and Synthesis
In this stage of the review process, the collected data has to be analysed by breaking down individual
studies into constituent parts and describe how each relates to the other. The resulting body of evidence is explored, cross-tabulated and analysed and in quantitative synthesis, the reviewer might highlight both the regularities and discrepancies in the data (Denyer and Tranfield, 2011).
Data from 42 papers were extracted from databases to MS Excel. Variables included in data analysis were: database (WoS/Scopus), author(s), title, keywords, abstract, year of publication, type (proceedings/journal), source title, total citations, average citations per year, DOI/ISSN. To answer the last review question, author manually extended the dataset by reading abstracts and reviewed: type of study (questionnaire, experiment, focus group, case study, literature review, etc.), data sources (primary/secondary), data form (Quantitative/Qualitative/Qualitative + Quantitative).
3.5 Step 5: Reporting and Using the Results
Subsequently, a systematic review is structured in a similar manner to a report of empirical research. The introduction section provides a statement of the problem and the review questions. The methodology section provides precise details of how the review was conducted — the search strategy, the selection criteria, and the analysis and synthesis criteria. The findings and discussion section contain a summary of all the studies in terms of the data extracted from the studies such as the percentage of studies in the field that are philosophical/discursive/conceptual, literature reviews, surveys, case studies, evaluations, or experiments/quasi-experiments. The findings and discussion section also specify precisely what is known and unknown about the questions addressed in the review. The conclusion section provides a summary of the review, the limitations of the study, recommendations for policy and practice, and future research needs. (Denyer and Tranfield, 2011)
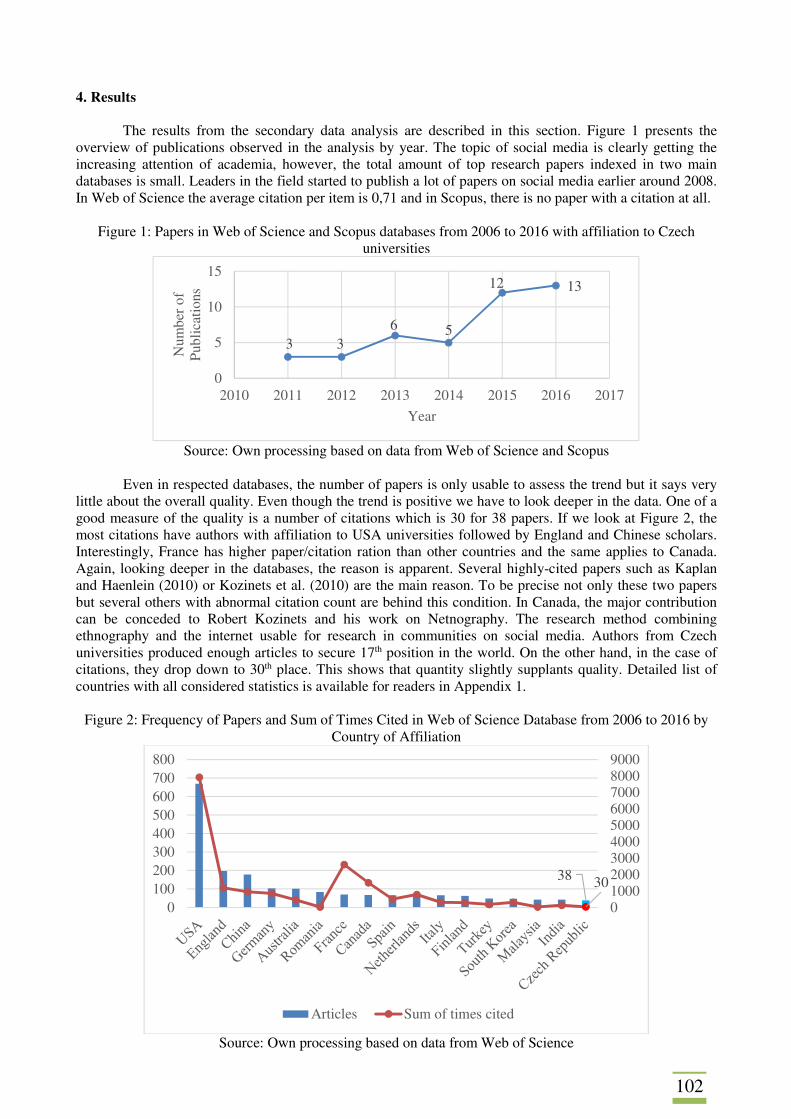
102
4. Results
The results from the secondary data analysis are described in this section. Figure 1 presents the overview of publications observed in the analysis by year. The topic of social media is clearly getting the increasing attention of academia, however, the total amount of top research papers indexed in two main databases is small. Leaders in the field started to publish a lot of papers on social media earlier around 2008. In Web of Science the average citation per item is 0,71 and in Scopus, there is no paper with a citation at all.
Figure 1: Papers in Web of Science and Scopus databases from 2006 to 2016 with affiliation to Czech
universities
Source: Own processing based on data from Web of Science and Scopus
Even in respected databases, the number of papers is only usable to assess the trend but it says very
little about the overall quality. Even though the trend is positive we have to look deeper in the data. One of a good measure of the quality is a number of citations which is 30 for 38 papers. If we look at Figure 2, the most citations have authors with affiliation to USA universities followed by England and Chinese scholars. Interestingly, France has higher paper/citation ration than other countries and the same applies to Canada. Again, looking deeper in the databases, the reason is apparent. Several highly-cited papers such as Kaplan and Haenlein (2010) or Kozinets et al. (2010) are the main reason. To be precise not only these two papers but several others with abnormal citation count are behind this condition. In Canada, the major contribution can be conceded to Robert Kozinets and his work on Netnography. The research method combining ethnography and the internet usable for research in communities on social media. Authors from Czech universities produced enough articles to secure 17th position in the world. On the other hand, in the case of citations, they drop down to 30th place. This shows that quantity slightly supplants quality. Detailed list of countries with all considered statistics is available for readers in Appendix 1.
Figure 2: Frequency of Papers and Sum of Times Cited in Web of Science Database from 2006 to 2016 by
Country of Affiliation
Source: Own processing based on data from Web of Science
3 36 5
12 13
0
5
10
15
2010 2011 2012 2013 2014 2015 2016 2017
Num
ber
of
Publ
icat
ions
Year
38 30
0100020003000400050006000700080009000
0100200300400500600700800
Articles Sum of times cited
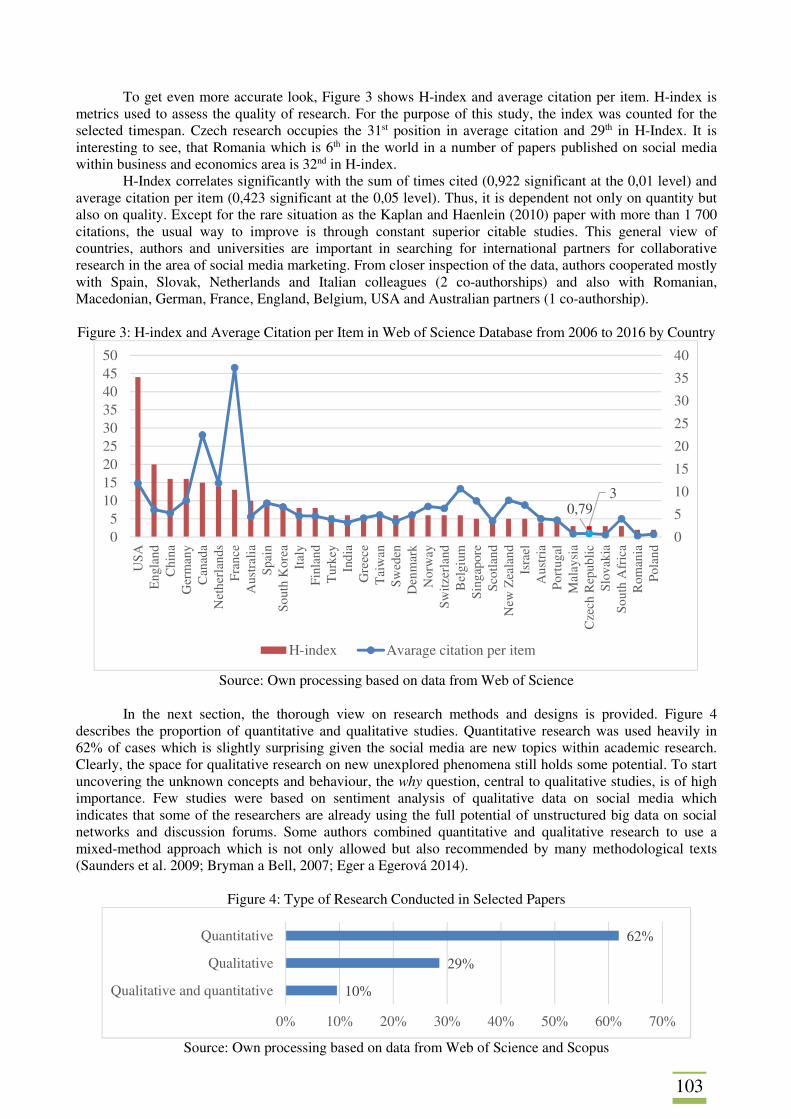
103
To get even more accurate look, Figure 3 shows H-index and average citation per item. H-index is metrics used to assess the quality of research. For the purpose of this study, the index was counted for the selected timespan. Czech research occupies the 31st position in average citation and 29th in H-Index. It is interesting to see, that Romania which is 6th in the world in a number of papers published on social media within business and economics area is 32nd in H-index.
H-Index correlates significantly with the sum of times cited (0,922 significant at the 0,01 level) and average citation per item (0,423 significant at the 0,05 level). Thus, it is dependent not only on quantity but also on quality. Except for the rare situation as the Kaplan and Haenlein (2010) paper with more than 1 700 citations, the usual way to improve is through constant superior citable studies. This general view of countries, authors and universities are important in searching for international partners for collaborative research in the area of social media marketing. From closer inspection of the data, authors cooperated mostly with Spain, Slovak, Netherlands and Italian colleagues (2 co-authorships) and also with Romanian, Macedonian, German, France, England, Belgium, USA and Australian partners (1 co-authorship).
Figure 3: H-index and Average Citation per Item in Web of Science Database from 2006 to 2016 by Country
Source: Own processing based on data from Web of Science
In the next section, the thorough view on research methods and designs is provided. Figure 4
describes the proportion of quantitative and qualitative studies. Quantitative research was used heavily in 62% of cases which is slightly surprising given the social media are new topics within academic research. Clearly, the space for qualitative research on new unexplored phenomena still holds some potential. To start uncovering the unknown concepts and behaviour, the why question, central to qualitative studies, is of high importance. Few studies were based on sentiment analysis of qualitative data on social media which indicates that some of the researchers are already using the full potential of unstructured big data on social networks and discussion forums. Some authors combined quantitative and qualitative research to use a mixed-method approach which is not only allowed but also recommended by many methodological texts (Saunders et al. 2009; Bryman a Bell, 2007; Eger a Egerová 2014).
Figure 4: Type of Research Conducted in Selected Papers
Source: Own processing based on data from Web of Science and Scopus
30,79
0
5
10
15
20
25
30
35
40
05
101520253035404550
USA
Eng
land
Chi
naG
erm
any
Can
ada
Net
herl
ands
Fran
ceA
ustr
alia
Spai
nSo
uth
Kor
eaIt
aly
Finl
and
Tur
key
Indi
aG
reec
eT
aiw
anSw
eden
Den
mar
kN
orw
aySw
itzer
land
Bel
gium
Sing
apor
eSc
otla
ndN
ew Z
eala
ndIs
rael
Aus
tria
Port
ugal
Mal
aysi
aC
zech
Rep
ublic
Slov
akia
Sout
h A
fric
aR
oman
iaPo
land
H-index Avarage citation per item
10%
29%
62%
0% 10% 20% 30% 40% 50% 60% 70%
Qualitative and quantitative
Qualitative
Quantitative
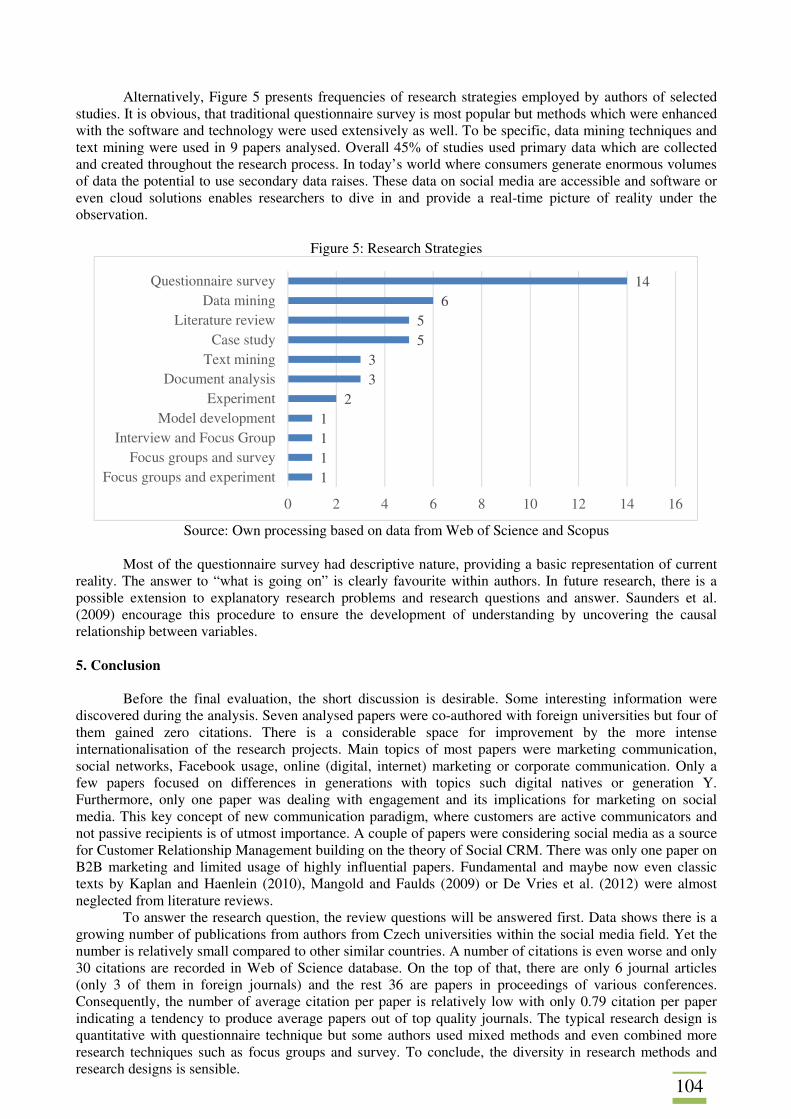
104
Alternatively, Figure 5 presents frequencies of research strategies employed by authors of selected studies. It is obvious, that traditional questionnaire survey is most popular but methods which were enhanced with the software and technology were used extensively as well. To be specific, data mining techniques and text mining were used in 9 papers analysed. Overall 45% of studies used primary data which are collected and created throughout the research process. In today’s world where consumers generate enormous volumes of data the potential to use secondary data raises. These data on social media are accessible and software or even cloud solutions enables researchers to dive in and provide a real-time picture of reality under the observation.
Figure 5: Research Strategies
Source: Own processing based on data from Web of Science and Scopus
Most of the questionnaire survey had descriptive nature, providing a basic representation of current
reality. The answer to “what is going on” is clearly favourite within authors. In future research, there is a possible extension to explanatory research problems and research questions and answer. Saunders et al. (2009) encourage this procedure to ensure the development of understanding by uncovering the causal relationship between variables.
5. Conclusion
Before the final evaluation, the short discussion is desirable. Some interesting information were discovered during the analysis. Seven analysed papers were co-authored with foreign universities but four of them gained zero citations. There is a considerable space for improvement by the more intense internationalisation of the research projects. Main topics of most papers were marketing communication, social networks, Facebook usage, online (digital, internet) marketing or corporate communication. Only a few papers focused on differences in generations with topics such digital natives or generation Y. Furthermore, only one paper was dealing with engagement and its implications for marketing on social media. This key concept of new communication paradigm, where customers are active communicators and not passive recipients is of utmost importance. A couple of papers were considering social media as a source for Customer Relationship Management building on the theory of Social CRM. There was only one paper on B2B marketing and limited usage of highly influential papers. Fundamental and maybe now even classic texts by Kaplan and Haenlein (2010), Mangold and Faulds (2009) or De Vries et al. (2012) were almost neglected from literature reviews.
To answer the research question, the review questions will be answered first. Data shows there is a growing number of publications from authors from Czech universities within the social media field. Yet the number is relatively small compared to other similar countries. A number of citations is even worse and only 30 citations are recorded in Web of Science database. On the top of that, there are only 6 journal articles (only 3 of them in foreign journals) and the rest 36 are papers in proceedings of various conferences. Consequently, the number of average citation per paper is relatively low with only 0.79 citation per paper indicating a tendency to produce average papers out of top quality journals. The typical research design is quantitative with questionnaire technique but some authors used mixed methods and even combined more research techniques such as focus groups and survey. To conclude, the diversity in research methods and research designs is sensible.
1111
233
55
614
0 2 4 6 8 10 12 14 16
Focus groups and experimentFocus groups and survey
Interview and Focus GroupModel development
ExperimentDocument analysis
Text miningCase study
Literature reviewData mining
Questionnaire survey
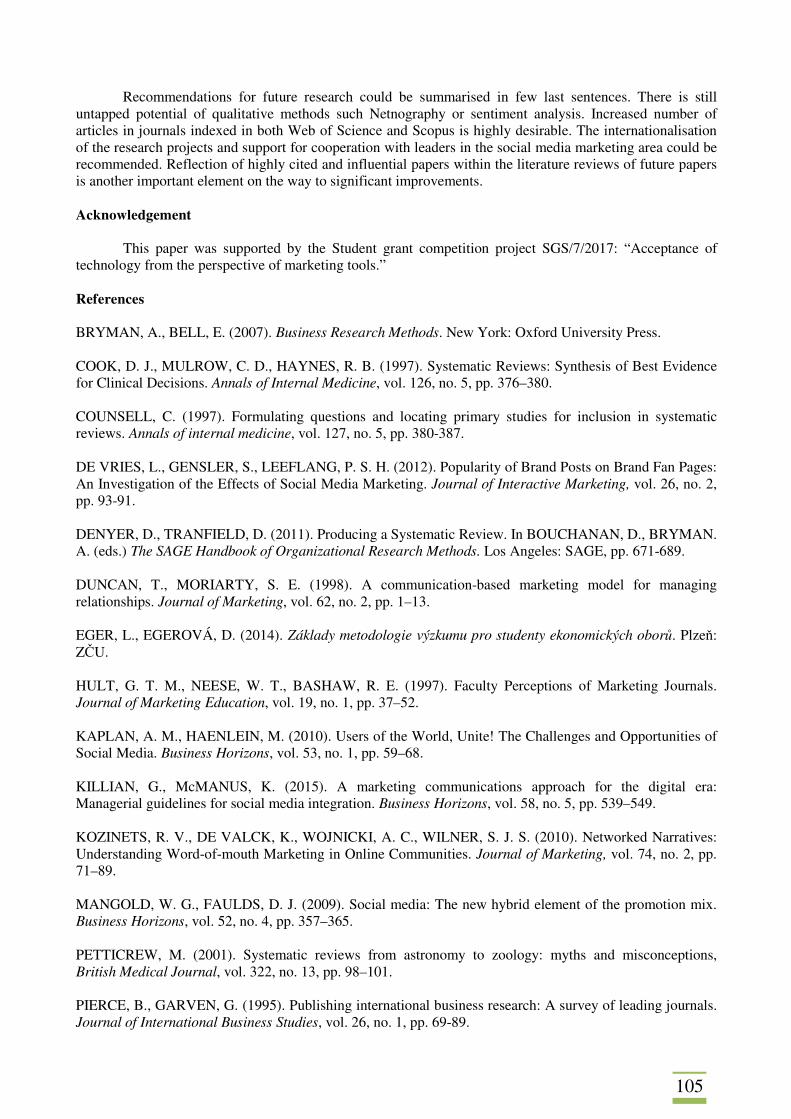
105
Recommendations for future research could be summarised in few last sentences. There is still untapped potential of qualitative methods such Netnography or sentiment analysis. Increased number of articles in journals indexed in both Web of Science and Scopus is highly desirable. The internationalisation of the research projects and support for cooperation with leaders in the social media marketing area could be recommended. Reflection of highly cited and influential papers within the literature reviews of future papers is another important element on the way to significant improvements. Acknowledgement
This paper was supported by the Student grant competition project SGS/7/2017: “Acceptance of technology from the perspective of marketing tools.” References BRYMAN, A., BELL, E. (2007). Business Research Methods. New York: Oxford University Press. COOK, D. J., MULROW, C. D., HAYNES, R. B. (1997). Systematic Reviews: Synthesis of Best Evidence for Clinical Decisions. Annals of Internal Medicine, vol. 126, no. 5, pp. 376–380. COUNSELL, C. (1997). Formulating questions and locating primary studies for inclusion in systematic reviews. Annals of internal medicine, vol. 127, no. 5, pp. 380-387. DE VRIES, L., GENSLER, S., LEEFLANG, P. S. H. (2012). Popularity of Brand Posts on Brand Fan Pages: An Investigation of the Effects of Social Media Marketing. Journal of Interactive Marketing, vol. 26, no. 2, pp. 93-91. DENYER, D., TRANFIELD, D. (2011). Producing a Systematic Review. In BOUCHANAN, D., BRYMAN. A. (eds.) The SAGE Handbook of Organizational Research Methods. Los Angeles: SAGE, pp. 671-689. DUNCAN, T., MORIARTY, S. E. (1998). A communication-based marketing model for managing relationships. Journal of Marketing, vol. 62, no. 2, pp. 1–13. EGER, L., EGEROVÁ, D. (2014). Základy metodologie výzkumu pro studenty ekonomických oborů. Plzeň: ZČU. HULT, G. T. M., NEESE, W. T., BASHAW, R. E. (1997). Faculty Perceptions of Marketing Journals. Journal of Marketing Education, vol. 19, no. 1, pp. 37–52. KAPLAN, A. M., HAENLEIN, M. (2010). Users of the World, Unite! The Challenges and Opportunities of Social Media. Business Horizons, vol. 53, no. 1, pp. 59–68. KILLIAN, G., McMANUS, K. (2015). A marketing communications approach for the digital era: Managerial guidelines for social media integration. Business Horizons, vol. 58, no. 5, pp. 539–549. KOZINETS, R. V., DE VALCK, K., WOJNICKI, A. C., WILNER, S. J. S. (2010). Networked Narratives: Understanding Word-of-mouth Marketing in Online Communities. Journal of Marketing, vol. 74, no. 2, pp. 71–89. MANGOLD, W. G., FAULDS, D. J. (2009). Social media: The new hybrid element of the promotion mix. Business Horizons, vol. 52, no. 4, pp. 357–365. PETTICREW, M. (2001). Systematic reviews from astronomy to zoology: myths and misconceptions, British Medical Journal, vol. 322, no. 13, pp. 98–101. PIERCE, B., GARVEN, G. (1995). Publishing international business research: A survey of leading journals. Journal of International Business Studies, vol. 26, no. 1, pp. 69-89.
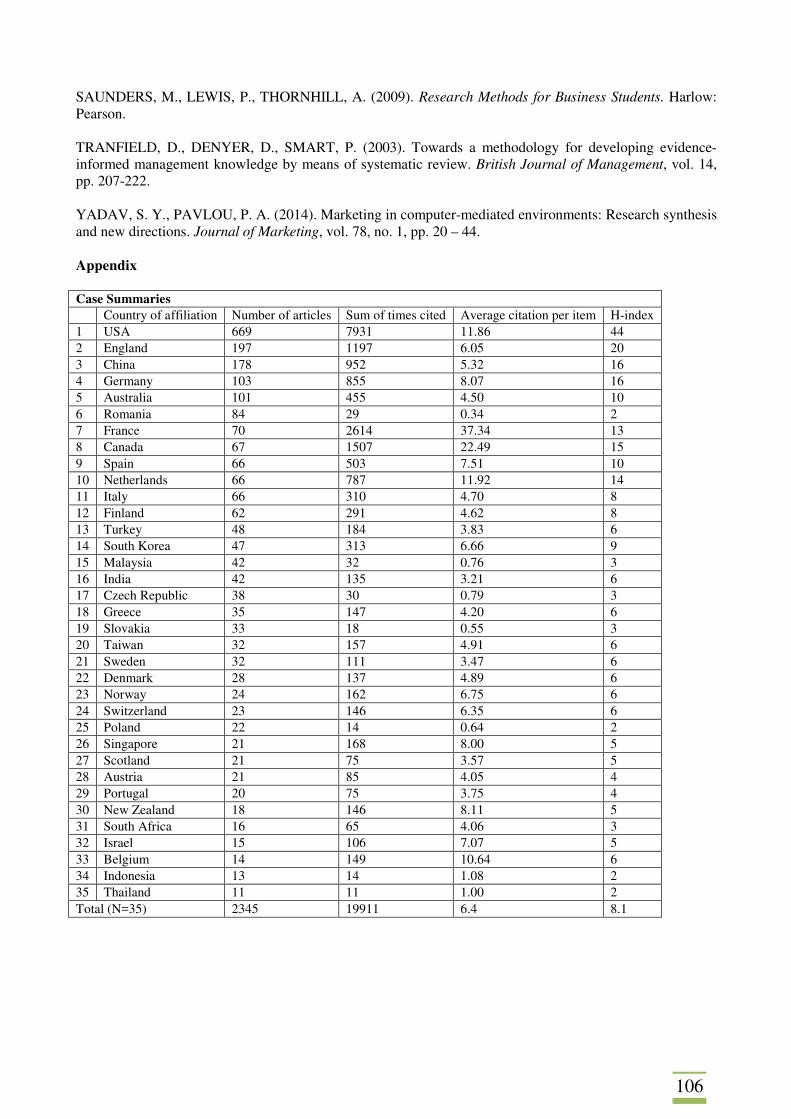
106
SAUNDERS, M., LEWIS, P., THORNHILL, A. (2009). Research Methods for Business Students. Harlow: Pearson. TRANFIELD, D., DENYER, D., SMART, P. (2003). Towards a methodology for developing evidence-informed management knowledge by means of systematic review. British Journal of Management, vol. 14, pp. 207-222. YADAV, S. Y., PAVLOU, P. A. (2014). Marketing in computer-mediated environments: Research synthesis and new directions. Journal of Marketing, vol. 78, no. 1, pp. 20 – 44. Appendix Case Summaries Country of affiliation Number of articles Sum of times cited Average citation per item H-index 1 USA 669 7931 11.86 44 2 England 197 1197 6.05 20 3 China 178 952 5.32 16 4 Germany 103 855 8.07 16 5 Australia 101 455 4.50 10 6 Romania 84 29 0.34 2 7 France 70 2614 37.34 13 8 Canada 67 1507 22.49 15 9 Spain 66 503 7.51 10 10 Netherlands 66 787 11.92 14 11 Italy 66 310 4.70 8 12 Finland 62 291 4.62 8 13 Turkey 48 184 3.83 6 14 South Korea 47 313 6.66 9 15 Malaysia 42 32 0.76 3 16 India 42 135 3.21 6 17 Czech Republic 38 30 0.79 3 18 Greece 35 147 4.20 6 19 Slovakia 33 18 0.55 3 20 Taiwan 32 157 4.91 6 21 Sweden 32 111 3.47 6 22 Denmark 28 137 4.89 6 23 Norway 24 162 6.75 6 24 Switzerland 23 146 6.35 6 25 Poland 22 14 0.64 2 26 Singapore 21 168 8.00 5 27 Scotland 21 75 3.57 5 28 Austria 21 85 4.05 4 29 Portugal 20 75 3.75 4 30 New Zealand 18 146 8.11 5 31 South Africa 16 65 4.06 3 32 Israel 15 106 7.07 5 33 Belgium 14 149 10.64 6 34 Indonesia 13 14 1.08 2 35 Thailand 11 11 1.00 2 Total (N=35) 2345 19911 6.4 8.1
107
DECISION PROCESS AND TOTAL VALUE ADDED TAX DUE OPTIMISATION IN SMALL AND MEDIUM SIZED ENTERPRISES Angelika Kútna Finančná správa Slovenskej republiky Finančné riaditeľstvo 949 01 Nitra Slovenská republika e-mail : [email protected] Norbert Gyurian Selye J. Univerzita, Ekonomická fakulta, katedra manažmentu Bratislavská cesta 3322 945 01 Komárno Slovenská republika e-mail : [email protected] Abstract Value added tax is the one of the mostly amended and problematic taxes from all types of direct and indirect taxes not only in the Slovak Republic but also in all Member States of European Union. VAT law is designed to bring greater flexibility for VAT payers. This flexibility is closely connected with the possibility of choosing an option from a list of legal alternatives that benefits the business the most. Questions regarding the total tax due optimization for a company have been and will be relevant part of decision process in majority of VAT payers enterprises. The paper focuses on the analysis of this type of decision process. The main aim of the paper is evaluation and quantification of the impact of value added tax on the factors which have significant influence on these decisions. Impact of the value added tax is quantified by financial expense interests. The research presented in paper confirms fact that potential SMEs management decision, which is the best variant of VAT return result, is mostly determined by probability of tax audit. Only 5% of SMEs management does not do decision concerning total VAT due optimization. Keywords: decision process, excess deduction, expense interest, small and medium-sized enterprises, value added tax, VAT JEL codes: H25 1. Introduction
The objective of this study is to examine the factors which have important influence on small and medium-sized enterprises (Hereinafter only „SMEs“) management decisions, concerning the financial tax law. In the concrete, decisions appertain choosing the tax period in which SMEs management, as the VAT tax payers, apply the right to deduct tax on goods and services according Slovak VAT Law - Act No. 222/2004 Coll. on Value Added Tax, as amended (hereinafter “VAT law”). The main aim of the paper is evaluation and quantification of the financial burden, as one of the basic factor of those decisions. The authors of study want to suggest discussion about tax optimization effectiveness, based on possibility to influence the VAT due or excess deduction amount for VAT tax payers. State and local government authorities (individual municipalities) financial activities executive requires law regulation of relationships between state, municipalities and all legal bodies as the membership of those financial relationships. It requires strong and clear definition of all right and duties for all their members. This is the main prediction of financial law. The means created by financial law, state and municipalities use for fulfilling their tasks as (Balko and Králik, 2005) have argued. The important role has tax policy of state. According to (Luttmer and Singhal, 2014) tax morale does indeed appear to be an important component of compliance decisions, and there is strong evidence that tax morale operates through a variety of underlying channels. The potential importance of tax morale in determining evasion suggests that policymakers may have access to a broader range of instruments to affect compliance than under a standard enforcement model. Simple nudges to taxpayers, such as presenting information in a more accessible form or providing payment reminders, can reduce tax evasion (for example, Del Carpio, 2014; Dwenger et al., 2014; Hallsworth et al., 2014). VAT has a different effect on businesses, increasing both their start-up and ongoing operating costs; this effect is stronger for small and medium-sized enterprises (SMEs) (Evans et al., 1996 ; Gunz et al., 1995). VAT
108
compliance activities consume a substantial amount of time for SMEs compared to other types of taxes, such as capital gains tax and income tax (Hansford and Hasseldine, 2013). Decision on the law is based the prediction of decision under the condition of certainty. Decision-making under conditions of risk should seek to identify, quantify, and absorb risk whenever possible. The majority of decision methods which are based on mathematical models are decision under certainty models. (Sedlák, 2001, p. 119-120). SMEs management decisions which are presented at this paper are not decision under certainty. Should be considerably improved (Hricová 2006), that management decision-making processes in economic reality are at majority decision-making processes under the risk. According to Veber (2009, p. 87) uncertainity can be consider as the state when the decision maker does not know all situation which can be possible and also he does not know the probabilities of each variant. Uncertainty is a state of having limited knowledge of current conditions or future outcomes. It is a major component of risk. SMEs managers often deal with uncertainty in their work; financial risk is included. To minimize the risk that their decisions will lead to undesired outcomes (longer period for excessive deduction payment connected with additional costs or tax audit), they try develop the skills and judgment necessary for reducing this uncertainty. Authors try to identify the appropriate risk category that may impact a SMEs manager decision to minimalize the risk of tax audit. At the paper will ascertain the costs incurred if a risky outcome were to happen. This can be mathematically daunting for many types of risk, especially financial risk. Uncertainty and risk is not the same thing. Whereas uncertainty deals with possible outcomes that are unknown, risk is a certain type of uncertainty that involves the real possibility of loss. Risks can be more comprehensively accounted for than uncertainty. As for the definition of decision-making process aims they can be expressed not only mathematically but also with verbal means (Fotr, 2010, p. 11). As Bojňanský (2008) claims the VAT is not only the base of the indirect taxation but also the most important part of all tax system at Slovak republic as well. Bojňanský, Krajčírová and Ferenczi-Vaňová (2013) and Baštincová (2009) have argued that value added tax as a classic representative of an indirect tax burdens has impact in the final result on the end-user. As pointed out by (Jarinkovičová 2005) tax optimization is a legal process of creation optimal variant of business, taxation of taxable incomes and using all legal possibilities to minimalize tax duties (not to pay less but even no more than is necessary according legal income tax and corporate tax law). SMEs management decision making process concerning the obligation to fulfil monthly VAT tax return and pay the tax due or to be entitled to an excessive deduction is a process of optimisation of the amount of excessive deduction to minimize the risk of tax audit, even though the total year amount of tax obligation is the same. The risk of tax audit is closely connected with the additional cost quantified through financial burden. The quantification of this influence through financial burden is also the part of our research. The right to deduct the tax on goods and services shall accrue to the taxpayer on the day when a tax liability in respect of these goods or services arises. The taxpayer may deduct tax on goods and services, which he used for another supplies of goods and services, it is strict condition according the VAT law (Bakeš at al., 2009). When taxpayer applies tax deduction a deductible tax shall be deducted from the total tax due.
The paper is organized as follows. First, the background of the VAT system in Slovak republic is presented, followed by the literature review and theoretical background of the study and the hypothesis development section. Next, the methods and findings are presented. Last, discussion and implications of the study are presented. 2. Decision Making Process in Small and Middle Companies According Financial VAT Law 2.1 Model and Data
2.1.1 Definition of the Decision Problem
According Act No. 222/2004 Coll. - Value Added Tax, as amended. (Hereinafter only “VAT Law“) the value added tax (Hereinafter only “VAT“) return shall be submitted within 25 days of the end of each tax period by each registered taxpayer. In this tax return, any person obliged to file a tax return shall state all the data necessary to calculate the total tax due and the total deductible tax, including the total value of goods and services attributable to the total tax and to the tax deduction, as well as the total value of goods and services exempt from the tax. The value of goods and services exempt from the tax shall be stated in a tax return for a tax period, in which the goods or service are supplied. The most important information for Slovak Financial Directorate is the total tax due amount or the total deductible tax amount. There are three
109
variants of tax return final result to state budget. Our research deals only with two most frequent variant tax due and excess deduction1.
Tax return final result is closely connected with follows: • A tax return shall be submitted within 25 days of the end of each tax period by each
taxpayer. The taxpayer shall be obliged to pay the tax charged within 25 days of the end of the tax period,
• If, during a tax period, a taxpayer becomes entitled to an excess deduction, he shall deduct this excess amount from the due tax in the next tax period. If the taxpayer cannot deduct excessive deduction from its own tax obligation in the following taxation period, the tax office shall return the non-deducted excessive deduction or its non-deducted part no later than 30 days after filing the tax return for the taxation period following the taxation period, in which the excessive deduction was created,
• If, within the time limit for refunding the excess deduction tax office initiates a tax audit, the tax office shall refund the excess deduction within ten days of the completion of the tax audit in the amount determined by the tax office no later than 10 days after completion of the tax audit.
The taxpayer shall execute a deduction of tax no sooner than in the taxation period, in which the right for tax deduction arises, and no later than in the last taxation period of the calendar year, in which the right for tax deduction arises, if he holds, up to the expiration. According this part of law the VAT taxpayer has a possibility to influence the final result of tax return. He can declare the total tax due instead of excess deduction, as the first variant of decision process. He can also reduce the amount of excess deduction amount (second variant). The third variant in this decision process is not optimizing the final result of tax return.
The most important factor which influences SMEs management decision is the tax audit risk. If, within the time limit for refunding the excess deduction tax office initiates a tax audit return the period for returning excessive deduction pro longed often more than one year. Monetization of time shifting period between days of VAT tax return submission to Financial Directorate by electronic means and between the validity day is considered in this study as the indicator “value of money”. This indicator represents the percentage of money which the taxpayer will have in case that he has them immediately after he becomes entitled to an excess deduction, and he lends them to the bank, having an interest for this financial operation. In addition, majority of companies borrow money from financial institutions and pay interest to them. From this point of view, we can consider the indicator “value of money” to be an indirect cost of company. Evaluating of results expressed by the indicators “value of money I” and “value of money II” should take into account also the following facts.
2.1.2 Data and Timing
The data were obtained from the tax and accounting evidence as follows: • The tax payers were registered as monthly VAT tax payers and corporate tax payers
(individual tax payers were excluded), • The SMEs – VAT tax audit has been performed 2011-2015, • Tax audit terminated on the end 2015 – it means the tax audit protocol was delivered ( in
the majority of cases), • The assessment proceedings had also finished on the end 2015 (it shall commence on the
date following after the delivery date of the protocol). As for timing, years 2011-2015 are analyzed in this study the standard mathematical and statistical
methods were used for analyzing and comparing of the partial indicators in the reporting period (arithmetic Average, base index) FINANCIAL BURDEN
The cause of this burden is time shifting period between the day of VAT tax return submission to the Financial Directorate by electronic means (this is the day of taxpayer`s entitlement to excessive deduction) and between the validity day (day, when the taxpayer receives payment to his bank account from the Financial directorate).
1 The third variant is the „zero variant“. This variant occurs if the taxpayer does not or ceased to, conduct an economic activity. In the frequent zero variant Financial Directorate (tax office) may cancel the VAT registration. Theoretically, if total tax due is equal to total deductible tax the result of tax return is also the zero variant.
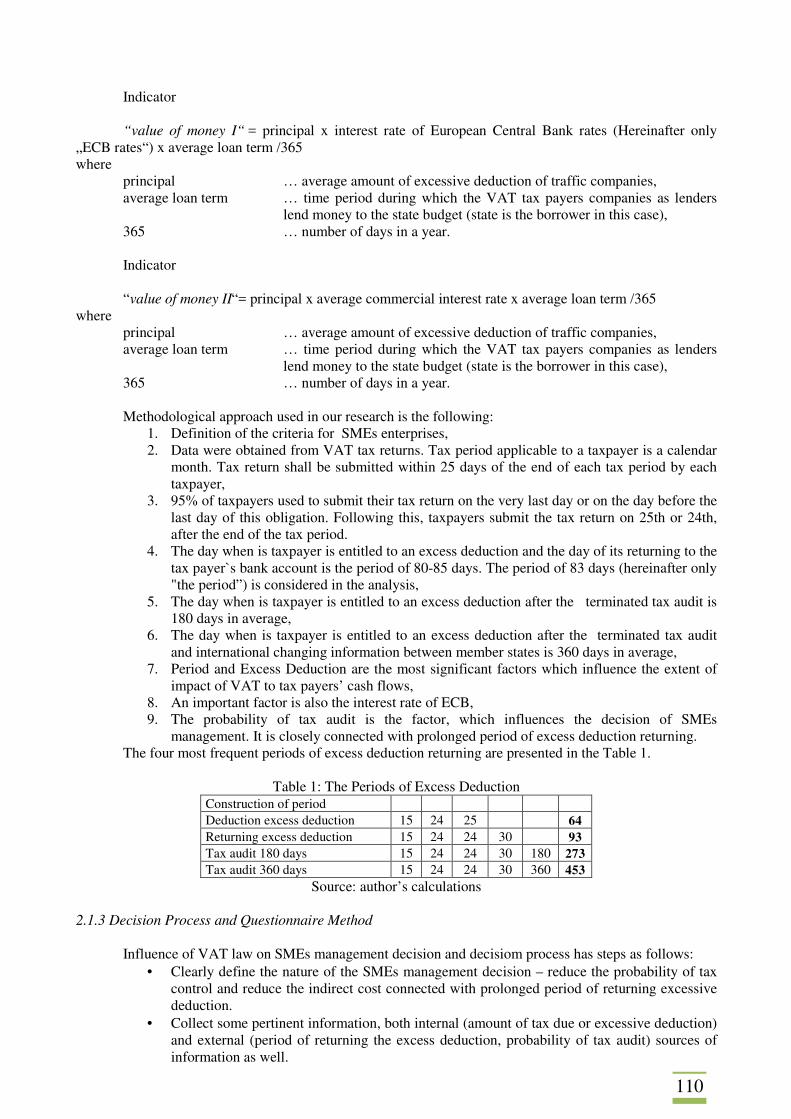
110
Indicator “value of money I“ = principal x interest rate of European Central Bank rates (Hereinafter only
„ECB rates“) x average loan term /365 where
principal … average amount of excessive deduction of traffic companies, average loan term … time period during which the VAT tax payers companies as lenders
lend money to the state budget (state is the borrower in this case), 365 … number of days in a year. Indicator “value of money II“= principal x average commercial interest rate x average loan term /365
where principal … average amount of excessive deduction of traffic companies, average loan term … time period during which the VAT tax payers companies as lenders
lend money to the state budget (state is the borrower in this case), 365 … number of days in a year. Methodological approach used in our research is the following:
1. Definition of the criteria for SMEs enterprises, 2. Data were obtained from VAT tax returns. Tax period applicable to a taxpayer is a calendar
month. Tax return shall be submitted within 25 days of the end of each tax period by each taxpayer,
3. 95% of taxpayers used to submit their tax return on the very last day or on the day before the last day of this obligation. Following this, taxpayers submit the tax return on 25th or 24th, after the end of the tax period.
4. The day when is taxpayer is entitled to an excess deduction and the day of its returning to the tax payer`s bank account is the period of 80-85 days. The period of 83 days (hereinafter only "the period”) is considered in the analysis,
5. The day when is taxpayer is entitled to an excess deduction after the terminated tax audit is 180 days in average,
6. The day when is taxpayer is entitled to an excess deduction after the terminated tax audit and international changing information between member states is 360 days in average,
7. Period and Excess Deduction are the most significant factors which influence the extent of impact of VAT to tax payers’ cash flows,
8. An important factor is also the interest rate of ECB, 9. The probability of tax audit is the factor, which influences the decision of SMEs
management. It is closely connected with prolonged period of excess deduction returning. The four most frequent periods of excess deduction returning are presented in the Table 1.
Table 1: The Periods of Excess Deduction
Construction of period Deduction excess deduction 15 24 25 64 Returning excess deduction 15 24 24 30 93 Tax audit 180 days 15 24 24 30 180 273 Tax audit 360 days 15 24 24 30 360 453
Source: author’s calculations
2.1.3 Decision Process and Questionnaire Method
Influence of VAT law on SMEs management decision and decisiom process has steps as follows: • Clearly define the nature of the SMEs management decision – reduce the probability of tax
control and reduce the indirect cost connected with prolonged period of returning excessive deduction.
• Collect some pertinent information, both internal (amount of tax due or excessive deduction) and external (period of returning the excess deduction, probability of tax audit) sources of information as well.
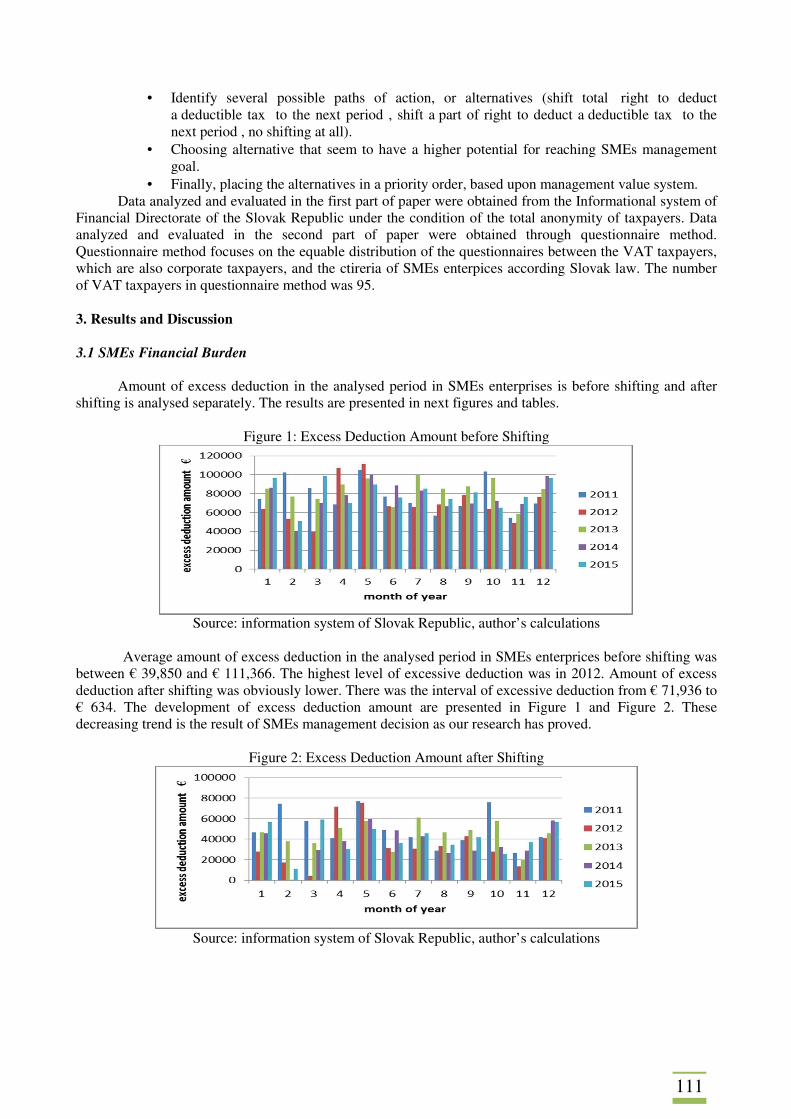
111
• Identify several possible paths of action, or alternatives (shift total right to deduct a deductible tax to the next period , shift a part of right to deduct a deductible tax to the next period , no shifting at all).
• Choosing alternative that seem to have a higher potential for reaching SMEs management goal.
• Finally, placing the alternatives in a priority order, based upon management value system. Data analyzed and evaluated in the first part of paper were obtained from the Informational system of
Financial Directorate of the Slovak Republic under the condition of the total anonymity of taxpayers. Data analyzed and evaluated in the second part of paper were obtained through questionnaire method. Questionnaire method focuses on the equable distribution of the questionnaires between the VAT taxpayers, which are also corporate taxpayers, and the ctireria of SMEs enterpices according Slovak law. The number of VAT taxpayers in questionnaire method was 95.
3. Results and Discussion 3.1 SMEs Financial Burden
Amount of excess deduction in the analysed period in SMEs enterprises is before shifting and after
shifting is analysed separately. The results are presented in next figures and tables.
Figure 1: Excess Deduction Amount before Shifting
Source: information system of Slovak Republic, author’s calculations
Average amount of excess deduction in the analysed period in SMEs enterprices before shifting was
between € 39,850 and € 111,366. The highest level of excessive deduction was in 2012. Amount of excess deduction after shifting was obviously lower. There was the interval of excessive deduction from € 71,936 to € 634. The development of excess deduction amount are presented in Figure 1 and Figure 2. These decreasing trend is the result of SMEs management decision as our research has proved.
Figure 2: Excess Deduction Amount after Shifting
Source: information system of Slovak Republic, author’s calculations
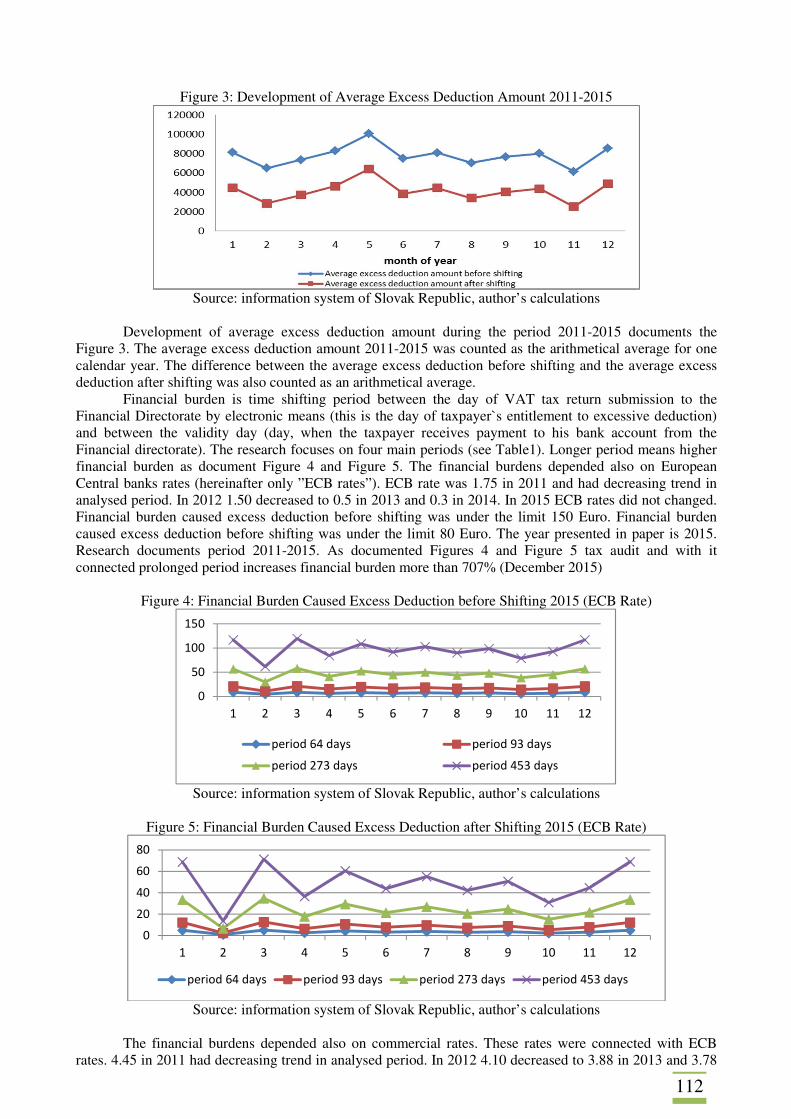
112
Figure 3: Development of Average Excess Deduction Amount 2011-2015
Source: information system of Slovak Republic, author’s calculations
Development of average excess deduction amount during the period 2011-2015 documents the
Figure 3. The average excess deduction amount 2011-2015 was counted as the arithmetical average for one calendar year. The difference between the average excess deduction before shifting and the average excess deduction after shifting was also counted as an arithmetical average.
Financial burden is time shifting period between the day of VAT tax return submission to the Financial Directorate by electronic means (this is the day of taxpayer`s entitlement to excessive deduction) and between the validity day (day, when the taxpayer receives payment to his bank account from the Financial directorate). The research focuses on four main periods (see Table1). Longer period means higher financial burden as document Figure 4 and Figure 5. The financial burdens depended also on European Central banks rates (hereinafter only ”ECB rates”). ECB rate was 1.75 in 2011 and had decreasing trend in analysed period. In 2012 1.50 decreased to 0.5 in 2013 and 0.3 in 2014. In 2015 ECB rates did not changed. Financial burden caused excess deduction before shifting was under the limit 150 Euro. Financial burden caused excess deduction before shifting was under the limit 80 Euro. The year presented in paper is 2015. Research documents period 2011-2015. As documented Figures 4 and Figure 5 tax audit and with it connected prolonged period increases financial burden more than 707% (December 2015)
Figure 4: Financial Burden Caused Excess Deduction before Shifting 2015 (ECB Rate)
Source: information system of Slovak Republic, author’s calculations
Figure 5: Financial Burden Caused Excess Deduction after Shifting 2015 (ECB Rate)
Source: information system of Slovak Republic, author’s calculations
The financial burdens depended also on commercial rates. These rates were connected with ECB
rates. 4.45 in 2011 had decreasing trend in analysed period. In 2012 4.10 decreased to 3.88 in 2013 and 3.78
0
50
100
150
1 2 3 4 5 6 7 8 9 10 11 12
period 64 days period 93 days
period 273 days period 453 days
0
20
40
60
80
1 2 3 4 5 6 7 8 9 10 11 12
period 64 days period 93 days period 273 days period 453 days
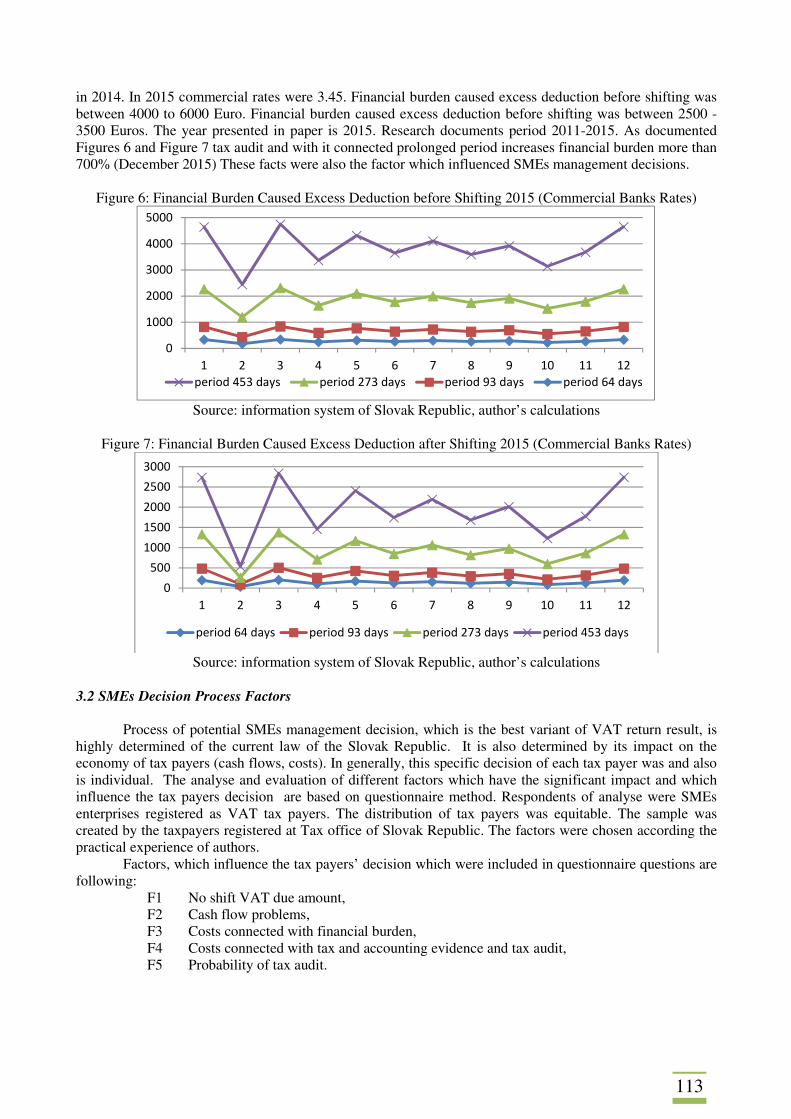
113
in 2014. In 2015 commercial rates were 3.45. Financial burden caused excess deduction before shifting was between 4000 to 6000 Euro. Financial burden caused excess deduction before shifting was between 2500 - 3500 Euros. The year presented in paper is 2015. Research documents period 2011-2015. As documented Figures 6 and Figure 7 tax audit and with it connected prolonged period increases financial burden more than 700% (December 2015) These facts were also the factor which influenced SMEs management decisions.
Figure 6: Financial Burden Caused Excess Deduction before Shifting 2015 (Commercial Banks Rates)
Source: information system of Slovak Republic, author’s calculations
Figure 7: Financial Burden Caused Excess Deduction after Shifting 2015 (Commercial Banks Rates)
Source: information system of Slovak Republic, author’s calculations
3.2 SMEs Decision Process Factors
Process of potential SMEs management decision, which is the best variant of VAT return result, is highly determined of the current law of the Slovak Republic. It is also determined by its impact on the economy of tax payers (cash flows, costs). In generally, this specific decision of each tax payer was and also is individual. The analyse and evaluation of different factors which have the significant impact and which influence the tax payers decision are based on questionnaire method. Respondents of analyse were SMEs enterprises registered as VAT tax payers. The distribution of tax payers was equitable. The sample was created by the taxpayers registered at Tax office of Slovak Republic. The factors were chosen according the practical experience of authors.
Factors, which influence the tax payers’ decision which were included in questionnaire questions are following:
F1 No shift VAT due amount, F2 Cash flow problems, F3 Costs connected with financial burden, F4 Costs connected with tax and accounting evidence and tax audit, F5 Probability of tax audit.
0
1000
2000
3000
4000
5000
1 2 3 4 5 6 7 8 9 10 11 12
period 453 days period 273 days period 93 days period 64 days
0
500
1000
1500
2000
2500
3000
1 2 3 4 5 6 7 8 9 10 11 12
period 64 days period 93 days period 273 days period 453 days
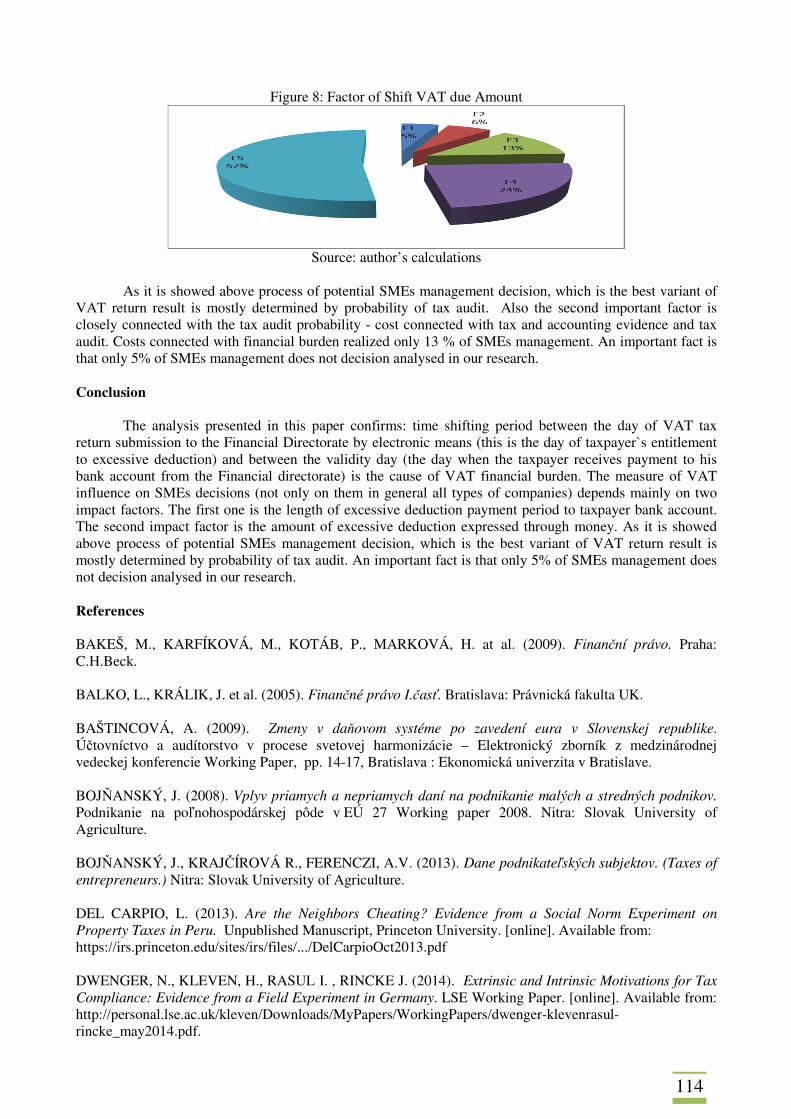
114
Figure 8: Factor of Shift VAT due Amount
Source: author’s calculations
As it is showed above process of potential SMEs management decision, which is the best variant of
VAT return result is mostly determined by probability of tax audit. Also the second important factor is closely connected with the tax audit probability - cost connected with tax and accounting evidence and tax audit. Costs connected with financial burden realized only 13 % of SMEs management. An important fact is that only 5% of SMEs management does not decision analysed in our research. Conclusion
The analysis presented in this paper confirms: time shifting period between the day of VAT tax return submission to the Financial Directorate by electronic means (this is the day of taxpayer`s entitlement to excessive deduction) and between the validity day (the day when the taxpayer receives payment to his bank account from the Financial directorate) is the cause of VAT financial burden. The measure of VAT influence on SMEs decisions (not only on them in general all types of companies) depends mainly on two impact factors. The first one is the length of excessive deduction payment period to taxpayer bank account. The second impact factor is the amount of excessive deduction expressed through money. As it is showed above process of potential SMEs management decision, which is the best variant of VAT return result is mostly determined by probability of tax audit. An important fact is that only 5% of SMEs management does not decision analysed in our research. References BAKEŠ, M., KARFÍKOVÁ, M., KOTÁB, P., MARKOVÁ, H. at al. (2009). Finanční právo. Praha: C.H.Beck. BALKO, L., KRÁLIK, J. et al. (2005). Finančné právo I.časť. Bratislava: Právnická fakulta UK. BAŠTINCOVÁ, A. (2009). Zmeny v daňovom systéme po zavedení eura v Slovenskej republike. Účtovníctvo a audítorstvo v procese svetovej harmonizácie – Elektronický zborník z medzinárodnej vedeckej konferencie Working Paper, pp. 14-17, Bratislava : Ekonomická univerzita v Bratislave. BOJŇANSKÝ, J. (2008). Vplyv priamych a nepriamych daní na podnikanie malých a stredných podnikov. Podnikanie na poľnohospodárskej pôde v EÚ 27 Working paper 2008. Nitra: Slovak University of Agriculture. BOJŇANSKÝ, J., KRAJČÍROVÁ R., FERENCZI, A.V. (2013). Dane podnikateľských subjektov. (Taxes of entrepreneurs.) Nitra: Slovak University of Agriculture. DEL CARPIO, L. (2013). Are the Neighbors Cheating? Evidence from a Social Norm Experiment on Property Taxes in Peru. Unpublished Manuscript, Princeton University. [online]. Available from: https://irs.princeton.edu/sites/irs/files/.../DelCarpioOct2013.pdf DWENGER, N., KLEVEN, H., RASUL I. , RINCKE J. (2014). Extrinsic and Intrinsic Motivations for Tax Compliance: Evidence from a Field Experiment in Germany. LSE Working Paper. [online]. Available from: http://personal.lse.ac.uk/kleven/Downloads/MyPapers/WorkingPapers/dwenger-klevenrasul-rincke_may2014.pdf.
115
EVANS C., RITCHIE, K., TRAN-NAM, B., WALPOLE, M. (1996). Report Into the Incremental Costs of Taxpayer Compliance, Canberra, Australia: Commonwealth Information Services. FOTR, J., ŠVECOVÁ, L., at al. (2010). Manažerské rozhodování – Postupy, metody a nástroje. Praha: Ekopress. GUNZ, S., MACNAUGHTON, A., WENSLEY, K. (1995). Measuring the compliance cost of tax expenditures: the case of research and development incentives. Canadian Tax Journal, vol. 43 no.6 pp. 2008–2034. HALLSWORTH M., LIST, J.A., METCALFE, R. D., VLAEV, I. (2014). The Behavioralist As Tax Collector: Using Natural Field Experiments to Enhance Tax Compliance. Journal of Public economic, vol. 148, pp. 13-41. HANSFORD A., HASSELDINE, J., HOWORTH, C., (2003). Factors affecting the costs of UK VAT compliance for small and medium-sized enterprises, Enviroment and planning C journal , vol. 21 no.4, pp. 479–492. HEINMANN, F., OVERESCH,M., RINCKE, J. (2010). Rate-cutting ax Reforms and Corporate Tax Competition in Europe. Economics & Politics, vol. 22, no. 3, pp. 498-518. HRICOVÁ, R. (2006). Metódy manažérskeho rozhodovania . Prešov: FVT TU Košice. JARINKOVIČOVÁ, V. (2005). Daňová optimalizácia – fyzické osoby. Daňový a účtovný poradca podnikateľa, vol.15, pp. 4-27. JARINKOVIČOVÁ, V. (2009). Zmeny v zákone o dani z príjmov. Daňový a účtovný poradca podnikateľa, vol. 4-5, pp. 13-32. KRAJČÍROVÁ, R., FERENCZI, A.V. (2014). Implementation of EU merger directive into the Slovak legislation and certain selected types of restructuring of business in the Slovak Republic. EU agrarian Law, vol. 3, no 1, pp. 37-41. KRAJČÍROVÁ R., FERENCZI, A.V. (2014). Merge control transactions and implementation of merger regulation and EU merger directive into the Slovak legislation. ICABR Working Paper, 2014. Brno. LUTTMER, E. F. P., SINGHAL, M. (2014). Tax Morale. Journal of Economic Perspectives, American Economic Association, vol. 28, no 4, pp. 149-68. VEBER, J. at al. (2009). Management – Základy moderní manažerské přístupy výkonnost a prosperita. Praha: Management Press. GUNZ, S., MACNAUGHTON, A., WENSLEY, K. (1995). Measuring the compliance cost of tax expenditures: the case of research and development incentives. Canadian Tax Journal, vol. 43, no.6, pp. 2008–2034.
116
PROSPECTS FOR INCREASING INTERNATIONAL TRADE VOLUMES OF MICRO AND SMALL ENTERPRISES IN SELECTED SECTORS IN POLAND Teresa Łuczka, Joanna Małecka Poznań University of Technology Faculty of Management Engineering ul. Strzelecka 11 60-965 Poznań Poland e-mail: [email protected], [email protected] Abstract By securing free access to resources, goods, services and technologies, international trade becomes a key driver for the growth of national economies. Upon moving into international markets, small and medium-sized enterprises, including micro and small businesses, encounter barriers that go beyond the hindrances typically faced by larger companies. Other than financial factors, the key barriers to the internationalization of enterprises of the size in question are considered to be regulatory and social. The aim of this paper is a presentation of selected prospects for increasing international trade volume of micro and small firm in chosen sectors in Poland The surveyed close to 7,000 micro and small enterprises owned by existing and prospective entrepreneurs. In their studies, they looked into the enterprises’ active involvement in exports and their investments, particularly in innovation intended to promote exports. A number of selected methods were also identified for boosting the competitiveness of micro and small enterprises having specific profiles and operating in specific sectors. Keywords: entrepreneurship, exports, internationalization,SMEs JEL codes: F13, F43, L11, L26 1. Introduction
Small and medium-sized enterprises play a major role in today’s market economies, as evidenced by their impact on macroeconomic performance. SMEs account for 99.8% of total enterprises and employ close to 75% of the overall workforce in the entrepreneurial sector. A substantial part of that sector are micro and small enterprises. Despite their indisputable significance for the economy, micro and small enterprises run against multiple barriers to growth, the most predominant of which are limited access to capital, low creditworthiness ratings (which limit their access to third-party capital and particularly to bank loans), exposure to fierce competitive pressures and, finally, difficulties with building competitive advantages, formulating company strategies, expanding to new markets and entering markets of successive orders of magnitude. This final barrier may prove particularly daunting for small and micro enterprises. Involvement in international markets requires skills for dealing with specific challenges and ultimately constitutes a test of the ability to successfully comply with international market standards (Mori, 2010, Łuczka 2002). Depending on the extent of their expansion, businesses seeking to expand internationally may either internationalize or globalize their operations. Literature enumerates some steps to globalizing one’s reach. The first of these, which is exporting, may prove to be the hardest for micro and small enterprises.
A particular challenge faced by Poland’s micro and small enterprises arose with the country’s accession to the European Single Market. Even before Poland joined the European Union, many entrepreneurs were aware of their options for active involvement in international trade, especially that some of them had already gone international (Łuczka, 2005, Łuczka 2007, Kundera, 2013, Kołodziejczyk 2016). The aim of this paper is a presentation of selected prospects for increasing international trade volume of micro and small firm in chosen sectors in Poland 1.1 Research Method and Data
The research findings presented in this article have been derived from the data provided in Raport
Banku Pekao SA o sytuacji mikro i małych firm w 2016 roku. (Pekao Bank Report on the standings of micro and small enterprises in 2016) published annually by the Bank Pekao S.A. Its most recent edition covered a sample of 6 903 enterprises, 6192 of which were micro and 711 small businesses, each interviewed by
117
telephone. The findings and own calculations based on The Report date are presented in tables to which mathematical analysis tools were applied to determine structures, growth trends, the extent and direction of change in each company’s exports and changes to the internationalization strategies of the surveyed companies. 2. Selected Theoretical Aspects of Exporting by Micro and Small Enterprises
Exporting is the first and predominant form of involvement in international markets and, as such, a starting point for internationalization (Taylor, 2013). The debate on the role of exports in small and medium-sized enterprises, as well as in micro enterprises, which were subsequently distinguished, has a long-standing tradition (Bonnaccorsi, 1992, Moen, 1999). Sterlacchini noted that his studies have revealed a specific correlation between the volume of exports and enterprise size, and that the correlation varies considerably depending on the size of the concerned SME. “Ceteris paribus, in order to become exporters and to have a substantial share of exports in their total sales, small firms must achieve a critical size. Below this minimum size, a firm probably does not posses sufficient managerial, financial and commercial capabilities to become an exporter. Above the size, the relationship between total sales and export performance is not significant and becomes U-shaped for large firms. A range of size variables characterized by an inverse relationship may arise. Large firms enjoy greater domestic market power and have less incentive to export.” (Sterlacchini, 2001)
Some economists have researched the exports – and, more broadly speaking, the internationalization of enterprises by classifying them by size and individual market economies. Among them, Bernard and Wagner (2001) examined the significance of German enterprises, and especially SMEs, in the German economy. Corte, Zamparelli and Micera (2013), in their turn, showed that traditional Italian companies have unique access to innovation and innovation financing. Some of them relied on cooperation and networking as key internationalization strategies (Zapletalova, 2013).
The engagement of micro, small and medium-sized enterprises in international trade proved to be of particular interest in connection with the enlargement of the European Union, as it embraced the once centrally-planned economies. A great deal of research was devoted to the building and growth of the SME sector in those countries and, ultimately, the limits of its involvement in internationalization and the increasingly stronger process of globalization (Hinterregger, 1993, Krakowski et al., 1993). These issues have attracted much interest on the part of researchers, giving rise to a proliferation of publications in the concerned countries, among them Poland (Łuczka and Przepióra, 2012, Małecka, 2016, Mazure and Tiltina 2015, Małecka and Łuczka, 2016, Małecka, 2017). Of great relevance for such research is the Klapper discussion on general barriers to entrepreneurship. (Klapper et al., 2006).
The current discussion has clearly been enhanced by the new findings and experience resulting from the expansion of micro, small and medium-sized enterprises into the African continent. Again, attention is drawn to the way internationalization and globalization works across different traditions and differently structured market economies. Of considerable interest from this viewpoint is the effect of learning-by-exporting, discussed extensively in literature. As underlined by Boerrman (2010), enterprises that engage in exporting tend to be more productive than those that shy away from international markets. Research shows clearly that the surveyed companies benefited substantially from the learning-by-exporting effect. Nonetheless, the outcomes of such learning are tied closely to the geographical destinations of their exports. Contrary to the businesses which exported their goods to Africa, those that reached markets outside of that continent became more capital intensive and hired more workers.
Mtigwe (2005) notes the vital importance of knowledge for enterprises which actively pursue internationalization. To a certain extent, the learning-by-exporting effect becomes comparable to that of learning-by-doing: regardless of the type and extent of a company’s markets, learning alone is certain to produce benefits, including productivity increases, for enterprises across the entire spectrum of sizes, including micro and small. As mentioned earlier, literature and business practitioners alike view exporting as the first step to internationalization and globalization. This first step proves to be decisive for the way enterprises of any size end up behaving in international markets. This is because the step is no less than a plunge by business owners into a whole new complex business environment, with an entirely new set of business, social, cultural and legal factors, new customers and greater exposures to risks. Such ventures cannot escape the universal rule, whereby the farther an enterprise moves along the path of internationalization, the less sensitive it becomes to barriers to entry into foreign markets (Wang et al., 2017).
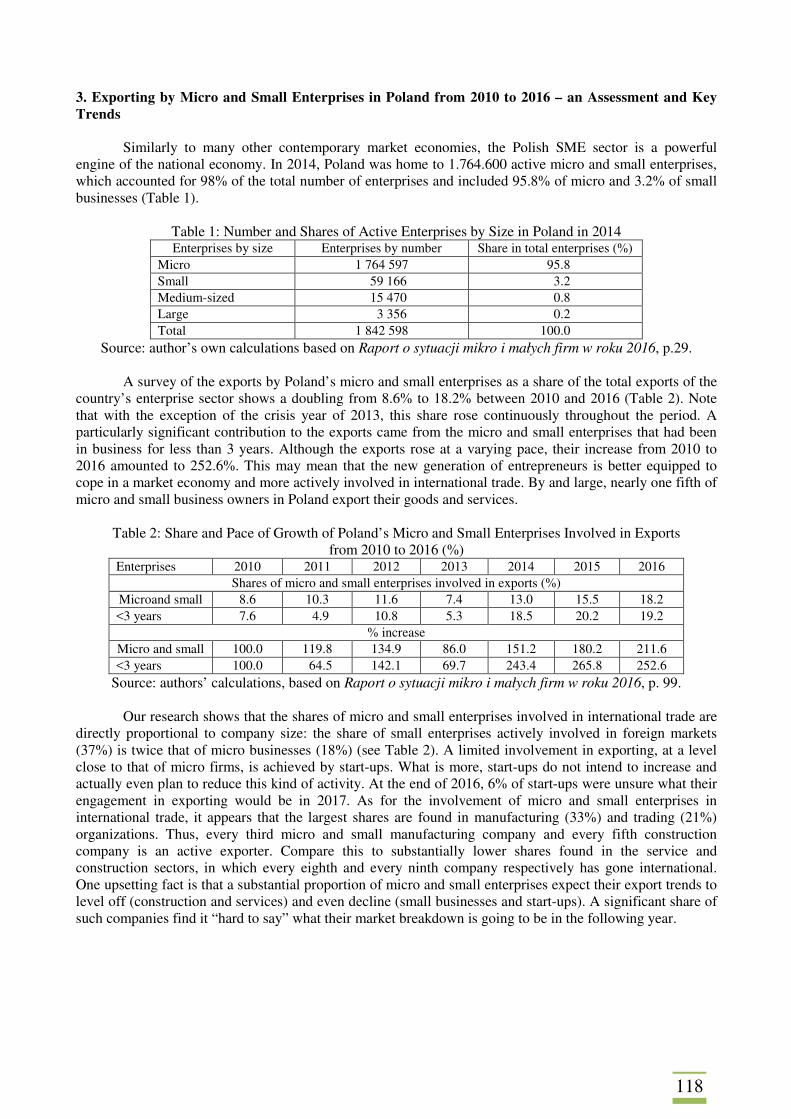
118
3. Exporting by Micro and Small Enterprises in Poland from 2010 to 2016 – an Assessment and Key Trends
Similarly to many other contemporary market economies, the Polish SME sector is a powerful engine of the national economy. In 2014, Poland was home to 1.764.600 active micro and small enterprises, which accounted for 98% of the total number of enterprises and included 95.8% of micro and 3.2% of small businesses (Table 1).
Table 1: Number and Shares of Active Enterprises by Size in Poland in 2014 Enterprises by size Enterprises by number Share in total enterprises (%)
Micro 1 764 597 95.8 Small 59 166 3.2 Medium-sized 15 470 0.8 Large 3 356 0.2 Total 1 842 598 100.0
Source: author’s own calculations based on Raport o sytuacji mikro i małych firm w roku 2016, p.29.
A survey of the exports by Poland’s micro and small enterprises as a share of the total exports of the country’s enterprise sector shows a doubling from 8.6% to 18.2% between 2010 and 2016 (Table 2). Note that with the exception of the crisis year of 2013, this share rose continuously throughout the period. A particularly significant contribution to the exports came from the micro and small enterprises that had been in business for less than 3 years. Although the exports rose at a varying pace, their increase from 2010 to 2016 amounted to 252.6%. This may mean that the new generation of entrepreneurs is better equipped to cope in a market economy and more actively involved in international trade. By and large, nearly one fifth of micro and small business owners in Poland export their goods and services.
Table 2: Share and Pace of Growth of Poland’s Micro and Small Enterprises Involved in Exports from 2010 to 2016 (%)
Enterprises 2010 2011 2012 2013 2014 2015 2016 Shares of micro and small enterprises involved in exports (%)
Microand small 8.6 10.3 11.6 7.4 13.0 15.5 18.2 <3 years 7.6 4.9 10.8 5.3 18.5 20.2 19.2
% increase Micro and small 100.0 119.8 134.9 86.0 151.2 180.2 211.6 <3 years 100.0 64.5 142.1 69.7 243.4 265.8 252.6
Source: authors’ calculations, based on Raport o sytuacji mikro i małych firm w roku 2016, p. 99.
Our research shows that the shares of micro and small enterprises involved in international trade are directly proportional to company size: the share of small enterprises actively involved in foreign markets (37%) is twice that of micro businesses (18%) (see Table 2). A limited involvement in exporting, at a level close to that of micro firms, is achieved by start-ups. What is more, start-ups do not intend to increase and actually even plan to reduce this kind of activity. At the end of 2016, 6% of start-ups were unsure what their engagement in exporting would be in 2017. As for the involvement of micro and small enterprises in international trade, it appears that the largest shares are found in manufacturing (33%) and trading (21%) organizations. Thus, every third micro and small manufacturing company and every fifth construction company is an active exporter. Compare this to substantially lower shares found in the service and construction sectors, in which every eighth and every ninth company respectively has gone international. One upsetting fact is that a substantial proportion of micro and small enterprises expect their export trends to level off (construction and services) and even decline (small businesses and start-ups). A significant share of such companies find it “hard to say” what their market breakdown is going to be in the following year.
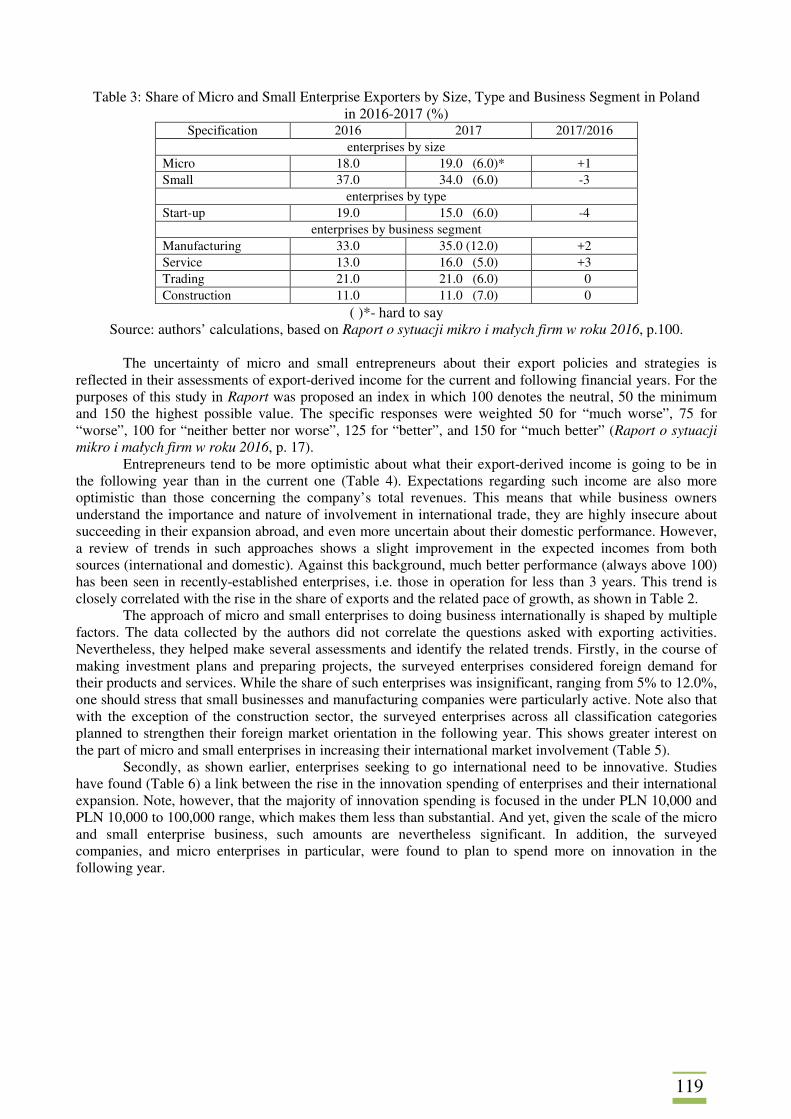
119
Table 3: Share of Micro and Small Enterprise Exporters by Size, Type and Business Segment in Poland in 2016-2017 (%)
Specification 2016 2017 2017/2016 enterprises by size
Micro 18.0 19.0 (6.0)* +1 Small 37.0 34.0 (6.0) -3
enterprises by type Start-up 19.0 15.0 (6.0) -4
enterprises by business segment Manufacturing 33.0 35.0 (12.0) +2 Service 13.0 16.0 (5.0) +3 Trading 21.0 21.0 (6.0) 0 Construction 11.0 11.0 (7.0) 0
( )*- hard to say Source: authors’ calculations, based on Raport o sytuacji mikro i małych firm w roku 2016, p.100.
The uncertainty of micro and small entrepreneurs about their export policies and strategies is
reflected in their assessments of export-derived income for the current and following financial years. For the purposes of this study in Raport was proposed an index in which 100 denotes the neutral, 50 the minimum and 150 the highest possible value. The specific responses were weighted 50 for “much worse”, 75 for “worse”, 100 for “neither better nor worse”, 125 for “better”, and 150 for “much better” (Raport o sytuacji mikro i małych firm w roku 2016, p. 17).
Entrepreneurs tend to be more optimistic about what their export-derived income is going to be in the following year than in the current one (Table 4). Expectations regarding such income are also more optimistic than those concerning the company’s total revenues. This means that while business owners understand the importance and nature of involvement in international trade, they are highly insecure about succeeding in their expansion abroad, and even more uncertain about their domestic performance. However, a review of trends in such approaches shows a slight improvement in the expected incomes from both sources (international and domestic). Against this background, much better performance (always above 100) has been seen in recently-established enterprises, i.e. those in operation for less than 3 years. This trend is closely correlated with the rise in the share of exports and the related pace of growth, as shown in Table 2.
The approach of micro and small enterprises to doing business internationally is shaped by multiple factors. The data collected by the authors did not correlate the questions asked with exporting activities. Nevertheless, they helped make several assessments and identify the related trends. Firstly, in the course of making investment plans and preparing projects, the surveyed enterprises considered foreign demand for their products and services. While the share of such enterprises was insignificant, ranging from 5% to 12.0%, one should stress that small businesses and manufacturing companies were particularly active. Note also that with the exception of the construction sector, the surveyed enterprises across all classification categories planned to strengthen their foreign market orientation in the following year. This shows greater interest on the part of micro and small enterprises in increasing their international market involvement (Table 5).
Secondly, as shown earlier, enterprises seeking to go international need to be innovative. Studies have found (Table 6) a link between the rise in the innovation spending of enterprises and their international expansion. Note, however, that the majority of innovation spending is focused in the under PLN 10,000 and PLN 10,000 to 100,000 range, which makes them less than substantial. And yet, given the scale of the micro and small enterprise business, such amounts are nevertheless significant. In addition, the surveyed companies, and micro enterprises in particular, were found to plan to spend more on innovation in the following year.
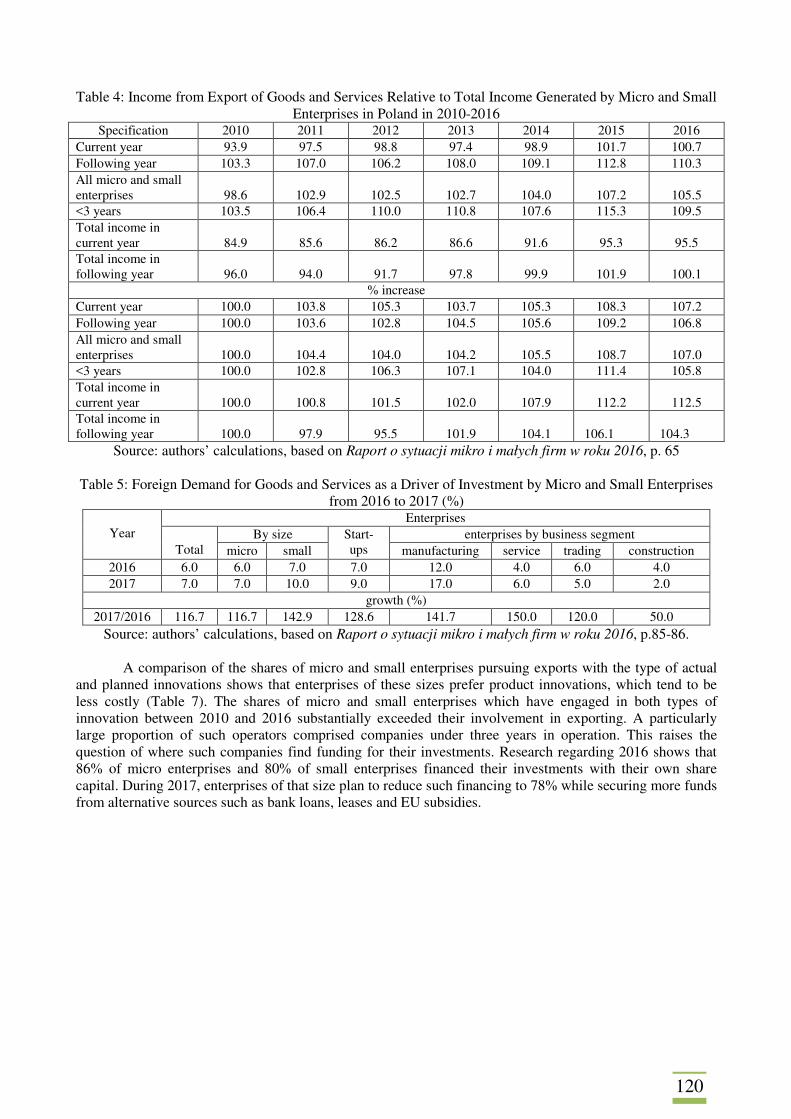
120
Table 4: Income from Export of Goods and Services Relative to Total Income Generated by Micro and Small Enterprises in Poland in 2010-2016
Specification 2010 2011 2012 2013 2014 2015 2016 Current year 93.9 97.5 98.8 97.4 98.9 101.7 100.7 Following year 103.3 107.0 106.2 108.0 109.1 112.8 110.3 All micro and small enterprises
98.6
102.9
102.5
102.7
104.0
107.2
105.5
<3 years 103.5 106.4 110.0 110.8 107.6 115.3 109.5 Total income in current year
84.9
85.6
86.2
86.6
91.6
95.3
95.5
Total income in following year
96.0
94.0
91.7
97.8
99.9
101.9
100.1
% increase Current year 100.0 103.8 105.3 103.7 105.3 108.3 107.2 Following year 100.0 103.6 102.8 104.5 105.6 109.2 106.8 All micro and small enterprises
100.0
104.4
104.0
104.2
105.5
108.7
107.0
<3 years 100.0 102.8 106.3 107.1 104.0 111.4 105.8 Total income in current year
100.0
100.8
101.5
102.0
107.9
112.2
112.5
Total income in following year
100.0
97.9
95.5
101.9
104.1
106.1
104.3
Source: authors’ calculations, based on Raport o sytuacji mikro i małych firm w roku 2016, p. 65
Table 5: Foreign Demand for Goods and Services as a Driver of Investment by Micro and Small Enterprises from 2016 to 2017 (%)
Year
Enterprises
Total By size Start-
ups enterprises by business segment
micro small manufacturing service trading construction 2016 6.0 6.0 7.0 7.0 12.0 4.0 6.0 4.0 2017 7.0 7.0 10.0 9.0 17.0 6.0 5.0 2.0
growth (%) 2017/2016 116.7 116.7 142.9 128.6 141.7 150.0 120.0 50.0
Source: authors’ calculations, based on Raport o sytuacji mikro i małych firm w roku 2016, p.85-86. A comparison of the shares of micro and small enterprises pursuing exports with the type of actual
and planned innovations shows that enterprises of these sizes prefer product innovations, which tend to be less costly (Table 7). The shares of micro and small enterprises which have engaged in both types of innovation between 2010 and 2016 substantially exceeded their involvement in exporting. A particularly large proportion of such operators comprised companies under three years in operation. This raises the question of where such companies find funding for their investments. Research regarding 2016 shows that 86% of micro enterprises and 80% of small enterprises financed their investments with their own share capital. During 2017, enterprises of that size plan to reduce such financing to 78% while securing more funds from alternative sources such as bank loans, leases and EU subsidies.
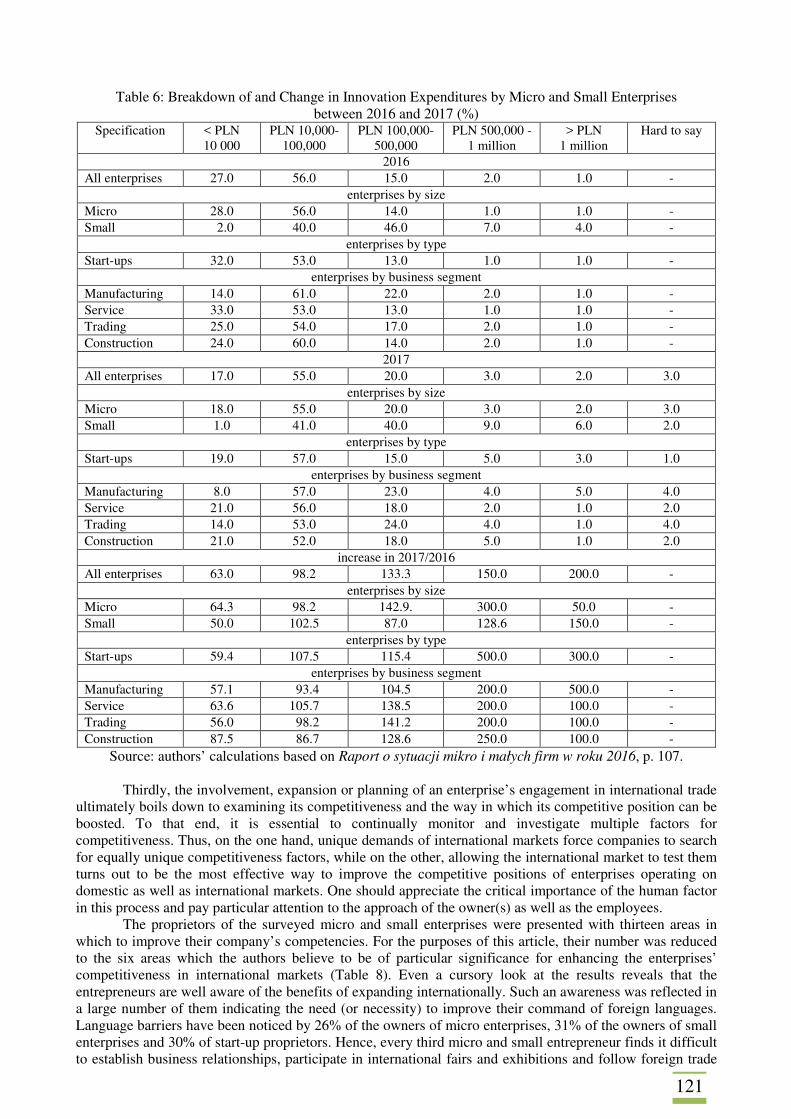
121
Table 6: Breakdown of and Change in Innovation Expenditures by Micro and Small Enterprises between 2016 and 2017 (%)
Specification < PLN 10 000
PLN 10,000-100,000
PLN 100,000-500,000
PLN 500,000 - 1 million
> PLN 1 million
Hard to say
2016 All enterprises 27.0 56.0 15.0 2.0 1.0 -
enterprises by size Micro 28.0 56.0 14.0 1.0 1.0 - Small 2.0 40.0 46.0 7.0 4.0 -
enterprises by type Start-ups 32.0 53.0 13.0 1.0 1.0 -
enterprises by business segment Manufacturing 14.0 61.0 22.0 2.0 1.0 - Service 33.0 53.0 13.0 1.0 1.0 - Trading 25.0 54.0 17.0 2.0 1.0 - Construction 24.0 60.0 14.0 2.0 1.0 -
2017 All enterprises 17.0 55.0 20.0 3.0 2.0 3.0
enterprises by size Micro 18.0 55.0 20.0 3.0 2.0 3.0 Small 1.0 41.0 40.0 9.0 6.0 2.0
enterprises by type Start-ups 19.0 57.0 15.0 5.0 3.0 1.0
enterprises by business segment Manufacturing 8.0 57.0 23.0 4.0 5.0 4.0 Service 21.0 56.0 18.0 2.0 1.0 2.0 Trading 14.0 53.0 24.0 4.0 1.0 4.0 Construction 21.0 52.0 18.0 5.0 1.0 2.0
increase in 2017/2016 All enterprises 63.0 98.2 133.3 150.0 200.0 -
enterprises by size Micro 64.3 98.2 142.9. 300.0 50.0 - Small 50.0 102.5 87.0 128.6 150.0 -
enterprises by type Start-ups 59.4 107.5 115.4 500.0 300.0 -
enterprises by business segment Manufacturing 57.1 93.4 104.5 200.0 500.0 - Service 63.6 105.7 138.5 200.0 100.0 - Trading 56.0 98.2 141.2 200.0 100.0 - Construction 87.5 86.7 128.6 250.0 100.0 -
Source: authors’ calculations based on Raport o sytuacji mikro i małych firm w roku 2016, p. 107.
Thirdly, the involvement, expansion or planning of an enterprise’s engagement in international trade ultimately boils down to examining its competitiveness and the way in which its competitive position can be boosted. To that end, it is essential to continually monitor and investigate multiple factors for competitiveness. Thus, on the one hand, unique demands of international markets force companies to search for equally unique competitiveness factors, while on the other, allowing the international market to test them turns out to be the most effective way to improve the competitive positions of enterprises operating on domestic as well as international markets. One should appreciate the critical importance of the human factor in this process and pay particular attention to the approach of the owner(s) as well as the employees.
The proprietors of the surveyed micro and small enterprises were presented with thirteen areas in which to improve their company’s competencies. For the purposes of this article, their number was reduced to the six areas which the authors believe to be of particular significance for enhancing the enterprises’ competitiveness in international markets (Table 8). Even a cursory look at the results reveals that the entrepreneurs are well aware of the benefits of expanding internationally. Such an awareness was reflected in a large number of them indicating the need (or necessity) to improve their command of foreign languages. Language barriers have been noticed by 26% of the owners of micro enterprises, 31% of the owners of small enterprises and 30% of start-up proprietors. Hence, every third micro and small entrepreneur finds it difficult to establish business relationships, participate in international fairs and exhibitions and follow foreign trade
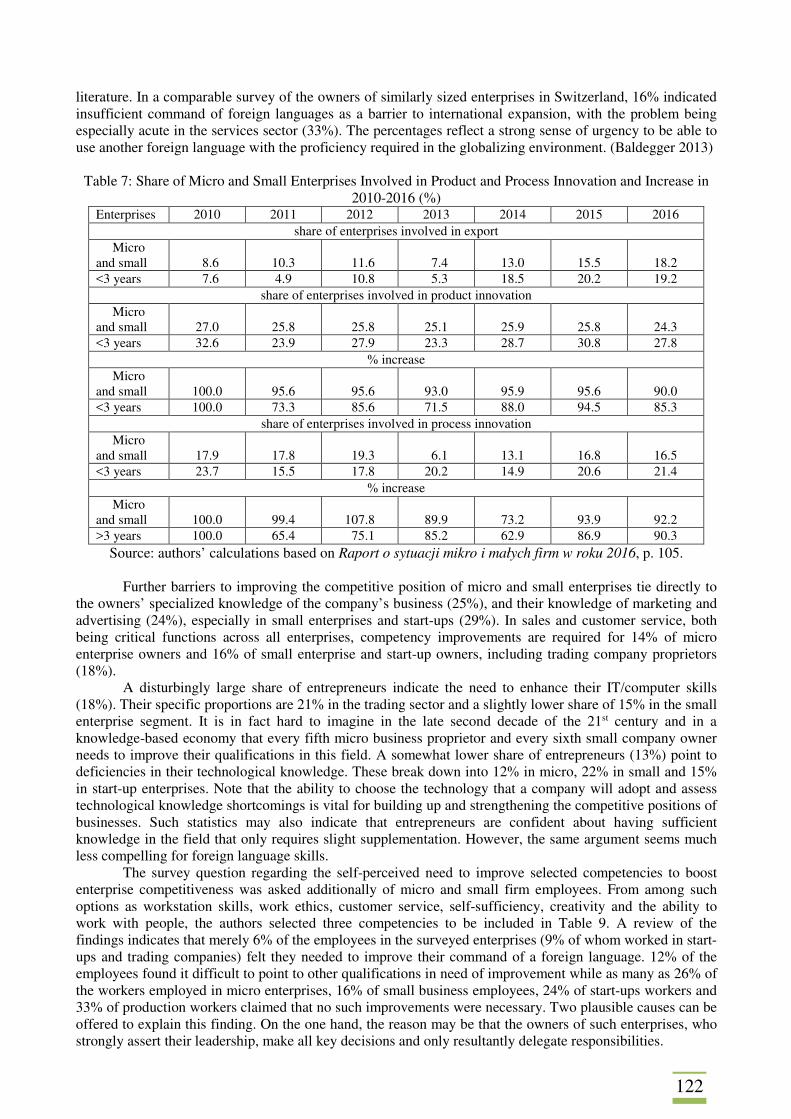
122
literature. In a comparable survey of the owners of similarly sized enterprises in Switzerland, 16% indicated insufficient command of foreign languages as a barrier to international expansion, with the problem being especially acute in the services sector (33%). The percentages reflect a strong sense of urgency to be able to use another foreign language with the proficiency required in the globalizing environment. (Baldegger 2013)
Table 7: Share of Micro and Small Enterprises Involved in Product and Process Innovation and Increase in
2010-2016 (%) Enterprises 2010 2011 2012 2013 2014 2015 2016
share of enterprises involved in export Micro
and small
8.6
10.3
11.6
7.4
13.0
15.5
18.2 <3 years 7.6 4.9 10.8 5.3 18.5 20.2 19.2
share of enterprises involved in product innovation Micro
and small
27.0
25.8
25.8
25.1
25.9
25.8
24.3 <3 years 32.6 23.9 27.9 23.3 28.7 30.8 27.8
% increase Micro
and small
100.0
95.6
95.6
93.0
95.9
95.6
90.0 <3 years 100.0 73.3 85.6 71.5 88.0 94.5 85.3
share of enterprises involved in process innovation Micro
and small
17.9
17.8
19.3
6.1
13.1
16.8
16.5 <3 years 23.7 15.5 17.8 20.2 14.9 20.6 21.4
% increase Micro
and small
100.0
99.4
107.8
89.9
73.2
93.9
92.2 >3 years 100.0 65.4 75.1 85.2 62.9 86.9 90.3
Source: authors’ calculations based on Raport o sytuacji mikro i małych firm w roku 2016, p. 105. Further barriers to improving the competitive position of micro and small enterprises tie directly to
the owners’ specialized knowledge of the company’s business (25%), and their knowledge of marketing and advertising (24%), especially in small enterprises and start-ups (29%). In sales and customer service, both being critical functions across all enterprises, competency improvements are required for 14% of micro enterprise owners and 16% of small enterprise and start-up owners, including trading company proprietors (18%).
A disturbingly large share of entrepreneurs indicate the need to enhance their IT/computer skills (18%). Their specific proportions are 21% in the trading sector and a slightly lower share of 15% in the small enterprise segment. It is in fact hard to imagine in the late second decade of the 21st century and in a knowledge-based economy that every fifth micro business proprietor and every sixth small company owner needs to improve their qualifications in this field. A somewhat lower share of entrepreneurs (13%) point to deficiencies in their technological knowledge. These break down into 12% in micro, 22% in small and 15% in start-up enterprises. Note that the ability to choose the technology that a company will adopt and assess technological knowledge shortcomings is vital for building up and strengthening the competitive positions of businesses. Such statistics may also indicate that entrepreneurs are confident about having sufficient knowledge in the field that only requires slight supplementation. However, the same argument seems much less compelling for foreign language skills.
The survey question regarding the self-perceived need to improve selected competencies to boost enterprise competitiveness was asked additionally of micro and small firm employees. From among such options as workstation skills, work ethics, customer service, self-sufficiency, creativity and the ability to work with people, the authors selected three competencies to be included in Table 9. A review of the findings indicates that merely 6% of the employees in the surveyed enterprises (9% of whom worked in start-ups and trading companies) felt they needed to improve their command of a foreign language. 12% of the employees found it difficult to point to other qualifications in need of improvement while as many as 26% of the workers employed in micro enterprises, 16% of small business employees, 24% of start-ups workers and 33% of production workers claimed that no such improvements were necessary. Two plausible causes can be offered to explain this finding. On the one hand, the reason may be that the owners of such enterprises, who strongly assert their leadership, make all key decisions and only resultantly delegate responsibilities.
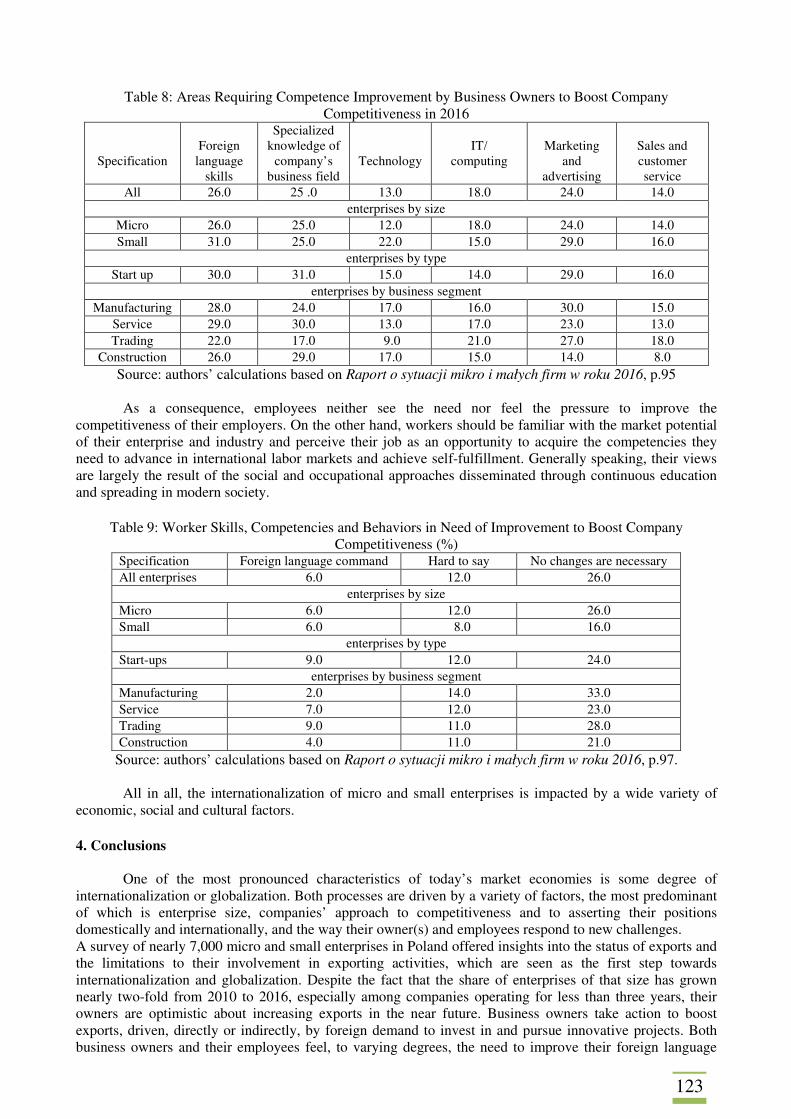
123
Table 8: Areas Requiring Competence Improvement by Business Owners to Boost Company Competitiveness in 2016
Specification
Foreign
language skills
Specialized knowledge of
company’s business field
Technology
IT/
computing
Marketing
and advertising
Sales and customer service
All 26.0 25 .0 13.0 18.0 24.0 14.0 enterprises by size
Micro 26.0 25.0 12.0 18.0 24.0 14.0 Small 31.0 25.0 22.0 15.0 29.0 16.0
enterprises by type Start up 30.0 31.0 15.0 14.0 29.0 16.0
enterprises by business segment Manufacturing 28.0 24.0 17.0 16.0 30.0 15.0
Service 29.0 30.0 13.0 17.0 23.0 13.0 Trading 22.0 17.0 9.0 21.0 27.0 18.0
Construction 26.0 29.0 17.0 15.0 14.0 8.0 Source: authors’ calculations based on Raport o sytuacji mikro i małych firm w roku 2016, p.95
As a consequence, employees neither see the need nor feel the pressure to improve the
competitiveness of their employers. On the other hand, workers should be familiar with the market potential of their enterprise and industry and perceive their job as an opportunity to acquire the competencies they need to advance in international labor markets and achieve self-fulfillment. Generally speaking, their views are largely the result of the social and occupational approaches disseminated through continuous education and spreading in modern society.
Table 9: Worker Skills, Competencies and Behaviors in Need of Improvement to Boost Company
Competitiveness (%) Specification Foreign language command Hard to say No changes are necessary All enterprises 6.0 12.0 26.0
enterprises by size Micro 6.0 12.0 26.0 Small 6.0 8.0 16.0
enterprises by type Start-ups 9.0 12.0 24.0
enterprises by business segment Manufacturing 2.0 14.0 33.0 Service 7.0 12.0 23.0 Trading 9.0 11.0 28.0 Construction 4.0 11.0 21.0
Source: authors’ calculations based on Raport o sytuacji mikro i małych firm w roku 2016, p.97.
All in all, the internationalization of micro and small enterprises is impacted by a wide variety of economic, social and cultural factors. 4. Conclusions
One of the most pronounced characteristics of today’s market economies is some degree of internationalization or globalization. Both processes are driven by a variety of factors, the most predominant of which is enterprise size, companies’ approach to competitiveness and to asserting their positions domestically and internationally, and the way their owner(s) and employees respond to new challenges. A survey of nearly 7,000 micro and small enterprises in Poland offered insights into the status of exports and the limitations to their involvement in exporting activities, which are seen as the first step towards internationalization and globalization. Despite the fact that the share of enterprises of that size has grown nearly two-fold from 2010 to 2016, especially among companies operating for less than three years, their owners are optimistic about increasing exports in the near future. Business owners take action to boost exports, driven, directly or indirectly, by foreign demand to invest in and pursue innovative projects. Both business owners and their employees feel, to varying degrees, the need to improve their foreign language
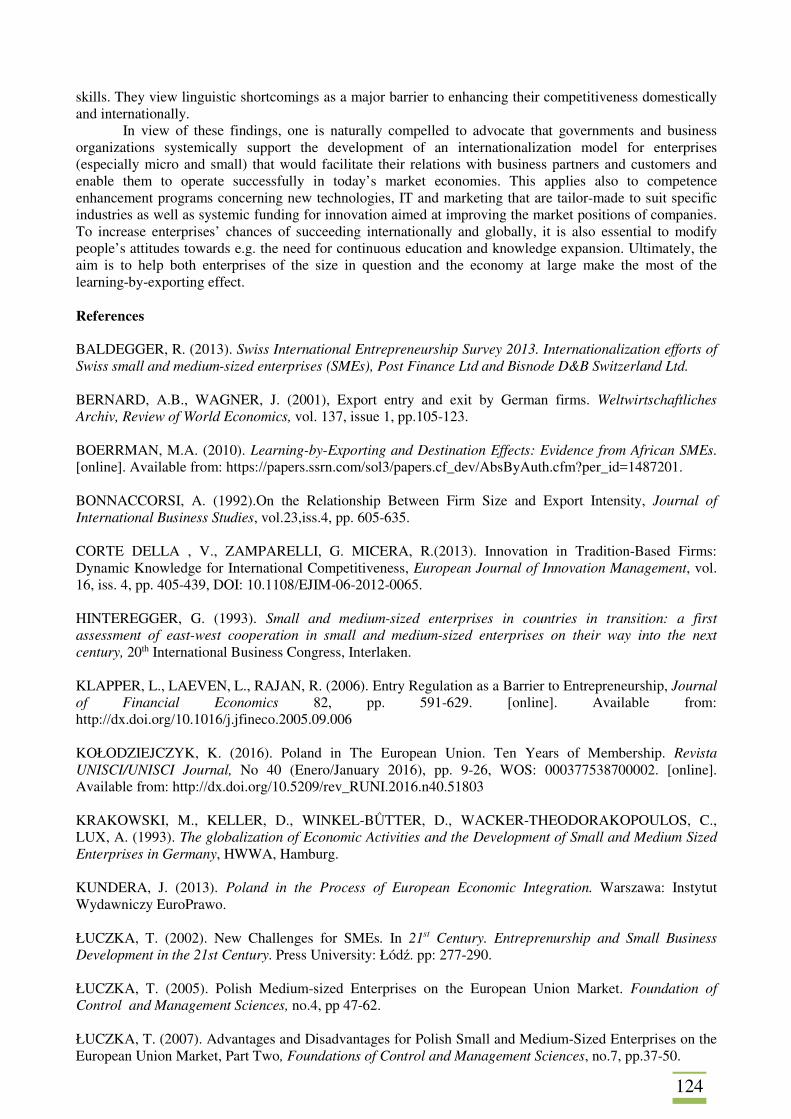
124
skills. They view linguistic shortcomings as a major barrier to enhancing their competitiveness domestically and internationally.
In view of these findings, one is naturally compelled to advocate that governments and business organizations systemically support the development of an internationalization model for enterprises (especially micro and small) that would facilitate their relations with business partners and customers and enable them to operate successfully in today’s market economies. This applies also to competence enhancement programs concerning new technologies, IT and marketing that are tailor-made to suit specific industries as well as systemic funding for innovation aimed at improving the market positions of companies. To increase enterprises’ chances of succeeding internationally and globally, it is also essential to modify people’s attitudes towards e.g. the need for continuous education and knowledge expansion. Ultimately, the aim is to help both enterprises of the size in question and the economy at large make the most of the learning-by-exporting effect. References BALDEGGER, R. (2013). Swiss International Entrepreneurship Survey 2013. Internationalization efforts of Swiss small and medium-sized enterprises (SMEs), Post Finance Ltd and Bisnode D&B Switzerland Ltd. BERNARD, A.B., WAGNER, J. (2001), Export entry and exit by German firms. Weltwirtschaftliches Archiv, Review of World Economics, vol. 137, issue 1, pp.105-123. BOERRMAN, M.A. (2010). Learning-by-Exporting and Destination Effects: Evidence from African SMEs. [online]. Available from: https://papers.ssrn.com/sol3/papers.cf_dev/AbsByAuth.cfm?per_id=1487201. BONNACCORSI, A. (1992).On the Relationship Between Firm Size and Export Intensity, Journal of International Business Studies, vol.23,iss.4, pp. 605-635. CORTE DELLA , V., ZAMPARELLI, G. MICERA, R.(2013). Innovation in Tradition-Based Firms: Dynamic Knowledge for International Competitiveness, European Journal of Innovation Management, vol. 16, iss. 4, pp. 405-439, DOI: 10.1108/EJIM-06-2012-0065. HINTEREGGER, G. (1993). Small and medium-sized enterprises in countries in transition: a first assessment of east-west cooperation in small and medium-sized enterprises on their way into the next century, 20th International Business Congress, Interlaken. KLAPPER, L., LAEVEN, L., RAJAN, R. (2006). Entry Regulation as a Barrier to Entrepreneurship, Journal of Financial Economics 82, pp. 591-629. [online]. Available from: http://dx.doi.org/10.1016/j.jfineco.2005.09.006 KOŁODZIEJCZYK, K. (2016). Poland in The European Union. Ten Years of Membership. Revista UNISCI/UNISCI Journal, No 40 (Enero/January 2016), pp. 9-26, WOS: 000377538700002. [online]. Available from: http://dx.doi.org/10.5209/rev_RUNI.2016.n40.51803 KRAKOWSKI, M., KELLER, D., WINKEL-BǗTTER, D., WACKER-THEODORAKOPOULOS, C., LUX, A. (1993). The globalization of Economic Activities and the Development of Small and Medium Sized Enterprises in Germany, HWWA, Hamburg. KUNDERA, J. (2013). Poland in the Process of European Economic Integration. Warszawa: Instytut Wydawniczy EuroPrawo. ŁUCZKA, T. (2002). New Challenges for SMEs. In 21st Century. Entreprenurship and Small Business Development in the 21st Century. Press University: Łódź. pp: 277-290. ŁUCZKA, T. (2005). Polish Medium-sized Enterprises on the European Union Market. Foundation of Control and Management Sciences, no.4, pp 47-62. ŁUCZKA, T. (2007). Advantages and Disadvantages for Polish Small and Medium-Sized Enterprises on the European Union Market, Part Two, Foundations of Control and Management Sciences, no.7, pp.37-50.
125
ŁUCZKA, T., PRZEPIÓRA, P. (2012). Regional Determinants of Efficiency Growth of Small and Medium-sized Enterprises. Evidence from Poland, Journal of Entrepreneurship, Management and Innovation, vol. 8, iss. 1, pp. 138-155. MAŁECKA, J. (2015). Selected Problems of the Capital Market in Poland. In Postuła, M., Turyna, J. (eds..), Finansowe Uwarunkowania Rozwoju Organizacji Gospodarczych, Zarządzanie Finansami a Efektywność Ekonomiczna, Warszawa: Wydawnictwo Naukowe Wydziału Zarządzania Uniwersytetu Warszawskiego, pp: 349-362. [online]. Available from: http://dx.doi.org/10.7172/978-83-65402-00-4.2015.wwz.1 MAŁECKA, J., ŁUCZKA., T. (2016). The Structure of Venture Capital Raising by Companies in Poland and Central and Eastern Europe: Selected Aspects. IMECS 2016, pp.:418-431. The Department of Entrepreneurship of the University of Economics, Prague. MAZURE, G., TILTINA, S. (2015). Export-Import Dynamics Within The European Union Trade Policy. Proceedings of the 2015 International Conference Economics Science for Rural Development, no.37, Jelgava LLU ESAF, pp. 23-24. MOEN, O. (1999). The Relationship Between Firm Size, Competitive Advantage and Export Performance Revisited. International Small Business Journal, vol.18, no.1, pp.53-73. MORI, N. (2010). Implications of the Marketing Strategy for Exporting SMEs from Developing Country. [online]. Available from: http:dx.doi.org/10.2139/rssn1507046 MTIGWE, B. (2005). The Entrepreneurial Firm Internationalization Process in the Southern African Context: A Comparative Approach, International Journal of Entrepreneurial Behavior Research, vol. 11, iss. 5, pp. 358-377, DOI: 10.1108/13552550510615006 Raport o sytuacji mikro i małych firm w roku 2016. Bank Pekao SA, Warszawa 2017. STERLACCHINI, A. (2001). The Determinants of Export Performance: A Firm-Level Study of Italian Manufacturing, Review of World Economics, vol.137, pp. 450-472, DOI.ORG/10.1007/BF 02707626 TAYLOR, P. (2013). The effect of entrepreneurial orientation on the internationalization of SMEs in developing countries. African Journal of Business Management, vol. 7, pp. 1927-1937, DOI;10.5897/AJBM2013.1633 WANG, Q., WU, H., XU, J., PANG, J. (2017). Entry regulation and international trade. Applied Economics Letters, 24:3.Routledge Taylor & Francis Group. pp: 182-185. [online]. Available from: http://dx.doi.org/10.1080/13504851.2016.1176105 ZAPLETALOVA, S. (2013). Internationalization of Entrepeneurial Activitties: Determination Process Level Knowledge. Aktualne Problemy Podnikovej Sfery. pp: 572-577. [online]. Available from: https://appsconf.files.wordpress.com/2016/01/2013.pdf
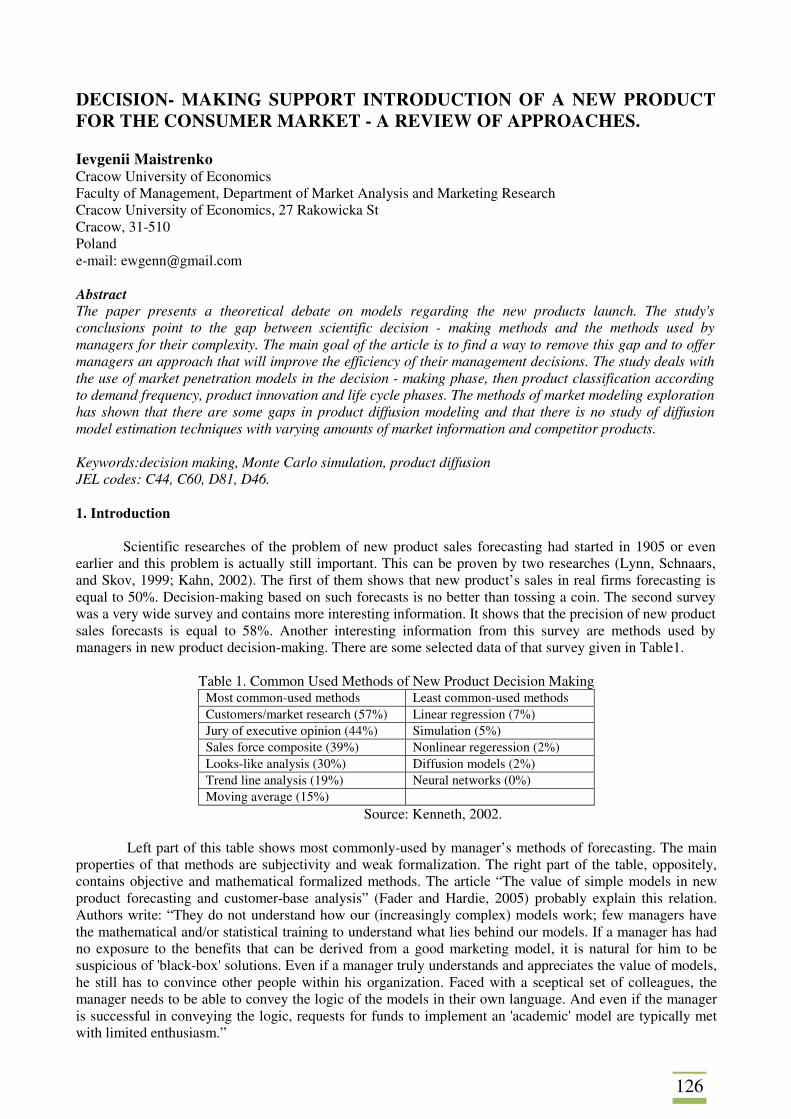
126
DECISION- MAKING SUPPORT INTRODUCTION OF A NEW PRODUCT FOR THE CONSUMER MARKET - A REVIEW OF APPROACHES. Ievgenii Maistrenko Cracow University of Economics Faculty of Management, Department of Market Analysis and Marketing Research Cracow University of Economics, 27 Rakowicka St Cracow, 31-510 Poland e-mail: [email protected] Abstract
The paper presents a theoretical debate on models regarding the new products launch. The study's conclusions point to the gap between scientific decision - making methods and the methods used by managers for their complexity. The main goal of the article is to find a way to remove this gap and to offer managers an approach that will improve the efficiency of their management decisions. The study deals with the use of market penetration models in the decision - making phase, then product classification according to demand frequency, product innovation and life cycle phases. The methods of market modeling exploration has shown that there are some gaps in product diffusion modeling and that there is no study of diffusion model estimation techniques with varying amounts of market information and competitor products. Keywords:decision making, Monte Carlo simulation, product diffusion JEL codes: C44, C60, D81, D46. 1. Introduction
Scientific researches of the problem of new product sales forecasting had started in 1905 or even earlier and this problem is actually still important. This can be proven by two researches (Lynn, Schnaars, and Skov, 1999; Kahn, 2002). The first of them shows that new product’s sales in real firms forecasting is equal to 50%. Decision-making based on such forecasts is no better than tossing a coin. The second survey was a very wide survey and contains more interesting information. It shows that the precision of new product sales forecasts is equal to 58%. Another interesting information from this survey are methods used by managers in new product decision-making. There are some selected data of that survey given in Table1.
Table 1. Common Used Methods of New Product Decision Making
Most common-used methods Least common-used methods Customers/market research (57%) Linear regression (7%) Jury of executive opinion (44%) Simulation (5%) Sales force composite (39%) Nonlinear regeression (2%) Looks-like analysis (30%) Diffusion models (2%) Trend line analysis (19%) Neural networks (0%) Moving average (15%)
Source: Kenneth, 2002.
Left part of this table shows most commonly-used by manager’s methods of forecasting. The main properties of that methods are subjectivity and weak formalization. The right part of the table, oppositely, contains objective and mathematical formalized methods. The article “The value of simple models in new product forecasting and customer-base analysis” (Fader and Hardie, 2005) probably explain this relation. Authors write: “They do not understand how our (increasingly complex) models work; few managers have the mathematical and/or statistical training to understand what lies behind our models. If a manager has had no exposure to the benefits that can be derived from a good marketing model, it is natural for him to be suspicious of 'black-box' solutions. Even if a manager truly understands and appreciates the value of models, he still has to convince other people within his organization. Faced with a sceptical set of colleagues, the manager needs to be able to convey the logic of the models in their own language. And even if the manager is successful in conveying the logic, requests for funds to implement an 'academic' model are typically met with limited enthusiasm.”
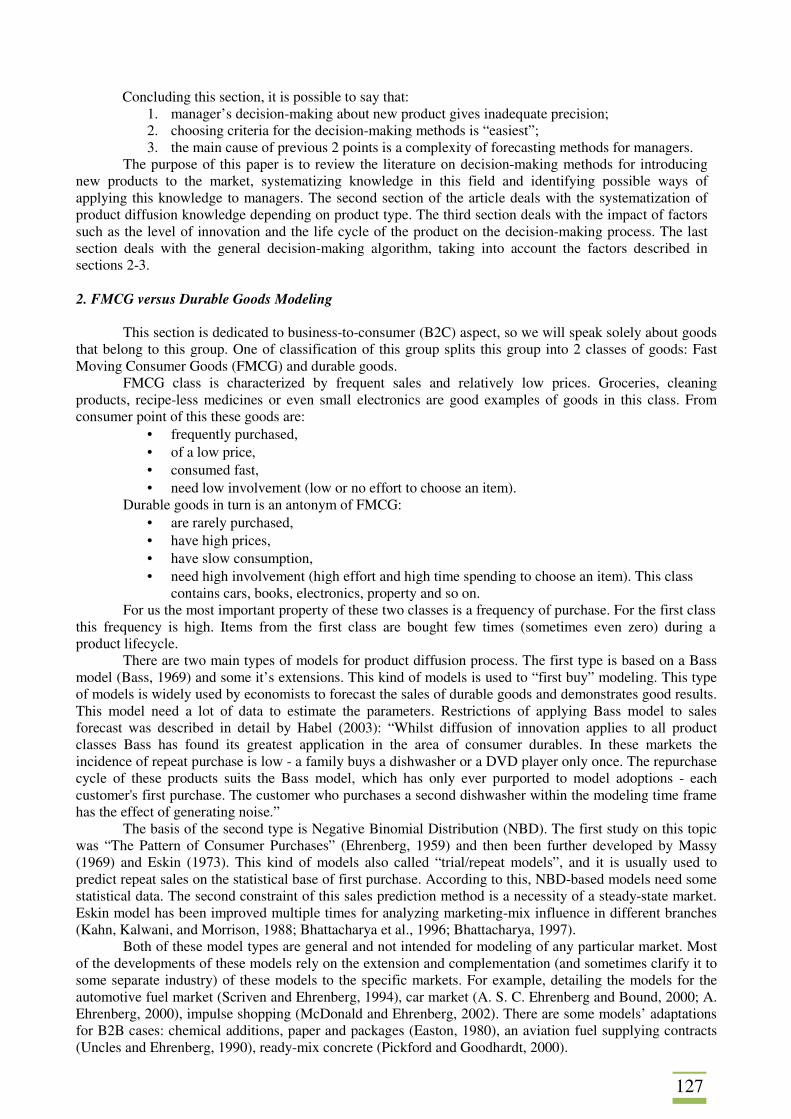
127
Concluding this section, it is possible to say that: 1. manager’s decision-making about new product gives inadequate precision; 2. choosing criteria for the decision-making methods is “easiest”; 3. the main cause of previous 2 points is a complexity of forecasting methods for managers.
The purpose of this paper is to review the literature on decision-making methods for introducing new products to the market, systematizing knowledge in this field and identifying possible ways of applying this knowledge to managers. The second section of the article deals with the systematization of product diffusion knowledge depending on product type. The third section deals with the impact of factors such as the level of innovation and the life cycle of the product on the decision-making process. The last section deals with the general decision-making algorithm, taking into account the factors described in sections 2-3. 2. FMCG versus Durable Goods Modeling
This section is dedicated to business-to-consumer (B2C) aspect, so we will speak solely about goods
that belong to this group. One of classification of this group splits this group into 2 classes of goods: Fast Moving Consumer Goods (FMCG) and durable goods.
FMCG class is characterized by frequent sales and relatively low prices. Groceries, cleaning products, recipe-less medicines or even small electronics are good examples of goods in this class. From consumer point of this these goods are:
• frequently purchased, • of a low price, • consumed fast, • need low involvement (low or no effort to choose an item).
Durable goods in turn is an antonym of FMCG: • are rarely purchased, • have high prices, • have slow consumption, • need high involvement (high effort and high time spending to choose an item). This class
contains cars, books, electronics, property and so on. For us the most important property of these two classes is a frequency of purchase. For the first class
this frequency is high. Items from the first class are bought few times (sometimes even zero) during a product lifecycle.
There are two main types of models for product diffusion process. The first type is based on a Bass model (Bass, 1969) and some it’s extensions. This kind of models is used to “first buy” modeling. This type of models is widely used by economists to forecast the sales of durable goods and demonstrates good results. This model need a lot of data to estimate the parameters. Restrictions of applying Bass model to sales forecast was described in detail by Habel (2003): “Whilst diffusion of innovation applies to all product classes Bass has found its greatest application in the area of consumer durables. In these markets the incidence of repeat purchase is low - a family buys a dishwasher or a DVD player only once. The repurchase cycle of these products suits the Bass model, which has only ever purported to model adoptions - each customer's first purchase. The customer who purchases a second dishwasher within the modeling time frame has the effect of generating noise.”
The basis of the second type is Negative Binomial Distribution (NBD). The first study on this topic was “The Pattern of Consumer Purchases” (Ehrenberg, 1959) and then been further developed by Massy (1969) and Eskin (1973). This kind of models also called “trial/repeat models”, and it is usually used to predict repeat sales on the statistical base of first purchase. According to this, NBD-based models need some statistical data. The second constraint of this sales prediction method is a necessity of a steady-state market. Eskin model has been improved multiple times for analyzing marketing-mix influence in different branches (Kahn, Kalwani, and Morrison, 1988; Bhattacharya et al., 1996; Bhattacharya, 1997).
Both of these model types are general and not intended for modeling of any particular market. Most of the developments of these models rely on the extension and complementation (and sometimes clarify it to some separate industry) of these models to the specific markets. For example, detailing the models for the automotive fuel market (Scriven and Ehrenberg, 1994), car market (A. S. C. Ehrenberg and Bound, 2000; A. Ehrenberg, 2000), impulse shopping (McDonald and Ehrenberg, 2002). There are some models’ adaptations for B2B cases: chemical additions, paper and packages (Easton, 1980), an aviation fuel supplying contracts (Uncles and Ehrenberg, 1990), ready-mix concrete (Pickford and Goodhardt, 2000).
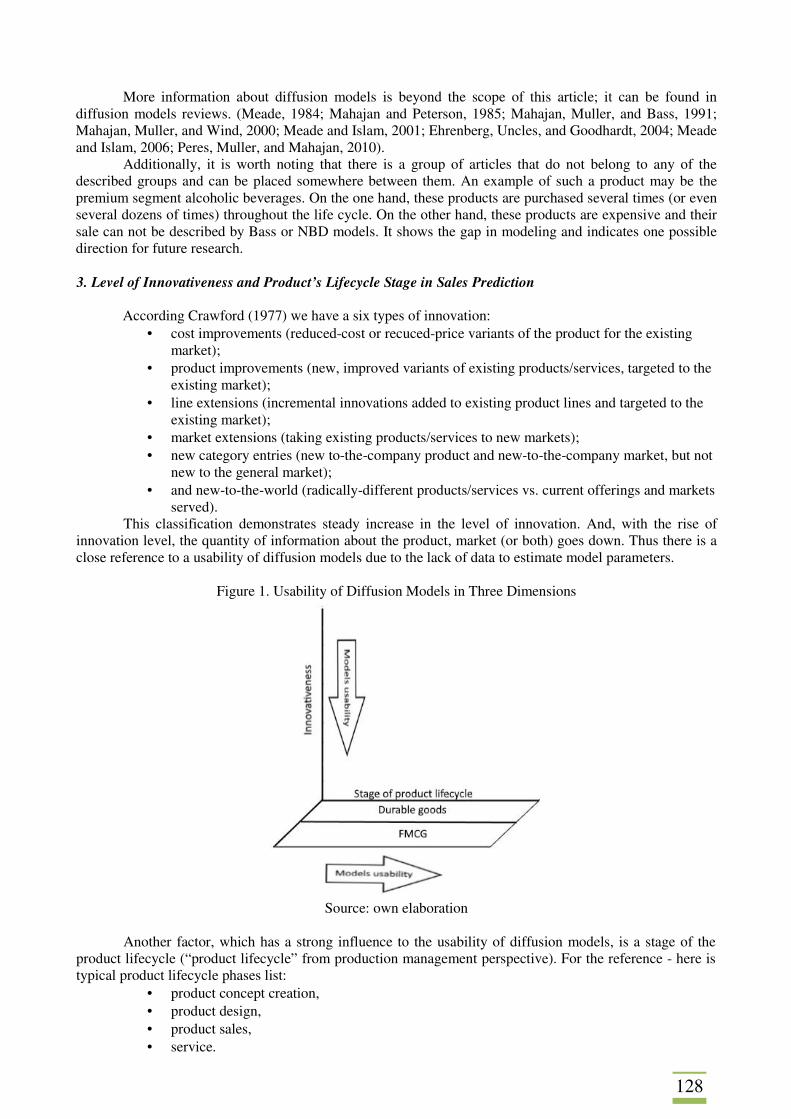
128
More information about diffusion models is beyond the scope of this article; it can be found in diffusion models reviews. (Meade, 1984; Mahajan and Peterson, 1985; Mahajan, Muller, and Bass, 1991; Mahajan, Muller, and Wind, 2000; Meade and Islam, 2001; Ehrenberg, Uncles, and Goodhardt, 2004; Meade and Islam, 2006; Peres, Muller, and Mahajan, 2010).
Additionally, it is worth noting that there is a group of articles that do not belong to any of the described groups and can be placed somewhere between them. An example of such a product may be the premium segment alcoholic beverages. On the one hand, these products are purchased several times (or even several dozens of times) throughout the life cycle. On the other hand, these products are expensive and their sale can not be described by Bass or NBD models. It shows the gap in modeling and indicates one possible direction for future research.
3. Level of Innovativeness and Product’s Lifecycle Stage in Sales Prediction
According Crawford (1977) we have a six types of innovation: • cost improvements (reduced-cost or recuced-price variants of the product for the existing
market); • product improvements (new, improved variants of existing products/services, targeted to the
existing market); • line extensions (incremental innovations added to existing product lines and targeted to the
existing market); • market extensions (taking existing products/services to new markets); • new category entries (new to-the-company product and new-to-the-company market, but not
new to the general market); • and new-to-the-world (radically-different products/services vs. current offerings and markets
served). This classification demonstrates steady increase in the level of innovation. And, with the rise of
innovation level, the quantity of information about the product, market (or both) goes down. Thus there is a close reference to a usability of diffusion models due to the lack of data to estimate model parameters.
Figure 1. Usability of Diffusion Models in Three Dimensions
Source: own elaboration Another factor, which has a strong influence to the usability of diffusion models, is a stage of the
product lifecycle (“product lifecycle” from production management perspective). For the reference - here is typical product lifecycle phases list:
• product concept creation, • product design, • product sales, • service.
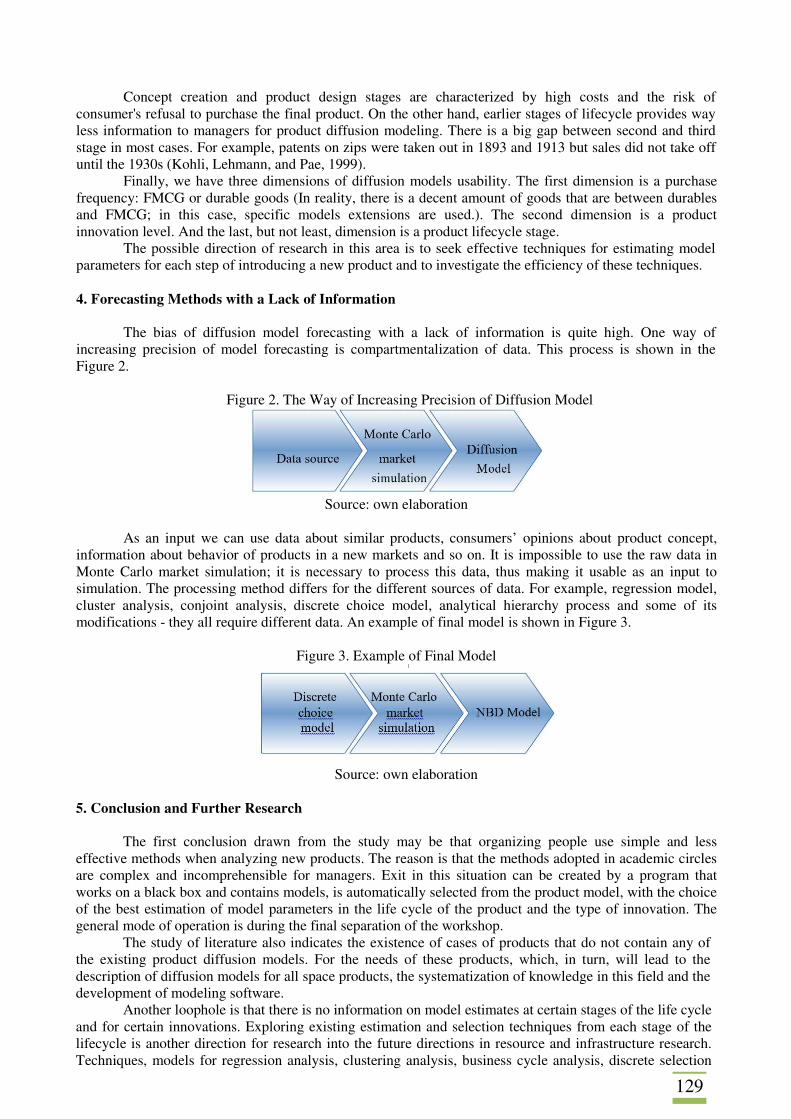
129
Concept creation and product design stages are characterized by high costs and the risk of consumer's refusal to purchase the final product. On the other hand, earlier stages of lifecycle provides way less information to managers for product diffusion modeling. There is a big gap between second and third stage in most cases. For example, patents on zips were taken out in 1893 and 1913 but sales did not take off until the 1930s (Kohli, Lehmann, and Pae, 1999).
Finally, we have three dimensions of diffusion models usability. The first dimension is a purchase frequency: FMCG or durable goods (In reality, there is a decent amount of goods that are between durables and FMCG; in this case, specific models extensions are used.). The second dimension is a product innovation level. And the last, but not least, dimension is a product lifecycle stage.
The possible direction of research in this area is to seek effective techniques for estimating model parameters for each step of introducing a new product and to investigate the efficiency of these techniques. 4. Forecasting Methods with a Lack of Information
The bias of diffusion model forecasting with a lack of information is quite high. One way of increasing precision of model forecasting is compartmentalization of data. This process is shown in the Figure 2.
Figure 2. The Way of Increasing Precision of Diffusion Model
Source: own elaboration
As an input we can use data about similar products, consumers’ opinions about product concept,
information about behavior of products in a new markets and so on. It is impossible to use the raw data in Monte Carlo market simulation; it is necessary to process this data, thus making it usable as an input to simulation. The processing method differs for the different sources of data. For example, regression model, cluster analysis, conjoint analysis, discrete choice model, analytical hierarchy process and some of its modifications - they all require different data. An example of final model is shown in Figure 3.
Figure 3. Example of Final Model
Source: own elaboration
5. Conclusion and Further Research
The first conclusion drawn from the study may be that organizing people use simple and less effective methods when analyzing new products. The reason is that the methods adopted in academic circles are complex and incomprehensible for managers. Exit in this situation can be created by a program that works on a black box and contains models, is automatically selected from the product model, with the choice of the best estimation of model parameters in the life cycle of the product and the type of innovation. The general mode of operation is during the final separation of the workshop.
The study of literature also indicates the existence of cases of products that do not contain any of the existing product diffusion models. For the needs of these products, which, in turn, will lead to the description of diffusion models for all space products, the systematization of knowledge in this field and the development of modeling software.
Another loophole is that there is no information on model estimates at certain stages of the life cycle and for certain innovations. Exploring existing estimation and selection techniques from each stage of the lifecycle is another direction for research into the future directions in resource and infrastructure research. Techniques, models for regression analysis, clustering analysis, business cycle analysis, discrete selection
130
models, analytical hierarchy (AHP), analytical network process (ANP), fuzzy AHP, fuzzy ANP, PROMETHEE, ELECTRE, TOPSIS. On Bass-like models, these may be different types of telemetry of potential consumer reactions to advertising.
To simulate future purchases as input for future models is offered the Monte Carlo method as a method that is used for practical issues in various areas.
References BASS, F. M. (1969). “A New Product Growth for Model Consumer Durables”. Management Science, vol. 15, no. 5, pp. 215–27. BHATTACHARYA, C. B. (1997). “Is Your Brand’s Loyalty Too Much, Too Little, or Just Right?: Explaining Deviations in Loyalty from the Dirichlet Norm.” International Journal of Research in Marketing, vol. 14, no. 5, pp. 421–435. BHATTACHARYA, C. B., FADER, P. S., LODISH, L. M., DESARBO W. S. (1996). “The Relationship between the Marketing Mix and Share of Category Requirements.” Marketing Letters, vol. 7, no. 1, pp.5–18. CRAWFORD, C. M. (1977). “Marketing Research and the New Product Failure Rate.” Journal of Marketing, vol. 41, no. 2, pp. 51–61. EASTON, G. (1980). “Stochastic Models of Industrial Buying Behaviour.” Omega, vol. 8, no. 1, pp. 63–69. EHRENBERG, A. S. C. (1959). “The Pattern of Consumer Purchases.” Journal of the Royal Statistical Society. Series C (Applied Statistics), vol. 8, no. 1, pp. 26–41. EHRENBERG, A. S. C., BOUND J. A. (2000). “Turning Data into Knowledge.” Marketing Research: State of the Art Perspectives (the Handbook of the American Marketing Association and the Professional Market Research Society). Chicago (IL): American Marketing Association, pp. 23–46. EHRENBERG, A. S. C. (2000). “Diversity in Analyzing Brand-Switching Tables: The Car Challenge.” Canadian Journal of Marketing Research, vol. 19, pp. 23-39. EHRENBERG, A. S. C., UNCLES, M. D., GOODHARDT G. J. (2004). “Understanding Brand Performance Measures: Using Dirichlet Benchmarks.” Journal of Business Research, vol. 57, no. 12, pp. 1307–1325. ESKIN G. J. (1973). “Dynamic Forecasts of New Product Demand Using a Depth of Repeat Model.” Journal of Marketing Research, vol. 10, no. 2, pp. 115–29. FADER, P. S., HARDIE, B. G. S. (2005). “The Value of Simple Models in New Product Forecasting and Customer-Base Analysis.” Applied Stochastic Models in Business and Industry, vol. 21, no. 4–5, pp. 461–473. HABEL, C., RUNGIE, C., GEURSEN, G., KWEH, J. (2003). “Common Ground for Bass and NBD/Dirichlet: Is Conditional Trend Analysis the Bridge?” In. Australian & New Zealand Marketing Academy. [online]. Available from: https://digital.library.adelaide.edu.au/dspace/handle/2440/46538. KAHN, B. E., KALWANI, M. U., MORRISON, D. G. (1988). “Niching versus Change-of-Pace Brands: Using Purchase Frequencies and Penetration Rates to Infer Brand Positionings.” Journal of Marketing Research, pp. 384–390. KAHN, K. B. (2002). “An Exploratory Investigation of New Product Forecasting Practices.” Journal of Product Innovation Management, vol. 19, no. 2, pp. 133–143. KOHLI, R., LEHMANN, D. R., PAE, J. (1999). “Extent and Impact of Incubation Time in New Product Diffusion.” Journal of Product Innovation Management, vol. 16, no. 2, pp. 134–144.
131
LYNN, G. S., SCHNAARS, S. P., SKOV, R B. (1999). “A Survey of New Product Forecasting Practices in Industrial High Technology and Low Technology Businesses.” Industrial Marketing Management, vol. 28, no. 6, pp. 565–71. MAHAJAN, V., MULLER, E., BASS, F. M. (1991). “New Product Diffusion Models in Marketing: A Review and Directions for Research.” In Diffusion of Technologies and Social Behavior, edited by Dr Nebojša Nakićenović and Dr Arnulf Grübler, Springer Berlin Heidelberg, pp. 125–77. MAHAJAN, V., MULLER, E., WIND, Y. (2000). New-Product Diffusion Models. Vol. 11. Springer Science & Business Media. [online]. Available from: https://books.google.com/books?hl=uk&lr=lang_en| lang_pl&id=Fz9aZQCjHWMC&oi=fnd&pg=PR7&dq=mahajan+muller+wind+2000&ots=_ZnKMefLD-&sig=jZYiTAWZPMRmIJeqTE3a88mfxxs. MAHAJAN, V., PETERSON, R. A. (1985). “Models for Innovation Diffusion. Series: Quantitative Applications in the Social Sciences.” Sara Miller McCune, Sage Publications, Inc, 87. MASSY, W. F. (1969). “Forecasting the Demand for New Convenience Products.” Journal of Marketing Research, pp. 405–412. MCDONALD, C., EHRENBERG, A. S. C. (2002). “Personal Buying Is like Family Shopping.” R&DI Report. South Bank University. MEADE, N. (1984). “The Use of Growth Curves in Forecasting Market Development—a Review and Appraisal.” Journal of Forecasting, vol. 3, no. 4, pp. 429–451. MEADE, N., ISLAM, T. (2001). “Forecasting the Diffusion of Innovations: Implications for Time-Series Extrapolation.” In Principles of Forecasting, 577–595. Springer. [online]. Available from: http://link.springer.com/chapter/10.1007/978-0-306-47630-3_26. MEADE, N., ISLAM, T. (2006). “Modelling and Forecasting the Diffusion of Innovation–A 25-Year Review.” International Journal of Forecasting, vol. 22, no. 3, pp. 519–545. PERES, R., MULLER, E., MAHAJAN, V. (2010). “Innovation Diffusion and New Product Growth Models: A Critical Review and Research Directions.” International Journal of Research in Marketing, vol. 27, no. 2, pp. 91–106. PICKFORD, C., GOODHARDT, G. J. (2000). “An Empirical Study of Buying Behaviour in an Industrial Market.” In Proceedings of the Academy of Marketing Annual Conference, University of Derby, UK. SCRIVEN, J., EHRENBERG, A. (1994). “Brand Loyalty: Now You See It, Now You Don’t.” Marketing and Research Today, vol. 22, no. 2, pp. 99–99. UNCLES, M. D., EHRENBERG, A. S. C. (1990). “Industrial Buying Behavior: Aviation Fuel Contracts.” International Journal of Research in Marketing, vol. 7, no. 1, pp. 57–68.
132
BEHAVIOUR PATTERNS OF POLISH START-UPS Joanna Małecka, Teresa Łuczka Poznań University of Technology Faculty of Management Engineering ul. Strzelecka 11 60-965 Poznań Poland e-mail: [email protected], [email protected] Abstract The importance of individual sectors in the economy and the directions and pace of its development are usually determined by innovative trends. Due to their flexibility and agility in adapting to the changing market situation in today’s economies, small businesses adjust and implement changes most quickly, thereby building and increasing their competitive advantage. From this point of view, it is important to study and analyses the sources of inspiration, carriers and ways of implementation of innovation in start-ups.The article aims to present the role of capital market solutions in obtaining sources of financing for development of small and medium-sized enterprises in Poland. The paper describes the outcomes of the survey conducted by Startup Poland from 10 June to 15 September 2015. This survey covers 17% of the population that responded to the questionnaire, meaning exactly 423 start-ups out of 2,432 invited to take part. The gathered data were analysed to depict the essence and place of start-ups in the Polish economy. The article presents the role and significance of start-ups as well as directions and pace of their development in Poland based on an analysis of the results obtained by Startup Poland. Products and sectors have been examined as the starting point for the analysis of start-up internationalisation and involvement in globalisation. Keywords: private equity, SME, start-up, venture capital JEL Codes: G24, L25, L26, M13 1. Introduction
The essential feature of small and medium-sized enterprises is their rapid adaptation to the changing ecosystem as well as legal and market conditions. They are often referred to as agile or flexible because they smoothly respond to local, regional, national and even international needs. In each enterprise, regardless of its size, many cyclical stages of development can be distinguished, but undeniably the most important one is the start (see also: Gompers et al., 2007, pp. 1–23). It is therefore worth noting what this stage looks like in companies with globally recognisable logos such as Hewlett Packard, Facebook, Google and Uber. Suddenly, venture capital and start-up as such are taking on a new meaning, becoming a tremendous opportunity for financial success through the use of sources of financing by means of capital market instruments.
The related literature contains many definitions and descriptions of start-ups identified as (1) enterprises in the development stage, (2) small new-tech companies, or (3) enterprises where information processing and technology-based products are a key component of their business models. However, the most common definitions were provided by Steve Blank and Bob Dorf describing a start-up as (4) a temporary organisation searching for a profitable, scalable and repetitive business model, and by Eric Ries stating that (5) a start-up is an organisation that develops products and services under extreme uncertainty (Blank and Dorf, 2012; Ries, 2011). The picture is complemented by Alexander Osterwalder’s proposal (6) according to which a business model describes how the organisation creates values and secures and gains profits from them (Osterwalder and Pigneur, 2010; Osterwalder, 2008). A start-up can thus be clearly defined as a specific sphere of entrepreneurship as it concerns the smallest entrepreneurs who have a strong impact on the economic indices in each economy.
Innovative activity is still another issue. In line with its definition, it should be at the heart of start-up development, which is contrary to company size and the fact that nearly 99% of start-ups are micro-, small and medium-sized enterprises that make only minimum use of new technologies in Poland. According to John Biggs1, the pace of development of start-up ecosystems in Poland, although fast, is still being slackened by certain laws and regulations and the tax system, which will have to change. This is, nonetheless, associated with possible effective cooperation among municipal authorities and their openness to new
1 East Coast Editor for TechCrunch and member of the Advisory Board of the Startup Poland foundation.
133
technologies (Startup Poland, 2015, p. 13). According to Jerzy Kalinowski2, national start-ups are facing a “trap of Poland’s size”. This is because these are essentially companies that, having innovative products, also have the potential that they cannot finance in a natural way. It turns out, however, that for Polish start-ups “natural” means natural concentration of both entrepreneurs and founders of start-ups only on their country from the very outset (the so-called “curse of 38 million people”). Going further, he estimates that only one hundredth start-up may succeed in Poland since only so few entrepreneurs start business thinking globally and targeting customers worldwide (Rzeczpospolita, 2017).
Thus, a new issue arises concerning today’s knowledge-based economy and its development possibilities in the aspect of innovative projects. In the related literature, these two are inseparable. This conviction is also shared by Marek Dietl, social advisor to the President of the Republic of Poland. Yet practice shows that only one in five Polish start-ups is able to survive four years with moderate success, meaning that the likelihood of investing public money in such ventures is like that in a lottery rather than a matter of business decisions. Hence, this is “rather a task for the state, which can financially support not start-ups as such but venture capital funds that invest in start-ups” (ekonomia.rp.pl, 14.03.2017, see also: Anokhin et al., 2016, pp. 4744–4749).
The article aims to present the role of capital market solutions in acquiring financing sources for the development of small and medium-sized enterprises in Poland. To this end, preferred business models, sectors where Polish start-ups operate and their main export developments directions are analysed. An attempt has also been made to determine the trend of development of particular areas of entrepreneurship among respondents.
2. Venture Capital as a Source of Financing for SMEs
The stage-focused analysis of the private equity structure in Central and Eastern Europe in 2007–2014 has revealed that venture capital funds rank third, right after buyouts and growth capital (Małecka and Łuczka, 2016, pp. 418–431). Venture capital as being important in both micro- and macro-scale is often called pro-developmental because it is the human, human inventiveness and its impact on the improvement of economy that form a meaningful part of the whole system. Innovation is inherently associated with new technology, and new technology is, in turn, identified with dynamism and faster growth supported by globalisation (see also: Gompers and Lerner, 2001, pp. 145–168; Nanda and Rhodes-Kropf, 2013, pp. 403-418). However, it is always important that all factors affecting the development of the ecosystem that has been chosen as the main business objective are combined while developing a new venture (Figure 1).
Taking into account both micro- and macroeconomic factors, the role of the state is evident in the discussion, especially since at some stages of investment development only the state can bear the risk, being driven by the social rate of return which is, by definition, lower than the market rate of return for business entities.
It is important to look at this issue both from the entrepreneurial point of view (creation of a business idea, business uniqueness, estimation of the target group, the ways of reaching it, awareness of one’s strengths and weaknesses, but first of all finding the source of funding the idea) and from the perspective of the economy (job creation, technology development supported by research that has a direct impact on development, which in turn determines the revenues of economies and their budgets – licenses, patents, taxes), merging actions into one process and thus enabling circulation oriented towards economic growth.
2 KPMG partner.
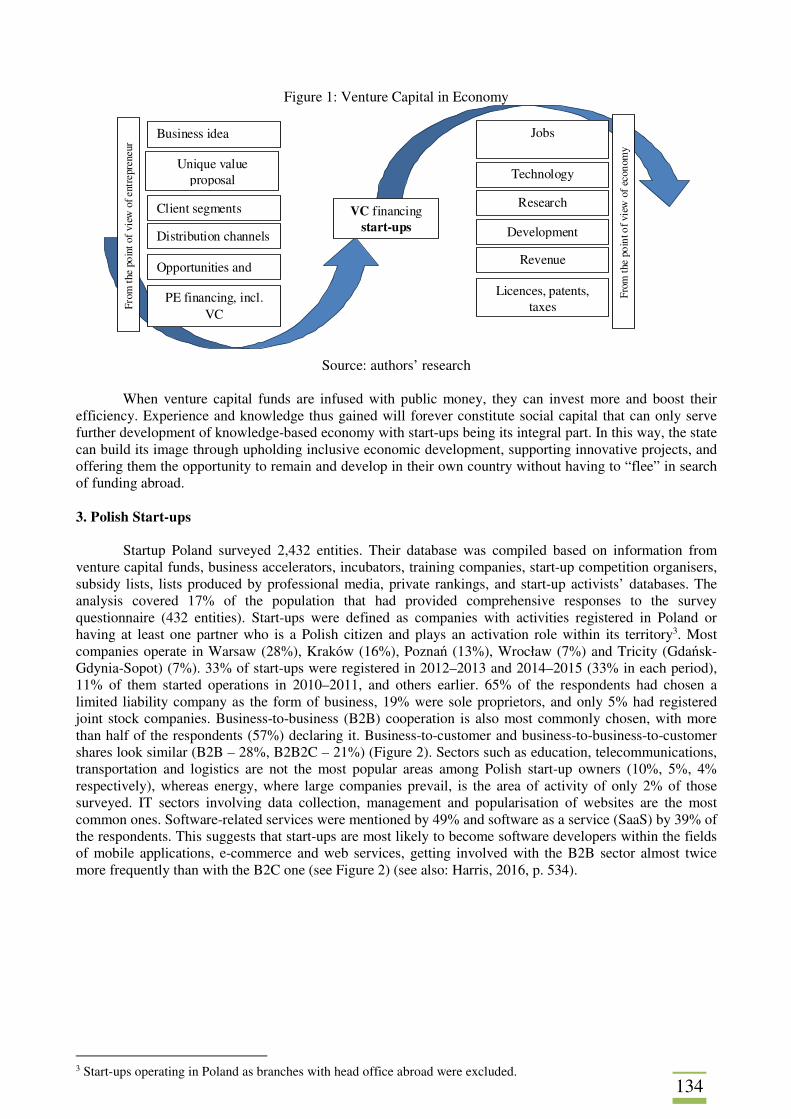
134
Figure 1: Venture Capital in Economy
Source: authors’ research
When venture capital funds are infused with public money, they can invest more and boost their
efficiency. Experience and knowledge thus gained will forever constitute social capital that can only serve further development of knowledge-based economy with start-ups being its integral part. In this way, the state can build its image through upholding inclusive economic development, supporting innovative projects, and offering them the opportunity to remain and develop in their own country without having to “flee” in search of funding abroad. 3. Polish Start-ups
Startup Poland surveyed 2,432 entities. Their database was compiled based on information from venture capital funds, business accelerators, incubators, training companies, start-up competition organisers, subsidy lists, lists produced by professional media, private rankings, and start-up activists’ databases. The analysis covered 17% of the population that had provided comprehensive responses to the survey questionnaire (432 entities). Start-ups were defined as companies with activities registered in Poland or having at least one partner who is a Polish citizen and plays an activation role within its territory3. Most companies operate in Warsaw (28%), Kraków (16%), Poznań (13%), Wrocław (7%) and Tricity (Gdańsk-Gdynia-Sopot) (7%). 33% of start-ups were registered in 2012–2013 and 2014–2015 (33% in each period), 11% of them started operations in 2010–2011, and others earlier. 65% of the respondents had chosen a limited liability company as the form of business, 19% were sole proprietors, and only 5% had registered joint stock companies. Business-to-business (B2B) cooperation is also most commonly chosen, with more than half of the respondents (57%) declaring it. Business-to-customer and business-to-business-to-customer shares look similar (B2B – 28%, B2B2C – 21%) (Figure 2). Sectors such as education, telecommunications, transportation and logistics are not the most popular areas among Polish start-up owners (10%, 5%, 4% respectively), whereas energy, where large companies prevail, is the area of activity of only 2% of those surveyed. IT sectors involving data collection, management and popularisation of websites are the most common ones. Software-related services were mentioned by 49% and software as a service (SaaS) by 39% of the respondents. This suggests that start-ups are most likely to become software developers within the fields of mobile applications, e-commerce and web services, getting involved with the B2B sector almost twice more frequently than with the B2C one (see Figure 2) (see also: Harris, 2016, p. 534).
3 Start-ups operating in Poland as branches with head office abroad were excluded.
Business idea Jobs
Licences, patents, taxes
Technology
Research
Development
Revenue
Unique value proposal
Client segments
Distribution channels
VC financing start-ups
Opportunities and
PE financing, incl. VC
From
the
poin
t of
view
of e
ntre
pren
eur
From
the
poin
t of v
iew
of
econ
omy
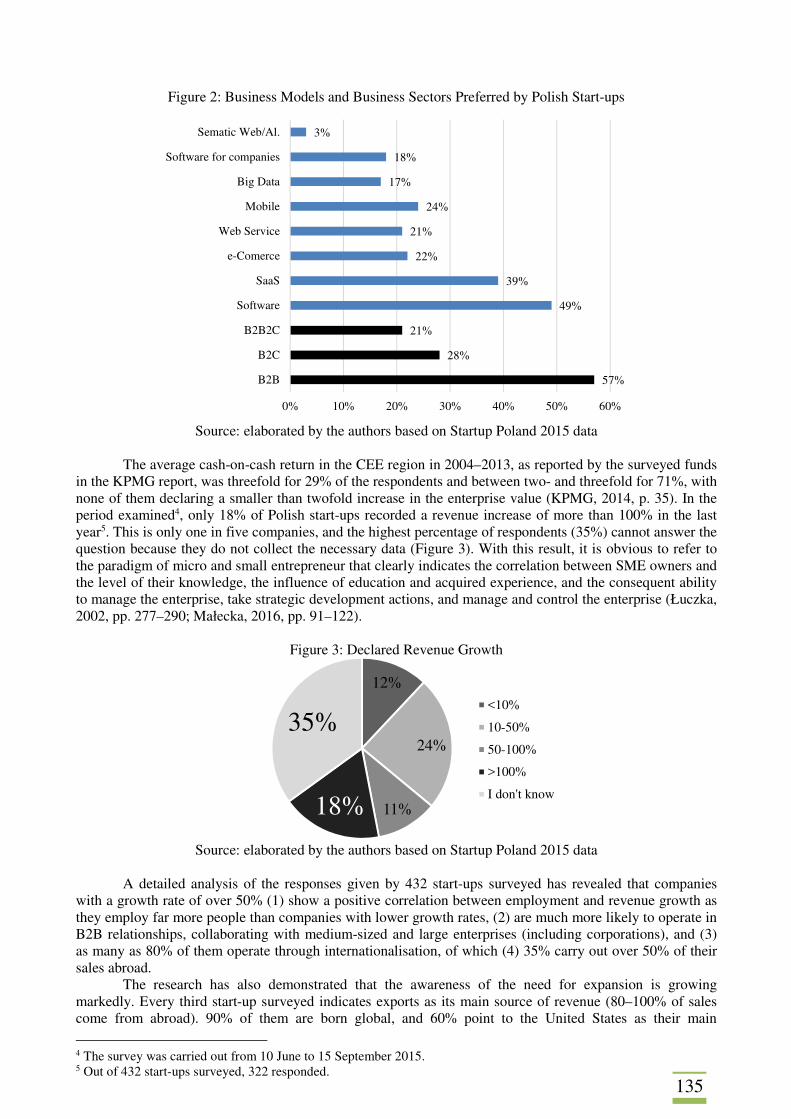
135
Figure 2: Business Models and Business Sectors Preferred by Polish Start-ups
Source: elaborated by the authors based on Startup Poland 2015 data
The average cash-on-cash return in the CEE region in 2004–2013, as reported by the surveyed funds
in the KPMG report, was threefold for 29% of the respondents and between two- and threefold for 71%, with none of them declaring a smaller than twofold increase in the enterprise value (KPMG, 2014, p. 35). In the period examined4, only 18% of Polish start-ups recorded a revenue increase of more than 100% in the last year5. This is only one in five companies, and the highest percentage of respondents (35%) cannot answer the question because they do not collect the necessary data (Figure 3). With this result, it is obvious to refer to the paradigm of micro and small entrepreneur that clearly indicates the correlation between SME owners and the level of their knowledge, the influence of education and acquired experience, and the consequent ability to manage the enterprise, take strategic development actions, and manage and control the enterprise (Łuczka, 2002, pp. 277–290; Małecka, 2016, pp. 91–122).
Figure 3: Declared Revenue Growth
Source: elaborated by the authors based on Startup Poland 2015 data
A detailed analysis of the responses given by 432 start-ups surveyed has revealed that companies
with a growth rate of over 50% (1) show a positive correlation between employment and revenue growth as they employ far more people than companies with lower growth rates, (2) are much more likely to operate in B2B relationships, collaborating with medium-sized and large enterprises (including corporations), and (3) as many as 80% of them operate through internationalisation, of which (4) 35% carry out over 50% of their sales abroad.
The research has also demonstrated that the awareness of the need for expansion is growing markedly. Every third start-up surveyed indicates exports as its main source of revenue (80–100% of sales come from abroad). 90% of them are born global, and 60% point to the United States as their main
4 The survey was carried out from 10 June to 15 September 2015. 5 Out of 432 start-ups surveyed, 322 responded.
57%
28%
21%
49%
39%
22%
21%
24%
17%
18%
3%
0% 10% 20% 30% 40% 50% 60%
B2B
B2C
B2B2C
Software
SaaS
e-Comerce
Web Service
Mobile
Big Data
Software for companies
Sematic Web/Al.
12%
24%
11%18%
35%<10%
10-50%
50-100%
>100%
I don't know
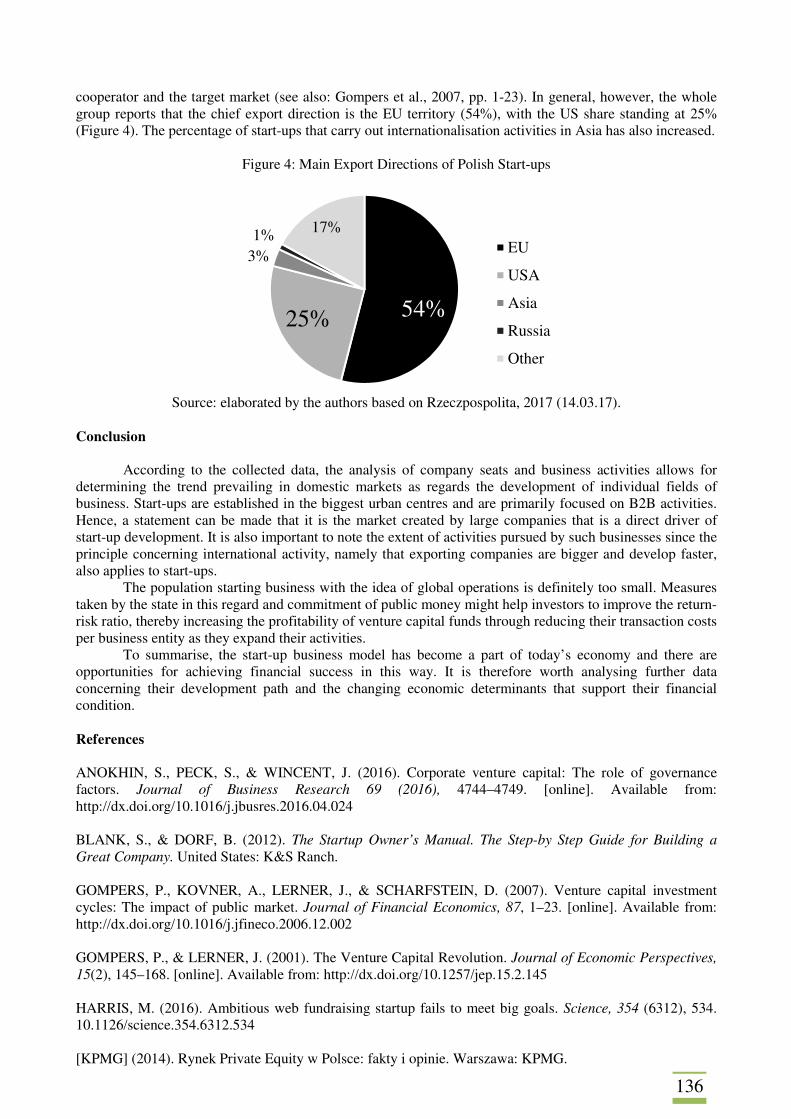
136
cooperator and the target market (see also: Gompers et al., 2007, pp. 1-23). In general, however, the whole group reports that the chief export direction is the EU territory (54%), with the US share standing at 25% (Figure 4). The percentage of start-ups that carry out internationalisation activities in Asia has also increased.
Figure 4: Main Export Directions of Polish Start-ups
Source: elaborated by the authors based on Rzeczpospolita, 2017 (14.03.17).
Conclusion
According to the collected data, the analysis of company seats and business activities allows for determining the trend prevailing in domestic markets as regards the development of individual fields of business. Start-ups are established in the biggest urban centres and are primarily focused on B2B activities. Hence, a statement can be made that it is the market created by large companies that is a direct driver of start-up development. It is also important to note the extent of activities pursued by such businesses since the principle concerning international activity, namely that exporting companies are bigger and develop faster, also applies to start-ups.
The population starting business with the idea of global operations is definitely too small. Measures taken by the state in this regard and commitment of public money might help investors to improve the return-risk ratio, thereby increasing the profitability of venture capital funds through reducing their transaction costs per business entity as they expand their activities.
To summarise, the start-up business model has become a part of today’s economy and there are opportunities for achieving financial success in this way. It is therefore worth analysing further data concerning their development path and the changing economic determinants that support their financial condition.
References ANOKHIN, S., PECK, S., & WINCENT, J. (2016). Corporate venture capital: The role of governance factors. Journal of Business Research 69 (2016), 4744–4749. [online]. Available from: http://dx.doi.org/10.1016/j.jbusres.2016.04.024 BLANK, S., & DORF, B. (2012). The Startup Owner’s Manual. The Step-by Step Guide for Building a Great Company. United States: K&S Ranch. GOMPERS, P., KOVNER, A., LERNER, J., & SCHARFSTEIN, D. (2007). Venture capital investment cycles: The impact of public market. Journal of Financial Economics, 87, 1–23. [online]. Available from: http://dx.doi.org/10.1016/j.jfineco.2006.12.002 GOMPERS, P., & LERNER, J. (2001). The Venture Capital Revolution. Journal of Economic Perspectives, 15(2), 145–168. [online]. Available from: http://dx.doi.org/10.1257/jep.15.2.145 HARRIS, M. (2016). Ambitious web fundraising startup fails to meet big goals. Science, 354 (6312), 534. 10.1126/science.354.6312.534 [KPMG] (2014). Rynek Private Equity w Polsce: fakty i opinie. Warszawa: KPMG.
54%25%
3%1% 17%
EU
USA
Asia
Russia
Other

137
ŁUCZKA, T. (2002). New challenges for SMEs in 21st century. In: B. Piasecki (Ed.), Entrepreneurship and Small Business Development in the 21st Century (pp. 277–290). Łódź: Wydawnictwo Uniwersytetu Łódzkiego. MAŁECKA, J. (2016). Revenues, expenses, profitability and investments of potential contenders for the status of a listed company in Poland. Oeconomia Copernicana, 6(4), pp 91–122. [online]. Available from: http://dx.doi.org/10.12775/OeC.2015.031 MAŁECKA, J. & ŁUCZKA, T. (2016). The structure of venture capital raising by companies in Poland and Central and Eastern Europe: Selected aspects. Proceedings Paper IMECS 2016, 418–431. Praha: Vysoka Skola Ekonomicka v Praze. NANDA, R., & RHODES-KROPF, M. (2013). Investment cycles and startup innovation. Journal of Financial Economics, 110, 403–418. [online]. Available from: http://dx.doi.org/10.1016/ j.jfineco.2013.07.001 OSTERWALDER, A. (2008). Business model canvas. Stanford. OSTERWALDER, A., & PIGNEUR, Y. (2010). Business model generation: A handbook for visionaries, game changers and challengers. Chichester West Sussex: Wiley. RIES, E. (2011). The lean startup. London: Penguin Books Ltd. [Rzeczpospolita] (2017). Ekonomia & rynek. Start-upy nie myślą globalnie. 21.03.2017. Startup Poland (2015). Polskie Start-upy. Raport 2015. A. Skala, E. Kruczkowska, & M.A. Olczak (Eds.). Warszawa: Startup Poland.
138
DECISION MAKING SOFTWARE FOR SMALL AND MEDIUM ENTERPRISES Jiří Mazurek School of Business Administration / Silesian University in Opava (Department of Mathematical Methods in Economics) Univerzitní náměstí 1934/3 733 40 Karviná Czech Republic [email protected] Abstract: Multiple criteria or group decision making plays a crucial role in business activities of every enterprise. The aim of this paper is to provide a review of decision making software developed at School of Business Administration in Karvina. OCRP Solver is a tool for group ordinal ranking solution written in Python. DAME is an alternative to Expert Choice, it is an Excel add-in for the analytic hierarchy process. Finally, Decision Adviser, also an Excel add-in, serves as an alternative to Super Decisions software, and it incorporates the analytic network process combined with a fuzzy approach. All three software tools are described and examples of solutions of given problems are provided as well. The software can be used as a support tool for small and medium enterprises, it is free of charge, easy to use and can be downloaded from University website. Keywords: decision making, multiple criteria decision making, small enterprises, software JEL-codes: C61, C88. 1. Introduction
In the recent decades a decision making became more and more complex, which resulted in an advancement of computer tools (software) helping decision makers in many areas of multiple criteria decision making and group decision making. Among the most known commercial products belong Expert Choice, the tool for the analytic hierarchy process (AHP), Super Decisions for the analytic network process (ANP), 1000Minds, DecideIt, modeFRONTIERS, VISA, Athena, IDS and many others, see for instance MCDM Society (2016). However, these products might not be suitable for small and medium sized enterprises (SME) for several reasons. Firstly, the products are rather expensive, and a user must pay for a set of modules even when he or she is interested only in one of them. Secondly, mastering of these products is usually time demanding, and especially small enterprises might find it difficult to assign one or more of their employees to this task.
Therefore, the aim of this paper is to provide a review of decision making software developed at School of Business Administration in Karvina, which is free of charge and very simple for users to work with, so it might be considered a more appropriate tool for SME. OCRP Solver is a tool for group ordinal ranking solution written in Python. DAME is an alternative to Expert Choice, it is an Excel add-in for the analytic hierarchy process. Finally, Decision Adviser, also an Excel add-in, serves as an alternative to Super Decision software, and it incorporates the analytic network process combined with a fuzzy approach. Also, the use of the three aforementioned software tools is demonstrated on examples.
The paper is organized as follows: sections 2, 3 and 4 provide description and illustrative examples for OCRP Solver, Decision Adviser and DAME respectively, and Conclusions close the article. 2. OCRP Solver 2.1. About the Software
The OCRP Solver is a result of a joint effort of OPF SU Karvina and FIT VUT Brno. It is a
command line tool written in Python, so it may run on any computer on which Python is installed, i.e., on computers running Windows, Linux, UNIX or Mac OS X operating systems. Currently the tool is able to compute a solution to an OCRP problem using four methods: Borda-Kendall’s method of marks (BAK), Maximize Agreement Heuristic (MAH), Consensus ranking model (CRM) and Distance-based ideal-seeking consensus ranking model (DCM). Description of these methods can be found in Tavana et al. (2007) or Mazurek (2010).
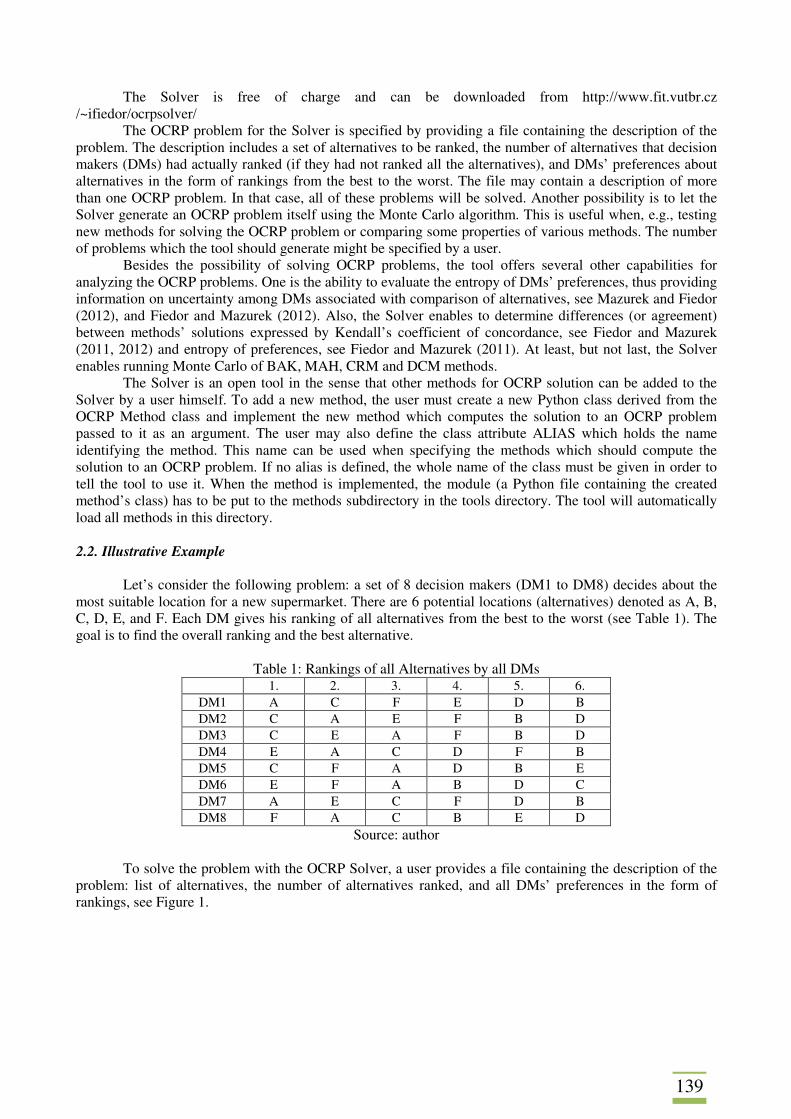
139
The Solver is free of charge and can be downloaded from http://www.fit.vutbr.cz /~ifiedor/ocrpsolver/
The OCRP problem for the Solver is specified by providing a file containing the description of the problem. The description includes a set of alternatives to be ranked, the number of alternatives that decision makers (DMs) had actually ranked (if they had not ranked all the alternatives), and DMs’ preferences about alternatives in the form of rankings from the best to the worst. The file may contain a description of more than one OCRP problem. In that case, all of these problems will be solved. Another possibility is to let the Solver generate an OCRP problem itself using the Monte Carlo algorithm. This is useful when, e.g., testing new methods for solving the OCRP problem or comparing some properties of various methods. The number of problems which the tool should generate might be specified by a user.
Besides the possibility of solving OCRP problems, the tool offers several other capabilities for analyzing the OCRP problems. One is the ability to evaluate the entropy of DMs’ preferences, thus providing information on uncertainty among DMs associated with comparison of alternatives, see Mazurek and Fiedor (2012), and Fiedor and Mazurek (2012). Also, the Solver enables to determine differences (or agreement) between methods’ solutions expressed by Kendall’s coefficient of concordance, see Fiedor and Mazurek (2011, 2012) and entropy of preferences, see Fiedor and Mazurek (2011). At least, but not last, the Solver enables running Monte Carlo of BAK, MAH, CRM and DCM methods.
The Solver is an open tool in the sense that other methods for OCRP solution can be added to the Solver by a user himself. To add a new method, the user must create a new Python class derived from the OCRP Method class and implement the new method which computes the solution to an OCRP problem passed to it as an argument. The user may also define the class attribute ALIAS which holds the name identifying the method. This name can be used when specifying the methods which should compute the solution to an OCRP problem. If no alias is defined, the whole name of the class must be given in order to tell the tool to use it. When the method is implemented, the module (a Python file containing the created method’s class) has to be put to the methods subdirectory in the tools directory. The tool will automatically load all methods in this directory. 2.2. Illustrative Example
Let’s consider the following problem: a set of 8 decision makers (DM1 to DM8) decides about the
most suitable location for a new supermarket. There are 6 potential locations (alternatives) denoted as A, B, C, D, E, and F. Each DM gives his ranking of all alternatives from the best to the worst (see Table 1). The goal is to find the overall ranking and the best alternative.
Table 1: Rankings of all Alternatives by all DMs 1. 2. 3. 4. 5. 6.
DM1 A C F E D B DM2 C A E F B D DM3 C E A F B D DM4 E A C D F B DM5 C F A D B E DM6 E F A B D C DM7 A E C F D B DM8 F A C B E D
Source: author To solve the problem with the OCRP Solver, a user provides a file containing the description of the
problem: list of alternatives, the number of alternatives ranked, and all DMs’ preferences in the form of rankings, see Figure 1.
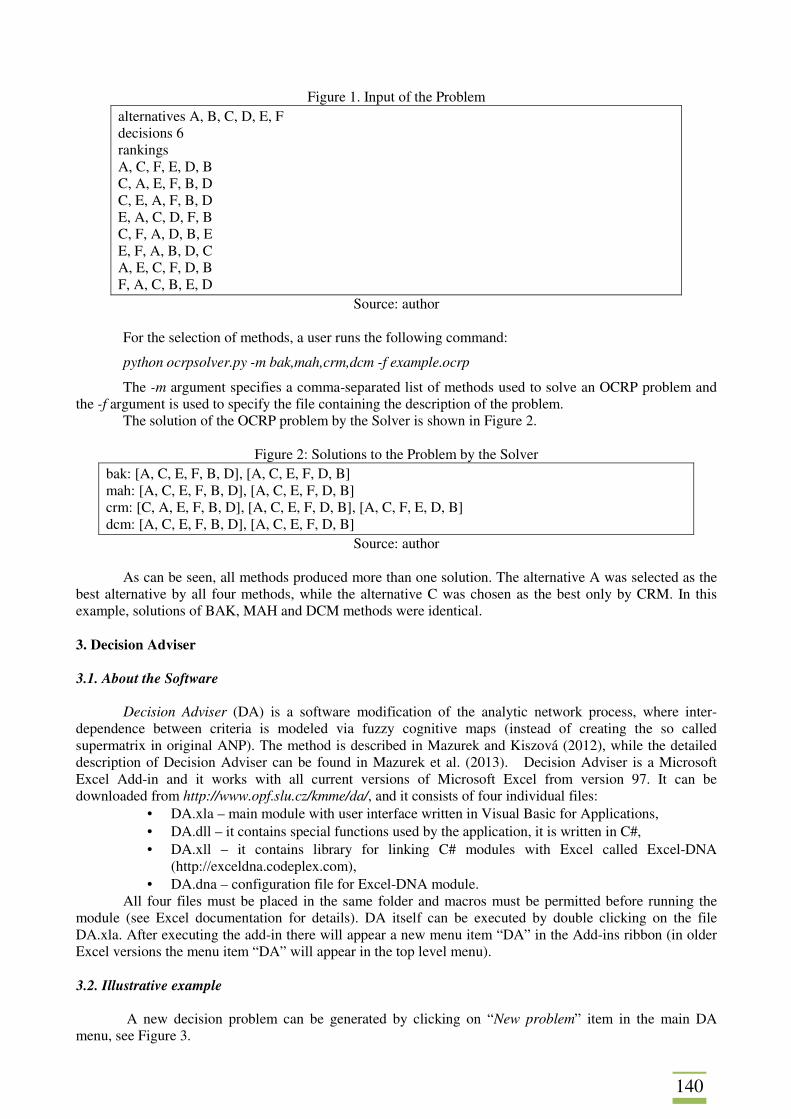
140
Figure 1. Input of the Problem alternatives A, B, C, D, E, F decisions 6 rankings A, C, F, E, D, B C, A, E, F, B, D C, E, A, F, B, D E, A, C, D, F, B C, F, A, D, B, E E, F, A, B, D, C A, E, C, F, D, B F, A, C, B, E, D
Source: author
For the selection of methods, a user runs the following command:
python ocrpsolver.py -m bak,mah,crm,dcm -f example.ocrp
The -m argument specifies a comma-separated list of methods used to solve an OCRP problem and the -f argument is used to specify the file containing the description of the problem.
The solution of the OCRP problem by the Solver is shown in Figure 2.
Figure 2: Solutions to the Problem by the Solver bak: [A, C, E, F, B, D], [A, C, E, F, D, B] mah: [A, C, E, F, B, D], [A, C, E, F, D, B] crm: [C, A, E, F, B, D], [A, C, E, F, D, B], [A, C, F, E, D, B] dcm: [A, C, E, F, B, D], [A, C, E, F, D, B]
Source: author
As can be seen, all methods produced more than one solution. The alternative A was selected as the best alternative by all four methods, while the alternative C was chosen as the best only by CRM. In this example, solutions of BAK, MAH and DCM methods were identical. 3. Decision Adviser 3.1. About the Software
Decision Adviser (DA) is a software modification of the analytic network process, where inter-
dependence between criteria is modeled via fuzzy cognitive maps (instead of creating the so called supermatrix in original ANP). The method is described in Mazurek and Kiszová (2012), while the detailed description of Decision Adviser can be found in Mazurek et al. (2013). Decision Adviser is a Microsoft Excel Add-in and it works with all current versions of Microsoft Excel from version 97. It can be downloaded from http://www.opf.slu.cz/kmme/da/, and it consists of four individual files:
• DA.xla – main module with user interface written in Visual Basic for Applications, • DA.dll – it contains special functions used by the application, it is written in C#, • DA.xll – it contains library for linking C# modules with Excel called Excel-DNA
(http://exceldna.codeplex.com), • DA.dna – configuration file for Excel-DNA module.
All four files must be placed in the same folder and macros must be permitted before running the module (see Excel documentation for details). DA itself can be executed by double clicking on the file DA.xla. After executing the add-in there will appear a new menu item “DA” in the Add-ins ribbon (in older Excel versions the menu item “DA” will appear in the top level menu).
3.2. Illustrative example
A new decision problem can be generated by clicking on “New problem” item in the main DA
menu, see Figure 3.
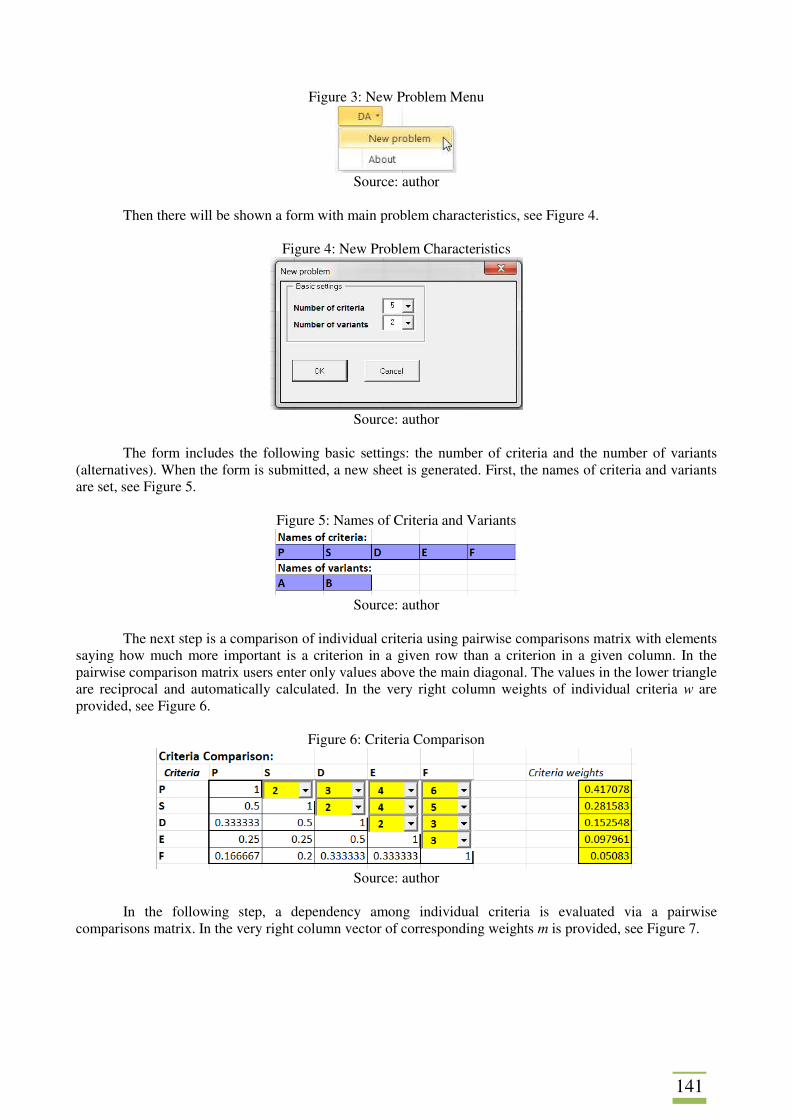
141
Figure 3: New Problem Menu
Source: author
Then there will be shown a form with main problem characteristics, see Figure 4.
Figure 4: New Problem Characteristics
Source: author
The form includes the following basic settings: the number of criteria and the number of variants
(alternatives). When the form is submitted, a new sheet is generated. First, the names of criteria and variants are set, see Figure 5.
Figure 5: Names of Criteria and Variants
Source: author
The next step is a comparison of individual criteria using pairwise comparisons matrix with elements
saying how much more important is a criterion in a given row than a criterion in a given column. In the pairwise comparison matrix users enter only values above the main diagonal. The values in the lower triangle are reciprocal and automatically calculated. In the very right column weights of individual criteria w are provided, see Figure 6.
Figure 6: Criteria Comparison
Source: author
In the following step, a dependency among individual criteria is evaluated via a pairwise
comparisons matrix. In the very right column vector of corresponding weights m is provided, see Figure 7.
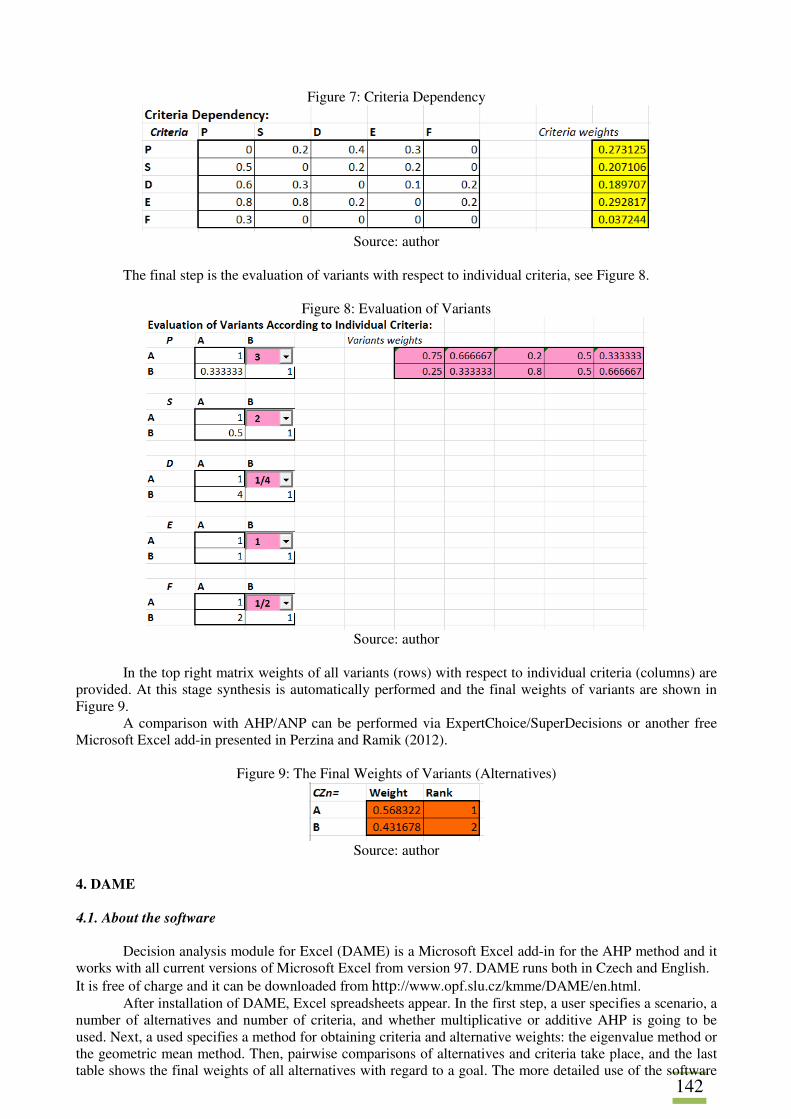
142
Figure 7: Criteria Dependency
Source: author
The final step is the evaluation of variants with respect to individual criteria, see Figure 8.
Figure 8: Evaluation of Variants
Source: author
In the top right matrix weights of all variants (rows) with respect to individual criteria (columns) are
provided. At this stage synthesis is automatically performed and the final weights of variants are shown in Figure 9.
A comparison with AHP/ANP can be performed via ExpertChoice/SuperDecisions or another free Microsoft Excel add-in presented in Perzina and Ramik (2012).
Figure 9: The Final Weights of Variants (Alternatives)
Source: author
4. DAME 4.1. About the software
Decision analysis module for Excel (DAME) is a Microsoft Excel add-in for the AHP method and it
works with all current versions of Microsoft Excel from version 97. DAME runs both in Czech and English. It is free of charge and it can be downloaded from http://www.opf.slu.cz/kmme/DAME/en.html.
After installation of DAME, Excel spreadsheets appear. In the first step, a user specifies a scenario, a number of alternatives and number of criteria, and whether multiplicative or additive AHP is going to be used. Next, a used specifies a method for obtaining criteria and alternative weights: the eigenvalue method or the geometric mean method. Then, pairwise comparisons of alternatives and criteria take place, and the last table shows the final weights of all alternatives with regard to a goal. The more detailed use of the software
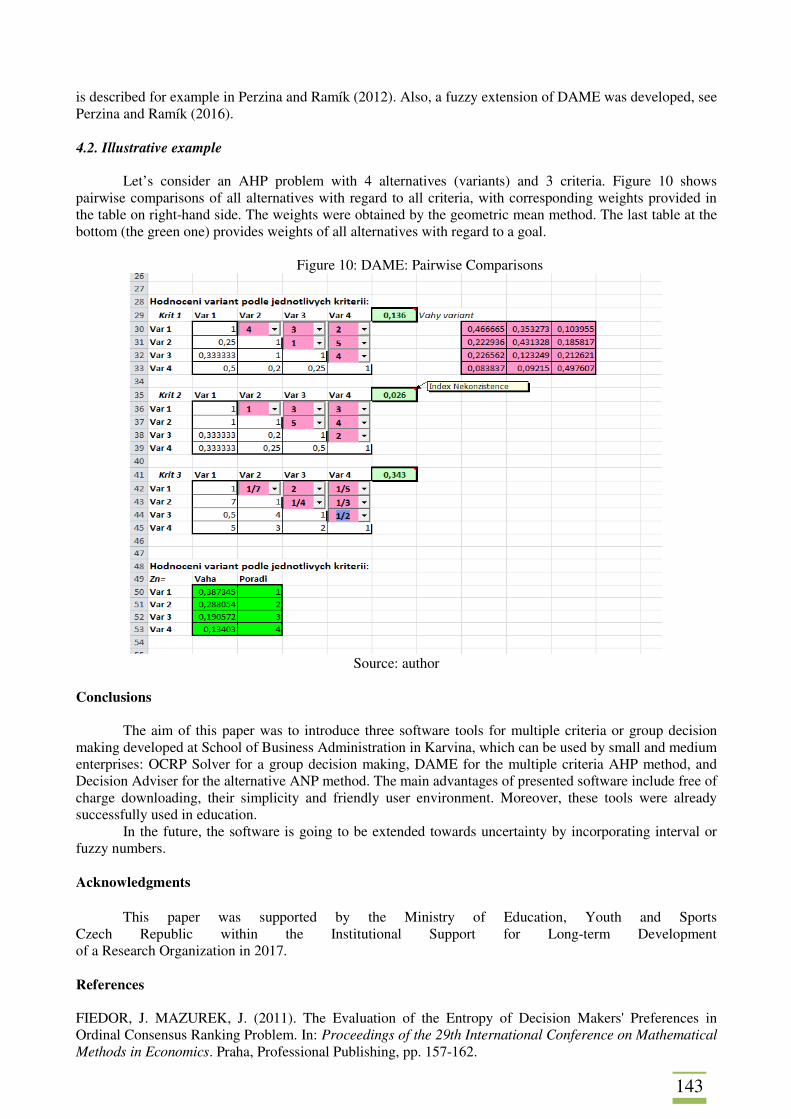
143
is described for example in Perzina and Ramík (2012). Also, a fuzzy extension of DAME was developed, see Perzina and Ramík (2016). 4.2. Illustrative example
Let’s consider an AHP problem with 4 alternatives (variants) and 3 criteria. Figure 10 shows pairwise comparisons of all alternatives with regard to all criteria, with corresponding weights provided in the table on right-hand side. The weights were obtained by the geometric mean method. The last table at the bottom (the green one) provides weights of all alternatives with regard to a goal.
Figure 10: DAME: Pairwise Comparisons
Source: author
Conclusions
The aim of this paper was to introduce three software tools for multiple criteria or group decision making developed at School of Business Administration in Karvina, which can be used by small and medium enterprises: OCRP Solver for a group decision making, DAME for the multiple criteria AHP method, and Decision Adviser for the alternative ANP method. The main advantages of presented software include free of charge downloading, their simplicity and friendly user environment. Moreover, these tools were already successfully used in education.
In the future, the software is going to be extended towards uncertainty by incorporating interval or fuzzy numbers. Acknowledgments
This paper was supported by the Ministry of Education, Youth and Sports Czech Republic within the Institutional Support for Long-term Development of a Research Organization in 2017. References FIEDOR, J. MAZUREK, J. (2011). The Evaluation of the Entropy of Decision Makers' Preferences in Ordinal Consensus Ranking Problem. In: Proceedings of the 29th International Conference on Mathematical Methods in Economics. Praha, Professional Publishing, pp. 157-162.

144
FIEDOR, J. MAZUREK, J. (2012). Optimizing permutation methods for the ordinal ranking problem. In: Proceedings of the 30th international conference Mathematical methods in economics. OPF SU Karviná, pp. 160-165. MAZUREK, J. (2010). Group Decision Making in Ordinal Consensus Ranking Problem. In: Proceedings of the 28th International Conference on Mathematical methods in Economy, České Budějovice, pp. 429-434. MAZUREK, J., FIEDOR, J. (2012). The Decision Support Tool for the Ordinal Consensus Ranking Problem. In: Conference Proceedings of the International Scientific Conference ICT for Competitiveness. OPF SU Karviná, pp. 184-189. MAZUREK, J., KISZOVÁ, Z. (2012). Modeling Dependence and Feedback in ANP with Fuzzy Cognitive Maps. In: Proceedings of the 30th International Conference Mathematical Methods in Economics. OPF SU, Karviná, pp. 558-563. MAZUREK, J., PERZINA, R., KISZOVÁ, Z. (2013). The Evaluation of Weights of Interdependent Criteria With the Decision Adviser: an Alternative Approach to the Analytic Network Process. WERProcedia Information, Technology and Computer Science, vol. 3, pp. 1319-1329. MCDM Society. (2016). [online]. Available from: http://www.mcdmsociety.org/soft.html. PERZINA, R., RAMÍK, J. (2012). DAME - Microsoft Excel Add-in for Solving Multicriteria Decision Problems with Scenarios. In: Proceedings of the 30th International Conference Mathematical Methods in Economics. OPF SU, Karvina, pp. 697-702. PERZINA, R., RAMÍK, J. (2016). Fuzzy Decision Analysis Module for Excel. In: Conference Proceedings of 34th International Conference Mathematical Methods in Economics. Liberec: Technical University, pp. 663-668. TAVANA, M., LOPINTO, F., SMITHER, J. W. (2007). A Hybrid Distance-Based Ideal-Seeking Consensus Ranking Model. Journal of Applied Mathematics and Decision Sciences.
145
DEPENDENCE OF SME EMPLOYMENT ON MACROECONOMIC FACTORS Elena Mielcová Silesian University in Opava School of Business Administration in Karviná, Department of Informatics and Mathematics Univerzitní náměstí 1934/3 Karviná, 73340 Czech Republic e-mail: [email protected] Abstract
Employment in the sector of small and medium enterprises plays a substantial role when big employers decrease employee numbers. The trend when labor market ‘big players’ leave positions of labor intensive productions in labor expensive countries leads to high unemployment in such countries. This increased unemployment is partly compensated by jobs in newly created enterprises. This study tries to reveal main economic factors behind this trend. Thus, the main aim of this study is to compare overall employment in the selected sector of small and medium enterprises on economic variables on data from selected countries of European Union – namely the Czech Republic and its neighbors – Germany, Austria, Poland, and Slovakia. Keywords: employment in SMEs, macroeconomic factors, panel data JEL codes: J21 1. Introduction
The main aim of this text is to compare overall employment in the sector “Transportation and Storage” of small and medium enterprises on main economic variables – namely exports and GDP for selected countries of European Union – the Czech Republic and its neighbors – Germany, Austria, Poland, and Slovakia. The focus will be on the segment of small and medium enterprises, defined with respect to European Commission rules.
In general, in accord with European Commission recommendations, small and medium enterprises (SMEs) are enterprises with less than 250 persons employed, with an annual turnover of up to EUR 50 million, or a balance sheet total of no more than EUR 43 million.
Small and medium enterprises can be studied from different points of view. This study is mostly concerned by the impact of macroeconomic performance of the country on the employment in different size enterprises in the segment of transportation and storage. As transportation and storage employment levels reflect the circulation of goods and services in economy, we could expect the positive impact of both export and GDP on the control variable. The relationship between export variables and productivity in economics was studied by Leichenko (2000) with uncertain results. He argued that “Export growth is found to promote increased production and higher productivity, but higher production and higher productivity also lead to export growth”.
Labor levels in SMEs was studied for example in Major (2008), who found, that the small and medium enterprises are more labor intensive, while they lack of capital assets. Assiedu and Freeman (2007) focused on the impact of globalization on profits of SMEs in the U.S. They concluded that profits of SMEs are dependent on the industry, income per capita and globalization measure (assets of multinational corporations). They also studied effect of ethnicity of owners on outcome of SMEs.
The first step of the analysis is to determine the break dates on overall economy data, which covers unit root tests, and break points unit roots analysis. The second step in the analysis is the determination of basic trends in data, as well as discussion of similarities and differences through countries and enterprise sizes. Then the basic dependencies in SME data will be studied using regular and panel regression analysis.
The text is structured as follows: the theoretical background to unit root and the break point unit root analysis is given in the second part of the text. The third section covers obtained results and discussion, followed by conclusions and the list of references.
2. Theoretical Background
The main aim of the next analysis is to determine break points and to check for basic relationships.
As we intend to investigate the break point analysis, we need first to test a stationarity of the process for each
146
variable, which means to use the Dickey-Fuller test for unit roots for data. The Dickey-Fuller is used to determine if the variable ρ in an estimation
ερβ ++= −10 . tt yy (1)
is not statistically different from 1. Dickey and Fuller (1976) suggested to rearrange equation (1) such that
εββερβ ++=+−+=− −−− 110101 .).1( tttt yyyy (2)
Then there is a possibility to use a t-test of the statistical significance of the estimated coefficient for lagged variable. If the coefficient )1( −ρ is not statistically significant, then the time series is expected to be stationary in the first differences, the hypothesis of unit root cannot be rejected. The null hypothesis – unit root is based on the test statistics equal to the t-ratio of the coefficient:
)( 1
1
ββ
SEDF t = (3)
In the case of more complicated relationship, the augmented Dickey-Fuller test can be used. For example, the model used for the Dickey-Fuller test with one lagged differential is of the form:
εβββ +∆++=∆ −− 12110 .. ttt yyy (4) When looking for irregularities in data, one of the suitable tools is a break point analysis, which is
also based on unit root tests. The structural breaks can occur in intercept or in a slope. In general, if the break occurs in the time series sample for time series ],2,1[ TK in time point *T such that ;*1 TT ≤≤ then the correct estimation will cover dummy variable d:
≤≤
=t*T
*Ttd
for1
for0 (5)
The estimation for break in intercept:
ttt xdy εβββ +++= 100 ' (6)
The estimation for break in slope:
ttt xdy εβββ +++= )'( 110 (7)
The estimation for break from intercept to slope:
ttt dxy εββ ++= 10 (8)
Statistical program EViews supports the automatic break date selection methods by minimization of
the Dickey-Fuller t-statistic for different values of variable d. As for the second part of the analysis, there was a problem with amount of available data. Therefore,
the ordinary least squares and panel estimation results are only roughly informative. 3. Data Description
This analysis is based on the macroeconomic data of employment, export and GDP in five European
countries, in the Czech Republic with its neighbors - Germany, Austria, Poland, and Slovakia. The first part presented analysis – determination of break points – is based on quarterly data of overall persons employed and GDP of above mentioned countries for the period of 1998-2016. The second part of the analysis is using annual data of persons employed in the sector “Transportation and Storage”, net exports, imports and GDP for the period of 2005-2014. The employment data of the sector “Transportation and Storage” cover annual data on employment in different size enterprises, namely data are divided into four main groups:
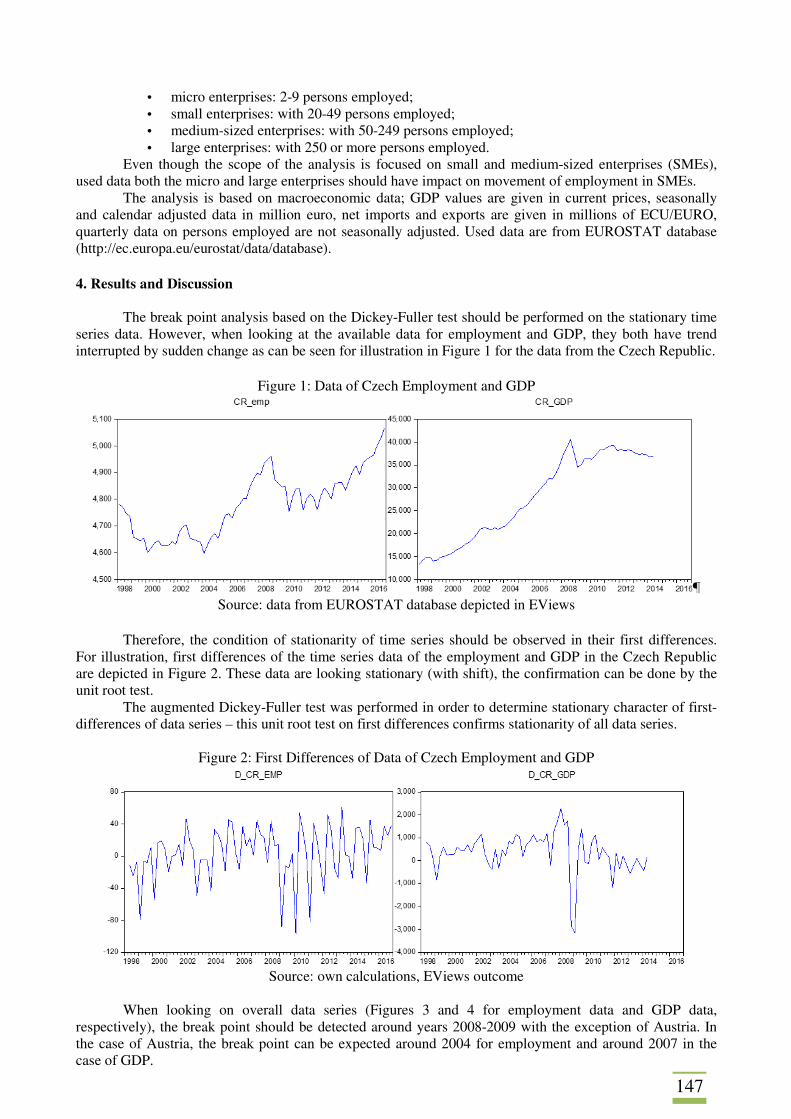
147
• micro enterprises: 2-9 persons employed; • small enterprises: with 20-49 persons employed; • medium-sized enterprises: with 50-249 persons employed; • large enterprises: with 250 or more persons employed.
Even though the scope of the analysis is focused on small and medium-sized enterprises (SMEs), used data both the micro and large enterprises should have impact on movement of employment in SMEs.
The analysis is based on macroeconomic data; GDP values are given in current prices, seasonally and calendar adjusted data in million euro, net imports and exports are given in millions of ECU/EURO, quarterly data on persons employed are not seasonally adjusted. Used data are from EUROSTAT database (http://ec.europa.eu/eurostat/data/database).
4. Results and Discussion
The break point analysis based on the Dickey-Fuller test should be performed on the stationary time series data. However, when looking at the available data for employment and GDP, they both have trend interrupted by sudden change as can be seen for illustration in Figure 1 for the data from the Czech Republic.
Figure 1: Data of Czech Employment and GDP
Source: data from EUROSTAT database depicted in EViews
Therefore, the condition of stationarity of time series should be observed in their first differences. For illustration, first differences of the time series data of the employment and GDP in the Czech Republic are depicted in Figure 2. These data are looking stationary (with shift), the confirmation can be done by the unit root test.
The augmented Dickey-Fuller test was performed in order to determine stationary character of first-differences of data series – this unit root test on first differences confirms stationarity of all data series.
Figure 2: First Differences of Data of Czech Employment and GDP
Source: own calculations, EViews outcome
When looking on overall data series (Figures 3 and 4 for employment data and GDP data, respectively), the break point should be detected around years 2008-2009 with the exception of Austria. In the case of Austria, the break point can be expected around 2004 for employment and around 2007 in the case of GDP.
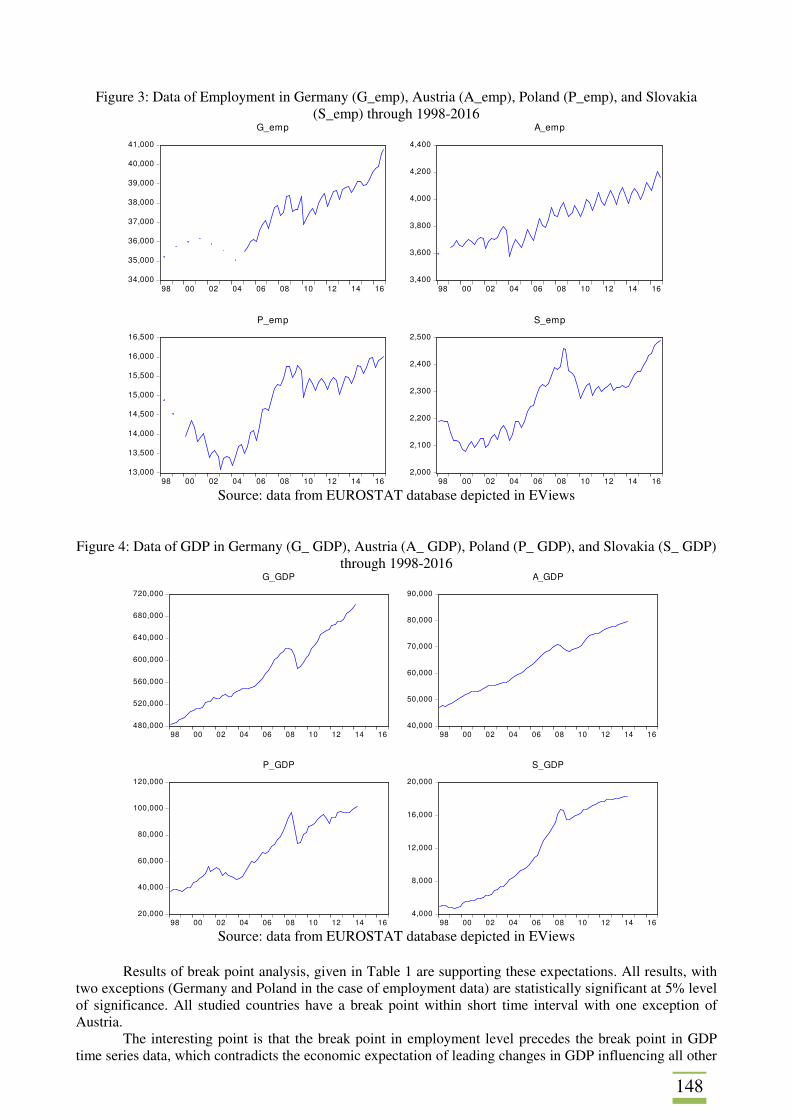
148
Figure 3: Data of Employment in Germany (G_emp), Austria (A_emp), Poland (P_emp), and Slovakia (S_emp) through 1998-2016
34,000
35,000
36,000
37,000
38,000
39,000
40,000
41,000
98 00 02 04 06 08 10 12 14 16
G_emp
3,400
3,600
3,800
4,000
4,200
4,400
98 00 02 04 06 08 10 12 14 16
A_emp
13,000
13,500
14,000
14,500
15,000
15,500
16,000
16,500
98 00 02 04 06 08 10 12 14 16
P_emp
2,000
2,100
2,200
2,300
2,400
2,500
98 00 02 04 06 08 10 12 14 16
S_emp
Source: data from EUROSTAT database depicted in EViews
Figure 4: Data of GDP in Germany (G_ GDP), Austria (A_ GDP), Poland (P_ GDP), and Slovakia (S_ GDP) through 1998-2016
480,000
520,000
560,000
600,000
640,000
680,000
720,000
98 00 02 04 06 08 10 12 14 16
G_GDP
40,000
50,000
60,000
70,000
80,000
90,000
98 00 02 04 06 08 10 12 14 16
A_GDP
20,000
40,000
60,000
80,000
100,000
120,000
98 00 02 04 06 08 10 12 14 16
P_GDP
4,000
8,000
12,000
16,000
20,000
98 00 02 04 06 08 10 12 14 16
S_GDP
Source: data from EUROSTAT database depicted in EViews
Results of break point analysis, given in Table 1 are supporting these expectations. All results, with
two exceptions (Germany and Poland in the case of employment data) are statistically significant at 5% level of significance. All studied countries have a break point within short time interval with one exception of Austria.
The interesting point is that the break point in employment level precedes the break point in GDP time series data, which contradicts the economic expectation of leading changes in GDP influencing all other
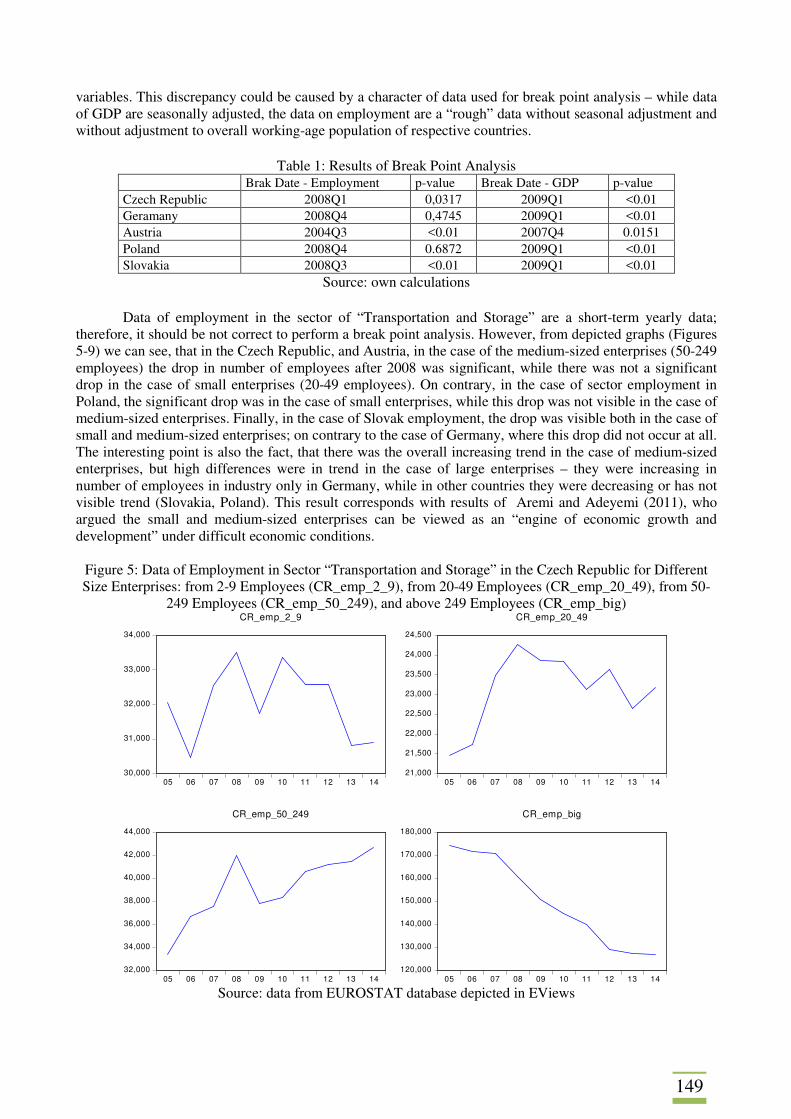
149
variables. This discrepancy could be caused by a character of data used for break point analysis – while data of GDP are seasonally adjusted, the data on employment are a “rough” data without seasonal adjustment and without adjustment to overall working-age population of respective countries.
Table 1: Results of Break Point Analysis
Brak Date - Employment p-value Break Date - GDP p-value Czech Republic 2008Q1 0,0317 2009Q1 <0.01 Geramany 2008Q4 0,4745 2009Q1 <0.01 Austria 2004Q3 <0.01 2007Q4 0.0151 Poland 2008Q4 0.6872 2009Q1 <0.01 Slovakia 2008Q3 <0.01 2009Q1 <0.01
Source: own calculations Data of employment in the sector of “Transportation and Storage” are a short-term yearly data;
therefore, it should be not correct to perform a break point analysis. However, from depicted graphs (Figures 5-9) we can see, that in the Czech Republic, and Austria, in the case of the medium-sized enterprises (50-249 employees) the drop in number of employees after 2008 was significant, while there was not a significant drop in the case of small enterprises (20-49 employees). On contrary, in the case of sector employment in Poland, the significant drop was in the case of small enterprises, while this drop was not visible in the case of medium-sized enterprises. Finally, in the case of Slovak employment, the drop was visible both in the case of small and medium-sized enterprises; on contrary to the case of Germany, where this drop did not occur at all. The interesting point is also the fact, that there was the overall increasing trend in the case of medium-sized enterprises, but high differences were in trend in the case of large enterprises – they were increasing in number of employees in industry only in Germany, while in other countries they were decreasing or has not visible trend (Slovakia, Poland). This result corresponds with results of Aremi and Adeyemi (2011), who argued the small and medium-sized enterprises can be viewed as an “engine of economic growth and development” under difficult economic conditions.
Figure 5: Data of Employment in Sector “Transportation and Storage” in the Czech Republic for Different Size Enterprises: from 2-9 Employees (CR_emp_2_9), from 20-49 Employees (CR_emp_20_49), from 50-
249 Employees (CR_emp_50_249), and above 249 Employees (CR_emp_big)
30,000
31,000
32,000
33,000
34,000
05 06 07 08 09 10 11 12 13 14
CR_emp_2_9
21,000
21,500
22,000
22,500
23,000
23,500
24,000
24,500
05 06 07 08 09 10 11 12 13 14
CR_emp_20_49
32,000
34,000
36,000
38,000
40,000
42,000
44,000
05 06 07 08 09 10 11 12 13 14
CR_emp_50_249
120,000
130,000
140,000
150,000
160,000
170,000
180,000
05 06 07 08 09 10 11 12 13 14
CR_emp_big
Source: data from EUROSTAT database depicted in EViews
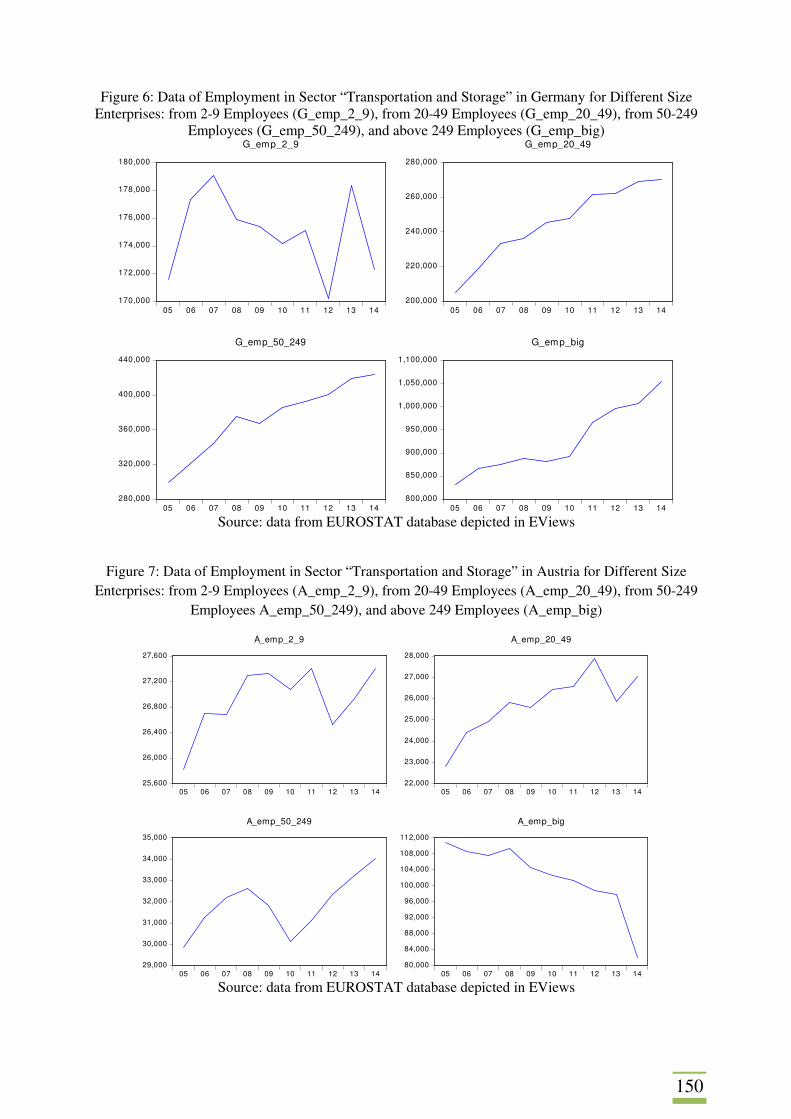
150
Figure 6: Data of Employment in Sector “Transportation and Storage” in Germany for Different Size Enterprises: from 2-9 Employees (G_emp_2_9), from 20-49 Employees (G_emp_20_49), from 50-249
Employees (G_emp_50_249), and above 249 Employees (G_emp_big)
170,000
172,000
174,000
176,000
178,000
180,000
05 06 07 08 09 10 11 12 13 14
G_emp_2_9
200,000
220,000
240,000
260,000
280,000
05 06 07 08 09 10 11 12 13 14
G_emp_20_49
280,000
320,000
360,000
400,000
440,000
05 06 07 08 09 10 11 12 13 14
G_emp_50_249
800,000
850,000
900,000
950,000
1,000,000
1,050,000
1,100,000
05 06 07 08 09 10 11 12 13 14
G_emp_big
Source: data from EUROSTAT database depicted in EViews
Figure 7: Data of Employment in Sector “Transportation and Storage” in Austria for Different Size Enterprises: from 2-9 Employees (A_emp_2_9), from 20-49 Employees (A_emp_20_49), from 50-249
Employees A_emp_50_249), and above 249 Employees (A_emp_big)
25,600
26,000
26,400
26,800
27,200
27,600
05 06 07 08 09 10 11 12 13 14
A_emp_2_9
22,000
23,000
24,000
25,000
26,000
27,000
28,000
05 06 07 08 09 10 11 12 13 14
A_emp_20_49
29,000
30,000
31,000
32,000
33,000
34,000
35,000
05 06 07 08 09 10 11 12 13 14
A_emp_50_249
80,000
84,000
88,000
92,000
96,000
100,000
104,000
108,000
112,000
05 06 07 08 09 10 11 12 13 14
A_emp_big
Source: data from EUROSTAT database depicted in EViews
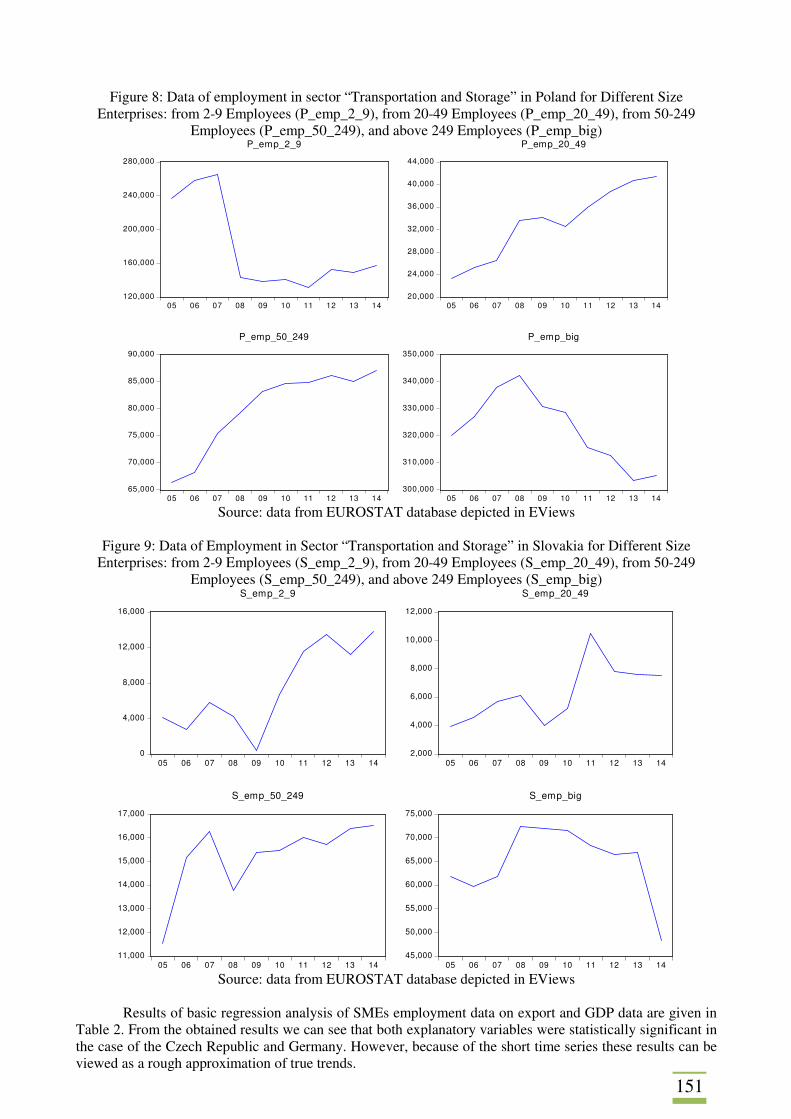
151
Figure 8: Data of employment in sector “Transportation and Storage” in Poland for Different Size Enterprises: from 2-9 Employees (P_emp_2_9), from 20-49 Employees (P_emp_20_49), from 50-249
Employees (P_emp_50_249), and above 249 Employees (P_emp_big)
120,000
160,000
200,000
240,000
280,000
05 06 07 08 09 10 11 12 13 14
P_emp_2_9
20,000
24,000
28,000
32,000
36,000
40,000
44,000
05 06 07 08 09 10 11 12 13 14
P_emp_20_49
65,000
70,000
75,000
80,000
85,000
90,000
05 06 07 08 09 10 11 12 13 14
P_emp_50_249
300,000
310,000
320,000
330,000
340,000
350,000
05 06 07 08 09 10 11 12 13 14
P_emp_big
Source: data from EUROSTAT database depicted in EViews
Figure 9: Data of Employment in Sector “Transportation and Storage” in Slovakia for Different Size
Enterprises: from 2-9 Employees (S_emp_2_9), from 20-49 Employees (S_emp_20_49), from 50-249 Employees (S_emp_50_249), and above 249 Employees (S_emp_big)
0
4,000
8,000
12,000
16,000
05 06 07 08 09 10 11 12 13 14
S_emp_2_9
2,000
4,000
6,000
8,000
10,000
12,000
05 06 07 08 09 10 11 12 13 14
S_emp_20_49
11,000
12,000
13,000
14,000
15,000
16,000
17,000
05 06 07 08 09 10 11 12 13 14
S_emp_50_249
45,000
50,000
55,000
60,000
65,000
70,000
75,000
05 06 07 08 09 10 11 12 13 14
S_emp_big
Source: data from EUROSTAT database depicted in EViews
Results of basic regression analysis of SMEs employment data on export and GDP data are given in
Table 2. From the obtained results we can see that both explanatory variables were statistically significant in the case of the Czech Republic and Germany. However, because of the short time series these results can be viewed as a rough approximation of true trends.
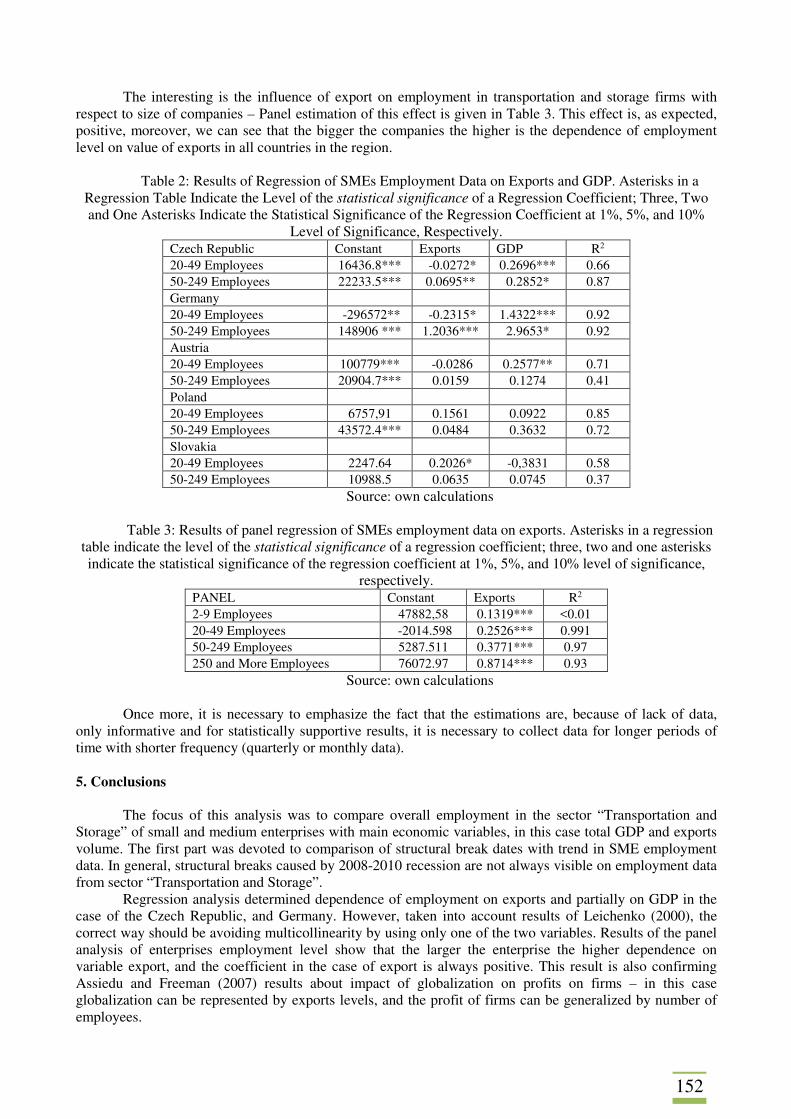
152
The interesting is the influence of export on employment in transportation and storage firms with respect to size of companies – Panel estimation of this effect is given in Table 3. This effect is, as expected, positive, moreover, we can see that the bigger the companies the higher is the dependence of employment level on value of exports in all countries in the region.
Table 2: Results of Regression of SMEs Employment Data on Exports and GDP. Asterisks in a
Regression Table Indicate the Level of the statistical significance of a Regression Coefficient; Three, Two and One Asterisks Indicate the Statistical Significance of the Regression Coefficient at 1%, 5%, and 10%
Level of Significance, Respectively. Czech Republic Constant Exports GDP R2 20-49 Employees 16436.8*** -0.0272* 0.2696*** 0.66 50-249 Employees 22233.5*** 0.0695** 0.2852* 0.87 Germany 20-49 Employees -296572** -0.2315* 1.4322*** 0.92 50-249 Employees 148906 *** 1.2036*** 2.9653* 0.92 Austria 20-49 Employees 100779*** -0.0286 0.2577** 0.71 50-249 Employees 20904.7*** 0.0159 0.1274 0.41 Poland 20-49 Employees 6757,91 0.1561 0.0922 0.85 50-249 Employees 43572.4*** 0.0484 0.3632 0.72 Slovakia 20-49 Employees 2247.64 0.2026* -0,3831 0.58 50-249 Employees 10988.5 0.0635 0.0745 0.37
Source: own calculations Table 3: Results of panel regression of SMEs employment data on exports. Asterisks in a regression
table indicate the level of the statistical significance of a regression coefficient; three, two and one asterisks indicate the statistical significance of the regression coefficient at 1%, 5%, and 10% level of significance,
respectively. PANEL Constant Exports R2 2-9 Employees 47882,58 0.1319*** <0.01 20-49 Employees -2014.598 0.2526*** 0.991 50-249 Employees 5287.511 0.3771*** 0.97 250 and More Employees 76072.97 0.8714*** 0.93
Source: own calculations Once more, it is necessary to emphasize the fact that the estimations are, because of lack of data,
only informative and for statistically supportive results, it is necessary to collect data for longer periods of time with shorter frequency (quarterly or monthly data). 5. Conclusions
The focus of this analysis was to compare overall employment in the sector “Transportation and
Storage” of small and medium enterprises with main economic variables, in this case total GDP and exports volume. The first part was devoted to comparison of structural break dates with trend in SME employment data. In general, structural breaks caused by 2008-2010 recession are not always visible on employment data from sector “Transportation and Storage”.
Regression analysis determined dependence of employment on exports and partially on GDP in the case of the Czech Republic, and Germany. However, taken into account results of Leichenko (2000), the correct way should be avoiding multicollinearity by using only one of the two variables. Results of the panel analysis of enterprises employment level show that the larger the enterprise the higher dependence on variable export, and the coefficient in the case of export is always positive. This result is also confirming Assiedu and Freeman (2007) results about impact of globalization on profits on firms – in this case globalization can be represented by exports levels, and the profit of firms can be generalized by number of employees.
153
Acknowledgement
This paper was supported by the Ministry of Education, Youth and Sports Czech Republic within the Institutional Support for Long-Term Development of a Research Organization in 2017.
References AREMU, M. A., ADEYEMI, S. L. (2011). Small and Medium Scale Enterprises as a Survival Strategy for Employment Generation in Nigeria. Journal of Sustainable Development, vol. 4, no. 1, pp. 200-206. ASIEDU, E., FREEMAN, J. (2007). The Effect of Globalization on the Performance of Small-and Medium-Sized Enterprises in the United States: Does Owners' Race/Ethnicity Matter? The American Economic Review, vol. 97, no. 2, pp. 368-372. DURBIN, J., WATSON, G. S. (1971). Testing for serial correlation in least squares regression. III. Biometrika, vol. 58, no. 1, pp. 1-19. LEICHENKO, R. (2000). Exports, Employment, and Production: A Causal Assessment of U.S. States and Regions. Economic Geography, vol. 76, no. 14, pp. 303-325. MAJOR, I. (2008). Technical Efficiency, Allocative Efficiency and Profitability in Hungarian Small and Medium-Sized Enterprises: A Model with Frontier Functions. Europe-Asia Studies, vol. 60, no. 8, pp. 1371-1396.
154
THE IMPORTANCE OF CONSTRUCTIVE CRITICAL ANALYSIS OF PROFIT CREATION AND QUANTIFICATION FOR A DECISION-MAKING ON ITS ALLOCATION Renáta Pakšiová University of Economics in Bratislava Faculty of Economic Informatics, Department of accounting and auditing Dolnozemská cesta 1 Bratislava, 852 35 Slovak Republic e-mail: [email protected] Abstract The decrease of the business property can cause a future reduction in the production ability of the enterprise to the extent causing an involuntary closing of business activities. The reduction of business property is usually caused not only by the reported loss, but also by the greater distribution of profits, as is the amount of the real level of the enterprise's distributable reserves profit of the business. A thorough analysis of the reported accounting profit must be the starting point for the allocation of profit, which does not compromise the further existence of the enterprise. It is important to be able to identify and assign a portion of the accounting profit, corresponding to the non-realised profit and fictive profit, where eventual release outside the enterprise threatens the future performance of the enterprise. These portions of the reported profit do not correspond to the actually made, realised and real production, which is a necessary condition to achieve a real profit. The division of real profit to the investors is the only thing that will not cause a threat to the existing abilities of an enterprise, neither in the short nor the long term. The decision on the way of division reported profit, any undertaking received in the present is therefore a strategic, especially in relation to the future of the business. Keywords: analysis of profit, decision-making, production ability, profit allocation JEL codes: D24, G32, M11, M40 1. Introduction
Nowadays, very actual and important problem in management of enterprises is the issue of a recognised profit quantification and its subsequent distribution. The problem is that enterprises use accrual accounting with recognised profit, but with cash flows not allowing them to continue to do business and pay out the shares smoothly. This means the enterprise needs to indebt itself to be able to provide assets recovery and pay out the shares, which leads to the expensive and uneconomic equity capital.
The greater distribution of profits, as is the amount of the real level of the enterprise's distributable reserves profit of the business causes reduction of business property and in future reduction in the production ability of the enterprise to the extent causing an involuntary closing of business activities. The analysis of the business property's changing trends of the entity should be one of the most important tasks of the financial analysis for the assessment of the financial situation of the enterprise. Very important in this context is to do thorough critical analysis of profit creation and quantification for any decision making on its allocation. A thorough analysis of the reported accounting profit must be the starting point for the allocation of profit, which does not compromise the further existence of the enterprise. 1.1 Model and Data
The aim of this paper is to analyse theoretical basis of constructive critical analysis of profit creation
and quantification for a decision-making on its allocation. The subject matter of this paper is highly actual, because profit or loss are indicators of entity's development and derive the entity's profitability and viability and determining the financial strategy of enterprises.
In this paper, several methods of examination such as analysis, comparison and synthesis were used. We examined mainly international and national legislation with an emphasis on the area of reporting and other book publications and publications in journals and conference proceedings related to research problems. Out of legislation, important were accounting law in SR and in European Union as well. Financial statements are important for an assessment of the enterprises financial situation. In the Slovak Republic they
155
are regulated by Act on Accounting 431/2002 following the transposition to the national legislation of Directive 2013/34/EU of the EP and of the Council. 2. Business Property and Business Development
Business property is the most important indicator to identify and assign a portion of the accounting profit, corresponding to the non-realised profit and fictive profit to continued decision-making of managers, associates and shareholders. To ensure good future in doing business enterprises should orient to sustainable business property. The decision on the way of division reported profit, any undertaking received in the present is therefore a strategic one, especially in relation to the future of the business. The strategy determines the long-term objectives, procedures for activity realization and distribution of resources, which contribute to meeting the entity's objective (Glautier and Unterdown, 1991). A produced profit may be considered the main internal sources of an entity's financing. The entity's strategic management is in the responsibility of its owners, top management and department of strategic management. When creating the strategy, it is necessary to analyse external environment and internal environment and select the appropriate strategy based on the results. External factors are “accepted” by entity and must adapt to new conditions. The internal factors may be actively influenced by entity, and thereby take advantage of opportunities and eliminate the threats, which arise from external environment (Šebestová and Wagnerová, 2007). Corporate strategy can be focused on the development and growth of the entity, transition to diversification, stabilization, growth, downturn or revitalization of the entity. In this, maintenance of assets and capital is very important (Tumpach and Baštincová, 2014; Markovič et al., 2013). Organizing the movement of capital, cash, receivables and payables is the content of the entity`s financial strategy for enterprise development. The movement of the parameters quantifies the benefits of all business activities, therefore financial strategy is an important part of entity's management. But “the survival of an entity does not depend only on the area of business, but according the previous analysis, on non-financial ratios such as cooperation, level of project management and others.” (Šebestová and Nowáková, 2013).
2.1 Understanding the Business Property
Understanding the business property of an enterprise is a starting point and a criterion for
determining the economic result, as well as its distributable part, and affects requirements for used valuation method. A detailed analysis of the development of the business property of an enterprise should be one of the most important tasks of the financial analysis (Šlosárová, 2014). For the correct evaluation of the development of the capital invested by owners into the accounting entity, the accountancy should be the one to provide reliable data (Procházka and Pelák, 2016). It is even more important because there usually is not any linear growth of the business property of the accounting entity in the market economy, but periods of the growth and decline vary. The decline in the business property of the accounting entity may be caused by a reported loss, but also by bigger profit distribution than the sum of actually achieved distributable profit (Pakšiová and Kubaščíková, 2014).
To define various understandings of the business property of an enterprise and decide the one to apply within the given a system, is the basis for the whole further analysis in applying specific methodological procedures. The basic understanding of the business property of an enterprise in a broader sense may be divided into:
A. capital – if the property is evaluated from the perspective of the invested capital, B. proprietary – if the property is evaluated from the perspective of its character and structure, C. performance – if the property is evaluated from the perspective of a means to achieve the
performance of an enterprise. They can also be further divided according to a method of its expressing into absolute and relative.
A1. Absolute capital understanding of the business property of an enterprise is expressed in an absolute amount of the owners' invested capital share in terms of financial units.
A2. Relative capital understanding of the business property of an enterprise is expressed as owners' invested capital share within the whole capital sum – own and borrowed.
B1. Absolute terms of the business property of an enterprise are quantified by the overall sum of the property in terms of financial units.
B2. Relative proprietary understanding of the business property of an enterprise represents relative terms of individual components of the business property of an enterprise, what is a quantification of those individual components' share on the gross assets. In a complex sum it represents 100% of the property.
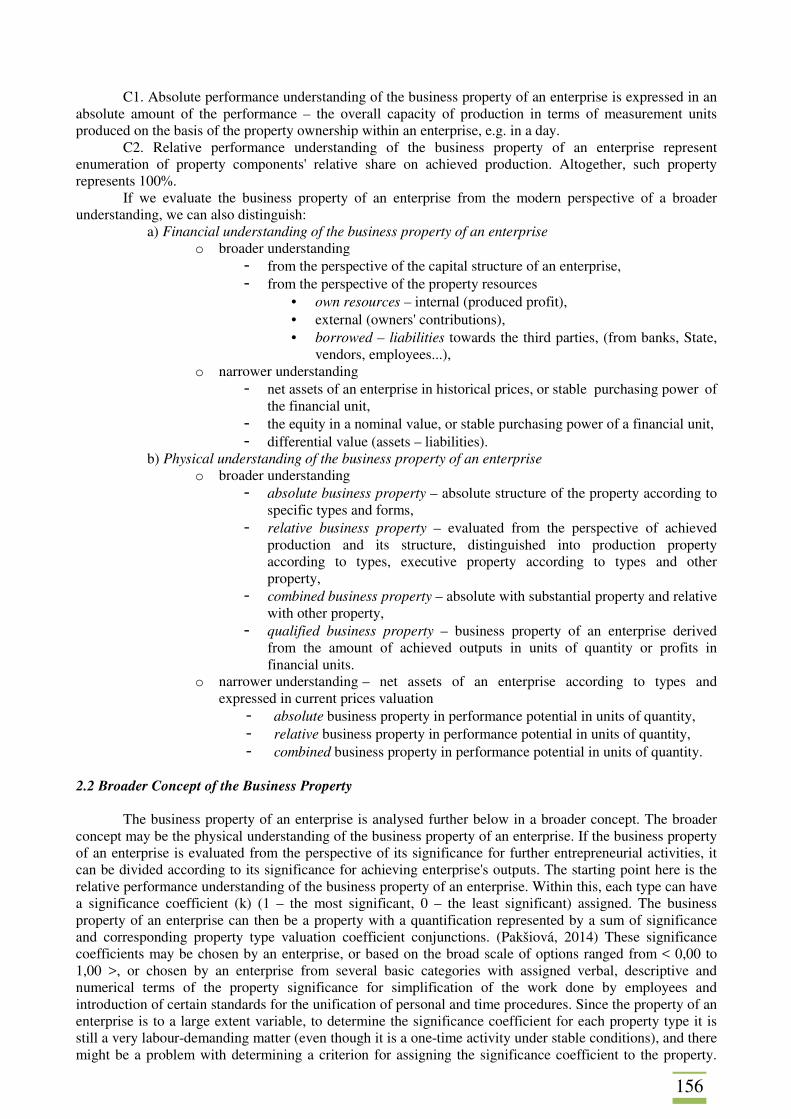
156
C1. Absolute performance understanding of the business property of an enterprise is expressed in an absolute amount of the performance – the overall capacity of production in terms of measurement units produced on the basis of the property ownership within an enterprise, e.g. in a day.
C2. Relative performance understanding of the business property of an enterprise represent enumeration of property components' relative share on achieved production. Altogether, such property represents 100%.
If we evaluate the business property of an enterprise from the modern perspective of a broader understanding, we can also distinguish:
a) Financial understanding of the business property of an enterprise o broader understanding
- from the perspective of the capital structure of an enterprise, - from the perspective of the property resources
• own resources – internal (produced profit), • external (owners' contributions), • borrowed – liabilities towards the third parties, (from banks, State,
vendors, employees...), o narrower understanding
- net assets of an enterprise in historical prices, or stable purchasing power of the financial unit,
- the equity in a nominal value, or stable purchasing power of a financial unit, - differential value (assets – liabilities).
b) Physical understanding of the business property of an enterprise o broader understanding
- absolute business property – absolute structure of the property according to specific types and forms,
- relative business property – evaluated from the perspective of achieved production and its structure, distinguished into production property according to types, executive property according to types and other property,
- combined business property – absolute with substantial property and relative with other property,
- qualified business property – business property of an enterprise derived from the amount of achieved outputs in units of quantity or profits in financial units.
o narrower understanding – net assets of an enterprise according to types and expressed in current prices valuation - absolute business property in performance potential in units of quantity, - relative business property in performance potential in units of quantity, - combined business property in performance potential in units of quantity.
2.2 Broader Concept of the Business Property
The business property of an enterprise is analysed further below in a broader concept. The broader
concept may be the physical understanding of the business property of an enterprise. If the business property of an enterprise is evaluated from the perspective of its significance for further entrepreneurial activities, it can be divided according to its significance for achieving enterprise's outputs. The starting point here is the relative performance understanding of the business property of an enterprise. Within this, each type can have a significance coefficient (k) (1 – the most significant, 0 – the least significant) assigned. The business property of an enterprise can then be a property with a quantification represented by a sum of significance and corresponding property type valuation coefficient conjunctions. (Pakšiová, 2014) These significance coefficients may be chosen by an enterprise, or based on the broad scale of options ranged from < 0,00 to 1,00 >, or chosen by an enterprise from several basic categories with assigned verbal, descriptive and numerical terms of the property significance for simplification of the work done by employees and introduction of certain standards for the unification of personal and time procedures. Since the property of an enterprise is to a large extent variable, to determine the significance coefficient for each property type it is still a very labour-demanding matter (even though it is a one-time activity under stable conditions), and there might be a problem with determining a criterion for assigning the significance coefficient to the property.
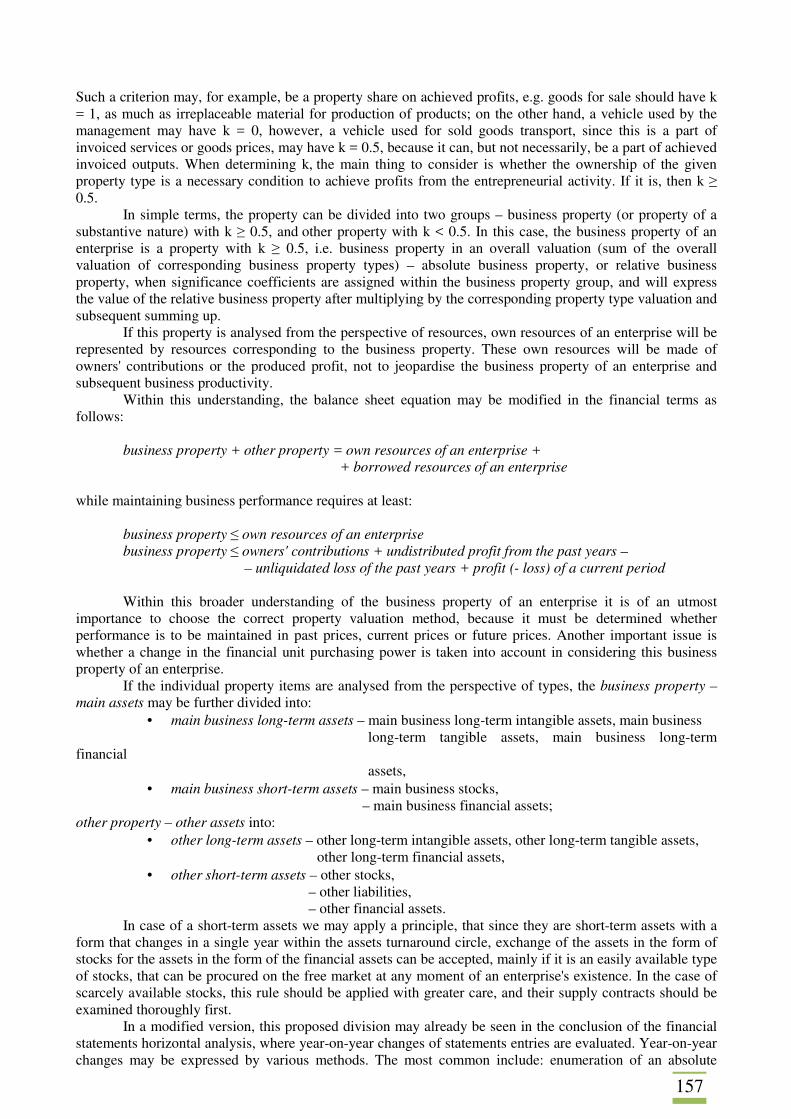
157
Such a criterion may, for example, be a property share on achieved profits, e.g. goods for sale should have k = 1, as much as irreplaceable material for production of products; on the other hand, a vehicle used by the management may have k = 0, however, a vehicle used for sold goods transport, since this is a part of invoiced services or goods prices, may have k = 0.5, because it can, but not necessarily, be a part of achieved invoiced outputs. When determining k, the main thing to consider is whether the ownership of the given property type is a necessary condition to achieve profits from the entrepreneurial activity. If it is, then k ≥ 0.5.
In simple terms, the property can be divided into two groups – business property (or property of a substantive nature) with k ≥ 0.5, and other property with k < 0.5. In this case, the business property of an enterprise is a property with k ≥ 0.5, i.e. business property in an overall valuation (sum of the overall valuation of corresponding business property types) – absolute business property, or relative business property, when significance coefficients are assigned within the business property group, and will express the value of the relative business property after multiplying by the corresponding property type valuation and subsequent summing up.
If this property is analysed from the perspective of resources, own resources of an enterprise will be represented by resources corresponding to the business property. These own resources will be made of owners' contributions or the produced profit, not to jeopardise the business property of an enterprise and subsequent business productivity.
Within this understanding, the balance sheet equation may be modified in the financial terms as follows:
business property + other property = own resources of an enterprise +
+ borrowed resources of an enterprise while maintaining business performance requires at least:
business property ≤ own resources of an enterprise business property ≤ owners' contributions + undistributed profit from the past years –
– unliquidated loss of the past years + profit (- loss) of a current period Within this broader understanding of the business property of an enterprise it is of an utmost
importance to choose the correct property valuation method, because it must be determined whether performance is to be maintained in past prices, current prices or future prices. Another important issue is whether a change in the financial unit purchasing power is taken into account in considering this business property of an enterprise.
If the individual property items are analysed from the perspective of types, the business property – main assets may be further divided into:
• main business long-term assets – main business long-term intangible assets, main business long-term tangible assets, main business long-term financial assets,
• main business short-term assets – main business stocks, – main business financial assets; other property – other assets into:
• other long-term assets – other long-term intangible assets, other long-term tangible assets, other long-term financial assets,
• other short-term assets – other stocks, – other liabilities, – other financial assets.
In case of a short-term assets we may apply a principle, that since they are short-term assets with a form that changes in a single year within the assets turnaround circle, exchange of the assets in the form of stocks for the assets in the form of the financial assets can be accepted, mainly if it is an easily available type of stocks, that can be procured on the free market at any moment of an enterprise's existence. In the case of scarcely available stocks, this rule should be applied with greater care, and their supply contracts should be examined thoroughly first.
In a modified version, this proposed division may already be seen in the conclusion of the financial statements horizontal analysis, where year-on-year changes of statements entries are evaluated. Year-on-year changes may be expressed by various methods. The most common include: enumeration of an absolute
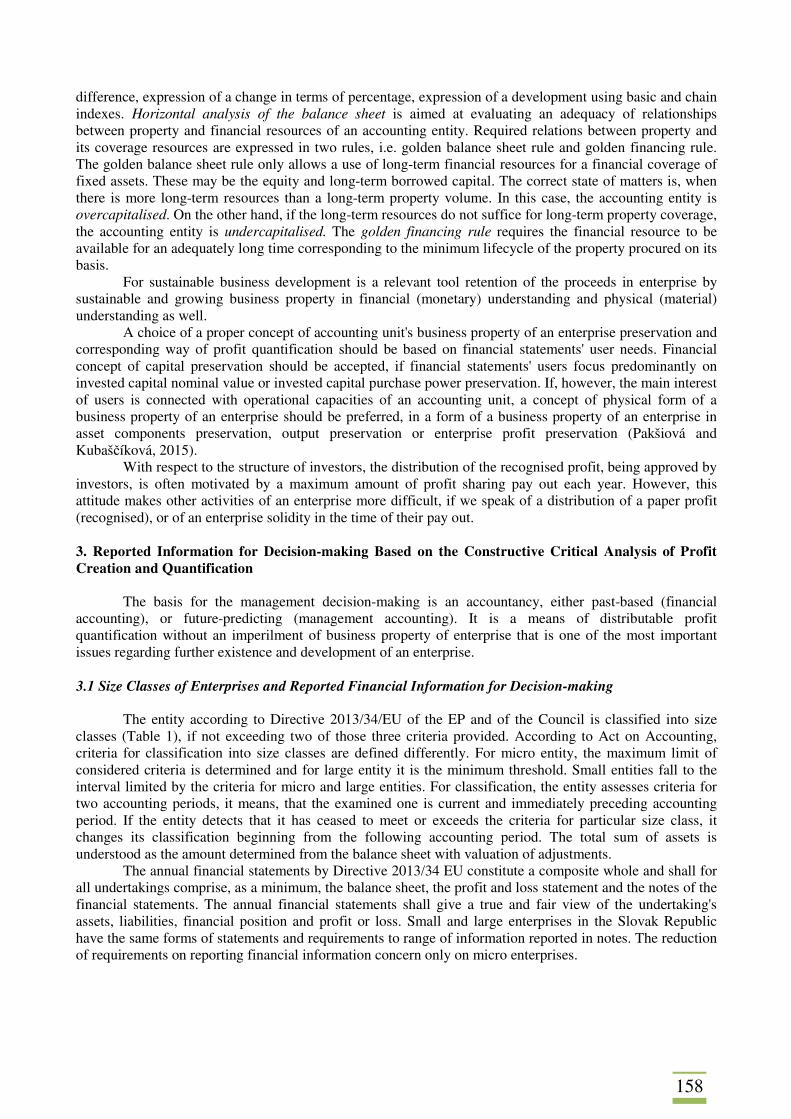
158
difference, expression of a change in terms of percentage, expression of a development using basic and chain indexes. Horizontal analysis of the balance sheet is aimed at evaluating an adequacy of relationships between property and financial resources of an accounting entity. Required relations between property and its coverage resources are expressed in two rules, i.e. golden balance sheet rule and golden financing rule. The golden balance sheet rule only allows a use of long-term financial resources for a financial coverage of fixed assets. These may be the equity and long-term borrowed capital. The correct state of matters is, when there is more long-term resources than a long-term property volume. In this case, the accounting entity is overcapitalised. On the other hand, if the long-term resources do not suffice for long-term property coverage, the accounting entity is undercapitalised. The golden financing rule requires the financial resource to be available for an adequately long time corresponding to the minimum lifecycle of the property procured on its basis.
For sustainable business development is a relevant tool retention of the proceeds in enterprise by sustainable and growing business property in financial (monetary) understanding and physical (material) understanding as well.
A choice of a proper concept of accounting unit's business property of an enterprise preservation and corresponding way of profit quantification should be based on financial statements' user needs. Financial concept of capital preservation should be accepted, if financial statements' users focus predominantly on invested capital nominal value or invested capital purchase power preservation. If, however, the main interest of users is connected with operational capacities of an accounting unit, a concept of physical form of a business property of an enterprise should be preferred, in a form of a business property of an enterprise in asset components preservation, output preservation or enterprise profit preservation (Pakšiová and Kubaščíková, 2015).
With respect to the structure of investors, the distribution of the recognised profit, being approved by investors, is often motivated by a maximum amount of profit sharing pay out each year. However, this attitude makes other activities of an enterprise more difficult, if we speak of a distribution of a paper profit (recognised), or of an enterprise solidity in the time of their pay out.
3. Reported Information for Decision-making Based on the Constructive Critical Analysis of Profit Creation and Quantification
The basis for the management decision-making is an accountancy, either past-based (financial
accounting), or future-predicting (management accounting). It is a means of distributable profit quantification without an imperilment of business property of enterprise that is one of the most important issues regarding further existence and development of an enterprise.
3.1 Size Classes of Enterprises and Reported Financial Information for Decision-making
The entity according to Directive 2013/34/EU of the EP and of the Council is classified into size
classes (Table 1), if not exceeding two of those three criteria provided. According to Act on Accounting, criteria for classification into size classes are defined differently. For micro entity, the maximum limit of considered criteria is determined and for large entity it is the minimum threshold. Small entities fall to the interval limited by the criteria for micro and large entities. For classification, the entity assesses criteria for two accounting periods, it means, that the examined one is current and immediately preceding accounting period. If the entity detects that it has ceased to meet or exceeds the criteria for particular size class, it changes its classification beginning from the following accounting period. The total sum of assets is understood as the amount determined from the balance sheet with valuation of adjustments.
The annual financial statements by Directive 2013/34 EU constitute a composite whole and shall for all undertakings comprise, as a minimum, the balance sheet, the profit and loss statement and the notes of the financial statements. The annual financial statements shall give a true and fair view of the undertaking's assets, liabilities, financial position and profit or loss. Small and large enterprises in the Slovak Republic have the same forms of statements and requirements to range of information reported in notes. The reduction of requirements on reporting financial information concern only on micro enterprises.
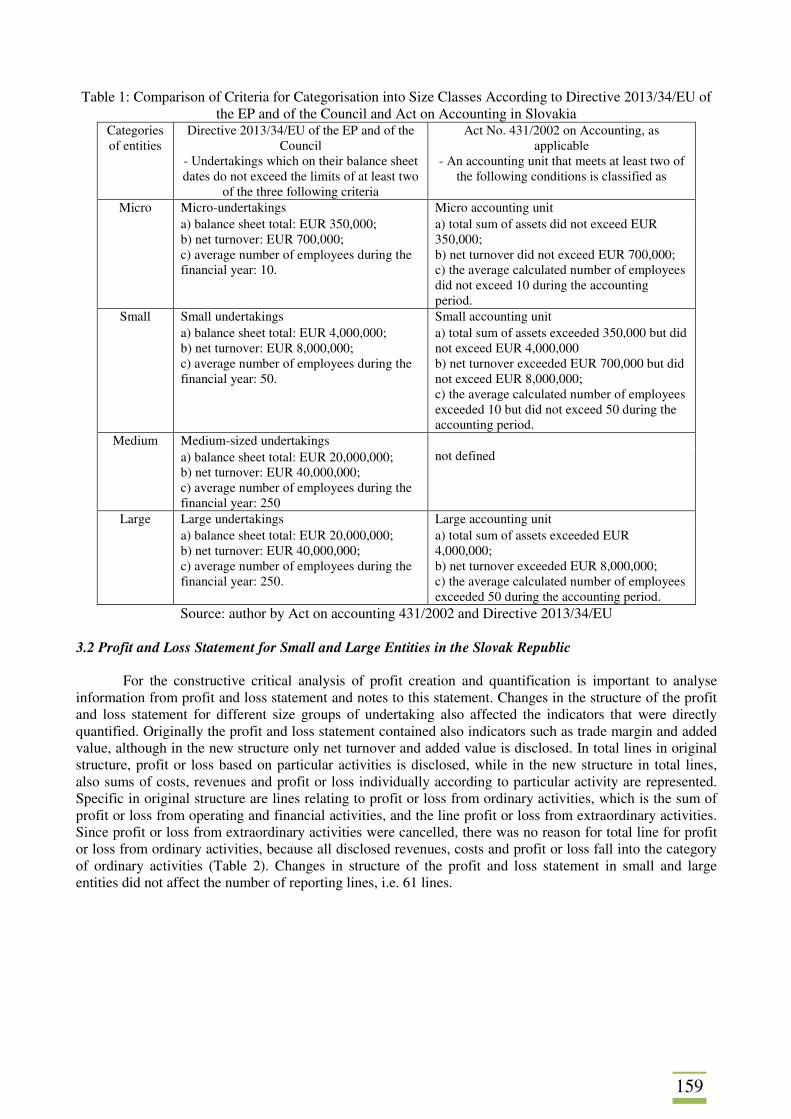
159
Table 1: Comparison of Criteria for Categorisation into Size Classes According to Directive 2013/34/EU of the EP and of the Council and Act on Accounting in Slovakia
Categories of entities
Directive 2013/34/EU of the EP and of the Council
- Undertakings which on their balance sheet dates do not exceed the limits of at least two
of the three following criteria
Act No. 431/2002 on Accounting, as applicable
- An accounting unit that meets at least two of the following conditions is classified as
Micro Micro-undertakings Micro accounting unit a) balance sheet total: EUR 350,000; b) net turnover: EUR 700,000; c) average number of employees during the financial year: 10.
a) total sum of assets did not exceed EUR 350,000; b) net turnover did not exceed EUR 700,000; c) the average calculated number of employees did not exceed 10 during the accounting period.
Small Small undertakings Small accounting unit a) balance sheet total: EUR 4,000,000; b) net turnover: EUR 8,000,000; c) average number of employees during the financial year: 50.
a) total sum of assets exceeded 350,000 but did not exceed EUR 4,000,000 b) net turnover exceeded EUR 700,000 but did not exceed EUR 8,000,000; c) the average calculated number of employees exceeded 10 but did not exceed 50 during the accounting period.
Medium Medium-sized undertakings not defined a) balance sheet total: EUR 20,000,000;
b) net turnover: EUR 40,000,000; c) average number of employees during the financial year: 250
Large Large undertakings Large accounting unit a) balance sheet total: EUR 20,000,000; b) net turnover: EUR 40,000,000; c) average number of employees during the financial year: 250.
a) total sum of assets exceeded EUR 4,000,000; b) net turnover exceeded EUR 8,000,000; c) the average calculated number of employees exceeded 50 during the accounting period.
Source: author by Act on accounting 431/2002 and Directive 2013/34/EU
3.2 Profit and Loss Statement for Small and Large Entities in the Slovak Republic For the constructive critical analysis of profit creation and quantification is important to analyse
information from profit and loss statement and notes to this statement. Changes in the structure of the profit and loss statement for different size groups of undertaking also affected the indicators that were directly quantified. Originally the profit and loss statement contained also indicators such as trade margin and added value, although in the new structure only net turnover and added value is disclosed. In total lines in original structure, profit or loss based on particular activities is disclosed, while in the new structure in total lines, also sums of costs, revenues and profit or loss individually according to particular activity are represented. Specific in original structure are lines relating to profit or loss from ordinary activities, which is the sum of profit or loss from operating and financial activities, and the line profit or loss from extraordinary activities. Since profit or loss from extraordinary activities were cancelled, there was no reason for total line for profit or loss from ordinary activities, because all disclosed revenues, costs and profit or loss fall into the category of ordinary activities (Table 2). Changes in structure of the profit and loss statement in small and large entities did not affect the number of reporting lines, i.e. 61 lines.
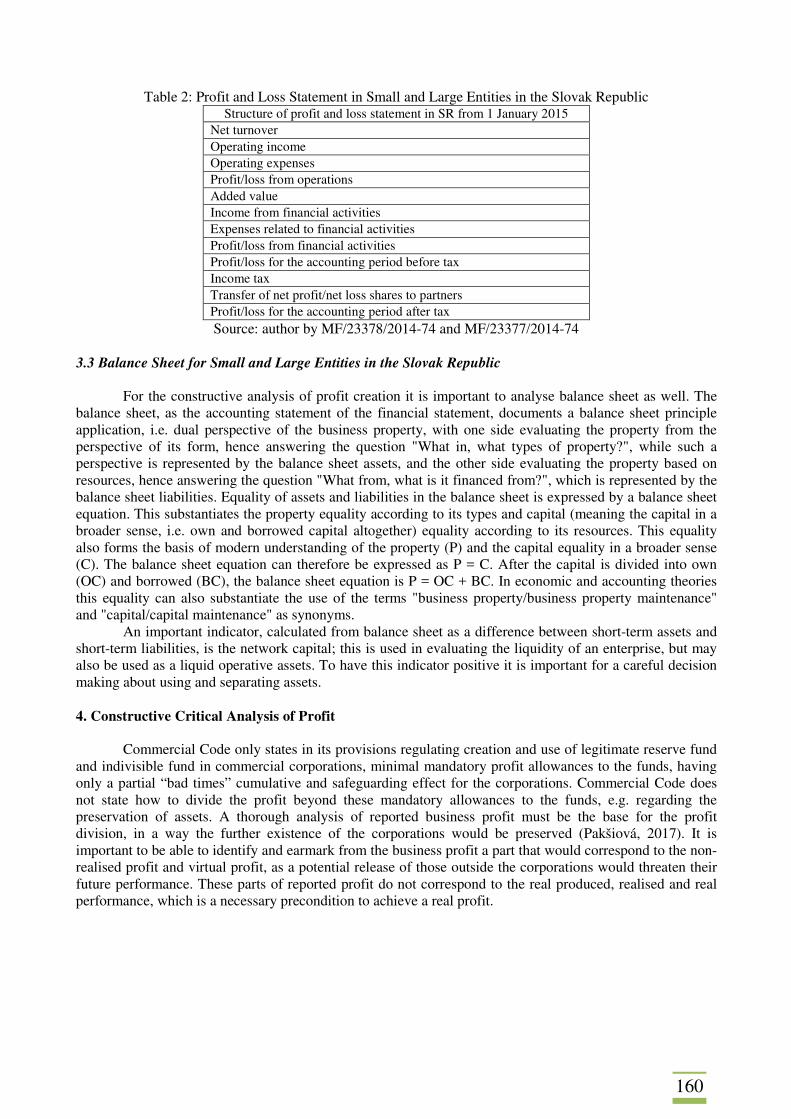
160
Table 2: Profit and Loss Statement in Small and Large Entities in the Slovak Republic Structure of profit and loss statement in SR from 1 January 2015
Net turnover Operating income Operating expenses Profit/loss from operations Added value Income from financial activities Expenses related to financial activities Profit/loss from financial activities Profit/loss for the accounting period before tax Income tax Transfer of net profit/net loss shares to partners Profit/loss for the accounting period after tax Source: author by MF/23378/2014-74 and MF/23377/2014-74
3.3 Balance Sheet for Small and Large Entities in the Slovak Republic
For the constructive analysis of profit creation it is important to analyse balance sheet as well. The
balance sheet, as the accounting statement of the financial statement, documents a balance sheet principle application, i.e. dual perspective of the business property, with one side evaluating the property from the perspective of its form, hence answering the question "What in, what types of property?", while such a perspective is represented by the balance sheet assets, and the other side evaluating the property based on resources, hence answering the question "What from, what is it financed from?", which is represented by the balance sheet liabilities. Equality of assets and liabilities in the balance sheet is expressed by a balance sheet equation. This substantiates the property equality according to its types and capital (meaning the capital in a broader sense, i.e. own and borrowed capital altogether) equality according to its resources. This equality also forms the basis of modern understanding of the property (P) and the capital equality in a broader sense (C). The balance sheet equation can therefore be expressed as P = C. After the capital is divided into own (OC) and borrowed (BC), the balance sheet equation is P = OC + BC. In economic and accounting theories this equality can also substantiate the use of the terms "business property/business property maintenance" and "capital/capital maintenance" as synonyms.
An important indicator, calculated from balance sheet as a difference between short-term assets and short-term liabilities, is the network capital; this is used in evaluating the liquidity of an enterprise, but may also be used as a liquid operative assets. To have this indicator positive it is important for a careful decision making about using and separating assets.
4. Constructive Critical Analysis of Profit
Commercial Code only states in its provisions regulating creation and use of legitimate reserve fund and indivisible fund in commercial corporations, minimal mandatory profit allowances to the funds, having only a partial “bad times” cumulative and safeguarding effect for the corporations. Commercial Code does not state how to divide the profit beyond these mandatory allowances to the funds, e.g. regarding the preservation of assets. A thorough analysis of reported business profit must be the base for the profit division, in a way the further existence of the corporations would be preserved (Pakšiová, 2017). It is important to be able to identify and earmark from the business profit a part that would correspond to the non-realised profit and virtual profit, as a potential release of those outside the corporations would threaten their future performance. These parts of reported profit do not correspond to the real produced, realised and real performance, which is a necessary precondition to achieve a real profit.
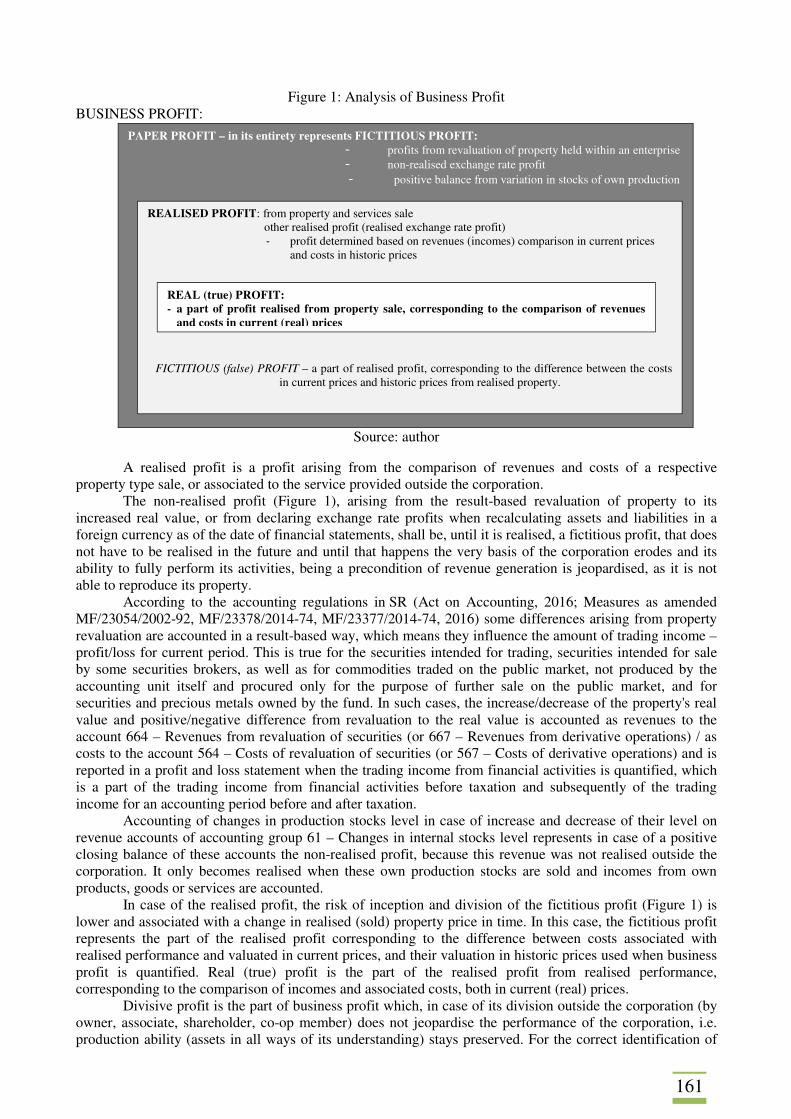
161
Figure 1: Analysis of Business Profit BUSINESS PROFIT:
Source: author
A realised profit is a profit arising from the comparison of revenues and costs of a respective
property type sale, or associated to the service provided outside the corporation. The non-realised profit (Figure 1), arising from the result-based revaluation of property to its
increased real value, or from declaring exchange rate profits when recalculating assets and liabilities in a foreign currency as of the date of financial statements, shall be, until it is realised, a fictitious profit, that does not have to be realised in the future and until that happens the very basis of the corporation erodes and its ability to fully perform its activities, being a precondition of revenue generation is jeopardised, as it is not able to reproduce its property.
According to the accounting regulations in SR (Act on Accounting, 2016; Measures as amended MF/23054/2002-92, MF/23378/2014-74, MF/23377/2014-74, 2016) some differences arising from property revaluation are accounted in a result-based way, which means they influence the amount of trading income – profit/loss for current period. This is true for the securities intended for trading, securities intended for sale by some securities brokers, as well as for commodities traded on the public market, not produced by the accounting unit itself and procured only for the purpose of further sale on the public market, and for securities and precious metals owned by the fund. In such cases, the increase/decrease of the property's real value and positive/negative difference from revaluation to the real value is accounted as revenues to the account 664 – Revenues from revaluation of securities (or 667 – Revenues from derivative operations) / as costs to the account 564 – Costs of revaluation of securities (or 567 – Costs of derivative operations) and is reported in a profit and loss statement when the trading income from financial activities is quantified, which is a part of the trading income from financial activities before taxation and subsequently of the trading income for an accounting period before and after taxation.
Accounting of changes in production stocks level in case of increase and decrease of their level on revenue accounts of accounting group 61 – Changes in internal stocks level represents in case of a positive closing balance of these accounts the non-realised profit, because this revenue was not realised outside the corporation. It only becomes realised when these own production stocks are sold and incomes from own products, goods or services are accounted.
In case of the realised profit, the risk of inception and division of the fictitious profit (Figure 1) is lower and associated with a change in realised (sold) property price in time. In this case, the fictitious profit represents the part of the realised profit corresponding to the difference between costs associated with realised performance and valuated in current prices, and their valuation in historic prices used when business profit is quantified. Real (true) profit is the part of the realised profit from realised performance, corresponding to the comparison of incomes and associated costs, both in current (real) prices.
Divisive profit is the part of business profit which, in case of its division outside the corporation (by owner, associate, shareholder, co-op member) does not jeopardise the performance of the corporation, i.e. production ability (assets in all ways of its understanding) stays preserved. For the correct identification of
PAPER PROFIT – in its entirety represents FICTITIOUS PROFIT: - profits from revaluation of property held within an enterprise - non-realised exchange rate profit - positive balance from variation in stocks of own production
REALISED PROFIT: from property and services sale other realised profit (realised exchange rate profit)
- profit determined based on revenues (incomes) comparison in current prices and costs in historic prices
FICTITIOUS (false) PROFIT – a part of realised profit, corresponding to the difference between the costs
in current prices and historic prices from realised property.
REAL (true) PROFIT: - a part of profit realised from property sale, corresponding to the comparison of revenues
and costs in current (real) prices
162
the divisive profit, it is thus important to quantify the real profit from the business profit, so we can consider the lower one divisive after their mutual comparison. 4. Conclusion
For the distribution of the achieved financial result, especially profit, is important to do it, in order to preserve the property in the business entity, thus ensuring that the enterprise operates in the future.
The analysis of the business property's changing trends of the entity should be one of the most important tasks of the financial analysis for the assessment of the financial situation of the enterprise. The decrease of the business property can cause a future reduction in the production ability of the enterprise to the extent causing an involuntary closing of business activities. The reduction of business property is usually caused not only by the reported loss, but also by the greater distribution of profits, as is the amount of the real level of the enterprise's distributable reserves profit of the business. A thorough analysis of the reported accounting profit must be the starting point for the allocation of profit, which does not compromise the further existence of the enterprise. It is important to be able to identify and assign a portion of the accounting profit, corresponding to the non-realised profit and fictive profit, where eventual release outside the enterprise threatens the future performance of the enterprise. These portions of the reported profit do not correspond to the actually made, realised and real production, which is a necessary condition to achieve a real profit. The division of real profit to the investors is the only thing that will not cause a threat to the existing abilities of an enterprise, neither in the short nor the long term. The decision on the way of division reported profit, any undertaking received in the present is therefore a strategic, especially in relation to the future of the business. For sustainable business development it is a relevant tool retention of the proceeds in enterprise by sustainable and growing business property in financial (monetary) understanding and physical (material) understanding as well.
Constructive critical analysis of profit creation and its quantification is important for every decision-making on its allocation with goal to maintenance of the enterprise's health.
Acknowledgement
This article is an output of the project of the Scientific Grant Agency of the Ministry of Culture of the Slovak Republic and Slovak Academy of Sciences (VEGA) no. 1/0512/16 (2016-2018) “Retention and Development of Business Property of Enterprise as a Relevant Tool for Sustainable Development” References Act 431/2002 Coll. on Accounting, as amended. Directive 2013/34/EU of the European Parliament and of the Council of 26 June 2013 on the annual financial statements consolidated financial statements and related reports of certain types of undertakings, amending. Directive 2006/43/EC of the European Parliament and of the Council and repeating council Directives 78/660/EEC and 83/449/EEC as amended. GLAUTIER, M. W. E., UNTERDOWN, B. (1991). Accounting : Theory and Practice. 4. ed. London: Pitman. MARKOVIČ, P., GRANČIČOVÁ, K., JUHÁSZOVÁ, Z. (2013). Finančné rozhodovanie o dlhodobej alokácii kapitálu. In Management trends in theory and practice: scientific papers. EDIS. Žilina: University Publishing House, University of Zilina, pp.247-249. Measure of the Ministry of Finance of the Slovak Republic of 16 December 2002 No. 23054/2002-92, On stipulation of details of accounting procedures and framework chart of accounts for entrepreneurs keeping double-entry accounting, as amended. Measure of the Ministry of Finance of the Slovak Republic from 3. December 2014 No. MF/23378/2014-74 defining details of the arrangement, marking, and content specification of items of an individual financial statement and extent of data determined for publication from an individual financial statement for entrepreneurs using double entry bookkeeping for small accounting units, as amended.

163
Measure of the Ministry of Finance of the Slovak Republic from 3. December 2014 No. MF/23377/2014-74 defining details of the arrangement, marking, and content specification of items of an individual financial statement and extent of data determined for publication from an individual financial statement for entrepreneurs using double entry bookkeeping for large accounting units and public interest entity, as amended. PAKŠIOVÁ, R. (2014). Majetková podstata podniku. Bratislava: EKONÓM. PAKŠIOVÁ, R., KUBAŠČÍKOVÁ, Z. (2015). Business property of company and investments. In Procedia economics and finance: 16th Annual conference on finance and Accounting, ACFA. Holandsko: Elsevier B. vol. 25, pp. 70-78. PAKŠIOVÁ, R., KUBAŠČÍKOVÁ, Z. (2014). Risks of company´s non-realised profits distribution. In Managing and Modelling of Financial Risks: 7th International Scientific Conference: proceedings Ostrava: VŠB - Technical University of Ostrava, 2014. pp. 598-605. PAKŠIOVÁ, R. (2017). Zisk ako indikátor rastu majetkovej podstaty a jeho analýza In Indikátory zmeny majetkovej podstaty a ich analýza [elektronický zdroj]: zborník vedeckých statí = Change indicators of the business property and their analysis: proceedings of scientific papers. Bratislava: Vydavateľstvo EKONÓM, pp. 100-111. PROCHÁZKA, D., PELÁK, J. (2016). Economic Theories of Accounting: The Review of Modern Approaches and their Relevance for Standard-Setting. Politická ekonomie, no. 4 (2016), pp. 451-467. ŠEBESTOVÁ, J., WAGNEROVÁ, E. (2007). Vnitřní faktory ovlivňující malé a střední podnikání: případová studie z Moravskoslezského kraje. Ekonomický časopis: časopis pre ekonomickú teóriu a hospodársku politiku, spoločensko-ekonomické prognózovanie = journal for economic theory, economic policy, social and economic forecasting, vol. 55, no. 4, pp. 411-424. ŠEBESTOVÁ, J., NOWÁKOVÁ, K. (2013). Dynamic strategy for sustainable business development: mania or hazard? Amfiteatru economic, vol. 15, no. 34, pp. 442-454. ŠLOSÁROVÁ, A. (2014). Analýza účtovnej závierky. 1. vyd. Bratislava: Vydavateľstvo Ekonóm. TUMPACH, M., BAŠTINCOVA, A. (2014). Cost and Benefit of Accounting Information in Slovakia: Do We Need to Redefine Relevance? In European Financial Systems 2014 : proceedings of the 11th International Scientific Conference: June 12-13, 2014 Lednice, Czech Republic. Brno: Masaryk University, pp. 655-676.
164
IMPACT OF COLOR TEMPERATURE ON THE EFFECTIVENESS OF ADVERTISING SPOKESPERSON Lina Pilelienė, Viktorija Grigaliūnaitė Vytautas Magnus University Faculty of Economics and Management, Marketing Department S. Daukanto str. 28 Kaunas, LT-44299 Lithuania e-mail: [email protected] Abstract
Advertising spokesperson is one of the undeniably important factors affecting advertising effectiveness. However, advertising spokesperson has to have some particular features to be effective. Various previous researches resulted in determination of different features of advertising spokesperson and their effectiveness; i.e. type of a spokesperson (celebrity vs. a regular person); gender and race of a spokesperson; etc. were found to have an impact on the spokesperson’s effectiveness. However, the research on the impact of shooting color temperature on its effectiveness is still scarce. The aim of this paper is to fill this gap. Neuromarketing research methods were applied to substantiate the impact of color temperature on spokesperson effectiveness and to determine the guidelines for its usage in advertising. Keywords: advertising color, advertising effectiveness, color temperature, spokesperson JEL codes: M31, M37 1. Introduction
In a context of intensive competition, many organizations are trying to conquer the market clutter using various tools of marketing communication. Advertising is becoming an inevitable part of human life. According to Bendixen (1993), advertising represents important means by which organizations communicates with their current and potential customers. Advertising allows companies to communicate a salient message to a large group of consumers faster than any other form of communication, truly connects with consumer by giving an opportunity of developing an ongoing brand relationship (Sharma, 2012). Advertising can play a key role in value creation and capturing (Tackx et al., 2017). However, being used massively, advertising loses its effectiveness and ability of solving many marketing and sales problems. Therefore, marketing scholars and business representatives are searching for ways of making advertisements more attractive, attention grabbing, and encouraging customers to make an action.
Many researches were provided to determine the factors influencing advertising effectiveness. One of the undeniably important factors is determined to be advertising spokesperson. To reinforce consumers’ impressions of advertising, enterprises, based on their brand image, strive for the right spokesperson for their products or service (Chih-Chung et al., 2012). Moreover, advertising spokesperson has to have some particular features to be effective. Various authors have provided researches concerning the features of advertising spokesperson and their impact on spokesperson effectiveness. Such characteristics of spokesperson as type (celebrity vs. a regular person), gender, race, age, etc. were assessed to provide a perfect picture. However, the research on the impact of shooting color temperature as a factor determining spokesperson effectiveness is still scarce. This paper seeks to contribute to previous researches by filling this gap. Therefore, the scientific problem solved in the article is: what is the impact of shooting color temperature on the effectiveness of advertising spokesperson? The aim of the research is to substantiate the impact of color temperature on spokesperson effectiveness and to determine the guidelines for its usage in advertising. In order to solve a problem and to contribute to a theory, neuromarketing research methods were applied. Implicit association test and eye tracking procedure were provided to substantiate an impact of color temperature on spokesperson effectiveness; based on research results, general guidelines concerning the usage of color temperature in advertising to make it more effective were given.
Reaching the aim, article was structured in to three main parts: theoretical substantiation (Chapter 2), methodological background (Chapter 3), and research results (Chapter 4). The summing-up conclusions are provided in Chapter 5.
165
2. Theoretical Substantiation
A spokesperson is anyone who imparts to the public the advertising message of a personal opinion, belief, finding, experience, etc. and it is believed by the public (Chih-Chung et al., 2012). Relying on spokesperson in advertising is a common strategy in advertising; therefore, the right choice of advertising spokesperson is a critical element in successful advertising (Lin, 2011). The question of ‘what attributes are desirable for an endorser to possess?’ (Priester and Petty, 2003) is quite relevant in a situation of tough competitions for consumer hearts.
After generalizing the scientific findings, Lin (2011) substantiates the usage of four types of spokespersons in advertising: celebrities, top managers, experts, and typical consumers. Despite the possibility of usage of each of them, numerous researches have proved empirically the effectiveness and the positive influence of celebrity endorsements in advertising (Gupta et al., 2015). Therefore, the main body of spokesperson-related empirical research is provided concerning celebrities. Banytė et al. (2011) emphasize that celebrities are often used by advertisers because of their famous attributes (i.e., beauty, talent, athleticism, power, etc.) that often represent the attractions desired for the brands they endorse – consumers may like the brand because they like the celebrity who endorses it. Previous research (see Grigaliūnaitė and Pilelienė, 2015) revealed positive effect of celebrity spokesperson on consumer purchase intentions (whereas a non-celebrity spokesperson hasn’t caused same effect).
However, choosing an appropriate celebrity is not enough. According to Chin-Chung et al. (2012), there are three main characteristics which have to be met by a spokesperson: attractiveness, trustworthiness, and expertise. Sertoglu et al. (2014) substantiated the effect of celebrities having latter characteristics on consumer purchase intentions. However, many factors may affect consumer perception and valuation of even the same spokesperson; therefore, presented in different circumstances the same person could cause different reaction.
One of the elements presumably having an effect on consumers’ perception of the spokesperson is advertising colors. A wide body of scientific research provides evidence of different color impact on consumer perception and behavior (Lee and Barnes, 1989; Smolders and de Kort, 2017.). As colors can be classified into warm and cool, Patil (2012) emphasizes that warm colors lean towards activity, and cool colors are passive. Therefore, it can be stated that colors have a particular temperature. The color temperature is defined as the correlated temperature of estimated illumination of color images, and it relates to the energy of illumination in the image: if the color temperature is low, an image looks reddish and the image looks bluish if the color temperature is high (Nam et al., 2005); thus, modifying the color temperature of an image simply changes how warm or cool (blue or red) an image looks. Considering latter insights we hypothesize that shooting color temperature has an impact on advertising spokesperson effectiveness.
3. Research Methodology
Color temperature is often measured in Kelvins (K) and lightning is classified according to colour
temperature, into the three following groups: Warm (about 2900 K), White (about 4200 K) and Cool (about 6000 K) (Kapogiannatou et al., 2016). Hence, for the research, ten sample advertisements of which 5 were warm color temperature (3000 K) and 5 were cool color temperature (6000 K) was created (see Figure 1). In all of the advertisements the same well known celebrity spokesperson and a product of mineral water (representing the category of fast moving consumer goods) were presented. The only two differences were color temperature and brand name on the product. For advertisements with warm color temperature one brand was created (in order to eliminate the influence of current attitude toward the existing brands) and for advertisements with cool color temperature – the other brand was created. All of the 10 created advertisements were used for the eye tracking experiment and implicit association test.
Figure 1: Color Temperatures Used for the Research
Source: author’s elaboration
EYE TRACKING EXPERIMENT
According to Pieters et al. (2010), effective advertising primarily needs to capture consumers’ attention. Attention is the first element of AIDA model developed by E. St. Elmo Lewis in 1898 (Li & Yu,
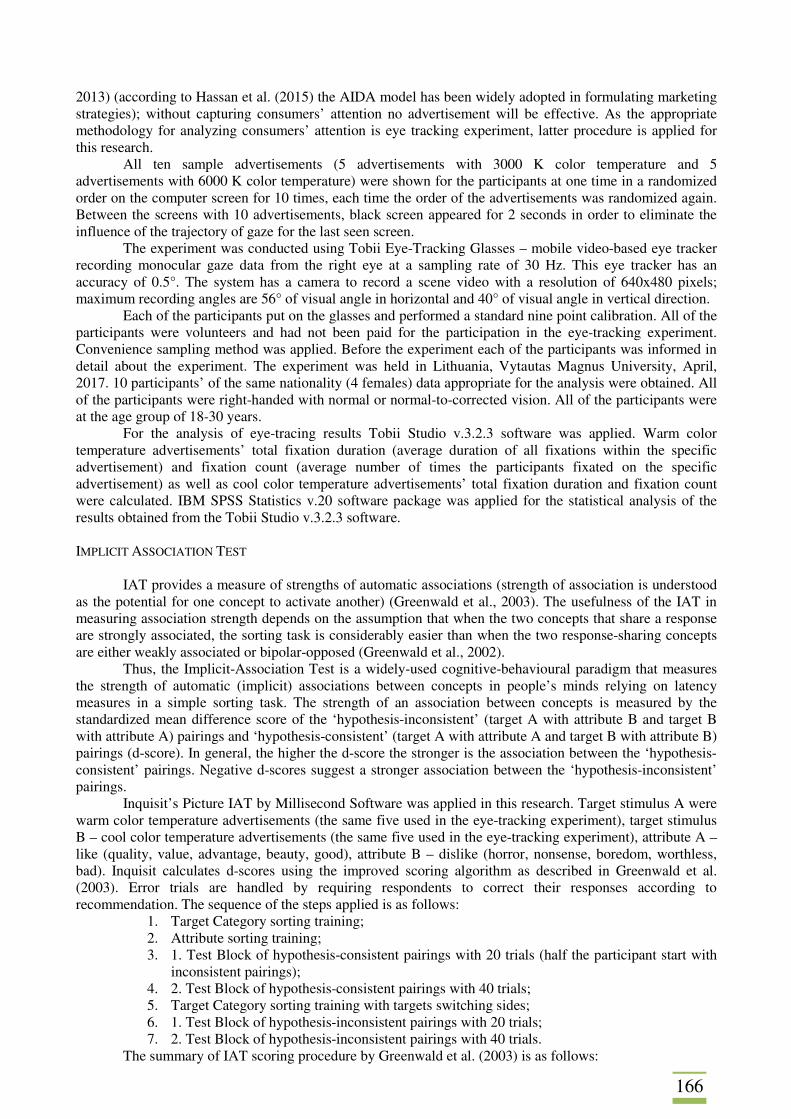
166
2013) (according to Hassan et al. (2015) the AIDA model has been widely adopted in formulating marketing strategies); without capturing consumers’ attention no advertisement will be effective. As the appropriate methodology for analyzing consumers’ attention is eye tracking experiment, latter procedure is applied for this research.
All ten sample advertisements (5 advertisements with 3000 K color temperature and 5 advertisements with 6000 K color temperature) were shown for the participants at one time in a randomized order on the computer screen for 10 times, each time the order of the advertisements was randomized again. Between the screens with 10 advertisements, black screen appeared for 2 seconds in order to eliminate the influence of the trajectory of gaze for the last seen screen.
The experiment was conducted using Tobii Eye-Tracking Glasses – mobile video-based eye tracker recording monocular gaze data from the right eye at a sampling rate of 30 Hz. This eye tracker has an accuracy of 0.5°. The system has a camera to record a scene video with a resolution of 640x480 pixels; maximum recording angles are 56° of visual angle in horizontal and 40° of visual angle in vertical direction.
Each of the participants put on the glasses and performed a standard nine point calibration. All of the participants were volunteers and had not been paid for the participation in the eye-tracking experiment. Convenience sampling method was applied. Before the experiment each of the participants was informed in detail about the experiment. The experiment was held in Lithuania, Vytautas Magnus University, April, 2017. 10 participants’ of the same nationality (4 females) data appropriate for the analysis were obtained. All of the participants were right-handed with normal or normal-to-corrected vision. All of the participants were at the age group of 18-30 years.
For the analysis of eye-tracing results Tobii Studio v.3.2.3 software was applied. Warm color temperature advertisements’ total fixation duration (average duration of all fixations within the specific advertisement) and fixation count (average number of times the participants fixated on the specific advertisement) as well as cool color temperature advertisements’ total fixation duration and fixation count were calculated. IBM SPSS Statistics v.20 software package was applied for the statistical analysis of the results obtained from the Tobii Studio v.3.2.3 software.
IMPLICIT ASSOCIATION TEST
IAT provides a measure of strengths of automatic associations (strength of association is understood as the potential for one concept to activate another) (Greenwald et al., 2003). The usefulness of the IAT in measuring association strength depends on the assumption that when the two concepts that share a response are strongly associated, the sorting task is considerably easier than when the two response-sharing concepts are either weakly associated or bipolar-opposed (Greenwald et al., 2002).
Thus, the Implicit-Association Test is a widely-used cognitive-behavioural paradigm that measures the strength of automatic (implicit) associations between concepts in people’s minds relying on latency measures in a simple sorting task. The strength of an association between concepts is measured by the standardized mean difference score of the ‘hypothesis-inconsistent’ (target A with attribute B and target B with attribute A) pairings and ‘hypothesis-consistent’ (target A with attribute A and target B with attribute B) pairings (d-score). In general, the higher the d-score the stronger is the association between the ‘hypothesis-consistent’ pairings. Negative d-scores suggest a stronger association between the ‘hypothesis-inconsistent’ pairings.
Inquisit’s Picture IAT by Millisecond Software was applied in this research. Target stimulus A were warm color temperature advertisements (the same five used in the eye-tracking experiment), target stimulus B – cool color temperature advertisements (the same five used in the eye-tracking experiment), attribute A – like (quality, value, advantage, beauty, good), attribute B – dislike (horror, nonsense, boredom, worthless, bad). Inquisit calculates d-scores using the improved scoring algorithm as described in Greenwald et al. (2003). Error trials are handled by requiring respondents to correct their responses according to recommendation. The sequence of the steps applied is as follows:
1. Target Category sorting training; 2. Attribute sorting training; 3. 1. Test Block of hypothesis-consistent pairings with 20 trials (half the participant start with
inconsistent pairings); 4. 2. Test Block of hypothesis-consistent pairings with 40 trials; 5. Target Category sorting training with targets switching sides; 6. 1. Test Block of hypothesis-inconsistent pairings with 20 trials; 7. 2. Test Block of hypothesis-inconsistent pairings with 40 trials.
The summary of IAT scoring procedure by Greenwald et al. (2003) is as follows:
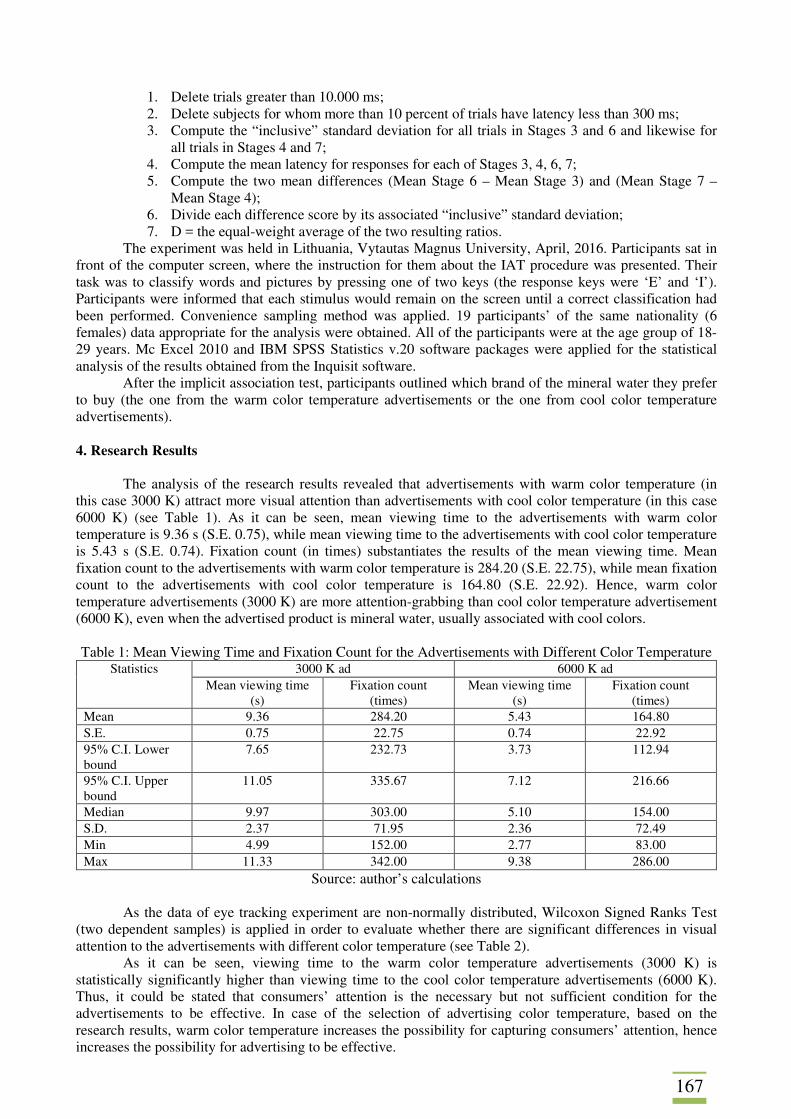
167
1. Delete trials greater than 10.000 ms; 2. Delete subjects for whom more than 10 percent of trials have latency less than 300 ms; 3. Compute the “inclusive” standard deviation for all trials in Stages 3 and 6 and likewise for
all trials in Stages 4 and 7; 4. Compute the mean latency for responses for each of Stages 3, 4, 6, 7; 5. Compute the two mean differences (Mean Stage 6 – Mean Stage 3) and (Mean Stage 7 –
Mean Stage 4); 6. Divide each difference score by its associated “inclusive” standard deviation; 7. D = the equal-weight average of the two resulting ratios.
The experiment was held in Lithuania, Vytautas Magnus University, April, 2016. Participants sat in front of the computer screen, where the instruction for them about the IAT procedure was presented. Their task was to classify words and pictures by pressing one of two keys (the response keys were ‘E’ and ‘I’). Participants were informed that each stimulus would remain on the screen until a correct classification had been performed. Convenience sampling method was applied. 19 participants’ of the same nationality (6 females) data appropriate for the analysis were obtained. All of the participants were at the age group of 18-29 years. Mc Excel 2010 and IBM SPSS Statistics v.20 software packages were applied for the statistical analysis of the results obtained from the Inquisit software.
After the implicit association test, participants outlined which brand of the mineral water they prefer to buy (the one from the warm color temperature advertisements or the one from cool color temperature advertisements). 4. Research Results
The analysis of the research results revealed that advertisements with warm color temperature (in
this case 3000 K) attract more visual attention than advertisements with cool color temperature (in this case 6000 K) (see Table 1). As it can be seen, mean viewing time to the advertisements with warm color temperature is 9.36 s (S.E. 0.75), while mean viewing time to the advertisements with cool color temperature is 5.43 s (S.E. 0.74). Fixation count (in times) substantiates the results of the mean viewing time. Mean fixation count to the advertisements with warm color temperature is 284.20 (S.E. 22.75), while mean fixation count to the advertisements with cool color temperature is 164.80 (S.E. 22.92). Hence, warm color temperature advertisements (3000 K) are more attention-grabbing than cool color temperature advertisement (6000 K), even when the advertised product is mineral water, usually associated with cool colors.
Table 1: Mean Viewing Time and Fixation Count for the Advertisements with Different Color Temperature
Statistics 3000 K ad 6000 K ad Mean viewing time
(s) Fixation count
(times) Mean viewing time
(s) Fixation count
(times) Mean 9.36 284.20 5.43 164.80 S.E. 0.75 22.75 0.74 22.92 95% C.I. Lower bound
7.65 232.73 3.73 112.94
95% C.I. Upper bound
11.05 335.67 7.12 216.66
Median 9.97 303.00 5.10 154.00 S.D. 2.37 71.95 2.36 72.49 Min 4.99 152.00 2.77 83.00 Max 11.33 342.00 9.38 286.00
Source: author’s calculations
As the data of eye tracking experiment are non-normally distributed, Wilcoxon Signed Ranks Test (two dependent samples) is applied in order to evaluate whether there are significant differences in visual attention to the advertisements with different color temperature (see Table 2).
As it can be seen, viewing time to the warm color temperature advertisements (3000 K) is statistically significantly higher than viewing time to the cool color temperature advertisements (6000 K). Thus, it could be stated that consumers’ attention is the necessary but not sufficient condition for the advertisements to be effective. In case of the selection of advertising color temperature, based on the research results, warm color temperature increases the possibility for capturing consumers’ attention, hence increases the possibility for advertising to be effective.
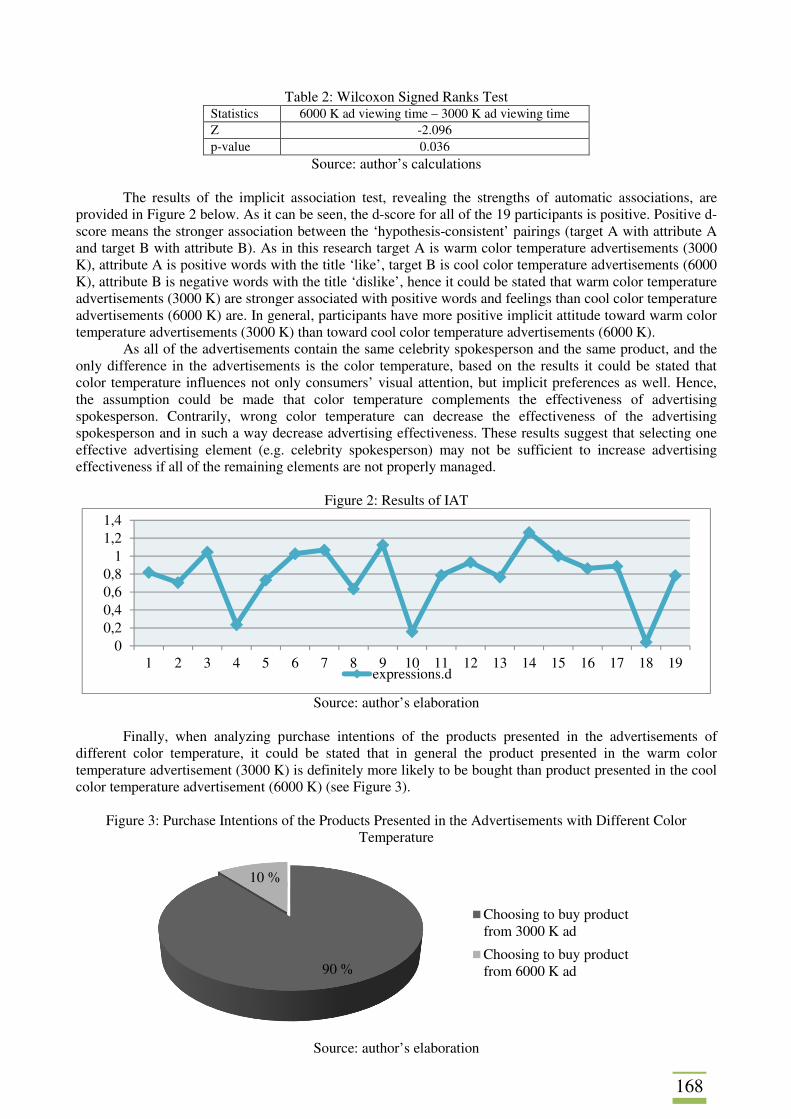
168
Table 2: Wilcoxon Signed Ranks Test Statistics 6000 K ad viewing time – 3000 K ad viewing time Z -2.096 p-value 0.036
Source: author’s calculations
The results of the implicit association test, revealing the strengths of automatic associations, are provided in Figure 2 below. As it can be seen, the d-score for all of the 19 participants is positive. Positive d-score means the stronger association between the ‘hypothesis-consistent’ pairings (target A with attribute A and target B with attribute B). As in this research target A is warm color temperature advertisements (3000 K), attribute A is positive words with the title ‘like’, target B is cool color temperature advertisements (6000 K), attribute B is negative words with the title ‘dislike’, hence it could be stated that warm color temperature advertisements (3000 K) are stronger associated with positive words and feelings than cool color temperature advertisements (6000 K) are. In general, participants have more positive implicit attitude toward warm color temperature advertisements (3000 K) than toward cool color temperature advertisements (6000 K).
As all of the advertisements contain the same celebrity spokesperson and the same product, and the only difference in the advertisements is the color temperature, based on the results it could be stated that color temperature influences not only consumers’ visual attention, but implicit preferences as well. Hence, the assumption could be made that color temperature complements the effectiveness of advertising spokesperson. Contrarily, wrong color temperature can decrease the effectiveness of the advertising spokesperson and in such a way decrease advertising effectiveness. These results suggest that selecting one effective advertising element (e.g. celebrity spokesperson) may not be sufficient to increase advertising effectiveness if all of the remaining elements are not properly managed.
Figure 2: Results of IAT
Source: author’s elaboration
Finally, when analyzing purchase intentions of the products presented in the advertisements of
different color temperature, it could be stated that in general the product presented in the warm color temperature advertisement (3000 K) is definitely more likely to be bought than product presented in the cool color temperature advertisement (6000 K) (see Figure 3).
Figure 3: Purchase Intentions of the Products Presented in the Advertisements with Different Color
Temperature
Source: author’s elaboration
00,20,40,60,8
11,21,4
1 2 3 4 5 6 7 8 9 10 11 12 13 14 15 16 17 18 19expressions.d
90 %
10 %
Choosing to buy productfrom 3000 K ad
Choosing to buy productfrom 6000 K ad
169
As it can be seen from Figure 3, 17 out of 19 participants (90 percent) chose to buy product (and brand) presented in the warm color temperature advertisements (3000 K). Consequently, visual attention, implicit attitude and purchase intentions are all higher for the advertisement / product with warm color temperature. 5. Conclusions
Being used massively, advertising loses its effectiveness and ability of solving many marketing and sales problems. Therefore, marketing scholars and business representatives are searching for ways of making advertisements more attractive, attention grabbing, and encouraging customers to make an action. Analysis and synthesis of scientific literature leads to the conclusion that without capturing consumers’ attention no advertisement will be effective. After capturing consumers’ attention advertisements receive the opportunity to become effective.
The analysis and synthesis of scientific literature allows concluding that advertising spokesperson is one of the undeniably important factors for advertising effectiveness. Nevertheless, properly selected spokesperson might not be enough to reach advertising effectiveness if other advertising elements are not managed properly and based on the research results one of the factors that influence consumer behavior is advertising color temperature.
The analysis of the research results leads to the conclusion that advertising color temperature influences consumers’ visual attention, implicit preferences, and purchase intentions. In the case of this research, warm color temperature (3000 K) attracts more visual attention to the advertisement, receives more positive implicit attitude toward the advertisement and elicits higher purchase intentions of the advertised product when compared to the cool color temperature advertisement (6000 K). Hence, color temperature complements the effectiveness of advertising spokesperson. Contrarily, wrong color temperature can decrease the effectiveness of the advertising spokesperson and in such a way decrease advertising effectiveness. References BANYTĖ, J., STONKIENĖ, E., PILIGRIMIENĖ, Ž. (2011). Selecting Celebrities in Advertising: The Case of Lithuanian Sports Celebrity in Non Sport Product Advertisement. Economics and Management, vol. 16, pp. 1215-1224. BENDIXEN, M. T. (1993). Advertising Effects and Effectiveness. European Journal of Marketing, vol. 27, no. 10, pp. 19-32. CHIH-CHUNG, CH., CHANG, CH., LIN, L. W.-CH., YAU-NANG. (2012). The Effect of Advertisement Frequency on the Advertisement Attitude-The controlled Effects of Brand Image and Spokesperson’s Credibility. Procedia - Social and Behavioral Sciences, vol. 57, pp. 352-359. GREENWALD, A. G., RUDMAN, L. A., NOSEK, B. A., BANAJI, M. R., FARNHAM, S. D., MELLOTT, D. S. (2002). A Unified Theory of Implicit Attitudes, Stereotypes, Self-Esteem, and Self-Concept. Psychological Review, vol. 109, no. 1, pp. 3-25. GREENWALD, A.G., NOSEK, B. A., BANAJI, M. R. (2003). Understanding and Using the Implicit Association Test: I. An Improved Scoring Algorithm. Journal of Personality and Social Psychology, vol. 85, no. 2, pp. 197-216. GRIGALIŪNAITĖ, V., PILELIENĖ, L. (2015). Determination of the impact of spokesperson on advertising effectiveness. International journal of management, accounting and economics, vol. 2, iss. 8, pp. 810-822. GUPTA, R., KISHORE, N., VERMA, D. P. S. (2015). Impact of Celebrity Endorsements on Consumers’ Ad Perception: a Study of Indian Consumers. British Journal of Marketing Studies, vol. 3, no. 8, pp.34-49. HASSAN, S. H., NADZIM, S. Z. A., SHIRATUDDIN, N. (2015). Strategic Use of Social Media for Small Business Based on the AIDA Model. Procedia - Social and Behavioral Sciences, vol. 172, pp. 262-269.

170
KAPOGIANNATOU, A., PARONIS, E., PASCHIDIS, K., POLISSIDIS, A., KOSTOMITSOPOULOS, N. G. (2016). Effect of light colour temperature and intensity on the behaviour of male C57CL/6J mice. Applied Animal Behaviour Science, vol. 184, pp. 135-140. LEE, S., BARNES, J. H. (1989). Using Color Preferences in Magazine Advertising. Journal Of Advertising Research, vol. 29, no. 6, pp. 25-30. LI, J., YU, H. (2013). An Innovative Marketing Model Based on AIDA: - A Case from E-bank Campus-marketing by China Construction Bank. iBusiness, vol. 5, pp. 47-51. LIN, L.-Y. (2011). The Impact of Advertising Appeals and Advertising Spokespersons on Advertising Attitudes and Purchase Intentions. African Journal of Business Management, vol. 5, no. 21, pp. 8446-8457. NAM, J., RO, Y. M., HUH, Y., KIM, M. (2005). Visual Content Adaptation According to User Perception Characteristics. IEEE Transactions on Multimedia, vol. 7, no. 3, pp. 435-445. PATIL, D. (2012). Coloring consumer’s psychology using different shades the role of perception of colors by consumers in consumer decision making process: a micro study of select departmental stores in Mumbai city, India. Journal Of Business & Retail Management Research, vol. 7, no. 1, pp. 60-73. PIETERS, R., WEDEL, M., BATRA, R. (2010). The Stopping Power of Advertising: Measures and Effects of Visual Complexity. Journal Of Marketing, vol. 74, no. 5, pp. 48-60. PRIESTER, J. R., PETTY, R. E. (2003). The Influence of Spokesperson Trustworthiness on Message Elaboration, Attitude Strength, and Advertising Effectiveness. Journal of Consumer Psychology, vol. 13, no. 4, 408–421. SERTOGLU, A. E., CATLI, O., KORKMAZ, S. (2014). Examining the Effect of Endorser Credibility on the Consumers' Buying Intentions: An Empirical Study in Turkey. International Review of Management and Marketing, vol. 4, no. 1, pp. 66-77. SHARMA, p. (2012). Advertising Effectiveness: “Understanding the Value of Creativity in Advertising”, a Review Study in India. Online Journal of Communication and Media Technologies, vol. 2, iss. 3, pp. 1-10. SMOLDERS, K. C. H. J., De KORT, Y. A. W. (2017). Investigating daytime effects of correlated colour temperature on experiences, performance, and arousal. Journal of Environmental Psychology, vol. 50, pp. 80-93. TACKX, K., ROTHENBERGER, S., VERDIN, P. (2017). Is Advertising for Losers? An Empirical Study from a Value Creation and Value Capturing Perspective. European Management Journal, vol. 35, iss. 3, pp. 327-335.
171
PAIRWISE COMPARISON MATRIX AND ITS APPLICATION TO RANKING ALTERNATIVES Jaroslav Ramík Silesian University in Opava School of Business Administration in Karviná, Department of Informatics and Mathematics University Square 1934/3 Karviná, 73340 Czech Republic e-mail: [email protected] Abstract
The decision making problem considered here is to rank n alternatives from the best to the worst, using information given by the decision maker(s) in the form of an n×n pairwise comparisons (PC) matrix. We investigate pairwise comparisons matrices with elements from a real interval which is a traditional multiplicative approach used in Analytic hierarchy process (AHP). Here, we deal with two essential elements of AHP: measuring consistency of PC matrix and the method of eliciting the priority vector by which the final ranking of alternatives is derived. Classical approaches introduced by T. Saaty in AHP are compared with later approaches based on the AHP criticism published in the literature. Advantages and disadvantages of both approaches are highlighted and discussed. Keywords: AHP, analytic hierarchy process, pairwise comparisons matrix, ranking alternatives JEL codes: C44 1. Introduction
Recently, each entrepreneur has its own personal computer(s), tablets, mobile phones, or other modern information technology means. Moreover, there is an increasing popularity of methods for decision support solvable by the help of computers. Multiple Criteria Decision Methods (MCDM) proved to be useful methods e.g. in the following areas:
• buying equipment (cars, machines, furniture), • investment opportunities, • services evaluations, etc.
Analytic Hierarchy Process (AHP) is a popular method for solving decision making (DM) problems of finding the „best“ alternatives among the given set of alternatives. This method is frequently used when evaluating, or, generally, when ranking objects. Pairwise comparisons (PC) method is an intrinsic element of AHP, one of the 3 principles of AHP: hierarchy principle, PC principle, and aggregation principle. Consider for instance the following simple decision problem depicted by 3-level hierarchy. Here, the PC principle is applied on the second level, particularly when evaluating the weights of the criteria, i.e. relative importance of the criteria. Moreover, the criteria could be either quantitative and/or qualitative. Evaluating qualitative criteria, PC method can be used, too, see Fig. 1.
PC method is based on the psychological observation that the human brain cannot compare more than 5 to 9 independent values in one moment (so called „cognitive overload“). For a human being it is much easier to compare only two elements: to do pairwise comparisons for all pairs, i.e. pair-wise comparison matrix (relation) A which is usually reciprocal.
At present, pairwise comparisons are practically identified with Saaty’s controversial AHP. On one hand, AHP is respected in practical applications, on the other hand, it is still considered by many as a flawed procedure that produces arbitrary rankings. In this paper we analyze two of the elements of PC method (a part of AHP) in order to remove possible theoretical problems of the original method and thus support better decisions. Particularly, we deal with two essential elements of AHP: measuring consistency of PC matrix, and eliciting the priority vector by which the final ranking of alternatives is derived. Classical approaches introduced by T. Saaty in AHP, see e.g. Saaty (1991), are compared with later approaches based on the AHP criticism published in the literature, see Bana e Costa et. al., (2008), Whitaker (2007). Here, advantages and disadvantages of both approaches are highlighted and discussed.
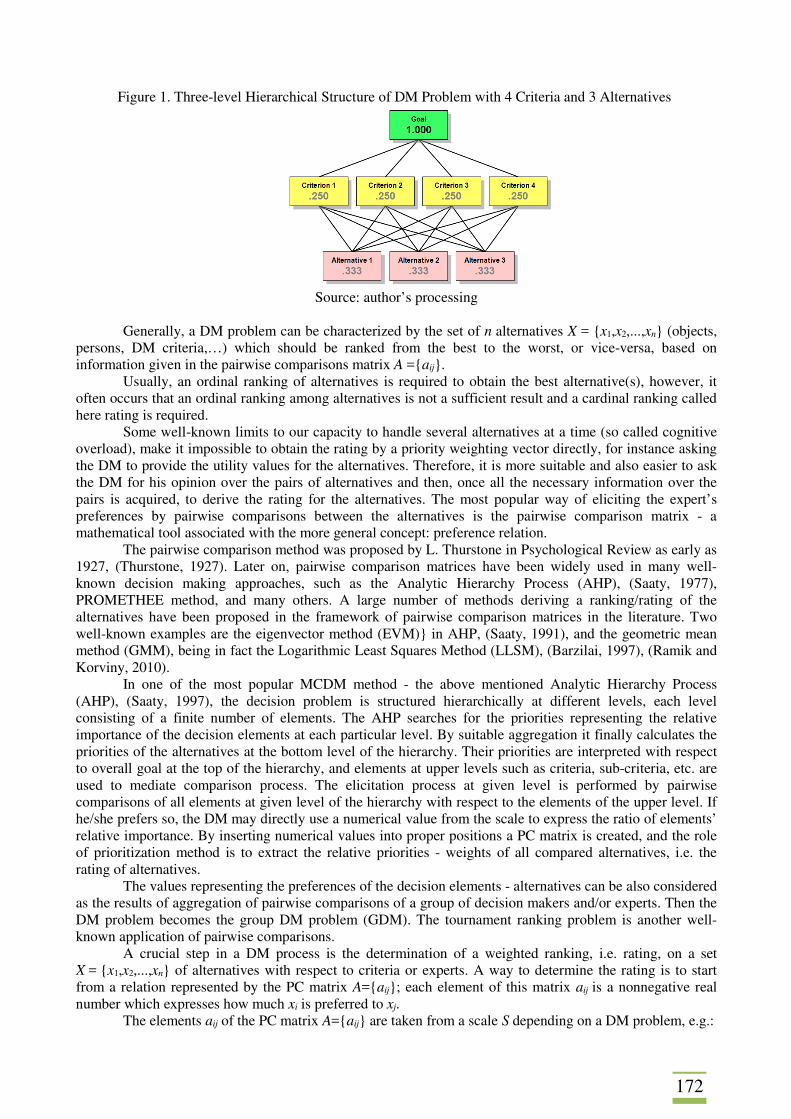
172
Figure 1. Three-level Hierarchical Structure of DM Problem with 4 Criteria and 3 Alternatives
Source: author’s processing
Generally, a DM problem can be characterized by the set of n alternatives X = {x1,x2,...,xn} (objects,
persons, DM criteria,…) which should be ranked from the best to the worst, or vice-versa, based on information given in the pairwise comparisons matrix A ={aij}.
Usually, an ordinal ranking of alternatives is required to obtain the best alternative(s), however, it often occurs that an ordinal ranking among alternatives is not a sufficient result and a cardinal ranking called here rating is required.
Some well-known limits to our capacity to handle several alternatives at a time (so called cognitive overload), make it impossible to obtain the rating by a priority weighting vector directly, for instance asking the DM to provide the utility values for the alternatives. Therefore, it is more suitable and also easier to ask the DM for his opinion over the pairs of alternatives and then, once all the necessary information over the pairs is acquired, to derive the rating for the alternatives. The most popular way of eliciting the expert’s preferences by pairwise comparisons between the alternatives is the pairwise comparison matrix - a mathematical tool associated with the more general concept: preference relation.
The pairwise comparison method was proposed by L. Thurstone in Psychological Review as early as 1927, (Thurstone, 1927). Later on, pairwise comparison matrices have been widely used in many well-known decision making approaches, such as the Analytic Hierarchy Process (AHP), (Saaty, 1977), PROMETHEE method, and many others. A large number of methods deriving a ranking/rating of the alternatives have been proposed in the framework of pairwise comparison matrices in the literature. Two well-known examples are the eigenvector method (EVM)} in AHP, (Saaty, 1991), and the geometric mean method (GMM), being in fact the Logarithmic Least Squares Method (LLSM), (Barzilai, 1997), (Ramik and Korviny, 2010).
In one of the most popular MCDM method - the above mentioned Analytic Hierarchy Process (AHP), (Saaty, 1997), the decision problem is structured hierarchically at different levels, each level consisting of a finite number of elements. The AHP searches for the priorities representing the relative importance of the decision elements at each particular level. By suitable aggregation it finally calculates the priorities of the alternatives at the bottom level of the hierarchy. Their priorities are interpreted with respect to overall goal at the top of the hierarchy, and elements at upper levels such as criteria, sub-criteria, etc. are used to mediate comparison process. The elicitation process at given level is performed by pairwise comparisons of all elements at given level of the hierarchy with respect to the elements of the upper level. If he/she prefers so, the DM may directly use a numerical value from the scale to express the ratio of elements’ relative importance. By inserting numerical values into proper positions a PC matrix is created, and the role of prioritization method is to extract the relative priorities - weights of all compared alternatives, i.e. the rating of alternatives.
The values representing the preferences of the decision elements - alternatives can be also considered as the results of aggregation of pairwise comparisons of a group of decision makers and/or experts. Then the DM problem becomes the group DM problem (GDM). The tournament ranking problem is another well-known application of pairwise comparisons.
A crucial step in a DM process is the determination of a weighted ranking, i.e. rating, on a set X = {x1,x2,...,xn} of alternatives with respect to criteria or experts. A way to determine the rating is to start from a relation represented by the PC matrix A={aij}; each element of this matrix aij is a nonnegative real number which expresses how much xi is preferred to xj.
The elements aij of the PC matrix A={aij} are taken from a scale S depending on a DM problem, e.g.:
173
S = {0,1} – binary scale, S ={1/9, 1/8,…,1/2, 1, 2, … ,9} – AHP scale, S = ]0
; +∞ [, or S = ]-∞
;+∞[ – interval scale,
S = [0 ; 1] – unit interval scale. The properties of the PC matrix depend on the various meaning given to the number aij , particularly,
the preference matrix A ={aij} becomes: multiplicative, additive or fuzzy. Probably, the first human who wrote about PC method was a medieval monk and scholar Ramon Llull. The method was mentioned by Marquis de Condorcet in 1785, and was explicitly mentioned and analyzed by Gustav Fechner in 1860, made popular by Luis Thurstone in 1927 and was transformed into a kind of formal methodology by Thomas Saaty in 1977 (called AHP - Analytic Hierarchy Process). Up till now, hundreds of real-life applications have been described in the literature, see e.g. Vaidya and Kumar (2006). 2. Reciprocity and Consistency
We say that a PC matrix A = {aij} is reciprocal, if aij ⋅ aji = 1, or aji
= 1/aij for all i, j ϵ {1,2,…,n}. (1)
A PC matrix A = {aij} is consistent, if aik =
aij ⋅ ajk ,
for all i, j, k ϵ {1,2,…,n}. (2) If (2) is not satisfied for some i, j, k, we say that A is inconsistent.
The fundamental result concerning consistency is formulated in the following basic theorem. Basic Theorem (Saaty, 1991):
A = {aij} is consistent whenever there exists a vector w = (w1,w2 ,…, wn) such that
aij = wi/wj for all i, j ϵ {1,2,…,n}. (3)
Example 1.
Let A ={aij}, B ={bij}, aij , bij > 0 , be 3×3 PC matrices given as follows:
=1
31
621
31
61
21A ,
=1
31
421
31
4121B .
It is easy to check (1), (2) and verify that A, B are reciprocal, A is consistent and B is inconsistent, as b13
≠ b12 ⋅ b23 , i.e. 4 ≠ 2 ⋅ 3 = 6.
Let A ={aij} be a PC matrix with positive elements. It is natural to assume reciprocity of PC matrix,
in real situations PC matrices are, however, always inconsistent. The measure of consistency of the PCM – consistency index CI - is a function of matrix elements, such that CI = 0, whenever the PC matrix is consistent. Here, we shall introduce and discuss most popular types of consistency indices. 3. Consistency
In this section we shall deal with two approaches how to measure the consistency of a PC matrix A ={aij} by consistency index. The first consistency index was introduced in (Saaty, 1977) and it is based on the eigenvalue of A ={aij}, the second method based directly on the definition of consistency (2) was proposed in (Koczkodaj, 1993).

174
3.1 Measuring Consistency 1
Let A ={aij} be an n×n PC matrix with positive elements, then by Perron-Frobenius theorem see e.g. Gavalec et. al., (2014) there exists a unique positive eigenvalue of A, λmax, and positive eigenvector w = (w1,w2 ,…, wn) such that
niwwawAw i
n
jjij ,...,2,1or max
1max === ∑
=
λλ (4)
Theorem (Saaty, 1991):
λmax = n whenever A ={aij} is consistent, otherwise λmax > n. (5)
T. Saaty defined consistency index CI of A as follows:
1)( max
−−=
n
nACI
λ , (6)
and, consistency ratio as:
)(
)()(
nRI
ACIACR = . (7)
Here, RI(n) is so called random index which is defined as the mean value of CIs for positive reciprocal PC matrices of dimension n. The values of RI(n) for n =3,4,...,15 can be found e.g. in (Saaty, 1991). By Saaty´s arguments, the consistency ratio “should be less than 0.1, i.e. CR < 0.1. Some PC matrices have CR < 0.1, however, their “intuitive consistency” is bad! Example 2. “Corner” PC matrix
=
111
1111
1111
111
),(
1 L
L
MOLMM
L
x
x
xnCPC .
Theorem:2
)),((n
xxnCPCCI ≤ .
For x = 10, CI(CPC(10,10))<0.1. Intuitively, CPC(10,10) is not consistent, as element x = 10 is
substantially different to other elements (i.e. 1s) of the matrix. 3.2 Measuring Consistency 2
Here, we define a different concept of consistency measure which is based on (2), see Koczkodaj (1993). A motivation is based on the equality
kjia
aaaaa
ij
kjikkjikij ,,01 ∀=⇔= - .
Definition: Let A ={aij} be PC matrix. The (Koczkodaj’s) consistency index KI(A) is defined as

175
=≤≤
},min{-1max)(1 ij
kjik
kjik
ij
ni,j,k a
aa
aa
aAKI . (8)
Notice that A is consistent whenever CI(A) = CR(A) = KI(A) = 0, where CI(A) is the consistency
index by T. Saaty. Moreover, In contrast to Saaty’s consistency index CI(A) that is unbounded in its values, the maximum value of KI(A) = 1. This property enables consistency comparing for various PC matrices with different dimensions n. It is clear that if A is inconsistent, then CI(A) ≠ CR(A) ≠ KI(A).
By a similar approach to the question of an “acceptable” measure of inconsistency we consider that KI(A) should not exceed the value 0.1 (i.e. 10 % of the range [0; 1]). Example 3.
Let B ={bij}, bij > 0 , be a 3×3 PC matrix as follows
=1
31
421
31
4121B .
It can be easily shown that B is inconsistent as b13
≠ b12 ⋅ b23, i.e. 4 ≠ 2 ⋅ 3 = 6.
Saaty’s consistency index:
017.05.0
009.0)3()(
)(,009.0)( ====RI
BCIBCRBCI
and Koczkodaj’s consistency index: KI(B) = 1- min{�
�,�
�} = 0.333 .
Whereas CR(B) < 0.1 and hence the inconsistency of B is acceptable, on the other hand, KI(B) > 0.1 saying that the inconsistency of B is unacceptable.
4. Priority Vector
Let A ={aij} be an n×n PC matrix (i.e. positive, reciprocal square matrix). Priority vector (PV) of PC
matrix A associated with n alternatives x1,x2,...,xn is an n-vector w = (w1,…,wn) with positive components (calculated from the elements of A) such that wi denotes the relative importance of xi, i=1,2,…,n, such that: xi is „not worse than“xj whenever wi
≥ wj .
Here, we deal with two most popular methods for calculating PV:1. Saaty´s EVM and 2. GAM (LLSQM). 4.1 Eigenvector Method - EVP
Let A ={aij}, aij > 0, be a PC matrix, w = (w1,…,wn), wj > 0, be a vector satisfying
niwwawAwi
n
j=jij
,...,2,1=)=or(=max
1max
λλ ∑ . (9)
Normalized solution w(A) = (w1,…,wn) of (9) is an eigenvector associated to λmax is called the priority vector of A (also called vector of weights) generated by EVP method.
Notice, that if A is consistent PC matrix, then by Basic theorem the priority vector w(A) satisfies: A ={aij}={wi
/wj}. (10)
Then each normalized row of A is a PV.
If A is inconsistent then the priority vector w(A) can be calculated iteratively by Wielandt’s theorem, see Saaty (1991):
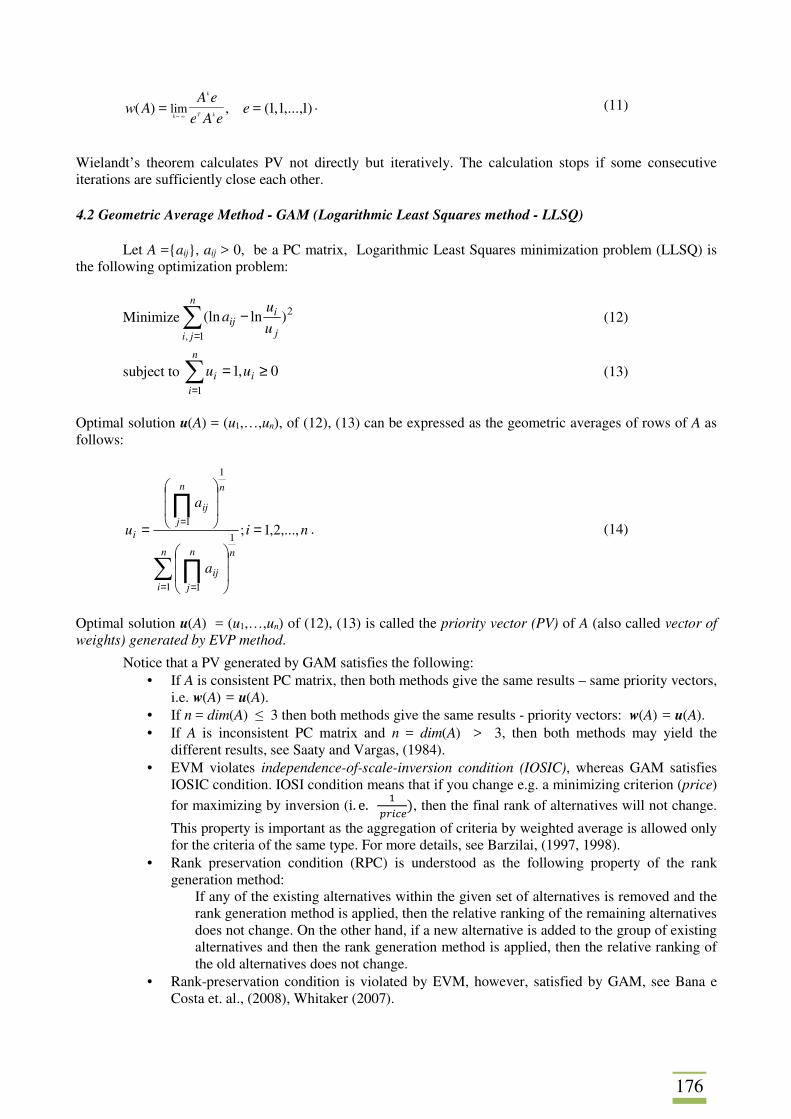
176
)1,...,1,1(=,=)( lim eeAe
eAAw
kT
k
k ∞→
. (11)
Wielandt’s theorem calculates PV not directly but iteratively. The calculation stops if some consecutive iterations are sufficiently close each other. 4.2 Geometric Average Method - GAM (Logarithmic Least Squares method - LLSQ)
Let A ={aij}, aij > 0, be a PC matrix, Logarithmic Least Squares minimization problem (LLSQ) is
the following optimization problem:
Minimize 2
1,
)ln(ln∑=
−n
ji j
iij u
ua (12)
subject to 0,11
≥=∑=
i
n
ii uu (13)
Optimal solution u(A) = (u1,…,un), of (12), (13) can be expressed as the geometric averages of rows of A as follows:
ni
a
a
u
nn
i
n
j
ij
nn
jij
i ,...,2,1;1
1 1
1
1 =
=
∑ ∏
∏
= =
=. (14)
Optimal solution u(A) = (u1,…,un) of (12), (13) is called the priority vector (PV) of A (also called vector of weights) generated by EVP method.
Notice that a PV generated by GAM satisfies the following: • If A is consistent PC matrix, then both methods give the same results – same priority vectors,
i.e. w(A) = u(A). • If n = dim(A) ≤ 3 then both methods give the same results - priority vectors: w(A) = u(A). • If A is inconsistent PC matrix and n = dim(A) > 3, then both methods may yield the
different results, see Saaty and Vargas, (1984). • EVM violates independence-of-scale-inversion condition (IOSIC), whereas GAM satisfies
IOSIC condition. IOSI condition means that if you change e.g. a minimizing criterion (price) for maximizing by inversion (i. e.
�
���), then the final rank of alternatives will not change.
This property is important as the aggregation of criteria by weighted average is allowed only for the criteria of the same type. For more details, see Barzilai, (1997, 1998).
• Rank preservation condition (RPC) is understood as the following property of the rank generation method:
If any of the existing alternatives within the given set of alternatives is removed and the rank generation method is applied, then the relative ranking of the remaining alternatives does not change. On the other hand, if a new alternative is added to the group of existing alternatives and then the rank generation method is applied, then the relative ranking of the old alternatives does not change.
• Rank-preservation condition is violated by EVM, however, satisfied by GAM, see Bana e Costa et. al., (2008), Whitaker (2007).
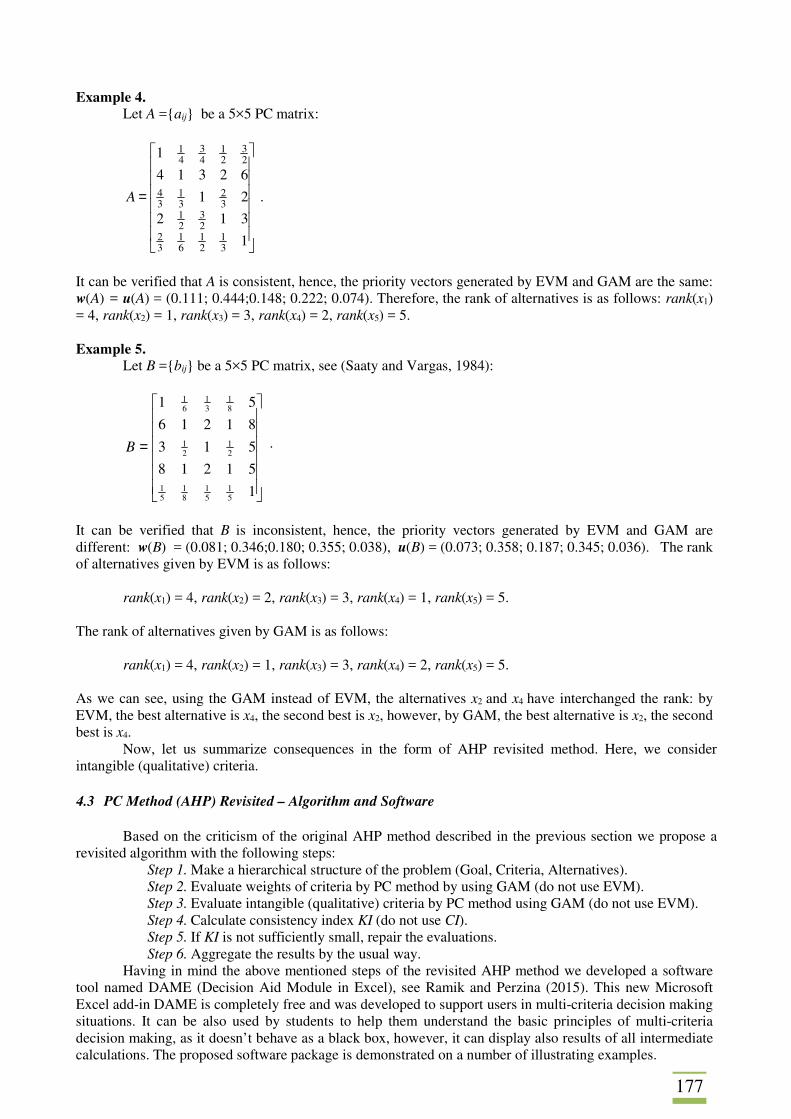
177
Example 4. Let A ={aij} be a 5×5 PC matrix:
1
312
21
62314
1
31
21
61
32
23
21
32
31
34
23
21
43
41
=A .
It can be verified that A is consistent, hence, the priority vectors generated by EVM and GAM are the same: w(A) = u(A) = (0.111; 0.444;0.148; 0.222; 0.074). Therefore, the rank of alternatives is as follows: rank(x1) = 4, rank(x2) = 1, rank(x3) = 3, rank(x4) = 2, rank(x5) = 5. Example 5.
Let B ={bij} be a 5×5 PC matrix, see (Saaty and Vargas, 1984):
=
1
51218
513
81216
51
51
51
81
51
21
21
81
31
61
B .
It can be verified that B is inconsistent, hence, the priority vectors generated by EVM and GAM are different: w(B) = (0.081; 0.346;0.180; 0.355; 0.038), u(B) = (0.073; 0.358; 0.187; 0.345; 0.036). The rank of alternatives given by EVM is as follows:
rank(x1) = 4, rank(x2) = 2, rank(x3) = 3, rank(x4) = 1, rank(x5) = 5. The rank of alternatives given by GAM is as follows:
rank(x1) = 4, rank(x2) = 1, rank(x3) = 3, rank(x4) = 2, rank(x5) = 5.
As we can see, using the GAM instead of EVM, the alternatives x2 and x4 have interchanged the rank: by EVM, the best alternative is x4, the second best is x2, however, by GAM, the best alternative is x2, the second best is x4.
Now, let us summarize consequences in the form of AHP revisited method. Here, we consider intangible (qualitative) criteria. 4.3 PC Method (AHP) Revisited – Algorithm and Software
Based on the criticism of the original AHP method described in the previous section we propose a
revisited algorithm with the following steps: Step 1. Make a hierarchical structure of the problem (Goal, Criteria, Alternatives). Step 2. Evaluate weights of criteria by PC method by using GAM (do not use EVM). Step 3. Evaluate intangible (qualitative) criteria by PC method using GAM (do not use EVM). Step 4. Calculate consistency index KI (do not use CI). Step 5. If KI is not sufficiently small, repair the evaluations. Step 6. Aggregate the results by the usual way.
Having in mind the above mentioned steps of the revisited AHP method we developed a software tool named DAME (Decision Aid Module in Excel), see Ramik and Perzina (2015). This new Microsoft Excel add-in DAME is completely free and was developed to support users in multi-criteria decision making situations. It can be also used by students to help them understand the basic principles of multi-criteria decision making, as it doesn’t behave as a black box, however, it can display also results of all intermediate calculations. The proposed software package is demonstrated on a number of illustrating examples.
178
5. Conclusion
In this paper, we have dealt with two essential elements of AHP: measuring consistency of PC matrix and eliciting a priority vector by which the final ranking of alternatives is settled. Classical approaches introduced by T. Saaty in AHP have been compared with later approaches based on the AHP criticism published in the literature. Particularly, consistency indices proposed originally by T. Saaty and later on by W. Koczkodaj have been discussed and some deficiency of the first one has been demonstrated. Moreover, the priority vector derived by eigenvalue method (EVM) has been investigated in comparison with the geometric average method (GAM). The most important advantages and disadvantages of both approaches have been highlighted and discussed. A new revisited algorithm of AHP method has been proposed and new software tool has been mentioned. Acknowledgement
This paper was supported by the Ministry of Education, Youth and Sports Czech Republic within the Institutional Support for Long-term Development of a Research Organization in 2017. References BANA E COSTA, C.A., VANSNICK, J. C. (2008). A critical analysis of the eigenvalue method used to derive priorities in the AHP. European Journal of Operational Research, vol.187, no.3, pp.1422-1428. BARZILAI, J. (1997). Deriving weights from pairwise comparison matrices. Journal of the Operational Research Society, vol. 48, no. 12, pp. 1226-1232. BARZILAI, J. (1998). Consistency Measures for Pairwise Comparison Matrice. J. Multi-Crit. Decis. Anal., vol. 7, no. 1, pp. 123-132. KOCZKODAJ, W. W. (1993). A new definition of consistency of pairwise comparisons. Math. Comput. Modelling, vol.18, pp.79-93. RAMIK, J., KORVINY, P. (2010). Inconsistency of pairwise comparison matrix with fuzzy elements based on geometric mean. Fuzzy Sets and Systems, vol. 161, pp.1604-1613. RAMIK, J., PERZINA, R. (2015). Educational Microsoft Excel Add-ins Solving Multicriteria Decision Making Problems. CSEDU 2015 - 7th International Conference on Computer Supported Education, 2015, pp. 510-515. GAVALEC, M., RAMIK, J., ZIMMERMANN, K. (2014). Decision making and Optimization – Special Matrices and Their Applications in Economics and Management. Springer Internat. Publ. Switzerland, Cham-Heidelberg-New York-Dordrecht-London. SAATY, T.L. (1977). A Scaling Method for Priorities in Hierarchical Structure. Journal of Mathematical Psychology, vol. 15, no. 3, pp. 234-281. SAATY, T.L. (1991). Multicriteria decision making - the Analytical Hierarchy Process. RWS Publications, vol. I., Pittsburgh. SAATY, T.L., VARGAS, L.G. (1984). Comparison of eigenvalue, logarithmic least squares and least squares methods in estimating ratios. Mathematical Modelling, vol. 5, pp. 309–324. THURSTONE, L.L. (1927). A Law of Comparative Judgments, Psychological Reviews, vol. 34, pp. 273-286. VAIDYA, O. S., KUMAR, S. (2006). Analytic hierarchy process: An overview of applications. European Journal of Operational Research, vol. 169, no. 1, pp. 1-29.

179
VARGAS, L.G. (1997). Why the Multiplicative AHP is Invalid: A practical counterexample. Journal of Multi-Criteria Decision Analysis, vol.6, pp. 169-170. WHITAKER, R. (2007). Criticisms of the Analytic Hierarchy Process: Why they often make no sense. Mathematical and Computer Modeling, vol. 46, no. 7/8, pp. 948-961.
180
WHY MANAGERS MAKE UNETHICAL MANAGERIAL DECISIONS Ján Rudy Comenius University in Bratislava Faculty of Management, Department of Management Odbojárov 10, P.O. Box 95 Bratislava, 820 05 Slovak Republic email: [email protected] Abstract:
This article is based on the research conducted by an international team of researchers on the sample of 810 managers from both state-owned and private companies operating in the Slovak business environment that has been completed in September 2015. Its primary focus was the identification of factors that influence ethical behavior of managers in competitive environments. Because of decision-making’s key role in managerial work, managers in real companies get both opportunity and responsibility to deal with factors that can influence both ethical and unethical behavior. This paper purposes to describe the main research findings in the area of individual managerial decision-making. Keywords: bounded model, decisional role of managers, individual and group decision-making, managerial decision-making, rational model JEL Codes: M12, M14 1. Introduction
The decisional role of a manager in practice is performed through both individual and group
managerial decision-making. Individual managerial decision-making differs from personal decision-making of a manager in several aspects. The latter is also individual decision-making but its focus is on the decision-maker‘s personality. Managerial decision-making deals with either problem solving or opportunity identification (Rudy and Rudyová, 2008). Depending on the level of management, its focus is on the organization as a whole or the organizational unit.
Managerial decision-making is a process that consists of several steps. According to the classical theory, the typical steps include such as identification of a problem, specification of alternatives, evaluation of alternatives according to the specific criteria, and selection of the best appropriate alternative. Some authors add also the implementation and evaluation of the decision. Depending on the decision-making model, such as rational or bounded rationality, usually there are specific criteria of the alternatives evaluation (Rudy et al., 2013). And this is the point where we turn to the area of behavioral ethics. It is an area of study that analyzes how people behave when confronted with ethical dilemma (Robbins and Judge, 2015) Ethical considerations should be an important criterion of the alternatives evaluation in all managerial decision-making. In reality, there is a room for ethical or unethical behavior of a manager in all steps of the decision-making process. Even in case of intuitive decision-making where managers pay little attention to the decision-making steps, the final product – the decision itself could be either ethical or unethical.
2. Empirical Research Objectives, Techniques, and Methodology
In reality, the research objective was twofold. First, the identification of the factors that influence
ethical/unethical behavior of managers as leaders, and second, the identification of the factors that influence ethical/unethical behavior of managers as decision-makers. The questionnaire as a research technique has been designed according to this research objective. Number of statistical techniques such as T-test, frequency analysis, linear regression, and some other have been applied in empirical data evaluation. The minimum size of the research sample 688 has been specified according to the methodology by J. Cohen (Cohen et al., 2013). Actual size of the research sample 810 managers from both the state-owned and private companies operating mainly in the secondary and tertiary sector of the Slovak business environment included managers from all managerial levels. Research sample of that size means the number of received responses. Total number of questionnaires that had been sent in both the electronic and the hard copy form was about four-times higher which means about 25 % response return. Part of a questionnaire dealing with ethical managerial decision-making included questions from the following areas of individual decision-making:
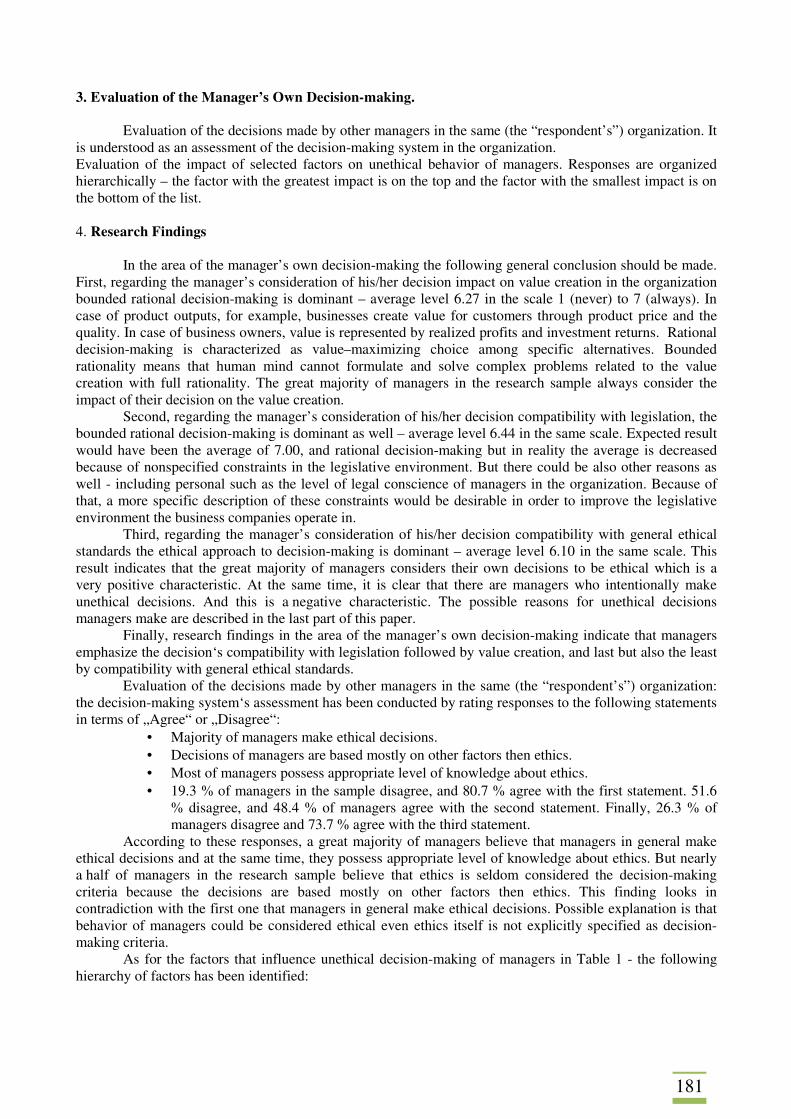
181
3. Evaluation of the Manager’s Own Decision-making. Evaluation of the decisions made by other managers in the same (the “respondent’s”) organization. It
is understood as an assessment of the decision-making system in the organization. Evaluation of the impact of selected factors on unethical behavior of managers. Responses are organized hierarchically – the factor with the greatest impact is on the top and the factor with the smallest impact is on the bottom of the list. 4. Research Findings
In the area of the manager’s own decision-making the following general conclusion should be made.
First, regarding the manager’s consideration of his/her decision impact on value creation in the organization bounded rational decision-making is dominant – average level 6.27 in the scale 1 (never) to 7 (always). In case of product outputs, for example, businesses create value for customers through product price and the quality. In case of business owners, value is represented by realized profits and investment returns. Rational decision-making is characterized as value–maximizing choice among specific alternatives. Bounded rationality means that human mind cannot formulate and solve complex problems related to the value creation with full rationality. The great majority of managers in the research sample always consider the impact of their decision on the value creation.
Second, regarding the manager’s consideration of his/her decision compatibility with legislation, the bounded rational decision-making is dominant as well – average level 6.44 in the same scale. Expected result would have been the average of 7.00, and rational decision-making but in reality the average is decreased because of nonspecified constraints in the legislative environment. But there could be also other reasons as well - including personal such as the level of legal conscience of managers in the organization. Because of that, a more specific description of these constraints would be desirable in order to improve the legislative environment the business companies operate in.
Third, regarding the manager’s consideration of his/her decision compatibility with general ethical standards the ethical approach to decision-making is dominant – average level 6.10 in the same scale. This result indicates that the great majority of managers considers their own decisions to be ethical which is a very positive characteristic. At the same time, it is clear that there are managers who intentionally make unethical decisions. And this is a negative characteristic. The possible reasons for unethical decisions managers make are described in the last part of this paper.
Finally, research findings in the area of the manager’s own decision-making indicate that managers emphasize the decision‘s compatibility with legislation followed by value creation, and last but also the least by compatibility with general ethical standards.
Evaluation of the decisions made by other managers in the same (the “respondent’s”) organization: the decision-making system‘s assessment has been conducted by rating responses to the following statements in terms of „Agree“ or „Disagree“:
• Majority of managers make ethical decisions. • Decisions of managers are based mostly on other factors then ethics. • Most of managers possess appropriate level of knowledge about ethics. • 19.3 % of managers in the sample disagree, and 80.7 % agree with the first statement. 51.6
% disagree, and 48.4 % of managers agree with the second statement. Finally, 26.3 % of managers disagree and 73.7 % agree with the third statement.
According to these responses, a great majority of managers believe that managers in general make ethical decisions and at the same time, they possess appropriate level of knowledge about ethics. But nearly a half of managers in the research sample believe that ethics is seldom considered the decision-making criteria because the decisions are based mostly on other factors then ethics. This finding looks in contradiction with the first one that managers in general make ethical decisions. Possible explanation is that behavior of managers could be considered ethical even ethics itself is not explicitly specified as decision-making criteria.
As for the factors that influence unethical decision-making of managers in Table 1 - the following hierarchy of factors has been identified:
182
Table 1: Unethical Decision-Making Factors
# Factor Level in the scale 1 to 7
Note
1 Unethical organizational culture 5.79 Highest impact 2 Stockholders are not interested in how the profit has been earned 5.66 3 Existence of injustice in HRM policy 5.60 4 Unethical behavior of superiors 5.57
5 Superiors are not interested in how tasks were accomplished, important is that tasks were accomplished 5.53
6 Pressure of a business partner to get unfair an advantage 5.21 7 In the organization is not clear what is ethical/unethical behavior 5.17 8 The company is in a critical economic situation 5.04 9 Manager is not capable identifying what is the ethical side of the problem 4.92 10 Decision is made under the time pressure (stress) 4.43 11 Poor organization of work 4.35 Lowest impact
Source: Ethical Leadership in Slovak Business Environment (Remišová et al., 2016)
Unethical organizational culture has been proven as the most influential factor on unethical behavior of managers. Organizational culture is the shared beliefs and values that influence the behavior of organizational members. In other words, organizational culture is the way in which things are done in our organization. Because of its role in ethical behavior of managers, organizational culture should be designed as a culture that will stimulate ethical behavior, and at the same time suppress unethical behavior. Ethical organizational structure design requires formal power. Because of that, the ethical organizational culture is a managerial responsibility. According to our research, it is the primary managerial responsibility.
„Stockholders are not interested in how the profit has been earned“ is the second factor influencing unethical behavior of managers. In the context of ethical decision criteria this is a quite unexpected finding. There are three basic ethical decision criteria known in literature. They are as follows:
• Utilitarianism – a system in which decisions are made to provide the greatest good for the greatest number (of people).
• Whistle-blowers – a system that emphasizes respecting and protecting the basic rights of individuals. Under this system, the whistle-blowers – the individuals who report unethical practices by their employer to outsiders – are protected when they use their right to free speech and report unethical practices.
A third criterion is related to justice in term of equitable distribution of benefits and costs. If the stockholders are not interested in how profit has been earned, it is for sure not utilitarianism. It
tends to be the justice approach. In our case it is clear that not ethical behavior but profit is a priority for stockholders. Similar to other countries, there are two forms of company ownership in Slovakia – private and public. Of course, in our research we did not separate private and public companies but in general private companies tend to be more efficient and more interested in profit simply because the owner is interested in profit. Public companies tend to be less efficient because the owner is the state which sometimes means there is no specific owner. Personal interest is missing in this case.
Existence of injustice in HRM policy is the third factor that according to our findings influences unethical behavior of managers. It is practical implementation of all HRM functions in the organization. There is both potential and possibility for unethical behavior and injustice in almost all HRM functions. The common output of the inequity practice in a company is dissatisfaction of employees. For example, performance appraisal systems and compensation systems have to be designed very carefully in term of internal, external, and individual equity. Career planning should be transparent as well.
Unethical behavior of superiors is closely related to the organizational culture influence. Even managers with strong ethical feelings will find themselves in intrapersonal conflict when asked by a superior to accept his/her unethical behavior or are forced to behave unethically. On the other hand, unethical managers feel like „a fish in the water“ in such an unethical environment because they get support from their superiors who are of the same „blood group“. Unethical behavior is the „value“ they appreciate.
Superiors are not interested in how tasks were accomplished, important is that tasks were accomplished. Here is a parallel to the influence of the stockholders who are not interested in how the profit has been earned. A superior is not necessarily the owner but the influence is similar. A superior’s personality traits such as authoritarianism support the influence of that factor.
Pressure of a business partner to get an unfair advantage is the sixth factor of influence in the hierarchy. It is expected that managers and companies who operate in a competitive environment frequently
183
find themselves in such a situation. The way to increase resistance to the influence of that factor is development of management communication and negotiation skills.
When it is not clear what is ethical/unethical behavior in the organization - it means the value system in the organization does not exist. Of course, individuals have their own sense what is right and what is wrong but formal regulation such as an ethical codex does not exist. Value systems of individuals usually differ from each other because they are formed by number of influences such as the family, friends, etc. It is beneficial for the company as well as for the employees if the company value system is clearly specified.
„The company is in a critical economic situation“ is the eighth factor in the hierarchy of impacts on unethical behavior of managers. There are several reasons why a company can get into a critical economic situation. For example losses, loans but also wrong decisions, insolvency and possibly some other. But in general, a critical economic situation is not a good reason to justify the unethical behavior of managers.
In reality it could happen that some managers are not capable identifying what is the ethical side of the problem. This refers to managerial skills development because „not knowing“ is also not an excuse for the unethical behavior of a manager. Issue could also be related to the leadership style of a manager. Single leadership style could result in limited information about the ethical side of the problem. Management development would have been the best suggestion to minimize the influence of this factor, i.e. the inability to identify the ethical side of the problem.
The following factor – „The decision was made under the time pressure“ is very common because managerial work itself is stressful. It is more or less surprising that respondents put it only in the tenth position because it could have been expected to be ranked higher. Unethical decision caused by stress is closely related to the last factor in our hierarchy – poor work organization.
Managers deal with two types of work organization – organization of their own work and organization of the work of subordinates. Managers always complain about a heavy work load but poor organization of their own work is a frequent reason for that. The only suggestion in this case would be the better organization of work.
Research methodology requires that we also ask an additional open question in the questionnaire. That question would be: „According to you, what are other possible factors that influence unethical decisions of managers?“ Of course we posed this question as well but there was not a single response received to it. 5. Conclusion
Taking in the consideration the size of the research sample these finding could be generalized for the entire business environment in Slovakia. According to the findings, an ethical approach to managerial decision-making is predominant. Managers very often or always take into consideration the impact of their decision on economic results of organization, very often or always take into consideration, whether their decision comply with ethical standards, and very often or always take into consideration, whether their decision adheres to the law in force. That means, the rational model of decision-making and ethical approach to decision-making dominates the managerial practice. This finding has to be considered very positive because it indicates that managers fulfil their primary mission, i.e. effective functioning of an organization. The fact that managers very often or always take into consideration, whether their decision adhere to the law in force is, in contrary, a warning signal. It assumes that business environment, where managers work, can have serious deficiencies. The existence and competition and functioning legal environment are basic prerequisites for functional market economy. Moreover, respecting the law in force is not a question of good will of managers or citizens in general, but it is their duty with with no exceptions. The deserved answer to this question shoud be always (not very often as it resulted from our research). When assessing other manager's decisions, that is the system of decision-making as we call it in our study we may conclude, that the system of decision-making in Slovak organizations basically creates good conditions for ethical decision-making, that managers respect ethical norms and lastly, that majority of managers think, they have sufficient knowledge of ethics. Finally, the three most influential factors that cause unethical behavior of managers are unethical organizational cultures followed by stockholders who are not interested in how profit has been earned, and the existence of injustice in HRM policy. Finally, it could be stated, that according to the research results, managerial ethics is not considered a kind of fashion anymore but a real and up-to-date requirement of the business environment.

184
References AWASTHI, V.N. (2008). Managerial Decision-Making on Moral Issues and the Effects of Teaching Ethics. Journal of Business Ethics. Volume 78, Issue 1–2, pp 207–223. [online]. Available from: https://doi.org/10.1007/s10551-006-9328-6. COHEN, J., COHEN, P., WEST, S. G., AIKEN, L.S. (2013). Applied Multiple Regression. Correlation Analysis for the Behavioral Sciences, Routledge. FRATRIČOVÁ, J. (2013). Obsah a charakteristika práce manažéra. In Rudy, J., Sulíková, R., Lašáková, A., Fratričová, J., Mitková, Ľ., Manažment a organizačné správanie, MV Wissenschaft. REMIŠOVÁ, A., LAŠÁKOVÁ, A., RUDY, J., SULÍKOVÁ, R., KIRCHMAYER, Z., FRATRIČOVÁ, J. (2015). Etické vedenie ľudí v slovenskom podnikateľskom prostredí. Wolters Kluwer. ROBBINS, S.P., JUDGE, T.A. (2015). Organizational Behavior. Pearson. RUDY, J., RUDYOVÁ, J. (2008). Human Resource Management in Japan. VHK Verlag. RUDY,J., SULÍKOVÁ, R., LAŠÁKOVÁ, A., FRATRIČOVÁ, J., MITKOVÁ, Ľ. (2013). Manažment a organizačné správanie. MV Wissenschaft. RUDY, J., SULÍKOVÁ, R., LAŠÁKOVÁ, A., FRATRIČOVÁ, J., MITKOVÁ, Ľ. (2013). Organizačné správanie. Univerzita Komenského v Bratislave. SCHERMERHORN, J. R., HUNT, J.G., OSBORN, R.N. (2005) Organizational Behavior. John Wiley&Sons.
185
COUNTERFACTUAL IMPACT EVALUATION IN INTERNAL ENVIRONMENT OF ENTERPRISES Žaneta Rylková, Karel Stelmach, Petr Vlček Silesian University in Opava School of Business Administration in Karvina, Department of Business Economics and Management Univerzitní nám. 1934/3 Karviná, 733 40 Czech Republic e-mail: [email protected], [email protected], [email protected] Abstract
Counterfactual impact evaluation (CIE) is strictly a scientific quantitative approach mainly based on experiments and quasi experiments. CIE is trying to prove a causal relationship between outputs and outcomes. Counterfactual indicates a hypothetical situation that will occur if certain change, activity is not realized. Currently CIE is used as an assessment tool evaluating the support from European funds. Within CIE there lacks coherence of external incentives on behavior of companies with internal incentives that have or may have an impact on the behavior of enterprises. The current state of scientific knowledge to CIE offers potential for innovation - new topic, in the Czech Republic it is not enough examined issue - particularly in the use of CIE for impact assessment of internal incentives having an impact on performance. As a result of this paper the authors set up internal evaluation criteria for businesses, counterfactuals and other metrics useful for creating a more complex metrics evaluating businesses including not only the external aspects of CIE, but also the internal aspects which could be used in CIE. Keywords: business evaluation, CIE, OEE, production process JEL codes: M11, M21, M29 1. Introduction
Counterfactual impact evaluation (CIE) is a systematic and an empirical study of the effects which is attributed to intervention - to certain change, help or support. The CIE analysis is currently being used as an assessment tool for the impact of support from the European Funds in the 2014-2020 programming period. In this area of evaluation, there is no interconnection between external incentives influencing the behavior of enterprises and internal incentives which have or may have an impact on business behavior. The current state of scientific counterfactual impact evaluation understanding brings innovation potential, particularly in the use of CIE for assessing the impact of internal incentives affecting business performance. Internal business processes are thought as those incentives taking place in the internal environment. The result of the counterfactual impact evaluation application should lead to the creation of not only quantitative evaluations but also qualitative oriented case studies that would help to demonstrate how to integrate the CIE into an enterprise's internal evaluation system, how to link the results of internal evaluation with the results of external evaluation. External evaluation linked to internal evaluation brings analogy to the interconnection of the SWOT analysis philosophy, which basically combines internal and external business incentives. However the evaluation lacks a more sophisticated evaluation tool to measure the impact of the company's activities.
Management of business entities especially from area of manufacturing enterprises (such as industrial, agricultural, construction enterprises) is significantly affected by the effect of production processes on individual machines or production lines. It can be assumed that the seed of the economic result is influenced at the production stage in terms of costs. Future products with their technical parameters and quality can influence the revenues of economic activity. One of the elements, which can be seen as an indicator of production factors consumption, is the fulfillment of the consumption standard of the relevant material inputs, referred to the THN (the Technical Economic Consumption Standard). The contribution of the paper can be seen in the the suggestion of a production process metric proposal applicable to the internal environment assessment of the manufacturing companies for the purposes of counterfactual impact evaluation and the suggestion of support for such as business entities.
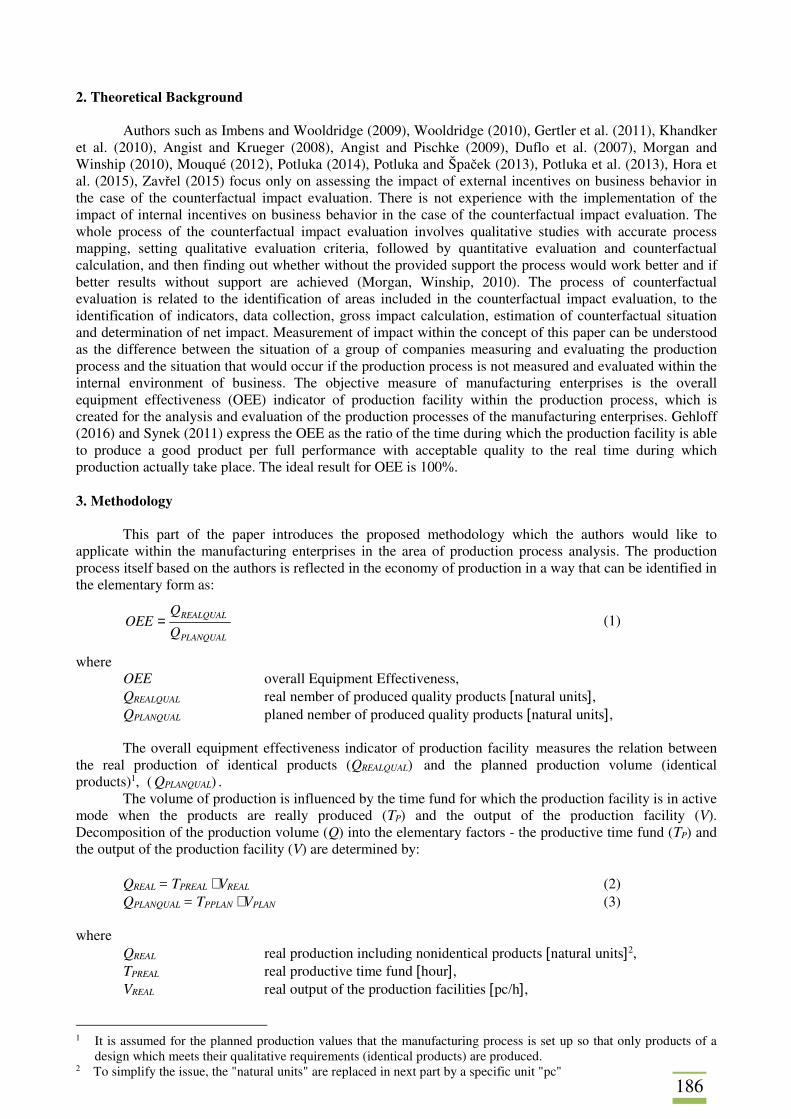
186
2. Theoretical Background
Authors such as Imbens and Wooldridge (2009), Wooldridge (2010), Gertler et al. (2011), Khandker et al. (2010), Angist and Krueger (2008), Angist and Pischke (2009), Duflo et al. (2007), Morgan and Winship (2010), Mouqué (2012), Potluka (2014), Potluka and Špaček (2013), Potluka et al. (2013), Hora et al. (2015), Zavřel (2015) focus only on assessing the impact of external incentives on business behavior in the case of the counterfactual impact evaluation. There is not experience with the implementation of the impact of internal incentives on business behavior in the case of the counterfactual impact evaluation. The whole process of the counterfactual impact evaluation involves qualitative studies with accurate process mapping, setting qualitative evaluation criteria, followed by quantitative evaluation and counterfactual calculation, and then finding out whether without the provided support the process would work better and if better results without support are achieved (Morgan, Winship, 2010). The process of counterfactual evaluation is related to the identification of areas included in the counterfactual impact evaluation, to the identification of indicators, data collection, gross impact calculation, estimation of counterfactual situation and determination of net impact. Measurement of impact within the concept of this paper can be understood as the difference between the situation of a group of companies measuring and evaluating the production process and the situation that would occur if the production process is not measured and evaluated within the internal environment of business. The objective measure of manufacturing enterprises is the overall equipment effectiveness (OEE) indicator of production facility within the production process, which is created for the analysis and evaluation of the production processes of the manufacturing enterprises. Gehloff (2016) and Synek (2011) express the OEE as the ratio of the time during which the production facility is able to produce a good product per full performance with acceptable quality to the real time during which production actually take place. The ideal result for OEE is 100%. 3. Methodology
This part of the paper introduces the proposed methodology which the authors would like to applicate within the manufacturing enterprises in the area of production process analysis. The production process itself based on the authors is reflected in the economy of production in a way that can be identified in the elementary form as:
PLANQUAL
REALQUAL
Q
QOEE = (1)
where OEE overall Equipment Effectiveness, QREALQUAL real nember of produced quality products [natural units], QPLANQUAL planed nember of produced quality products [natural units],
The overall equipment effectiveness indicator of production facility measures the relation between
the real production of identical products (QREALQUAL) and the planned production volume (identical products)1, ( QPLANQUAL) .
The volume of production is influenced by the time fund for which the production facility is in active mode when the products are really produced (TP) and the output of the production facility (V). Decomposition of the production volume (Q) into the elementary factors - the productive time fund (TP) and the output of the production facility (V) are determined by:
QREAL = TPREAL ⋅ VREAL (2) QPLANQUAL = TPPLAN ⋅ VPLAN (3)
where QREAL real production including nonidentical products [natural units]2, TPREAL real productive time fund [hour], VREAL real output of the production facilities [pc/h],
1 It is assumed for the planned production values that the manufacturing process is set up so that only products of a
design which meets their qualitative requirements (identical products) are produced. 2 To simplify the issue, the "natural units" are replaced in next part by a specific unit "pc"
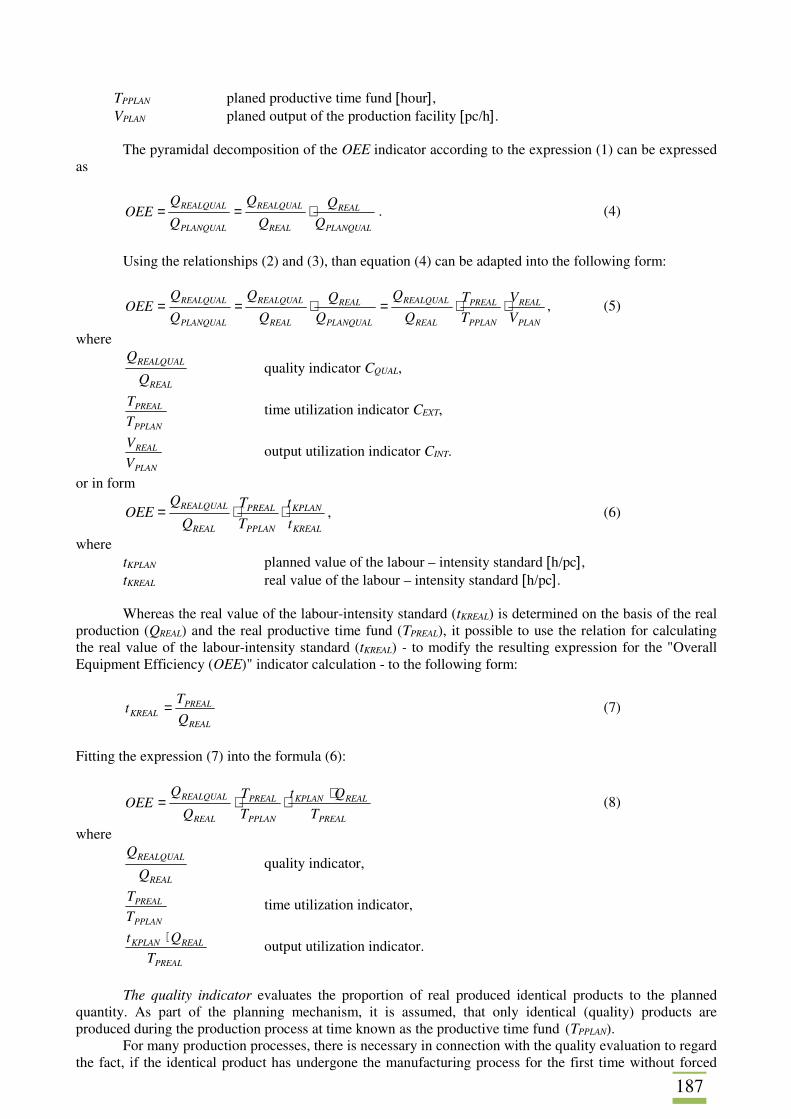
187
TPPLAN planed productive time fund [hour], VPLAN planed output of the production facility [pc/h].
The pyramidal decomposition of the OEE indicator according to the expression (1) can be expressed as
PLANQUAL
REAL
REAL
REALQUAL
PLANQUAL
REALQUAL
Q
Q
Q
Q
Q
QOEE ⋅== . (4)
Using the relationships (2) and (3), than equation (4) can be adapted into the following form:
PLAN
REAL
PPLAN
PREAL
REAL
REALQUAL
PLANQUAL
REAL
REAL
REALQUAL
PLANQUAL
REALQUAL
V
V
T
T
Q
Q
Q
Q
Q
Q
Q
QOEE ⋅⋅=⋅== , (5)
where
REAL
REALQUAL
Q
Q quality indicator CQUAL,
PPLAN
PREAL
T
T time utilization indicator CEXT,
PLAN
REAL
V
V output utilization indicator CINT.
or in form
KREAL
KPLAN
PPLAN
PREAL
REAL
REALQUAL
t
t
T
T
Q
QOEE ⋅⋅= , (6)
where tKPLAN planned value of the labour – intensity standard [h/pc], tKREAL real value of the labour – intensity standard [h/pc]. Whereas the real value of the labour-intensity standard (tKREAL) is determined on the basis of the real
production (QREAL) and the real productive time fund (TPREAL), it possible to use the relation for calculating the real value of the labour-intensity standard (tKREAL) - to modify the resulting expression for the "Overall Equipment Efficiency (OEE)" indicator calculation - to the following form:
REAL
PREALKREAL Q
Tt = (7)
Fitting the expression (7) into the formula (6):
PREAL
REALKPLAN
PPLAN
PREAL
REAL
REALQUAL
T
Qt
T
T
Q
QOEE
⋅⋅⋅= (8)
where
REAL
REALQUAL
Q
Q quality indicator,
PPLAN
PREAL
T
T time utilization indicator,
PREAL
REALKPLAN
T
Qt ⋅ output utilization indicator.
The quality indicator evaluates the proportion of real produced identical products to the planned
quantity. As part of the planning mechanism, it is assumed, that only identical (quality) products are produced during the production process at time known as the productive time fund (TPPLAN).
For many production processes, there is necessary in connection with the quality evaluation to regard the fact, if the identical product has undergone the manufacturing process for the first time without forced
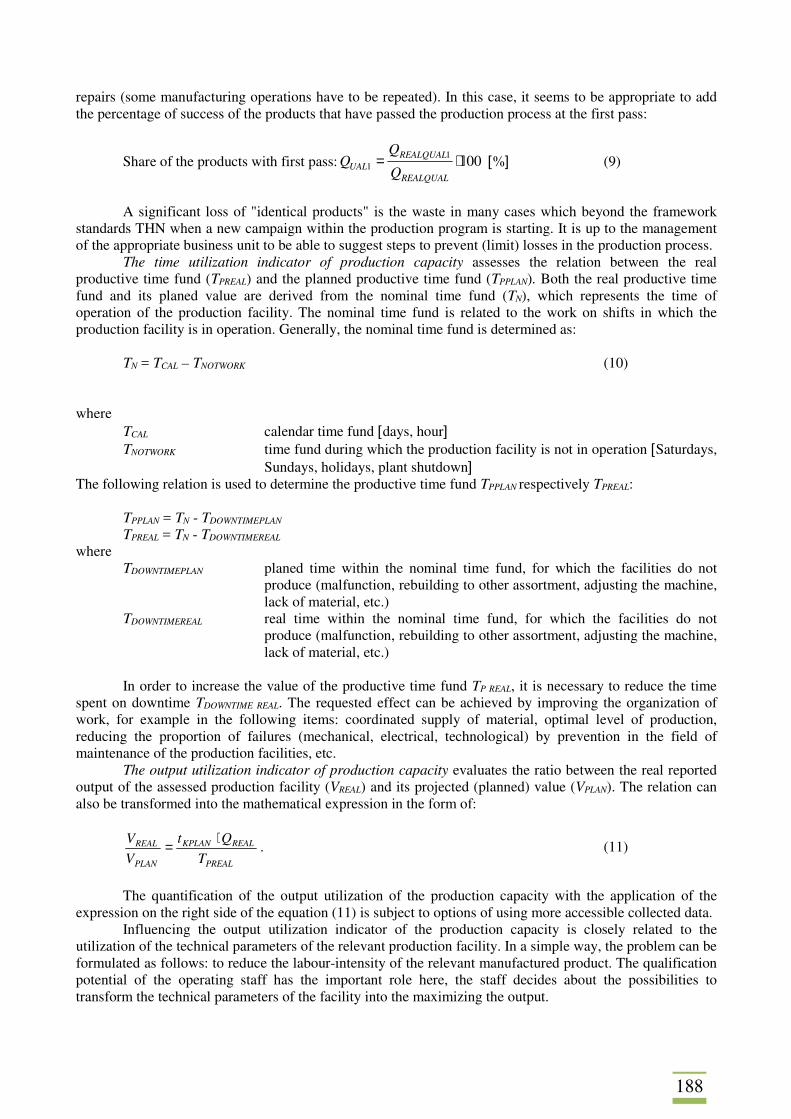
188
repairs (some manufacturing operations have to be repeated). In this case, it seems to be appropriate to add the percentage of success of the products that have passed the production process at the first pass:
Share of the products with first pass: 10011 ⋅=
REALQUAL
REALQUALUAL Q
QQ [%] (9)
A significant loss of "identical products" is the waste in many cases which beyond the framework
standards THN when a new campaign within the production program is starting. It is up to the management of the appropriate business unit to be able to suggest steps to prevent (limit) losses in the production process.
The time utilization indicator of production capacity assesses the relation between the real productive time fund (TPREAL) and the planned productive time fund (TPPLAN). Both the real productive time fund and its planed value are derived from the nominal time fund (TN), which represents the time of operation of the production facility. The nominal time fund is related to the work on shifts in which the production facility is in operation. Generally, the nominal time fund is determined as:
TN = TCAL – TNOTWORK (10)
where
TCAL calendar time fund [days, hour] TNOTWORK time fund during which the production facility is not in operation [Saturdays,
Sundays, holidays, plant shutdown] The following relation is used to determine the productive time fund TPPLAN respectively TPREAL:
TPPLAN = TN - TDOWNTIMEPLAN TPREAL = TN - TDOWNTIMEREAL
where TDOWNTIMEPLAN planed time within the nominal time fund, for which the facilities do not
produce (malfunction, rebuilding to other assortment, adjusting the machine, lack of material, etc.)
TDOWNTIMEREAL real time within the nominal time fund, for which the facilities do not produce (malfunction, rebuilding to other assortment, adjusting the machine, lack of material, etc.)
In order to increase the value of the productive time fund TP REAL, it is necessary to reduce the time
spent on downtime TDOWNTIME REAL. The requested effect can be achieved by improving the organization of work, for example in the following items: coordinated supply of material, optimal level of production, reducing the proportion of failures (mechanical, electrical, technological) by prevention in the field of maintenance of the production facilities, etc.
The output utilization indicator of production capacity evaluates the ratio between the real reported output of the assessed production facility (VREAL) and its projected (planned) value (VPLAN). The relation can also be transformed into the mathematical expression in the form of:
PREAL
REALKPLAN
PLAN
REAL
T
Qt
V
V ⋅= . (11)
The quantification of the output utilization of the production capacity with the application of the
expression on the right side of the equation (11) is subject to options of using more accessible collected data. Influencing the output utilization indicator of the production capacity is closely related to the
utilization of the technical parameters of the relevant production facility. In a simple way, the problem can be formulated as follows: to reduce the labour-intensity of the relevant manufactured product. The qualification potential of the operating staff has the important role here, the staff decides about the possibilities to transform the technical parameters of the facility into the maximizing the output.
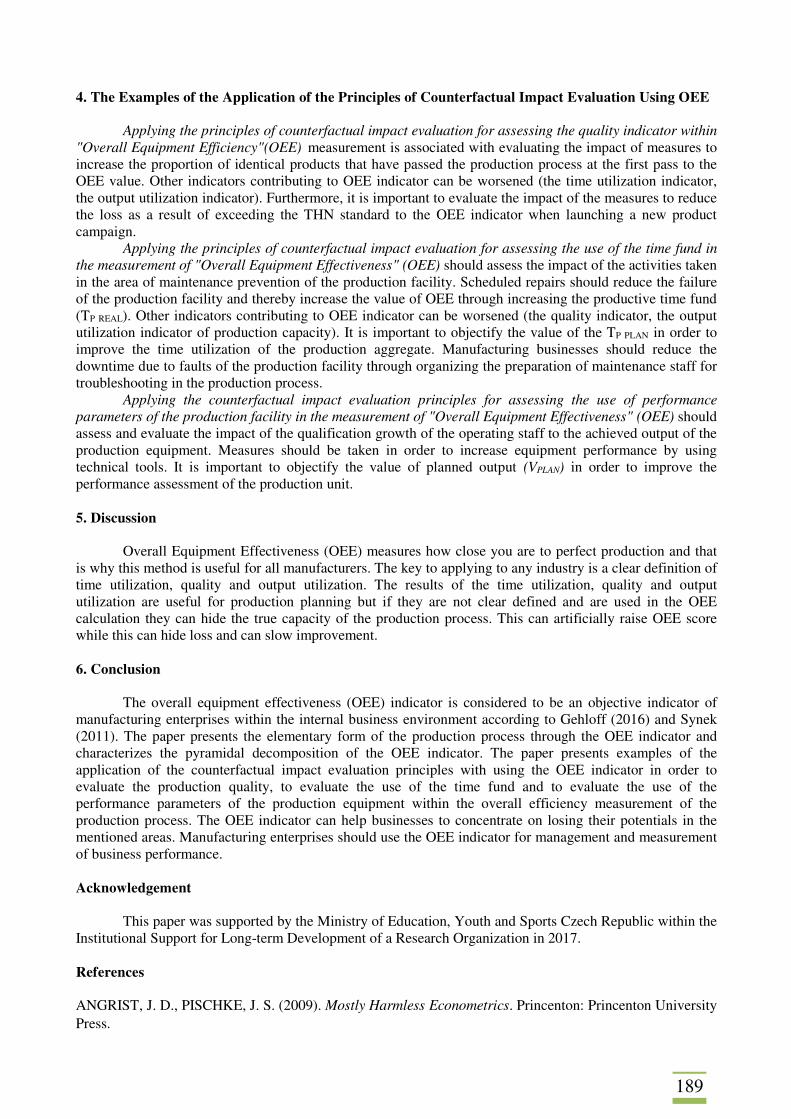
189
4. The Examples of the Application of the Principles of Counterfactual Impact Evaluation Using OEE
Applying the principles of counterfactual impact evaluation for assessing the quality indicator within "Overall Equipment Efficiency"(OEE) measurement is associated with evaluating the impact of measures to increase the proportion of identical products that have passed the production process at the first pass to the OEE value. Other indicators contributing to OEE indicator can be worsened (the time utilization indicator, the output utilization indicator). Furthermore, it is important to evaluate the impact of the measures to reduce the loss as a result of exceeding the THN standard to the OEE indicator when launching a new product campaign.
Applying the principles of counterfactual impact evaluation for assessing the use of the time fund in the measurement of "Overall Equipment Effectiveness" (OEE) should assess the impact of the activities taken in the area of maintenance prevention of the production facility. Scheduled repairs should reduce the failure of the production facility and thereby increase the value of OEE through increasing the productive time fund (TP REAL). Other indicators contributing to OEE indicator can be worsened (the quality indicator, the output utilization indicator of production capacity). It is important to objectify the value of the TP PLAN in order to improve the time utilization of the production aggregate. Manufacturing businesses should reduce the downtime due to faults of the production facility through organizing the preparation of maintenance staff for troubleshooting in the production process.
Applying the counterfactual impact evaluation principles for assessing the use of performance parameters of the production facility in the measurement of "Overall Equipment Effectiveness" (OEE) should assess and evaluate the impact of the qualification growth of the operating staff to the achieved output of the production equipment. Measures should be taken in order to increase equipment performance by using technical tools. It is important to objectify the value of planned output (VPLAN) in order to improve the performance assessment of the production unit.
5. Discussion
Overall Equipment Effectiveness (OEE) measures how close you are to perfect production and that is why this method is useful for all manufacturers. The key to applying to any industry is a clear definition of time utilization, quality and output utilization. The results of the time utilization, quality and output utilization are useful for production planning but if they are not clear defined and are used in the OEE calculation they can hide the true capacity of the production process. This can artificially raise OEE score while this can hide loss and can slow improvement. 6. Conclusion
The overall equipment effectiveness (OEE) indicator is considered to be an objective indicator of manufacturing enterprises within the internal business environment according to Gehloff (2016) and Synek (2011). The paper presents the elementary form of the production process through the OEE indicator and characterizes the pyramidal decomposition of the OEE indicator. The paper presents examples of the application of the counterfactual impact evaluation principles with using the OEE indicator in order to evaluate the production quality, to evaluate the use of the time fund and to evaluate the use of the performance parameters of the production equipment within the overall efficiency measurement of the production process. The OEE indicator can help businesses to concentrate on losing their potentials in the mentioned areas. Manufacturing enterprises should use the OEE indicator for management and measurement of business performance. Acknowledgement
This paper was supported by the Ministry of Education, Youth and Sports Czech Republic within the Institutional Support for Long-term Development of a Research Organization in 2017. References ANGRIST, J. D., PISCHKE, J. S. (2009). Mostly Harmless Econometrics. Princenton: Princenton University Press.
190
ANGRIST, J. D., KRUEGER, B. (2001). Instrumental Variables and the Search for Identification: From supply and Demand to Natural Experiments. Journal of Economic Perspectives, vol. 15, no. 4, pp. 69 – 85. DUFLO, E., GLENNERSTER R., KREMER, M. (2007). Using Randomization in Development Economics Research: A Toolkit. Handbook of Development Economics, vol. 4, pp. 3895 – 3962. GEHLOFF, M. (2016). OEE vs. MTBF: Která z nich je ta pravá metoda měření? Charleston: Allied Reliability Group. GERTLER, P. J., MARTINEZ, S., PREMAND, P., RAWLINGS, L. B., VERMEERSCH, CH. M. J. (2011). Impact Evaluation in Practice. Washington: World Bank. HORA, O., VYHLÍDAL, J., SIROVÁTKOVÁ, T., SUCHANEC, M. (2015). Metodika „Nové postupy pro zpracování a využití databáze nezaměstnaných k hodnocení programů aktivní politiky zaměstnanosti a dalších opatření k začlenění na trhu práce“. Prague: Research Institute of Labor and Social Affairs. IMBENS, G. W., WOOLDRIDGE, J. M. (2009). Recent developments in the econometrics of program evaluation. Journal of Economic Literature 47, no. 1, pp. 5-86. KHANDKER, S. R., KOOLWAL, G. B., SAMAD, H. A. (2010). Handbook on Impact Evaluation: Quantitative Methods and Practices. Washington: World Bank. MORGAN, S. L., WINSHIP, C. (2010). Counterfactuals and causal inference: methods and principles for social research. Cambridge: Cambridge University Press. MOUQUÉ, D. (2012). What are counterfactual impact evaluations teaching us about enterprise and innovation support? Brussels: European Commision. POTLUKA, O. (2014). Management dopadových evaluací. Prague: IREAS center. POTLUKA, O., BRŮHA, J., PĚLUCHA, M., KVĚTOŇ, V., VRBOVÁ, L., ŠPAČEK, M., LOUN, J. (2013). Pilotní counterfactual impact evaluation OP LZZ, oblast podpory 1.1. Prague: IREAS center. POTLUKA, O., ŠPAČEK, M. (2013). Postupy a metody kontrafaktuálních dopadových evaluací pro Operační program Zaměstnanost v období 2014 – 2020. Prague: Ministry of Labor and Social Affairs. SYNEK, M. (2011). Manažerská ekonomika. Prague: Grada Publishing. WOOLDRIDGE, J. M. (2010). Econometric Analysis of Cross Section and Panel Data. Cambridge: MIT Press. ZAVŘEL, L. (2015). Kontrafaktuální evaluace dopadů ROP Jihovýchod na vymezených územích. Evaluační teorie a praxe, no. 3(1). pp. 53-58.
191
THE INCENTIVES FOR THE RATIONAL USE OF THE HEALTH CARE SYSTEM RESOURCES MANAGING THE NONCOMMUNICABLE DISEASES Rimantas Stašys Klaipėda University The faculty of social sciences, department of management Herkaus Manto str. 84 92294 Klaipėda Lithuania e-mail: [email protected] Arnoldas Jurgutis Klaipėda University The faculty of healthcare sciences, department of public health Herkaus Manto str. 84 92294 Klaipėda e-mail: [email protected] Arvydas Martinkėnas Klaipėda University The faculty of healthcare sciences, department of public health Herkaus Manto str. 84 92294 Klaipėda e-mail: [email protected] Kristupas Žegunis Klaipėda University The faculty of social sciences, department of management Herkaus Manto str. 84 92294 Klaipėda Lithuania e-mail: [email protected] Abstract The longer life expectancy and the increased overall number of the non-communicable diseases is one of the main challenges of the health care systems in European Union countries. The early diagnostics and the control of the non-communicable diseases in the primary level may help to reduce the costs of the health care system and to increase the efficiency of the health care management (da Silva et al., 2013). The overall objective of the article is to analyse the health services utilisation data, and to offer the advanced model of health services delivery for selected non-communicable diseases conditions, which based on international evidence have potential to be successfully managed and decrease burden for secondary and tertiary health care levels. Data on health services utilisation are obtained from database of Klaipeda Regional Patient Fund. For the purpose of this research Health Research and Innovation Scientific Centre of the Faculty of Health Sciences, Klaipeda University received data on all outpatient visits to the primary, secondary and tertiary level during the period 2012 – 2015 of all patients enlisted to the Primary health care institutions working under agreement with Klaipeda territorial patient fund. The initial objective was to collect, analyse and summarise the statistic data provided by Klaipeda Regional Patient Fund, focusing Diabetes mellitus which according World health Organisation is one of the most common ambulatory care sensitive chronic conditions and proper management at a primary health care level lead to reduced hospitalisations because of the diabetes mellitus complications. Key words: Analysis of Health Care Markets, Health Behavior, Health: General, National Government Expenditures and Health JEL codes: H51, I10, I12, I11
192
1. The role of Primary Health Care in the Management of the Noncommunicable Diseases
Incentives of the efficient health care services in Lithuania is major challenge for the Lithuanian health care system. Still much of the health care services are provided in secondary or tertiary level bypassing the primary healthcare level. This situation leads to increasing waiting time for out-patient secondary and tertiary health care and contributes to increasing overall health care expenses. Different studies and discussions indicate that primary healthcare (PHC) level is not enough supported and controlled (http://ltblekinge.se/globalassets/forskning-och-utveckling/blekinge-kompetenscentrum/projekt/imprim/publications/wp3-report-3-pilot-projects-in-latvia-and-lithuania-imprim.pdf). Patients still have the thinking that their conditions can managed more efficiently in the secondary level. Though it is proved that most of the non-communicable diseases (NCD’s) cases can be diagnosed, managed and controlled in the PHC level (Proimos, 2017). The policy makers should find the more efficient ways of the communication with the community members and PHC physician to encourage the collaboration (Institute of Medicine, 2012). The policy makers agree that the support and extra funding of the primary sector and community education is needed.NCD’s related health needs are very comprehensive and multidimensional - degree of illness and decisions regarding his/her health and health care depend on biomedical, social, psychological, cultural domains. Patient awareness about the early diagnostics and control of the NCD’s including the diabetes mellitus (DM) management is one of the main factors in prevention of the complications and the need of the hospitalisation (Alwan, 2017). Traditional disease oriented and hospital based models of health service delivery have to be changed to more holistic, community based and people centred health care models. People centred health services at a primary health care level should be integrated with social care services, other community services (horizontal integration), and also with specialised services (vertical integration) that in the best way to address health needs of all individuals in the community (Oyama, 2016).Health service delivery practices have to be standardised based on international evidence and accounting local circumstances and supported by clinical guidelines and protocols. There should be optimal care pathways for patients, well accounting individual health needs and avoiding duplication and/or inappropriate use of services. Therefore despite integration with narrow specialised services, when needed, primary health care professionals should be well organised to act as first contacts within health care system and guarantee continuous and coordinated care for the whole population they serve (Fortin, 2017). Therefore a well facilitated information exchange processes across different levels of care has to be established.
2. The Economic Burden of the Noncommunicable Diseases Management
Non-communicable diseases, such as heart disease, stroke, cancer, chronic respiratory diseases and diabetes, are the leading cause of mortality in the world 40 million of the 56 million global deaths in 2015 were due to NCD’s, 80% of premature heart disease, stroke and diabetes can be prevented (http://www.who.int/gho/ncd/en/).
According the international association of diabetes, approximately 415 million adults have diabetes; by 2040 this will rise to 642 million. The greatest number of people with diabetes are between 40 and 59 years of age. The more important fact is that 1 in 2 (46%) people with diabetes are undiagnosed (https://www.idf.org/about-diabetes/what-is-diabetes.html).
Diabetes caused at least EUR 619 billion dollars in health expenditure in 2015 – 12% of total spending on adults. The average health expenditure per capita in was EU 2781 EUR (https://www.oecd.org/els/health-systems/Health-at-a-Glance-Europe-2016-CHARTSET.pdf).
The increasing economic burden is one of the main challenge for the health care systems (Bollyki, 2015). The expenses spend on patients in different health care levels differs significantly. The table 1 shows the average expenses in secondary and tertiary levels.
Table 1: Average Expenses of Healthcare Services in Secondary and Tertiary Levels in Lithuania Average hospitalization expenses per day 537 EUR
Consultation in secondary level 15.76 EUR
Consultations in tertiary level 29.05 EUR
Consultation in secondary level plus procedure manipulation 21.93 EUR
Consultation in tertiary level plus procedure manipulation 38.66 EUR
Source: Lithuanian State patient fund

193
The expenses for the healthcare services in primary healthcare level compared to secondary and tertiary levels differ significantly. The data is shown in table number 2.
Table 2: The Average Expenses on Patients in Primary Health Care in Lithuania Expenses for one patient per year in the primary healthcare level
Patient age <1 year 1–4 year 5–6 year 7–17 year 18–49
year 50–65 year
> 65 year
Primary healthcare services (excluding odontology and psychiatry)
106,53 EUR
60,91 EUR
46,66 EUR
31,11 EUR
21,86 EUR
34,52 EUR
40,13 EUR
Source: Lithuanian State patient fund
Summarising the data it should be noted that improved health of community should be end result of well-organised and systematically managed health services. Therefore should be well monitored intermediate results of care and systematically examined clinical processes through strong clinical governance. The early diagnostics and the control of the NCD’s in the primary level may help to increase the number of avoidable hospitalisations, reduce the costs of the health care system and to increase the efficiency of the health care management (Ferrer, 2016). The NCD’s management should focus on:
1. Primary healthcare, 2. Strengthening the role of nurses, 3. Enhancing the teamwork, 4. Finding synergies with public health and social care, 5. Promote patients centred medicine, 6. Strengthen patient’s responsibility.
The focus on primary healthcare would allow to (Kumar, 2016): 1. Increase the number of the avoidable hospitalisations, 2. Decrease the number of undiagnosed or/and late diagnosed cases of NCD’s which lead to
hospitalisation, 3. Reduce the costs of the health care system and to increase the efficiency of the health care
management. Objective of the study: The statistic data of the diabetes mellitus management in Klaipeda region and
the analysis of the compared and contrasted numbers of visits to primary, secondary and tertiary health care for selected NCD’s.
Aim of the study: To identify the strategies of the health care management that would allow to increase the effectiveness and efficiency of the health systems by reduction of the hospitalisation rate for ambulatory care sensitive diabetes mellitus conditions.
3. Methods
Study object were patients, with all type of DM listed in primary, secondary and tertiary health care institutions of Klaipeda region. Data of registered DM diagnoses and all visits to primary, secondary and tertiary health care institutions during year 2012 - 2015 were obtained from database of Klaipeda regional state patient fund.
The initial statistic information collected from the statistic base operated by Klaipeda regional patient fund showed the total number of all visits to the primary, secondary and tertiary level. Different health care disorders and healthcare management in different levels are difficult to be compared therefore according the world health organisation statistics the analysis of the most common non-communicable disease - Diabetes mellitus was selected. Statistical analysis had been made using SPSS 13.0 software for comparison of prevalence of chronic conditions and visits to primary and secondary healthcare of patients with chronic conditions listed to different types of PHC doctors.
The total number of population in Klaipeda region was 324628. The total number of registered to the primary healthcare level was 407046. The gender distribution analysis show that 213859 of registered were females and 193187 men. The distinction between the population and the total number of registered to the primary healthcare level is determined by patients which have declared theirs residence outside the Klaipeda region.
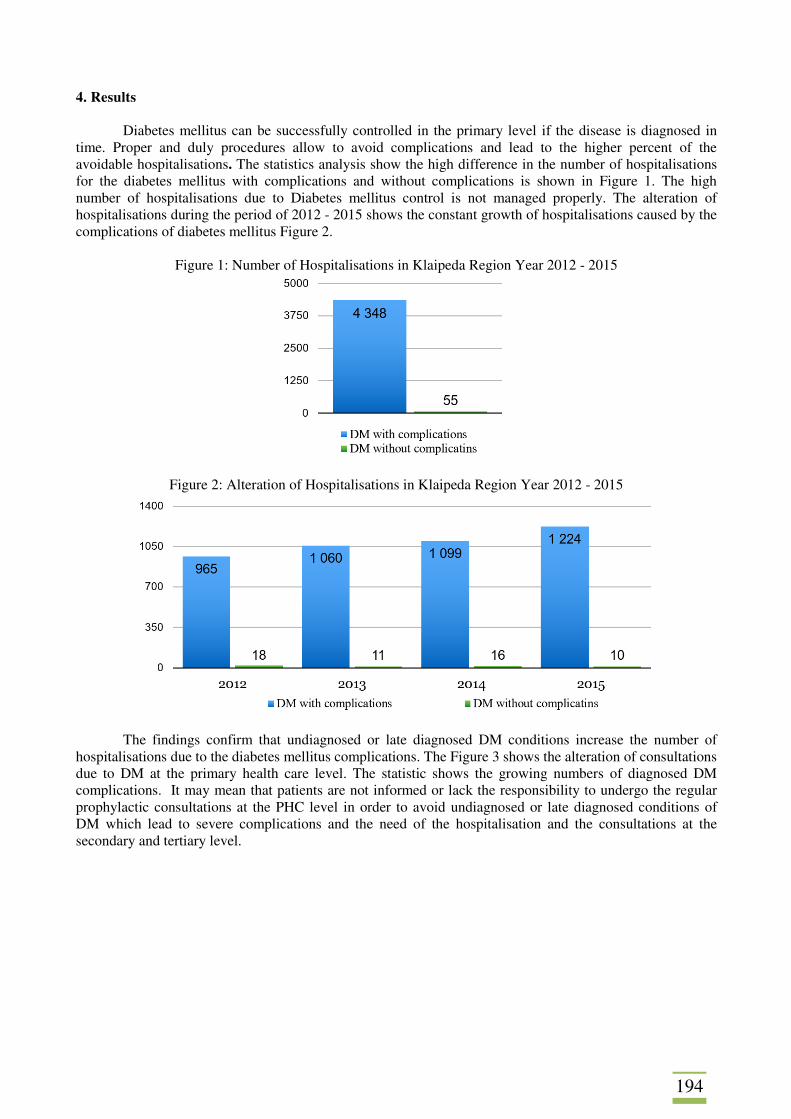
194
4. Results
Diabetes mellitus can be successfully controlled in the primary level if the disease is diagnosed in time. Proper and duly procedures allow to avoid complications and lead to the higher percent of the avoidable hospitalisations. The statistics analysis show the high difference in the number of hospitalisations for the diabetes mellitus with complications and without complications is shown in Figure 1. The high number of hospitalisations due to Diabetes mellitus control is not managed properly. The alteration of hospitalisations during the period of 2012 - 2015 shows the constant growth of hospitalisations caused by the complications of diabetes mellitus Figure 2.
Figure 1: Number of Hospitalisations in Klaipeda Region Year 2012 - 2015
Figure 2: Alteration of Hospitalisations in Klaipeda Region Year 2012 - 2015
The findings confirm that undiagnosed or late diagnosed DM conditions increase the number of
hospitalisations due to the diabetes mellitus complications. The Figure 3 shows the alteration of consultations due to DM at the primary health care level. The statistic shows the growing numbers of diagnosed DM complications. It may mean that patients are not informed or lack the responsibility to undergo the regular prophylactic consultations at the PHC level in order to avoid undiagnosed or late diagnosed conditions of DM which lead to severe complications and the need of the hospitalisation and the consultations at the secondary and tertiary level.
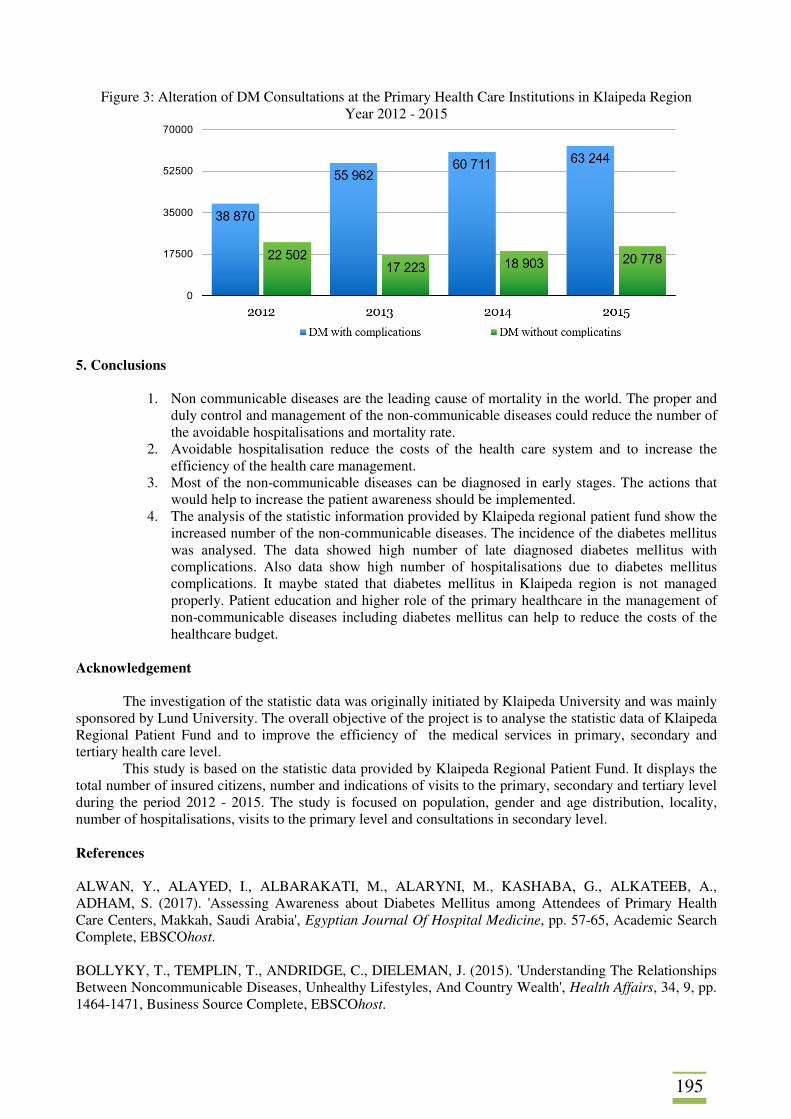
195
Figure 3: Alteration of DM Consultations at the Primary Health Care Institutions in Klaipeda Region Year 2012 - 2015
5. Conclusions
1. Non communicable diseases are the leading cause of mortality in the world. The proper and duly control and management of the non-communicable diseases could reduce the number of the avoidable hospitalisations and mortality rate.
2. Avoidable hospitalisation reduce the costs of the health care system and to increase the efficiency of the health care management.
3. Most of the non-communicable diseases can be diagnosed in early stages. The actions that would help to increase the patient awareness should be implemented.
4. The analysis of the statistic information provided by Klaipeda regional patient fund show the increased number of the non-communicable diseases. The incidence of the diabetes mellitus was analysed. The data showed high number of late diagnosed diabetes mellitus with complications. Also data show high number of hospitalisations due to diabetes mellitus complications. It maybe stated that diabetes mellitus in Klaipeda region is not managed properly. Patient education and higher role of the primary healthcare in the management of non-communicable diseases including diabetes mellitus can help to reduce the costs of the healthcare budget.
Acknowledgement
The investigation of the statistic data was originally initiated by Klaipeda University and was mainly sponsored by Lund University. The overall objective of the project is to analyse the statistic data of Klaipeda Regional Patient Fund and to improve the efficiency of the medical services in primary, secondary and tertiary health care level.
This study is based on the statistic data provided by Klaipeda Regional Patient Fund. It displays the total number of insured citizens, number and indications of visits to the primary, secondary and tertiary level during the period 2012 - 2015. The study is focused on population, gender and age distribution, locality, number of hospitalisations, visits to the primary level and consultations in secondary level. References ALWAN, Y., ALAYED, I., ALBARAKATI, M., ALARYNI, M., KASHABA, G., ALKATEEB, A., ADHAM, S. (2017). 'Assessing Awareness about Diabetes Mellitus among Attendees of Primary Health Care Centers, Makkah, Saudi Arabia', Egyptian Journal Of Hospital Medicine, pp. 57-65, Academic Search Complete, EBSCOhost. BOLLYKY, T., TEMPLIN, T., ANDRIDGE, C., DIELEMAN, J. (2015). 'Understanding The Relationships Between Noncommunicable Diseases, Unhealthy Lifestyles, And Country Wealth', Health Affairs, 34, 9, pp. 1464-1471, Business Source Complete, EBSCOhost.

196
FERRER, A, GRISI, S. (2016). 'Assessment of access to primary health care among children and adolescents hospitalized due to avoidable conditions', Revista Da Associacao Medica Brasileira (1992), 62, 6, pp. 513-523, MEDLINE, EBSCOhost. FORTIN, M., CHOUINARD, M., DUBOIS, M., BELANGER, M., ALMIRALL, J., BOUHALI, T., SASSEVILLE, M. (2016). 'Integration of chronic disease prevention and management services into primary care: a pragmatic randomized controlled trial (PR1MaC)', CMAJ Open, 4, 4, pp. E588-E598, Academic Search Complete, EBSCOhost. INSTITUTE OF MEDICINE. (2012). Primary Care And Public Health: Exploring Integration To Improve Population Health, Washington, D.C.: National Academies Press, eBook Academic Collection (EBSCOhost), EBSCOhost. INTERNATIONAL DIABETES FEDERATION. (2017). [online]. Available from: http://www.idf.org/sites/default/files/Atlas7e-poster.pdf. IMPRIM. (2017). Quality indicators for high quality PHC performance. [online]. Available from: http://ltblekinge.se/globalassets/forskning-och-utveckling/blekinge-kompetenscentrum/projekt/imprim/ publications/wp3-report-3-pilot-projects-in-latvia-and-lithuania-imprim.pdf. KUMAR, P. (2016). 'How to strengthen primary health care', Journal Of Family Medicine & Primary Care, 5, 3, pp. 543-546, Academic Search Complete, EBSCOhost. OECD. (2016). Health at a Glance: Europe 2016-State of Health in the EU Cycle. [online]. Available from: https://www.oecd.org/els/health-systems/Health-at-a-Glance-Europe-2016-CHARTSET.pdf. OYAMA, O., BURG, M. (2016). The Behavioral Health Specialist In Primary Care : Skills For Integrated Practice, New York, NY: Springer Publishing Company, eBook Academic Collection (EBSCOhost), EBSCOhost. PROIMOS, J., KLEIN, J. (2012). 'Noncommunicable Diseases in Children and Adolescents', Pediatrics, 130, 3, pp. 379-381, Education Source, EBSCOhost. DA SILVA, L.S., COTTA, R.M., ROSA. (2013). Revista Panamericana De Salud Publica = Pan American Journal Of Public Health [Rev Panam Salud Publica] 2013 Nov; Vol. 34 (5), pp. 343-50, MEDLINE, EBSCOhost.
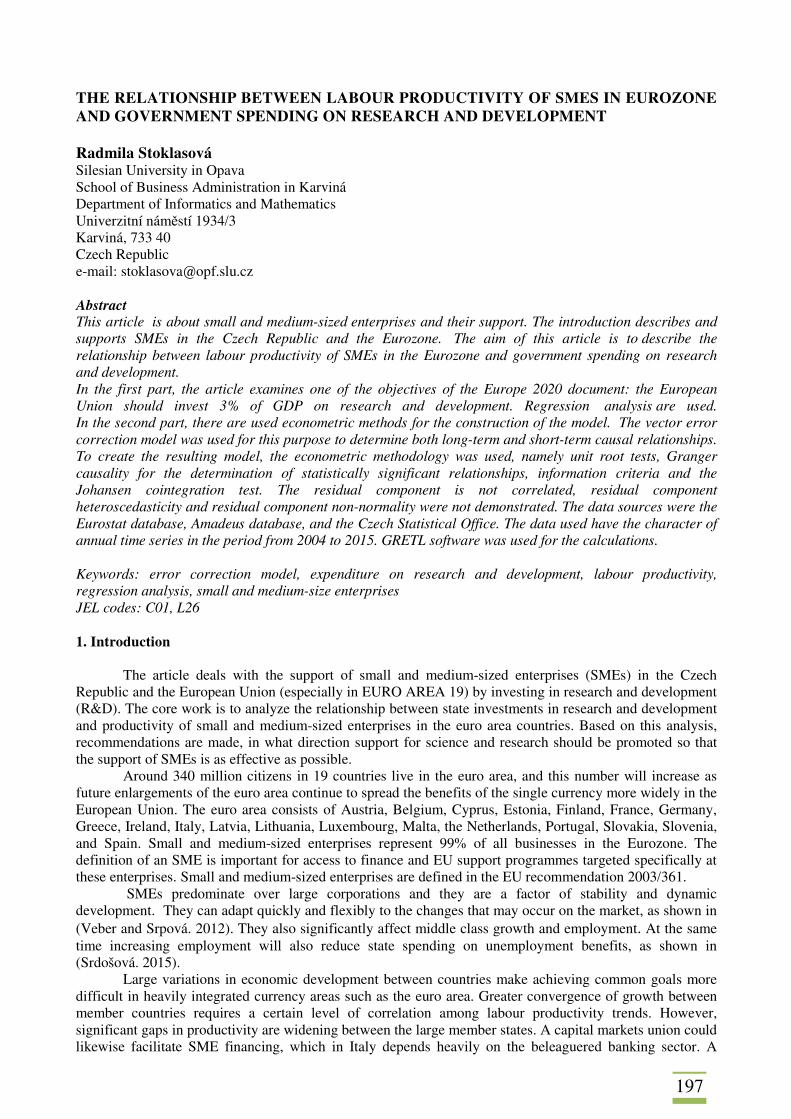
197
THE RELATIONSHIP BETWEEN LABOUR PRODUCTIVITY OF SMES IN EUROZONE AND GOVERNMENT SPENDING ON RESEARCH AND DEVELOPMENT Radmila Stoklasová Silesian University in Opava School of Business Administration in Karviná Department of Informatics and Mathematics Univerzitní náměstí 1934/3 Karviná, 733 40 Czech Republic e-mail: [email protected] Abstract This article is about small and medium-sized enterprises and their support. The introduction describes and supports SMEs in the Czech Republic and the Eurozone. The aim of this article is to describe the relationship between labour productivity of SMEs in the Eurozone and government spending on research and development. In the first part, the article examines one of the objectives of the Europe 2020 document: the European Union should invest 3% of GDP on research and development. Regression analysis are used. In the second part, there are used econometric methods for the construction of the model. The vector error correction model was used for this purpose to determine both long-term and short-term causal relationships. To create the resulting model, the econometric methodology was used, namely unit root tests, Granger causality for the determination of statistically significant relationships, information criteria and the Johansen cointegration test. The residual component is not correlated, residual component heteroscedasticity and residual component non-normality were not demonstrated. The data sources were the Eurostat database, Amadeus database, and the Czech Statistical Office. The data used have the character of annual time series in the period from 2004 to 2015. GRETL software was used for the calculations. Keywords: error correction model, expenditure on research and development, labour productivity, regression analysis, small and medium-size enterprises JEL codes: C01, L26 1. Introduction
The article deals with the support of small and medium-sized enterprises (SMEs) in the Czech Republic and the European Union (especially in EURO AREA 19) by investing in research and development (R&D). The core work is to analyze the relationship between state investments in research and development and productivity of small and medium-sized enterprises in the euro area countries. Based on this analysis, recommendations are made, in what direction support for science and research should be promoted so that the support of SMEs is as effective as possible.
Around 340 million citizens in 19 countries live in the euro area, and this number will increase as future enlargements of the euro area continue to spread the benefits of the single currency more widely in the European Union. The euro area consists of Austria, Belgium, Cyprus, Estonia, Finland, France, Germany, Greece, Ireland, Italy, Latvia, Lithuania, Luxembourg, Malta, the Netherlands, Portugal, Slovakia, Slovenia, and Spain. Small and medium-sized enterprises represent 99% of all businesses in the Eurozone. The definition of an SME is important for access to finance and EU support programmes targeted specifically at these enterprises. Small and medium-sized enterprises are defined in the EU recommendation 2003/361.
SMEs predominate over large corporations and they are a factor of stability and dynamic development. They can adapt quickly and flexibly to the changes that may occur on the market, as shown in (Veber and Srpová. 2012). They also significantly affect middle class growth and employment. At the same time increasing employment will also reduce state spending on unemployment benefits, as shown in (Srdošová. 2015).
Large variations in economic development between countries make achieving common goals more difficult in heavily integrated currency areas such as the euro area. Greater convergence of growth between member countries requires a certain level of correlation among labour productivity trends. However, significant gaps in productivity are widening between the large member states. A capital markets union could likewise facilitate SME financing, which in Italy depends heavily on the beleaguered banking sector. A
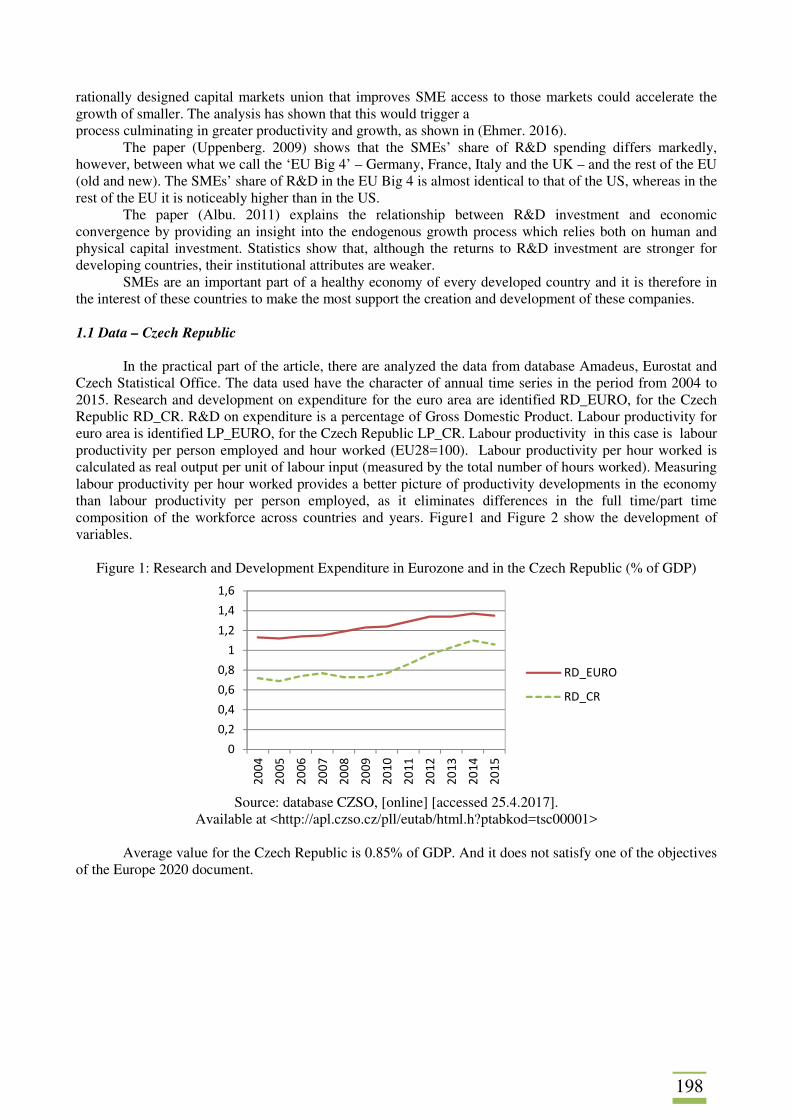
198
rationally designed capital markets union that improves SME access to those markets could accelerate the growth of smaller. The analysis has shown that this would trigger a process culminating in greater productivity and growth, as shown in (Ehmer. 2016).
The paper (Uppenberg. 2009) shows that the SMEs’ share of R&D spending differs markedly, however, between what we call the ‘EU Big 4’ – Germany, France, Italy and the UK – and the rest of the EU (old and new). The SMEs’ share of R&D in the EU Big 4 is almost identical to that of the US, whereas in the rest of the EU it is noticeably higher than in the US.
The paper (Albu. 2011) explains the relationship between R&D investment and economic convergence by providing an insight into the endogenous growth process which relies both on human and physical capital investment. Statistics show that, although the returns to R&D investment are stronger for developing countries, their institutional attributes are weaker.
SMEs are an important part of a healthy economy of every developed country and it is therefore in the interest of these countries to make the most support the creation and development of these companies.
1.1 Data – Czech Republic
In the practical part of the article, there are analyzed the data from database Amadeus, Eurostat and Czech Statistical Office. The data used have the character of annual time series in the period from 2004 to 2015. Research and development on expenditure for the euro area are identified RD_EURO, for the Czech Republic RD_CR. R&D on expenditure is a percentage of Gross Domestic Product. Labour productivity for euro area is identified LP_EURO, for the Czech Republic LP_CR. Labour productivity in this case is labour productivity per person employed and hour worked (EU28=100). Labour productivity per hour worked is calculated as real output per unit of labour input (measured by the total number of hours worked). Measuring labour productivity per hour worked provides a better picture of productivity developments in the economy than labour productivity per person employed, as it eliminates differences in the full time/part time composition of the workforce across countries and years. Figure1 and Figure 2 show the development of variables.
Figure 1: Research and Development Expenditure in Eurozone and in the Czech Republic (% of GDP)
Source: database CZSO, [online] [accessed 25.4.2017].
Available at <http://apl.czso.cz/pll/eutab/html.h?ptabkod=tsc00001>
Average value for the Czech Republic is 0.85% of GDP. And it does not satisfy one of the objectives of the Europe 2020 document.
0
0,2
0,4
0,6
0,8
1
1,2
1,4
1,6
20
04
20
05
20
06
20
07
20
08
20
09
20
10
20
11
20
12
20
13
20
14
20
15
RD_EURO
RD_CR
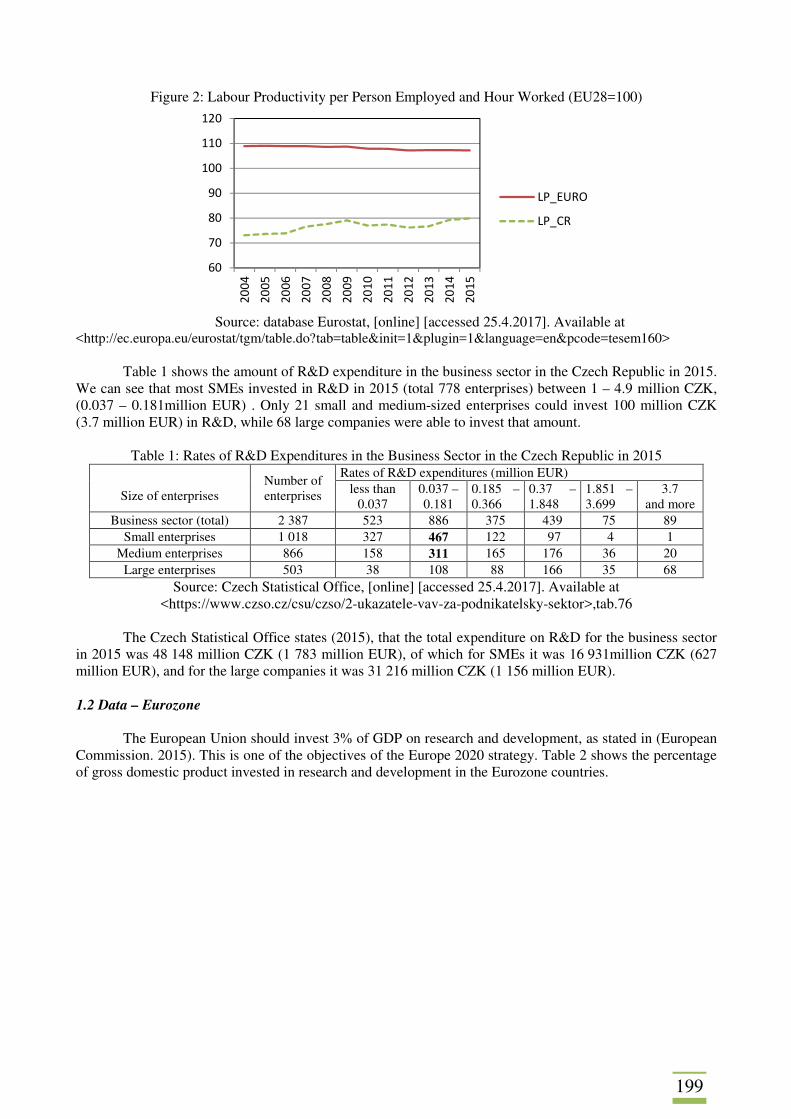
199
Figure 2: Labour Productivity per Person Employed and Hour Worked (EU28=100)
Source: database Eurostat, [online] [accessed 25.4.2017]. Available at
<http://ec.europa.eu/eurostat/tgm/table.do?tab=table&init=1&plugin=1&language=en&pcode=tesem160>
Table 1 shows the amount of R&D expenditure in the business sector in the Czech Republic in 2015. We can see that most SMEs invested in R&D in 2015 (total 778 enterprises) between 1 – 4.9 million CZK, (0.037 – 0.181million EUR) . Only 21 small and medium-sized enterprises could invest 100 million CZK (3.7 million EUR) in R&D, while 68 large companies were able to invest that amount.
Table 1: Rates of R&D Expenditures in the Business Sector in the Czech Republic in 2015
Size of enterprises
Number of enterprises
Rates of R&D expenditures (million EUR) less than
0.037 0.037 – 0.181
0.185 – 0.366
0.37 – 1.848
1.851 – 3.699
3.7 and more
Business sector (total) 2 387 523 886 375 439 75 89 Small enterprises 1 018 327 467 122 97 4 1
Medium enterprises 866 158 311 165 176 36 20 Large enterprises 503 38 108 88 166 35 68
Source: Czech Statistical Office, [online] [accessed 25.4.2017]. Available at <https://www.czso.cz/csu/czso/2-ukazatele-vav-za-podnikatelsky-sektor>,tab.76
The Czech Statistical Office states (2015), that the total expenditure on R&D for the business sector
in 2015 was 48 148 million CZK (1 783 million EUR), of which for SMEs it was 16 931million CZK (627 million EUR), and for the large companies it was 31 216 million CZK (1 156 million EUR).
1.2 Data – Eurozone
The European Union should invest 3% of GDP on research and development, as stated in (European
Commission. 2015). This is one of the objectives of the Europe 2020 strategy. Table 2 shows the percentage of gross domestic product invested in research and development in the Eurozone countries.
60
70
80
90
100
110
120
20
04
20
05
20
06
20
07
20
08
20
09
20
10
20
11
20
12
20
13
20
14
20
15
LP_EURO
LP_CR
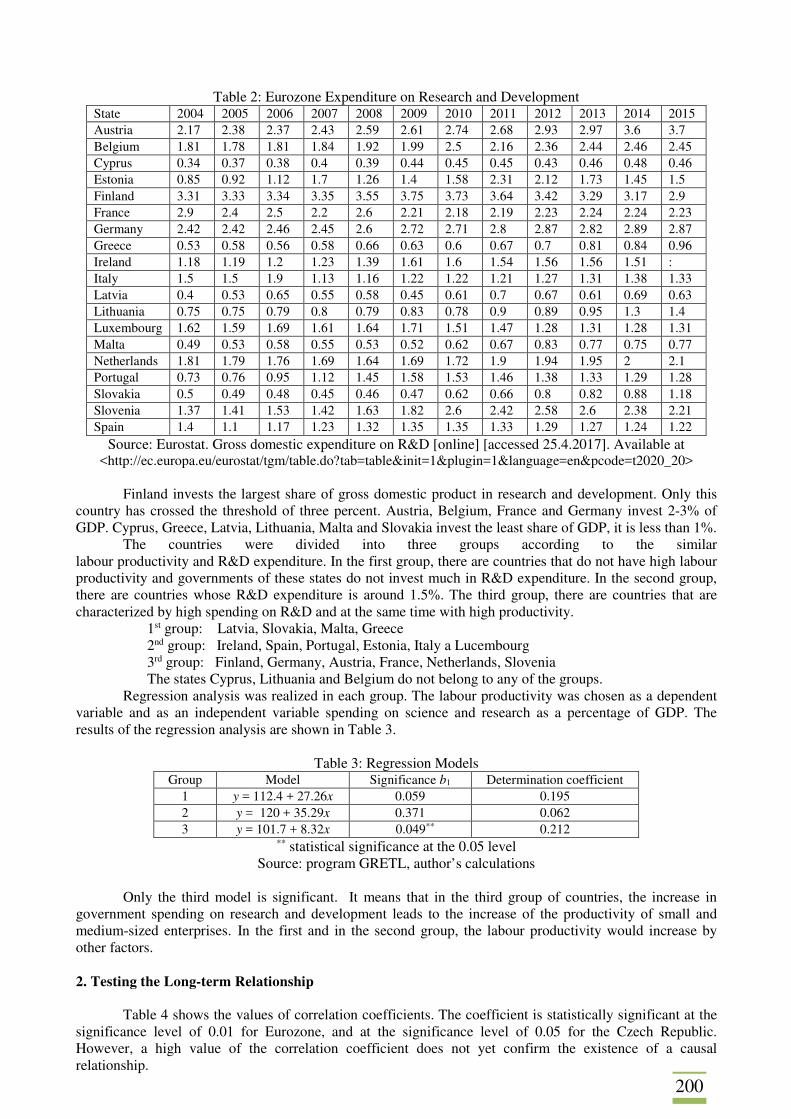
200
Table 2: Eurozone Expenditure on Research and Development State 2004 2005 2006 2007 2008 2009 2010 2011 2012 2013 2014 2015 Austria 2.17 2.38 2.37 2.43 2.59 2.61 2.74 2.68 2.93 2.97 3.6 3.7 Belgium 1.81 1.78 1.81 1.84 1.92 1.99 2.5 2.16 2.36 2.44 2.46 2.45 Cyprus 0.34 0.37 0.38 0.4 0.39 0.44 0.45 0.45 0.43 0.46 0.48 0.46 Estonia 0.85 0.92 1.12 1.7 1.26 1.4 1.58 2.31 2.12 1.73 1.45 1.5 Finland 3.31 3.33 3.34 3.35 3.55 3.75 3.73 3.64 3.42 3.29 3.17 2.9 France 2.9 2.4 2.5 2.2 2.6 2.21 2.18 2.19 2.23 2.24 2.24 2.23 Germany 2.42 2.42 2.46 2.45 2.6 2.72 2.71 2.8 2.87 2.82 2.89 2.87 Greece 0.53 0.58 0.56 0.58 0.66 0.63 0.6 0.67 0.7 0.81 0.84 0.96 Ireland 1.18 1.19 1.2 1.23 1.39 1.61 1.6 1.54 1.56 1.56 1.51 : Italy 1.5 1.5 1.9 1.13 1.16 1.22 1.22 1.21 1.27 1.31 1.38 1.33 Latvia 0.4 0.53 0.65 0.55 0.58 0.45 0.61 0.7 0.67 0.61 0.69 0.63 Lithuania 0.75 0.75 0.79 0.8 0.79 0.83 0.78 0.9 0.89 0.95 1.3 1.4 Luxembourg 1.62 1.59 1.69 1.61 1.64 1.71 1.51 1.47 1.28 1.31 1.28 1.31 Malta 0.49 0.53 0.58 0.55 0.53 0.52 0.62 0.67 0.83 0.77 0.75 0.77 Netherlands 1.81 1.79 1.76 1.69 1.64 1.69 1.72 1.9 1.94 1.95 2 2.1 Portugal 0.73 0.76 0.95 1.12 1.45 1.58 1.53 1.46 1.38 1.33 1.29 1.28 Slovakia 0.5 0.49 0.48 0.45 0.46 0.47 0.62 0.66 0.8 0.82 0.88 1.18 Slovenia 1.37 1.41 1.53 1.42 1.63 1.82 2.6 2.42 2.58 2.6 2.38 2.21 Spain 1.4 1.1 1.17 1.23 1.32 1.35 1.35 1.33 1.29 1.27 1.24 1.22
Source: Eurostat. Gross domestic expenditure on R&D [online] [accessed 25.4.2017]. Available at <http://ec.europa.eu/eurostat/tgm/table.do?tab=table&init=1&plugin=1&language=en&pcode=t2020_20>
Finland invests the largest share of gross domestic product in research and development. Only this
country has crossed the threshold of three percent. Austria, Belgium, France and Germany invest 2-3% of GDP. Cyprus, Greece, Latvia, Lithuania, Malta and Slovakia invest the least share of GDP, it is less than 1%.
The countries were divided into three groups according to the similar labour productivity and R&D expenditure. In the first group, there are countries that do not have high labour productivity and governments of these states do not invest much in R&D expenditure. In the second group, there are countries whose R&D expenditure is around 1.5%. The third group, there are countries that are characterized by high spending on R&D and at the same time with high productivity.
1st group: Latvia, Slovakia, Malta, Greece 2nd group: Ireland, Spain, Portugal, Estonia, Italy a Lucembourg 3rd group: Finland, Germany, Austria, France, Netherlands, Slovenia The states Cyprus, Lithuania and Belgium do not belong to any of the groups.
Regression analysis was realized in each group. The labour productivity was chosen as a dependent variable and as an independent variable spending on science and research as a percentage of GDP. The results of the regression analysis are shown in Table 3.
Table 3: Regression Models
Group Model Significance b1 Determination coefficient 1 y = 112.4 + 27.26x 0.059 0.195 2 y = 120 + 35.29x 0.371 0.062 3 y = 101.7 + 8.32x 0.049** 0.212
** statistical significance at the 0.05 level Source: program GRETL, author’s calculations
Only the third model is significant. It means that in the third group of countries, the increase in
government spending on research and development leads to the increase of the productivity of small and medium-sized enterprises. In the first and in the second group, the labour productivity would increase by other factors.
2. Testing the Long-term Relationship
Table 4 shows the values of correlation coefficients. The coefficient is statistically significant at the significance level of 0.01 for Eurozone, and at the significance level of 0.05 for the Czech Republic. However, a high value of the correlation coefficient does not yet confirm the existence of a causal relationship.
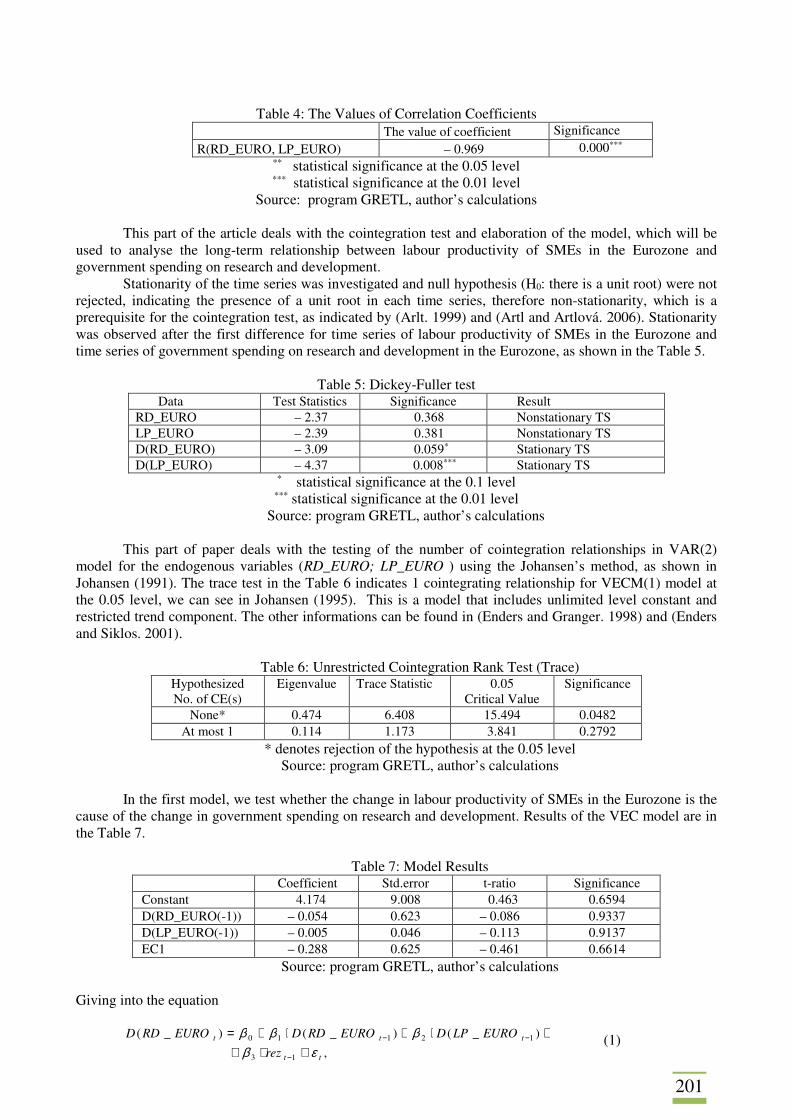
201
Table 4: The Values of Correlation Coefficients
The value of coefficient Significance
R(RD_EURO, LP_EURO) – 0.969 0.000***
** statistical significance at the 0.05 level *** statistical significance at the 0.01 level
Source: program GRETL, author’s calculations
This part of the article deals with the cointegration test and elaboration of the model, which will be used to analyse the long-term relationship between labour productivity of SMEs in the Eurozone and government spending on research and development.
Stationarity of the time series was investigated and null hypothesis (H0: there is a unit root) were not rejected, indicating the presence of a unit root in each time series, therefore non-stationarity, which is a prerequisite for the cointegration test, as indicated by (Arlt. 1999) and (Artl and Artlová. 2006). Stationarity was observed after the first difference for time series of labour productivity of SMEs in the Eurozone and time series of government spending on research and development in the Eurozone, as shown in the Table 5.
Table 5: Dickey-Fuller test
Data Test Statistics Significance Result RD_EURO – 2.37 0.368 Nonstationary TS LP_EURO – 2.39 0.381 Nonstationary TS D(RD_EURO) – 3.09 0.059* Stationary TS D(LP_EURO) – 4.37 0.008*** Stationary TS
* statistical significance at the 0.1 level *** statistical significance at the 0.01 level
Source: program GRETL, author’s calculations This part of paper deals with the testing of the number of cointegration relationships in VAR(2)
model for the endogenous variables (RD_EURO; LP_EURO ) using the Johansen’s method, as shown in Johansen (1991). The trace test in the Table 6 indicates 1 cointegrating relationship for VECM(1) model at the 0.05 level, we can see in Johansen (1995). This is a model that includes unlimited level constant and restricted trend component. The other informations can be found in (Enders and Granger. 1998) and (Enders and Siklos. 2001).
Table 6: Unrestricted Cointegration Rank Test (Trace)
Hypothesized No. of CE(s)
Eigenvalue Trace Statistic 0.05 Critical Value
Significance
None* 0.474 6.408 15.494 0.0482 At most 1 0.114 1.173 3.841 0.2792
* denotes rejection of the hypothesis at the 0.05 level Source: program GRETL, author’s calculations
In the first model, we test whether the change in labour productivity of SMEs in the Eurozone is the
cause of the change in government spending on research and development. Results of the VEC model are in the Table 7.
Table 7: Model Results
Coefficient Std.error t-ratio Significance Constant 4.174 9.008 0.463 0.6594 D(RD_EURO(-1)) – 0.054 0.623 – 0.086 0.9337
D(LP_EURO(-1)) – 0.005 0.046 – 0.113 0.9137 EC1 – 0.288 0.625 – 0.461 0.6614
Source: program GRETL, author’s calculations
Giving into the equation
,
)_()_()_(
13
12110
tt
ttt
rez
EUROLPDEURORDDEURORDD
εββββ
+⋅++⋅+⋅+=
−
−− (1)
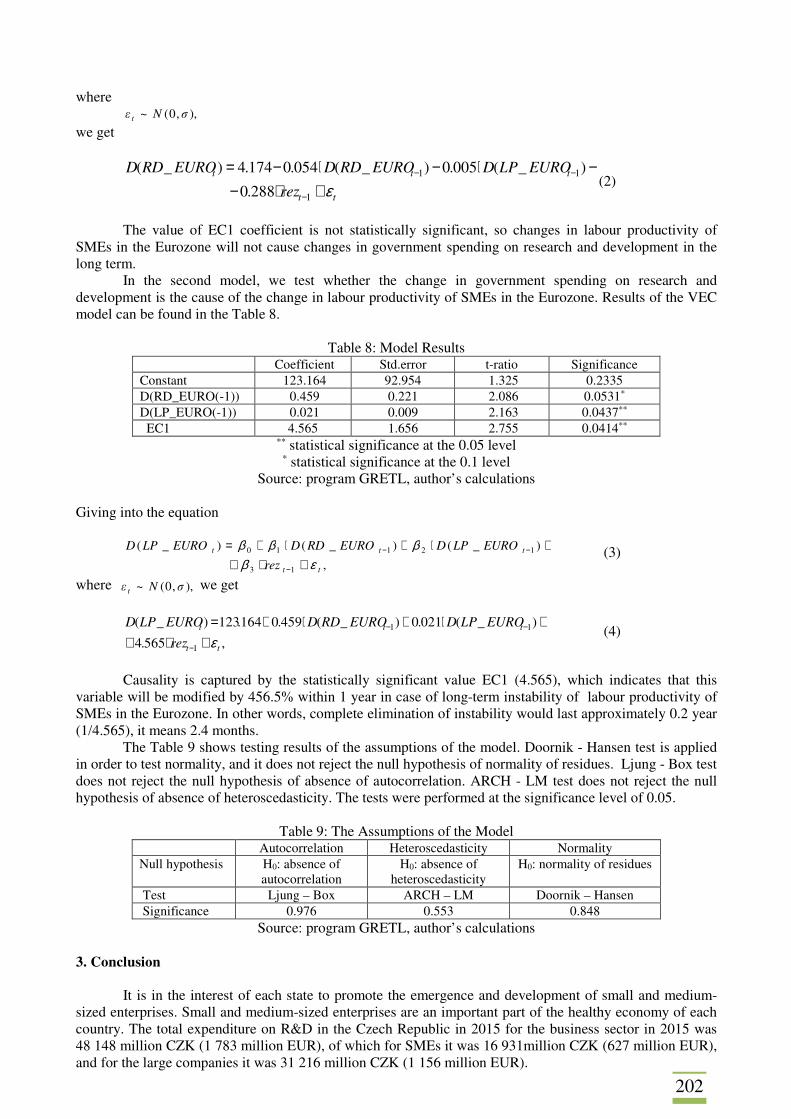
202
where ),,0(~ σNε t
we get
tt
ttt
rez
EUROLPDEURORDDEURORDD
ε+⋅−−⋅−⋅−=
−
−−
1
11
288.0
)_(005.0)_(054.0174.4)_((2)
The value of EC1 coefficient is not statistically significant, so changes in labour productivity of
SMEs in the Eurozone will not cause changes in government spending on research and development in the long term.
In the second model, we test whether the change in government spending on research and development is the cause of the change in labour productivity of SMEs in the Eurozone. Results of the VEC model can be found in the Table 8.
Table 8: Model Results
Coefficient Std.error t-ratio Significance Constant 123.164 92.954 1.325 0.2335 D(RD_EURO(-1)) 0.459 0.221 2.086 0.0531*
D(LP_EURO(-1)) 0.021 0.009 2.163 0.0437**
EC1 4.565 1.656 2.755 0.0414**
** statistical significance at the 0.05 level * statistical significance at the 0.1 level
Source: program GRETL, author’s calculations
Giving into the equation
,
)_()_()_(
13
12110
tt
ttt
rez
EUROLPDEURORDDEUROLPD
εββββ
+⋅++⋅+⋅+=
−
−− (3)
where ),,0(~ σNε t we get
,565.4
)_(021.0)_(459.0164.123)_(
1
11
tt
ttt
rez
EUROLPDEURORDDEUROLPD
ε+⋅++⋅+⋅+=
−
−− (4)
Causality is captured by the statistically significant value EC1 (4.565), which indicates that this
variable will be modified by 456.5% within 1 year in case of long-term instability of labour productivity of SMEs in the Eurozone. In other words, complete elimination of instability would last approximately 0.2 year (1/4.565), it means 2.4 months.
The Table 9 shows testing results of the assumptions of the model. Doornik - Hansen test is applied in order to test normality, and it does not reject the null hypothesis of normality of residues. Ljung - Box test does not reject the null hypothesis of absence of autocorrelation. ARCH - LM test does not reject the null hypothesis of absence of heteroscedasticity. The tests were performed at the significance level of 0.05.
Table 9: The Assumptions of the Model
Autocorrelation Heteroscedasticity Normality Null hypothesis H0: absence of
autocorrelation H0: absence of
heteroscedasticity H0: normality of residues
Test Ljung – Box ARCH – LM Doornik – Hansen Significance 0.976 0.553 0.848
Source: program GRETL, author’s calculations 3. Conclusion
It is in the interest of each state to promote the emergence and development of small and medium-
sized enterprises. Small and medium-sized enterprises are an important part of the healthy economy of each country. The total expenditure on R&D in the Czech Republic in 2015 for the business sector in 2015 was 48 148 million CZK (1 783 million EUR), of which for SMEs it was 16 931million CZK (627 million EUR), and for the large companies it was 31 216 million CZK (1 156 million EUR).
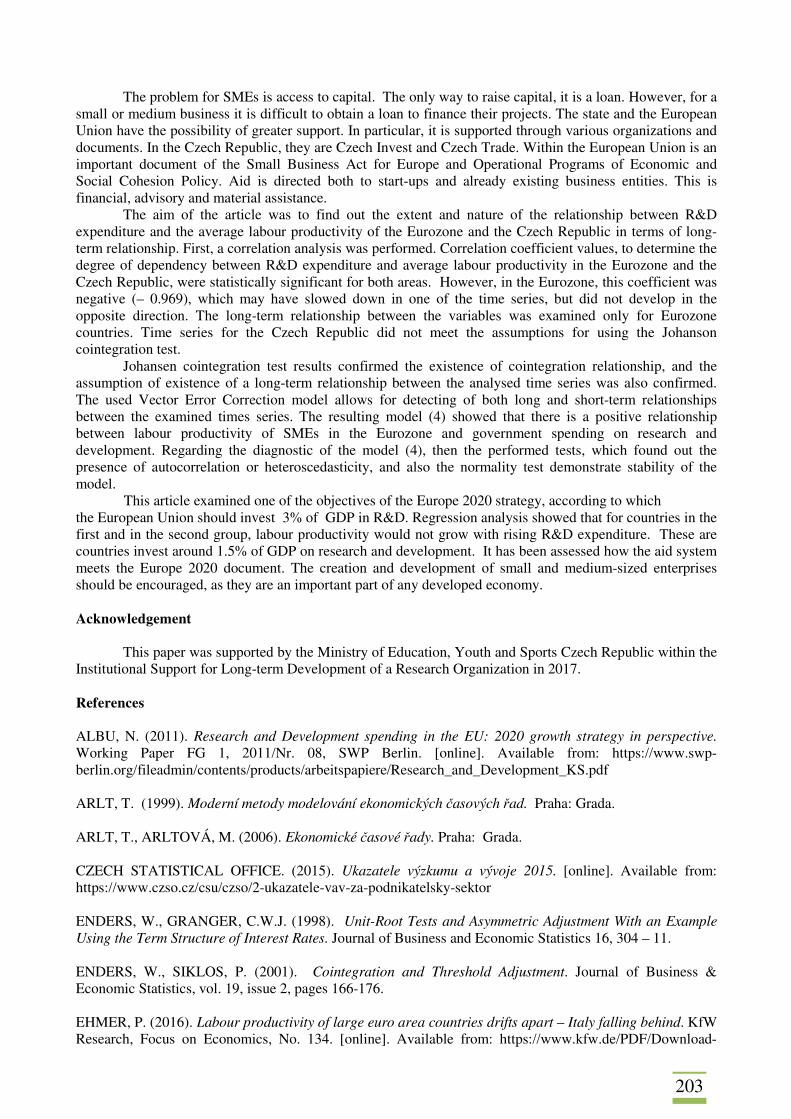
203
The problem for SMEs is access to capital. The only way to raise capital, it is a loan. However, for a small or medium business it is difficult to obtain a loan to finance their projects. The state and the European Union have the possibility of greater support. In particular, it is supported through various organizations and documents. In the Czech Republic, they are Czech Invest and Czech Trade. Within the European Union is an important document of the Small Business Act for Europe and Operational Programs of Economic and Social Cohesion Policy. Aid is directed both to start-ups and already existing business entities. This is financial, advisory and material assistance.
The aim of the article was to find out the extent and nature of the relationship between R&D expenditure and the average labour productivity of the Eurozone and the Czech Republic in terms of long-term relationship. First, a correlation analysis was performed. Correlation coefficient values, to determine the degree of dependency between R&D expenditure and average labour productivity in the Eurozone and the Czech Republic, were statistically significant for both areas. However, in the Eurozone, this coefficient was negative (– 0.969), which may have slowed down in one of the time series, but did not develop in the opposite direction. The long-term relationship between the variables was examined only for Eurozone countries. Time series for the Czech Republic did not meet the assumptions for using the Johanson cointegration test.
Johansen cointegration test results confirmed the existence of cointegration relationship, and the assumption of existence of a long-term relationship between the analysed time series was also confirmed. The used Vector Error Correction model allows for detecting of both long and short-term relationships between the examined times series. The resulting model (4) showed that there is a positive relationship between labour productivity of SMEs in the Eurozone and government spending on research and development. Regarding the diagnostic of the model (4), then the performed tests, which found out the presence of autocorrelation or heteroscedasticity, and also the normality test demonstrate stability of the model.
This article examined one of the objectives of the Europe 2020 strategy, according to which the European Union should invest 3% of GDP in R&D. Regression analysis showed that for countries in the first and in the second group, labour productivity would not grow with rising R&D expenditure. These are countries invest around 1.5% of GDP on research and development. It has been assessed how the aid system meets the Europe 2020 document. The creation and development of small and medium-sized enterprises should be encouraged, as they are an important part of any developed economy. Acknowledgement
This paper was supported by the Ministry of Education, Youth and Sports Czech Republic within the Institutional Support for Long-term Development of a Research Organization in 2017. References ALBU, N. (2011). Research and Development spending in the EU: 2020 growth strategy in perspective. Working Paper FG 1, 2011/Nr. 08, SWP Berlin. [online]. Available from: https://www.swp-berlin.org/fileadmin/contents/products/arbeitspapiere/Research_and_Development_KS.pdf ARLT, T. (1999). Moderní metody modelování ekonomických časových řad. Praha: Grada. ARLT, T., ARLTOVÁ, M. (2006). Ekonomické časové řady. Praha: Grada. CZECH STATISTICAL OFFICE. (2015). Ukazatele výzkumu a vývoje 2015. [online]. Available from: https://www.czso.cz/csu/czso/2-ukazatele-vav-za-podnikatelsky-sektor ENDERS, W., GRANGER, C.W.J. (1998). Unit-Root Tests and Asymmetric Adjustment With an Example Using the Term Structure of Interest Rates. Journal of Business and Economic Statistics 16, 304 – 11. ENDERS, W., SIKLOS, P. (2001). Cointegration and Threshold Adjustment. Journal of Business & Economic Statistics, vol. 19, issue 2, pages 166-176. EHMER, P. (2016). Labour productivity of large euro area countries drifts apart – Italy falling behind. KfW Research, Focus on Economics, No. 134. [online]. Available from: https://www.kfw.de/PDF/Download-
204
Center/Konzernthemen/Research/PDF-Dokumente-Fokus Volkswirtschaft/Fokus-englische-Dateien/Fokus-No.-134-Labour-productivity-Euro-area.pdf EVROPSKÁ KOMISE. (2015). Cíle strategie Evropa 2020. [online]. Available from: http://ec.europa.eu/europe2020/europe-2020-in-a-nutshell/targets/index_cs.htm. JOHANSEN, S. (1991). Estimation and Hypothesis Testing of Cointegration Vectors in Gaussian Vector Autoregressive Models. Econometrica, Vol. 59, No. 6, pp. 1551-1580. JOHANSEN, S. (1995). Likelihood-based Inference in Cointegrated Vector Autoregressive Models. Oxford: Oxford University Press. SRDOŠOVÁ, K. (2015). The European Union support of small and medium - sized enterprises in Czech and Slovak Republic. In JURČÍK. R..VYKLICKÝ. M.. ČUPROVÁ, I.(eds.) Brno : 1. VZPPP. UPPENBERG, K. (2009). R&D in Europe expenditures across sectors, regions and firm sizes. European investment bank, Centre for European Policy Studies, Brussels. [online]. Available from: http://aei.pitt.edu/32615/1/54._R%26D_in_Europe.pdf VEBER, J., SRPOVÁ, J. at al. (2012). Podnikání malé a střední firmy. Praha: Grada.
205
LOYALTY TO TWO BRANDS OF BEER OF THE SAME PRODUCER František Sudzina Aalborg University Faculty of Social Sciences, Department of Business and Management A.C. Meyers Vænge 15 2450 Copenhagen Denmark e-mail: [email protected] Abstract
The focus of the paper is loyalty to two brands of beer produced by the Carlsberg Group - Tuborg and Carlsberg. Both beers are lagers. The Carlsberg Group markets Tuborg as a more premium brand, and it also aims to promote it to women. Unlike in the Netherlands with one brand - Heineken and unlike in the Czech Republic with many well-known brands by a multitude of producers, the Danish case gives a unique opportunity to investigate if customers truly prefer one of two brands or are approximately equally low in loyalty to any brand as it is produced by the same company and tastes very similarly (if not the same), i.e. if brand loyalty can be built to similar products produced by the same company. Data for the research were collected using an on-line questionnaire. The survey was conducted in Denmark. Respondents were Danish university students; such selection was done in order to ensure familiarity of respondents with both brands. Attitudinal and behavioral components of loyalty were measured by validated constructs consisting of two statements each. Keywords: beer, brand loyalty JEL codes: M31, L66 1. Introduction
Howard and Sheth (1969) stressed the importance of loyalty to brands already about a half-century ago. According to Aaker (1991), brand loyalty may imply lower marketing costs, and higher number of new customers. Dick and Basu (1994) point out also positive word of mouth, and increased resistance to competitive strategies among loyal consumers. In order to be able to achieve advantages of brand loyalty identified by Aaker (1991) and Dick and Basu (1994), branding is required. But obviously, as Hollensen (2016) states, branding means added costs, namely for marketing, labeling, packaging, and promotion.
As Kotler et al. (2017) note, even highly loyal customers can be of different types - at one extreme, quietly satisfied, and at the other extreme, ones that cannot wait to tell everybody. Loyalty consists of attitudinal and behavioral components. Attitudinal loyalty means that a customer is willing to purchase the particular product at any reasonable price. Behavioral loyalty means re-purchasing. In the paper, average loyalty to the brands is compared among groups according to an explicitly stated preference. In general, some constructs are domain-independent (such as the construct by Sengupta and Johar (2002) for measuring affective dimension of attitude toward any brand), some are domain-specific (such as the constructs by Homer (2006) for measuring affective and cognitive dimensions of attitude toward a brand of beer). To measure both attitudinal and behavioral components of brand loyalty, general-purpose constructs developed by Chaudhuri and Holbrook (2001) were used.
The aim of the paper is to investigate if brand loyalty can be built to similar products produced by the same company. According to Grosová (2017), in spite of a steady decrease, the Czech Republic still has the world highest beer consumption. But the research was conducted in Denmark where two brands of beer - Tuborg and Carlsberg - are well known virtually to everybody. In many instances, waiters in Denmark ask which of the two brands a customer wants, rather than whether the customer prefers a light or a dark beer, and what percentage of alcohol it should have. Such setting would not be available in the Czech Republic where there are many breweries with many brands.
The rest of the paper is organized in the following way: In the next section, there is a description of data collection, and how they were analyzed. In the following section, results of the analysis are presented. The last section offers conclusions.
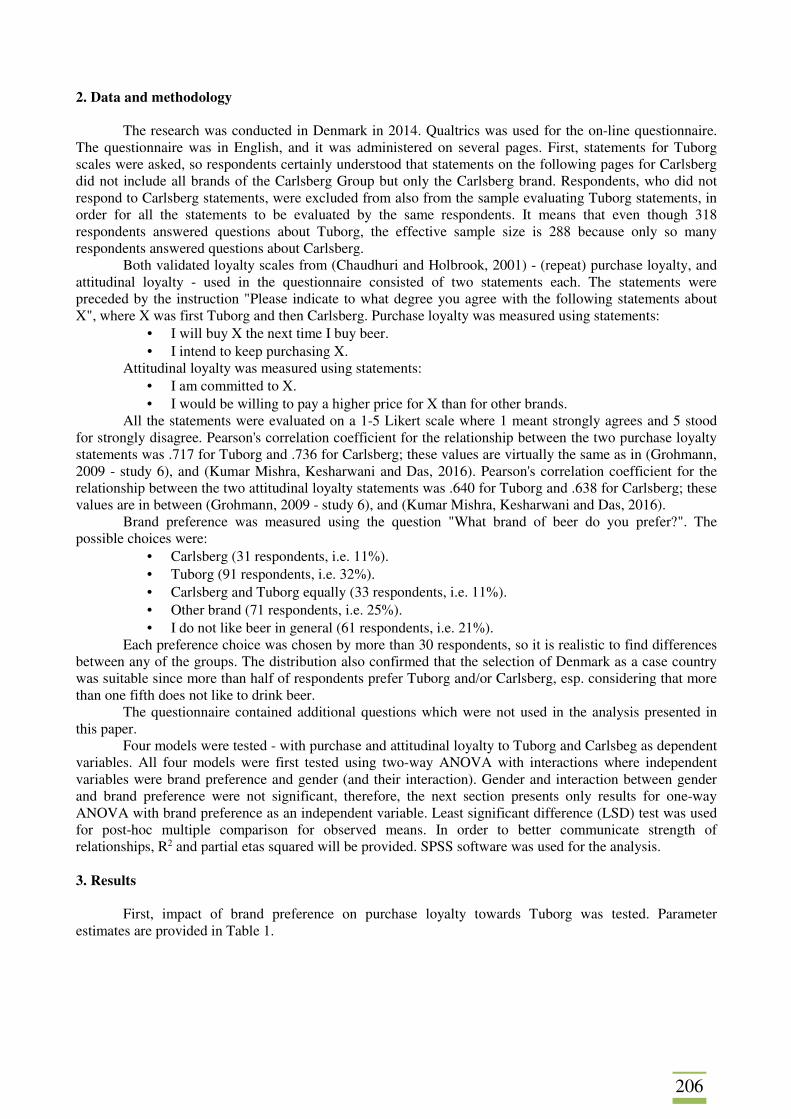
206
2. Data and methodology
The research was conducted in Denmark in 2014. Qualtrics was used for the on-line questionnaire. The questionnaire was in English, and it was administered on several pages. First, statements for Tuborg scales were asked, so respondents certainly understood that statements on the following pages for Carlsberg did not include all brands of the Carlsberg Group but only the Carlsberg brand. Respondents, who did not respond to Carlsberg statements, were excluded from also from the sample evaluating Tuborg statements, in order for all the statements to be evaluated by the same respondents. It means that even though 318 respondents answered questions about Tuborg, the effective sample size is 288 because only so many respondents answered questions about Carlsberg.
Both validated loyalty scales from (Chaudhuri and Holbrook, 2001) - (repeat) purchase loyalty, and attitudinal loyalty - used in the questionnaire consisted of two statements each. The statements were preceded by the instruction "Please indicate to what degree you agree with the following statements about X", where X was first Tuborg and then Carlsberg. Purchase loyalty was measured using statements:
• I will buy X the next time I buy beer. • I intend to keep purchasing X.
Attitudinal loyalty was measured using statements: • I am committed to X. • I would be willing to pay a higher price for X than for other brands.
All the statements were evaluated on a 1-5 Likert scale where 1 meant strongly agrees and 5 stood for strongly disagree. Pearson's correlation coefficient for the relationship between the two purchase loyalty statements was .717 for Tuborg and .736 for Carlsberg; these values are virtually the same as in (Grohmann, 2009 - study 6), and (Kumar Mishra, Kesharwani and Das, 2016). Pearson's correlation coefficient for the relationship between the two attitudinal loyalty statements was .640 for Tuborg and .638 for Carlsberg; these values are in between (Grohmann, 2009 - study 6), and (Kumar Mishra, Kesharwani and Das, 2016).
Brand preference was measured using the question "What brand of beer do you prefer?". The possible choices were:
• Carlsberg (31 respondents, i.e. 11%). • Tuborg (91 respondents, i.e. 32%). • Carlsberg and Tuborg equally (33 respondents, i.e. 11%). • Other brand (71 respondents, i.e. 25%). • I do not like beer in general (61 respondents, i.e. 21%).
Each preference choice was chosen by more than 30 respondents, so it is realistic to find differences between any of the groups. The distribution also confirmed that the selection of Denmark as a case country was suitable since more than half of respondents prefer Tuborg and/or Carlsberg, esp. considering that more than one fifth does not like to drink beer.
The questionnaire contained additional questions which were not used in the analysis presented in this paper.
Four models were tested - with purchase and attitudinal loyalty to Tuborg and Carlsbeg as dependent variables. All four models were first tested using two-way ANOVA with interactions where independent variables were brand preference and gender (and their interaction). Gender and interaction between gender and brand preference were not significant, therefore, the next section presents only results for one-way ANOVA with brand preference as an independent variable. Least significant difference (LSD) test was used for post-hoc multiple comparison for observed means. In order to better communicate strength of relationships, R2 and partial etas squared will be provided. SPSS software was used for the analysis. 3. Results
First, impact of brand preference on purchase loyalty towards Tuborg was tested. Parameter estimates are provided in Table 1.
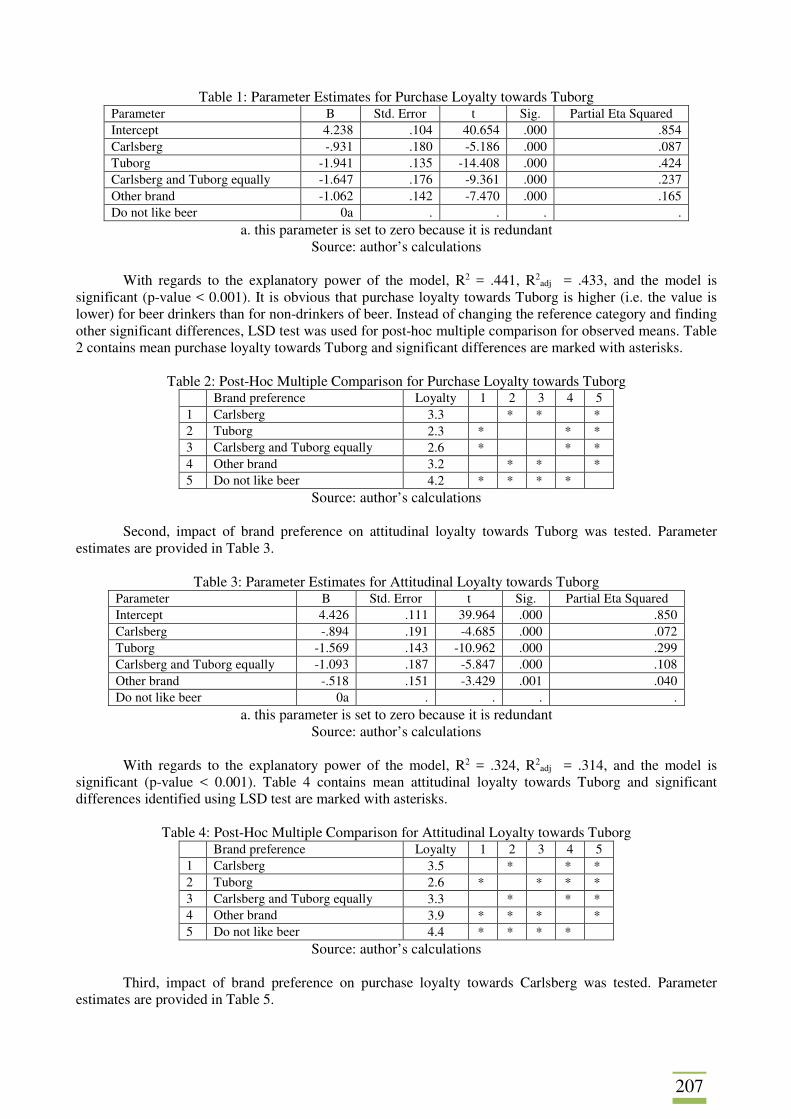
207
Table 1: Parameter Estimates for Purchase Loyalty towards Tuborg Parameter B Std. Error t Sig. Partial Eta Squared Intercept 4.238 .104 40.654 .000 .854 Carlsberg -.931 .180 -5.186 .000 .087 Tuborg -1.941 .135 -14.408 .000 .424 Carlsberg and Tuborg equally -1.647 .176 -9.361 .000 .237 Other brand -1.062 .142 -7.470 .000 .165 Do not like beer 0a . . . .
a. this parameter is set to zero because it is redundant Source: author’s calculations
With regards to the explanatory power of the model, R2 = .441, R2
adj = .433, and the model is significant (p-value < 0.001). It is obvious that purchase loyalty towards Tuborg is higher (i.e. the value is lower) for beer drinkers than for non-drinkers of beer. Instead of changing the reference category and finding other significant differences, LSD test was used for post-hoc multiple comparison for observed means. Table 2 contains mean purchase loyalty towards Tuborg and significant differences are marked with asterisks.
Table 2: Post-Hoc Multiple Comparison for Purchase Loyalty towards Tuborg
Brand preference Loyalty 1 2 3 4 5 1 Carlsberg 3.3 * * * 2 Tuborg 2.3 * * * 3 Carlsberg and Tuborg equally 2.6 * * * 4 Other brand 3.2 * * * 5 Do not like beer 4.2 * * * *
Source: author’s calculations Second, impact of brand preference on attitudinal loyalty towards Tuborg was tested. Parameter
estimates are provided in Table 3.
Table 3: Parameter Estimates for Attitudinal Loyalty towards Tuborg Parameter B Std. Error t Sig. Partial Eta Squared Intercept 4.426 .111 39.964 .000 .850 Carlsberg -.894 .191 -4.685 .000 .072 Tuborg -1.569 .143 -10.962 .000 .299 Carlsberg and Tuborg equally -1.093 .187 -5.847 .000 .108 Other brand -.518 .151 -3.429 .001 .040 Do not like beer 0a . . . .
a. this parameter is set to zero because it is redundant Source: author’s calculations
With regards to the explanatory power of the model, R2 = .324, R2
adj = .314, and the model is significant (p-value < 0.001). Table 4 contains mean attitudinal loyalty towards Tuborg and significant differences identified using LSD test are marked with asterisks.
Table 4: Post-Hoc Multiple Comparison for Attitudinal Loyalty towards Tuborg
Brand preference Loyalty 1 2 3 4 5 1 Carlsberg 3.5 * * * 2 Tuborg 2.6 * * * * 3 Carlsberg and Tuborg equally 3.3 * * * 4 Other brand 3.9 * * * * 5 Do not like beer 4.4 * * * *
Source: author’s calculations Third, impact of brand preference on purchase loyalty towards Carlsberg was tested. Parameter
estimates are provided in Table 5.
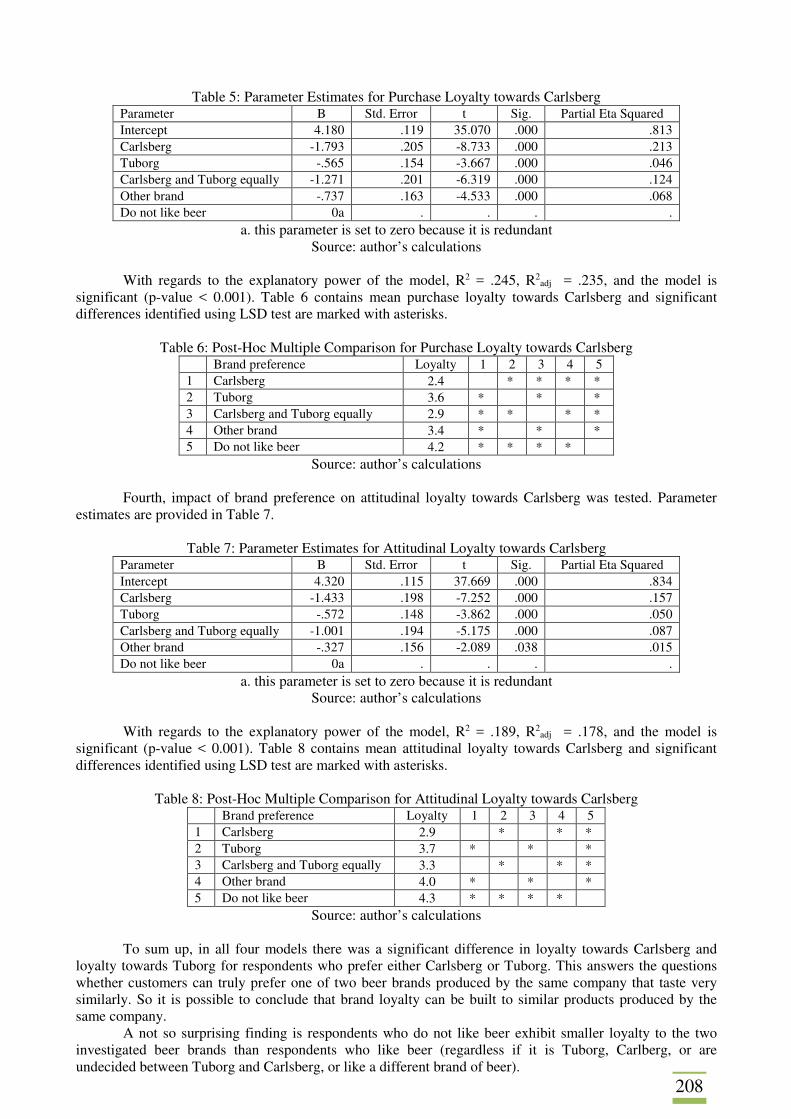
208
Table 5: Parameter Estimates for Purchase Loyalty towards Carlsberg Parameter B Std. Error t Sig. Partial Eta Squared Intercept 4.180 .119 35.070 .000 .813 Carlsberg -1.793 .205 -8.733 .000 .213 Tuborg -.565 .154 -3.667 .000 .046 Carlsberg and Tuborg equally -1.271 .201 -6.319 .000 .124 Other brand -.737 .163 -4.533 .000 .068 Do not like beer 0a . . . .
a. this parameter is set to zero because it is redundant Source: author’s calculations
With regards to the explanatory power of the model, R2 = .245, R2
adj = .235, and the model is significant (p-value < 0.001). Table 6 contains mean purchase loyalty towards Carlsberg and significant differences identified using LSD test are marked with asterisks.
Table 6: Post-Hoc Multiple Comparison for Purchase Loyalty towards Carlsberg
Brand preference Loyalty 1 2 3 4 5 1 Carlsberg 2.4 * * * * 2 Tuborg 3.6 * * * 3 Carlsberg and Tuborg equally 2.9 * * * * 4 Other brand 3.4 * * * 5 Do not like beer 4.2 * * * *
Source: author’s calculations Fourth, impact of brand preference on attitudinal loyalty towards Carlsberg was tested. Parameter
estimates are provided in Table 7.
Table 7: Parameter Estimates for Attitudinal Loyalty towards Carlsberg Parameter B Std. Error t Sig. Partial Eta Squared Intercept 4.320 .115 37.669 .000 .834 Carlsberg -1.433 .198 -7.252 .000 .157 Tuborg -.572 .148 -3.862 .000 .050 Carlsberg and Tuborg equally -1.001 .194 -5.175 .000 .087 Other brand -.327 .156 -2.089 .038 .015 Do not like beer 0a . . . .
a. this parameter is set to zero because it is redundant Source: author’s calculations
With regards to the explanatory power of the model, R2 = .189, R2
adj = .178, and the model is significant (p-value < 0.001). Table 8 contains mean attitudinal loyalty towards Carlsberg and significant differences identified using LSD test are marked with asterisks.
Table 8: Post-Hoc Multiple Comparison for Attitudinal Loyalty towards Carlsberg
Brand preference Loyalty 1 2 3 4 5 1 Carlsberg 2.9 * * * 2 Tuborg 3.7 * * * 3 Carlsberg and Tuborg equally 3.3 * * * 4 Other brand 4.0 * * * 5 Do not like beer 4.3 * * * *
Source: author’s calculations To sum up, in all four models there was a significant difference in loyalty towards Carlsberg and
loyalty towards Tuborg for respondents who prefer either Carlsberg or Tuborg. This answers the questions whether customers can truly prefer one of two beer brands produced by the same company that taste very similarly. So it is possible to conclude that brand loyalty can be built to similar products produced by the same company.
A not so surprising finding is respondents who do not like beer exhibit smaller loyalty to the two investigated beer brands than respondents who like beer (regardless if it is Tuborg, Carlberg, or are undecided between Tuborg and Carlsberg, or like a different brand of beer).
209
Another not so surprising results was that average loyalty for respondents who prefer Tuborg and Carlsberg equally was in between averages for respondents who prefer only Tuborg and only Carlsberg.
A more surprising finding is that significant differences in loyalty were found almost between all preference categories; to be more specific, only one difference was not significant for attitudinal loyalty towards Tuborg and purchase loyalty towards Carlsberg, and two differences were not significant for purchase loyalty towards Tuborg and attitudinal loyalty towards Carlsberg.
Another observation is that in three of four models, respondents who prefer a different Carlsberg Group brand, are loyal to the investigated Carlsberg Group brand only as much as (i.e. not significantly differently than) respondents who prefer a non-Carlsberg Group brand. In other words, respondents who prefer Carlsberg or other brand do not significantly differ in purchase loyalty towards Tuborg, respondents who prefer Tuborg or other brand do not significantly differ in purchase loyalty towards Carlsberg, and respondents who prefer Tuborg or other brand do not significantly differ in attitudinal loyalty towards Carlsberg. It also supports the thesis that it is possible to build a brand loyalty to similar products produced by the same company without building a loyalty to all products produced by the company.
4. Conclusion
The paper aimed to answer if it is possible for a company producing two well-known and similar products to build a strong brand for both products independently on the case of Carlsberg Group producing Tuborg and Carlsberg beer brands. Therefore, the research was conducted in Denmark.
Approximately three quarters of respondents who preferred Carlsberg or Tuborg were able to select one of them as a preferred one. In three of four models, respondents who preferred a different Carlsberg Group brand, are loyal to the investigated Carlsberg Group brand only as much as (i.e. not significantly differently than) respondents who preferred a non-Carlsberg Group brand.
For both beer brands and for both components of loyalty, there was a significant difference in loyalty towards Carlsberg and loyalty towards Tuborg for respondents who prefer either Carlsberg or Tuborg. All these findings support the hypothesis that it is possible to build a brand loyalty to two similarly tasting beers produced by the same company without building a loyalty to all beers produced by the company. Therefore, it is advisable that further research is focused on how Carlsberg Group managed to achieve it with the aim on how to replicate the success, preferably also in other industries and in other countries. References AAKER, D.A. (1991). Managing Brand Equity. New York, NY: The Free Press. CHAUDHURI, A., HOLBROOK, M.B. (2001). The Chain of Effects from Brand Trust and Brand Affect to Brand Performance: The Role of Brand Loyalty. Journal of Marketing, vol. 65, no. 2, pp. 81–93. DICK, A.S., BASU, K. (1994). Customer Loyalty: Toward an Integrated Conceptual Framework. Journal of the Academy of Marketing Science, vol. 22, no. 2, pp. 99–113. GROHMANN, B. (2009). Gender dimensions of brand personality. Journal of Marketing Research, vol. 46, no. 1, pp. 105–119. GROSOVÁ, S., MASÁR, M., KUTNOHORSKÁ, O., KUBEŠ, V. (2017). The demand for beer in Czech Republic: Understanding longrun on- and off-trade price elasticities. Czech Journal of Food Sciences, vol. 35, no. 2, pp. 165–170. HOLLENSEN, S. (2016). Global Marketing, 7th edition. London: Pearson. HOMER, P. M. (2006). Relationships Among Ad-Induced Affect, Beliefs, and Attitudes: Another Look. Journal of Advertising, vol. 35, no. 1, pp. 35–51. HOWARD, J., SHETH, J. (1969). The Theory of Buyer Behavior. New York: John Wiley & Sons. KOTLER, P., ARMSTRONG, G., HARRIS, L.C., PIERCY, N. (2017). Principles of Marketing, 7th European ed. New Jersey: Pearson Publishing.

210
KUMAR MISHRA, M., KESHARWANI, A., DAS, D. (2016). The relationship between risk aversion, brand trust, brand affect and loyalty: Evidence from the FMCG industry. Journal of Indian Business Research, vol. 8, no. 2, pp. 78–97. SENGUPTA, J., JOHAR, G. V. (2002). Effects of Inconsistent Attribute Information on the Predictive Value of Product Attitudes: Toward a Resolution of Opposing Perspectives. Journal of Consumer Research, vol. 29, no. 1, pp. 39–56.
211
PERFORMANCE ASSESSMENT AS A BASELINE FOR DECISION MAKING IN SOCIAL GOAL-ORIENTED ORGANIZATIONS Jarmila Šebestová, Zuzana Palová Silesian University in Opava School of Business Administration in Karvina, Department of Business Economics and Management Univerzitní nám. 1934/3 Karvina, 733 40 Czech Republic e-mail: [email protected] Abstract
The impact and performance measurement of socially oriented organizations varies across regional and country contexts and is also influenced by the extent of the social and environmental problems they seek to address. This impact can be measured by considering the Output (O) of an organization, the ways in which organization influence existing Structures (S) and institutions and how their contribution to encouraging Vitality (V) across problem areas. (Lundström and Stevenson, 2005). These three pillars have an influence on external organizational support from public or private financial sources. With the respect to that model, the main goal of this article is to evaluate different methods of performance assessment to improve that assessment model to be sustainable. A model improvement is based on survey results among beneficiaries of two operational programs 2007-2013 in the Czech Republic, conducted in the year 2015, testing several techniques connected with the social area such as SROI, Organizational Performance Index, Social Impact Assessment (SIA) and Counterfactual analysis. Results confirmed earlier step-by-step analysis, that most successful project were those, who met the criteria (goals) of the supporting body. When beneficiaries prefer more regional needs, the impact score is 10-20% lower. Keywords: decision making, performance, social impact JEL codes: H43, L21, L31, O35, R58 1. Introduction
The importance of prosocial behaviour in many organizations is gaining momentum and combine an economic logic with a social one are more and more called for due to changes in the society (Haigh et al., 2015, Jones, 2007). On the other hand, goals with the social impact is so hard to measure in real life. Those alternative goals or set of goals of organizations are based on the interaction of internal and external interest groups within their power or state of implementation of their own strategy. A set of alternative goals includes tangible and intangible types of goals in character and finally those objectives are difficult to measure in monetary or other units or target indicators. This alternative way of economic thought was pointed out by Vimrová (2015) who distinguishes five basic alternative theories such as Management theory, Behavioral theory, Institutional theory, Post-Keynesian theory and Employee theory. The behavioral theory is closely connected with socially oriented organizations from all those alternative theories. Although the behavioural theories are more suitable for large company, the role of the interest groups in socially oriented organizations (supported by external subsidies) are higher than in “usual” small or medium organizations.
Social impact could be measured by monetization (social costs and benefits), quantification (e.g. number of individuals supported by subsidies), qualitative assessment in terms of qualitative indicators like satisfaction or improvement of social situation and by mention, when the social impacts will occur, but this is not substantiated. (TEP, 2010).
The main goal of this paper is to model an assessment of beneficiaries of two chosen programs under background of Social Impact Assessment as a guideline for decision making of future support. There were compared other evaluation methods, specially developed for organization operating in area of social services or with social mission. 1.1 Decision Making Based on Behavioural Models
Decision- making under behavioural theories assume that the complex structure of organizations
leads to the existence of various interest groups. Those main groups are identified as owners, management and ordinary workers, when owners and small shareholders could have different objectives. Other interest groups can be subdivided. In each presented model, we can see different classification of them. All models
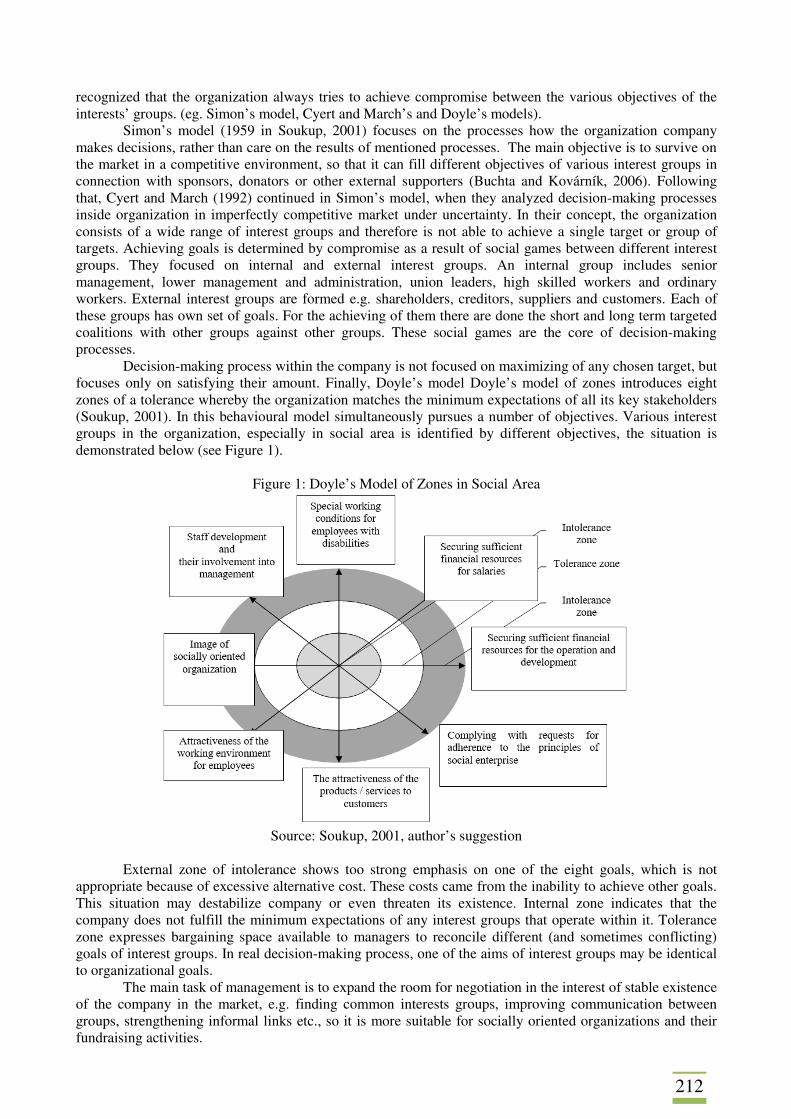
212
recognized that the organization always tries to achieve compromise between the various objectives of the interests’ groups. (eg. Simon’s model, Cyert and March’s and Doyle’s models).
Simon’s model (1959 in Soukup, 2001) focuses on the processes how the organization company makes decisions, rather than care on the results of mentioned processes. The main objective is to survive on the market in a competitive environment, so that it can fill different objectives of various interest groups in connection with sponsors, donators or other external supporters (Buchta and Kovárník, 2006). Following that, Cyert and March (1992) continued in Simon’s model, when they analyzed decision-making processes inside organization in imperfectly competitive market under uncertainty. In their concept, the organization consists of a wide range of interest groups and therefore is not able to achieve a single target or group of targets. Achieving goals is determined by compromise as a result of social games between different interest groups. They focused on internal and external interest groups. An internal group includes senior management, lower management and administration, union leaders, high skilled workers and ordinary workers. External interest groups are formed e.g. shareholders, creditors, suppliers and customers. Each of these groups has own set of goals. For the achieving of them there are done the short and long term targeted coalitions with other groups against other groups. These social games are the core of decision-making processes.
Decision-making process within the company is not focused on maximizing of any chosen target, but focuses only on satisfying their amount. Finally, Doyle’s model Doyle’s model of zones introduces eight zones of a tolerance whereby the organization matches the minimum expectations of all its key stakeholders (Soukup, 2001). In this behavioural model simultaneously pursues a number of objectives. Various interest groups in the organization, especially in social area is identified by different objectives, the situation is demonstrated below (see Figure 1).
Figure 1: Doyle’s Model of Zones in Social Area
Source: Soukup, 2001, author’s suggestion
External zone of intolerance shows too strong emphasis on one of the eight goals, which is not
appropriate because of excessive alternative cost. These costs came from the inability to achieve other goals. This situation may destabilize company or even threaten its existence. Internal zone indicates that the company does not fulfill the minimum expectations of any interest groups that operate within it. Tolerance zone expresses bargaining space available to managers to reconcile different (and sometimes conflicting) goals of interest groups. In real decision-making process, one of the aims of interest groups may be identical to organizational goals.
The main task of management is to expand the room for negotiation in the interest of stable existence of the company in the market, e.g. finding common interests groups, improving communication between groups, strengthening informal links etc., so it is more suitable for socially oriented organizations and their fundraising activities.
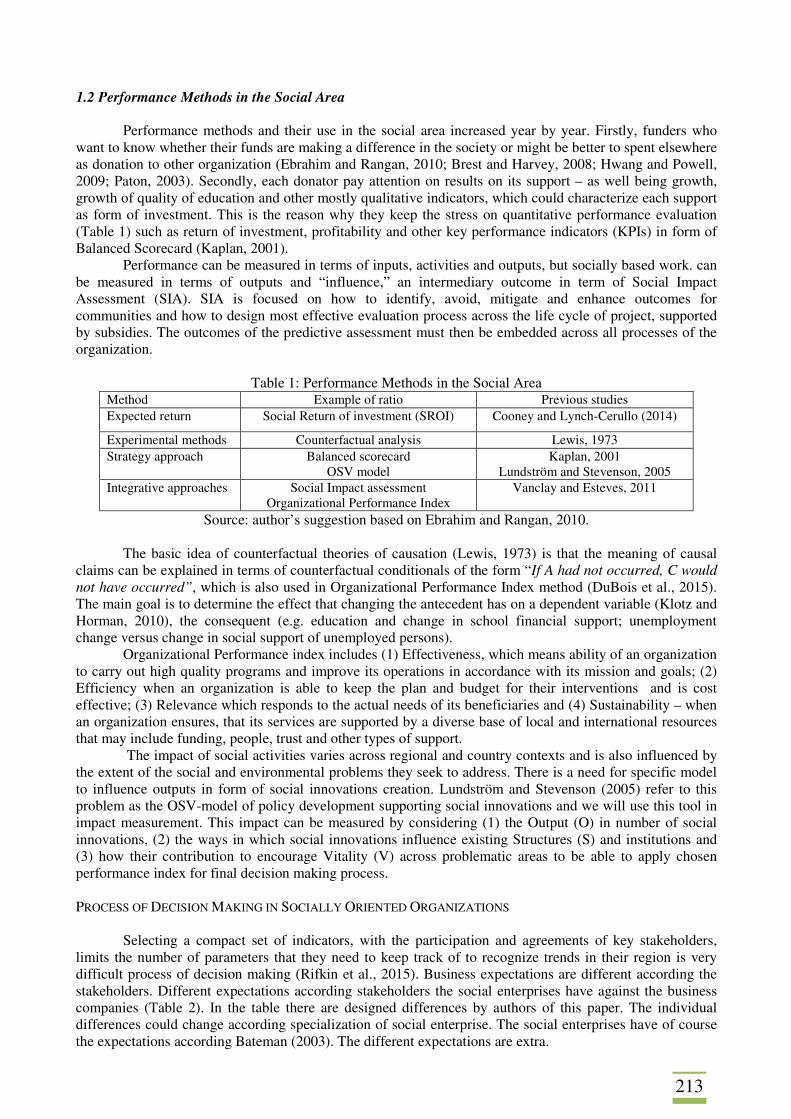
213
1.2 Performance Methods in the Social Area
Performance methods and their use in the social area increased year by year. Firstly, funders who
want to know whether their funds are making a difference in the society or might be better to spent elsewhere as donation to other organization (Ebrahim and Rangan, 2010; Brest and Harvey, 2008; Hwang and Powell, 2009; Paton, 2003). Secondly, each donator pay attention on results on its support – as well being growth, growth of quality of education and other mostly qualitative indicators, which could characterize each support as form of investment. This is the reason why they keep the stress on quantitative performance evaluation (Table 1) such as return of investment, profitability and other key performance indicators (KPIs) in form of Balanced Scorecard (Kaplan, 2001).
Performance can be measured in terms of inputs, activities and outputs, but socially based work. can be measured in terms of outputs and “influence,” an intermediary outcome in term of Social Impact Assessment (SIA). SIA is focused on how to identify, avoid, mitigate and enhance outcomes for communities and how to design most effective evaluation process across the life cycle of project, supported by subsidies. The outcomes of the predictive assessment must then be embedded across all processes of the organization.
Table 1: Performance Methods in the Social Area
Method Example of ratio Previous studies Expected return Social Return of investment (SROI) Cooney and Lynch-Cerullo (2014)
Experimental methods Counterfactual analysis Lewis, 1973 Strategy approach Balanced scorecard
OSV model Kaplan, 2001
Lundström and Stevenson, 2005 Integrative approaches Social Impact assessment
Organizational Performance Index Vanclay and Esteves, 2011
Source: author’s suggestion based on Ebrahim and Rangan, 2010. The basic idea of counterfactual theories of causation (Lewis, 1973) is that the meaning of causal
claims can be explained in terms of counterfactual conditionals of the form “If A had not occurred, C would not have occurred”, which is also used in Organizational Performance Index method (DuBois et al., 2015). The main goal is to determine the effect that changing the antecedent has on a dependent variable (Klotz and Horman, 2010), the consequent (e.g. education and change in school financial support; unemployment change versus change in social support of unemployed persons).
Organizational Performance index includes (1) Effectiveness, which means ability of an organization to carry out high quality programs and improve its operations in accordance with its mission and goals; (2) Efficiency when an organization is able to keep the plan and budget for their interventions and is cost effective; (3) Relevance which responds to the actual needs of its beneficiaries and (4) Sustainability – when an organization ensures, that its services are supported by a diverse base of local and international resources that may include funding, people, trust and other types of support.
The impact of social activities varies across regional and country contexts and is also influenced by the extent of the social and environmental problems they seek to address. There is a need for specific model to influence outputs in form of social innovations creation. Lundström and Stevenson (2005) refer to this problem as the OSV-model of policy development supporting social innovations and we will use this tool in impact measurement. This impact can be measured by considering (1) the Output (O) in number of social innovations, (2) the ways in which social innovations influence existing Structures (S) and institutions and (3) how their contribution to encourage Vitality (V) across problematic areas to be able to apply chosen performance index for final decision making process. PROCESS OF DECISION MAKING IN SOCIALLY ORIENTED ORGANIZATIONS
Selecting a compact set of indicators, with the participation and agreements of key stakeholders, limits the number of parameters that they need to keep track of to recognize trends in their region is very difficult process of decision making (Rifkin et al., 2015). Business expectations are different according the stakeholders. Different expectations according stakeholders the social enterprises have against the business companies (Table 2). In the table there are designed differences by authors of this paper. The individual differences could change according specialization of social enterprise. The social enterprises have of course the expectations according Bateman (2003). The different expectations are extra.
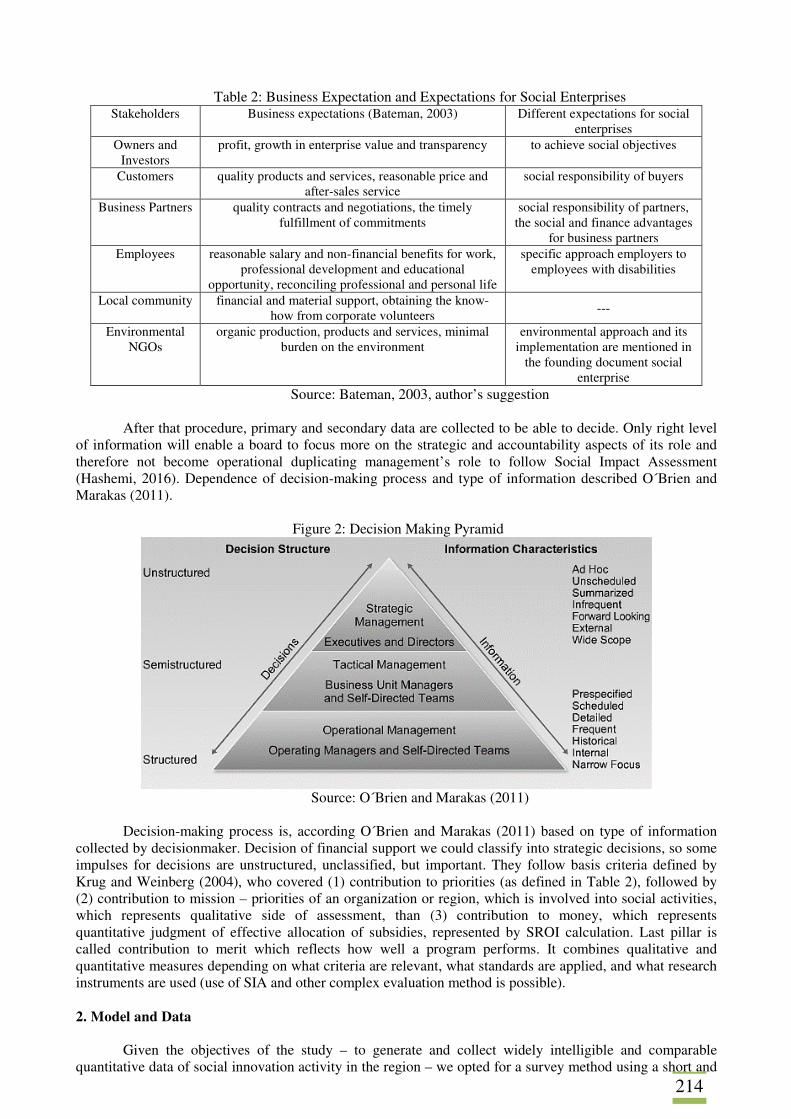
214
Table 2: Business Expectation and Expectations for Social Enterprises Stakeholders Business expectations (Bateman, 2003) Different expectations for social
enterprises Owners and
Investors profit, growth in enterprise value and transparency to achieve social objectives
Customers quality products and services, reasonable price and after-sales service
social responsibility of buyers
Business Partners quality contracts and negotiations, the timely fulfillment of commitments
social responsibility of partners, the social and finance advantages
for business partners Employees reasonable salary and non-financial benefits for work,
professional development and educational opportunity, reconciling professional and personal life
specific approach employers to employees with disabilities
Local community financial and material support, obtaining the know-how from corporate volunteers ---
Environmental NGOs
organic production, products and services, minimal burden on the environment
environmental approach and its implementation are mentioned in
the founding document social enterprise
Source: Bateman, 2003, author’s suggestion After that procedure, primary and secondary data are collected to be able to decide. Only right level
of information will enable a board to focus more on the strategic and accountability aspects of its role and therefore not become operational duplicating management’s role to follow Social Impact Assessment (Hashemi, 2016). Dependence of decision-making process and type of information described O´Brien and Marakas (2011).
Figure 2: Decision Making Pyramid
Source: O´Brien and Marakas (2011)
Decision-making process is, according O´Brien and Marakas (2011) based on type of information
collected by decisionmaker. Decision of financial support we could classify into strategic decisions, so some impulses for decisions are unstructured, unclassified, but important. They follow basis criteria defined by Krug and Weinberg (2004), who covered (1) contribution to priorities (as defined in Table 2), followed by (2) contribution to mission – priorities of an organization or region, which is involved into social activities, which represents qualitative side of assessment, than (3) contribution to money, which represents quantitative judgment of effective allocation of subsidies, represented by SROI calculation. Last pillar is called contribution to merit which reflects how well a program performs. It combines qualitative and quantitative measures depending on what criteria are relevant, what standards are applied, and what research instruments are used (use of SIA and other complex evaluation method is possible).
2. Model and Data
Given the objectives of the study – to generate and collect widely intelligible and comparable quantitative data of social innovation activity in the region – we opted for a survey method using a short and
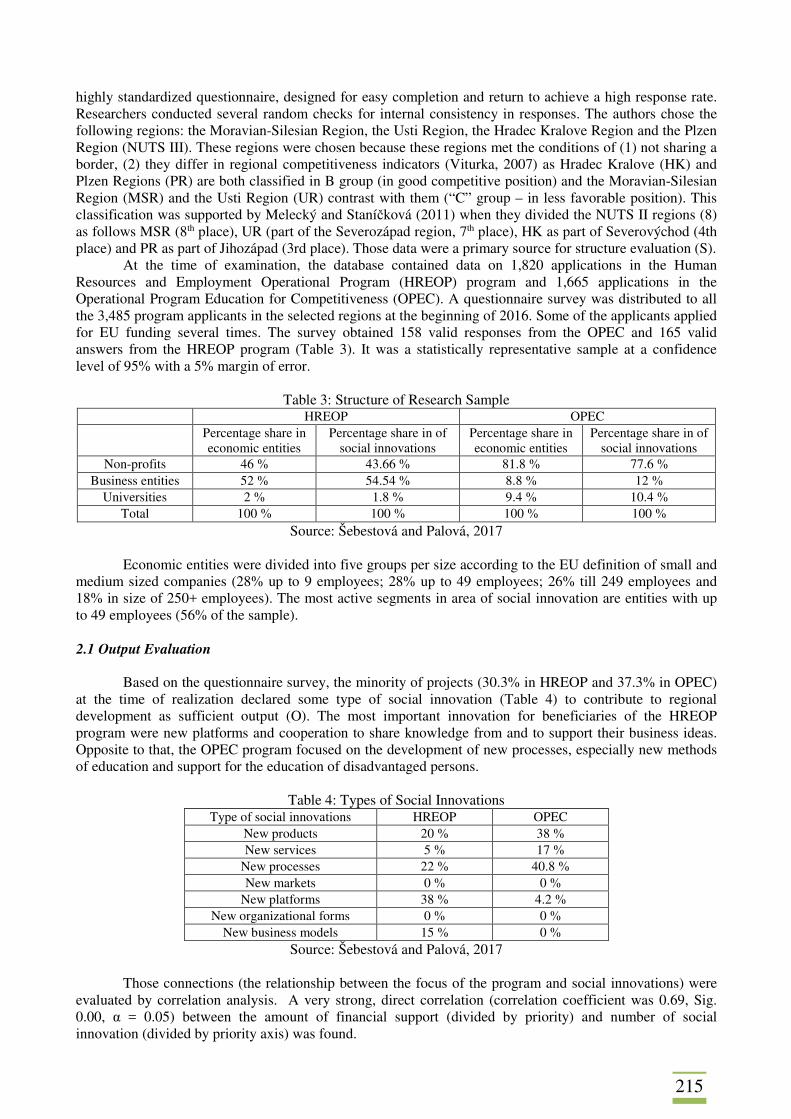
215
highly standardized questionnaire, designed for easy completion and return to achieve a high response rate. Researchers conducted several random checks for internal consistency in responses. The authors chose the following regions: the Moravian-Silesian Region, the Usti Region, the Hradec Kralove Region and the Plzen Region (NUTS III). These regions were chosen because these regions met the conditions of (1) not sharing a border, (2) they differ in regional competitiveness indicators (Viturka, 2007) as Hradec Kralove (HK) and Plzen Regions (PR) are both classified in B group (in good competitive position) and the Moravian-Silesian Region (MSR) and the Usti Region (UR) contrast with them (“C” group – in less favorable position). This classification was supported by Melecký and Staníčková (2011) when they divided the NUTS II regions (8) as follows MSR (8th place), UR (part of the Severozápad region, 7th place), HK as part of Severovýchod (4th place) and PR as part of Jihozápad (3rd place). Those data were a primary source for structure evaluation (S).
At the time of examination, the database contained data on 1,820 applications in the Human Resources and Employment Operational Program (HREOP) program and 1,665 applications in the Operational Program Education for Competitiveness (OPEC). A questionnaire survey was distributed to all the 3,485 program applicants in the selected regions at the beginning of 2016. Some of the applicants applied for EU funding several times. The survey obtained 158 valid responses from the OPEC and 165 valid answers from the HREOP program (Table 3). It was a statistically representative sample at a confidence level of 95% with a 5% margin of error.
Table 3: Structure of Research Sample
HREOP OPEC Percentage share in
economic entities Percentage share in of
social innovations Percentage share in economic entities
Percentage share in of social innovations
Non-profits 46 % 43.66 % 81.8 % 77.6 % Business entities 52 % 54.54 % 8.8 % 12 %
Universities 2 % 1.8 % 9.4 % 10.4 % Total 100 % 100 % 100 % 100 %
Source: Šebestová and Palová, 2017 Economic entities were divided into five groups per size according to the EU definition of small and
medium sized companies (28% up to 9 employees; 28% up to 49 employees; 26% till 249 employees and 18% in size of 250+ employees). The most active segments in area of social innovation are entities with up to 49 employees (56% of the sample).
2.1 Output Evaluation
Based on the questionnaire survey, the minority of projects (30.3% in HREOP and 37.3% in OPEC)
at the time of realization declared some type of social innovation (Table 4) to contribute to regional development as sufficient output (O). The most important innovation for beneficiaries of the HREOP program were new platforms and cooperation to share knowledge from and to support their business ideas. Opposite to that, the OPEC program focused on the development of new processes, especially new methods of education and support for the education of disadvantaged persons.
Table 4: Types of Social Innovations
Type of social innovations HREOP OPEC New products 20 % 38 % New services 5 % 17 %
New processes 22 % 40.8 % New markets 0 % 0 %
New platforms 38 % 4.2 % New organizational forms 0 % 0 %
New business models 15 % 0 % Source: Šebestová and Palová, 2017
Those connections (the relationship between the focus of the program and social innovations) were
evaluated by correlation analysis. A very strong, direct correlation (correlation coefficient was 0.69, Sig. 0.00, α = 0.05) between the amount of financial support (divided by priority) and number of social innovation (divided by priority axis) was found.
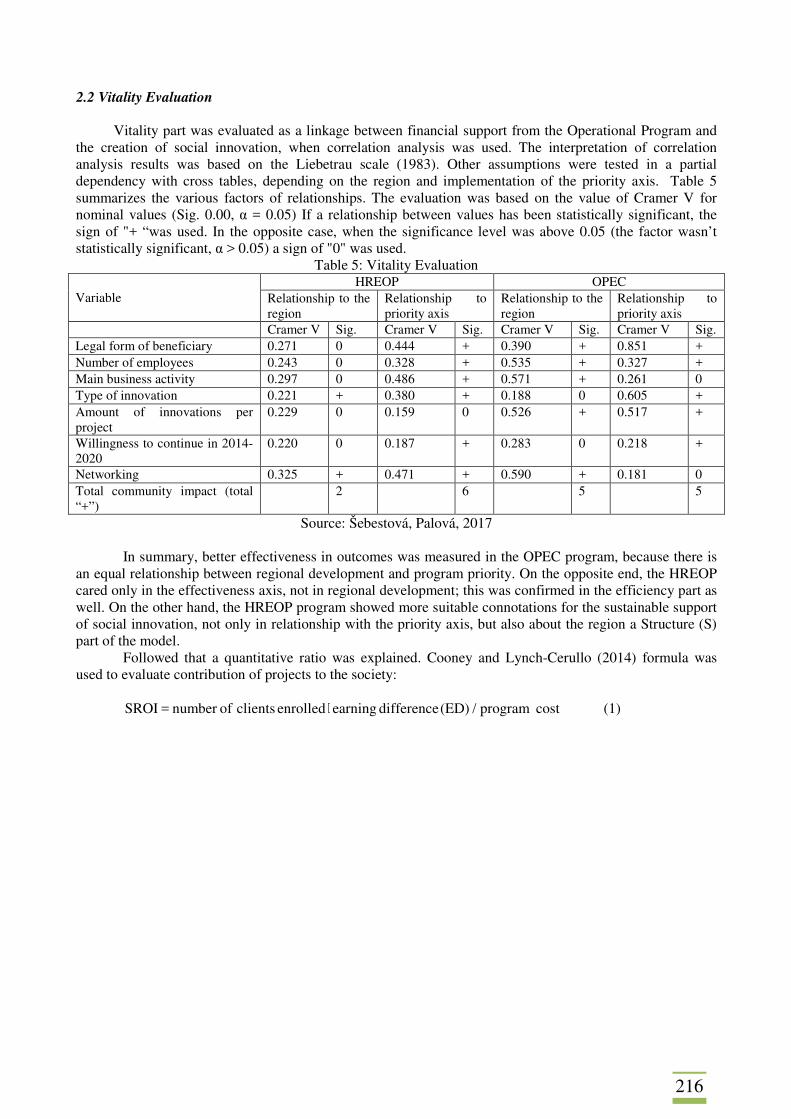
216
2.2 Vitality Evaluation
Vitality part was evaluated as a linkage between financial support from the Operational Program and
the creation of social innovation, when correlation analysis was used. The interpretation of correlation analysis results was based on the Liebetrau scale (1983). Other assumptions were tested in a partial dependency with cross tables, depending on the region and implementation of the priority axis. Table 5 summarizes the various factors of relationships. The evaluation was based on the value of Cramer V for nominal values (Sig. 0.00, α = 0.05) If a relationship between values has been statistically significant, the sign of "+ “was used. In the opposite case, when the significance level was above 0.05 (the factor wasn’t statistically significant, α > 0.05) a sign of "0" was used.
Table 5: Vitality Evaluation
Variable HREOP OPEC
Relationship to the region
Relationship to priority axis
Relationship to the region
Relationship to priority axis
Cramer V Sig. Cramer V Sig. Cramer V Sig. Cramer V Sig. Legal form of beneficiary 0.271 0 0.444 + 0.390 + 0.851 + Number of employees 0.243 0 0.328 + 0.535 + 0.327 + Main business activity 0.297 0 0.486 + 0.571 + 0.261 0 Type of innovation 0.221 + 0.380 + 0.188 0 0.605 + Amount of innovations per project
0.229 0 0.159 0 0.526 + 0.517 +
Willingness to continue in 2014-2020
0.220 0 0.187 + 0.283 0 0.218 +
Networking 0.325 + 0.471 + 0.590 + 0.181 0 Total community impact (total “+”)
2 6 5 5
Source: Šebestová, Palová, 2017
In summary, better effectiveness in outcomes was measured in the OPEC program, because there is an equal relationship between regional development and program priority. On the opposite end, the HREOP cared only in the effectiveness axis, not in regional development; this was confirmed in the efficiency part as well. On the other hand, the HREOP program showed more suitable connotations for the sustainable support of social innovation, not only in relationship with the priority axis, but also about the region a Structure (S) part of the model.
Followed that a quantitative ratio was explained. Cooney and Lynch-Cerullo (2014) formula was used to evaluate contribution of projects to the society:
cost program /(ED) difference earning enrolled clients ofnumber = SROI ⋅ (1)
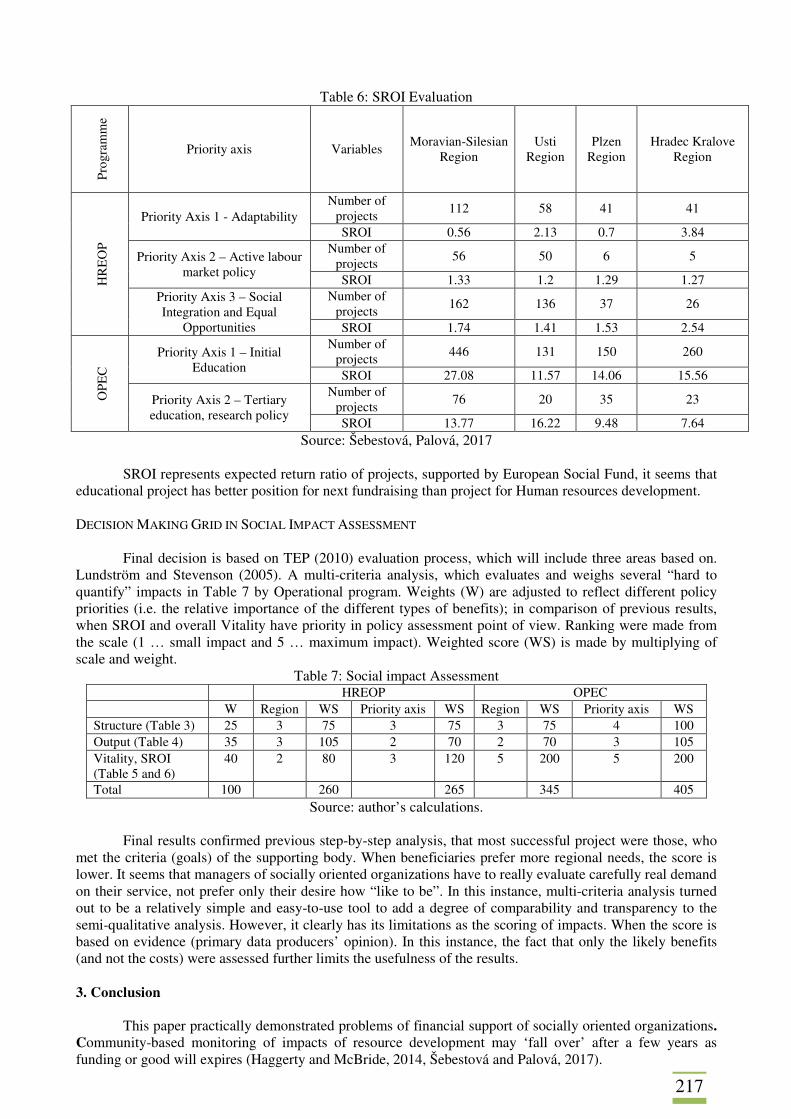
217
Table 6: SROI Evaluation Pr
ogra
mm
e
Priority axis Variables Moravian-Silesian
Region Usti
Region Plzen
Region Hradec Kralove
Region
HR
EO
P
Priority Axis 1 - Adaptability Number of
projects 112 58 41 41
SROI 0.56 2.13 0.7 3.84
Priority Axis 2 – Active labour market policy
Number of projects
56 50 6 5
SROI 1.33 1.2 1.29 1.27 Priority Axis 3 – Social Integration and Equal
Opportunities
Number of projects
162 136 37 26
SROI 1.74 1.41 1.53 2.54
OPE
C
Priority Axis 1 – Initial Education
Number of projects 446 131 150 260
SROI 27.08 11.57 14.06 15.56
Priority Axis 2 – Tertiary education, research policy
Number of projects
76 20 35 23
SROI 13.77 16.22 9.48 7.64 Source: Šebestová, Palová, 2017
SROI represents expected return ratio of projects, supported by European Social Fund, it seems that
educational project has better position for next fundraising than project for Human resources development.
DECISION MAKING GRID IN SOCIAL IMPACT ASSESSMENT Final decision is based on TEP (2010) evaluation process, which will include three areas based on.
Lundström and Stevenson (2005). A multi-criteria analysis, which evaluates and weighs several “hard to quantify” impacts in Table 7 by Operational program. Weights (W) are adjusted to reflect different policy priorities (i.e. the relative importance of the different types of benefits); in comparison of previous results, when SROI and overall Vitality have priority in policy assessment point of view. Ranking were made from the scale (1 … small impact and 5 … maximum impact). Weighted score (WS) is made by multiplying of scale and weight.
Table 7: Social impact Assessment HREOP OPEC W Region WS Priority axis WS Region WS Priority axis WS
Structure (Table 3) 25 3 75 3 75 3 75 4 100 Output (Table 4) 35 3 105 2 70 2 70 3 105 Vitality, SROI (Table 5 and 6)
40 2 80 3 120 5 200 5 200
Total 100 260 265 345 405 Source: author’s calculations.
Final results confirmed previous step-by-step analysis, that most successful project were those, who
met the criteria (goals) of the supporting body. When beneficiaries prefer more regional needs, the score is lower. It seems that managers of socially oriented organizations have to really evaluate carefully real demand on their service, not prefer only their desire how “like to be”. In this instance, multi-criteria analysis turned out to be a relatively simple and easy-to-use tool to add a degree of comparability and transparency to the semi-qualitative analysis. However, it clearly has its limitations as the scoring of impacts. When the score is based on evidence (primary data producers’ opinion). In this instance, the fact that only the likely benefits (and not the costs) were assessed further limits the usefulness of the results.
3. Conclusion
This paper practically demonstrated problems of financial support of socially oriented organizations. Community-based monitoring of impacts of resource development may ‘fall over’ after a few years as funding or good will expires (Haggerty and McBride, 2014, Šebestová and Palová, 2017).
218
These characteristics have made our development of agreed indicators to track the cumulative socioeconomic impacts of multiple gas megaprojects a highly iterative process. Social impact assessment would be a useful step how to clarify relationship between social impact and beneficiaries from subsidies. Acknowledgement
This paper was supported by the Ministry of Education, Youth and Sports Czech Republic within the Institutional Support for Long-term Development of a Research Organization in 2017.
References BATEMAN, T. (2003). Thinking About Corporate Social Responsibility. Integra Ventures. BREST, P., HARVEY, H. (2008). Money Well Spent: A Strategic Plan for Smart Philanthropy. New York: Bloomberg Press. BUCHTA, M., KOVÁRNÍK, J. (2006). Behavioristické modely ve veřejném sektoru. Scientific papers of the University of Pardubice. Series D, vol. 10, pp. 24-33. COONEY, K., LYNCH-CERULLO, K. (2014). Measuring the Social Returns of Nonprofits and Social Enterprises: The Promise and Perils of the SROI. Nonprofit Policy Forum, vol. 5, no. 2, pp. 367–393. CYERT, R.M., MARCH, J.G., (1992). A behavioral theory of the firm (2nd ed). Cambridge, MA: Blackwell. DUBOIS, R., REEVES, M., YAKIMAKHO, O. (2015). Organizational Performance Index (OPI) Handbook. Washington: Pactworld. EBRAHIM, A., RANGAN, V. K. (2010). The Limits of Nonprofit Impact: A Contingency Framework For Measuring Social Performance. Working Paper 10-099. Harvard: Harvard Business School. Florence, Italy. [online]. Available from: http://conferences.iaia.org/2015/final_papers.php HAGGERTY, J., McBRIDE, K. (2014). Navigating beyond the resource curse: Do local monitoring programs empower fracking host communities? Montana: Headwaters Economics. HAIGH, N., WALKER, J., BACQ, S., KICKUL, J. (2015). Hybrid Organizations. Origins, Strategies, Impacts, and Implications, vol. 57, no. 3, pp. 5-12. HASHEMI, N. (2016). Nonprofits: decision making in a challenging environment: Is your management information fit for purpose? London: Crowe Clark Whitehill. HWANG, H., POWELL, W. W. (2009). The Rationalization of Charity: The Influences of Professionalism in the Nonprofit Sector. Administrative Science Quarterly, 54: 268-298. JONES, M. B. (2007). The multiple sources of mission drift. Nonprofit and Voluntary Sector Quarterly, vol. 36, no.2, pp. 299-307. KAPLAN, R. S. (2001). Strategic Performance Measurement and Management in Nonprofit Organizations. Nonprofit Management and Leadership, vol.11, no.3, pp. 353-370. KLOTZ, L., HORMAN, M. (2010). Counterfactual Analysis of Sustainable Project Delivery Processes. Journal of Construction Engineering and Management, vol. 136, no. 5, pp. 147-157. KRUG, K., WEINBERG, CH. B. (2004) Mission, Money, and Merit: Strategic Decision Making by Nonprofit Managers. Nonprofit Management & Leadership, vol. 14, no. 3, pp. 325-342. LIEBETRAU, A. M., 1983. Measures of association. (Quantitative Applications in the Social Sciences Series) Newbury Park: Sage Publications.
219
LEWIS, D. (1973). Causation. Journal of Philosophy, vol. 70, pp. 556–567. LUNDSTRÖM, A., STEVENSON, L. (2005). Entrepreneurship – Theory and practice. New York:Springer. MELECKÝ, L., STANÍČKOVÁ, M. (2011). Evaluation of the Czech Republic regions' competitiveness in the context of the Lisbon strategy. Ekonomická revue - Central European Review of Economic Issues, vol.14, no. 3, pp. 183-200. O'BRIEN, J. A., MARAKAS, G. M. (2011). Management information systems. 10th ed. New York: McGraw-Hill/Irwin. PATON, R. (2003). Managing and Measuring Social Enterprises. London: Sage Publications. RIFKIN, W., WITT, K., EVERINGHAM, J.-A., UHLMANN, V. (2015). Adaptive Assessment of Cumulative Socioeconomic Impacts. In Impact Assessment in the Digital Era: 35th Annual Conference of the International Association for Impact Assessment. ŠEBESTOVÁ, J., PALOVÁ, Z. (2017). Support of Social Innovations: Case of the Czech Republic. In: Lewandowski, M. B.Kożuch, (ed). Public Sector Entrepreneurship and the Integration of Innovative Business Models. Hershey: IGI Global, pp. 165-187. SOUKUP, J. (2001). Mikroekonomická analýza. Slaný: Melandrium. THE EVALUATION PARTNERSHIP - TEP (2010). Study on Social Impact Assessment as a tool for mainstreaming social inclusion and social protection concerns in public policy in EU Member States. Brussels: EU Commision. VANCLAY, F., ESTEVES, A.M. (2011). New Directions in Social Impact Assessment: Conceptual and Methodological Advances. Cheltenham: Edward Elgar. VIMROVÁ, V. (2015). Proces aplikace alternativních modelů teorie firmy na nestandardní vlastnickou a organizační strukturu. Český finanční a účetní časopis, vol. 2, no. 2, pp. 95-117. VITURKA, M. (2007): Konkurenceschopnost regionů a možnosti jejího hodnocení. Politická ekonomie, vol. 55, no. 5, pp. 637–658.
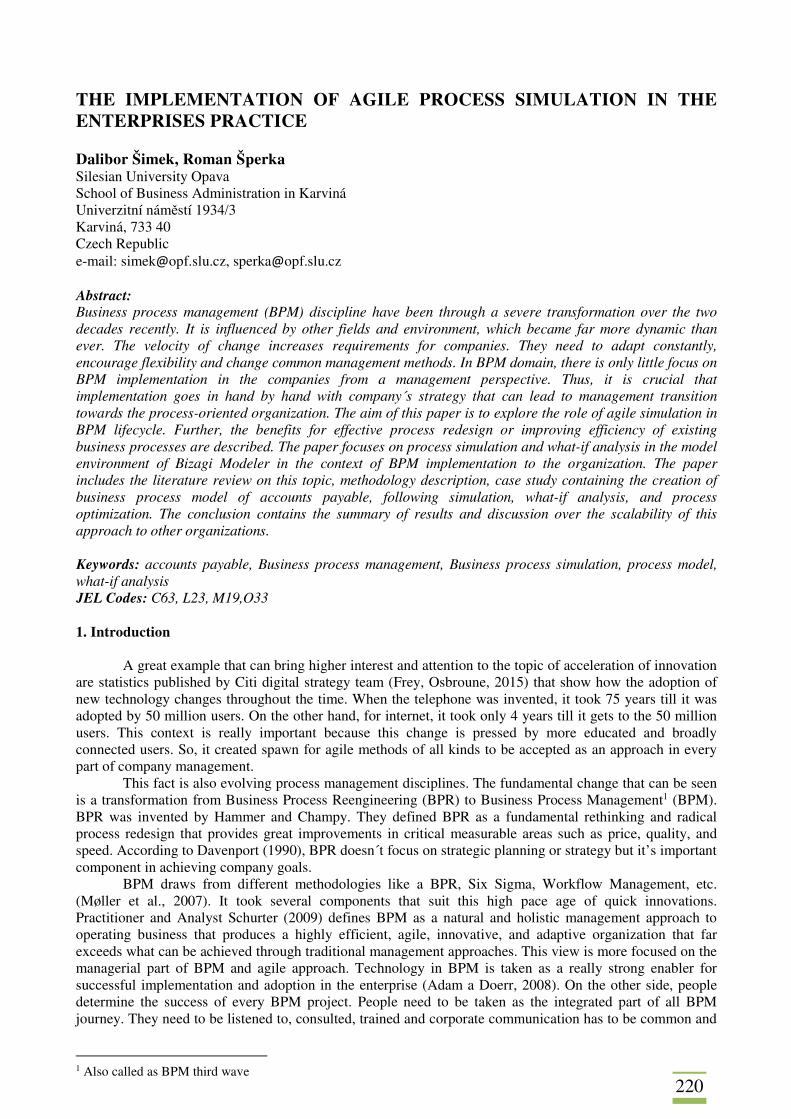
220
THE IMPLEMENTATION OF AGILE PROCESS SIMULATION IN THE ENTERPRISES PRACTICE Dalibor Šimek, Roman Šperka Silesian University Opava School of Business Administration in Karviná Univerzitní náměstí 1934/3 Karviná, 733 40 Czech Republic e-mail: [email protected], [email protected] Abstract: Business process management (BPM) discipline have been through a severe transformation over the two decades recently. It is influenced by other fields and environment, which became far more dynamic than ever. The velocity of change increases requirements for companies. They need to adapt constantly, encourage flexibility and change common management methods. In BPM domain, there is only little focus on BPM implementation in the companies from a management perspective. Thus, it is crucial that implementation goes in hand by hand with company´s strategy that can lead to management transition towards the process-oriented organization. The aim of this paper is to explore the role of agile simulation in BPM lifecycle. Further, the benefits for effective process redesign or improving efficiency of existing business processes are described. The paper focuses on process simulation and what-if analysis in the model environment of Bizagi Modeler in the context of BPM implementation to the organization. The paper includes the literature review on this topic, methodology description, case study containing the creation of business process model of accounts payable, following simulation, what-if analysis, and process optimization. The conclusion contains the summary of results and discussion over the scalability of this approach to other organizations. Keywords: accounts payable, Business process management, Business process simulation, process model, what-if analysis JEL Codes: C63, L23, M19,O33 1. Introduction
A great example that can bring higher interest and attention to the topic of acceleration of innovation are statistics published by Citi digital strategy team (Frey, Osbroune, 2015) that show how the adoption of new technology changes throughout the time. When the telephone was invented, it took 75 years till it was adopted by 50 million users. On the other hand, for internet, it took only 4 years till it gets to the 50 million users. This context is really important because this change is pressed by more educated and broadly connected users. So, it created spawn for agile methods of all kinds to be accepted as an approach in every part of company management.
This fact is also evolving process management disciplines. The fundamental change that can be seen is a transformation from Business Process Reengineering (BPR) to Business Process Management1 (BPM). BPR was invented by Hammer and Champy. They defined BPR as a fundamental rethinking and radical process redesign that provides great improvements in critical measurable areas such as price, quality, and speed. According to Davenport (1990), BPR doesn´t focus on strategic planning or strategy but it’s important component in achieving company goals.
BPM draws from different methodologies like a BPR, Six Sigma, Workflow Management, etc. (Møller et al., 2007). It took several components that suit this high pace age of quick innovations. Practitioner and Analyst Schurter (2009) defines BPM as a natural and holistic management approach to operating business that produces a highly efficient, agile, innovative, and adaptive organization that far exceeds what can be achieved through traditional management approaches. This view is more focused on the managerial part of BPM and agile approach. Technology in BPM is taken as a really strong enabler for successful implementation and adoption in the enterprise (Adam a Doerr, 2008). On the other side, people determine the success of every BPM project. People need to be taken as the integrated part of all BPM journey. They need to be listened to, consulted, trained and corporate communication has to be common and
1 Also called as BPM third wave
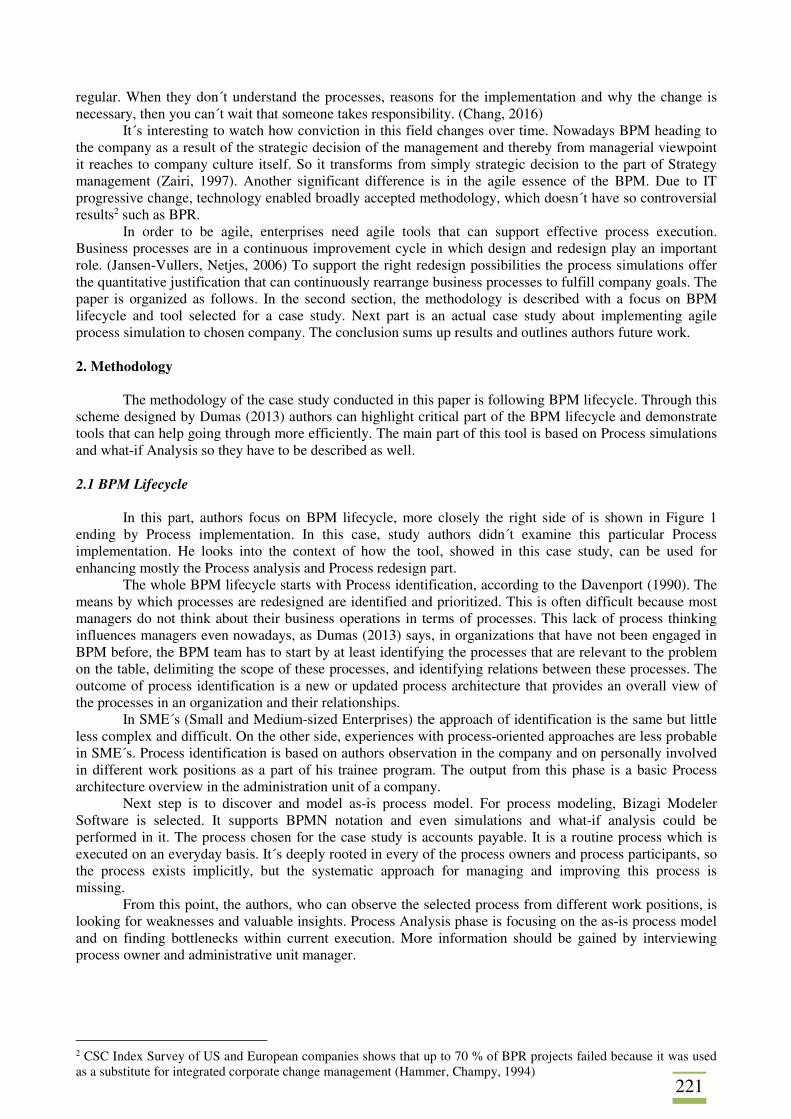
221
regular. When they don´t understand the processes, reasons for the implementation and why the change is necessary, then you can´t wait that someone takes responsibility. (Chang, 2016)
It´s interesting to watch how conviction in this field changes over time. Nowadays BPM heading to the company as a result of the strategic decision of the management and thereby from managerial viewpoint it reaches to company culture itself. So it transforms from simply strategic decision to the part of Strategy management (Zairi, 1997). Another significant difference is in the agile essence of the BPM. Due to IT progressive change, technology enabled broadly accepted methodology, which doesn´t have so controversial results2 such as BPR.
In order to be agile, enterprises need agile tools that can support effective process execution. Business processes are in a continuous improvement cycle in which design and redesign play an important role. (Jansen-Vullers, Netjes, 2006) To support the right redesign possibilities the process simulations offer the quantitative justification that can continuously rearrange business processes to fulfill company goals. The paper is organized as follows. In the second section, the methodology is described with a focus on BPM lifecycle and tool selected for a case study. Next part is an actual case study about implementing agile process simulation to chosen company. The conclusion sums up results and outlines authors future work.
2. Methodology
The methodology of the case study conducted in this paper is following BPM lifecycle. Through this
scheme designed by Dumas (2013) authors can highlight critical part of the BPM lifecycle and demonstrate tools that can help going through more efficiently. The main part of this tool is based on Process simulations and what-if Analysis so they have to be described as well. 2.1 BPM Lifecycle
In this part, authors focus on BPM lifecycle, more closely the right side of is shown in Figure 1 ending by Process implementation. In this case, study authors didn´t examine this particular Process implementation. He looks into the context of how the tool, showed in this case study, can be used for enhancing mostly the Process analysis and Process redesign part.
The whole BPM lifecycle starts with Process identification, according to the Davenport (1990). The means by which processes are redesigned are identified and prioritized. This is often difficult because most managers do not think about their business operations in terms of processes. This lack of process thinking influences managers even nowadays, as Dumas (2013) says, in organizations that have not been engaged in BPM before, the BPM team has to start by at least identifying the processes that are relevant to the problem on the table, delimiting the scope of these processes, and identifying relations between these processes. The outcome of process identification is a new or updated process architecture that provides an overall view of the processes in an organization and their relationships.
In SME´s (Small and Medium-sized Enterprises) the approach of identification is the same but little less complex and difficult. On the other side, experiences with process-oriented approaches are less probable in SME´s. Process identification is based on authors observation in the company and on personally involved in different work positions as a part of his trainee program. The output from this phase is a basic Process architecture overview in the administration unit of a company.
Next step is to discover and model as-is process model. For process modeling, Bizagi Modeler Software is selected. It supports BPMN notation and even simulations and what-if analysis could be performed in it. The process chosen for the case study is accounts payable. It is a routine process which is executed on an everyday basis. It´s deeply rooted in every of the process owners and process participants, so the process exists implicitly, but the systematic approach for managing and improving this process is missing.
From this point, the authors, who can observe the selected process from different work positions, is looking for weaknesses and valuable insights. Process Analysis phase is focusing on the as-is process model and on finding bottlenecks within current execution. More information should be gained by interviewing process owner and administrative unit manager.
2 CSC Index Survey of US and European companies shows that up to 70 % of BPR projects failed because it was used as a substitute for integrated corporate change management (Hammer, Champy, 1994)
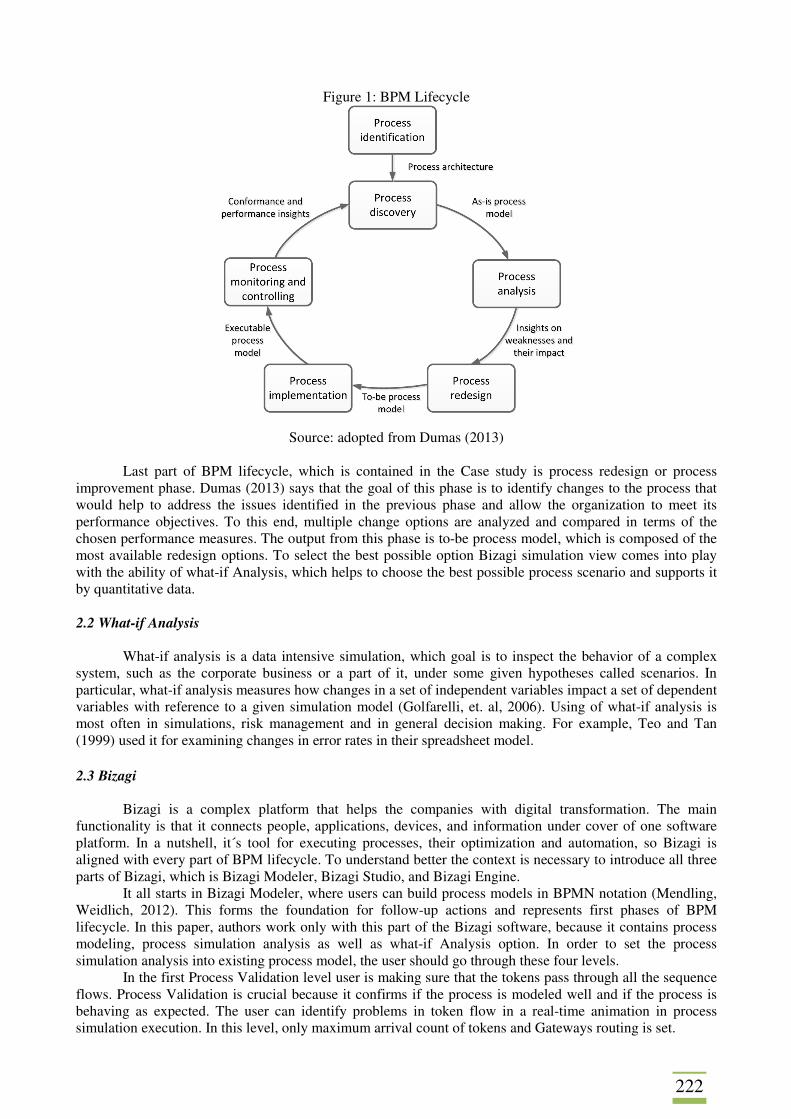
222
Figure 1: BPM Lifecycle
Source: adopted from Dumas (2013)
Last part of BPM lifecycle, which is contained in the Case study is process redesign or process improvement phase. Dumas (2013) says that the goal of this phase is to identify changes to the process that would help to address the issues identified in the previous phase and allow the organization to meet its performance objectives. To this end, multiple change options are analyzed and compared in terms of the chosen performance measures. The output from this phase is to-be process model, which is composed of the most available redesign options. To select the best possible option Bizagi simulation view comes into play with the ability of what-if Analysis, which helps to choose the best possible process scenario and supports it by quantitative data.
2.2 What-if Analysis
What-if analysis is a data intensive simulation, which goal is to inspect the behavior of a complex system, such as the corporate business or a part of it, under some given hypotheses called scenarios. In particular, what-if analysis measures how changes in a set of independent variables impact a set of dependent variables with reference to a given simulation model (Golfarelli, et. al, 2006). Using of what-if analysis is most often in simulations, risk management and in general decision making. For example, Teo and Tan (1999) used it for examining changes in error rates in their spreadsheet model.
2.3 Bizagi
Bizagi is a complex platform that helps the companies with digital transformation. The main
functionality is that it connects people, applications, devices, and information under cover of one software platform. In a nutshell, it´s tool for executing processes, their optimization and automation, so Bizagi is aligned with every part of BPM lifecycle. To understand better the context is necessary to introduce all three parts of Bizagi, which is Bizagi Modeler, Bizagi Studio, and Bizagi Engine.
It all starts in Bizagi Modeler, where users can build process models in BPMN notation (Mendling, Weidlich, 2012). This forms the foundation for follow-up actions and represents first phases of BPM lifecycle. In this paper, authors work only with this part of the Bizagi software, because it contains process modeling, process simulation analysis as well as what-if Analysis option. In order to set the process simulation analysis into existing process model, the user should go through these four levels.
In the first Process Validation level user is making sure that the tokens pass through all the sequence flows. Process Validation is crucial because it confirms if the process is modeled well and if the process is behaving as expected. The user can identify problems in token flow in a real-time animation in process simulation execution. In this level, only maximum arrival count of tokens and Gateways routing is set.
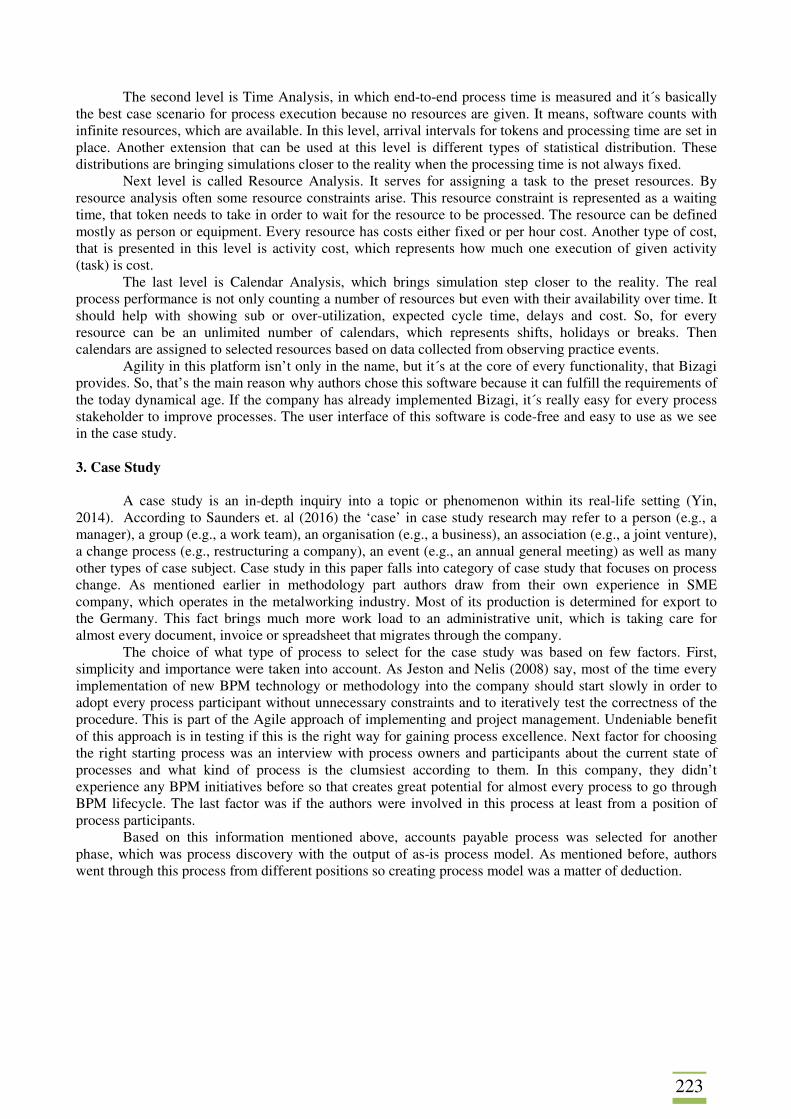
223
The second level is Time Analysis, in which end-to-end process time is measured and it´s basically the best case scenario for process execution because no resources are given. It means, software counts with infinite resources, which are available. In this level, arrival intervals for tokens and processing time are set in place. Another extension that can be used at this level is different types of statistical distribution. These distributions are bringing simulations closer to the reality when the processing time is not always fixed.
Next level is called Resource Analysis. It serves for assigning a task to the preset resources. By resource analysis often some resource constraints arise. This resource constraint is represented as a waiting time, that token needs to take in order to wait for the resource to be processed. The resource can be defined mostly as person or equipment. Every resource has costs either fixed or per hour cost. Another type of cost, that is presented in this level is activity cost, which represents how much one execution of given activity (task) is cost.
The last level is Calendar Analysis, which brings simulation step closer to the reality. The real process performance is not only counting a number of resources but even with their availability over time. It should help with showing sub or over-utilization, expected cycle time, delays and cost. So, for every resource can be an unlimited number of calendars, which represents shifts, holidays or breaks. Then calendars are assigned to selected resources based on data collected from observing practice events.
Agility in this platform isn’t only in the name, but it´s at the core of every functionality, that Bizagi provides. So, that’s the main reason why authors chose this software because it can fulfill the requirements of the today dynamical age. If the company has already implemented Bizagi, it´s really easy for every process stakeholder to improve processes. The user interface of this software is code-free and easy to use as we see in the case study.
3. Case Study
A case study is an in-depth inquiry into a topic or phenomenon within its real-life setting (Yin, 2014). According to Saunders et. al (2016) the ‘case’ in case study research may refer to a person (e.g., a manager), a group (e.g., a work team), an organisation (e.g., a business), an association (e.g., a joint venture), a change process (e.g., restructuring a company), an event (e.g., an annual general meeting) as well as many other types of case subject. Case study in this paper falls into category of case study that focuses on process change. As mentioned earlier in methodology part authors draw from their own experience in SME company, which operates in the metalworking industry. Most of its production is determined for export to the Germany. This fact brings much more work load to an administrative unit, which is taking care for almost every document, invoice or spreadsheet that migrates through the company.
The choice of what type of process to select for the case study was based on few factors. First, simplicity and importance were taken into account. As Jeston and Nelis (2008) say, most of the time every implementation of new BPM technology or methodology into the company should start slowly in order to adopt every process participant without unnecessary constraints and to iteratively test the correctness of the procedure. This is part of the Agile approach of implementing and project management. Undeniable benefit of this approach is in testing if this is the right way for gaining process excellence. Next factor for choosing the right starting process was an interview with process owners and participants about the current state of processes and what kind of process is the clumsiest according to them. In this company, they didn’t experience any BPM initiatives before so that creates great potential for almost every process to go through BPM lifecycle. The last factor was if the authors were involved in this process at least from a position of process participants.
Based on this information mentioned above, accounts payable process was selected for another phase, which was process discovery with the output of as-is process model. As mentioned before, authors went through this process from different positions so creating process model was a matter of deduction.
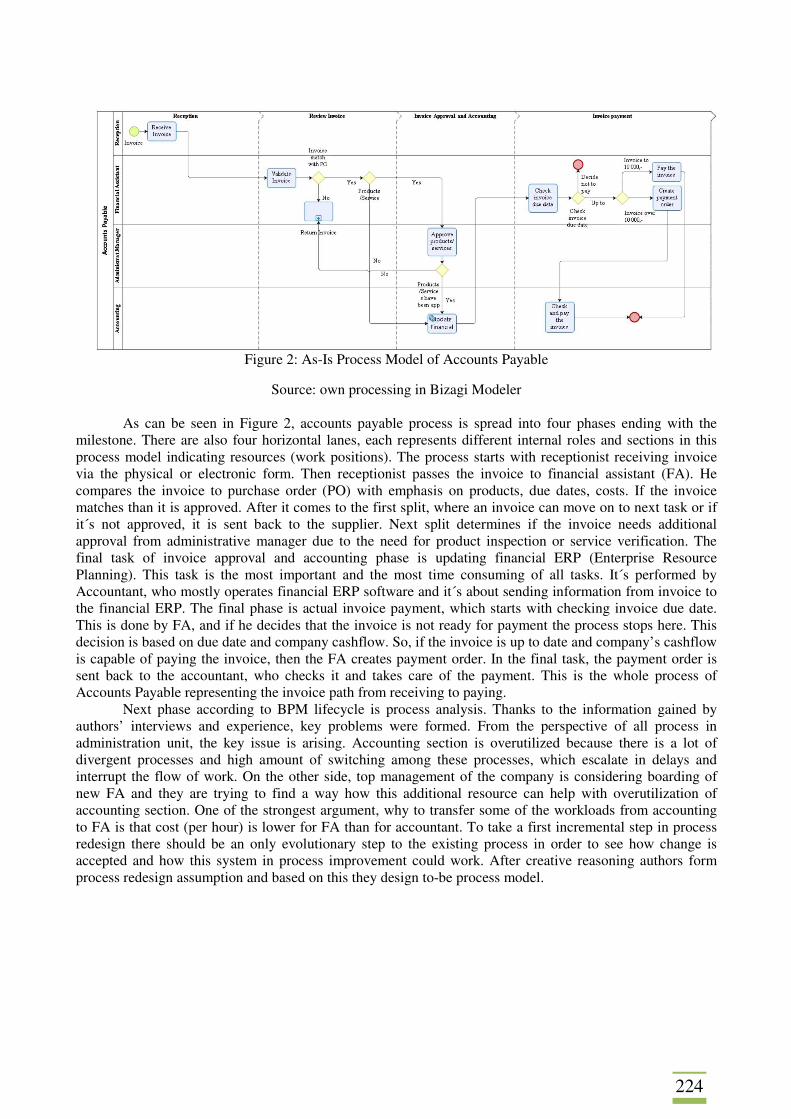
224
Figure 2: As-Is Process Model of Accounts Payable
Source: own processing in Bizagi Modeler
As can be seen in Figure 2, accounts payable process is spread into four phases ending with the milestone. There are also four horizontal lanes, each represents different internal roles and sections in this process model indicating resources (work positions). The process starts with receptionist receiving invoice via the physical or electronic form. Then receptionist passes the invoice to financial assistant (FA). He compares the invoice to purchase order (PO) with emphasis on products, due dates, costs. If the invoice matches than it is approved. After it comes to the first split, where an invoice can move on to next task or if it´s not approved, it is sent back to the supplier. Next split determines if the invoice needs additional approval from administrative manager due to the need for product inspection or service verification. The final task of invoice approval and accounting phase is updating financial ERP (Enterprise Resource Planning). This task is the most important and the most time consuming of all tasks. It´s performed by Accountant, who mostly operates financial ERP software and it´s about sending information from invoice to the financial ERP. The final phase is actual invoice payment, which starts with checking invoice due date. This is done by FA, and if he decides that the invoice is not ready for payment the process stops here. This decision is based on due date and company cashflow. So, if the invoice is up to date and company’s cashflow is capable of paying the invoice, then the FA creates payment order. In the final task, the payment order is sent back to the accountant, who checks it and takes care of the payment. This is the whole process of Accounts Payable representing the invoice path from receiving to paying.
Next phase according to BPM lifecycle is process analysis. Thanks to the information gained by authors’ interviews and experience, key problems were formed. From the perspective of all process in administration unit, the key issue is arising. Accounting section is overutilized because there is a lot of divergent processes and high amount of switching among these processes, which escalate in delays and interrupt the flow of work. On the other side, top management of the company is considering boarding of new FA and they are trying to find a way how this additional resource can help with overutilization of accounting section. One of the strongest argument, why to transfer some of the workloads from accounting to FA is that cost (per hour) is lower for FA than for accountant. To take a first incremental step in process redesign there should be an only evolutionary step to the existing process in order to see how change is accepted and how this system in process improvement could work. After creative reasoning authors form process redesign assumption and based on this they design to-be process model.
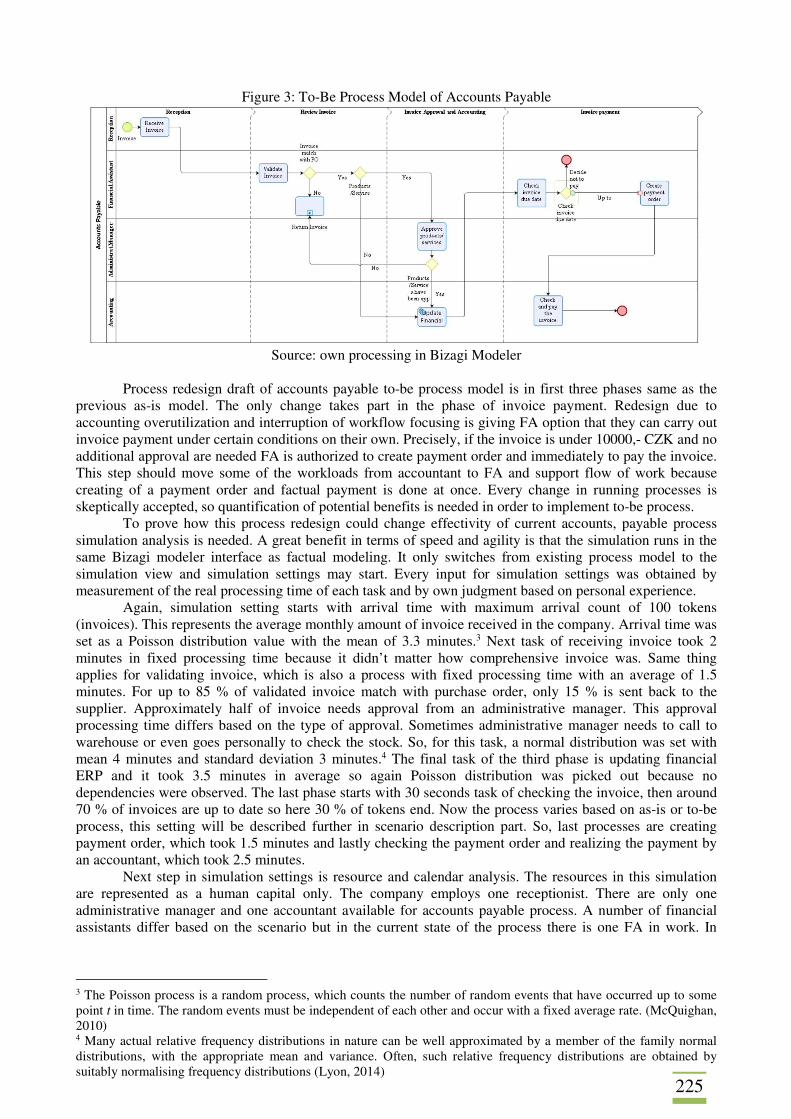
225
Figure 3: To-Be Process Model of Accounts Payable
Source: own processing in Bizagi Modeler
Process redesign draft of accounts payable to-be process model is in first three phases same as the
previous as-is model. The only change takes part in the phase of invoice payment. Redesign due to accounting overutilization and interruption of workflow focusing is giving FA option that they can carry out invoice payment under certain conditions on their own. Precisely, if the invoice is under 10000,- CZK and no additional approval are needed FA is authorized to create payment order and immediately to pay the invoice. This step should move some of the workloads from accountant to FA and support flow of work because creating of a payment order and factual payment is done at once. Every change in running processes is skeptically accepted, so quantification of potential benefits is needed in order to implement to-be process.
To prove how this process redesign could change effectivity of current accounts, payable process simulation analysis is needed. A great benefit in terms of speed and agility is that the simulation runs in the same Bizagi modeler interface as factual modeling. It only switches from existing process model to the simulation view and simulation settings may start. Every input for simulation settings was obtained by measurement of the real processing time of each task and by own judgment based on personal experience.
Again, simulation setting starts with arrival time with maximum arrival count of 100 tokens (invoices). This represents the average monthly amount of invoice received in the company. Arrival time was set as a Poisson distribution value with the mean of 3.3 minutes.3 Next task of receiving invoice took 2 minutes in fixed processing time because it didn’t matter how comprehensive invoice was. Same thing applies for validating invoice, which is also a process with fixed processing time with an average of 1.5 minutes. For up to 85 % of validated invoice match with purchase order, only 15 % is sent back to the supplier. Approximately half of invoice needs approval from an administrative manager. This approval processing time differs based on the type of approval. Sometimes administrative manager needs to call to warehouse or even goes personally to check the stock. So, for this task, a normal distribution was set with mean 4 minutes and standard deviation 3 minutes.4 The final task of the third phase is updating financial ERP and it took 3.5 minutes in average so again Poisson distribution was picked out because no dependencies were observed. The last phase starts with 30 seconds task of checking the invoice, then around 70 % of invoices are up to date so here 30 % of tokens end. Now the process varies based on as-is or to-be process, this setting will be described further in scenario description part. So, last processes are creating payment order, which took 1.5 minutes and lastly checking the payment order and realizing the payment by an accountant, which took 2.5 minutes.
Next step in simulation settings is resource and calendar analysis. The resources in this simulation are represented as a human capital only. The company employs one receptionist. There are only one administrative manager and one accountant available for accounts payable process. A number of financial assistants differ based on the scenario but in the current state of the process there is one FA in work. In
3 The Poisson process is a random process, which counts the number of random events that have occurred up to some point t in time. The random events must be independent of each other and occur with a fixed average rate. (McQuighan, 2010) 4 Many actual relative frequency distributions in nature can be well approximated by a member of the family normal distributions, with the appropriate mean and variance. Often, such relative frequency distributions are obtained by suitably normalising frequency distributions (Lyon, 2014)
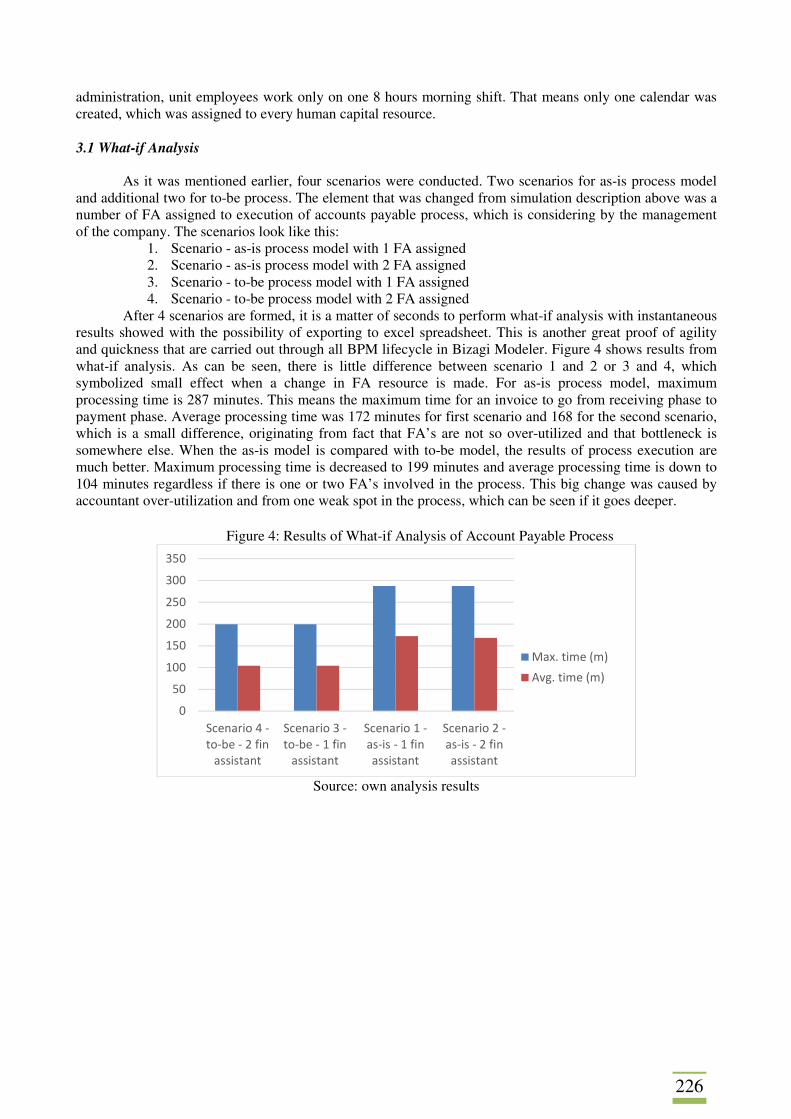
226
administration, unit employees work only on one 8 hours morning shift. That means only one calendar was created, which was assigned to every human capital resource.
3.1 What-if Analysis
As it was mentioned earlier, four scenarios were conducted. Two scenarios for as-is process model
and additional two for to-be process. The element that was changed from simulation description above was a number of FA assigned to execution of accounts payable process, which is considering by the management of the company. The scenarios look like this:
1. Scenario - as-is process model with 1 FA assigned 2. Scenario - as-is process model with 2 FA assigned 3. Scenario - to-be process model with 1 FA assigned 4. Scenario - to-be process model with 2 FA assigned
After 4 scenarios are formed, it is a matter of seconds to perform what-if analysis with instantaneous results showed with the possibility of exporting to excel spreadsheet. This is another great proof of agility and quickness that are carried out through all BPM lifecycle in Bizagi Modeler. Figure 4 shows results from what-if analysis. As can be seen, there is little difference between scenario 1 and 2 or 3 and 4, which symbolized small effect when a change in FA resource is made. For as-is process model, maximum processing time is 287 minutes. This means the maximum time for an invoice to go from receiving phase to payment phase. Average processing time was 172 minutes for first scenario and 168 for the second scenario, which is a small difference, originating from fact that FA’s are not so over-utilized and that bottleneck is somewhere else. When the as-is model is compared with to-be model, the results of process execution are much better. Maximum processing time is decreased to 199 minutes and average processing time is down to 104 minutes regardless if there is one or two FA’s involved in the process. This big change was caused by accountant over-utilization and from one weak spot in the process, which can be seen if it goes deeper.
Figure 4: Results of What-if Analysis of Account Payable Process
Source: own analysis results
0
50
100
150
200
250
300
350
Scenario 4 -
to-be - 2 fin
assistant
Scenario 3 -
to-be - 1 fin
assistant
Scenario 1 -
as-is - 1 fin
assistant
Scenario 2 -
as-is - 2 fin
assistant
Max. time (m)
Avg. time (m)
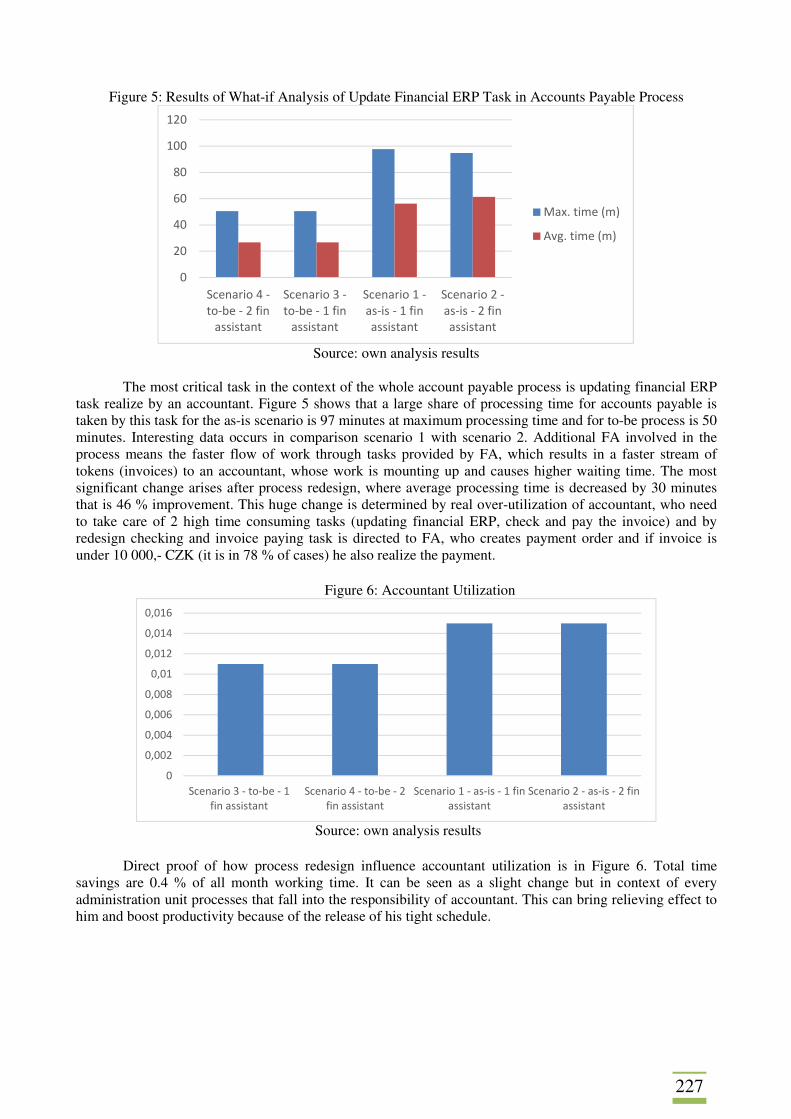
227
Figure 5: Results of What-if Analysis of Update Financial ERP Task in Accounts Payable Process
Source: own analysis results
The most critical task in the context of the whole account payable process is updating financial ERP
task realize by an accountant. Figure 5 shows that a large share of processing time for accounts payable is taken by this task for the as-is scenario is 97 minutes at maximum processing time and for to-be process is 50 minutes. Interesting data occurs in comparison scenario 1 with scenario 2. Additional FA involved in the process means the faster flow of work through tasks provided by FA, which results in a faster stream of tokens (invoices) to an accountant, whose work is mounting up and causes higher waiting time. The most significant change arises after process redesign, where average processing time is decreased by 30 minutes that is 46 % improvement. This huge change is determined by real over-utilization of accountant, who need to take care of 2 high time consuming tasks (updating financial ERP, check and pay the invoice) and by redesign checking and invoice paying task is directed to FA, who creates payment order and if invoice is under 10 000,- CZK (it is in 78 % of cases) he also realize the payment.
Figure 6: Accountant Utilization
Source: own analysis results
Direct proof of how process redesign influence accountant utilization is in Figure 6. Total time savings are 0.4 % of all month working time. It can be seen as a slight change but in context of every administration unit processes that fall into the responsibility of accountant. This can bring relieving effect to him and boost productivity because of the release of his tight schedule.
0
20
40
60
80
100
120
Scenario 4 -
to-be - 2 fin
assistant
Scenario 3 -
to-be - 1 fin
assistant
Scenario 1 -
as-is - 1 fin
assistant
Scenario 2 -
as-is - 2 fin
assistant
Max. time (m)
Avg. time (m)
0
0,002
0,004
0,006
0,008
0,01
0,012
0,014
0,016
Scenario 3 - to-be - 1
fin assistant
Scenario 4 - to-be - 2
fin assistant
Scenario 1 - as-is - 1 fin
assistant
Scenario 2 - as-is - 2 fin
assistant
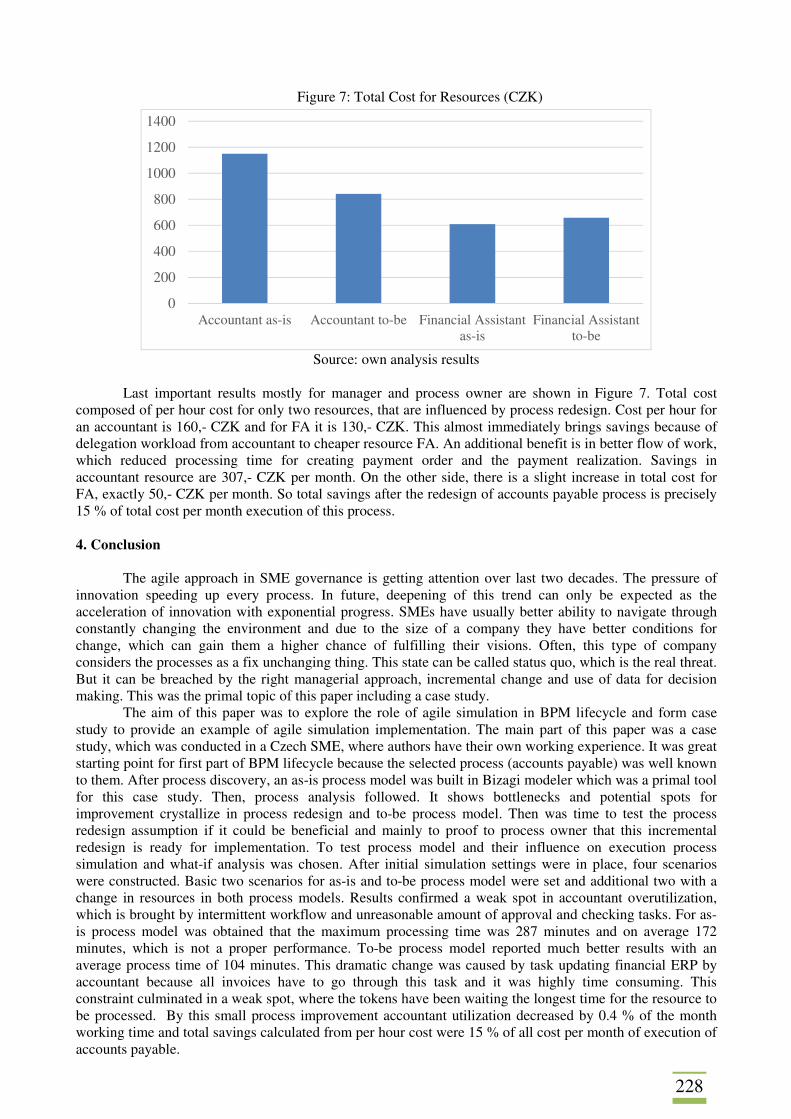
228
Figure 7: Total Cost for Resources (CZK)
Source: own analysis results
Last important results mostly for manager and process owner are shown in Figure 7. Total cost composed of per hour cost for only two resources, that are influenced by process redesign. Cost per hour for an accountant is 160,- CZK and for FA it is 130,- CZK. This almost immediately brings savings because of delegation workload from accountant to cheaper resource FA. An additional benefit is in better flow of work, which reduced processing time for creating payment order and the payment realization. Savings in accountant resource are 307,- CZK per month. On the other side, there is a slight increase in total cost for FA, exactly 50,- CZK per month. So total savings after the redesign of accounts payable process is precisely 15 % of total cost per month execution of this process. 4. Conclusion
The agile approach in SME governance is getting attention over last two decades. The pressure of innovation speeding up every process. In future, deepening of this trend can only be expected as the acceleration of innovation with exponential progress. SMEs have usually better ability to navigate through constantly changing the environment and due to the size of a company they have better conditions for change, which can gain them a higher chance of fulfilling their visions. Often, this type of company considers the processes as a fix unchanging thing. This state can be called status quo, which is the real threat. But it can be breached by the right managerial approach, incremental change and use of data for decision making. This was the primal topic of this paper including a case study.
The aim of this paper was to explore the role of agile simulation in BPM lifecycle and form case study to provide an example of agile simulation implementation. The main part of this paper was a case study, which was conducted in a Czech SME, where authors have their own working experience. It was great starting point for first part of BPM lifecycle because the selected process (accounts payable) was well known to them. After process discovery, an as-is process model was built in Bizagi modeler which was a primal tool for this case study. Then, process analysis followed. It shows bottlenecks and potential spots for improvement crystallize in process redesign and to-be process model. Then was time to test the process redesign assumption if it could be beneficial and mainly to proof to process owner that this incremental redesign is ready for implementation. To test process model and their influence on execution process simulation and what-if analysis was chosen. After initial simulation settings were in place, four scenarios were constructed. Basic two scenarios for as-is and to-be process model were set and additional two with a change in resources in both process models. Results confirmed a weak spot in accountant overutilization, which is brought by intermittent workflow and unreasonable amount of approval and checking tasks. For as-is process model was obtained that the maximum processing time was 287 minutes and on average 172 minutes, which is not a proper performance. To-be process model reported much better results with an average process time of 104 minutes. This dramatic change was caused by task updating financial ERP by accountant because all invoices have to go through this task and it was highly time consuming. This constraint culminated in a weak spot, where the tokens have been waiting the longest time for the resource to be processed. By this small process improvement accountant utilization decreased by 0.4 % of the month working time and total savings calculated from per hour cost were 15 % of all cost per month of execution of accounts payable.
0
200
400
600
800
1000
1200
1400
Accountant as-is Accountant to-be Financial Assistantas-is
Financial Assistantto-be
229
The approach described in this paper could be applied to various business processes in SMEs. The agility is caused by the selected tool. Bizagi Modeler meets agile requirements because in the same tool where process execution is carried out the process redesign and follow-up simulation supported with the what-if analysis could be done too. With a combination of user friendliness, compactness and cloud access agile process simulation could be implemented into a company with great results. We will concentrate on BPM implementation from a managerial perspective in our forthcoming research.
Acknowledgement
This paper was supported by the Student grant competition project SGS/19/2016: „Advanced mining methods and simulation techniques in business process domain“. References ADAM, S., DOERR, J. (2008). How to Better Align Bpm & Soa – Ideas on Improving the Transition between Process Design and Deployment. 9th Workshop on Business Process Modeling, Development and Support, Vol. 335. CHANG, J. F. (2016). Business Process Management Systems: Strategy and Implementation. CRC Press. DAVENPORT, T. (1990). The New Industrial Engineering: Information Technology And Business Process Redesign. Sloan Management Review, vol. 31, no. 4, pg. 11. DUMAS, M., ROSA, M. L., MENDLING, J., REIJERS, H. (2013). Fundamentals of Business Process Management. New York: Springer. FREY, B. F., OSBORNE, M. (2015). Technology at work: The Future of Innovation and Employment. [online]. Available from: http://www.oxfordmartin.ox.ac.uk/downloads/reports/Citi_GPS_Technology_Work.pdf GOLFARELLI, M., RIZZI, S., PROLI, A. (2006). Designing What-if Analysis: Towards a Methodology, Proceedings of the 9th ACM International Workshop on Data Warehousing and OLAP. ACM. pp. 51–58. HAMMER, M., CHAMPY, J. (1993). Reengineering the Corporation: A Manifesto for Business Revolution. Harper Business. JANSEN-VULLERS, M.H., NETJES, M. (2006). Business process simulation – a tool survey. In Workshop and Tutorial on Practical Use of Coloured Petri Nets and the CPN. Aarhus, Denmark, pp. 1-20. JESTON, J., NELIS, J. (2008). Business Process Management: Practical Guidelines to Successful Implementations. Amsterdam; Boston; London: Routledge. LYON, A. (2014). Why are Normal Distributions Normal? The British Journal for the Philosophy of Science. vol. 65 no. 3, pp. 621-649. MENDLING, J., WEIDLICH, M. (2012). Business Process Model and Notation. Berlin: Springer Heidelberg. MØLLER, C., MAACK, C. J., TAN, R. D. (2007). What is Business Process Management: A Two Stage Literature Review of an Emerging Field. Springer US. SAUNDERS, M. N. (2011). Research methods for business students, 5/e. Pearson Education India. SCHURTER, T., FINGAR, P. (2009). The Insiders’ Guide to BPM: 7 Steps to Process Mastery. Tampa, Fla.: Meghan-Kiffer Press. TEO, T., TAN, M. (1999). Spreadsheet development and ‘what-if’ analysis: quantitative versus qualitative errors. Accounting, Management and Information Technologies, vol. 9, no. 3, pp. 141-160.

230
YIN, R. K. (2013). Case Study Research: Design and Methods. London: SAGE Publications.
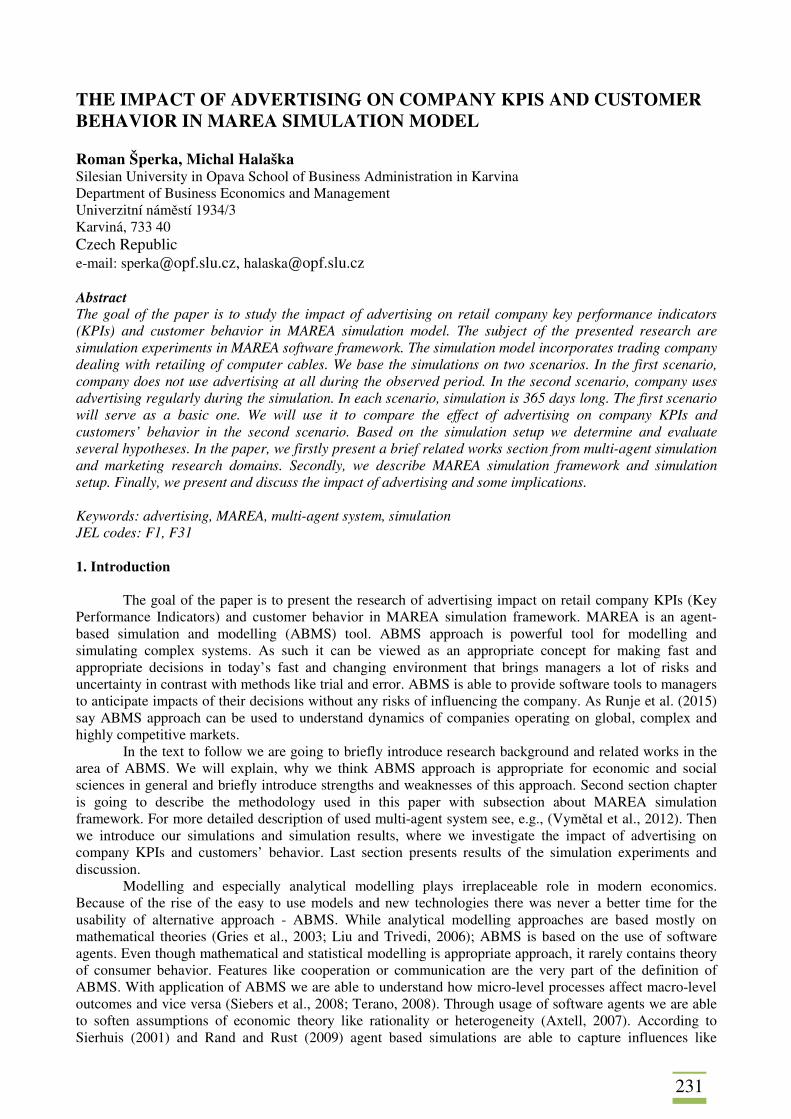
231
THE IMPACT OF ADVERTISING ON COMPANY KPIS AND CUSTOMER BEHAVIOR IN MAREA SIMULATION MODEL Roman Šperka, Michal Halaška Silesian University in Opava School of Business Administration in Karvina Department of Business Economics and Management Univerzitní náměstí 1934/3 Karviná, 733 40 Czech Republic e-mail: [email protected], [email protected] Abstract The goal of the paper is to study the impact of advertising on retail company key performance indicators (KPIs) and customer behavior in MAREA simulation model. The subject of the presented research are simulation experiments in MAREA software framework. The simulation model incorporates trading company dealing with retailing of computer cables. We base the simulations on two scenarios. In the first scenario, company does not use advertising at all during the observed period. In the second scenario, company uses advertising regularly during the simulation. In each scenario, simulation is 365 days long. The first scenario will serve as a basic one. We will use it to compare the effect of advertising on company KPIs and customers’ behavior in the second scenario. Based on the simulation setup we determine and evaluate several hypotheses. In the paper, we firstly present a brief related works section from multi-agent simulation and marketing research domains. Secondly, we describe MAREA simulation framework and simulation setup. Finally, we present and discuss the impact of advertising and some implications. Keywords: advertising, MAREA, multi-agent system, simulation JEL codes: F1, F31 1. Introduction
The goal of the paper is to present the research of advertising impact on retail company KPIs (Key Performance Indicators) and customer behavior in MAREA simulation framework. MAREA is an agent-based simulation and modelling (ABMS) tool. ABMS approach is powerful tool for modelling and simulating complex systems. As such it can be viewed as an appropriate concept for making fast and appropriate decisions in today’s fast and changing environment that brings managers a lot of risks and uncertainty in contrast with methods like trial and error. ABMS is able to provide software tools to managers to anticipate impacts of their decisions without any risks of influencing the company. As Runje et al. (2015) say ABMS approach can be used to understand dynamics of companies operating on global, complex and highly competitive markets.
In the text to follow we are going to briefly introduce research background and related works in the area of ABMS. We will explain, why we think ABMS approach is appropriate for economic and social sciences in general and briefly introduce strengths and weaknesses of this approach. Second section chapter is going to describe the methodology used in this paper with subsection about MAREA simulation framework. For more detailed description of used multi-agent system see, e.g., (Vymětal et al., 2012). Then we introduce our simulations and simulation results, where we investigate the impact of advertising on company KPIs and customers’ behavior. Last section presents results of the simulation experiments and discussion.
Modelling and especially analytical modelling plays irreplaceable role in modern economics. Because of the rise of the easy to use models and new technologies there was never a better time for the usability of alternative approach - ABMS. While analytical modelling approaches are based mostly on mathematical theories (Gries et al., 2003; Liu and Trivedi, 2006); ABMS is based on the use of software agents. Even though mathematical and statistical modelling is appropriate approach, it rarely contains theory of consumer behavior. Features like cooperation or communication are the very part of the definition of ABMS. With application of ABMS we are able to understand how micro-level processes affect macro-level outcomes and vice versa (Siebers et al., 2008; Terano, 2008). Through usage of software agents we are able to soften assumptions of economic theory like rationality or heterogeneity (Axtell, 2007). According to Sierhuis (2001) and Rand and Rust (2009) agent based simulations are able to capture influences like
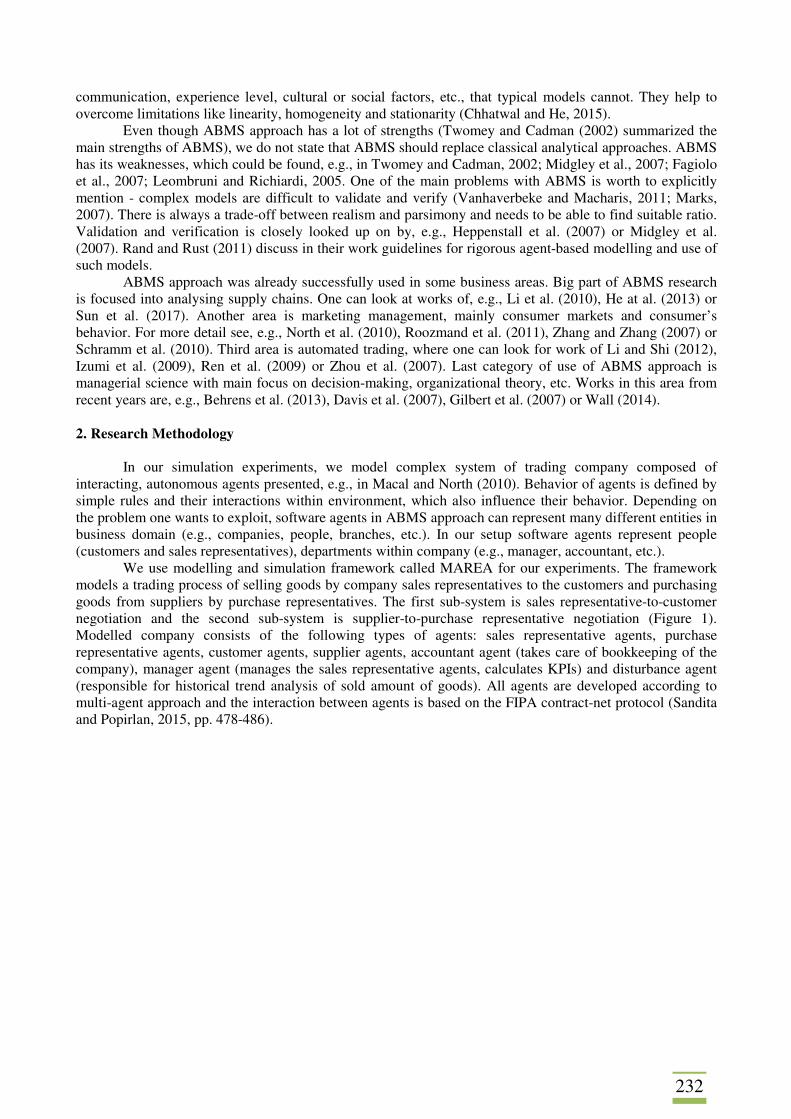
232
communication, experience level, cultural or social factors, etc., that typical models cannot. They help to overcome limitations like linearity, homogeneity and stationarity (Chhatwal and He, 2015).
Even though ABMS approach has a lot of strengths (Twomey and Cadman (2002) summarized the main strengths of ABMS), we do not state that ABMS should replace classical analytical approaches. ABMS has its weaknesses, which could be found, e.g., in Twomey and Cadman, 2002; Midgley et al., 2007; Fagiolo et al., 2007; Leombruni and Richiardi, 2005. One of the main problems with ABMS is worth to explicitly mention - complex models are difficult to validate and verify (Vanhaverbeke and Macharis, 2011; Marks, 2007). There is always a trade-off between realism and parsimony and needs to be able to find suitable ratio. Validation and verification is closely looked up on by, e.g., Heppenstall et al. (2007) or Midgley et al. (2007). Rand and Rust (2011) discuss in their work guidelines for rigorous agent-based modelling and use of such models.
ABMS approach was already successfully used in some business areas. Big part of ABMS research is focused into analysing supply chains. One can look at works of, e.g., Li et al. (2010), He at al. (2013) or Sun et al. (2017). Another area is marketing management, mainly consumer markets and consumer’s behavior. For more detail see, e.g., North et al. (2010), Roozmand et al. (2011), Zhang and Zhang (2007) or Schramm et al. (2010). Third area is automated trading, where one can look for work of Li and Shi (2012), Izumi et al. (2009), Ren et al. (2009) or Zhou et al. (2007). Last category of use of ABMS approach is managerial science with main focus on decision-making, organizational theory, etc. Works in this area from recent years are, e.g., Behrens et al. (2013), Davis et al. (2007), Gilbert et al. (2007) or Wall (2014). 2. Research Methodology
In our simulation experiments, we model complex system of trading company composed of
interacting, autonomous agents presented, e.g., in Macal and North (2010). Behavior of agents is defined by simple rules and their interactions within environment, which also influence their behavior. Depending on the problem one wants to exploit, software agents in ABMS approach can represent many different entities in business domain (e.g., companies, people, branches, etc.). In our setup software agents represent people (customers and sales representatives), departments within company (e.g., manager, accountant, etc.).
We use modelling and simulation framework called MAREA for our experiments. The framework models a trading process of selling goods by company sales representatives to the customers and purchasing goods from suppliers by purchase representatives. The first sub-system is sales representative-to-customer negotiation and the second sub-system is supplier-to-purchase representative negotiation (Figure 1). Modelled company consists of the following types of agents: sales representative agents, purchase representative agents, customer agents, supplier agents, accountant agent (takes care of bookkeeping of the company), manager agent (manages the sales representative agents, calculates KPIs) and disturbance agent (responsible for historical trend analysis of sold amount of goods). All agents are developed according to multi-agent approach and the interaction between agents is based on the FIPA contract-net protocol (Sandita and Popirlan, 2015, pp. 478-486).
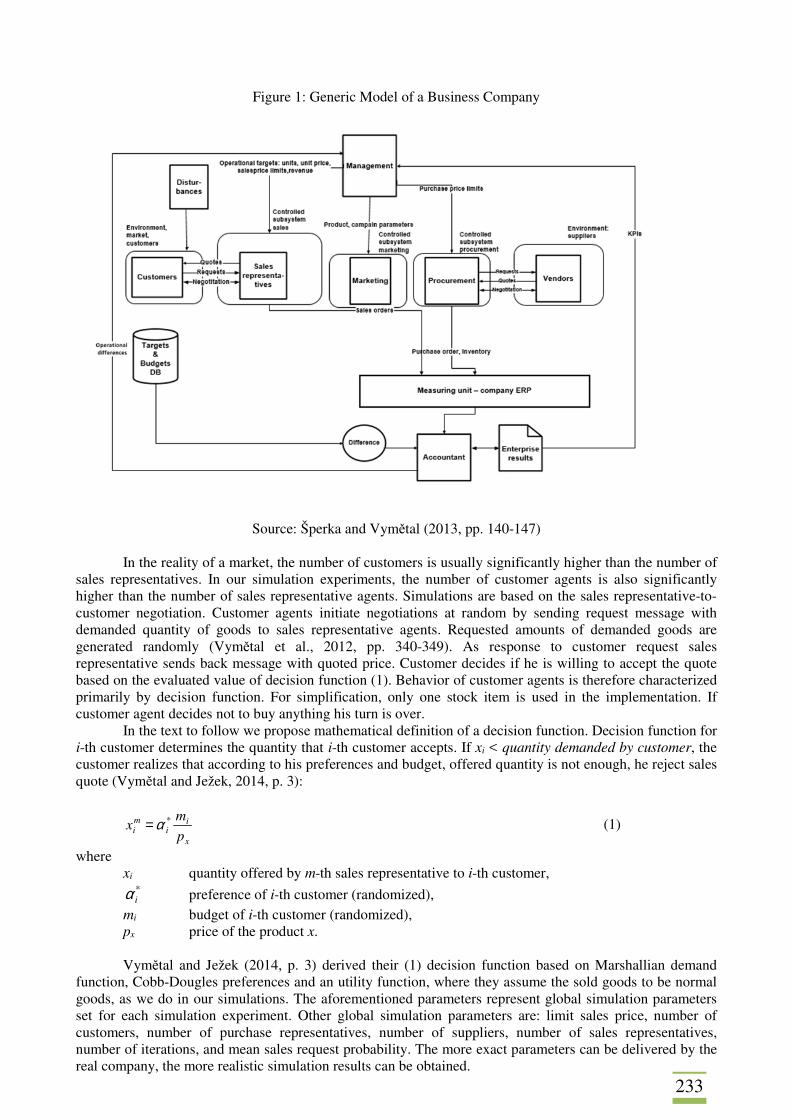
233
Figure 1: Generic Model of a Business Company
Source: Šperka and Vymětal (2013, pp. 140-147)
In the reality of a market, the number of customers is usually significantly higher than the number of
sales representatives. In our simulation experiments, the number of customer agents is also significantly higher than the number of sales representative agents. Simulations are based on the sales representative-to-customer negotiation. Customer agents initiate negotiations at random by sending request message with demanded quantity of goods to sales representative agents. Requested amounts of demanded goods are generated randomly (Vymětal et al., 2012, pp. 340-349). As response to customer request sales representative sends back message with quoted price. Customer decides if he is willing to accept the quote based on the evaluated value of decision function (1). Behavior of customer agents is therefore characterized primarily by decision function. For simplification, only one stock item is used in the implementation. If customer agent decides not to buy anything his turn is over.
In the text to follow we propose mathematical definition of a decision function. Decision function for i-th customer determines the quantity that i-th customer accepts. If xi < quantity demanded by customer, the customer realizes that according to his preferences and budget, offered quantity is not enough, he reject sales quote (Vymětal and Ježek, 2014, p. 3):
x
ii
mi p
mx *α= (1)
where xi quantity offered by m-th sales representative to i-th customer,
*iα preference of i-th customer (randomized),
mi budget of i-th customer (randomized), px price of the product x. Vymětal and Ježek (2014, p. 3) derived their (1) decision function based on Marshallian demand
function, Cobb-Dougles preferences and an utility function, where they assume the sold goods to be normal goods, as we do in our simulations. The aforementioned parameters represent global simulation parameters set for each simulation experiment. Other global simulation parameters are: limit sales price, number of customers, number of purchase representatives, number of suppliers, number of sales representatives, number of iterations, and mean sales request probability. The more exact parameters can be delivered by the real company, the more realistic simulation results can be obtained.
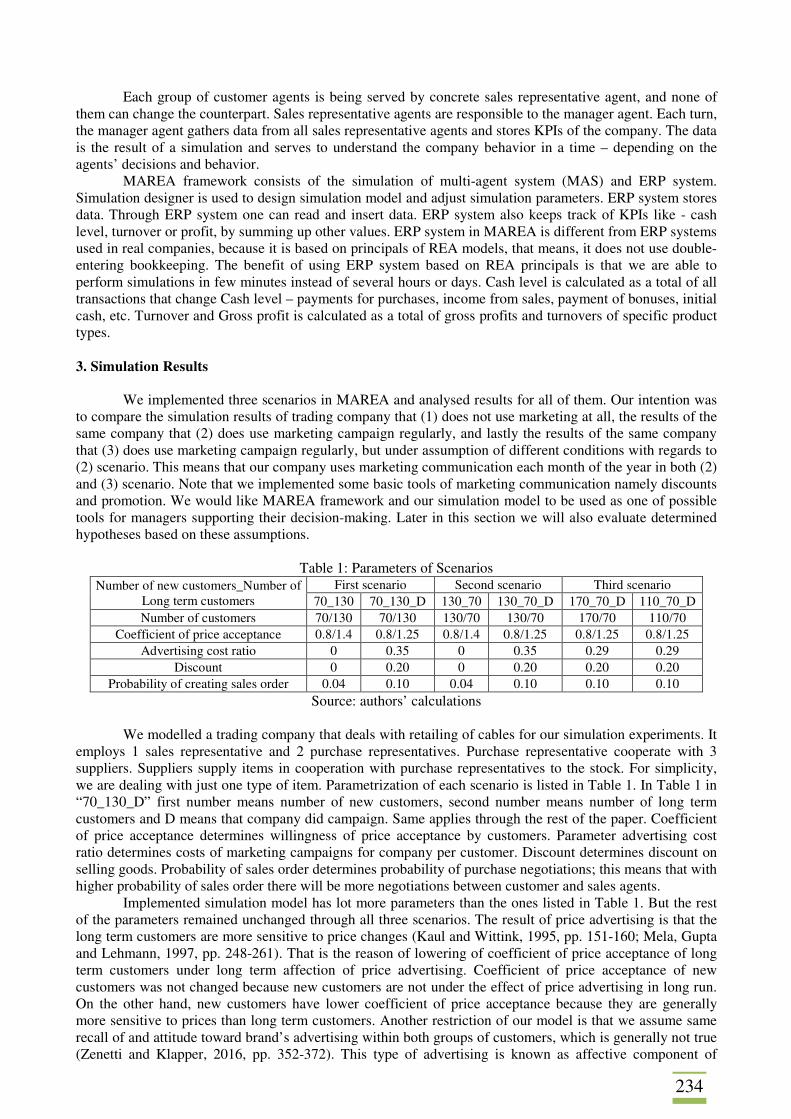
234
Each group of customer agents is being served by concrete sales representative agent, and none of them can change the counterpart. Sales representative agents are responsible to the manager agent. Each turn, the manager agent gathers data from all sales representative agents and stores KPIs of the company. The data is the result of a simulation and serves to understand the company behavior in a time – depending on the agents’ decisions and behavior.
MAREA framework consists of the simulation of multi-agent system (MAS) and ERP system. Simulation designer is used to design simulation model and adjust simulation parameters. ERP system stores data. Through ERP system one can read and insert data. ERP system also keeps track of KPIs like - cash level, turnover or profit, by summing up other values. ERP system in MAREA is different from ERP systems used in real companies, because it is based on principals of REA models, that means, it does not use double-entering bookkeeping. The benefit of using ERP system based on REA principals is that we are able to perform simulations in few minutes instead of several hours or days. Cash level is calculated as a total of all transactions that change Cash level – payments for purchases, income from sales, payment of bonuses, initial cash, etc. Turnover and Gross profit is calculated as a total of gross profits and turnovers of specific product types.
3. Simulation Results
We implemented three scenarios in MAREA and analysed results for all of them. Our intention was
to compare the simulation results of trading company that (1) does not use marketing at all, the results of the same company that (2) does use marketing campaign regularly, and lastly the results of the same company that (3) does use marketing campaign regularly, but under assumption of different conditions with regards to (2) scenario. This means that our company uses marketing communication each month of the year in both (2) and (3) scenario. Note that we implemented some basic tools of marketing communication namely discounts and promotion. We would like MAREA framework and our simulation model to be used as one of possible tools for managers supporting their decision-making. Later in this section we will also evaluate determined hypotheses based on these assumptions.
Table 1: Parameters of Scenarios
Number of new customers_Number of Long term customers
First scenario Second scenario Third scenario 70_130 70_130_D 130_70 130_70_D 170_70_D 110_70_D
Number of customers 70/130 70/130 130/70 130/70 170/70 110/70 Coefficient of price acceptance 0.8/1.4 0.8/1.25 0.8/1.4 0.8/1.25 0.8/1.25 0.8/1.25
Advertising cost ratio 0 0.35 0 0.35 0.29 0.29 Discount 0 0.20 0 0.20 0.20 0.20
Probability of creating sales order 0.04 0.10 0.04 0.10 0.10 0.10 Source: authors’ calculations
We modelled a trading company that deals with retailing of cables for our simulation experiments. It
employs 1 sales representative and 2 purchase representatives. Purchase representative cooperate with 3 suppliers. Suppliers supply items in cooperation with purchase representatives to the stock. For simplicity, we are dealing with just one type of item. Parametrization of each scenario is listed in Table 1. In Table 1 in “70_130_D” first number means number of new customers, second number means number of long term customers and D means that company did campaign. Same applies through the rest of the paper. Coefficient of price acceptance determines willingness of price acceptance by customers. Parameter advertising cost ratio determines costs of marketing campaigns for company per customer. Discount determines discount on selling goods. Probability of sales order determines probability of purchase negotiations; this means that with higher probability of sales order there will be more negotiations between customer and sales agents.
Implemented simulation model has lot more parameters than the ones listed in Table 1. But the rest of the parameters remained unchanged through all three scenarios. The result of price advertising is that the long term customers are more sensitive to price changes (Kaul and Wittink, 1995, pp. 151-160; Mela, Gupta and Lehmann, 1997, pp. 248-261). That is the reason of lowering of coefficient of price acceptance of long term customers under long term affection of price advertising. Coefficient of price acceptance of new customers was not changed because new customers are not under the effect of price advertising in long run. On the other hand, new customers have lower coefficient of price acceptance because they are generally more sensitive to prices than long term customers. Another restriction of our model is that we assume same recall of and attitude toward brand’s advertising within both groups of customers, which is generally not true (Zenetti and Klapper, 2016, pp. 352-372). This type of advertising is known as affective component of
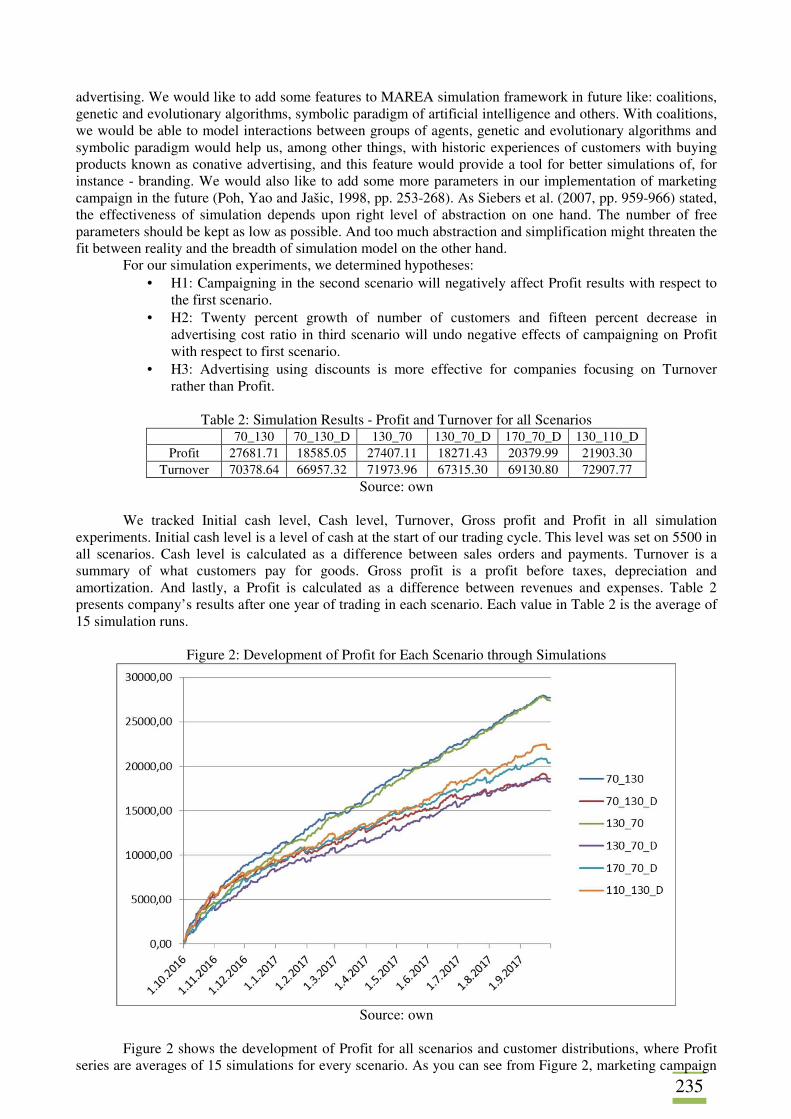
235
advertising. We would like to add some features to MAREA simulation framework in future like: coalitions, genetic and evolutionary algorithms, symbolic paradigm of artificial intelligence and others. With coalitions, we would be able to model interactions between groups of agents, genetic and evolutionary algorithms and symbolic paradigm would help us, among other things, with historic experiences of customers with buying products known as conative advertising, and this feature would provide a tool for better simulations of, for instance - branding. We would also like to add some more parameters in our implementation of marketing campaign in the future (Poh, Yao and Jašic, 1998, pp. 253-268). As Siebers et al. (2007, pp. 959-966) stated, the effectiveness of simulation depends upon right level of abstraction on one hand. The number of free parameters should be kept as low as possible. And too much abstraction and simplification might threaten the fit between reality and the breadth of simulation model on the other hand.
For our simulation experiments, we determined hypotheses: • H1: Campaigning in the second scenario will negatively affect Profit results with respect to
the first scenario. • H2: Twenty percent growth of number of customers and fifteen percent decrease in
advertising cost ratio in third scenario will undo negative effects of campaigning on Profit with respect to first scenario.
• H3: Advertising using discounts is more effective for companies focusing on Turnover rather than Profit.
Table 2: Simulation Results - Profit and Turnover for all Scenarios
70_130 70_130_D 130_70 130_70_D 170_70_D 130_110_D
Profit 27681.71 18585.05 27407.11 18271.43 20379.99 21903.30 Turnover 70378.64 66957.32 71973.96 67315.30 69130.80 72907.77
Source: own
We tracked Initial cash level, Cash level, Turnover, Gross profit and Profit in all simulation experiments. Initial cash level is a level of cash at the start of our trading cycle. This level was set on 5500 in all scenarios. Cash level is calculated as a difference between sales orders and payments. Turnover is a summary of what customers pay for goods. Gross profit is a profit before taxes, depreciation and amortization. And lastly, a Profit is calculated as a difference between revenues and expenses. Table 2 presents company’s results after one year of trading in each scenario. Each value in Table 2 is the average of 15 simulation runs.
Figure 2: Development of Profit for Each Scenario through Simulations
Source: own
Figure 2 shows the development of Profit for all scenarios and customer distributions, where Profit
series are averages of 15 simulations for every scenario. As you can see from Figure 2, marketing campaign
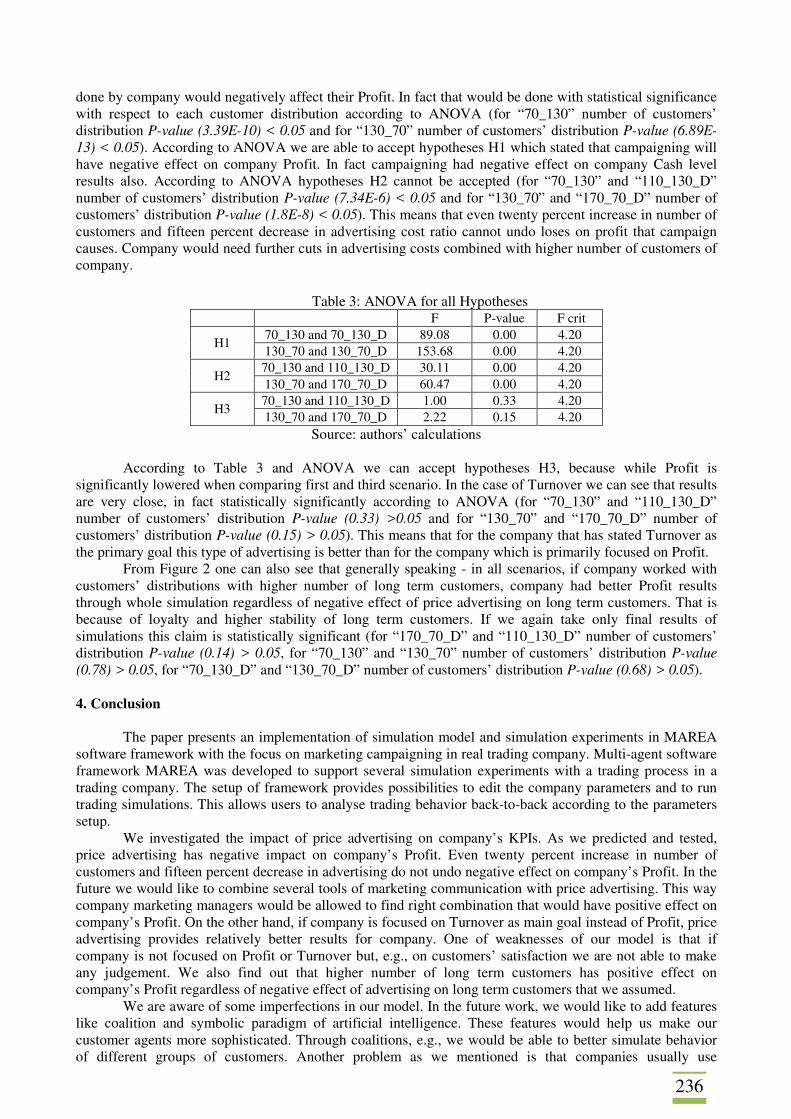
236
done by company would negatively affect their Profit. In fact that would be done with statistical significance with respect to each customer distribution according to ANOVA (for “70_130” number of customers’ distribution P-value (3.39E-10) < 0.05 and for “130_70” number of customers’ distribution P-value (6.89E-13) < 0.05). According to ANOVA we are able to accept hypotheses H1 which stated that campaigning will have negative effect on company Profit. In fact campaigning had negative effect on company Cash level results also. According to ANOVA hypotheses H2 cannot be accepted (for “70_130” and “110_130_D” number of customers’ distribution P-value (7.34E-6) < 0.05 and for “130_70” and “170_70_D” number of customers’ distribution P-value (1.8E-8) < 0.05). This means that even twenty percent increase in number of customers and fifteen percent decrease in advertising cost ratio cannot undo loses on profit that campaign causes. Company would need further cuts in advertising costs combined with higher number of customers of company.
Table 3: ANOVA for all Hypotheses F P-value F crit
H1 70_130 and 70_130_D 89.08 0.00 4.20 130_70 and 130_70_D 153.68 0.00 4.20
H2 70_130 and 110_130_D 30.11 0.00 4.20 130_70 and 170_70_D 60.47 0.00 4.20
H3 70_130 and 110_130_D 1.00 0.33 4.20 130_70 and 170_70_D 2.22 0.15 4.20
Source: authors’ calculations According to Table 3 and ANOVA we can accept hypotheses H3, because while Profit is
significantly lowered when comparing first and third scenario. In the case of Turnover we can see that results are very close, in fact statistically significantly according to ANOVA (for “70_130” and “110_130_D” number of customers’ distribution P-value (0.33) >0.05 and for “130_70” and “170_70_D” number of customers’ distribution P-value (0.15) > 0.05). This means that for the company that has stated Turnover as the primary goal this type of advertising is better than for the company which is primarily focused on Profit.
From Figure 2 one can also see that generally speaking - in all scenarios, if company worked with customers’ distributions with higher number of long term customers, company had better Profit results through whole simulation regardless of negative effect of price advertising on long term customers. That is because of loyalty and higher stability of long term customers. If we again take only final results of simulations this claim is statistically significant (for “170_70_D” and “110_130_D” number of customers’ distribution P-value (0.14) > 0.05, for “70_130” and “130_70” number of customers’ distribution P-value (0.78) > 0.05, for “70_130_D” and “130_70_D” number of customers’ distribution P-value (0.68) > 0.05).
4. Conclusion
The paper presents an implementation of simulation model and simulation experiments in MAREA
software framework with the focus on marketing campaigning in real trading company. Multi-agent software framework MAREA was developed to support several simulation experiments with a trading process in a trading company. The setup of framework provides possibilities to edit the company parameters and to run trading simulations. This allows users to analyse trading behavior back-to-back according to the parameters setup.
We investigated the impact of price advertising on company’s KPIs. As we predicted and tested, price advertising has negative impact on company’s Profit. Even twenty percent increase in number of customers and fifteen percent decrease in advertising do not undo negative effect on company’s Profit. In the future we would like to combine several tools of marketing communication with price advertising. This way company marketing managers would be allowed to find right combination that would have positive effect on company’s Profit. On the other hand, if company is focused on Turnover as main goal instead of Profit, price advertising provides relatively better results for company. One of weaknesses of our model is that if company is not focused on Profit or Turnover but, e.g., on customers’ satisfaction we are not able to make any judgement. We also find out that higher number of long term customers has positive effect on company’s Profit regardless of negative effect of advertising on long term customers that we assumed.
We are aware of some imperfections in our model. In the future work, we would like to add features like coalition and symbolic paradigm of artificial intelligence. These features would help us make our customer agents more sophisticated. Through coalitions, e.g., we would be able to better simulate behavior of different groups of customers. Another problem as we mentioned is that companies usually use

237
combination of several marketing communication tools. Thus in the future we would like to incorporate combination of several marketing communication tools. We also considered only negative effect of price advertising on long term customers. In the future, we would like to simulate trading with more items in the future, for more realistic simulations.
Acknowledgement
The work was supported by SGS/19/2016 project of Silesian University in Opava, Czechia titled
“Advanced mining methods and simulation techniques in business process domain”.
References
AXTELL, R. L. (2007). What economic agents do: How cognition and interaction lead to emergence and complexity. The Review of Austrian Economics, vol. 20, no. 2–3, pp. 105–122. BEHRENS, D. A., BERLINGER, S., WALL, F. (2013). Phrasing and Timing Information Dissemination in Organizations: Results of an Agent-Based Simulation. Lecture Notes in Economics and Mathematical Systems Artificial Economics and Self Organization, vol. 669, pp. 179-190. CHHATWAL, J., HE, T. (2015). Economic Evaluations with Agent-Based Modelling: An Introduction. PharmacoEconomics, vol. 33, no. 5, pp. 423–433. DAVIS, J. P., EISENHARDT, K. M., BINGHAM, C. B. (2007). Developing Theory Through Simulation Methods. Academy of Management Review, vol. 32, no. 2, pp. 480–499. FAGIOLO, G., BIRCHENHALL, C., WINDRUM, P. (2007). Empirical Validation in Agent-based Models: Introduction to the Special Issue. Computational Economics, vol. 30, no. 3, pp. 189–194. GILBERT, N., AHRWEILER, P., PYKA, A. (2007). Learning in innovation networks: Some simulation experiments. Physica A: Statistical Mechanics and Its Applications, vol. 378, no. 1, 100–109. GRIES, M., KULKARNI CH., SAUER, CH., KEUTZER, K. (2011). Comparing Analytical Modeling with Simulation for Network Processors: A Case Study. [online]. Available from: https://pdfs.semanticscholar.org/83a4/bc3623b74c360512224cb8227bb1dbfd3d51.pdf. HE, Z., WANG, S., CHENG, T. C. E. (2013). Competition and evolution in multi-product supply chains: An agent-based retailer model. International Journal of Production Economics, vol. 146, no. 1, pp. 325–336. HEPPENSTALL, A. J., EVANS, A. J., BIRKIN, M. H. (2007). Genetic Algorithm Optimisation of An Agent-Based Model for Simulating a Retail Market. Environment and Planning B: Planning and Design, vol. 34, no. 6, pp. 1051–1070. IZUMI, K., TORIUMI, F., MATSUI, H. (2009). Evaluation of automated-trading strategies using an artificial market. Neurocomputing, vol. 72, no. 16–18, pp. 3469–3476. KAUL, A., WITTINK, D. R. (1995). Empirical Generalizations About the Impact of Advertising on Price Sensitivity and Price. Marketing Science, vol. 14, no. 3, pp. 151-160. LEOMBRUNI, R., RICHIARDI, M. (2005). Why are economists sceptical about agent-based simulations?. Physica A: Statistical Mechanics and Its Applications, vol. 355, no. 1, pp. 103–109. LI, G., SHI, J. (2012). Agent-based modeling for trading wind power with uncertainty in the day-ahead wholesale electricity markets of single-sided auctions. Applied Energy, vol. 99, pp. 13–22. LI, J., SHENG, Z., LIU, H. (2010). Multi-agent simulation for the dominant players’ behavior in supply chains. Simulation Modelling Practice and Theory, vol. 18, no. 6, pp. 850–859. LIU, Y., TRIVEDI, K. S. (2006). Survivability Quantification: The Analytical Modeling Approach. [online]. Available from: http://people.ee.duke.edu/ ~kst/surv/IoJP.pdf.

238
MACAL, C. M., & NORTH, M. J. (2010). Tutorial on agent-based modelling and simulation. Journal of Simulation, vol. 4, no. 3, pp. 151–162. MARKS, R. E. (2007). Validating Simulation Models: A General Framework and Four Applied Examples. Computational Economics, vol. 30, no. 3, pp. 265–290. MELA, C. F., GUPTA, S, LEHMANN, D. R. (1997). The Long-Term Impact of Promotion and Advertising on Consumer Brand Choice. Journal of Marketing Research, vol. 34, no. 2, pp. 248–261. MIDGLEY, D., MARKS, R., KUNCHAMWAR, D. (2007). Building and assurance of agent-based models: An example and challenge to the field. Journal of Business Research, vol. 60, no. 8, pp. 884–893. NORTH, M. J., MACAL, C. M., AUBIN, J. S., THIMMAPURAM, P., BRAGEN, M., HAHN, J., HAMPTON, D. (2010). Multiscale agent-based consumer market modeling. Complexity, vol. 15, no. 5, pp. 37–47. POH, H.-L., YAO, J., JAŠIC, T. (1998). Neural networks for the analysis and forecasting of advertising and promotion impact. International Journal of Intelligent Systems in Accounting, Finance and Management, vol. 7, no. 4, pp. 253–268. RAND, W., RUST, R. T. (2011). Agent-based modeling in marketing: Guidelines for rigor. International Journal of Research in Marketing, vol. 28, no. 3, pp. 181–193. REN, F., ZHANG, M., SIM, K. M. (2009). Adaptive conceding strategies for automated trading agents in dynamic, open markets. Decision Support Systems, vol. 46, no. 3, pp. 704–716. ROOZMAND, O., GHASEM-AGHAEE, N., HOFSTEDE, G. J., NEMATBAKHSH, M. A., BARAANI, A., VERWAART, T. (2011). Agent-based modeling of consumer decision making process based on power distance and personality. Knowledge-Based Systems, vol. 24, no. 7, pp. 1075-1095. RUNJE, B., KRSTIĆ VUKELJA, E., STEPANIĆ, J. (2015). Agent-based simulation of measuring the quality of services. Technical Gazette, vol. 22, no. 6, pp. 1561–1566. SANDITA, A. V., POPIRLAN, C. I. (2015). Developing A Multi-Agent System in JADE for Information Management in Educational Competence Domains. Procedia Economics and Finance, vol. 23, pp. 478–486. SCHRAMM, M. E., TRAINOR, K. J., SHANKER, M., HU, M. Y. (2010). An agent-based diffusion model with consumer and brand agents. Decision Support Systems, vol. 50, no. 1, pp. 234–242. SIEBERS, P., AICKELIN, U., CELIA, H., CLEGG, C. (2008). A Multi-Agent Simulation of Retail Management Practices. SSRN Electronic Journal, pp. 1-8. SIERHUIS, M. (2001). Modeling and simulating work practice. Ph.D. thesis, University of Amsterdam. ŠPERKA, R., VYMĚTAL, D. (2013). MAREA - an Education Application for Trading Company Simulation based on REA Principles. Advances in Education Research, vol. 30, pp. 140-147. SUN, J., TANG, J., FU, W., WU, B. (2017). Hybrid modeling and empirical analysis of automobile supply chain network. Physica A: Statistical Mechanics and Its Applications, vol. 473, pp. 377–389. TERANO, T. (2008). Beyond the KISS Principle for Agent-Based Social Simulation. Journal of Socio-Informatics, vol. 1, no 1, pp. 175–187. TWOMEY, P., CADMAN, R. (2002). Agent-based modelling of customer behaviour in the telecoms and media markets. Info, vol. 4, no. 1, pp. 56–63. VANHAVERBEKE, L., MACHARIS, C. (2011). An agent-based model of consumer mobility in a retail environment. Procedia - Social and Behavioral Sciences, vol. 20, pp. 186–196.

239
VYMĚTAL, D., JEŽEK, F. (2014). Demand function and its role in a business simulator. Munich Personal RePEc Archive, no. 54716, pp. 1-8. VYMĚTAL, D., SPIŠÁK, M., ŠPERKA, R. (2012). An Influence of Random Number Generation Function to Multiagent Systems, JEZIC, G., KUSEK, M., NGUYEN, NT., HOWLETT, R. J., JAIN, L. C. (eds), Agent and Multi-Agent Systems. Technologies and Applications, Berlin: Springer, pp. 340-349. WALL, F. (2014). Agent-based modeling in managerial science: an illustrative survey and study. Review of Managerial Science, vol. 10, no. 1, pp. 135–193. ZENETTI, G., KLAPPER, D. (2016). Advertising Effects Under Consumer Heterogeneity – The Moderating Role of Brand Experience, Advertising Recall and Attitude. Journal of Retailing, vol. 92, no. 3, 352-372. ZHANG, T., ZHANG, D. (2007). Agent-based simulation of consumer purchase decision-making and the decoy effect. Journal of Business Research, vol. 60, no. 8, pp. 912–922. ZHOU, Z., CHAN, W. K., CHOW, J. H. (2007). Agent-based simulation of electricity markets: a survey of tools. Artificial Intelligence Review, vol. 28, no. 4, 305–342.
240
MARKETING COMMUNICATION IN AN ONLINE ENVIRONMENT IN B2B MARKETS Filip Štroch School of Business Administration in Karvina Department of Business Economics and Management Univerzitni namesti 1934/3 733 40 Karvina Czech Republic e-mail: [email protected] Abstract
The growing importance of the internet to B2B customer purchasing decisions has motivated B2B sellers to create digital content that leads potential buyers to interact with their company. The active role played by customers in finding and evaluating information on the internet has given rise to a new marketing paradigm, which is referred to as content (digital) marketing. Several major methodologies of content marketing were introduced to enrich the understanding of B2B customers buying behavior. The aim of the article is to document the development of content marketing and potential barriers of its implementation in B2B settings. Based on these findings and insights from practice of B2B companies a communication model will be created to advance understanding of the organizational processes within B2B companies, especially between marketing and sales departments and will be used for future research. Keywords: B2B, Digital marketing, Marketing automation, Marketing and sales alignment, New technology JEL codes: M10, M31 1. Introduction
The growing influence of digital tools has seen a significant shift in the B2B segments purchasing behavior (Lingqvist, et al., 2015). According to Adamson et al. (2012) recent study of more than 1,400 customers in the B2B segment has revealed that buyers rely heavily on information resources available on the internet to complete the buying process by almost 60% before contacting the retailer.
This active role played by buyers in searching for and evaluating information on the Internet has given rise to a new marketing paradigm, which is referred to as content marketing. According to Holliman and Rowley (2014) argues that B2B digital content marketing involves creating, distributing and sharing time-relevant content to engage and reach customers at a suitable point in their purchasing decisions to encourage them to complete their purchase.
Pulizzi and Handley (2014) presented a study from which more than 86% of B2B marketers (n = 1820) use content marketing tactics as a strategic marketing approach and 47% of them have a dedicated organization for their needs . Academic research on this topic is at its early stages. According to Solis (2013) we are dealing with a situation in which technology and society are developing faster than companies’ ability to adapt to new conditions. This phenomenon is collectively referred to as digital darwinism. This inability to adapt new processes to marketing business management gives rise to a number of misunderstandings that are common, for example, between eternal rivals - the marketing and sales department. However, a recent case study by Järvinen and Taiminen (2016) suggests that the use of content marketing methods, along with marketing automation tools, can prevent these misunderstandings and clarify the clear role of marketing in corporate markets that is so difficult to justify before organizational management.
Wiersema (2013) argues that by integrating marketing and sales systems, marketing teams can gain a deeper insight into customer data in Customer Relationship Management (CRM) and sales teams can then learn more about marketing activities. While content marketing and marketing automation offer promising opportunities to address a number of issues in marketing management in B2B markets, very little is known about how B2B companies are able to adopt these tools in their processes.
The aim of this article is to document the development of content marketing and its impact on buyer preferences in B2B settings. The study advances understanding of the organizational processes of B2B companies and provides insights in creating marketing and sales communication model which should be used for future research.
241
2. Marketing Communication in an Online Environment on B2B Markets
The growing importance of the Internet for B2B customer buying decisions motivates vendors to create digital content that leads to potential customer contacts. This trend is currently referred to as content marketing. Although creative content has been a part of marketing ever since (in the form of posters, radio or TV commercials), in today's context of marketing communications in an online environment, content marketing, according to Vajre (2016), is a tool for distributing time and context-relevant information that leads to real-time interaction between vendor and customer. 2.1 Content Marketing Tools
According to Halligan and Shah (2014), digital marketing channels such as social networks, blogs, websites and customer relationship management systems are used to such extent, in a last 10 years, that numerous types of methodologies have been developed to share and distribute content reflecting the different potential buyers stages in the B2B segment.
The most widespread form of digital communication on B2B markets is a website with a business presentation. In B2B settings the main purpose is to complete the inquiry form. Manufacturing companies are not used to using websites as a direct sales tool, unlike it is in B2C segment. Halligan and Shah (2014) argues that e-mail is still vital marketing tool for digital communication because it is used both to pass a value offer and to link to a business website. Pay-per-click business model is getting momentum as a key advertisement tool. The advantage of a pay-per-click ad is its planning and measurability and also the fact that the advertiser does not pay for each ad impression, but only after the ad was clicked. A specific area of content marketing is also search engine optimization, which in the internet industry denotes the methodology of creating and building backlinks of web pages in such a way that their form and content are suitable for automated processing in Internet search engines. The goal of search engine optimization is to get a better position in search results.
According to Brennan and Croft (2012) social media platform number grows as fast as their importance. Although partial saturation can be traced on B2B markets, businesses are finding new ways to use them. The purpose of social media is to create a platform for associating businesses or individuals of the same interest and to make them share information, whether in the form of contributions, links, photographs or videos.
Vajre (2016) argues that the purpose of using these tools is to not only get contact information but specific data about buyers behaviour. This is a marketing goal designed to create data rich lists of potential customers who are genuinely interested in the products or services of a given company and has a strong tendency to shop. Customer lists are cleared and analyzed through a customer relationship management system.
According to Järvinen and Taiminen (2016) marketing automation has been a major issue in the area of digital marketing. It is a specialized software that can bind all of the above mentioned tools and work with them automatized or even predictive. They are able to track the activity of individual potential customers and are ranked on the basis of their action. Upon reaching a certain point count, a potential customer can be sent, for example, a sequence of emails to speed up purchasing decisions, or the contact is automatically assigned to a sales representative via the CRM system.
The goal of marketing automation is to generate highly qualified business contacts on the basis of content personalization and behavioral marketing. Marketing departments are therefore trying to pass on as many potential contacts as possible to business representatives. Guenzi and Troilo (2007) argues that sales departments are criticized for their passivity when working with new contacts and, on the contrary, are not satisfied with the quality of the business opportunities they receive from marketing departments. Since integration of these principles is a relatively new issue for business and marketing departments, the absence of cooperative processes is often a source of misunderstanding. 2.2 Content Marketing Tactics
To achieve these goals, tactics or methodologies are used that build on the understanding of B2B customers buying behavior. According to Vajre (2016) two major methodologies, inbound marketing and account-based marketing, are recognized within marketing departments. Both coincide in three of the four stages of the purchase cycle. With the first stage, however, there is a contradiction between the way of reaching the masses or selected companies. Commercial marketing automation tools are tailored to these tactics to suit the specifics of the business.
242
Inbound marketing is conceptually based on pull marketing theories that were introduced more than a century ago (e.g. AIDA). As a methodology principle wrapped in a software platform, it was commercially introduced approximately a decade ago by Hubspot. Since then a number of variations have been introduced. In summary, the methodology is composed of four stages while each stage interconnects. Halligan a Shah (2014) describes the four buying cycle stages of inbound marketing methodology as follows:
• Attract - In the first phase of addressing, new potential buyers of products or services should be approached. The goal is to get as many back links as possible to visit the website. Achieving this can be done by making interesting content and publishing it on channels that can reach the broad masses. Goal is to motivate a potential customer to visit the site.
• Convert - If a prospective customer has been approached via a back link to the business website, they should be referred to landing pages. The benefits of a product or service should be explained in an effort to persuade the customer to implement the action. At this stage, a potential customer may not yet be 100% convinced, so it is important to get at least a contact, preferably in the form of an email.
• Close - At the engagement stage, we need to communicate with potential customers who have left contact with each other to support their decision to take action. This is a great way to send bulk mailing tools where they can get accurate information about how to buy.
• Delight - By purchasing or submitting demand, marketing communication does not end. Customers who are already actively communicating should be given the appropriate care to establish a relationship with the company and recommend it further. This will suitably close the circle in which new entrants can be approached, who will go through all phases of decision making.
In general, the goal of inbound marketing is to drive traffic to website, gather leads and nurture them to that point, where they become satisfied customers. It is clear that the above procedures require technical support and knowledge and when applying in companies it should be considered with some competition whether it suites with its business model.
Vajre (2016) states that unlike inbound marketing focused on leads, account-based marketing is targeted at accounts (companies as a whole). It is an example of the alignment of sales and marketing teams. In the aligned model, organizations able to unite tactical marketing efforts with defined sales goals and use feedback from sales to identify new potential markets. For account-based marketing to succeed, joint working relationship with sales is essential and marketing needs to be measuring and optimizing based on accounts.
It is a strategic approach to B2B marketing based on account awareness in which an organization considers and communicates with individual prospect or customer accounts as markets of one. Account-based marketing is typically employed in enterprise level sales organizations. Its goal is to help companies to increase account relevance, engage earlier and higher with deal, align marketing activity with account strategies, get the best value out of marketing and inspire customers with compelling content. In terms of specific marketing activities that form part of account-based marketing programs, the following provides a basis for selecting the appropriate tactics for any specific account:
• Intelligence – marketing’s role in profiling the target account and contacts within it to identify relevant propositions and communication preferences. Identifying target accounts should be a collaborative effort between marketing and sales, since it will require data from both areas - firmographic data, which consists of things like industry, company size, location, and annual revenue, as well as strategic factors, like market influence, likelihood of repeat purchase, and expected profit margin.
• Awareness – in target accounts where awareness of the supplier is low, regular communications have a role to play in creating a more favorable perception. When the key stakeholders within each account are known, new content which should be focused on the single purchases should be made for each specific organization. In this stage it is possible to see account-based marketing and inbound marketing working together, as it's clear that quality, compelling content plays a role in reaching account-based targets. It’s important to choose the right channels to deliver it, based on what’s most effective for a given organization or role.
• Campaigning – in large target accounts, lead generation campaigns can be run to uncover opportunities and appoint meetings. This can also be combined with a digital targeted marketing campaign targeted to the chosen companies.
• Sales – marketing has a role to play in supporting sales bids to improve conversion rates and shorten the sales cycle.
243
• Advocacy – the cycle is completed when customers become advocates and are used to drive further incremental business.
Consumer sensitivity to content and marketing message form are the main difference between Inbound marketing and account-based marketing. While inbound is focused on gathering leads through broadcasting wide marketing message, account-based marketing methodology concentrate the efforts to personalize the content to each individual account (company). 2.3 Barriers to Adoption of New Processes in Marketing Management in B2B Markets
In connection with the innovations that can be observed in B2B marketing, it is important to work with the ability of companies to adopt modern principles of online marketing communications. Kaufmann et al. (2015) states that in this respect, both the theories describing the way technology and innovation take over, as well as the practical experience of enterprises, have been gradually developing the barriers to the adoption of new processes in marketing management.
Le Meunier-Fitzugh et al. (2011) argues that lack inspiring case studies and scientific research is almost in the prenatal stage. Although we can see the beginnings of constructive communication opposed to the trade as usual, for good studies or research we still need to look abroad. Wieserma (2013), with his team, apparently conducted the most extensive research called B2B Agenda where he stated current challenges B2B marketing is facing. Lilien (2016) talks about the need to interconnect young scientists and practitioners, which has been the case for Järvinen and Taminen (2016) who have documented the process of implementing marketing automation in small and medium-sized enterprises.
There are many factors and reasons behind the adoption of new processes in marketing management. Nonetheless, it is possible to trace the repeated occurrences that prevented the digital transformation of B2B companies. According to Möller and Parvinen (2015) the most common ones.
• Changing culture in product value perception • Marketing and sales collaboration • Financially quantifiable marketing benefits.
The methods of solving the barriers described above are the subject of current investigation in academic sphere and practice. Siamagka et al. (2015) states that the aim is not only to solve these partial problems but also to determine the importance and benefits of content marketing and related methodology. 3. Developing the B2B Marketing Communication Model
Based on findings from current literature, content marketing model for online communication was made which respects consumer sensitivity to content and marketing message form based on inbound marketing and account-based marketing tactics. Insights from real practice, especially relationships between marketing and sales departments, helped advance understanding of the organizational processes within B2B companies.
In figure 1 we can see the content marketing communication model which should be tested and used for future research. In the first stage, called Inteligence, there is three particular points which should be done by collaboration of marketing and sales departments within B2B company. First is to create an ideal customer profile, based on insights of current customers or desired potential customers. Then it is necessary to do a research to find such companies and gather as many information useful for future communication. Finally, all these information should be stored in customer relationship management system. The goal is to prepare firmographic data for awareness and campaigning stage.
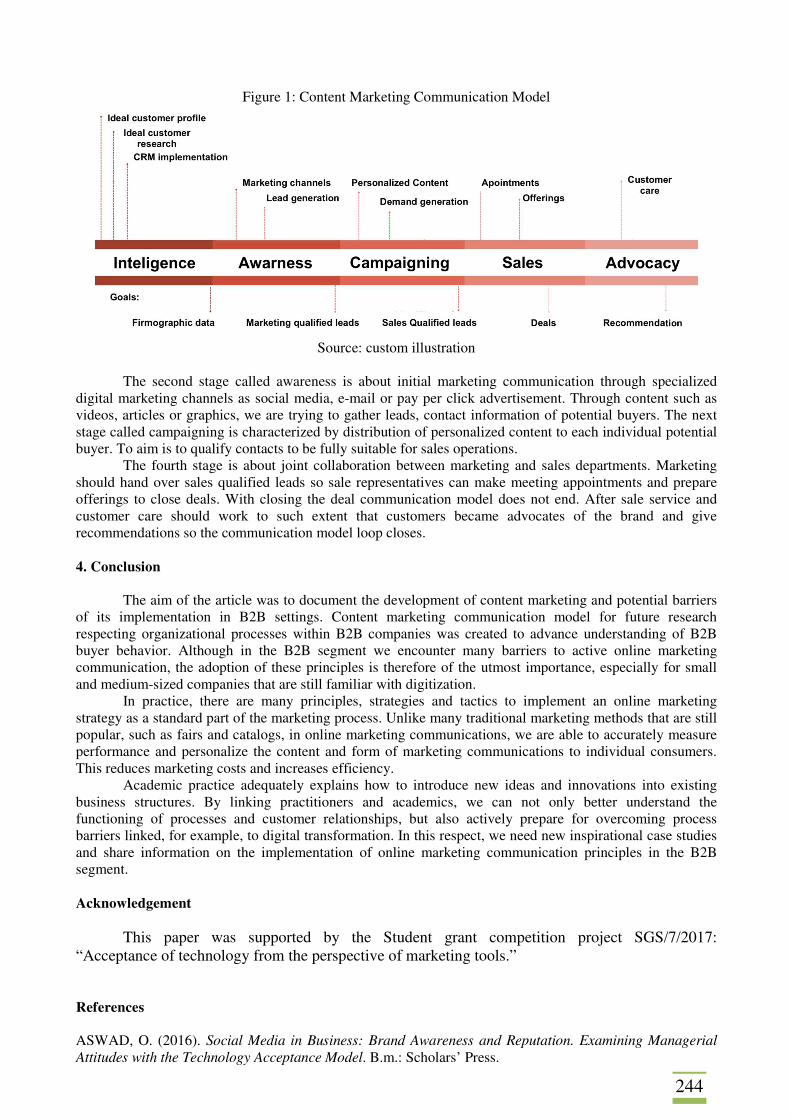
244
Figure 1: Content Marketing Communication Model
Source: custom illustration
The second stage called awareness is about initial marketing communication through specialized digital marketing channels as social media, e-mail or pay per click advertisement. Through content such as videos, articles or graphics, we are trying to gather leads, contact information of potential buyers. The next stage called campaigning is characterized by distribution of personalized content to each individual potential buyer. To aim is to qualify contacts to be fully suitable for sales operations.
The fourth stage is about joint collaboration between marketing and sales departments. Marketing should hand over sales qualified leads so sale representatives can make meeting appointments and prepare offerings to close deals. With closing the deal communication model does not end. After sale service and customer care should work to such extent that customers became advocates of the brand and give recommendations so the communication model loop closes. 4. Conclusion
The aim of the article was to document the development of content marketing and potential barriers of its implementation in B2B settings. Content marketing communication model for future research respecting organizational processes within B2B companies was created to advance understanding of B2B buyer behavior. Although in the B2B segment we encounter many barriers to active online marketing communication, the adoption of these principles is therefore of the utmost importance, especially for small and medium-sized companies that are still familiar with digitization.
In practice, there are many principles, strategies and tactics to implement an online marketing strategy as a standard part of the marketing process. Unlike many traditional marketing methods that are still popular, such as fairs and catalogs, in online marketing communications, we are able to accurately measure performance and personalize the content and form of marketing communications to individual consumers. This reduces marketing costs and increases efficiency.
Academic practice adequately explains how to introduce new ideas and innovations into existing business structures. By linking practitioners and academics, we can not only better understand the functioning of processes and customer relationships, but also actively prepare for overcoming process barriers linked, for example, to digital transformation. In this respect, we need new inspirational case studies and share information on the implementation of online marketing communication principles in the B2B segment.
Acknowledgement
This paper was supported by the Student grant competition project SGS/7/2017: “Acceptance of technology from the perspective of marketing tools.”
References ASWAD, O. (2016). Social Media in Business: Brand Awareness and Reputation. Examining Managerial Attitudes with the Technology Acceptance Model. B.m.: Scholars’ Press.
245
BRENNAN, R., CROFT, R. (2012). The use of social media in B2B marketing and branding: An exploratory study. Journal of Customer Behaviour, vol. 11, no. 2, pp. 101–115. GUENZI, P., TROILO, G. (2007). The joint contribution of marketing and sales to the creation of superior customer value. Journal of Business Research. The 8th International Forum on the Sciences, Techniques and Art applied to Marketing, pp. 98–107. HADJIKHANI, A., LAPLACA, P. (2013). Development of B2B marketing theory. Industrial Marketing Management. 4., 42(3), Theoretical Perspectives in Industrial Marketing Management, pp. 294–305. HALLIGAN, B., SHAH, D. (2014). Inbound Marketing, Revised and Updated: Attract, Engage, and Delight Customers online. Hoboken, New Jersey: Wiley. HOLLIMAN, G., ROWLEY, J. (2014). Business to business digital content marketing: Marketers’ perceptions of best practice. Journal of Research in Interactive Marketing. vol. 8, no. 4, pp. 269–293. JÄRVINEN, J., TAIMINEN, H. (2016). Harnessing marketing automation for B2B content marketing. Industrial Marketing Management, vol. 4, no. 54, pp. 164–175. KAUFMANN, H. R., CZINKOTA, M. R., ZAKRZEWSKI, M. (2015). B2B and internal relationships and curative international marketing: A polish case study. Industrial Marketing Management, vol 11, no. 51, pp. 69–78. LE MEUNIER-FITZHUGH, K., MASSEY, G.R., PIERCY, N.F. (2011). The impact of aligned rewards and senior manager attitudes on conflict and collaboration between sales and marketing. Industrial Marketing Management, vol. 40 no. 7, pp. 161 - 1171. LILIEN, G.L. (2016). The B2B Knowledge Gap. International Journal of Research in Marketing, vol. 33, no. 3, pp. 543–556. MÖLLER, K., PARVINEN, P. (2015). An impact-oriented implementation approach in business marketing research: Introduction to the Special Issue on “Implementing Strategies and Theories of B2B Marketing and Sales Management”. Industrial Marketing Management, vol. 45, pp. 3–11. OZAWA, T., SEKIGUCHI, A., TSUDA, K. (2016). A Method for the Construction of User Targeting Knowledge for B2B Industry Website. Procedia Computer Science. ROGERS, E.M., (2003). Diffusion of Innovations. New York: Free Press. SCHWARTZ, E.I. (2001). Digital Darwinism: 7 Breakthrough Business Strategies for Surviving in the Cutthroat Web Economy.New York: Broadway. SIAMAGKA, N., CHRISTODOULIDES, G., MICHAELIDOU, N., VALVI, A. (2015). Determinants of social media adoption by B2B organizations. Industrial Marketing Management. Vol. 11, no. 51, pp. 89–99. SOLIS, B. (2011). The End of Business As Usual: Rewire the Way You Work to Succeed in the Consumer Revolution. Hoboken, N.J: Wiley. VAJRE, S. (2016). Account-Based Marketing For Dummies. Indianapolis: For Dummies. WIERSEMA, F. (2013). The B2B Agenda: The current state of B2B marketing and a look ahead. Industrial Marketing Management, vol. 42, no. 4, pp. 470–488.
246
RESEARCH IN CUSTOMER PREFERENCES SELECTING INSURANCE SERVICES: A CASE STUDY OF LITHUANIA Vilma Tamulienė, Vytautas Pilipavičius Aleksandras Stulginskis University Faculty of Economics and Management Institute of Business and Rural Development Management Studentų St. 11, Academia, Kauno district, LT-53361 Lithuania E-mail: [email protected], [email protected] Abstract The strong competition between insurance companies providing forces them to search for the ways to keep customers loyal. Customers have many opportunities to meet their needs and they have many choices selecting products and services in the market. Loyal customers are each company's greatest ambition and purpose; however, the customer's preferences selecting products and services are turning into an important and topical subject nowadays. How to keep loyal customer who is going to change the organization providing insurance services? What factors inhibit the customer's intention from leaving an insurance service organization? The purpose of the research - to identify and investigate the factors, influencing hindering customer's intention to change the organization working on insurance services in Lithuania. For the research completion, the methods of questionnaire survey were applied. The gained research outcome has disclosed that customers' intention to change the insurance organization influences the credibility of the organization and relational values. Keywords: customer loyalty, insurance company, insurance services, Lithuania, switching behavior JEL codes : M30, M31, P2 1. Introduction
The research in customer preferences, selecting the insurance services, is related to the customerloyalty. Customer loyalty, as the research object, was analyzed as a process of re-purchase Johnson et al. (2006), Pileliene and Svagzdiene (2009). Later, loyalty was studied in the theory of relationship marketing, according Pileliene and Svagzdiene (2009) where loyalty was seen as a longterm development of relations between an organization and a customer and this approach has been mostly studied in terms of loyalty to this day. The latest concept, analyzing customer loyalty is the concept of switching-behavior. Therefore, customer-switching behavior is constantly affected by the certain factors that build his/her frustration with the organization and with the purchased product / service. Finally, a customer assesses the potential switching costs, chooses another alternative - migrates to another organization.
The factors, due to which customers are changing insurance companies, have not been studied in terms of insurance services in Lithuania. There is a lack of the research on customer preferences, disclosing what is requested to be replaced concerning the change of one insurance company into another. There are no identified factors revealing why customers leave the company and choose another one. Thus, the insurance services are very important to explain customers' loyalty correspondingly to the concept of customer-switching behavior. Consequently, there are discussed the reasons that prevent customer migration to other insurance organizations.
In the following article there is set a problem that is formulated under a question - how to keep loyal customers who have an intention to change the organization providing insurance services?
The purpose of the research - to identify and investigate the factors influencing hindering customer's intention to change the organization working on insurance services in Lithuania.
The article object - the factors influencing hindering customer's intention to change the organization working on insurance services.
The objectives of the research: • To review the companies, providing insurance services in Lithuania. • To identify the factors influencing hindering customer's intention to change the organization. • To investigate the factors influencing hindering customer's intention to change the organization working on insurance services in Lithuanian organizations.
The methods of the research. There has been chosen the secondary data analyse for insurance companies financial statements for the period 2015; the quantitative, questionnaire-survey method for the research of the empirical research problem and literature analyse. The data were analyzed and administrated
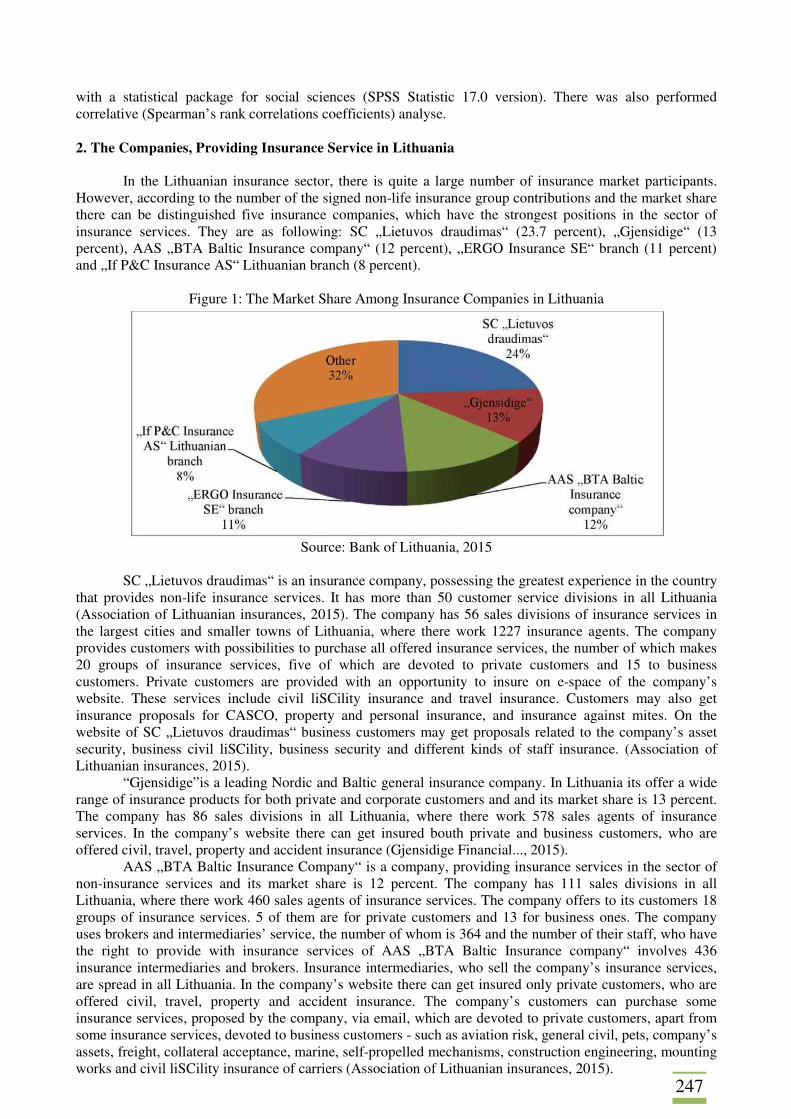
247
with a statistical package for social sciences (SPSS Statistic 17.0 version). There was also performed correlative (Spearman’s rank correlations coefficients) analyse.
2. The Companies, Providing Insurance Service in Lithuania
In the Lithuanian insurance sector, there is quite a large number of insurance market participants. However, according to the number of the signed non-life insurance group contributions and the market share there can be distinguished five insurance companies, which have the strongest positions in the sector of insurance services. They are as following: SC „Lietuvos draudimas“ (23.7 percent), „Gjensidige“ (13 percent), AAS „BTA Baltic Insurance company“ (12 percent), „ERGO Insurance SE“ branch (11 percent) and „If P&C Insurance AS“ Lithuanian branch (8 percent).
Figure 1: The Market Share Among Insurance Companies in Lithuania
Source: Bank of Lithuania, 2015
SC „Lietuvos draudimas“ is an insurance company, possessing the greatest experience in the country
that provides non-life insurance services. It has more than 50 customer service divisions in all Lithuania (Association of Lithuanian insurances, 2015). The company has 56 sales divisions of insurance services in the largest cities and smaller towns of Lithuania, where there work 1227 insurance agents. The company provides customers with possibilities to purchase all offered insurance services, the number of which makes 20 groups of insurance services, five of which are devoted to private customers and 15 to business customers. Private customers are provided with an opportunity to insure on e-space of the company’s website. These services include civil liSCility insurance and travel insurance. Customers may also get insurance proposals for CASCO, property and personal insurance, and insurance against mites. On the website of SC „Lietuvos draudimas“ business customers may get proposals related to the company’s asset security, business civil liSCility, business security and different kinds of staff insurance. (Association of Lithuanian insurances, 2015).
“Gjensidige”is a leading Nordic and Baltic general insurance company. In Lithuania its offer a wide range of insurance products for both private and corporate customers and and its market share is 13 percent. The company has 86 sales divisions in all Lithuania, where there work 578 sales agents of insurance services. In the company’s website there can get insured bouth private and business customers, who are offered civil, travel, property and accident insurance (Gjensidige Financial..., 2015).
AAS „BTA Baltic Insurance Company“ is a company, providing insurance services in the sector of non-insurance services and its market share is 12 percent. The company has 111 sales divisions in all Lithuania, where there work 460 sales agents of insurance services. The company offers to its customers 18 groups of insurance services. 5 of them are for private customers and 13 for business ones. The company uses brokers and intermediaries’ service, the number of whom is 364 and the number of their staff, who have the right to provide with insurance services of AAS „BTA Baltic Insurance company“ involves 436 insurance intermediaries and brokers. Insurance intermediaries, who sell the company’s insurance services, are spread in all Lithuania. In the company’s website there can get insured only private customers, who are offered civil, travel, property and accident insurance. The company’s customers can purchase some insurance services, proposed by the company, via email, which are devoted to private customers, apart from some insurance services, devoted to business customers - such as aviation risk, general civil, pets, company’s assets, freight, collateral acceptance, marine, self-propelled mechanisms, construction engineering, mounting works and civil liSCility insurance of carriers (Association of Lithuanian insurances, 2015).
248
„ERGO Insurance SE“ branch - a company, providing non-life insurance services, has a market share of 10.8 percent in the national non-life insurance services. The branch has sales divisions in the largest Lithuanian cities and smaller towns, where there work 657 insurance agents, selling company’s insurance services. In the company’s sales divisions, customers can purchase all insurance services, proposed by the company, the total proposed number of which is 10. Four insurance service groups are devoted to private customers and six ones to business customer. The company cooperates with agents, who provide with insurance services at the insured person’s house. The agents’ number is currently 180. Besides, all day long, the company’s private customers can immediately and with no inquiry purchase such services as civil insurance, travel insurance, property insurance, insurance against accidents and cyclist’s insurance. Just private customers can be insured online, purchasing the mentioned insurance services. Meanwhile, business customers are not provided with online service. This is very convenient for private customers; however, the following limits business customers’ possibilities to purchase insurance services online. Customers may purchase the proposed insurance services on the phone or via email. It is of great significance to mention that „ERGO Insurance SE“ offers a self-service only in the field of life-insurance; meanwhile, there is no set self-service in the provision with the company’s non-life insurance services.
In the Lithuanian sector -for non-insurance services there is present an insurance company - „If P&C Insurance AS“. Its market share is 8 percent and it has 15 customer service divisions in the largest cities of the country and in larger settlements. The company sells insurance services, using the service of 133 insurance brokers and intermediaries. They are conferred the right to sell 13 insurance services, offered by the company. The company’s private customers can purchase online the following insurance services: compulsory civil liSCility service and CASCO insurance. Customers can also make inquiries online concerning the purchase of property and travel insurance. Meanwhile, business customers are not provided with opportunities to purchase insurance online - they have to apply to company’s agents on the phone, via email or arrive to a customer service division.
Other companies as Compensa, Reso Insurance etc. also providing non-life insurance services, have a market share of 32 percent in the national non-life insurance services.
Competition among insurance services companies is quite high in Lithuanian insurance service market. Each company, which provides insurance services, in order to effectively carry out its activities, must take into account not only insurance service, sales channels and its process for logistics in order to follow current and potential competitors and their actions, but also in order to meet customers’ needs and priorities in selecting insurance services.
Thus, in the Lithuanian insurance service market, Lithuanian customers have an opportunity to choose insurance services in different companies, which provide insurance services. Consequently, customers can exchange one insurance company to another if one does not meet their needs. In addition, insurance service managers must know the key factors of customer choice, preparing marketing strategies for future company activities in particular.
Having compared customer behavior with other services, insurance services, are specific, since the purchase of financial services and their result is not always appreciable, but only in case of a disaster, from which a customer was pre-insured. The customer is difficult to assess the quality or value of the insurance service. For this reason, it is not easy to attract customers, and it is even more difficult to keep customer loyalty. Customer have many opportunities to meet their needs, they have many choices when selecting products and services in the market. Loyal customers of each company's greatest ambition and purpose, however, the important and topical subject becomes the customer's preferences selecting products and services. As a result, there is question - how to keep a loyal customer, who is going to change the organization providing insurance services?
3. Factors Hindering Customer’s Intention to Change the Organization
In order to identify factors that inhibit customer intention to change the organization has invoked customer loyalty concept. The customer loyalty concept is investigated in the theory of consumer behavior, in the concepts of relationship marketing and switching behavior.
According to Andreassen et al. (1998), customer loyalty in consumer behavior is an intended behavior, related to a service or an organization, involving, the possibility for the completion of future contracts, customer change possibility (if they change one organization to another), a possibility that customers will disseminate positive reviews as in a „word of mouth“. Customers may be loyal agreeably with high barriers in order to change services or due to the absence of alternatives. Also, due to the fact that they are satisfied and they are willing to continue the cooperation (Andreassen, T.W., Lindestad, B., 1998, p.9-12).
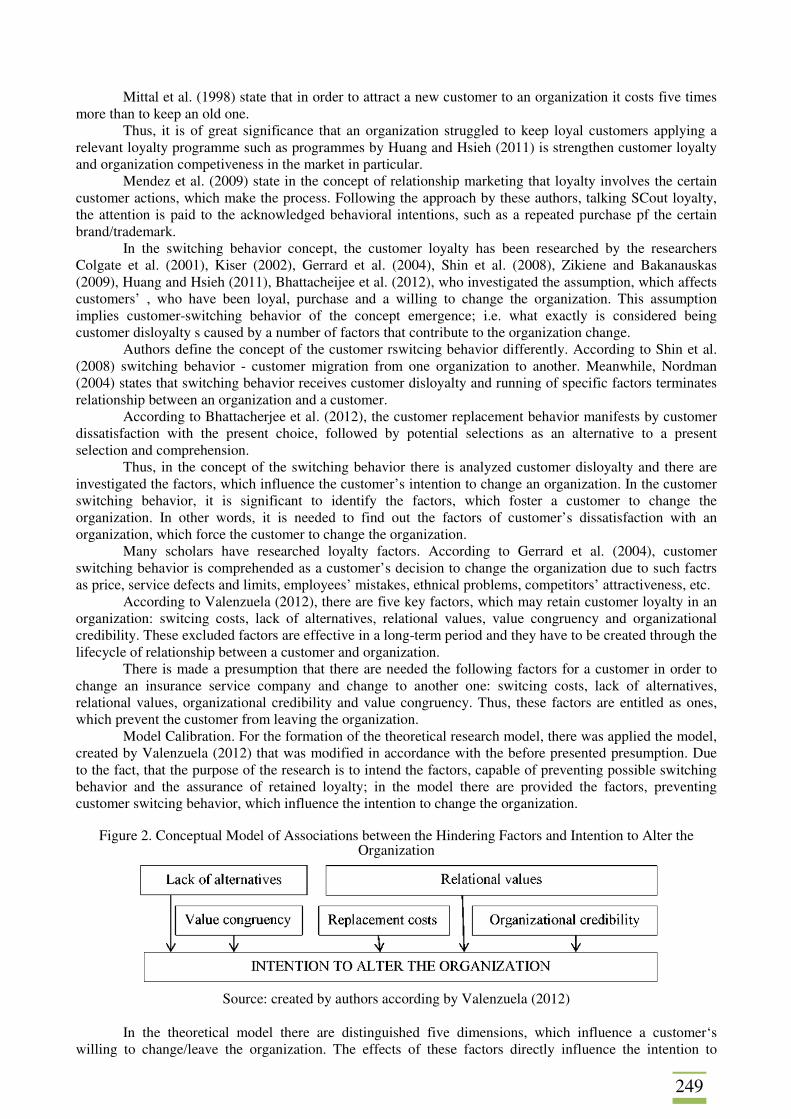
249
Mittal et al. (1998) state that in order to attract a new customer to an organization it costs five times more than to keep an old one.
Thus, it is of great significance that an organization struggled to keep loyal customers applying a relevant loyalty programme such as programmes by Huang and Hsieh (2011) is strengthen customer loyalty and organization competiveness in the market in particular.
Mendez et al. (2009) state in the concept of relationship marketing that loyalty involves the certain customer actions, which make the process. Following the approach by these authors, talking SCout loyalty, the attention is paid to the acknowledged behavioral intentions, such as a repeated purchase pf the certain brand/trademark.
In the switching behavior concept, the customer loyalty has been researched by the researchers Colgate et al. (2001), Kiser (2002), Gerrard et al. (2004), Shin et al. (2008), Zikiene and Bakanauskas (2009), Huang and Hsieh (2011), Bhattacheijee et al. (2012), who investigated the assumption, which affects customers’ , who have been loyal, purchase and a willing to change the organization. This assumption implies customer-switching behavior of the concept emergence; i.e. what exactly is considered being customer disloyalty s caused by a number of factors that contribute to the organization change.
Authors define the concept of the customer rswitcing behavior differently. According to Shin et al. (2008) switching behavior - customer migration from one organization to another. Meanwhile, Nordman (2004) states that switching behavior receives customer disloyalty and running of specific factors terminates relationship between an organization and a customer.
According to Bhattacherjee et al. (2012), the customer replacement behavior manifests by customer dissatisfaction with the present choice, followed by potential selections as an alternative to a present selection and comprehension.
Thus, in the concept of the switching behavior there is analyzed customer disloyalty and there are investigated the factors, which influence the customer’s intention to change an organization. In the customer switching behavior, it is significant to identify the factors, which foster a customer to change the organization. In other words, it is needed to find out the factors of customer’s dissatisfaction with an organization, which force the customer to change the organization.
Many scholars have researched loyalty factors. According to Gerrard et al. (2004), customer switching behavior is comprehended as a customer’s decision to change the organization due to such factrs as price, service defects and limits, employees’ mistakes, ethnical problems, competitors’ attractiveness, etc.
According to Valenzuela (2012), there are five key factors, which may retain customer loyalty in an organization: switcing costs, lack of alternatives, relational values, value congruency and organizational credibility. These excluded factors are effective in a long-term period and they have to be created through the lifecycle of relationship between a customer and organization.
There is made a presumption that there are needed the following factors for a customer in order to change an insurance service company and change to another one: switcing costs, lack of alternatives, relational values, organizational credibility and value congruency. Thus, these factors are entitled as ones, which prevent the customer from leaving the organization.
Model Calibration. For the formation of the theoretical research model, there was applied the model, created by Valenzuela (2012) that was modified in accordance with the before presented presumption. Due to the fact, that the purpose of the research is to intend the factors, capable of preventing possible switching behavior and the assurance of retained loyalty; in the model there are provided the factors, preventing customer switcing behavior, which influence the intention to change the organization.
Figure 2. Conceptual Model of Associations between the Hindering Factors and Intention to Alter the
Organization
Source: created by authors according by Valenzuela (2012) In the theoretical model there are distinguished five dimensions, which influence a customer‘s
willing to change/leave the organization. The effects of these factors directly influence the intention to
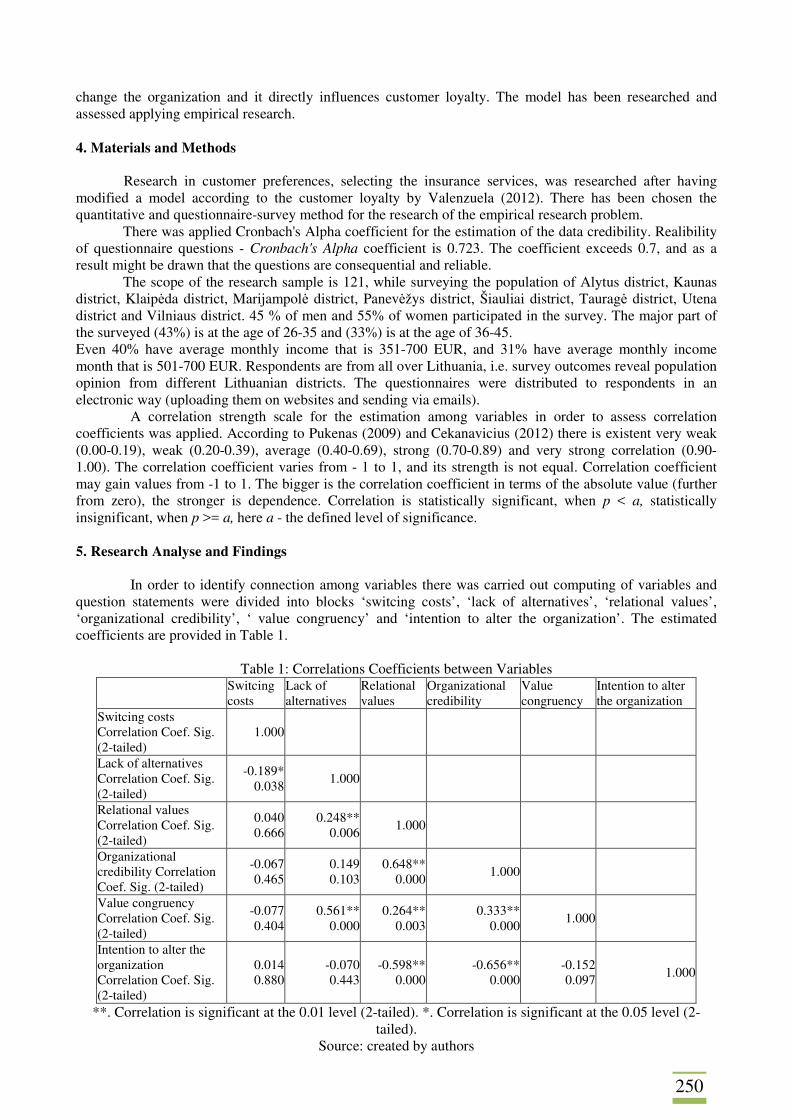
250
change the organization and it directly influences customer loyalty. The model has been researched and assessed applying empirical research.
4. Materials and Methods
Research in customer preferences, selecting the insurance services, was researched after having modified a model according to the customer loyalty by Valenzuela (2012). There has been chosen the quantitative and questionnaire-survey method for the research of the empirical research problem.
There was applied Cronbach's Alpha coefficient for the estimation of the data credibility. Realibility of questionnaire questions - Cronbach's Alpha coefficient is 0.723. The coefficient exceeds 0.7, and as a result might be drawn that the questions are consequential and reliable.
The scope of the research sample is 121, while surveying the population of Alytus district, Kaunas district, Klaipėda district, Marijampolė district, Panevėžys district, Šiauliai district, Tauragė district, Utena district and Vilniaus district. 45 % of men and 55% of women participated in the survey. The major part of the surveyed (43%) is at the age of 26-35 and (33%) is at the age of 36-45. Even 40% have average monthly income that is 351-700 EUR, and 31% have average monthly income month that is 501-700 EUR. Respondents are from all over Lithuania, i.e. survey outcomes reveal population opinion from different Lithuanian districts. The questionnaires were distributed to respondents in an electronic way (uploading them on websites and sending via emails).
A correlation strength scale for the estimation among variables in order to assess correlation coefficients was applied. According to Pukenas (2009) and Cekanavicius (2012) there is existent very weak (0.00-0.19), weak (0.20-0.39), average (0.40-0.69), strong (0.70-0.89) and very strong correlation (0.90-1.00). The correlation coefficient varies from - 1 to 1, and its strength is not equal. Correlation coefficient may gain values from -1 to 1. The bigger is the correlation coefficient in terms of the absolute value (further from zero), the stronger is dependence. Correlation is statistically significant, when p < a, statistically insignificant, when p >= a, here a - the defined level of significance.
5. Research Analyse and Findings
In order to identify connection among variables there was carried out computing of variables and question statements were divided into blocks ‘switcing costs’, ‘lack of alternatives’, ‘relational values’, ‘organizational credibility’, ‘ value congruency’ and ‘intention to alter the organization’. The estimated coefficients are provided in Table 1.
Table 1: Correlations Coefficients between Variables
Switcing costs
Lack of alternatives
Relational values
Organizational credibility
Value congruency
Intention to alter the organization
Switcing costs Correlation Coef. Sig. (2-tailed)
1.000
Lack of alternatives Correlation Coef. Sig. (2-tailed)
-0.189* 0.038
1.000
Relational values Correlation Coef. Sig. (2-tailed)
0.040 0.666
0.248** 0.006
1.000
Organizational credibility Correlation Coef. Sig. (2-tailed)
-0.067 0.465
0.149 0.103
0.648** 0.000
1.000
Value congruency Correlation Coef. Sig. (2-tailed)
-0.077 0.404
0.561** 0.000
0.264** 0.003
0.333** 0.000
1.000
Intention to alter the organization Correlation Coef. Sig. (2-tailed)
0.014 0.880
-0.070 0.443
-0.598** 0.000
-0.656** 0.000
-0.152 0.097 1.000
**. Correlation is significant at the 0.01 level (2-tailed). *. Correlation is significant at the 0.05 level (2-tailed).
Source: created by authors
251
The gained outcomes of the correlation analysis show that statistically significant correlation is between the intention of the statistically significant variable to change the organization and the relational values (coefficient = -0,598, p=0,000) and the intention to change the organization and the credibility of the organization (coefficient = -0,656, p=0,000). The correlations are averrage strong, but negative, that means that in the case of the increase in the credibility of the organization, and the relational values, there decreases the expectation for the emerging of the intention to change the organization. Meanwhile, between the intention to change the organization and the factors, such as switcing costs, a lack of alternatives and the value congruency, there is no significant correlation (p value >0,05).
The analysis of correlation showed that there is a meaningful and the strongest correlation between the relational values and the intention to change the organization and the credibility of the organization.
6. Conclusion
The market analysis of the insurance services disclosed that consumers may select non-life insurance services from five strong companies, which compete with each other and which provide with a wide range of similar non-life insurance services and have a rich network of them in all Lithuania.
The literature analysis concerning consumer loyalty enabled the distinguishing and identification of five damping factors, which keep a consumer in an organization. Having modified the mode, created by Velenzuela, there was prepared an empiric research model that states that there are five factors, damping a customer, which aid at the keeping of a customer in an organization, i.e. a consumer stays in the organization and does not change it to another if there are present these factors. Agreeably with the empirical research it was defined that only two factors from five aid the organization at the keeping of customers and other three are insignificant. The research disclosed that average strength correlations are present between these factors.
A customer is encouraged to stay in a company by a relational values and organizational credibility in the insurance service company. A consumer, selecting an insurance company, assigns his/her preference to the relations values and credibility of the organization in Lithuania.
References ANDREASSEN, T. W., LINDESTAD, B. (1998). The effect of corporate image in the formation of customer loyalty. Journal of Service Research, vol. 1, no. 1, pp. 82-92. BHATTACHERJEE, A., LIMAYEM, M., CHEUNG, C. M. (2012). User switching of information technology: A theoretical synthesis and empirical test. Information & Management, vol. 49, no. 7, pp. 327-333. CHATTANANON, A., TRIMETSOONTORN, J. (2009). Relationship marketing: a Thai case. International Journal of Emerging Markets, vol. 4, no. 3, pp. 252-274. CHIU, H. C., HSIEH, Y. C., LI, Y. C., LEE, M. (2005). Relationship marketing and consumer switching behavior. Journal of Business Research, vol. 55, no. 12, pp. 1681-1689. CEKANAVICIUS, V. (2011). Taikomoji regresene analize socialiniuose tyrimuose, KTU: Kaunas. SHIN, COLGATE, M., LANG, B. (2001). Switching barriers in consumer markets: an investigation og the financialservices industry. Journal of Consumer Marketing, vol. 18, pp. 332-347. GERRARD, P., BARTON C., J. (2004). Consumer switching behavior in the Asian banking market. Journal of Services Marketing, vol. 18, no. 3, pp. 215-223. Gjensidige Financial Statements for the period. (2015). [online]. Available from: https://www.gjensidige.lt/-/media/lt/finansine/2015/adb-gj ensidige-2015-lt.pdf?la=lt-lt HUANG, L. Y., HSIEH, Y. J. (2011). Predicting online game loyalty based on need gratification and experiential motives. Internet Research, vol. 21, no. 5, pp. 581-598.
252
KIM, D. H., W. Y. (2008). Forecasting customer switching intention in mobile service: An exploratory study of predictive factors in mobile number portability. Technological Forecasting and Social Change, vol. 75, no. 6, pp. 854-874. KISER, E. K. (2002). Predicting household switching behavior and switching costs at depository institutions. Review of Industrial Organization, vol. 20, no. 4, pp. 349-365. LIETUVOS DRAUDIKŲ ASOCIACIJA (Association of Lithuanian insurances). (2015). IF P&C Insurance AS filialas [online]. Available from: http: //www .draudikai ,lt/lt/visi-draudikai/if. LIETUVOS BANKAS (Bank of Lithuania). (2015). Lietuvos draudimo rinkos apžvalga 2015 III ketvirtis. Vilnius: Lietuvos bankas. [online]. Available from: http: //www .draudikai .lt/lt/draudimas. LEE. M. Y., LEE. A. S., SOHN, S. Y. (2013). Behavior scoring model for coalition loyalty programs by using summary variables of transaction data. Expert Systems with Applications, vol. 40, no. 5, pp. 1564-1570. JOHNSON, M. D., HERRMANN, A., HUBER, F. (2006). The evolution of loyalty intentions. Journal of marketing, vol. 70, no. 2, pp. 122-132. MITTAL, B., LASSAR, W. M. (1998). Why do customers switch? The dynamics of satisfaction versus loyalty. Journal of services marketing, vol. 12, no. 3, pp. 177-194. PILELIENE, L., SVAGZDIENE, B. (2009). The formation of customer loyalty conception in the context of the evolution of schools of marketing thought. PUKĖNAS, K. (2009) Qualitative data analysis program for SPSS. Lietuvos kūno kultūros akademija: Kaunas. VALENZUELA, F. R. (2012). The effect of switching barriers types on customer loyalty. International Review of Business Research Papers, vol A, no. 1, pp. 1-19. ZIKIENE, K., BAKANAUSKAS, A. P. (2009). Research of factors influencing loyal customer switching behaviour. Organizacijų Vadyba: Sisteminiai Tyrimai, no. 52, pp. 153-161.
253
THE DECISION MAKING OF SMALL AND MEDIUM-SIZED ENTERPRISES TO ENTER FOREIGN MARKETS Šárka Zapletalová Silesian University in Opava School of Business Administration in Karviná, Department of Business Economics and Management Univerzitní nám. 1934/3 Karviná, 733 40 Czech Republic e-mail: [email protected] Abstract
The globalization of economy offers new opportunities to enterprises, resulting from their access to bigger markets, scale economies and exposure to best practice management and technology. In response to these challenges, enterprises try to conquer new foreign markets and expand their presence and operating in the global market. Decision making about foreign entry markets is a comprehensive process influenced by many factors. The paper focuses on decision making on foreign business activities of Czech family small and medium-sized enterprises. The objective of the paper is to define and to specify the internal factors influencing the decision making of Czech family small and medium-sized enterprises to enter foreign markets. The enterprises included in the study are those family SMEs that have already undertaken internationalization activities and are incorporated in the Czech Republic. A total of 490 enterprises participated in the study, and the main primary data collection instrument was a questionnaire-interview. The findings of the factor analysis show the influence of selected internal variables on the decision-making process of Czech family small and medium-sized enterprises. Keywords: Czech SMEs, family businesses, foreign markets, internationalization process JEL codes: F23, M16 1. Introduction
Whereas most research on internationalization activities have focused on large multinational companies, this study deals with SMEs of family nature. The reason for this choice is that the issue of internationalization activities is becoming increasingly important for small and medium-sized companies, especially those that are technologically driven and which internationalize during the early stages of their organizational lives (Almor 2006). We focused on small and medium-sized enterprises from post-transition economies, specifically from the Czech Republic. One of the main reasons of the interest of Czech family SMEs to expand to foreign markets nowadays is a limited market size of the Czech Republic and, consequently, the increasing competition in the domestic market. The growing interest in doing business in foreign markets gives rise to interests in internationalization in a broader context.
However, the research on international entrepreneurship and internationalization processes in Czech professional and business literature is relatively scarce; there are only a few studies exploring and monitoring internationalization processes of Czech SMEs. Due to the absence of substantial research, the author of the present study carried out a research survey among Czech family SMEs to define and to specify the internal factors influencing the decision making of Czech family SMEs to enter foreign markets. The findings presented in the study are the first of their kind in the Czech Republic. In this study, we focused on a problem of the process of deciding on entrepreneurial activities in foreign markets. The main research question of the research is to find out what the factors influence the process deciding on entering foreign markets. More specifically, the analysis is aimed at better understanding of factors, especially internal factors, which influences the decision-making about entrepreneurial activities in foreign markets. The study is based on primary data collected from a recent survey of Czech family SMEs. The relationships of interest are analyzed using relevant regression techniques and factor analysis. The paper is organized into three parts. The first part of the paper outlines selected theories dealing with the internationalization process and factors affecting decision making to enter foreign markets. The second part of the paper aims to present and then interpret results of the survey carried out among Czech family SMEs. Finally, the last section provides the conclusion of the research and offers a discussion of the most important implications. The results of the analysis are discussed, and further recommendations are provided for managers in the last section.
This paper offers several contributions to international business research and attempts to answer calls for studies that span across the disciplines. In particular, the paper pays attention to the key role of internal
254
factors in decision-making on international activities. Although we use a single small country, the Czech Republic, as a laboratory to test our theoretical propositions, our study is clearly situated within the domain of international business studies. We offer a new angle on an international business theory by focusing on the process of decision-making on foreign activities. Although the author does not develop a new theory, the work builds on prior works in the field of international business towards a theory of the internationalization of company. The results of this work contribute new insights on the internationalization process of companies in the post-communist country. In the country, where were held significant changes in the economic system 25 years ago and where the majority of companies have a history shorter than 25 years. 2. Theoretical Framework and Research Hypotheses
Small and medium enterprises (SME) currently play an important role in international business. The internationalization process of SMEs and company’s decision to sell its products in international markets has been the subject of intense academic research in the past 40 years. Several theories and conceptual frameworks have been developed outlining a company’s decision to initiate the internationalization process. The foreign market entry selection is highly significant for the company’s future performance. The research findings suggest that because SMEs differ from their larger competitors, their mode choice may also differ. Among characteristics of SMEs affecting the mode choice were included these characteristics: managerial and financial resources (Zacharakis, 1997), the ability to service small niche markets (Yap and Souder, 1994), and less innovative of the SME technology (Tether et al., 1997). Hollenstein (2005) has explained that the internationalization process of SMEs involves limitations of resources in the form of finance, information, and management capacity to a much greater extent for multinational cooperations. On the other hand, Bradley et al. (2006) have argued that many SMEs be forced to internationalize, particularly high technology companies, due to the focus on niche markets, shorter product life cycles and frequently, the small size of their domestic markets relative to the potential that exists abroad.
Several studies have analyzed the factors that drive the internationalization activities of SMEs (Gabrielsson and Kirpalani 2004; Knight and Cavusgil 2004; Filatotchev et al. 2009). The majority of previous studies on the internationalization activities have been focused on factors explaining why companies internationalize (Almor and Hashai 2004; Autio et al. 2000; Jones and Coviello 2005; Knight and Cavusgil 2004). The companies that decide to enter international entrepreneurship must be aware both of entrepreneurship opportunities and risks, which are inseparably connected with entrepreneurship. Avoiding business opportunity risks does not lead to economic growth but results in missing business opportunities. The companies that decide to enter international market undergo particular stages of internalization. The progress and speed of business activity internalization depend on the interest and role that is assumed to the international entrepreneurship within entrepreneurship strategy of the company. The first attempt to explain the behavior of companies on international markets from microeconomic point of view are believed to be Hymer´s doctoral thesis on internationalization of American companies and the theory of monopolistic advantage developed by Hymer and Kindleberger, as well as the theory of international product life cycle developed by Vernon (Jarosiński, 2013). Two broad theoretical streams have emerged. First, traditional internationalization theories (such as stage theory, internalization theory, transaction cost theory), have focused on the factors influencing internationalization, especially in larger companies. Second, the international entrepreneurship theories (such as strategic choice theory, learning and knowledge theory relating to international new ventures or born globals, resource-based theory, network theory), have focused on the SMEs internationalize from the outset (Wright et al., 2007). These theories on international processes or models are continually evolving and developing: this reflects constant changes in the global business environment. Despite new and emerging theories of internationalization, the stage approach (gradually globalizing company) and the global approach (born global company) remain and are treated as most fundamental and default approaches. The newly evolving approaches and theories are usually based on these two basic frameworks which thus become a springboard for further modification and innovation.
The factors influencing company’s choice of entry mode are according to Johanson and Vahlne (1977) divided into two main groups, external factors, and internal factors. Koch (2001) introduced a holistic model of the market entry mode selection process. All factors proposed to influence the market/market entry mode selection process to fall into three broad categories: external, internal, and the mixed category. According to Koch (2001), the external category includes industry feasibility, characteristics of the country business environment, market growth rate, image support requirements, global management efficiency requirements, the popularity of individual market entry modes in the overseas market, market barriers, and so forth.
255
The internal category includes calculation methods applied, management locus of control, market share targets, company size and resources, profit targets, management risk attitudes, experience in using individual market entry modes, and so forth.
The third mixed category includes sufficiency and reliability of information inputs, competencies, capabilities, and skills required and available for each market entry modes. Some of the proposed categories of factors may influence each other, adding to the complexity of the decision process.
Therefore, in the context author propose: • Hypothesis 1: The desire for expansion of entrepreneurial activities relates positively to the
decision-making process regarding entry into foreign markets. • Hypothesis 2: Efforts to increase sales of the company relates positively to the decision-
making process regarding entry into foreign markets. • Hypothesis 3: The level of business knowledge of managers relates positively to the decision-
making process regarding entry into foreign markets. • Hypothesis 4: The level of international experience of managers relates positively to the
decision-making process regarding entry into foreign markets. • Hypothesis 5: Total available resources of the company relates positively to the decision-
making process regarding entry into foreign markets. • Hypothesis 6: Existing contacts of the company to foreign partners relates positively to the
decision-making process regarding entry into foreign markets. • Hypothesis 7: Previous import activities of the company relates positively to the decision-
making process regarding entry into foreign markets. 3. Methodology 3.1 Sample and Procedure
The analysis is based on data from a standardized empirical study, which comprises of many
questions on entrepreneurial activities of Czech enterprises in foreign markets. For the purpose of the analysis decision-making process regarding enter into foreign markets, some questions on the deciding on entrepreneurial activities on foreign markets we asked in the survey. Like this, the paper is concentrated on various aspects of international activities, only a few questions from the survey we analyzed in this paper. The paper raises the question of which internal factors influence the decisions about entering foreign markets. The objective of the paper is to investigate the effect of human resources on the success of international activities of Czech family SMEs, namely the effect of international experience, and business knowledge of managers. The data on human resources and on the success of international activities we collected in an on-site survey of 246 Czech family SMEs in period 05/2015 – 05/2016. We were not able to use some official databases because we do not have some databases about family businesses.
The sample consists of the internationally experienced family SMEs in the Czech Republic. Selection of companies under research was based on the method of non-probability purposive sampling, by assumption and occasional selection. The researched companies have already started their internationalization operations, all of them were founded in the Czech Republic, and all of them are private subjects. This delimitation on companies with the international experience was made to enable on-site data collection. The focus was on small and medium-sized enterprises, the European Union definition based on a headcount of fewer than 250 employees (Eurostat 2011) was followed.
First, telephone calls were made with general managers or CEOs of the Czech companies to explain the purpose of the study and to ask for their participation. A high level of personal involvement consisting of telephone calls and personal delivery and pickup of questionnaires was necessary because of the relatively low response rate in mail surveys in the Czech Republic, and sensitivity to Czech managers’ concerns about industrial espionage. Moreover, by the first telephone, we excluded those no representative of the population, such as companies with no current international activities, companies distributed to Czech customers´ foreign facilities or sister companies within their own corporations. After the step, the sample in the Czech Republic fulfilling the selection criteria consisted of 400 companies. In a second step, we hand-distributed questionnaires to the top managers and CEOs. Trained research assistants helped the top managers and CEOs complete the questionnaire, and explained any items that the respondents wished to have clarified. This procedure resulted in 350 matched questionnaires, out of which 104 we eliminated due to the incompleteness of responses. Thus 246 (a response rate of 70.3%) questionnaires were used in the subsequent data analysis and statistical processing. The final sample consisted of companies with an average age of 22 years
256
(minimum one; maximum 25), an average size of 54 employees (minimum one; maximum 250). The sample comes from a variety of industries: about 52% in manufacturing, 25% in retailing, and 23% in services.
The method of the oral questioning and a questionnaire as the principal instrument applied for researching the relationship between human resources and success of international activities. The instrument used in the survey, a structured questionnaire, contains five fields of varying degrees of complexity relating to the area of entrepreneurial activities in international markets. The questionnaire consists of closed, semi-closed and open questions. The questions were designed while based on the information gained from experts from business and universities and previous research. In some questions, particularly those related to the entry mode choice and market choice, simple and complex scales were used, mostly the Likert-type scale (5 = strongly agree to 1 = strongly disagree). Also, the questionnaire also included four questions related to the company background (the type of a business sector on the domestic market and international markets; the size of the company measured by the number of employees, and the revenue; the year of company foundation; the year of the first foreign market entry). The questionnaire was pre-tested for the instrument validity by 20 managers. In interviews, the managers were asked to respond to the items measuring the theoretical construct. They were also asked to identify any ambiguities revealed in the questionnaire draft. Based on the feedback some minor changes of wording were made. 3.2 Variables and Measurement
Dependent Variables. The DECISION to enter foreign markets is our dependent variable. The
decision to enter foreign markets is monitored in terms of time when the decision. Respondents had three variants: decision before the founding of the company, decision during business start-up, a decision during entrepreneurial activities. Most respondents said that they had decided to enter foreign markets during entrepreneurial activities.
Independent Variables. Our explanatory variables are these selected internal factors: the desire for expansion of entrepreneurial activities, efforts to increase sales, the level of business knowledge of managers, the level of international experience of managers, total available resources of the company, existing contacts of the company to foreign partners, previous import activities. Questions on the DESIRE for expansion of entrepreneurial activities, efforts to increase SALES, existing CONTACTS of the company to foreign partners, and previous IMPORT activities were presented in the form of five-point scales (5 = strongly agree, 4 = agree, 3 = neutral, 2 = disagree, and 1 = strongly disagree) to ensure maximal respondent specificity. All multi-item measures achieved superior or adequate reliability scores in tests using Cronbach´s alpha. The alpha values range from 0.74 to 0.82. International EXPERIENCE with international activities we measured at the company level using of prior work international experiences (by years), in keeping with prior management research (Beckman and Burton, 2008; Walske and Zacharakis, 2009). International experience includes prior work in a company with international entrepreneurial activities. The average rate of international experience as measured by the number of years was seven years (minimum 0 years, maximum 45 years). Business KNOWLEDGE measures knowledge of international markets and knowledge of practices in international markets by company management. The knowledge of international markets plays in the process of the realization of international entrepreneurial activities key role. Knowledge contributes to increased competitiveness of entrepreneurial subjects in international markets. Questions on business knowledge of managers were presented in the form of five-point scales (5 = strongly agree, 4 = agree, 3 = neutral, 2 = disagree, and 1 = strongly disagree) to ensure maximal respondent specificity. All multi-item measures achieved superior or adequate reliability scores in tests using Cronbach´s alpha. The alpha values range from 0.74 to 0.82. Total available RESOURCES of the company are monitored in categories tangible resources and intangible resources. Respondents identified their most significant resources. The most important resources were resources of intangible character (81%).
Control Variables. Guided by previous literature and empirical evidence, we have included several control variables. Among the company-level determinants of company performance, the company´s size and company age are the two widely used demographic characteristics of companies. Therefore, we include company SIZE (natural logarithm of the number of employees) and company AGE (in years). In addition to the company-level determinants, we also include INDUSTRY level of the company: whether the company operates in the manufacturing or service sector. We included a dummy variable for industry level, as Acquaah and Yasai-Ardekani (2007), did because the distinction between manufacturing and services obviously has a considerable effect on company performance.
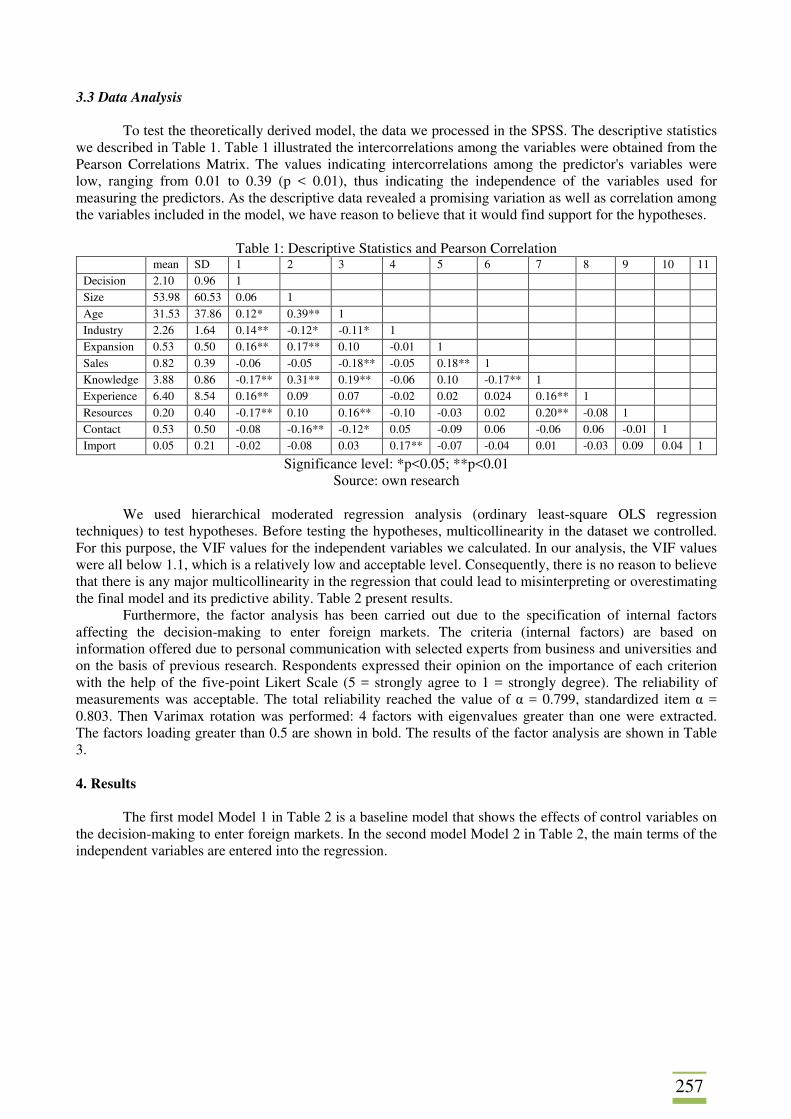
257
3.3 Data Analysis
To test the theoretically derived model, the data we processed in the SPSS. The descriptive statistics
we described in Table 1. Table 1 illustrated the intercorrelations among the variables were obtained from the Pearson Correlations Matrix. The values indicating intercorrelations among the predictor's variables were low, ranging from 0.01 to 0.39 (p < 0.01), thus indicating the independence of the variables used for measuring the predictors. As the descriptive data revealed a promising variation as well as correlation among the variables included in the model, we have reason to believe that it would find support for the hypotheses.
Table 1: Descriptive Statistics and Pearson Correlation mean SD 1 2 3 4 5 6 7 8 9 10 11 Decision 2.10 0.96 1 Size 53.98 60.53 0.06 1 Age 31.53 37.86 0.12* 0.39** 1 Industry 2.26 1.64 0.14** -0.12* -0.11* 1 Expansion 0.53 0.50 0.16** 0.17** 0.10 -0.01 1 Sales 0.82 0.39 -0.06 -0.05 -0.18** -0.05 0.18** 1 Knowledge 3.88 0.86 -0.17** 0.31** 0.19** -0.06 0.10 -0.17** 1 Experience 6.40 8.54 0.16** 0.09 0.07 -0.02 0.02 0.024 0.16** 1 Resources 0.20 0.40 -0.17** 0.10 0.16** -0.10 -0.03 0.02 0.20** -0.08 1 Contact 0.53 0.50 -0.08 -0.16** -0.12* 0.05 -0.09 0.06 -0.06 0.06 -0.01 1 Import 0.05 0.21 -0.02 -0.08 0.03 0.17** -0.07 -0.04 0.01 -0.03 0.09 0.04 1
Significance level: *p<0.05; **p<0.01 Source: own research
We used hierarchical moderated regression analysis (ordinary least-square OLS regression
techniques) to test hypotheses. Before testing the hypotheses, multicollinearity in the dataset we controlled. For this purpose, the VIF values for the independent variables we calculated. In our analysis, the VIF values were all below 1.1, which is a relatively low and acceptable level. Consequently, there is no reason to believe that there is any major multicollinearity in the regression that could lead to misinterpreting or overestimating the final model and its predictive ability. Table 2 present results.
Furthermore, the factor analysis has been carried out due to the specification of internal factors affecting the decision-making to enter foreign markets. The criteria (internal factors) are based on information offered due to personal communication with selected experts from business and universities and on the basis of previous research. Respondents expressed their opinion on the importance of each criterion with the help of the five-point Likert Scale (5 = strongly agree to 1 = strongly degree). The reliability of measurements was acceptable. The total reliability reached the value of α = 0.799, standardized item α = 0.803. Then Varimax rotation was performed: 4 factors with eigenvalues greater than one were extracted. The factors loading greater than 0.5 are shown in bold. The results of the factor analysis are shown in Table 3. 4. Results
The first model Model 1 in Table 2 is a baseline model that shows the effects of control variables on the decision-making to enter foreign markets. In the second model Model 2 in Table 2, the main terms of the independent variables are entered into the regression.
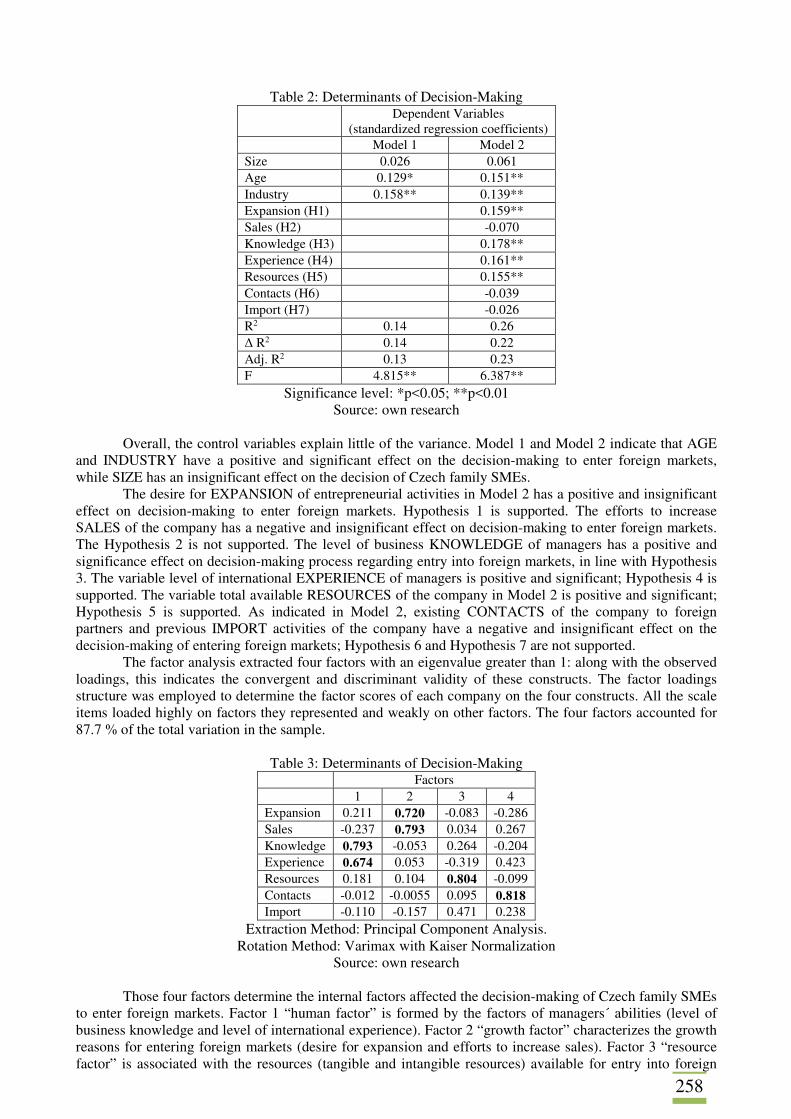
258
Table 2: Determinants of Decision-Making Dependent Variables
(standardized regression coefficients) Model 1 Model 2 Size 0.026 0.061 Age 0.129* 0.151** Industry 0.158** 0.139** Expansion (H1) 0.159** Sales (H2) -0.070 Knowledge (H3) 0.178** Experience (H4) 0.161** Resources (H5) 0.155** Contacts (H6) -0.039 Import (H7) -0.026 R2 0.14 0.26 Δ R2 0.14 0.22 Adj. R2 0.13 0.23 F 4.815** 6.387**
Significance level: *p<0.05; **p<0.01 Source: own research
Overall, the control variables explain little of the variance. Model 1 and Model 2 indicate that AGE
and INDUSTRY have a positive and significant effect on the decision-making to enter foreign markets, while SIZE has an insignificant effect on the decision of Czech family SMEs.
The desire for EXPANSION of entrepreneurial activities in Model 2 has a positive and insignificant effect on decision-making to enter foreign markets. Hypothesis 1 is supported. The efforts to increase SALES of the company has a negative and insignificant effect on decision-making to enter foreign markets. The Hypothesis 2 is not supported. The level of business KNOWLEDGE of managers has a positive and significance effect on decision-making process regarding entry into foreign markets, in line with Hypothesis 3. The variable level of international EXPERIENCE of managers is positive and significant; Hypothesis 4 is supported. The variable total available RESOURCES of the company in Model 2 is positive and significant; Hypothesis 5 is supported. As indicated in Model 2, existing CONTACTS of the company to foreign partners and previous IMPORT activities of the company have a negative and insignificant effect on the decision-making of entering foreign markets; Hypothesis 6 and Hypothesis 7 are not supported.
The factor analysis extracted four factors with an eigenvalue greater than 1: along with the observed loadings, this indicates the convergent and discriminant validity of these constructs. The factor loadings structure was employed to determine the factor scores of each company on the four constructs. All the scale items loaded highly on factors they represented and weakly on other factors. The four factors accounted for 87.7 % of the total variation in the sample.
Table 3: Determinants of Decision-Making Factors 1 2 3 4 Expansion 0.211 0.720 -0.083 -0.286 Sales -0.237 0.793 0.034 0.267 Knowledge 0.793 -0.053 0.264 -0.204 Experience 0.674 0.053 -0.319 0.423 Resources 0.181 0.104 0.804 -0.099 Contacts -0.012 -0.0055 0.095 0.818 Import -0.110 -0.157 0.471 0.238
Extraction Method: Principal Component Analysis. Rotation Method: Varimax with Kaiser Normalization
Source: own research
Those four factors determine the internal factors affected the decision-making of Czech family SMEs to enter foreign markets. Factor 1 “human factor” is formed by the factors of managers´ abilities (level of business knowledge and level of international experience). Factor 2 “growth factor” characterizes the growth reasons for entering foreign markets (desire for expansion and efforts to increase sales). Factor 3 “resource factor” is associated with the resources (tangible and intangible resources) available for entry into foreign
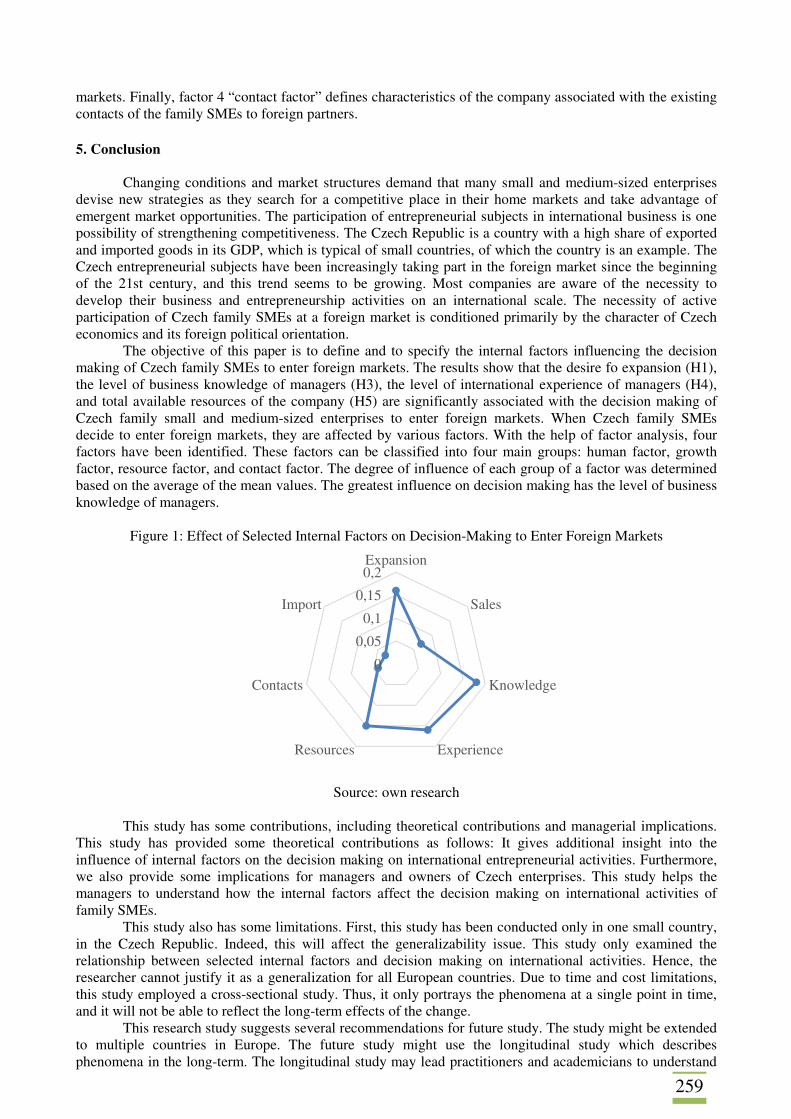
259
markets. Finally, factor 4 “contact factor” defines characteristics of the company associated with the existing contacts of the family SMEs to foreign partners.
5. Conclusion
Changing conditions and market structures demand that many small and medium-sized enterprises devise new strategies as they search for a competitive place in their home markets and take advantage of emergent market opportunities. The participation of entrepreneurial subjects in international business is one possibility of strengthening competitiveness. The Czech Republic is a country with a high share of exported and imported goods in its GDP, which is typical of small countries, of which the country is an example. The Czech entrepreneurial subjects have been increasingly taking part in the foreign market since the beginning of the 21st century, and this trend seems to be growing. Most companies are aware of the necessity to develop their business and entrepreneurship activities on an international scale. The necessity of active participation of Czech family SMEs at a foreign market is conditioned primarily by the character of Czech economics and its foreign political orientation.
The objective of this paper is to define and to specify the internal factors influencing the decision making of Czech family SMEs to enter foreign markets. The results show that the desire fo expansion (H1), the level of business knowledge of managers (H3), the level of international experience of managers (H4), and total available resources of the company (H5) are significantly associated with the decision making of Czech family small and medium-sized enterprises to enter foreign markets. When Czech family SMEs decide to enter foreign markets, they are affected by various factors. With the help of factor analysis, four factors have been identified. These factors can be classified into four main groups: human factor, growth factor, resource factor, and contact factor. The degree of influence of each group of a factor was determined based on the average of the mean values. The greatest influence on decision making has the level of business knowledge of managers.
Figure 1: Effect of Selected Internal Factors on Decision-Making to Enter Foreign Markets
Source: own research
This study has some contributions, including theoretical contributions and managerial implications.
This study has provided some theoretical contributions as follows: It gives additional insight into the influence of internal factors on the decision making on international entrepreneurial activities. Furthermore, we also provide some implications for managers and owners of Czech enterprises. This study helps the managers to understand how the internal factors affect the decision making on international activities of family SMEs.
This study also has some limitations. First, this study has been conducted only in one small country, in the Czech Republic. Indeed, this will affect the generalizability issue. This study only examined the relationship between selected internal factors and decision making on international activities. Hence, the researcher cannot justify it as a generalization for all European countries. Due to time and cost limitations, this study employed a cross-sectional study. Thus, it only portrays the phenomena at a single point in time, and it will not be able to reflect the long-term effects of the change.
This research study suggests several recommendations for future study. The study might be extended to multiple countries in Europe. The future study might use the longitudinal study which describes phenomena in the long-term. The longitudinal study may lead practitioners and academicians to understand
0
0,05
0,1
0,15
0,2Expansion
Sales
Knowledge
ExperienceResources
Contacts
Import
260
the causal relationship between factors (internal and external) and decision making on international activities. Acknowledgement
This paper is the outcome of the Student Competition Grant, project no. SGS 24/2016 (Silesian University in Opava) Lidské zdroje v rodinných podnicích – Human Resources in Family Businesses. References AABY, N. E., SLATER, S. F. (1989). Management Influences on Export Performance: A Review of the Empirical Literature 1978-88. International Marketing Review, vol. 6, no. 4, pp. 7-26. ACQUAAH, M., YASANI-ARDEKANI, M. (2007). Does the Implementation of a Combination Competitive Strategy Yield Incremental Performance Benefits? A New Perspective from a Transition Economy in Sub-Saharan Africa. Journal of Business Research, no. 61, pp. 346-354. ALMOR, T. (2006). Conceptualizing Path of Growth for the Born Global Firms. Annual Conference on Corporate Strategy: Berlin. ALMOR, T., HASHAI, N. (2004). Competitive Advantage and Strategic Configuration of Knowledge-Intensive, Small and Medium-Sized Multinationals: A Modified Resource-Based View. Journal of International Management, vol. 10, no. 4, pp. 479-500. AUTIO, E., SAPIENZA, H. J., ALMEIDA, J. G. (2000). Effects of Age a Entry, Knowledge Intensity and Imitability on International Growth. Academy of Management Journal. 2000, vol. 43, no. 5, pp. 909-924. BECKMAN, C. M., BURTON, M. D., O´REILLY, C. (2007). Early Teams: The Impact of Team Demography on VC Financing and Going Public. Journal of Business Venturing, vol. 22, no. 2, pp. 147-273. BRADLEY, F., MEYER, R., GAO, Y. (2006). Use of supplier-customer relationships by SMEs to enter foreign markets. Industrial Marketing Management, no. 35, pp. 652-665. EUROSTAT. (2011). Summary Indicators - Employment Size Classes for EU25/EU27 (all NACE activities). [online]. Available from: http://appsso.eurostat.ec.europa.eu/nui/setupModifyTableLayout.do. FILATOTCHEV, I., LIU, X., BUCK, T., WRIGHT, M. (2009). The Export Orientation and Export Performance of High-Technology SMEs in Emerging Markets: The Effects of Knowledge Transfer by Returnee Entrepreneurs. Journal of International Business Studies, no. 40, pp. 1005-1021. GABRIELSSON, M., KIRPALANI, V. H. (2004). Born Globals: How to Reach New Business Space Rapidly. International Business Review, vol. 13, no. 5, pp. 555-571. HOLLENSTEIN, H. (2005). Determinants of international activities: Are SMEs different? Small Business Economics, vol. 24, no. 5, pp. 431-450. JAROSIŃSKI, M. (2013). Contemporary Models of Polish Firms´ Internationalization. Journal of Economics and Management, no. 13, pp. 57-65. JOHANSON, J., VAHLNE, J. E. (1977). The internationalization process of the firm—A model of knowledge development and increasing foreign market commitments. Journal of International Business Studies, no. 8, pp. 23-32.
261
JONES, M. V., COVIELLO, N. E. (2005). Internationalization: Conceptualising an Entrepreneurial Process of Behaviour in Time. Journal of International Business Studies, vol. 36, no. 3, pp. 284-303. KEUPP, M. M., GASSMANN, O. (2009). The Past and the Future of International Entrepreneurship: A Review and Suggestions for Developing the Field. Journal of Management, vol. 35, no. 3, pp. 600-633. KNIGHT, G. A., CAVUSGIL, S. T. (2004). Innovation, Organizational Capabilities, and the Born-Global Firm. Journal of International Business Studies, vol. 35, no. 2, pp. 124-141. KOCH, A. J. (2001). Factors influencing market and entry mode selection: Developing the MEMS model. Marketing Intelligence & Planning, vol. 19, no. 5, pp. 411-432. ONKELIX, J., MANOLOVA, T. S., EDELMAN, L. F. (2016). Human Capital and SME Internationalization: Empirical Evidence from Belgium. International Small Business Journal, vol. 34, no. 6, pp. 818-837. TETHER, B. S., SMITH, I. J., THWAITES, A. T. (1997). Smaller enterprises and innovation in the UK: The SPRU innovations database revisited. Reserach Policy, vol. 26, no. 1, pp. 19-32. UHLENBRUCK, K., DECASTRO, J. O. (2000). Foreign Acquisitions in Central and Eastern Europe: Outcomes of Privatization in Transitional Economies. Academy of Management Journal, vol. 43, no. 3, pp. 381-402. WALES, W. J., GUPTA, V. K., MOUSA, F. T. (2013). Empirical Research on Entrepreneurial Orientation: As Assessment and Suggestions for Future Research. International Small Business Journal, vol. 31, no. 4, pp. 357-383. WALSKE, J. M., ZACHARAKIS, A. (2009). Genetically Engineered: Why Some Venture Capital Firms are more Successful than Others. Entrepreneurship: Theory and Practice, vol. 33, no. 1, pp. 297-318. WEINZIMMER, L. G., NYSTROM, P. C., FREEMAN, S. J. (1998). Measuring Organizational Growth: Issues, Consequences and Guidelines. Journal of Management, vol. 24, no. 2, pp. 235-262. WRIGHT, M., WESTHEAD, P., UCBASARAN, D. (2007). Internationalization of small and medium-sized enterprises (smes) and international entrepreneurship: A critique and policy implications. Regional Studies, vol. 41, no. 7, pp. 1013 – 1029. YAP, C., SOUDER, W. (1994). Factors influencing new product success and failure in small entrepreneurial high-technology electronic firms. Journal of Product Innovation Management, no. 11, pp. 418-432. ZACHARAKIS, A. (1997). Entrepreneurial entry into foreign markets: A transaction cost perspective. Entrepreneurship Theory & Practice, vol. 21, no. 3, pp. 23-39.
262
THE LEGITIMACY OF THE IMPLEMENTATION OF THE REQUIREMENTS OF ISO 9001: 2015 IN SMALL AND MEDIUM-SIZED ORGANIZATIONS Dominik Zimon Rzeszow University of Technology Department of Management Systems and Logistics al. Powstańców Warszawy 10 Rzeszow, 35-959 Poland e-mail: [email protected] Teresa Gajewska Cracow University of Technology, Division of Logistics System Al. Jana Pawla II 37 Cracow, 31-864 Poland e-mail: [email protected] Abstract
The main aim of the publication was an attempt to determine how representatives of small and medium organizations perceive changes in ISO 9001: 2015. In pursuit of this goal, a research process was carried out which covered 76 employees (23 management representatives and 53 middle managers) employed in 23 small and medium sized organizations operating in south-eastern Poland (It was imperative that each of the organizations under test had a quality management system implemented and certified in accordance with ISO 9001). The research was conducted at the turn of January and February 2017, using a research tool such as a questionnaire, which was consisted of eight questions both open and closed. the research process has allowed the following conclusions, which may affect the decision stuff in implementation of the requirements of ISO 9001: according to a majority of the respondents, the changes introduced in ISO 9001: 2015 are not revolutionary enough to be considered as a response to the needs of small and medium-sized organizations, the respondents considered the need for defining the context of the organization as the highest rated change, changes to the standard structure and references to knowledge management were considered the least necessary changes for smaller organizations. Keywords: ISO 9001:2015, Management systems, SMEs. JEL codes: D2, D21. 1. Introduction
Small and medium-sized organizations undoubtedly are forced to look for new solutions and ideas to improve their functioning. Therefore, the implementation of standardized quality management systems in small and medium-sized organizations will increase in the coming years (Vorkapić et al., 2017; Ejdys and Matuszak‐Flejszman, 2010). This is evidenced among other things, increasing the number of certificates to be granted to small and medium-sized enterprises in Poland and Europe. With the increase of the number of implemented quality management systems in small and medium organizations, the number of difficulties encountered in implementing the system is increasing. These difficulties are largely due to the specifics of small and medium-sized organizations. The companies representing this sector are characterized by certain limitations and barriers determining their way of functioning (Kartiwi and Macgregor, 2007; Abdullah et al., 2013):
• limited financial opportunities, • significant costs of running this type of organization, • high cost of raising capital from external sources, • insufficient level of knowledge and lack of adequate management skills, • lack of suitably qualified staff, • the lack of a clearly defined division of powers,
263
• too high research and development costs in relation to the budget of this type of organization,
• highly restrictive training budget, • the lack of a clearly defined strategy.
The above list clearly indicates that implementing a standardized quality management system in small and medium organizations is a complex issue. According to Herasa-Saizarbitoria and Boirala (2015), the main obstacle for small and medium-sized enterprises is the fact that the requirements of the ISO 9001 standard necessitate some formalization of measures. By contrast, a typical smaller company limits the number of documents to a minimum. The researchers also point out that significant obstacles for small and medium-sized organizations on the path to the certificate is undoubtedly the lack of specify policies, strategies and the heavy burden of management and personnel.
Citing research conducted by Ligarskiego and Koczaj (2004) small and medium-sized organizations in the implementation of quality management systems encounter difficulties mainly in the field:
• preparation of system documentation, • carrying out monitoring and measurement, • involvement and qualifications of employees, • contacts with suppliers.
The above mentioned problems are largely due to staffing difficulties and limited budget of small and medium commercial organizations. On the other hand, Zimon (2017) based on his observations to the most problematic areas that make difficulty for smaller organizations include:
• the need to hire additional specialists, • high training costs, • financial problems, • problems with preparation for audits.
Bearing in mind the above considerations, it should be noted that the specificity of small and medium-sized enterprises should be specifically addressed in ISO 9001. The research conducted by the authors of this publication and the review of literature shows that the ISO 9001: 2008 standard was not fully adapted to the requirements of smaller organizations (Zimon and Bednarova, 2016; Wolniak, 2013; Filina-Dawidowicz, 2014). The authors of the ISO standard have perceived this fact, and in the amendment of the year 2015 they have implemented some changes that aimed not only at matching the requirements of the standard to market changes but also its deformations and adapting to the needs of small non-production organizations.
The impetus to undertake research in this area was the fact that small and medium-sized organizations, in particular those in which it operates a certified quality management system, are interested in the essence of the changes introduced next release standards possible due to the need to modernize the management system and make changes in documentation (Kerekes and Csernátoni, 2016). It is worth recalling that in the past adjustment of the quality management system to the currently applicable standards often meant the need for changes in the structure of the organization and even redesign of processes. The ISO 9001: 2015 standard is not revolutionary but contains a number of changes that may be difficult to interpret (Anttila and Jussila, 2017; Tatoglu et al., 2016; ). And their correct implementation can be a problem especially for smaller companies (Rybski et al., 2017). These changes may include, among others (Wilson and Campbell, 2016; Chiarini, 2017; Savino et al., 2017; Fonseca and Domingues, 2016):
• understanding the organization and its context, • strengthening the role of top management, • change of norm structure, • a risk-based approach, • flexible approach to documentation, • introduction of knowledge requirements.
2. Research Methodology
The main aim of the publication was an attempt to determine how representatives of small and
medium organizations perceive changes in ISO 9001: 2015. The explanation of this general research problem and the refinement of research issues prompted the authors to formulate the following research questions:
• How do small and medium-sized organizations assess the key changes introduced in ISO 9001: 2015?
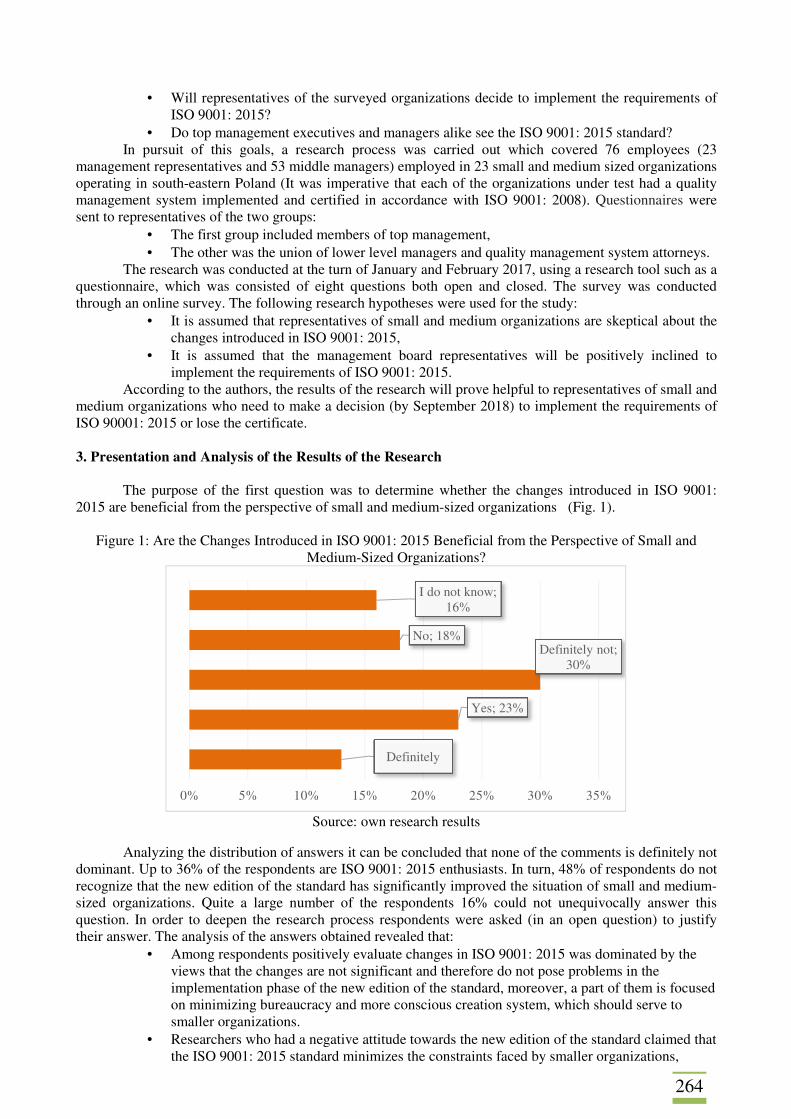
264
• Will representatives of the surveyed organizations decide to implement the requirements of ISO 9001: 2015?
• Do top management executives and managers alike see the ISO 9001: 2015 standard? In pursuit of this goals, a research process was carried out which covered 76 employees (23
management representatives and 53 middle managers) employed in 23 small and medium sized organizations operating in south-eastern Poland (It was imperative that each of the organizations under test had a quality management system implemented and certified in accordance with ISO 9001: 2008). Questionnaires were sent to representatives of the two groups:
• The first group included members of top management, • The other was the union of lower level managers and quality management system attorneys.
The research was conducted at the turn of January and February 2017, using a research tool such as a questionnaire, which was consisted of eight questions both open and closed. The survey was conducted through an online survey. The following research hypotheses were used for the study:
• It is assumed that representatives of small and medium organizations are skeptical about the changes introduced in ISO 9001: 2015,
• It is assumed that the management board representatives will be positively inclined to implement the requirements of ISO 9001: 2015.
According to the authors, the results of the research will prove helpful to representatives of small and medium organizations who need to make a decision (by September 2018) to implement the requirements of ISO 90001: 2015 or lose the certificate.
3. Presentation and Analysis of the Results of the Research
The purpose of the first question was to determine whether the changes introduced in ISO 9001: 2015 are beneficial from the perspective of small and medium-sized organizations (Fig. 1).
Figure 1: Are the Changes Introduced in ISO 9001: 2015 Beneficial from the Perspective of Small and
Medium-Sized Organizations?
Source: own research results
Analyzing the distribution of answers it can be concluded that none of the comments is definitely not
dominant. Up to 36% of the respondents are ISO 9001: 2015 enthusiasts. In turn, 48% of respondents do not recognize that the new edition of the standard has significantly improved the situation of small and medium-sized organizations. Quite a large number of the respondents 16% could not unequivocally answer this question. In order to deepen the research process respondents were asked (in an open question) to justify their answer. The analysis of the answers obtained revealed that:
• Among respondents positively evaluate changes in ISO 9001: 2015 was dominated by the views that the changes are not significant and therefore do not pose problems in the implementation phase of the new edition of the standard, moreover, a part of them is focused on minimizing bureaucracy and more conscious creation system, which should serve to smaller organizations.
• Researchers who had a negative attitude towards the new edition of the standard claimed that the ISO 9001: 2015 standard minimizes the constraints faced by smaller organizations,
Definitely
Yes; 23%
Definitely not; 30%
No; 18%
I do not know; 16%
0% 5% 10% 15% 20% 25% 30% 35%
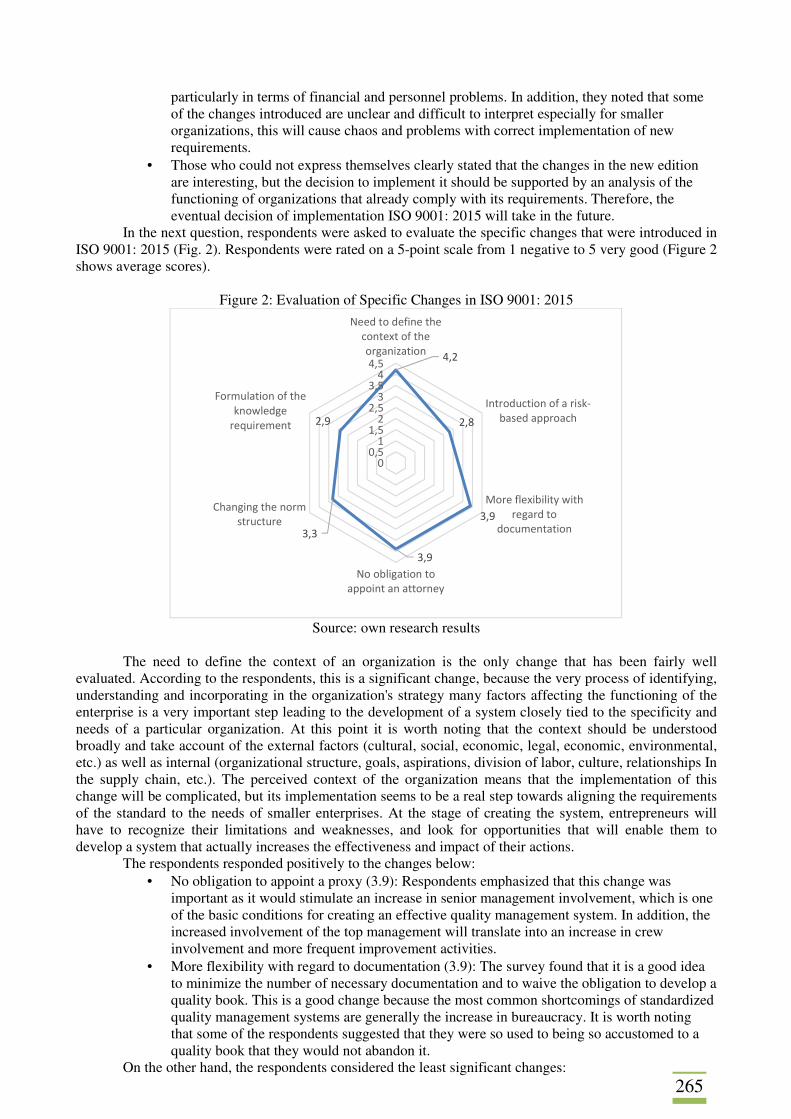
265
particularly in terms of financial and personnel problems. In addition, they noted that some of the changes introduced are unclear and difficult to interpret especially for smaller organizations, this will cause chaos and problems with correct implementation of new requirements.
• Those who could not express themselves clearly stated that the changes in the new edition are interesting, but the decision to implement it should be supported by an analysis of the functioning of organizations that already comply with its requirements. Therefore, the eventual decision of implementation ISO 9001: 2015 will take in the future.
In the next question, respondents were asked to evaluate the specific changes that were introduced in ISO 9001: 2015 (Fig. 2). Respondents were rated on a 5-point scale from 1 negative to 5 very good (Figure 2 shows average scores).
Figure 2: Evaluation of Specific Changes in ISO 9001: 2015
Source: own research results
The need to define the context of an organization is the only change that has been fairly well
evaluated. According to the respondents, this is a significant change, because the very process of identifying, understanding and incorporating in the organization's strategy many factors affecting the functioning of the enterprise is a very important step leading to the development of a system closely tied to the specificity and needs of a particular organization. At this point it is worth noting that the context should be understood broadly and take account of the external factors (cultural, social, economic, legal, economic, environmental, etc.) as well as internal (organizational structure, goals, aspirations, division of labor, culture, relationships In the supply chain, etc.). The perceived context of the organization means that the implementation of this change will be complicated, but its implementation seems to be a real step towards aligning the requirements of the standard to the needs of smaller enterprises. At the stage of creating the system, entrepreneurs will have to recognize their limitations and weaknesses, and look for opportunities that will enable them to develop a system that actually increases the effectiveness and impact of their actions.
The respondents responded positively to the changes below: • No obligation to appoint a proxy (3.9): Respondents emphasized that this change was
important as it would stimulate an increase in senior management involvement, which is one of the basic conditions for creating an effective quality management system. In addition, the increased involvement of the top management will translate into an increase in crew involvement and more frequent improvement activities.
• More flexibility with regard to documentation (3.9): The survey found that it is a good idea to minimize the number of necessary documentation and to waive the obligation to develop a quality book. This is a good change because the most common shortcomings of standardized quality management systems are generally the increase in bureaucracy. It is worth noting that some of the respondents suggested that they were so used to being so accustomed to a quality book that they would not abandon it.
On the other hand, the respondents considered the least significant changes:
4,2
2,8
3,9
3,9
3,3
2,9
00,5
11,5
22,5
33,5
44,5
Need to define the
context of the
organization
Introduction of a risk-
based approach
More flexibility with
regard to
documentation
No obligation to
appoint an attorney
Changing the norm
structure
Formulation of the
knowledge
requirement
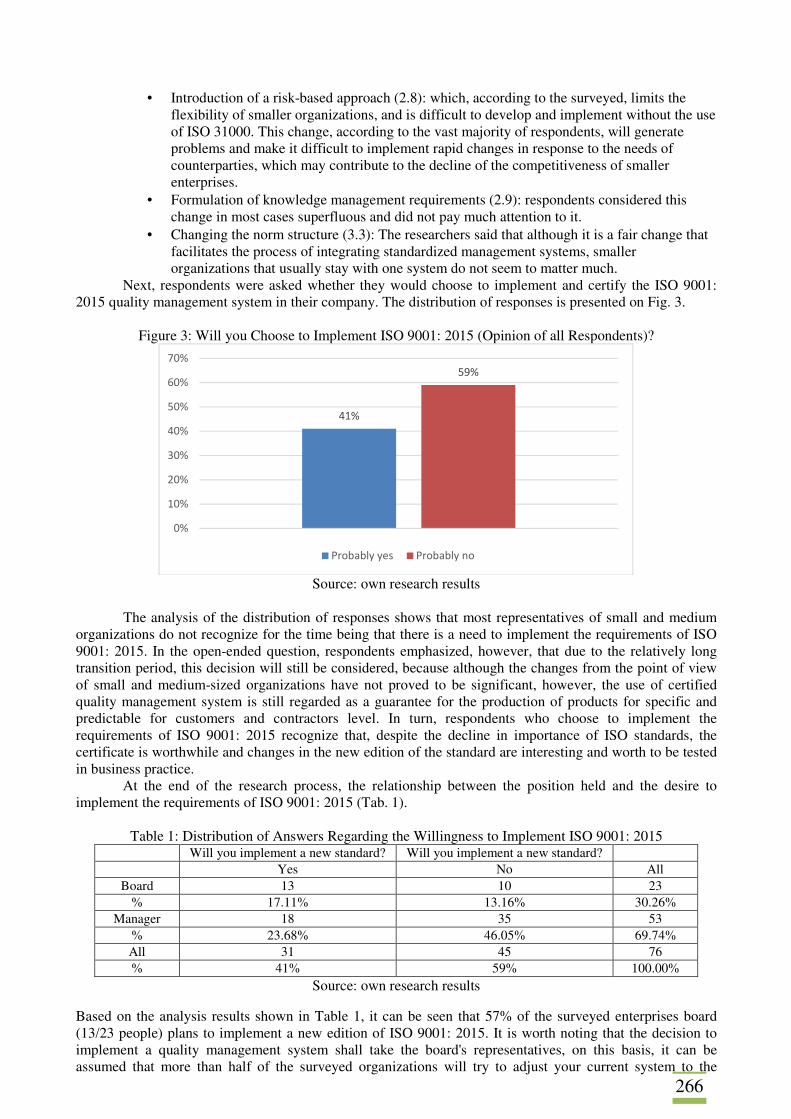
266
• Introduction of a risk-based approach (2.8): which, according to the surveyed, limits the flexibility of smaller organizations, and is difficult to develop and implement without the use of ISO 31000. This change, according to the vast majority of respondents, will generate problems and make it difficult to implement rapid changes in response to the needs of counterparties, which may contribute to the decline of the competitiveness of smaller enterprises.
• Formulation of knowledge management requirements (2.9): respondents considered this change in most cases superfluous and did not pay much attention to it.
• Changing the norm structure (3.3): The researchers said that although it is a fair change that facilitates the process of integrating standardized management systems, smaller organizations that usually stay with one system do not seem to matter much.
Next, respondents were asked whether they would choose to implement and certify the ISO 9001: 2015 quality management system in their company. The distribution of responses is presented on Fig. 3.
Figure 3: Will you Choose to Implement ISO 9001: 2015 (Opinion of all Respondents)?
Source: own research results
The analysis of the distribution of responses shows that most representatives of small and medium
organizations do not recognize for the time being that there is a need to implement the requirements of ISO 9001: 2015. In the open-ended question, respondents emphasized, however, that due to the relatively long transition period, this decision will still be considered, because although the changes from the point of view of small and medium-sized organizations have not proved to be significant, however, the use of certified quality management system is still regarded as a guarantee for the production of products for specific and predictable for customers and contractors level. In turn, respondents who choose to implement the requirements of ISO 9001: 2015 recognize that, despite the decline in importance of ISO standards, the certificate is worthwhile and changes in the new edition of the standard are interesting and worth to be tested in business practice.
At the end of the research process, the relationship between the position held and the desire to implement the requirements of ISO 9001: 2015 (Tab. 1).
Table 1: Distribution of Answers Regarding the Willingness to Implement ISO 9001: 2015
Will you implement a new standard? Will you implement a new standard? Yes No All
Board 13 10 23 % 17.11% 13.16% 30.26%
Manager 18 35 53 % 23.68% 46.05% 69.74% All 31 45 76 % 41% 59% 100.00%
Source: own research results
Based on the analysis results shown in Table 1, it can be seen that 57% of the surveyed enterprises board (13/23 people) plans to implement a new edition of ISO 9001: 2015. It is worth noting that the decision to implement a quality management system shall take the board's representatives, on this basis, it can be assumed that more than half of the surveyed organizations will try to adjust your current system to the
41%
59%
0%
10%
20%
30%
40%
50%
60%
70%
Probably yes Probably no
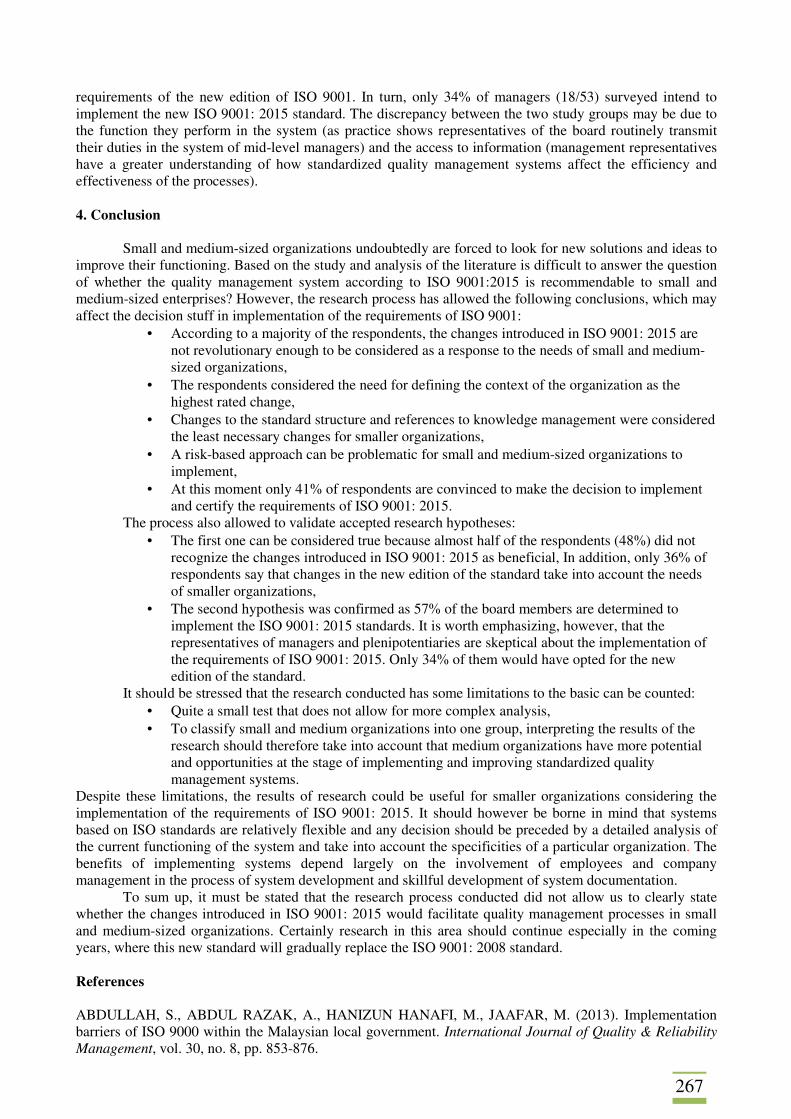
267
requirements of the new edition of ISO 9001. In turn, only 34% of managers (18/53) surveyed intend to implement the new ISO 9001: 2015 standard. The discrepancy between the two study groups may be due to the function they perform in the system (as practice shows representatives of the board routinely transmit their duties in the system of mid-level managers) and the access to information (management representatives have a greater understanding of how standardized quality management systems affect the efficiency and effectiveness of the processes). 4. Conclusion
Small and medium-sized organizations undoubtedly are forced to look for new solutions and ideas to improve their functioning. Based on the study and analysis of the literature is difficult to answer the question of whether the quality management system according to ISO 9001:2015 is recommendable to small and medium-sized enterprises? However, the research process has allowed the following conclusions, which may affect the decision stuff in implementation of the requirements of ISO 9001:
• According to a majority of the respondents, the changes introduced in ISO 9001: 2015 are not revolutionary enough to be considered as a response to the needs of small and medium-sized organizations,
• The respondents considered the need for defining the context of the organization as the highest rated change,
• Changes to the standard structure and references to knowledge management were considered the least necessary changes for smaller organizations,
• A risk-based approach can be problematic for small and medium-sized organizations to implement,
• At this moment only 41% of respondents are convinced to make the decision to implement and certify the requirements of ISO 9001: 2015.
The process also allowed to validate accepted research hypotheses: • The first one can be considered true because almost half of the respondents (48%) did not
recognize the changes introduced in ISO 9001: 2015 as beneficial, In addition, only 36% of respondents say that changes in the new edition of the standard take into account the needs of smaller organizations,
• The second hypothesis was confirmed as 57% of the board members are determined to implement the ISO 9001: 2015 standards. It is worth emphasizing, however, that the representatives of managers and plenipotentiaries are skeptical about the implementation of the requirements of ISO 9001: 2015. Only 34% of them would have opted for the new edition of the standard.
It should be stressed that the research conducted has some limitations to the basic can be counted: • Quite a small test that does not allow for more complex analysis, • To classify small and medium organizations into one group, interpreting the results of the
research should therefore take into account that medium organizations have more potential and opportunities at the stage of implementing and improving standardized quality management systems.
Despite these limitations, the results of research could be useful for smaller organizations considering the implementation of the requirements of ISO 9001: 2015. It should however be borne in mind that systems based on ISO standards are relatively flexible and any decision should be preceded by a detailed analysis of the current functioning of the system and take into account the specificities of a particular organization. The benefits of implementing systems depend largely on the involvement of employees and company management in the process of system development and skillful development of system documentation.
To sum up, it must be stated that the research process conducted did not allow us to clearly state whether the changes introduced in ISO 9001: 2015 would facilitate quality management processes in small and medium-sized organizations. Certainly research in this area should continue especially in the coming years, where this new standard will gradually replace the ISO 9001: 2008 standard. References ABDULLAH, S., ABDUL RAZAK, A., HANIZUN HANAFI, M., JAAFAR, M. (2013). Implementation barriers of ISO 9000 within the Malaysian local government. International Journal of Quality & Reliability Management, vol. 30, no. 8, pp. 853-876.
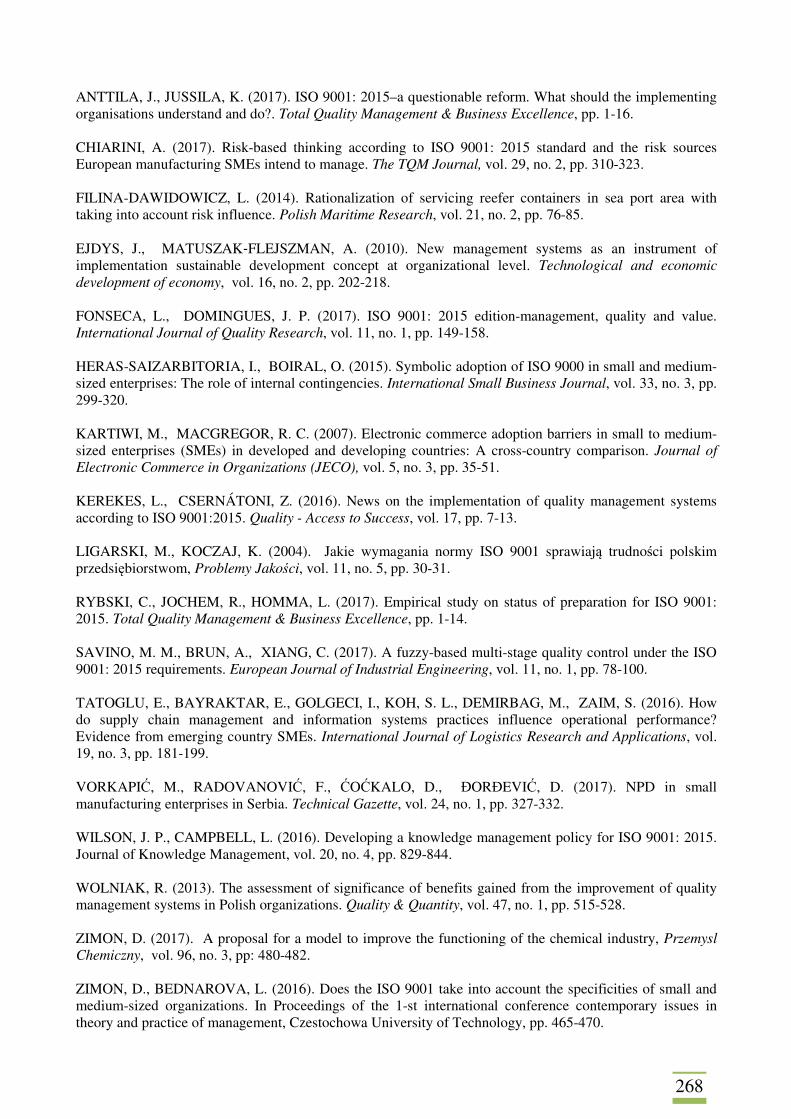
268
ANTTILA, J., JUSSILA, K. (2017). ISO 9001: 2015–a questionable reform. What should the implementing organisations understand and do?. Total Quality Management & Business Excellence, pp. 1-16. CHIARINI, A. (2017). Risk-based thinking according to ISO 9001: 2015 standard and the risk sources European manufacturing SMEs intend to manage. The TQM Journal, vol. 29, no. 2, pp. 310-323. FILINA-DAWIDOWICZ, L. (2014). Rationalization of servicing reefer containers in sea port area with taking into account risk influence. Polish Maritime Research, vol. 21, no. 2, pp. 76-85. EJDYS, J., MATUSZAK‐FLEJSZMAN, A. (2010). New management systems as an instrument of implementation sustainable development concept at organizational level. Technological and economic development of economy, vol. 16, no. 2, pp. 202-218. FONSECA, L., DOMINGUES, J. P. (2017). ISO 9001: 2015 edition-management, quality and value. International Journal of Quality Research, vol. 11, no. 1, pp. 149-158. HERAS-SAIZARBITORIA, I., BOIRAL, O. (2015). Symbolic adoption of ISO 9000 in small and medium-sized enterprises: The role of internal contingencies. International Small Business Journal, vol. 33, no. 3, pp. 299-320. KARTIWI, M., MACGREGOR, R. C. (2007). Electronic commerce adoption barriers in small to medium-sized enterprises (SMEs) in developed and developing countries: A cross-country comparison. Journal of Electronic Commerce in Organizations (JECO), vol. 5, no. 3, pp. 35-51. KEREKES, L., CSERNÁTONI, Z. (2016). News on the implementation of quality management systems according to ISO 9001:2015. Quality - Access to Success, vol. 17, pp. 7-13. LIGARSKI, M., KOCZAJ, K. (2004). Jakie wymagania normy ISO 9001 sprawiają trudności polskim przedsiębiorstwom, Problemy Jakości, vol. 11, no. 5, pp. 30-31. RYBSKI, C., JOCHEM, R., HOMMA, L. (2017). Empirical study on status of preparation for ISO 9001: 2015. Total Quality Management & Business Excellence, pp. 1-14. SAVINO, M. M., BRUN, A., XIANG, C. (2017). A fuzzy-based multi-stage quality control under the ISO 9001: 2015 requirements. European Journal of Industrial Engineering, vol. 11, no. 1, pp. 78-100. TATOGLU, E., BAYRAKTAR, E., GOLGECI, I., KOH, S. L., DEMIRBAG, M., ZAIM, S. (2016). How do supply chain management and information systems practices influence operational performance? Evidence from emerging country SMEs. International Journal of Logistics Research and Applications, vol. 19, no. 3, pp. 181-199. VORKAPIĆ, M., RADOVANOVIĆ, F., ĆOĆKALO, D., ĐORĐEVIĆ, D. (2017). NPD in small manufacturing enterprises in Serbia. Technical Gazette, vol. 24, no. 1, pp. 327-332. WILSON, J. P., CAMPBELL, L. (2016). Developing a knowledge management policy for ISO 9001: 2015. Journal of Knowledge Management, vol. 20, no. 4, pp. 829-844. WOLNIAK, R. (2013). The assessment of significance of benefits gained from the improvement of quality management systems in Polish organizations. Quality & Quantity, vol. 47, no. 1, pp. 515-528. ZIMON, D. (2017). A proposal for a model to improve the functioning of the chemical industry, Przemysl Chemiczny, vol. 96, no. 3, pp: 480-482. ZIMON, D., BEDNAROVA, L. (2016). Does the ISO 9001 take into account the specificities of small and medium-sized organizations. In Proceedings of the 1-st international conference contemporary issues in theory and practice of management, Czestochowa University of Technology, pp. 465-470.

269
ZIMON, G., ZIMON, D. (2016). Influence of logistics on profitability of commercial companies. In. Carpathian logistics congress - conference proceedings, Jesenik, pp. 565-570.
International conference on Decision making for Small and Medium-Sized Enterprises (DEMSME 2017) Conference Proceedings Edited by Petr Suchánek Roman Šperka Šárka Čemerková Radim Dolák Responsible Editors Šárka Čemerková and Radim Dolák Typeset by Radim Dolák using MS Word Cover layout by Lenka Přečková Linguistic revision of the texts was not undertaken. Published by Silesian University in Opava School of Business Administration in Karvina Univerzitní nám. 1934/3 733 40 Karvina Czech Republic www.slu.cz/opf/en/ Printed by X-MEDIA servis s.r.o. First edition Karviná 2017 ISBN 978-80-7510-243-0

Title: International conference on Decision making for Small and Medium-Sized Enterprises. Conference Proceedings
Editors: Petr Suchánek, Roman Šperka, Šárka Čemerková, Radim Dolák
Publisher: Silesian University in Opava School of Business Administration in Karviná
Number of pages: 269
Number of copies: 50
Printing Office: X-MEDIA servis s.r.o., Ostrava
Karviná 2017
ISBN 978-80-7510-243-0
Related Documents