RESEARCH ARTICLE Open Access Decision maker perceptions of resource allocation processes in Canadian health care organizations: a national survey Neale Smith 1* , Craig Mitton 1,2 , Stirling Bryan 1,2 , Alan Davidson 3 , Bonnie Urquhart 4 , Jennifer L Gibson 5,6 , Stuart Peacock 2,7,8 and Cam Donaldson 9 Abstract Background: Resource allocation is a key challenge for healthcare decision makers. While several case studies of organizational practice exist, there have been few large-scale cross-organization comparisons. Methods: Between January and April 2011, we conducted an on-line survey of senior decision makers within regional health authorities (and closely equivalent organizations) across all Canadian provinces and territories. We received returns from 92 individual managers, from 60 out of 89 organizations in total. The survey inquired about structures, process features, and behaviours related to organization-wide resource allocation decisions. We focus here on three main aspects: type of process, perceived fairness, and overall rating. Results: About one-half of respondents indicated that their organization used a formal process for resource allocation, while the others reported that political or historical factors were predominant. Seventy percent (70%) of respondents self-reported that their resource allocation process was fair and just over one-half assessed their process as ‘good’ or ‘very good’. This paper explores these findings in greater detail and assesses them in context of the larger literature. Conclusion: Data from this large-scale cross-jurisdictional survey helps to illustrate common challenges and areas of positive performance among Canada’s health system leadership teams. Keywords: Resource allocation, Priority setting, Survey research, Canada Background Resource allocation is a central function of all healthcare delivery systems. We know that priority setting and re- source allocation processes need to be both economic- ally sound (making best use of resources to maximize health benefit) and ethical –fair and transparent [1-3]. Evidence from many countries suggests that decision makers struggle to assemble and use relevant evidence [4-7], and to engage clinical stakeholders [8,9] and the public [10-12] in a meaningful fashion. Institutional and cultural barriers stand in the way [13-15]. Our knowledge has accumulated largely through case studies of individual organizations, in Canada [16-22] and elsewhere [23-25]. However cross-jurisdictional, cross- sectional studies of decision makers’ perspectives are rela- tively few. Some large-scale surveys have been conducted among planning and service delivery agencies within the UK National Health Service; Greener & Powell [26] sought replies from 121 health authorities, while Robinson et al. [27] surveyed 152 Primary Care Trusts. Because primary constitutional authority for organization of healthcare delivery systems in Canada rests with the provincial and territorial jurisdictions, a pan-Canadian survey could potentially be a very rich source of information on political, institutional and cultural factors that influence resource al- location efforts among senior managers with service deliv- ery responsibility. * Correspondence: [email protected] 1 Centre for Clinical Epidemiology & Evaluation, Vancouver Coastal Health Research Institute, 7th floor, 828 W 10 Avenue, V5Z1M9, Vancouver, BC, Canada Full list of author information is available at the end of the article © 2013 Smith et al.; licensee BioMed Central Ltd. This is an Open Access article distributed under the terms of the Creative Commons Attribution License (http://creativecommons.org/licenses/by/2.0), which permits unrestricted use, distribution, and reproduction in any medium, provided the original work is properly cited. Smith et al. BMC Health Services Research 2013, 13:247 http://www.biomedcentral.com/1472-6963/13/247

Welcome message from author
This document is posted to help you gain knowledge. Please leave a comment to let me know what you think about it! Share it to your friends and learn new things together.
Transcript
Smith et al. BMC Health Services Research 2013, 13:247http://www.biomedcentral.com/1472-6963/13/247
RESEARCH ARTICLE Open Access
Decision maker perceptions of resource allocationprocesses in Canadian health care organizations:a national surveyNeale Smith1*, Craig Mitton1,2, Stirling Bryan1,2, Alan Davidson3, Bonnie Urquhart4, Jennifer L Gibson5,6,Stuart Peacock2,7,8 and Cam Donaldson9
Abstract
Background: Resource allocation is a key challenge for healthcare decision makers. While several case studies oforganizational practice exist, there have been few large-scale cross-organization comparisons.
Methods: Between January and April 2011, we conducted an on-line survey of senior decision makers withinregional health authorities (and closely equivalent organizations) across all Canadian provinces and territories. Wereceived returns from 92 individual managers, from 60 out of 89 organizations in total. The survey inquired aboutstructures, process features, and behaviours related to organization-wide resource allocation decisions. We focushere on three main aspects: type of process, perceived fairness, and overall rating.
Results: About one-half of respondents indicated that their organization used a formal process for resourceallocation, while the others reported that political or historical factors were predominant. Seventy percent (70%) ofrespondents self-reported that their resource allocation process was fair and just over one-half assessed theirprocess as ‘good’ or ‘very good’. This paper explores these findings in greater detail and assesses them in context ofthe larger literature.
Conclusion: Data from this large-scale cross-jurisdictional survey helps to illustrate common challenges and areasof positive performance among Canada’s health system leadership teams.
Keywords: Resource allocation, Priority setting, Survey research, Canada
BackgroundResource allocation is a central function of all healthcaredelivery systems. We know that priority setting and re-source allocation processes need to be both economic-ally sound (making best use of resources to maximizehealth benefit) and ethical –fair and transparent [1-3].Evidence from many countries suggests that decisionmakers struggle to assemble and use relevant evidence[4-7], and to engage clinical stakeholders [8,9] and thepublic [10-12] in a meaningful fashion. Institutional andcultural barriers stand in the way [13-15].
* Correspondence: [email protected] for Clinical Epidemiology & Evaluation, Vancouver Coastal HealthResearch Institute, 7th floor, 828 W 10 Avenue, V5Z1M9, Vancouver, BC,CanadaFull list of author information is available at the end of the article
© 2013 Smith et al.; licensee BioMed Central LCommons Attribution License (http://creativecreproduction in any medium, provided the or
Our knowledge has accumulated largely through casestudies of individual organizations, in Canada [16-22]and elsewhere [23-25]. However cross-jurisdictional, cross-sectional studies of decision makers’ perspectives are rela-tively few. Some large-scale surveys have been conductedamong planning and service delivery agencies within theUK National Health Service; Greener & Powell [26] soughtreplies from 121 health authorities, while Robinson et al.[27] surveyed 152 Primary Care Trusts. Because primaryconstitutional authority for organization of healthcaredelivery systems in Canada rests with the provincialand territorial jurisdictions, a pan-Canadian survey couldpotentially be a very rich source of information on political,institutional and cultural factors that influence resource al-location efforts among senior managers with service deliv-ery responsibility.
td. This is an Open Access article distributed under the terms of the Creativeommons.org/licenses/by/2.0), which permits unrestricted use, distribution, andiginal work is properly cited.
Smith et al. BMC Health Services Research 2013, 13:247 Page 2 of 10http://www.biomedcentral.com/1472-6963/13/247
In the early days of regionalization in Canadian healthservices, Lomas, Veenstra and Woods surveyed boardmembers, rather than senior executives, about variousactivities including priority setting and resource alloca-tion [28]. Mitton and Donaldson studied opinions ofdecision makers in three regional authorities in Alberta[29]; Menon, Stafinski and Martin subsequently en-gaged senior managers and board members in sevenAlberta health regions [30]. Both the latter two studiesused semi-structured in-person interviews as their mainmethod. They found that resource allocation is oftendone on a historical basis, with budgets essentiallyrolling over from one year to the next. Limited dataavailability was also mentioned as a barrier to ‘good’practice. Lack of clinical engagement was also seenas a problem worth addressing.In this paper, we report on a national survey of senior
decision makers in Canadian health organizations. Thesurvey captures decision makers’ views from a much lar-ger number of organizations than previously seen, acrossdifferent geographies and sizes, including smaller andmore rural organizations that have not been typicallystudied. We anticipate that this paper will be of particu-lar interest to decision-makers in Canada, who may findit useful to see the state of play in other organizations,to identify ways in which they might learn from practiceselsewhere, and to generate ideas for leading change ef-forts in their own organizations. Internationally, seniordecision-makers who are committed to the pursuit ofexcellence in managing health system resources and toachieving ‘high performance’ [31,32] may also learnsomething of how to operationalize this in practice.In the following sections, we first outline our survey
methodology. Results are presented in four sections. Webegin with information about individual respondentsand their organizations. We then focus on descriptivefindings related to three research questions:
1. What type of resource allocation processes are usedby Canadian healthcare organizations? Literaturesuggests that in Canada and elsewhere, healthcareorganizations typically allocate resources on thebasis of historical patterns –‘locking in’ to pastbudget choices [26] -- and/or political rationales[7,33,34], and there are powerful institutional andcultural reasons why this is so [35,36]. However,senior decision makers reportedly desire increasedformalization or rationality in priority settingpractice [16,20,37-39]. Our aim in the survey was toexplore the balance between these different modesin a quantifiable way.
2. Do decision makers in these organizations perceivethat these processes are fair? Considerable literaturehas made the case that priority setting is as much an
ethical as an economic or technical activity [1-3].Some healthcare organizations have made deliberateattempts to incorporate ethical frameworks into theirdecision making [3,40,41]. Accountability forReasonableness, or A4R, is a commonly usedframework for assessing the actual fairness of resourceallocation and priority setting procedures [42-44]. Thefour original aspects of the A4R model are relevance,publicity, enforcement and appeals. Gibson, Martin &Singer have suggested that Empowerment might beseen as a fifth dimension of A4R [45]; this principle isabout allowing opportunity for affected stakeholdersto have meaningful input into the process. A numberof items based on A4R features were embeddedthroughout the survey.
3. Overall, how do decision makers rate their currentresource allocation practice? This is an attempt togauge whether or not current practice is seen assuccessful. Past research in this area is surprisinglylimited; as Sibbald et al. note, “only a few studieshave presented ideas for evaluating the success ofpriority setting” [46]; see also [43,47-49]. Given themulti-faceted nature of this concept, the summarymeasure used here can only be a partial indicator.Nonetheless, we were interested in investigatingwhether there were individual or organizationalfactors which influenced respondents’ opinions. Weexpect to elaborate the concept more fully throughsubsequent qualitative case study work.
There are, of course, many more survey findings thanpossibly can be reported in a single article.In the Discussion and Conclusion, we strive to interpret
these findings and indicate what they mean for furtherstudy and applied research in the Canadian healthcare sys-tem. This survey is one part of a broader project alsoinvolving case studies of potentially high performing orga-nizations, whose ultimate aim is to develop a frameworkand tools to assist healthcare decision makers in assessingtheir own priority setting practice. Results from subsequentphases will be reported elsewhere.
MethodsThe goal of the online survey was to obtain views of se-nior decision makers (i.e., those at the vice-presidentlevel) in Regional Health Authorities (RHAs) or theirclosest equivalents, in all 10 Canadian provinces and 3territories, about their own organization-wide resourceallocation processes. The literature was reviewed toidentify aspects of priority setting and resource allo-cation which are thought to be related to effective-ness, success or high performance; this informed thesurvey content as a whole. Questions were decidedby the research team through iterative discussion; detailed
Smith et al. BMC Health Services Research 2013, 13:247 Page 3 of 10http://www.biomedcentral.com/1472-6963/13/247
discussion of question development is reported else-where [50]. The survey was organized in six mainsections, with 22 questions in total: descriptive infor-mation about the respondents and their organizations(9 questions); an overview of current resource allocationpractice (2 questions); organizational values applied to de-cision making (3 questions); specific factors and criteriaconsidered in decision making (2 questions); organizationalculture and context (2 questions); and overall assessmentof resource allocation practice (4 questions). The surveyalso included 2 optional questions meant to set up the casestudy phase, asking respondents to identify organizationsthey thought might be considered ‘high performers’ in re-gard to resource allocation. The full instrument is availablefrom the authors on request.The penultimate version of the instrument was pilot
tested with three senior decision makers representativeof the intended target audience (i.e., vice-presidents ofRegional Health Authorities). No substantial revisionswere made to the survey instrument or the online ad-ministration process in consequence, and results fromthe pilot test application were pooled with those obtainedfrom the survey roll out for analysis purposes. Completingthe survey took respondents an average of 24 minutes(range 15–39 minutes).Eighty-nine organizations were identified. We sought
to obtain three replies per organization, representing dif-ferent functional roles where possible, for a maximumresponse of 267 individuals in total. Contact names andemail addresses were obtained primarily from publiclyaccessible websites or posted email contacts. Some orga-nizations (n=4) declined to provide this information andfor some we were unable to obtain it during the surveyperiod (n=4). Thus, we were able to approach decisionmakers from 81 organizations to participate in this sur-vey. In some organizations, fewer than three names wereavailable to contact (due to the small size of the seniorexecutive team, or to pre-selection of possible respon-dents by the organization). Taking these restrictions intoaccount, the maximum possible response can be ad-justed to 244.Contacts were chosen to represent each of three differ-
ent roles, where possible: finance, operations, and plan-ning (defined within the survey instrument). Wheremore than one executive member was available withinone of these categories, the contact was chosen ran-domly. Contacts were invited to participate in the surveyby email through clicking on a survey link and enteringan individualized password. The survey was hosted on asecure server maintained by the UBC Faculty of Educa-tion (EduData). After approximately three weeks andone reminder, initial contacts who did not respond werereplaced by a new name; the same procedure was followedthrough four waves or until contact names were exhausted.
The survey period lasted from late-January through late-April, 2011. Respondents were able to reply to either anEnglish or French language version of the survey.
ResultsFour sections follow. The first reports on response rateand information about the respondents. Sections Bthrough D organize findings around the key themes oftype of process, assessments of process fairness, and re-spondents’ overall rating of their priority setting and re-source allocation efforts.
A. RespondentsNinety-two (92) replies were retained for analysis: 88complete and 4 substantially complete (at least 80%, or18 of the main 22 questions answered in full) – 80 inEnglish and 12 in French. We achieved 34.4% of theideal target (92/267), or 37.7% of the adjusted target (92/244); response rate among all managers contacted acrossthe four waves of data collection (n=410) was 22.4%.At least one reply was received from every province or
territory (see Table 1). Geography is a potential proxy formany organizational features, such as socio-economic orpolitical context, or institutional aspects of the healthcaresystem that in Canada can vary across jurisdictions due tothe provinces’ constitutional authority over healthcare ser-vices. However, we do not have enough responses to carryout meaningful sub-analyses on this dimension.Sixty out of 89 organizations are represented by at
least one respondent (see Table 1). Among respondents,slightly over one-half indicated that their organization’stotal annual budget was $500 million or less; 30%reported a budget of greater than $1 billion. The major-ity of respondents indicated that their budgets had in-creased over the last three years, whereas about one-fifthof respondents indicated a stable trend and a small pro-portion (8%) indicated that their organization’s budgethad contracted. Based on the researchers’ assessment ofpopulation and geographic location, we would suggestthat 22% of respondents came from primarily urban orga-nizations (average population of just over 800,000), and32% from primarily rural or remote organizations (averagepopulation of slightly less than 55,000); the remainder ofcases would be classed as mixed or indeterminate.Fifty one percent (51%) of respondents self-identified
as carrying out an Operational role; 28% were in Plan-ning portfolios and 21% in Finance roles. About 55% ofrespondents had an educational background in medicineor another health profession. Responsibilities were re-lated to respondents’ educational background: 80% ofOperations, 50% of Planning, but none of Finance seniormanagement team members reported doing their majortraining in medicine or other health professions. Asexpected, respondents appear to be quite an experienced
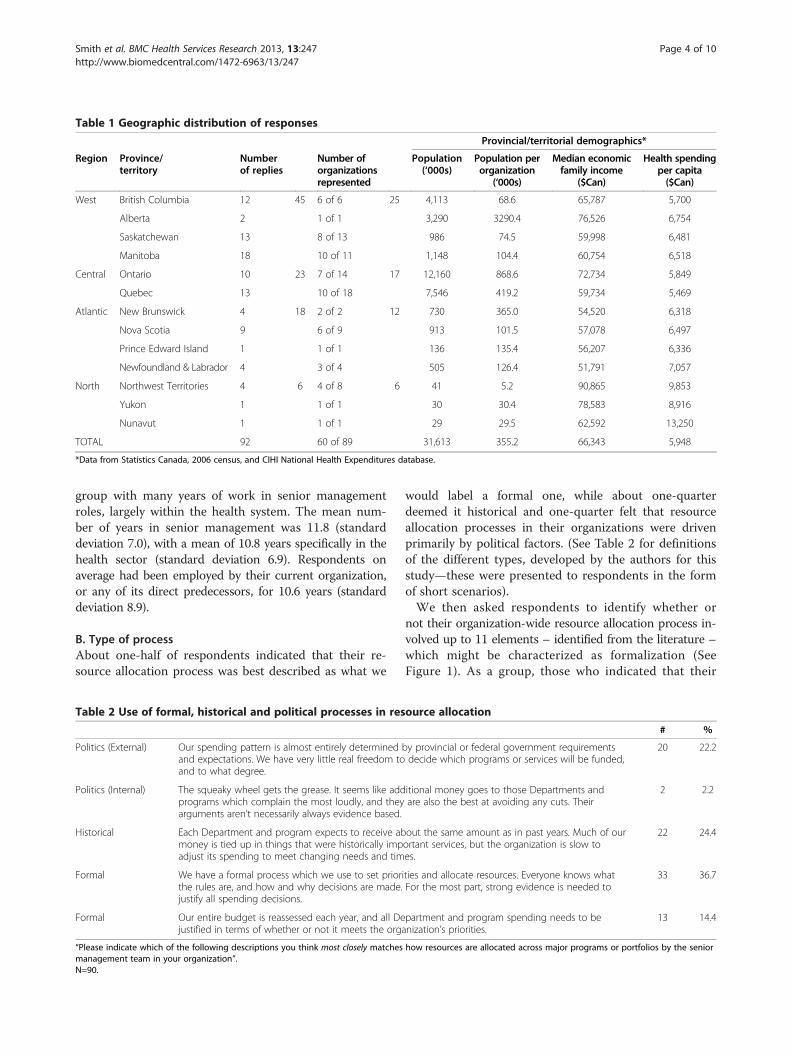
Table 1 Geographic distribution of responses
Provincial/territorial demographics*
Region Province/territory
Numberof replies
Number oforganizationsrepresented
Population(‘000s)
Population perorganization
(‘000s)
Median economicfamily income
($Can)
Health spendingper capita($Can)
West British Columbia 12 45 6 of 6 25 4,113 68.6 65,787 5,700
Alberta 2 1 of 1 3,290 3290.4 76,526 6,754
Saskatchewan 13 8 of 13 986 74.5 59,998 6,481
Manitoba 18 10 of 11 1,148 104.4 60,754 6,518
Central Ontario 10 23 7 of 14 17 12,160 868.6 72,734 5,849
Quebec 13 10 of 18 7,546 419.2 59,734 5,469
Atlantic New Brunswick 4 18 2 of 2 12 730 365.0 54,520 6,318
Nova Scotia 9 6 of 9 913 101.5 57,078 6,497
Prince Edward Island 1 1 of 1 136 135.4 56,207 6,336
Newfoundland & Labrador 4 3 of 4 505 126.4 51,791 7,057
North Northwest Territories 4 6 4 of 8 6 41 5.2 90,865 9,853
Yukon 1 1 of 1 30 30.4 78,583 8,916
Nunavut 1 1 of 1 29 29.5 62,592 13,250
TOTAL 92 60 of 89 31,613 355.2 66,343 5,948
*Data from Statistics Canada, 2006 census, and CIHI National Health Expenditures database.
Smith et al. BMC Health Services Research 2013, 13:247 Page 4 of 10http://www.biomedcentral.com/1472-6963/13/247
group with many years of work in senior managementroles, largely within the health system. The mean num-ber of years in senior management was 11.8 (standarddeviation 7.0), with a mean of 10.8 years specifically in thehealth sector (standard deviation 6.9). Respondents onaverage had been employed by their current organization,or any of its direct predecessors, for 10.6 years (standarddeviation 8.9).
B. Type of processAbout one-half of respondents indicated that their re-source allocation process was best described as what we
Table 2 Use of formal, historical and political processes in res
Politics (External) Our spending pattern is almost entirely determinedand expectations. We have very little real freedom toand to what degree.
Politics (Internal) The squeaky wheel gets the grease. It seems like addprograms which complain the most loudly, and theyarguments aren’t necessarily always evidence based.
Historical Each Department and program expects to receive abmoney is tied up in things that were historically impadjust its spending to meet changing needs and tim
Formal We have a formal process which we use to set priorthe rules are, and how and why decisions are made.justify all spending decisions.
Formal Our entire budget is reassessed each year, and all Dejustified in terms of whether or not it meets the orga
“Please indicate which of the following descriptions you think most closely matchesmanagement team in your organization”.N=90.
would label a formal one, while about one-quarterdeemed it historical and one-quarter felt that resourceallocation processes in their organizations were drivenprimarily by political factors. (See Table 2 for definitionsof the different types, developed by the authors for thisstudy—these were presented to respondents in the formof short scenarios).We then asked respondents to identify whether or
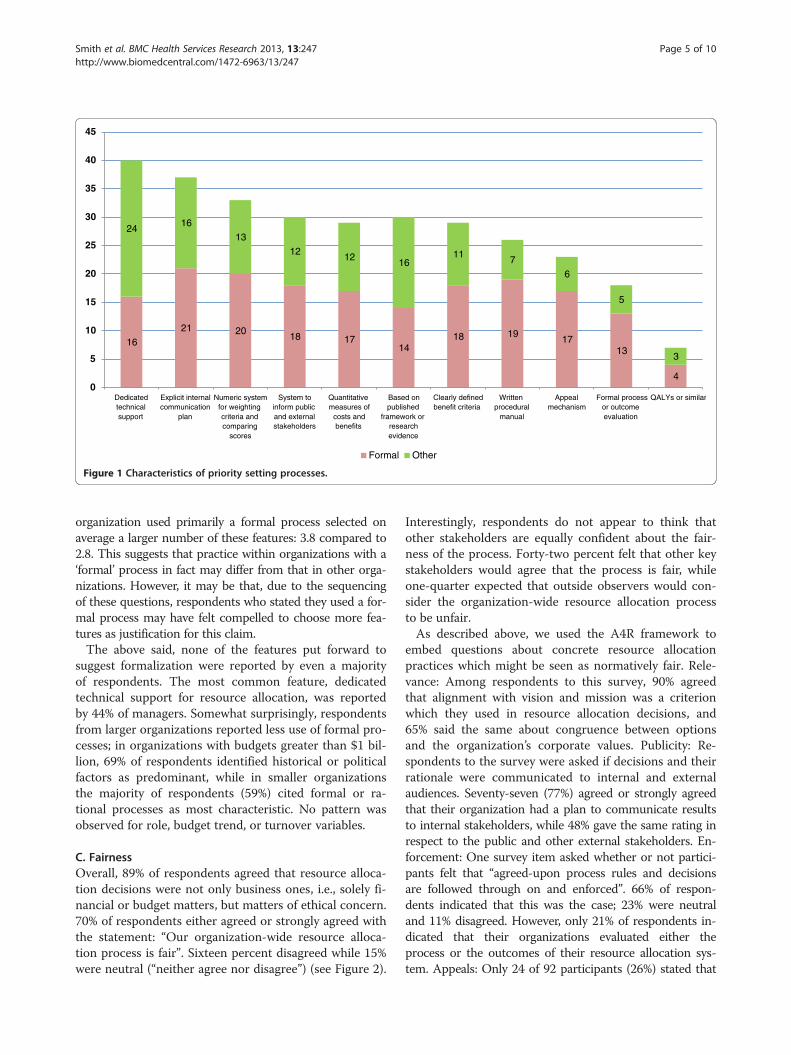
not their organization-wide resource allocation process in-volved up to 11 elements – identified from the literature –which might be characterized as formalization (SeeFigure 1). As a group, those who indicated that their
ource allocation
# %
by provincial or federal government requirementsdecide which programs or services will be funded,
20 22.2
itional money goes to those Departments andare also the best at avoiding any cuts. Their
2 2.2
out the same amount as in past years. Much of ourortant services, but the organization is slow toes.
22 24.4
ities and allocate resources. Everyone knows whatFor the most part, strong evidence is needed to
33 36.7
partment and program spending needs to benization’s priorities.
13 14.4
how resources are allocated across major programs or portfolios by the senior
16
21 2018 17
1418 19
1713
4
2416
13
1212
1611
7
6
5
3
0
5
10
15
20
25
30
35
40
45
Dedicatedtechnicalsupport
Explicit internalcommunication
plan
Numeric systemfor weightingcriteria andcomparing
scores
System toinform publicand externalstakeholders
Quantitativemeasures of
costs andbenefits
Based onpublished
framework orresearchevidence
Clearly definedbenefit criteria
Writtenprocedural
manual
Appealmechanism
Formal processor outcomeevaluation
QALYs or similar
Formal Other
Figure 1 Characteristics of priority setting processes.
Smith et al. BMC Health Services Research 2013, 13:247 Page 5 of 10http://www.biomedcentral.com/1472-6963/13/247
organization used primarily a formal process selected onaverage a larger number of these features: 3.8 compared to2.8. This suggests that practice within organizations with a‘formal’ process in fact may differ from that in other orga-nizations. However, it may be that, due to the sequencingof these questions, respondents who stated they used a for-mal process may have felt compelled to choose more fea-tures as justification for this claim.The above said, none of the features put forward to
suggest formalization were reported by even a majorityof respondents. The most common feature, dedicatedtechnical support for resource allocation, was reportedby 44% of managers. Somewhat surprisingly, respondentsfrom larger organizations reported less use of formal pro-cesses; in organizations with budgets greater than $1 bil-lion, 69% of respondents identified historical or politicalfactors as predominant, while in smaller organizationsthe majority of respondents (59%) cited formal or ra-tional processes as most characteristic. No pattern wasobserved for role, budget trend, or turnover variables.
C. FairnessOverall, 89% of respondents agreed that resource alloca-tion decisions were not only business ones, i.e., solely fi-nancial or budget matters, but matters of ethical concern.70% of respondents either agreed or strongly agreed withthe statement: “Our organization-wide resource alloca-tion process is fair”. Sixteen percent disagreed while 15%were neutral (“neither agree nor disagree”) (see Figure 2).
Interestingly, respondents do not appear to think thatother stakeholders are equally confident about the fair-ness of the process. Forty-two percent felt that other keystakeholders would agree that the process is fair, whileone-quarter expected that outside observers would con-sider the organization-wide resource allocation processto be unfair.As described above, we used the A4R framework to
embed questions about concrete resource allocationpractices which might be seen as normatively fair. Rele-vance: Among respondents to this survey, 90% agreedthat alignment with vision and mission was a criterionwhich they used in resource allocation decisions, and65% said the same about congruence between optionsand the organization’s corporate values. Publicity: Re-spondents to the survey were asked if decisions and theirrationale were communicated to internal and externalaudiences. Seventy-seven (77%) agreed or strongly agreedthat their organization had a plan to communicate resultsto internal stakeholders, while 48% gave the same rating inrespect to the public and other external stakeholders. En-forcement: One survey item asked whether or not partici-pants felt that “agreed-upon process rules and decisionsare followed through on and enforced”. 66% of respon-dents indicated that this was the case; 23% were neutraland 11% disagreed. However, only 21% of respondents in-dicated that their organizations evaluated either theprocess or the outcomes of their resource allocation sys-tem. Appeals: Only 24 of 92 participants (26%) stated that
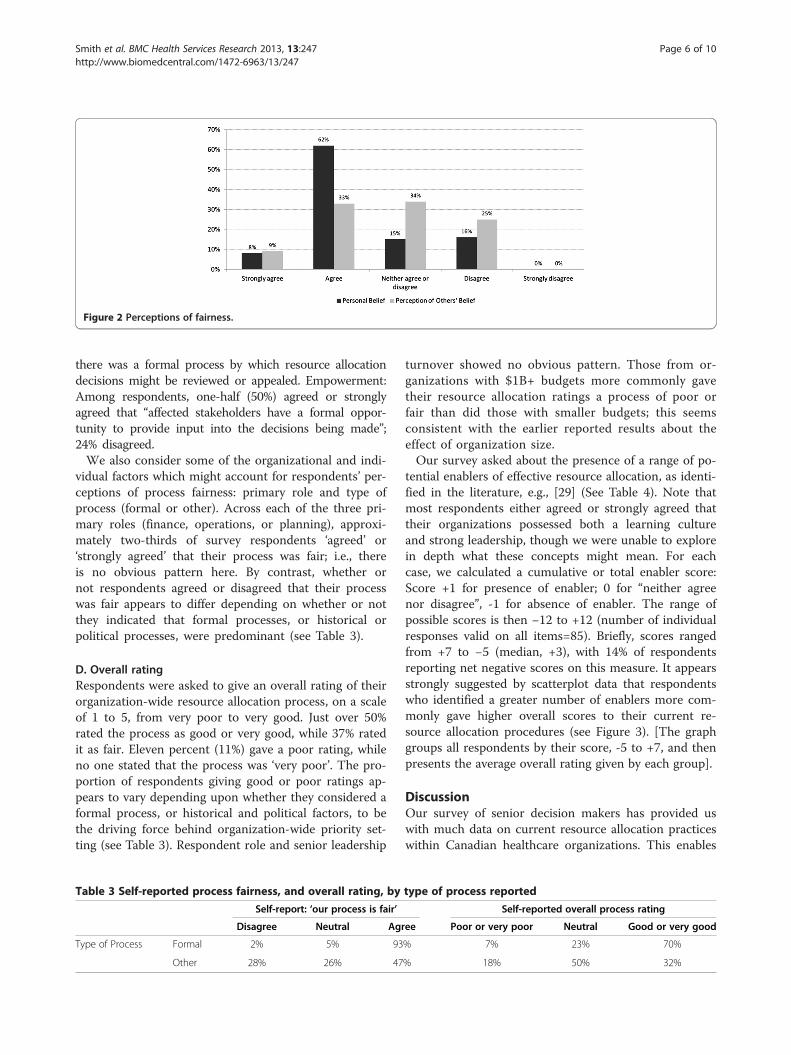
Figure 2 Perceptions of fairness.
Smith et al. BMC Health Services Research 2013, 13:247 Page 6 of 10http://www.biomedcentral.com/1472-6963/13/247
there was a formal process by which resource allocationdecisions might be reviewed or appealed. Empowerment:Among respondents, one-half (50%) agreed or stronglyagreed that “affected stakeholders have a formal oppor-tunity to provide input into the decisions being made”;24% disagreed.We also consider some of the organizational and indi-
vidual factors which might account for respondents’ per-ceptions of process fairness: primary role and type ofprocess (formal or other). Across each of the three pri-mary roles (finance, operations, or planning), approxi-mately two-thirds of survey respondents ‘agreed’ or‘strongly agreed’ that their process was fair; i.e., thereis no obvious pattern here. By contrast, whether ornot respondents agreed or disagreed that their processwas fair appears to differ depending on whether or notthey indicated that formal processes, or historical orpolitical processes, were predominant (see Table 3).
D. Overall ratingRespondents were asked to give an overall rating of theirorganization-wide resource allocation process, on a scaleof 1 to 5, from very poor to very good. Just over 50%rated the process as good or very good, while 37% ratedit as fair. Eleven percent (11%) gave a poor rating, whileno one stated that the process was ‘very poor’. The pro-portion of respondents giving good or poor ratings ap-pears to vary depending upon whether they considered aformal process, or historical and political factors, to bethe driving force behind organization-wide priority set-ting (see Table 3). Respondent role and senior leadership
Table 3 Self-reported process fairness, and overall rating, by
Self-report: ‘our process is fair’
Disagree Neutral Agr
Type of Process Formal 2% 5% 93
Other 28% 26% 47
turnover showed no obvious pattern. Those from or-ganizations with $1B+ budgets more commonly gavetheir resource allocation ratings a process of poor orfair than did those with smaller budgets; this seemsconsistent with the earlier reported results about theeffect of organization size.Our survey asked about the presence of a range of po-
tential enablers of effective resource allocation, as identi-fied in the literature, e.g., [29] (See Table 4). Note thatmost respondents either agreed or strongly agreed thattheir organizations possessed both a learning cultureand strong leadership, though we were unable to explorein depth what these concepts might mean. For eachcase, we calculated a cumulative or total enabler score:Score +1 for presence of enabler; 0 for “neither agreenor disagree”, -1 for absence of enabler. The range ofpossible scores is then −12 to +12 (number of individualresponses valid on all items=85). Briefly, scores rangedfrom +7 to −5 (median, +3), with 14% of respondentsreporting net negative scores on this measure. It appearsstrongly suggested by scatterplot data that respondentswho identified a greater number of enablers more com-monly gave higher overall scores to their current re-source allocation procedures (see Figure 3). [The graphgroups all respondents by their score, -5 to +7, and thenpresents the average overall rating given by each group].
DiscussionOur survey of senior decision makers has provided uswith much data on current resource allocation practiceswithin Canadian healthcare organizations. This enables
type of process reported
Self-reported overall process rating
ee Poor or very poor Neutral Good or very good
% 7% 23% 70%
% 18% 50% 32%
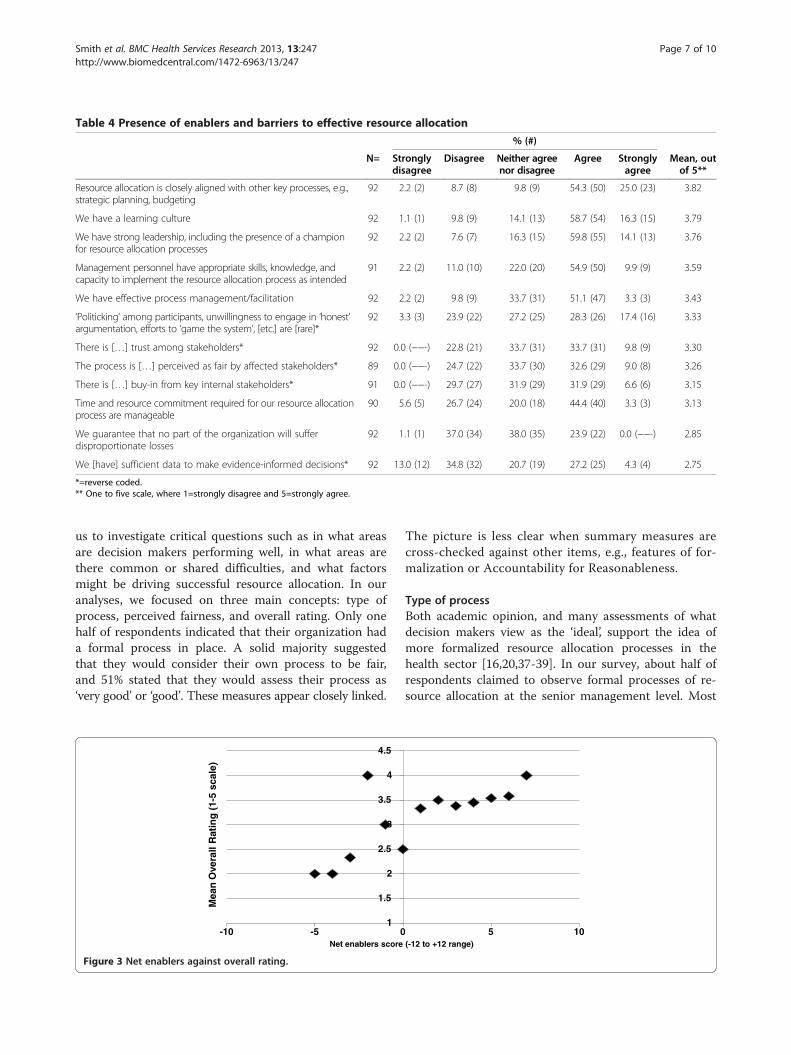
Table 4 Presence of enablers and barriers to effective resource allocation
% (#)
N= Stronglydisagree
Disagree Neither agreenor disagree
Agree Stronglyagree
Mean, outof 5**
Resource allocation is closely aligned with other key processes, e.g.,strategic planning, budgeting
92 2.2 (2) 8.7 (8) 9.8 (9) 54.3 (50) 25.0 (23) 3.82
We have a learning culture 92 1.1 (1) 9.8 (9) 14.1 (13) 58.7 (54) 16.3 (15) 3.79
We have strong leadership, including the presence of a championfor resource allocation processes
92 2.2 (2) 7.6 (7) 16.3 (15) 59.8 (55) 14.1 (13) 3.76
Management personnel have appropriate skills, knowledge, andcapacity to implement the resource allocation process as intended
91 2.2 (2) 11.0 (10) 22.0 (20) 54.9 (50) 9.9 (9) 3.59
We have effective process management/facilitation 92 2.2 (2) 9.8 (9) 33.7 (31) 51.1 (47) 3.3 (3) 3.43
‘Politicking’ among participants, unwillingness to engage in ‘honest’argumentation, efforts to ‘game the system’, [etc.] are [rare]*
92 3.3 (3) 23.9 (22) 27.2 (25) 28.3 (26) 17.4 (16) 3.33
There is […] trust among stakeholders* 92 0.0 (−−-) 22.8 (21) 33.7 (31) 33.7 (31) 9.8 (9) 3.30
The process is […] perceived as fair by affected stakeholders* 89 0.0 (−−-) 24.7 (22) 33.7 (30) 32.6 (29) 9.0 (8) 3.26
There is […] buy-in from key internal stakeholders* 91 0.0 (−−-) 29.7 (27) 31.9 (29) 31.9 (29) 6.6 (6) 3.15
Time and resource commitment required for our resource allocationprocess are manageable
90 5.6 (5) 26.7 (24) 20.0 (18) 44.4 (40) 3.3 (3) 3.13
We guarantee that no part of the organization will sufferdisproportionate losses
92 1.1 (1) 37.0 (34) 38.0 (35) 23.9 (22) 0.0 (−−-) 2.85
We [have] sufficient data to make evidence-informed decisions* 92 13.0 (12) 34.8 (32) 20.7 (19) 27.2 (25) 4.3 (4) 2.75
*=reverse coded.** One to five scale, where 1=strongly disagree and 5=strongly agree.
Smith et al. BMC Health Services Research 2013, 13:247 Page 7 of 10http://www.biomedcentral.com/1472-6963/13/247
us to investigate critical questions such as in what areasare decision makers performing well, in what areas arethere common or shared difficulties, and what factorsmight be driving successful resource allocation. In ouranalyses, we focused on three main concepts: type ofprocess, perceived fairness, and overall rating. Only onehalf of respondents indicated that their organization hada formal process in place. A solid majority suggestedthat they would consider their own process to be fair,and 51% stated that they would assess their process as‘very good’ or ‘good’. These measures appear closely linked.
1
1.5
2
2.5
3
3.5
4
4.5
-10 -5 0Net enablers score
Mea
n O
vera
ll R
atin
g (
1-5
scal
e)
Figure 3 Net enablers against overall rating.
The picture is less clear when summary measures arecross-checked against other items, e.g., features of for-malization or Accountability for Reasonableness.
Type of processBoth academic opinion, and many assessments of whatdecision makers view as the ‘ideal’, support the idea ofmore formalized resource allocation processes in thehealth sector [16,20,37-39]. In our survey, about half ofrespondents claimed to observe formal processes of re-source allocation at the senior management level. Most
5 10 (-12 to +12 range)
Smith et al. BMC Health Services Research 2013, 13:247 Page 8 of 10http://www.biomedcentral.com/1472-6963/13/247
indicated that these were self-developed, not directly de-rived from models in the literature (Figure 1). This is ad-mirable initiative perhaps, yet suggests the existence of aknowledge translation gap, whether that is due to lackof opportunities for researcher-decision maker interaction,or the failure of academics to ‘push’ or managers to ‘pull’relevant research [51]. Fewer respondents identified thepresence of the elements of what we would consider mainfeatures of formalization, as derived from the literature.Perhaps there is social desirability bias—respondents feelthat their organizations should make decisions on thisbasis. Or perhaps decision makers’ understanding of a for-mal allocation process contains element other than thoseso far identified in the literature; we could not have antici-pated or asked about the presence of such features. Furtherresearch is required.We also need to note what seems like a counter-
intuitive relationship between organization size and typeof process identified in this data. We anticipated thatlarge organizations would more likely have formalized re-source allocation processes; the results do not confirmthis. It may be that large organizations are exposed tomore diverse opinions and more open political con-testation around decisions. Another possible explan-ation could be that it is easier to obtain consensusamong stakeholders in smaller organizations to imple-ment a particular form of resource allocation, includingformal processes if desired. On a positive note, we mighttake this to mean that there are no systemic barrierswhich prevent organizations of any size from being ableto establish practices that enable high performance in re-source allocation.
FairnessOur respondents recognized the ethical nature of theirresource allocation practice; only 11% agreed that theywere simply making business decisions. This contrastswith more than 40% in a US survey (from which we de-rived this question) [52]. It was notable that respon-dents, taken as a whole, seemed to suspect that outsideobservers would perceive their organization-wide re-source allocation process as less fair than they them-selves do. Further data would be required as to whatmay account for this discrepancy. It might for in-stance be mediated by views about the effectiveness oforganizational communication. Recent research withhealthcare organizations in one Canadian province hasfound a strong link between perceived fairness and per-ceived transparency [41]. There is some evidence thatdecision makers may hold different preferences in re-gard to priority areas for spending than members of thepublic or healthcare providers [53,54] which might in-fluence what the groups believe to be fair or unfairabout the processes currently being used.
The use of A4R elements as survey items provides away of checking respondent claims about overall fairnessagainst the presence or absence of specific featureswhich are often considered to exemplify fair process. Ifadherence to A4R principles constitutes fair process(which is an assumption rather than a given), then weshould be somewhat cautious in accepting the self-reported claims about fairness made by our respondents.That is, claims about fairness may not be supportedbased on the extent to which features thought by re-searchers to facilitate fairness are actually reported aspresent by these respondents and described above. Someliterature has suggested that decision makers are less at-tached to the importance of formal appeals mechanismsthan to other aspects of A4R [55]. Our data appear con-sistent with this. This leaves interesting questions as towhether it is the attitudes and beliefs of decision makers,or the theory of what makes ethical practice, whichneeds to change in order to bring about alignment here.
Overall ratingWe seem to have received generally positive responsesfrom our survey participants (assuming that one takes agrading of ‘fair’ to be a positive response). Decisionmakers no doubt are working hard to do their best,within constraints. But very few nominated themselvesas ‘high performers’, indicating awareness of much workyet to do. The findings related to barriers and enablerssupport the importance of factors previously identifiedin the priority setting literature as contributing to orrestricting effective organizational performance in re-source allocation [29].
LimitationsAs with many surveys, it is possible to question the rep-resentativeness of the respondents and the generalizabilityof responses. However the broad range of responses frommany different organizations across the country gives ussome degree of confidence that we have tapped a diverseset of informants. Response rate is not out of ordinary foran email survey [56]; the large-scale UK surveys notedabove had response rates of 23% [26] and 53% [27]. Giventhat informants are very busy executives who wereapproached without advance notice, we are not unhappywith the return. We presume (but cannot be sure) thatresponse was provided by the intended informant, andnot delegated to someone else.A further potential limitation is that we certainly have
not measured all the relevant variables. The strengthand quality of organizational leadership, for one, may ac-count for whether or not organizations choose to imple-ment formal resource allocation processes, the nature ofsuch processes, their fairness, and perceptions amongteam members of success. We included one question
Smith et al. BMC Health Services Research 2013, 13:247 Page 9 of 10http://www.biomedcentral.com/1472-6963/13/247
which touched on this (Table 4) -- most respondentsreported that their senior management teams displayedstrong leadership. However, we know that leadership is amulti-dimensional concept, though we were unable todisaggregate it here. Reeleder et al. identify some of theneeded skills as creating relationships, managing net-works, building supportive coalitions, and mobilizingsupport [57]. Dickinson et al. suggest that among thesefunctions “a number .. tend to be weak, or absent, fromleadership skills of health care professionals” [58].In addition, internal consistency in responses from re-
spondents from the same organization is perhaps bestdescribed as ‘fair’ (for ordinal questions, inter-rater reli-ability calculated with Spearman’s rank correlation coef-ficient averaged 0.580; for nominal questions, Cohen’skappa averaged 0.274). This is not necessarily surprising,as previous research has noted the members of seniorexecutive teams can have strikingly different percep-tions of organizational processes [59]. Role within theorganization may lead to different experiences andvantage points to account for this –though we tested itin our study and did not find it to be an explanatoryfactor. A host of other factors may also be at play. Weonly included senior managers in this survey. We mightwell expect senior managers as a group to believe, forinstance, in the fairness of processes which they mayhave helped craft. Those in mid-level management po-sitions may not necessarily perceive organizational re-source allocation processes and results in the sameterms, but further research is needed to address this.
ConclusionOur findings here help to shape up understanding of di-mensions of ‘high performance’ which can be more fullyinvestigated both in our own further research, and in theefforts of other scholars and practitioners. A uniquecontribution to the literature is our assembly of quan-titative data about resource allocation practice fromto our knowledge the largest yet pan-Canadian set ofsenior health system managers. Health leaders canlook at their own processes in light of what isreported here; it may help them see where they facecommon challenges – which recur across different so-cial and political geographies -- and where they areseeing significant relative success. This may point tothe places where they can teach, where they can learn,and where they may want to reach out to the researchcommunity for further knowledge development and sup-port. There is great opportunity for productive mutual en-gagement to improve resource allocation within Canada’shealth system.
Competing interestsThe authors declare that they have no competing interests.
Authors’ contributionsCM and NS conceived the study; NS took the lead on writing the first draftof the paper; AD, SP, JG, BU, CD and SB all provided input into study designand implementation, and each provided critical comments on drafts of thepaper. All authors read and approved the final manuscript.
AcknowledgmentsThe authors thank Evelyn Cornelissen, Francois Dionne, Lisa Kuramoto, andLisa Masucci for their helpful feedback. We also thank the audience at aC2E2 Grand Rounds presentation (September 2011) for their comments.Cory McPhail provided assistance with some of the data analysis. Thisproject was funded by the Canadian Institutes of Health Researchthrough the Partnerships for Health System Improvement program (REF#200911PHE-216368). Ethics approval was obtained from the University ofBritish Columbia Behavioural Research Ethics Board. Additional approvalfor data collection in specific jurisdictions was obtained from theKeewatin Yatthé Regional Health Authority, and through the NorthwestTerritories Scientific Research Licensing system.
Author details1Centre for Clinical Epidemiology & Evaluation, Vancouver Coastal HealthResearch Institute, 7th floor, 828 W 10 Avenue, V5Z1M9, Vancouver, BC,Canada. 2School of Population and Public Health, University of BritishColumbia, Vancouver, Canada. 3Faculty of Health and Social Development,UBC Okanagan, Kelowna, Canada. 4Northern Health Authority, Prince George,Canada. 5University of Toronto Joint Centre for Bioethics, Toronto, Canada.6Department of Health Policy, Management & Evaluation, University ofToronto, Toronto, Canada. 7British Columbia Cancer Agency, Vancouver,Canada. 8Canadian Centre for Applied Research in Cancer Control (ARCC),Vancouver, Canada. 9Yunus Centre for Social & Business Health, GlasgowCaledonian University, Glasgow, UK.
Received: 8 February 2012 Accepted: 6 June 2013Published: 2 July 2013
References1. Clark S, Weale A: Social values in health priority setting: a conceptual
framework. J Health Organ Manag 2012, 26:293–316.2. Gibson JL, Martin DK, Singer PA: Evidence, economics and ethics: resource
allocation in health services organizations. Healthc Q 2005, 8:50–59.3. Gibson J, Mitton C, Martin D, Donaldson C, Singer P: Ethics and economics:
does programme budgeting and marginal analysis contribute to fairpriority setting? J Health Serv Res Policy 2006, 11:32–37.
4. Bryan S, Williams I, McIver S: Seeing the NICE side of cost-effectivenessanalysis: a qualitative investigation of the use of CEA in NICE technologyappraisals. Health Econ 2007, 16:179–193.
5. Eddama O, Coast J: A systematic review of the use of economicevaluation in local decision-making. Health Policy 2008, 86:129–141.
6. Ross J: The use of economic evaluation in health care: Australiandecision makers’ perceptions. Health Policy 1995, 31:103–110.
7. Mitton C, Donaldson C: Priority Setting Toolkit: A Guide to the Use of Economics inHealthcare Decision Making. London: BMJ Books; 2004.
8. Harrison A, Mitton C: Engaging physicians in priority setting: the Albertaexperience. Healthc Manage Forum 2004, 17(4):21–27.
9. Ruta D, Mitton C, Bate A, Donaldson C: Programme budgeting andmarginal analysis: bridging the divide between doctors and managers.BMJ 2005, 330(7506):1501–1503.
10. Mitton C, Smith N, Peacock S, Evoy B, Abelson J: Public participation inhealth care priority setting: a scoping review. Health Policy 2009,91:219–228.
11. Bruni RA, Laupacis A, Martin DK: Public engagement in setting priorities inhealth care. Can Med Assoc J 2008, 179:15–18.
12. Chafe R, Neville D, Rathwell T, Deber R: A framework for involving thepublic in health care coverage and resource allocation decisions.Healthc Manage Forum 2008, 21:6–21.
13. Jan S: Institutional considerations in priority setting: transactions costperspective on PBMA. Health Econ 2000, 9:631–641.
14. Williams I, Bryan S: Understanding the limited impact of economicevaluation in health care resource allocation: A conceptual framework.Health Policy 2007, 80:135–143.
Smith et al. BMC Health Services Research 2013, 13:247 Page 10 of 10http://www.biomedcentral.com/1472-6963/13/247
15. Williams I: Institutions, cost-effectiveness analysis and healthcarerationing: the example of healthcare coverage in the English NationalHealth Services. Policy & Politics 2013, 41:223–239.
16. Dionne F, Mitton C, Smith N, Donaldson C: Decision maker views onpriority setting in the Vancouver Island Health Authority. CostEffectiveness and Resource Allocation 2008, 6:13.
17. Madden S, Martin DK, Downey S, Singer PA: Hospital priority setting withan appeals process: a qualitative case study and evaluation. Health Policy2005, 73:10–20.
18. Martin DK, Hollenberg D, MacRae S, Madden S, Singer P: Priority setting ina hospital drug formulary: a qualitative case study and evaluation.Health Policy 2003, 66:295–303.
19. Patten S, Mitton C, Donaldson C: Using participatory action research tobuild a priority setting process in a Canadian regional health authority.Soc Sci Med 2006, 63:1121–1134.
20. Teng F, Mitton C, MacKenzie J: Priority setting in the Provincial HealthServices Authority: survey of key decision makers. BMC Health Serv Res2007, 7:84.
21. Urquhart B, Mitton C, Peacock S: Introducing priority setting and resourceallocation in home and community programs. J Health Serv Res Policy2008, 13(Supp 1):41–45.
22. Walton NA, Martin DK, Peter EH, Pringle DM, Singer PA: Priority settingand cardiac surgery: a qualitative case study. Health Policy 2007,80:444–458.
23. Bohner P, Pain C, Watt A, Abernethy P, Sceats J: Maximizing health gainwithin available resources in the New Zealand public health system.Health Policy 2001, 55:37–50.
24. Griffiths L, Hughes D: Purchasing in the British NHS: does contractingmean explicit rationing? Health 1998, 2:349–371.
25. Craig N, Parkin D, Gerard K: Clearing the fog on the Tyne: programmebudgeting in Newcastle and North Tyneside Health Authority.Health Policy 1995, 33:107–125.
26. Greener I, Powell J: Health authorities, priority-setting and resourceallocation: a study in decision-making in New Labour’s NHS. Social Policy& Administration 2003, 37:35–48.
27. Robinson S, Dickinson H, Freeman T, Rumbold B, Williams I: Structuresand processes for priority-setting by health-care funders: a nationalsurvey of Primary Care Trusts in England. Health Serv Manage Res 2012,25:113–130.
28. Lomas J, Veenstra G, Woods J: Devolving authority for health care inCanada’s provinces: 2. Backgrounds, resources and activities of boardmembers. Can Med Assoc J 1997, 156:513–520.
29. Mitton C, Donaldson C: Setting priorities and allocating resources inhealth regions: lessons from a project evaluating program budgetingand marginal analysis (PBMA). Health Policy 2003, 64:335–348.
30. Menon D, Stafinski T, Martin D: Priority-setting for healthcare: who, how,and is it fair? Health Policy 2007, 84:220–233.
31. Baker GR, MacIntosh-Murray A, Porcellato C, Dionne L, Stelmacovich K, Born K:High Performing Healthcare Systems: Delivering Quality by Design. Toronto:Longwoods Publishing Corporation; 2008.
32. Baker GR: The Roles of Leaders in High-Performing Health Care Systems.London: The King’s Fund; 2011.
33. Mitton C, Donaldson C: Setting priorities and allocating resources inhealth regions: lessons from a project evaluating program budgetingand marginal analysis. Health Policy 2003, 64:335–348.
34. Bate A, Donaldson C, Murtagh MJ: Managing to manage healthcareresources in the English NHS? What can health economics teach? Whatcan health economics learn? Health Policy 2007, 84(2–3):249–261.
35. Baker GR, Ginsburg L, Langley A: An organizational science perspectiveon information, knowledge, evidence, and organizational decision-making (pg. 86–114). In Using knowledge and evidence in health care –Multidisciplinary perspectives. Edited by Lemieux-Charles L, Champagne F.Toronto: University of Toronto Press; 2004.
36. Goddard M, Hauck K, Preker A, Smith PC: Priority setting in health—apolitical economy perspective. Health Econ Policy Law 2006, 1:79–90.
37. Mitton C, Patten S: Evidence-based priority-setting: what do the decision-makers think? J Health Serv Res Policy 2004, 9:146–152.
38. Mitton C, Donaldson C: Setting priorities in Canadian regional healthauthorities: a survey of key decision makers. Health Policy 2002, 60:39–58.
39. Mitton C, Prout S: Setting priorities in the south west of WesternAustralia: where are we now? Aust Health Rev 2004, 28:301–310.
40. Yeo M, Williams JR, Hooper W: Incorporating ethics in priority setting: acase study of a regional health board in Canada. Health Care Anal 1999,7:177–194.
41. Gibson J, Mitton C, Dubois-Wing G: Priority setting in Ontario’s LHINs:ethics and economics in action. Healthc Q 2011, 14:35–46.
42. Daniels N, Sabin J: Setting Limits Fairly: Can We Learn to Share MedicalResources?. Oxford: Oxford University Press; 2002.
43. Gibson J, Martin D, Singer P: Setting priorities in health care organizations:criteria, processes, and parameters of success. BMC Health Serv Res 2004, 4:25.
44. Martin DK, Giacomini M, Singer PA: Fairness, accountability forreasonableness, and the views of priority setting decision-makers. HealthPolicy 2002, 61:279–290.
45. Gibson J, Martin D, Singer P: Priority setting in hospitals: fairness,inclusiveness, and the problem of institutional power differences. Soc SciMed 2005, 61:2355–2362.
46. Sibbald SL, Singer PA, Upshur R, Martin DK: Priority setting: whatconstitutes success? A conceptual framework for successful prioritysetting. BMC Health Serv Res 2009, 9:43.
47. Sibbald SL, Gibson JL, Singer PA, Upshur R, Martin DK: Evaluating prioritysetting success in healthcare: a pilot study. BMC Health Serv Res 2010,10:131.
48. Kapiriri L, Martin DK: Successful priority setting in low and middle incomecountries: a framework for evaluation. Healthcare Analysis 2010, 18:129–147.
49. Sabik LM, Lie RK: Priority setting in health care: lessons from theexperiences of eight countries. International Journal for Equity in Health2008, 7:4.
50. Smith N, Mitton C, Davidson A, Gibson JL, Peacock S, Bryan S, Donaldson C:Design and implementation of a survey of senior Canadian healthcaredecision makers: organization-wide resource allocation processes.Health 2012, 4:1007–1014.
51. Lavis JN: Research, public policymaking, and knowledge-translationprocesses: Canadian efforts to build bridges. J Contin Educ Health Prof2006, 26:37–45.
52. Foglia MB, Pearlman RA, Bottrell MM, Altemose JK, Fox E: Priority settingand the ethics of resource allocation within VA health facilities: results ofa survey. Organ Ethic 2007, 4:83–96.
53. Jacobson B, Bowling A: Involving the public: practical and ethical issues.Br Med Bull 1995, 51:869–875.
54. Myllykangas M, Ryynanen OP, Kinnunen J, Takala J: Comparison of doctors’,nurses’, politicians’ and public attitudes to health care priorities. J HealthServ Res Policy 1996, 1:212–216.
55. Kapiriri L, Norheim O, Martin DK: Priority setting at the micro-, meso- andmacro-levels in Canada, Norway and Uganda. Health Policy 2007, 82:78–94.
56. Cook C, Heath F, Thompson RL: A meta-analysis of response rates in web-or internet-based surveys. Educ Psychol Meas 2000, 60:821–836.
57. Reeleder D, Goel V, Singer PA, Martin DK: Leadership and priority setting:the perspective of hospital CEOs. Health Policy 2006, 79:24–34.
58. Dickinson H, Freeman T, Robinson S, Williams I: Resource scarcity andpriority-setting: from management to leadership in the rationing ofhealth care? Public Money & Management 2011, 31:363–370.
59. Starbuck WH, Mezias JM: Opening Pandora’s box: studying the accuracyof managers’ perceptions. J Organ Behav 1996, 17:99–117.
doi:10.1186/1472-6963-13-247Cite this article as: Smith et al.: Decision maker perceptions of resourceallocation processes in Canadian health care organizations: a nationalsurvey. BMC Health Services Research 2013 13:247.
Related Documents