Deciphering the Relations between Pore Structure and Adsorption Behavior in Metal-Organic Frameworks: Unexpected Lessons from Argon Adsorption on Copper-Benzene-1,3,5-tricarboxylate Silvio Dantas, † Lev Sarkisov, ‡ and Alexander V. Neimark* ,† † Department of Chemical and Biochemical Engineering, Rutgers, The State University of New Jersey, 98 Brett Road, Piscataway, New Jersey 08854, United States ‡ Institute for Materials and Processes, School of Engineering, The University of Edinburgh, Edinburgh EH9 3JL, United Kingdom * S Supporting Information ABSTRACT: Consistent adsorption characterization of metal-organic frameworks (MOFs) is imperative for their wider adoption in industry and practical applications. Current approaches are based on the conventional intuitive representation of MOF pore space as a regular network of pore compartments (cages and channels), adsorption in which occurs independently according to their geometric dimensions. Here, we demonstrate that this conventional approach is unable to describe even qualitatively the shape of Ar adsorption isotherms on hydrated and dehydrated Cu-BTC structures, one of the most well-known MOF materials. A combination of geometric characterization of MOF crystallographic structure, molecular simulation, and virtual visualization of the adsorption process reveals that the filling of the adjacent pore compartments proceeds in parallel in a complex cooperative fashion. The proposed synergistic approach helps us to understand the relations between pore structure geometric and chemical features and adsorption behavior, laying down a foundation for improved methods for MOF characterization. M etal-organic frameworks (MOFs) and related classes of porous crystals have dominated the literature on adsorption studies in the past 10 years. 1-12 The promise these materials hold for various applications stems from their exceptional adsorption characteristics and wide range of textural properties. The important issue that needs to be addressed is consistent structural characterization of MOFs. Despite being crystalline materials in theory, real samples often deviate from the ideal structure due to residual solvent and reactants in the structure, missing linkers, and partially collapsed regions of the framework. The most instructive technique that is routinely used for MOF characterization is physical adsorption of nitrogen or argon at their normal boiling temperatures. 13 Measured adsorption isotherms contain important information about the sample porosity, surface area, and pore sizes, provided a clear link exists between adsorption behavior and pore structure. It is assumed that, as the gas pressure increases, the adsorbate fills the pores in the order of their sizes, so that the pore size distribution (PSD) can be derived using a particular kernel of reference adsorption isotherms in model pores of different sizes. 13 However, generic adsorption characterization methods rely on simplified pore structure models (independent cylindrical, spherical, or slit-shaped pores), which neglect real complex pore morphology of MOF crystals and produce, in some cases, PSDs inconsistent with the crystallographic parameters. 14,15 Molecular simulations and computational structure character- ization tools can be of immense help to remedy this situation, since in silico, unlike in experiments, one can investigate properties of an ideal, defect-free crystal, generate adsorption isotherms using well-developed force fields, and directly obtain information on the pore morphology. Superficially, one may think that, for the case of an idealized, perfect MOF, development of relations between structural characteristics and adsorption isotherms should be a straightforward task. However, application of this approach to a well-known Cu-BTC structure led to several challenges and unexpected lessons which we would like to share and explore in more detail, as they will be instrumental in further efforts to develop reliable character- ization approaches. Since its first reported synthesis in 1999 by Chui et al., 16 Cu- BTC (also known as HKUST-1) has been extensively investigated using both experimental and theoretical ap- proaches. Notably, the first molecular simulation study of adsorption in MOFs was performed on Cu-BTC. 17 The basic building block of Cu-BTC is formed by Cu atoms coordinated by benzene-1,3,5-tricarboxylate (BTC) ligands. Adsorption and catalytic properties are mainly determined by accessibility of unsaturated metal sites that might be easily hydrated or occupied by impurities or ligands. One of the goals of structural characterization is to distinguish between the samples with different levels of hydration. In order to get a better understanding of the effects of hydration on structural and adsorption properties, we consider two reference Cu-BTC structures, one with fully saturated Cu sites (hydrated 18 ) and another with unsaturated sites (dehy- drated 19 ). The cubic unit cell of Cu-BTC can be compartmen- talized into three types of cages denoted here as S1, L2, and L3. 20 The pore structure represents a 3D network of alternating larger spheroidal cages L2 and L3 with tetrahedral-shaped small S1 cages connected to L3 cages. In Figure 1A,C, we demonstrate the sizes of these cages by using probe spheres inscribed inside Received: February 4, 2019 Published: May 15, 2019 Communication pubs.acs.org/JACS Cite This: J. Am. Chem. Soc. 2019, 141, 8397-8401 © 2019 American Chemical Society 8397 DOI: 10.1021/jacs.9b00906 J. Am. Chem. Soc. 2019, 141, 8397-8401 Downloaded by RUTGERS UNIV at 11:09:09:466 on June 05, 2019 from https://pubs.acs.org/doi/10.1021/jacs.9b00906.

Welcome message from author
This document is posted to help you gain knowledge. Please leave a comment to let me know what you think about it! Share it to your friends and learn new things together.
Transcript
Deciphering the Relations between Pore Structure and AdsorptionBehavior in Metal−Organic Frameworks: Unexpected Lessons fromArgon Adsorption on Copper−Benzene-1,3,5-tricarboxylateSilvio Dantas,† Lev Sarkisov,‡ and Alexander V. Neimark*,†
†Department of Chemical and Biochemical Engineering, Rutgers, The State University of New Jersey, 98 Brett Road, Piscataway,New Jersey 08854, United States‡Institute for Materials and Processes, School of Engineering, The University of Edinburgh, Edinburgh EH9 3JL, United Kingdom
*S Supporting Information
ABSTRACT: Consistent adsorption characterization ofmetal−organic frameworks (MOFs) is imperative for theirwider adoption in industry and practical applications.Current approaches are based on the conventionalintuitive representation of MOF pore space as a regularnetwork of pore compartments (cages and channels),adsorption in which occurs independently according totheir geometric dimensions. Here, we demonstrate thatthis conventional approach is unable to describe evenqualitatively the shape of Ar adsorption isotherms onhydrated and dehydrated Cu-BTC structures, one of themost well-known MOF materials. A combination ofgeometric characterization of MOF crystallographicstructure, molecular simulation, and virtual visualizationof the adsorption process reveals that the filling of theadjacent pore compartments proceeds in parallel in acomplex cooperative fashion. The proposed synergisticapproach helps us to understand the relations betweenpore structure geometric and chemical features andadsorption behavior, laying down a foundation forimproved methods for MOF characterization.
Metal−organic frameworks (MOFs) and related classes ofporous crystals have dominated the literature on
adsorption studies in the past 10 years.1−12 The promise thesematerials hold for various applications stems from theirexceptional adsorption characteristics and wide range of texturalproperties. The important issue that needs to be addressed isconsistent structural characterization of MOFs. Despite beingcrystalline materials in theory, real samples often deviate fromthe ideal structure due to residual solvent and reactants in thestructure, missing linkers, and partially collapsed regions of theframework. Themost instructive technique that is routinely usedfor MOF characterization is physical adsorption of nitrogen orargon at their normal boiling temperatures.13 Measuredadsorption isotherms contain important information about thesample porosity, surface area, and pore sizes, provided a clearlink exists between adsorption behavior and pore structure. It isassumed that, as the gas pressure increases, the adsorbate fills thepores in the order of their sizes, so that the pore size distribution(PSD) can be derived using a particular kernel of referenceadsorption isotherms in model pores of different sizes.13
However, generic adsorption characterization methods rely onsimplified pore structure models (independent cylindrical,spherical, or slit-shaped pores), which neglect real complexpore morphology of MOF crystals and produce, in some cases,PSDs inconsistent with the crystallographic parameters.14,15
Molecular simulations and computational structure character-ization tools can be of immense help to remedy this situation,since in silico, unlike in experiments, one can investigateproperties of an ideal, defect-free crystal, generate adsorptionisotherms using well-developed force fields, and directly obtaininformation on the pore morphology. Superficially, one maythink that, for the case of an idealized, perfect MOF,development of relations between structural characteristicsand adsorption isotherms should be a straightforward task.However, application of this approach to a well-known Cu-BTCstructure led to several challenges and unexpected lessons whichwe would like to share and explore in more detail, as they will beinstrumental in further efforts to develop reliable character-ization approaches.Since its first reported synthesis in 1999 by Chui et al.,16 Cu-
BTC (also known as HKUST-1) has been extensivelyinvestigated using both experimental and theoretical ap-proaches. Notably, the first molecular simulation study ofadsorption in MOFs was performed on Cu-BTC.17 The basicbuilding block of Cu-BTC is formed by Cu atoms coordinatedby benzene-1,3,5-tricarboxylate (BTC) ligands. Adsorption andcatalytic properties are mainly determined by accessibility ofunsaturated metal sites that might be easily hydrated oroccupied by impurities or ligands. One of the goals of structuralcharacterization is to distinguish between the samples withdifferent levels of hydration.In order to get a better understanding of the effects of
hydration on structural and adsorption properties, we considertwo reference Cu-BTC structures, one with fully saturated Cusites (hydrated18) and another with unsaturated sites (dehy-drated19). The cubic unit cell of Cu-BTC can be compartmen-talized into three types of cages denoted here as S1, L2, and L3.20
The pore structure represents a 3D network of alternating largerspheroidal cages L2 and L3 with tetrahedral-shaped small S1cages connected to L3 cages. In Figure 1A,C, we demonstratethe sizes of these cages by using probe spheres inscribed inside
Received: February 4, 2019Published: May 15, 2019
Communication
pubs.acs.org/JACSCite This: J. Am. Chem. Soc. 2019, 141, 8397−8401
© 2019 American Chemical Society 8397 DOI: 10.1021/jacs.9b00906J. Am. Chem. Soc. 2019, 141, 8397−8401
Dow
nloa
ded
by R
UT
GE
RS
UN
IV a
t 11:
09:0
9:46
6 on
Jun
e 05
, 201
9fr
om h
ttps:
//pub
s.ac
s.or
g/do
i/10.
1021
/jacs
.9b0
0906
.

each cage, without overlapping with any framework atoms, andserving as yardsticks: purple for S1, green for L2, and orange forL3. For dehydrated structure, the defined cage diameters (D) areS1, 0.45 nm; L2, 1.05 nm; and L3, 1.29 nm; as such, S1 falls inthe category of ultramicropores (D < 0.7 nm), while L2 and L3are supramicropores (0.7 nm < D < 2 nm).13
The hydrated structure, Figure 1C, has a more complex shapedue to the presence of the extra 12 oxygen atoms protruding intothe cage. These extra atoms significantly decrease the size of thesphere that can fit within the L3 cage (0.85 nm).Several methods for geometric analysis were developed to
calculate the pore volume, surface area, and PSD in modelporous materials, both disordered (activated carbons, polymers)and crystalline (zeolites, MOFs, ZIFs, etc.).21−24 Here, weemploy the Poreblazer code,24 described in detail in theSupporting Informaion (SI). It is based on the Connolly surfacemethod25 originally described by Gelb and Gubbins in thecontext of model porous glasses.26 The algorithm assigns a pointwithin the available pore space to a pore of a particular size withrespect to the maximum diameter of a spherical probe, as shownin Figure 1B,D.The geometric PSD analysis brings to light the striking effect
of the hydration on the pore shape and connectivity. From thevisual inspection of the pore structure compartmentalizationpresented in Figure 1A,C, one might expect to see three distinctpeaks on the differential PSD corresponding to the three cagetypes. Indeed, this is what is observed for the PSD of thedehydrated structure (Figure 1E top). Each of these peakscorresponds to the pore spaces represented in Figure 1B by
spheres of characteristic size and color (0.45 nm, purple; 1.0 nm,green; and 1.29 nm, orange). Similar distributions are found inthe literature20,27 using the geometrical methods applied inRASPA19 and Poreblazer.24 The green spherical caps seen ontop of the orange sphere represent the regions in the L3 cage notembraced by the largest fitted sphere due to not ideally sphericalpore shape. Nevertheless, the volume of each cage type can beunambiguously determined from the geometrical PSD with thetotal pore volume distributed between S1 (15%), L2 (42.5%),and L3 (42.5%) cages.In contrast, the PSD of the hydrated version (Figure 1E,
bottom) has four, rather than three, pronounced peaks thatshould indicate the existence of four pore types of distinct sizes.This effect is a result of the protrusion of oxygen atoms into L3cage, causing the geometric algorithm to interpret the shape ofL3 cage as being comprised of smaller pores. Figure 1Dillustrates the nature of this effect (additional schematics areprovided in the SI). First, the maximum size of the fitted spherein L3 cage reduces from 1.29 nm in dehydrated structure(orange in Figure 1B) to 0.85 nm (yellow in Figure 1D). Second,the remainder of L3 cage space is filled by additional blue (0.65nm), and purple (0.45 nm) spheres. The shape of L2 cagebecomes also more complex with the 1.01 nm cage in the center(green) and smaller peripheral compartments. The complexshape of the connected L2 and L3 cages is schematicallypresented in Figure 1F as a corrugated channel comprised ofoverlapping purple, yellow, blue, and green spheres. Notably, theblue spheres between the L2 and L3 cages correspond to thewindow spaces that were assigned to L3 cages in the dehydrated
Figure 1. Geometrical characterization of the pore structure in the dehydrated and hydrated Cu-BTC crystals. The framework atoms are set in theircrystallographic positions. (A, C) Compartmentalization of the unit cell into three types of cages shown by inserted spheres: S1 (purple), L2 (green),and L3 (orange). (B, D) Assignment of the pore diameters in geometric analysis by largest inserted spherical probes shown in different colors. (E)Geometric PSDs (differential and cumulative) of the dehydrated (top plot) and hydrated (bottom plot) structures. (F) Schematic representation ofthe pore space connecting L2 and L3 cages in the hydrated structure.
Journal of the American Chemical Society Communication
DOI: 10.1021/jacs.9b00906J. Am. Chem. Soc. 2019, 141, 8397−8401
8398
structure. Finally, smaller purple spheres represent not only S1cages, but also the peripheral regions of L2 and L3 cages, makingthe correspondent peak bigger than the one seen in the PSD forthe dehydrated sample.The characteristic differences in the pore geometry should be
reflected in the adsorption behavior, specifically by thecharacteristic steps and inflection points on the adsorptionisotherms. Assuming the Cu-BTC structure as consisting ofthree cage types, one could expect a three-step adsorptionisotherm for Ar at 87 K, with the first step at low pressurescorresponding to the filling of ultramicropores (S1) and twosubsequent distinct steps corresponding to the filling ofsupramicropores L2 and L3. Such three-step isotherm would
correspond to the geometrical PSD with three distinct peakssuch as the one for the dehydrated structure. On the other side,the PSD distribution with four peaks found for the hydrated Cu-BTC makes one expect a four-step adsorption isothermreflecting the subsequent filling of four groups of pores.Surprisingly, the adsorption isotherms obtained using grand
canonical Monte Carlo (GCMC) simulations (computationaldetails are given in the SI) do not conform to any of theseexpected scenarios (Figure 2A). Aside from the filling of theultramicropore cages S1 at 10−5 to 10−3 P/P0, the dehydratedsample features essentially one step in the region between 10−3
P/P0 and 10−2 P/P0. This step is initially very sharp, followed by
a gradual increase before reaching saturation levels. On the other
Figure 2.Molecular simulations of adsorption. (A) Adsorption isotherms of Ar at 87.3 K. (B, C) Adsorption potential maps with isosurfaces at −11(red), −8 (light green), and −4 (purple) kJ/mol.
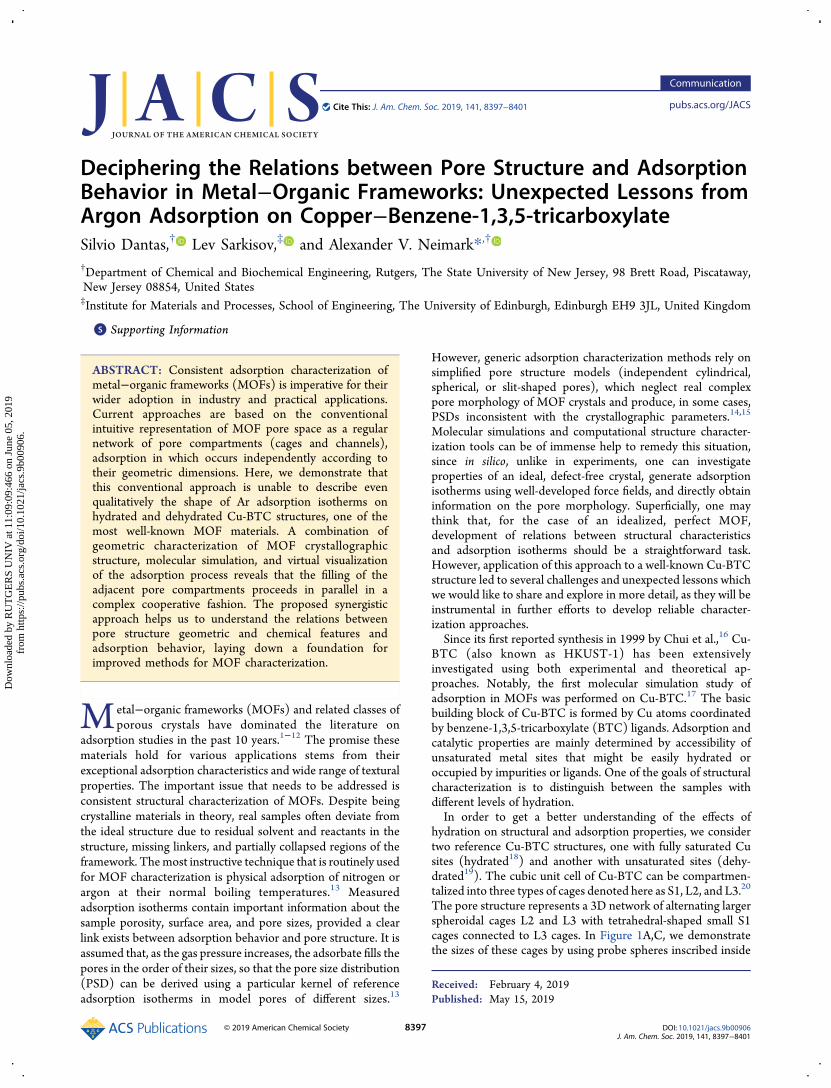
Figure 3. Simulated adsorption isotherms of Ar at 87.3 K in (A) dehydrated and (E) hydrated structures of Cu-BTC and respective snapshots at thepressure points 4× 10⁻⁴ (B, F), 3.2× 10⁻³ (C, G), 1× 10⁻¹ (D, H). Framework atoms shown: C, gray; O, red; Cu, tan. To distinguish the distributionof adsorbate in different cages, Ar molecules are shown in purple within S1, green within L2, and orange within L3. (B, F) Complete filling of S1; (C, G)complete filling of L2 and partial filling of L3; (D, H) complete filling.
Journal of the American Chemical Society Communication
DOI: 10.1021/jacs.9b00906J. Am. Chem. Soc. 2019, 141, 8397−8401
8399

hand, in the hydrated sample in the same pressure range thereare two very distinct steps. Additional insight is brought by theadsorption potential maps (Figure 2B, C) with isosurfaces forthree characteristic potential energies: −11 (red), −8 (lightgreen), and −4 (purple) kJ/mol. A side-by-side comparison ofthe isosurfaces shows the differences of the key adsorption sitesin the structures considered. The first isosurface, with energy of−11 kJ/mol (shown in red), is larger for the hydrated structure,which explains the higher adsorption in ultramicropores, whichincludes S1 cages, at pressures below 10−3 P/P0. The secondisosurface (−8 kJ/mol, light-green) is also larger for thehydrated structure, which is, most likely, the cause of slightlyearlier Ar condensation in L2 cages. Lastly, the third isosurface(−4 kJ/mol, purple) is smaller for the hydrated structure, whichcould explain delayed condensation in L3 pores in the hydratedstructure in contrast to the dehydrated one.To understand the adsorption mechanisms in these
structures, it is instructive to visualize the distributions ofmolecules along the isotherms. Snapshots in Figure 3 show thatalthough the geometric PSD analysis interprets L3 cage as asystem of smaller pores in the hydrated sample (even smallerthan L2), the sequence of complete pore filling in bothstructures is the same: S1, then L2, then L3 (detailed descriptionof Figure 3 is in the SI). The significant difference is the fact that,in the dehydrated sample, the steps associated withcondensation of argon in L2 and L3 are not distinct. Whilethe step associated with the filling L2 cages is quite sharp, fillingof the L3 cages proceeds gradually due to relatively largewindows between these cages. From this perspective, thesupramicropore structure of the dehydrated sample can bethought of as a network of corrugated channels rather than anetwork of distinct cages (L2 and L3) connected by narrowerwindows. For the hydrated sample, apparently, the adsorption inthe windows between L2 and L3 cages is delayed and, despitethe geometrical size of L3 cage is smaller due to the protrudingoxygen atoms, filling of L3 cage is reflected as a separate step onthe isotherm.In conclusion, a synergistic combination of geometrical
characterization of the pore structure, Monte Carlo simulationof adsorption isotherms, and molecular visualizations is neededto elucidate adsorption mechanisms and to establish nontrivialrelationships between geometrical and chemical features of aMOF and specifics of adsorption behavior. Our results giveimpetus to developing a novel approach to MOF character-ization based on the comparison of the experimental isothermswith their in silico simulated counterparts to reveal the similarityand the difference between the real samples and the idealcrystals. This will allow us to identify the fraction of MOFcrystals in the sample, the degree of hydration, and possiblecrystal defects due to residual solvents and other imperfections.
■ ASSOCIATED CONTENT
*S Supporting InformationThe Supporting Information is available free of charge on theACS Publications website at DOI: 10.1021/jacs.9b00906.
Poreblazer details, Monte Carlo simulation details, anddetails of visualization of adsorption behavior (PDF)
Computational files: adsorption isotherms, geometricalpore size distributions, and potential maps, includinginput-output files and codes (ZIP)
■ AUTHOR INFORMATIONCorresponding Author*[email protected] Dantas: 0000-0001-7168-4938Lev Sarkisov: 0000-0001-7637-7670Alexander V. Neimark: 0000-0002-3443-0389NotesThe authors declare no competing financial interest.
■ ACKNOWLEDGMENTSThis work is supported in part by the National ScienceFoundation (grant No 1834339) and by the CAPES Foundationthrough the Science Without Borders program.
■ REFERENCES(1) Forse, A. C.; Milner, P. J.; Lee, J. H.; Redfearn, H. N.; Oktawiec, J.;Siegelman, R. L.; Martell, J. D.; Dinakar, B.; Porter-Zasada, L. B.;Gonzalez,M. I.; Neaton, J. B.; Long, J. R.; Reimer, J. A. Elucidating CO2Chemisorption in Diamine-Appended Metal-Organic Frameworks. J.Am. Chem. Soc. 2018, 140 (51), 18016−18031.(2) Li, J.; Wang, X. X.; Zhao, G. X.; Chen, C. L.; Chai, Z. F.; Alsaedi,A.; Hayat, T.; Wang, X. K. Metal-organic framework-based materials:superior adsorbents for the capture of toxic and radioactive metal ions.Chem. Soc. Rev. 2018, 47 (7), 2322−2356.(3) Kobielska, P. A.; Howarth, A. J.; Farha, O. K.; Nayak, S. Metal-organic frameworks for heavy metal removal from water. Coord. Chem.Rev. 2018, 358, 92−107.(4) Kalmutzki, M. J.; Diercks, C. S.; Yaghi, O. M. Metal-OrganicFrameworks for Water Harvesting from Air. Adv. Mater. 2018, 30 (37),No. 1704304.(5)Hobday, C. L.;Woodall, C. H.; Lennox,M. J.; Frost, M.; Kamenev,K.; Duren, T.; Morrison, C. A.; Moggach, S. A. Understanding theadsorption process in ZIF-8 using high pressure crystallography andcomputational modelling. Nat. Commun. 2018, 9 (1), 1429.(6) Shen, V. K.; Siderius, D.W.;Mahynski, N. A.Molecular simulationof capillary phase transitions in flexible porous materials. J. Chem. Phys.2018, 148 (12), 124115.(7) Dang, S.; Zhu, Q. L.; Xu, Q. Nanomaterials derived from metal-organic frameworks. Nat. Rev. Mater. 2017, 3 (1), 17075−17088.(8) Lustig, W. P.; Mukherjee, S.; Rudd, N. D.; Desai, A. V.; Li, J.;Ghosh, S. K. Metal-organic frameworks: functional luminescent andphotonic materials for sensing applications. Chem. Soc. Rev. 2017, 46(11), 3242−3285.(9) Howarth, A. J.; Peters, A. W.; Vermeulen, N. A.; Wang, T. C.;Hupp, J. T.; Farha, O. K. Best Practices for the Synthesis, Activation,and Characterization of Metal-Organic Frameworks. Chem. Mater.2017, 29 (1), 26−39.(10) Choi, K. M.; Kim, D.; Rungtaweevoranit, B.; Trickett, C. A.;Barmanbek, J. T. D.; Alshammari, A. S.; Yang, P. D.; Yaghi, O. M.Plasmon-Enhanced PhotoCatalytic CO2 Conversion within MetalOrganic Frameworks under Visible Light. J. Am. Chem. Soc. 2017, 139(1), 356−362.(11) Demir, H.; Walton, K. S.; Sholl, D. S. Computational Screeningof Functionalized UiO-66 Materials for Selective ContaminantRemoval from Air. J. Phys. Chem. C 2017, 121 (37), 20396−20406.(12) Bien, C. E.; Chen, K. K.; Chien, S.-C.; Reiner, B. R.; Lin, L.-C.;Wade, C. R.; Ho, W. S. W. Bioinspired Metal−Organic Framework forTrace CO2 Capture. J. Am. Chem. Soc. 2018, 140 (40), 12662−12666.(13) Thommes, M.; Kaneko, K.; Neimark, A. V.; Olivier, J. P.;Rodriguez-Reinoso, F.; Rouquerol, J.; Sing, K. S. W. Physisorption ofgases, with special reference to the evaluation of surface area and poresize distribution (IUPACTechnical Report). Pure Appl. Chem. 2015, 87(9−10), 1051−1069.(14) Liang, X.; Zhang, Y.; Qu, Y. Y.; Han, Y.; Wang, X. L.; Cheng, A.;Duan, A. J.; Zhao, L. Synthesis of HKUST-1 and zeolite beta
Journal of the American Chemical Society Communication
DOI: 10.1021/jacs.9b00906J. Am. Chem. Soc. 2019, 141, 8397−8401
8400

composites for deep desulfurization of model gasoline. RSC Adv. 2018,8 (25), 13750−13754.(15) Beckner, M.; Dailly, A. Adsorption Enthalpy Calculations ofHydrogen Adsorption at Ambient Temperature and PressuresExceeding 300 bar. Am. J. Anal. Chem. 2013, 4 (10), 8−16.(16) Chui, S. S. Y.; Lo, S. M. F.; Charmant, J. P. H.; Orpen, A. G.;Williams, I. D. A chemically functionalizable nanoporous material [Cu-3(TMA)(2)(H2O)(3)](n). Science 1999, 283 (5405), 1148−1150.(17) Vishnyakov, A.; Ravikovitch, P. I.; Neimark, A. V.; Bulow, M.;Wang, Q. M. Nanopore Structure and Sorption Properties of Cu−BTCMetal−Organic Framework. Nano Lett. 2003, 3 (6), 713−718.(18) Yakovenko, A. A.; Reibenspies, J. H.; Bhuvanesh, N.; Zhou, H. C.Generation and applications of structure envelopes for porous metal-organic frameworks. J. Appl. Crystallogr. 2013, 46, 346−353.(19) Dubbeldam, D.; Calero, S.; Ellis, D. E.; Snurr, R. Q. RASPA:molecular simulation software for adsorption and diffusion in flexiblenanoporous materials. Mol. Simul. 2016, 42 (2), 81−101.(20) Getzschmann, J.; Senkovska, I.; Wallacher, D.; Tovar, M.; Fairen-Jimenez, D.; Duren, T.; van Baten, J. M.; Krishna, R.; Kaskel, S.Methane storage mechanism in the metal-organic framework Cu-3(btc)(2): An in situ neutron diffraction study.Microporous MesoporousMater. 2010, 136 (1−3), 50−58.(21) Martin, R. L.; Haranczyk, M. Construction and Characterizationof Structure Models of Crystalline Porous Polymers. Cryst. Growth Des.2014, 14 (5), 2431−2440.(22) Pinheiro, M.; Martin, R. L.; Rycroft, C. H.; Jones, A.; Iglesia, E.;Haranczyk, M. Characterization and comparison of pore landscapes incrystalline porous materials. J. Mol. Graphics Modell. 2013, 44, 208−219.(23) First, E. L.; Floudas, C. A. MOFomics: Computational porecharacterization of metal−organic frameworks.MicroporousMesoporousMater. 2013, 165, 32−39.(24) Sarkisov, L.; Harrison, A. Computational structure character-isation tools in application to ordered and disordered porous materials.Mol. Simul. 2011, 37 (15), 1248−1257.(25) Connolly, M. L. Analytical Molecular-Surface Calculation. J.Appl. Crystallogr. 1983, 16 (Oct), 548−558.(26) Gelb, L. D.; Gubbins, K. E. Characterization of Porous Glasses:Simulation Models, Adsorption Isotherms, and the Brunauer−Emmett−Teller Analysis Method. Langmuir 1998, 14 (8), 2097−2111.(27) Wu, Y.; Liu, D. F.; Chen, H. Y.; Qian, Y.; Xi, H. X.; Xia, Q. B.Enhancement effect of lithium-doping functionalization on methanoladsorption in copper-based metal-organic framework. Chem. Eng. Sci.2015, 123, 1−10.
Journal of the American Chemical Society Communication
DOI: 10.1021/jacs.9b00906J. Am. Chem. Soc. 2019, 141, 8397−8401
8401
Related Documents