Decimation Estimation and Super-Resolution Using Zoomed Observations Prakash P. Gajjar, Manjunath V. Joshi, Asim Banerjee, and Suman Mitra Dhirubhai Ambani Institute of Information and Communication Technology, Gandhinagar, India Abstract. We propose a technique for super-resolving an image from several observations taken at different camera zooms. From the set of these images, a super-resolved image of the entire scene (least zoomed) is obtained at the resolution of the most zoomed one. We model the super- resolution image as a Markov Random Field (MRF). The cost function is derived using a Maximum a posteriori (MAP) estimation method and is optimized by using gradient descent technique. The novelty of our ap- proach is that the decimation (aliasing) matrix is obtained from the given observations themselves. Results are illustrated with real data captured using a zoom camera. Application of our technique to multiresolution fusion in remotely sensed images is shown. 1 Introduction In many of the imaging applications, images with high spatial resolution are desired and often required. The spatial resolution can be increased by using high density sensor for capturing the image. However, this is not possible as there exist a limit on pixel size. The resolution enhancement from a single observation using image interpolation is of limited application because of the aliasing present in the low resolution image. Super-resolution refers to the process of producing a high spatial resolution image from several low-resolution observations. When one captures the images with different zoom settings, the amount of aliasing is different in differently zoomed observations. This is because the least zoomed entire area of the scene is represented by a very limited number of pixels, i.e., it is sampled with a very low sampling rate and the most zoomed image with a higher sampling frequency. Therefore, larger scene coverage will have lower resolution with more aliasing effect. By varying the zoom level, one observes the scene at different levels of aliasing and blurring. Thus, one can use zoom as a cue for generating high-resolution images at the lesser zoomed area of a scene. The super-resolution idea was first proposed by Tsai and Huang [1] using frequency domain approach and employing motion as a cue. In [2], the authors use a Maximum a posteriori framework for jointly estimating the registration pa- rameters and the high-resolution image for severely aliased observations. A MAP estimator with Huber-MRF prior is described by Schultz and Stevenson in [3]. Lin and Shum determine the fundamental limits of reconstruction-based super- resolution algorithms using the motion cue and obtain the magnification limits P. Kalra and S. Peleg (Eds.): ICVGIP 2006, LNCS 4338, pp. 45–57, 2006. c Springer-Verlag Berlin Heidelberg 2006

Welcome message from author
This document is posted to help you gain knowledge. Please leave a comment to let me know what you think about it! Share it to your friends and learn new things together.
Transcript

Decimation Estimation and Super-Resolution
Using Zoomed Observations
Prakash P. Gajjar, Manjunath V. Joshi, Asim Banerjee, and Suman Mitra
Dhirubhai Ambani Institute of Information and Communication Technology,Gandhinagar, India
Abstract. We propose a technique for super-resolving an image fromseveral observations taken at different camera zooms. From the set ofthese images, a super-resolved image of the entire scene (least zoomed) isobtained at the resolution of the most zoomed one. We model the super-resolution image as a Markov Random Field (MRF). The cost functionis derived using a Maximum a posteriori (MAP) estimation method andis optimized by using gradient descent technique. The novelty of our ap-proach is that the decimation (aliasing) matrix is obtained from the givenobservations themselves. Results are illustrated with real data capturedusing a zoom camera. Application of our technique to multiresolutionfusion in remotely sensed images is shown.
1 Introduction
In many of the imaging applications, images with high spatial resolution aredesired and often required. The spatial resolution can be increased by usinghigh density sensor for capturing the image. However, this is not possible as thereexist a limit on pixel size. The resolution enhancement from a single observationusing image interpolation is of limited application because of the aliasing presentin the low resolution image. Super-resolution refers to the process of producinga high spatial resolution image from several low-resolution observations. Whenone captures the images with different zoom settings, the amount of aliasing isdifferent in differently zoomed observations. This is because the least zoomedentire area of the scene is represented by a very limited number of pixels, i.e.,it is sampled with a very low sampling rate and the most zoomed image witha higher sampling frequency. Therefore, larger scene coverage will have lowerresolution with more aliasing effect. By varying the zoom level, one observes thescene at different levels of aliasing and blurring. Thus, one can use zoom as acue for generating high-resolution images at the lesser zoomed area of a scene.
The super-resolution idea was first proposed by Tsai and Huang [1] usingfrequency domain approach and employing motion as a cue. In [2], the authorsuse a Maximum a posteriori framework for jointly estimating the registration pa-rameters and the high-resolution image for severely aliased observations. A MAPestimator with Huber-MRF prior is described by Schultz and Stevenson in [3].Lin and Shum determine the fundamental limits of reconstruction-based super-resolution algorithms using the motion cue and obtain the magnification limits
P. Kalra and S. Peleg (Eds.): ICVGIP 2006, LNCS 4338, pp. 45–57, 2006.c© Springer-Verlag Berlin Heidelberg 2006

46 P.P. Gajjar et al.
from the conditioning analysis of the coefficient matrix [4]. Capel and Zisserman[5] have proposed a technique for automated mosaicing with super-resolutionzoom by fusing information from several views of a planar surface in order toestimate its texture. The authors in [6] integrate the tasks of super-resolutionand recognition by directly computing a maximum likelihood parameter vectorin high-resolution tensor space for face recognition.
Most of the methods of super-resolution proposed in literature use motion cuefor estimating high resolution image. This requires registration of images withsub-pixel accuracy. The non-redundant information can also be obtained by us-ing different camera parameters or different lighting conditions while capturingthe scene. The authors in [7] describe an MAP-MRF based super-resolutiontechnique using blur cue. They recover both the high-resolution scene intensityand the depth fields simultaneously using the defocus cue. The authors in [8]recover the super-resolution intensity field from a sequence of zoomed observa-tions. The resolution of entire scene is obtained at the resolution of the mostzoomed observed image which consists of only a portion of the actual scene. Formore details refer to [9].
In this paper, we obtain super-resolution by using zoom as a cue. We modelthe super-resolution image as an MRF and assume that the high resolution imageat the most zoom setting is super-resolved. In our image formation model, welearn the decimation (aliasing) matrix from the most zoomed observation anduse MAP-MRF formulation to obtain super-resolved image for the entire scene.We are also assuming that the images are registered while zooming. Howeverafter registering the images we need to estimate the aliasing accurately so thatthe model fits well. It may be interesting to see that our approach generates asuper-resolved image of the entire scene, although only a part of the observedscene has multiple observations.
2 Image Formation Model
The zoom based super-resolution problem can be cast in a restoration frame-work. There are p observed images Yi, i = 1 to p, each captured with differentzoom settings and are of size M1 × M2 pixels each. Fig. 1 illustrates the blockschematic of how the low-resolution observations of a scene at different zoomsettings are related to the high-resolution image. Here we consider that the mostzoomed observed image of the scene Yp (p = 3) has the highest spatial resolution.We are assuming that there is no rotation about the optical axis between the ob-served images taken at different zooms. Since different zoom settings give rise todifferent resolutions, the least zoomed scene corresponding to entire scene needsto be upsampled to the size of (q1q2 . . . qp−1) × (M1 × M2) pixels (= N1 × N2
pixels), where q1, q2, . . . , qp−1 are the corresponding zoom factors between twosuccessively observed images of the scene Y1Y2, Y2Y3, . . ., Yp−1Yp respectively.Given Yp, the remaining (p−1) observed images are then modeled as decimatedand noisy versions of this single high-resolution image of the appropriate regionin the scene. The most zoomed observed image will have no decimation. The lowresolution image observation model is shown in Fig. 2.

Decimation Estimation and Super-Resolution Using Zoomed Observations 47
Fig. 1. Illustration of observations at different zoom levels, Y1 corresponds to the leastzoomed and Y3 to the most zoomed images. Here z is the high resolution image of thescene.
Fig. 2. Low-resolution image formation model for three different zoom levels. Viewcropping block just crops the relevant part of the high resolution image Z as the fieldof view shrinks with zooming.
Let ym represent the lexicographically ordered vector of size M1M2×1, whichcontains the pixels from differently zoomed images Ym and z be the super-resolved image. The observed images can be modeled as
ym = DmCm(z − zαm) + nm, m = 1, · · · , p, (1)
where D is the decimation matrix which takes care of aliasing present whilezooming. The subscript m in D denotes that the amount of decimation dependson the amount of zoom for mth observation, size of which depends on the zoomfactor. For an integer zoom factor of q, the decimation matrix D consists of

48 P.P. Gajjar et al.
q2 non-zero elements along each row at appropriate locations. The procedurefor estimating the decimation matrix is described in section 3. Cm is a croppingoperator with zαm = z(x−αmx , y−αmy) and αm = (αmx , αmy) representing thelateral shift of the optical shift during zooming process for the mth observation.The cropping operation is analogous to a characteristic function which crop outsthe �q1q2 . . . qm−1N1� × �q1q2 . . . qm−1N2� pixel area from the high resolutionimage z at an appropriate position. nm is the i.i.d noise vector with zero meanand variance σ2
n. It is of the size, M1M2 × 1. The multivariate noise probabilitydensity is given by
P (nm) =1
(2πσ2n)
M1M22
e− 1
2σ2nnT
mnm. (2)
Our problem is to estimate z given yms, which is an ill-posed inverse problem.It may be mentioned here that the observations captured are not blurred. Inother words, we assume identity matrix for blur.
3 Estimation of Decimation (Aliasing) Matrix
The general model for super-resolution based on motion cue is [10],
y = DHWz + n, (3)
where W is a warping matrix, H is a blur matrix, D is a decimation matrixand n is a noise vector. Here the decimation model to obtain the aliased pixelintensities from the high resolution pixels has the form [3]
D =1q2
⎛⎜⎜⎝
1 1 . . . 1 01 1 . . . 1
0 1 1 . . . 1
⎞⎟⎟⎠ . (4)
As an example, consider an observation of size 2×2. For the decimation factorof q = 2, the size of z becomes 4 × 4. z can be represented as lexicographicallyordered vector having 16 elements. The Decimation matrix D is of size 4 × 16and it can be expressed with reordering of z as
D =14
⎛⎜⎜⎝
1 1 1 1 0 0 0 0 0 0 0 0 0 0 0 00 0 0 0 1 1 1 1 0 0 0 0 0 0 0 00 0 0 0 0 0 0 0 1 1 1 1 0 0 0 00 0 0 0 0 0 0 0 0 0 0 0 1 1 1 1
⎞⎟⎟⎠ . (5)
In other words the aliased pixel intensity at a location (i, j) of a low resolutionimage for a zoom factor of q = 2 is given by
y(i, j) =14z(2i, 2j)+
14z(2i, 2j+1)+
14z(2i+1, 2j)+
14z(2i+1, 2j+1)+n(i, j). (6)

Decimation Estimation and Super-Resolution Using Zoomed Observations 49
Here (2i, 2j), (2i, 2j +1), (2i+1, 2j) and (2i+1, 2j +1) are corresponding 4 (q2)pixel locations in the higher resolution image and n(i, j) is the noise at the pixel(i, j).
The decimation matrix in Eq. (4) indicates that a low resolution pixel intensityy(i, j) is obtained by averaging the intensities of q2 pixels corresponding to thesame scene in the high resolution image and adding noise intensity n(i, j) (referto Eq.(1)). In other words, all q2 high resolution intensities are weighted equallyby 1
q2 (14 for q = 2) to obtain the distorted or aliased pixel. This decimation
model simulates the integration of light intensity that falls on the high resolutiondetector. This assumes that the entire area of a pixel acts as the light sensingarea and there is no space in the pixel area for wiring or insulation. In otherwords, fill factor for the CCD array is unity. However, in practice, the observedintensity at a pixel captured due to low resolution sampling depends on variousfactors such as camera gain, illumination condition, zoom factor, noise etc. Hencethe aliased low resolution pixel intensity of an image point is not always equallyweighted sum of the high resolution intensities. Since we capture the images atdifferent resolutions using zoom camera and the most zoomed image is assumedto be alias free, we estimate the weights from the most zoomed region. Theseweights are obtained by considering the most zoomed image and correspondingportion in the lesser zoomed images. We estimate 4 weights for a zoom factor of2 and 16 for a zoom factor of 4. The estimated weight vectors are then used inEq.(1) for forming D matrix to get the observation model. It may be noted thatfor a given zoom factor, we are not estimating different weights for each location.Since the average brightness of each observation varies due to AGC of camera,we used mean correction to maintain average brightness of the captured imagesapproximately the same and use these observations for the D matrix estimationas well as for experimentation. Mean correction for Y2 is obtained by subtractingit’s mean from each of its pixel and adding the mean of corresponding portionin Y1. Similarly, for Y3, it is obtained by subtracting from each pixel, its meanand adding the mean of corresponding portion in Y1. (Refer to Fig.1.)
The decimation matrix of the form shown in Eq.(4), can now be modified as,
D =
⎛⎜⎜⎝
a1 a2 . . . aq2 0a1 a2 . . . aq2
0 a1 a2 . . . aq2
⎞⎟⎟⎠ , (7)
where |ai| ≤ 1, i = 1, 2, . . . q2. The Decimation matrix D for the consideredexample of 2 × 2 observation can be expressed with reordering of z as
D =
⎛⎜⎜⎝
a1 a2 a3 a4 0 0 0 0 0 0 0 0 0 0 0 00 0 0 0 a1 a2 a3 a4 0 0 0 0 0 0 0 00 0 0 0 0 0 0 0 a1 a2 a3 a4 0 0 0 00 0 0 0 0 0 0 0 0 0 0 0 a1 a2 a3 a4
⎞⎟⎟⎠ . (8)

50 P.P. Gajjar et al.
The aliased pixel intensity at a location (i, j) for a zoom factor of q = 2 is nowgiven by
y(i, j) = a1z(2i, 2j)+a2z(2i, 2j+1)+a3z(2i+1, 2j)+a4z(2i+1, 2j+1)+n(i, j).(9)
In [11], authors discuss the spatial interaction model and choice of neighborsand use the same for texture synthesis. They model every pixel in an image as alinear combination of neighboring pixels considering neighborhood system. Theyestimate the model parameters using the Least Squares (LS) estimation approachas the initial estimates. In this paper, we use their approach for estimating theweights in decimation matrices for different zoom factors.
4 Super-Resolving a Scene
4.1 MRF Prior Model for the Super-Resolved Image
In order to obtain a regularized estimate of the high-resolution image, we definean appropriate prior term using an MRF modeling of the field. The MRF pro-vides a convenient and consistent way of modeling context dependent entities.This is achieved through characterizing mutual influence among such entitiesusing conditional probabilities for a given neighborhood. The practical use ofMRF models is largely ascribed to the equivalence between the MRF and theGibbs Random Fields (GRF). We assume that the high-resolution image can berepresented by an MRF. This is justified because the changes in intensities ina scene is gradual and hence there is a local dependency. Let Z be a randomfield over an regular N × N lattice of sites L = {(i, j)|1 < i, j < N}. From theHammersley-Clifford theorem for MRF-GRF equivalence, we have,
P (Z = z) =1Zp
e−U(z), (10)
where z is a realization of Z, Zp is a partition function given by Zp =∑
z e−U(z)
and U(z) is energy function given by U(z) =∑
c∈C Vc(z). Vc(z) denotes thepotential function of clique c and C is the set of all cliques. The lexicographicallyordered high resolution image z satisfying Gibbs density function is now writtenas
P (z) =1Zp
e−�
c∈C Vc(z). (11)
We consider pair wise cliques on a first-order neighborhoods consisting of thefour nearest neighbors for each pixel and impose a quadratic cost which is afunction of finite difference approximations of the first order derivative at eachpixel location. i.e.,
∑c∈C
Vc(z) = λ
N1∑k=1
N2∑l=1
[(zk,l − zk,l−1)2 + (zk,l − zk−1,l)2], (12)
where λ represents the penalty for departure from the smoothness in z.

Decimation Estimation and Super-Resolution Using Zoomed Observations 51
4.2 Maximum a Posteriori (MAP) Estimation
Having defined the MRF prior, we use the MAP estimator to restore the high-resolution field z. Given the ensemble of images yi, i = 1 to p, at differentresolutions, the MAP estimate z, using Bayesian rule, is given by
z =argmax
zP (z|y1,y2, · · · ,yp) =
argmax
zP (y1,y2, · · · ,yp|z)P (z). (13)
Taking the log of the posterior probability we can write,
z =argmax
z[
p∑m=1
logP (ym|z) + logP (z)], (14)
since nm are independent. Now using Eqs. (1) and (2), we get
P (ym|z) =1
(2πσ2n)
M1M22
e−‖ym−DmCm(z−zαm )‖2
2σ2n . (15)
The final cost function is obtained as
z =argmin
z[
p∑m=1
‖ym − DmCm(z − zαm)‖2
2σ2n
+∑c∈C
Vc(z)]. (16)
The above cost function is convex and is minimized using the gradient descenttechnique. The initial estimate z(0) is obtained as follows. Pixels in the zero orderhold of the least zoomed observation corresponding to the entire scene is replacedsuccessively at appropriate places with zero order hold of the other observedimages with increasing zoom factors. Finally, the most zoomed observed imagewith the highest resolution is copied at the appropriate location (see Fig. 1.)with no interpolation.
5 Experimental Results
In this section, we present the results of the proposed method of obtaining super-resolution by estimating the decimation. All the experiments were conducted onreal images taken by a zoom camera and known integer zoom factors. It assumedthat the lateral shift during zooming is known. In each experiment, we considerthree low resolution observations Y1, Y2, Y3 of an image. Each observed image is ofsize 72×96. Zoom factor q between Y1 and Y2 is 2 and that between Y1 and Y3 is4. The super-resolved images for the entire scene are of size 288×384. We obtainsuper-resolution and compare the results obtained using decimation matrix of theform in Eq. (4) consisting of equal weights. We used the quantitative measuresMean Square Error (MSE) and Mean Absolute Error (MAE) for comparison ofthe results. The MSE used here is

52 P.P. Gajjar et al.
MSE =
∑i,j [f(i, j) − f(i, j)]2∑
i,j [f(i, j)]2(17)
and MAE is
MAE =
∑i,j |f(i, j) − f(i, j)|∑
i,j |f(i, j)| , (18)
where f(i, j) is the original high resolution image and f(i, j) is estimated super-resolution image. In order to use high resolution image for the entire scene themost zoomed image was captured with entire scene content. However, whileexperimenting only a portion of it was used. The estimated D matrices are usedin the cost function given by Eq. (16).
(a) (b) (c)
Fig. 3. Observed images of ’Nidhi’ captured with three different integer zoom settings.The zoom factor between (a) and (b) is 2 and between (b) and (c) is also 2.
In the first experiment, we considered three low resolution observations of agirl image ’Nidhi’ shown in Fig. 3, where the observed images have less intensityvariations. Fig. 4(a) and (b) shows zoomed ’Nidhi’ image obtained by successivepixel replication and successive bicubic interpolation respectively. In both theimages the seam is clearly visible. Fig. 5(a) shows super-resolved ’Nidhi’ imageobtained by using the decimation matrix of the form in Eq. (4) and Fig. 5(b)shows super-resolved ’Nidhi’ image obtained by proposed method by using theestimated decimation matrix of the form in Eq. (7). The comparison of the
(a) (b)
Fig. 4. Zoomed ’Nidhi’ image (a) using successive pixel replication and (b) using suc-cessive bicubic interpolation
Decimation Estimation and Super-Resolution Using Zoomed Observations 53
(a) (b)
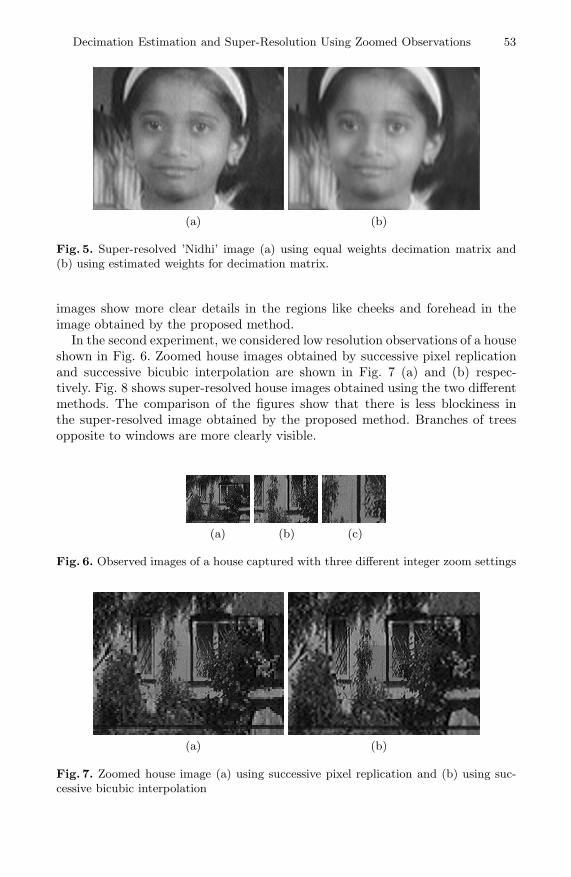
Fig. 5. Super-resolved ’Nidhi’ image (a) using equal weights decimation matrix and(b) using estimated weights for decimation matrix.
images show more clear details in the regions like cheeks and forehead in theimage obtained by the proposed method.
In the second experiment, we considered low resolution observations of a houseshown in Fig. 6. Zoomed house images obtained by successive pixel replicationand successive bicubic interpolation are shown in Fig. 7 (a) and (b) respec-tively. Fig. 8 shows super-resolved house images obtained using the two differentmethods. The comparison of the figures show that there is less blockiness inthe super-resolved image obtained by the proposed method. Branches of treesopposite to windows are more clearly visible.
(a) (b) (c)
Fig. 6. Observed images of a house captured with three different integer zoom settings
(a) (b)
Fig. 7. Zoomed house image (a) using successive pixel replication and (b) using suc-cessive bicubic interpolation

54 P.P. Gajjar et al.
(a) (b)
Fig. 8. Super-resolved house image. (a) using equal weights decimation matrix and (b)using estimated weights for decimation matrix.
(a) (b) (c)
Fig. 9. Observed images of a scene captured with three different integer zoom settings
(a) (b)
Fig. 10. Super-resolved scene image. (a) using equal weights decimation matrix and(b) using estimated weights for decimation matrix.
In order to consider images with significant texture, we experimented by cap-turing zoomed images of a natural scene. The observed images are displayed in Fig.9. Fig. 10 shows super-resolved scene images. The small house near the center ofimage appear sharper in the image super-resolved using the proposed approach.
Table 1. shows the quantitative comparison of the our results with the oneobtained using equal weights for decimation matrix. It can be seen that for allthe three experiments, MSE and MAE of the super-resolved images obtainedby using estimated decimation matrices is lower than those obtained by fixeddecimation matrix entries showing improvement in the quantitative measures.

Decimation Estimation and Super-Resolution Using Zoomed Observations 55
Table 1. Comparison of performance of the two methods of super-resolution
MSE MAEImage Estimated Fixed Estimated Fixed
decimation decimation decimation decimation(Equal weights) (Equal weights)
Nidhi 0.0484 0.0514 0.0489 0.0525House 0.6671 0.6733 0.6678 0.6751Scene 0.2732 0.3056 0.2741 0.3082
6 Application of Zoom Based Super-Resolution toMultiresolution Fusion in Remotely Sensed Images
In this section we show the application of the proposed zoom based super-resolution to multiresolution fusion in remotely sensed images. The process ofcombining panchromatic (Pan) and multispectral (MS) data to produce imagescharacterized by both high spatial and spectral resolutions is known as multires-olution fusion. Because of the technological limitations, MS images are generallyacquired with a lower spatial resolution. With a fusion of different images, wecan overcome the limitations of information obtained from individual sourcesand obtain a better understanding of the observed scene. Since the Pan imagehas high spatial resolution and MS images have lower spatial resolution, we es-timate the aliasing on MS images by using the Pan image. The same Pan imageis used to estimate the aliasing on each of MS images. Available Pan image canbe used for estimating aliasing matrices for all the MS images as the aliasingdepends on difference in spatial resolution between high resolution and low reso-lution images.For the experiment, we consider LANDSAT-7 Enhanced Thematic
(a) (b)
Fig. 11. (a) MS image (Band 1) and (b) fused image using estimated weights fordecimation matrix

56 P.P. Gajjar et al.
Mapper Plus (ETM+) images acquired over a city. We use available Pan imageand six MS images having decimation factor of q = 2 between the Pan image andMS images. We learn the decimation matrix from the Pan image and minimizethe cost function given by Eq. (16) for each of MS images separately. It may benoted that the z in the equations has to be replaced by zm, where m = 1, 2, . . . , 5(One of the MS images, Band 6, is not used.). Due to space limitation, we showresults for only one MS image. Fig. 11(a) shows observed MS image (Band 1).The fused image obtained by using estimated weights is shown in in Fig. 11(b).From the figure it is clear that the fused image has high spatial resolution withnegligible spectral distortion. It may be mentioned that we have not comparedthe performance of this method with other methods of fusion available in theliterature due to space limitation.
7 Conclusion
We have presented a technique to recover the super-resolution intensity fieldfrom a sequence of zoomed observations by using decimation matrices derivedfrom the observations. The resolution of the entire scene is obtained at theresolution of the most zoomed observed image that consists of only a smallportion of the actual scene. The high-resolution image is modeled as an MRFand the decimation matrix entries are estimated using appropriate regions inthe lesser zoomed image and the most zoomed image. Our future work involvesincorporating the line fields in MRF model so that the discontinuities can bebetter preserved in the super-resolved image and also to extend the proposedapproach for fractional zoom settings.
References
1. Tsai, R.Y., Huang, T.S.: Multiframe image restoration and registration. Advancesin Computer Vision and Image Processsing. (1984) 317 – 339
2. Hardie, R.C., Barnard, K.J., Armstrong, E.E.: Joint map registration and high-resolution image estimation using a sequence of undersampled images. IEEE Trans.Image Process. 6 (1997) 1621 – 1633
3. Schultz, R.R., Stevenson, R.L.: A Bayesian approach to image expansion for im-proved definition. IEEE Trans. Image Process. 3 (1994) 233 – 242
4. Lin, Z., Shum, H.Y.: Fundamental limits of reconstruction-based super-resolutionalgorithms under local translation. IEEE Trans. Pattern Anal. Machine Intell. 26(2004) 83 – 97
5. Capel, D., Zisserman, A.: Automated mosaicing with super-resolution zoom. Proc.IEEE Int. Conf. Comput. Vision Pattern Recogn. (1998) 885 – 891
6. Jia, K., Gong, S.: Multi-modal tensor face for simultaneous super-resolution andrecognition. Proc. of IEEE Int. Conf. on Computer Vision 2 (2005) 1683 – 1690
7. Rajan, D., Chaudhuri, S.: Generation of super-resolution images from blurredobservations using an MRF model. J. Math. Imag. Vision 16 (2002) 5 – 15
8. Joshi, M.V., Chaudhuri, S., Rajkiran, P.: Super-resolution imaging: Use of zoomas a cue. Image and Vision Computing 22 (2004) 1185 – 1196

Decimation Estimation and Super-Resolution Using Zoomed Observations 57
9. Chaudhuri, S., Joshi, M.V.: Motion-free Super-resolution. Springer (2005)10. Park, S.C., Park, M.K., Kang, M.G.: Super-resolution image reconstruction: A
technical overview. IEEE Signal Processing Magazine 20 (2003) 21 – 3611. Kashyap, R., Chellappa, R.: Estimation and choice of neighbors in spatial-
interaction models of images. IEEE Trans. Inf. Theory IT-29 (1983) 60 – 72
Related Documents