Decentralization and Segment Reporting Chapter 12

Welcome message from author
This document is posted to help you gain knowledge. Please leave a comment to let me know what you think about it! Share it to your friends and learn new things together.
Transcript

Decentralization and
Segment Reporting
Chapter
12

12-2
© McGraw-Hill Ryerson Limited., 2001
LEARNING OBJECTIVES
1. Differentiate between a cost centre, profitcentre and investment centre and explainhow performance is measured in each.
2. Prepare a segmented income statementusing the contribution format, and explain thedifference between traceable fixed costs andcommon fixed costs.
3. Identify three business practices that hinderproper cost assignment.
4. Analyze variances from revenue targets.
After studying this chapter, you should be able to:
12-3
© McGraw-Hill Ryerson Limited., 2001
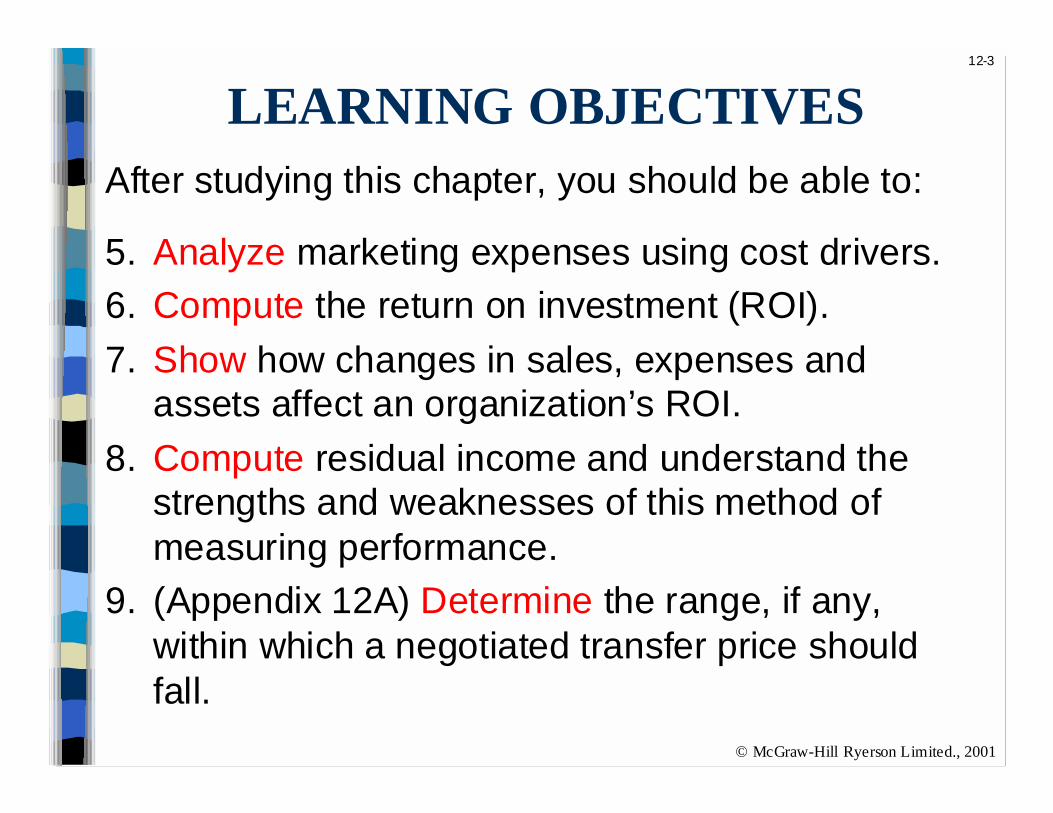
LEARNING OBJECTIVES
5. Analyze marketing expenses using cost drivers.
6. Compute the return on investment (ROI).
7. Show how changes in sales, expenses andassets affect an organization’s ROI.
8. Compute residual income and understand thestrengths and weaknesses of this method ofmeasuring performance.
9. (Appendix 12A) Determine the range, if any,within which a negotiated transfer price shouldfall.
After studying this chapter, you should be able to:
12-4
© McGraw-Hill Ryerson Limited., 2001
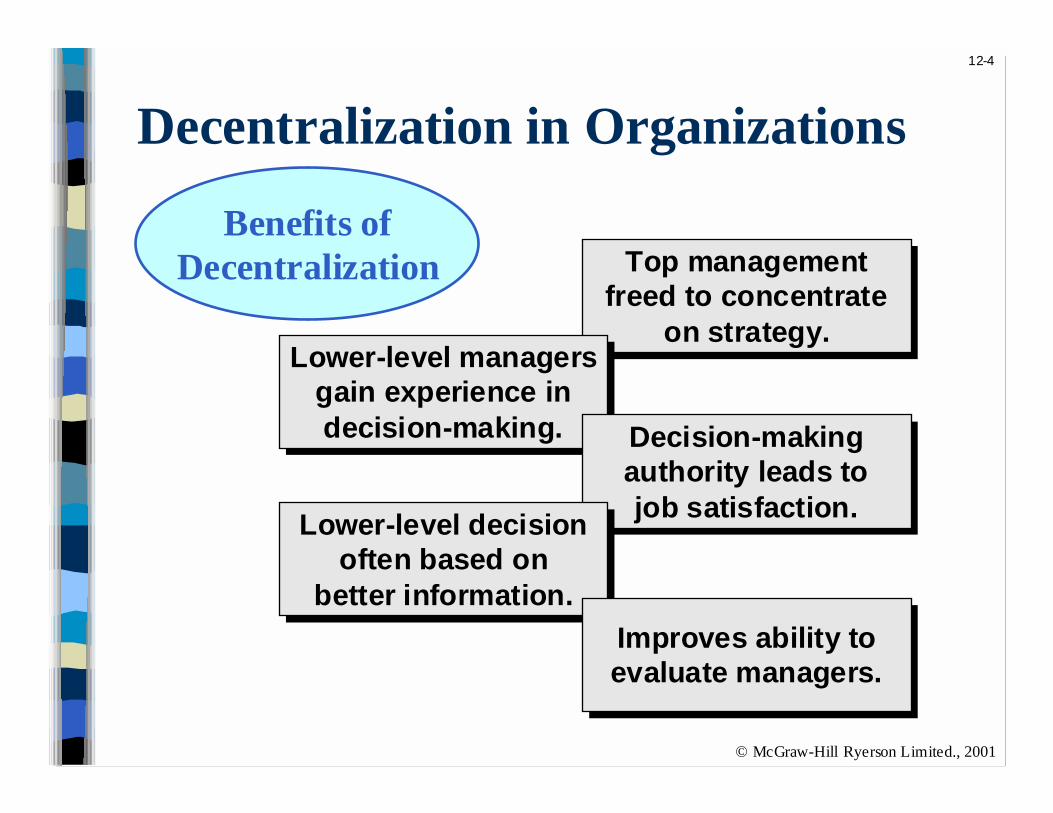
Decentralization in Organizations
Benefits ofDecentralization Top management
freed to concentrateon strategy.
Top managementfreed to concentrate
on strategy.Lower-level managers
gain experience indecision-making.
Lower-level managersgain experience indecision-making. Decision-making
authority leads tojob satisfaction.
Decision-makingauthority leads tojob satisfaction.
Lower-level decisionoften based on
better information.
Lower-level decisionoften based on
better information.
Improves ability toevaluate managers.
Improves ability toevaluate managers.

12-5
© McGraw-Hill Ryerson Limited., 2001
Decentralization in Organizations
Disadvantages ofDecentralization
Lower-level managersmay make decisionswithout seeing the
“big picture.”
Lower-level managersmay make decisionswithout seeing the
“big picture.”
May be a lack ofcoordination among
autonomousmanagers.
May be a lack ofcoordination among
autonomousmanagers.
Lower-level manager’sobjectives may not
be those of theorganization.
Lower-level manager’sobjectives may not
be those of theorganization.
May be difficult tospread innovative ideas
in the organization.
May be difficult tospread innovative ideas
in the organization.
12-6
© McGraw-Hill Ryerson Limited., 2001
Decentralization and Segment Reporting
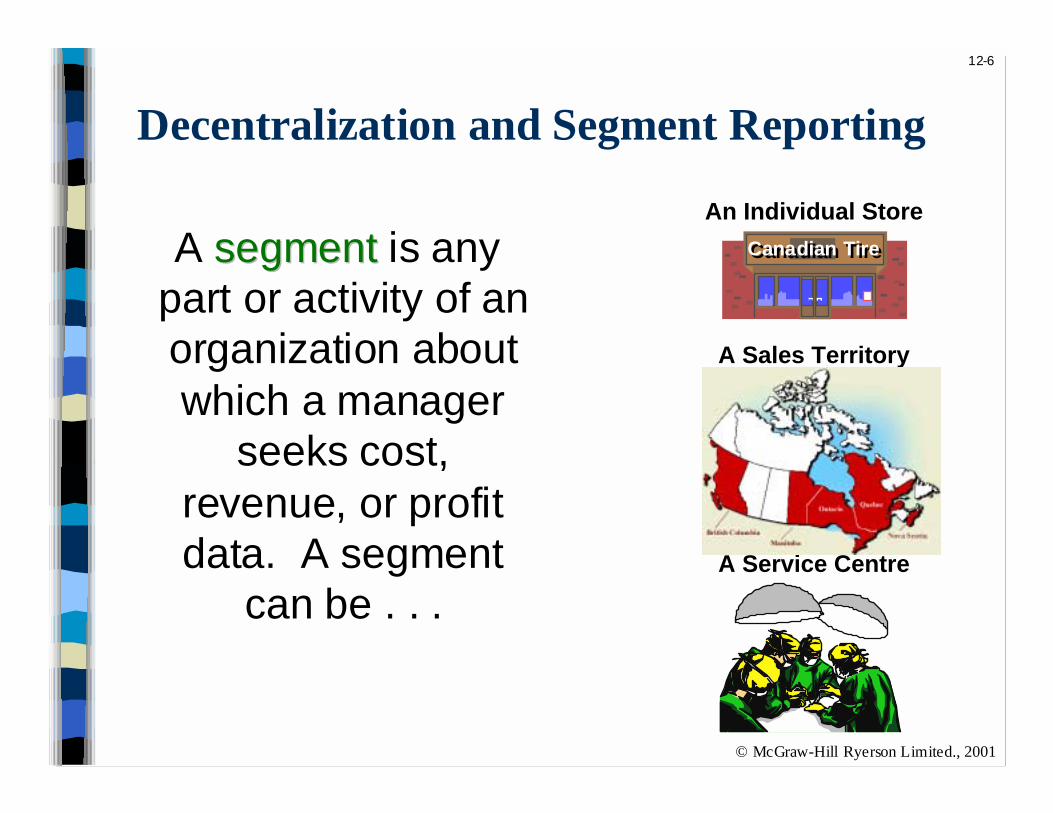
A segmentsegment is anypart or activity of anorganization aboutwhich a manager
seeks cost,revenue, or profitdata. A segment
can be . . .
Canadian TireCanadian Tire
An Individual Store
A Sales Territory
A Service Centre

12-7
© McGraw-Hill Ryerson Limited., 2001
Cost, Profit and Investment Centres
Cost Centre A segment whose
manager hascontrol over costs,
but not overrevenues or
investment funds. CostCost
Cost
12-8
© McGraw-Hill Ryerson Limited., 2001
Cost, Profit and Investment Centres
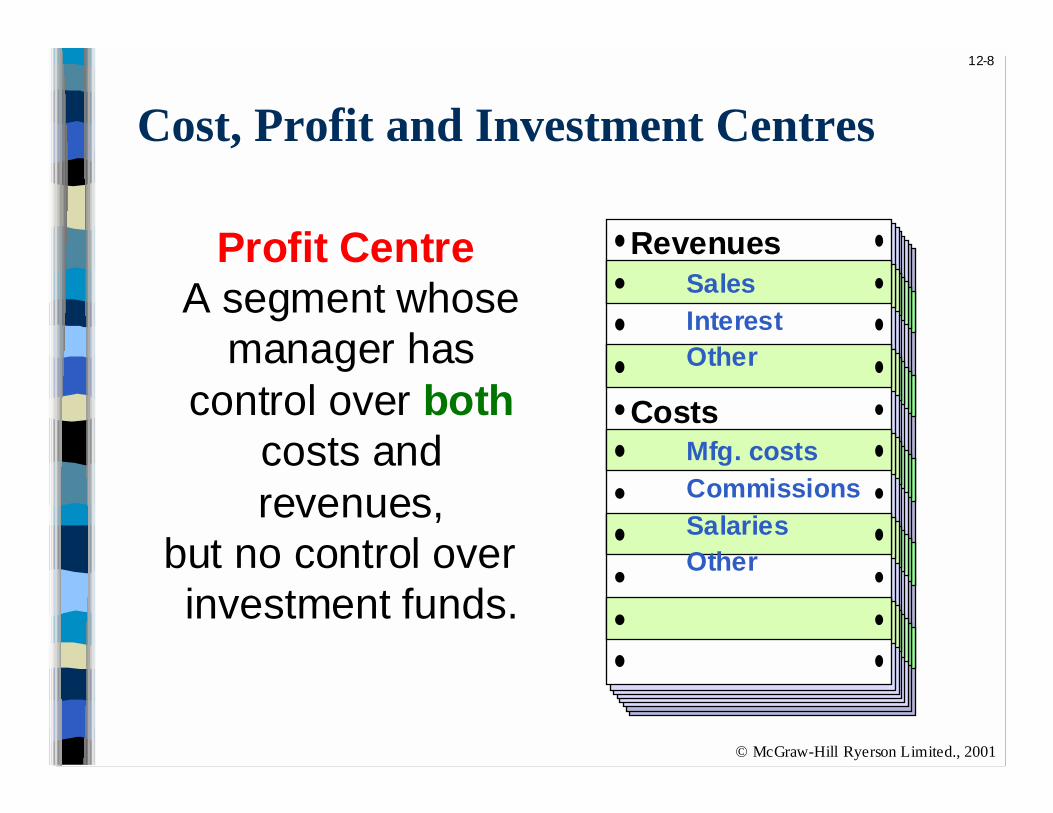
Profit Centre A segment whose
manager hascontrol over both
costs andrevenues,
but no control overinvestment funds.
RevenuesSales
InterestOther
CostsMfg. costs
Commissions
SalariesOther

12-9
© McGraw-Hill Ryerson Limited., 2001
Cost, Profit and Investment Centres
Investment Centre
A segment whosemanager has
control over costs,revenues, andinvestments in
operating assets.
Corporate Headquarters
12-10
© McGraw-Hill Ryerson Limited., 2001
Cost, Profit and Investment Centres
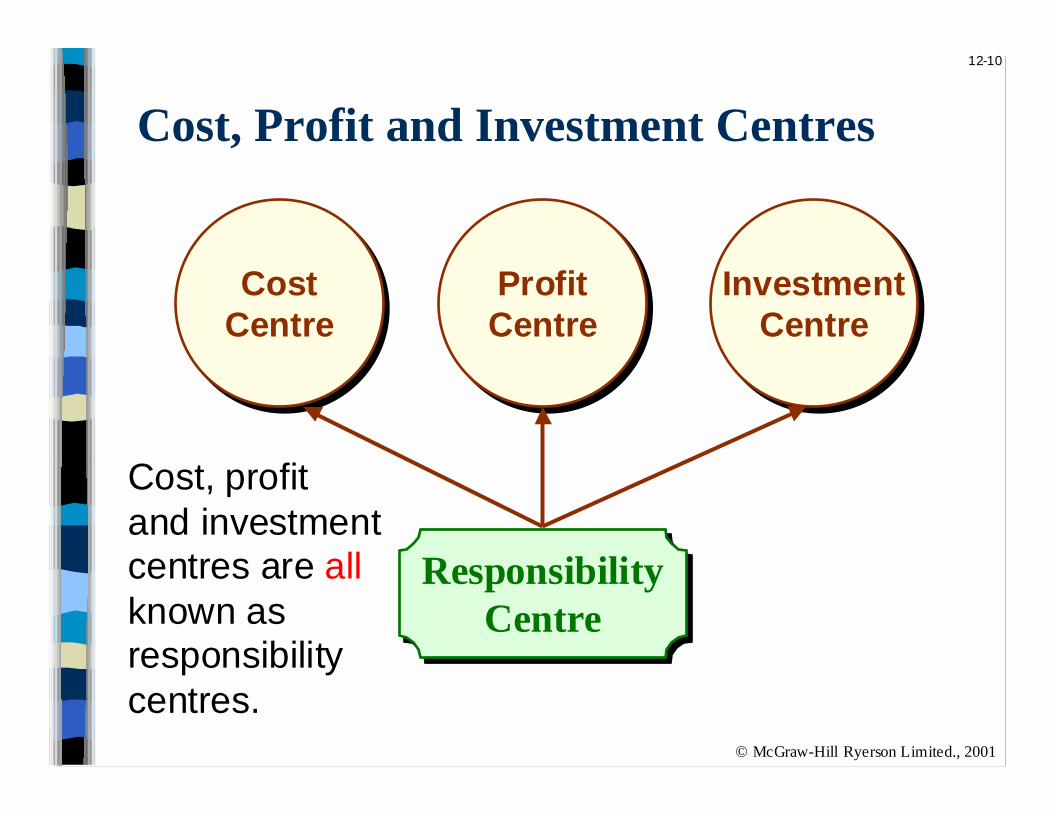
ResponsibilityCentre
ResponsibilityCentre
CostCentreCost
CentreProfitCentreProfitCentre
InvestmentCentre
InvestmentCentre
Cost, profitand investmentcentres are allknown asresponsibilitycentres.
12-11
© McGraw-Hill Ryerson Limited., 2001
Traceable and Common Costs
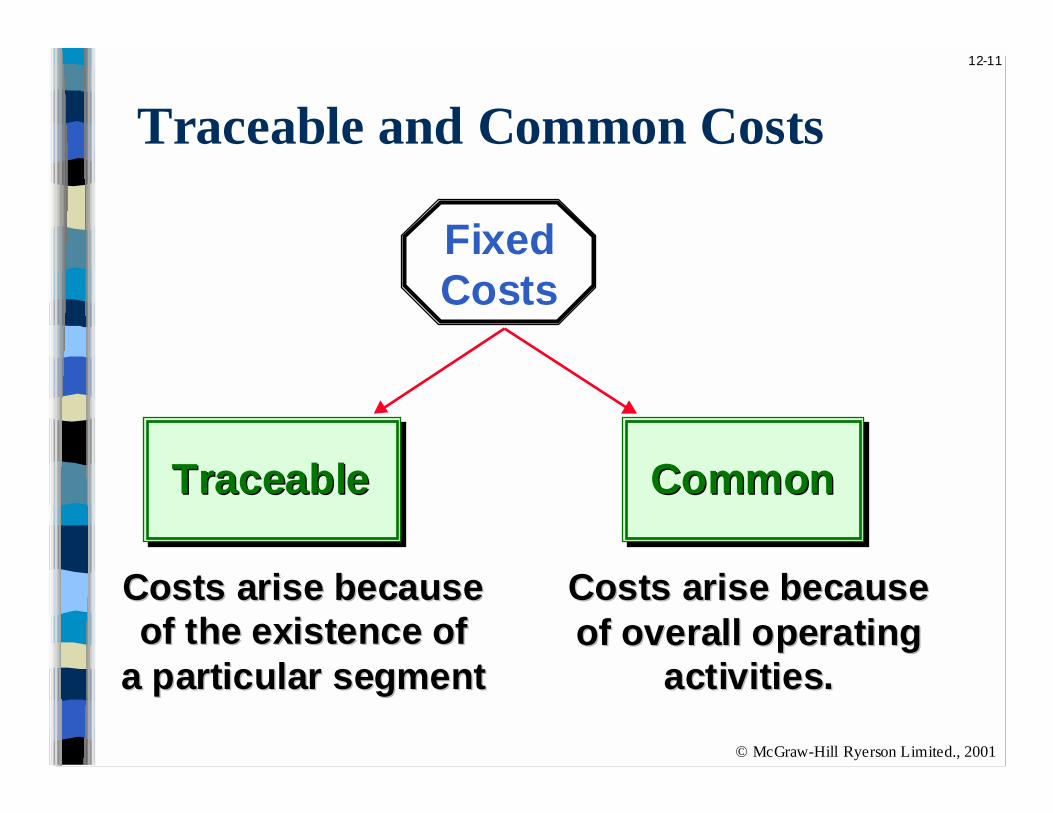
FixedCosts
TraceableTraceable CommonCommon
Costs arise becauseCosts arise becauseof the existence ofof the existence of
a particular segmenta particular segment
Costs arise becauseCosts arise becauseof overall operatingof overall operating
activities.activities.

12-12
© McGraw-Hill Ryerson Limited., 2001
Traceable and Common Costs
FixedCosts
TraceableTraceable CommonCommon
Costs arise becauseCosts arise becauseof the existence ofof the existence of
a particular segmenta particular segment
Costs arise becauseCosts arise becauseof overall operatingof overall operating
activities.activities.
Don’t allocateDon’t allocatecommon costs.common costs.

12-13
© McGraw-Hill Ryerson Limited., 2001
Identifying Traceable Fixed Costs
Traceable costs would disappear overtime if the segment itself disappeared.
No computer No computer division means . . .division means . . .
No computerNo computerdivision manager.division manager.

12-14
© McGraw-Hill Ryerson Limited., 2001
Identifying Common Fixed Costs
Common costs arise because of overalloperation of the company and are not due to
the existence of a particular segment.
No computer No computer division but . . .division but . . .
We still have aWe still have acompany president.company president.

12-15
© McGraw-Hill Ryerson Limited., 2001
Levels of Segmented Statements
Let’s look more closely at the TelevisionDivision’s income statement.
Let’s look more closely at the TelevisionDivision’s income statement.
W ebber, Inc. has two divisions.
Computer Division Television Division
Webber, Inc.

12-16
© McGraw-Hill Ryerson Limited., 2001
Levels of Segmented Statements
Our approach to segment reporting uses thecontribution format.
Income StatementContribution Margin Format
Television DivisionSales 300,000$ Variable COGS 120,000 Other variable costs 30,000 Total variable costs 150,000 Contribution margin 150,000 Traceable fixed costs 90,000 Segment margin 60,000$
Cost of goodssold consists of
variable manufacturing
costs.
Cost of goodssold consists of
variable manufacturing
costs.
Fixed andvariable costsare listed in
separatesections.
Fixed andvariable costsare listed in
separatesections.

12-17
© McGraw-Hill Ryerson Limited., 2001
Levels of Segmented Statements
Our approach to segment reporting uses thecontribution format.
Income StatementContribution Margin Format
Television DivisionSales 300,000$ Variable COGS 120,000 Other variable costs 30,000 Total variable costs 150,000 Contribution margin 150,000 Traceable fixed costs 90,000 Segment margin 60,000$
Segment marginis Television’s
contributionto overall
operations.
Segment marginis Television’s
contributionto overall
operations.

12-18
© McGraw-Hill Ryerson Limited., 2001
Levels of Segmented Statements
Let’s see how the TelevisionLet’s see how the TelevisionDivision fits into Webber, Inc.Division fits into Webber, Inc.

12-19
© McGraw-Hill Ryerson Limited., 2001
Levels of Segmented Statements
Income Statem ent
Company Television Compute rSa les 300,000$ Va ria ble costs (150,000) CM 150,000 Tra ce a ble FC (90,000) Division ma rgin 60,000
Comm on costsNe t incom e
Let’s add the Com puterLet’s add the Com puterDivision’s num bers.Division’s num bers.
Segment margin has nowbecome division margin.
Segment margin has nowbecome division margin.

12-20
© McGraw-Hill Ryerson Limited., 2001
Levels of Segmented Statements
Income Statem ent
Company Television Compute rSa les 500,000$ 300,000$ 200,000$ Va ria ble costs (230,000) (150,000) (80,000) CM 270,000 150,000 120,000 Tra ce a ble FC (170,000) (90,000) (80,000) Division ma rgin 100,000 60,000 40,000
Comm on costsNe t incom e

12-21
© McGraw-Hill Ryerson Limited., 2001
Levels of Segmented Statements
Income Statem ent
Company Television Compute rSa les 500,000$ 300,000$ 200,000$ Va ria ble costs (230,000) (150,000) (80,000) CM 270,000 150,000 120,000 Tra ce a ble FC (170,000) (90,000) (80,000) Division ma rgin 100,000 60,000 40,000
Comm on costs (25,000) Ne t incom e 75,000$
Common costs arise because of overalloperating activities. ABC may be helpful
in the analysis of common costs.
Common costs arise because of overalloperating activities. ABC may be helpful
in the analysis of common costs.

12-22
© McGraw-Hill Ryerson Limited., 2001
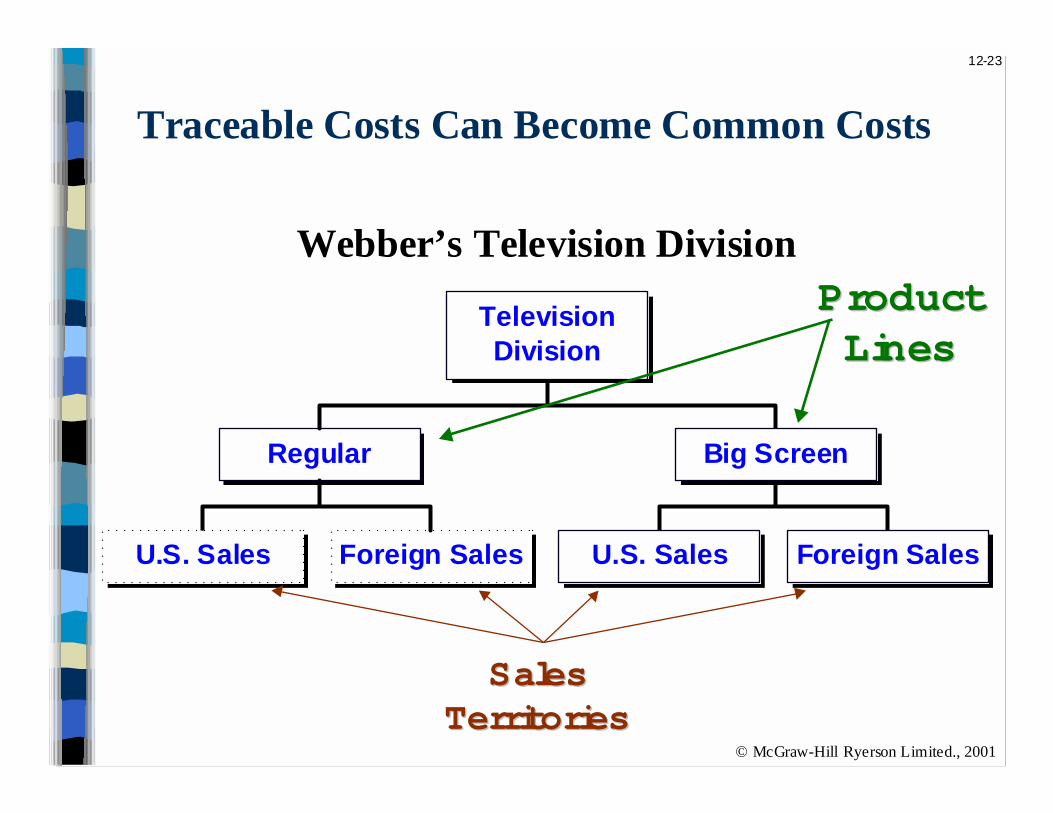
Traceable Costs Can Become Common Costs
Fixed costs that are traceable on onesegmented statement can become
common if the company is divided intosmaller smaller segments.
Let’s see how this works!
12-23
© McGraw-Hill Ryerson Limited., 2001
U.S. Sales Foreign Sales
Regular
U.S. Sales Foreign Sales
Big Screen
TelevisionDivision
Traceable Costs Can Become Common Costs
ProductProductLinesLines
SalesSalesTerritoriesTerritories
Webber’s Television Division

12-24
© McGraw-Hill Ryerson Limited., 2001
Traceable Costs Can Become Common Costs
W e obtained the follow ing inform ation fromthe Regular and Big Screen segm ents.
Income Statement Television
Division Regular Big ScreenSales 200,000$ 100,000$ Variable costs (95,000) (55,000) CM 105,000 45,000 Traceable FC (45,000) (35,000) Product line margin 60,000 10,000
Common costsDivisional margin

12-25
© McGraw-Hill Ryerson Limited., 2001
Income Statement Television
Division Regular Big ScreenSales 300,000$ 200,000$ 100,000$ Variable costs (150,000) (95,000) (55,000) CM 150,000 105,000 45,000 Traceable FC (80,000) (45,000) (35,000) Product line margin 70,000 60,000 10,000
Common costs 10,000 Divisional margin 60,000$
Traceable Costs Can Become Common Costs
Fixed costs directly tracedto the Television Division
$80,000 + $10,000 = $90,000
Fixed costs directly tracedto the Television Division
$80,000 + $10,000 = $90,000

12-26
© McGraw-Hill Ryerson Limited., 2001
Income StatementTelevision Division Regular Big Screen
Sales 300,000$ 200,000$ 100,000$ Variable costs (150,000) (95,000) (55,000) CM 150,000 105,000 45,000 Traceable FC (80,000) (45,000) (35,000) Product line margin 70,000 60,000 10,000
Common costs 10,000 Divisional margin 60,000$
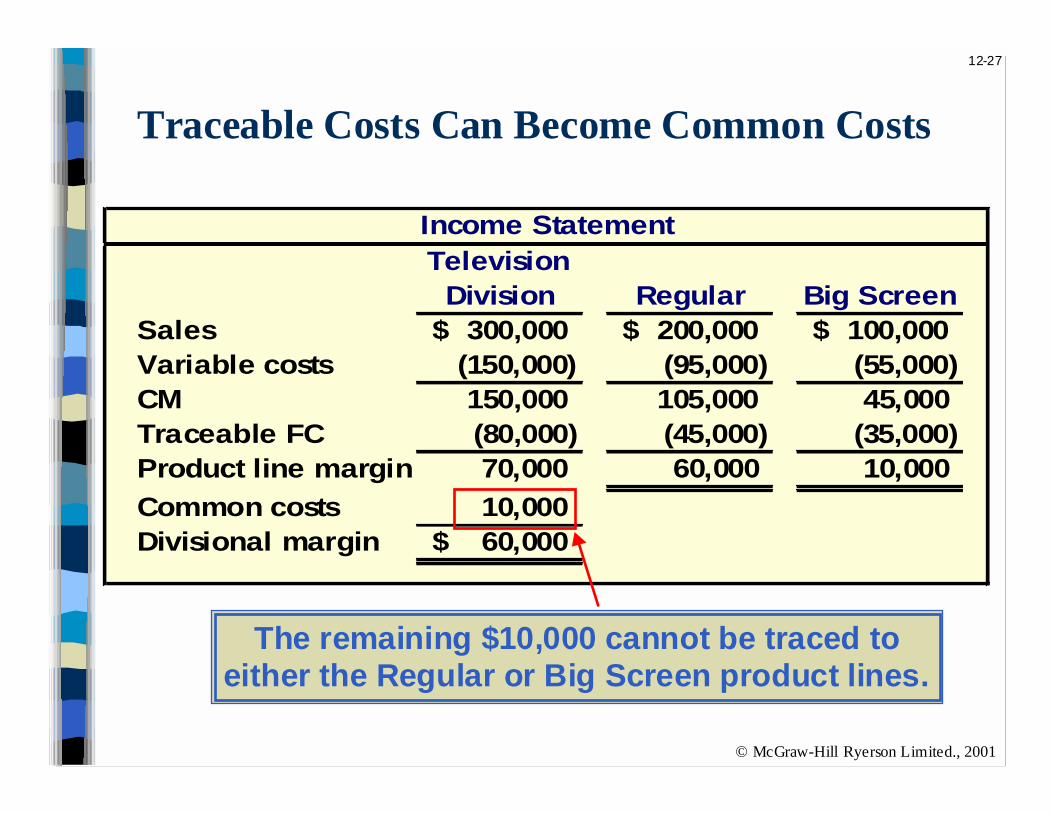
Traceable Costs Can Become Common Costs
Of the $90,000 cost directly traced tothe Television Division, $45,000 istraceable to Regular and $35,000
traceable to Big Screen product lines.
12-27
© McGraw-Hill Ryerson Limited., 2001
Income StatementTelevision
Division Regular Big ScreenSales 300,000$ 200,000$ 100,000$ Variable costs (150,000) (95,000) (55,000) CM 150,000 105,000 45,000 Traceable FC (80,000) (45,000) (35,000) Product line margin 70,000 60,000 10,000
Common costs 10,000 Divisional margin 60,000$
Traceable Costs Can Become Common Costs
The remaining $10,000 cannot be traced toeither the Regular or Big Screen product lines.

12-28
© McGraw-Hill Ryerson Limited., 2001
Segment Margin
The segment margin is the best gauge best gauge ofthe long-run profitability of a segment.
TimeTime
Pro
fits
Pro
fits

12-29
© McGraw-Hill Ryerson Limited., 2001
Hindrances to Proper Cost Assignment
Three Problem sThree Problem s
Omission of some
costs in the
assignment process.
The use of inappropriate
methods for allocating
costs among segments.
Assignment of costs
to segments that are
really common costs of
the entire organization.

12-30
© McGraw-Hill Ryerson Limited., 2001
Omission of CostsCosts assigned to a segment should include all
costs attributable to that segment from thecompany’s entire value chainvalue chain.
Life cycle costingLife cycle costing focuses on all costs along thevalue chain that will be generated throughout
the entire life of the product.
Product Customer R&D Design Manufacturing Marketing Distribution Service
Business FunctionsBusiness FunctionsMaking Up TheMaking Up The
Value ChainValue Chain

12-31
© McGraw-Hill Ryerson Limited., 2001
Inappropriate Methods of AllocatingCosts Among Segments
Segment3
Segment4
FailureFailure to trace to tracecosts directlycosts directly
Arbitrarily dividingArbitrarily dividingcommon costscommon costs
among segmentsamong segmentsInappropriateInappropriate
allocation baseallocation base
Segment2
Segment1

12-32
© McGraw-Hill Ryerson Limited., 2001
Revenue Variance AnalysisConsider the following example for CardCo:
Budget Actual
Budget sales in units:
Deluxe cards 14,000 17,000
Standard cards 6,000 5,000
Budget price per unit:
Deluxe cards $18 $16
Standard cards $ 9 $10
Market volume expected:
Deluxe cards 75,000 85,000
Standard cards 95,000 90,000
Variable cost per unit:
Deluxe cards $ 8 $ 8
Standard cards $ 3 $ 3

12-33
© McGraw-Hill Ryerson Limited., 2001
Revenue Variance Analysis
Revenue: Deluxe (17,000x16) 272,000$ Standard (5,000x10) 50,000
322,000 Variable expenses: Deluxe (17,000x8) 136,000 Standard (5,000x3) 15,000
151,000 Contribution margin 171,000$
Actual Results Flexible Budget Master Budget
Actual results are based onthe actualactual quantity soldmultiplied by the actualactual
selling price or
variable cost
CardCo Actual and Budgeted Results

12-34
© McGraw-Hill Ryerson Limited., 2001
Revenue Variance Analysis
Revenue: Deluxe (17,000x16) 272,000$ (17,000x18) 306,000$ Standard (5,000x10) 50,000 (5,000x9) 45,000
322,000 351,000 Variable expenses: Deluxe (17,000x8) 136,000 (17,000x8) 136,000 Standard (5,000x3) 15,000 (5,000x3) 15,000
151,000 151,000 Contribution margin 171,000$ 200,000$
Actual Results Flexible Budget Master Budget
Flexible budget results arebased on the actualactual quantity
sold multiplied by the budgetedbudgetedselling price
orvariable cost
CardCo Actual and Budgeted Results

12-35
© McGraw-Hill Ryerson Limited., 2001
Revenue Variance Analysis
Revenue: Deluxe (17,000x16) 272,000$ (17,000x18) 306,000$ (14,000x18) 252,000$ Standard (5,000x10) 50,000 (5,000x9) 45,000 (6,000x9) 54,000
322,000 351,000 306,000 Variable expenses: Deluxe (17,000x8) 136,000 (17,000x8) 136,000 (14,000x8) 112,000 Standard (5,000x3) 15,000 (5,000x3) 15,000 (6,000x3) 18,000
151,000 151,000 130,000 Contribution margin 171,000$ 200,000$ 176,000$
Actual Results Flexible Budget Master Budget
Master budget results arebased on the budgetedbudgeted quantitysold multiplied by the budgetedbudgeted
selling price or
variable cost
CardCo Actual and Budgeted Results

12-36
© McGraw-Hill Ryerson Limited., 2001
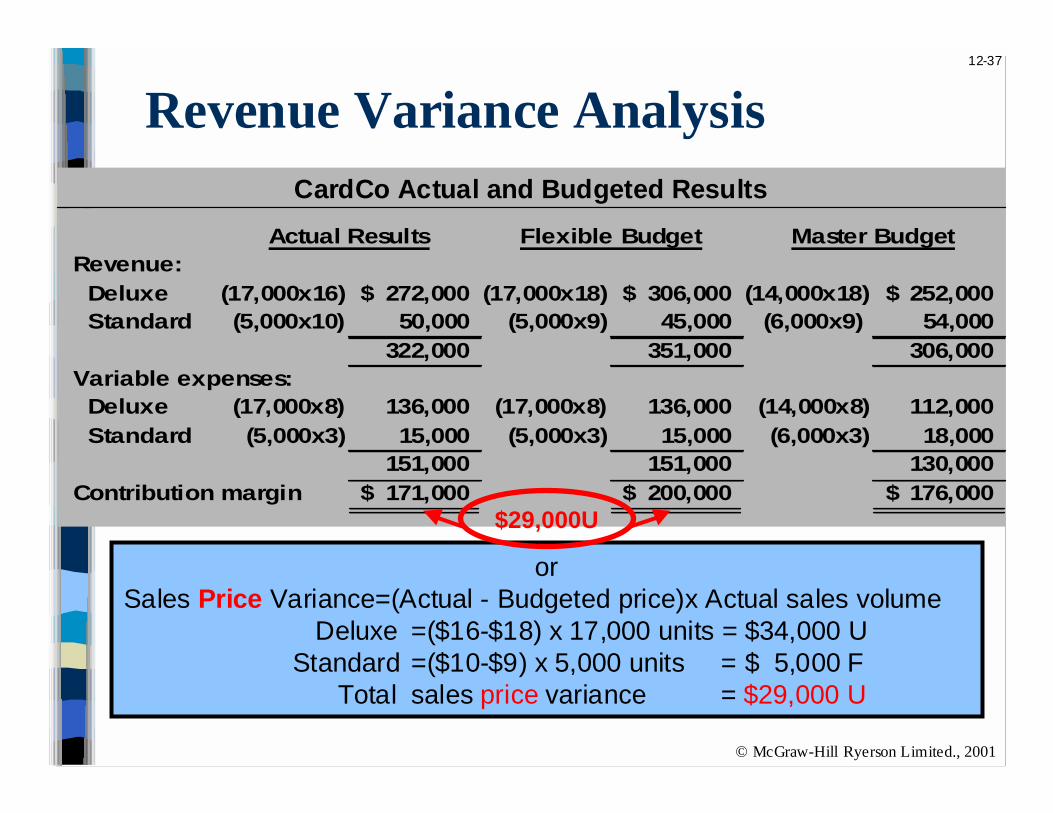
Revenue Variance Analysis
Revenue: Deluxe (17,000x16) 272,000$ (17,000x18) 306,000$ (14,000x18) 252,000$ Standard (5,000x10) 50,000 (5,000x9) 45,000 (6,000x9) 54,000
322,000 351,000 306,000 Variable expenses: Deluxe (17,000x8) 136,000 (17,000x8) 136,000 (14,000x8) 112,000 Standard (5,000x3) 15,000 (5,000x3) 15,000 (6,000x3) 18,000
151,000 151,000 130,000 Contribution margin 171,000$ 200,000$ 176,000$
Actual Results Flexible Budget Master Budget
Sales Price Variance$29,000 U
CardCo Actual and Budgeted Results
12-37
© McGraw-Hill Ryerson Limited., 2001
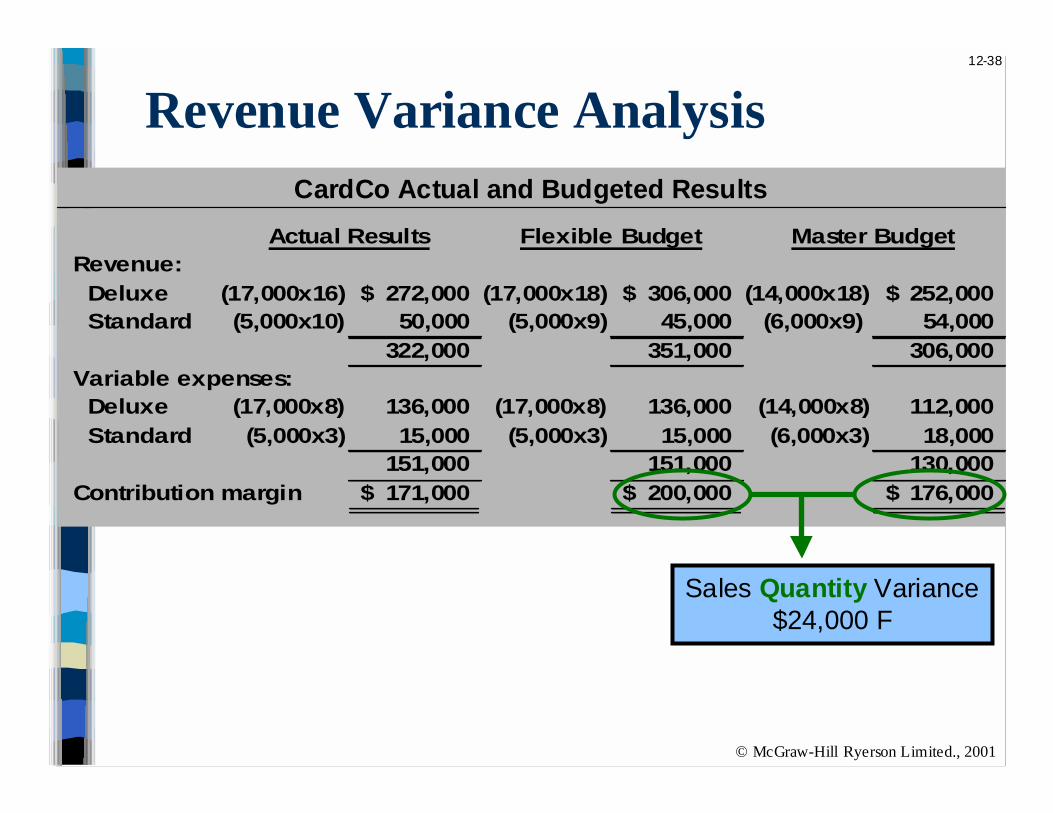
Revenue Variance Analysis
Revenue: Deluxe (17,000x16) 272,000$ (17,000x18) 306,000$ (14,000x18) 252,000$ Standard (5,000x10) 50,000 (5,000x9) 45,000 (6,000x9) 54,000
322,000 351,000 306,000 Variable expenses: Deluxe (17,000x8) 136,000 (17,000x8) 136,000 (14,000x8) 112,000 Standard (5,000x3) 15,000 (5,000x3) 15,000 (6,000x3) 18,000
151,000 151,000 130,000 Contribution margin 171,000$ 200,000$ 176,000$
Actual Results Flexible Budget Master Budget
orSales Price Variance=(Actual - Budgeted price)x Actual sales volume
Deluxe =($16-$18) x 17,000 units = $34,000 U Standard =($10-$9) x 5,000 units = $ 5,000 F
Total sales price variance = $29,000 U
$29,000U
CardCo Actual and Budgeted Results
12-38
© McGraw-Hill Ryerson Limited., 2001
Revenue Variance Analysis
Revenue: Deluxe (17,000x16) 272,000$ (17,000x18) 306,000$ (14,000x18) 252,000$ Standard (5,000x10) 50,000 (5,000x9) 45,000 (6,000x9) 54,000
322,000 351,000 306,000 Variable expenses: Deluxe (17,000x8) 136,000 (17,000x8) 136,000 (14,000x8) 112,000 Standard (5,000x3) 15,000 (5,000x3) 15,000 (6,000x3) 18,000
151,000 151,000 130,000 Contribution margin 171,000$ 200,000$ 176,000$
Actual Results Flexible Budget Master Budget
Sales Quantity Variance$24,000 F
CardCo Actual and Budgeted Results
12-39
© McGraw-Hill Ryerson Limited., 2001
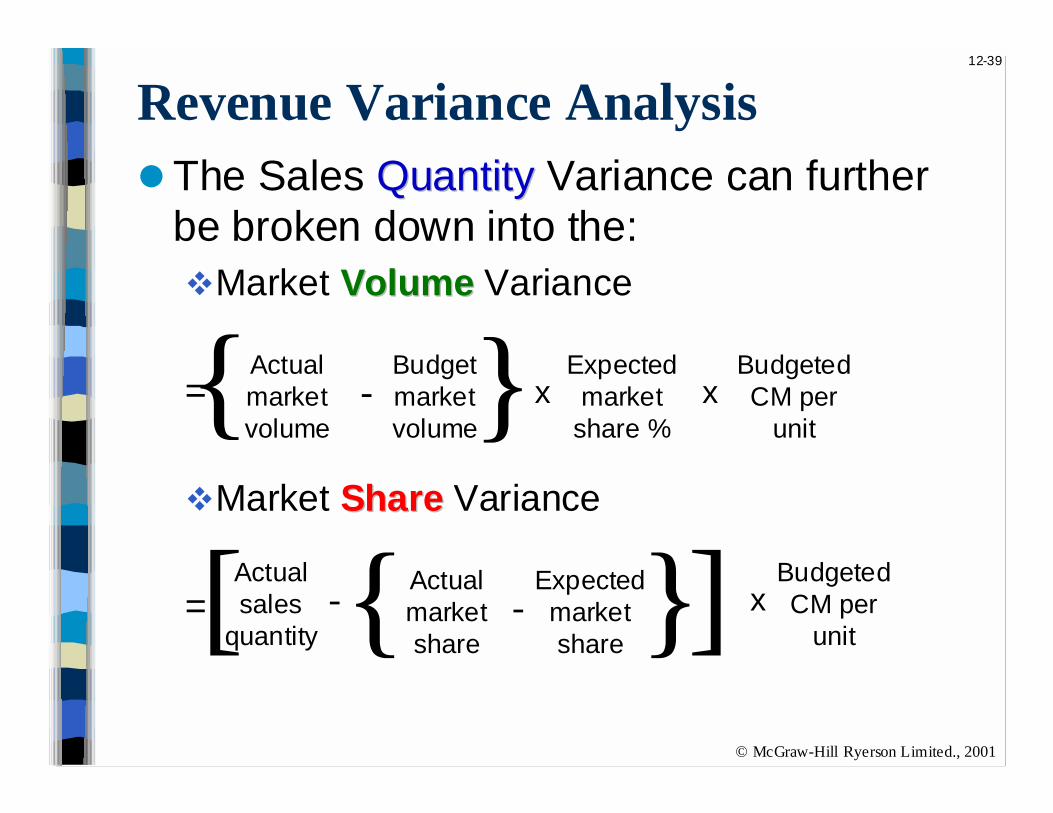
!The Sales QuantityQuantity Variance can furtherbe broken down into the:"Market VolumeVolume Variance
=
"Market ShareShare Variance
=
Revenue Variance Analysis
BudgetedCM per
unit
Actualmarketvolume
Budgetmarketvolume
-{ } x
BudgetedCM per
unitx
Actualmarketshare
-Expectedmarketshare }{
xExpectedmarket
share %
Actualsales
quantity-[ ]

12-40
© McGraw-Hill Ryerson Limited., 2001
!For CardCo, the Sales QuantityQuantity Varianceof $24,000 F breakdown further as follows:"Market VolumeVolume VarianceDeluxe=(85,000-75,000) x (14,000/75,000) x (18-8)=18,667 F
Standard=(90,000-95,000) x (6,000/95,000) x (9-3)= 1,895 U
Total Market Volume Variance ❶ =16,772 F16,772 F
"Market ShareShare VarianceDeluxe=[17,000-(85,000 x 14,000/75,000)] x (18-8) =11,333 F
Standard=[5,000-(90,000 x 6,000/95,000)] x (9-3) = 4,105 U
Total Market Share Variance = 7,228 F7,228 F
Sales QuantityQuantity Variance = ❶ + ❷ =24,000 F
Revenue Variance Analysis
❷
12-41
© McGraw-Hill Ryerson Limited., 2001
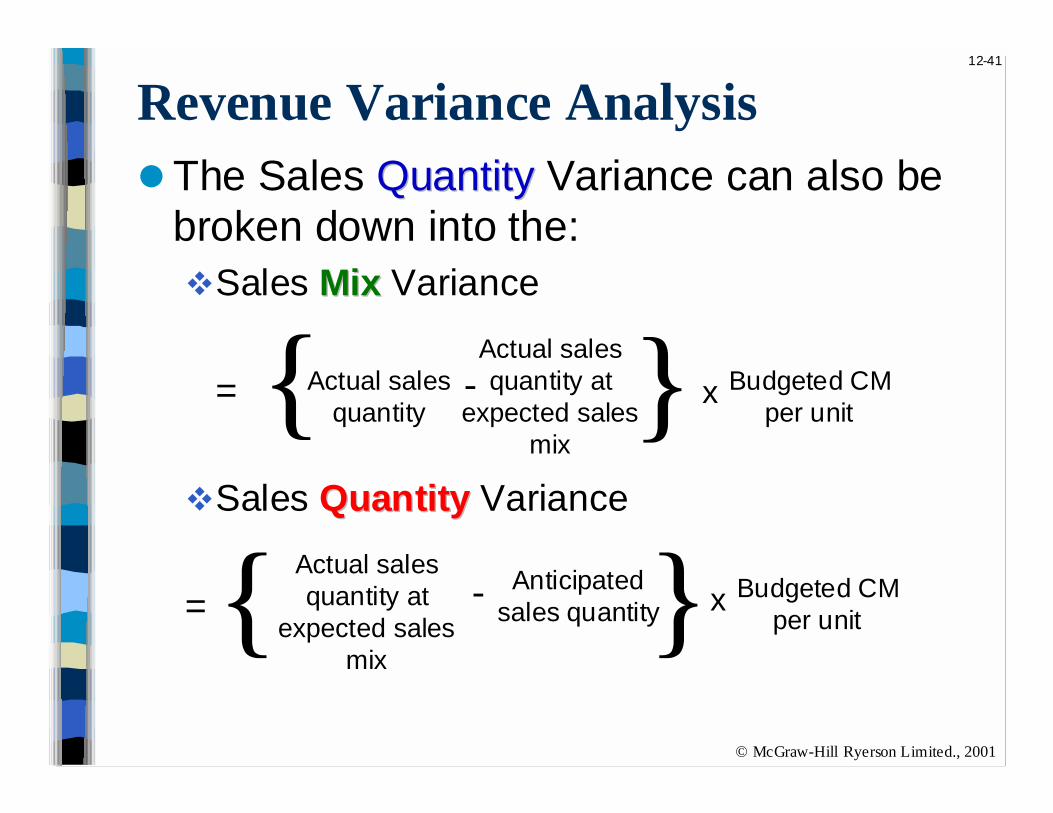
!The Sales QuantityQuantity Variance can also bebroken down into the:"Sales MixMix Variance
=
"Sales QuantityQuantity Variance
=
Revenue Variance Analysis
Actual salesquantity
Actual salesquantity at
expected salesmix
Budgeted CMper unit
-{ } x
Actual salesquantity at
expected salesmix
- Anticipatedsales quantity} Budgeted CM
per unitx{

12-42
© McGraw-Hill Ryerson Limited., 2001
!For CardCo, the Sales QuantityQuantity Varianceof $24,000F is made up of:"Sales MixMix VarianceDeluxe=[17,000-(22,000 x14/20)] x (18-8) =16,000 F
Standard=[(5,000-22,000 x 6/20)] x (9-3) = 9,600 U
Total Sales Mix Variance ❶ = 6,400 F6,400 F
"Sales QuantityQuantity VarianceDeluxe=[(22,000 x 14/20)-14,000] x (18-8) =14,000 F
Standard=[(22,000 x 6/20)-6,000] x (9-3) = 3,600 F
Total Sales Quantity Variance ❷ = 17,600F17,600F
Sales QuantityQuantity Variance = ❶ + ❷ = 24,000F
Revenue Variance Analysis

12-43
© McGraw-Hill Ryerson Limited., 2001
Costs factors to consider inmarketing strategy:
Marketing Strategy
Transport Warehousing
SellingAdvertising
Credit
12-44
© McGraw-Hill Ryerson Limited., 2001
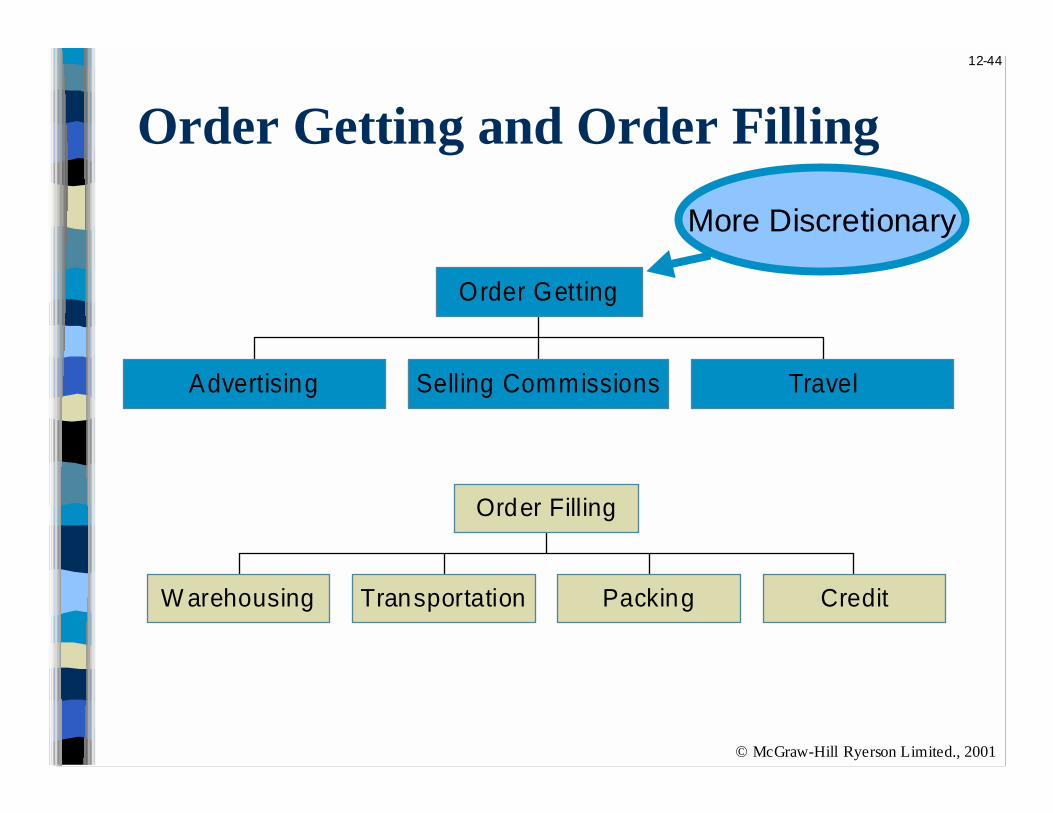
Order Getting and Order Filling
Advertising Selling Commissions Travel
Order Getting
W arehousing Transportation Packing Credit
Order Filling
More Discretionary
12-45
© McGraw-Hill Ryerson Limited., 2001
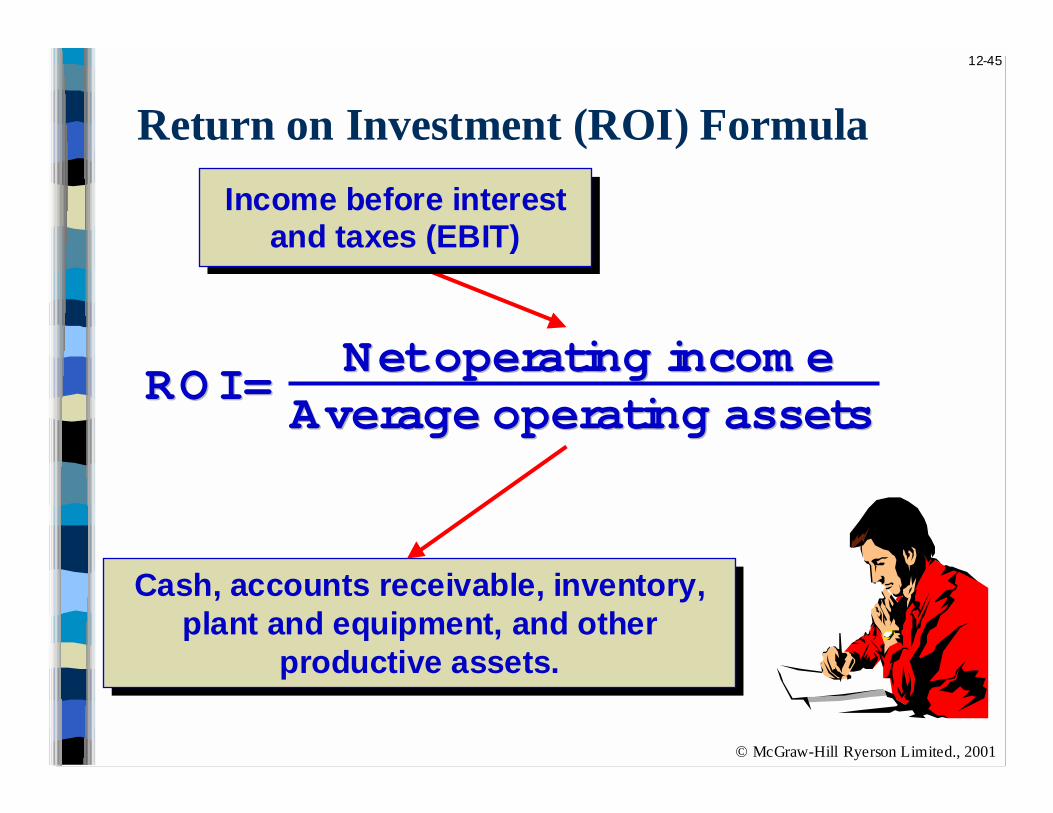
Return on Investment (ROI) Formula
ROI = ROI = Net operating incom eNet operating incom e
Average operating assets Average operating assets
Cash, accounts receivable, inventory,plant and equipment, and other
productive assets.
Cash, accounts receivable, inventory,plant and equipment, and other
productive assets.
Income before interestand taxes (EBIT)
Income before interestand taxes (EBIT)

12-46
© McGraw-Hill Ryerson Limited., 2001
Return on Investment (ROI) Formula
Regal Company reports the following:Regal Company reports the following:
Net operating income $ 30,000Net operating income $ 30,000
Average operating assets $ 200,000 Average operating assets $ 200,000
Sales $ 500,000 Sales $ 500,000
$30,000 $200,000
= 15%15%RO I =
12-47
© McGraw-Hill Ryerson Limited., 2001
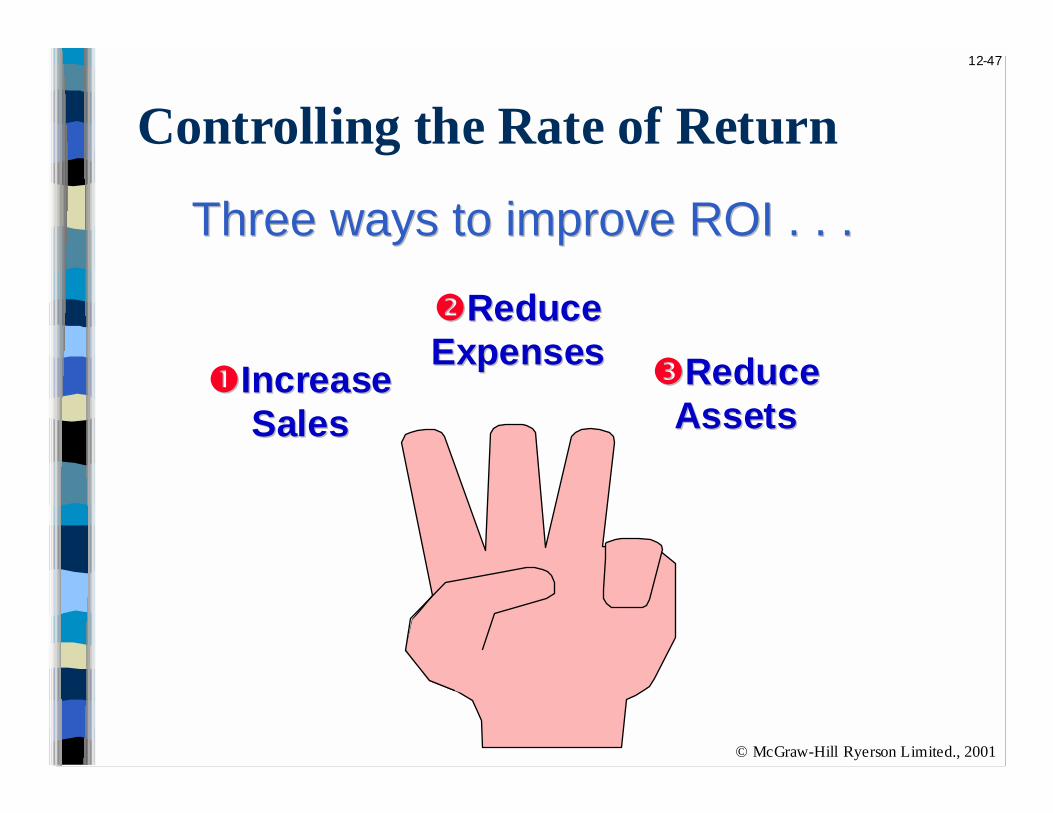
Controlling the Rate of Return
Three ways to improve ROI . . .Three ways to improve ROI . . .
##IncreaseIncreaseSalesSales
$$ReduceReduceExpensesExpenses
%%ReduceReduceAssetsAssets

12-48
© McGraw-Hill Ryerson Limited., 2001
Controlling the Rate of Return
!Regal’s manager was able to increasesales to $600,000 which increased netoperating income to $42,000.
!There was no change in the averageoperating assets of the segment.
Let’s calculate the new ROI.Let’s calculate the new ROI.

12-49
© McGraw-Hill Ryerson Limited., 2001
Return on Investment (ROI) Formula
Net operating incom e Sales
Sales Average operating assets
×RO I =
$42,000 $600,000
×$600,000$200,000
21%21%
We can modify our original formula slightly:
RO I =
RO I =
We increased ROI from 15% to 21%We increased ROI from 15% to 21%
Margin Turnover×
12-50
© McGraw-Hill Ryerson Limited., 2001
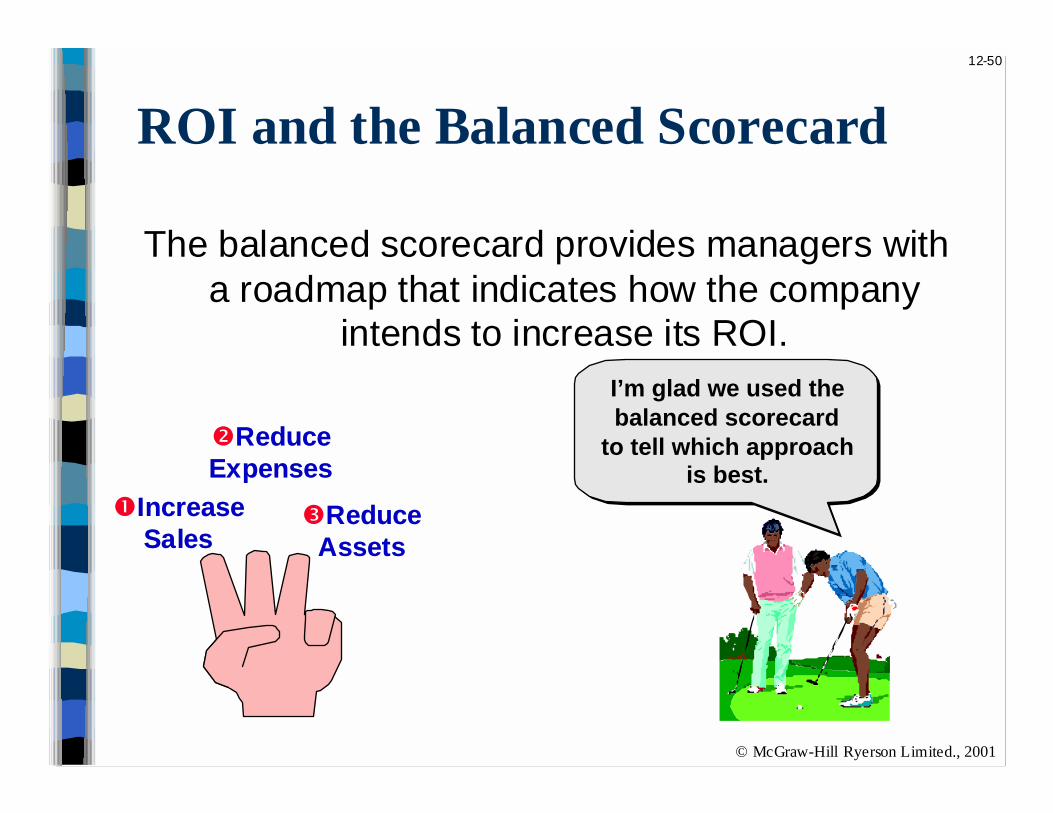
ROI and the Balanced Scorecard
The balanced scorecard provides managers witha roadmap that indicates how the company
intends to increase its ROI.
##IncreaseIncreaseSalesSales
$$ReduceReduceExpensesExpenses
%%ReduceReduceAssetsAssets
I’m glad we used thebalanced scorecard
to tell which approachis best.
I’m glad we used thebalanced scorecard
to tell which approachis best.

12-51
© McGraw-Hill Ryerson Limited., 2001
Criticisms of ROI
In the absence of the balancedscorecard, management may
not know how to increase ROI.
Managers often inherit manycommitted costs over which
they have no control.
Managers evaluated on ROImay reject profitable
investment opportunities.
12-52
© McGraw-Hill Ryerson Limited., 2001
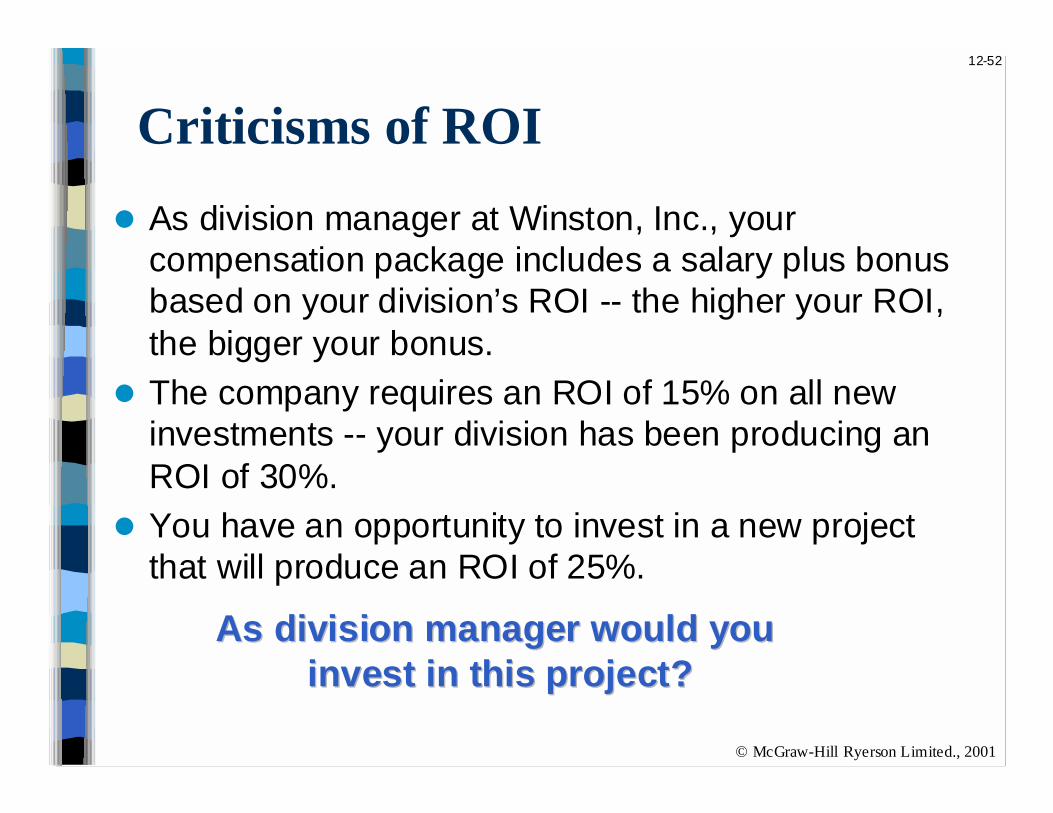
Criticisms of ROI
! As division manager at Winston, Inc., yourcompensation package includes a salary plus bonusbased on your division’s ROI -- the higher your ROI,the bigger your bonus.
! The company requires an ROI of 15% on all newinvestments -- your division has been producing anROI of 30%.
! You have an opportunity to invest in a new projectthat will produce an ROI of 25%.
As division manager would you As division manager would you invest in this project?invest in this project?

12-53
© McGraw-Hill Ryerson Limited., 2001
Criticisms of ROI
As division manager,I wouldn’t invest in
that project becauseit would lower my pay!

12-54
© McGraw-Hill Ryerson Limited., 2001
Criticisms of ROI
Gee . . .I thought we were
supposed to do what was best for the
company!

12-55
© McGraw-Hill Ryerson Limited., 2001
Residual Income - Another Measure ofPerformance
Net operating incomeabove some minimum
return on operatingassets

12-56
© McGraw-Hill Ryerson Limited., 2001
Residual Income
!A division of Zepher, Inc. has averageoperating assets of $100,000 and isrequired to earn a return of 20% on theseassets.
! In the current period the division earns$30,000.
Let’s calculate residual incom e.Let’s calculate residual incom e.

12-57
© McGraw-Hill Ryerson Limited., 2001
Residual Income
Operating assets 100,000$ Required rate of return × 20%Required return 20,000$
Operating assets 100,000$ Required rate of return × 20%Required return 20,000$
Actual return 30,000$ Required return (20,000) Residual income 10,000$
Actual return 30,000$ Required return (20,000) Residual income 10,000$

12-58
© McGraw-Hill Ryerson Limited., 2001
Motivation and Residual Income
Residual incom e encourages m anagers to Residual incom e encourages m anagers to m ake profitable investm ents that w ouldm ake profitable investm ents that w ouldbe rejected by m anagers using RO I.be rejected by m anagers using RO I.
Transfer Pricing
Appendix
12A

12-60
© McGraw-Hill Ryerson Limited., 2001
Transfer Pricing
!Fundamental Objective:" Setting transfer prices to motivate the
managers to act in the
“best interest of the overall company”“best interest of the overall company”

12-61
© McGraw-Hill Ryerson Limited., 2001
Three Common Approaches:
Managers negotiatetheir own transfer price
❶
Set transfer price using either:1. Variable Cost, or2. Full (Absorption) Cost
❷
Set transfer price atmarket price
❸

12-62
© McGraw-Hill Ryerson Limited., 2001
Let’s get to workLet’s get to workon m y ROI . . .on m y ROI . . .
End of Chapter 12
Related Documents