Decent Work Country Report - Bulgaria* by Iskra Beleva and Vasil Tzanov Institute of Economics Bulgarian Academy of Sciences February 2008 International Labour Office Regional Office for Europe and Central Asia * This report has not been edited.

Welcome message from author
This document is posted to help you gain knowledge. Please leave a comment to let me know what you think about it! Share it to your friends and learn new things together.
Transcript
Decent Work Country Report - Bulgaria*
by
Iskra Beleva and Vasil Tzanov Institute of Economics
Bulgarian Academy of Sciences
February 2008
International Labour Office Regional Office for Europe and Central Asia
* This report has not been edited.
1
Copyright © International Labour Organization 2008 Publications of the International Labour Office enjoy copyright under Protocol 2 of the Universal Copyright Convention. Nevertheless, short excerpts from them may be reproduced without authorization, on condition that the source is indicated. For rights of reproduction or translation, application should be made to ILO Publications (Rights and Permissions), International Labour Office, CH-1211 Geneva 22, Switzerland, or by email: [email protected]. The International Labour Office welcomes such applications.
Libraries, institutions and other users registered with reproduction rights organizations may make copies in accordance with the licences issued to them for this purpose. Visit www.ifrro.org to find the reproduction rights organization in your country. ISBN 978-92-2-122019-0 (web pdf) The designations employed in ILO publications, which are in conformity with United Nations practice, and the presentation of material therein do not imply the expression of any opinion whatsoever on the part of the International Labour Office concerning the legal status of any country, area or territory or of its authorities, or concerning the delimitation of its frontiers.
The responsibility for opinions expressed in signed articles, studies and other contributions rests solely with their authors, and publication does not constitute an endorsement by the International Labour Office of the opinions expressed in them.
Reference to names of firms and commercial products and processes does not imply their endorsement by the International Labour Office, and any failure to mention a particular firm, commercial product or process is not a sign of disapproval.
ILO publications and electronic products can be obtained through major booksellers or ILO local offices in many countries, or direct from ILO Publications, International Labour Office, CH-1211 Geneva 22, Switzerland. Catalogues or lists of new publications are available free of charge from the above address, or by email: [email protected]
Visit our website: www.ilo.org/publns
2
Contents 1. Introduction ............................................................................................................................ 3 2. The economic and social context ........................................................................................... 5 3. Trends in working and employment conditions................................................................... 10
3.1. Employment status/contracts of employment ............................................................... 10 3.2. Wages ............................................................................................................................ 14 3.3. Working time and work organization............................................................................ 20 3.4. Working intensity.......................................................................................................... 23 3.5. Safety and health ........................................................................................................... 25 3.6. Access to training .......................................................................................................... 29 3.7. Social dialogue and workers’ participation................................................................... 32 3.8. Social protection coverage ............................................................................................ 35 3.9. Work and family............................................................................................................ 43 3.10. Child labour, forced labour ......................................................................................... 47
4.Linkages, trade-ins and trade-offs between different elements of working and employment conditions ................................................................................................................................. 52
4.1. Linkages between the elements from the point of view of their direct or indirect interactions ........................................................................................................................... 52 4.3. Identification of vulnerable groups affected by existing interrelations......................... 59
5. Conclusions and policy recommendations........................................................................... 60 List of Tables............................................................................................................................ 67 List of Figures .......................................................................................................................... 67
Annex ................................................................................................................................... 68 Table 1 – Some macroeconomic and financial indicators (1995-2006)........................... 68 Table 2 –Income levels in EURO equivalent (1997-2006).............................................. 68 Table 3 – Population below, in and over working age in Bulgaria by sex (1990-2006).. 68 Table 4 – Labour Market Indicators, Bulgaria ................................................................. 68
Annex, Table 4 – Labour Market Indicators, Bulgaria........................................................ 72 The author’s contribution to the paper is as follows: Iskra Beleva (part 1, part 2, part 3.1; 3.3; 3.5; 3.6; 3.9 and 3.10, part 4.4 and part 5) and Vasil Tzanov (part 3.2; 3.4; 3.7; 3.8 and 4.2)
3
1. Introduction This Report develops the issue of Decent work in Bulgaria focusing on employment conditions e.g. employment contracts, working time, wages, health and safety at work place, access to training, conciliation of work and family, as well as some specific issues like child labour, in particular. 1 When studying the effects of structural and technological transformations in Bulgaria on decent work environment the authors have paid special attention on the analysis of the interrelations and linkages between the different elements of decent work. Important aspect of the analysis is that of the relevance between some economic and social policies and the achieved progress. The development of socio-economic and political environment in Bulgaria in the period 1995-2006 outlines stable upward trend of improvement in work conditions. In some segments the improvement had been more visible, while in others – not. Irrespective of this, the ongoing debates on the issues and the more attention, paid by policy-makers on it, should be considered as a first step of the progress. As a second step we have to consider the more consistent and relevant character of the applied policies that were introduced since 2000. The study includes two parts. In the first it analyses the trends in the development of the elements of decent work in Bulgaria, numbered above. This analysis is based on the available statistics and in some cases it covers the period 1995-2006, but in others – it does not because of lack of regular statistical observations. The second part of the study deals with some interactions between the elements of decent work. They are analysed taking into consideration their multi-dimensional character and available statistical information. Some of the linkages and trade-offs are metrically assessed (where it is possible), while the others are based on qualitative assumptions and evaluations. As a result the study identifies the main vulnerable groups. The study ended with some conclusions and recommendations, which followed from the analysis. The main outcomes of the study are numbered below:
1. The study outlines sequences between the macroeconomic stabilization and the improvement of working conditions. After 2000 the political, social and economic environment became more favourable for developing decent employment conditions. The period of deep transformation of economic rules and actors and significant deterioration in working conditions has been overcome. Since 2000 the country has been facing trends towards improvement and more positive interactions between the studied domains of working conditions. This improvement has been influenced to a high extent by the stable macroeconomic environment, accompanied by the implementation of new legal framework and improvement of the institutional capacity and efficiency. The international experience and assistance in the process of preparing Bulgaria’s EU membership is the second important feature that had positive and
1 Some of these issues were object of an earlier study and its’ outcomes had been published in a book named “The evolving world of work in the enlarged EU, Progress and vulnerability” edited by Francois Eyraud and Daniel Vaughan-Whitehead, ILO, Geneva, 2007.
4
creative impact on the rules and conditions of work. Nevertheless, there are still areas where imbalances exist and further efforts are needed.
2. The analysis found out positive trends in working conditions considering labour
contracts. More employed people work on labour contracts, which means higher social insurance level, guaranteed labour remuneration and health insurance. These positive trends are results from the improvement of the labour legislation and the better control on its implementation. Meanwhile the dynamic growth in the number of people hired at temporary labour contracts indicates greater flexibility of labour relations; more opportunities for combining several jobs and more opportunities for choosing between working time and time for the family.
3. The caching up process of nominal and real wages has been observed but the real
wages do not reached the pre-transition level. This is due to the low relationship with economic development and productivity. The share of employees’ compensations in GDP is relatively low and the real wage is growing at a lower rate than labour productivity. This imbalance between the dynamics of wages and labour productivity indicates the insufficiently effective bargaining at firm level. The relatively weaker positions of the trade union organisations in the social dialogue process are expressed in the low labour remuneration level, the deterioration of labour environment parameters and the increase of professional disease among the employed. The growing labour intensity is an additional factor contributing to the deterioration of the employed people’s health status. The practical changes in the labour environment towards healthier and better labour conditions are slowly implemented although the legislation is in place and institutional network has been established. The preventive measures are an insufficiently developed instrument for protection of the employed.
4. Positive trends in the working time and labour organisation are also monitored. The
provision of more legal opportunities for working time flexibility enables the employed people to better balance their personal needs for time and work. At the same time however the low labour remuneration forces most of the people to substitute personal leisure time with more work and this has negative reflection on the health status of the employed people. The employed people often voluntarily ignore the working time limits and labour protection by committing extra work. The labour intensification in a number of cases happens in a hidden form and is not remunerated by the employers.
5. The training of the employed people as a component of labour conditions is
underdeveloped. This is no doubt a negative feature and it indicates the still low degree of technological innovation and the insufficient attitude of the employers to invest in human potential. Most of the employed people should invest themselves in their own professional development particularly in the private sector and in the small and medium enterprises. Some groups of the employed people are considerably isolated from the training processes and these are mainly the self-employed people in the agriculture and in the sphere of traditional services.
6. Positive development has been observed in social protection. It concerns changes in
legislation, coverage and financing. Legal basis is in process of harmonization with EU recommendations and conventions. The pension system has been reformed through implementation of a 3 pillar model. The changes in social assistance and
5
social services legislation are focus on the improvement of the eligibility criteria aiming for a more adequate coverage of vulnerable groups. Social protection covers the main risk groups of population and shows different tendency of development. More people are covered by the social insurance and employment services, while the coverage of some social assistance programs and unemployment benefits decline. Financial support of the social protection programs has increased. The social expenditures share in GDP and in the State Budget increases. Particularly this concerns expenditures on health care. Despite the positive trends in social protection coverage there is still a need for improvements e.g. the further development and coverage of social services (employment and health services) and social assistance programs.
7. The dynamics of labour conditions indicates the contradictory development of its
components. Some of them are characterised with more balanced and steadily increasing development, while others demonstrate less progress as a result of the general economic environment and the deep structural reforms that still cannot be overcome.
8. Differences among the employed people are monitored in terms of labour conditions.
These differences are formed based on different principles, however the branch specific is a determinant factor. The age and the sex of the employed people also affect the evaluation of labour conditions.
9. The study outlines some interrelations between the elements of decent work. However,
it stated, that such interrelations could be studied in details only on micro level and on the basis of regular long-term database or regular case studies. It points that such studies and database are quite limited and irregular for Bulgaria and this fact limited the opportunities of comprehensive analysis.
2. The economic and social context Quite contradictive economic and social processes occurred in Bulgaria in the period 1995-2006. Beginning the transition with radical changes of the economic environment, e.g. liberalization of prices and trade conditions; privatisation of big state enterprises and liquidation of existing cooperatives in agricultural sector, after 1994 the reform speed slowed down significantly. As a consequence a constructive process did not follow the economic destruction. Thus new job creation had not followed the mass job closure due to privatisation of big state enterprises. Foreign investments by that time were incidental, the development of small and medium-sized business was in its dawn, and the land restoration has just started in agricultural sector. The latter is still an ongoing process, which limits its capacity to create employment. All this caused incredibly high unemployment, which affected more than half a million people and stayed stable at this level up to 2003. Unemployment rate in the period 1995-2000 was over 13%, and employment decrease continued, going down by 300 thousand people for the period. In the late 1996 the country experienced crisis in the bank system and hyperinflation. The latter erased the savings of the population and contributed to the further impoverishment of the population. In the mid 1997 the country introduced a Currency Board regime. The effects of the financial restraints were positive and the economy was stabilized. After 1998 the GDP
6
growth upturned. Employment growth followed that of GDP with a lag of two-three years, however, the great collapse of all incomes (wages, pensions, benefits, etc.), as well as the exhausted households and state financial resources, influenced the social development. The polarization of the society has increased.
Table 1. Main economic indicators in Bulgaria 1995-2006 (growth rate - %)
Years GDP Inflation
Real wage
Employment
Unemployment * Direct foreign investment
(million euro)**
Trade balance deficit (export-import) %
of GDP 1995 2.9 - - 1.0 11.4 - -0,2
1996 -10.1 121.5 -18.7 -0.2 11.1 137.3 -1,7
1997 -6.9 1058.9 -17.2 -3.8 14.0 570.2 5.5
1998 4.0 18.7 23.4 -0.1 12.2 605.1 -2.9
1999 2.3 2.6 6.9 -2.9 13.8 866.0 -7.7
2000 5.4 10.3 1.0 -3.5 18.2 1103.3 -5.5
2001 4.1 7.4 -0.2 -0.4 17.5 903.4 -7.5
2002 4.9 5.8 1.6 0.4 17.3 980.0 -6.6
2003 4.5 2.3 3.4 6.3 14.3 1850.5 -10.8
2004 5.6 6.1 0.9 1.9 12.7 2735.9 -11.5
2005 6.2 5.0 5.4 1.5 11.4 3103.3 -16.2
2006 6.0 7.3 2.1 3.9 9.6 4364.0 -19.0 Source: Statistical Yearbook for the respective years. *Registered unemployment **www/bnb.bg
The improved macroeconomic environment after 1998 was more favourable for social and labour market development. The upward economic growth after 2000 (by average 5%) contributed for increase of the employment by nearly 3% average per year after 2002. The economic growth and the more job opportunities absorbed unemployment, which decreased double to a level of 9.6% in 2006. Moreover, nowadays the country faces labour shortage in many branches and skills. Macroeconomic stability created favourable climate for foreign investments and their value increased about 4 times after 2000. The newly opened jobs contributed to the employment increase, as well as to introduction of new management practices. Another positive aspect was that the stability of the economic development made it more predictable, so as employers could have more strategic views of the business development and respective needs of labour. Despite the progression in macroeconomic development the worrying tendency is the growing deficit in trade balance. The percentage of trade deficit in GDP increased over three times in comparison to 2000 and reached almost one fifth of the GDP in 2006. This circumstance creates unfavourable environment for improvement of working conditions and social protection policy. The economic turbulences in the period 1995-2000 were not a favourable environment for focusing the tax policy on improving labour market and work conditions. After 2000 tax policy became more consistent and better targeted in this respect. Several measures should be mentioned: (a) decreasing tax burden on labour was one of the important tax measures in the efforts of the policy-makers to encourage the employers to open more jobs and to increase employment; (b) significant decrease of corporation tax after 2000 from 19% to 15% and then to 10%; (c) introduction of specific regional preferences for employers who invest in regions with unemployment level higher the average for the country.
7
Another form of tax relief referred to income taxation, where the scale and income burden were restructured, so as to increase the disposable income. Family income taxation was also introduced as stimuli for childbirth and relief of family incomes depending on the number of children. The social insurance taxation (social insurance, health insurance and unemployment fund) continues to follow the undertaken policy of sharing taxation between employers and employees towards gradual equalization of these payments. Tax relieves were also introduced for self-employed people. After 1997 radical changes occurred in the social insurance system. The introduced three-pillar system aimed at increasing the social protection of employed people by mixing the mandatory social insurance (I pillar) with supplementary insurance funds (II pillar – for people born after 1959) and voluntary form (III pillar). The introduction of policy measures, which encourage the beneficiaries to participate on the labour market and to be active in employment reintegration, was an important aspect of labour market policy concerning flexibility and decent work. Thus, unemployment and social benefits were linked more closely to participation in active measures, and especially in training and education. Family social allowances were also more closely linked to beneficiaries’ behaviour regarding employment and adjustment to market demand. The improved economic environment and introduced policies stimulated labour force participation. The level of economic activity of both men and women has increased, reaching 51.8% in 2006 (57.4% for men and 46.8% for women) although still below the level of 1993.
Figure 1. Labour force participation -total and by gender
0
1020
3040
5060
70
Sept'93 Nov'98 Nov'99 Dec'00 Dec'01 Dec'02 Sep'03 Sep'04 4Q'05 4Q'06
%
male female total
Source: LFS for respective years, NSI.
Labour in Bulgaria continues to be paid at a relatively low level compared with EU level, although since 2000 the income policy has been consistent and focused on gradual increase of labour incomes. Some of these policies include regular increase of minimum payments; increase of social insurance thresholds, further development of social protection policy by improvements of pension system and social assistance. The better economic environment reflected also the rate of growth of real wages. The significant erosion of real incomes, and wages in particular, was one the main negative feature of the transition. Although wage level in Bulgaria continues to be one of the lowest in the EU, during the last five years there was a stable upward tendency. This increase could be considered a result of the quite consistent income policy of the governments in force since 2000. At a micro level the growth in real wages reflected the changes of employers’ attitude due to the understanding that wage level is an important tool to keep the workforce. This understanding was strongly provoked by the processes of liberalization of labour migration (e.g. waiving visa regimes) and especially after the accession of the country in EU.
8
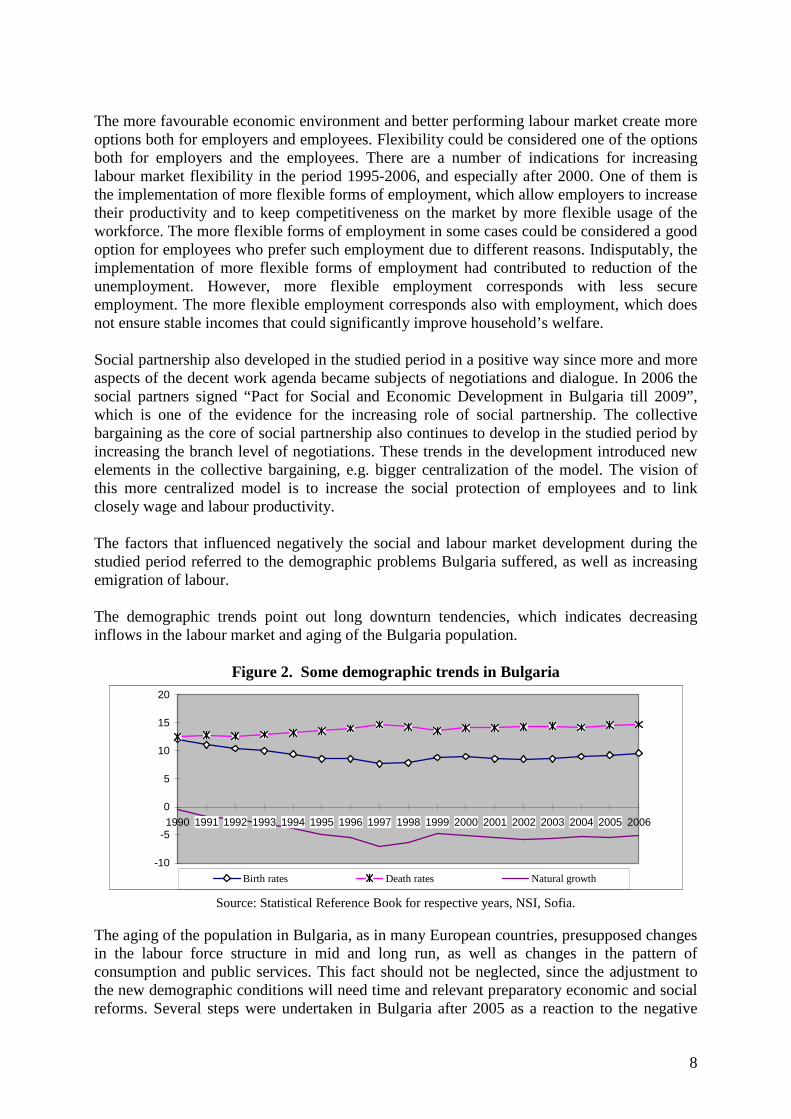
The more favourable economic environment and better performing labour market create more options both for employers and employees. Flexibility could be considered one of the options both for employers and the employees. There are a number of indications for increasing labour market flexibility in the period 1995-2006, and especially after 2000. One of them is the implementation of more flexible forms of employment, which allow employers to increase their productivity and to keep competitiveness on the market by more flexible usage of the workforce. The more flexible forms of employment in some cases could be considered a good option for employees who prefer such employment due to different reasons. Indisputably, the implementation of more flexible forms of employment had contributed to reduction of the unemployment. However, more flexible employment corresponds with less secure employment. The more flexible employment corresponds also with employment, which does not ensure stable incomes that could significantly improve household’s welfare. Social partnership also developed in the studied period in a positive way since more and more aspects of the decent work agenda became subjects of negotiations and dialogue. In 2006 the social partners signed “Pact for Social and Economic Development in Bulgaria till 2009”, which is one of the evidence for the increasing role of social partnership. The collective bargaining as the core of social partnership also continues to develop in the studied period by increasing the branch level of negotiations. These trends in the development introduced new elements in the collective bargaining, e.g. bigger centralization of the model. The vision of this more centralized model is to increase the social protection of employees and to link closely wage and labour productivity. The factors that influenced negatively the social and labour market development during the studied period referred to the demographic problems Bulgaria suffered, as well as increasing emigration of labour. The demographic trends point out long downturn tendencies, which indicates decreasing inflows in the labour market and aging of the Bulgaria population.
Figure 2. Some demographic trends in Bulgaria
-10
-5
0
5
10
15
20
1990 1991 1992 1993 1994 1995 1996 1997 1998 1999 2000 2001 2002 2003 2004 2005 2006
Birth rates Death rates Natural growth
Source: Statistical Reference Book for respective years, NSI, Sofia. The aging of the population in Bulgaria, as in many European countries, presupposed changes in the labour force structure in mid and long run, as well as changes in the pattern of consumption and public services. This fact should not be neglected, since the adjustment to the new demographic conditions will need time and relevant preparatory economic and social reforms. Several steps were undertaken in Bulgaria after 2005 as a reaction to the negative
9
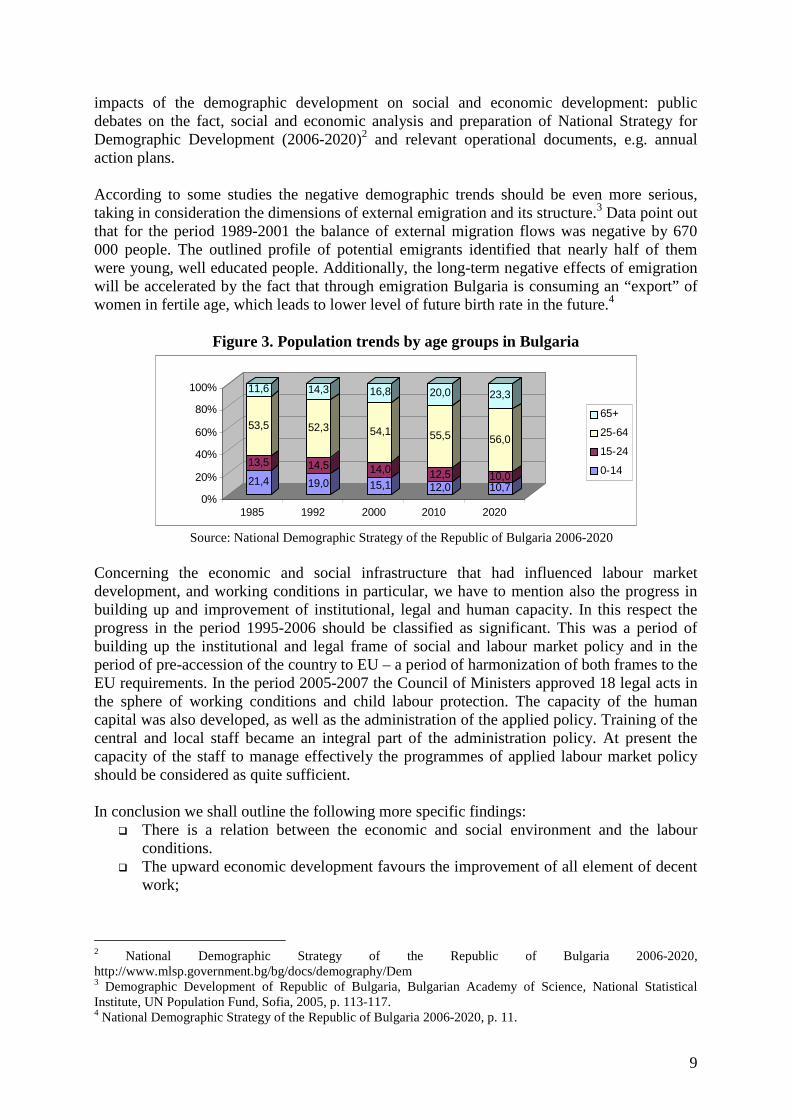
impacts of the demographic development on social and economic development: public debates on the fact, social and economic analysis and preparation of National Strategy for Demographic Development (2006-2020)2 and relevant operational documents, e.g. annual action plans. According to some studies the negative demographic trends should be even more serious, taking in consideration the dimensions of external emigration and its structure.3 Data point out that for the period 1989-2001 the balance of external migration flows was negative by 670 000 people. The outlined profile of potential emigrants identified that nearly half of them were young, well educated people. Additionally, the long-term negative effects of emigration will be accelerated by the fact that through emigration Bulgaria is consuming an “export” of women in fertile age, which leads to lower level of future birth rate in the future.4
Figure 3. Population trends by age groups in Bulgaria
21,4
13,5
53,5
11,6
19,0
14,5
52,3
14,3
15,1
14,0
54,1
16,8
12,012,5
55,5
20,0
10,710,0
56,0
23,3
0%
20%
40%
60%
80%
100%
1985 1992 2000 2010 2020
65+
25-64
15-24
0-14
Source: National Demographic Strategy of the Republic of Bulgaria 2006-2020
Concerning the economic and social infrastructure that had influenced labour market development, and working conditions in particular, we have to mention also the progress in building up and improvement of institutional, legal and human capacity. In this respect the progress in the period 1995-2006 should be classified as significant. This was a period of building up the institutional and legal frame of social and labour market policy and in the period of pre-accession of the country to EU – a period of harmonization of both frames to the EU requirements. In the period 2005-2007 the Council of Ministers approved 18 legal acts in the sphere of working conditions and child labour protection. The capacity of the human capital was also developed, as well as the administration of the applied policy. Training of the central and local staff became an integral part of the administration policy. At present the capacity of the staff to manage effectively the programmes of applied labour market policy should be considered as quite sufficient. In conclusion we shall outline the following more specific findings:
� There is a relation between the economic and social environment and the labour conditions.
� The upward economic development favours the improvement of all element of decent work;
2 National Demographic Strategy of the Republic of Bulgaria 2006-2020, http://www.mlsp.government.bg/bg/docs/demography/Dem 3 Demographic Development of Republic of Bulgaria, Bulgarian Academy of Science, National Statistical Institute, UN Population Fund, Sofia, 2005, p. 113-117. 4 National Demographic Strategy of the Republic of Bulgaria 2006-2020, p. 11.
10
� There are still factors limiting working condition development e.g. financial restrictions and negative demographic factors;
� Decent work issues has become more debated in the society and attracts much the attention of policy-makers;
� The good practices that were introduced in the country by foreign investors stimulated the improvement of labour conditions.
� The positive impact of the EU accession process should also be underlined with its positive impacts through harmonization of the legal framework and further strengthening of the institutional capacity.
3. Trends in working and employment conditions
3.1. Employment status/contracts of employment
The Bulgarian labour legislation distinguishes several types of contract: (a) labour contract, civil contract, other contract. (b) depending on the duration of the contract there are permanent and temporary contracts. (b) the third grouping follows from the length of working time fixed in the contract and in this case there are full-time and part-time labour contracts.
In the context of job security/insecurity employment status, identified by the type of employment contracts, could be provisionally divided in three groups:
(a) employment under labour contract on permanent job and on full-time. It is considered the most secure form of employment.
(b) employment under a combination of the pointed three forms of contract, e.g. under labour contract but temporary and on part-time, or under labour contract but temporary on full-time, or under civil contract on permanent and full-time, etc. This could be classified as less secure but more flexible.
(c) all other forms of contract that are associated with lower level of security. This could be named non-standard form of employment. The group of people, who declare in Labour Force Survey that they do not have written contract should also be taken into consideration here.
The division is provisional since at this stage of the analysis we do not discuss the reasons causing the acceptation of one or another form of employment. This means that some people may have personal preferences to have non-standard employment (less secure) instead of standard (more secure).
Bearing in mind the above, during the period 2000-2006, for which data are available, employment security in Bulgaria has increased. This statement follows from several facts:
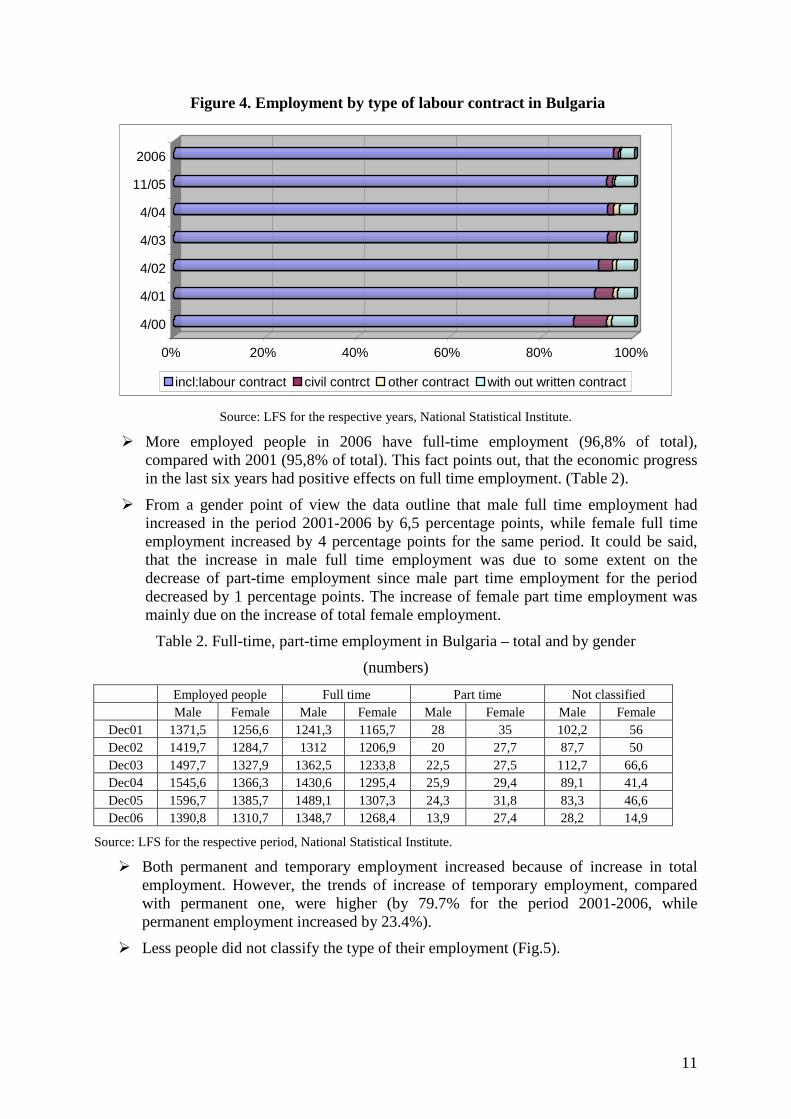
� More employees became employed under labour contract (95.5% of total number of employees in 2006, compared with 86.8% in 2000).5
5 Bulgarian labour legislation distinguishes the following type of labour contracts: labour contract, civil contract, other contract. The more secure form of employment is under labour contract, in case the person has only one employment contract.
11
Figure 4. Employment by type of labour contract in Bulgaria
0% 20% 40% 60% 80% 100%
4/00
4/01
4/02
4/03
4/04
11/05
2006
incl:labour contract civil contrct other contract with out written contract
Source: LFS for the respective years, National Statistical Institute.
� More employed people in 2006 have full-time employment (96,8% of total), compared with 2001 (95,8% of total). This fact points out, that the economic progress in the last six years had positive effects on full time employment. (Table 2).
� From a gender point of view the data outline that male full time employment had increased in the period 2001-2006 by 6,5 percentage points, while female full time employment increased by 4 percentage points for the same period. It could be said, that the increase in male full time employment was due to some extent on the decrease of part-time employment since male part time employment for the period decreased by 1 percentage points. The increase of female part time employment was mainly due on the increase of total female employment.
Table 2. Full-time, part-time employment in Bulgaria – total and by gender
(numbers)
Employed people Full time Part time Not classified Male Female Male Female Male Female Male Female
Dec01 1371,5 1256,6 1241,3 1165,7 28 35 102,2 56 Dec02 1419,7 1284,7 1312 1206,9 20 27,7 87,7 50 Dec03 1497,7 1327,9 1362,5 1233,8 22,5 27,5 112,7 66,6 Dec04 1545,6 1366,3 1430,6 1295,4 25,9 29,4 89,1 41,4 Dec05 1596,7 1385,7 1489,1 1307,3 24,3 31,8 83,3 46,6 Dec06 1390,8 1310,7 1348,7 1268,4 13,9 27,4 28,2 14,9
Source: LFS for the respective period, National Statistical Institute.
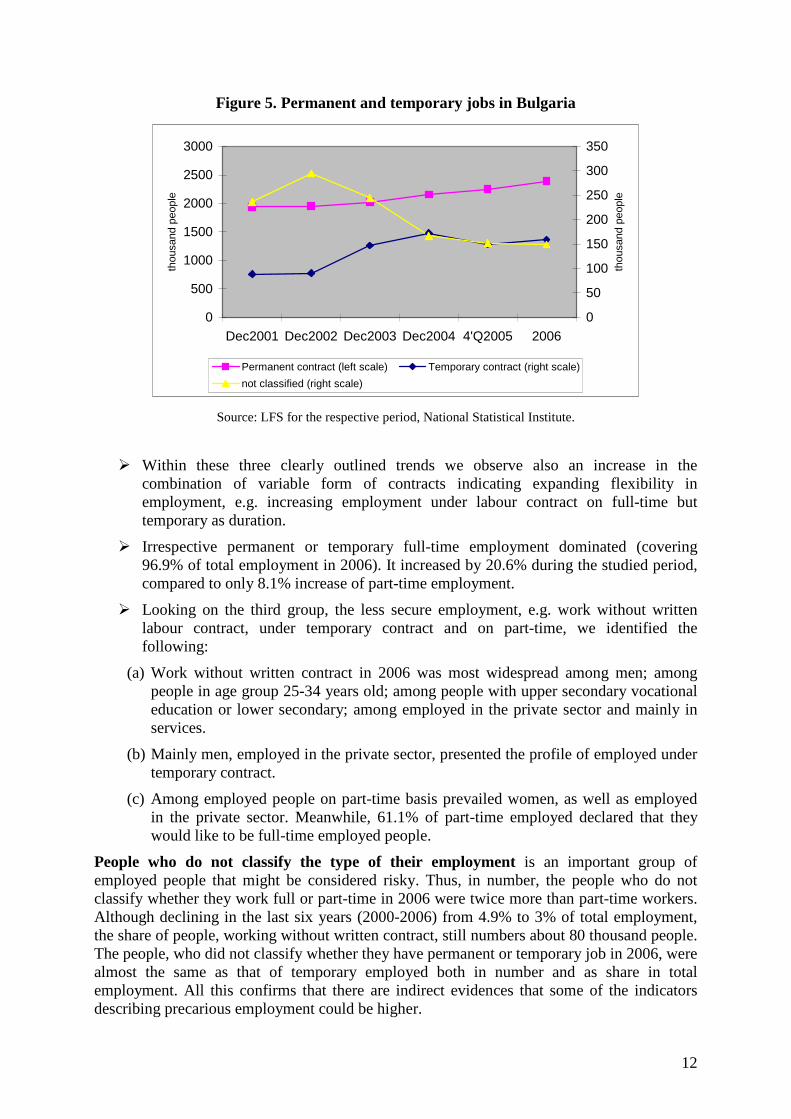
� Both permanent and temporary employment increased because of increase in total employment. However, the trends of increase of temporary employment, compared with permanent one, were higher (by 79.7% for the period 2001-2006, while permanent employment increased by 23.4%).
� Less people did not classify the type of their employment (Fig.5).
12
Figure 5. Permanent and temporary jobs in Bulgaria
0
500
1000
1500
2000
2500
3000
Dec2001 Dec2002 Dec2003 Dec2004 4'Q2005 2006
thou
sand
peo
ple
0
50
100
150
200
250
300
350
thou
sand
peo
ple
Permanent contract (left scale) Temporary contract (right scale)
not classified (right scale)
Source: LFS for the respective period, National Statistical Institute.
� Within these three clearly outlined trends we observe also an increase in the combination of variable form of contracts indicating expanding flexibility in employment, e.g. increasing employment under labour contract on full-time but temporary as duration.
� Irrespective permanent or temporary full-time employment dominated (covering 96.9% of total employment in 2006). It increased by 20.6% during the studied period, compared to only 8.1% increase of part-time employment.
� Looking on the third group, the less secure employment, e.g. work without written labour contract, under temporary contract and on part-time, we identified the following:
(a) Work without written contract in 2006 was most widespread among men; among people in age group 25-34 years old; among people with upper secondary vocational education or lower secondary; among employed in the private sector and mainly in services.
(b) Mainly men, employed in the private sector, presented the profile of employed under temporary contract.
(c) Among employed people on part-time basis prevailed women, as well as employed in the private sector. Meanwhile, 61.1% of part-time employed declared that they would like to be full-time employed people.
People who do not classify the type of their employment is an important group of employed people that might be considered risky. Thus, in number, the people who do not classify whether they work full or part-time in 2006 were twice more than part-time workers. Although declining in the last six years (2000-2006) from 4.9% to 3% of total employment, the share of people, working without written contract, still numbers about 80 thousand people. The people, who did not classify whether they have permanent or temporary job in 2006, were almost the same as that of temporary employed both in number and as share in total employment. All this confirms that there are indirect evidences that some of the indicators describing precarious employment could be higher.
13
Self-employment in Bulgaria should be considered a specific form of employment closer to non-standard form. Decreasing as a share in total employment (7.9% in 2006, compared to 9.5 % in 2000), self-employed people numbered almost 250 thousand people. Among them the proportion men/women was 2/1. Self-employed people are evenly spread between urban and rural areas and among them the ones with upper secondary education prevailed. The decreasing number of self-employed people after 2003 confirms some previous studies, pointing that self-employment is mainly a surviving strategy.6 As soon as economic conditions improved and demand for labour increased, many self-employed people passed to employees, a more stable and secure status in employment. It was commonly recognized that self-employed people survived in the market competition because they avoid payment of social and health insurance as well as many other taxes. The more strict current control presses them, so, for many of the self-employed people the dilemma whether to change their status and become employees with social and health insurance, or to continue to be self-employed in condition of increasing competition, was decided by a change in the employment status. However, for the reminder of the self-employed people the issue of safety working conditions continue to be a problem.
Another group to be mentioned is that of the unpaid family workers. In 2006 this group was about 1.2% of total employment or almost 40 thousand people. In the group profile women; unpaid family workers in age between 25-54 years; mainly people with lower secondary education as well as people living in rural areas, predominated. In the period 2000-2006 this group had been decreasing both in number and as share in total employment. The decrease could be associated with the better opportunities the market offers regarding payment, security, working conditions, etc.
There are many other evidences that confirm the increasing stability and security in employment, e.g. the increasing social security revenues. Following the data provided by the National Social Insurance Institute, the number of social insured people had increased from 2216 thousand people in 2003 to 2518 thousand people in 2006, and that of insured self-employed people – from 177,8 thousand in 2003 to 228,7 thousand in 2006.
� The role of General Labour Inspection in increasing employment security and stability should not be neglected. Together with other institutions the number of controls has increased from 1792 cases in 2005 to 2821 cases in 2006. The number of consultations given to newly registered employers also increased from 60008 in 2005 to 61482 in 2006.7
� Meanwhile, the debate in the society regarding illegal economic activities and respective illegal employment continues to be quite active, provoked by permanent budget shortages. According to some studies, illegal employment was 3.5-3.7% of total employment in the period 2002-2004; undeclared working places – 2.1-2.6% of total number of working places, and unpaid social insurance were 3.9-4.1% of total social insurance. About 10% of social insurance concerning basic labour contracts had not been paid to the National Social Insurance Institute and about 70% of that for second job contract.8
6 Beleva, I., V. Tzanov. Bulgaria: Towards a Better Balanced World of World? – In: Eyraud, F., D. Vaughan-Whitehead (ed.), The Evolving World of Work in the Enlarged EU, Progress and Vulnerability. ILO, Geneva, 2007, p. 59. 7 Annual Report of the General Labour Inspectorate, 2006, http://git.mlsp.government.bg/ 8 Center for Study of the Democracy, Hidden economy in Bulgaria, 2005, Vitosha Research and Coalition 2000; http://www.csd.bg/bg/econ/
14
� As far as other forms of employment is concerned, e.g. seasonal employment, employment through interim agency, on call contracts or by assignments, multiple jobs, etc., there is very limited and fragment information, which does not allow a representative conclusions to be reported.
Meanwhile, the Annual Report of the General Labour Inspection points out that in 2006 the violations in the sphere of labour relations continue to be a problem in view of type of contract, duration of working time, payment of extra working time, etc. This report points out e.g. that Food processing industry had a number of violations due to replacement of labour with civil contract. In this way employers avoid or decline social insurance taxes. Another violation that was pointed out is that employers continued to pay less than the minimum level of wage. Violation is also when employers keep people officially on lower staff positions, thus insuring them at lower social insurance thresholds. This is one way to reduce social insurance expenditure on behalf of employees.
Summarizing the most significant features regarding employment status based on type of contract we shall outline:
� The increasing trends in the development of more secure forms of contracting e.g. employment under labour contract, permanent employment on full time;
� However, there are also evidences that labour relations are becoming more flexible and thus - to some extend insecure;
� Although, both employers and employees have more legal opportunities to choose the forms of employment and contracting;
� The development of atypical forms of employment e.g. self-employment, unpaid family workers etc. complicates additionally the picture regarding the types of labour contracts.
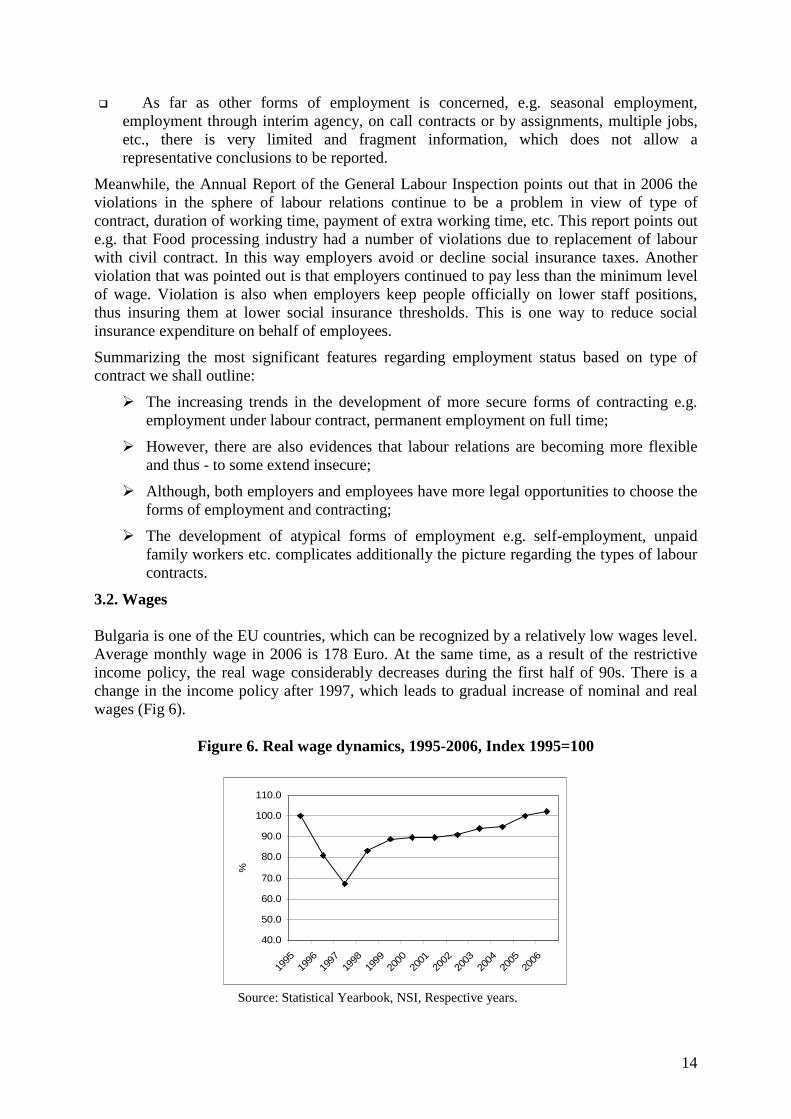
3.2. Wages Bulgaria is one of the EU countries, which can be recognized by a relatively low wages level. Average monthly wage in 2006 is 178 Euro. At the same time, as a result of the restrictive income policy, the real wage considerably decreases during the first half of 90s. There is a change in the income policy after 1997, which leads to gradual increase of nominal and real wages (Fig 6).
Figure 6. Real wage dynamics, 1995-2006, Index 1995=100
40.0
50.0
60.0
70.0
80.0
90.0
100.0
110.0
1995
1996
1997
1998
1999
2000
2001
2002
2003
2004
2005
2006
%
Source: Statistical Yearbook, NSI, Respective years.
15
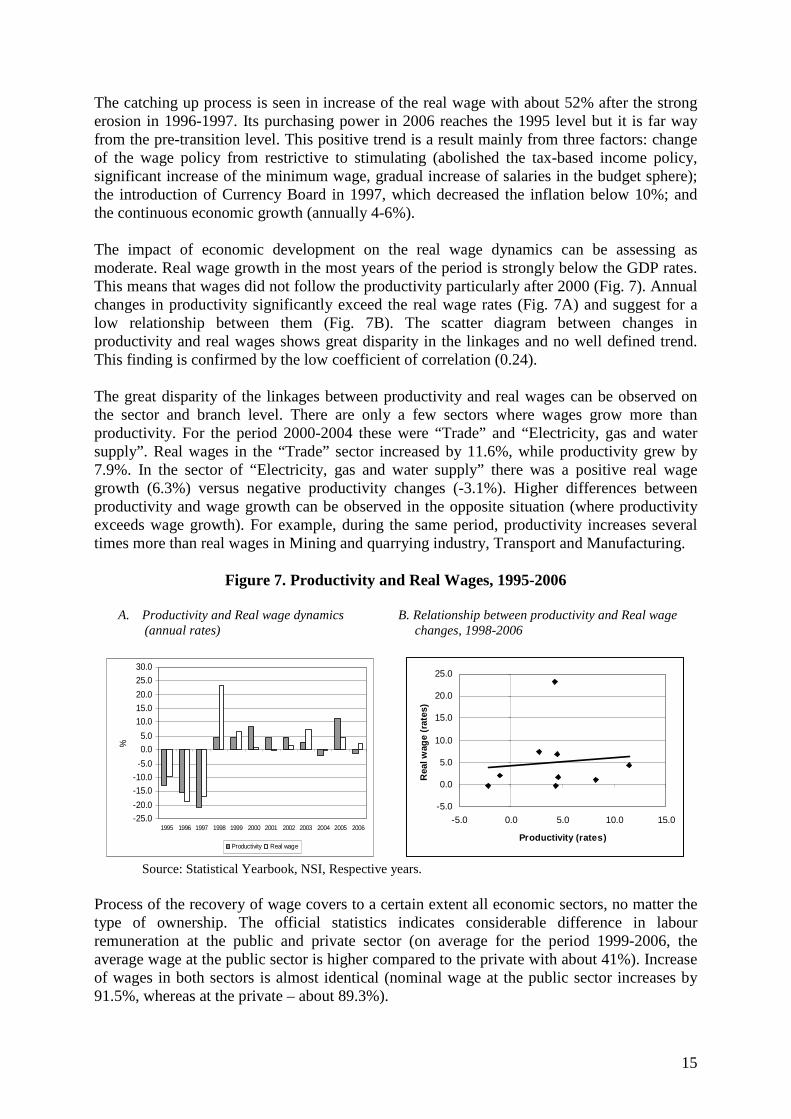
The catching up process is seen in increase of the real wage with about 52% after the strong erosion in 1996-1997. Its purchasing power in 2006 reaches the 1995 level but it is far way from the pre-transition level. This positive trend is a result mainly from three factors: change of the wage policy from restrictive to stimulating (abolished the tax-based income policy, significant increase of the minimum wage, gradual increase of salaries in the budget sphere); the introduction of Currency Board in 1997, which decreased the inflation below 10%; and the continuous economic growth (annually 4-6%). The impact of economic development on the real wage dynamics can be assessing as moderate. Real wage growth in the most years of the period is strongly below the GDP rates. This means that wages did not follow the productivity particularly after 2000 (Fig. 7). Annual changes in productivity significantly exceed the real wage rates (Fig. 7A) and suggest for a low relationship between them (Fig. 7B). The scatter diagram between changes in productivity and real wages shows great disparity in the linkages and no well defined trend. This finding is confirmed by the low coefficient of correlation (0.24). The great disparity of the linkages between productivity and real wages can be observed on the sector and branch level. There are only a few sectors where wages grow more than productivity. For the period 2000-2004 these were “Trade” and “Electricity, gas and water supply”. Real wages in the “Trade” sector increased by 11.6%, while productivity grew by 7.9%. In the sector of “Electricity, gas and water supply” there was a positive real wage growth (6.3%) versus negative productivity changes (-3.1%). Higher differences between productivity and wage growth can be observed in the opposite situation (where productivity exceeds wage growth). For example, during the same period, productivity increases several times more than real wages in Mining and quarrying industry, Transport and Manufacturing.
Figure 7. Productivity and Real Wages, 1995-2006
A. Productivity and Real wage dynamics B. Relationship between productivity and Real wage (annual rates) changes, 1998-2006
-25.0
-20.0
-15.0
-10.0
-5.0
0.0
5.0
10.0
15.0
20.0
25.0
30.0
1995 1996 1997 1998 1999 2000 2001 2002 2003 2004 2005 2006
%
Productivity Real wage
-5.0
0.0
5.0
10.0
15.0
20.0
25.0
-5.0 0.0 5.0 10.0 15.0
Productivity (rates)
Rea
l wag
e (r
ates
)
Source: Statistical Yearbook, NSI, Respective years.
Process of the recovery of wage covers to a certain extent all economic sectors, no matter the type of ownership. The official statistics indicates considerable difference in labour remuneration at the public and private sector (on average for the period 1999-2006, the average wage at the public sector is higher compared to the private with about 41%). Increase of wages in both sectors is almost identical (nominal wage at the public sector increases by 91.5%, whereas at the private – about 89.3%).
16
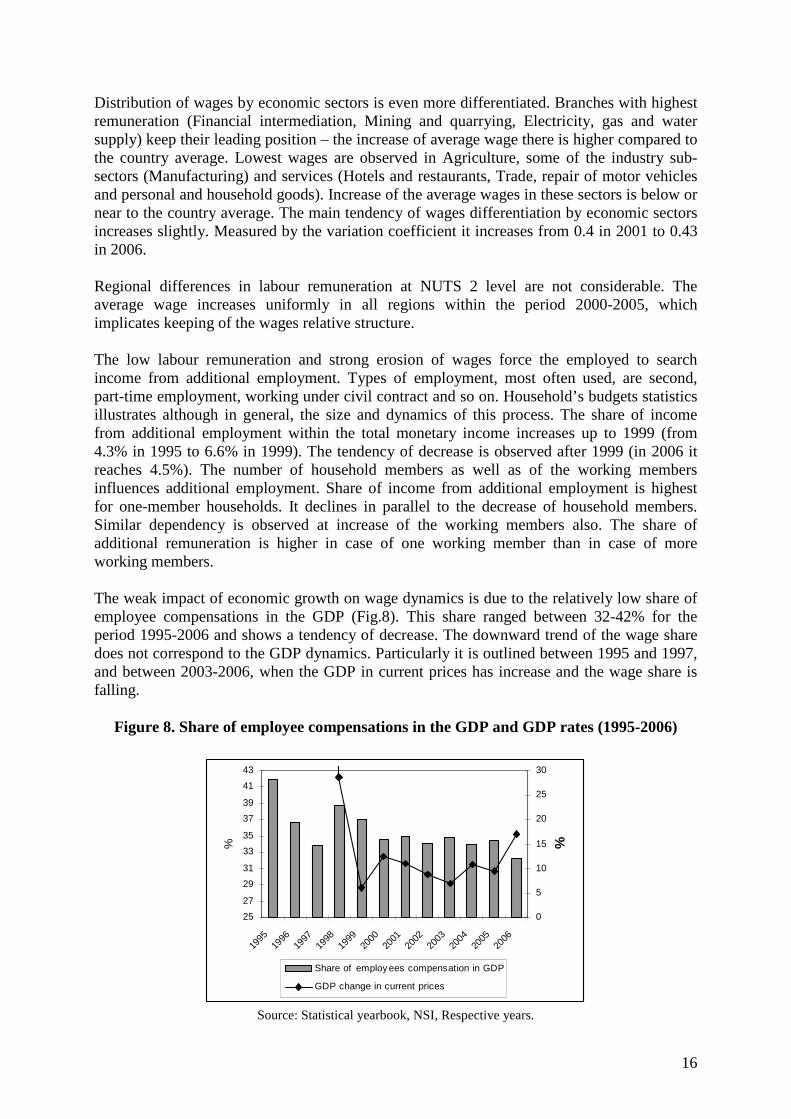
Distribution of wages by economic sectors is even more differentiated. Branches with highest remuneration (Financial intermediation, Mining and quarrying, Electricity, gas and water supply) keep their leading position – the increase of average wage there is higher compared to the country average. Lowest wages are observed in Agriculture, some of the industry sub-sectors (Manufacturing) and services (Hotels and restaurants, Trade, repair of motor vehicles and personal and household goods). Increase of the average wages in these sectors is below or near to the country average. The main tendency of wages differentiation by economic sectors increases slightly. Measured by the variation coefficient it increases from 0.4 in 2001 to 0.43 in 2006. Regional differences in labour remuneration at NUTS 2 level are not considerable. The average wage increases uniformly in all regions within the period 2000-2005, which implicates keeping of the wages relative structure. The low labour remuneration and strong erosion of wages force the employed to search income from additional employment. Types of employment, most often used, are second, part-time employment, working under civil contract and so on. Household’s budgets statistics illustrates although in general, the size and dynamics of this process. The share of income from additional employment within the total monetary income increases up to 1999 (from 4.3% in 1995 to 6.6% in 1999). The tendency of decrease is observed after 1999 (in 2006 it reaches 4.5%). The number of household members as well as of the working members influences additional employment. Share of income from additional employment is highest for one-member households. It declines in parallel to the decrease of household members. Similar dependency is observed at increase of the working members also. The share of additional remuneration is higher in case of one working member than in case of more working members. The weak impact of economic growth on wage dynamics is due to the relatively low share of employee compensations in the GDP (Fig.8). This share ranged between 32-42% for the period 1995-2006 and shows a tendency of decrease. The downward trend of the wage share does not correspond to the GDP dynamics. Particularly it is outlined between 1995 and 1997, and between 2003-2006, when the GDP in current prices has increase and the wage share is falling.
Figure 8. Share of employee compensations in the GDP and GDP rates (1995-2006)
25
27
29
31
33
35
37
39
41
43
1995
1996
1997
1998
1999
2000
2001
2002
2003
2004
2005
2006
%
0
5
10
15
20
25
30
%
Share of employ ees compensation in GDP
GDP change in current prices
Source: Statistical yearbook, NSI, Respective years.
17
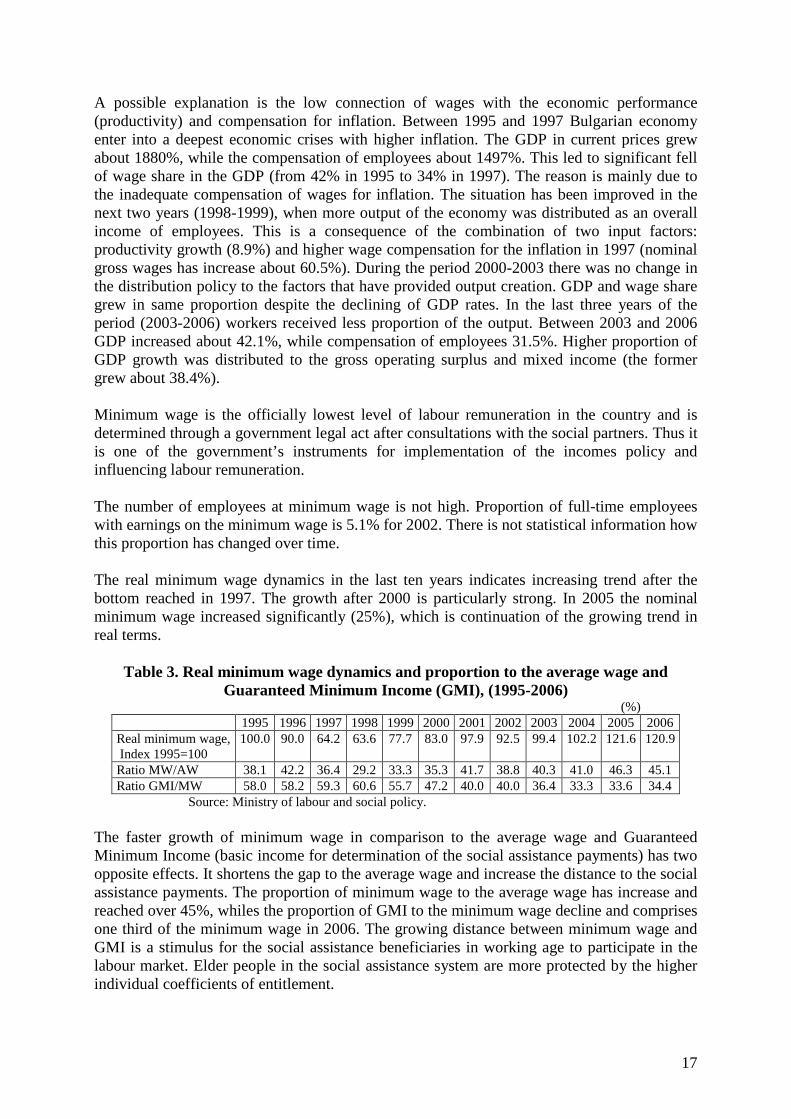
A possible explanation is the low connection of wages with the economic performance (productivity) and compensation for inflation. Between 1995 and 1997 Bulgarian economy enter into a deepest economic crises with higher inflation. The GDP in current prices grew about 1880%, while the compensation of employees about 1497%. This led to significant fell of wage share in the GDP (from 42% in 1995 to 34% in 1997). The reason is mainly due to the inadequate compensation of wages for inflation. The situation has been improved in the next two years (1998-1999), when more output of the economy was distributed as an overall income of employees. This is a consequence of the combination of two input factors: productivity growth (8.9%) and higher wage compensation for the inflation in 1997 (nominal gross wages has increase about 60.5%). During the period 2000-2003 there was no change in the distribution policy to the factors that have provided output creation. GDP and wage share grew in same proportion despite the declining of GDP rates. In the last three years of the period (2003-2006) workers received less proportion of the output. Between 2003 and 2006 GDP increased about 42.1%, while compensation of employees 31.5%. Higher proportion of GDP growth was distributed to the gross operating surplus and mixed income (the former grew about 38.4%). Minimum wage is the officially lowest level of labour remuneration in the country and is determined through a government legal act after consultations with the social partners. Thus it is one of the government’s instruments for implementation of the incomes policy and influencing labour remuneration. The number of employees at minimum wage is not high. Proportion of full-time employees with earnings on the minimum wage is 5.1% for 2002. There is not statistical information how this proportion has changed over time. The real minimum wage dynamics in the last ten years indicates increasing trend after the bottom reached in 1997. The growth after 2000 is particularly strong. In 2005 the nominal minimum wage increased significantly (25%), which is continuation of the growing trend in real terms.
Table 3. Real minimum wage dynamics and proportion to the average wage and
Guaranteed Minimum Income (GMI), (1995-2006) (%)
1995 1996 1997 1998 1999 2000 2001 2002 2003 2004 2005 2006 Real minimum wage, Index 1995=100
100.0 90.0 64.2 63.6 77.7 83.0 97.9 92.5 99.4 102.2 121.6 120.9
Ratio MW/AW 38.1 42.2 36.4 29.2 33.3 35.3 41.7 38.8 40.3 41.0 46.3 45.1 Ratio GMI/MW 58.0 58.2 59.3 60.6 55.7 47.2 40.0 40.0 36.4 33.3 33.6 34.4
Source: Ministry of labour and social policy. The faster growth of minimum wage in comparison to the average wage and Guaranteed Minimum Income (basic income for determination of the social assistance payments) has two opposite effects. It shortens the gap to the average wage and increase the distance to the social assistance payments. The proportion of minimum wage to the average wage has increase and reached over 45%, whiles the proportion of GMI to the minimum wage decline and comprises one third of the minimum wage in 2006. The growing distance between minimum wage and GMI is a stimulus for the social assistance beneficiaries in working age to participate in the labour market. Elder people in the social assistance system are more protected by the higher individual coefficients of entitlement.
18
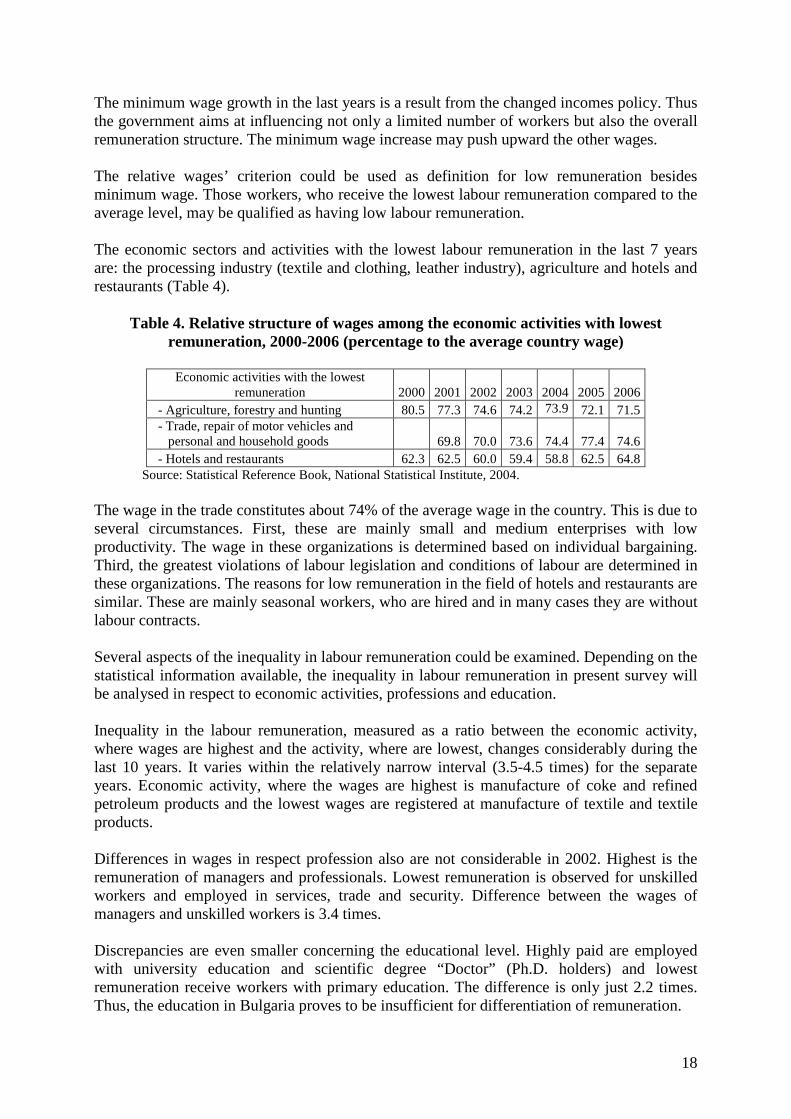
The minimum wage growth in the last years is a result from the changed incomes policy. Thus the government aims at influencing not only a limited number of workers but also the overall remuneration structure. The minimum wage increase may push upward the other wages. The relative wages’ criterion could be used as definition for low remuneration besides minimum wage. Those workers, who receive the lowest labour remuneration compared to the average level, may be qualified as having low labour remuneration. The economic sectors and activities with the lowest labour remuneration in the last 7 years are: the processing industry (textile and clothing, leather industry), agriculture and hotels and restaurants (Table 4).
Table 4. Relative structure of wages among the economic activities with lowest remuneration, 2000-2006 (percentage to the average country wage)
Economic activities with the lowest
remuneration 2000
2001 2002 2003
2004
2005
2006 - Agriculture, forestry and hunting 80.5 77.3 74.6 74.2 73.9 72.1 71.5 - Trade, repair of motor vehicles and personal and household goods 69.8 70.0 73.6 74.4 77.4 74.6 - Hotels and restaurants 62.3 62.5 60.0 59.4 58.8 62.5 64.8
Source: Statistical Reference Book, National Statistical Institute, 2004. The wage in the trade constitutes about 74% of the average wage in the country. This is due to several circumstances. First, these are mainly small and medium enterprises with low productivity. The wage in these organizations is determined based on individual bargaining. Third, the greatest violations of labour legislation and conditions of labour are determined in these organizations. The reasons for low remuneration in the field of hotels and restaurants are similar. These are mainly seasonal workers, who are hired and in many cases they are without labour contracts. Several aspects of the inequality in labour remuneration could be examined. Depending on the statistical information available, the inequality in labour remuneration in present survey will be analysed in respect to economic activities, professions and education. Inequality in the labour remuneration, measured as a ratio between the economic activity, where wages are highest and the activity, where are lowest, changes considerably during the last 10 years. It varies within the relatively narrow interval (3.5-4.5 times) for the separate years. Economic activity, where the wages are highest is manufacture of coke and refined petroleum products and the lowest wages are registered at manufacture of textile and textile products. Differences in wages in respect profession also are not considerable in 2002. Highest is the remuneration of managers and professionals. Lowest remuneration is observed for unskilled workers and employed in services, trade and security. Difference between the wages of managers and unskilled workers is 3.4 times. Discrepancies are even smaller concerning the educational level. Highly paid are employed with university education and scientific degree “Doctor” (Ph.D. holders) and lowest remuneration receive workers with primary education. The difference is only just 2.2 times. Thus, the education in Bulgaria proves to be insufficient for differentiation of remuneration.
19
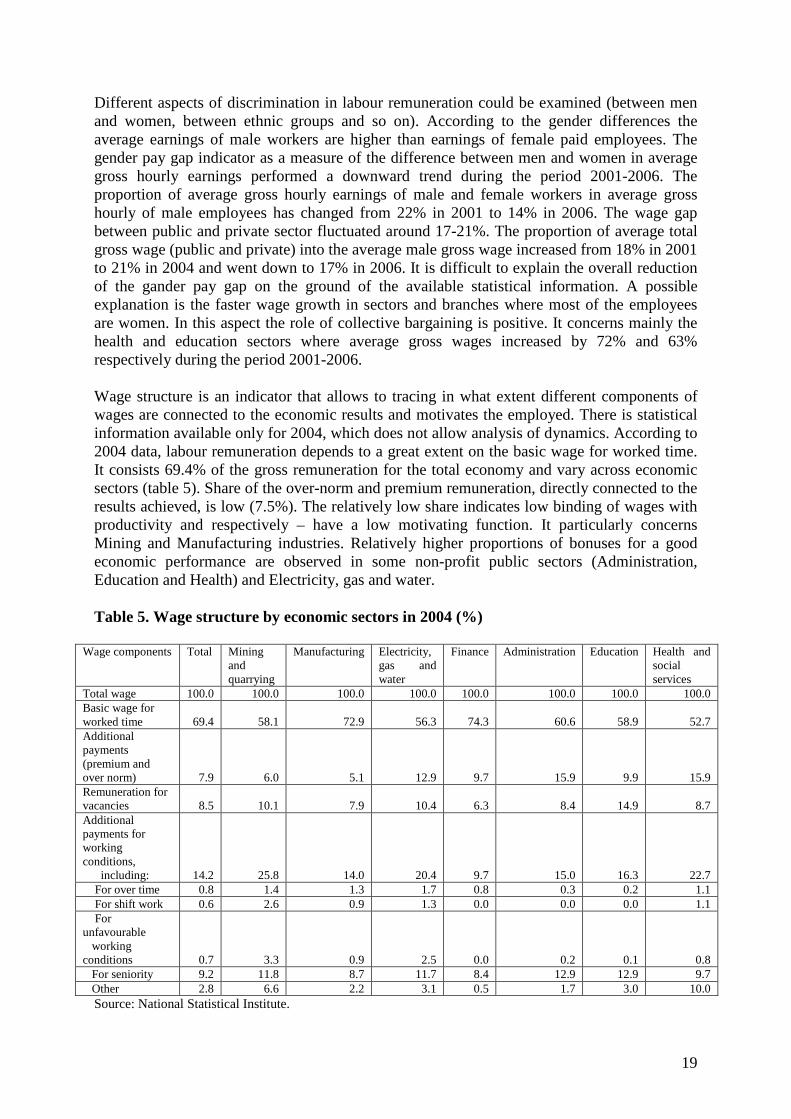
Different aspects of discrimination in labour remuneration could be examined (between men and women, between ethnic groups and so on). According to the gender differences the average earnings of male workers are higher than earnings of female paid employees. The gender pay gap indicator as a measure of the difference between men and women in average gross hourly earnings performed a downward trend during the period 2001-2006. The proportion of average gross hourly earnings of male and female workers in average gross hourly of male employees has changed from 22% in 2001 to 14% in 2006. The wage gap between public and private sector fluctuated around 17-21%. The proportion of average total gross wage (public and private) into the average male gross wage increased from 18% in 2001 to 21% in 2004 and went down to 17% in 2006. It is difficult to explain the overall reduction of the gander pay gap on the ground of the available statistical information. A possible explanation is the faster wage growth in sectors and branches where most of the employees are women. In this aspect the role of collective bargaining is positive. It concerns mainly the health and education sectors where average gross wages increased by 72% and 63% respectively during the period 2001-2006. Wage structure is an indicator that allows to tracing in what extent different components of wages are connected to the economic results and motivates the employed. There is statistical information available only for 2004, which does not allow analysis of dynamics. According to 2004 data, labour remuneration depends to a great extent on the basic wage for worked time. It consists 69.4% of the gross remuneration for the total economy and vary across economic sectors (table 5). Share of the over-norm and premium remuneration, directly connected to the results achieved, is low (7.5%). The relatively low share indicates low binding of wages with productivity and respectively – have a low motivating function. It particularly concerns Mining and Manufacturing industries. Relatively higher proportions of bonuses for a good economic performance are observed in some non-profit public sectors (Administration, Education and Health) and Electricity, gas and water. Table 5. Wage structure by economic sectors in 2004 (%)
Wage components Total Mining and quarrying
Manufacturing Electricity, gas and water
Finance Administration Education Health and social services
Total wage 100.0 100.0 100.0 100.0 100.0 100.0 100.0 100.0 Basic wage for worked time 69.4 58.1 72.9 56.3 74.3 60.6 58.9 52.7 Additional payments (premium and over norm) 7.9 6.0 5.1 12.9 9.7 15.9 9.9 15.9 Remuneration for vacancies 8.5 10.1 7.9 10.4 6.3 8.4 14.9 8.7 Additional payments for working conditions, including: 14.2 25.8 14.0 20.4 9.7 15.0 16.3 22.7 For over time 0.8 1.4 1.3 1.7 0.8 0.3 0.2 1.1 For shift work 0.6 2.6 0.9 1.3 0.0 0.0 0.0 1.1 For unfavourable working conditions 0.7 3.3 0.9 2.5 0.0 0.2 0.1 0.8 For seniority 9.2 11.8 8.7 11.7 8.4 12.9 12.9 9.7 Other 2.8 6.6 2.2 3.1 0.5 1.7 3.0 10.0
Source: National Statistical Institute.
20
Share of benefits for unfavourable working conditions, over-time worked, long-term employment at the same employer (seniority bonuses) and others represent the highest percentage of the flexible part of wages (14.2%). Fluctuations among sectors are not so high. The biggest part amongst them is seniority bonuses (average 9.2%). Compensations for unfavourable working conditions, over-time worked and shift work is below 1 per cent. Among these compensations the payments for over-time worked are highest. This is a result of the increasing number of working hours in some sectors and branches (see section “Working time and work organization”). The following conclusions can be drawn based on the survey results:
• There is a catching up process of real wage in the last 10 years but it is still below the pre-transition period;
• Low binding between wages and GDP. The share of wages in GDP is relatively low and shows tendency of decrease during the last years;
• Workers in Bulgaria receive some of the lowest wages in Europe. Along with the considerable erosion of real wage this is a serious challenge for the income policy. The workers in the processing industry (textile, clothing and leather industry) and the services sector (hotels) are with the lowest remuneration;
• Wage inequality could be evaluated as moderate. No significant changes are monitored in dynamic aspect. This concerns the inter-sector differences in wages as well as differences among particular professions and educational levels;
• Structure of wages is weakly connected to the economic results and does not have strongly expressed motivating function.
3.3. Working time and work organization
The Labour Code in Bulgaria identifies normal duration of working time (art. 136)9; reduced working hours (art. 137)10; part-time work (art. 138-139)11, as well as some specific forms of
9 Article136 (1) The normal duration of the weekly working hours for a five-day work week shall be up to 40 hours. (2) The normal duration of the weekly working hours for the sectors where the five-day workweek has not been introduced shall be up to 46 hours for a six-day work week. (3) The normal duration of the working hours during the day shall be: 1. for a five-day work week - up to 8 hours; 2. for a six-day work week - up to 8 hours, and on days before days off or holidays -up to 6 hours. (4) The normal duration of the working hours under the preceding paragraph shall not be extended. (5) The transition from a six-day to a five-day work week shall be done upon a decision of the Council of Ministers. 10 Article 137 (1) Reduced working hours shall be established for: 1. employees working under unhealthy conditions or doing work under special conditions upon the decision of the Council of Ministers; 2. employees who have not reached 18 years of age. 11 Article 138 The parties to the employment contract may negotiate work for a part of the statutory working hours (part-time work). In this case they shall specify the duration and allocation of the working hours. Article 139 (1) The allocation of working hours shall be established by the internal rules of the enterprise. (2) In enterprises where organization of work allows flexible working hours may be established. The time during which the employee must be at work in the enterprise, as well as the manner of accounting for it, shall be specified by the employer. Outside the time of his compulsory presence, the employee may determine the beginning of his working hours himself.
21
working time, e.g. night work (art. 140), work in shifts (art. 141), overtime work (art. 143-144), etc.
In 2004 a number of changes were introduced so as to make the legal norms in working time more flexible, e.g. extended working time.12 There are also some additional legal norms concerning people, whose working time is calculated for a certain period.13 The categories of workers are protected in view of working time schemes, i.e. mothers with children aged under 3 to work extra and on night shifts.14
Within this legal frame, the reality, as registered by the regular statistical observations (LFS and Time Budget Survey), presents the following trends in working time.
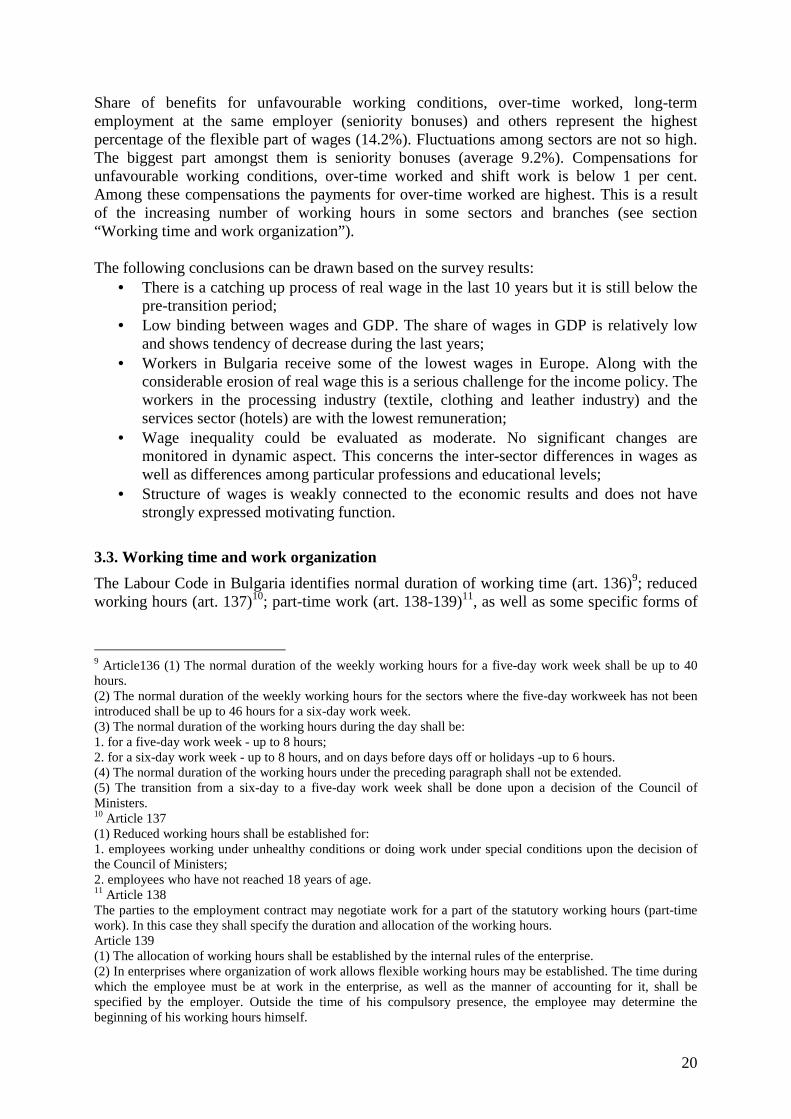
Table 6. Average actual working hours per week in 2001-2006
2001
Total Male Female Private sector Public sector Total 40,8 41,1 40,4 41,3 40,2 Full time employed 41,0 41,3 40,8 41,6 40,4 Part-time employed 20,8 20,7 20,8 21,1 20,2
2006 Total Male Female Private sector Public sector Total 41.0 41.6 40.4 41.8 39.2 Full time employed 41.4 41.9 40.9 42.2 39.5 Part-time employed 20.7 21.6 20.1 20.4 21.4
Source: LFS , 2001, 2006
Comparing the average actual working hours per week in 2006 and 2001, we have to say that in a five-year period no significant changes occurred. There are two exceptions only: The first is that part-time employed people in the private sector had started to work less hours per week (by -0.8 hour), while the ones in the public sector worked more hours (by 1.2 hour). The second is that total average working hours in public sector and for full-time employed people in the public sector had decreased, while the ones in the private sector stayed relatively stable.
(3) Depending on the nature of work and the labour organization, the working day may be divided into two or three parts. (4) For some categories of employees, due to the special nature of their work, the Minister of Labour and Social Welfare may establish open-ended working hours. The employees on opened working hours shall, if necessary, perform their duties even after the expiry of the regular working hours. The overtime on working days shall be compensated by an additional annual paid leave, and work on legal holidays - by an increased remuneration for overtime work. (5) For some categories of employees, due to the special nature of their work, an obligation may be established to be on duty or to stand by at the disposal of the employer during specified hours in a 24-hour period. The Minister of Labour and Social Welfare determines the categories of employees, the maximum duration of the hours, and the terms and procedures of accounting for them. 12 Extended working time by the employer but the total weekly duration cannot exceed 48 hours, and for the employees with reduced working time – up to 40 hours. The extended working day cannot exceed 10 hours, and for the employees with reduced working time – up to 1 hour over the reduced working time. 13 The duration of working day for these employees cannot be over 12 hours, and the weekly duration cannot exceed 56 hours. 14 However this prohibition may fall off if the employee agrees in written form. If employees, whose working time is calculated on daily basis, work extra, they are entitled to compensations amounting to 24 hours in the next week, pointed by the employer.
22
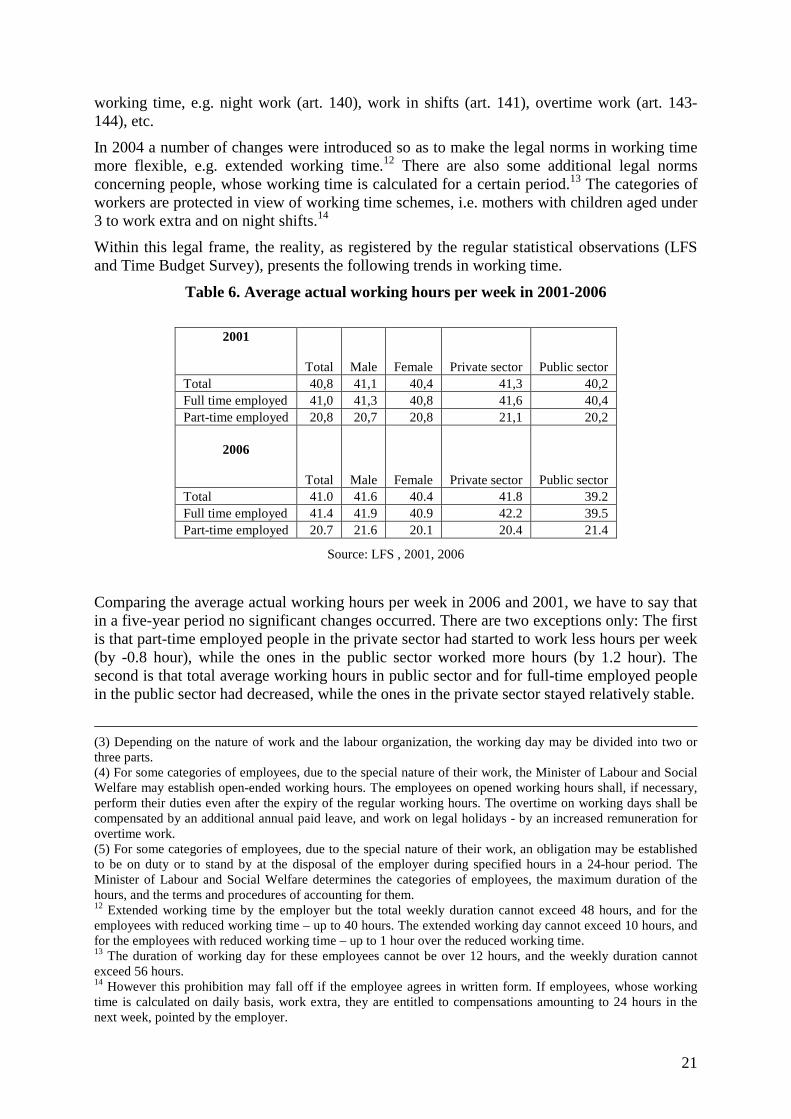
The distribution of the usual worked hours in 2004 points out that the majority of the employed people worked between 40-49 hours per week. Bearing in mind the legal norm stated in the Labour Code as a normal length i.e. up to 40 hours, this means that more people worked extra hours in 2006 compared with 2004. Within the total balance of working time this means also that less people are engaged at working time below 40 hours or under the legally fixed norm.
Table 7. Distribution of employed people by usual worked hours - structure
2004 2006 Total Man Women Total Man Women 100.0 100.0 100.0 100.0 100.0 100.0 1-9 0.1 0.0 0.1 0.1 0.0 0.1 10-19 0.3 0.3 0.4 0.2 0.1 0.3 20-29 1.9 1.6 0.3 1.5 1.1 1.9 30-39 2.5 1.9 3.2 1.8 1.1 2.6 40-49 80.7 78.4 82.3 82.0 79.4 84.8 50-59 3.9 4.4 3.3 4.0 4.5 3.4 60+ 2.0 2.5 3.0 1.9 2.5 1.2 Unclassified 8.6 10.8 6.0 8.6 11.2 5.6
Source: LFS
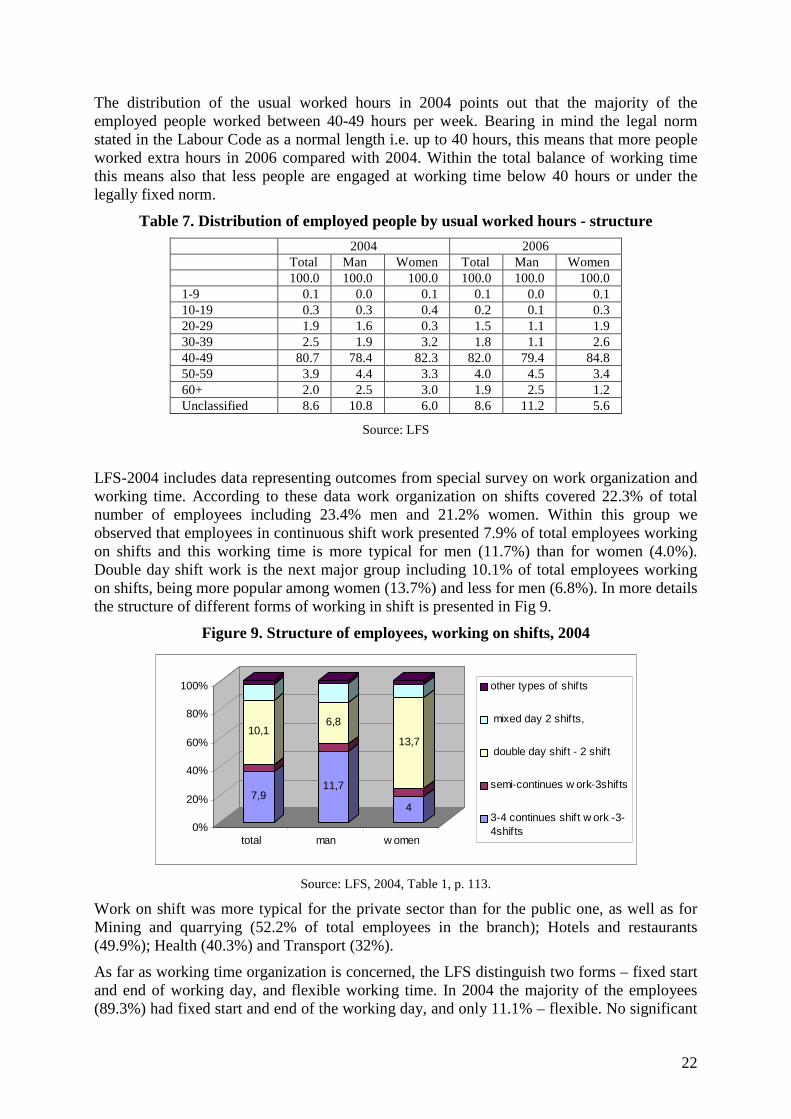
LFS-2004 includes data representing outcomes from special survey on work organization and working time. According to these data work organization on shifts covered 22.3% of total number of employees including 23.4% men and 21.2% women. Within this group we observed that employees in continuous shift work presented 7.9% of total employees working on shifts and this working time is more typical for men (11.7%) than for women (4.0%). Double day shift work is the next major group including 10.1% of total employees working on shifts, being more popular among women (13.7%) and less for men (6.8%). In more details the structure of different forms of working in shift is presented in Fig 9.
Figure 9. Structure of employees, working on shifts, 2004
7,9
10,1
11,7
6,8
4
13,7
0%
20%
40%
60%
80%
100%
total man w omen
other types of shifts
mixed day 2 shifts,
double day shift - 2 shift
semi-continues w ork-3shifts
3-4 continues shift w ork -3-4shifts
Source: LFS, 2004, Table 1, p. 113.
Work on shift was more typical for the private sector than for the public one, as well as for Mining and quarrying (52.2% of total employees in the branch); Hotels and restaurants (49.9%); Health (40.3%) and Transport (32%).
As far as working time organization is concerned, the LFS distinguish two forms – fixed start and end of working day, and flexible working time. In 2004 the majority of the employees (89.3%) had fixed start and end of the working day, and only 11.1% – flexible. No significant
23
differences by gender in this respect is observed, but by branches there are some branches where the flexible working day is clearly outlined, e.g. Agriculture (23.7% of total number of employees in the branch); Construction (17.5%), Hotel and restaurants (16.5%); Transport (15.3%), Education (26%).
Nearly half of the total number of employees in 2004 had worked in the evening – 1 214,6 thousand people. Among them men prevailed (58.4%). The evening work is the usual working time for 47.3% of all employees that declared they work in the evening, while for the rest it was an occasional case.
In 2004 Saturday work concerned 53.9% of the employees, of them 60% men and 40% women. Among all people who worked on Saturday almost half did that as usual mode and for the rest it was an occasional case.
The people, who worked on Sunday presented 1/3 of total number of employees. This was valid for 40% of the men, as well as for 44% as usual time and for 46% – only sometimes.
The most vulnerable groups regarding not typical working time are those of employers, self-employed people and unpaid family workers. The last one in 2004 presented 54% of people working in the evening, 90% of those, working on Saturday and 73% of those, working on Sunday.
Meanwhile, the Annual Report of the General Labour Inspection points out that in 2006 the violations in the sphere of extra working hours were 1043 cases, which was by 10% more compared with 2005. It also named three branches – Hotel and restaurants, Retail trade and Clothing industry, where more of the violations were registered.
The above analysis allows us to conclude the following:
� The presented data suggest that the working time mode still remains quite traditional;
� As a result of the present more stable economic development the working time extends. There is a clearly outlined extension of working time by the end of week and in weekends especially in specific branches and in the private sector. Unfortunately we cannot analyse the trends of changes in working time in details due to lack of regular observations;
� The flexible forms of working hours covered only 11.1% in 2004, however, in some branches the flexible working time is more frequent e.g. constructions, trade, hotel and restaurants, etc. However, following a number of indirect evidences and in comparison with earlier periods of transition, there are more options for flexible and atypical work.
3.4. Working intensity Labour intensity depends on many factors of which the most essential are production technology, organization and rhythm of labour activity. During the recent years the debate on labour intensity in European countries is connected with the relation between the aspiration for reduction of working time and its compensation via increasing the intensity. In Bulgaria the labour intensity issue is not on the agenda. That is why there are not many studies in this area. Meanwhile the statistics does not collect data and does not calculate basic indicators for labour intensity. So the objective of the present survey is to show the development trend and the relation with the hours worked based on the existing statistical information. In this study labour intensity is defined as an amount of output produced per unit of time (1 hour). The evaluations are made on macroeconomic level (for the economy in general and by
24
particular sectors). Information for the amount of output in comparative prices by economic sectors and hours worked has been used for the purpose. The evaluations of labour intensity15 in Bulgarian economy for the period 2000-2004 indicate two particular features:
� The first related to the relatively low intensity level. The amount of output produced by Bulgarian economy per 100 hours worked is less than BGN 2.
� The second feature is that labour intensity grows during the studied period. It grows by about 16% compared to 2000. This positive trend is a result from all factors (technological, organizational, etc.) influencing intensity. The available statistical information does not allow distinguishing their particular impact.
No clear correlation is monitored at macro level between labour intensity and average duration of working day during the studied period. While the intensity grows, the working day’s duration does not indicate any trend of change as seen from data in the section 3.3 (it grows initially, after which declines). Despite the great degree of conventionality it could be concluded that the increase of labour intensity in Bulgaria during the recent years is not accompanied with increase of working day’s duration. The level and dynamics of labour intensity by economic sectors show differences, which consistence with the expectations. The intensity in the agriculture is lowest. For example in 2004 the amount of produced output in the agriculture per 100 hours worked is BGN 0.47, while in industry it is BGN 1.6, and in the services sector - BGN 0.9. Looking at the dynamics of labour intensity by economic sectors the differences also appeared. Industry outlined greater dynamics. The increase of labour intensity in industry is within 29%, however in value it is almost insignificant. Production grows from BGN 1.3 in 2000 to BGN 1.6 in 2003 per every 100 hours worked i.e. by only BGN 0.34. There is no change in labour intensity in agriculture, while in services it is not significant (almost 11%). This is a result from the greater increase of hours worked, which is due to the employment growth. The hours worked in the sector increase by about 14%, as the number of employed during this period increases with the same percentage. In most of the economic activities the increased intensity does not correlate with the increase of real wage. Conclusions about this relation are made based on the evaluations for labour intensity for the period 2000-2004 only. The changes in the wage in the economic activities with relatively low remuneration (hotels and restaurants, trade, agriculture, etc.) are not connected with the change of hour labour intensity. Only in mining industry and in some industrial activities (oil processing industry) the increase of labour intensity correlates with the increase of wages. All above-mentioned provide arguments to recommend greater activity of trade unions in the social dialogue at company level. Along with the debate on remuneration and labour conditions, the social dialogue should also pay greater attention to labour organization, labour intensification and their effects on workers.
15 Authors calculations, unpublished
25
3.5. Safety and health
During the studied period 1995-2006 safety and health conditions at working place had changed significantly due to changes in economic conditions and in the system of regulation and observation of healthy and safety at work place. The changed were not in one way – the period 1990-2000 could be characterized mostly with destructive process in both directions, while in the period after 2000 some constructive signs occurred, namely: (a) safety and health conditions at working place became debated problems both at political and social level; (b) practical steps were undertaken towards more regular observation and monitoring of the events; (c) a system for assessment of health risks was introduced in practice; (d) the specialised medical offices for prevention and regular control became an important part of the whole system, since their controlling functions as an integral part of the whole system were legally announced.16
The Labour Code and the Law on Safe and Healthy Labour Conditions and the regulations under this law are the legal bases for ensuring safety and health in work. Bulgaria has introduced all EU directives in the field of labour safety and health. The system of safe labour conditions follows the logic of identifying and evaluating the risk of work. This system is legally constructed following the European standards and criteria in the field. As prescribed by the Law on Safe and Healthy Labour Conditions:
(a) The responsibilities for healthy and safety work conditions is on behalf of employers;
(b) The preventive approach should be applied regarding the risks at work place; (c) For solving the problems in the field a tripartite principle should be in force; (d) The General Labour Inspection (GLI) is obliged for the integral control over the
system; (e) Labour medicine services are built up as a relevant infrastructure for healthy and
safety work conditions.
Within these main principles a relatively good institutional frame operates for their implementation and control. The social partnership in this area is built through the collective labour bargaining and the labour conditions committees operating in the enterprises. The established labour medicine services have consulting functions for supporting the employers in planning and maintaining safe labour conditions. The General Labour Inspection reported that in 2006 the share of firms that had implemented this system was 65%, compared with 50% in 2005.17
Of course, there are some problems related to the internal control of the institutional system. The relatively high provision with legal acts (over 700 legal acts should be observed and controlled) marked some of the problems. The following of the available legislation is one of them. For example out of all violations determined by the General Labour Inspectorate in 2005 43.2% were in the field of company organization and management of safe and healthy labour conditions, 16.5% in the field of labour safety and 12.5% related to labour hygiene.
16 The detailed analyses and further political steps are available in the Report for the health of the nation in the beginning of 21 century, Ministry of Health, 2004 http/en/ncphp.government.bg/files/Docl.mz.11.2004. 17 Annual Report, 2006.
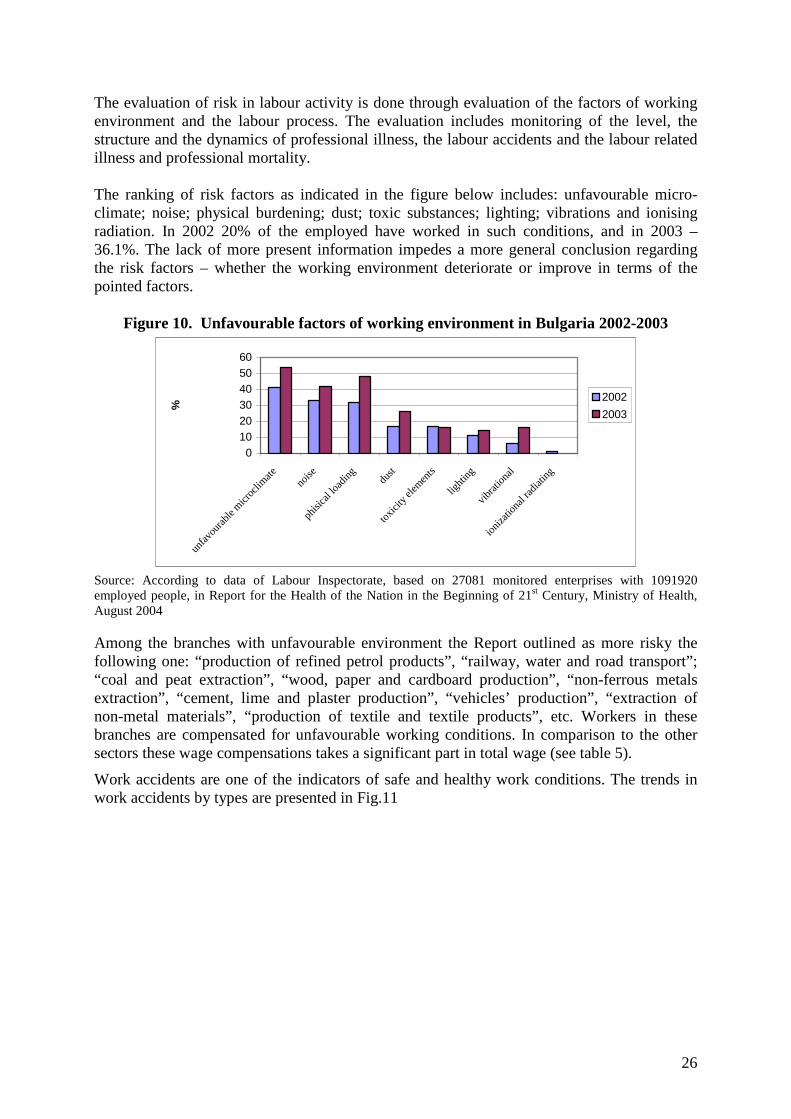
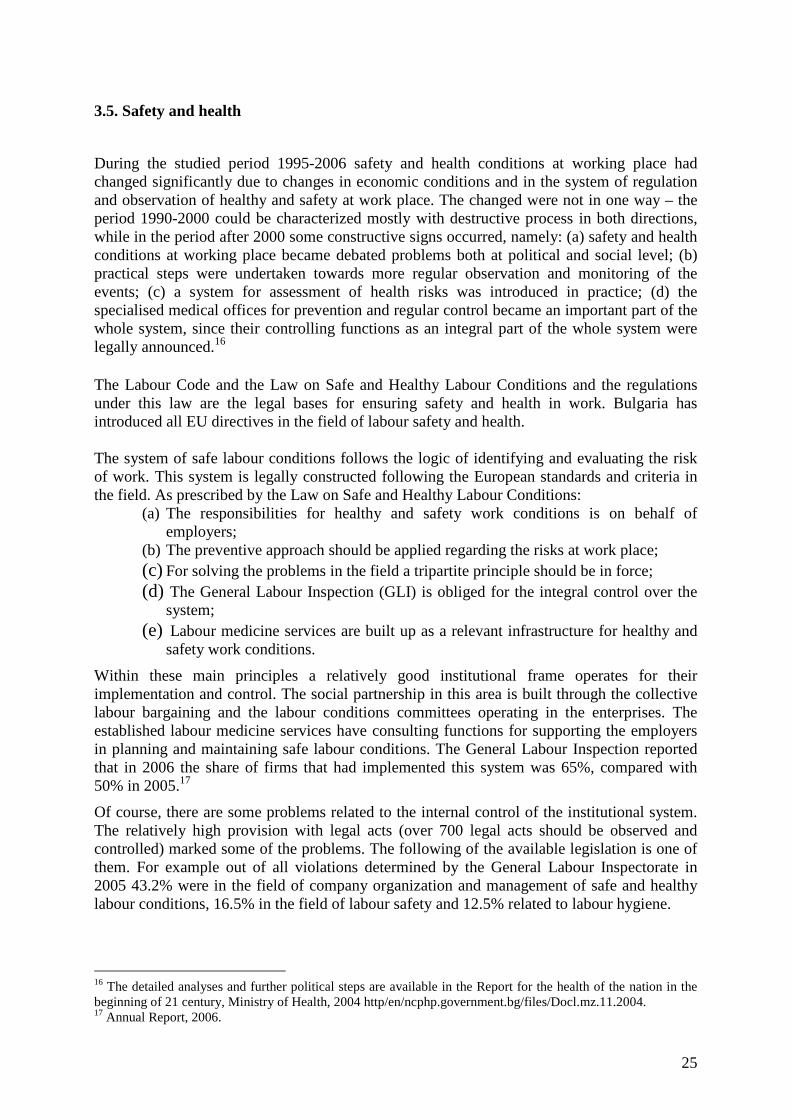
26
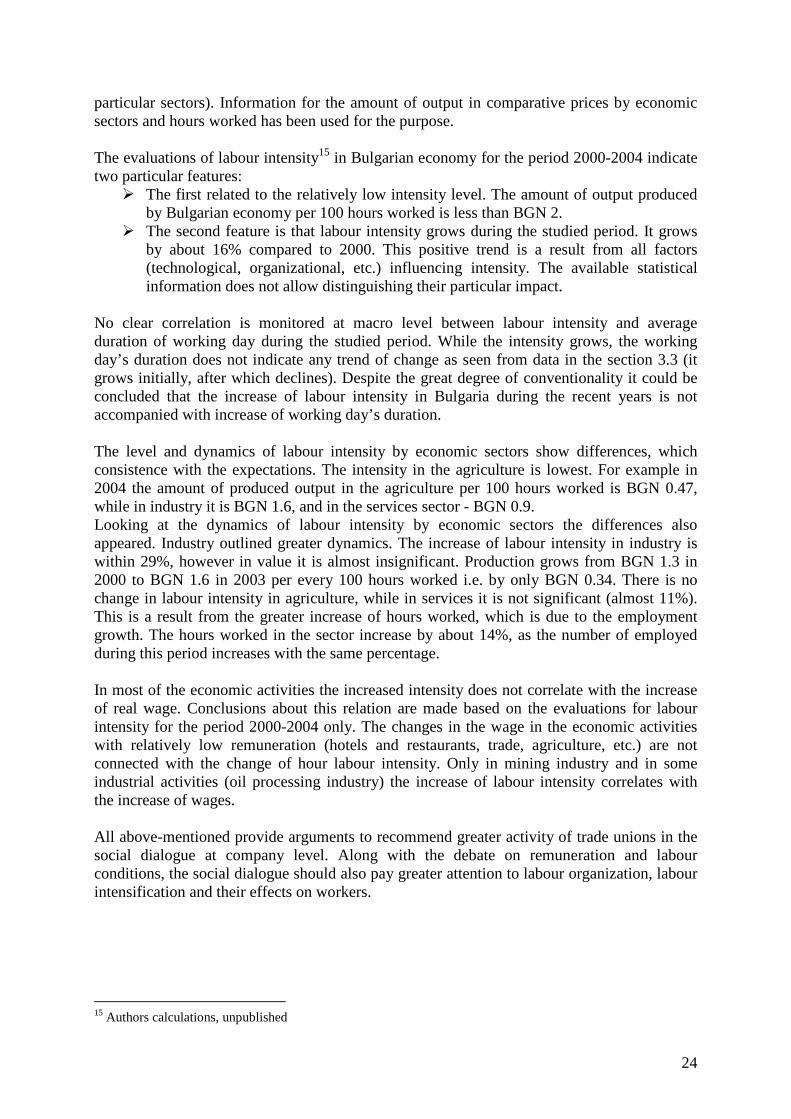
The evaluation of risk in labour activity is done through evaluation of the factors of working environment and the labour process. The evaluation includes monitoring of the level, the structure and the dynamics of professional illness, the labour accidents and the labour related illness and professional mortality. The ranking of risk factors as indicated in the figure below includes: unfavourable micro-climate; noise; physical burdening; dust; toxic substances; lighting; vibrations and ionising radiation. In 2002 20% of the employed have worked in such conditions, and in 2003 – 36.1%. The lack of more present information impedes a more general conclusion regarding the risk factors – whether the working environment deteriorate or improve in terms of the pointed factors.
Figure 10. Unfavourable factors of working environment in Bulgaria 2002-2003
0102030405060
unfa
vour
able
micr
oclim
ateno
ise
phisi
cal lo
ading du
st
toxic
ity e
lemen
ts
light
ing
vibra
tiona
l
ioniza
tiona
l radia
ting
%
2002
2003
Source: According to data of Labour Inspectorate, based on 27081 monitored enterprises with 1091920 employed people, in Report for the Health of the Nation in the Beginning of 21st Century, Ministry of Health, August 2004 Among the branches with unfavourable environment the Report outlined as more risky the following one: “production of refined petrol products”, “railway, water and road transport”; “coal and peat extraction”, “wood, paper and cardboard production”, “non-ferrous metals extraction”, “cement, lime and plaster production”, “vehicles’ production”, “extraction of non-metal materials”, “production of textile and textile products”, etc. Workers in these branches are compensated for unfavourable working conditions. In comparison to the other sectors these wage compensations takes a significant part in total wage (see table 5).
Work accidents are one of the indicators of safe and healthy work conditions. The trends in work accidents by types are presented in Fig.11
27
Figure 11. Total number of work accidents, and work accidents that caused death or disability –trends in development
0
1000
2000
3000
4000
5000
6000
7000
1995 2000 2001 2002 2003 2004 2005 2006
num
bers
Total work accidents-numbers
Work accidents that caused death or invalidization
Source: National Insurance Institute (www.noi.bg); National Register of professional Illness, Ministry of Health.
The decreasing work accidents after 2000 could be a result of many factors, among which the better organization of the control over labour conditions carried out by the units of the General Labour Inspection, should not be neglected. In 2006 the General Labour Inspection performed 36036 controls compared with 29683 in 2001 or by 21% more.
The number of working hours, lost due to work accidents, also decreased by 18% for the period 2000-2006 both for total number of accidents and accidents causing death or disability.18
Data on professional illnesses points out similar downturn trends for the period 1995-2000 with a slight increase between 2000 and 2004 and again downturn tendency since than.
Figure 12. Professional illness – numbers and per 100 000 employed people
0
500
1000
1500
2000
1995 2000 2001 2002 2003 2004 2005 2006
num
bers
0
10000
20000
30000
40000
50000
60000
professional illness - cases per100 000emp
Sources: Authors calculations based on absolute numbers of professional illness and number of employed people
The profile of professional ill people outlined as most risky groups that of miners (19.1%), drivers (18.2%), metal workers and fitters (14.6%),19 as well as people in age 45-55 years old
18 In 2000 the number of total hours lost decreased from 302578 to 247842. The number of hours lost due to accidents that caused death or disability decreased from 256704 to 208926 according to National Insurance Institute data.
28
(42.8%), followed by people aged 35-44 (30.2%) and also people with length of service between 20 and 30 years. According to the same source of information the most often cases of professional illness in 2006 were: illnesses of the locomotory system (27.7%); vegetative polyneuropathy (19.5%); silicosis, asbestosis and other pneumoconiosis (19.5%); respiratory illnesses (21.7%); neuritis of the auditory nerve (11.5).20
The risk groups regarding working conditions and workers’ health result from the branches where the people are employed. They have already been pointed, however some additional details are summarized here:
� According to data of the General Labour Inspection 44% of the workers in 2005 have worked in conditions of increasing risk for hearing deterioration. In this group the people aged 45-55 and with length of service over 10 years were particularly threatened with hearing deterioration.
� The people working in small and medium enterprises were exposed to a higher degree of risk related to noise, because no regular monitoring of working environment and elimination of health risk factors is done.
� The people working in stress in Bulgaria were 25.4% according to Eurobarometer (2002), compared to 17% for the EU25 countries. This is an important factor because it results from the high employment uncertainty at relatively high unemployment in the country. The fear from losing work determines a behaviour of compromise regarding the working conditions, working time duration and other factors that have negative impact on health. A national survey indicates that 48.3% of the people working in unfavourable conditions do this due to the lack of another alternative and 22.1% – because of better remuneration.21
� The working organization and the working atmosphere were also factors of unhealthy nature for part of the enterprises. A survey indicates that 46.6% of the employed have stressful situations due to the nature of the work itself, 33.5% determine the relations with clients as stressful; 23.7% define the relations with their colleagues as stressful; and the relations with the people with superior positions in the professional hierarchy are stressful for 35.6%.22
� The changes in labour conditions show better results for women than for men. During the period 1990-2000 the working environment for men has deteriorated in relation to the intensity of rhythm of work; increase of manual monotonous work with repeating operations; increase of painful poses in the working process; carrying of heavy burdens; increased work in vibrations; noise over the permitted level and inhalation of hazardous substances.
� Although better trends were monitored for the women by particular indicators, there is also deterioration of working conditions for this group, like increase of work’s intensity because of high rhythm of work, carrying heavy burdens, work at higher temperatures, work with hazardous substances, etc. The increase of work in weekends for the women is also greater (29.8%, compared to 16 % for the men).
19 Tzacheva, N., K. Dinkova, M. Yancheva. Occupational Environment and Workforce Health – Harmonization with European Legislation. – Archives, Balcan Medical Union, vol. 42, 2007, 4, p. 197-203. 20 I.e. 21 Working Time, Labour Conditions and Demographic Behaviour. 22 Changes in the Working Conditions and the Demographic Behaviour in Bulgaria. – In: Working Time and Labour Conditions, University of National and World Economy, Sofia, 2005, p. 158.
29
� Having breaks during work was not monitored – 44% of women and 40% of men declare that they work without breaks during work according to the pointed national survey.23
� The prophylaxis of illnesses, which is part of the commitments of employers, was very reduced. According to the cited survey on labour conditions and working time during the last three years almost half of the interviewed (48.5%) have not passed any prophylactic examination, 28.1% have done it only once and 12.1% – twice. Only 6.2% of the employed have been examined over three times.
The Bulgaria OSH monitoring system includes registration of accidents and diseases and annual reporting as well as three months activity accounts of the GLI. The data are grouped in sectors, branches and regions.24 Every year the inspections cover representative parts of all the sectors and branches and different sized economic operators. During recent years special attention is being turned to the small and medium size enterprises. The data of those subjected to controls are being compiled in files. Check-ups are made in connection with complaints and signals from citizens.
The staff of the GLI numbers 389 people in 2006. During the year these people realized 36036 controls in 29291 enterprises with 1 233823 employees (691034 man and 542789 women). The number of registered offenders was 212116 or by 8% more compared with 2005. Nearly 74% of the registered offenders were linked to safe working conditions.25:
In conclusion it could be summarized that:
� The progress in healthy and safety work conditions in Bulgaria has been closely linked to macroeconomic prospect. The economic bloom after 2000 resulted in positive trends in some of the indicators, presenting safety and healthy work conditions.
� The international firms operating in the country transfer good practices in this field and positively influence the process of improvement of this element of working conditions.
� The implemented policy of prevention is based on joint efforts of all stakeholders on tripartite principle.
� However, the economic environment still contains a number of risks for employed people. These risks come from a number of objective and subjective factors, e.g. origin of technology, intensity of work organization, way of conciliation of family and work life, etc.
� The more strict control of the GLI could be outlined as a factor for bettering the working environment.
3.6. Access to training
After a number of years of neglecting training as an element of decent work and a major factor for increasing the competitiveness of the economy, presently the problems of training, e.g. vocational training and matching supply and demand of skilled labour, continuing
23 Ibid, p. 184 24 Data files for the companies are prepared and supported, covering the inspections, findings, prescriptions and recommendations and for other measures attempted and penalties levied. Source of the data is the total GLI activity. 25 Annual Report of GLI, 2006, http://git.mlsp.government.bg/
30
training of employed people, re-training, training of unemployed people, integration of inactive people through relevant training and education, etc., are in the agenda of the policy-makers and in the focus of social debates.
The present attention of the society and the policy-makers on the discussed topic is a result of the accumulated problems in the area of education and vocation training that caused social tension and economic losses.26
Looking on the legal frame of vocational (VT) and continuing vocational training (CVT) in particular, it could be considered that this frame is almost complete.27 There are number of documents of the Council of Ministers, e.g. National Strategic Reference Framework Republic of Bulgaria, 2007-2013; Operational Program “Human Capital Development: 2007-2013”; Employment Strategy 2004-2010; National Strategy for Continuing Vocational Training 2005-2010; Life-long Learning Strategy, Social Inclusion Strategy, etc., which deal with this issue. There are also Annual Action Plans that supplement the pointed strategic documents. In all these documents the politicians shared the understanding of the need of consistent policies and respective measures to encourage employers to invest in human capital and stimulate employees to be active in education and training.
The institutional frame quite clearly subordinates the interest of the state, the social partners and the society. It includes institutions at national, regional and local level. The social partnership is an integral element of the whole system presented also at all levels. The National Agency of CVT is the institution in charge of the coordination of activities between all stakeholders. There is well-developed national set of centres for professional education including 295 centres and 183 sub-centres. Some of the challenges the system has to improve concern its coordination, information, monitoring and assessment of its effectiveness.
When analysing the problems concerning access to training we have to mention that our conclusions are based on several studies, performed by the National Statistical Institute in 2005.28 The sample of the survey includes 3795 enterprises of all 53060, with 1744 thousand employees and is representative for the country. Another source of information is the Annual Report of the National Employment Agency; it refers to the training of unemployed and inactive people mainly, but also training of employed to extend, to which employers participate in such training programmes.
Data points out that the participation of the Bulgarian population in life-long learning is quite modest – in 2003 only 16% of population aged 25-65 had participated in any form of learning (formal, informal or on its own).29 In numbers this means about 1288 thousand people, which is 19.6% of the population of the country. The majority of these people, 1039 thousand, did that on their own by reading books, on internet, by listening to TV education programs, etc.
The share of enterprises that had organized CVT for their employees was 11.5% of total number of observed enterprises in 2004, while in 2002 it was 14.5%, and in 1999 – 16.5%. Enterprises with higher number of employed people were more inclined to organize CVT.
26 E.g. in September 2007 there was a strike of teachers, which continued for 33 days of very hard negotiations with the Government. 27 National Strategic Reference Framework Republic of Bulgaria, For the Programming period 2007-2013, Council of Ministers, 2007, p, 29; http://www: government.bg. 28 This survey was based on Eurostat methodology and was a continuation of another survey, performed in 2000 and 2003 under Phare project CVTS2 – Continuing Vocational Training Survey. 29 LFS, Module Life-long Learning, 2003, National Statistical Institute.
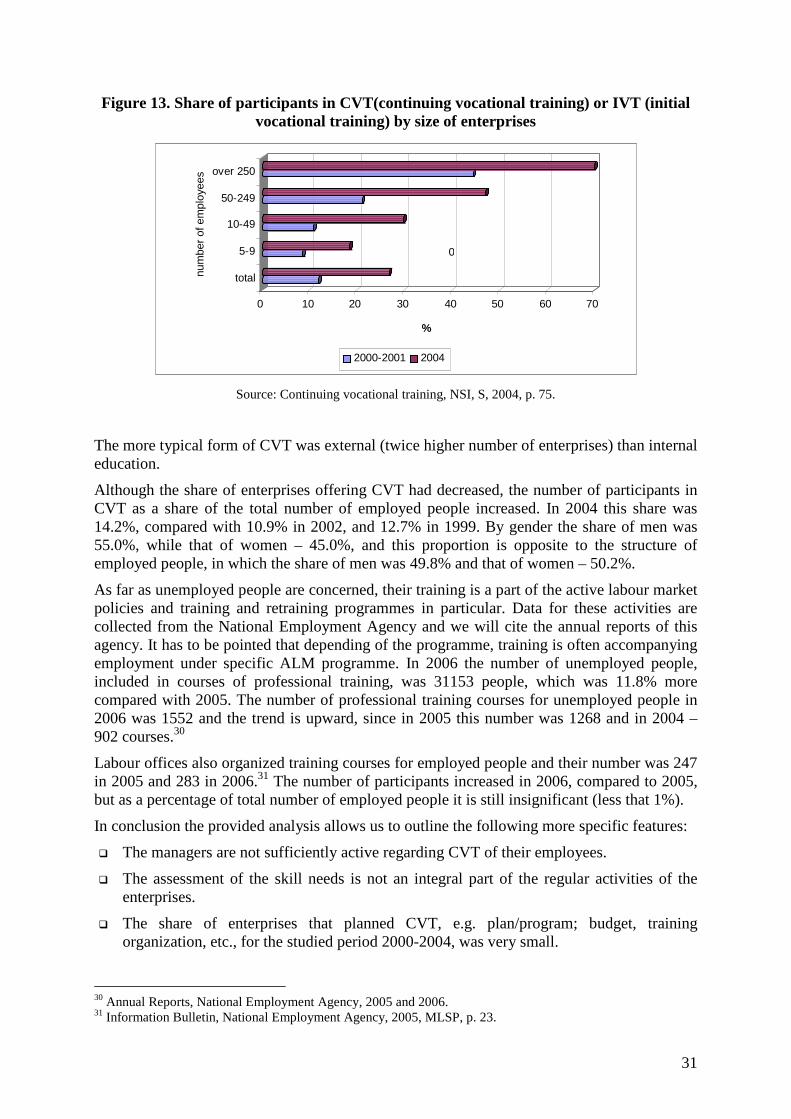
31
Figure 13. Share of participants in CVT(continuing vocational training) or IVT (initial vocational training) by size of enterprises
0 10 20 30 40 50 60 70
%
total
5-9
10-49
50-249
over 250
num
ber
of e
mpl
oyee
s
2000-2001 2004
0
Source: Continuing vocational training, NSI, S, 2004, p. 75.
The more typical form of CVT was external (twice higher number of enterprises) than internal education.
Although the share of enterprises offering CVT had decreased, the number of participants in CVT as a share of the total number of employed people increased. In 2004 this share was 14.2%, compared with 10.9% in 2002, and 12.7% in 1999. By gender the share of men was 55.0%, while that of women – 45.0%, and this proportion is opposite to the structure of employed people, in which the share of men was 49.8% and that of women – 50.2%.
As far as unemployed people are concerned, their training is a part of the active labour market policies and training and retraining programmes in particular. Data for these activities are collected from the National Employment Agency and we will cite the annual reports of this agency. It has to be pointed that depending of the programme, training is often accompanying employment under specific ALM programme. In 2006 the number of unemployed people, included in courses of professional training, was 31153 people, which was 11.8% more compared with 2005. The number of professional training courses for unemployed people in 2006 was 1552 and the trend is upward, since in 2005 this number was 1268 and in 2004 – 902 courses.30
Labour offices also organized training courses for employed people and their number was 247 in 2005 and 283 in 2006.31 The number of participants increased in 2006, compared to 2005, but as a percentage of total number of employed people it is still insignificant (less that 1%).
In conclusion the provided analysis allows us to outline the following more specific features:
� The managers are not sufficiently active regarding CVT of their employees.
� The assessment of the skill needs is not an integral part of the regular activities of the enterprises.
� The share of enterprises that planned CVT, e.g. plan/program; budget, training organization, etc., for the studied period 2000-2004, was very small.
30 Annual Reports, National Employment Agency, 2005 and 2006. 31 Information Bulletin, National Employment Agency, 2005, MLSP, p. 23.
32
� Employers prefer to engage people with the requested qualification instead of qualifying people by different forms of CVT.
� The share of people, who pass CVT, increases but the length of the training decreases.
� Employers preferred to organize on-the-job-training as a more inexpensive form of training.
� The training costs had increased insignificantly for the studied period.
� Employers’ preferences regarding the form of CVT are directed to external organizations instead of organizing their own training centres.
3.7. Social dialogue and workers’ participation The system of modern industrial relations in Bulgaria was established in the beginning of 90s and it assumed legal form with the amendments of the Labour Code in 2003. The introduction of collective bargaining approximated the form and contents of industrial relations to those in the developed market economies. The type of industrial relations in Bulgaria and respectively the bargaining system have specifics features, which distinguish it from the traditional understanding for centralized and decentralized system. It could be defined as national-centralized type. The main characteristic features32 indicate that it is not typically centralized because there is no clear strong coordination and subordination between levels33. On the other hand the existence of national level makes it different from the decentralized system. The particular bargaining levels have different degree of development. Branch bargaining is the least developed level. The system practically operates at national and company level. The consulting character of bargaining at national level and the prevailing bargaining at company level approximate the operation of the system of industrial relations to that of a decentralized system. There are no developed alternative forms of workers’ participations in Bulgaria such as works councils. Bulgaria as a new EU member state is obliged to harmonize labour legislation with respect to the EU recommendations and Directives on this topic. The public debate on this issue is focus on questions concerning the rights and duties of trade unions and work councils, the interactions between them, and the levels and places of establishment of work councils. Employers and trade unions point of view differ. Employer’s opinion is to create work councils elsewhere where it is possible and to have equal competence in the social dialog as the syndicate’s organizations. Trade unions express view of limited establishment of work councils at enterprise level (in those firms where there is no syndicate representation). Also they want to specify in labour legislation the areas of competence and interaction with trade unions. The degree of coverage is an important characteristic feature of the bargaining system, which has considerable impact on the labour market. Two indicators for measuring it are used. The first indicator is the relative share of trade union members in the total number of workers. This indicator measures the degree of trade unionisation of workers. The second indicator is the relative share of workers covered by collective bargaining. It answers the question
32 For detailed description please see Beleva, I., Tzanov, V. “Labour market flexibility and employment security, Bulgaria, Employment paper, 2001/30, ILO, Geneva, pp. 47-49. 33 The observation of the agreements regarding minimum wage makes exception. Minimum wage is obligatory as minimum limit for the lowest levels. The agreements for the parameters of the mechanism for additional taxation of funds for wages had the same effect
33
regarding the part of the employees whose working conditions (wage, working time, etc.) are determined by collective bargaining. The more workers are covered by the collective bargaining system, the greater is its influence over the main parameters of the labour market and respectively its flexibility. The evaluation of the degree of trade unionisation of workers in Bulgaria has decreasing trend. The share of trade union members in the total number of workers declined from 82.5% in 1990 to 24.8% in 2003. According to a survey of ILO34, carried out in 1995, the relative share of trade union members in the total number of workers working on labour contracts in Bulgaria is 58.2%. A labour market survey35 performed in 1996 in Bulgaria provides a similar evaluation. According to the received results collective bargaining is performed in about 56% of the companies. The percentage of workers covered by collective labour bargaining is near 38%. There is no information about the dynamics of this indicator. The collective bargaining in Bulgaria covers all workers in the state sector no matter of their trade union affiliation. This is due to the fact that the law allows the bargaining to spread also over the non-trade union members in the institution. Collective bargaining is not widely spread in the private sector. It exists mostly in the large companies where the trade union organizations have been preserved after the privatisation. The practice indicates that there are no trade union organizations in the newly established medium and large companies. The limited extension of collective bargaining in the private sector to a high degree is due to another circumstance – the prevailing number of small enterprises in Bulgarian economy. Because most of the small companies have maximum 5-6 workers it is impossible to establish trade union organizations in them. The collective bargaining in Bulgaria and particularly the negotiation of wage and working conditions are done mainly at company level. At national level the minimum wage is the subject of negotiation in the field of labour remuneration. An important feature of the issues negotiated at national level is that they do not have direct impact on the amount of wages contracted at company level. The branch bargaining of wage and the signing of branch labour contracts started in the second half of 90s. In 2006 in action are 10 sector agreements (Education, Construction, Transport, Culture, etc.) and 59 branch agreements. System for collective negotiation in Bulgaria is characterized by relatively low degree of coordination between the separate levels. It concerns not only the vertical, but also the horizontal coordination. There are several arguments for this estimate. First, the consultations at national level do not include negotiations on the wages size or dynamics, which to become advisable or compulsory for the lower levels. Second, no generally accepted (pilot) model of negotiating at key branch or industry level exists, which could be used as a model at lower levels. Third, the state intervention in defining wages decrease after removal of the limitation on increase of wages in the public sector. At the enterprise level, which is prevailing in the country, negotiation is between employers and trade unions, i.e. there is no state participation in the process of negotiations. «Pact on economic and social development of the Republic of Bulgaria up to 2009» signed by the social partners in 2005 would lead to considerable strengthening of the vertical 34 Pekka, Aro, P. Repo, Trade Union Experience in Collective Bargaining in Central Europe, Geneva, 1997. 35 The survey covers 309 companies of all economic branches.
34
coordination. According to the Pact, the recommended rate of wages, based on inflation, labour productivity and another macro-economic indicators, has to be defined at national level. Similar to the vertical, the horizontal coordination is at low level also. There are no connection and interactions existing between the collective negotiating in separate organizations at a given level. Negotiations between the social partners at company or branch level are independent and decisions taken, on the wages size or working conditions, are not interrelated. The social dialog does not have strong effect on wages. This finding is confirmed by two facts. The first fact concerns the low protection of real wages against inflation. The real wages declined significantly in the entire period. The insufficient connection of wage with productivity is the main problem of bargaining. In the state sector this is due to a great extent to the application of regulatory mechanisms, which are insufficiently related to production results. A greater correspondence of wages to labour productivity has been achieved in the private sector. The second fact concerns the low-income protection of employed at minimum wage despite the increase during the last few years. Till 2003 the amount of minimum wage changed within 35-38% of the average wage, which is a relatively low percentage compared to the developed European countries. Besides this in most companies the minimum wage is negotiated at national level despite the organization’s financial capacity. This low level of remuneration of the low-qualified workers implies greater uncertainty of the working places and greater possibility for substituting these workers with external ones. The protection of existing jobs and employment at enterprise level takes mainly two forms: administrative unpaid leaves and part-time employment. These forms of worker’s security (particularly the first) are not a common practice in the collective bargaining and uncommonly have been included in the collective contracts. They are implemented particularly when the enterprises fell in a deep production and financial crisis. In these cases the social partners negotiated and agreed about the measures for avoiding job reduction and dismissal of the staff. Most of agreements include one of above forms of protections or both. The problems of income security and compensation of lost income of redundant workers take place mainly in collective bargaining at enterprise level. The social partners negotiated the following groups of issues: the size of compensation for determinate labour contracts and social assistance of redundant workers. The minimum size of redundancy compensation is regulated by the Labour Code and is fixed at the level of one monthly wage. Usually the social partners negotiated bigger size of compensation. It depends on many factors and circumstances. In practice there are great disparities in the negotiated levels of redundancy compensations. They vary from 1 to 6 monthly wages. For administrative workers one or two monthly wage compensation prevail. The other topic of negotiation at enterprise level is the coverage of social services for redundant workers. They have equal rights and entrance to social services as the other workers in many cases. The main conclusions about the role of social dialogue for the labour conditions could be summarized as follows:
35
• Workers’ participation in the social dialog is represented only by trade unions. The legislative and practical steps taken to develop an alternative form of participation such as work councils should be intensified.
• There is a relatively low degree of unionisation, coverage and coordination in the social dialog. The number of trade union members significantly decreases during the period of transition. The collective bargaining cover over one third of the workers. There is an agreement between the social partners to strengthen the vertical coordination;
• The bargaining problems are at company level. The trade unions are not in a position to cause effective pressure for improving the working conditions (including labour remuneration). They cannot manage to negotiate such wages that correspond to the labour productivity;
• There is need for intensifying the social dialogue at branch level and for expanding the trade union influence in the low-remuneration sectors. The establishment of trade union organizations in these sectors will improve the labour conditions and the remuneration for the workers. 3.8. Social protection coverage Bulgarian social protection system can be define as wide range of measures, benefits and services aimed to replacing the lost primary income, improving the living conditions and to guarantee the minimum income standard for family and persons who are not in condition to ensure the sufficient living standard with own resources. The social protection activities are in respect to old age, disability, sickness and health, unemployment, maternity, housing, family, children and social exclusion. Bulgarian social protection model is in process of improvement. The efforts are aimed to building up a stable and efficient social protection system harmonized with European legislation, policy and social practice. Social protection interventions in Bulgaria are delivered through public and private channels. Public interventions are realized by two systems: social insurance system and social assistance system. Private type provisions are payments by employer for sickness, child allowances, maternity, etc. The other view at social protection interventions is social insurance, universal benefits and social assistance. Social insurance incorporates pensions and unemployment benefits. Pension system has been reformed during the last 10 years. The reform can be seen in creation of the 3-pillar pension model36, including not only the pillar covering the expenses, but capital type of voluntary and compulsory insurance also. The system provides almost full coverage of the population at pension age. Unemployment benefits have insurance character and include unemployed who have been subject to obligatory insurance for all insured social risks.
36 First pillar: compulsory, covering the expenses. Includes pensions paid by funds, financed with social contributions and/or state budget transfers. Administered by the National Insurance Institute. Second pillar: supplementary, compulsory, covering the capital. Includes pensions paid from resources gathered at universal and/or professional pension insurance funds, managed by licensed pension-insurance companies. Financing is provided from employers and employees social insurance contributions. Third pillar: supplementary, voluntary, covering the capital. Includes pensions paid from resources gathered at voluntary pension insurance funds, managed by licensed pension-insurance companies. Financing is provided from social insurance contributions agreed between the parties. It consists of schemes, based on collective labour agreements and schemes based on person’s individual will.
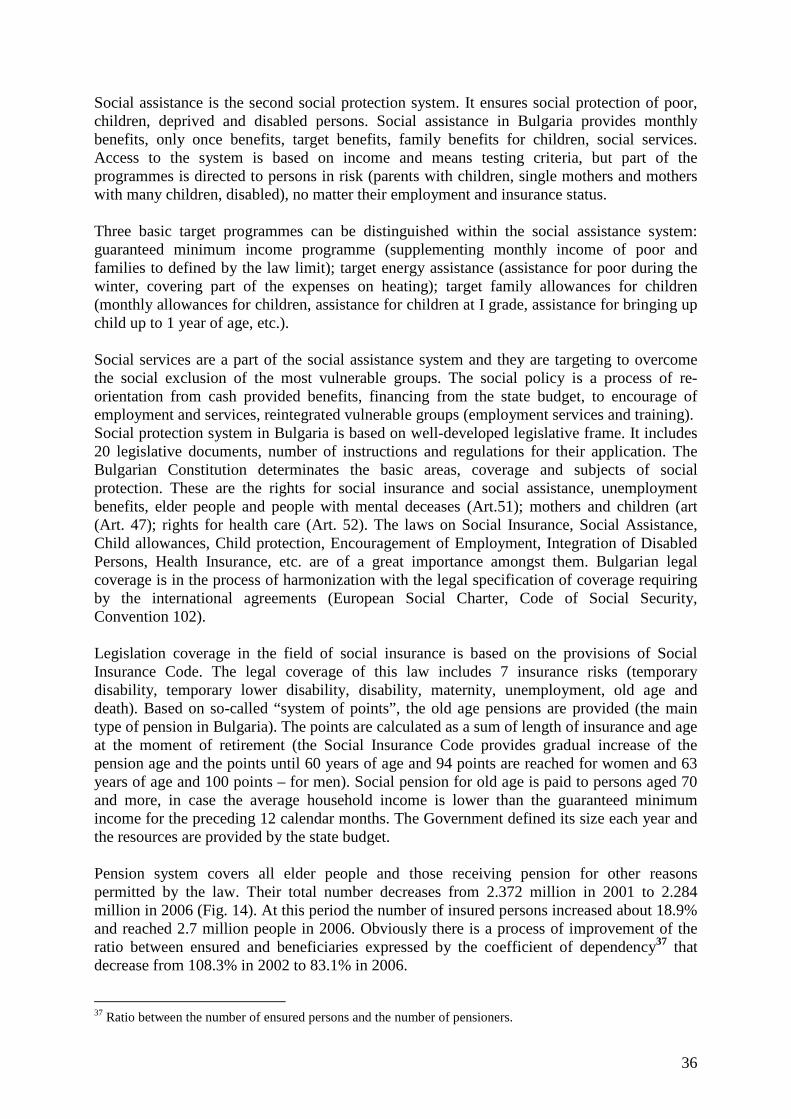
36
Social assistance is the second social protection system. It ensures social protection of poor, children, deprived and disabled persons. Social assistance in Bulgaria provides monthly benefits, only once benefits, target benefits, family benefits for children, social services. Access to the system is based on income and means testing criteria, but part of the programmes is directed to persons in risk (parents with children, single mothers and mothers with many children, disabled), no matter their employment and insurance status. Three basic target programmes can be distinguished within the social assistance system: guaranteed minimum income programme (supplementing monthly income of poor and families to defined by the law limit); target energy assistance (assistance for poor during the winter, covering part of the expenses on heating); target family allowances for children (monthly allowances for children, assistance for children at I grade, assistance for bringing up child up to 1 year of age, etc.). Social services are a part of the social assistance system and they are targeting to overcome the social exclusion of the most vulnerable groups. The social policy is a process of re-orientation from cash provided benefits, financing from the state budget, to encourage of employment and services, reintegrated vulnerable groups (employment services and training). Social protection system in Bulgaria is based on well-developed legislative frame. It includes 20 legislative documents, number of instructions and regulations for their application. The Bulgarian Constitution determinates the basic areas, coverage and subjects of social protection. These are the rights for social insurance and social assistance, unemployment benefits, elder people and people with mental deceases (Art.51); mothers and children (art (Art. 47); rights for health care (Art. 52). The laws on Social Insurance, Social Assistance, Child allowances, Child protection, Encouragement of Employment, Integration of Disabled Persons, Health Insurance, etc. are of a great importance amongst them. Bulgarian legal coverage is in the process of harmonization with the legal specification of coverage requiring by the international agreements (European Social Charter, Code of Social Security, Convention 102). Legislation coverage in the field of social insurance is based on the provisions of Social Insurance Code. The legal coverage of this law includes 7 insurance risks (temporary disability, temporary lower disability, disability, maternity, unemployment, old age and death). Based on so-called “system of points”, the old age pensions are provided (the main type of pension in Bulgaria). The points are calculated as a sum of length of insurance and age at the moment of retirement (the Social Insurance Code provides gradual increase of the pension age and the points until 60 years of age and 94 points are reached for women and 63 years of age and 100 points – for men). Social pension for old age is paid to persons aged 70 and more, in case the average household income is lower than the guaranteed minimum income for the preceding 12 calendar months. The Government defined its size each year and the resources are provided by the state budget. Pension system covers all elder people and those receiving pension for other reasons permitted by the law. Their total number decreases from 2.372 million in 2001 to 2.284 million in 2006 (Fig. 14). At this period the number of insured persons increased about 18.9% and reached 2.7 million people in 2006. Obviously there is a process of improvement of the ratio between ensured and beneficiaries expressed by the coefficient of dependency37 that decrease from 108.3% in 2002 to 83.1% in 2006.
37 Ratio between the number of ensured persons and the number of pensioners.
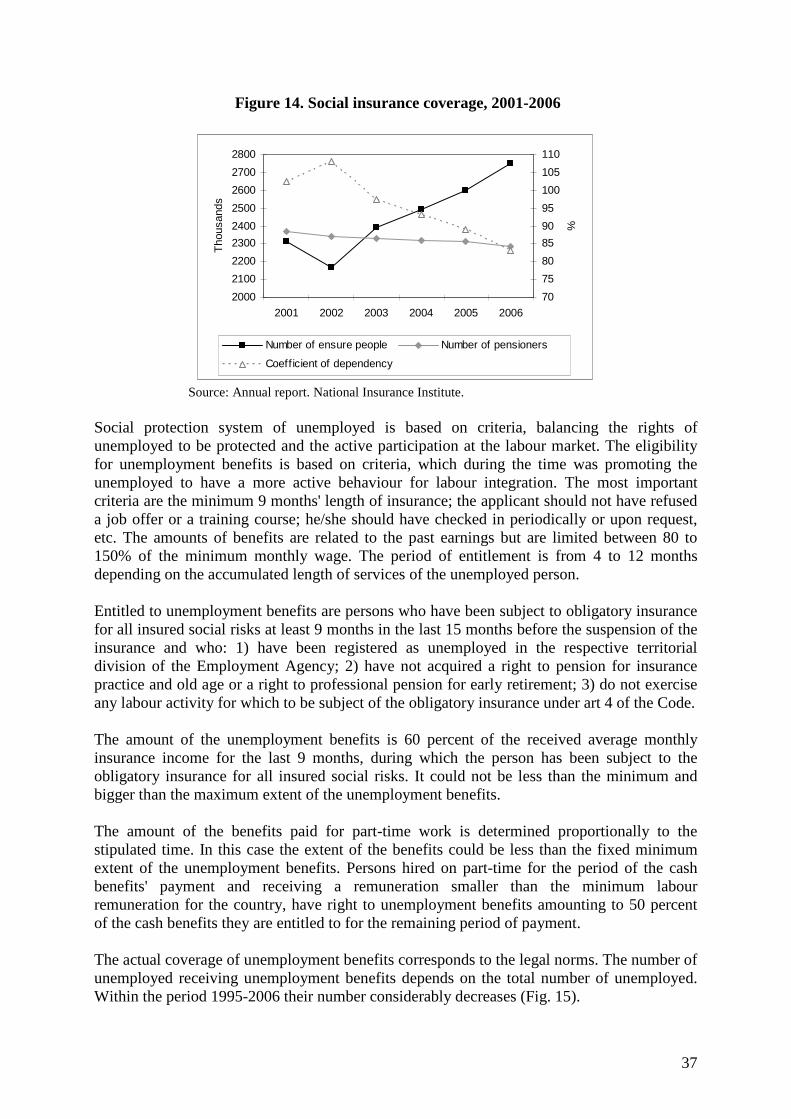
37
Figure 14. Social insurance coverage, 2001-2006
2000
2100
2200
2300
2400
2500
2600
2700
2800
2001 2002 2003 2004 2005 2006
Tho
usan
ds
70
75
80
85
90
95
100
105
110
%
Number of ensure people Number of pensioners
Coefficient of dependency
Source: Annual report. National Insurance Institute.
Social protection system of unemployed is based on criteria, balancing the rights of unemployed to be protected and the active participation at the labour market. The eligibility for unemployment benefits is based on criteria, which during the time was promoting the unemployed to have a more active behaviour for labour integration. The most important criteria are the minimum 9 months' length of insurance; the applicant should not have refused a job offer or a training course; he/she should have checked in periodically or upon request, etc. The amounts of benefits are related to the past earnings but are limited between 80 to 150% of the minimum monthly wage. The period of entitlement is from 4 to 12 months depending on the accumulated length of services of the unemployed person. Entitled to unemployment benefits are persons who have been subject to obligatory insurance for all insured social risks at least 9 months in the last 15 months before the suspension of the insurance and who: 1) have been registered as unemployed in the respective territorial division of the Employment Agency; 2) have not acquired a right to pension for insurance practice and old age or a right to professional pension for early retirement; 3) do not exercise any labour activity for which to be subject of the obligatory insurance under art 4 of the Code. The amount of the unemployment benefits is 60 percent of the received average monthly insurance income for the last 9 months, during which the person has been subject to the obligatory insurance for all insured social risks. It could not be less than the minimum and bigger than the maximum extent of the unemployment benefits. The amount of the benefits paid for part-time work is determined proportionally to the stipulated time. In this case the extent of the benefits could be less than the fixed minimum extent of the unemployment benefits. Persons hired on part-time for the period of the cash benefits' payment and receiving a remuneration smaller than the minimum labour remuneration for the country, have right to unemployment benefits amounting to 50 percent of the cash benefits they are entitled to for the remaining period of payment. The actual coverage of unemployment benefits corresponds to the legal norms. The number of unemployed receiving unemployment benefits depends on the total number of unemployed. Within the period 1995-2006 their number considerably decreases (Fig. 15).
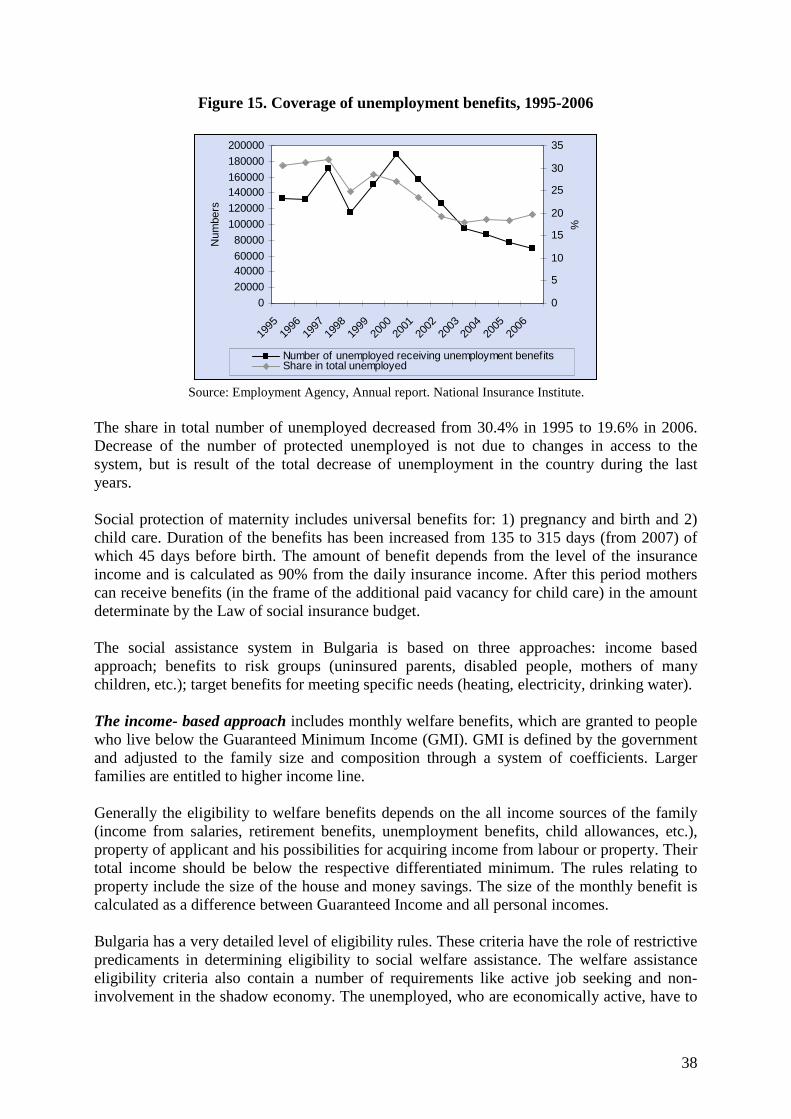
38
Figure 15. Coverage of unemployment benefits, 1995-2006
0
20000
4000060000
80000
100000
120000
140000160000
180000
200000
1995
1996
1997
1998
1999
2000
2001
2002
2003
2004
2005
2006
Num
bers
0
5
10
15
20
25
30
35
%
Number of unemployed receiving unemployment benefitsShare in total unemployed
Source: Employment Agency, Annual report. National Insurance Institute.
The share in total number of unemployed decreased from 30.4% in 1995 to 19.6% in 2006. Decrease of the number of protected unemployed is not due to changes in access to the system, but is result of the total decrease of unemployment in the country during the last years. Social protection of maternity includes universal benefits for: 1) pregnancy and birth and 2) child care. Duration of the benefits has been increased from 135 to 315 days (from 2007) of which 45 days before birth. The amount of benefit depends from the level of the insurance income and is calculated as 90% from the daily insurance income. After this period mothers can receive benefits (in the frame of the additional paid vacancy for child care) in the amount determinate by the Law of social insurance budget. The social assistance system in Bulgaria is based on three approaches: income based approach; benefits to risk groups (uninsured parents, disabled people, mothers of many children, etc.); target benefits for meeting specific needs (heating, electricity, drinking water). The income- based approach includes monthly welfare benefits, which are granted to people who live below the Guaranteed Minimum Income (GMI). GMI is defined by the government and adjusted to the family size and composition through a system of coefficients. Larger families are entitled to higher income line. Generally the eligibility to welfare benefits depends on the all income sources of the family (income from salaries, retirement benefits, unemployment benefits, child allowances, etc.), property of applicant and his possibilities for acquiring income from labour or property. Their total income should be below the respective differentiated minimum. The rules relating to property include the size of the house and money savings. The size of the monthly benefit is calculated as a difference between Guaranteed Income and all personal incomes. Bulgaria has a very detailed level of eligibility rules. These criteria have the role of restrictive predicaments in determining eligibility to social welfare assistance. The welfare assistance eligibility criteria also contain a number of requirements like active job seeking and non-involvement in the shadow economy. The unemployed, who are economically active, have to
39
be registered with the labour office as active job seekers and should not have declined a job offer from the labour office or municipality.
Benefits to people at risk are a form of social assistance that allows universal benefits, which eligibility criteria include affiliation to a specific group at risk (parents with children, single mothers and mothers with many children, disabled persons) irrespective of their employment and insurance status. Their purpose is to meet urgent needs, such as necessity for treatment abroad or shortage of funds for specific needs. The amount is determined subjectively and it is also possible for individual’ income to be used as a secondary criterion. Sometimes they are used as informal compensation as an alternative to low income benefits. Targeted energy grants were introduced in 1994 as a result of the liberalisation of the prices of energy and fuel. These grants are also disbursed following means-test criteria. The income, determining eligibility for energy grants, is higher than the GMI. It is calculated by adding the heating season (1 November - 30 April) energy rates to the Guaranteed minimum income. The eligibility criteria for families with children and for disabled persons were relieved after the introduction of higher coefficients in the calculation of the differentiated minimum income. For this reason the number of the beneficiaries is bigger than the recipients of monthly social assistance. Below this eligibility income are a large number of families with unemployed members, receiving unemployment benefits, as well as low paid working people and pensioners with low pensions.
The amount of the monthly welfare benefits and that of the energy grants is calculated as a difference between the differentiated minimum income and the other income of the household. The lower the income is, the higher the level of assistance. If the family has no other sources of income, the level of assistance is the highest possible. Families, who are eligible, but have income that is closely below the GMI are entitled to lower levels of assistance. Coverage of the first programme is not wide and a tendency of decrease is observed (number of persons and families in 2002 is about 250 thousand, in 2003 it increase to 268 thousand and decreases to 220 thousand in 2004, and to 212 thousand in 2005). The declining number of people covering by monthly social benefits is due to the improvement of their welfare situation and overall reducing the poverty. Coverage of the target energy assistance programme is wider than GMI program. The reason is easer access to this programme. The coverage of energy program has been extended by 29% in 2006 (the number of beneficiaries increased from 116 thousand in 2005 to 150 thousand in 2006). In addition to the above mention family related benefits the social assistance provide protection of the children in the families with low incomes. This protection is based on the Law of child allowances and the Law of family benefits for children. Family benefits for children include child allowances and benefits for pregnancy, birth and child care. Eligibility for such benefits has families with per capita income under a limit defined by the law. Till 2007 it was 200 BGN. Duration of the monthly child allowances and monthly benefits for childcare is until the child graduated from the secondary school but no more than 20 years old child. The number of families receiving monthly allowances for children declines from 744.1 thousand in 2005 to 728.7 thousand in 2006. Respectively the number of children covered by these programs also decline (from 1.129 million in 2005 to 1.055 million in 2006).
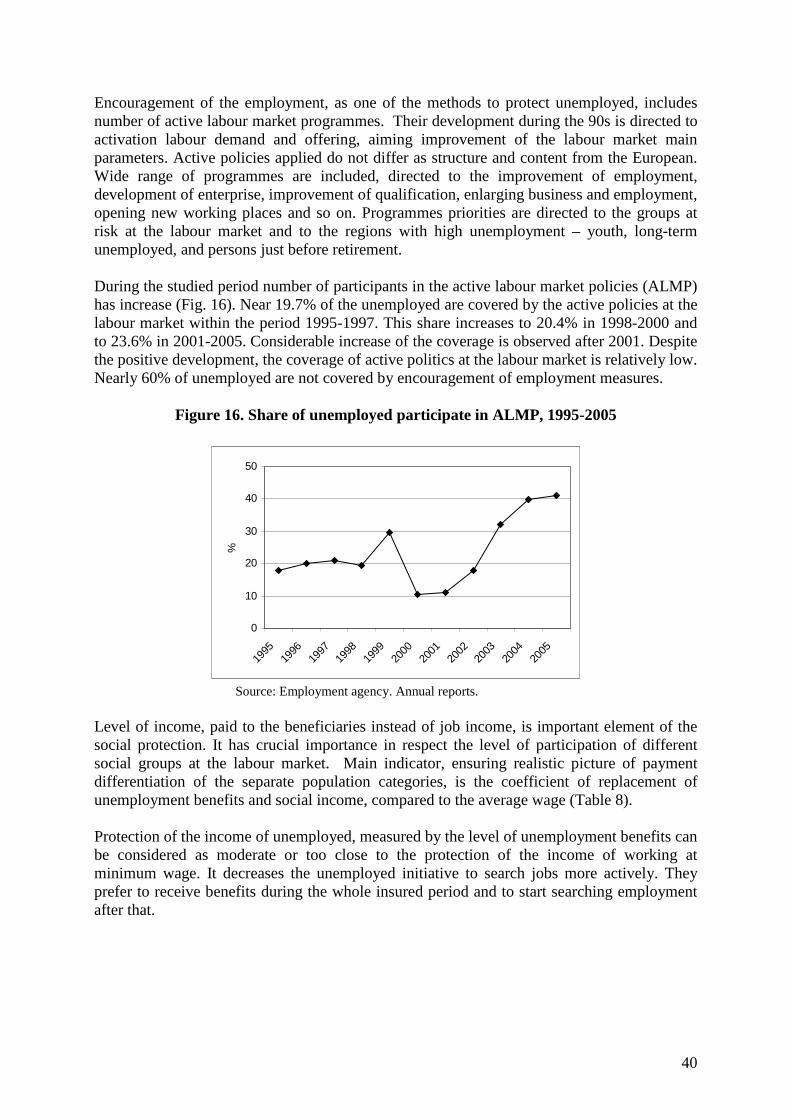
40
Encouragement of the employment, as one of the methods to protect unemployed, includes number of active labour market programmes. Their development during the 90s is directed to activation labour demand and offering, aiming improvement of the labour market main parameters. Active policies applied do not differ as structure and content from the European. Wide range of programmes are included, directed to the improvement of employment, development of enterprise, improvement of qualification, enlarging business and employment, opening new working places and so on. Programmes priorities are directed to the groups at risk at the labour market and to the regions with high unemployment – youth, long-term unemployed, and persons just before retirement. During the studied period number of participants in the active labour market policies (ALMP) has increase (Fig. 16). Near 19.7% of the unemployed are covered by the active policies at the labour market within the period 1995-1997. This share increases to 20.4% in 1998-2000 and to 23.6% in 2001-2005. Considerable increase of the coverage is observed after 2001. Despite the positive development, the coverage of active politics at the labour market is relatively low. Nearly 60% of unemployed are not covered by encouragement of employment measures.
Figure 16. Share of unemployed participate in ALMP, 1995-2005
0
10
20
30
40
50
1995
1996
1997
1998
1999
2000
2001
2002
2003
2004
2005
%
Source: Employment agency. Annual reports.
Level of income, paid to the beneficiaries instead of job income, is important element of the social protection. It has crucial importance in respect the level of participation of different social groups at the labour market. Main indicator, ensuring realistic picture of payment differentiation of the separate population categories, is the coefficient of replacement of unemployment benefits and social income, compared to the average wage (Table 8). Protection of the income of unemployed, measured by the level of unemployment benefits can be considered as moderate or too close to the protection of the income of working at minimum wage. It decreases the unemployed initiative to search jobs more actively. They prefer to receive benefits during the whole insured period and to start searching employment after that.
41
Table 8. Relationship between the minimum wage, unemployment benefits and guaranteed minimum income (GMI) and the average wage, 1992-2005 (%)
Relationships 1995 1996 1997 1998 1999 2000 2001 2002 2003 2004 2005 Unemployment benefits/Average wage
34.0 28.6 29.5 32.0 30.8 31.0 33.5 38.7 34.2 34.2 31.8
GMI/Average wage
18.7 16.4 13.6 14.9 18.6 16.6 14.9 14.7 14.1 13.7 15.3
Source: Calculated on data from Ministry of Labour and Social Policy. Protection of income of unemployed, who does not receive unemployment benefits, is low. Those people do not have regular income. Up to 2002 part of the long-term unemployed received social assistance, but these are not paid since 2003. Lowest protection of income of non-active persons is observed – persons on social assistance. Level of GMI is too low (40 BGN in 2004 and 55 BGN since 1 June 2005) and constitutes less than 1/5 of the average wage. Thus, the social assistance system cannot be considered “generous” to the pointed population category. The protection of income of non-active persons in productive age cannot be an obstacle to a higher mobility and participation at the labour market. Expenditures on passive labour market policies, as a percentage of the GDP, remain relatively low (less than 1 per cent) and change in parallel to the dynamics of number of unemployed, receiving unemployment benefits (Fig. 17). It varies, depending on newly registered unemployed fluctuations. It increases to 0.62% in 2000 in parallel to increase of the unemployment. Share of expenditure on passive politics at the labour market, as a percentage of the GDP, decreases to 0.21% in 2005. This trend is a result from the strong restrictive passive policy at the labour market in respect the access, the period of payment of unemployment benefits and allowances. Increase of the number of unemployment benefits recipients within the period 1997-2000 is a consequence of the increased number of newly registered unemployed. Expenditures on active labour market policies, measured as a percentage of the GDP, are relatively low (less than 1 per cent). They are characterized with positive trend, which means that increase during the observed period (Fig. 17). Average share of the expenditure on active policies within the period 1993-1997 is 0.16%; 1998-2000 it increases to 0.27% and for the period 2001-2005 – to 0.39%. The shares, compared to the unemployed38, are as follows: 1993-1997 – 0.012; 1998-2000 – 0.018; 2001-2003 – 0.026. The results show that more and more resources are directed to active politics at the labour market during the observed period.
38 Share of the active politics at the labour market in GDP, referred to the percentage of registered unemployed.
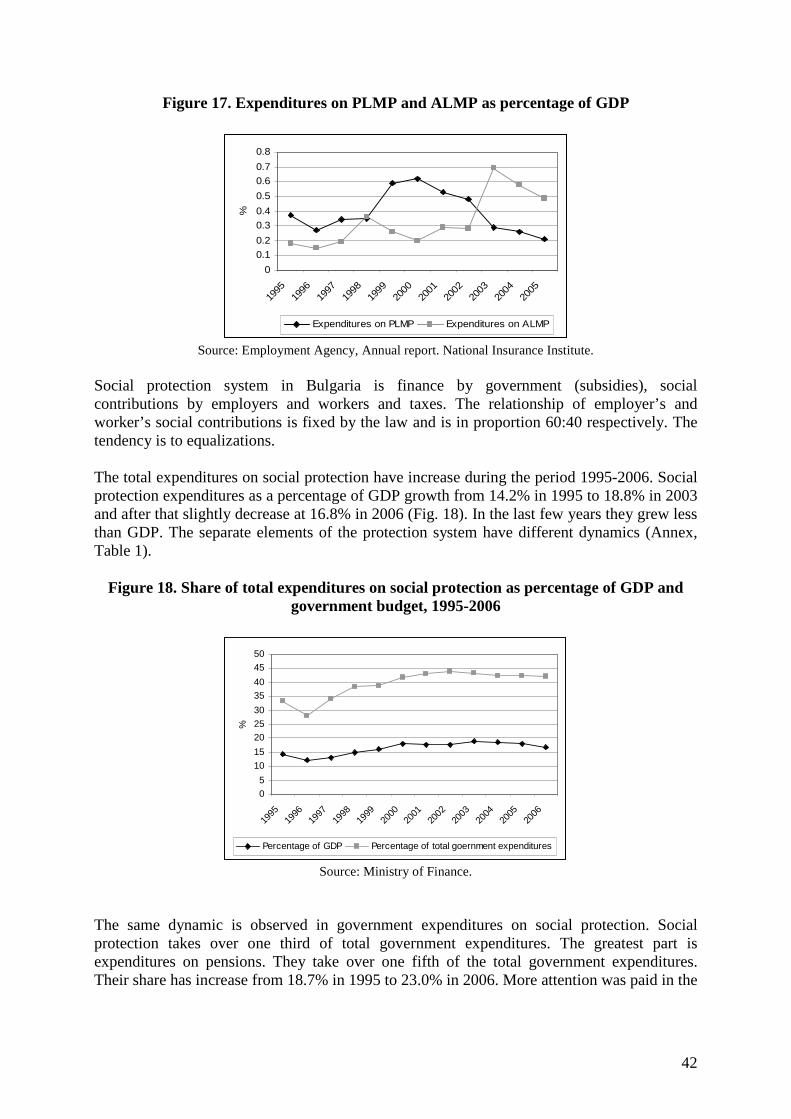
42
Figure 17. Expenditures on PLMP and ALMP as percentage of GDP
0
0.1
0.2
0.3
0.4
0.5
0.6
0.7
0.8
1995
1996
1997
1998
1999
2000
2001
2002
2003
2004
2005
%
Expenditures on PLMP Expenditures on ALMP
Source: Employment Agency, Annual report. National Insurance Institute.
Social protection system in Bulgaria is finance by government (subsidies), social contributions by employers and workers and taxes. The relationship of employer’s and worker’s social contributions is fixed by the law and is in proportion 60:40 respectively. The tendency is to equalizations. The total expenditures on social protection have increase during the period 1995-2006. Social protection expenditures as a percentage of GDP growth from 14.2% in 1995 to 18.8% in 2003 and after that slightly decrease at 16.8% in 2006 (Fig. 18). In the last few years they grew less than GDP. The separate elements of the protection system have different dynamics (Annex, Table 1).
Figure 18. Share of total expenditures on social protection as percentage of GDP and
government budget, 1995-2006
0
5
10
15
20
25
30
35
40
45
50
1995
1996
1997
1998
1999
2000
2001
2002
2003
2004
2005
2006
%
Percentage of GDP Percentage of total goernment expenditures
Source: Ministry of Finance.
The same dynamic is observed in government expenditures on social protection. Social protection takes over one third of total government expenditures. The greatest part is expenditures on pensions. They take over one fifth of the total government expenditures. Their share has increase from 18.7% in 1995 to 23.0% in 2006. More attention was paid in the
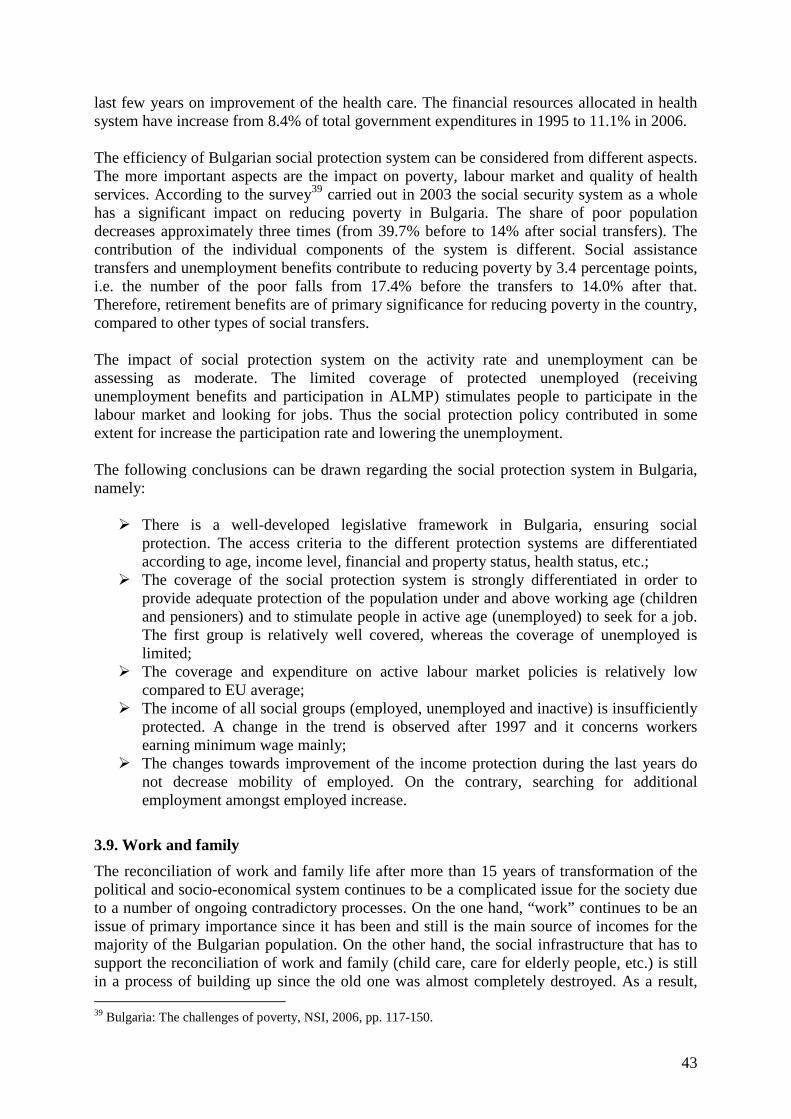
43
last few years on improvement of the health care. The financial resources allocated in health system have increase from 8.4% of total government expenditures in 1995 to 11.1% in 2006. The efficiency of Bulgarian social protection system can be considered from different aspects. The more important aspects are the impact on poverty, labour market and quality of health services. According to the survey39 carried out in 2003 the social security system as a whole has a significant impact on reducing poverty in Bulgaria. The share of poor population decreases approximately three times (from 39.7% before to 14% after social transfers). The contribution of the individual components of the system is different. Social assistance transfers and unemployment benefits contribute to reducing poverty by 3.4 percentage points, i.e. the number of the poor falls from 17.4% before the transfers to 14.0% after that. Therefore, retirement benefits are of primary significance for reducing poverty in the country, compared to other types of social transfers. The impact of social protection system on the activity rate and unemployment can be assessing as moderate. The limited coverage of protected unemployed (receiving unemployment benefits and participation in ALMP) stimulates people to participate in the labour market and looking for jobs. Thus the social protection policy contributed in some extent for increase the participation rate and lowering the unemployment. The following conclusions can be drawn regarding the social protection system in Bulgaria, namely:
� There is a well-developed legislative framework in Bulgaria, ensuring social protection. The access criteria to the different protection systems are differentiated according to age, income level, financial and property status, health status, etc.;
� The coverage of the social protection system is strongly differentiated in order to provide adequate protection of the population under and above working age (children and pensioners) and to stimulate people in active age (unemployed) to seek for a job. The first group is relatively well covered, whereas the coverage of unemployed is limited;
� The coverage and expenditure on active labour market policies is relatively low compared to EU average;
� The income of all social groups (employed, unemployed and inactive) is insufficiently protected. A change in the trend is observed after 1997 and it concerns workers earning minimum wage mainly;
� The changes towards improvement of the income protection during the last years do not decrease mobility of employed. On the contrary, searching for additional employment amongst employed increase.
3.9. Work and family
The reconciliation of work and family life after more than 15 years of transformation of the political and socio-economical system continues to be a complicated issue for the society due to a number of ongoing contradictory processes. On the one hand, “work” continues to be an issue of primary importance since it has been and still is the main source of incomes for the majority of the Bulgarian population. On the other hand, the social infrastructure that has to support the reconciliation of work and family (child care, care for elderly people, etc.) is still in a process of building up since the old one was almost completely destroyed. As a result, 39 Bulgaria: The challenges of poverty, NSI, 2006, pp. 117-150.
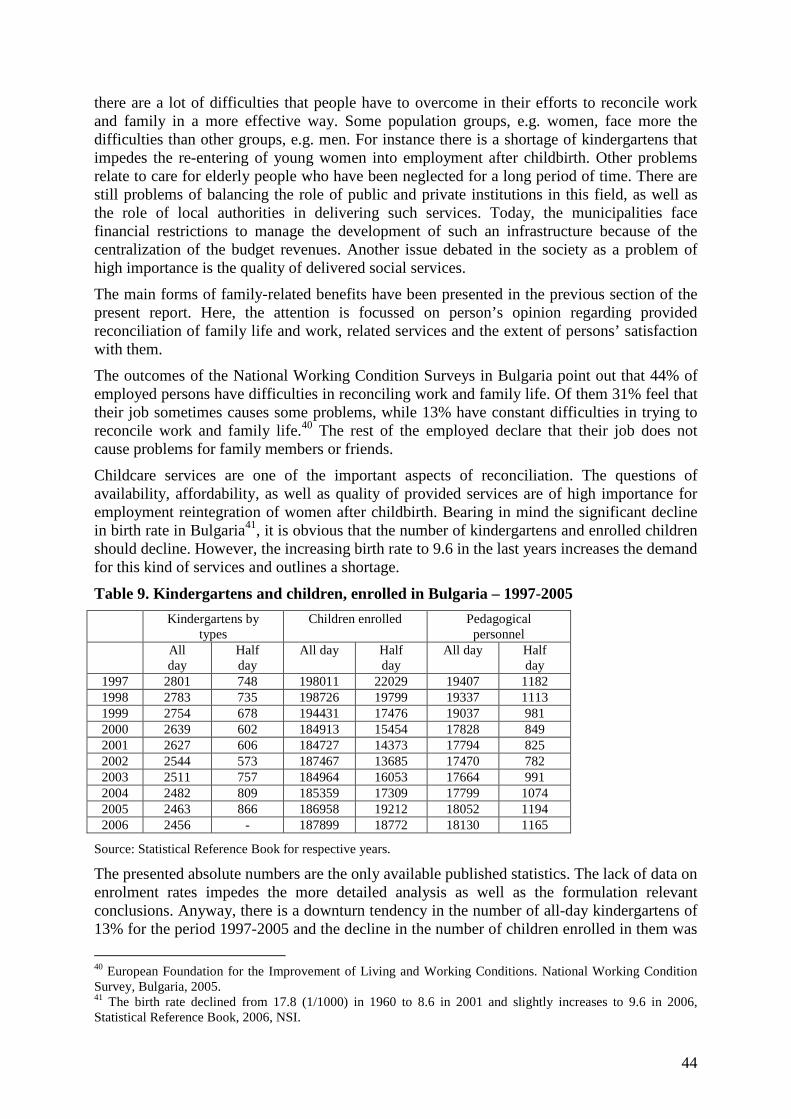
44
there are a lot of difficulties that people have to overcome in their efforts to reconcile work and family in a more effective way. Some population groups, e.g. women, face more the difficulties than other groups, e.g. men. For instance there is a shortage of kindergartens that impedes the re-entering of young women into employment after childbirth. Other problems relate to care for elderly people who have been neglected for a long period of time. There are still problems of balancing the role of public and private institutions in this field, as well as the role of local authorities in delivering such services. Today, the municipalities face financial restrictions to manage the development of such an infrastructure because of the centralization of the budget revenues. Another issue debated in the society as a problem of high importance is the quality of delivered social services.
The main forms of family-related benefits have been presented in the previous section of the present report. Here, the attention is focussed on person’s opinion regarding provided reconciliation of family life and work, related services and the extent of persons’ satisfaction with them.
The outcomes of the National Working Condition Surveys in Bulgaria point out that 44% of employed persons have difficulties in reconciling work and family life. Of them 31% feel that their job sometimes causes some problems, while 13% have constant difficulties in trying to reconcile work and family life.40 The rest of the employed declare that their job does not cause problems for family members or friends.
Childcare services are one of the important aspects of reconciliation. The questions of availability, affordability, as well as quality of provided services are of high importance for employment reintegration of women after childbirth. Bearing in mind the significant decline in birth rate in Bulgaria41, it is obvious that the number of kindergartens and enrolled children should decline. However, the increasing birth rate to 9.6 in the last years increases the demand for this kind of services and outlines a shortage.
Table 9. Kindergartens and children, enrolled in Bulgaria – 1997-2005
Kindergartens by types
Children enrolled Pedagogical personnel
All day
Half day
All day Half day
All day Half day
1997 2801 748 198011 22029 19407 1182 1998 2783 735 198726 19799 19337 1113 1999 2754 678 194431 17476 19037 981 2000 2639 602 184913 15454 17828 849 2001 2627 606 184727 14373 17794 825 2002 2544 573 187467 13685 17470 782 2003 2511 757 184964 16053 17664 991 2004 2482 809 185359 17309 17799 1074 2005 2463 866 186958 19212 18052 1194 2006 2456 - 187899 18772 18130 1165
Source: Statistical Reference Book for respective years.
The presented absolute numbers are the only available published statistics. The lack of data on enrolment rates impedes the more detailed analysis as well as the formulation relevant conclusions. Anyway, there is a downturn tendency in the number of all-day kindergartens of 13% for the period 1997-2005 and the decline in the number of children enrolled in them was
40 European Foundation for the Improvement of Living and Working Conditions. National Working Condition Survey, Bulgaria, 2005. 41 The birth rate declined from 17.8 (1/1000) in 1960 to 8.6 in 2001 and slightly increases to 9.6 in 2006, Statistical Reference Book, 2006, NSI.
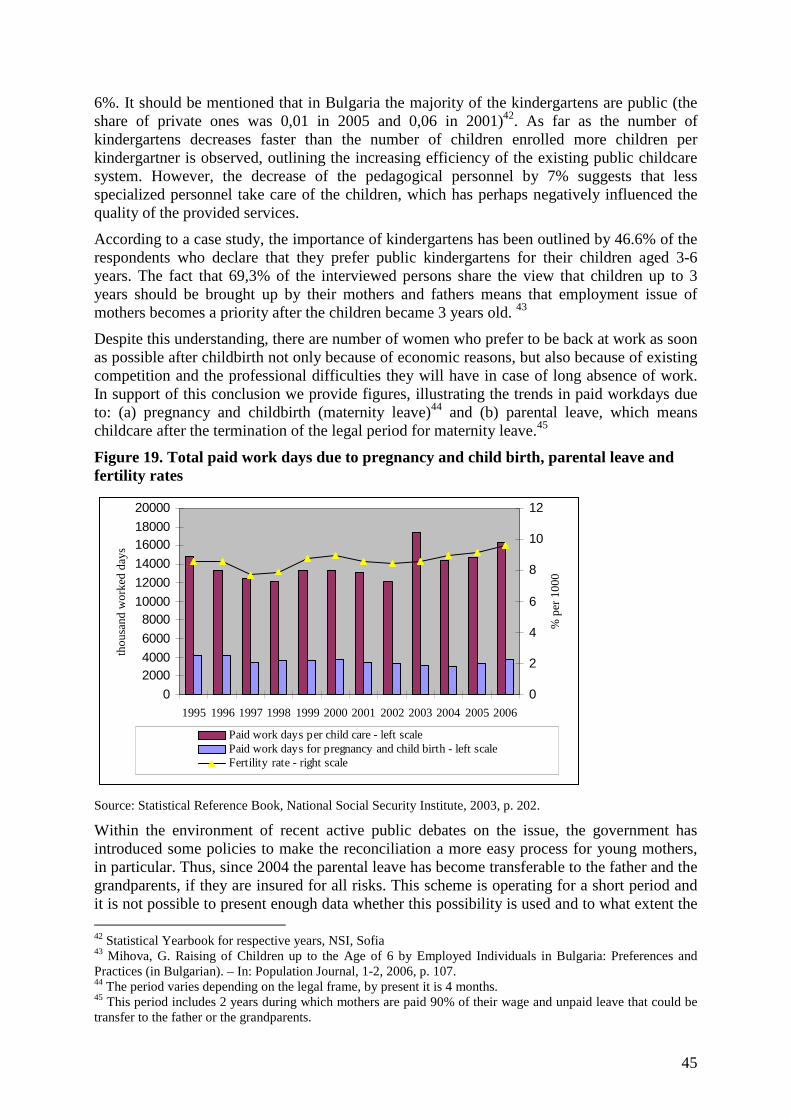
45
6%. It should be mentioned that in Bulgaria the majority of the kindergartens are public (the share of private ones was 0,01 in 2005 and 0,06 in 2001)42. As far as the number of kindergartens decreases faster than the number of children enrolled more children per kindergartner is observed, outlining the increasing efficiency of the existing public childcare system. However, the decrease of the pedagogical personnel by 7% suggests that less specialized personnel take care of the children, which has perhaps negatively influenced the quality of the provided services.
According to a case study, the importance of kindergartens has been outlined by 46.6% of the respondents who declare that they prefer public kindergartens for their children aged 3-6 years. The fact that 69,3% of the interviewed persons share the view that children up to 3 years should be brought up by their mothers and fathers means that employment issue of mothers becomes a priority after the children became 3 years old. 43
Despite this understanding, there are number of women who prefer to be back at work as soon as possible after childbirth not only because of economic reasons, but also because of existing competition and the professional difficulties they will have in case of long absence of work. In support of this conclusion we provide figures, illustrating the trends in paid workdays due to: (a) pregnancy and childbirth (maternity leave)44 and (b) parental leave, which means childcare after the termination of the legal period for maternity leave.45
Figure 19. Total paid work days due to pregnancy and child birth, parental leave and fertility rates
0
20004000
6000
800010000
12000
14000
1600018000
20000
1995 1996 1997 1998 1999 2000 2001 2002 2003 2004 2005 2006
tho
usa
nd
wo
rked
day
s
0
2
4
6
8
10
12
% p
er 1
00
0
Paid work days per child care - left scalePaid work days for pregnancy and child birth - left scaleFertility rate - right scale
Source: Statistical Reference Book, National Social Security Institute, 2003, p. 202.
Within the environment of recent active public debates on the issue, the government has introduced some policies to make the reconciliation a more easy process for young mothers, in particular. Thus, since 2004 the parental leave has become transferable to the father and the grandparents, if they are insured for all risks. This scheme is operating for a short period and it is not possible to present enough data whether this possibility is used and to what extent the 42 Statistical Yearbook for respective years, NSI, Sofia 43 Mihova, G. Raising of Children up to the Age of 6 by Employed Individuals in Bulgaria: Preferences and Practices (in Bulgarian). – In: Population Journal, 1-2, 2006, p. 107. 44 The period varies depending on the legal frame, by present it is 4 months. 45 This period includes 2 years during which mothers are paid 90% of their wage and unpaid leave that could be transfer to the father or the grandparents.
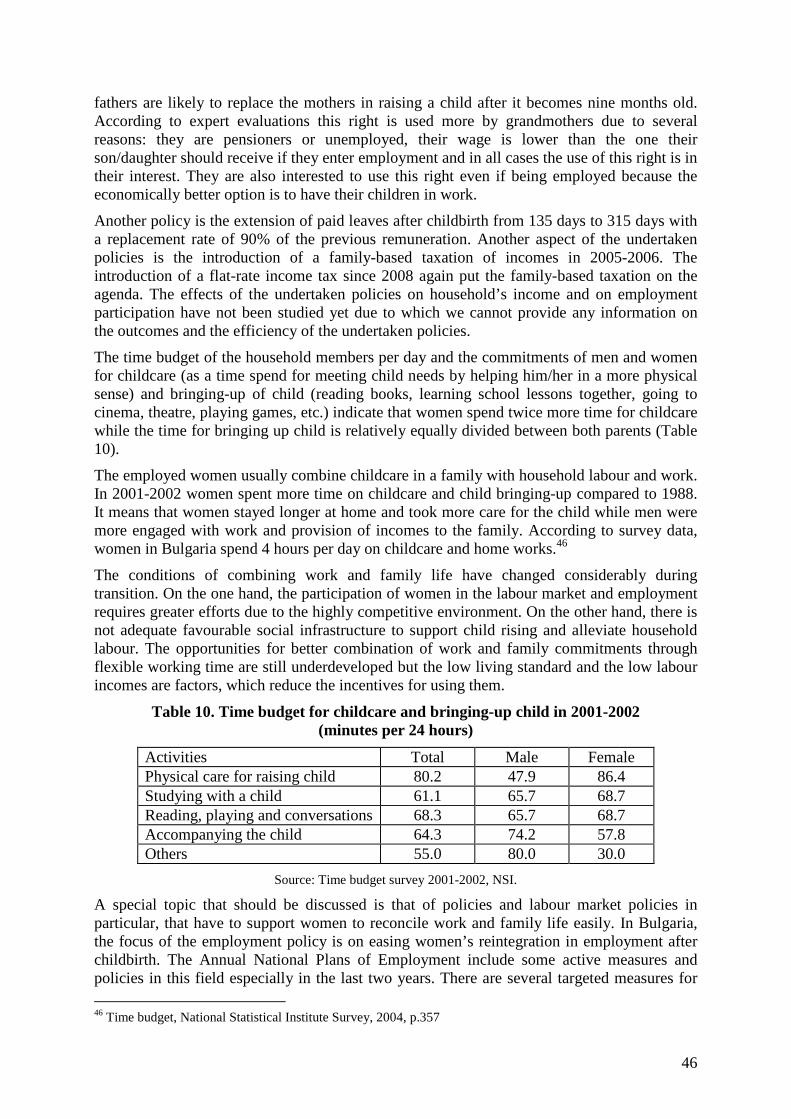
46
fathers are likely to replace the mothers in raising a child after it becomes nine months old. According to expert evaluations this right is used more by grandmothers due to several reasons: they are pensioners or unemployed, their wage is lower than the one their son/daughter should receive if they enter employment and in all cases the use of this right is in their interest. They are also interested to use this right even if being employed because the economically better option is to have their children in work.
Another policy is the extension of paid leaves after childbirth from 135 days to 315 days with a replacement rate of 90% of the previous remuneration. Another aspect of the undertaken policies is the introduction of a family-based taxation of incomes in 2005-2006. The introduction of a flat-rate income tax since 2008 again put the family-based taxation on the agenda. The effects of the undertaken policies on household’s income and on employment participation have not been studied yet due to which we cannot provide any information on the outcomes and the efficiency of the undertaken policies.
The time budget of the household members per day and the commitments of men and women for childcare (as a time spend for meeting child needs by helping him/her in a more physical sense) and bringing-up of child (reading books, learning school lessons together, going to cinema, theatre, playing games, etc.) indicate that women spend twice more time for childcare while the time for bringing up child is relatively equally divided between both parents (Table 10).
The employed women usually combine childcare in a family with household labour and work. In 2001-2002 women spent more time on childcare and child bringing-up compared to 1988. It means that women stayed longer at home and took more care for the child while men were more engaged with work and provision of incomes to the family. According to survey data, women in Bulgaria spend 4 hours per day on childcare and home works.46
The conditions of combining work and family life have changed considerably during transition. On the one hand, the participation of women in the labour market and employment requires greater efforts due to the highly competitive environment. On the other hand, there is not adequate favourable social infrastructure to support child rising and alleviate household labour. The opportunities for better combination of work and family commitments through flexible working time are still underdeveloped but the low living standard and the low labour incomes are factors, which reduce the incentives for using them.
Table 10. Time budget for childcare and bringing-up child in 2001-2002 (minutes per 24 hours)
Activities Total Male Female Physical care for raising child 80.2 47.9 86.4 Studying with a child 61.1 65.7 68.7 Reading, playing and conversations 68.3 65.7 68.7 Accompanying the child 64.3 74.2 57.8 Others 55.0 80.0 30.0
Source: Time budget survey 2001-2002, NSI.
A special topic that should be discussed is that of policies and labour market policies in particular, that have to support women to reconcile work and family life easily. In Bulgaria, the focus of the employment policy is on easing women’s reintegration in employment after childbirth. The Annual National Plans of Employment include some active measures and policies in this field especially in the last two years. There are several targeted measures for
46 Time budget, National Statistical Institute Survey, 2004, p.357
47
helping women’s reintegration into the labour market after childbirth, including incentives for employers to hire people from this target group, or incentives for updating qualification and education of young women to increase their employability. Some protections are also in force regarding extra working time of mothers with small children less than 3 years of age described in more details in section 3.3 above.
The social policy supports mothers with children with cash or in-kind payments (e.g. medicine, cloths, food in school, etc) in case the family income is below a certain level and they are considered poor or in case of disability of the child, etc.
The family-based taxation should be mentioned as an element of the tax policy. It was introduced in 2006 and since no assessment of its effects on family budgets or employment motivation was made it is difficult to support or to criticize this policy tool.
Summarizing the evidences and the policies in place the issue of reconciliation of work and family is a debated one, but not of primary importance. There are many aspects that are not studied in details or are not under regular observation. Due to this the debates as well as the undertaken measures could be defined mainly as incidental rather than systematic. Therefore, more consistent and systematic analysis of the precarious status of some groups of the population, e.g. women, is needed. Meanwhile, there are many other aspects that have to be studied, e.g. the effects of long-term or seasonal emigration of a parent on bringing-up children; of long-hours work on family life, etc. These and many other questions still need to be answered as well as more studies on interrelation between the reconciliation problems and the social and economic development to be conducted.
3.10. Child labour, forced labour
The issue of child labour is an integral part of the labour market policy and a subject of debates, however, not on regular basis. There are a number of legal documents that frame the national policy regarding children involvement in labour.47 By ratifying a number of key related treaties in the field of child labour Bulgaria also has demonstrated its commitments to the international standards.48
The State Agency for Child Protection acts as a national institution in charge of state policy implementation. 49 The close cooperation of the Agency with other institutions is considered to be a precondition for its effective work, e.g. in 2003 the State Agency signed the first
47 Bulgarian Constitution; Labour Code (art.301); Child Protection Act; Public Education Act; Vocational Education and Training Act; Penal Code; Combating Trafficking in Human Beings Act; Social Assistance Act; Juvenile Delinquency Act etc. 48 Bulgaria has ratified the relevant international documents on child labour48, and has transferred their provisions in its national legislation, namely in the following documents48: Bulgarian Constitution (1991), Public Education Act (last amended SG 105/2006), Labour Code (last amended SG 102, 105/2006), Penal Code (last amended SG 75, 102/2006), Combating Trafficking in Human Beings Act (last amended SG 86/2005), Child Protection Act (last amended SG 82/2006), Social Assistance Act (last amended SG 105/2006), Family Benefits for Children Act (last amended SG 95/2006), Vocational Training and Education Act (last amended SG 62/2006), Occupational Health and Safety Act (last amended SG 105/2006), Juvenile Delinquency Act (last amended SG 103/2005), and certain secondary legislation discussed below. 49 It was established under the Child Protection Act with an Ordinance of the Council of Ministers No.226 from 30 October 2000 and started its activity on 1st of January, 2001. The Chairperson of the Agency is a Council of Ministers specialized body for guidance, coordination and control in the area of child protection activities. The Chairperson with the cooperation of ministries, implementing childcare activities, develops the state policy for child protection, develops and controls national and regional child protection programs implementation, licenses natural persons and legal entities, supplying child care services, controls child rights protection etc. The Agency acts in cooperation with ministries, agencies and NGOs, working in child rights protection area
48
document, named “Collaboration Agreement” with the General Labour Inspectorate aimed at combating child labour. The IPEC programmes and projects, performed in the country in the period 2004-2007, have supported the protection of worst form of child labour in the country very actively.50 There are 42 non-governmental organizations that deal with child problems and child labour in particular.
In 2000 a National Survey named “Child Labour in condition of transformation in Bulgaria” was preformed to lighten the scope and depth of the problem. Since then a number of governmental documents had been adopted to outline the legal frame of the policy. The most important to be pointed out is the Child Protection Law (adopted in 2000, latest amendments in 2006) and the National Child Strategy (2004-2006), as well the annual action plans under the national strategy, etc.
It should be mentioned that according to the legislation children aged 16-18 could be engage in work but only after an official permission by the labour inspection and in a legally determined rules – up to 30 hours per week, regular working time, etc.51 Since 2004 child labour without permission is considered a crime and is imposed by prison (up to 6 months or more depending on the children age) and fine.
In numbers, the significance of the problem, according to the above-mentioned survey, amounts to 83 thousand children in work (out of 1294 thousand) and this presented 6,4% of all children aged 5-17.52 Additional 418 thousand or 32.3% were engaged in family farms and 41.8% in households’ work. Further the survey points out that only 14% of the children are not in work or are not engaged in family farming or household work.
Majority of the working children were engaged in the private sector and without labour contracts. In fact this means that they were in employment illegally. From a branch point of view 56.2% were engaged in Trade sector and services, 16.9% in Agriculture and 7% – in Communications.53
Further in the profile of “working children”, as outlined in 2000, the share of male prevailed (55.8%); the age structure pointed out that with the increase of age the share of working children increases (11.8% in the age group 5-9 and 55.3% - in age group 15-17 years old). The study also outlined that employed children were paid very low – 43.3% received monthly amount of 10 to 30 BGL or 5-15 Euro. The rest received over 30 BGL or over 15 Euro but the survey did not point out how much. The employers determined the amount of the wage on their own and 34% of the children add this money to the family budget.
The length of working day for children, as found by the survey, was up to 9 hours – for 41.6% of the requested children and over 41 hours – for 3.3% only. This means that the legal norms in some cases were violated since only 30 hours are permitted under the law. In many cases the school and work were combined (34% of children were in school and working in the family farm; 39.4% – in school and work in household), while in some cases children were only in work and did not go to school (3.4% did not go to school and work in family farm and 8.2% did not go to school and worked household work).54
There are many reasons, which caused engagement of children in work. However, poverty reflects to the highest extent the behaviour of the family and their attitude to children labour. 50 In the period 2005-2007 the IPEC/Protect CEE activities numbered 5 action programs, 11 mini programs, 2 ext. collaboration contracts, 2 direct contracts with publishers and 3 national seminars.
51 Child Law. 52 Child Labour Problems in Condition of Transformations in Bulgaria, ILO, IPEC, Sofia, 2001, p. XVII. 53 Ibid. p. XVIII. 54 Ibid. p. XX.
49
E.g. child labour in agriculture reflects both the lower level of incomes of rural families but also a traditional family understanding that all member of the family have to contribute to family welfare. The above-mentioned national study paid special attention to this problem. According to its outcomes in 2000, an estimated 418,000 children worked in agriculture (plants growing and animals care). Out of them 55.8% were boys and 44.2% were girls. The average age to start working for those children is 7.2 years of age (33% of the children). 77.4% of respondents who answered the questions declared that they worked voluntarily and 15% - as per the will of their parents but also voluntarily. 16.6% of children declared that they worked more than 30 hours weekly. 34% of children working in agriculture were attending school (39% of boys and 33% of girls). 3.4% from the boys that are economically active and engaged in family farms do not attend school. For more than 90% of children, work is not perceived as affecting their school performance. Only 1.8% of the working children say they have health problems. More Turkish children report being involved in hazardous agricultural work (19% including 15% of them are working with pesticides), while Roma are typically less involved in agriculture (as most do not own land). This data suggests that child labour needs further research in terms of defining the hazardous conditions of child labour in agriculture that needs elimination and the light works that children could be involved in. Child labour is closely linked to dropping out from school and in many cases it could be an indicator for engaging children in labour. The data from National Statistical Institute indicates that 23% of the children between 9th and 12th grades are out of the system. In the junior high school – from 5th and 8th class, 16% of children do not attend school. Another research indicates that the number of children dropping out varies according to the different ethnic groups. It is highest among the Roma-Muslims – 18,1%, followed by the Roma-Christians – 12,8%, Turks – 8,3% and Bulgarians – 2%. The most crucial situation is with the Roma-Muslims living in villages – 25.6% of these children do not attend school55. UNDP National Report points at the fact that children living in the rural areas are more vulnerable for dropping-out from the educational system than children from urban areas56. The Municipality of Kardjali was one of the examples for low level of school attendance – 87.94% in 2003 (the average for the country is 91.78%). Working Street Children is a category of special attention. In December 2004, the State Agency for Child Protection reported 625 children involved in WFCL in the streets of five big cities (Sofia, Varna, Plovdiv, Burgas and Stara Zagora). The types of work the children were performing included begging, car washing, scavenging and prostitution. Life for working street children is marked by many problems related to their health, access to education, socialization and overall development. They are also most vulnerable to other WFCL including child trafficking, exploitation for illicit activities and prostitution. The studied problem cound not exclude one more aspect – e.g. children involved in illicit activities: According to the Annual Report of the Central Commission against Juvenile Delinquency for 2003, 13 per cent of crimes in Bulgaria in 2002, were committed by children. The National Statistics show an increase of the number of anti-social acts57 and crimes 55 Project report „Assessment of the educational policies concerning the access to education for children from minorities”, National Council for Ethnic and Demographic Issues. http://www.imir-bg.org/ 56 UNDP (2003г.). National report for the human development: Rural areas, surmounting difficulties during the development. Page. 36-40. http://www.undp.bg/bg/publications, 57 The legal definition stipulates that “The “anti-social act” is any conduct which is socially dangerous and against the law or against the moral and good mores.“ This definition allows children that are actually at risk as defined by the Child Protection Act to be treated as perpetrators and to become subjects of restrictive and punitive measures instead of protection measures as victims/ children at risk.
50
committed by children and registered in the Child Pedagogic Rooms under the Juvenile Delinquency Act58 - 13,196 in 2003 against 11,070 in 2002. It has to be noted that “anti-social acts” cover a wide variety of activities - running away from home, wandering, prostitution, alcohol and drug addiction – of which not all would be criminalized in other countries. There is no data for children involved in drug dealing, but according to the police and the local commissions on juvenile delinquency, children are engaged in the dissemination of drugs near schools. Child trafficking as a form of WFCL reflected the country since “Bulgaria is a source, transit, and destination country for men and women trafficked from Moldova, Romania, Russia, Ukraine, and Armenia to Bulgaria and through Bulgaria to Spain, Austria, Germany, France, Italy, the Netherlands, Belgium, the Czech Republic, and Macedonia for the purposes of sexual exploitation. Men and women from Bulgaria are trafficked to Cyprus, Greece, and Turkey for purposes of sexual exploitation and forced labour". 59
There is a strict and clear legal base related to child trafficking. 60
The implemented policy against child trafficking is considered to be positive. “Bulgaria improved its victim assistance infrastructure by opening a government-run child trafficking shelter and continued to demonstrate increased law enforcement efforts”.61 However, the same report outlines existing problems: “Bulgaria's National Anti-Trafficking Commission could not effectively monitor and improve national and local efforts due to inadequate staffing. Bulgaria should improve support for the Executive Secretary of the Commission and ensure implementation of the National Anti-Trafficking Strategy, which was adopted in February 2005. 62
Regarding the prevention policy the government relied exclusively on NGOs and the international community to fund and execute public awareness campaigns about the dangers of trafficking. The National Border Police actively monitored airports and land border crossings for evidence of trafficking in persons.63
In September 2006, the government opened two crisis centres that provide rehabilitative, psychological, and medical assistance specifically tailored to address the needs of child trafficking victims; each shelter has capacity for 10 children. These centres assisted approximately 20 children from September 2006 through March 2007. The government referred repatriated Bulgarian trafficking victims and foreign victims trafficked to Bulgaria to NGOs for legal, medical, and psychological assistance. All victims in Bulgaria are eligible for free medical and psychological care provided through public hospitals and NGOs. In 2006, 11 victims gave testimony in support of trafficking prosecutions, but none was protected under the full witness protection program. Victims are encouraged to assist in trafficking investigations and prosecutions; victims who choose to cooperate with law enforcement investigators are provided with full residency and employment rights for the
58 Criminal statistics in: www.nsi.bg 59 US State Department, Trafficking in Persons Report 2007. 60 The Constitution prohibits forced labour. The Law on Combating Trafficking in Human Beings, which entered into force in January 2004, includes measures for the protection and assistance of child victims of trafficking, and created the National Anti-Trafficking Commission to coordinate and construct policy on trafficking. Bulgarian law penalizes trafficking a minor with 2 to 10 years imprisonment and fines. Inducement to prostitution, which is often associated with trafficking, is punishable by 10 to 20 years imprisonment, if the victim was a minor. 61 US State Department, Trafficking in Persons Report 2007. 62 US State Department, Trafficking in Persons Report 2007. 63 Ibid.
51
duration of the criminal proceedings. Foreign victims who choose not to cooperate in trafficking investigations are permitted to stay in Bulgaria for 1 month and 10 days before they are repatriated. Victims generally were not detained, fined, or otherwise penalized for unlawful acts committed as a result of their being trafficked.64
Notions regarding the changes in the situation in the years and the direction of these changes , are based on the information from the annual reports of labour inspections and separate case studies. There are several important features that should be outlined:
� The increasing cases of legalization of children engagement in employment. According to the annual report in 2006, more and more employers started to ask labour inspections to hire children (16-17 years old), e.g. in Vratsa region the official permissions in 2006 were twice more than in 2005.
� No differences had been observed from branch point of view regarding child labour – tourism, trade, clothing, etc. are the spheres where employers engage children. Usually this is a seasonal employment in small and medium firms.
� Despite the more strict legal norms and considering child labour a crime, a journalistic inquiry in 2006 points out a number of violations in 7 regions in the country. However, their conclusions confirmed the tendency towards legalization of children labour in the frame of the law, since more permission were issued for employment of children between 16-17 years old. The majority of the requests were for seasonal employment during the summer vacancy. However, illegal children employment remains, as confirmed by local inspections (e.g. girls, dancers in night clubs).
� The number of children who wish to work increases, according to local inspectors in Gabrovo, where up to 5 requests per day were registered in the last year. According to inspectors’ view, children do not want to lose their time in summer and prefer to do something. However, they find the legal regime quite inflexible and overburden.
As pointed above numerous national strategies and action plans address issues, related to child labour, education, poverty, and social inclusion. This means that there is a complex of policies, undertaken in the country to combat child labour and especially the WFCL. The family taxation aims at relieving family incomes depending on number of children; the labour market policy aims at more and better employment for people meaning more job opportunities and more incomes for all. Active labour market policies contain a variety of programs and measured for special groups, incl. lonely mothers and fathers and mothers with small children, programs for employment reintegration of some groups like ethnic families with more children, etc. The social policy includes scheme for children allowances; social assistance system also includes schemes for supporting low-income families as described in section 3.8 of this report. Children are also encourage to by in school by some grant schemes e.g. free of charge books, breakfasts, etc.
In conclusion the child labour as a problem that exists in the country and focuses the attention of the society and the policy-makers. Both aspects of child labour – its legal forms and the so-called “worst forms of child labour" are subject to different policies and measures, and many institutions are in charge of policy implementation. The dimensions and the forms of child labour, as well as the factors behind it, have been subject to special studies and analyses, unfortunately, not on a regular basis. Due to this the trends in the child labour development could not be outlined.
64 Ibid.
52
The implemented policies in the country could be distinguished depending on the nature of child labour: on the one hand, a policy for legalizing and making more clear the procedure of permitted under the law forms of CL65 On the another hand, a policy of strict control on WFCL e.g. trafficking of children; working children in the streets, etc. Although the legal and institutional framework has been updated and harmonized with the EU standards, some forms of child employment (illegal) and especially WFCL, in particular, trouble the society. In this respect it should be also concluded that there is a need for regular monitoring of child labour so as to have clear idea about the trends and the efficiency of the applied policies. As described above, there are many policies, considering child labour. However, there are no evaluations of the effects of these policies on decreasing illegal child employment or WFCL. Consequently, there is a need for such evaluations that could be of help for policy-makers to reshape or restructure the existing programs and measures. 4.Linkages, trade-ins and trade-offs between different elements of working
and employment conditions The elements of decent work, subject of analysis in the previous part of this paper, differ in their origin and causing effects (sequences). Due to this the study of the interactions between the different elements should have to consider this multi-dimensions between the elements. This means at least several things: (a) some of the elements could be characterized as primary in view of their effects to the others; (b) some of the linkages have direct effects, while other interrelations occurred indirectly; (c) some of the interrelations could be metrically verified, while others – not; (d) in some cases the effects are combined or multiplied; (e) the interrelations between the different element have different powerful effects, etc. There is also one important point that should have to be taken in consideration – depending on professional and branch status the interrelations between the studied elements of the decent work differ to a high extent. This means that we could assess the real effects in more details only when studying interrelations in a concrete sphere, e.g. specific job or decent work in particular branch or at firm level. Unfortunately, in Bulgaria such studies are very episodic and fragmented. Nevertheless, we will try to identify the interactions between the elements, the trade-offs and the trade-ins and will present in quantitative and qualitative way some of the interactions. 4.1. Linkages between the elements from the point of view of their direct or indirect interactions The first part of this paper studied 10 elements of decent work. Among them the type of labour contract could be considered as element of primary origin regarding wage level, working time, training, healthy and safety work environment since all elements depend on labour contract conditions. Generally in Bulgaria, employment under labour contract for
65 It should be mentioned that in Bulgaria the family solidarity regarding household incomes is quite high and voluntary child labour especially in the agriculture follows specific national traditions: e.g. for many centuries the rural families shared the efforts between all family members in cultivating land, plants growing and animals care Meanwhile, the economic and social restructuring during the transformation caused serious changes in employment status and households well fare. The low level of incomes and the social and economic stratification encourage children participation in economic activities for earning money. The economic activities during the summer school holidays are also a form of child participation in the labour market.
53
permanent job and on full-time means to a certain extent more decent work conditions regarding payment, health and training conditions, and social protection. However, wage level does not correspond to type of contract but depends on job position and branch. For instance, according to a case study in bank sector, where permanent full-time employment predominated, employed people reported satisfaction on wage level, training, social protection, health care, but also complained on over-time, high labour intensity, stress, etc.66 There are curtain branches where part-time job and a wide variety of atypical forms of employment, including over-time, night-time, end of the week, holidays work, etc, are often reported but not systematically studied, e.g. retail, hotel and restaurants, tourism, etc. This specific working time does not mean higher wage level, on the contrary, the wage level is lower than average and the health protection is very low in case of self-employed people, engaged in retail.67 The effects of over-time and employment by the end of week and on holidays have negative impacts on family life and childcare. That is way we observed many young people engaged in these activities, as well as people over 50 years old or pensioners. A case study on youth employment pointed out that atypical working time was one of the specific features of their employment.68 Concerning the interrelations, we have to mention that working time depends on labour contract but also on level of payment. Usually, the low level of payment is compensated by more working hours, extra work time, second and third job, etc. Thus, working time indirectly influences the health status, family life, etc. Generally, the type of contract plays important role on the interactions since stable employment contracts (permanent and on full-time working day) insures, as a rule, higher level of wages, better opportunities for training, in some cases – better health and safety environment, etc. On the contrary, part-time, temporary, etc. forms of contracts are associated with non-standard working time; lower level of payment; fewer opportunities for training, difficulties in reconciliation work and family, etc. Health status influences directly on work and family life. But health is also a factor, pre-determining people choice of type of contract, of working time. Health is mostly influenced by work pace and work organization, as pointed above. Training is an element of work organization and of social dialogue. But level of training on its term influences wage level, since the higher the qualification of the person, the higher the level of payment. Work and family life is influence by the type of contract of employed people, the level of wages, the working time, etc. And, on the contrary, the family life pre-determined in many cases the choice of type of contract, of working time, etc. This is valid especially for some groups and mainly for young women and elderly people. Depending on the understanding of child labour as illegal activity, or as activity allowed under the existing national legal norms, this element could be considered first as exception of
66 Case study, Better working conditions in the internationalised banking sector, in “Towards a better balanced world of work”, The evolving world of work in the enlarged EU, EC-ILO, 2007, p.81-85. 67 Tomev, L. 2000, Rabotnoto vreme na targivskite obekti – ikonomicheski, sojialni I trudovi-pravni aspekti, Sofia, KNSB. 68 Case study, Youth employment in transition, performed for the project. The evolving world of work in the enlarged EU, EC-ILO, 2007, unpublished.
54
labour market rules that reflects social and economic problems in the society, poverty problems in particular. Being an activity out of the rules of the market, child labour should be connected with activity without contract, atypical working time, lack of social protection, etc. The second form of child labour – the one allowed under the law for some age groups, is also associated with atypical forms of employment (contracts, wages, working time, etc), since this is usually a seasonal employment or permanent work. 4.2. Trade-offs and trade-ins between some of the studied elements As already pointed above there are number of connections and interactions existing between the separate elements of working and employment conditions. It is difficult to find out the degree of influence and to what extent cause-reason connections exist based on the existing statistical information. That’s why, the interaction between separate elements will be surveyed here, based on qualitative estimates, and thus the quantitative estimates will be presented, where possible. Social protection, as one of the basic elements of working and employment conditions, interacts with the rest to a different degree. Social protection of unemployed and inactive persons in productive age is of a particular importance for the labour market. First one is realized by the labour market policies (active and passive) and second – throughout social assistance system. The second connection is quite important in the Bulgarian conditions due to the relatively high percentage of encouraged unemployed, compared to the inactive population (12%) and relatively low economic activity. Social protection influences most considerably the main labour market parameters (employment, unemployment and economic activity) and employment status. The separate social protection systems interact differently with the labour market parameters. Two main connections will be investigated in the present survey: 1) interaction between the social protection (protection of inactive persons in productive age), employment status and labour market parameters; 2) interaction between the protection of unemployed (passive and active politics) and labour market parameters. The comparative analysis of the social assistance characteristics and the labour market parameter dynamics are a reason to consider this dependency as trade-off one. Social assistance system provides weak protection for inactive persons in productive age. It covers small part of this population category and ensures low-income level. The percentage of replacement of wages by social benefits is lowest (16% in 2005) and the expenditure on social allowances for inactive persons in productive age is about 0.3% of GDP. In this aspect, the social assistance stimulates the economic activity and employment. Economic activity and employment show tendency of increase during the last years, which proves the pointed dependency. At the same time, the insufficient assistance of population in active age stimulates development of flexible employment types (part-time, self-employed and fixed term contracts). Interaction between the unemployed protection and application of active and passive labour market influences considerably the level of employment and unemployment. Quite strong is the impact of the active policies on the employment. Increase of the resources for active policies correlates positively with the employment change (Fig. 20). It is quite obvious during the period after 2000 (Fig 20, A).
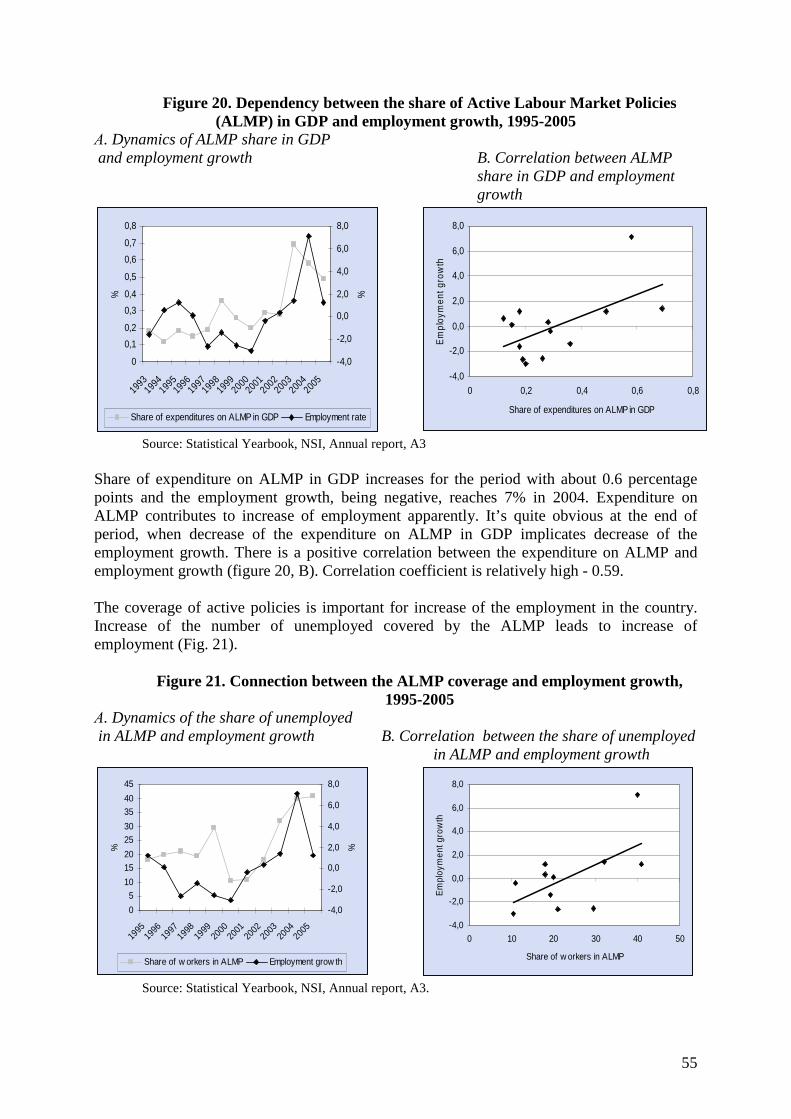
55
Figure 20. Dependency between the share of Active Labour Market Policies (ALMP) in GDP and employment growth, 1995-2005
А. Dynamics of ALMP share in GDP and employment growth B. Correlation between ALMP
share in GDP and employment growth
0
0,1
0,2
0,3
0,4
0,5
0,6
0,7
0,8
1993
199419
9519
9619
9719
9819
9920
0020
01200
220
0320
04200
5
%
-4,0
-2,0
0,0
2,0
4,0
6,0
8,0
%
Share of expenditures on ALMP in GDP Employment rate
-4,0
-2,0
0,0
2,0
4,0
6,0
8,0
0 0,2 0,4 0,6 0,8
Share of expenditures on ALMP in GDP
Em
ploy
men
t gro
wth
Source: Statistical Yearbook, NSI, Annual report, A3
Share of expenditure on ALMP in GDP increases for the period with about 0.6 percentage points and the employment growth, being negative, reaches 7% in 2004. Expenditure on ALMP contributes to increase of employment apparently. It’s quite obvious at the end of period, when decrease of the expenditure on ALMP in GDP implicates decrease of the employment growth. There is a positive correlation between the expenditure on ALMP and employment growth (figure 20, B). Correlation coefficient is relatively high - 0.59. The coverage of active policies is important for increase of the employment in the country. Increase of the number of unemployed covered by the ALMP leads to increase of employment (Fig. 21).
Figure 21. Connection between the ALMP coverage and employment growth, 1995-2005
А. Dynamics of the share of unemployed in ALMP and employment growth B. Correlation between the share of unemployed in ALMP and employment growth
0
5
10
1520
2530
3540
45
1995
1996
1997
1998
1999
2000
2001
2002
2003
2004
2005
%
-4,0
-2,0
0,0
2,0
4,0
6,0
8,0
%
Share of w orkers in ALMP Employment grow th
-4,0
-2,0
0,0
2,0
4,0
6,0
8,0
0 10 20 30 40 50
Share of w orkers in ALMP
Em
ploy
men
t gro
wth
Source: Statistical Yearbook, NSI, Annual report, A3.
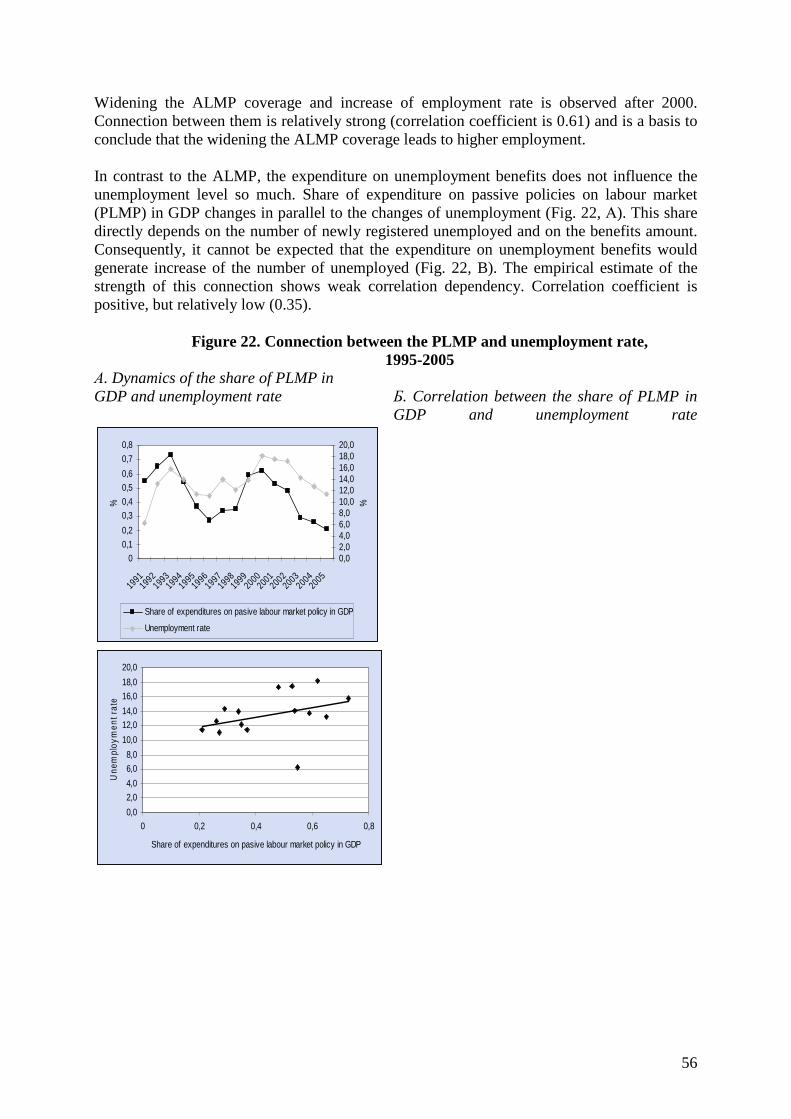
56
Widening the ALMP coverage and increase of employment rate is observed after 2000. Connection between them is relatively strong (correlation coefficient is 0.61) and is a basis to conclude that the widening the ALMP coverage leads to higher employment. In contrast to the ALMP, the expenditure on unemployment benefits does not influence the unemployment level so much. Share of expenditure on passive policies on labour market (PLMP) in GDP changes in parallel to the changes of unemployment (Fig. 22, А). This share directly depends on the number of newly registered unemployed and on the benefits amount. Consequently, it cannot be expected that the expenditure on unemployment benefits would generate increase of the number of unemployed (Fig. 22, B). The empirical estimate of the strength of this connection shows weak correlation dependency. Correlation coefficient is positive, but relatively low (0.35).
Figure 22. Connection between the PLMP and unemployment rate, 1995-2005
А. Dynamics of the share of PLMP in GDP and unemployment rate Б. Correlation between the share of PLMP in
GDP and unemployment rate
0
0,1
0,2
0,3
0,4
0,5
0,6
0,7
0,8
1991
1992199
3199
41995
1996
199719
98199
920
00200
12002
2003
200420
05
%
0,02,04,06,08,010,012,014,016,018,020,0
%
Share of expenditures on pasive labour market policy in GDP
Unemployment rate
0,0
2,0
4,0
6,0
8,0
10,0
12,0
14,0
16,0
18,0
20,0
0 0,2 0,4 0,6 0,8
Share of expenditures on pasive labour market policy in GDP
Une
mpl
oym
ent r
ate
57
Source: Statistical Reference book, National Insurance Institute, Annual report, A3.
Summarizing estimates of interaction between labour market policies and labour market functioning, the following conclusions could be done: First, ALMP in Bulgaria (and especially after 2000) influence substantially its functioning. In general they lead to improvement of the parameters and in this respect can be considered as trade-ins. Increase of the expenditure and coverage of labour market policies could be considered as important prerequisite, stimulating the labour market. Second, the expenditure and coverage of PLMP do not stimulate unemployment. No matter the positive dependency found between them, they are not main factor, restricting labour supply. Interaction between social protection and the rest elements of labour conditions is not clearly expressed. Connection with wages is not direct, because they are determined during the negotiation process (collective and individual bargaining). The low replacement level of income from wages by social allowances and unemployment benefits stimulates participation in the labour market. The relatively low proportions express the trade-off between them. Low social protection is at the expense of higher wages. Social protection of unemployed, realized through ALMP, correlates closely with the access to training. No matter that the expenditure on training and qualification of unemployed in Bulgaria is not high, they increase and cover bigger number of unemployed. In this sense, interaction between the pointed two elements can be characterized as trade-ins – increase of the first leads to proportional increase of the second. Social protection of deprived children and maternity in the country influence positively the balance between the labour and family. Child allowances are not high, but the access to them is relatively high. At the same time, maternity leave duration is one of the highest in EU. Thus, the interaction between the children, maternity and family protection complements one another. The social dialog, as one of the main institutions at the labour market, directly interacts with all working and employment conditions elements. It is strongest in respect the wages. One of the basic functions of collective negotiating is the protection of wages from inflation and their binding with the economic results. Two aspects of the connection between the income from employment and negotiations system could be examined: protection of wages against inflation and dependency of wages on labour productivity. Those two aspects are a basis for estimations of the influence of collective negotiating and its effectiveness. Real wage dynamics (minimum and average) shows that protection against inflation is underestimated after 1990. Compared to the beginning of 90s, the average wage erosion is about 48% and the minimum – nearly 40%. No matter that a process of recovery is observed after 1997, the real wage does not reach the level, registered
58
before the reforms. It is due to the restrictive state policy up to mid 90s and to the weak position of trade unions at a company level. Number of trade unions members decrease since the beginning of 90s. Something more, the collective negotiations cover relatively small part of employed. So, the connection between the trade unions power in negotiations and wage dynamics is positive – decreasing trade unions power influences the low wages dynamics. Another important element of the security of the employed income is the connection between wages and labour productivity. The connection between labour productivity and wages in Bulgaria is not strong. This dependency generates relatively low expenditure on labour and lower protection of the income of employed respectively. Low commitment of wages with social dialog at company level is a consequence of the lack of dialog at most of the private sector enterprises. Thus, the workers at these organizations are exposed to uncertainty and risk. Most affected in this respect are working at services (hotels, trade), manufacturing industry (tailoring and textile) and construction. Interaction between the social dialog and the employment status is not clearly expressed. Employers hire workers according to their necessities and trade unions cannot influence this process. The collective negotiating is more meaningful in changes of the labour contract character (transition from permanent to temporary contract for example). Last years data show increase of number of employed under permanent labour contract, which means relatively high protection of employed under such contracts. Social dialog influences in particular the working time and labour organization. The analysis of the respective indicators dynamic gives grounds to suppose that trade unions are “debtors” to employed in this respect. Increase of the time worked proves the relatively weak protection of the employed. In this respect, decreased negotiating strength of the trade unions corresponds to the lower protection of employed, concerning working time. Similar is the dependency between the social dialog and the intensity and stress at the working place. The social dialog role in creation healthy and safety working conditions in Bulgaria could be estimated as positive. Decrease of the number of work accidents during the last years is the proof. The situation is a consequence of the joint efforts of employers and trade unions during the negotiations. Level of wages interacts differently with the rest working and employment conditions elements. Low remuneration level in the country does not stimulate the development of part-time contracts. Most of the employed under part-time contracts show the lack of better possibility as a reason to accept it. Just small part of them is searching such type of employment. The relatively low protection of the real wages stimulates employed to search second employment or additional part-time employment. Household budgets survey69 data prove this tendency. Share of income from additional employment increases 11 times
69 Household Budgets in the Republic of Bulgaria, NSI, different years.
59
(from 0.4% in 1990 to 4.8% in 2005). Accepting additional employment creates possibilities for increasing the stress, psychical burden and for worsening health status of employed. The additional work takes part of the free time also and restricts the possibilities for reconciliation work and family life. 4.3. Identification of vulnerable groups affected by existing interrelations Following the outcomes of present and previous studies70 on this topic we identify different vulnerable groups in the labour market.
� Depending on the type of contract the most vulnerable groups are: (a) Young people (b) Elderly employed people. (c) Self-employed people (d) People in employment without labour contract.
They are more often employed under less secure form of contracts – e.g. on part time, temporary, long time, Saturday and Sunday, evening time, etc. Self-employed people are listed as specific category since some of them worked without social insurance and health protection and in some cases – they do have contract. There are also people illegally in employment that means that they do not have contracts at all.
� Depending on level of payment the study recognized as vulnerable people engaged in that branches where the wage level is below the average for the country and more concrete – textiles and clothing; leather industry; hotels and restaurants.
� In accordance with working time and work organization the most
vulnerable are again young people and that employed in services and retail trade.
� Work intensity highly depends on branch specifics due to which it is a factor
for vulnerability for people employed in many sectors but especially in construction, trade, and more advanced services e.g. telecommunications, computer design, programming, etc.
� Safety and healthy work conditions are also closely linked to branch
technology. In some branches the negative effects are mostly psychological and are connected with stress due to high work intensity while in others the negative effects hamper the physical status of the employed people due to dusty, noisy work (e.g. textile, leather industry) or to other factors (mining and quarrying, manufacturing).
� Access to training is most available for people who worked on permanent
contract and in public or big private enterprises. Small and medium sector
70 Beleva, I. Tzanov, V. Towards a better balanced world of work in “The evolving world of work in the enlarged EU, Progress and vulnerability” ILO, Geneva, 2007, pp 54-55; Flexibility and Security in the Labour Market; Bulgaria’s Experience, ILO, Flexicurity paper 2004/03
60
offers fewer opportunities in this respect. Self-employed people engaged in trade, hotels, transport are also reluctant to training and could be considered as vulnerable.
� Social dialog is mostly developed in public and big private firms. Most of the
workers in private sector are not protected by the trade unions. Practically the workers in the small and medium size private enterprises (textile, trade, manufacturing, hotels and restaurants) as well as self-employed are not cover by any form of collective agreements. The lack of alternative forms of workers participation makes employees in these sectors most vulnerable in respect to wages, working conditions, etc.
� Social protection system covers wide range of population. Despite this the
interaction analysis finds out unemployed and inactive people as more vulnerable groups. Particularly these are unemployed with low education and no qualification. In relation to the level of incomes (pensions, unemployment benefits and social benefits), receiving from the different programs, most of the recipients are protected at minimum level. These groups are pensioners with low pensions, unemployed, beneficiaries of social assistance and families with children.
� Reconciliation of work and family life is most problematic for women than
for man and this is understandable. However, the provisions at firm (municipality as well) level to reduce to weight of women are still not so developed in Bulgaria as in more advanced EU countries. Poor women, women from minority, less educated women, young women could be numbered as more risky groups from this angle of the study.
� Child labour is a factor for vulnerability for all children that are in
employment but in particular it concerns children from poor households and ethnic minority.
5. Conclusions and policy recommendations This study presents the status and the trends in working conditions and the interactions among them on the basis of the available information. Some of the main conclusions are as follows:
1) The labour conditions during the studied period have been influenced by several factors, namely: macroeconomic development; best international practices transfer and the Bulgarian EU accession process.
� The study has found out that the economic development in the country after 2000 has positive effects on labour conditions and contributes to their improvement. More people have been integrated in the labour market under labour contracts on permanent and full time basis; both nominal and real wages increase; safety and healthy conditions have been improved to some extent but the most important is that many of the issues of decent work has become a debated and focussed the attention of the policy-makers; reconciliation of family life and work has also become a subject of
61
attention and some new policies have been introduced. However, the effects differ - for some of the decent work elements, e.g. social dialogue, training, working time and work organization the progress was less significant.
� The EU accession process leads to revision and harmonization of legal framework and institutional capacity development in all spheres of the studied topic.
� Many good practices have been transferred to the country by foreign investors and international management. The market competition stimulates the wider dissemination of these good practices.
2) Regarding employment status based on types of contract, the study has outlined that there are increasing trends in the development of more secure forms of contracting, e.g. employment under labour contract, permanent employment on full time basis. However, there are also evidences that labour relations are becoming more flexible and thus - to some extend insecure. The development of atypical forms of employment e.g. self-employment, unpaid family workers etc. complicates additionally the picture regarding the types of labour contracts. In addition, new, atypical forms of employment occur, which are however, still not studied in details but point out that both employers and employees need more flexible forms of labour relations.
3) There is a moderate improvement of the wage level of all workers. A catching up process of nominal and real wages exists but the real wages are still below the pre-transition period. Despite the progress towards a more decent wages the further improvement remains a serious challenge for the wage policy. Particularly this concerns low-paid workers (workers in the processing industry (textile, clothing and leather industry) and in the services sector (trade and hotels)).
4) The study also has identified a strong relationship between low wages
and the other elements of working and employment conditions. Low wages encourage workers for additional employment (second or multiple jobs), which leads to decrease in leisure, decline in family time and overloaded workers. This results in increase of workers’ health problems e.g. stress and over-exhausting. The relatively low wages press people to work over time, to undertake jobs with unsocial working time, which additionally depress their family and social life.
5) There is no strong interaction between wages and economic growth.
The share of wages in GDP is relatively low and shows tendency of decrease during the last years. This result is mainly due to the relatively low link between wages and productivity. The real wage dynamics lack behind the productivity growth, despite the improvement of this linkage.
6) The study has found out that wage inequality in Bulgaria is relatively
low. There are no significant changes in wage differentials by sectors, occupation, professions and education. Generally, the workers in the low-paid sectors are not involved in the collective bargaining process.
62
Also, most of the collective agreements at branch level were not extended to the non-included firms although there are legal provisions at place. In this sense the effectiveness of the social dialog should improve.
7) Wage structure does not motivate employers and workers for better
economic performance. The variable part of wages, corresponding to the financial results, constitutes a small part of total wages.
8) The working time mode still remains quite traditional. However, the present, more stable economic development results in extension of working time mainly by the end of week and in weekends especially in specific branches and in the private sector. The study outlines the need for regular observations of working time as an instrument for monitoring the trends in its development.
9) The flexible forms of working hours cover only a small part of employed persons. Nevertheless, in some branches the flexible working time is more frequent e.g. constructions, trade, hotel and restaurants, etc. Anyway, following a number of indirect evidences and in comparison with earlier periods of transition, there are more options for flexible and atypical working time.
10) The progress in healthy and safety work conditions in Bulgaria has been closely linked to macroeconomic prospect and international standards. The economic bloom after 2000 resulted in positive trends in some of the indicators, presenting safety and healthy work conditions. The international firms operating in the country transfer good practices in this field and positively influence the process of improvement of this element of working conditions.
11) The implemented policy of prevention for safety and healthy work conditions is based on the joint efforts of all stakeholders on tripartite principle. However, the economic environment still contains a number of risks for employed persons. These risks come from some objective and subjective factors, e.g. origin of technology, intensity of work organization, way of reconciliation of family and work life, etc. The more strict control of the GLI could be outlined as a factor for bettering the working environment.
12) Access to training is still less developed domain of working conditions. The managers are not sufficiently active regarding CVT of their employees. The assessment of the skill needs is not an integral part of the regular activities of the enterprises. The share of enterprises that planned CVT, e.g. plan/program; budget, training organization, etc., for the studied period 2000-2004, was very small. Employers prefer to engage people with the requested qualification instead of qualifying people by different forms of CVT.
13) Workers participation in the social dialog is based on the trade union organizations. There are no developing alternative forms of workers participation as workers’ councils. The study outlines a tendency
63
towards decreasing of union density and coverage. Coordination between different levels of negotiations is low but there is a will expressed by the social partners to strengthen the coordination between national, branch and firm level.
14) Social protection system is based on legislation that is in the process of harmonization with EU recommendations. It covers all insurance risks (sickness, disability, old age, maternity, etc.). The coverage of the social protection system is strongly differentiated in order to provide adequate protection of the population under and above working age (children and pensioners) and to stimulate people in active age (unemployed) to search employment. The first group is relatively well covered, whereas the coverage of unemployed is limited.
15) Summarizing the evidences and the policies in place of reconciliation of work and family the study points out that although a debated issue, it is still not of primary importance. There are many aspects of the issue, which are not studied in details or which are not under regular observation. Due to this, the debates as well as the undertaken measures could be defined mainly as incidental rather than systematic. Therefore, more consistent and systematic analysis of the precarious status of some groups of the population, e.g. women, is needed. Meanwhile, there are many other aspects that have to be studies, e.g. the effects of long-term or seasonal emigration of a parent on bringing-up children; of long-hours work on family life, etc. These and many other questions still need to be answered as well as more studies on interrelations between the reconciliation problems and the social and economic development to be conducted.
16) Child labour is a problem that exists in the country and focuses the attention of the society and the policy-makers. Both aspects of child labour – its legal forms and the so-called “worst forms of child labour" are subject to different policies and measures, and many institutions are in charge of policy implementation. The dimensions and the forms of child labour, as well as the factors behind it, have been subject to special studies and analyses, unfortunately, not on a regular basis. Due to this the trends in the child labour development could not be outlined.
17) The implemented policies in the country could be distinguished
depending on the nature of child labour: on the one hand, a policy for legalizing and making more clear the procedure of permitted under the law forms of CL. On the other hand, a policy of strict control on WFCL e.g. trafficking of children; working children in the streets, etc.
18) Although the legal and institutional framework has been updated and
harmonized with the EU standards, some forms of child employment (illegal) and especially WFCL, in particular, trouble the society. In this respect it should be also concluded that there is a need for regular monitoring of child labour so as to have clear idea about the trends and the efficiency of the applied policies. As described above, there are many policies, considering child labour. However, there are no evaluations of the effects of these policies on decreasing illegal child
64
employment or WFCL. Consequently, there is a need for such evaluations that could be of help for policy-makers to reshape or restructure the existing programs and measures.
19) Multi-dimensional analysis of the linkages and interactions among the
elements of the working conditions outlines some important relationships. The relatively low wage level influences negatively the work and family balance, health status, employment flexibility (part-time contracts are not attractive) and labour supply. The social dialog interacts with wages and safety and healthy conditions in a negative way (the weak positions of trade unions at company level has low impact on protection of wages and working conditions). Social protection interacts with the main labour market parameters (employment, unemployment, economic activity) in a positive way. In this aspect, social assistance stimulates the economic activity and the employment. Quite strong is the impact of the active labour market policies on the employment and unemployment. Social protection of unemployed, realized through ALMP, correlates closely with the access to training.
With regard to policy recommendations we should underline once again that by present there is relatively complete legal and institutional framework that provide favourable conditions for decent work development. However, further efforts are needed to put in practice the rules and their observation. In this respect we have:
� to enlarge the developed system for monitoring of working conditions to include regular quality studies;
� to develop a system of indicators for assessment of working conditions in line
with technological and economic development. � to improve the existing system for regular assessment and reporting of the
state and the trends in the development of decent work conditions and increase its publicity.
� to build up a practice for regular discussion of decent work problems in the
society by involving in the discussion not only the interested stakeholders but rather wider social audience.
Improving decent work conditions is not only a matter of policy in sense of laws, acts, institutions, observations, etc. It is a matter of culture and mentality. This means a style of responsible management of firms and a style of workers behaving like people, who care about themselves at working places and who insist on their rights for decent work conditions. In this sense, the further steps as policy measures should be:
� Development of a system through which employers and employees to be regularly educated on decent work rules and responsibilities.
� Development of a system through which both sides – employers and
employees to be motivated to follow the rules of decent work. In this case the role of trade unions and employers’ organizations should be more active.

65
� Development of mechanisms through which the society and its non-
governmental structures could react effectively when decent work rules are violated. This means to increase the efficiency and the effectiveness of linkages between the institutions in charge and the social structures.
66
References:
1. Annual Report of the General Labour Inspectorate, 2006,
http://git.mlsp.government.bg/ 2. Annual Report of the National Employment Agency, MLSP, 2006 3. Beleva, I. Tzanov, V. Towards a better balanced world of work in “The
evolving world of work in the enlarged EU, Progress and vulnerability” edited by Francois Eyraud and Daniel Vaughan-Whitehead, ILO, Geneva, 2007.
4. Beleva, I., Tzanov, V. “Labour market flexibility and employment security, Bulgaria, Employment paper, 2001/30, ILO, Geneva
5. Beleva, I. Tzanov, V.Flexibility and Security in the Labour Market; Bulgaria’s Experience, ILO, Flexicurity paper 2004/03
6. Bulgaria: The Challenges of Poverty, NSI, 2006, pp. 117-150 7. Centre for Study of the Democracy, Hidden economy in Bulgaria, 2005,
Vitosha Research and Coalition 2000; http://www.csd.bg/bg/econ/ 8. Child Labour Problems in Condition of Transformations in Bulgaria, ILO,
IPEC, Sofia, 2001 9. Child Law, Minister of Councils, Sofia, Repealed SG, N 48/13.06.2000 10. Changes in the Working Conditions and the Demographic Behaviour in
Bulgaria. – In: Working Time and Labour Conditions, University of National and World Economy, Sofia, 2005
11. Demographic development of Republic of Bulgaria, Bulgarian Academy of Science, National Statistical Institute, UN Population Fund, Sofia, 2005,pp.113-117
12. European Foundation for the Improvement of Living and Working Conditions, Working Condition Survey, Bulgaria, 2005
13. Information Bulletin, National Employment Agency, MLSP, 2005 14. Labour Code, Repealed SG, N 48 /13.06.2000 15. Health and Safety Labour Law, Repealed SG, N124 /23.12.1997 16. Labour Force Survey (LFS), National Statistical Institute, Sofia 17. LFS, Module Life-long Learning, 2003, National Statistical Institute 18. Mihova, G. Raising of Children up to the Age of 6 by Employed Individuals in
Bulgaria: Preferences and Practices (in Bulgarian). – In: Population Journal, 1-2, 2006,
19. National Demographic Strategy of the Republic of Bulgaria 2006-2020, http://www.mlsp.government.bg/bg/docs/demography/Dem
20. National Strategic Reference Framework Republic of Bulgaria, For the Programming period 2007-2013, Council of Ministers, 2007, p, 29; http://www: government.bg.
21. Report for the Health of the Nation in the Beginning of 21st Century, Ministry of Health, August 2004.
22. Statistical Reference Book for respective years, NSI, Sofia 23. Statistical yearbook, 1995-2005, National Statistical Institute, Sofia 24. Tzacheva, N., Dinkova, K., Yancheva, M. Occupational environment and
workforce health – harmonization with European legislation, Arhives, Balcan medical union, vol. 42, 2007, 4, 197 - 203
25. Time budget, National Statistical Institute Survey, 2004 26. Tomev, L.2000, Rabotnoto vreme na targivskite obekti – ikonomicheski,
sojialni I trudovi-pravni aspekti, Sofia, KNSB,
67
27. Working Time, Labour Conditions and Demographic Behaviour, In: Working Time and Labour Conditions, University of National and World Economy, Sofia, 2005
List of Tables
1. Main economic indicators in Bulgaria 1995-2006 (growth rate)
2. Full-time, part-time employment in Bulgaria (numbers)
3. Real minimum wage dynamics and proportion to the average wage (1995-2006)
4. Relative structure of wages among the economic activities with lowest remuneration, 2000-2006 (percentage to the average country wage)
5. Wage structure by economic sectors in 2004 (%)
6. Average actual working hours per week in 2006
7. Distribution of employed people by usual worked hours - structure
8. Relationship between the minimum wage, unemployment benefits and guaranteed minimum income (GMI) and the average wage, 1992-2005 (%)
9. Kindergartens and children, enrolled in Bulgaria – 1997-2005
10. Time budget for childcare and bringing up child in 2001-2002 (minutes per 24 hours)
List of Figures
1. Labour force participation -total and by gender
2. Some demographic trends in Bulgaria
3. Population trends by age groups in Bulgaria
4. Employment by type of labour contract in Bulgaria
5. Permanent and temporary jobs in Bulgaria
6. Real wage dynamics, 1995-2006, Index 1995=100
7. Productivity and Real Wages, 1995-2006
8. Share of employees compensations in the GDP and GDP rates (1997-2006)
9. Structure of employees, working on shifts, 2004
10. Unfavourable factors of working environment in Bulgaria 2002-2003
11. Total number of work accidents, and work accidents that caused death or
disability, professional illnesses
12. Professional illness – numbers and per 100 000 employed people
13. Share of participants in CVT or ITV by size of enterprises
14. Social insurance coverage, 2001-2006
15. Coverage of unemployment benefits, 1995-2006
68
16. Share of unemployed participate in ALMP, 1995-2005
17. Expenditures on PLMP and ALMP as percentage of GDP
18. Share of total expenditures on social protection as percentage of GDP and
government budget, 1995-2006
19. Total paid work days due to pregnancy and birth and for child care
20. Dependency between the Active Labour Market Policy (ALMP) share in GDP
and employment rate, 1995-2005
21. Connection between the ALMP coverage and employment rate, 1995-2005
22. Connection between the PLMP and unemployment rate, 1995-2005
Annex Table 1 – Some macroeconomic and financial indicators (1995-2006) Table 2 –Income levels in EURO equivalent (1997-2006) Table 3 – Population below, in and over working age in Bulgaria by sex (1990-2006) Table 4 – Labour Market Indicators, Bulgaria
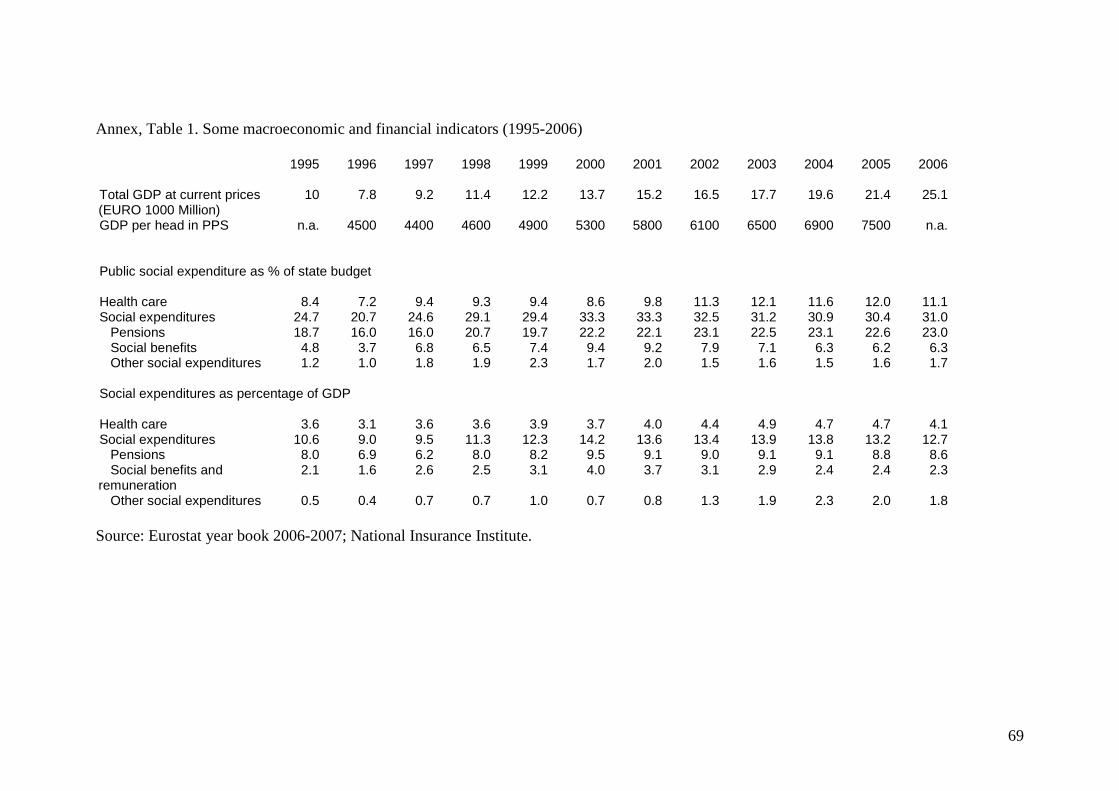
69
Annex, Table 1. Some macroeconomic and financial indicators (1995-2006)
1995 1996 1997 1998 1999 2000 2001 2002 2003 2004 2005 2006
Total GDP at current prices (EURO 1000 Million)
10 7.8 9.2 11.4 12.2 13.7 15.2 16.5 17.7 19.6 21.4 25.1
GDP per head in PPS n.a. 4500 4400 4600 4900 5300 5800 6100 6500 6900 7500 n.a.
Public social expenditure as % of state budget
Health care 8.4 7.2 9.4 9.3 9.4 8.6 9.8 11.3 12.1 11.6 12.0 11.1 Social expenditures 24.7 20.7 24.6 29.1 29.4 33.3 33.3 32.5 31.2 30.9 30.4 31.0 Pensions 18.7 16.0 16.0 20.7 19.7 22.2 22.1 23.1 22.5 23.1 22.6 23.0 Social benefits 4.8 3.7 6.8 6.5 7.4 9.4 9.2 7.9 7.1 6.3 6.2 6.3 Other social expenditures 1.2 1.0 1.8 1.9 2.3 1.7 2.0 1.5 1.6 1.5 1.6 1.7
Social expenditures as percentage of GDP
Health care 3.6 3.1 3.6 3.6 3.9 3.7 4.0 4.4 4.9 4.7 4.7 4.1 Social expenditures 10.6 9.0 9.5 11.3 12.3 14.2 13.6 13.4 13.9 13.8 13.2 12.7 Pensions 8.0 6.9 6.2 8.0 8.2 9.5 9.1 9.0 9.1 9.1 8.8 8.6 Social benefits and remuneration
2.1 1.6 2.6 2.5 3.1 4.0 3.7 3.1 2.9 2.4 2.4 2.3
Other social expenditures 0.5 0.4 0.7 0.7 1.0 0.7 0.8 1.3 1.9 2.3 2.0 1.8 Source: Eurostat year book 2006-2007; National Insurance Institute.
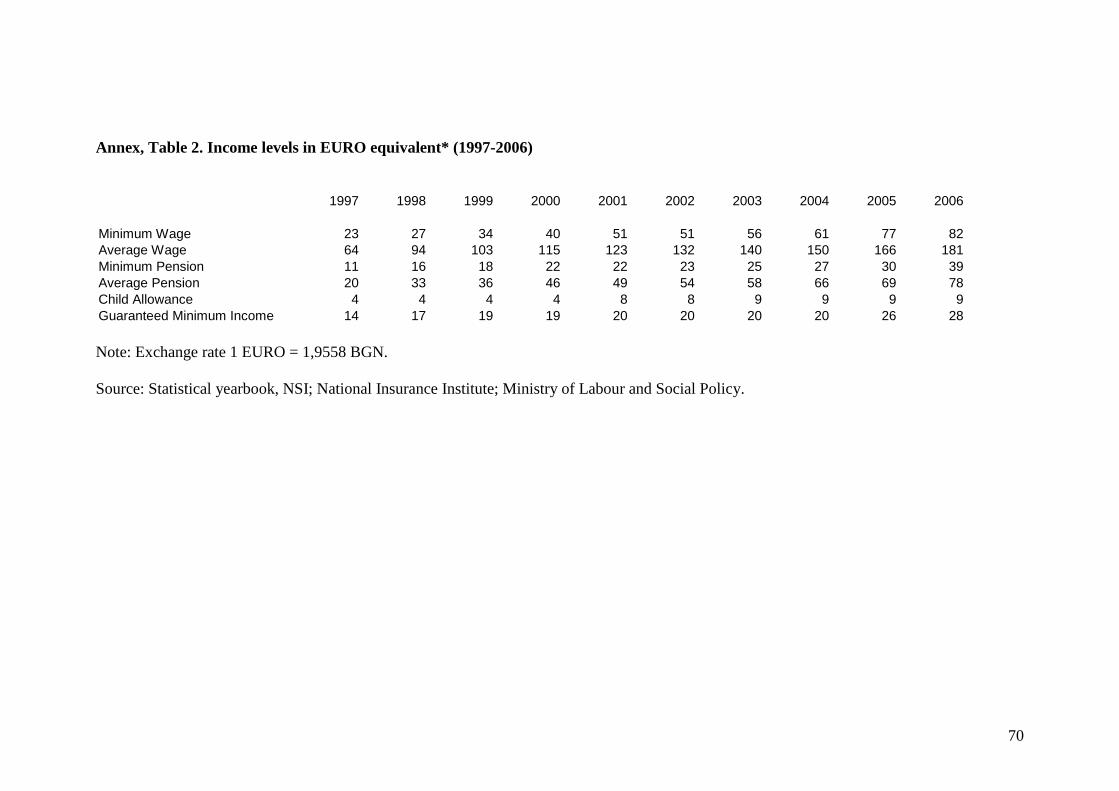
70
Annex, Table 2. Income levels in EURO equivalent* (1997-2006)
1997 1998 1999 2000 2001 2002 2003 2004 2005 2006
Minimum Wage 23 27 34 40 51 51 56 61 77 82 Average Wage 64 94 103 115 123 132 140 150 166 181 Minimum Pension 11 16 18 22 22 23 25 27 30 39 Average Pension 20 33 36 46 49 54 58 66 69 78 Child Allowance 4 4 4 4 8 8 9 9 9 9 Guaranteed Minimum Income 14 17 19 19 20 20 20 20 26 28 Note: Exchange rate 1 EURO = 1,9558 BGN. Source: Statistical yearbook, NSI; National Insurance Institute; Ministry of Labour and Social Policy.
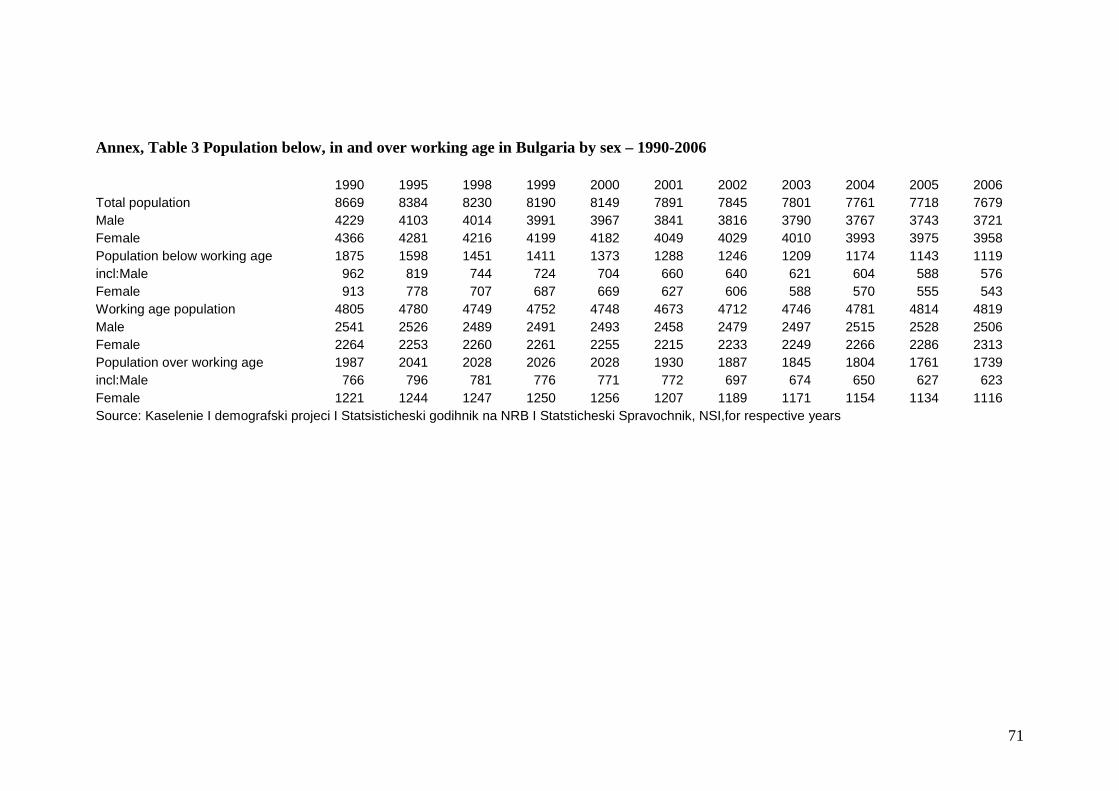
71
Annex, Table 3 Population below, in and over working age in Bulgaria by sex – 1990-2006 1990 1995 1998 1999 2000 2001 2002 2003 2004 2005 2006 Total population 8669 8384 8230 8190 8149 7891 7845 7801 7761 7718 7679 Male 4229 4103 4014 3991 3967 3841 3816 3790 3767 3743 3721 Female 4366 4281 4216 4199 4182 4049 4029 4010 3993 3975 3958 Population below working age 1875 1598 1451 1411 1373 1288 1246 1209 1174 1143 1119 incl:Male 962 819 744 724 704 660 640 621 604 588 576 Female 913 778 707 687 669 627 606 588 570 555 543 Working age population 4805 4780 4749 4752 4748 4673 4712 4746 4781 4814 4819 Male 2541 2526 2489 2491 2493 2458 2479 2497 2515 2528 2506 Female 2264 2253 2260 2261 2255 2215 2233 2249 2266 2286 2313 Population over working age 1987 2041 2028 2026 2028 1930 1887 1845 1804 1761 1739 incl:Male 766 796 781 776 771 772 697 674 650 627 623 Female 1221 1244 1247 1250 1256 1207 1189 1171 1154 1134 1116 Source: Kaselenie I demografski projeci I Statsisticheski godihnik na NRB I Statsticheski Spravochnik, NSI,for respective years
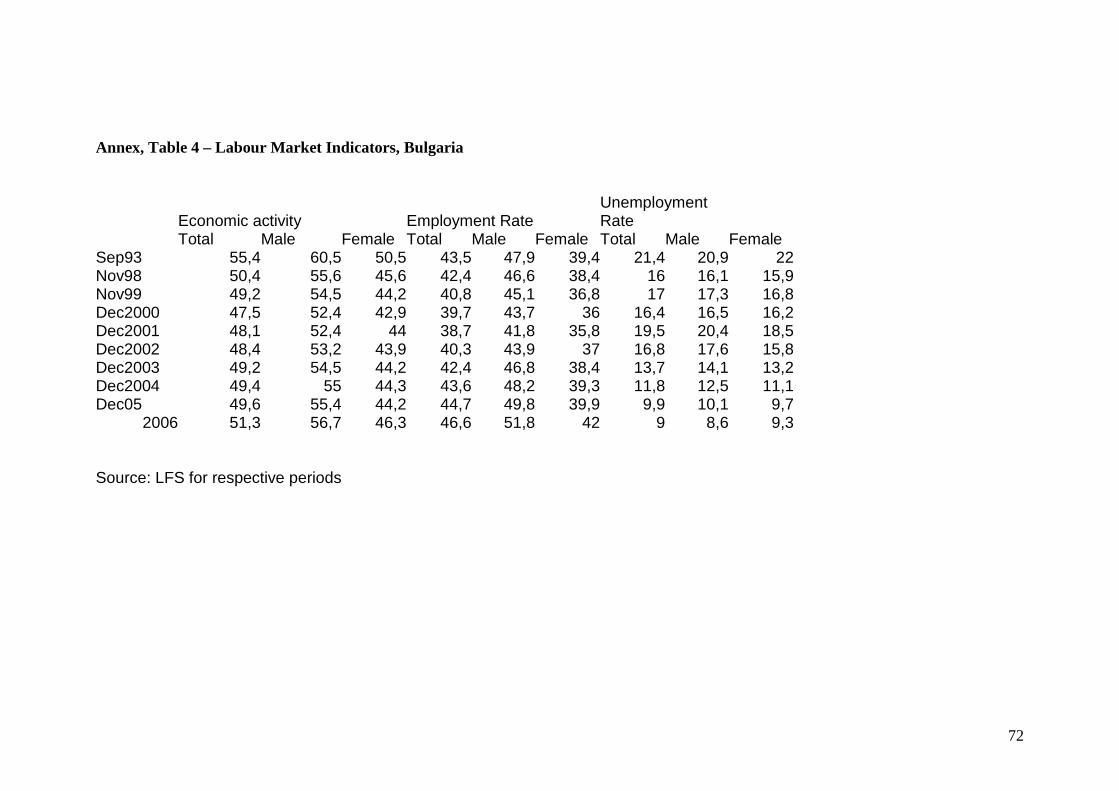
72
Annex, Table 4 – Labour Market Indicators, Bulgaria
Economic activity Employment Rate Unemployment Rate
Total Male Female Total Male Female Total Male Female Sep93 55,4 60,5 50,5 43,5 47,9 39,4 21,4 20,9 22Nov98 50,4 55,6 45,6 42,4 46,6 38,4 16 16,1 15,9Nov99 49,2 54,5 44,2 40,8 45,1 36,8 17 17,3 16,8Dec2000 47,5 52,4 42,9 39,7 43,7 36 16,4 16,5 16,2Dec2001 48,1 52,4 44 38,7 41,8 35,8 19,5 20,4 18,5Dec2002 48,4 53,2 43,9 40,3 43,9 37 16,8 17,6 15,8Dec2003 49,2 54,5 44,2 42,4 46,8 38,4 13,7 14,1 13,2Dec2004 49,4 55 44,3 43,6 48,2 39,3 11,8 12,5 11,1Dec05 49,6 55,4 44,2 44,7 49,8 39,9 9,9 10,1 9,7
2006 51,3 56,7 46,3 46,6 51,8 42 9 8,6 9,3 Source: LFS for respective periods
Related Documents