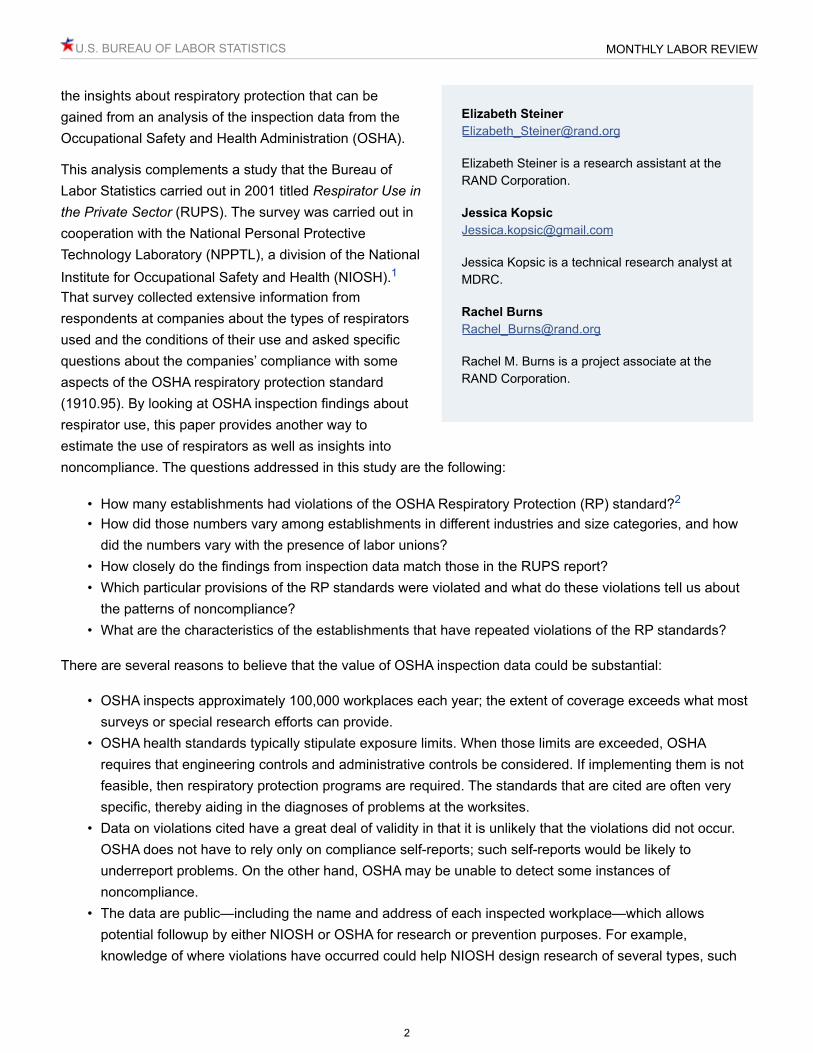
1 Using OSHA inspection data to analyze respirator protection program compliance Several million American workers wear respirators on a regular basis, and the Occupational Safety and Health Administration (OSHA) requires that nonagricultural firms have a respiratory protection program. This article uses the OSHA inspection data base to examine all inspections in manufacturing in 47 states from 1999 through 2006; the examination starts with 1999 because an expanded OSHA respiratory program standard became effective in late 1998. The article identifies all inspections and all establishments at which respiratory protection (RP) violations were cited, and it compares the prevalence of violations by industry with the prevalence reported in a recent Bureau of Labor Statistics survey of respirator use. Multivariate analyses are used to identify the roles of industry, establishment size, union status, and employee participation in the inspection on noncompliance at the inspection level and for repeated inspections at the same establishment. The authors find that the pattern of noncompliance across industries mostly mirrors the survey findings about the prevalence of requirements for respirator use, although the chemical industry has fewer violations than expected. The probability of citing an RP violation is similar across establishment size categories, except for a large drop for establishments with over 200 workers. The presence of a worker accompanying the inspector increases the probability that a respiratory program violation will be cited; the presence of a union slightly decreases it. Despite recent advances, knowledge is limited about the extent to which workers who are exposed to noise, toxic materials, and other risks are protected by personal protective equipment (PPE). This article explores some of John Mendeloff [email protected] John Mendeloff is a professor at the University of Pittsburgh and the director of the RAND Corporation Center for Health and Safety in the Workplace. Maryann D’Alessandro [email protected] Maryann D'Alessandro is the director of the National Personal Protective Technology Laboratory, Centers for Disease Control and Prevention. Hangsheng Liu [email protected] Hangsheng Liu is a policy researcher at the RAND Corporation. December 2013

Welcome message from author
This document is posted to help you gain knowledge. Please leave a comment to let me know what you think about it! Share it to your friends and learn new things together.
Transcript
1
Using OSHA inspection data to analyze respirator protection program complianceSeveral million American workers wear respirators on a regular basis, and the Occupational Safety and Health Administration (OSHA) requires that nonagricultural firms have a respiratory protection program. This article uses the OSHA inspection data base to examine all inspections in manufacturing in 47 states from 1999 through 2006; the examination starts with 1999 because an expanded OSHA respiratory program standard became effective in late 1998. The article identifies all inspections and all establishments at which respiratory protection (RP) violations were cited, and it compares the prevalence of violations by industry with the prevalence reported in a recent Bureau of Labor Statistics survey of respirator use. Multivariate analyses are used to identify the roles of industry, establishment size, union status, and employee participation in the inspection on noncompliance at the inspection level and for repeated inspections at the same establishment. The authors find that the pattern of noncompliance across industries mostly mirrors the survey findings about the prevalence of requirements for respirator use, although the chemical industry has fewer violations than expected. The probability of citing an RP violation is similar across establishment size categories, except for a large drop for establishments with over 200 workers. The presence of a worker accompanying the inspector increases the probability that a respiratory program violation will be cited; the presence of a union slightly decreases it.
Despite recent advances, knowledge is limited about the extent to which workers who are exposed to noise, toxic materials, and other risks are protected by personal protective equipment (PPE). This article explores some of
John [email protected]
John Mendeloff is a professor at the University of Pittsburgh and the director of the RAND Corporation Center for Health and Safety in the Workplace.
Maryann D’[email protected]
Maryann D'Alessandro is the director of the National Personal Protective Technology Laboratory, Centers for Disease Control and Prevention.
Hangsheng [email protected]
Hangsheng Liu is a policy researcher at the RAND Corporation.
December 2013
U.S. BUREAU OF LABOR STATISTICS MONTHLY LABOR REVIEW
2
the insights about respiratory protection that can be gained from an analysis of the inspection data from the Occupational Safety and Health Administration (OSHA).
This analysis complements a study that the Bureau of Labor Statistics carried out in 2001 titled Respirator Use in the Private Sector (RUPS). The survey was carried out in cooperation with the National Personal Protective Technology Laboratory (NPPTL), a division of the National Institute for Occupational Safety and Health (NIOSH).1
That survey collected extensive information from respondents at companies about the types of respirators used and the conditions of their use and asked specific questions about the companies’ compliance with some aspects of the OSHA respiratory protection standard (1910.95). By looking at OSHA inspection findings about respirator use, this paper provides another way to estimate the use of respirators as well as insights into noncompliance. The questions addressed in this study are the following:
• How many establishments had violations of the OSHA Respiratory Protection (RP) standard?2
• How did those numbers vary among establishments in different industries and size categories, and how did the numbers vary with the presence of labor unions?
• How closely do the findings from inspection data match those in the RUPS report?• Which particular provisions of the RP standards were violated and what do these violations tell us about
the patterns of noncompliance?• What are the characteristics of the establishments that have repeated violations of the RP standards?
There are several reasons to believe that the value of OSHA inspection data could be substantial:
• OSHA inspects approximately 100,000 workplaces each year; the extent of coverage exceeds what most surveys or special research efforts can provide.
• OSHA health standards typically stipulate exposure limits. When those limits are exceeded, OSHA requires that engineering controls and administrative controls be considered. If implementing them is not feasible, then respiratory protection programs are required. The standards that are cited are often very specific, thereby aiding in the diagnoses of problems at the worksites.
• Data on violations cited have a great deal of validity in that it is unlikely that the violations did not occur. OSHA does not have to rely only on compliance self-reports; such self-reports would be likely to underreport problems. On the other hand, OSHA may be unable to detect some instances of noncompliance.
• The data are public—including the name and address of each inspected workplace—which allows potential followup by either NIOSH or OSHA for research or prevention purposes. For example, knowledge of where violations have occurred could help NIOSH design research of several types, such
Elizabeth [email protected]
Elizabeth Steiner is a research assistant at the RAND Corporation.
Jessica [email protected]
Jessica Kopsic is a technical research analyst at MDRC.
Rachel [email protected]
Rachel M. Burns is a project associate at the RAND Corporation.

U.S. BUREAU OF LABOR STATISTICS MONTHLY LABOR REVIEW
3
as choosing facilities to investigate to see whether defects in respiratory protection programs are related to physiological changes in workers. When these RP programs are required, employers are often required to maintain medical records. Knowledge of where violations were cited in one inspection but not in a subsequent one could be used to identify workplaces where NIOSH might study how improvements in protection came about.
• The OSHA data often, although not always, provide exposure measurements at workplaces where toxic substance exposures have been present. Knowing exposure levels helps us interpret the information on PPE use.
• The OSHA data are continually updated, hence providing the potential for longitudinal studies.• The OSHA data include a set, although limited, of establishment characteristics (industry, size, location,
union status, past inspection history) that may be useful for predicting outcomes.
Only one prior study has used OSHA inspection data to look at the quality of respirator programs.3 It reviewed inspection data from 1976 to 1982 in the states where federal OSHA operated the enforcement program. Thus it does not provide information about the much more detailed respiratory protection standard adopted in 1998. It did calculate that 12 percent of health inspections cited 1 or more violations of the RP standard in effect during the 1976–1982 period. Also, by estimating that the compliance with the RP was examined in only 37 percent of health inspections, the study concluded that 34 percent of the inspections in which respirator programs were reviewed resulted in a citation.4
The limitations of OSHA data for surveillance are reviewed in the discussion section of this article. One obvious issue is that the OSHA data are not collected through a random process and so representativeness cannot be assured. Nevertheless, a number of researchers have used the data for studies of exposure prevalence and trends.5 As a study on noise reported, “The exposure measurements in IMIS [Integrated Management Information System, OSHA inspection data] can be a useful surveillance tool, but interpretation of the data is dependent on the sampling strategies used by OSHA compliance officers and consultants applicable at the time the measurements are collected.”6 This conclusion applies to exposure data for other hazards as well. The data’s usefulness for characterizing exposures also depends upon the volume of data. The study concluded that the number of samples was adequate to characterize noise exposures in manufacturing but not in other sectors. For this study, our 1999–2006 data set includes over 30,000 respiratory program violations at manufacturing firms.
Respiratory protection standardOSHA’s respiratory protection standard was promulgated on January 8, 1998 and took effect on October 5, 1998. It has over 150 separate provisions within the 13 major sections of the standard—1910.134(a) to 1910.134(m).
In brief, these are the RP standard’s requirements for employers:
• Employers must provide respirators where needed to protect workers’ health.• When respirators are required, employers must establish a written RP program which assures that the
activities below will be carried out.

U.S. BUREAU OF LABOR STATISTICS MONTHLY LABOR REVIEW
4
• When employees wear respirators when they are not required to, the employer must establish a partial RP program to ensure that respirator use itself does not harm the worker.
• Employers must assess whether respirators are needed and provide the appropriate type.• Employers must make sure that employees are medically fit to wear respirators and that tight-fitting
respirators have the proper fit.• Employers must ensure that workers wear their respirators appropriately and that equipment is properly
cleaned and maintained.• Employers must train workers to use respirators properly.• Employers must keep records to document that the preceding steps have been carried out and
periodically evaluate their RP program.
Data and methodsThe OSHA Integrated Management Information System (IMIS) collects information from inspections carried out by compliance officers. Since 1991, the IMIS has included data from every state. We obtained inspection data from OSHA through 2006 and linked all violation data to the inspections in which the violations were cited. However, the IMIS does not have a common identifier either at the establishment or the firm level. (In the IMIS, the term “establishment” generally refers to a single workplace or facility.) Although some linking can be done by simple name and address matching, there are variations in how names and addresses are recorded, which can leave uncertainty in many cases. Because linking at the establishment level is important for this study (as well as many others), we rely on probabilistic matching to link inspections to the establishment level.7
In 29 states, the federal OSHA directly operates the enforcement program in the private sector. The other states operate their own enforcement programs upon OSHA’s certification that the state’s program is “as effective as” the federal program. The great majority of these “state plan” states have adopted all of the federal standards and use the same codes. However, a few states, including California, Oregon, and Washington, have their own distinct set of standards for all or some hazards. For this reason, we excluded these three states from this analysis.
The IMIS variables that we use in this study include
• number of employees at the establishment• Standard Industrial Classification• inspection type—e.g., programmed or complaint• safety or health inspection• scope—comprehensive or limited• union—yes or no• whether a worker accompanied the compliance officer• year—i.e., opening date of the inspection• standards cited• current violation type—e.g., serious, other than serious

U.S. BUREAU OF LABOR STATISTICS MONTHLY LABOR REVIEW
5
Table 1 presents the number of RP violations cited by OSHA in different industry sectors from 1999 to 2006. We present our findings for the manufacturing sector as a whole and for the major 18 two-digit industries within manufacturing. We excluded inspections in tobacco (SIC 21) and leather (SIC 31) from our data because of the small number of inspections in each industry.
IndustryTotal in
industry
Number
inspected
Number with
health
inspections
Number
with at
least 1
RPV
Number with
RPVs cited in
health
inspections
Percent
of total
with at
least 1
RPV
(=col4/
col1)
Percent
inspected
with RPVs
(=col4/col2)
Percent with
health
inspections
where RPVs
were cited
(=col5/col3)
Percent
requiring
respirator
use (RUPS)
All manufacturing 325,746 94,813 40,339 11,397 9,059 3.5 12.0 22.0 —
SIC 20—Food products 18,157 7,147 3,115 713 570 3.9 10.0 18.0 20.0
SIC 22—Textile mill products
5,549 1,473 689 127 113 2.3 9.0 16.0 12.0
SIC 23—Apparel 17,117 1,386 509 61 48 0.4 4.0 9.0 5.0
SIC 24—Lumber and wood
31,112 12,268 3,538 884 599 2.8 7.0 17.0 6.0
SIC 25—Furniture 10,026 3,786 1,644 546 415 5.4 14.0 25.0 18.0
SIC 26—Paper 5,671 2,216 910 108 81 1.9 5.0 9.0 12.0SIC 27—Printing, publishing
52,272 2,965 1,283 91 74 0.2 3.0 6.0 0.0
SIC 28—Chemicals 10,592 3,585 2,546 748 680 7.1 21.0 27.0 48.0
SIC 29—Petroleum refining
1,886 626 294 81 68 4.3 13.0 23.0 22.0
SIC 30—Rubber 14,311 6,822 2,786 606 491 4.2 9.0 18.0 20.0
SIC 32—Stone, clay, glass
14,399 6,583 4,007 1,337 1,151 9.3 20.0 29.0 21.0
SIC 33—Primary metal 5,787 3,519 2,044 668 586 11.9 19.0 29.0 35.0
SIC 34—Fabricated metal
32,609 18,610 7,124 2,380 1,781 7.3 13.0 25.0 21.0
SIC 35—Machinery 47,894 10,910 3,617 1,144 849 2.4 10.0 23.0 16.0
SIC 36—Electric 13,117 2,874 1,566 325 281 2.5 11.0 18.0 21.0
Table 1. Numbers of establishments requiring respirator use and cited for respiratory program violations (RP violations), 1999–2006
See footnotes at end of table.

U.S. BUREAU OF LABOR STATISTICS MONTHLY LABOR REVIEW
6
Note: Column 1 (total establishments in industry) is based on 1997 County Business Patterns. All figures exclude California, Oregon, and Washington. RP violations exclude 1910.134(c)(2).Sources: OSHA IMIS, BLS RUPS study, and authors' calculations.
Survey of respirator use in the private sectorIn 2002, the Bureau of Labor Statistics (BLS) carried out a survey of respirator use on behalf of NIOSH. The mail survey of “Respiratory Usage in Private Sector Firms” (RUPS) was conducted from August 2001 through January 2002 using a representative sample of U.S. employers. Establishments included in the sample were selected from the Longitudinal Establishment Database, which is maintained by the Bureau of Labor Statistics. All establishments in the survey were located in the 50 U.S. states and the District of Columbia. The final sample size was 40,002 private industry establishments. The survey provides estimates of the numbers of establishments and employees who were in establishments in 2001 where respiratory equipment was required or worn voluntarily during the previous 12 months.
The survey also provides estimates of the types of respirators used and information about how establishments have implemented OSHA’s respiratory protection standard. In addition, the survey provides breakdowns by establishment size as well as information about the types of hazards that the respirators are protecting against.
The survey does have some shortcomings regarding surveillance. The most detailed industry level at which it presents findings is the two-digit SIC; more-fine-grained industry categories would be useful. Respondents were not asked to specify the actual levels of exposures or whether the facility had been cited by OSHA for RP violations.
In addition, we don’t know whether respirator use was occasional or continuous. Finally, we do not know how reliable the answers provided by respondents were or whether some establishments that should have been using respiratory protection were not.
IndustryTotal in
industry
Number
inspected
Number with
health
inspections
Number
with at
least 1
RPV
Number with
RPVs cited in
health
inspections
Percent
of total
with at
least 1
RPV
(=col4/
col1)
Percent
inspected
with RPVs
(=col4/col2)
Percent with
health
inspections
where RPVs
were cited
(=col5/col3)
Percent
requiring
respirator
use (RUPS)
SIC 37—Transportation equipment
9,961 6,158 2,841 1,025 810 10.3 17.0 29.0 41.0
SIC 38—Instruments 9,229 1,019 577 126 109 1.4 12.0 19.0 14.0
SIC 39—Miscellaneous manufacturing
15,112 2,866 1,249 427 353 2.8 15.0 28.0 19.0
Table 1. Numbers of establishments requiring respirator use and cited for respiratory program violations (RP violations), 1999–2006
U.S. BUREAU OF LABOR STATISTICS MONTHLY LABOR REVIEW
7
In this report, we use only the survey’s estimates of what percentage of establishments in each industry required respirator use during the prior 12 months. We compare this figure with the percentage of establishments in each industry that had been cited by OSHA for RP violations from 1999 to 2006. Although these measures are different, the comparison does help us see whether the OSHA data provide a similar picture of industries using respiratory protection.
Measuring rates of noncompliance. One issue was what measure to use to assess the prevalence of noncompliance. To compare our data with the RUPS data, we used a measure of the number of establishments where violations were cited. (During the period we looked at, some establishments received multiple inspections.) One measure of noncompliance prevalence could be the number of establishments with RP violations divided by all establishments in the industry (in the 47 states in our sample). That would be a valid estimate assuming the establishments actually cited for noncompliance were the only ones that were noncompliant; however, that assumption is untenable because only a minority of establishments were inspected and some of those that were not inspected had violations.
A second potential measure would be the percentage of inspected establishments that were cited for RP violations during this period. This second measure would be a valid one if inspected and uninspected manufacturing establishments in each industry were equally likely to be cited for RP violations. This assumption is reasonable, although it ignores the fact that, while most inspections are “safety inspections” rather than “health inspections,” over 90 percent of the RP violations were cited in health inspections. Apparently, in safety inspections the inspectors are generally not looking for respirator program violations.
Following through on that logic, a third measure could be RP violations only in health inspections.8 This third measure would overestimate the prevalence of noncompliance as some violations were identified in safety inspections. However, it seems likely to be a better measure than the others.
Two other factors further complicate the estimates. First, it is likely that there will be RP violations that are missed even in the health inspections. Second, because of entrances and exits, the total number of establishments in existence during the 8-year period we are examining exceeds the number that existed in
1997, the year we employ for the denominator, perhaps by as much as 50 percent.9 These two factors work in opposite directions. The first reduces the establishments-with-violations number in the numerator. The second reduces the establishments number in the denominator. We will use measure 3 in our discussions, but the
reader should keep in mind the uncertainties.10 Also, to the extent that we are concerned with the relative position of the industries, the choice between measure 2 and measure 3 poses fewer problems; the correlation between them for the 18 industries we examine is +0.93.
We also carried out multivariate analyses of the factors that are associated with a greater likelihood of RP violations a) being cited at an establishment and b) being cited in a subsequent inspection at an establishment that had an RP violation. We used negative binomial regressions because a goodness of fit test rejected the assumptions required for Poisson regression.
U.S. BUREAU OF LABOR STATISTICS MONTHLY LABOR REVIEW
8
FindingsThe OSHA IMIS reports more than 30,000 violations of the respiratory protection program standard and associated overexposures in manufacturing between 1999 (which was shortly after the standard became effective) and the end of 2006. Table 1 shows the number of establishments in each industry where OSHA inspections cited violations of the RP standard.11 The first column provides the 1997 estimate of the number of establishments in each industry, based on County Business Patterns. (We exclude the tobacco and leather industries because they have so few establishments and, as explained, we exclude establishments and inspections in California, Oregon, and Washington.)
The second and third columns show the number of establishments inspected during this period and the number of them that had at least one health inspection. The fourth column presents the number of establishments where OSHA cited a firm for overexposure to a toxic substance or to the RP standard.12 Column 5 presents the number of establishments with one or more RP violations where the establishment was cited for those violations in a health inspection.
Columns 7 through 9 in table 1 provide a basis for estimates of the prevalence of violations of the RP standard using the three measures described in the methods section. For example, the 3.9 percent for the food industry in column 7 would be a valid estimate assuming that the establishments actually cited for noncompliance were the only ones that were noncompliant. The 10-percent figure in column 8 (measure 2) would be a valid measure if inspected and uninspected manufacturing establishments in each industry were equally likely to be cited for RP violations. The 18-percent figure in column 9 (measure 3) is, as we indicated, the one that we think comes closest to measuring the use (and misuse) of respirators in places where they are required. That 18-percent projection would indicate, for example, that about 3,300 food industry establishments are estimated to have RP violations.13
Finally, column 10 shows the RUPS estimate of the percentage of establishments in each industry where respirator use was required during the last 12 months. (The exact period would depend upon when in 1991 the survey was given to the establishment.)14
The disparities between column 9 and column 10 appear to provide insights into the extent to which respiratory programs in different industries are well implemented. Most strikingly, RUPS indicates that 48 percent of chemical industry establishments require respirator use but only 27 percent of health inspections in the industry cited RP violations. Another industry where respirator violations appear to be less frequent than respirator use might suggest is transportation equipment (SIC 37), where RUPS shows required respirator use in 41 percent of establishments but inspectors cited violations in only 29 percent of health inspections.
At the other end of the spectrum, in a number of industries the RUPS report indicated a lower prevalence of required respirator use than the percentage of establishments cited for RP violations. The lumber and wood industry led the way with 6-percent prevalence in RUPS but 17 percent of health inspections with RP violations. Miscellaneous manufacturing (19 percent and 28 percent) and stone, clay, and glass (21 percent and 29 percent) were next in line.

U.S. BUREAU OF LABOR STATISTICS MONTHLY LABOR REVIEW
9
Figure 1 plots the percentage of establishments requiring respirator use (from the RUPS report) against the percentage of establishments with health inspections in which RP violations were cited (column 9 in table 1). The correlation coefficient here is +0.75. (If we plot the RUPS figures against the percentage of all inspected establishments that were cited for RP violations, the correlation is +0.85.) The RUPS survey is reporting on establishments’ use of respirators while the OSHA data are reporting on establishments that either are or should be using respirators and that are not complying with the OSHA standard. It is hardly surprising that industries where respirators are used more widely also have more establishments where they are misused. At least at the two-digit SIC level, this finding indicates that estimates from the IMIS generally provide good estimates of the percentage of establishments requiring respirator use.
If we view the RUPS survey as a “gold standard” for the prevalence of respirator use, we can note whether industries have more or less misuse than would be expected simply on the basis of respirator prevalence. Of course, our interpretation of these findings must be qualified. We know that many things might account for disparities. For example, if respirator use in an industry tends to be more episodic and short term, we would not expect inspections to detect and cite as many violations.
The analysis so far has focused on RP violations per establishment. The reason is that we were interested in comparing inspection data with RUPS data collected at the establishment level. Establishments in industries where inspections are more frequent will tend to have a larger gap between the percentage of inspections with RP violations and the percentage of establishments with RP violations. We did find a correlation of +0.33 between each industry’s percentage of inspections with RP violations and the number of inspections per establishment in the industry. In other words, establishments are somewhat more likely to get multiple inspections in industries where the yield of RP violations is higher. Thus, establishments with multiple
U.S. BUREAU OF LABOR STATISTICS MONTHLY LABOR REVIEW
10
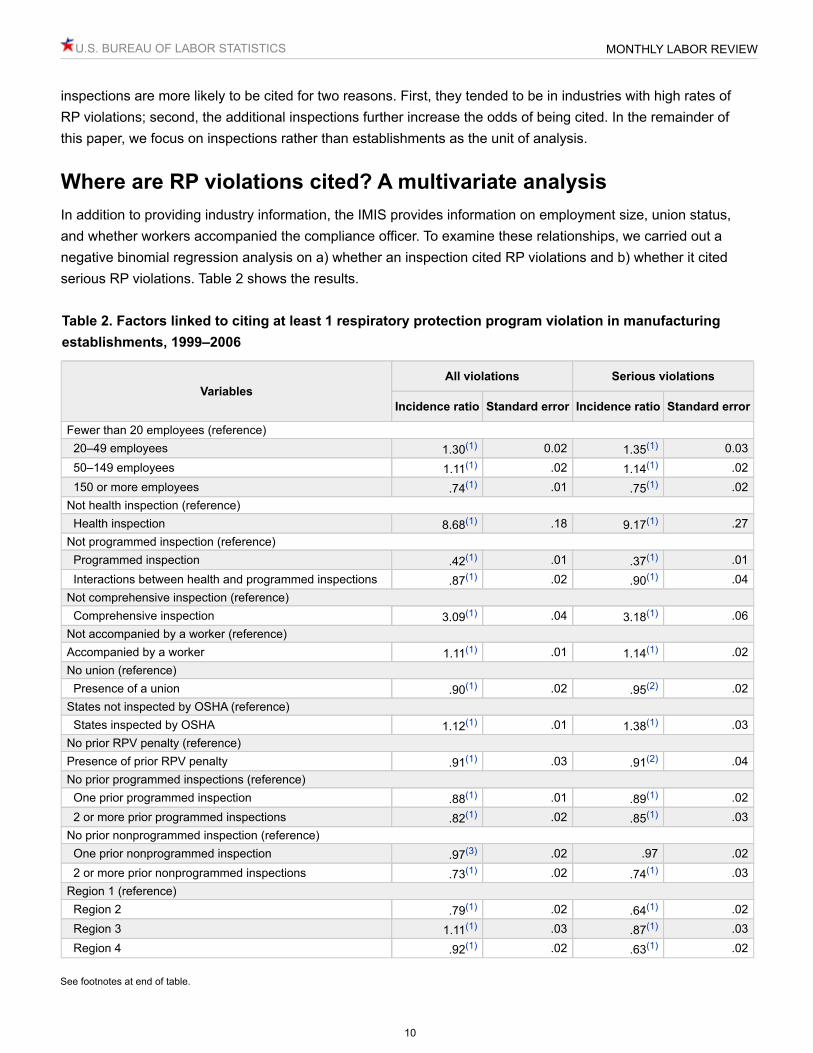
inspections are more likely to be cited for two reasons. First, they tended to be in industries with high rates of RP violations; second, the additional inspections further increase the odds of being cited. In the remainder of this paper, we focus on inspections rather than establishments as the unit of analysis.
Where are RP violations cited? A multivariate analysisIn addition to providing industry information, the IMIS provides information on employment size, union status, and whether workers accompanied the compliance officer. To examine these relationships, we carried out a negative binomial regression analysis on a) whether an inspection cited RP violations and b) whether it cited serious RP violations. Table 2 shows the results.
VariablesAll violations Serious violations
Incidence ratio Standard error Incidence ratio Standard error
Fewer than 20 employees (reference) 20–49 employees 1.30(1) 0.02 1.35(1) 0.03 50–149 employees 1.11(1) .02 1.14(1) .02 150 or more employees .74(1) .01 .75(1) .02Not health inspection (reference) Health inspection 8.68(1) .18 9.17(1) .27Not programmed inspection (reference) Programmed inspection .42(1) .01 .37(1) .01 Interactions between health and programmed inspections .87(1) .02 .90(1) .04Not comprehensive inspection (reference) Comprehensive inspection 3.09(1) .04 3.18(1) .06Not accompanied by a worker (reference) Accompanied by a worker 1.11(1) .01 1.14(1) .02No union (reference) Presence of a union .90(1) .02 .95(2) .02States not inspected by OSHA (reference) States inspected by OSHA 1.12(1) .01 1.38(1) .03No prior RPV penalty (reference) Presence of prior RPV penalty .91(1) .03 .91(2) .04No prior programmed inspections (reference) One prior programmed inspection .88(1) .01 .89(1) .02 2 or more prior programmed inspections .82(1) .02 .85(1) .03No prior nonprogrammed inspection (reference) One prior nonprogrammed inspection .97(3) .02 .97 .02 2 or more prior nonprogrammed inspections .73(1) .02 .74(1) .03Region 1 (reference) Region 2 .79(1) .02 .64(1) .02 Region 3 1.11(1) .03 .87(1) .03 Region 4 .92(1) .02 .63(1) .02
Table 2. Factors linked to citing at least 1 respiratory protection program violation in manufacturing establishments, 1999–2006
See footnotes at end of table.

U.S. BUREAU OF LABOR STATISTICS MONTHLY LABOR REVIEW
11
Notes:(1) p < 0.01.(2) p < 0.05.(3) p < 0.10.Sources: OSHA IMIS and authors' calculations.
The explanatory variables fall into three categories: characteristics of the present inspection, characteristics of the establishment (size, industry, unionization), and characteristics of the establishment’s inspection history.
Holding other factors constant, health inspections are about 9 times more likely than safety inspections to cite RP violations. Comprehensive inspections are 3 times more likely than limited inspections to cite RP violations. Programmed inspections are only about 40 percent as likely as complaint inspections to cite the violations. Inspectors who are accompanied by an employee during the inspection are somewhat more likely to cite RP violations. Federal OSHA inspectors are somewhat more likely to cite violations than their counterparts in state-run OSHA programs, especially for serious violations. Finally, most federal OSHA regions are similar in their
VariablesAll violations Serious violations
Incidence ratio Standard error Incidence ratio Standard error
Region 5 .65(1) .02 .55(1) .02 Region 6 .81(1) .02 .65(1) .02 Region 7 .82(1) .03 .59(1) .03 Region 8 1.37(1) .04 1.44(1) .05 Region 9 .76(1) .03 .50(1) .03 Region 10 1.18(1) .06 .96 .07SIC 20 (reference) SIC 22 .73(1) .04 .44(1) .04 SIC 23 .56(1) .04 .36(1) .04 SIC 24 .96 .03 .70(1) .03 SIC 25 1.46(1) .05 1.02 .05 SIC 26 .48(1) .03 .33(1) .03 SIC 27 .34(1) .02 .21(1) .02 SIC 28 1.39(1) .04 1.23(1) .05 SIC 29 1.19(2) .08 1.20(2) .11 SIC 30 .94(3) .03 .77(1) .03 SIC 32 1.85(1) .05 1.85(1) .07 SIC 33 1.58(1) .05 1.64(1) .07 SIC 34 1.60(1) .04 1.34(1) .05 SIC 35 1.49(1) .04 1.26(1) .05 SIC 36 1.02 .04 .78(1) .04 SIC 37 1.74(1) .05 1.53(1) .06 SIC 38 1.07 .06 .89 .07 SIC 39 1.56(1) .06 1.23(1) .06
Table 2. Factors linked to citing at least 1 respiratory protection program violation in manufacturing establishments, 1999–2006
U.S. BUREAU OF LABOR STATISTICS MONTHLY LABOR REVIEW
12
citing patterns, but region 1 (New England) and especially region 8 (Mountain states) are somewhat more likely
than other regions to cite RP violations.15
Compared with the inspection characteristics, features of the establishments do not have as strong effects. Larger establishments are least likely to be cited: establishments with over 150 employees are only about half as likely to have RP violations cited in inspections as are plants with 20–49 workers. Plants with unions are about 15 percent less likely to be cited for RP violations. However, when an employee accompanies the inspector, the probability increases by about 20 percent for all plants. Because that practice is usually confined to union workplaces, the net effect is that unionized workplaces are somewhat more likely than nonunion workplaces to be cited.
The industry coefficients here show a rank order very close to that found in table 1. This means that the patterns we found in table 1 are not accounted for by the other variables introduced in this multivariate analysis.
The inspection history variables show that prior inspections, whether programmed or nonprogrammed, modestly reduce the probability of being cited for an RP violation. So does the citation of an RP violation in a prior inspection.
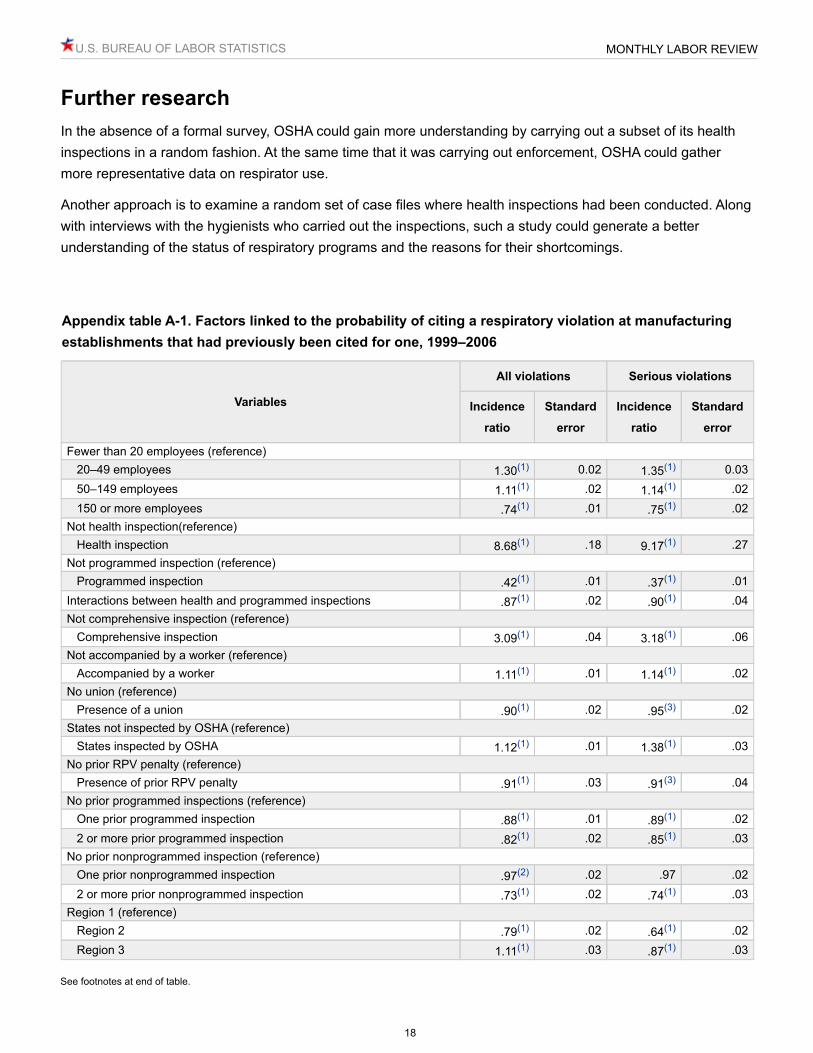
RP violations at establishments with multiple inspectionsWe also examined the establishments with multiple inspections during this period and identified those in which an inspection with an RP violation was followed by another inspection or inspections. What were the characteristics of those establishments which seemed to have continuing RP-standard noncompliance? There were 4,755 establishments with multiple inspections and an RP violation in an earlier inspection. Of these, 842 (almost 18 percent) were cited again for an RP violation. (The regression table for these results is appendix table A-1.)
More violations were found again for both health inspections and comprehensive inspections, although the effects were not as large as those shown in table 2. Federal OSHA inspectors were about 40 percent more likely than state inspectors to cite RPs in these inspections. The size of the penalty for the earlier RP violation had no effect on finding a serious RP violation in the subsequent inspection. However, employers who had several serious violations (unrelated to the RP violation) in the earlier inspection were about 50 percent more likely to have an RP violation again. We also found that the effect of additional inspections appears to be fairly linear. Thus, having two inspections after being cited doubles the probability of being cited again compared with having only one inspection after being cited.
The presence of a union was not significant in the analysis of subsequent inspections. However, the largest size category was only about half as likely to have another RP violation as were any of the smaller establishments. Industry effects were smaller in this analysis. The probability that later inspections would find another RP violation was elevated for establishments in the furniture, stone, transportation, and fabricated metals industries, although only for total violations, not for serious violations. These were the only cases where the industry effects were statistically significant at 0.05. These four industries were also among the five with the largest positive effects on violations in the analysis of all inspections.
U.S. BUREAU OF LABOR STATISTICS MONTHLY LABOR REVIEW
13
What is the nature of the problems that inspectors find?OSHA requires that engineering controls and administrative controls be explored before an employer is allowed to rely on respirators to protect workers exposed to toxins. Overexposing workers generally leads to a citation of sections 1910.1000 a–d or to a substance-specific citation for the approximately 15 health standards that OSHA has issued since 1972. Failure to require the use of respirators in the face of an overexposure generally leads to citations of section 1910.1000(e). When there is an overexposure and no respirator program has been implemented, OSHA will generally cite section 1910.134(a)(2) as well as 1910.1000(e).
Section 1910.134(a)(2) requires that employers maintain a written RP program whenever respirators are required to protect workers and stipulates that the program must contain the elements of 134(c). That section has two main subsections. Section 134(c)(1) lays out the requirements when respirator use is required. If there is no written program, section 134(c)(1) is cited. If the written program is missing an element, then a subsection of (c)(1) is cited. The actual activities that employers must carry out to implement the program are described in sections d–m. If these activities have not been implemented properly, those sections are cited. Thus a citation of section 134(c)(1) by itself means that the program is in place but the written program is not.
Section (c)(2) lays out the requirements for employers when respirator use is voluntary. In those cases, the employer still has obligations, although they are limited to providing information to the users and ensuring that respirator use does not harm them. Generally, this requires providing medical exams prior to allowing the worker to use the respirator—section 134(e)—and maintenance procedures to ensure that it remains sanitary—134(k). As with134(c)(1), 134c(2) by itself indicates only a paperwork violation. (Of course, the absence of written programs can be an indicator of a less-well-implemented program.)
The specific actions required by the RP program are laid out in sections 134(d) through 134(m):
• Sections 134(d) (selection of respirators) and 134(i) (providing pure air for air-supplied respirators) address appropriate equipment for the exposures.
• Sections 134(e) and 134(f) both address the appropriateness of the equipment for the worker. The first is described above; the second requires procedures for fit testing for tight-fitting respirators.
• Section 134(g) prescribes rules forbidding the use of tight-fitting respirators for workers with facial hair that could affect the seal, for leaving the work area before washing or cleaning respirators, and for carrying out work where there is an imminent danger to health or life.
• Section 134(h) requires that respirators shall be clean and stored properly.• Section 134(k) prescribes training activities.• Sections 134(l) and 134(m) (program evaluation and recordkeeping, respectively) are paperwork
requirements.
Table 3 shows the number of inspections in which provisions of the different sections were cited. (This table includes only provisions of section 1910.134 and thus excludes the standards that represent overexposures, e.g., 1910.1000). For example, of the 13,711 inspections where section 1910.134 was cited, section 1910.134(a) was cited in 1,113 inspections. In 819 of those (74 percent), it was the only section of the RP standard that was cited.

U.S. BUREAU OF LABOR STATISTICS MONTHLY LABOR REVIEW
14
Notes:(1) The violations cited in the sections of 1910.134 in table 4 include all of the subsections within those standards.Sources: OSHA IMIS and authors' calculations.
Several features about these figures are worth noting. First, most—9,068 (66 percent) of the inspections with RP violations—cited firms for inadequate or nonexistent written programs. In half of those cases (4,576, or 33 percent of total inspections with violations), the violation for the deficient written program was the only RP violation cited.
Second, the violation of the requirement of a written program for voluntary users (section 1934(c)(2)) was the sole citation most of the time (72 percent). This is largely because the activities required with voluntary respirator use usually do not go beyond medical exams and training. The great majority of section 1934(c)(2) violations were for failing to provide the required information brochure to the affected workers.
Third, in 1,113 inspections, the employer was cited for violations of section 1910.134(a). In the great majority of cases, the employer had no RP program and there were overexposures to employees. Usually, this provision is cited by itself because there is no need to cite other deficiencies.
Fourth, if we add together all cases in table 3 in which only a single section of standard 1910.134 was cited in
the inspection, we get 7,488, or 55 percent of all the inspections with RP violations.16 Among the other 6,200 inspections, over 2,000 cited at least 4 different sections of the standard.
Fifth, the most frequently cited of the other sections of the standard is 134(e), which requires medical exams to determine whether an employee is able to wear a respirator. Like the other requirements beginning with 134(d), 134(e) is rarely cited by itself but often goes along with failures of the written program.
Observation Total As the only 1910.134 section citedCited with
c(1)
Cited with
other
All inspections citing 1910.134 13,711 — — —Inspections citing section—(1)
134(a)—no program, overexposure 1,113 819 (74 percent of inspections with 134(a)) (6 percent of all inspections) — —
134(c)(1)—required respirator use 5,217 1,793 (34 percent of inspections with c(1)) — —
134(c)(2)—voluntary respirator use 3,851 2,783 (72 percent of inspections with c(2)) — —
Total, 134(c)(1) or (2) 9,068 4,576 (33 percent of all inspections) — —
134(d)—selection of respirators 2,055 449 (22 percent) 886 (43 percent)
720 (35 percent)
134(e)—medical exam 4,586 486 (11 percent) 2,599 (57 percent)
1,501 (32 percent)
134(f)—fit testing 3,614 311 (9 percent) 2,087 (58 percent)
1,216 (33 percent)
134(h)—maintenance 1,728 315 (18 percent) 828 (48 percent)
585 (34 percent)
134(k)—training 3,149 532 (17 percent) 1,735 (55 percent)
882 (28 percent)
Total, 134(d),(e), (f), (j), or (k) — 2,093 (15 percent of all inspections) — —
Table 3. Number of inspections where selected sections of 1910.134 were cited
U.S. BUREAU OF LABOR STATISTICS MONTHLY LABOR REVIEW
15
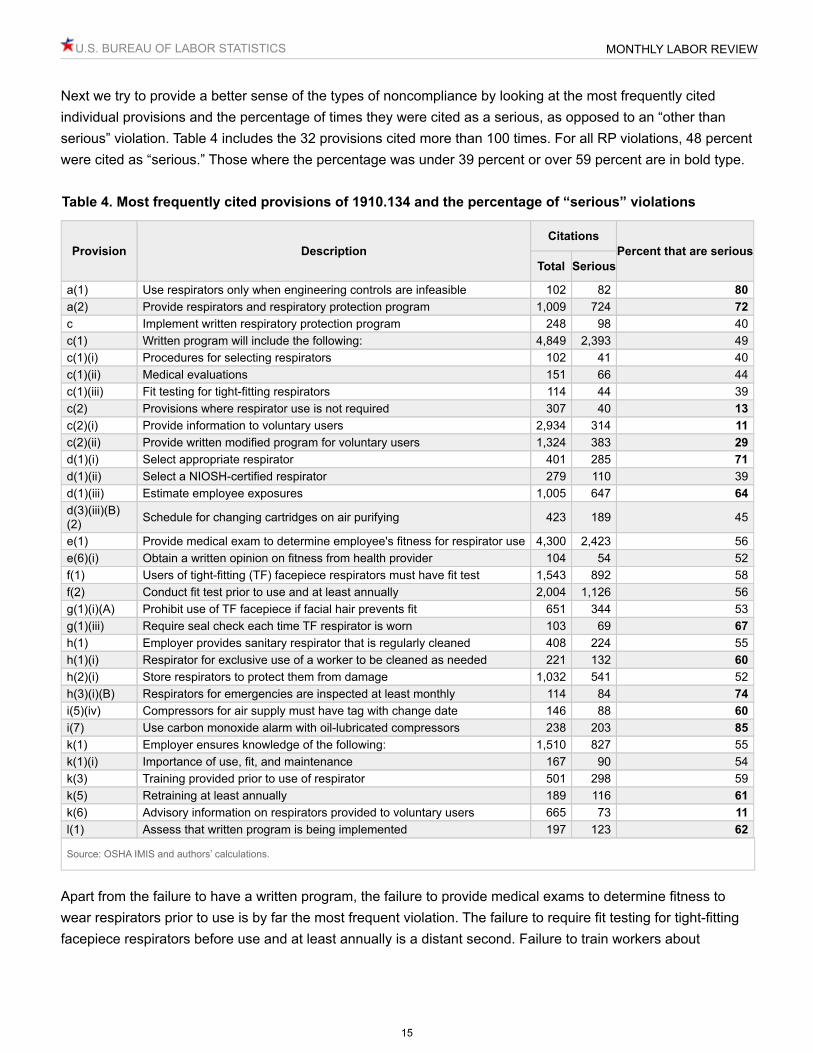
Next we try to provide a better sense of the types of noncompliance by looking at the most frequently cited individual provisions and the percentage of times they were cited as a serious, as opposed to an “other than serious” violation. Table 4 includes the 32 provisions cited more than 100 times. For all RP violations, 48 percent were cited as “serious.” Those where the percentage was under 39 percent or over 59 percent are in bold type.
Source: OSHA IMIS and authors’ calculations.
Apart from the failure to have a written program, the failure to provide medical exams to determine fitness to wear respirators prior to use is by far the most frequent violation. The failure to require fit testing for tight-fitting facepiece respirators before use and at least annually is a distant second. Failure to train workers about
Provision DescriptionCitations
Percent that are seriousTotal Serious
a(1) Use respirators only when engineering controls are infeasible 102 82 80a(2) Provide respirators and respiratory protection program 1,009 724 72c Implement written respiratory protection program 248 98 40c(1) Written program will include the following: 4,849 2,393 49c(1)(i) Procedures for selecting respirators 102 41 40c(1)(ii) Medical evaluations 151 66 44c(1)(iii) Fit testing for tight-fitting respirators 114 44 39c(2) Provisions where respirator use is not required 307 40 13c(2)(i) Provide information to voluntary users 2,934 314 11c(2)(ii) Provide written modified program for voluntary users 1,324 383 29d(1)(i) Select appropriate respirator 401 285 71d(1)(ii) Select a NIOSH-certified respirator 279 110 39d(1)(iii) Estimate employee exposures 1,005 647 64d(3)(iii)(B)(2) Schedule for changing cartridges on air purifying 423 189 45
e(1) Provide medical exam to determine employee's fitness for respirator use 4,300 2,423 56e(6)(i) Obtain a written opinion on fitness from health provider 104 54 52f(1) Users of tight-fitting (TF) facepiece respirators must have fit test 1,543 892 58f(2) Conduct fit test prior to use and at least annually 2,004 1,126 56g(1)(i)(A) Prohibit use of TF facepiece if facial hair prevents fit 651 344 53g(1)(iii) Require seal check each time TF respirator is worn 103 69 67h(1) Employer provides sanitary respirator that is regularly cleaned 408 224 55h(1)(i) Respirator for exclusive use of a worker to be cleaned as needed 221 132 60h(2)(i) Store respirators to protect them from damage 1,032 541 52h(3)(i)(B) Respirators for emergencies are inspected at least monthly 114 84 74i(5)(iv) Compressors for air supply must have tag with change date 146 88 60i(7) Use carbon monoxide alarm with oil-lubricated compressors 238 203 85k(1) Employer ensures knowledge of the following: 1,510 827 55k(1)(i) Importance of use, fit, and maintenance 167 90 54k(3) Training provided prior to use of respirator 501 298 59k(5) Retraining at least annually 189 116 61k(6) Advisory information on respirators provided to voluntary users 665 73 11l(1) Assess that written program is being implemented 197 123 62
Table 4. Most frequently cited provisions of 1910.134 and the percentage of “serious” violations

U.S. BUREAU OF LABOR STATISTICS MONTHLY LABOR REVIEW
16
respirator usage is the third most common, followed by requirements for proper storage of respirators and for employers to estimate employee exposures in order to determine the appropriate respiratory protection.
Second, we see that the percentage of violations cited as serious ranges from 11 percent for sections 134(c)(2)(i) and 134(k)(6) to 85 percent for section 134(i)(7). Thus, whether a particular violation of a standard is cited as
“serious” depends upon the context of the violation.17 The first two standards both require providing voluntary users with informational brochures about respirators. The last requires that carbon monoxide alarms be used when providing compressed air to air-supplied respirators.
The four provisions cited as serious less than 30 percent of the time all pertain to voluntary respirator use. Those with percentages of 60 percent or greater tend not to be the most frequently violated. Sections 134(a)(2) and 134(d)(1)(iii) are the only provisions above 60 percent that each have more than 1,000 violations.
DiscussionThis paper used the findings of OSHA inspections in manufacturing to make inferences about the prevalence of different types of problems with respiratory protection (RP) programs and about the factors associated with the occurrence of those problems. In the absence of other sources of information, these data can provide useful insights despite the basic limitation that they are not based on a representative sample of inspections or establishments inspected.
In the case of RP problems, we are able to use the RUPS survey to provide a partial validation of the findings from inspection data. A major purpose of the survey was to estimate the prevalence of respirator use across industries. Since respirator misuse cannot occur in the absence of respirator use (except in the cases where respirators should be used but are not), it is plausible to assume that the estimates of respirator use and the findings about violations of OSHA’s RP standard would be positively correlated. Indeed, for two-digit SIC manufacturing industries, the correlations were +0.75 and +0.85, depending upon the measure of noncompliance used.
Those findings are also used to identify the industries where required respirator use and the prevalence of RP violations diverged most sharply. The chemical industry (SIC 28) and the transportation industry (SIC 37) both had many fewer violations than would have been expected on the basis of required use. In contrast, the lumber and wood industry (SIC 24), miscellaneous manufacturing (SIC 39), and stone, clay, and glass (SIC 32) all had more violations than expected. The same findings for industries persisted when we controlled for the types of inspections, other establishment characteristics (size and unionization), and inspection history. It appears that education about the RP standards’ requirements and perhaps greater efforts to enforce those requirements could be especially desirable among respirator-using facilities in the latter set of industries. However, OSHA would also need to take account of the severity of the exposures that the RP standard is intended to guard against.
Other findings from the regression analysis could also be used to identify where RP violations are most and least likely to be found. Not surprisingly, larger establishments (over 150 employees) were about half as likely to be cited for serious violations as were smaller establishments. Prior inspections of any type modestly reduced the likelihood of RP violations, as did prior RP violations.
U.S. BUREAU OF LABOR STATISTICS MONTHLY LABOR REVIEW
17
We also looked directly at the factors associated with subsequent RP violations at establishments that had previous RP violations. The results were generally similar with respect to the effects of inspection type. Union status no longer had an effect, although the effect of establishment size was even stronger than in the table 2 findings. Industry effects were still common for all violation types, but for serious violations only the machinery industry had a significant and positive effect. We also examined whether the likelihood of a repeated RP violation varied with the section of 1910.134 that had been cited. There were only a few indications of impact. Citations for violations of programs where respirator use was voluntary were much less likely to be followed by another RP violation. Maintenance violations were more likely to be followed by other violations, as were citations for overexposures and the failure to provide an appropriate RP plan. It would be important in the future to focus more on this most serious set of violations.
We also found that by far the most frequent violation of the RP standard was the failure to have a written RP program. In about a third of all inspections with RP violations, this was the only RP violation cited. In an equal percentage of cases, this violation for the written program was cited along with violations for failing to carry out the mandated activities in the proper way. In over 1,100 cases, the employer was cited both for overexposing workers and for having no written program.
Data limitationsIn addition to the nonrandom nature of the sample, other limiting factors need to be considered. Although, as noted above, the citation of a violation is very strong evidence that a violation did indeed exist, the absence of a violation is a much less reliable indicator that a violation did not exist. In their 1985 study, James M. Paull and Frank S. Rosenthal estimated that the respiratory program had been examined in only 37 percent of health inspections.18 Interviews with industrial hygienists indicated to us that the practice was considerably more routine now, but we do not have a specific estimate; we assume 100 percent in our calculations.
Our regression analyses show that violation citation practices vary among states and within OSHA regions. Changes in OSHA enforcement policy can affect the numbers of particular types of inspections that are carried out and the policy for citing violations.
We often do not know from the IMIS what the nature of the exposure was in terms of its duration and whether the processes generating the exposure were occasional or constant. Compliance officers would be less likely to detect violations at establishments with brief, occasional requirements for respirator use than at those where use was for an extended period.
The IMIS itself provides only limited information on the reasons for the defects in the personal protective equipment programs. We can learn whether the employer failed to provide PPE, whether the employer failed to ensure that employees wore it as needed, and whether the equipment was not selected properly or was not adequately maintained. But we do not know, for example, whether employees resisted wearing the equipment because the environment was too hot.
U.S. BUREAU OF LABOR STATISTICS MONTHLY LABOR REVIEW
18
Further researchIn the absence of a formal survey, OSHA could gain more understanding by carrying out a subset of its health inspections in a random fashion. At the same time that it was carrying out enforcement, OSHA could gather more representative data on respirator use.
Another approach is to examine a random set of case files where health inspections had been conducted. Along with interviews with the hygienists who carried out the inspections, such a study could generate a better understanding of the status of respiratory programs and the reasons for their shortcomings.
Variables
All violations Serious violations
Incidence
ratio
Standard
error
Incidence
ratio
Standard
error
Fewer than 20 employees (reference) 20–49 employees 1.30(1) 0.02 1.35(1) 0.0350–149 employees 1.11(1) .02 1.14(1) .02150 or more employees .74(1) .01 .75(1) .02
Not health inspection(reference) Health inspection 8.68(1) .18 9.17(1) .27
Not programmed inspection (reference) Programmed inspection .42(1) .01 .37(1) .01
Interactions between health and programmed inspections .87(1) .02 .90(1) .04Not comprehensive inspection (reference)
Comprehensive inspection 3.09(1) .04 3.18(1) .06Not accompanied by a worker (reference)
Accompanied by a worker 1.11(1) .01 1.14(1) .02No union (reference)
Presence of a union .90(1) .02 .95(3) .02States not inspected by OSHA (reference)
States inspected by OSHA 1.12(1) .01 1.38(1) .03No prior RPV penalty (reference)
Presence of prior RPV penalty .91(1) .03 .91(3) .04No prior programmed inspections (reference)
One prior programmed inspection .88(1) .01 .89(1) .022 or more prior programmed inspection .82(1) .02 .85(1) .03
No prior nonprogrammed inspection (reference) One prior nonprogrammed inspection .97(2) .02 .97 .022 or more prior nonprogrammed inspection .73(1) .02 .74(1) .03
Region 1 (reference) Region 2 .79(1) .02 .64(1) .02Region 3 1.11(1) .03 .87(1) .03
Appendix table A-1. Factors linked to the probability of citing a respiratory violation at manufacturing establishments that had previously been cited for one, 1999–2006
See footnotes at end of table.

U.S. BUREAU OF LABOR STATISTICS MONTHLY LABOR REVIEW
19
Notes:(1) p < 0.01.(2) p < 0.10.(3) p < 0.05.Source: OSHA IMIS and authors’ calculations.
AcknowledgementsThis study was supported by the National Personal Protective Technology Laboratory of the National Institute of Occupational Safety and Health through a contract with the RAND Corporation Center for Health and Safety in the Workplace. Douglas Landsittel of NPPTL provided many helpful comments.
Variables
All violations Serious violations
Incidence
ratio
Standard
error
Incidence
ratio
Standard
error
Region 4 .92(1) .02 .63(1) .02Region 5 .65(1) .02 .55(1) .02Region 6 .81(1) .02 .65(1) .02Region 7 .82(1) .03 .59(1) .03Region 8 1.37(1) .04 1.44(1) .05Region 9 .76(1) .03 .50(1) .03Region 10 1.18(1) .06 .96 .07
SIC 20 (reference) SIC 22 .73(1) .04 .44(1) .04SIC 23 .56(1) .04 .36(1) .04SIC 24 .96 .03 .70(1) .03SIC 25 1.46(1) .05 1.02 .05SIC 26 .48(1) .03 .33(1) .03SIC 27 .34(1) .02 .21(1) .02SIC 28 1.39(1) .04 1.23(1) .05SIC 29 1.19(3) .08 1.20(3) .11SIC 30 .94(2) .03 .77(1) .03SIC 32 1.85(1) .05 1.85(1) .07SIC 33 1.58(1) .05 1.64(1) .07SIC 34 1.60(1) .04 1.34(1) .05SIC 35 1.49(1) .04 1.26(1) .05SIC 36 1.02 .04 .78(1) .04SIC 37 1.74(1) .05 1.53(1) .06SIC 38 1.07 .06 .89 .07SIC 39 1.56(1) .06 1.23(1) .06
Appendix table A-1. Factors linked to the probability of citing a respiratory violation at manufacturing establishments that had previously been cited for one, 1999–2006

U.S. BUREAU OF LABOR STATISTICS MONTHLY LABOR REVIEW
20
Several OSHA officials aided our understanding of enforcement practices and the conditions under which different violations would be cited. They included Melody Sands, Craig Moulton, and Fred Malaby. Carol Shum provided assistance in interpreting some of the industrial hygiene practices.
At RAND, we would like to gratefully acknowledge the help of Scott Ashwood and Michelle McMullen.
ReferencesLofgren, Don, David Johnson, and Terry Walley. “OSHA compliance issues: silica and noise exposure during installation of fibercement siding.” Journal of Occupational and Environmental Hygiene 1(1) (2004), pp. D1–D6.
Foley, Michael, Barbara Silverstein, Nayak Polissar, and Blazej Neradilek. “Impact of implementing the Washington state ergonomics rule on employer reported risk factors and hazard reduction activity.” American Journal of Industrial Medicine 52 (2009), pp. 1–16.
Gomez, Manuel. “Factors associated with exposures in Occupational Safety and Health Administration data.” AIHA Journal 58 (1997), pp. 186–195.
Gray, Wayne B. and John M. Mendeloff. “The declining effects of OSHA inspections in manufacturing, 1979–1998.” Industrial and Labor Relations Review (July 2005), pp. 571–587.
Henneberger, Paul K., Sandra K. Goe, William Miller, Brent Doney, and Dennis W. Groce. “Industries in the United States with airborne beryllium exposure and estimates of the number of current workers potentially exposed.” Journal of Occupational and Environmental Hygiene 1(10) (2004), pp. 648–659.
Institute of Medicine and National Research Council. The Personal Protective Technology Program at NIOSH. Committee to Review the NIOSH Personal Protective Technology Program. Report No. 5, Reviews of research programs of the National Institute for Occupational Safety and Health, Washington, D.C: The National Academies Press, 2008.
Lavoue, Jerome, Raymond Vincent, and Michel Gerin. “Formaldehyde exposure in U.S. industries from OSHA air sampling data.” Journal of Occupational and Environmental Hygiene 5(9) (2008), pp. 575–587.
Linch, Kenneth D., William E. Miller, Rochelle B. Althouse, Dennis W, Groce, Janet M. Hale. “Surveillance of respirable crystalline silica dust using OSHA compliance data (1979–1995).” American Journal of Industrial Medicine 34(6) (1998), pp. 547–558.
Lurie, P. and S. M. Wolfe. “Continuing exposure to hexavalent chromium, a known lung carcinogen: an analysis of OSHA compliance inspections, 1990–2000.” American Journal of Industrial Medicine (November 2002), pp. 378–383.
Middendorf, Paul J. “Surveillance of occupational noise exposures using OSHA's Integrated Management Information System.” American Journal of Industrial Medicine (November 2004), pp. 492–504.
National Research Council. Measuring Respirator Use in the Workplace. Washington, D.C.: The National Academies Press, 2007.
U.S. BUREAU OF LABOR STATISTICS MONTHLY LABOR REVIEW
21
Rosenthal, F.S. and J.M. Paull (1985). “The quality of respirator programs: an analysis from OSHA compliance Data.” American Industrial Hygiene Association Journal 46(12) (1985), pp. 709–715.
Teschke, Kay, Stephen A. Marion, Thomas L. Vaughan, Michael S. Morgan, and Janice Camp. “Exposures to wood dust in U.S. industries and occupations, 1979 to 1997.” American Journal of Industrial Medicine (June 1999), pp. 581–589.
U.S. Department of Labor, Occupational Safety and Health Administration, Directorate of Compliance Programs. Inspection procedures for the Respiratory Protection Standard. CPL 02-00-120–CPL 2-0.120, 1998.
Yassin, Abdiaziz., Francis Yebesi, and Rex Tingle. “Occupational exposure to crystalline silica dust in the United States, 1988–2003.” Environmental Health Perspectives (March 2005), pp. 255–260.
SUGGESTED CITATION
John Mendeloff, Maryann D’Alessandro, Hangsheng Liu, Elizabeth Steiner, Jessica Kopsic, and Rachel Burns, "Using OSHA inspection data to analyze respirator protection program compliance," Monthly Labor Review, U.S. Bureau of Labor Statistics, December 2013, https://doi.org/10.21916/mlr.2013.37.
NOTES
1 NPPTL’s role in surveillance has been endorsed by several reports, including the 2008 report of the Institute of Medicine Review Committee on Personal Protection Control Technology.
2 This standard (1910.134) has the same number as the earlier OSHA respiratory protection standard but is far more detailed in its requirements. See Federal Register, January 8, 1998, effective October 5, 1998.
3 F.S. Rosenthal and J.M. Paull, “The quality of respirator programs: an analysis from OSHA compliance data,” American Industrial Hygiene Association Journal 46(12) (1985), pp. 709–715.
4 The article reports a figure of 27 percent (not 34 percent), but this figure excludes cases that we include. Calculated using our definition of inspections with RP violations, the figure would be 34 percent.
5 Recent published studies using IMIS data have looked at exposures to formaldehyde (Lavoue 2008), silica (Yassin et al. 2005, Linch et al. 1998), wood dust (Teschke et al. 1999), beryllium (Henneberger et al. 2004), noise (Middendorf 2004), chromium (Lurie and Wolfe 2002) and lead, silica, and perchloroethylene (Gomez 1997).
6 Paul J. Middendorf, “Surveillance of occupational noise exposures using OSHA's Integrated Management Information System,” American Journal of Industrial Medicine (November 2004), pp. 492–504.
7 The program for doing this is described in Wayne B. Gray and John M. Mendeloff, “The declining effects of OSHA inspections in manufacturing, 1979–1998,” Industrial and Labor Relations Review (July 2005), pp. 571–587.
8 Here and elsewhere in the report, the figures for the percentage of establishments with health inspections that had violations refers only to violations cited in the health inspections.
9 Commerce Department figures indicate that about 10 percent of all establishments enter in a given year and about 10 percent exit. New establishments are less likely to survive, so an estimate of a 50-percent increase over an 8-year period seems plausible, although probably high. See table 739 in Statistical Abstract of the United States, 2009.

U.S. BUREAU OF LABOR STATISTICS MONTHLY LABOR REVIEW
22
10 The uncertainties include whether workplaces generating complaints about health hazards are more likely to have RP violations than are those without complaints. And while OSHA does try to find workplaces with health problems, the targeting system for programmed health inspections during this period allowed a great deal of area-office discretion.
11 We linked all inspections that occurred at the same establishment during this period in order to provide measures of establishment coverage. The 1997 County Business Patterns was the last to use SIC codes (not NAICS codes) and thus facilitates analysis for OSHA, which continued to use SIC codes through this period.
12 The general standard for overexposures (1910.1000) includes section E, which requires employers to first attempt to use engineering controls or administrative controls before resorting to the use of respirators to reduce exposures.
13 Here and elsewhere in the report, the figures for the percentage of establishments with health inspections that had violations refers only to violations cited in the health inspections.
14 T figure is drawn from table 6 in the RUPS report.
15 The numbers of federal inspections in regions 9 and 10 are too small to make those coefficients meaningful.
16 The number is a little higher than 7,488 because table 3 does not include sections 134g, i, l, or m.
17 OSHA’s Field Operations Manual (OSHA 1994) notes that there are four factors to consider in determining whether a violation should be classified as “serious”: “The first three factors address whether there is a substantial probability that death or serious physical harm could result from an accident/incident or exposure relating to the violative condition…The fourth factor addresses whether the employer knew or could have known of the violative condition.”
18 James M. Paull and Frank S. Rosenthal, “The quality of respirator programs: an analysis from OSHA compliance Data,” American Industrial Hygiene Association Journal 46(12) (1985), pp. 709–715.
RELATED CONTENT
Related Articles
An analysis of fatal occupational injuries at road construction sites, 2003–2010, Monthly Labor Review, November 2013.
Occupational Safety and Health Data Users’ Workshop, 2013, Monthly Labor Review, October 2013.
Using workplace safety and health data for injury prevention, Monthly Labor Review, October 2013.
Using data from the Census of Fatal Occupational Injuries to estimate the “value of a statistical life,” Monthly Labor Review, October 2013.
Related Subjects
Occupational safety and health Workplace injuries and illnesses Worker safety and health
Related Documents