News Release FOR IMMEDIATE RELEASE For more information please contact: Craig Munn, Assistant Manager, Communications Real Estate Board of Greater Vancouver Phone: (604) 730-3146 Fax: (604) 730-3102 E-mail: [email protected] also available at www.realtylink.org -30- The real estate industry is a key economic driver in British Columbia. In 2010, 30,595 homes changed ownership in the Board's area, generating $1.28 billion in spin-off activity and 8,567 jobs. The total dollar value of residential sales transacted through the MLS® system in Greater Vancou- ver totalled $21 billion in 2010. The Real Estate Board of Greater Vancouver is an association representing more than 10,000 REALTORS® and their companies. The Board provides a variety of member services, including the Multiple Listing Service®. For more information on real estate, statistics, and buying or selling a home, contact a local REALTOR® or visit www.rebgv.org. Balanced real estate market prevailed through much of 2011 V ANCOUVER, B.C. – January 4, 2012 – The 2011 Greater Vancouver housing market began with heightened demand in regional hot spots and concluded with greater balance between seller supply and buyer demand. The Real Estate Board of Greater V ancouver (REBGV) reports that total sales of detached, attached and apartment prop- erties in 2011 reached 32,390, a 5.9 per cent increase from the 30,595 sales recorded in 2010, and a 9.2 per cent decrease from the 35,669 residential sales in 2009. Last year’s home sale total was 6.3 per cent below the ten-year average for annual Multiple Listing Service® (MLS®) sales in the region. The number of residential properties listed for sale on the MLS® in G reater V ancouver increased 2.7 per cent in 2011 to 59,549 compared to the 58,009 properties listed in 2010. Looking back further, last year’s total represents a 12.8 per cent increase compared to the 52,869 residential properties listed in 2009. Last year’s listing total was 11.1 per cent above the ten- year average for annual Multiple Listing Service® (MLS®) property listings in the region. “It was a relatively balanced year for the real estate market in Greater Van couver with listing totals slightly above historical norms and sale numbers slightly below,” Rosario Setticasi, REBGV president said. Residential property sales in Greater Vancouver totalled 1,658 in December 2011, a decrease of 12.7 per cent from the 1,899 sales recorded in December 2010 and a 29.7 per cent decline compared to November 2011 when 2,360 home sales occurred. More broadly , last month’s residential sales represent a 34.1 per cent decrease over the 2,515 residential sales in December 2009, a 79.4 per cent increase compared to December 2008’s 924 sales, and a 12.6 per cent decrease compared to the 1,897 sales in December 2007. The overall residential benchmark price, as calculated by the MLSLink Housing Price Index®, for Greater Vancouver increased 7.6 per cent to $621,674 between Decembers 2010 and 2011. However, prices have decreased 1.5 per cent since hitting a peak of $630,921 in June 2011. “Our market remained in a balanced state for most of the year, although higher levels of demand for detached properties in the region’s larges t communities caused prices in certain areas to rise higher than others,” Setticasi said. “For example, the benchmark price of a single-family detached home experienced double-digit increases in nine areas w ithin the region over the last 12 months.” New listings for detached, attached and apartment properties in Greater V ancouver totalled 1,629 in December 2011. This represents a 4.1 per cent decline compared to the 1,699 units listed in December 2010 and a 49.4 per cent decline compared to November 2011 when 3,222 properties were listed. Sales of detached properties in December 2011 reached 630, a decrease of 18.1 per cent from the 769 detached sales re- corded in December 2010, and a 30.2 per cent decrease from the 902 units sold in December 2009. The benchmark price for detached properties increased 11.2 per cent from December 2010 to $887,471. Sales of apartment properties reached 774 in December 2011, a decline of 4.6 per cent compared to the 811 sales in December 2010, and a decrease of 32.9 per cent compared to the 1,154 sales in December 2009.The benchmark price of an apartment property increased 3.7 per cent from December 2010 to $401,396. Attached property sales in December 2011 totalled 254, a decline of 20.4 per cent compared to the 319 sales in December 2010, and a 44.7 per cent decrease from the 459 attached properties sold in December 2009. The benchmark price of an at- tached unit increased 4.2 per cent between December 2010 and 2011 to $511,499.

Welcome message from author
This document is posted to help you gain knowledge. Please leave a comment to let me know what you think about it! Share it to your friends and learn new things together.
Transcript
8/3/2019 December 2011 REBGV Stats Courtesy of Mike Stewart Vancouver Realtor
http://slidepdf.com/reader/full/december-2011-rebgv-stats-courtesy-of-mike-stewart-vancouver-realtor 1/7
News ReleaseFOR IMMEDIATE RELEASE
For more information please contact:Craig Munn, Assistant Manager, CommunicationsReal Estate Board of Greater VancouverPhone: (604) 730-3146 Fax: (604) 730-3102E-mail: [email protected] also available at www.realtylink.org
-30-
The real estate industry is a key economic driver in British Columbia. In 2010, 30,595 homes changed ownership in the Board's area, generating
$1.28 billion in spin-off activity and 8,567 jobs. The total dollar value of residential sales transacted through the MLS® system in Greater Vancou-
ver totalled $21 billion in 2010. The Real Estate Board of Greater Vancouver is an association representing more than 10,000 REALTORS® and
their companies. The Board provides a variety of member services, including the Multiple Listing Service®. For more information on real estate,
statistics, and buying or selling a home, contact a local REALTOR® or visit www.rebgv.org.
Balanced real estate market prevailed through much of 2011VANCOUVER, B.C. – January 4, 2012 – The 2011 Greater Vancouver housing market began with heightened demand in
regional hot spots and concluded with greater balance between seller supply and buyer demand.The Real Estate Board of Greater Vancouver (REBGV) reports that total sales of detached, attached and apartment prop-
erties in 2011 reached 32,390, a 5.9 per cent increase from the 30,595 sales recorded in 2010, and a 9.2 per cent decrease
from the 35,669 residential sales in 2009. Last year’s home sale total was 6.3 per cent below the ten-year average for annual
Multiple Listing Service® (MLS®) sales in the region.
The number of residential properties listed for sale on the MLS® in Greater Vancouver increased 2.7 per cent in 2011 to
59,549 compared to the 58,009 properties listed in 2010. Looking back further, last year’s total represents a 12.8 per cent
increase compared to the 52,869 residential properties listed in 2009. Last year’s listing total was 11.1 per cent above the ten-
year average for annual Multiple Listing Service® (MLS®) property listings in the region.
“It was a relatively balanced year for the real estate market in Greater Vancouver with listing totals slightly above historical
norms and sale numbers slightly below,” Rosario Setticasi, REBGV president said.
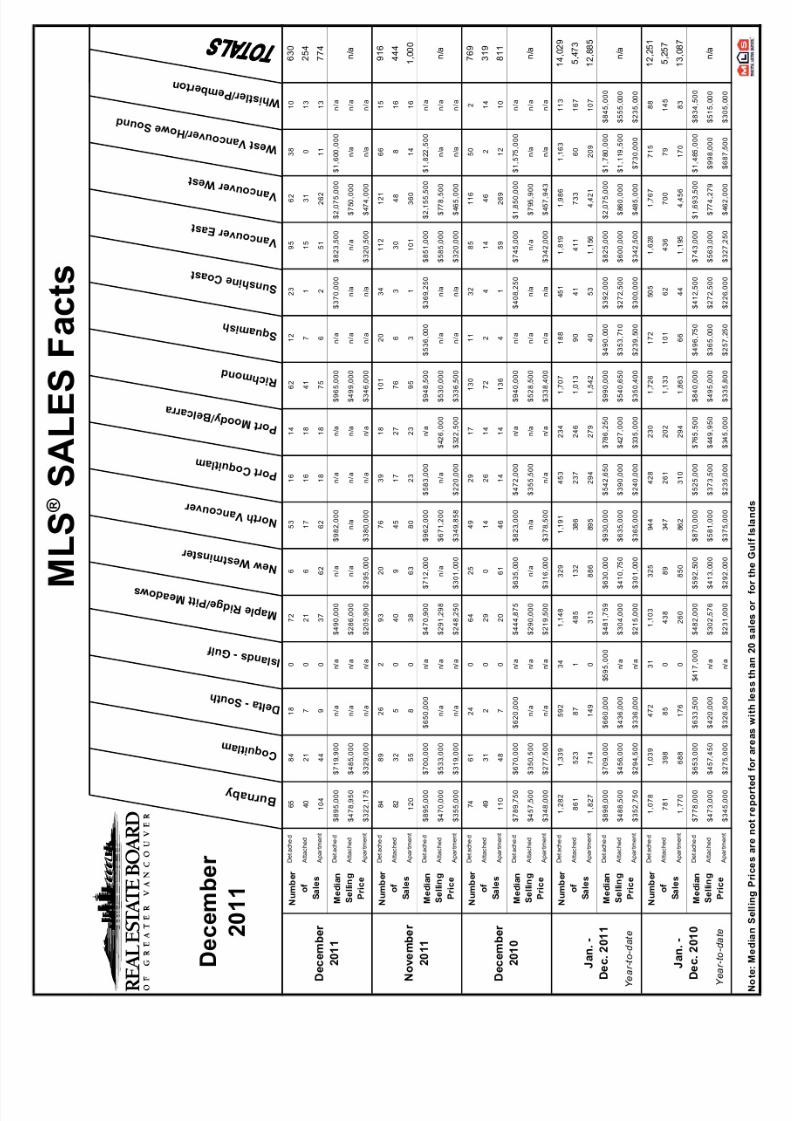
Residential property sales in Greater Vancouver totalled 1,658 in December 2011, a decrease of 12.7 per cent from the 1,899
sales recorded in December 2010 and a 29.7 per cent decline compared to November 2011 when 2,360 home sales occurred.
More broadly, last month’s residential sales represent a 34.1 per cent decrease over the 2,515 residential sales in December
2009, a 79.4 per cent increase compared to December 2008’s 924 sales, and a 12.6 per cent decrease compared to the 1,897
sales in December 2007.
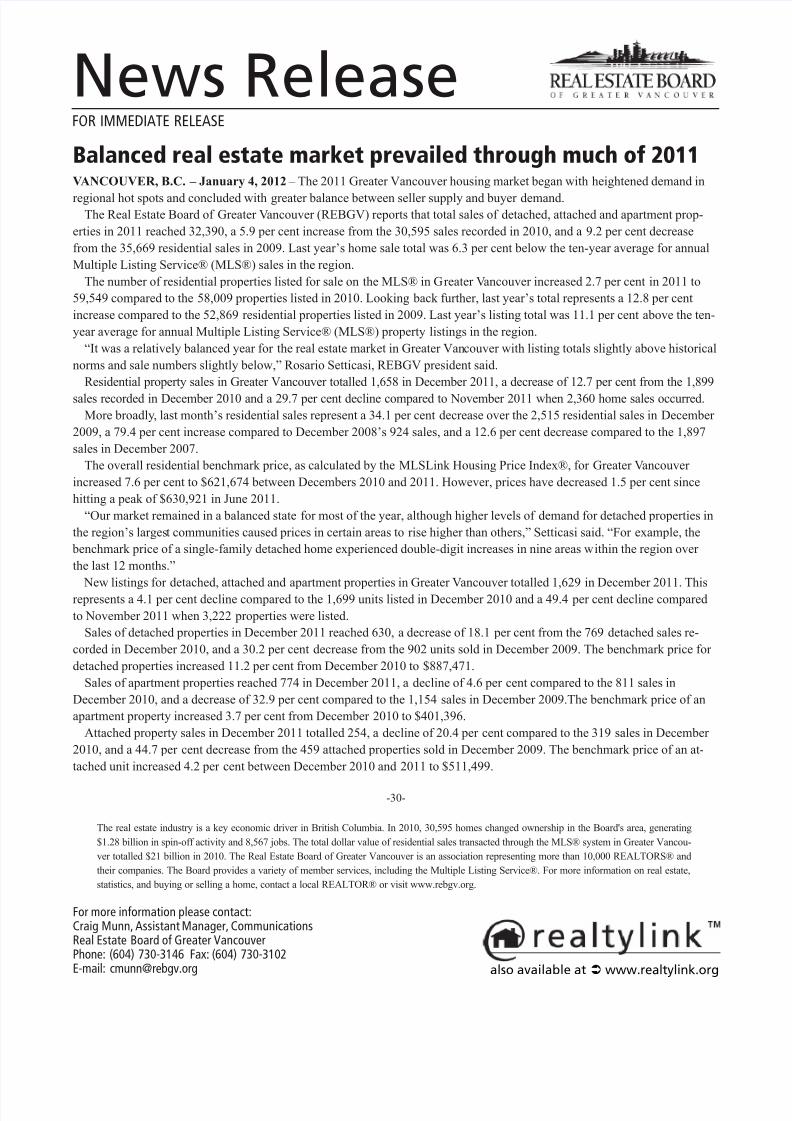
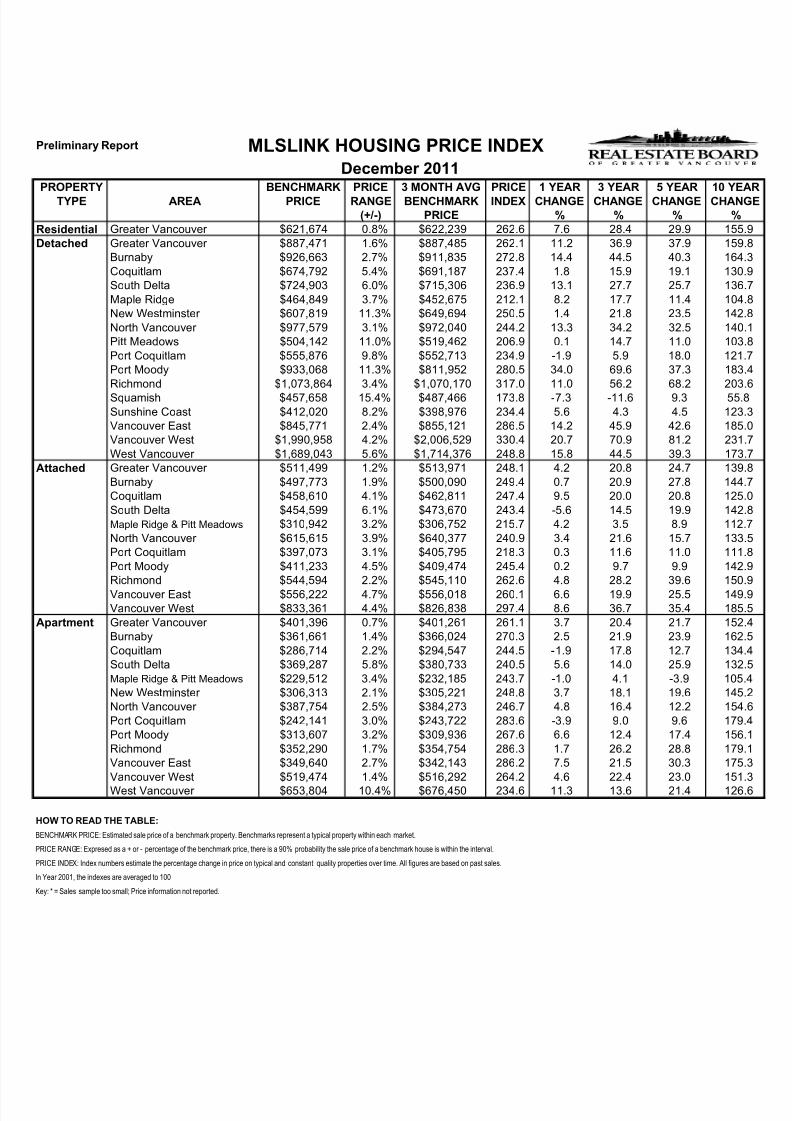
The overall residential benchmark price, as calculated by the MLSLink Housing Price Index®, for Greater Vancouver
increased 7.6 per cent to $621,674 between Decembers 2010 and 2011. However, prices have decreased 1.5 per cent since
hitting a peak of $630,921 in June 2011.
“Our market remained in a balanced state for most of the year, although higher levels of demand for detached properties in
the region’s largest communities caused prices in certain areas to rise higher than others,” Setticasi said. “For example, the
benchmark price of a single-family detached home experienced double-digit increases in nine areas within the region over
the last 12 months.”
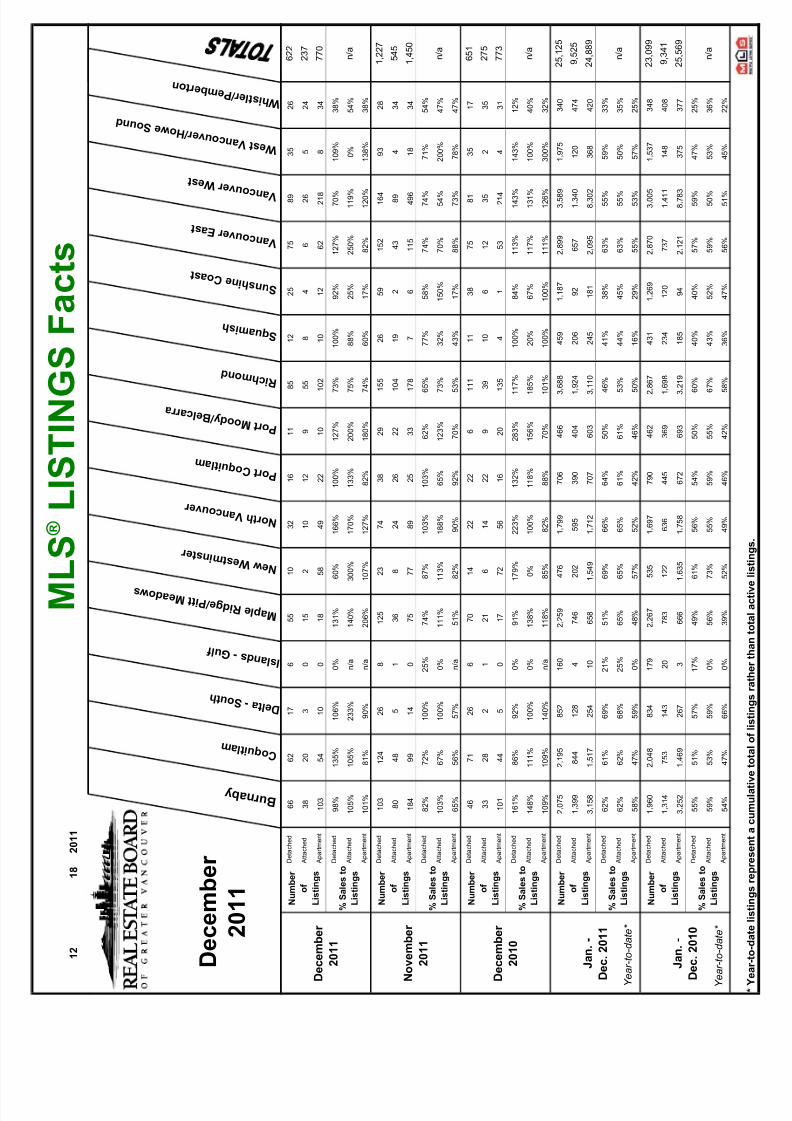
New listings for detached, attached and apartment properties in Greater Vancouver totalled 1,629 in December 2011. This
represents a 4.1 per cent decline compared to the 1,699 units listed in December 2010 and a 49.4 per cent decline compared
to November 2011 when 3,222 properties were listed.
Sales of detached properties in December 2011 reached 630, a decrease of 18.1 per cent from the 769 detached sales re-
corded in December 2010, and a 30.2 per cent decrease from the 902 units sold in December 2009. The benchmark price for
detached properties increased 11.2 per cent from December 2010 to $887,471.
Sales of apartment properties reached 774 in December 2011, a decline of 4.6 per cent compared to the 811 sales in
December 2010, and a decrease of 32.9 per cent compared to the 1,154 sales in December 2009.The benchmark price of an
apartment property increased 3.7 per cent from December 2010 to $401,396.
Attached property sales in December 2011 totalled 254, a decline of 20.4 per cent compared to the 319 sales in December
2010, and a 44.7 per cent decrease from the 459 attached properties sold in December 2009. The benchmark price of an at-
tached unit increased 4.2 per cent between December 2010 and 2011 to $511,499.
8/3/2019 December 2011 REBGV Stats Courtesy of Mike Stewart Vancouver Realtor
http://slidepdf.com/reader/full/december-2011-rebgv-stats-courtesy-of-mike-stewart-vancouver-realtor 2/7
Preliminary Report MLSLINK HOUSING PRICE INDEX
December 2011PROPERTY BENCHMARK PRICE 3 MONTH AVG PRICE 1 YEAR 3 YEAR 5 YEAR 10 YE
TYPE AREA PRICE RANGE BENCHMARK INDEX CHANGE CHANGE CHANGE CHAN
(+/-) PRICE % % % %
Residential Greater Vancouver $621,674 0.8% $622,239 262.6 7.6 28.4 29.9 155Detached Greater Vancouver $887,471 1.6% $887,485 262.1 11.2 36.9 37.9 159
Burnaby $926,663 2.7% $911,835 272.8 14.4 44.5 40.3 164Coquitlam $674,792 5.4% $691,187 237.4 1.8 15.9 19.1 130South Delta $724,903 6.0% $715,306 236.9 13.1 27.7 25.7 136Maple Ridge $464,849 3.7% $452,675 212.1 8.2 17.7 11.4 104New Westminster $607,819 11.3% $649,694 250.5 1.4 21.8 23.5 142North Vancouver $977,579 3.1% $972,040 244.2 13.3 34.2 32.5 140Pitt Meadows $504,142 11.0% $519,462 206.9 0.1 14.7 11.0 103Port Coquitlam $555,876 9.8% $552,713 234.9 -1.9 5.9 18.0 121Port Moody $933,068 11.3% $811,952 280.5 34.0 69.6 37.3 183Richmond $1,073,864 3.4% $1,070,170 317.0 11.0 56.2 68.2 203Squamish $457,658 15.4% $487,466 173.8 -7.3 -11.6 9.3 55.Sunshine Coast $412,020 8.2% $398,976 234.4 5.6 4.3 4.5 123Vancouver East $845,771 2.4% $855,121 286.5 14.2 45.9 42.6 185Vancouver West $1,990,958 4.2% $2,006,529 330.4 20.7 70.9 81.2 231West Vancouver $1,689,043 5.6% $1,714,376 248.8 15.8 44.5 39.3 173
Attached Greater Vancouver $511,499 1.2% $513,971 248.1 4.2 20.8 24.7 139Burnaby $497,773 1.9% $500,090 249.4 0.7 20.9 27.8 144Coquitlam $458,610 4.1% $462,811 247.4 9.5 20.0 20.8 125South Delta $454,599 6.1% $473,670 243.4 -5.6 14.5 19.9 142Maple Ridge & Pitt Meadows $310,942 3.2% $306,752 215.7 4.2 3.5 8.9 112North Vancouver $615,615 3.9% $640,377 240.9 3.4 21.6 15.7 133Port Coquitlam $397,073 3.1% $405,795 218.3 0.3 11.6 11.0 111Port Moody $411,233 4.5% $409,474 245.4 0.2 9.7 9.9 142Richmond $544,594 2.2% $545,110 262.6 4.8 28.2 39.6 150Vancouver East $556,222 4.7% $556,018 260.1 6.6 19.9 25.5 149Vancouver West $833,361 4.4% $826,838 297.4 8.6 36.7 35.4 185
Apartment Greater Vancouver $401,396 0.7% $401,261 261.1 3.7 20.4 21.7 152Burnaby $361,661 1.4% $366,024 270.3 2.5 21.9 23.9 162Coquitlam $286,714 2.2% $294,547 244.5 -1.9 17.8 12.7 134South Delta $369,287 5.8% $380,733 240.5 5.6 14.0 25.9 132Maple Ridge & Pitt Meadows $229,512 3.4% $232,185 243.7 -1.0 4.1 -3.9 105New Westminster $306,313 2.1% $305,221 248.8 3.7 18.1 19.6 145North Vancouver $387,754 2.5% $384,273 246.7 4.8 16.4 12.2 154Port Coquitlam $242,141 3.0% $243,722 283.6 -3.9 9.0 9.6 179Port Moody $313,607 3.2% $309,936 267.6 6.6 12.4 17.4 156Richmond $352,290 1.7% $354,754 286.3 1.7 26.2 28.8 179Vancouver East $349,640 2.7% $342,143 286.2 7.5 21.5 30.3 175Vancouver West $519,474 1.4% $516,292 264.2 4.6 22.4 23.0 151West Vancouver $653,804 10.4% $676,450 234.6 11.3 13.6 21.4 126
HOW TO READ THE TABLE:
BENCHMARK PRICE: Estimated sale price of a benchmark property. Benchmarks represent a typical property within each market.
PRICE RANGE: Expresed as a + or - percentage of the benchmark price, there is a 90% probability the sale price of a benchmark house is within the interval.
PRICE INDEX: Index numbers estimate the percentage change in price on typical and constant quality properties over time. All figures are based on past sales.
In Year 2001, the indexes are averaged to 100
Key: * = Sales sample too small; Price information not reported.
8/3/2019 December 2011 REBGV Stats Courtesy of Mike Stewart Vancouver Realtor
http://slidepdf.com/reader/full/december-2011-rebgv-stats-courtesy-of-mike-stewart-vancouver-realtor 3/7
C : \ D A T A \ M o n t h E n d \ H p i \ e x p o r t \ h i_ r e s \ g v - h p i 2 . t i f
M L S ®
H o u s i n g
P r i c e I n d e x - G r e a t e r V a n c o u v e r
1 0 Y e a r T r e n d
8 0
1 0 0
1 2 0
1 4 0
1 6 0
1 8 0
2 0 0
2 2 0
2 4 0
2 6 0
2 8 0
Dec 2001
Apr 2002
Aug 2002
Dec 2002
Apr 2003
Aug 2003
Dec 2003
Apr 2004
Aug 2004
Dec 2004
Apr 2005
Aug 2005
Dec 2005
Apr 2006
Aug 2006
Dec 2006
Apr 2007
Aug 2007
Dec 2007
Apr 2008
Aug 2008
Dec 2008
Apr 2009
Aug 2009
Dec 2009
Apr 2010
Aug 2010Dec 2010
Apr 2011
Aug 2011
Dec 2011
P r i c e I n d e x
D e t a c h e
d
A t t a c h e d
A p a r t m e n t
Y e a r 2 0 0 1 a v e r a g e = 1 0 0
8/3/2019 December 2011 REBGV Stats Courtesy of Mike Stewart Vancouver Realtor
http://slidepdf.com/reader/full/december-2011-rebgv-stats-courtesy-of-mike-stewart-vancouver-realtor 4/7
8/3/2019 December 2011 REBGV Stats Courtesy of Mike Stewart Vancouver Realtor
http://slidepdf.com/reader/full/december-2011-rebgv-stats-courtesy-of-mike-stewart-vancouver-realtor 5/7
1 2
1 8
2 0 1 1
M
L S ® L
I S T I N G
S F a c t s
B u r n a b y
C o q u i t l a m
D e l t a - S o u t h
I s l a n d s - G u l f
M a p l e R i d g e / P i t t M e a d o w s
N e w W e s t m i n s t e r
N o r t h V a n c o u v e r
P o r t C o q u i t l a m
P o r t M o o d y / B e l c a r r a
R i c h m o n d
S q u a m i s h
S u n s h i n e C o a s t
V a n c o u v e r E a s t
V a n c o u v e r W e s t
W e s t V a n c o u v e r / H o w e S o u n d
W h i s t l e r / P e m b e r t o n
D e t a c h e d
6 6
6 2
1 7
6
5 5
1 0
3 2
1 6
1 1
8 5
1 2
2 5
7 5
8 9
3 5
2 6
6 2 2
A t t a c h e d
3 8
2 0
3
0
1 5
2
1 0
1 2
9
5 5
8
4
6
2 6
5
2 4
2 3 7
A p a r t m e n t
1 0 3
5 4
1 0
0
1 8
5 8
4 9
2 2
1 0
1 0 2
1 0
1 2
6 2
2 1 8
8
3 4
7 7 0
D e t a c h e d
9 8 %
1 3 5 %
1 0 6 %
0 %
1 3 1 %
6 0 %
1 6 6 %
1 0 0 %
1 2 7 %
7 3 %
1 0 0 %
9 2 %
1 2 7 %
7 0 %
1 0 9 %
3 8 %
A t t a c h e d
1 0 5 %
1 0 5 %
2 3 3 %
n / a
1 4 0 %
3 0 0 %
1 7 0 %
1 3 3 %
2 0 0 %
7 5 %
8 8 %
2 5 %
2 5 0 %
1 1 9 %
0 %
5 4 %
n / a
A p a r t m e n t
1 0 1 %
8 1 %
9 0 %
n / a
2 0 6 %
1 0 7 %
1 2 7 %
8 2 %
1 8 0 %
7 4 %
6 0 %
1 7 %
8 2 %
1 2 0 %
1 3 8 %
3 8 %
D e t a c h e d
1 0 3
1 2 4
2 6
8
1 2 5
2 3
7 4
3 8
2 9
1 5 5
2 6
5 9
1 5 2
1 6 4
9 3
2 8
1 , 2
2 7
A t t a c h e d
8 0
4 8
5
1
3 6
8
2 4
2 6
2 2
1 0 4
1 9
2
4 3
8 9
4
3 4
5 4 5
A p a r t m e n t
1 8 4
9 9
1 4
0
7 5
7 7
8 9
2 5
3 3
1 7 8
7
6
1 1 5
4 9 6
1 8
3 4
1 , 4
5 0
D e t a c h e d
8 2 %
7 2 %
1 0 0 %
2 5 %
7 4 %
8 7 %
1 0 3 %
1 0 3 %
6 2 %
6 5 %
7 7 %
5 8 %
7 4 %
7 4 %
7 1 %
5 4 %
A t t a c h e d
1 0 3 %
6 7 %
1 0 0 %
0 %
1 1 1 %
1 1 3 %
1 8 8 %
6 5 %
1 2 3 %
7 3 %
3 2 %
1 5 0 %
7 0 %
5 4 %
2 0 0 %
4 7 %
n / a
A p a r t m e n t
6 5 %
5 6 %
5 7 %
n / a
5 1 %
8 2 %
9 0 %
9 2 %
7 0 %
5 3 %
4 3 %
1 7 %
8 8 %
7 3 %
7 8 %
4 7 %
D e t a c h e d
4 6
7 1
2 6
6
7 0
1 4
2 2
2 2
6
1 1 1
1 1
3 8
7 5
8 1
3 5
1 7
6 5 1
A t t a c h e d
3 3
2 8
2
1
2 1
6
1 4
2 2
9
3 9
1 0
6
1 2
3 5
2
3 5
2 7 5
A p a r t m e n t
1 0 1
4 4
5
0
1 7
7 2
5 6
1 6
2 0
1 3 5
4
1
5 3
2 1 4
4
3 1
7 7 3
D e t a c h e d
1 6 1 %
8 6 %
9 2 %
0 %
9 1 %
1 7 9 %
2 2 3 %
1 3 2 %
2 8 3 %
1
1 7 %
1 0 0 %
8 4 %
1 1 3 %
1 4 3 %
1 4 3 %
1 2 %
A t t a c h e d
1 4 8 %
1 1 1 %
1 0 0 %
0 %
1 3 8 %
0 %
1 0 0 %
1 1 8 %
1 5 6 %
1
8 5 %
2 0 %
6 7 %
1 1 7 %
1 3 1 %
1 0 0 %
4 0 %
n / a
A p a r t m e n t
1 0 9 %
1 0 9 %
1 4 0 %
n / a
1 1 8 %
8 5 %
8 2 %
8 8 %
7 0 %
1
0 1 %
1 0 0 %
1 0 0 %
1 1 1 %
1 2 6 %
3 0 0 %
3 2 %
D e t a c h e d
2 , 0
7 5
2 , 1
9 5
8 5 2
1 6 0
2 , 2
5 9
4 7 6
1 , 7
9 9
7 0 6
4 6 6
3
, 6 8 8
4 5 9
1 , 1
8 7
2 , 8
9 9
3 , 5 8
9
1 , 9
7 5
3 4 0
2 5 , 1
2 5
A t t a c h e d
1 , 3
9 9
8 4 4
1 2 8
4
7 4 6
2 0 2
5 9 5
3 9 0
4 0 4
1
, 9 2 4
2 0 6
9 2
6 5 7
1 , 3 4
0
1 2 0
4 7 4
9 , 5
2 5
A p a r t m e n t
3 , 1
5 8
1 , 5
1 7
2 5 4
1 0
6 5 8
1 , 5
4 9
1 , 7
1 2
7 0 7
6 0 3
3
, 1 1 0
2 4 5
1 8 1
2 , 0
9 5
8 , 3 0
2
3 6 8
4 2 0
2 4 , 8
8 9
D e t a c h e d
6 2 %
6 1 %
6 9 %
2 1 %
5 1 %
6 9 %
6 6 %
6 4 %
5 0 %
4 6 %
4 1 %
3 8 %
6 3 %
5 5 %
5 9 %
3 3 %
A t t a c h e d
6 2 %
6 2 %
6 8 %
2 5 %
6 5 %
6 5 %
6 5 %
6 1 %
6 1 %
5 3 %
4 4 %
4 5 %
6 3 %
5 5 %
5 0 %
3 5 %
n / a
A p a r t m e n t
5 8 %
4 7 %
5 9 %
0 %
4 8 %
5 7 %
5 2 %
4 2 %
4 6 %
5 0 %
1 6 %
2 9 %
5 5 %
5 3 %
5 7 %
2 5 %
D e t a c h e d
1 , 9
6 0
2 , 0
4 8
8 3 4
1 7 9
2 , 2
6 7
5 3 5
1 , 6
9 7
7 9 0
4 6 2
2
, 8 6 7
4 3 1
1 , 2
6 9
2 , 8
7 0
3 , 0 0
5
1 , 5
3 7
3 4 8
2 3 , 0
9 9
A t t a c h e d
1 , 3
1 4
7 5 3
1 4 3
2 0
7 8 3
1 2 2
6 3 6
4 4 5
3 6 9
1
, 6 9 8
2 3 4
1 2 0
7 3 7
1 , 4 1
1
1 4 8
4 0 8
9 , 3
4 1
A p a r t m e n t
3 , 2
5 2
1 , 4
6 9
2 6 7
3
6 6 6
1 , 6
3 5
1 , 7
5 8
6 7 2
6 9 3
3
, 2 1 9
1 8 5
9 4
2 , 1
2 1
8 , 7 8
3
3 7 5
3 7 7
2 5 , 5
6 9
D e t a c h e d
5 5 %
5 1 %
5 7 %
1 7 %
4 9 %
6 1 %
5 6 %
5 4 %
5 0 %
6 0 %
4 0 %
4 0 %
5 7 %
5 9 %
4 7 %
2 5 %
A t t a c h e d
5 9 %
5 3 %
5 9 %
0 %
5 6 %
7 3 %
5 5 %
5 9 %
5 5 %
6 7 %
4 3 %
5 2 %
5 9 %
5 0 %
5 3 %
3 6 %
n / a
A p a r t m e n t
5 4 %
4 7 %
6 6 %
0 %
3 9 %
5 2 %
4 9 %
4 6 %
4 2 %
5 8 %
3 6 %
4 7 %
5 6 %
5 1 %
4 5 %
2 2 %
N u m b e r
o f
L i s t i n g s
D e c e m b e r
2 0 1 1
N u m b e r
o f
L i s t i n g s
% S a l e s t o
L i s t i n g s
N u m b e r
o f
L i s t i n g s
% S a l e s t o
L i s t i n g s
N u m b e r
o f
L i s t i n g s
% S a l e s t o
L i s t i n g s
N o v e m b e r
2 0 1 1
D e c e m b e r
2 0 1 0
J a n . -
D e c . 2 0 1 1
J a n . -
D e c . 2 0 1 0
% S a l e s t o
L i s t i n g s
N u m b e r
o f
L i s t i n g s
% S a l e s t o
L i s t i n g s
D e c e m b e r
2 0 1 1
Y
e a r - t o - d a t e *
Y e a r - t o - d a t e *
8/3/2019 December 2011 REBGV Stats Courtesy of Mike Stewart Vancouver Realtor
http://slidepdf.com/reader/full/december-2011-rebgv-stats-courtesy-of-mike-stewart-vancouver-realtor 6/7
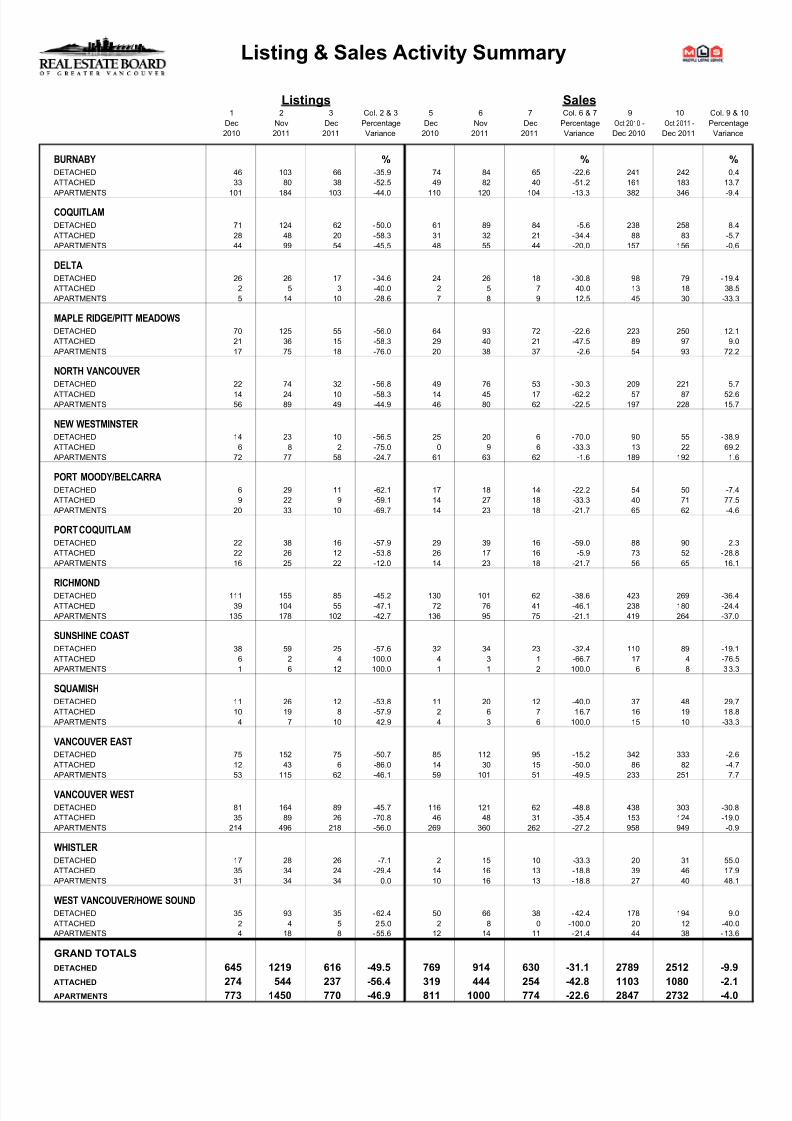
Listing & Sales Activity Summary
Listings Sales1 2 3 Col. 2 & 3 5 6 7 Col. 6 & 7 9 10 Col. 9 & 1
Dec Nov Dec Percentage Dec Nov Dec Percentage Oct 2010 - Oct 2011 - Percenta
2010 2011 2011 Variance 2010 2011 2011 Variance Dec 2010 Dec 2011 Variance
BURNABY % % %
DETACHED 46 103 66 -35.9 74 84 65 -22.6 241 242 0.4
ATTACHED 33 80 38 -52.5 49 82 40 -51.2 161 183 13.7
APARTMENTS 101 184 103 -44.0 110 120 104 -13.3 382 346 -9.4
COQUITLAM
DETACHED 71 124 62 -50.0 61 89 84 -5.6 238 258 8.4
ATTACHED 28 48 20 -58.3 31 32 21 -34.4 88 83 -5.7
APARTMENTS 44 99 54 -45.5 48 55 44 -20.0 157 156 -0.6
DELTA
DETACHED 26 26 17 -34.6 24 26 18 -30.8 98 79 -19.4
ATTACHED 2 5 3 -40.0 2 5 7 40.0 13 18 38.5
APARTMENTS 5 14 10 -28.6 7 8 9 12.5 45 30 -33.3
MAPLE RIDGE/PITT MEADOWS
DETACHED 70 125 55 -56.0 64 93 72 -22.6 223 250 12.1
ATTACHED 21 36 15 -58.3 29 40 21 -47.5 89 97 9.0
APARTMENTS 17 75 18 -76.0 20 38 37 -2.6 54 93 72.2
NORTH VANCOUVER
DETACHED 22 74 32 -56.8 49 76 53 -30.3 209 221 5.7
ATTACHED 14 24 10 -58.3 14 45 17 -62.2 57 87 52.6APARTMENTS 56 89 49 -44.9 46 80 62 -22.5 197 228 15.7
NEW WESTMINSTER
DETACHED 14 23 10 -56.5 25 20 6 -70.0 90 55 -38.9
ATTACHED 6 8 2 -75.0 0 9 6 -33.3 13 22 69.2
APARTMENTS 72 77 58 -24.7 61 63 62 -1.6 189 192 1.6
PORT MOODY/BELCARRA
DETACHED 6 29 11 -62.1 17 18 14 -22.2 54 50 -7.4
ATTACHED 9 22 9 -59.1 14 27 18 -33.3 40 71 77.5
APARTMENTS 20 33 10 -69.7 14 23 18 -21.7 65 62 -4.6
PORT COQUITLAM
DETACHED 22 38 16 -57.9 29 39 16 -59.0 88 90 2.3
ATTACHED 22 26 12 -53.8 26 17 16 -5.9 73 52 -28.8
APARTMENTS 16 25 22 -12.0 14 23 18 -21.7 56 65 16.1
RICHMOND
DETACHED 111 155 85 -45.2 130 101 62 -38.6 423 269 -36.4
ATTACHED 39 104 55 -47.1 72 76 41 -46.1 238 180 -24.4
APARTMENTS 135 178 102 -42.7 136 95 75 -21.1 419 264 -37.0
SUNSHINE COAST
DETACHED 38 59 25 -57.6 32 34 23 -32.4 110 89 -19.1
ATTACHED 6 2 4 100.0 4 3 1 -66.7 17 4 -76.5
APARTMENTS 1 6 12 100.0 1 1 2 100.0 6 8 33.3
SQUAMISH
DETACHED 11 26 12 -53.8 11 20 12 -40.0 37 48 29.7
ATTACHED 10 19 8 -57.9 2 6 7 16.7 16 19 18.8
APARTMENTS 4 7 10 42.9 4 3 6 100.0 15 10 -33.3
VANCOUVER EAST
DETACHED 75 152 75 -50.7 85 112 95 -15.2 342 333 -2.6
ATTACHED 12 43 6 -86.0 14 30 15 -50.0 86 82 -4.7
APARTMENTS 53 115 62 -46.1 59 101 51 -49.5 233 251 7.7
VANCOUVER WEST
DETACHED 81 164 89 -45.7 116 121 62 -48.8 438 303 -30.8
ATTACHED 35 89 26 -70.8 46 48 31 -35.4 153 124 -19.0
APARTMENTS 214 496 218 -56.0 269 360 262 -27.2 958 949 -0.9
WHISTLER
DETACHED 17 28 26 -7.1 2 15 10 -33.3 20 31 55.0
ATTACHED 35 34 24 -29.4 14 16 13 -18.8 39 46 17.9
APARTMENTS 31 34 34 0.0 10 16 13 -18.8 27 40 48.1
WEST VANCOUVER/HOWE SOUND
DETACHED 35 93 35 -62.4 50 66 38 -42.4 178 194 9.0
ATTACHED 2 4 5 25.0 2 8 0 -100.0 20 12 -40.0
APARTMENTS 4 18 8 -55.6 12 14 11 -21.4 44 38 -13.6
GRAND TOTALS
DETACHED 645 1219 616 -49.5 769 914 630 -31.1 2789 2512 -9.9
ATTACHED 274 544 237 -56.4 319 444 254 -42.8 1103 1080 -2.1APARTMENTS 773 1450 770 -46.9 811 1000 774 -22.6 2847 2732 -4.0
8/3/2019 December 2011 REBGV Stats Courtesy of Mike Stewart Vancouver Realtor
http://slidepdf.com/reader/full/december-2011-rebgv-stats-courtesy-of-mike-stewart-vancouver-realtor 7/7
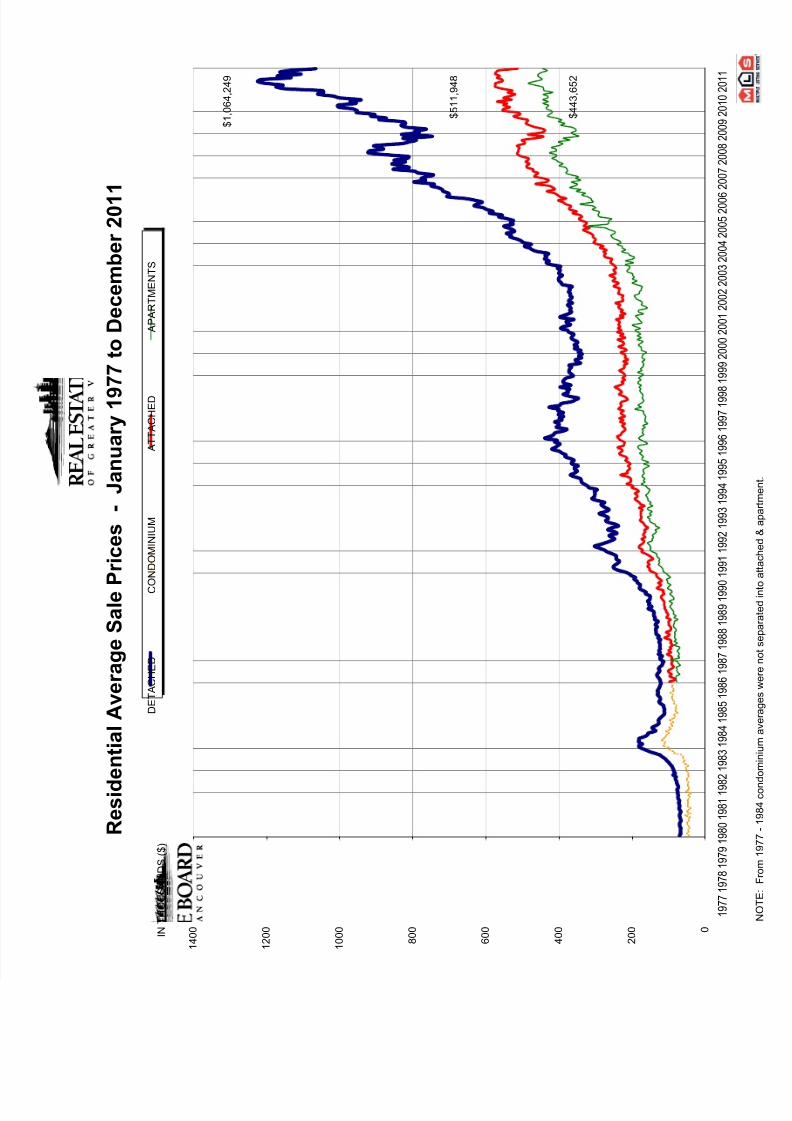
R e s i d
e n t i a l A v e r a g e S a l e P r i c e s
- J a n u a r y 1 9
7 7 t o D e c e m b e r 2 0 1 1
0
2 0 0
4 0 0
6 0 0
8 0 0
1 0 0 0
1 2 0 0
1 4 0 0
1 9 7 7
1 9 7 8
1 9 7 9
1 9 8 0
1 9 8 1
1 9 8 2
1 9 8 3
1 9 8 4
1 9 8 5
1 9 8 6
1 9 8 7
1 9 8 8
1 9 8 9
1 9 9
0
1 9 9 1
1 9 9 2
1 9 9 3
1 9 9 4
1 9 9 5
1 9 9 6
1 9 9 7
1 9 9
8
1 9 9 9
2 0 0 0
2 0 0 1
2 0 0 2
2 0 0 3
2 0 0 4
2 0 0 5
2 0 0 6
2 0 0 7
2 0 0 8
2 0 0 9
2 0 1 0
2 0 1 1
D E T A C H E D
C
O N D O M I N I U M
A T T A C H E D
A P A R T M E N T S
I N
T H O U S A N D S ( $ )
$ 5 1 1 , 9 4 8
$ 4 4 3 , 6 5 2
$ 1 , 0 6 4 , 2 4 9
Related Documents