PM40069240 EXPLORATION PROJECTS TO WATCH SPECIAL FOCUS Milestones on the horizon for juniors chasing hot prospects / 9–15 ROB MCEWEN: ANSWERS CRITICS OF US$90M OFFERING / 5 FORTUNA SILVER: NEARS PRODUCTION AT LINDERO / 16 DECEMBER 10–23, 2018 / VOL. 104 ISSUE 25 / GLOBAL MINING NEWS · SINCE 1915 / $3.99 / WWW.NORTHERNMINER.COM 905 841 5004 | geotech.ca VTEM™ | ZTEM™ | Gravity | Magnetics WWW.SGS.COM/MINING [email protected] DELIVERING QUALITY EXPERTISE GLOBALLY ACROSS THE ENTIRE MINING LIFE CYCLE A drill rig at Nighthawk Gold’s Indin Lake gold property in the Northwest Territories. NIGHTHAWK GOLD S ince it kicked off this year’s 32,500-metre drill program in March, Nighthawk Gold (TSX: NHK; US-OTC: MIMZF) has continued drilling at the Colomac and Grizzly Bear gold deposits, which, along with its Goldcrest gold deposit, make up the Colomac project’s inferred resource of 2.61 million con- tained oz. gold in 50.3 million tonnes grading 1.62 grams gold per tonne. But the company has also spent a lot of time drilling several of its regional gold deposits and showings to build on what it says is a gold camp with vast, underexplored potential in the Indin Lake greenstone belt of the Northwest Territories, 200 km north of Yellowknife. “This past year a little over half of our drill metres were outside Colomac on our larger land package,” Michael Byron, Nighthawk’s president and CEO, says in a telephone interview. “e whole concept of why we consolidated the Indin Lake belt was to demonstrate that it is a gold camp at its very early stages of exploration and evolution.” So far, Nighthawk’s most ex- citing regional targets on the property are Treasure Island, 11 km northwest of Colomac; Leta Arm, 15 km southwest of Colomac; and Damoti Lake, 28 km south of Colomac. e company drilled 16 holes (4,000 metres) at Treasure Island this year — the first drilling there since the company intersected several shallow, high-grade gold intercepts in 2011. All 16 holes intersected min- eralization, with visible gold in 14 of them. Highlights include 46.3 metres grading 3.31 grams gold per tonne from 118 metres downhole, in- cluding 21.8 metres of 6.23 grams Nighthawk explores regions near Colomac in NWT GOLD | Drills ‘vast, unexplored potential’ north of Yellowknife BY TRISH SAYWELL [email protected] See NIGHTHAWK / 6 BY TRISH SAYWELL [email protected] D espite its best efforts, the “most likely scenario” is that in 2021, mining operations will cease in Flin Flon, Man., an internal memo to employees at Hud- bay Minerals (TSX: HBM; NYSE: HBM) says. While the company has extended the life of its 777 mine from 2019 to 2021, the memo notes, its efforts to find new sources of ore from 777 “did not turn out as we hoped.” That means that the Flin Flon mill will also cease operations, the memo states, and the “most likely outcome is that the zinc plant will also close in 2021. “We have to be honest: aſter min- ing for 90 years in the Flin Flon area, we now know that we won’t have an anchor mine to replace 777 and sustain operations in Flin Flon the same way they are today,” Robert Assabgui, vice-president of Hudbay’s Manitoba business unit, wrote to staff. “In 2022, with only Lalor ore avail- able, the zinc plant will have only 50% of the feed that it has today. It is unlikely we will be able to techni- cally or commercially operate the plant at this reduced throughput.” e 777 zinc-copper-gold-silver mine began commercial produc- tion in 2004. e company said it is working to figure out what this means for jobs, but doesn’t have all the answers yet. “I can tell you that we know there will be a need for more people at Stall mill and Lalor mine,” Assabgui said. Flin Flon mining to stop in 2021, Hudbay memo says BASE METALS | Efforts to find more ore failed See HUDBAY / 2

Welcome message from author
This document is posted to help you gain knowledge. Please leave a comment to let me know what you think about it! Share it to your friends and learn new things together.
Transcript

PM40069240
EXPLORATION PROJECTS TO WATCH
SPECIAL FOCUS
Milestones on the horizon for juniors chasing hot prospects / 9–15
ROB MCEWEN: ANSWERS CRITICS OF US$90M OFFERING / 5
FORTUNA SILVER: NEARS PRODUCTION AT LINDERO / 16
DECEMBER 10–23, 2018 / VOL. 104 ISSUE 25 / GLOBAL MINING NEWS · SINCE 1915 / $3.99 / WWW.NORTHERNMINER.COM
905 841 5004 | geotech.ca
VTEM™ | ZTEM™ | Gravity | Magnetics
Geotech_Earlug_2016_Alt2.pdf 1 2016-06-24 4:27:20 PM
WWW.SGS.COM/MINING [email protected]
DELIVERING QUALITY EXPERTISE GLOBALLY ACROSS THE ENTIRE MINING LIFE CYCLE
A drill rig at Nighthawk Gold’s Indin Lake gold property in the Northwest Territories. NIGHTHAWK GOLD
Since it kicked off this year’s 32,500-metre drill program in March, Nighthawk Gold
(TSX: NHK; US-OTC: MIMZF) has continued drilling at the Colomac and Grizzly Bear gold deposits, which, along with its Goldcrest gold deposit, make up the Colomac project’s inferred resource of 2.61 million con-tained oz. gold in 50.3 million tonnes grading 1.62 grams gold per tonne.
But the company has also spent a lot of time drilling several of
its regional gold deposits and showings to build on what it says is a gold camp with vast, underexplored potential in the Indin Lake greenstone belt of the Northwest Territories, 200 km north of Yellowknife.
“This past year a little over half of our drill metres were outside Colomac on our larger land package,” Michael Byron, Nighthawk’s president and CEO, says in a telephone interview. “The whole concept of why we consolidated the Indin Lake belt was to demonstrate that it is a gold camp at its very early stages of exploration and evolution.”
So far, Nighthawk’s most ex-citing regional targets on the
property are Treasure Island, 11 km northwest of Colomac; Leta Arm, 15 km southwest of Colomac; and Damoti Lake, 28 km south of Colomac.
The company drilled 16 holes (4,000 metres) at Treasure Island this year — the first drilling there since the company intersected several shallow, high-grade gold intercepts in 2011.
All 16 holes intersected min-eralization, with visible gold in 14 of them.
Highlights include 46.3 metres grading 3.31 grams gold per tonne from 118 metres downhole, in-cluding 21.8 metres of 6.23 grams
Nighthawk explores regions near Colomac in NWT
GOLD | Drills ‘vast, unexplored potential’ north of Yellowknife
BY TRISH [email protected]
See NIGHTHAWK / 6
BY TRISH [email protected]
Despite its best efforts, the “most likely scenario” is that in 2021, mining operations
will cease in Flin Flon, Man., an internal memo to employees at Hud-bay Minerals (TSX: HBM; NYSE: HBM) says.
While the company has extended the life of its 777 mine from 2019 to 2021, the memo notes, its efforts to find new sources of ore from 777 “did not turn out as we hoped.”
That means that the Flin Flon mill will also cease operations, the memo states, and the “most likely outcome is that the zinc plant will also close in 2021.
“We have to be honest: after min-ing for 90 years in the Flin Flon area, we now know that we won’t have an anchor mine to replace 777 and sustain operations in Flin Flon the same way they are today,” Robert Assabgui, vice-president of Hudbay’s Manitoba business unit, wrote to staff.
“In 2022, with only Lalor ore avail-able, the zinc plant will have only 50% of the feed that it has today. It is unlikely we will be able to techni-cally or commercially operate the plant at this reduced throughput.”
The 777 zinc-copper-gold-silver mine began commercial produc-tion in 2004.
The company said it is working to figure out what this means for jobs, but doesn’t have all the answers yet.
“I can tell you that we know there will be a need for more people at Stall mill and Lalor mine,” Assabgui said.
Flin Flon mining to
stop in 2021, Hudbay
memo saysBASE METALS | Efforts to
find more ore failed
See HUDBAY / 2
1-16_DEC10_Main .indd 1 2018-12-04 9:34 PM

WWW.NORTHERNMINER.COM2 DECEMBER 10–23, 2018 / THE NORTHERN MINER
Leading provider of analytical geochemistry services
alsglobal.com/geochemistry • [email protected]
BY RICHARD [email protected]
Carube Copper (TSXV: CUC) has expanded the gold-in-soil anomaly at its Main Ridge
gold project in Jamaica east to a 5.5 km total strike length.
Though Carube has several copper and gold projects in Jamaica, the company says Main Ridge is one it can fast track through explora-tion. Carube is now carrying out detailed mapping and sampling at Main Ridge, including rock-chip samples, grab samples and chan-nel samples across all mineralized structures it considers significant. This could continue until year-end.
“We are aggressively working on our Main Ridge gold project in Jamaica, where we’ve found pretty good indications of mineralization at surface,” company president and CEO Stephen Hughes says in a tele-phone interview with The Northern Miner.
The company first defined a gold-in-soil anomaly at Main Ridge in August 2018 to a minimum 2 km strike length, with gold values rang-ing from 0.05 to 6.13 grams gold per tonne. At the time, Carube found two mineralized structures. It collected grab samples grading 6.1 grams gold and 13.9 grams gold from what became its Donkey Hill and Mango Valley prospects.
The prospects sit along trend northwest of the Pennants gold deposit, which AusJam Mining developed into a small, open-pit gold mine after BHP Billiton (LON: BHP; NYSE: BHP) found it in the early 1990s. Drilling by AusJam at Pennants reported grades as high as 429.78 grams gold over 1.7 me-tres, and 56.41 grams gold over 3.8 metres. AusJ reportedly mined as much as 15,000 oz. gold at Pennants.
The Pennants deposit has a 75,500-tonne historical resource
grading 20.4 grams gold. AusJam reported 17 grams gold over 3.1 metres and 2.7 grams gold over 1.4 metres in historical drilling at Main Ridge.
In October 2018, Carube an-nounced more high-grade, rock-chip samples from Main Ridge, along with a third gold prospect called Silver Fish. Recent grab samples have graded as high as 19.3 grams gold at Mango Valley, 12 grams gold at Donkey Hill and 1.7 grams gold at Silver Fish. All prospects are hosted in quartz vein
structures.Most recently, Carube found two
more gold-in-soil anomalies on the other side of Pennants, east of the deposit, called Guava Ridge and John Austin. The company took 326 samples at eastern Main Ridge at 100-metre spacings over a 1,500- by 1,900-metre area.
The samples graded up to 1.14 grams gold in soils at Guava Ridge and 2.11 grams gold in soils at John Austin. Grab samples graded as high as 0.21 gram gold at Guava Ridge and 1.19 grams gold at John Austin.
Main Ridge also hosts two copper-in-soil anomalies called Orange Hill and Trout Hall. Rock-chip channel sampling at Trout Hall returned grades as high as 0.84% copper over 0.8 metre and 0.79% copper over 1.5 metres.
“Outside of that we’re actively speaking to at least 10 companies at a time about copper projects across the globe, with a preference to the Americas,” Hughes says.
Hughes took over as CEO earlier this year, replacing Jeff Ackert, who stepped aside and became the com-
pany’s vice-president of business development. The company then reorganized its board.
“What we’ve done is created a group of extremely experienced and talented individuals to look at things a bit differently than what was done in the past at Carube,” Hughes says. “It was a Jamaica-focused company, and I see that changing now.”
Hughes says Jamaica has good copper projects, but not “of the scale that is of serious interest.” Still, the company is reviewing its copper anomalies across Jamaica to determine which ones could host a deposit.
The company intends to pick up at least two more exploration or development projects. While its focus is copper, Hughes says he is considering gold assets, as well. He says his intent is to lower the com-pany’s risk profile by diversifying its portfolio.
“First and foremost, I don’t like being isolated in one country,” Hughes says. “It just increases your risk.”
He adds that “everyone on the board, we all believe that next year there’s going to be a significant in-crease in copper price, as companies either don’t meet production levels, or those that are have lower grades than planned.”
Before joining Carube, Hughes served for 23 years as a director and as vice-president of explora-tion for Asiamet Resources (LON: ARS; US-OTC: KMGLF), which is preparing a bankable feasibility study for its Beruang Kanan Main copper project in Indonesia. The project has 49.2 million measured and indicated tonnes grading 0.7% copper for 711.3 million lb. copper at a 0.2% copper cut-off grade.
Shares of Carube Copper are trad-ing at 4¢ in a 52-week range of 4¢ to 10¢. The company has a $7-million market capitalization. TNM
Carube expands gold anomalyat Main Ridge in Jamaica
GOLD | New management to expand company’s focus beyond Jamaica
“We are also optimistic that there will be additional jobs at the New Brit gold mill once refurbished, and potentially at Pen, if this project moves forward.
“We are still working through these business scenarios, and since these studies are still ongoing, we cannot provide a definitive answer. We anticipate offering training to help people transition to future roles, but we also expect that job loss will be part of the outcome.”
In 2015, Hudbay acquired a 100%
stake in the New Britannia mine and mill in Snow Lake. The mill is on care and maintenance, but if refurbished, could process up to 1,500 tonnes per day of gold zone and copper-gold zone ore
from Lalor, and could provide an alternative to moving Lalor ore to Flin Flon for processing. The New Britannia mill includes a carbon-in-pulp circuit that has historically produced gold doré on-site.
Hudbay’s Lalor mine, in the Chisel basin, 208 km east of Flin Flon in Snow Lake, produces zinc, copper, gold and silver. Initial pro-duction began in August 2012 and the mine reached commercial pro-duction in the third quarter of 2014.
Hudbay’s concentrator in Snow Lake processes ore from Lalor. The concentrator was refurbished in 2014 and processes 3,000 tonnes of mineralized material a day from the Lalor mine, and produces zinc and copper concentrates.
Hudbay’s Reed copper mine, 120 km east of Flin Flon, produced its last ore in August and processing was completed in September. The mine started commercial produc-tion in the first quarter of 2014. TNM
“WE HAVE TO BE HONEST: AFTER MINING FOR 90 YEARS IN THE FLIN FLON AREA, WE NOW KNOW THAT WE WON’T HAVE AN ANCHOR MINE TO REPLACE 777.”ROBERT ASSABGUIVICE-PRESIDENT OF MANITOBA BUSINESS UNIT, HUDBAY
HUDBAY From 1
Flin Flon mining to stop in 2021, Hudbay memo says
A jumbo at Hudbay Minerals’ 777 zinc-copper mine in Flin Flon, Manitoba. HUDBAY MINERALS
Personnel in the field at Carube Copper’s Main Ridge gold project in Jamaica. CARUBE COPPER
1-16_DEC10_Main .indd 2 2018-12-04 9:34 PM
GLOBAL MINING NEWS THE NORTHERN MINER / DECEMBER 10–23, 2018 3
Cobalt 27 Capital Corp. (TSXV: KBLT; OTCQX: CBLLF; FRA: 270) is ramping up its exposure to the electric vehicle (EV) revolution with substantial cobalt stream acquisitions to complement its portfolio of battery metal royalties and inventory of physical cobalt.
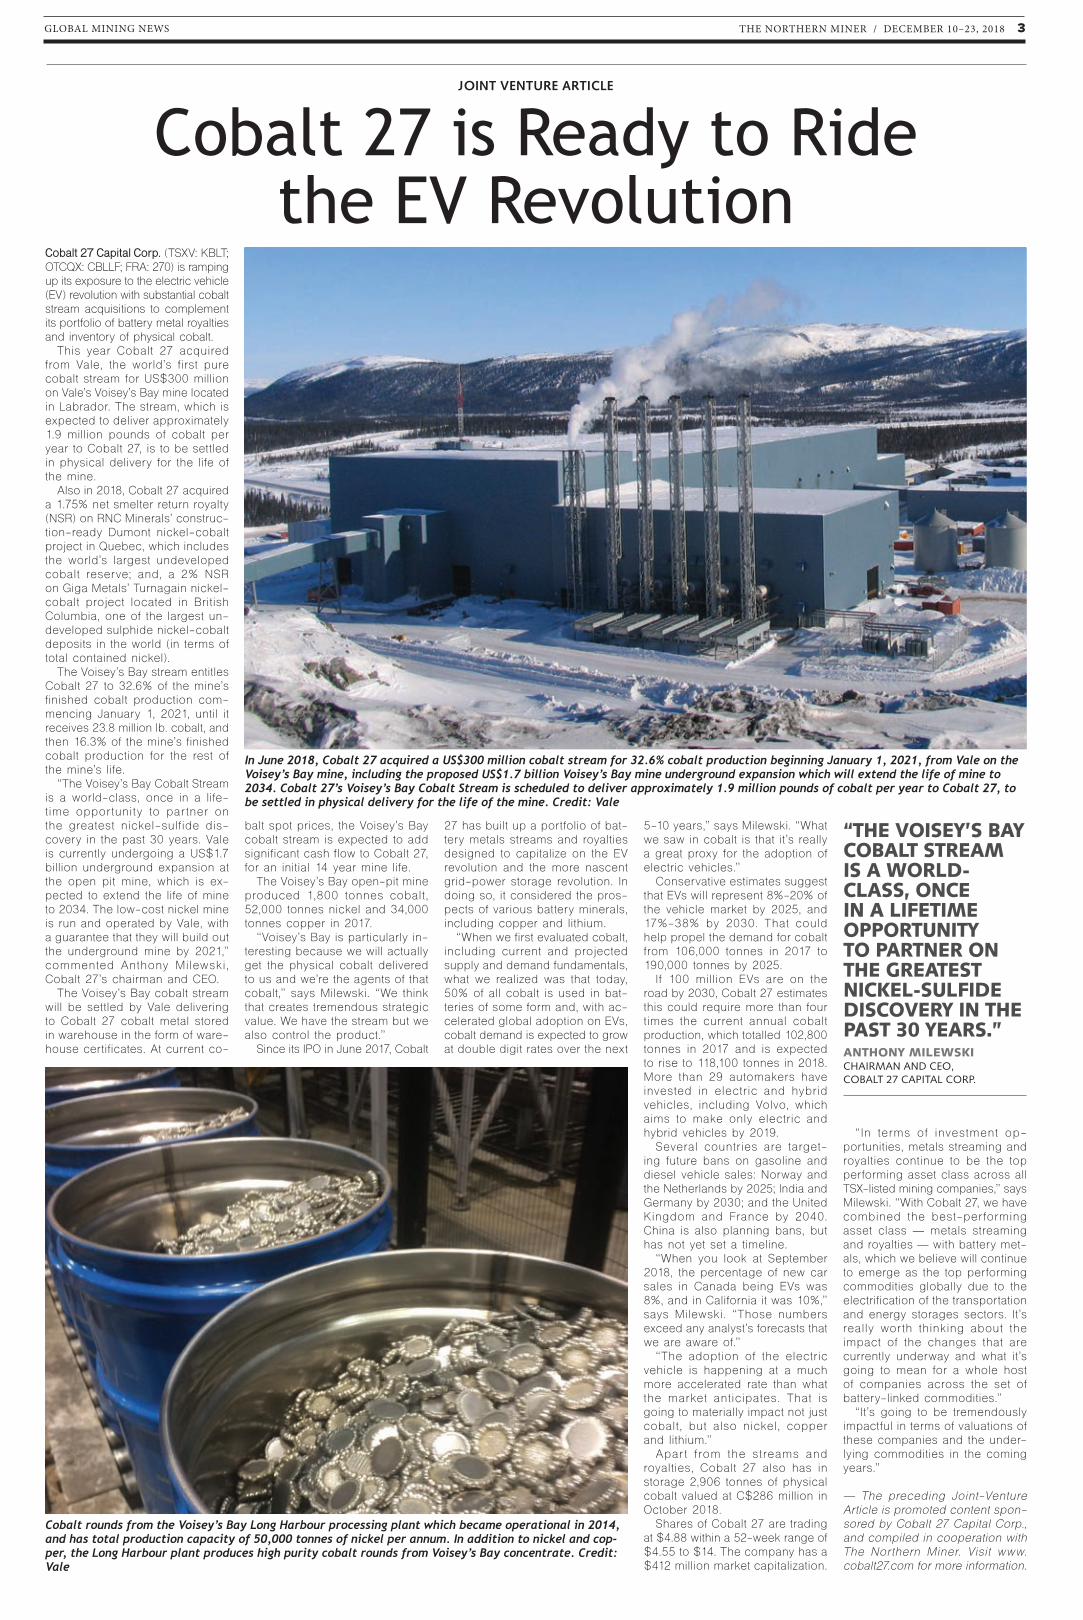
This year Cobalt 27 acquired from Vale, the world’s first pure cobalt stream for US$300 million on Vale’s Voisey’s Bay mine located in Labrador. The stream, which is expected to deliver approximately 1.9 million pounds of cobalt per year to Cobalt 27, is to be settled in physical delivery for the life of the mine.
Also in 2018, Cobalt 27 acquired a 1.75% net smelter return royalty (NSR) on RNC Minerals’ construc-tion-ready Dumont nickel-cobalt project in Quebec, which includes the world’s largest undeveloped cobalt reserve; and, a 2% NSR on Giga Metals’ Turnagain nickel-cobalt project located in British Columbia, one of the largest un-developed sulphide nickel-cobalt deposits in the world (in terms of total contained nickel).
The Voisey’s Bay stream entitles Cobalt 27 to 32.6% of the mine’s finished cobalt production com-mencing January 1, 2021, until it receives 23.8 million lb. cobalt, and then 16.3% of the mine’s finished cobalt production for the rest of the mine’s life.
“The Voisey’s Bay Cobalt Stream is a world-class, once in a life-t ime oppor tunity to par tner on the greatest nickel-sulf ide dis-covery in the past 30 years. Vale is currently undergoing a US$1.7 billion underground expansion at the open pit mine, which is ex-pected to extend the life of mine to 2034. The low-cost nickel mine is run and operated by Vale, with a guarantee that they will build out the underground mine by 2021,” commented Anthony Milewski, Cobalt 27’s chairman and CEO.
The Voisey’s Bay cobalt stream will be settled by Vale delivering to Cobalt 27 cobalt metal stored in warehouse in the form of ware-house certificates. At current co-
balt spot prices, the Voisey’s Bay cobalt stream is expected to add significant cash flow to Cobalt 27, for an initial 14 year mine life.
The Voisey’s Bay open-pit mine produced 1,800 tonnes cobalt, 52,000 tonnes nickel and 34,000 tonnes copper in 2017.
“Voisey’s Bay is particularly in-teresting because we will actually get the physical cobalt delivered to us and we’re the agents of that cobalt,” says Milewski. “We think that creates tremendous strategic value. We have the stream but we also control the product.”
Since its IPO in June 2017, Cobalt
27 has built up a portfolio of bat-tery metals streams and royalties designed to capitalize on the EV revolution and the more nascent grid-power storage revolution. In doing so, it considered the pros-pects of various battery minerals, including copper and lithium.
“When we first evaluated cobalt, including current and projected supply and demand fundamentals, what we realized was that today, 50% of all cobalt is used in bat-teries of some form and, with ac-celerated global adoption on EVs, cobalt demand is expected to grow at double digit rates over the next
5-10 years,” says Milewski. “What we saw in cobalt is that it’s really a great proxy for the adoption of electric vehicles.”
Conservative estimates suggest that EVs will represent 8%-20% of the vehicle market by 2025, and 17%-38% by 2030. That could help propel the demand for cobalt from 106,000 tonnes in 2017 to 190,000 tonnes by 2025.
If 100 million EVs are on the road by 2030, Cobalt 27 estimates this could require more than four times the current annual cobalt production, which totalled 102,800 tonnes in 2017 and is expected to rise to 118,100 tonnes in 2018. More than 29 automakers have invested in electr ic and hybrid vehicles, including Volvo, which aims to make only electric and hybrid vehicles by 2019.
Several countries are target-ing future bans on gasoline and diesel vehicle sales: Norway and the Netherlands by 2025; India and Germany by 2030; and the United Kingdom and France by 2040. China is also planning bans, but has not yet set a timeline.
“When you look at September 2018, the percentage of new car sales in Canada being EVs was 8%, and in California it was 10%,” says Milewski. “Those numbers exceed any analyst’s forecasts that we are aware of.”
“The adoption of the electric vehicle is happening at a much more accelerated rate than what the market ant ic ipates. That is going to materially impact not just cobalt, but also nickel, copper and lithium.”
Apar t f rom the st reams and royalties, Cobalt 27 also has in storage 2,906 tonnes of physical cobalt valued at C$286 million in October 2018.
Shares of Cobalt 27 are trading at $4.88 within a 52-week range of $4.55 to $14. The company has a $412 million market capitalization.
“In terms of investment op-portunities, metals streaming and royalties continue to be the top performing asset class across all TSX-listed mining companies,” says Milewski. “With Cobalt 27, we have combined the best-per forming asset class — metals streaming and royalties — with battery met-als, which we believe will continue to emerge as the top performing commodities globally due to the electrification of the transportation and energy storages sectors. It’s really wor th thinking about the impact of the changes that are currently underway and what it’s going to mean for a whole host of companies across the set of battery-linked commodities.”
“It’s going to be tremendously impactful in terms of valuations of these companies and the under-lying commodities in the coming years.”
— The preceding Joint-Venture Article is promoted content spon-sored by Cobalt 27 Capital Corp., and compiled in cooperation with The Northern Miner. Visit www.cobalt27.com for more information.
In June 2018, Cobalt 27 acquired a US$300 million cobalt stream for 32.6% cobalt production beginning January 1, 2021, from Vale on the Voisey’s Bay mine, including the proposed US$1.7 billion Voisey’s Bay mine underground expansion which will extend the life of mine to 2034. Cobalt 27’s Voisey’s Bay Cobalt Stream is scheduled to deliver approximately 1.9 million pounds of cobalt per year to Cobalt 27, to be settled in physical delivery for the life of the mine. Credit: Vale
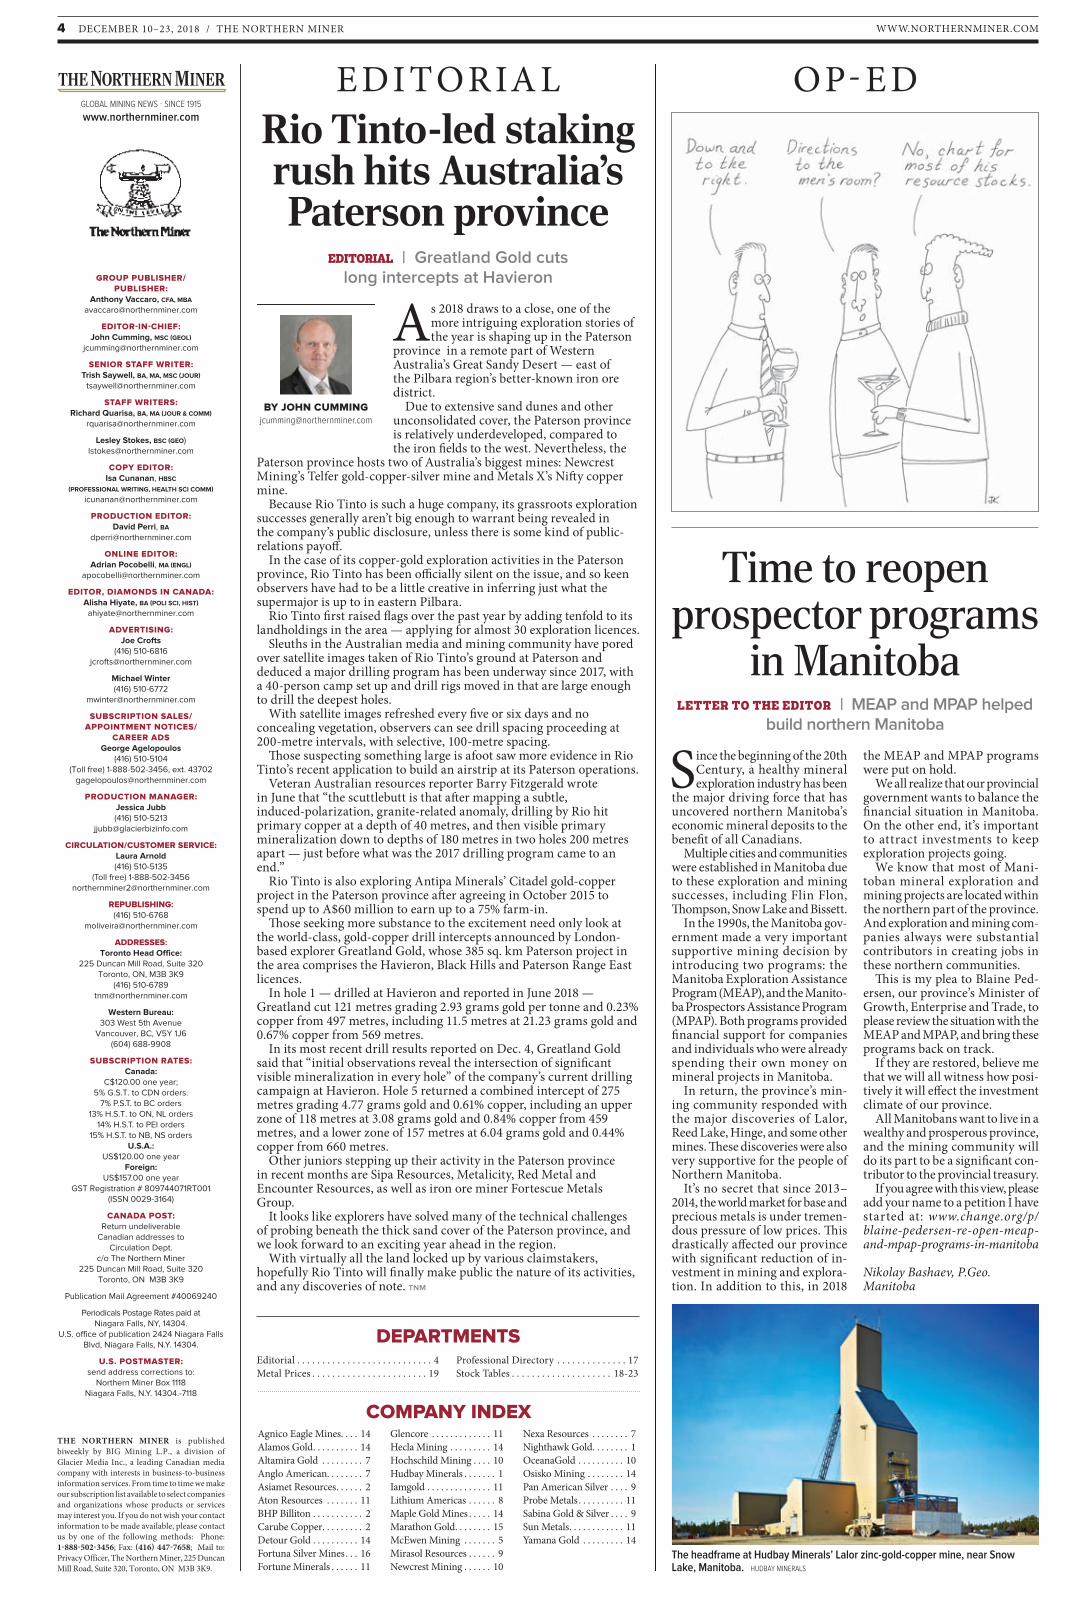
Cobalt rounds from the Voisey’s Bay Long Harbour processing plant which became operational in 2014, and has total production capacity of 50,000 tonnes of nickel per annum. In addition to nickel and cop-per, the Long Harbour plant produces high purity cobalt rounds from Voisey’s Bay concentrate. Credit: Vale
Cobalt 27 is Ready to Ride the EV Revolution
JOINT VENTURE ARTICLE
“THE VOISEY’S BAY COBALT STREAM IS A WORLD-CLASS, ONCE IN A LIFETIME OPPORTUNITY TO PARTNER ON THE GREATEST NICKEL-SULFIDE DISCOVERY IN THE PAST 30 YEARS.”ANTHONY MILEWSKICHAIRMAN AND CEO, COBALT 27 CAPITAL CORP.
1-16_DEC10_Main .indd 3 2018-12-04 9:26 PM
WWW.NORTHERNMINER.COM4 DECEMBER 10–23, 2018 / THE NORTHERN MINER
As 2018 draws to a close, one of the more intriguing exploration stories of the year is shaping up in the Paterson
province in a remote part of Western Australia’s Great Sandy Desert — east of the Pilbara region’s better-known iron ore district.
Due to extensive sand dunes and other unconsolidated cover, the Paterson province is relatively underdeveloped, compared to the iron fields to the west. Nevertheless, the
Paterson province hosts two of Australia’s biggest mines: Newcrest Mining’s Telfer gold-copper-silver mine and Metals X’s Nifty copper mine.
Because Rio Tinto is such a huge company, its grassroots exploration successes generally aren’t big enough to warrant being revealed in the company’s public disclosure, unless there is some kind of public-relations payoff.
In the case of its copper-gold exploration activities in the Paterson province, Rio Tinto has been officially silent on the issue, and so keen observers have had to be a little creative in inferring just what the supermajor is up to in eastern Pilbara.
Rio Tinto first raised flags over the past year by adding tenfold to its landholdings in the area — applying for almost 30 exploration licences.
Sleuths in the Australian media and mining community have pored over satellite images taken of Rio Tinto’s ground at Paterson and deduced a major drilling program has been underway since 2017, with a 40-person camp set up and drill rigs moved in that are large enough to drill the deepest holes.
With satellite images refreshed every five or six days and no concealing vegetation, observers can see drill spacing proceeding at 200-metre intervals, with selective, 100-metre spacing.
Those suspecting something large is afoot saw more evidence in Rio Tinto’s recent application to build an airstrip at its Paterson operations.
Veteran Australian resources reporter Barry Fitzgerald wrote in June that “the scuttlebutt is that after mapping a subtle, induced-polarization, granite-related anomaly, drilling by Rio hit primary copper at a depth of 40 metres, and then visible primary mineralization down to depths of 180 metres in two holes 200 metres apart — just before what was the 2017 drilling program came to an end.”
Rio Tinto is also exploring Antipa Minerals’ Citadel gold-copper project in the Paterson province after agreeing in October 2015 to spend up to A$60 million to earn up to a 75% farm-in.
Those seeking more substance to the excitement need only look at the world-class, gold-copper drill intercepts announced by London-based explorer Greatland Gold, whose 385 sq. km Paterson project in the area comprises the Havieron, Black Hills and Paterson Range East licences.
In hole 1 — drilled at Havieron and reported in June 2018 — Greatland cut 121 metres grading 2.93 grams gold per tonne and 0.23% copper from 497 metres, including 11.5 metres at 21.23 grams gold and 0.67% copper from 569 metres.
In its most recent drill results reported on Dec. 4, Greatland Gold said that “initial observations reveal the intersection of significant visible mineralization in every hole” of the company’s current drilling campaign at Havieron. Hole 5 returned a combined intercept of 275 metres grading 4.77 grams gold and 0.61% copper, including an upper zone of 118 metres at 3.08 grams gold and 0.84% copper from 459 metres, and a lower zone of 157 metres at 6.04 grams gold and 0.44% copper from 660 metres.
Other juniors stepping up their activity in the Paterson province in recent months are Sipa Resources, Metalicity, Red Metal and Encounter Resources, as well as iron ore miner Fortescue Metals Group.
It looks like explorers have solved many of the technical challenges of probing beneath the thick sand cover of the Paterson province, and we look forward to an exciting year ahead in the region.
With virtually all the land locked up by various claimstakers, hopefully Rio Tinto will finally make public the nature of its activities, and any discoveries of note. TNM
EDITORIAL
DEPARTMENTS
COMPANY INDEXAgnico Eagle Mines . . . . 14Alamos Gold . . . . . . . . . . 14Altamira Gold . . . . . . . . . 7Anglo American. . . . . . . . 7Asiamet Resources . . . . . . 2Aton Resources . . . . . . . 11BHP Billiton . . . . . . . . . . . 2Carube Copper . . . . . . . . . 2Detour Gold . . . . . . . . . . 14Fortuna Silver Mines . . . 16Fortune Minerals . . . . . . 11
Glencore . . . . . . . . . . . . . 11Hecla Mining . . . . . . . . . 14Hochschild Mining . . . . 10Hudbay Minerals . . . . . . . 1Iamgold . . . . . . . . . . . . . . 11Lithium Americas . . . . . . 8Maple Gold Mines . . . . . 14Marathon Gold . . . . . . . . 15McEwen Mining . . . . . . . 5Mirasol Resources . . . . . . 9Newcrest Mining . . . . . . 10
Nexa Resources . . . . . . . . 7Nighthawk Gold. . . . . . . . 1OceanaGold . . . . . . . . . . 10Osisko Mining . . . . . . . . 14Pan American Silver . . . . 9Probe Metals . . . . . . . . . . 11Sabina Gold & Silver . . . . 9Sun Metals . . . . . . . . . . . . 11Yamana Gold . . . . . . . . . 14
Editorial . . . . . . . . . . . . . . . . . . . . . . . . . . . 4Metal Prices . . . . . . . . . . . . . . . . . . . . . . . 19
Professional Directory . . . . . . . . . . . . . . 17Stock Tables . . . . . . . . . . . . . . . . . . . . 18-23
Rio Tinto-led staking rush hits Australia’s Paterson province
EDITORIAL | Greatland Gold cuts long intercepts at Havieron
Since the beginning of the 20th Century, a healthy mineral exploration industry has been
the major driving force that has uncovered northern Manitoba’s economic mineral deposits to the benefit of all Canadians.
Multiple cities and communities were established in Manitoba due to these exploration and mining successes, including Flin Flon, Thompson, Snow Lake and Bissett.
In the 1990s, the Manitoba gov-ernment made a very important supportive mining decision by introducing two programs: the Manitoba Exploration Assistance Program (MEAP), and the Manito-ba Prospectors Assistance Program (MPAP). Both programs provided financial support for companies and individuals who were already spending their own money on mineral projects in Manitoba.
In return, the province’s min-ing community responded with the major discoveries of Lalor, Reed Lake, Hinge, and some other mines. These discoveries were also very supportive for the people of Northern Manitoba.
It’s no secret that since 2013–2014, the world market for base and precious metals is under tremen-dous pressure of low prices. This drastically affected our province with significant reduction of in-vestment in mining and explora-tion. In addition to this, in 2018
the MEAP and MPAP programs were put on hold.
We all realize that our provincial government wants to balance the financial situation in Manitoba. On the other end, it’s important to attract investments to keep exploration projects going.
We know that most of Mani-toban mineral exploration and mining projects are located within the northern part of the province. And exploration and mining com-panies always were substantial contributors in creating jobs in these northern communities.
This is my plea to Blaine Ped-ersen, our province’s Minister of Growth, Enterprise and Trade, to please review the situation with the MEAP and MPAP, and bring these programs back on track.
If they are restored, believe me that we will all witness how posi-tively it will effect the investment climate of our province.
All Manitobans want to live in a wealthy and prosperous province, and the mining community will do its part to be a significant con-tributor to the provincial treasury.
If you agree with this view, please add your name to a petition I have started at: www.change.org/p/blaine-pedersen-re-open-meap-and-mpap-programs-in-manitoba
Nikolay Bashaev, P.Geo.Manitoba
Time to reopen prospector programs
in ManitobaLETTER TO THE EDITOR | MEAP and MPAP helped
build northern Manitoba
OP-EDGLOBAL MINING NEWS · SINCE 1915
www.northernminer.com
BY JOHN [email protected]
GROUP PUBLISHER/ PUBLISHER:
Anthony Vaccaro, CFA, MBA [email protected]
EDITOR-IN-CHIEF: John Cumming, MSC (GEOL)
SENIOR STAFF WRITER: Trish Saywell, BA, MA, MSC (JOUR)
STAFF WRITERS: Richard Quarisa, BA, MA (JOUR & COMM)
Lesley Stokes, BSC (GEO) [email protected]
COPY EDITOR: Isa Cunanan, HBSC
(PROFESSIONAL WRITING, HEALTH SCI COMM) [email protected]
PRODUCTION EDITOR: David Perri, BA
ONLINE EDITOR: Adrian Pocobelli, MA (ENGL)
EDITOR, DIAMONDS IN CANADA: Alisha Hiyate, BA (POLI SCI, HIST) [email protected]
ADVERTISING: Joe Crofts
(416) 510-6816 [email protected]
Michael Winter (416) 510-6772
SUBSCRIPTION SALES/ APPOINTMENT NOTICES/
CAREER ADS George Agelopoulos
(416) 510-5104 (Toll free) 1-888-502-3456, ext. 43702
PRODUCTION MANAGER: Jessica Jubb (416) 510-5213
CIRCULATION/CUSTOMER SERVICE: Laura Arnold (416) 510-5135
(Toll free) 1-888-502-3456 [email protected]
REPUBLISHING: (416) 510-6768
ADDRESSES: Toronto Head Office:
225 Duncan Mill Road, Suite 320 Toronto, ON, M3B 3K9
(416) 510-6789 [email protected]
Western Bureau: 303 West 5th Avenue
Vancouver, BC, V5Y 1J6 (604) 688-9908
SUBSCRIPTION RATES: Canada:
C$120.00 one year; 5% G.S.T. to CDN orders.
7% P.S.T. to BC orders 13% H.S.T. to ON, NL orders
14% H.S.T. to PEI orders 15% H.S.T. to NB, NS orders
U.S.A.: US$120.00 one year
Foreign: US$157.00 one year
GST Registration # 809744071RT001 (ISSN 0029-3164)
CANADA POST: Return undeliverable
Canadian addresses to Circulation Dept.
c/o The Northern Miner 225 Duncan Mill Road, Suite 320
Toronto, ON M3B 3K9
Publication Mail Agreement #40069240
Periodicals Postage Rates paid at Niagara Falls, NY, 14304.
U.S. office of publication 2424 Niagara Falls Blvd, Niagara Falls, N.Y. 14304.
U.S. POSTMASTER: send address corrections to:
Northern Miner Box 1118 Niagara Falls, N.Y. 14304.-7118
THE NORTHERN MINER is published biweekly by BIG Mining L.P., a division of Glacier Media Inc., a leading Canadian media company with interests in business-to-business information services. From time to time we make our subscription list available to select companies and organi zations whose products or services may interest you. If you do not wish your contact information to be made available, please contact us by one of the following methods: Phone: 1-888-502-3456; Fax: (416) 447-7658; Mail to: Privacy Officer, The Northern Miner, 225 Duncan Mill Road, Suite 320, Toronto, ON M3B 3K9.
The headframe at Hudbay Minerals’ Lalor zinc-gold-copper mine, near Snow Lake, Manitoba. HUDBAY MINERALS
1-16_DEC10_Main .indd 4 2018-12-04 9:26 PM
GLOBAL MINING NEWS THE NORTHERN MINER / DECEMBER 10–23, 2018 5
BY TRISH [email protected]
On Nov. 8, McEwen Mining (TSX: MUX; NYSE: MUX) entered an equity distribu-
tion agreement with UBS Securi-ties, BMO Capital Markets, Cantor Fitzgerald & Co., H.C. Wainwright & Co., Roth Capital Partners and Alliance Global Partners to offer up to US$90 million of its common stock in the United States. Under the terms of the at-the-market offering (ATM) filed with the U.S. Securities and Exchange Commission (SEC), the agents can sell stock in McEwen Mining at the current market price on the New York Stock Exchange and get a 2% commission of the gross sales price per share of the company’s common stock. ATMs have become a popular method of financing for companies in the U.S., helping them raise equity capital over time by selling new shares into the trading market at prevailing prices, rather than through traditional underwrit-ten offerings of a fixed number of shares at a fixed price all at once. They are generally less expensive and less complicated to execute. Most companies disclose ATMs when they provide regular financial updates, such as during quarterly conference calls. The Northern Miner spoke with McEwen Mining founder Rob McEwen about the offering.
The Northern Miner: What was the rationale behind the offering and the timing?
Rob McEwen: It’s an instrument called an “at-the-market financing.” They’re fairly common in the U.S. and are gaining popularity here. It’s a cheaper way of raising money. The investment bankers’ fees are half or less. They say that they don’t have to do as much work. They basically sell shares into the market over an extended period of time.
TNM: How does it work?
RM: You do a registration with the SEC, and, similar to shelf fil-ings, the registration is for potential sales, meaning the sales under this instrument can be done at our dis-cretion and timing. This financing is not done right away. This instru-ment allows us to raise up to US$90 million over a period of time. The shares will be sold into the market at the market price. So, you don’t have the traditional discount that occurs when you do a financing like a marketed deal or a bought deal. Investment banking fees are usually half or less. Also, this type of financing is usually less disruptive to your share price. Furthermore, the advice we received from our financial advisors was that most
companies that use this form of financing make the mandatory public filings but do not make or issue a press release relating to the financing. So we followed what was standard practice. We registered the financing to have flexibility. Not only are we building our Gold Bar mine, but we wanted to have funds for exploration targets on our other properties, and to also have the capacity to take advantage of attractive growth opportunities.
TNM: What is the period of time specified for issuing these additional shares?
RM: There is no defined period and it can effectively be evergreen, but, again, this is at our discretion and we can cancel it at any time. Or we can raise the full amount and satisfy the registration limit. But it wouldn’t be raised all at once.
TNM: In the system for electronic document analysis and retrieval (SEDAR) filing, it says the net pro-ceeds will be used by McEwen Mining for working capital and for general corporate purposes, and some of it might be used to invest in short-term, investment-grade, interest-bearing investments and U.S. government
securities. Can you elaborate?
RM: The time to look for and acquire growth opportunities is right now. The financing is all about being pre-pared and able to react when we see a value-adding transaction. It could be a joint venture or a mergers and acquisitions transaction.
TNM: Could you be more specific?
RM: [Laughs.] No comment.
TNM: There has been some criti-cism of the company for not issuing a press release.
RM: The advice we got from the investment bankers is that you don’t need a press release. Very few com-panies that use this type of financ-ing, which must be publicly filed on SEDAR, make a press release. Once filed on SEDAR, it is consid-ered publicly disclosed. Filings on SEDAR trigger notices on watch lists monitored by many investors. I was surprised and saddened by the reaction. In hindsight, a press release setting out why we were registering this financing and how the financing worked would have been a good idea.
TNM: If you did another one, would you put out a press release?
RM: Absolutely, given the adverse reaction we experienced.
TNM: How are other things going at McEwen Mining?
RM: Construction of our Gold Bar mine is advancing, and we expect it to be up and running by year-end, and declaring commercial production in the first quarter. The tricky part about building a mine is making it work the way you said it was going to work, so we are very anxious until it’s doing just that: delivering the promise. I am pleased to say that Gold Bar is on schedule and on budget.
We’re just completing our explo-ration program at Black Fox. We spent $15 million on our property in Timmins. We’ll soon release resource updates in December and in the first quarter of 2019 for Black Fox and Gold Bar, and in the first half hope to have an amended permit to construct our Fenix project in Mexico. We are focused on extending the lives of our mines, reducing our operating cost per ounce and building our production base. TNM
Rob McEwen responds to criticism of US$90M at-the-market offering
INTERVIEW | Fundraising effort aims to give McEwen Mining more flexibility
In a move long sought by mineral explorers active in Canada, Canada’s federal government
has extended its mineral explora-tion tax credit (METC) for five years, in contrast to the prior trad-tion of renewing it annually.
The news came in November as part of the government’s fall eco-nomic statement, which included a $17.6-billion suite of business-friendly tax measures and invest-ments that should benefit firms in the mineral sector.
The METC allows qualifying ex-plorers (that don’t generate revenue from which to deduct expenses) to pass deductions on to investors by selling them flow-through shares. Investors also get an extra 15% tax credit when investing in what are now known as “super flow-through shares.”
The latest iteration of the METC was set to expire on March 31, 2019.
The government estimates the METC extension will lower revenues by $365 million over the five years.
Between 2010 and 2016, compa-nies raised an average $505 million each year under the METC, accord-ing to the government.
The Prospectors and Developers Association of Canada (PDAC) says this marks the first multi-year extension of the METC since its iteration was introduced in 2000. It was later renewed annually by successive governments.
“We are pleased that the govern-ment has heard our concerns about Canada’s waning competitiveness and adopted our recommendation,” says Lisa McDonald, PDAC interim executive director and chief operat-ing officer.
The Mining Association of Can-ada (MAC) also lauded the govern-ment for announcing two other tax measures, which should help miners and metal producers by helping firms write off three times the eligible costs of newly bought assets in the acquisition year, and write off the full cost of clean energy equipment.
“The enhanced treatment of capi-tal expenditures in the first year for mining and metal manufacturing provides an important incentive to invest in Canada,” MAC head Pierre Gratton says. “The write-off of the full cost of clean energy equipment will serve to incentivize investments in northern Canada where access to grid power does not exist, sup-porting a transition to low carbon energy alternatives.”
Gratton adds that he hopes miners can write off the cost of switching to electric haul trucks and other equipment.
MAC welcomed several other measures in the government an-nouncement: another $800 mil-lion over five years for the Strategic Innovation Fund; a commitment to boost overseas exports 50% by 2025; a proposed $13.6-million in-crease to the multimodal integrated passenger-freight information sys-tem; bolstering the Canadian Trade Commissioner Service; a suite of proposals to improve regulatory competitiveness; and accelerated investment of $773.9 million over the next five years of national, trade-corridors funding.
MAC notes these moves will help Canada compete for investment in light of recent tax changes in the United States. TNM
Canadian budget update full of goodies for miners
GOVERNMENT | Five-year extension of Mineral Exploration Tax Credit a boon to explorers
Northern Miner 6” x 8.5”
1-16_DEC10_Main .indd 5 2018-12-04 9:26 PM

WWW.NORTHERNMINER.COM6 DECEMBER 10–23, 2018 / THE NORTHERN MINER
gold from 121 metres downhole and 16.5 metres of 7.71 grams gold from 126 metres downhole in drill hole 18-4B. Drill hole 18-3B cut 18.5 metres grading 7.37 grams gold from 165 metres below surface, including 8 metres of 16.14 grams gold, starting from 167 metres downhole.
“Those are wicked hits and are brand new in this area,” Byron says. “Now it’s just a function of understanding the mechanism of the emplacement of that higher grade.”
Treasure Island is the northern-most project on Nighthawk’s Indin Lake property and is situated along the eastern end of a 7-kilogram mineralized corridor that hosts several high-priority gold show-ings, including Laurie Lake, 4 km west. So far drilling has confirmed the gold system is upwards of 200 metres wide, 700 metres long and open in all directions, and supports Byron’s thesis that it could become a high-grade feeder to any future mining operation at Colomac.
Nighthawk also went back to Damoti Lake, a high-grade gold deposit in iron formation that it had not touched since 2010. Previous owner Anaconda Gold completed a resource estimate for Damoti Lake in 2005. The deposit has a measured and indicated resource of 40,600 tonnes grading 26.17 grams gold per tonne, with another inferred mineral resource of 17,800 tonnes grading 16.38 gram gold per tonne at a cut-off grade of 8 grams gold.
Nighthawk says there is an op-portunity to grow the resource beyond its high-grade core and will release drill results before year-end.
“We wanted to go back there this year and see if we could build out those mineralized domains a little farther afield, and grow that resource,” Bryon says. “It doesn’t have a 43-101 that encapsulates the entire mineralization. We’re hoping to deliver that in early 2019, so we’ll see how that goes — that’s our intention.”
Byron says they will also test some exploration models at Damoti Lake because previous operators typically stepped out only 25 metres or so if they had a good hole. “No one looked at it as an exploration exercise to say ‘where else could it leak into, and let’s test some conceptual targets,’ so that’s what
we’re doing.”Meanwhile, the company also
drilled its Leta Arm gold proj-ect, where it had not worked since 2011. Leta Arm straddles the Leta Arm fault zone, a north- to south-trending regional deformation zone up to 10 km long and 500 metres wide, which hosts two historical gold mines — North Inca and Di-versified — and two gold showings: No. 3 and Lexindrin.
The Diversified mine is 1.3 km north of the North Inca mine and the No. 3 showing is situated in between (450 metres south of the Diversified shaft and 800 metres south of North Inca’s East zone), while Lexindrin is 1.2 km north of the Diversified shaft.
Exploration shafts and limited underground development were done on the North Inca and Di-versified deposits in the 1940s to explore quartz veins with high-grade gold mineralization.
Byron says Diversified, North Inca, No. 3 and Lexindrin are part of the same mineralized system because they share similar min-eralization styles, mineralized widths, morphology, a common, steep northern plunge, and are
distributed along a linear array.Drilling this year focused on ex-
tending the deposits and exploring for a connection along strike, while searching for new deposits along the Leta Arm fault zone.
All 11 holes drilled into North Inca intersected mineralization, with visible gold in eight of them. The highlight was 18-3B, which returned 26 metres of 2.68 grams gold from 94 metres downhole, including 10 metres of 4.90 grams gold. Another hole, 18-2B, assayed 9 metres of 4.49 grams gold from 86 metres downhole, including 2 metres of 10.45 grams gold.
At Diversified, drill highlights included 18 metres grading 5.81 grams gold, including 9 metres of 9.65 grams gold in hole 18-8 and 14 metres of 3.50 grams gold from 127 metres downhole, including 7 metres of 6.67 grams gold in hole 18-6.
The best results from the No. 3 showing were 10 metres of 2.67 grams gold from 42 metres down-hole in 318-2B, and from the Lex-indrin showing, 21.8 metres of 1.20 grams gold from 121 metres downhole in 18-1B.
“The more and more we do this
[drilling], we’re basically proving up our thesis, which is — we’ve got a gold camp here,” Byron says. “We’re closer to the beginning than the end, that’s why it is so exciting. You never know what the next drill hole is going to give you.”
The company also drilled its four zones at the main Colomac deposit (1, 1.5, 2.5 and 3.5) and at its Grizzly Bear deposit.
At Grizzly Bear, 4 km southwest of Colomac’s Zone 1.5, all 11 holes intersected mineralization, includ-ing several broad zones that are open to depth. Highlights include 6 metres of 4.04 grams gold per tonne from 62 metres downhole, includ-ing 3 metres of 7.78 grams gold.
Other positive results from Co-lomac this year include 20 metres of 2.98 grams gold from 153 me-tres, including 13 metres of 4.30 grams gold in Zone 3; 26 metres of 2.04 grams gold from 232 metres downhole in Zone 2.5; 25 metres of 3.42 grams gold from 138 metres downhole in Zone 2; 68 metres of 2.24 grams gold, including 6 me-tres of 5.70 grams gold from 298 metres downhole in Zone 3.5; and 84 metres of 2.91 grams gold from 276 metres downhole, including
25 metres of 5.05 grams gold in Zone 1.5.
Nighthawk’s 899 sq. km land package takes up 95% of the entire Indin Lake greenstone belt, Byron estimates — or “three times the size of the core of the Timmins camp.
“We grabbed every showing, every deposit,” he says. “What we did at Indin Lake was just identify that it had potential to be like these other mining camps, and it was cheap, because no one else was thinking along those lines, and there was no competition.”
Annual costs to hold the land are reasonable, too. Mining claim assessment requirements cost the company $100,000 a year and taxes on mining leases add $50,000 an-nually, for a total $150,000.
What’s more, the company has no work commitments on any of the ground, Byron says. When it did its deals for Colomac and Leta Arm, for example, Nighthawk took full ownership.
Nighthawk has $15 million in cash, and Byron says the company could afford to do another large drill program next year.
But, he says, Nighthawk’s man-agement team is flexible.
“If there is an opportunity to look at a financing at good terms and our share price is there and we can do flow-through, we’ll look at that, but we haven’t made any plans to go down that road,” he says. “If it presents itself, we will. But we’re not desperate here — let me put it that way. We’re not running on fumes.”
In July the company raised $2.5 million in a non-brokered, flow-through private placement to boost its 2018 exploration drill and prospecting program from 25,000 metres to 32,500 metres.
As for working in the North-west Territories, Byron says, it’s all pretty good.
The First Nations and Metis are on the same page about protecting the environment and the impor-tance of creating jobs for their youth, he notes.
He says 30% of the gross do-mestic product in the Northwest Territories comes from diamond mining, so the government is well aware of its economic dependence on mining.
“Maybe diamonds last forever, but diamond mines don’t,” Byron says. “And there will come a day when you have to find that 30% somewhere else and mining is the logical choice, as they are already schooled in it.” TNM
TO THE EXECUTORS, HEIRS, SUCCESSORS OR ASSIGNS OFCHARLES ANTHONY BARDESSONO
Charles Anthony Bardessono of Hibbing, Minnesota, is a co-owner of the surface rights of two parcels of land in Deloro Township, Timmins, Ontario, Canada under PIN #65442-0240 and PIN #65442-0241 (“Parcels”). It is believed that he passed away in 1976.
Goldcorp Canada Ltd. and Goldcorp Inc. (“Goldcorp”) have commenced an application pursuant to section 175 of the Mining Act (Ontario) before the Mining and Lands Tribunal (“Tribunal”) for an order giving it the right to use the Parcels in return for compensation.
Executors, legal heirs, successors or assigns of Mr. Bardessono may be entitled to compensation for the loss of their rights to the Parcels if the application is successful and the Tribunal makes the order requested by Goldcorp. The publication of this notice should not be construed as evidence that any party is entitled to compensation.
If you are an executor, heir, successor or assign of Mr. Bardessono or are otherwise entitled to the interest of Mr. Bardessono in the Parcels, you may obtain a copy of the application and more information by contacting Goldcorp counsel, Cassels Brock & Blackwell LLP, via email at [email protected].
If you wish to participate in the application, you must file your notice of intention to appear with the Mining and Lands Tribunal, 655 Bay Street, Suite 1500, Toronto, Ontario M5G 1E5 by mail or courier, or email to the Registrar at [email protected], or fax at (416) 326-5370 no later than December 31, 2018.
TO THE EXECUTORS, HEIRS, SUCCESSORS OR ASSIGNS OFEVA CAMERON GIRARDOT
Eva Cameron Girardot of Malden, Massachusetts, is a co-owner of the surface rights of two parcels of land in Deloro Township, Timmins, Ontario, Canada under PIN #65442-0240 and PIN #65442-0241 (“Parcels”). It is believed that she is deceased.
Goldcorp Canada Ltd. and Goldcorp Inc. (“Goldcorp”) have commenced an application pursuant to section 175 of the Mining Act (Ontario) before the Mining and Lands Tribunal (“Tribunal”) for an order giving it the right to use the Parcels in return for compensation.
Executors, legal heirs, successors or assigns of Ms. Girardot may be entitled to compensation for the loss of their rights to the Parcels if the application is successful and the Tribunal makes the order requested by Goldcorp. The publication of this notice should not be construed as evidence that any party is entitled to compensation.
If you are an executor, heir, successor or assign of Ms. Girardot or are otherwise entitled to the interest of Ms. Girardot in the Parcels, you may obtain a copy of the application and more information by contacting Goldcorp counsel, Cassels Brock & Blackwell LLP, via email at [email protected].
If you wish to participate in the application, you must file your notice of intention to appear with the Mining and Lands Tribunal, 655 Bay Street, Suite 1500, Toronto, Ontario M5G 1E5 by mail or courier, or email to the Registrar at [email protected], or fax at (416) 326-5370 no later than December 31, 2018.
Nighthawk explores regions near Colomac in NWTNIGHTHAWK From 1
A worker wets drill core from the Colomac deposit at Nighthawk Gold’s Indin Lake gold project. NIGHTHAWK GOLD
1-16_DEC10_Main .indd 6 2018-12-04 9:26 PM
GLOBAL MINING NEWS THE NORTHERN MINER / DECEMBER 10–23, 2018 7
BY RICHARD [email protected]
Altamira Gold (TSXV: ALTA; US-OTC: EQTRF) wrapped up this year’s trenching pro-
gram at its Cajueiro gold project in Brazil by finding two gold-bearing structures on the northern end of its Matrincha target, just south of its Baldo target.
Until the start of 2017, Altamira had focused on the project’s Crente zone, which hosts Cajueiro’s entire indicated resource and most of its inferred resource.
In sulphides, the project con-tains 8.64 million indicated tonnes grading 0.78 gram gold per tonne for 214,000 oz. gold, as well as 9.53 million inferred tonnes at 0.66 gram gold for 204,000 oz. gold. It has another 179,000 inferred oz. gold in oxides.
“But now we’ve got our teeth into the Baldo area and Matrincha,” Altamira Gold president and CEO Michael Bennett says in an interview with The Northern Miner. “We’ve discovered these consistent, almost east–west brecciated zones, which are much higher grade. On surface there are grades over 100 grams gold per tonne.”
The company focused its trench-ing on Matrincha and Baldo because the areas are slightly elevated, com-pared to other parts of the project. As a result, they feature less soil and saprolitic cover on top of the bedrock, making them easier to trench and sample.
Two trenches from Matrincha, developed 275 metres apart, cut 8.82 grams gold over 1 metre and 5.31 grams gold over 5 metres. The company then cut a parallel zone in both trenches. These returned 18.9 grams gold over 1 metre and 30.19 grams gold over 3.6 metres, includ-ing 106.31 grams gold over 1 metre.
The company also completed four trenches at Baldo East and extended the strike length of the Baldo 2 structure to 950 metres. The best trench graded 8.42 grams gold over 4 metres.
“More important than that ... you’ve got something happening at depth below our Cajueiro block,” Bennett says. “We need to look at the near-surface resources, but we realize that we are looking at near-surface gold mineralization, which is being fuelled by a deeper intrusive source.”
Bennett says at least five ma-jors, including Anglo American (LON: AAL), Nexa Resources (TSX: NEXA; NYSE: NEXA) and Codelco, are active in the Juruena belt, look-ing for deeper sources of the gold mineralization. Bennett hopes it’s a porphyry source.
He says Altamira is in contact with several major companies in-vestigating the possibility of work-ing together on deeper exploration within Altamira’s properties.
“It’s something that is not out of our technical hands, but in this market might be out of our financial hands, and where we might need a major to help us,” he says.
With the rainy season beginning, Altamira will put more trenching on hold until early next year. Instead,
it will focus on stream sediment and pan concentrate sampling at its newly staked Sao Joaozinho prop-erty, south of Cajueiro, as well as its 620 sq. km Santa Helena claim block, in the southern end of the Juruena belt. It will likely do the same on its Cajueiro and Apiacas properties toward year-end.
“During the dry season we could trench,” Bennett says. “We could have taken stream-sediment sam-ples, but it would have been difficult to process them on-site, because there was no water.”
The company will test its stream-sediment samples for base metals, in addition to the gold-focused pan sampling. Altamira just started the sampling program at Santa Helena. It will take the company two months to complete.
“Santa Helena is a very important area,” Bennett says. “We’ve been sampling there recently because the local farmers are digging a few pits in the area, and they’re finding some very high-grade, gold-vein structures.”
He says that though the veins are only a few metres wide, they are con-
sistent along strike and associated with copper. Santa Helena features hydrothermally altered rocks on surface with either stockwork or parallel quartz veining, and Al-tamira says the area could overlie a deeper-seated mineralization source. Bennett puts it along with Cajueiro and Apiacas as the company’s three properties that are most prospective for both shallow gold and deeper-seated mineralization.
Meanwhi le, Brazi l recent ly wrapped up a presidential elec-tion that saw populist pro-business candidate Jair Bolsonaro emerge victorious. It is unclear what im-pact, if any, this will have on min-ing regulations in Brazil. Speaking before the election, Bennett said the current system is hampered, not by laws, but by “the agility of the paperwork.”
The Brazilian government has established an agency in the last year to speed up the paperwork related to mineral exploration. Still, stak-ing claims in Brazil can take time.
“Some of the areas we claim go into a bidding process, and that bidding process is very, very slow,” Bennett says. “They’re now thinking of changing that to a much more agile process that can be done online.
“When you’re an exploration com-pany, you need to get the explora-tion permit and the environmental permit, and spend your money and look for what you’re looking for — not wait and wait and wait for the paperwork to come out. So that’s a really important move in Brazil.”
Shares of Altamira are trading at 9¢ in a 52-week range of 8¢ to 35¢. The company has a $5-million market capitalization. TNM
Altamira cuts high-grade gold in BrazilGOLD | Looking for deeper sources of near-surface mineralization
THE 2019 CANADIAN MINING HALL OF FAME INDUCTEES KATE CARMACK
Joining the Klondike Discoverers
JAMES M. FRANKLINJAMES W. GILLSANDY LAIRD
BRIAN K. G. MEIKLE
CELEBRATE WITH US AT OUR 31ST ANNUAL DINNER & INDUCTION CEREMONY
January 10, 2019Metro Toronto Convention Centre
North Building • Constitution Hall RESERVE TODAY AT:
MININGHALLOFFAME.CA/ANNUAL-CEREMONY
DIAMOND SPONSOR
DINNER WINE SPONSOR VIP RECEPTION SPONSOR
PLATINUM SPONSORS
TICKETS 65% SOLD
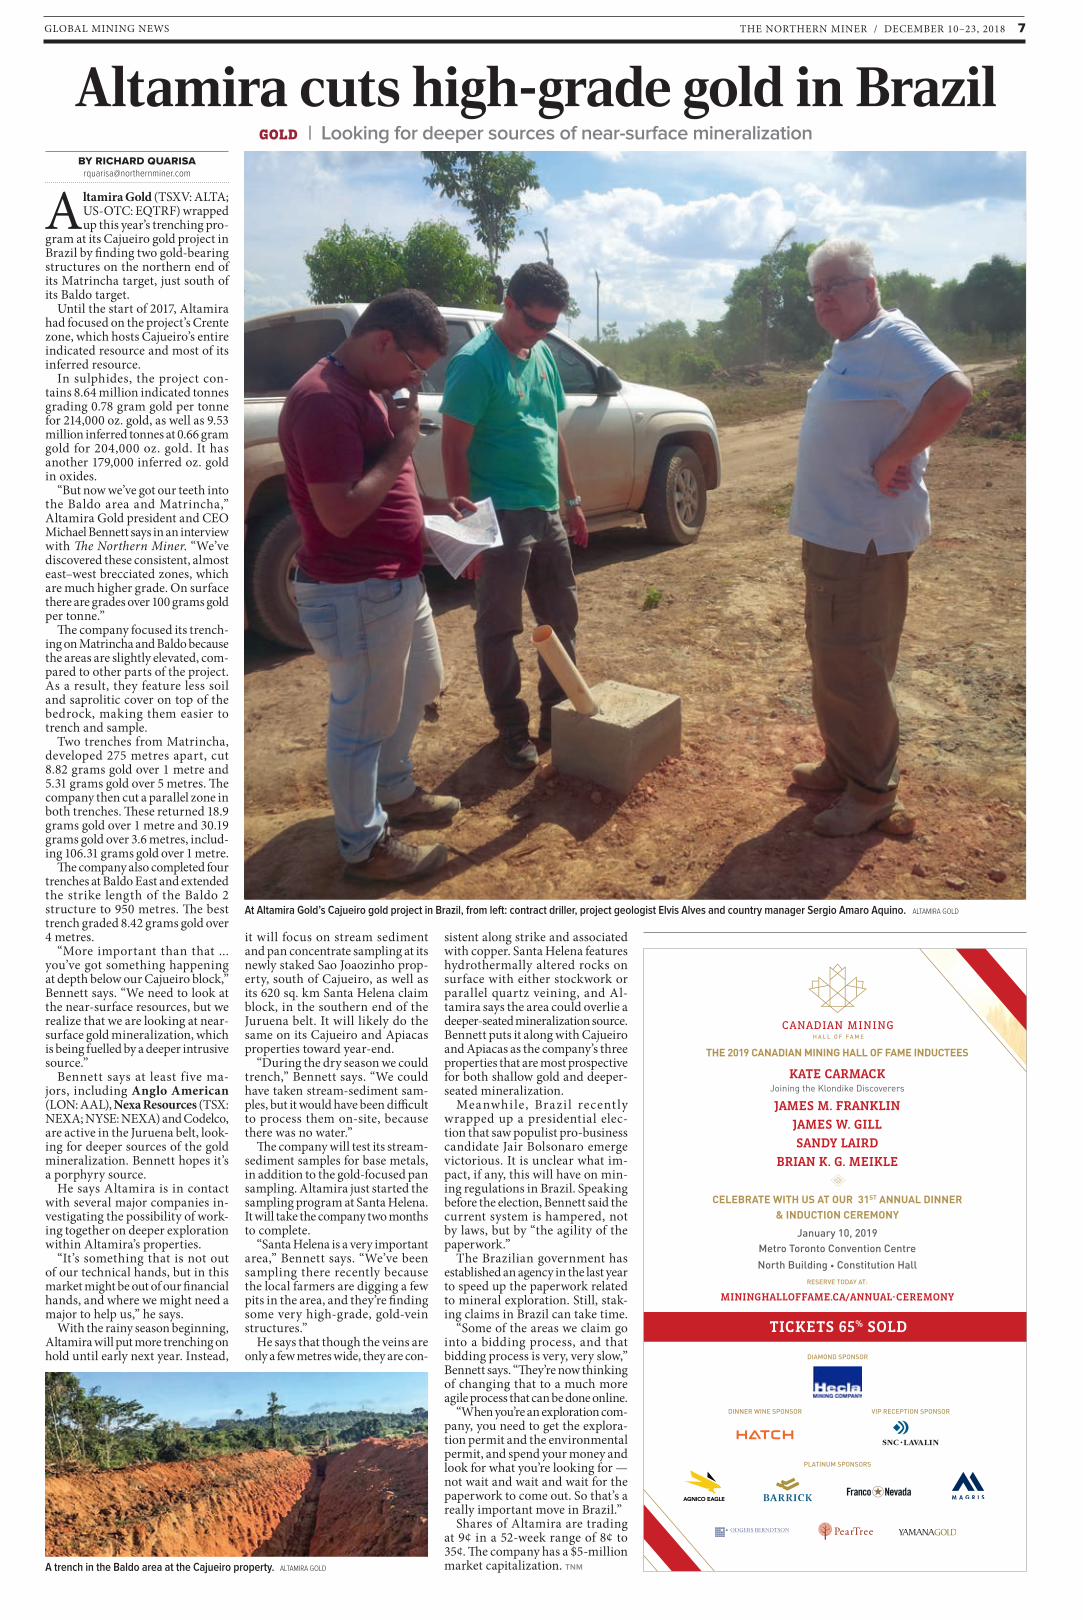
At Altamira Gold’s Cajueiro gold project in Brazil, from left: contract driller, project geologist Elvis Alves and country manager Sergio Amaro Aquino. ALTAMIRA GOLD
A trench in the Baldo area at the Cajueiro property. ALTAMIRA GOLD
1-16_DEC10_Main .indd 7 2018-12-04 9:26 PM
WWW.NORTHERNMINER.COM8 DECEMBER 10–23, 2018 / THE NORTHERN MINER
BY TRISH [email protected]
Lit hium Americas (TSX: LAC; NYSE: LAC) is perhaps best known for its f lagship,
62.5%-owned, Cauchari-Olaroz lithium brine project in northwestern Argentina’s Jujuy province, which could produce battery-grade lithium carbonate (Li2CO3) over a 40-year mine life from 2020.
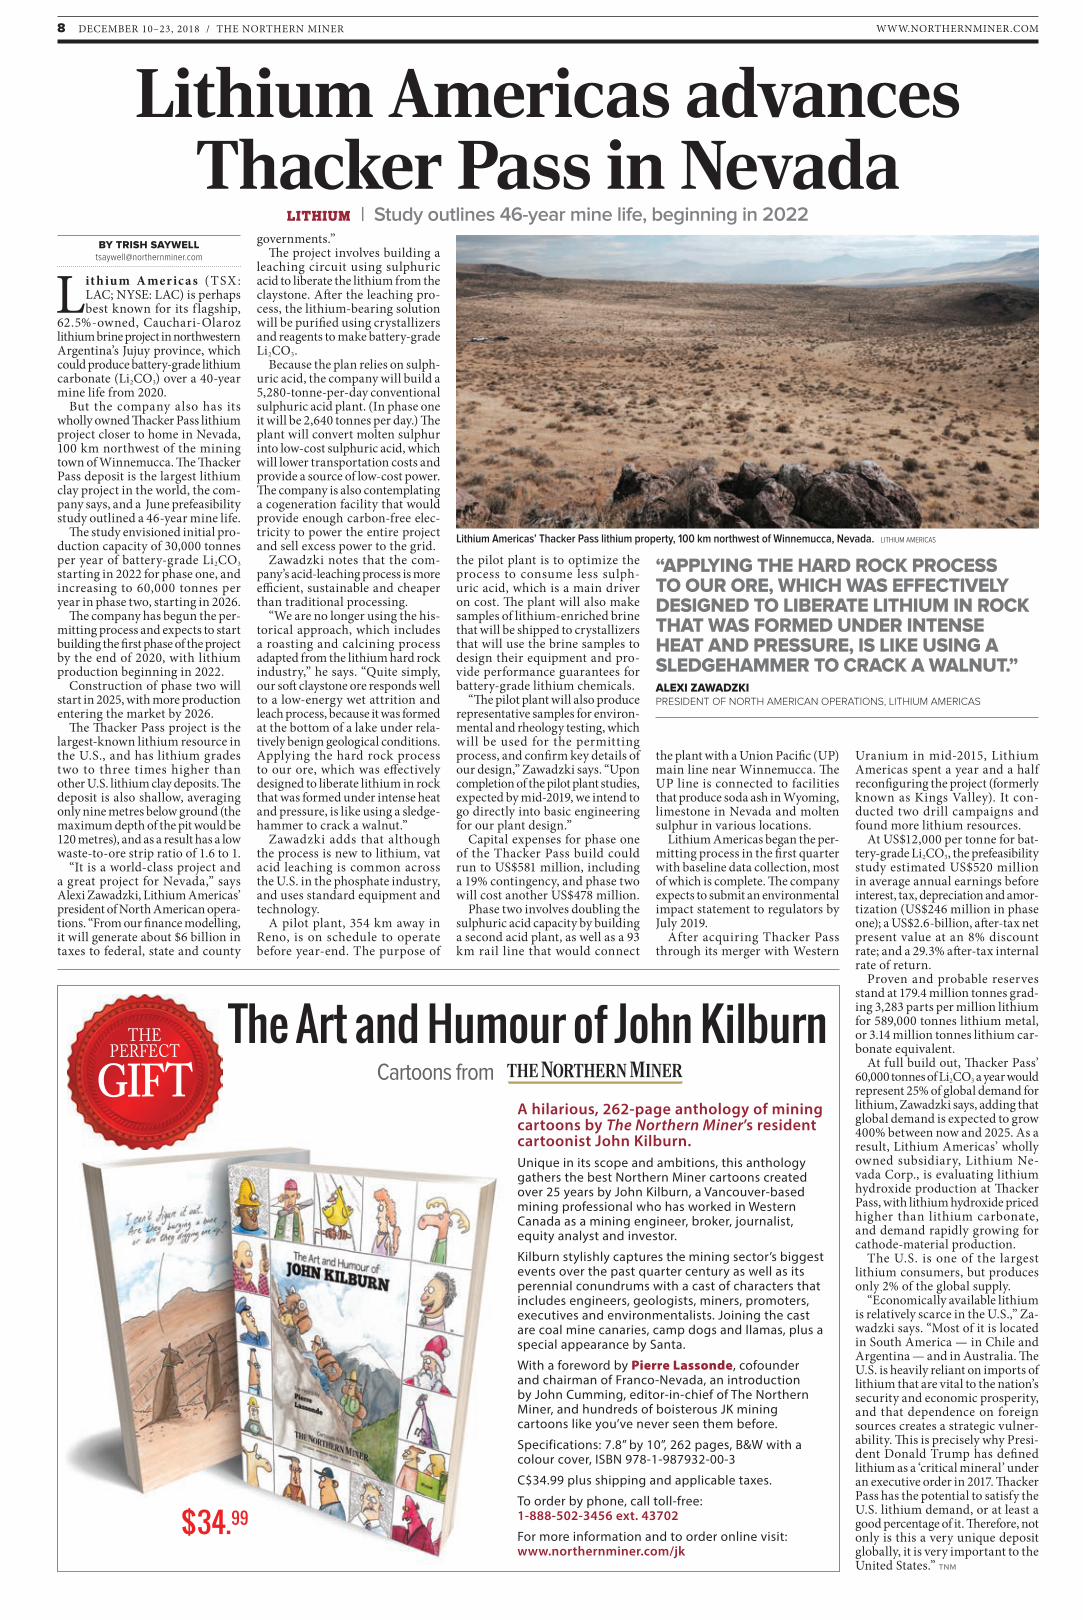
But the company also has its wholly owned Thacker Pass lithium project closer to home in Nevada, 100 km northwest of the mining town of Winnemucca. The Thacker Pass deposit is the largest lithium clay project in the world, the com-pany says, and a June prefeasibility study outlined a 46-year mine life.
The study envisioned initial pro-duction capacity of 30,000 tonnes per year of battery-grade Li2CO3 starting in 2022 for phase one, and increasing to 60,000 tonnes per year in phase two, starting in 2026.
The company has begun the per-mitting process and expects to start building the first phase of the project by the end of 2020, with lithium production beginning in 2022.
Construction of phase two will start in 2025, with more production entering the market by 2026.
The Thacker Pass project is the largest-known lithium resource in the U.S., and has lithium grades two to three times higher than other U.S. lithium clay deposits. The deposit is also shallow, averaging only nine metres below ground (the maximum depth of the pit would be 120 metres), and as a result has a low waste-to-ore strip ratio of 1.6 to 1.
“It is a world-class project and a great project for Nevada,” says Alexi Zawadzki, Lithium Americas’ president of North American opera-tions. “From our finance modelling, it will generate about $6 billion in taxes to federal, state and county
governments.”The project involves building a
leaching circuit using sulphuric acid to liberate the lithium from the claystone. After the leaching pro-cess, the lithium-bearing solution will be purified using crystallizers and reagents to make battery-grade Li2CO3.
Because the plan relies on sulph-uric acid, the company will build a 5,280-tonne-per-day conventional sulphuric acid plant. (In phase one it will be 2,640 tonnes per day.) The plant will convert molten sulphur into low-cost sulphuric acid, which will lower transportation costs and provide a source of low-cost power. The company is also contemplating a cogeneration facility that would provide enough carbon-free elec-tricity to power the entire project and sell excess power to the grid.
Zawadzki notes that the com-pany’s acid-leaching process is more efficient, sustainable and cheaper than traditional processing.
“We are no longer using the his-torical approach, which includes a roasting and calcining process adapted from the lithium hard rock industry,” he says. “Quite simply, our soft claystone ore responds well to a low-energy wet attrition and leach process, because it was formed at the bottom of a lake under rela-tively benign geological conditions. Applying the hard rock process to our ore, which was effectively designed to liberate lithium in rock that was formed under intense heat and pressure, is like using a sledge-hammer to crack a walnut.”
Zawadzki adds that although the process is new to lithium, vat acid leaching is common across the U.S. in the phosphate industry, and uses standard equipment and technology.
A pilot plant, 354 km away in Reno, is on schedule to operate before year-end. The purpose of
the pilot plant is to optimize the process to consume less sulph-uric acid, which is a main driver on cost. The plant will also make samples of lithium-enriched brine that will be shipped to crystallizers that will use the brine samples to design their equipment and pro-vide performance guarantees for battery-grade lithium chemicals.
“The pilot plant will also produce representative samples for environ-mental and rheology testing, which will be used for the permitting process, and confirm key details of our design,” Zawadzki says. “Upon completion of the pilot plant studies, expected by mid-2019, we intend to go directly into basic engineering for our plant design.”
Capital expenses for phase one of the Thacker Pass build could run to US$581 million, including a 19% contingency, and phase two will cost another US$478 million.
Phase two involves doubling the sulphuric acid capacity by building a second acid plant, as well as a 93 km rail line that would connect
the plant with a Union Pacific (UP) main line near Winnemucca. The UP line is connected to facilities that produce soda ash in Wyoming, limestone in Nevada and molten sulphur in various locations.
Lithium Americas began the per-mitting process in the first quarter with baseline data collection, most of which is complete. The company expects to submit an environmental impact statement to regulators by July 2019.
After acquiring Thacker Pass through its merger with Western
Uranium in mid-2015, Lithium Americas spent a year and a half reconfiguring the project (formerly known as Kings Valley). It con-ducted two drill campaigns and found more lithium resources.
At US$12,000 per tonne for bat-tery-grade Li2CO3, the prefeasibility study estimated US$520 million in average annual earnings before interest, tax, depreciation and amor-tization (US$246 million in phase one); a US$2.6-billion, after-tax net present value at an 8% discount rate; and a 29.3% after-tax internal rate of return.
Proven and probable reserves stand at 179.4 million tonnes grad-ing 3,283 parts per million lithium for 589,000 tonnes lithium metal, or 3.14 million tonnes lithium car-bonate equivalent.
At full build out, Thacker Pass’ 60,000 tonnes of Li2CO3 a year would represent 25% of global demand for lithium, Zawadzki says, adding that global demand is expected to grow 400% between now and 2025. As a result, Lithium Americas’ wholly owned subsidiary, Lithium Ne-vada Corp., is evaluating lithium hydroxide production at Thacker Pass, with lithium hydroxide priced higher than lithium carbonate, and demand rapidly growing for cathode-material production.
The U.S. is one of the largest lithium consumers, but produces only 2% of the global supply.
“Economically available lithium is relatively scarce in the U.S.,” Za-wadzki says. “Most of it is located in South America — in Chile and Argentina — and in Australia. The U.S. is heavily reliant on imports of lithium that are vital to the nation’s security and economic prosperity, and that dependence on foreign sources creates a strategic vulner-ability. This is precisely why Presi-dent Donald Trump has defined lithium as a ‘critical mineral’ under an executive order in 2017. Thacker Pass has the potential to satisfy the U.S. lithium demand, or at least a good percentage of it. Therefore, not only is this a very unique deposit globally, it is very important to the United States.” TNM
Lithium Americas advances Thacker Pass in Nevada
LITHIUM | Study outlines 46-year mine life, beginning in 2022
“APPLYING THE HARD ROCK PROCESS TO OUR ORE, WHICH WAS EFFECTIVELY DESIGNED TO LIBERATE LITHIUM IN ROCK THAT WAS FORMED UNDER INTENSE HEAT AND PRESSURE, IS LIKE USING A SLEDGEHAMMER TO CRACK A WALNUT.” ALEXI ZAWADZKIPRESIDENT OF NORTH AMERICAN OPERATIONS, LITHIUM AMERICAS
Lithium Americas’ Thacker Pass lithium property, 100 km northwest of Winnemucca, Nevada. LITHIUM AMERICAS
A hilarious, 262-page anthology of mining cartoons by The Northern Miner’s resident cartoonist John Kilburn.Unique in its scope and ambitions, this anthology gathers the best Northern Miner cartoons created over 25 years by John Kilburn, a Vancouver-based mining professional who has worked in Western Canada as a mining engineer, broker, journalist, equity analyst and investor.
Kilburn stylishly captures the mining sector’s biggest events over the past quarter century as well as its perennial conundrums with a cast of characters that includes engineers, geologists, miners, promoters, executives and environmentalists. Joining the cast are coal mine canaries, camp dogs and llamas, plus a special appearance by Santa.
With a foreword by Pierre Lassonde, cofounder and chairman of Franco-Nevada, an introduction by John Cumming, editor-in-chief of The Northern Miner, and hundreds of boisterous JK mining cartoons like you’ve never seen them before.
Specifications: 7.8” by 10”, 262 pages, B&W with a colour cover, ISBN 978-1-987932-00-3
C$34.99 plus shipping and applicable taxes.
To order by phone, call toll-free: 1-888-502-3456 ext. 43702
For more information and to order online visit: www.northernminer.com/jk
The Art and Humour of John KilburnCartoons from
$34.99
THEPERFECT
GIFT
1-16_DEC10_Main .indd 8 2018-12-04 9:26 PM

Mirasol Resources (TSXV: MRZ; US-OTC: MRZLF) is about to do something
it doesn’t do often: drill one of its own projects.
The Argentina- and Chile-focused precious metals project generator is in the middle of a $4.5-million exploration initiative at its gold-silver-copper projects in Chile and Nico gold-silver project in Argentina. It intends to spend $1.51 million exploring Nico alone, which it is permitting for a phase-one drill program in January 2019.
On top of that, three of the com-pany’s joint-venture partners will spend at least $7 million across four of Mirasol’s projects in Argentina and Chile. All of this is happening during Mirasol’s financial year, which began on July 1, 2018.
“We’re sticking to that project-generation model for our core, large-scale, high-risk, high-reward projects,” Mirasol president and CEO Stephen Nano says in an in-terview with The Northern Miner, “but we also have a crop of projects, with high-grade mineralization at surface, and very near mine
infrastructure.“It’s a really sensible, risk-reward
profile for us to be drill testing those kinds of projects, where even a modest discovery would create substantial value for our sharehold-ers. Nico is one of those projects.”
Nico straddles a provincial gravel road that Pan American Silver (TSX: PAAS; NASDAQ: PAAS) plans to use to truck ore from its COSE and Joaquin silver proper-
ties through Nico to its nearby Manantial Espejo mine facility for processing.
The company is already doing surface work, including geophysics, geological mapping and geochemi-cal sampling at Nico’s Aurora and Vittoria prospects to prepare them for drill testing. Over the past year, it has brought Nico’s Resolution target to drill-ready status — a 2 km long trend where channel
samples taken in 2018 graded as high as 950 grams per tonne silver and 4.27 grams gold over 0.3 metre. The company will drill outcropping mineralization to see if it extends underground.
Mirasol is funding its explora-tion in part with the $8 million it raised during a private placement in June 2018.
SPECIAL FOCUS
EXPLORATION PROJECTS TO WATCH
Sabina Gold & Silver’s (TSX: SBB) Back River project is already expected to produce
198,000 oz. gold a year in its first 12 years at all-in sustaining costs of US$620 per oz. gold. However, those numbers were released in a September 2015 feasibility study, and the company has continued to make more discoveries on its 540 sq. km property in Nunavut.
Drilling at the Nuvuyak target returned an intercept of 11.58 grams gold per tonne over 39.5 metres from 798 metres downhole, with abundant, visible gold. The hole, 18GSE545, was drilled 1 km west of Goose Main along strike and 1,000 metres down-plunge of Back River’s largest deposit — Goose Main — and prompted Sabina to double its 2018 exploration program to 20,000 metres.
The latest batch of drill results re-leased in October have only height-ened the company’s enthusiasm for Nuvuyak, with intercepts in drill hole 18GSE558 of 7.78 grams gold over 12.4 metres, starting from 719 metres; 16.39 grams gold over 13.2 metres, from 741 metres downhole; and 13.32 grams gold over 5.1 me-tres, from 784 metres downhole. A second hole, 18GSE553, returned 8.58 grams gold over 4.9 metres from 723 metres.
The drilling also showed a zone extension between 130 and 500 metres from the discovery hole toward a previously identified tar-get on the property called “Hook,” which the company says could link to the Goose Main deposit, where resources exceed 1 million oz. gold.
The mineralization at Nuvuyak is hosted within a polyphase fold sequence of Back River lower iron formation stratigraphy and co-incident gold structures that are interpreted as a big part of the major mineralizing horizon at the Goose property.
Early interpretations of the Nu-vuyak zone and its similarities to Back River’s high-grade Umwelt Vault zone suggest the potential for a large-scale mineral trend from the Goose Main deposit to the Umwelt Vault deposit, which could intersect much of the central Goose property,
Sabina hits more gold at Back RiverNUNAVUT | Growing
project is shovel ready, CEO says
See SABINA / 12
A drill rig on Kutcho Copper’s namesake copper property in northern British Columbia. KUTCHO COPPER
Mirasol exploresin Argentina, Chile
GOLD-SILVER | JV partners will combine to spend $7M at grassroots properties
BY TRISH [email protected]
BY RICHARD [email protected]
Project geologist Oscar Pederson surveying a control point for drone flights, which will collect high-resolution images and an elevation model, ahead of the next drill program at Mirasol Resources’ Nico gold-silver project in Argentina. MIRASOL RESOURCES
“IT’S A REALLY SENSIBLE, RISK-REWARD PROFILE FOR US TO BE DRILL TESTING THOSE KINDS OF PROJECTS, WHERE EVEN A MODEST DISCOVERY WOULD CREATE SUBSTANTIAL VALUE FOR OUR SHAREHOLDERS. NICO IS ONE OF THOSE PROJECTS.”STEPHEN NANOPRESIDENT AND CEO, MIRASOL RESOURCES
See MIRASOL / 10
Now Available from
Sponsored by
www.segweb.org/store
Geoscience and Exploration of the Argyle, Bunder, Diavik, and Murowa Diamond DepositsEditors: Andy T. Davy, Chris B. Smith, Herwart Helmstaedt, and A. Lynton Jaques
1-16_DEC10_Main .indd 9 2018-12-04 9:26 PM
WWW.NORTHERNMINER.COM10 DECEMBER 10–23, 2018 / THE NORTHERN MINER EXPLORATION PROJECTS TO WATCH
Argentina is experiencing an economic crisis that has seen its currency fall to half the value it had a year ago. Inflation has also risen to 45.5% in October 2018 from 25.4% in January 2018.
“I’ve personally worked in Ar-gentina now for 25 to 30 years, and, unfortunately, Argentina goes through these high inflation pe-riods, but they never at any stage impacted our ability to explore or discover or operate in that coun-try,” Nano says. “The perception of what’s happening in Argentina is probably much more significant than the reality of it for us at the moment.”
Nano says the company has seen a surge of interest in its Argentina projects, from first-tier precious metals producers all the way to juniors, as well as from companies’ operating mines in Argentina to those that aren’t, but want to get in.
“The financial issues Argentina as a country is facing aren’t im-pacting us at any level negatively,” Nano says, “and in fact are probably creating opportunities for us at this stage, because these companies are
saying this is the time to come in and secure good projects.”
Still, Nano says Mirasol tries to balance Argentina’s financial risk with its Chilean portfolio. It intends to spend $1 million on early-stage exploration at its projects in the Chilean Miocene-Pliocene belt.
“The desire to do more deals with us on our project portfolio is stronger now than I’ve ever seen before,” Nano says.
“The companies that didn’t blow up their balance sheets with poor in-vestments during the last boom have been making really good margins and have got the money to spend on exploration again, but none of them were spending on exploration over the last five or six years, so they had no project pipelines.”
Newcrest Mining (ASX: NCM; US-OTC: NCMGY) will spend $4.3 million exploring Mirasol’s Altazor gold project in northern Chile. It starts late this quarter with a surface-exploration program. It intends to follow up with an initial drill program targeted for 2019’s second quarter, permits pending. Newcrest can earn up to 80% of Altazor.
Hochschild Mining (LON: HOC; US-OTC: HCHDF) will spend $1 million over a year and a half at Mirasol’s Indra precious metal project in northern Chile. It has committed $370,000 to a December 2018 surface-exploration program that will define targets for 2019 drilling. Hochschild can earn up to 75% of the project.
OceanaGold (TSX: OGC; US-OTC: OCANF) will spend $1.6 million this year at the Claudia and La Curva precious metal joint ventures in Santa Cruz, Argentina. The spending includes a 3,000-me-tre drill program already underway at La Curva. It can acquire up to 75% at both La Curva and Claudia.
“There’s a small pool of projects for these companies to joint venture into, and Mirasol stands with a big bag of projects,” Nano says. “We have really good ones in highly prospective belts and places where you can still turn discoveries into mines.”
Shares of Mirasol are trading at $1.18, in a 52-week range of 99¢ to $2.60. The company has a $74-mil-lion market capitalization. With $24 million in cash, Nano says the company doesn’t need to go to the market and raise funds.
“We’re balancing our business risk by using that project genera-tor model to take on these really large-scale districts, and now, very judiciously, selecting some of our high-probability discovery projects that are near mine infrastructure to drill ourselves,” Nano says.
“It’s a balanced and well-thought-out strategy, and it’s designed to bring that potential for discovery forward to our shareholders much faster than relying on joint ventures alone.” TNM
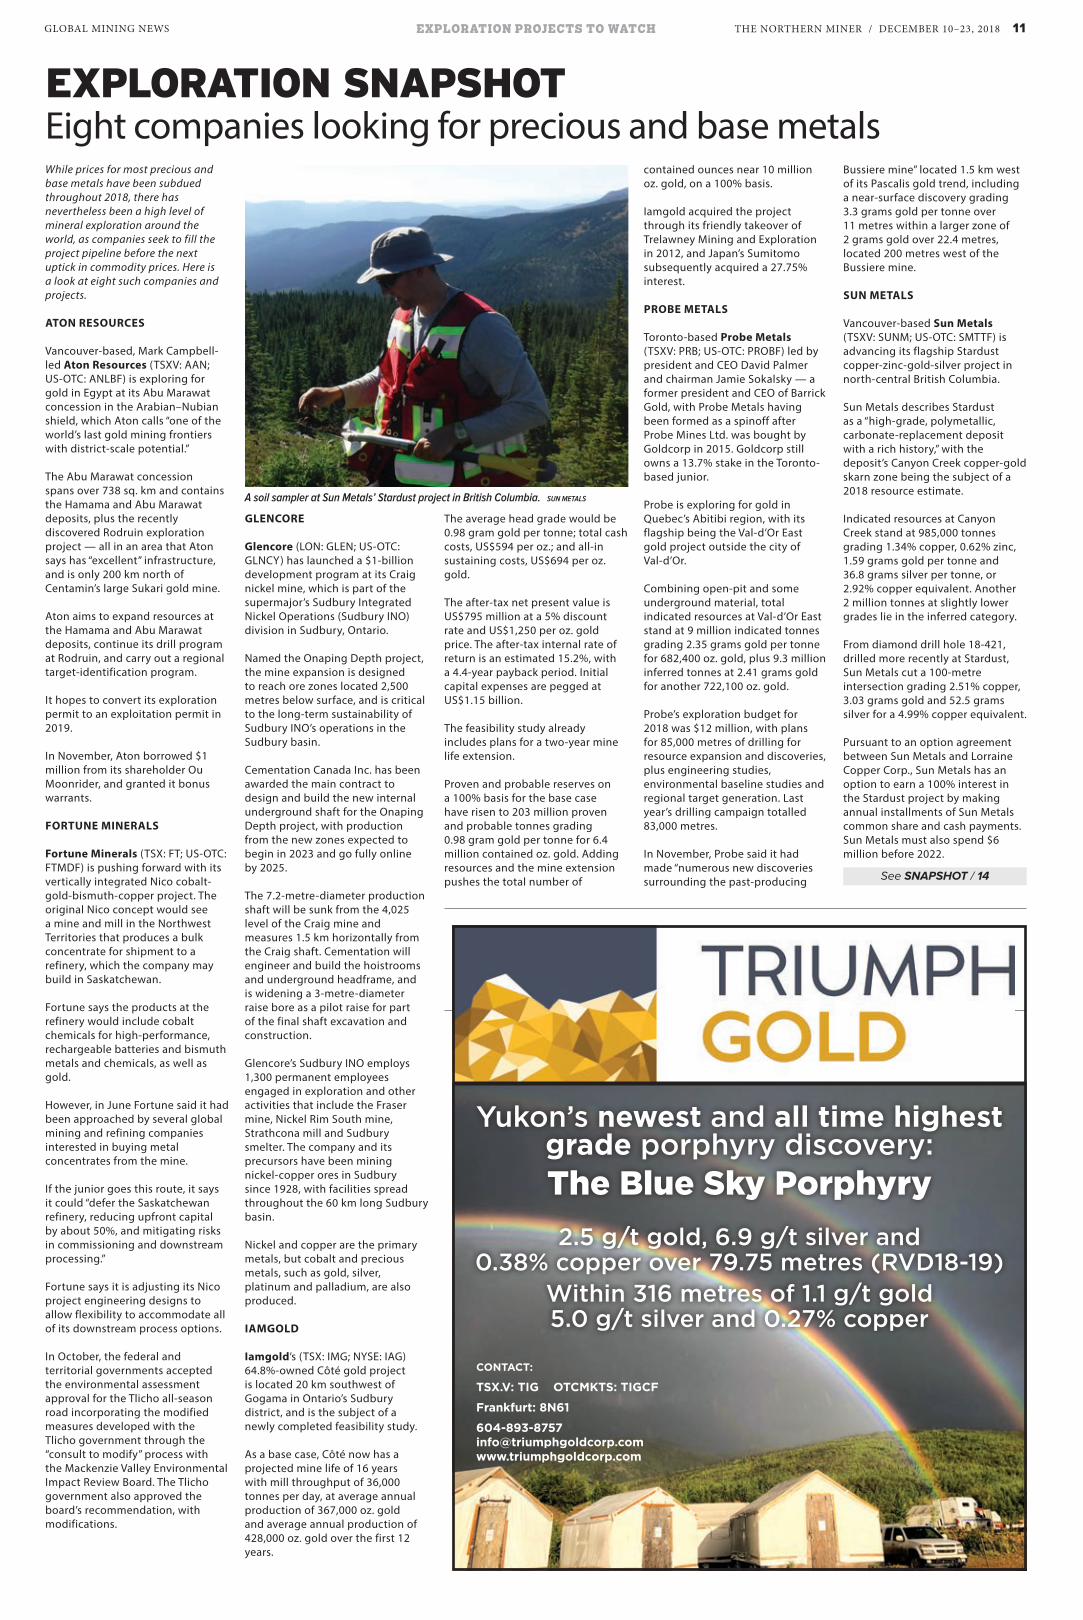
Drillers at work on Mirasol Resources’ La Curva gold project in Santa Cruz, Argentina, which is under a joint-venture agreement with OceanaGold. MIRASOL RESOURCES
MIRASOL From 9
Mirasol explores in Argentina, Chile
www.rockbreaker.com
POWER YOUR PRODUCTIVITY & GET AHEAD OF THE GRADE
For sixty years, BTI has worked to evolve the mining industry through innovative machines built for demanding environments. From secondary rockbreaking to utility, we make equipment that improves safety and productivity to keep you ahead of the grade.
NEW DISTRIBUTOR SERVICING ONTARIO
60A Magill St, Lively, ON705.806.0123 I www.crdcreighton.com
300 BOOM-TO- BREAKERCOMBINATIONS
CUSTOMIZED TO YOUR SITE
The Northern Miner_CRD Co Brand AD_Mining_Nov2018.indd 1 10/30/2018 9:49:12 AM
“THE COMPANIES THAT DIDN’T BLOW UP THEIR BALANCE SHEETS WITH POOR INVESTMENTS DURING THE LAST BOOM HAVE BEEN MAKING REALLY GOOD MARGINS AND HAVE GOT THE MONEY TO SPEND ON EXPLORATION AGAIN.”STEPHEN NANOPRESIDENT AND CEO, MIRASOL RESOURCES
1-16_DEC10_Main .indd 10 2018-12-04 9:26 PM
THE NORTHERN MINER / DECEMBER 10–23, 2018 11GLOBAL MINING NEWS EXPLORATION PROJECTS TO WATCH
While prices for most precious and base metals have been subdued throughout 2018, there has nevertheless been a high level of mineral exploration around the world, as companies seek to fill the project pipeline before the next uptick in commodity prices. Here is a look at eight such companies and projects.
ATON RESOURCES
Vancouver-based, Mark Campbell-led Aton Resources (TSXV: AAN; US-OTC: ANLBF) is exploring for gold in Egypt at its Abu Marawat concession in the Arabian–Nubian shield, which Aton calls “one of the world’s last gold mining frontiers with district-scale potential.”
The Abu Marawat concession spans over 738 sq. km and contains the Hamama and Abu Marawat deposits, plus the recently discovered Rodruin exploration project — all in an area that Aton says has “excellent” infrastructure, and is only 200 km north of Centamin’s large Sukari gold mine.
Aton aims to expand resources at the Hamama and Abu Marawat deposits, continue its drill program at Rodruin, and carry out a regional target-identification program.
It hopes to convert its exploration permit to an exploitation permit in 2019.
In November, Aton borrowed $1 million from its shareholder Ou Moonrider, and granted it bonus warrants.
FORTUNE MINERALS
Fortune Minerals (TSX: FT; US-OTC: FTMDF) is pushing forward with its vertically integrated Nico cobalt-gold-bismuth-copper project. The original Nico concept would see a mine and mill in the Northwest Territories that produces a bulk concentrate for shipment to a refinery, which the company may build in Saskatchewan.
Fortune says the products at the refinery would include cobalt chemicals for high-performance, rechargeable batteries and bismuth metals and chemicals, as well as gold.
However, in June Fortune said it had been approached by several global mining and refining companies interested in buying metal concentrates from the mine.
If the junior goes this route, it says it could “defer the Saskatchewan refinery, reducing upfront capital by about 50%, and mitigating risks in commissioning and downstream processing.”
Fortune says it is adjusting its Nico project engineering designs to allow flexibility to accommodate all of its downstream process options.
In October, the federal and territorial governments accepted the environmental assessment approval for the Tlicho all-season road incorporating the modified measures developed with the Tlicho government through the “consult to modify” process with the Mackenzie Valley Environmental Impact Review Board. The Tlicho government also approved the board’s recommendation, with modifications.
GLENCORE
Glencore (LON: GLEN; US-OTC: GLNCY) has launched a $1-billion development program at its Craig nickel mine, which is part of the supermajor’s Sudbury Integrated Nickel Operations (Sudbury INO) division in Sudbury, Ontario.
Named the Onaping Depth project, the mine expansion is designed to reach ore zones located 2,500 metres below surface, and is critical to the long-term sustainability of Sudbury INO’s operations in the Sudbury basin.
Cementation Canada Inc. has been awarded the main contract to design and build the new internal underground shaft for the Onaping Depth project, with production from the new zones expected to begin in 2023 and go fully online by 2025.
The 7.2-metre-diameter production shaft will be sunk from the 4,025 level of the Craig mine and measures 1.5 km horizontally from the Craig shaft. Cementation will engineer and build the hoistrooms and underground headframe, and is widening a 3-metre-diameter raise bore as a pilot raise for part of the final shaft excavation and construction.
Glencore’s Sudbury INO employs 1,300 permanent employees engaged in exploration and other activities that include the Fraser mine, Nickel Rim South mine, Strathcona mill and Sudbury smelter. The company and its precursors have been mining nickel-copper ores in Sudbury since 1928, with facilities spread throughout the 60 km long Sudbury basin.
Nickel and copper are the primary metals, but cobalt and precious metals, such as gold, silver, platinum and palladium, are also produced.
IAMGOLD
Iamgold’s (TSX: IMG; NYSE: IAG) 64.8%-owned Côté gold project is located 20 km southwest of Gogama in Ontario’s Sudbury district, and is the subject of a newly completed feasibility study.
As a base case, Côté now has a projected mine life of 16 years with mill throughput of 36,000 tonnes per day, at average annual production of 367,000 oz. gold and average annual production of 428,000 oz. gold over the first 12 years.
The average head grade would be 0.98 gram gold per tonne; total cash costs, US$594 per oz.; and all-in sustaining costs, US$694 per oz. gold.
The after-tax net present value is US$795 million at a 5% discount rate and US$1,250 per oz. gold price. The after-tax internal rate of return is an estimated 15.2%, with a 4.4-year payback period. Initial capital expenses are pegged at US$1.15 billion.
The feasibility study already includes plans for a two-year mine life extension.
Proven and probable reserves on a 100% basis for the base case have risen to 203 million proven and probable tonnes grading 0.98 gram gold per tonne for 6.4 million contained oz. gold. Adding resources and the mine extension pushes the total number of
contained ounces near 10 million oz. gold, on a 100% basis.
Iamgold acquired the project through its friendly takeover of Trelawney Mining and Exploration in 2012, and Japan’s Sumitomo subsequently acquired a 27.75% interest.
PROBE METALS
Toronto-based Probe Metals (TSXV: PRB; US-OTC: PROBF) led by president and CEO David Palmer and chairman Jamie Sokalsky — a former president and CEO of Barrick Gold, with Probe Metals having been formed as a spinoff after Probe Mines Ltd. was bought by Goldcorp in 2015. Goldcorp still owns a 13.7% stake in the Toronto-based junior.
Probe is exploring for gold in Quebec’s Abitibi region, with its flagship being the Val-d’Or East gold project outside the city of Val-d’Or.
Combining open-pit and some underground material, total indicated resources at Val-d’Or East stand at 9 million indicated tonnes grading 2.35 grams gold per tonne for 682,400 oz. gold, plus 9.3 million inferred tonnes at 2.41 grams gold for another 722,100 oz. gold.
Probe’s exploration budget for 2018 was $12 million, with plans for 85,000 metres of drilling for resource expansion and discoveries, plus engineering studies, environmental baseline studies and regional target generation. Last year’s drilling campaign totalled 83,000 metres.
In November, Probe said it had made “numerous new discoveries surrounding the past-producing
Bussiere mine” located 1.5 km west of its Pascalis gold trend, including a near-surface discovery grading 3.3 grams gold per tonne over 11 metres within a larger zone of 2 grams gold over 22.4 metres, located 200 metres west of the Bussiere mine.
SUN METALS
Vancouver-based Sun Metals (TSXV: SUNM; US-OTC: SMTTF) is advancing its flagship Stardust copper-zinc-gold-silver project in north-central British Columbia.
Sun Metals describes Stardust as a “high-grade, polymetallic, carbonate-replacement deposit with a rich history,” with the deposit’s Canyon Creek copper-gold skarn zone being the subject of a 2018 resource estimate.
Indicated resources at Canyon Creek stand at 985,000 tonnes grading 1.34% copper, 0.62% zinc, 1.59 grams gold per tonne and 36.8 grams silver per tonne, or 2.92% copper equivalent. Another 2 million tonnes at slightly lower grades lie in the inferred category.
From diamond drill hole 18-421, drilled more recently at Stardust, Sun Metals cut a 100-metre intersection grading 2.51% copper, 3.03 grams gold and 52.5 grams silver for a 4.99% copper equivalent.
Pursuant to an option agreement between Sun Metals and Lorraine Copper Corp., Sun Metals has an option to earn a 100% interest in the Stardust project by making annual installments of Sun Metals common share and cash payments. Sun Metals must also spend $6 million before 2022.
EXPLORATION SNAPSHOTEight companies looking for precious and base metals
A soil sampler at Sun Metals’ Stardust project in British Columbia. SUN METALS
See SNAPSHOT / 14
Yukon’s newest and all time highest grade porphyry discovery: The Blue Sky Porphyry2.5 g/t gold, 6.9 g/t silver and
0.38% copper over 79.75 metres (RVD18-19)Within 316 metres of 1.1 g/t gold 5.0 g/t silver and 0.27% copper
CONTACT:
TSX.V: TIG OTCMKTS: TIGCF
Frankfurt: 8N61
604-893-8757 [email protected]
1-16_DEC10_Main .indd 11 2018-12-04 9:26 PM
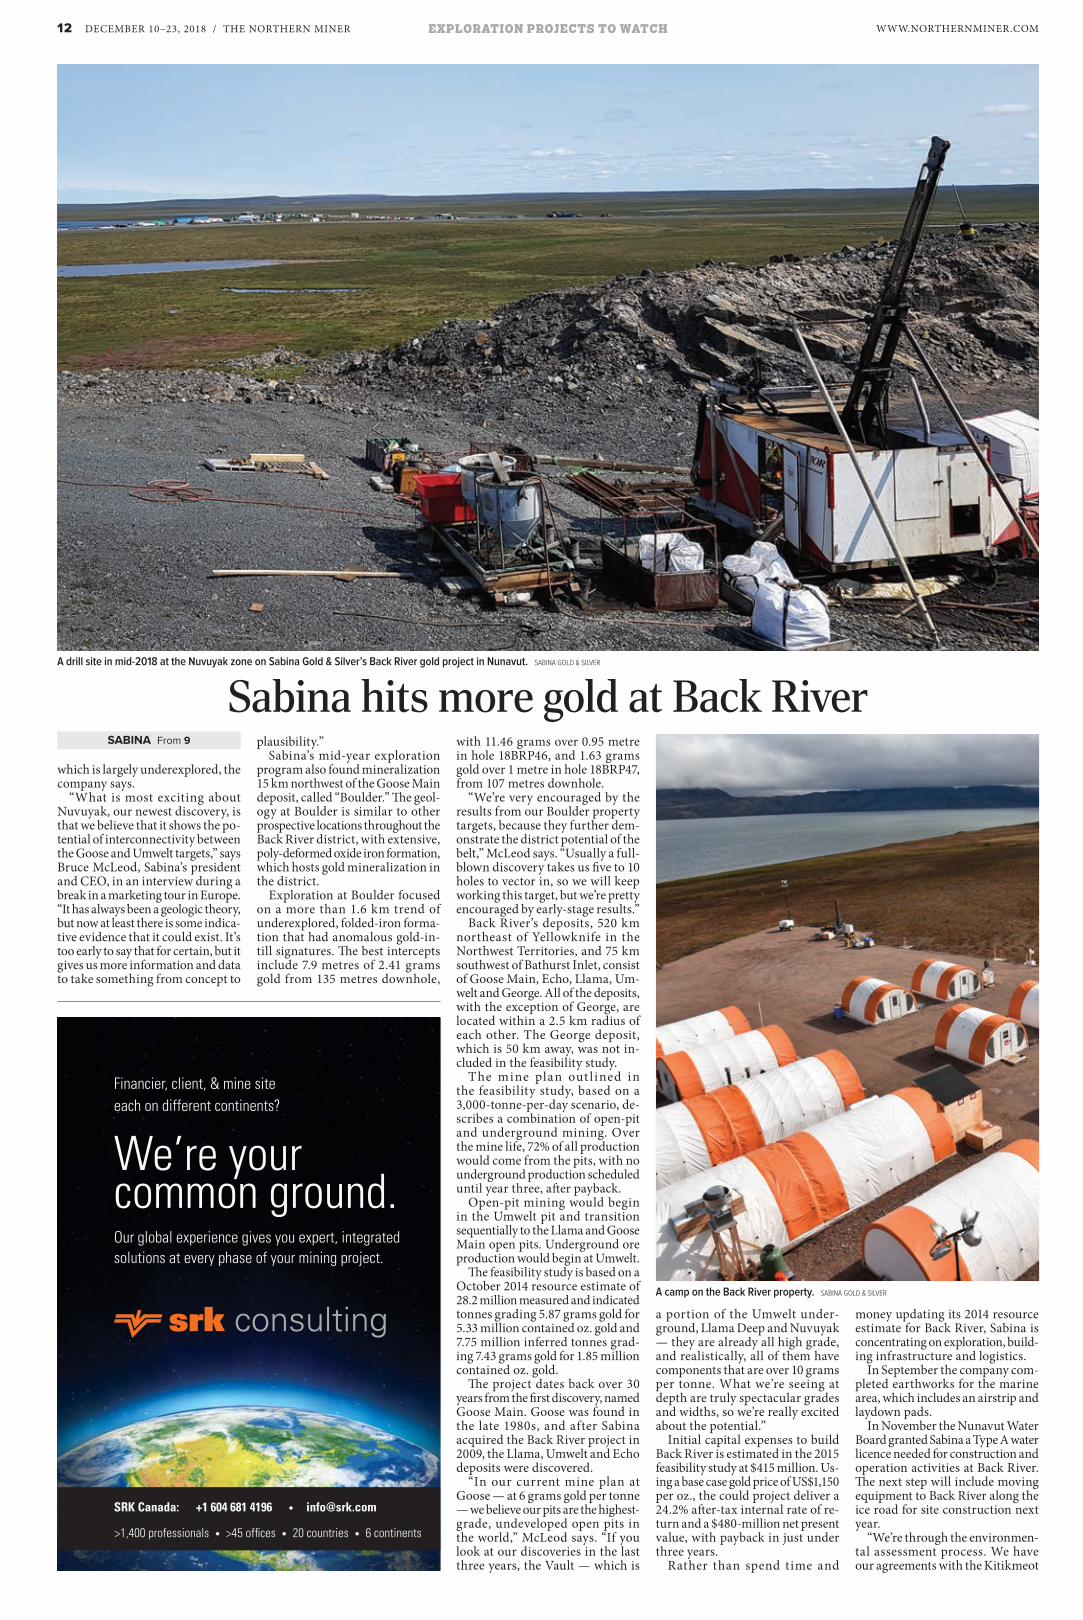
WWW.NORTHERNMINER.COM12 DECEMBER 10–23, 2018 / THE NORTHERN MINER EXPLORATION PROJECTS TO WATCH
which is largely underexplored, the company says.
“What is most exciting about Nuvuyak, our newest discovery, is that we believe that it shows the po-tential of interconnectivity between the Goose and Umwelt targets,” says Bruce McLeod, Sabina’s president and CEO, in an interview during a break in a marketing tour in Europe. “It has always been a geologic theory, but now at least there is some indica-tive evidence that it could exist. It’s too early to say that for certain, but it gives us more information and data to take something from concept to
plausibility.”Sabina’s mid-year exploration
program also found mineralization 15 km northwest of the Goose Main deposit, called “Boulder.” The geol-ogy at Boulder is similar to other prospective locations throughout the Back River district, with extensive, poly-deformed oxide iron formation, which hosts gold mineralization in the district.
Exploration at Boulder focused on a more than 1.6 km trend of underexplored, folded-iron forma-tion that had anomalous gold-in-till signatures. The best intercepts include 7.9 metres of 2.41 grams gold from 135 metres downhole,
with 11.46 grams over 0.95 metre in hole 18BRP46, and 1.63 grams gold over 1 metre in hole 18BRP47, from 107 metres downhole.
“We’re very encouraged by the results from our Boulder property targets, because they further dem-onstrate the district potential of the belt,” McLeod says. “Usually a full-blown discovery takes us five to 10 holes to vector in, so we will keep working this target, but we’re pretty encouraged by early-stage results.”
Back River’s deposits, 520 km northeast of Yellowknife in the Northwest Territories, and 75 km southwest of Bathurst Inlet, consist of Goose Main, Echo, Llama, Um-welt and George. All of the deposits, with the exception of George, are located within a 2.5 km radius of each other. The George deposit, which is 50 km away, was not in-cluded in the feasibility study.
The mine plan out l ined in the feasibility study, based on a 3,000-tonne-per-day scenario, de-scribes a combination of open-pit and underground mining. Over the mine life, 72% of all production would come from the pits, with no underground production scheduled until year three, after payback.
Open-pit mining would begin in the Umwelt pit and transition sequentially to the Llama and Goose Main open pits. Underground ore production would begin at Umwelt.
The feasibility study is based on a October 2014 resource estimate of 28.2 million measured and indicated tonnes grading 5.87 grams gold for 5.33 million contained oz. gold and 7.75 million inferred tonnes grad-ing 7.43 grams gold for 1.85 million contained oz. gold.
The project dates back over 30 years from the first discovery, named Goose Main. Goose was found in the late 1980s, and after Sabina acquired the Back River project in 2009, the Llama, Umwelt and Echo deposits were discovered.
“In our current mine plan at Goose — at 6 grams gold per tonne — we believe our pits are the highest-grade, undeveloped open pits in the world,” McLeod says. “If you look at our discoveries in the last three years, the Vault — which is
a portion of the Umwelt under-ground, Llama Deep and Nuvuyak — they are already all high grade, and realistically, all of them have components that are over 10 grams per tonne. What we’re seeing at depth are truly spectacular grades and widths, so we’re really excited about the potential.”
Initial capital expenses to build Back River is estimated in the 2015 feasibility study at $415 million. Us-ing a base case gold price of US$1,150 per oz., the could project deliver a 24.2% after-tax internal rate of re-turn and a $480-million net present value, with payback in just under three years.
Rather than spend time and
money updating its 2014 resource estimate for Back River, Sabina is concentrating on exploration, build-ing infrastructure and logistics.
In September the company com-pleted earthworks for the marine area, which includes an airstrip and laydown pads.
In November the Nunavut Water Board granted Sabina a Type A water licence needed for construction and operation activities at Back River. The next step will include moving equipment to Back River along the ice road for site construction next year.
“We’re through the environmen-tal assessment process. We have our agreements with the Kitikmeot
Sabina hits more gold at Back RiverSABINA From 9
A drill site in mid-2018 at the Nuvuyak zone on Sabina Gold & Silver’s Back River gold project in Nunavut. SABINA GOLD & SILVER
Financier, client, & mine site each on different continents?
We’re your common ground.Our global experience gives you expert, integrated solutions at every phase of your mining project.
SRK Canada: +1 604 681 4196 • [email protected]
>1,400 professionals • >45 offices • 20 countries • 6 continents
A camp on the Back River property. SABINA GOLD & SILVER
1-16_DEC10_Main .indd 12 2018-12-04 9:26 PM

THE NORTHERN MINER / DECEMBER 10–23, 2018 13GLOBAL MINING NEWS EXPLORATION PROJECTS TO WATCH
Inuit Association — our social li-cence — and we’ve started to do some infrastructure improvements,” McLeod says. “We’ve built our port and completed our initial sea lifts, bringing fuel equipment and sup-plies into Back River. Essentially, we’re shovel-ready.”
Unfortunately, he adds, the mar-ket environment “truly isn’t re-warding these accomplishments,” and while the debt market is the strongest he’s seen it, the weak eq-uity market means the company is better off de-risking the project.
“The market is clearly not in-terested in building a mine at this point, so we will take a balanced approach. We will continue to de-risk the project with prudent capital allocation, work on refining our project capital costs and engineer-ing, and continue to explore. We believe this approach will poise us to be ready when the market turns, and we can make a production decision.”
As for resource updates, it will be cheaper for the company to define resource updates after more infra-structure has been built, he says.
“The reality is, we’re drilling off on a pretty wide spacing, and for us to convert those to measured or indicated ... a new study would probably not be a good use of pro-ceeds today,” McLeod reasons. “We
already have 12 years of reserves, which is only 2.5 million oz. of our global resource, which is over 7 million ounces.”
McLeod says there is significant growth potential on the belt.
“I always joke and say I don’t need a corporate development team to grow. When we get this first mine up and running, our growth is go-ing to come from the belt, so I need more geologists and more drills.”
So far all the deposits at Back River are open, and McLeod says the prospects of Back River could become much larger than what has been found to date.
“It’s only in frontiers like this that you can assemble a land package that you own 100%,” he says. “It is truly infrastructure and logistics that we will build and will enable us to develop other parts of this trend.”
The company has $40 million in cash and equivalents.
In addition to Back River, Sabina owns a silver royalty on Glencore’s (LON: GLEN) Hackett River project. The royalty has 22.5% of the first 190 million oz. produced and 12.5% of all silver produced thereafter.
At press time, Sabina’s shares were trading at $1.42, in a 52-week range of $1.11 to $2.62 per share. The company has 264 million shares out-standing for a $388-million market capitalization. TNM
“USUALLY A FULL-BLOWN DISCOVERY TAKES US FIVE TO 10 HOLES TO VECTOR IN, SO WE WILL KEEP WORKING THIS TARGET, BUT WE’RE PRETTY ENCOURAGED BY EARLY-STAGE RESULTS.”BRUCE MCLEODPRESIDENT AND CEO, SABINA GOLD & SILVER
Nelson Takkiruq, of Gjoa Haven, Nunavut, at work this year at the Goose airstrip at Back River. SABINA GOLD & SILVER
1-16_DEC10_Main .indd 13 2018-12-04 9:26 PM
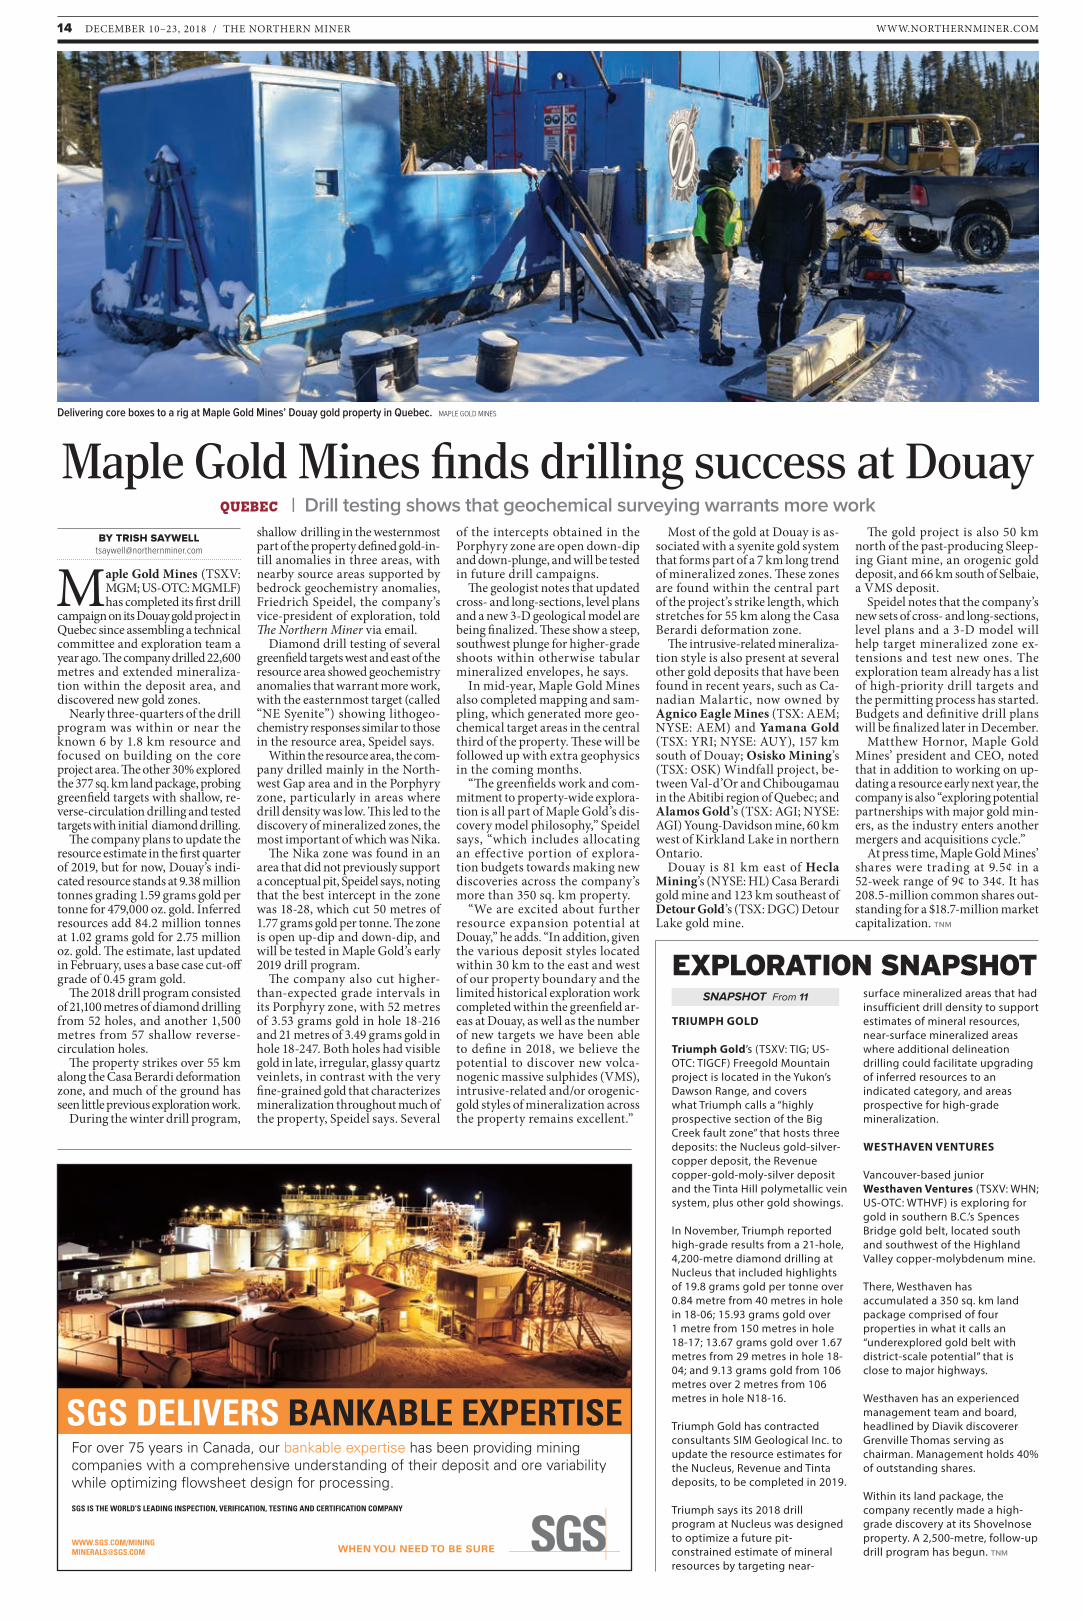
WWW.NORTHERNMINER.COM14 DECEMBER 10–23, 2018 / THE NORTHERN MINER
BY TRISH [email protected]
Maple Gold Mines (TSXV: MGM; US-OTC: MGMLF) has completed its first drill
campaign on its Douay gold project in Quebec since assembling a technical committee and exploration team a year ago. The company drilled 22,600 metres and extended mineraliza-tion within the deposit area, and discovered new gold zones.
Nearly three-quarters of the drill program was within or near the known 6 by 1.8 km resource and focused on building on the core project area. The other 30% explored the 377 sq. km land package, probing greenfield targets with shallow, re-verse-circulation drilling and tested targets with initial diamond drilling.
The company plans to update the resource estimate in the first quarter of 2019, but for now, Douay’s indi-cated resource stands at 9.38 million tonnes grading 1.59 grams gold per tonne for 479,000 oz. gold. Inferred resources add 84.2 million tonnes at 1.02 grams gold for 2.75 million oz. gold. The estimate, last updated in February, uses a base case cut-off grade of 0.45 gram gold.
The 2018 drill program consisted of 21,100 metres of diamond drilling from 52 holes, and another 1,500 metres from 57 shallow reverse-circulation holes.
The property strikes over 55 km along the Casa Berardi deformation zone, and much of the ground has seen little previous exploration work.
During the winter drill program,
shallow drilling in the westernmost part of the property defined gold-in-till anomalies in three areas, with nearby source areas supported by bedrock geochemistry anomalies, Friedrich Speidel, the company’s vice-president of exploration, told The Northern Miner via email.
Diamond drill testing of several greenfield targets west and east of the resource area showed geochemistry anomalies that warrant more work, with the easternmost target (called “NE Syenite”) showing lithogeo-chemistry responses similar to those in the resource area, Speidel says.
Within the resource area, the com-pany drilled mainly in the North-west Gap area and in the Porphyry zone, particularly in areas where drill density was low. This led to the discovery of mineralized zones, the most important of which was Nika.
The Nika zone was found in an area that did not previously support a conceptual pit, Speidel says, noting that the best intercept in the zone was 18-28, which cut 50 metres of 1.77 grams gold per tonne. The zone is open up-dip and down-dip, and will be tested in Maple Gold’s early 2019 drill program.
The company also cut higher-than-expected grade intervals in its Porphyry zone, with 52 metres of 3.53 grams gold in hole 18-216 and 21 metres of 3.49 grams gold in hole 18-247. Both holes had visible gold in late, irregular, glassy quartz veinlets, in contrast with the very fine-grained gold that characterizes mineralization throughout much of the property, Speidel says. Several
of the intercepts obtained in the Porphyry zone are open down-dip and down-plunge, and will be tested in future drill campaigns.
The geologist notes that updated cross- and long-sections, level plans and a new 3-D geological model are being finalized. These show a steep, southwest plunge for higher-grade shoots within otherwise tabular mineralized envelopes, he says.
In mid-year, Maple Gold Mines also completed mapping and sam-pling, which generated more geo-chemical target areas in the central third of the property. These will be followed up with extra geophysics in the coming months.
“The greenfields work and com-mitment to property-wide explora-tion is all part of Maple Gold’s dis-covery model philosophy,” Speidel says, “which includes allocating an effective portion of explora-tion budgets towards making new discoveries across the company’s more than 350 sq. km property.
“We are excited about further resource expansion potential at Douay,” he adds. “In addition, given the various deposit styles located within 30 km to the east and west of our property boundary and the limited historical exploration work completed within the greenfield ar-eas at Douay, as well as the number of new targets we have been able to define in 2018, we believe the potential to discover new volca-nogenic massive sulphides (VMS), intrusive-related and/or orogenic-gold styles of mineralization across the property remains excellent.”
Most of the gold at Douay is as-sociated with a syenite gold system that forms part of a 7 km long trend of mineralized zones. These zones are found within the central part of the project’s strike length, which stretches for 55 km along the Casa Berardi deformation zone.
The intrusive-related mineraliza-tion style is also present at several other gold deposits that have been found in recent years, such as Ca-nadian Malartic, now owned by Agnico Eagle Mines (TSX: AEM; NYSE: AEM) and Yamana Gold (TSX: YRI; NYSE: AUY), 157 km south of Douay; Osisko Mining’s (TSX: OSK) Windfall project, be-tween Val-d’Or and Chibougamau in the Abitibi region of Quebec; and Alamos Gold’s (TSX: AGI; NYSE: AGI) Young-Davidson mine, 60 km west of Kirkland Lake in northern Ontario.
Douay is 81 km east of Hecla Mining’s (NYSE: HL) Casa Berardi gold mine and 123 km southeast of Detour Gold’s (TSX: DGC) Detour Lake gold mine.
The gold project is also 50 km north of the past-producing Sleep-ing Giant mine, an orogenic gold deposit, and 66 km south of Selbaie, a VMS deposit.
Speidel notes that the company’s new sets of cross- and long-sections, level plans and a 3-D model will help target mineralized zone ex-tensions and test new ones. The exploration team already has a list of high-priority drill targets and the permitting process has started. Budgets and definitive drill plans will be finalized later in December.
Matthew Hornor, Maple Gold Mines’ president and CEO, noted that in addition to working on up-dating a resource early next year, the company is also “exploring potential partnerships with major gold min-ers, as the industry enters another mergers and acquisitions cycle.”
At press time, Maple Gold Mines’ shares were trading at 9.5¢ in a 52-week range of 9¢ to 34¢. It has 208.5-million common shares out-standing for a $18.7-million market capitalization. TNM
TRIUMPH GOLD
Triumph Gold’s (TSXV: TIG; US-OTC: TIGCF) Freegold Mountain project is located in the Yukon’s Dawson Range, and covers what Triumph calls a “highly prospective section of the Big Creek fault zone” that hosts three deposits: the Nucleus gold-silver-copper deposit, the Revenue copper-gold-moly-silver deposit and the Tinta Hill polymetallic vein system, plus other gold showings.
In November, Triumph reported high-grade results from a 21-hole, 4,200-metre diamond drilling at Nucleus that included highlights of 19.8 grams gold per tonne over 0.84 metre from 40 metres in hole in 18-06; 15.93 grams gold over 1 metre from 150 metres in hole 18-17; 13.67 grams gold over 1.67 metres from 29 metres in hole 18-04; and 9.13 grams gold from 106 metres over 2 metres from 106 metres in hole N18-16.
Triumph Gold has contracted consultants SIM Geological Inc. to update the resource estimates for the Nucleus, Revenue and Tinta deposits, to be completed in 2019.
Triumph says its 2018 drill program at Nucleus was designed to optimize a future pit-constrained estimate of mineral resources by targeting near-
surface mineralized areas that had insufficient drill density to support estimates of mineral resources, near-surface mineralized areas where additional delineation drilling could facilitate upgrading of inferred resources to an indicated category, and areas prospective for high-grade mineralization.
WESTHAVEN VENTURES
Vancouver-based junior Westhaven Ventures (TSXV: WHN; US-OTC: WTHVF) is exploring for gold in southern B.C.’s Spences Bridge gold belt, located south and southwest of the Highland Valley copper-molybdenum mine.
There, Westhaven has accumulated a 350 sq. km land package comprised of four properties in what it calls an “underexplored gold belt with district-scale potential” that is close to major highways.
Westhaven has an experienced management team and board, headlined by Diavik discoverer Grenville Thomas serving as chairman. Management holds 40% of outstanding shares.
Within its land package, the company recently made a high-grade discovery at its Shovelnose property. A 2,500-metre, follow-up drill program has begun. TNM
Maple Gold Mines finds drilling success at DouayQUEBEC | Drill testing shows that geochemical surveying warrants more work
For over 75 years in Canada, our bankable expertise has been providing mining companies with a comprehensive understanding of their deposit and ore variability while optimizing flowsheet design for processing.
SGS IS THE WORLD’S LEADING INSPECTION, VERIFICATION, TESTING AND CERTIFICATION COMPANY
WWW.SGS.COM/MINING [email protected]
SGS DELIVERS BANKABLE EXPERTISE
Delivering core boxes to a rig at Maple Gold Mines’ Douay gold property in Quebec. MAPLE GOLD MINES
SNAPSHOT From 11
EXPLORATION SNAPSHOT
1-16_DEC10_Main .indd 14 2018-12-04 9:26 PM
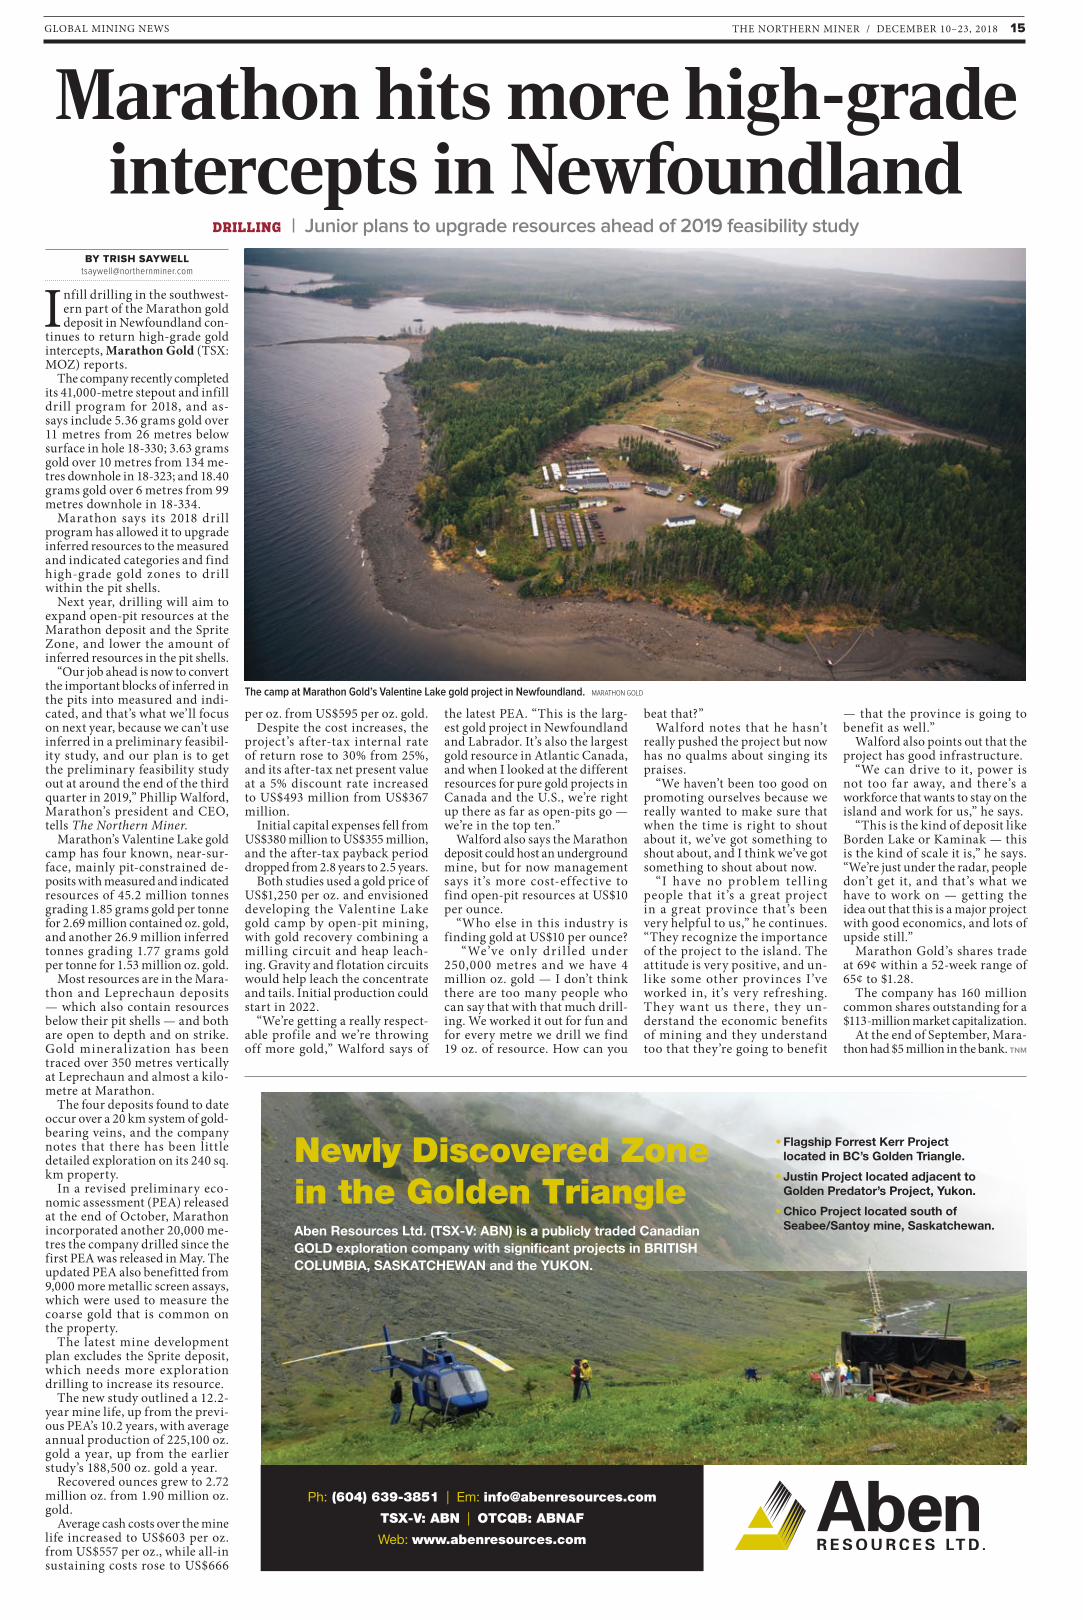
GLOBAL MINING NEWS THE NORTHERN MINER / DECEMBER 10–23, 2018 15
BY TRISH [email protected]
Infill drilling in the southwest-ern part of the Marathon gold deposit in Newfoundland con-
tinues to return high-grade gold intercepts, Marathon Gold (TSX: MOZ) reports.
The company recently completed its 41,000-metre stepout and infill drill program for 2018, and as-says include 5.36 grams gold over 11 metres from 26 metres below surface in hole 18-330; 3.63 grams gold over 10 metres from 134 me-tres downhole in 18-323; and 18.40 grams gold over 6 metres from 99 metres downhole in 18-334.
Marathon says its 2018 dril l program has allowed it to upgrade inferred resources to the measured and indicated categories and find high-grade gold zones to dril l within the pit shells.
Next year, drilling will aim to expand open-pit resources at the Marathon deposit and the Sprite Zone, and lower the amount of inferred resources in the pit shells.
“Our job ahead is now to convert the important blocks of inferred in the pits into measured and indi-cated, and that’s what we’ll focus on next year, because we can’t use inferred in a preliminary feasibil-ity study, and our plan is to get the preliminary feasibility study out at around the end of the third quarter in 2019,” Phillip Walford, Marathon’s president and CEO, tells The Northern Miner.
Marathon’s Valentine Lake gold camp has four known, near-sur-face, mainly pit-constrained de-posits with measured and indicated resources of 45.2 million tonnes grading 1.85 grams gold per tonne for 2.69 million contained oz. gold, and another 26.9 million inferred tonnes grading 1.77 grams gold per tonne for 1.53 million oz. gold.
Most resources are in the Mara-thon and Leprechaun deposits — which also contain resources below their pit shells — and both are open to depth and on strike. Gold mineralization has been traced over 350 metres vertically at Leprechaun and almost a kilo-metre at Marathon.
The four deposits found to date occur over a 20 km system of gold-bearing veins, and the company notes that there has been little detailed exploration on its 240 sq. km property.
In a revised preliminary eco-nomic assessment (PEA) released at the end of October, Marathon incorporated another 20,000 me-tres the company drilled since the first PEA was released in May. The updated PEA also benefitted from 9,000 more metallic screen assays, which were used to measure the coarse gold that is common on the property.
The latest mine development plan excludes the Sprite deposit, which needs more exploration drilling to increase its resource.
The new study outlined a 12.2-year mine life, up from the previ-ous PEA’s 10.2 years, with average annual production of 225,100 oz. gold a year, up from the earlier study’s 188,500 oz. gold a year.
Recovered ounces grew to 2.72 million oz. from 1.90 million oz. gold.
Average cash costs over the mine life increased to US$603 per oz. from US$557 per oz., while all-in sustaining costs rose to US$666
per oz. from US$595 per oz. gold.Despite the cost increases, the
project’s after-tax internal rate of return rose to 30% from 25%, and its after-tax net present value at a 5% discount rate increased to US$493 million from US$367 million.
Initial capital expenses fell from US$380 million to US$355 million, and the after-tax payback period dropped from 2.8 years to 2.5 years.
Both studies used a gold price of US$1,250 per oz. and envisioned developing the Valentine Lake gold camp by open-pit mining, with gold recovery combining a milling circuit and heap leach-ing. Gravity and f lotation circuits would help leach the concentrate and tails. Initial production could start in 2022.
“We’re getting a really respect-able profile and we’re throwing off more gold,” Walford says of
the latest PEA. “This is the larg-est gold project in Newfoundland and Labrador. It’s also the largest gold resource in Atlantic Canada, and when I looked at the different resources for pure gold projects in Canada and the U.S., we’re right up there as far as open-pits go — we’re in the top ten.”
Walford also says the Marathon deposit could host an underground mine, but for now management says it’s more cost-effective to find open-pit resources at US$10 per ounce.
“Who else in this industry is finding gold at US$10 per ounce?
“We’ve only dri l led under 250,000 metres and we have 4 million oz. gold — I don’t think there are too many people who can say that with that much drill-ing. We worked it out for fun and for every metre we drill we find 19 oz. of resource. How can you
beat that?”Walford notes that he hasn’t
really pushed the project but now has no qualms about singing its praises.
“We haven’t been too good on promoting ourselves because we really wanted to make sure that when the time is right to shout about it, we’ve got something to shout about, and I think we’ve got something to shout about now.
“I have no problem tel l ing people that it ’s a great project in a great province that’s been very helpful to us,” he continues. “They recognize the importance of the project to the island. The attitude is very positive, and un-like some other provinces I’ve worked in, it’s very refreshing. They want us there, they un-derstand the economic benefits of mining and they understand too that they’re going to benefit
— that the province is going to benefit as well.”
Walford also points out that the project has good infrastructure.
“We can drive to it, power is not too far away, and there’s a workforce that wants to stay on the island and work for us,” he says.
“This is the kind of deposit like Borden Lake or Kaminak — this is the kind of scale it is,” he says. “We’re just under the radar, people don’t get it, and that’s what we have to work on — getting the idea out that this is a major project with good economics, and lots of upside still.”
Marathon Gold’s shares trade at 69¢ within a 52-week range of 65¢ to $1.28.
The company has 160 million common shares outstanding for a $113-million market capitalization.
At the end of September, Mara-thon had $5 million in the bank. TNM
Marathon hits more high-grade intercepts in Newfoundland
DRILLING | Junior plans to upgrade resources ahead of 2019 feasibility study
The camp at Marathon Gold’s Valentine Lake gold project in Newfoundland. MARATHON GOLD
Ph: (604) 639-3851 | Em: [email protected]
TSX-V: ABN | OTCQB: ABNAF
Web: www.abenresources.com
Newly Discovered Zone in the Golden TriangleAben Resources Ltd. (TSX-V: ABN) is a publicly traded Canadian GOLD exploration company with significant projects in BRITISH COLUMBIA, SASKATCHEWAN and the YUKON.
• Flagship Forrest Kerr Project located in BC’s Golden Triangle.
• Justin Project located adjacent to Golden Predator’s Project, Yukon.
• Chico Project located south of Seabee/Santoy mine, Saskatchewan.
1-16_DEC10_Main .indd 15 2018-12-04 9:27 PM

WWW.NORTHERNMINER.COM16 DECEMBER 10–23, 2018 / THE NORTHERN MINER
BY TRISH [email protected]
Construction is accelerating at Fortuna Silver Mines’ (TSX: FVI; NYSE: FSM) Lindero
project in northern Argentina, and commercial production is planned to start by September 2019, the company says.
“The project has gained signifi-cant momentum,” Jorge Ganoza, Fortuna’s president and CEO, told analysts and investors on a con-ference call for its third-quarter results. Fortuna decided to build the open-pit, heap-leach gold mine in Salta province after completing a feasibility study in September 2017.
The company recently estimated that project expenses in 2018 would total between US$110 million and US$130 million.
Initial capital expense (capex) estimates of US$239 million have been revised. In August, the com-pany increased its capex forecast for the development gold project by 10 to 17%.
Some of the increase will be offset by the devaluation of the Argentine peso against the dollar, which has
not been included in cost forecasts.“Up to the third quarter, we have
captured gains due to exchange rates against our original budget of close to US$7 million, and we expect to continue to see gains against our budget,” Ganoza said. “Contrac-tors were awarded with pesos in the range of 17 pesos to the dollar, so yes, we’re benefitting right now from that. We are forecasting zero to 14% higher capital costs for Lindero, but that will be offset by exchange rate gains.”
Li ndero i s desig ned as a n 18,750-tonne-per-day, owner-op-erated open-pit mine, with a 13-year pit life based on existing reserves.
The feasibility study outlined an after-tax net present value of US$130 million at a 5% discount rate, and an 18% post-tax internal rate of return at a base case of US$1,250 per oz. gold.
All-in sustaining costs (AISCs) are an expected US$802 per oz. gold. A life-of-mine, 0.62-gram-gold-per-tonne head grade could come with a 75% life-of-mine recovery.
In addition to the Lindero proj-ect, Fortuna Silver’s primary assets include the Caylloma silver mine in southern Peru and the San Jose silver-gold mine in Mexico.
For the third quarter, the com-pany reported a US$6.9-million net income and 4¢ earnings per share, based on revenues of US$59.6 mil-lion, despite a 12% and 5% decrease in silver and gold prices.
“In spite of having the lowest aver-age quarterly silver price for three years, our business results show ro-bust margins of 41%,” Ganoza said.
Net cash provided by operations came in at US$21.5 million, and adjusted earnings before interest, taxes, depreciation and amortiza-tion were US$24.2 million. Ex-cluding Lindero capex, Fortuna generated US$13.6 million in free cash flow during the quarter and US$42.2 million for the first nine months.
Production totalled 2.23 mil-lion oz. silver and 12,542 oz. gold, compared with 2.01 million oz. silver and 13,412 oz. gold in the comparable quarter in 2017.
San Jose produced 1.99 million oz. silver and 12,387 oz. gold, while Caylloma produced 239,253 oz. silver, 7.6 million lb. lead and 11.5 million lb. zinc.
AISCs for the quarter were US$10.8 per equivalent oz. silver.
At the end of September, Fortuna had US$177 million in cash and equivalents.
Ganoza says management is ex-
cited about the exploration potential at Lindero and elsewhere in Salta, where the company has assembled a portfolio of early-stage projects.
“We are exploring the porphyry system within 3 km of Lindero, and we have expectations of com-ing up with a satellite deposit,” Ganoza said.
At press time, Fortuna’s shares were trading at $4.70 per share in a 52-week trading range of $4.60 to $7.78.
Ryan Thompson of BMO Capital Markets has an $8-per-share price target. TNM
Fortuna’s Lindero on track for production in Q3 2019
ARGENTINA | Revised capex comes in at US$350M for construction
JOB OPPORTUNITIES
ADVERTISE YOUR JOB OPENINGSJoe Crofts 416-510-6816,
[email protected] Toll free North America:
1-888-502-3456, (ext. 43729)
“UP TO THE THIRD QUARTER WE HAVE CAPTURED GAINS DUE TO EXCHANGE RATES AGAINST OUR ORIGINAL BUDGET OF CLOSE TO US$7 MILLION, AND WE EXPECT TO CONTINUE TO SEE GAINS AGAINST OUR BUDGET.”JORGE GANOZAPRESIDENT AND CEO, FORTUNA SILVER MINES
Lithium Americas’ Thacker Pass lithium property, 100 km northwest of the mining town of Winnemucca, Nevada. LITHIUM AMERICAS
Trucks at the Lindero project. FORTUNA SILVER MINES
1-16_DEC10_Main .indd 16 2018-12-04 9:27 PM

GLOBAL MINING NEWS THE NORTHERN MINER / DECEMBER 10–24, 2018 17
PROFESSIONAL DIRECTORYASSAYERS
CONSTRUCTION MANAGEMENT
INSTRUMENTATION
CONSULTING
Project generation, design, managementIndependent reporting|Geophysics|GIS
www.mphconsulting.com+1.416.365.0930
International Exploration& Mining Consultants
Rentals and Salesof instruments for:
Magnetics/VLFIP, Radiation
Resistivity(Multi-electrodes)
SusceptibilityConductivity
GPR/ GPSGravity
SeismicsBorehole Logging
TERRAPLUS INC.52 W. Beaver Creek Rd., Unit 12Richmond Hill, OntarioL4B 1L9 (Canada)
Tel: (905) 764-5505 Fax: (905) 764-8093e-mail: [email protected]: www.terraplus.ca
Sales and Rentals:
Magnetometers/VLFGamma-Ray Spectrometers
Infrared SpectrometersTDEM and HLEMResistivity (ERT)
Full Wave Form IPBorehole Gyro
Borehole LoggingMagnetic Susceptibility
ConductivityGPR
Seismic
Leading the World of Magneticssince 1980
Highest Precision Magnetometers in the World
www.gemsystems.ca • [email protected] • Tel: +1.905.752.2202 • +1.888.635.1829
UAV - Airborne - Ground Solutions
Call for a Quote today
Providing Robust High Precision Potassium, Overhauser
and Proton Magnetometers
with
New add-on or stand alone VLF for resistivity depth sections
Providing Robust High Precision Potassium, Overhauser
and Proton Magnetometers
with
New add-on or stand alone VLF for resistivity depth sections
Rent / Purchase 3D IP & EM GearCanadian Manufacturer of Geophysical Instruments
since 1976
- 3D / 32 channels IP Receivers - 4800V / 10,000W IP Transmitters - MPP - SCIP - Chain+Level - Beep Mat
www.gdd.ca Tel.: +1 418-877-4249
To reserve space for your advertisement in the Professional Directory, please contact:
Joe Crofts: 416-510-6816Toll free North America:
1-888-502-3456 (ext. 43729)[email protected]
Fax: 416-447-7658
JEAN-LUC CORRIVEAU, Q.L.S., CLSLand & Mining Surveyors – 3D Scanning
GYRO-THEODOLITE, UNDERGROUND CONTROL PHOTOGRAMMETRIC MAPPING (AIRBORNE LIDAR AND DRONE), CAVITY SCANNING, BOREHOLE AND BATHYMETRIC SURVEYS
1085, 3rd Avenue West, Val-d’Or (Quebec) J9P 1T5Tel: (819) 825-3702 Fax: (819) 825-2863 E-mail: [email protected] www.corriveaujl.com
Tel: (819)825-3702 www.corriveaujl.com E-mail: [email protected]
GYRO BOREHOLE SURVEYINGCORRIVEAU J.L. & ASS. INC.
Also, Magnetic probe surveysVal-d’Or (Quebec)
Services
SURVEYORS & CORE SYSTEMS
SITE SUPPLIES
LEGAL
MARKETING
Excellence in Commercial Litigation and Competition Lawagmlawyers.com • thelitigator.ca
litigateCONTRACTUAL & MINING DISPUTESCONSTRUCTION DISPUTESPRODUCT LIABILITY DISPUTESINQUESTS: OCCUPATIONAL/SAFETY DEFENCE Affleck Greene McMurtry LLP
365 Bay Street, Suite 200, Toronto Canada M5H 2V1 T 416.360.2800
We
M3 Engineering & Technology CorporationA full-service international firm offering
EPCM services to the minerals industry.www.m3eng.com
csaglobal.com
More than 30 years of mining and exploration projects across all commodities and all stages of project development.
CORPORATE MINING RESOURCES EXPLORATION TECHNOLOGY
• Diamond Indicator Heavy Minerals Extraction• Precious and Base Metals Extraction• Electron Microprobe Precision Analyses • Diamond Indicator and Mineral Classification• Microdiamond Recovery and Characterisation• High Quality / Low Cost / Quick Turnaround
1677 Powick RoadKelowna, B.C.Canada V1X 4L1
TEL: 250-860-8525FAX: 250-862-9435
C.F. Mineral Research Ltd.INDEPENDENT SPECIALISTS IN HEAVY MINERAL GEOCHEMISTRY
— SERVING THE EXPLORATION SECTOR WORLDWIDE SINCE 1977 —
Caracle CreekGEOLOGICAL & GEOPHYSICAL CONSULTANTS
Project Design & Management 3D Compilations and Modelling Independent Reporting (NI43-101) Resource Estimation QA/QC ProgramsDue DiligenceProperty Valuations/Evaluations
Geophysical Survey Design and Interpretation• Borehole Resistivity/
IP Tomography • Surface IP/Resistivity• Airborne EM-MagSudbury, Canada
Tel: +1-705-671-1801 Email: [email protected]
www.caraclecreek.com
CCIC
TRI-CORE PLASTICS CONTAINERS LTD.1 (800) 214-3542 • www.plasticfishcontainers.com
DX 335Capacity 2000lbs
DX 327Capacity 1500lbs
D 660900lbs
DX 310Capacity 300lbs
MINING TOUGHIn Stock, West Coast
amcconsultants.com
1,800+ CLIENTS 8,000+ PROJECTS
30+ YEARS EXPERIENCE
Evaluate Develop Improve Transform
GEOLOGY, MINING ENGINEERING, GEOTECHNICAL CONSULTING SERVICES
LEADING NEWSSTRATEGIC PLANS. PR. GLOBAL MARKETS.
State-of-the-art. Professional. Experienced* G&M, BBC, WSJ, NYT, CNBC, NM. MW
[email protected] • 1-416-434-3681 • www.leadingnews.ca
TorontoDenverLondon Quebec CityVancouver
Geological and Mining Consultants www.rpacan.com +1 (416) 947-0907
Geological and Mining Consultants I Since 1962 wgm.caCall (416) 364-6244
Geological and Mining Consultants
Trusted Advisors to theGlobal Mineral Resource Industry
Since 1962
Trusted Advisors to the Global Mineral Resource Industry
GEOPHYSICS
Worldwide 3D Pulse-EM TDEM, 3D E-SCAN IP/Resistivity Surveys
(905) 814-0100www.cronegeophysics.com3D Pulse-EM (Time-Domain EM) Borehole and Surface Surveys Coil, Fluxgate or SQUID Sensors High Power, Low noise Step Response
3D E-SCAN (IP/DC Res) Mapping Recon3D , Target3D , HiRes3D Any Topography, any Scale Immediate QC, daily Results Deep, Efficient, Safe
R
Crone Geophysics
R
R
R
VTEM™ | ZTEM™ | Gravity | Magnetics | Radiometrics | Data Processing | Interpretation
Your Exploration Advantage.
905 841 5004 | geotech.ca
2 Hangar RoadSaskatoon, SK
S7L 5X4
tel 306 249 4474 - www.goldak.ca
GOLDAK AIRBORNE SURVEYS
TRI-MAXIAL MAGNETIC GRADIOMETER
Full 4 sensor - 3 axis gradiometry 3D attitude correction system
True gradient guided gridding process
1024 channel radiometrics
TDEM New ! GPRTEM SystemMagnetics Gradiometer HELIMAGERHeliborne & Fixed-wingMagnetics, Radiometrics and Gravity
TDEM New ! GPRTEM SystemMagnetics Gradiometer HELIMAGERHeliborne & Fixed-wingMagnetics, Radiometrics and Gravity
450-679-2400 [email protected] www.geophysicsgpr.com
Competent Persons / NI 43-101 Technical Reports; Mineral Resource Estimates; Due Diligence
Independent Engineer Services; Geology, Mine Planning, Metallurgy, Environmental; Economic Evaluation and Feasibility Studies; Expert Witness and Mineral Property Valuation
www.micon-international.com
Toronto Vancouver Norwich Cornwall
17_DEC10_ProDirectory .indd 17 2018-12-04 1:18 PM
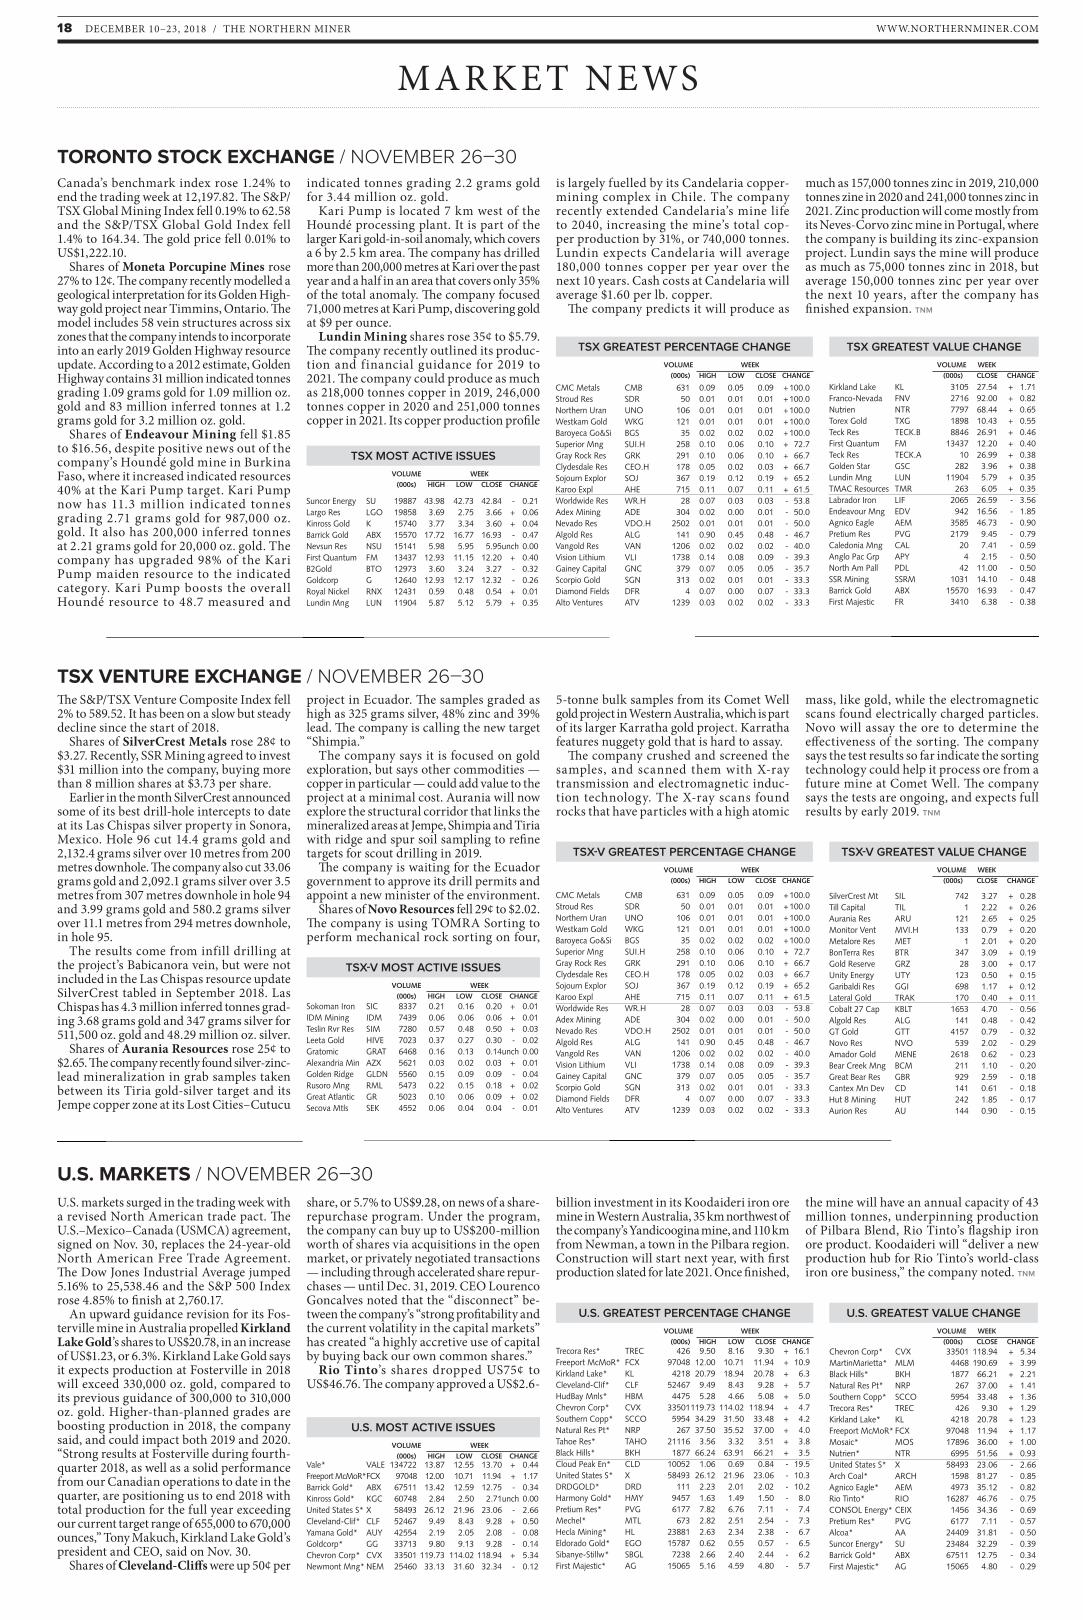
WWW.NORTHERNMINER.COM18 DECEMBER 10–23, 2018 / THE NORTHERN MINER
MARKET NEWS
TSX GREATEST VALUE CHANGE
VOLUME WEEK
(000s) CLOSE CHANGE
TSX GREATEST PERCENTAGE CHANGE
VOLUME WEEK
(000s) HIGH LOW CLOSE CHANGE
TSX MOST ACTIVE ISSUES
VOLUME WEEK
(000s) HIGH LOW CLOSE CHANGE
TSX-V GREATEST VALUE CHANGE
VOLUME WEEK
(000s) CLOSE CHANGE
TSX-V GREATEST PERCENTAGE CHANGE
VOLUME WEEK
(000s) HIGH LOW CLOSE CHANGE
TSX-V MOST ACTIVE ISSUES
VOLUME WEEK
(000s) HIGH LOW CLOSE CHANGE
U.S. GREATEST VALUE CHANGE
VOLUME WEEK
(000s) CLOSE CHANGE
U.S. GREATEST PERCENTAGE CHANGE
VOLUME WEEK
(000s) HIGH LOW CLOSE CHANGE
U.S. MOST ACTIVE ISSUES
VOLUME WEEK
(000s) HIGH LOW CLOSE CHANGE
Chevron Corp* CVX 33501 118.94 + 5.34MartinMarietta* MLM 4468 190.69 + 3.99Black Hills* BKH 1877 66.21 + 2.21Natural Res Pt* NRP 267 37.00 + 1.41Southern Copp* SCCO 5954 33.48 + 1.36Trecora Res* TREC 426 9.30 + 1.29Kirkland Lake* KL 4218 20.78 + 1.23Freeport McMoR* FCX 97048 11.94 + 1.17Mosaic* MOS 17896 36.00 + 1.00Nutrien* NTR 6995 51.56 + 0.93United States S* X 58493 23.06 - 2.66Arch Coal* ARCH 1598 81.27 - 0.85Agnico Eagle* AEM 4973 35.12 - 0.82Rio Tinto* RIO 16287 46.76 - 0.75CONSOL Energy* CEIX 1456 34.36 - 0.69Pretium Res* PVG 6177 7.11 - 0.57Alcoa* AA 24409 31.81 - 0.50Suncor Energy* SU 23484 32.29 - 0.39Barrick Gold* ABX 67511 12.75 - 0.34First Majestic* AG 15065 4.80 - 0.29
Trecora Res* TREC 426 9.50 8.16 9.30 + 16.1Freeport McMoR* FCX 97048 12.00 10.71 11.94 + 10.9Kirkland Lake* KL 4218 20.79 18.94 20.78 + 6.3Cleveland-Clif* CLF 52467 9.49 8.43 9.28 + 5.7HudBay Mnls* HBM 4475 5.28 4.66 5.08 + 5.0Chevron Corp* CVX 33501 119.73 114.02 118.94 + 4.7Southern Copp* SCCO 5954 34.29 31.50 33.48 + 4.2Natural Res Pt* NRP 267 37.50 35.52 37.00 + 4.0Tahoe Res* TAHO 21116 3.56 3.32 3.51 + 3.8Black Hills* BKH 1877 66.24 63.91 66.21 + 3.5Cloud Peak En* CLD 10052 1.06 0.69 0.84 - 19.5United States S* X 58493 26.12 21.96 23.06 - 10.3DRDGOLD* DRD 111 2.23 2.01 2.02 - 10.2Harmony Gold* HMY 9457 1.63 1.49 1.50 - 8.0Pretium Res* PVG 6177 7.82 6.76 7.11 - 7.4Mechel* MTL 673 2.82 2.51 2.54 - 7.3Hecla Mining* HL 23881 2.63 2.34 2.38 - 6.7Eldorado Gold* EGO 15787 0.62 0.55 0.57 - 6.5Sibanye-Stillw* SBGL 7238 2.66 2.40 2.44 - 6.2First Majestic* AG 15065 5.16 4.59 4.80 - 5.7
Vale* VALE 134722 13.87 12.55 13.70 + 0.44Freeport McMoR* FCX 97048 12.00 10.71 11.94 + 1.17Barrick Gold* ABX 67511 13.42 12.59 12.75 - 0.34Kinross Gold* KGC 60748 2.84 2.50 2.71 unch 0.00United States S* X 58493 26.12 21.96 23.06 - 2.66Cleveland-Clif* CLF 52467 9.49 8.43 9.28 + 0.50Yamana Gold* AUY 42554 2.19 2.05 2.08 - 0.08Goldcorp* GG 33713 9.80 9.13 9.28 - 0.14Chevron Corp* CVX 33501 119.73 114.02 118.94 + 5.34Newmont Mng* NEM 25460 33.13 31.60 32.34 - 0.12
SilverCrest Mt SIL 742 3.27 + 0.28Till Capital TIL 1 2.22 + 0.26Aurania Res ARU 121 2.65 + 0.25Monitor Vent MVI.H 133 0.79 + 0.20Metalore Res MET 1 2.01 + 0.20BonTerra Res BTR 347 3.09 + 0.19Gold Reserve GRZ 28 3.00 + 0.17Unity Energy UTY 123 0.50 + 0.15Garibaldi Res GGI 698 1.17 + 0.12Lateral Gold TRAK 170 0.40 + 0.11Cobalt 27 Cap KBLT 1653 4.70 - 0.56Algold Res ALG 141 0.48 - 0.42GT Gold GTT 4157 0.79 - 0.32Novo Res NVO 539 2.02 - 0.29Amador Gold MENE 2618 0.62 - 0.23Bear Creek Mng BCM 211 1.10 - 0.20Great Bear Res GBR 929 2.59 - 0.18Cantex Mn Dev CD 141 0.61 - 0.18Hut 8 Mining HUT 242 1.85 - 0.17Aurion Res AU 144 0.90 - 0.15
CMC Metals CMB 631 0.09 0.05 0.09 + 100.0Stroud Res SDR 50 0.01 0.01 0.01 + 100.0Northern Uran UNO 106 0.01 0.01 0.01 + 100.0Westkam Gold WKG 121 0.01 0.01 0.01 + 100.0Baroyeca Go&Si BGS 35 0.02 0.02 0.02 + 100.0Superior Mng SUI.H 258 0.10 0.06 0.10 + 72.7Gray Rock Res GRK 291 0.10 0.06 0.10 + 66.7Clydesdale Res CEO.H 178 0.05 0.02 0.03 + 66.7Sojourn Explor SOJ 367 0.19 0.12 0.19 + 65.2Karoo Expl AHE 715 0.11 0.07 0.11 + 61.5Worldwide Res WR.H 28 0.07 0.03 0.03 - 53.8Adex Mining ADE 304 0.02 0.00 0.01 - 50.0Nevado Res VDO.H 2502 0.01 0.01 0.01 - 50.0Algold Res ALG 141 0.90 0.45 0.48 - 46.7Vangold Res VAN 1206 0.02 0.02 0.02 - 40.0Vision Lithium VLI 1738 0.14 0.08 0.09 - 39.3Gainey Capital GNC 379 0.07 0.05 0.05 - 35.7Scorpio Gold SGN 313 0.02 0.01 0.01 - 33.3Diamond Fields DFR 4 0.07 0.00 0.07 - 33.3Alto Ventures ATV 1239 0.03 0.02 0.02 - 33.3
Sokoman Iron SIC 8337 0.21 0.16 0.20 + 0.01IDM Mining IDM 7439 0.06 0.06 0.06 + 0.01Teslin Rvr Res SIM 7280 0.57 0.48 0.50 + 0.03Leeta Gold HIVE 7023 0.37 0.27 0.30 - 0.02Gratomic GRAT 6468 0.16 0.13 0.14 unch 0.00Alexandria Min AZX 5621 0.03 0.02 0.03 + 0.01Golden Ridge GLDN 5560 0.15 0.09 0.09 - 0.04Rusoro Mng RML 5473 0.22 0.15 0.18 + 0.02Great Atlantic GR 5023 0.10 0.06 0.09 + 0.02Secova Mtls SEK 4552 0.06 0.04 0.04 - 0.01
Kirkland Lake KL 3105 27.54 + 1.71Franco-Nevada FNV 2716 92.00 + 0.82Nutrien NTR 7797 68.44 + 0.65Torex Gold TXG 1898 10.43 + 0.55Teck Res TECK.B 8846 26.91 + 0.46First Quantum FM 13437 12.20 + 0.40Teck Res TECK.A 10 26.99 + 0.38Golden Star GSC 282 3.96 + 0.38Lundin Mng LUN 11904 5.79 + 0.35TMAC Resources TMR 263 6.05 + 0.35Labrador Iron LIF 2065 26.59 - 3.56Endeavour Mng EDV 942 16.56 - 1.85Agnico Eagle AEM 3585 46.73 - 0.90Pretium Res PVG 2179 9.45 - 0.79Caledonia Mng CAL 20 7.41 - 0.59Anglo Pac Grp APY 4 2.15 - 0.50North Am Pall PDL 42 11.00 - 0.50SSR Mining SSRM 1031 14.10 - 0.48Barrick Gold ABX 15570 16.93 - 0.47First Majestic FR 3410 6.38 - 0.38
CMC Metals CMB 631 0.09 0.05 0.09 + 100.0Stroud Res SDR 50 0.01 0.01 0.01 + 100.0Northern Uran UNO 106 0.01 0.01 0.01 + 100.0Westkam Gold WKG 121 0.01 0.01 0.01 + 100.0Baroyeca Go&Si BGS 35 0.02 0.02 0.02 + 100.0Superior Mng SUI.H 258 0.10 0.06 0.10 + 72.7Gray Rock Res GRK 291 0.10 0.06 0.10 + 66.7Clydesdale Res CEO.H 178 0.05 0.02 0.03 + 66.7Sojourn Explor SOJ 367 0.19 0.12 0.19 + 65.2Karoo Expl AHE 715 0.11 0.07 0.11 + 61.5Worldwide Res WR.H 28 0.07 0.03 0.03 - 53.8Adex Mining ADE 304 0.02 0.00 0.01 - 50.0Nevado Res VDO.H 2502 0.01 0.01 0.01 - 50.0Algold Res ALG 141 0.90 0.45 0.48 - 46.7Vangold Res VAN 1206 0.02 0.02 0.02 - 40.0Vision Lithium VLI 1738 0.14 0.08 0.09 - 39.3Gainey Capital GNC 379 0.07 0.05 0.05 - 35.7Scorpio Gold SGN 313 0.02 0.01 0.01 - 33.3Diamond Fields DFR 4 0.07 0.00 0.07 - 33.3Alto Ventures ATV 1239 0.03 0.02 0.02 - 33.3
Suncor Energy SU 19887 43.98 42.73 42.84 - 0.21Largo Res LGO 19858 3.69 2.75 3.66 + 0.06Kinross Gold K 15740 3.77 3.34 3.60 + 0.04Barrick Gold ABX 15570 17.72 16.77 16.93 - 0.47Nevsun Res NSU 15141 5.98 5.95 5.95 unch 0.00First Quantum FM 13437 12.93 11.15 12.20 + 0.40B2Gold BTO 12973 3.60 3.24 3.27 - 0.32Goldcorp G 12640 12.93 12.17 12.32 - 0.26Royal Nickel RNX 12431 0.59 0.48 0.54 + 0.01Lundin Mng LUN 11904 5.87 5.12 5.79 + 0.35
TORONTO STOCK EXCHANGE / NOVEMBER 26–30
TSX VENTURE EXCHANGE / NOVEMBER 26–30
U.S. MARKETS / NOVEMBER 26–30
U.S. markets surged in the trading week with a revised North American trade pact. The U.S.–Mexico–Canada (USMCA) agreement, signed on Nov. 30, replaces the 24-year-old North American Free Trade Agreement. The Dow Jones Industrial Average jumped 5.16% to 25,538.46 and the S&P 500 Index rose 4.85% to finish at 2,760.17.
An upward guidance revision for its Fos-terville mine in Australia propelled Kirkland Lake Gold’s shares to US$20.78, in an increase of US$1.23, or 6.3%. Kirkland Lake Gold says it expects production at Fosterville in 2018 will exceed 330,000 oz. gold, compared to its previous guidance of 300,000 to 310,000 oz. gold. Higher-than-planned grades are boosting production in 2018, the company said, and could impact both 2019 and 2020. “Strong results at Fosterville during fourth-quarter 2018, as well as a solid performance from our Canadian operations to date in the quarter, are positioning us to end 2018 with total production for the full year exceeding our current target range of 655,000 to 670,000 ounces,” Tony Makuch, Kirkland Lake Gold’s president and CEO, said on Nov. 30.
Shares of Cleveland-Cliffs were up 50¢ per
the mine will have an annual capacity of 43 million tonnes, underpinning production of Pilbara Blend, Rio Tinto’s flagship iron ore product. Koodaideri will “deliver a new production hub for Rio Tinto’s world-class iron ore business,” the company noted. TNM
billion investment in its Koodaideri iron ore mine in Western Australia, 35 km northwest of the company’s Yandicoogina mine, and 110 km from Newman, a town in the Pilbara region. Construction will start next year, with first production slated for late 2021. Once finished,
share, or 5.7% to US$9.28, on news of a share-repurchase program. Under the program, the company can buy up to US$200-million worth of shares via acquisitions in the open market, or privately negotiated transactions — including through accelerated share repur-chases — until Dec. 31, 2019. CEO Lourenco Goncalves noted that the “disconnect” be-tween the company’s “strong profitability and the current volatility in the capital markets” has created “a highly accretive use of capital by buying back our own common shares.”
Rio Tinto’s shares dropped US75¢ to US$46.76. The company approved a US$2.6-
The S&P/TSX Venture Composite Index fell 2% to 589.52. It has been on a slow but steady decline since the start of 2018.
Shares of SilverCrest Metals rose 28¢ to $3.27. Recently, SSR Mining agreed to invest $31 million into the company, buying more than 8 million shares at $3.73 per share.
Earlier in the month SilverCrest announced some of its best drill-hole intercepts to date at its Las Chispas silver property in Sonora, Mexico. Hole 96 cut 14.4 grams gold and 2,132.4 grams silver over 10 metres from 200 metres downhole. The company also cut 33.06 grams gold and 2,092.1 grams silver over 3.5 metres from 307 metres downhole in hole 94 and 3.99 grams gold and 580.2 grams silver over 11.1 metres from 294 metres downhole, in hole 95.
The results come from infill drilling at the project’s Babicanora vein, but were not included in the Las Chispas resource update SilverCrest tabled in September 2018. Las Chispas has 4.3 million inferred tonnes grad-ing 3.68 grams gold and 347 grams silver for 511,500 oz. gold and 48.29 million oz. silver.
Shares of Aurania Resources rose 25¢ to $2.65. The company recently found silver-zinc-lead mineralization in grab samples taken between its Tiria gold-silver target and its Jempe copper zone at its Lost Cities–Cutucu
5-tonne bulk samples from its Comet Well gold project in Western Australia, which is part of its larger Karratha gold project. Karratha features nuggety gold that is hard to assay.
The company crushed and screened the samples, and scanned them with X-ray transmission and electromagnetic induc-tion technology. The X-ray scans found rocks that have particles with a high atomic
mass, like gold, while the electromagnetic scans found electrically charged particles. Novo will assay the ore to determine the effectiveness of the sorting. The company says the test results so far indicate the sorting technology could help it process ore from a future mine at Comet Well. The company says the tests are ongoing, and expects full results by early 2019. TNM
project in Ecuador. The samples graded as high as 325 grams silver, 48% zinc and 39% lead. The company is calling the new target “Shimpia.”
The company says it is focused on gold exploration, but says other commodities — copper in particular — could add value to the project at a minimal cost. Aurania will now explore the structural corridor that links the mineralized areas at Jempe, Shimpia and Tiria with ridge and spur soil sampling to refine targets for scout drilling in 2019.
The company is waiting for the Ecuador government to approve its drill permits and appoint a new minister of the environment.
Shares of Novo Resources fell 29¢ to $2.02. The company is using TOMRA Sorting to perform mechanical rock sorting on four,
Canada’s benchmark index rose 1.24% to end the trading week at 12,197.82. The S&P/TSX Global Mining Index fell 0.19% to 62.58 and the S&P/TSX Global Gold Index fell 1.4% to 164.34. The gold price fell 0.01% to US$1,222.10.
Shares of Moneta Porcupine Mines rose 27% to 12¢. The company recently modelled a geological interpretation for its Golden High-way gold project near Timmins, Ontario. The model includes 58 vein structures across six zones that the company intends to incorporate into an early 2019 Golden Highway resource update. According to a 2012 estimate, Golden Highway contains 31 million indicated tonnes grading 1.09 grams gold for 1.09 million oz. gold and 83 million inferred tonnes at 1.2 grams gold for 3.2 million oz. gold.
Shares of Endeavour Mining fell $1.85 to $16.56, despite positive news out of the company’s Houndé gold mine in Burkina Faso, where it increased indicated resources 40% at the Kari Pump target. Kari Pump now has 11.3 million indicated tonnes grading 2.71 grams gold for 987,000 oz. gold. It also has 200,000 inferred tonnes at 2.21 grams gold for 20,000 oz. gold. The company has upgraded 98% of the Kari Pump maiden resource to the indicated category. Kari Pump boosts the overall Houndé resource to 48.7 measured and
much as 157,000 tonnes zinc in 2019, 210,000 tonnes zine in 2020 and 241,000 tonnes zinc in 2021. Zinc production will come mostly from its Neves-Corvo zinc mine in Portugal, where the company is building its zinc-expansion project. Lundin says the mine will produce as much as 75,000 tonnes zinc in 2018, but average 150,000 tonnes zinc per year over the next 10 years, after the company has finished expansion. TNM
indicated tonnes grading 2.2 grams gold for 3.44 million oz. gold.
Kari Pump is located 7 km west of the Houndé processing plant. It is part of the larger Kari gold-in-soil anomaly, which covers a 6 by 2.5 km area. The company has drilled more than 200,000 metres at Kari over the past year and a half in an area that covers only 35% of the total anomaly. The company focused 71,000 metres at Kari Pump, discovering gold at $9 per ounce.
Lundin Mining shares rose 35¢ to $5.79. The company recently outlined its produc-tion and financial guidance for 2019 to 2021. The company could produce as much as 218,000 tonnes copper in 2019, 246,000 tonnes copper in 2020 and 251,000 tonnes copper in 2021. Its copper production profile
is largely fuelled by its Candelaria copper-mining complex in Chile. The company recently extended Candelaria’s mine life to 2040, increasing the mine’s total cop-per production by 31%, or 740,000 tonnes. Lundin expects Candelaria will average 180,000 tonnes copper per year over the next 10 years. Cash costs at Candelaria will average $1.60 per lb. copper.
The company predicts it will produce as
18_DEC10_MarketNews.indd 18 2018-12-04 9:25 PM

GLOBAL MINING NEWS · SINCE 1915 THE NORTHERN MINER / DECEMBER 10–23, 2018 19
METALS, MINING AND MONEY MARKET S
STAFF INVESTMENT POLICYThe Northern Miner does not permit any editorial employee to file stories about companies in which the writer owns shares. Editorial employees are also not permitted to take part in initial public offerings or to engage in short selling.
CONVERSIONS OF WEIGHTS & MEASURES1 troy ounce = 31.1 grams
1 kilogram = 32.15 troy ounces
1 kilogram = 2.2046 pounds
1 (metric) tonne = 1,000 kilograms
1 (metric) tonne = 2,204.6 pounds
1 (short) ton = 2,000 pounds
1 (metric) tonne = 1.1023 (short) tons
1 gram per (metric) tonne = 0.02917 troy
ounces per (short) ton
= 0.03215 troy ounces per (metric)
tonne
1 kilometre = 0.6214 miles
1 hectare = 2.47 acres
Financial information provided by Fundata Canada Inc. ©Fundata Canada Inc. All rights reserved
LEGENDA – Australian Securities
ExchangeC – Canadian Stock ExchangeL – London Stock ExchangeN – New York Stock ExchangeO – U.S. over-the-counterQ – NASDAQ or U.S. OTCT – Toronto Stock ExchangeV – TSX Venture ExchangeX – NYSE American* – Denotes price in U.S.$
Own your moment in
the press with a Re-
Publishing License for
any article printed in The
Northern Miner or posted
on our website. Basic
Re-Publishing License
cost: $525
GLOBAL MINING NEWS · SINCE 1915
Re-Publishing License
Contact: [email protected] or 416-510-6768
TSX WARRANTS
NEW 52-WEEK HIGHS AND LOWS NOVEMBER 26–30, 2018
TSX VENTURE WARRANTS
CANADIAN GOLD MUTUAL FUNDS
Fund Nov 30 ($) Nov 23 ($) Change ($) Change (%) YTDChange (%) MER (%) TotalAssets (M$)AGF Prec Mtls Fd MF 16.33 16.47 -0.14 -0.85 -20.66 2.80 84.97BMO Prec Mtls Fd A 15.35 15.40 -0.04 -0.29 -16.28 2.40 49.04BMO ZGD 7.24 7.42 -0.19 -2.53 -22.77 0.61 BMO ZJG 6.28 6.49 -0.21 -3.18 -27.75 0.60 CIBC Prec Metal Fd A 8.05 8.20 -0.15 -1.81 -21.95 2.45 35.89Dyn Prec Metls Fd A 6.15 6.21 -0.06 -0.97 -10.70 2.71 306.11Galileo GOGO 8.62 8.69 -0.07 -0.75 -15.24 Horizons HEP 20.22 20.57 -0.25 -1.21 -13.35 0.81 IG Mac GbPMetCl A 7.29 7.43 -0.13 -1.78 -17.09 2.75 27.88iShares XGD 10.28 10.42 -0.14 -1.37 -17.82 0.61 715.18Mac Prec Met Cl A 38.01 38.70 -0.69 -1.78 -17.45 2.52 51.56NBI PrecMetFd Invt 9.97 10.14 -0.17 -1.68 -19.78 2.46 23.05NPT Gold&PrMinFdA 29.10 29.40 -0.31 -1.04 -18.14 3.04 NPT SilverEquCl A 3.99 3.98 0.01 0.19 -24.40 2.95 RBC GblPreMetFd A 26.61 27.13 -0.52 -1.90 -16.71 2.13 274.09Sentry Pre Met Fd A 29.53 29.87 -0.34 -1.13 -18.95 2.54 229.91TD PreciousMetalsInv 26.97 27.40 -0.43 -1.57 -19.92 2.27 91.88
Alamos Gold (AGI.WT.A) - Wt buys sh @ $10.00 to Jan 7/19Alio Gold Inc. (ALO.WT) - 10 Warrants to purchase one common share of the Issuer at $7.00 until expiryAlio Gold Inc. J (ALO.WT.A) - One War-rant to purchase one common share of the Issuer at $8.00 until expiryAscendant Resources (ASND.WT) - Wt buys sh @ $1.25 to Mar 7/22eColbalt Solutions Inc. J (ECS.WT) - One Warrant to purchase one common share of the Issuer at US$1.95 per share until expiryExcellon Resources Inc (EXN.WT.A) - One warrant to purchase one common share of the Issuer at $2.80 until expiryGolden Queen Mining Co (GQM.WT) - Wt buys sh @ $2 to Jul 25/19Gran Colombia Gold (GCM.WT.A) - Wt buys sh @ $3.25 to Mar 18/19Gran Colombia Gold (GCM.WT.B) - One warrant to purchase one common share of the Issuer at $2.21 until expiry.
Liberty Gold Corp. Wt (LGD.WT) - One Warrant to purchase one common share of the Issuer at $0.90 until expiry may 16, 2019Lithium Americas Corp (LAC.WT) - One Warrant to purchase one common share of the Issuer at $0.90 until expiryLydian International Limited (LYD.WT) - One Warrant to purchase one additional ordinary share of the Issuer at $0.36 per share until expiryMBAC Fertilizer (MBC.WT) - Wt buys sh @ $1 to Apr 17/19Nemaska Lithium Inc (NMX.WT) - Wt buys sh @ $1.5 to Jul 8/19Northern Dynasty Minerals Ltd. J (NDM.WT.A) - Wt buys sh @ $0.55 to Jul 9/20Northern Dynasty Minerals Ltd. J (NDM.WT.B) - Wt buys sh @ $0.55 to Jun 10/21Northern Dynasty Minerals Ltd. J (NDM.WT.B) - Wt buys sh @ $0.55 to Jun 10/21Osisko Gold Royalties (OR.WT) - Wt buys sh @ $36.5 to Feb 18/22
Osisko Gold Royalties (OR.WT.A) - Wt buys sh @ $19.08 to Feb 26/19Pilot Gold Inc. Wt (PLG.WT) - Wt buys sh @ $0.9 to May 16/19Platinum Group Metals Ltd. (PTM.WT.U) - One Warrant to purchase one common share of the Issuer at US$0.17 until expiryPrairie Provident Resources Inc Wt (PPR.WT) - Wt buys sh @ $0.87 to Mar 16/19Sandstorm Gold (SSL.WT.B) - One War-rant to purchase one common share of the Issuer at US $14.00 until expiry.Sherritt International Corporation (S.WT) - Each whole Warrant entitles the holder to acquire between 1.00 and 1.25 addi-tional common shares (as bulletin 2018-0062 table ) determined based on the Ap-plicable Reference Cobalt Price at an exercise price of $1.95 per Warrant at any time prior to the Expiry DateSprott Resource Corp (SRHI.WT) - Wt buys sh @ $0.3333 to Feb 09/22
ABE Resources Inc. (ABE.WT) - One war-rant to purchase one common share at $0.15 per share.American Cumo Mining Corp. (MLY.RT) - 2 rights and $0.07 are required to pur-chase one shareAntioquia Gold Inc. (AGD.RT) - One (1) Right and $0.042 are required to purchase one share.Avino Silver & Gold Mines Ltd. (ASM.WT) - Wt buys sh @ US$0.2 to Nov 28/19Boreal Metals Corp. (BMX.WT) - One warrant to purchase one common share at $0.30 per share.Brazil Resources (BRI.WT) - Wt buys sh @ $0.75 to Dec 31/18Cordoba Minerals Corp (CDB.WT) - One warrant to purchase one common share at $1.08 per share.Cornerstone Capital Resources (CGP.WT.S) - Wt buys sh @ $0.35 to Apr 07/19Equinoxgold Corp (EQX.WT) - One war-rant to purchase one common share at $3.00 per share.Falco Resources Ltd. (FPC.WT) - One warrant to purchase one common share at $1.70 per share.
Goldmining Inc. (GOLD.WT) - Wt buys sh @ $0.75 to Dec 31/18Goldstar Minerals (GDM.RT) - One Right to purchase one common share at $0.03 per share.Goldstar Minerals Inc. (GDM.RT) - One (1) Right and $0.05 are required to pur-chase one common share.JDL Gold Corp. (JDL.WT) - Wt buy sh @ $3.00 to Oct 06/21Jet Metal (JET.WT) - Wt buys sh @ $0.25 to Sep 16/19Jet Metal (JET.WT.A) - Wt buys sh @ $0.5 to Feb 28/19Kootenay Silver Inc. (KTN.WT) - Wt buys sh @ $0.55 to Apr 21/21LSC Lithium Corporation (LSC.RT) - One (1) right exercisable for One (1) Unit at $0.40 per Unit.Maple Gold Mines Ltd. (MGM.WT) - One warrant to purchase one common share at $0.40 per shareMillennial Lithium Corp. (ML.WT) - One warrant to purchase one common share at $4.25 per share.
Rainy Mountain Royalty Corp. (RMO.WT) - Wt buys sh @ $0.15 to Mar 1/18 and sh @ $0.25 from Mar 2/18 to Mar 1/19Rainy Mountain Royalty Corp. (RMD.WT) - Wt buys sh @ $0.15 to Mar 1/18 and sh @ $0.25 from Mar 2/18 to Mar 1/19Sandfire Resources America Inc. (SFR.RT) - Eight (8) Rights exercisable for One (1) share at $0.06 per unit.Silvercrest Metals Inc. (SIL.WT) - Wt buys sh @ $3 to Dec 06/18Tintina Resources Inc. (TAU.RT) - Nine(9) Rights exercisable for one share at $0.06 per share.Trek Mining (TREK.WT) - Wt buy sh @ $3.00 to Oct 06/21Vision Lithium Inc. (VLI.WT) - One war-rant to purchase one common share at $0.15 per share.West Kirkland Mining (WKM.WT) - Wt buys sh @ $0.3 to Apr 17/19Yellowhead Mining Inc. (YMI.RT) - One (1) Right and $0.12 are required to pr-chase one Share
27 New HighsAldridge Min*Allante PotashAurcana Corp*Barolo Vent*Black Hills*CMC MetalsGalantas GoldGatling ExplorIrving ResIrving Res*KAT Expl*Monitor Vent Monitor Vent*Mundoro CapMundoro Cap*Nevsun ResNevsun Res*Niocan IncNX Uranium*Orsu MetalsRandsburg Int*Slave Lake ZnSuperior MngUnity Energy
West High YldXanadu MinesXtra-Gold Res141 New Lows60 North Gold*Abacus Mining*Advantage LithAdvantage Lith*Adventus Zinc*Alamos GoldAlamos Gold*Alcoa*Aldebaran ResAlexandria Min*Alto Ventures*Alumina Inc*Americas Silvr*Argonaut GoldArgonaut Gold*ATAC ResAvino Silver*Barkerville GoBarkerville Go*Bird River ResBlack Iron*
Blackrock Gold*Blue Moon ZincBonTerra Res*Bullion Gld ResCabral Gold*Cameo Cobalt*Canasil ResCentenera MngChakana CopperChakana Copper*Chalice Gold MCloud Peak En*Cobalt 27 CapCobalt Pwr Grp*Coeur Mng*Copper Mtn MngCore GoldCrystal LakeCrystal Lake*Desert LionElcora Res*Eldorado GoldEldorado Gold*Endeavour MngEndeavr Silver
Endeavr Silver*Engold Mines*Equinox GoldErdene Res DevEssex MineralsFancamp ExplFirst MajesticFirst Majestic*Fission Uran*Fortuna SilvrFortuna Silvr*Garibaldi ResGaribaldi Res *General Moly*Gldn PredatorGldn Predator*Gold Finder ExGold Resource*Gold Std VentsGold Std Vents*Golden RidgeGoldplay Expl*Goliath Res*Granada GoldGrenville Gold
Gungnir ResGuyana GldfldsHut 8 MiningIMPACT SilverIntl Bethl Mng*Intl Lithium*Leading EdgeLeeta GoldLevon Res Ltd *Liberty One Li*Lithium ChileLithium Corp*Lucara DiamLydian IntlM.P.V. ExplorM2 Cobalt*Maple Gold*Metallic MnrlsMetals Creek*MGX MineralsMGX Minerals*Millrock Res*Montero Mg&Ex *Mountain Prov*
Napier Vent*Nautilus Mnrls*Neo LithiumNew Milln Iron*Nickel Creek*Noront ResNortec Mnls*Northern LightNorthern Uran*NRG MetalsNRG Metals*Nrthn Graphite*Nrthn VertexNuLegacy Gold*Orca GoldOrla Mng LtdOsisko MetalsParamount Gold*Peabody Enrgy*Portex Mnrls*Power MetalsPUF Vent Inc *Pure Energy Pure Energy*Regulus Res
Riverside Res*Rover MetalsScorpio GoldSilvercorp Met*Spanish Mtn Gd*Spearmint Res*Taseko Mines*Thunder Mtn Gd*Tinka ResU.S. Gold*Ucore Rare MtlUcore Rare Mtl*United States S*Vedanta*Vista Gold*Viva Gold*Wealth MnrlsWealth Mnrls*Westmoreland*Wolfeye ResZincX Res
SPOT PRICES PRODUCER AND DEALER PRICES
TSX VENTURE SHORT POSITIONS
DAILY METAL PRICES
EXCHANGE RATES
LME WAREHOUSE LEVELS
TSX SHORT POSITIONS
Thermal Coal CAPP: US$40.00 per short tonCoal: Central Appalachia, 12,500 Btu, 1.2 S02-R,W: US$78.95Coal: Powder River Basin, 8,800 Btu, 0.8 S02-R, W: US$12.00Cobalt: US$25.06/lb.Copper: US$2.86/lb.Copper: CME Group Futures Jan. 2019: US$2.75/lb.; Feb. 2019: US$2.76/lbIridium: NY Dealer Mid-mkt US$1,480.00/tr oz. Iron Ore 62% Fe CFR China-S: US$66.20Lead: US$0.89/lb.Lithium carbonate min 99.5% Li2CO3 battery grade, spot prices CIF China, Japan & Korea : US$13.00-15.15/kgLithium hydroxide monohydrate min 56.5% LiOH.H2O bat-tery grade, spot prices cif China, Japan & Korea : US$15-18/kgMagnesium: n.a.Manganese Ore Index 37% Mn, cif Tianjin China: US$6.82 per dmtu of metal contained.Molybdenum Oxide: US$11.79/lb.Phosphate Rock: US$86.00/tonnePotash: US$226.00/tonneRhodium: Mid-mkt US$2,600.00 tr. oz.Ruthenium: Mid-mkt US$270.00/tr. oz.Silver: Handy & Harman Base: US$14.47 per oz.; Handy & Harman Fabricated: US$18.08 per oz.Spodumene min 7-7.5% Li20, CIF China, US$900-1000 per tonne.Tantalite Ore : US$186.50/kgTin: US$8.56/lb. Uranium: U3O8, Trade Tech spot price: US$29.00 per lb U308Zinc: US$1.21/lb.Prices current Dec. 4, 2018
Tuesday, December 4, 2018Precious Metals Price (US$/oz.)Gold $1240.30Silver $14.55Platinum $804.00Palladium $1213.00
Metal stocks (in tonnes) held in London Metal Exchange ware-houses at opening, November 30, 2018 (change from Novem-ber 23, 2018 in brackets):Aluminium Alloy 12560 (-100)Aluminium 1052450 (-14550)Copper 136175 (-3375)Lead 105200 (-2975)Nickel 213570 (-618)Tin 3000 (+95)Zinc 117550 (-4000)
Short positions outstanding as of Nov 16, 2018 (with changes from Nov 01, 2018)Largest short positionsAldershot Res ALZ 2601824 2121761 11/1/2018Aldershot Res ALZ 2601824 2071522 11/1/2018First Cobalt FCC 1770950 1040235 11/1/2018Prize Mng PRZ 1678021 -713923 11/1/2018Amarillo Gold AGC 886500 157500 11/1/2018Leeta Gold HIVE 837700 20826 11/1/2018Saturn Mnrls SOIL 721749 248582 11/1/2018Cobalt 27 Cap KBLT 690800 -31500 11/1/2018Gratomic GRAT 637270 492570 11/1/2018Sandspring Res SSP 596928 585983 11/1/2018Atlantic Gold AGB 557440 18440 11/1/2018Vanadium One VONE 459720 228220 11/1/2018Equinox Gold EQX 370466 34566 11/1/2018Zadar Ventures ZAD 321700 321700 11/1/2018Novo Res NVO 307100 181700 11/1/2018Largest increase in short positionAldershot Res ALZ 2601824 2121761 11/1/2018Aldershot Res ALZ 2601824 2071522 11/1/2018First Cobalt FCC 1770950 1040235 11/1/2018Sandspring Res SSP 596928 585983 11/1/2018Gratomic GRAT 637270 492570 11/1/2018Largest decrease in short positionCentral Tim Ex CTEC 0 -2250000 11/1/2018Gowest Gold GWA 10800 -944271 11/1/2018Berkwood Res BKR 53000 -784765 11/1/2018Prize Mng PRZ 1678021 -713923 11/1/2018Jaxon Mining JAX 1249 -286100 11/1/2018
Short positions outstanding as of Nov 16, 2018 (with changes from Nov 01, 2018)Largest short positionsSandstorm Gold SSL 15433024 135967 11/1/2018Ivanhoe Mines IVN 13835881 -309852 11/1/2018Goldcorp G 12185753 5699114 11/1/2018Osisko Mng Inc OSK 10606179 -64787 11/1/2018Barrick Gold ABX 10351371 2021093 11/1/2018Suncor Energy SU 10292261 3285948 11/1/2018Kinross Gold K 9960987 2284199 11/1/2018First Quantum FM 9479904 2081667 11/1/2018Eldorado Gold ELD 9473838 -195975 11/1/2018OceanaGold OGC 8942349 156128 11/1/2018Nemaska Lith NMX 8538681 -826187 11/1/2018Nexgen Energy NXE 7140618 235340 11/1/2018First Majestic FR 6923422 434263 11/1/2018Turquoise HIl TRQ 6426316 -1161696 11/1/2018New Gold NGD 6248186 -1400250 11/1/2018Largest increase in short positionGoldcorp G 12185753 5699114 11/1/2018Suncor Energy SU 10292261 3285948 11/1/2018Prophecy Coal PCY 3247500 3214929 11/1/2018Kinross Gold K 9960987 2284199 11/1/2018First Quantum FM 9479904 2081667 11/1/2018Largest decrease in short positionNew Gold NGD 6248186 -1400250 11/1/2018Pine Cliff En PNE 1550909 -1198822 11/1/2018Turquoise HIl TRQ 6426316 -1161696 11/1/2018Alacer Gold ASR 3472128 -1072536 11/1/2018McEwen Mng MUX 2783522 -927414 11/1/2018
Daily Metal PricesDate Dec 3 Nov 30 Nov 29 Nov 28 Nov 27BASE METALS (London Metal Exchange -- Midday official cash/3-month prices, US$ per tonne)Al Alloy 1370/1360 1385/1370 1320/1360 1350/1370 1320/1360Aluminum 1982/1978.50 1934.50/1937.50 1931/1932 1911.50/1923.50 1924.50/1935Copper 6306/6285 6237/6200 6280/6240 6197/6155 6168.50/6135.50Lead 1964/1975 1956/1968 1932/1949 1906.50/1934 1905.50/1931Nickel 11190/11275 11010/11080 10885/10950 10730/10825 10700/10775Tin 18850/18775 18500/18500 18575/18550 18400/18350 18700/18700Zinc 2674.50/2580 2628/2499 2552/2454.50 2514/2428 2505/2440
PRECIOUS METAL PRICES (London fix, LBMA silver price, US$ per troy oz.)Gold AM 1231.05 1220.45 1226.45 1213.20 1225.05Gold PM 1230.30 1217.55 1226.25 1213.25 1221.20Silver 14.39 14.24 14.27 14.15 14.28Platinum 804.00 805.00 820.00 831.00 843.00Palladium 1213.00 1205.00 1174.00 1181.00 1143.00
Date Nov 30 Nov 29 Nov 28 Nov 27 Nov 26US$ in C$ 1.3295 1.3276 1.3277 1.3296 1.3254C$ in US$ 0.7521 0.7532 0.7532 0.7521 0.7545
Exchange rates (Quote Media, November 30, 2018)C$ to AUS C$ to EURO C$ to YEN C$ to Mex Peso C$ to SA Rand1.0287 0.6612 85.4295 15.2447 10.2964C$ to UK Pound C$ to China Yuan C$ to India Rupee C$ to Swiss Franc C$ to S. Korea Won0.5892 5.2286 52.5620 0.7503 841.6011US to AUS US to EURO US to YEN US to Mex Peso US to SA Rand1.3657 0.8778 113.4140 20.2412 13.6664US to UK Pound US to China Yuan US to India Rupee US to Swiss Franc US to S. Korea Won0.7822 6.9425 69.9350 0.9961 1118.0200
52-week
NORTH AMERICAN STOCK EXCHANGE INDICES
Index Nov 30 Nov 29 Nov 28 Nov 27 Nov 26 High LowS&P/TSX Composite 15197.82 15194.04 15171.25 14944.09 15012.65 15527.30 12400.15S&P/TSXV Composite 589.52 591.12 591.69 585.89 593.10 1050.26 883.52S&P/TSX 60 913.29 914.36 912.16 898.81 901.69 896.74 709.99S&P/TSX Global Gold 164.34 165.28 166.98 162.55 165.42 218.90 149.29DJ Precious Metals 138.24 138.24 139.41 135.82 138.69 420.72 130.95
19_DEC10_MMMM.indd 19 2018-12-04 6:19 PM
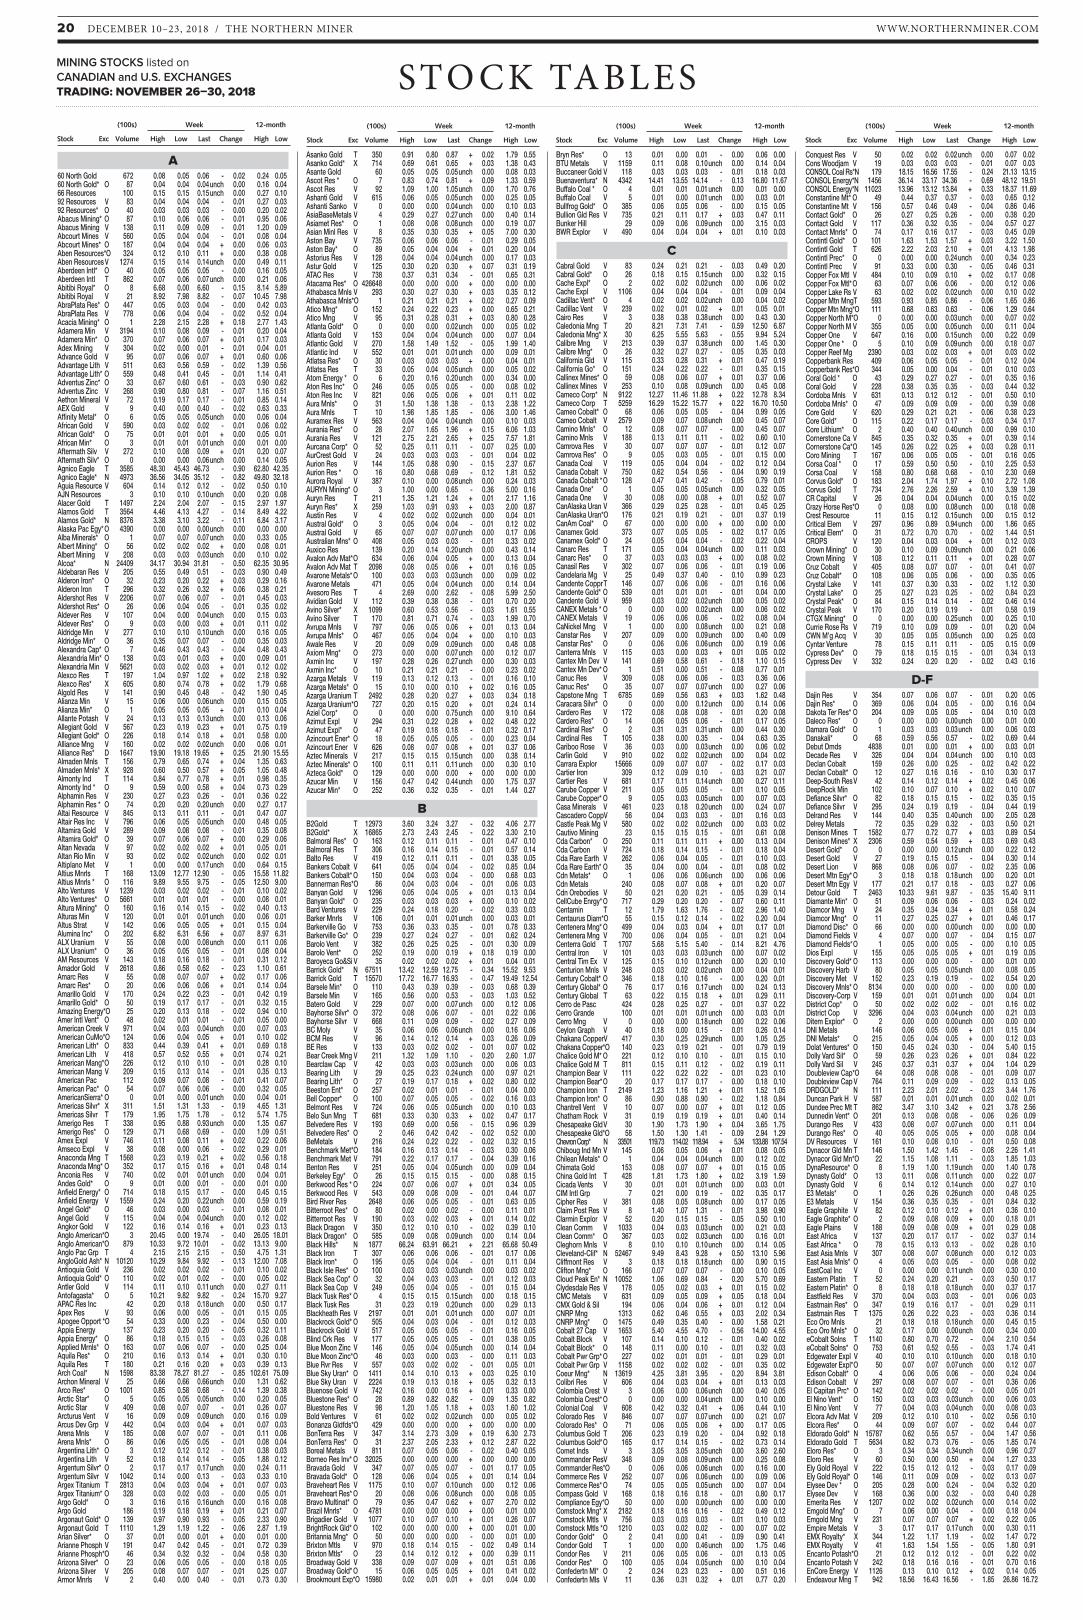
WWW.NORTHERNMINER.COM20 DECEMBER 10–23, 2018 / THE NORTHERN MINER
STO CK TABLES (100s) Week 12-month
Stock Exc Volume High Low Last Change High Low
(100s) Week 12-month
Stock Exc Volume High Low Last Change High Low
(100s) Week 12-month
Stock Exc Volume High Low Last Change High Low
(100s) Week 12-month
Stock Exc Volume High Low Last Change High Low
MINING STOCKS listed onCANADIAN and U.S. EXCHANGESTRADING: NOVEMBER 26–30, 2018
A60 North Gold 672 0.08 0.05 0.06 - 0.02 0.24 0.0560 North Gold* O 87 0.04 0.04 0.04 unch 0.00 0.16 0.0466 Resources 100 0.15 0.15 0.15 unch 0.00 0.27 0.1092 Resources V 83 0.04 0.04 0.04 - 0.01 0.27 0.0392 Resources* O 40 0.03 0.03 0.03 - 0.00 0.20 0.02Abacus Mining* O 87 0.10 0.06 0.06 - 0.01 0.95 0.06Abacus Mining V 138 0.11 0.09 0.09 - 0.01 1.20 0.09Abcourt Mines V 560 0.05 0.04 0.04 - 0.01 0.08 0.04Abcourt Mines* O 187 0.04 0.04 0.04 + 0.00 0.06 0.03Aben Resources* O 324 0.12 0.10 0.11 + 0.00 0.38 0.08Aben Resources V 1274 0.15 0.14 0.14 unch 0.00 0.49 0.11Aberdeen Intl* O 40 0.05 0.05 0.05 - 0.00 0.16 0.05Aberdeen Intl T 862 0.07 0.06 0.07 unch 0.00 0.21 0.06Abitibi Royal* O 8 6.68 0.00 6.60 - 0.15 8.14 5.89Abitibi Royal V 21 8.92 7.98 8.82 - 0.07 10.45 7.98AbraPlata Res* O 447 0.05 0.03 0.04 - 0.00 0.42 0.03AbraPlata Res V 778 0.06 0.04 0.04 - 0.02 0.52 0.04Acacia Mining* O 1 2.28 2.15 2.28 + 0.18 2.77 1.43Adamera Min V 3194 0.10 0.08 0.09 - 0.01 0.20 0.04Adamera Min* O 370 0.07 0.06 0.07 + 0.01 0.17 0.03Adex Mining V 304 0.02 0.00 0.01 - 0.01 0.04 0.01Advance Gold V 95 0.07 0.06 0.07 + 0.01 0.60 0.06Advantage Lith V 511 0.63 0.56 0.59 - 0.02 1.39 0.56Advantage Lith* O 559 0.48 0.41 0.45 - 0.01 1.14 0.41Adventus Zinc* O 33 0.67 0.60 0.61 - 0.03 0.90 0.62Adventus Zinc V 268 0.90 0.80 0.81 - 0.07 1.16 0.51Aethon Mineral V 72 0.19 0.17 0.17 - 0.01 0.85 0.14AEX Gold V 9 0.40 0.00 0.40 - 0.02 0.63 0.33Affinity Metal* O 6 0.05 0.05 0.05 unch 0.00 0.06 0.04African Gold V 590 0.03 0.02 0.02 - 0.01 0.06 0.02African Gold* O 75 0.01 0.01 0.01 + 0.00 0.05 0.01African Min* O 3 0.01 0.01 0.01 unch 0.00 0.01 0.00Aftermath Silv V 272 0.10 0.08 0.09 + 0.01 0.20 0.07Aftermath Silv* O 0 0.00 0.00 0.06 unch 0.00 0.14 0.05Agnico Eagle T 3585 48.30 45.43 46.73 - 0.90 62.80 42.35Agnico Eagle* N 4973 36.56 34.05 35.12 - 0.82 49.80 32.18Aguia Resource V 604 0.14 0.12 0.12 - 0.02 0.50 0.10AJN Resources 3 0.10 0.10 0.10 unch 0.00 0.20 0.08Alacer Gold T 1497 2.24 2.04 2.07 - 0.15 2.97 1.97Alamos Gold T 3564 4.46 4.13 4.27 - 0.14 8.49 4.22Alamos Gold* N 8376 3.38 3.10 3.22 - 0.11 6.84 3.17Alaska Pac Egy* O 4390 0.00 0.00 0.00 unch 0.00 0.00 0.00Alba Minerals* O 1 0.07 0.07 0.07 unch 0.00 0.33 0.05Albert Mining* O 56 0.02 0.02 0.02 + 0.00 0.08 0.01Albert Mining V 208 0.03 0.03 0.03 unch 0.00 0.10 0.02Alcoa* N 24409 34.17 30.94 31.81 - 0.50 62.35 30.95Aldebaran Res V 205 0.55 0.49 0.51 - 0.03 0.90 0.49Alderon Iron* O 32 0.23 0.20 0.22 + 0.03 0.29 0.16Alderon Iron T 296 0.32 0.26 0.32 + 0.06 0.38 0.21Aldershot Res V 2206 0.07 0.06 0.07 - 0.01 0.45 0.03Aldershot Res* O 26 0.06 0.04 0.05 - 0.01 0.35 0.02Aldever Res V 107 0.04 0.00 0.04 unch 0.00 0.15 0.03Aldever Res* O 9 0.03 0.00 0.03 + 0.01 0.11 0.02Aldridge Min V 277 0.10 0.10 0.10 unch 0.00 0.16 0.05Aldridge Min* O 36 0.35 0.07 0.07 - 0.00 0.35 0.03Alexandra Cap* O 7 0.46 0.43 0.43 - 0.04 0.48 0.43Alexandria Min* O 138 0.03 0.01 0.03 + 0.00 0.09 0.01Alexandria Min V 5621 0.03 0.02 0.03 + 0.01 0.12 0.02Alexco Res T 197 1.04 0.97 1.02 + 0.02 2.18 0.92Alexco Res* X 605 0.80 0.74 0.78 + 0.02 1.79 0.68Algold Res V 141 0.90 0.45 0.48 - 0.42 1.90 0.45Alianza Min V 15 0.06 0.00 0.06 unch 0.00 0.15 0.05Alianza Min* O 1 0.05 0.05 0.05 + 0.01 0.10 0.04Allante Potash V 24 0.13 0.13 0.13 unch 0.00 0.13 0.06Allegiant Gold V 567 0.23 0.19 0.23 + 0.01 0.75 0.19Allegiant Gold* O 226 0.18 0.14 0.18 + 0.01 0.58 0.00Alliance Mng V 160 0.02 0.02 0.02 unch 0.00 0.06 0.01Alliance Res* D 1647 19.90 19.18 19.65 + 0.25 21.90 15.55Almaden Mnls T 156 0.79 0.65 0.74 + 0.04 1.35 0.63Almaden Mnls* X 928 0.60 0.50 0.57 + 0.05 1.05 0.48Almonty Ind T 114 0.84 0.77 0.78 + 0.01 0.98 0.35Almonty Ind * O 9 0.59 0.00 0.58 + 0.04 0.73 0.29Alphamin Res V 230 0.27 0.23 0.26 - 0.01 0.36 0.22Alphamin Res * O 74 0.20 0.20 0.20 unch 0.00 0.27 0.17Altai Resource V 845 0.13 0.11 0.11 - 0.01 0.47 0.07Altair Res Inc V 796 0.06 0.05 0.05 unch 0.00 0.48 0.05Altamira Gold V 289 0.09 0.08 0.08 - 0.01 0.35 0.08Altamira Gold* O 39 0.07 0.06 0.07 + 0.00 0.29 0.06Altan Nevada V 97 0.02 0.02 0.02 + 0.01 0.05 0.01Altan Rio Min V 93 0.02 0.02 0.02 unch 0.00 0.02 0.01Altiplano Met V 1 0.00 0.00 0.17 unch 0.00 0.64 0.15Altius Mnrls T 168 13.09 12.77 12.90 - 0.05 15.58 11.82Altius Mnrls * O 116 9.89 9.55 9.75 - 0.05 12.50 9.00Alto Ventures V 1239 0.03 0.02 0.02 - 0.01 0.10 0.02Alto Ventures* O 5661 0.01 0.01 0.01 - 0.00 0.08 0.01Altura Mining* O 160 0.16 0.14 0.15 - 0.02 0.40 0.13Alturas Min V 120 0.01 0.01 0.01 unch 0.00 0.06 0.01Altus Strat V 142 0.06 0.05 0.05 + 0.01 0.15 0.04Alumina Inc* O 202 6.82 6.31 6.56 + 0.07 8.97 6.31ALX Uranium V 55 0.08 0.00 0.08 unch 0.00 0.11 0.06ALX Uranium* O 36 0.05 0.05 0.05 - 0.01 0.08 0.04AM Resources V 143 0.18 0.16 0.18 - 0.01 0.31 0.12Amador Gold V 2618 0.86 0.58 0.62 - 0.23 1.10 0.61Amarc Res V 55 0.08 0.07 0.07 + 0.02 0.17 0.06Amarc Res* O 20 0.06 0.06 0.06 + 0.01 0.14 0.04Amarillo Gold V 170 0.24 0.22 0.23 - 0.01 0.42 0.19Amarillo Gold* O 50 0.19 0.17 0.17 - 0.01 0.32 0.15Amazing Energy* O 25 0.20 0.13 0.18 - 0.02 0.94 0.10Amer Intl Vent* O 48 0.02 0.01 0.01 - 0.01 0.05 0.00American Creek V 971 0.04 0.03 0.04 unch 0.00 0.07 0.03American CuMo* O 124 0.06 0.04 0.05 + 0.01 0.10 0.02American Lith* O 833 0.44 0.39 0.41 + 0.01 0.69 0.18American Lith V 418 0.57 0.52 0.55 + 0.01 0.74 0.21American Mang* O 226 0.12 0.10 0.10 - 0.01 0.28 0.10American Mang V 209 0.15 0.13 0.14 - 0.01 0.35 0.13American Pac 112 0.09 0.07 0.08 - 0.01 0.41 0.07American Pac* O 54 0.07 0.06 0.06 - 0.00 0.32 0.05AmericanSierra* O 0 0.01 0.00 0.01 unch 0.00 0.04 0.01Americas Silvr* X 311 1.51 1.31 1.33 - 0.19 4.65 1.31Americas Silvr T 179 1.95 1.75 1.78 - 0.12 5.74 1.75Amerigo Res T 338 0.95 0.88 0.93 unch 0.00 1.35 0.67Amerigo Res* O 129 0.71 0.68 0.69 - 0.00 1.09 0.51Amex Expl V 746 0.11 0.08 0.11 + 0.02 0.22 0.06Amseco Expl V 38 0.08 0.00 0.06 - 0.02 0.29 0.01Anaconda Mng T 1568 0.23 0.19 0.21 + 0.02 0.56 0.18Anaconda Mng* O 352 0.17 0.15 0.16 + 0.01 0.48 0.14Anconia Res V 740 0.02 0.01 0.01 unch 0.00 0.04 0.01Andes Gold* O 9 0.01 0.00 0.01 - 0.00 0.01 0.00Anfield Energy* O 714 0.18 0.15 0.17 - 0.00 0.45 0.15Anfield Energy V 1559 0.24 0.20 0.22 unch 0.00 0.59 0.19Angel Gold* O 46 0.03 0.00 0.03 - 0.01 0.08 0.01Angel Gold V 115 0.04 0.04 0.04 unch 0.00 0.12 0.02Angkor Gold V 122 0.16 0.14 0.16 + 0.01 0.23 0.13Anglo American* O 3 20.45 0.00 19.74 - 0.40 26.05 18.01Anglo American* O 879 10.33 9.72 10.01 - 0.02 13.13 9.00Anglo Pac Grp T 4 2.15 2.15 2.15 - 0.50 4.75 1.31AngloGold Ash* N 10120 10.29 9.84 9.92 - 0.13 12.00 7.08Antioquia Gold V 236 0.02 0.02 0.02 - 0.01 0.10 0.02Antioquia Gold* O 110 0.02 0.01 0.02 - 0.00 0.05 0.02Antler Gold V 114 0.11 0.10 0.11 unch 0.00 0.27 0.11Antofagasta* O 5 10.21 9.82 9.82 - 0.24 15.70 9.27APAC Res Inc 42 0.20 0.18 0.18 unch 0.00 0.50 0.17Apex Res V 93 0.06 0.00 0.05 - 0.01 0.15 0.05Apogee Opport * O 54 0.33 0.00 0.23 - 0.04 0.50 0.00Appia Energy 137 0.23 0.20 0.20 - 0.05 0.32 0.11Appia Energy* O 86 0.18 0.15 0.15 - 0.03 0.26 0.08Applied Mrnls* O 163 0.07 0.06 0.07 - 0.00 0.25 0.04Aquila Res* O 210 0.16 0.13 0.14 + 0.01 0.30 0.10Aquila Res T 180 0.21 0.16 0.20 + 0.03 0.39 0.13Arch Coal* N 1598 83.38 78.27 81.27 - 0.85 102.61 75.09Archon Mineral V 25 0.66 0.66 0.66 unch 0.00 1.31 0.62Arco Res* O 1001 0.85 0.58 0.68 - 0.14 1.39 0.38Arctic Star* O 5 0.05 0.05 0.05 unch 0.00 0.20 0.05Arctic Star V 409 0.08 0.07 0.07 - 0.01 0.26 0.07Arcturus Vent V 16 0.09 0.09 0.09 unch 0.00 0.16 0.09Arcus Dev Grp V 442 0.04 0.03 0.04 + 0.01 0.07 0.03Arena Mnls V 185 0.08 0.07 0.07 - 0.01 0.11 0.06Arena Mnls* O 86 0.06 0.05 0.05 - 0.01 0.08 0.04Argentina Lith* O 3 0.12 0.12 0.12 - 0.01 0.38 0.03Argentina Lith V 52 0.18 0.14 0.14 - 0.05 1.88 0.12Argentum Silvr* O 2 0.17 0.17 0.17 unch 0.00 0.24 0.11Argentum Silvr V 1042 0.14 0.00 0.13 - 0.03 0.33 0.10Argex Titanium T 2813 0.04 0.03 0.04 + 0.01 0.07 0.03Argex Titanium* O 328 0.03 0.02 0.03 - 0.00 0.05 0.01Argo Gold* O 3 0.16 0.16 0.16 unch 0.00 0.16 0.08Argo Gold 186 0.19 0.18 0.19 + 0.01 0.21 0.07Argonaut Gold* O 139 0.97 0.90 0.93 - 0.05 2.33 0.90Argonaut Gold T 1110 1.29 1.19 1.22 - 0.06 2.87 1.19Arian Silver* O 37 0.01 0.00 0.01 + 0.00 0.01 0.00Arianne Phosph V 191 0.47 0.42 0.45 - 0.01 0.72 0.39Arianne Phosph* O 46 0.34 0.32 0.32 - 0.04 0.58 0.30Arizona Silver* O 23 0.06 0.05 0.05 - 0.00 0.18 0.05Arizona Silver V 205 0.08 0.07 0.07 - 0.01 0.25 0.07Armor Mnrls V 2 0.40 0.00 0.40 - 0.01 0.73 0.30
Conquest Res V 50 0.02 0.02 0.02 unch 0.00 0.07 0.02Cons Woodjam V 19 0.03 0.03 0.03 - 0.01 0.07 0.03CONSOL Coal Rs* N 179 18.15 16.56 17.55 - 0.24 21.13 13.15CONSOL Energy* N 1456 36.14 33.17 34.36 - 0.69 48.12 19.51CONSOL Energy* N 11023 13.96 13.12 13.84 + 0.33 18.37 11.69Constantine Mt* O 49 0.44 0.37 0.37 - 0.03 0.65 0.12Constantine Mt V 156 0.57 0.46 0.49 - 0.04 0.86 0.46Contact Gold* O 26 0.27 0.25 0.26 - 0.00 0.38 0.20Contact Gold V 117 0.36 0.32 0.35 - 0.04 0.57 0.27Contact Mnrls* O 74 0.17 0.16 0.17 - 0.03 0.45 0.09Contintl Gold* O 101 1.63 1.53 1.57 + 0.03 3.22 1.50Contintl Gold T 626 2.22 2.03 2.10 + 0.01 4.13 1.98Contintl Prec* O 0 0.00 0.00 0.24 unch 0.00 0.34 0.23Contintl Prec V 91 0.33 0.00 0.30 - 0.05 0.46 0.31Copper Fox Mtl V 484 0.10 0.09 0.10 + 0.02 0.17 0.08Copper Fox Mtl* O 63 0.07 0.06 0.06 - 0.00 0.12 0.06Copper Lake Rs V 63 0.02 0.02 0.02 unch 0.00 0.10 0.02Copper Mtn Mng T 593 0.93 0.85 0.86 - 0.06 1.65 0.86Copper Mtn Mng* O 111 0.68 0.63 0.63 - 0.06 1.29 0.64Copper North M* O 0 0.00 0.00 0.03 unch 0.00 0.07 0.02Copper North M V 355 0.05 0.00 0.05 unch 0.00 0.11 0.04Copper One V 647 0.16 0.00 0.15 unch 0.00 0.22 0.09Copper One * O 5 0.10 0.09 0.09 unch 0.00 0.18 0.07Copper Reef Mg 2390 0.03 0.02 0.03 + 0.01 0.03 0.02Copperbank Res 409 0.06 0.05 0.05 - 0.01 0.12 0.04Copperbank Res* O 344 0.05 0.00 0.04 - 0.01 0.10 0.03Coral Gold * O 43 0.29 0.27 0.27 - 0.01 0.35 0.16Coral Gold V 228 0.38 0.35 0.35 - 0.03 0.44 0.32Cordoba Mnls V 631 0.13 0.12 0.12 - 0.01 0.50 0.10Cordoba Mnls* O 47 0.09 0.09 0.09 - 0.00 0.39 0.08Core Gold V 620 0.29 0.21 0.21 - 0.06 0.38 0.23Core Gold* O 115 0.22 0.17 0.17 - 0.03 0.34 0.17Core Lithium* O 2 0.40 0.40 0.40 unch 0.00 0.99 0.10Cornerstone Ca V 845 0.35 0.32 0.35 + 0.01 0.39 0.14Cornerstone Ca* O 145 0.26 0.22 0.25 + 0.03 0.28 0.11Coro Mining T 167 0.06 0.05 0.05 - 0.01 0.16 0.05Corsa Coal * O 17 0.59 0.50 0.50 - 0.10 2.25 0.53Corsa Coal V 158 0.80 0.68 0.68 - 0.10 2.30 0.69Corvus Gold* O 183 2.04 1.74 1.97 + 0.10 2.72 1.08Corvus Gold T 734 2.76 2.26 2.59 + 0.10 3.39 1.39CR Capital V 26 0.04 0.04 0.04 unch 0.00 0.15 0.02Crazy Horse Res* O 0 0.08 0.00 0.08 unch 0.00 0.18 0.08Crest Resource 11 0.15 0.12 0.15 unch 0.00 0.15 0.12Critical Elem V 297 0.96 0.89 0.94 unch 0.00 1.86 0.65Critical Elem* O 31 0.72 0.70 0.70 - 0.02 1.44 0.51CROPS V 120 0.04 0.03 0.04 + 0.01 0.12 0.03Crown Mining* O 30 0.10 0.09 0.09 unch 0.00 0.21 0.06Crown Mining V 108 0.12 0.11 0.11 + 0.01 0.28 0.07Cruz Cobalt V 405 0.08 0.07 0.07 - 0.01 0.41 0.07Cruz Cobalt* O 108 0.06 0.05 0.06 - 0.00 0.35 0.05Crystal Lake V 141 0.37 0.30 0.33 - 0.02 1.12 0.30Crystal Lake* O 25 0.27 0.23 0.25 - 0.02 0.84 0.23Crystal Peak* O 84 0.15 0.14 0.14 - 0.02 0.46 0.14Crystal Peak V 170 0.20 0.19 0.19 - 0.01 0.58 0.19CTGX Mining* O 0 0.00 0.00 0.25 unch 0.00 0.25 0.10Currie Rose Rs V 719 0.10 0.09 0.09 - 0.01 0.20 0.04CWN M’g Acq V 30 0.05 0.05 0.05 unch 0.00 0.25 0.03Cyntar Venture 78 0.15 0.11 0.11 - 0.05 0.15 0.09Cypress Dev* O 79 0.18 0.15 0.15 - 0.01 0.34 0.13Cypress Dev V 332 0.24 0.20 0.20 - 0.02 0.43 0.16
D-FDajin Res V 354 0.07 0.06 0.07 - 0.01 0.20 0.05Dajin Res* O 369 0.06 0.04 0.05 - 0.00 0.16 0.04Dakota Ter Res* O 204 0.09 0.05 0.05 - 0.04 0.10 0.03Daleco Res* O 0 0.00 0.00 0.00 unch 0.00 0.01 0.00Damara Gold* O 1 0.03 0.03 0.03 unch 0.00 0.06 0.03Danakali* O 68 0.59 0.56 0.57 - 0.02 0.69 0.44Debut Dmds 4838 0.01 0.00 0.01 + 0.00 0.03 0.01Decade Res V 326 0.04 0.04 0.04 unch 0.00 0.10 0.03Declan Cobalt 159 0.26 0.00 0.25 - 0.02 0.42 0.22Declan Cobalt* O 12 0.27 0.16 0.16 - 0.10 0.30 0.17Deep-South Res V 42 0.14 0.12 0.14 + 0.02 0.45 0.06DeepRock Min 102 0.10 0.07 0.10 + 0.02 0.10 0.07Defiance Silvr* O 82 0.18 0.15 0.15 - 0.02 0.35 0.15Defiance Silvr V 295 0.24 0.19 0.19 - 0.04 0.44 0.19Delrand Res V 144 0.40 0.35 0.40 unch 0.00 2.05 0.28Delrey Metals 72 0.35 0.29 0.32 - 0.03 0.50 0.21Denison Mines T 1582 0.77 0.72 0.77 + 0.03 0.89 0.54Denison Mines* X 2306 0.59 0.54 0.59 + 0.03 0.69 0.43Desert Gold* O 0 0.00 0.00 0.12 unch 0.00 0.22 0.12Desert Gold V 27 0.19 0.15 0.15 - 0.04 0.30 0.14Desert Lion V 868 0.08 0.06 0.07 - 0.02 2.35 0.06Desert Mtn Egy* O 3 0.18 0.18 0.18 unch 0.00 0.20 0.01Desert Mtn Egy V 177 0.21 0.17 0.18 - 0.03 0.27 0.06Detour Gold T 2463 10.33 9.61 9.87 - 0.35 15.40 9.11Diamante Min* O 51 0.09 0.06 0.06 - 0.03 0.24 0.02Diamcor Mng V 24 0.35 0.34 0.34 + 0.01 0.58 0.24Diamcor Mng* O 11 0.27 0.25 0.27 + 0.01 0.46 0.17Diamond Disc* O 66 0.00 0.00 0.00 unch 0.00 0.00 0.00Diamond Fields V 4 0.07 0.00 0.07 - 0.04 0.15 0.07Diamond Fields* O 1 0.05 0.00 0.05 - 0.00 0.10 0.05Dios Expl V 155 0.05 0.05 0.05 + 0.01 0.19 0.05Discovery Gold* O 113 0.00 0.00 0.00 - 0.00 0.01 0.00Discovery Harb V 80 0.05 0.05 0.05 unch 0.00 0.08 0.05Discovery Met V 152 0.23 0.19 0.19 - 0.02 0.54 0.20Discovery Mnls* O 8134 0.00 0.00 0.00 - 0.00 0.00 0.00Discovery-Corp V 159 0.01 0.01 0.01 unch 0.00 0.04 0.01District Cop* O 50 0.02 0.02 0.02 - 0.01 0.16 0.02District Cop V 3296 0.04 0.03 0.04 unch 0.00 0.21 0.03Ditem Explor* O 2 0.00 0.00 0.00 unch 0.00 0.00 0.00DNI Metals 146 0.06 0.05 0.06 + 0.01 0.15 0.04DNI Metals* O 215 0.05 0.04 0.05 + 0.00 0.12 0.03Dolat Ventures* O 150 0.45 0.24 0.30 - 0.04 5.40 0.15Dolly Vard Sil* O 59 0.26 0.23 0.26 + 0.01 0.84 0.22Dolly Vard Sil V 245 0.37 0.31 0.37 + 0.04 1.04 0.29Doubleview Cap* O 64 0.08 0.08 0.08 - 0.01 0.09 0.07Doubleview Cap V 764 0.11 0.09 0.09 - 0.02 0.13 0.05DRDGOLD* N 111 2.23 2.01 2.02 - 0.23 3.44 1.76Duncan Park H V 587 0.01 0.01 0.01 unch 0.00 0.02 0.01Dundee Prec Mt T 862 3.47 3.10 3.42 + 0.21 3.78 2.56Dunnedin Vent* O 201 0.13 0.08 0.08 - 0.06 0.26 0.09Durango Res V 433 0.08 0.07 0.07 unch 0.00 0.11 0.04Durango Res* O 40 0.05 0.05 0.05 + 0.00 0.08 0.04DV Resources V 161 0.10 0.08 0.10 - 0.01 0.50 0.08Dynacor Gld Mn T 146 1.50 1.42 1.45 - 0.08 2.26 1.41Dynacor Gld Mn* O 22 1.15 1.08 1.11 - 0.03 1.85 1.03DynaResource* O 8 1.19 1.00 1.19 unch 0.00 1.40 0.78Dynasty Gold* O 13 0.11 0.08 0.11 unch 0.00 0.22 0.07Dynasty Gold V 6 0.14 0.12 0.14 unch 0.00 0.27 0.10E3 Metals* O 1 0.26 0.26 0.26 unch 0.00 0.48 0.25E3 Metals V 154 0.36 0.35 0.35 - 0.01 0.84 0.32Eagle Graphite V 82 0.12 0.10 0.12 + 0.01 0.36 0.10Eagle Graphite* O 2 0.09 0.08 0.09 + 0.00 0.18 0.01Eagle Plains V 188 0.09 0.08 0.09 + 0.01 0.29 0.08East Africa V 137 0.20 0.17 0.17 - 0.02 0.37 0.14East Africa * O 78 0.15 0.13 0.13 - 0.02 0.28 0.10East Asia Mnls V 307 0.08 0.07 0.08 unch 0.00 0.12 0.03East Asia Mnls* O 4 0.05 0.03 0.05 - 0.00 0.08 0.02EastCoal Inc V 0 0.00 0.00 0.11 unch 0.00 0.30 0.10Eastern Platin T 52 0.24 0.20 0.21 - 0.03 0.50 0.17Eastern Platin* O 8 0.18 0.18 0.18 unch 0.00 0.37 0.17Eastfield Res V 370 0.04 0.03 0.03 - 0.01 0.06 0.03Eastmain Res* O 347 0.19 0.16 0.17 - 0.01 0.29 0.11Eastmain Res T 1375 0.26 0.22 0.23 - 0.03 0.36 0.14Eco Oro Mnls 21 0.18 0.18 0.18 unch 0.00 0.45 0.15Eco Oro Mnls* O 32 0.17 0.00 0.00 unch 0.00 0.34 0.00eCobalt Solns T 1140 0.80 0.70 0.72 - 0.04 2.10 0.54eCobalt Solns* O 753 0.61 0.52 0.55 - 0.03 1.74 0.41Edgewater Expl V 40 0.10 0.10 0.10 unch 0.00 0.18 0.10Edgewater Expl* O 50 0.07 0.07 0.07 unch 0.00 0.12 0.07Edison Cobalt* O 4 0.06 0.05 0.06 - 0.00 0.24 0.04Edison Cobalt V 297 0.08 0.07 0.07 - 0.01 0.36 0.06El Capitan Prc* O 142 0.02 0.02 0.02 - 0.00 0.05 0.01El Nino Vent* O 150 0.03 0.03 0.03 unch 0.00 0.06 0.03El Nino Vent V 77 0.04 0.03 0.04 unch 0.00 0.08 0.03Elcora Adv Mat V 209 0.12 0.10 0.10 - 0.02 0.56 0.10Elcora Res* O 44 0.09 0.07 0.07 - 0.02 0.44 0.07Eldorado Gold* N 15787 0.62 0.55 0.57 - 0.04 1.47 0.56Eldorado Gold T 5634 0.82 0.73 0.76 - 0.05 1.85 0.74Eloro Res* O 3 0.34 0.34 0.34 unch 0.00 0.96 0.27Eloro Res V 60 0.50 0.00 0.50 + 0.04 1.27 0.33Ely Gold Royal V 222 0.15 0.12 0.12 - 0.03 0.17 0.09Ely Gold Royal* O 146 0.11 0.09 0.09 - 0.02 0.13 0.07Elysee Dev * O 205 0.28 0.00 0.24 - 0.04 0.32 0.20Elysee Dev V 168 0.36 0.00 0.32 - 0.03 0.40 0.28Emerita Res V 1207 0.02 0.02 0.02 unch 0.00 0.14 0.02Emgold Mng* O 7 0.06 0.00 0.04 - 0.00 0.18 0.04Emgold Mng V 231 0.07 0.07 0.07 + 0.02 0.22 0.05Empire Metals V 3 0.17 0.17 0.17 unch 0.00 0.30 0.11EMX Royalty* X 344 1.22 1.17 1.19 - 0.02 1.47 0.72EMX Royalty V 41 1.63 1.54 1.55 - 0.05 1.80 0.91Encanto Potash* O 21 0.12 0.12 0.12 - 0.01 0.22 0.02Encanto Potash V 242 0.18 0.16 0.16 - 0.01 0.70 0.16EnCore Energy V 1126 0.13 0.10 0.12 + 0.02 0.14 0.05Endeavour Mng T 942 18.56 16.43 16.56 - 1.85 26.86 16.72
Asanko Gold T 350 0.91 0.80 0.87 + 0.02 1.79 0.55Asanko Gold* X 714 0.69 0.61 0.65 + 0.03 1.38 0.43Asante Gold 60 0.05 0.05 0.05 unch 0.00 0.08 0.03Ascot Res * O 7 0.83 0.74 0.81 + 0.09 1.33 0.59Ascot Res V 92 1.09 1.00 1.05 unch 0.00 1.70 0.76Ashanti Gold V 615 0.06 0.05 0.05 unch 0.00 0.25 0.05Ashanti Sanko V 0 0.00 0.00 0.04 unch 0.00 0.10 0.03AsiaBaseMetals V 4 0.29 0.27 0.27 unch 0.00 0.40 0.14Asiamet Res* O 1 0.08 0.08 0.08 unch 0.00 0.19 0.07Asian Minl Res V 8 0.35 0.30 0.35 + 0.05 7.00 0.30Aston Bay V 735 0.06 0.06 0.06 - 0.01 0.29 0.05Aston Bay* O 89 0.05 0.04 0.04 + 0.01 0.20 0.04Astorius Res V 128 0.04 0.04 0.04 unch 0.00 0.17 0.03Astur Gold V 125 0.30 0.20 0.30 + 0.07 0.31 0.19ATAC Res V 738 0.37 0.31 0.34 - 0.01 0.65 0.31Atacama Res* O 426648 0.00 0.00 0.00 + 0.00 0.00 0.00Athabasca Mnls V 293 0.30 0.27 0.30 + 0.03 0.35 0.12Athabasca Mnls* O 1 0.21 0.21 0.21 + 0.02 0.27 0.09Atico Mng* O 152 0.24 0.22 0.23 + 0.00 0.65 0.21Atico Mng V 95 0.31 0.28 0.31 + 0.03 0.80 0.28Atlanta Gold* O 0 0.00 0.00 0.02 unch 0.00 0.05 0.02Atlanta Gold V 153 0.04 0.04 0.04 unch 0.00 0.07 0.04Atlantic Gold V 270 1.58 1.49 1.52 - 0.05 1.99 1.40Atlantic Ind V 552 0.01 0.01 0.01 unch 0.00 0.09 0.01Atlatsa Res* O 30 0.03 0.03 0.03 + 0.00 0.04 0.01Atlatsa Res T 33 0.05 0.04 0.05 unch 0.00 0.05 0.02Atom Energy * O 6 0.20 0.16 0.20 unch 0.00 0.34 0.00Aton Res Inc* O 246 0.05 0.05 0.05 - 0.00 0.08 0.02Aton Res Inc V 821 0.06 0.05 0.06 + 0.01 0.11 0.02Aura Mnls* O 31 1.50 1.38 1.38 - 0.13 2.38 1.22Aura Mnls T 10 1.98 1.85 1.85 - 0.06 3.00 1.46Auramex Res V 563 0.04 0.04 0.04 unch 0.00 0.10 0.03Aurania Res* O 28 2.07 1.65 1.96 + 0.15 6.06 1.03Aurania Res V 121 2.75 2.21 2.65 + 0.25 7.57 1.81Aurcana Corp* O 52 0.25 0.11 0.11 - 0.07 0.25 0.00AurCrest Gold V 24 0.03 0.03 0.03 - 0.01 0.04 0.02Aurion Res V 144 1.05 0.88 0.90 - 0.15 2.37 0.67Aurion Res * O 16 0.80 0.68 0.69 - 0.12 1.81 0.52Aurora Royal V 387 0.10 0.00 0.08 unch 0.00 0.24 0.03AURYN Mining* O 3 1.00 0.00 0.65 - 0.36 5.00 0.16Auryn Res T 211 1.35 1.21 1.24 + 0.01 2.17 1.16Auryn Res* X 259 1.03 0.91 0.93 + 0.03 2.00 0.87Austin Res V 4 0.02 0.02 0.02 unch 0.00 0.04 0.01Austral Gold* O 3 0.05 0.04 0.04 - 0.01 0.12 0.02Austral Gold V 65 0.07 0.07 0.07 unch 0.00 0.17 0.06Australian Mns* O 408 0.05 0.03 0.03 - 0.01 0.33 0.02Auxico Res 139 0.20 0.14 0.20 unch 0.00 0.43 0.14Avalon Adv Mat* O 634 0.06 0.04 0.05 + 0.00 0.13 0.04Avalon Adv Mat T 2098 0.08 0.05 0.06 + 0.01 0.16 0.05Avarone Metals* O 100 0.03 0.03 0.03 unch 0.00 0.09 0.02Avarone Metals 471 0.05 0.04 0.04 unch 0.00 0.14 0.04Avesoro Res T 4 2.69 0.00 2.62 - 0.08 5.99 2.50Avidian Gold V 112 0.39 0.38 0.38 - 0.01 0.70 0.20Avino Silver* X 1099 0.60 0.53 0.56 - 0.03 1.61 0.55Avino Silver T 170 0.81 0.71 0.74 - 0.03 1.99 0.70Avrupa Mnls V 797 0.06 0.05 0.06 + 0.01 0.13 0.04Avrupa Mnls* O 467 0.05 0.04 0.04 + 0.00 0.10 0.03Awale Res V 20 0.09 0.09 0.09 unch 0.00 0.48 0.08Axiom Mng* O 273 0.00 0.00 0.07 unch 0.00 0.12 0.07Axmin Inc V 197 0.28 0.26 0.27 unch 0.00 0.30 0.03Axmin Inc* O 10 0.21 0.21 0.21 - 0.00 0.23 0.02Azarga Metals V 119 0.13 0.12 0.13 - 0.01 0.16 0.10Azarga Metals* O 15 0.10 0.00 0.10 + 0.02 0.16 0.05Azarga Uranium T 2492 0.28 0.20 0.27 + 0.03 0.34 0.18Azarga Uranium* O 727 0.20 0.15 0.20 + 0.01 0.24 0.14Aziel Corp* O 0 0.00 0.00 0.75 unch 0.00 9.10 0.64Azimut Expl V 294 0.31 0.22 0.28 + 0.02 0.48 0.22Azimut Expl* O 47 0.19 0.18 0.18 - 0.01 0.32 0.17Azincourt Ener* O 18 0.05 0.05 0.05 - 0.00 0.23 0.04Azincourt Ener V 626 0.08 0.07 0.08 + 0.01 0.37 0.06Aztec Minerals V 217 0.15 0.15 0.15 unch 0.00 0.38 0.14Aztec Minerals* O 100 0.11 0.11 0.11 unch 0.00 0.30 0.10Azteca Gold* O 129 0.00 0.00 0.00 + 0.00 0.00 0.00Azucar Min V 156 0.47 0.42 0.44 unch 0.00 1.75 0.37Azucar Min* O 252 0.36 0.32 0.35 - 0.01 1.44 0.27
BB2Gold T 12973 3.60 3.24 3.27 - 0.32 4.06 2.77B2Gold* X 16865 2.73 2.43 2.45 - 0.22 3.30 2.10Balmoral Res* O 163 0.12 0.11 0.11 - 0.01 0.47 0.10Balmoral Res T 306 0.16 0.14 0.15 - 0.01 0.57 0.14Balto Res V 419 0.12 0.11 0.11 - 0.01 0.38 0.05Bankers Cobalt V 641 0.05 0.04 0.04 - 0.02 0.85 0.04Bankers Cobalt* O 150 0.04 0.03 0.04 - 0.00 0.68 0.03Bannerman Res* O 86 0.04 0.03 0.04 - 0.01 0.06 0.03Banyan Gold V 1296 0.05 0.04 0.05 + 0.01 0.13 0.04Banyan Gold* O 235 0.03 0.03 0.03 + 0.00 0.10 0.02Bard Ventures V 229 0.24 0.18 0.20 - 0.02 0.33 0.03Barker Mnrls V 106 0.01 0.01 0.01 unch 0.00 0.03 0.01Barkerville Go V 753 0.36 0.33 0.35 - 0.01 0.78 0.33Barkerville Go* O 239 0.27 0.24 0.27 - 0.01 0.62 0.24Barolo Vent V 382 0.26 0.25 0.25 - 0.01 0.30 0.09Barolo Vent* O 252 0.19 0.00 0.19 + 0.18 0.19 0.00Baroyeca Go&Si V 35 0.02 0.02 0.02 + 0.01 0.04 0.01Barrick Gold* N 67511 13.42 12.59 12.75 - 0.34 15.52 9.53Barrick Gold T 15570 17.72 16.77 16.93 - 0.47 19.49 12.54Barsele Min* O 110 0.43 0.39 0.39 - 0.03 0.68 0.39Barsele Min V 165 0.56 0.00 0.53 - 0.03 1.03 0.52Batero Gold V 229 0.07 0.00 0.07 unch 0.00 0.12 0.06Bayhorse Silvr* O 372 0.08 0.06 0.07 - 0.01 0.22 0.06Bayhorse Silvr V 668 0.11 0.09 0.09 - 0.02 0.27 0.09BC Moly V 35 0.06 0.06 0.06 unch 0.00 0.16 0.06BCM Res V 96 0.14 0.12 0.14 + 0.03 0.26 0.09BE Res V 133 0.03 0.02 0.02 - 0.01 0.07 0.02Bear Creek Mng V 211 1.32 1.09 1.10 - 0.20 2.60 1.07Bearclaw Cap V 42 0.03 0.03 0.03 unch 0.00 0.06 0.03Bearing Lith V 29 0.25 0.23 0.24 unch 0.00 0.97 0.21Bearing Lith* O 27 0.19 0.17 0.18 + 0.02 0.80 0.02Beeston Ent* O 257 0.02 0.01 0.01 - 0.01 0.04 0.00Bell Copper* O 100 0.07 0.05 0.05 - 0.02 0.16 0.03Belmont Res V 724 0.06 0.05 0.05 unch 0.00 0.10 0.03Belo Sun Mng T 681 0.33 0.30 0.33 + 0.02 0.47 0.17Belvedere Res V 193 0.69 0.00 0.56 - 0.15 0.96 0.39Belvedere Res* O 2 0.46 0.42 0.42 - 0.02 0.52 0.00BeMetals V 216 0.24 0.22 0.22 - 0.02 0.32 0.15Benchmark Met* O 184 0.16 0.13 0.14 - 0.03 0.30 0.06Benchmark Met V 791 0.22 0.17 0.17 - 0.04 0.39 0.16Benton Res V 251 0.05 0.04 0.05 unch 0.00 0.09 0.04Berkeley Egy* O 26 0.15 0.15 0.15 - 0.00 0.88 0.15Berkwood Res * O 224 0.07 0.06 0.07 + 0.01 0.34 0.05Berkwood Res V 543 0.09 0.08 0.09 - 0.01 0.44 0.07Bird River Res 2648 0.06 0.05 0.05 - 0.01 0.63 0.05Bitterroot Res* O 80 0.02 0.00 0.02 - 0.00 0.11 0.01Bitterroot Res V 190 0.03 0.02 0.03 + 0.01 0.14 0.02Black Dragon V 350 0.12 0.10 0.10 - 0.02 0.39 0.10Black Dragon* O 585 0.09 0.08 0.09 unch 0.00 0.14 0.04Black Hills* N 1877 66.24 63.91 66.21 + 2.21 65.68 50.49Black Iron T 307 0.06 0.06 0.06 - 0.01 0.17 0.06Black Iron* O 195 0.05 0.04 0.04 - 0.01 0.11 0.04Black Isle Res* O 100 0.03 0.03 0.03 unch 0.00 0.03 0.02Black Sea Cop* O 32 0.04 0.03 0.03 - 0.01 0.12 0.03Black Sea Cop V 249 0.05 0.04 0.05 - 0.01 0.15 0.04Black Tusk Res* O 4 0.15 0.15 0.15 unch 0.00 0.18 0.15Black Tusk Res 31 0.23 0.19 0.20 unch 0.00 0.29 0.13Blackheath Res V 2197 0.01 0.01 0.01 unch 0.00 0.07 0.01Blackrock Gold* O 505 0.04 0.03 0.04 - 0.01 0.12 0.03Blackrock Gold V 517 0.05 0.05 0.05 - 0.01 0.16 0.05Blind Crk Res V 177 0.05 0.05 0.05 - 0.01 0.38 0.05Blue Moon Zinc V 146 0.05 0.04 0.05 unch 0.00 0.14 0.04Blue Moon Zinc* O 46 0.03 0.00 0.03 - 0.00 0.11 0.03Blue Rvr Res V 557 0.03 0.02 0.02 - 0.01 0.05 0.01Blue Sky Uran* O 1411 0.14 0.10 0.13 + 0.03 0.25 0.10Blue Sky Uran V 2224 0.19 0.13 0.18 + 0.05 0.32 0.13Bluenose Gold V 742 0.16 0.00 0.16 + 0.01 0.33 0.00Bluestone Res* O 28 0.89 0.82 0.82 - 0.09 1.35 0.82Bluestone Res V 98 1.20 1.05 1.18 + 0.03 1.60 1.02Bold Ventures V 61 0.02 0.02 0.02 unch 0.00 0.05 0.02Bonanza Gldfds* O 429 0.00 0.00 0.00 + 0.00 0.00 0.00BonTerra Res V 347 3.14 2.73 3.09 + 0.19 6.30 2.73BonTerra Res* O 31 2.37 2.05 2.33 + 0.12 2.87 0.22Boreal Metals V 811 0.07 0.05 0.06 - 0.02 0.40 0.05Borneo Res Inv* O 32025 0.00 0.00 0.00 + 0.00 0.00 0.00Bravada Gold V 347 0.07 0.05 0.07 - 0.01 0.17 0.05Bravada Gold* O 128 0.06 0.04 0.05 + 0.01 0.14 0.04Braveheart Res V 1175 0.10 0.07 0.10 unch 0.00 0.12 0.06Braveheart Res* O 20 0.08 0.06 0.08 unch 0.00 0.08 0.05Bravo Multinat* O 79 0.95 0.47 0.62 + 0.07 2.70 0.02Brazil Mnrls* O 4781 0.00 0.00 0.00 + 0.00 0.01 0.00Brigadier Gold V 1077 0.10 0.07 0.10 + 0.01 0.26 0.07BrightRock Gld* O 102 0.00 0.00 0.00 + 0.00 0.01 0.00Britannia Mng* O 50 0.00 0.00 0.00 - 0.00 0.01 0.00Brixton Mtls V 970 0.18 0.14 0.15 - 0.02 0.49 0.14Brixton Mtls* O 23 0.14 0.12 0.12 + 0.00 0.39 0.11Broadway Gold V 338 0.09 0.07 0.09 + 0.01 0.51 0.06Broadway Gold* O 15 0.06 0.05 0.05 + 0.01 0.41 0.02Brookmount Exp* O 15980 0.02 0.01 0.01 + 0.01 0.04 0.00
Bryn Res* O 13 0.01 0.00 0.01 - 0.00 0.06 0.00BTU Metals V 1159 0.11 0.08 0.10 unch 0.00 0.14 0.04Buccaneer Gold V 118 0.03 0.03 0.03 - 0.01 0.18 0.03Buenaventura* N 4342 14.41 13.55 14.14 - 0.13 16.80 11.67Buffalo Coal * O 4 0.01 0.01 0.01 unch 0.00 0.01 0.00Buffalo Coal V 5 0.01 0.00 0.01 unch 0.00 0.03 0.01Bullfrog Gold* O 385 0.06 0.05 0.06 - 0.00 0.15 0.05Bullion Gld Res V 735 0.21 0.11 0.17 + 0.03 0.47 0.11Bunker Hill 29 0.09 0.06 0.09 unch 0.00 3.15 0.03BWR Explor V 490 0.04 0.04 0.04 + 0.01 0.10 0.03
CCabral Gold V 83 0.24 0.21 0.21 - 0.03 0.49 0.20Cabral Gold* O 26 0.18 0.15 0.15 unch 0.00 0.32 0.15Cache Expl* O 2 0.02 0.02 0.02 unch 0.00 0.06 0.02Cache Expl V 1106 0.04 0.04 0.04 - 0.01 0.09 0.04Cadillac Vent* O 4 0.02 0.02 0.02 unch 0.00 0.04 0.02Cadillac Vent V 239 0.02 0.01 0.02 + 0.01 0.05 0.01Cairo Res V 3 0.38 0.38 0.38 unch 0.00 0.43 0.30Caledonia Mng T 20 8.21 7.31 7.41 - 0.59 12.50 6.87Caledonia Mng* X 30 6.25 5.55 5.63 - 0.55 9.94 5.24Calibre Mng V 213 0.39 0.37 0.38 unch 0.00 1.45 0.30Calibre Mng* O 26 0.32 0.27 0.27 - 0.05 0.35 0.03California Gld V 115 0.33 0.28 0.31 + 0.01 0.47 0.19California Go* O 151 0.24 0.22 0.22 - 0.01 0.35 0.15Callinex Mines* O 59 0.08 0.06 0.07 + 0.01 0.37 0.06Callinex Mines V 253 0.10 0.08 0.09 unch 0.00 0.45 0.08Cameco Corp* N 9122 12.27 11.46 11.88 + 0.22 12.78 8.34Cameco Corp T 5259 16.29 15.22 15.77 + 0.22 16.70 10.50Cameo Cobalt* O 68 0.06 0.05 0.05 - 0.04 0.99 0.05Cameo Cobalt V 2579 0.09 0.07 0.08 unch 0.00 0.45 0.07Camino Mnls* O 12 0.08 0.07 0.07 - 0.00 0.45 0.07Camino Mnls V 188 0.13 0.11 0.11 - 0.02 0.60 0.10Camrova Res V 30 0.07 0.07 0.07 - 0.01 0.12 0.07Camrova Res* O 9 0.05 0.03 0.05 - 0.01 0.15 0.00Canada Coal V 119 0.05 0.04 0.04 - 0.02 0.12 0.04Canada Cobalt V 750 0.62 0.54 0.56 - 0.04 0.90 0.19Canada Cobalt * O 128 0.47 0.41 0.42 - 0.05 0.79 0.01Canada One* O 1 0.05 0.05 0.05 unch 0.00 0.32 0.05Canada One V 30 0.08 0.00 0.08 + 0.01 0.52 0.07CanAlaska Uran V 366 0.29 0.25 0.28 - 0.01 0.45 0.25CanAlaska Uran* O 176 0.21 0.19 0.21 - 0.01 0.37 0.19CanAm Coal* O 67 0.00 0.00 0.00 + 0.00 0.00 0.00Canamex Gold 373 0.07 0.05 0.05 - 0.02 0.17 0.05Canamex Gold* O 24 0.05 0.04 0.04 - 0.02 0.22 0.04Canarc Res T 171 0.05 0.04 0.04 unch 0.00 0.11 0.03Canarc Res* O 37 0.03 0.03 0.03 + 0.00 0.08 0.02Canasil Res V 302 0.07 0.06 0.06 - 0.01 0.19 0.06Candelaria Mg V 25 0.49 0.37 0.40 - 0.10 0.99 0.23Candente Coppr T 146 0.07 0.06 0.06 - 0.01 0.16 0.06Candente Gold* O 539 0.01 0.01 0.01 - 0.01 0.04 0.00Candente Gold V 959 0.03 0.02 0.02 unch 0.00 0.05 0.02CANEX Metals * O 0 0.00 0.00 0.02 unch 0.00 0.06 0.02CANEX Metals V 19 0.06 0.06 0.06 - 0.02 0.08 0.04CaNickel Mng V 1 0.00 0.00 0.08 unch 0.00 0.21 0.08Canstar Res V 207 0.09 0.00 0.09 unch 0.00 0.40 0.09Canstar Res* O 0 0.06 0.06 0.06 unch 0.00 0.19 0.06Canterra Mnls V 115 0.03 0.00 0.03 + 0.01 0.05 0.02Cantex Mn Dev V 141 0.69 0.58 0.61 - 0.18 1.10 0.15Cantex Mn Dev* O 1 0.51 0.00 0.51 - 0.08 0.77 0.01Canuc Res V 309 0.08 0.06 0.06 - 0.03 0.36 0.06Canuc Res* O 35 0.07 0.07 0.07 unch 0.00 0.27 0.06Capstone Mng T 6785 0.69 0.56 0.63 + 0.03 1.62 0.48Caracara Silvr* O 0 0.00 0.00 0.12 unch 0.00 0.14 0.06Cardero Res V 172 0.08 0.08 0.08 - 0.01 0.20 0.08Cardero Res* O 14 0.06 0.05 0.06 - 0.01 0.17 0.05Cardinal Res* O 2 0.31 0.31 0.31 unch 0.00 0.44 0.30Cardinal Res T 105 0.38 0.00 0.35 - 0.04 0.63 0.35Cariboo Rose V 36 0.03 0.00 0.03 unch 0.00 0.06 0.02Carlin Gold V 910 0.02 0.02 0.02 unch 0.00 0.04 0.02Carrara Explor 15666 0.09 0.07 0.07 - 0.02 0.17 0.03Cartier Iron 309 0.12 0.09 0.10 - 0.03 0.21 0.07Cartier Res V 681 0.17 0.11 0.14 unch 0.00 0.27 0.11Carube Copper V 211 0.05 0.05 0.05 - 0.01 0.10 0.05Carube Copper* O 9 0.05 0.03 0.05 unch 0.00 0.07 0.03Casa Minerals V 461 0.23 0.18 0.20 unch 0.00 0.24 0.07Cascadero Copp V 56 0.04 0.03 0.03 - 0.01 0.16 0.03Castle Peak Mg V 580 0.02 0.02 0.02 unch 0.00 0.03 0.02Cautivo Mining 23 0.15 0.15 0.15 - 0.01 0.61 0.08Cda Carbon* O 250 0.11 0.11 0.11 + 0.00 0.13 0.04Cda Carbon V 724 0.18 0.14 0.15 - 0.01 0.18 0.04Cda Rare Earth V 262 0.06 0.04 0.05 - 0.01 0.10 0.03Cda Rare Earth* O 35 0.04 0.00 0.04 - 0.01 0.08 0.02Cdn Metals* O 1 0.06 0.06 0.06 unch 0.00 0.06 0.06Cdn Metals 240 0.08 0.07 0.08 + 0.01 0.20 0.07Cdn Orebodies V 50 0.21 0.20 0.21 - 0.05 0.39 0.14CellCube Enrgy* O 717 0.29 0.20 0.20 - 0.07 0.60 0.11Centamin T 12 1.79 1.63 1.76 - 0.02 2.96 1.40Centaurus Diam* O 55 0.15 0.12 0.14 - 0.02 0.20 0.04Centenera Mng* O 499 0.04 0.03 0.04 + 0.01 0.17 0.01Centenera Mng V 700 0.06 0.04 0.05 - 0.01 0.21 0.04Centerra Gold T 1707 5.68 5.15 5.40 - 0.14 8.21 4.76Central Iron V 101 0.03 0.03 0.03 unch 0.00 0.07 0.02Central Tim Ex V 125 0.15 0.10 0.12 unch 0.00 0.20 0.10Centurion Mnls V 248 0.03 0.02 0.02 unch 0.00 0.04 0.01Century Cobalt* O 346 0.18 0.10 0.16 - 0.00 0.20 0.01Century Global* O 76 0.17 0.16 0.17 unch 0.00 0.24 0.13Century Global T 63 0.22 0.15 0.18 + 0.01 0.29 0.11Cerro de Pasc 424 0.28 0.25 0.27 - 0.01 0.37 0.22Cerro Grande 100 0.01 0.01 0.01 unch 0.00 0.03 0.01Cerro Mng V 0 0.00 0.00 0.18 unch 0.00 0.22 0.06Ceylon Graph V 40 0.18 0.00 0.15 - 0.01 0.26 0.14Chakana Copper V 417 0.30 0.25 0.29 unch 0.00 1.05 0.25Chakana Copper* O 140 0.23 0.19 0.21 - 0.01 0.79 0.19Chalice Gold M* O 221 0.12 0.10 0.10 - 0.01 0.15 0.10Chalice Gold M T 811 0.15 0.11 0.12 - 0.02 0.19 0.11Champion Bear V 111 0.22 0.22 0.22 - 0.01 0.23 0.10Champion Bear* O 20 0.17 0.17 0.17 - 0.00 0.18 0.10Champion Iron T 2149 1.23 1.16 1.21 + 0.01 1.52 1.05Champion Iron* O 86 0.90 0.88 0.90 - 0.02 1.18 0.84Chantrell Vent V 10 0.07 0.00 0.07 + 0.01 0.12 0.05Chatham Rock V 31 0.19 0.19 0.19 + 0.01 0.40 0.14Chesapeake Gld V 30 1.90 1.73 1.90 + 0.04 3.65 1.75Chesapeake Gld* O 58 1.50 1.30 1.41 - 0.09 2.94 1.29Chevron Corp* N 33501 119.73 114.02 118.94 + 5.34 133.88 107.54Chiboug Ind Mn V 145 0.06 0.05 0.06 + 0.01 0.08 0.05Chilean Metals* O 1 0.04 0.04 0.04 unch 0.00 0.12 0.02Chimata Gold 153 0.08 0.07 0.07 + 0.01 0.15 0.05China Gold Int T 428 1.81 1.73 1.80 + 0.02 3.19 1.59Cicada Vents V 30 0.01 0.01 0.01 unch 0.00 0.03 0.01CIM Intl Grp 7 0.21 0.00 0.19 - 0.02 0.35 0.17Cipher Res V 381 0.08 0.05 0.08 unch 0.00 0.17 0.05Claim Post Res V 8 1.40 1.07 1.31 - 0.01 3.98 0.90Clarmin Explor V 52 0.20 0.15 0.15 - 0.05 0.50 0.10Clean Comm V 1033 0.04 0.03 0.03 unch 0.00 0.21 0.03Clean Comm* O 367 0.03 0.02 0.03 unch 0.00 0.16 0.01Cleghorn Mnls V 8 0.10 0.10 0.10 unch 0.00 0.14 0.05Cleveland-Clif* N 52467 9.49 8.43 9.28 + 0.50 13.10 5.96Cliffmont Res V 3 0.18 0.18 0.18 unch 0.00 0.90 0.15Clifton Mng* O 166 0.07 0.07 0.07 - 0.00 0.10 0.05Cloud Peak En* N 10052 1.06 0.69 0.84 - 0.20 5.70 0.69Clydesdale Res V 178 0.05 0.02 0.03 + 0.01 0.15 0.02CMC Metals V 631 0.09 0.05 0.09 + 0.05 0.18 0.04CMX Gold & Sil 194 0.06 0.04 0.06 + 0.01 0.12 0.04CNRP Mng 1313 0.62 0.46 0.55 + 0.03 2.02 0.34CNRP Mng* O 1475 0.49 0.35 0.40 - 0.00 1.58 0.21Cobalt 27 Cap V 1653 5.40 4.55 4.70 - 0.56 14.00 4.55Cobalt Block V 107 0.14 0.10 0.12 - 0.01 0.40 0.02Cobalt Block* O 148 0.11 0.00 0.10 - 0.01 0.32 0.03Cobalt Pwr Grp* O 227 0.02 0.01 0.01 - 0.01 0.29 0.01Cobalt Pwr Grp V 1158 0.02 0.02 0.02 - 0.01 0.35 0.02Coeur Mng* N 13619 4.25 3.81 3.95 - 0.20 8.94 3.81Colibri Res V 606 0.04 0.03 0.04 + 0.01 0.13 0.03Colombia Crest V 3 0.06 0.00 0.06 unch 0.00 0.40 0.05Colombia Crest* O 0 0.00 0.00 0.04 unch 0.00 0.10 0.00Colonial Coal V 608 0.42 0.32 0.41 + 0.06 0.44 0.10Colorado Res V 846 0.07 0.07 0.07 unch 0.00 0.21 0.07Colorado Res* O 71 0.06 0.05 0.06 + 0.00 0.17 0.05Columbus Gold T 206 0.23 0.19 0.20 - 0.04 0.92 0.18Columbus Gold* O 165 0.17 0.14 0.15 - 0.02 0.73 0.14Comet Inds V 3 3.05 3.05 3.05 unch 0.00 3.60 2.60Commander Res V 348 0.09 0.08 0.09 unch 0.00 0.25 0.08Commander Res* O 0 0.06 0.06 0.06 unch 0.00 0.16 0.00Commerce Res V 252 0.07 0.06 0.06 unch 0.00 0.09 0.06Commerce Res* O 74 0.05 0.05 0.05 unch 0.00 0.07 0.04Compass Gold V 168 0.18 0.16 0.18 - 0.01 0.80 0.17Compliance Egy* O 50 0.00 0.00 0.00 unch 0.00 0.00 0.00Comstock Mng* X 2182 0.18 0.16 0.16 - 0.02 0.49 0.12Comstock Mtls V 756 0.03 0.03 0.03 - 0.01 0.10 0.03Comstock Mtls * O 1210 0.03 0.02 0.02 - 0.00 0.07 0.02Condor Gold* O 2 0.41 0.00 0.41 - 0.09 0.90 0.41Condor Gold T 1 0.00 0.00 0.46 unch 0.00 1.75 0.46Condor Res V 211 0.06 0.05 0.06 - 0.01 0.13 0.05Condor Res* O 100 0.05 0.04 0.05 unch 0.00 0.10 0.04Confedertn Ml* O 2 0.24 0.23 0.23 - 0.00 0.51 0.16Confedertn Mls V 11 0.36 0.31 0.32 + 0.01 0.77 0.20
20-22_DEC10_StockTables.indd 20 2018-12-04 1:39 PM

GLOBAL MINING NEWS THE NORTHERN MINER / DECEMBER 10–23, 2018 21
(100s) Week 12-month
Stock Exc Volume High Low Last Change High Low
(100s) Week 12-month
Stock Exc Volume High Low Last Change High Low
(100s) Week 12-month
Stock Exc Volume High Low Last Change High Low
(100s) Week 12-month
Stock Exc Volume High Low Last Change High Low
Leading Edge V 329 0.30 0.23 0.23 - 0.05 1.01 0.25Leagold Mg T 1484 1.55 1.33 1.47 + 0.05 3.25 1.28Leagold Mg* O 227 1.17 0.95 1.11 + 0.01 2.66 0.95Leeta Gold V 7023 0.37 0.27 0.30 - 0.02 4.05 0.27Leo Res* O 5 0.15 0.10 0.11 - 0.03 0.86 0.01Lepanto Con Mg* O 74 0.00 0.00 0.00 unch 0.00 0.01 0.00Levon Res Ltd T 172 0.15 0.12 0.13 - 0.01 0.39 0.12Levon Res Ltd * O 88 0.11 0.00 0.09 - 0.02 0.32 0.09Libero Copper V 190 0.10 0.07 0.09 + 0.02 0.15 0.07Liberty Gold* O 296 0.25 0.21 0.25 + 0.00 0.42 0.21Liberty One Li V 184 0.13 0.07 0.09 - 0.04 1.60 0.07Liberty One Li* O 654 0.10 0.05 0.06 - 0.03 1.28 0.05LiCo Energy* O 111 0.10 0.08 0.09 + 0.02 0.18 0.01LiCo Energy V 147 0.14 0.11 0.11 - 0.01 2.00 0.10Lincoln Mng V 412 0.02 0.02 0.02 - 0.01 0.05 0.01Lion One Mtls V 171 0.43 0.39 0.40 - 0.02 0.76 0.40Lion One Mtls* O 96 0.33 0.30 0.30 - 0.02 0.62 0.30Lions Bay Cap V 500 0.05 0.05 0.05 unch 0.00 0.17 0.04Lithium Amer T 576 5.36 4.80 5.05 - 0.06 13.84 4.00Lithium Amer* N 511 4.03 3.61 3.81 - 0.00 10.78 3.04Lithium Chile* O 79 0.45 0.38 0.41 - 0.03 0.97 0.38Lithium Chile V 111 0.58 0.52 0.53 - 0.08 1.35 0.52Lithium Corp* O 374 0.14 0.10 0.12 - 0.01 0.62 0.10Lithium Energi* O 1 0.21 0.21 0.21 - 0.00 0.57 0.18Lithium Energi V 25 0.28 0.25 0.26 unch 0.00 0.76 0.24Lithium Energy V 78 0.17 0.12 0.14 + 0.03 1.30 0.09Lithium Expl* O 721 0.01 0.01 0.01 + 0.00 0.13 0.01Lithoquest Dia V 526 0.20 0.14 0.16 - 0.04 0.88 0.14Lithoquest Dia* O 1 0.14 0.14 0.14 unch 0.00 0.51 0.14LKA Gold* O 13 0.14 0.12 0.14 + 0.01 0.30 0.05Logan Res* O 3 0.00 0.00 0.00 unch 0.00 0.03 0.00Lomiko Mtls* O 141 0.04 0.00 0.03 - 0.01 0.24 0.03Lomiko Mtls V 391 0.05 0.04 0.04 unch 0.00 0.31 0.04Loncor Res* O 10 0.06 0.06 0.06 unch 0.00 0.09 0.04Loncor Res T 35 0.09 0.09 0.09 - 0.01 0.14 0.06Lone Star Gold* O 260 0.01 0.01 0.01 + 0.00 0.03 0.00Lonmin plc* O 27 0.69 0.54 0.60 - 0.11 1.24 0.45Lonmin plc* O 0 0.00 0.00 0.63 unch 0.00 0.90 0.53Lorraine Coppr* O 64 0.10 0.09 0.09 - 0.00 0.12 0.01Lorraine Coppr V 261 0.13 0.11 0.12 - 0.01 0.19 0.07Los Andes Copp V 232 0.22 0.20 0.22 unch 0.00 0.39 0.20LSC Lithium* O 29 0.40 0.35 0.35 - 0.06 1.31 0.24Lucara Diam T 1453 1.97 1.78 1.89 - 0.03 2.91 1.78Lucky Mnls V 879 0.15 0.13 0.13 + 0.01 0.21 0.09Lucky Mnls * O 288 0.11 0.09 0.10 - 0.00 0.16 0.06Luckystrike * O 196 0.15 0.15 0.15 unch 0.00 0.35 0.15Luckystrike V 215 0.17 0.14 0.17 + 0.03 0.55 0.14Lumina Gold* O 52 0.41 0.36 0.40 + 0.03 0.67 0.36Lumina Gold V 500 0.55 0.47 0.51 + 0.01 0.85 0.46Luminex Res V 56 0.60 0.56 0.58 + 0.03 1.05 0.51Lundin Gold T 59 4.75 4.60 4.75 + 0.15 5.52 4.07Lundin Mng T 11904 5.87 5.12 5.79 + 0.35 9.21 4.70Lupaka Gold V 144 0.14 0.00 0.13 + 0.01 0.29 0.12Lydian Intl* O 79 0.08 0.05 0.05 - 0.03 0.50 0.05Lydian Intl T 2635 0.10 0.07 0.07 - 0.03 0.63 0.07Lynas Corp* O 343 1.54 1.48 1.53 + 0.01 2.20 0.20Lynas Corp* O 72 1.56 1.44 1.51 - 0.04 2.20 0.55
MM.P.V. Explor 625 0.08 0.07 0.07 - 0.02 0.30 0.07M2 Cobalt* O 2 0.19 0.17 0.17 - 0.02 0.61 0.17Macarthur Mnl V 753 0.03 0.02 0.03 unch 0.00 0.08 0.02Macarthur Mnl* O 34 0.01 0.01 0.01 - 0.00 0.06 0.01MacDonald Mns* O 19 0.03 0.02 0.03 + 0.01 0.09 0.02MacDonald Mns V 340 0.04 0.03 0.03 unch 0.00 0.14 0.03MAG Silver T 823 9.47 8.65 8.98 - 0.05 15.97 8.10Magellan Gold* O 1262 0.03 0.02 0.03 + 0.00 0.06 0.01Magna Terra V 150 0.05 0.03 0.03 - 0.01 0.06 0.03Majestic Gold* O 4 0.05 0.05 0.05 unch 0.00 0.08 0.03Majestic Gold V 466 0.07 0.06 0.07 - 0.01 0.11 0.04Makena Res* O 4 0.05 0.05 0.05 - 0.00 0.15 0.05Makena Res 136 0.06 0.00 0.05 unch 0.00 0.24 0.05Mako Mining V 186 0.18 0.16 0.16 - 0.02 0.29 0.15Mako Mining* O 49 0.13 0.00 0.13 + 0.02 0.23 0.00Mammoth Res V 281 0.04 0.03 0.03 unch 0.00 0.16 0.03Manado Gold V 220 0.04 0.04 0.04 + 0.01 0.17 0.04Mandalay Res T 630 0.07 0.06 0.07 unch 0.00 0.31 0.05Mandalay Res* O 261 0.06 0.04 0.05 - 0.00 0.24 0.03Manganese X* O 100 0.10 0.09 0.09 - 0.01 0.21 0.09Manganese X V 841 0.14 0.11 0.12 - 0.03 0.28 0.11Mangazeya Mng V 246 0.03 0.02 0.02 - 0.01 0.05 0.02Manitou Gold V 1729 0.06 0.04 0.05 - 0.01 0.19 0.04Manitou Gold * O 4 0.05 0.05 0.05 unch 0.00 0.15 0.03Maple Gold V 702 0.10 0.09 0.10 - 0.01 0.34 0.09Maple Gold* O 781 0.08 0.07 0.08 + 0.00 0.27 0.07Marathon Gold* O 84 0.54 0.51 0.54 + 0.00 1.03 0.49Marathon Gold T 543 0.73 0.67 0.71 unch 0.00 1.28 0.65Margaret Lake V 175 0.04 0.04 0.04 unch 0.00 0.16 0.03Margaux Res V 413 0.06 0.04 0.04 - 0.01 0.35 0.04Margaux Res* O 10 0.04 0.04 0.04 unch 0.00 0.24 0.01Marifil Mines* O 53 0.08 0.06 0.06 - 0.01 0.17 0.01Marifil Mines V 112 0.10 0.08 0.08 - 0.02 0.32 0.08Maritime Res V 1103 0.10 0.09 0.10 + 0.02 0.14 0.07Marlin Gold V 24 0.13 0.12 0.12 unch 0.00 1.02 0.11Martina Mnls V 0 0.00 0.00 0.04 unch 0.00 0.07 0.03MartinMarietta* N 4468 199.12 188.27 190.69 + 3.99 241.33 150.75Mas Gold V 6 0.06 0.06 0.06 unch 0.00 0.15 0.06Mason Graphite* O 204 0.49 0.40 0.43 - 0.02 2.25 0.34Mason Graphite V 413 0.65 0.54 0.56 - 0.04 2.87 0.44Mason Res* O 23 0.30 0.29 0.29 - 0.02 0.31 0.11Mason Res T 743 0.40 0.40 0.40 unch 0.00 0.40 0.14Matachewan Con V 5 0.16 0.16 0.16 unch 0.00 0.30 0.15Matica Ent* O 47 0.10 0.08 0.08 - 0.00 0.64 0.08Matica Ent 1741 0.13 0.11 0.12 unch 0.00 0.81 0.10Maudore Mnrls* O 174 0.00 0.00 0.00 unch 0.00 0.00 0.00Maverix Metals V 20 2.56 2.31 2.40 + 0.01 2.85 1.33Maverix Metals* O 16 1.95 1.73 1.78 - 0.06 2.10 1.03Mawson Res T 72 0.29 0.22 0.22 - 0.02 0.63 0.22Mawson Res* O 17 0.19 0.19 0.19 - 0.00 0.48 0.17MaxTech Vent* O 304 0.17 0.10 0.16 + 0.06 0.48 0.07MaxTech Vent 413 0.22 0.14 0.19 + 0.04 0.60 0.10Maxwell Res* O 387 0.00 0.00 0.00 + 0.00 0.01 0.00Maya Gold &Sil* O 28 1.58 1.25 1.25 - 0.27 2.35 1.10Maya Gold &Sil T 153 2.10 1.65 1.97 - 0.02 3.02 1.36Mazarin V 132 0.12 0.00 0.12 + 0.03 0.18 0.04MBMI Res* O 1 0.02 0.02 0.02 unch 0.00 0.09 0.00MBMI Res V 76 0.03 0.03 0.03 - 0.01 0.13 0.03McChip Res V 9 0.89 0.89 0.89 unch 0.00 0.89 0.50McEwen Mng T 701 2.43 2.25 2.35 - 0.07 3.28 2.24McEwen Mng* N 7218 1.84 1.69 1.76 - 0.05 2.55 1.68McLaren Res 94 0.03 0.03 0.03 + 0.01 0.19 0.02MDN Inc* O 5 0.22 0.22 0.22 unch 0.00 0.28 0.13Meadow Bay Gd 37 0.04 0.04 0.04 unch 0.00 0.26 0.03Meadow Bay Gd* O 5 0.03 0.03 0.03 unch 0.00 0.28 0.03Mechel* N 673 2.82 2.51 2.54 - 0.20 5.60 2.30Medallion Res V 221 0.12 0.10 0.11 - 0.02 0.18 0.08Medallion Res* O 88 0.10 0.07 0.08 - 0.02 0.14 0.06Medgold Res V 240 0.16 0.14 0.14 - 0.01 0.51 0.14Medgold Res* O 55 0.12 0.12 0.12 + 0.01 0.38 0.11Medinah Mnrls* O 6092 0.00 0.00 0.00 - 0.00 0.01 0.00Mega Copper V 1 0.16 0.16 0.16 unch 0.00 0.18 0.16Mega Uranium* O 68 0.10 0.00 0.09 + 0.00 0.19 0.08Mega Uranium T 1670 0.14 0.12 0.13 + 0.01 0.24 0.11Megastar Dev V 6 0.04 0.04 0.04 unch 0.00 0.11 0.04MegumaGold* O 33 0.16 0.15 0.16 unch 0.00 0.24 0.09MegumaGold 301 0.24 0.18 0.20 - 0.04 0.30 0.12Melior Res V 2 0.57 0.00 0.56 - 0.01 1.50 0.56Melkior Res V 312 0.07 0.06 0.07 + 0.01 0.11 0.04Merger Mines* O 0 0.00 0.00 25.00 unch 0.00 Meridian Mg V 90 0.08 0.07 0.07 - 0.01 1.28 0.05Meryllion Res 38 0.02 0.00 0.02 - 0.01 0.21 0.02MetalCorp V 91 0.02 0.01 0.02 unch 0.00 0.04 0.01Metalex Vent V 70 0.03 0.03 0.03 + 0.01 0.10 0.02Metalla Rylty* O 238 0.62 0.57 0.60 - 0.02 0.71 0.42Metalla Rylty V 267 0.81 0.77 0.80 - 0.01 0.88 0.62Metallic Mnrls V 130 0.20 0.16 0.18 - 0.02 0.50 0.16Metallic Mnrls* O 127 0.15 0.12 0.14 + 0.00 0.40 0.12Metallica Min* O 9 0.03 0.02 0.02 unch 0.00 0.05 0.02Metallis Res V 180 0.72 0.58 0.68 + 0.01 2.05 0.49Metalo Manuf 6 0.25 0.20 0.20 - 0.05 0.57 0.15Metalore Res V 1 2.02 1.81 2.01 + 0.20 3.14 1.77Metals Creek* O 59 0.04 0.02 0.04 + 0.02 0.08 0.02Metals Creek V 339 0.06 0.04 0.06 + 0.02 0.11 0.04Metals X* O 12 0.29 0.27 0.29 + 0.02 0.96 0.27Metron Capital V 10 0.06 0.06 0.06 unch 0.00 0.08 0.05Mexican Gold* O 190 0.14 0.12 0.12 - 0.02 0.34 0.12Mexus Gold* O 1829 0.01 0.01 0.01 unch 0.00 0.07 0.01MGX Minerals* O 2137 0.48 0.32 0.35 - 0.14 1.58 0.32MGX Minerals 2901 0.62 0.42 0.45 - 0.17 1.96 0.42Midas Gold T 329 0.66 0.63 0.63 - 0.03 1.21 0.55Midas Gold* O 655 0.51 0.47 0.48 - 0.01 0.95 0.42Midasco Cap V 74 0.10 0.09 0.09 unch 0.00 0.15 0.07Midland Expl V 103 0.90 0.81 0.90 + 0.01 1.41 0.66Midnight Star 27 0.30 0.27 0.27 - 0.04 0.40 0.11Midnight Sun V 178 0.14 0.12 0.14 + 0.01 0.48 0.10Millennial Lit* O 70 1.23 1.08 1.13 - 0.03 3.87 1.07Millennial Lit V 197 1.62 1.46 1.51 + 0.01 4.80 1.38Millrock Res* O 212 0.10 0.07 0.09 + 0.01 0.31 0.07Millrock Res V 397 0.13 0.10 0.12 unch 0.00 0.40 0.10Minaurum Gold V 651 0.51 0.46 0.48 - 0.03 0.67 0.21Minaurum Gold* O 195 0.40 0.35 0.36 - 0.02 0.52 0.16Minco Silver* O 45 0.36 0.34 0.36 + 0.02 0.77 0.33
Highland Copp* O 47 0.08 0.07 0.07 - 0.00 0.13 0.04Highway 50 Gld V 57 0.23 0.19 0.19 - 0.04 0.48 0.21HiHo Silver 184 0.05 0.04 0.05 + 0.01 0.14 0.03Hinterland Mtl V 373 0.03 0.03 0.03 - 0.01 0.05 0.02Hochschild Mg* O 15 2.10 0.00 2.10 - 0.07 3.55 1.96Honey Badger E V 313 0.04 0.04 0.04 unch 0.00 0.20 0.04Horizonte Mnls T 474 0.04 0.03 0.04 unch 0.00 0.11 0.03Hornby Bay Mnl V 117 0.03 0.03 0.03 - 0.01 0.08 0.00HudBay Mnls* N 4475 5.28 4.66 5.08 + 0.24 10.25 3.44HudBay Mnls T 7312 7.00 6.20 6.74 + 0.29 12.65 4.51Hudson Res V 216 0.46 0.42 0.44 + 0.02 0.64 0.38Hudson Res* O 39 0.35 0.31 0.34 - 0.00 0.52 0.29Hunt Mng* O 48 0.11 0.11 0.11 unch 0.00 0.41 0.10Hunt Mng V 4 0.15 0.00 0.15 + 0.02 0.51 0.13Hut 8 Mining* O 112 1.54 1.24 1.37 - 0.13 3.74 1.24Hut 8 Mining V 242 2.02 1.61 1.85 - 0.17 5.00 0.05Hybrid Mineral V 70 0.11 0.09 0.09 - 0.01 0.55 0.06Hycroft Mg* O 270 0.01 0.01 0.01 unch 0.00 0.07 0.01
I-J-KI-Minerals V 92 0.18 0.15 0.15 - 0.02 0.35 0.14I-Minerals* O 57 0.12 0.12 0.12 unch 0.00 0.28 0.12IAMGOLD* N 17979 3.30 3.00 3.05 - 0.16 6.52 2.75IAMGOLD T 5796 4.34 4.00 4.03 - 0.23 8.20 3.64Iconic Mnls * O 87 0.10 0.08 0.08 - 0.01 0.28 0.05Iconic Mnls V 411 0.13 0.11 0.11 - 0.01 0.43 0.05IDM Mining* O 587 0.05 0.04 0.04 - 0.00 0.10 0.03IDM Mining V 7439 0.06 0.06 0.06 + 0.01 0.12 0.04IEMR Res V 14 0.02 0.02 0.02 unch 0.00 0.05 0.02iMetal Res V 2345 0.13 0.11 0.12 + 0.01 0.18 0.07iMetal Res* O 136 0.10 0.09 0.09 + 0.00 0.12 0.05IMPACT Silver V 607 0.24 0.20 0.21 - 0.04 0.56 0.20Imperial Metal T 293 1.65 1.11 1.21 + 0.08 3.47 0.93Imperial Metal* O 9 1.19 0.87 0.92 + 0.01 2.77 0.72Imperial Mg Gr V 198 0.08 0.07 0.08 unch 0.00 0.27 0.05Inca One Gold* O 10 0.04 0.03 0.04 + 0.00 0.09 0.03Inca One Gold V 515 0.05 0.04 0.04 unch 0.00 0.11 0.04Inception Mng * O 34 0.12 0.11 0.12 unch 0.00 0.33 0.05Independence G* O 1 0.03 0.00 0.03 - 0.00 0.10 0.03Independence G V 142 0.06 0.05 0.06 + 0.01 0.14 0.04Indiana Res* O 5 0.03 0.03 0.03 unch 0.00 0.06 0.03Indico Res V 330 0.01 0.01 0.01 unch 0.00 0.03 0.01Indigo Expl V 364 0.02 0.01 0.02 + 0.01 0.04 0.01Infinite Lith V 63 0.14 0.00 0.12 - 0.02 0.45 0.09Infinite Lith* O 13 0.11 0.09 0.09 - 0.02 0.34 0.08Inform Res V 60 0.07 0.00 0.07 - 0.01 0.31 0.07Inomin Mines V 22 0.05 0.05 0.05 unch 0.00 0.20 0.03Intact Gold V 175 0.07 0.06 0.06 - 0.01 1.18 0.06Integra Res* O 30 0.57 0.52 0.55 + 0.01 1.83 0.05Integra Res V 515 0.75 0.69 0.70 unch 0.00 1.40 0.68Inter-Rock Mnl V 170 0.25 0.20 0.21 - 0.02 0.59 0.20Intercontinent V 1534 0.25 0.20 0.25 + 0.04 0.65 0.14Intercontinent* O 168 0.16 0.15 0.16 unch 0.00 0.47 0.12Intgr Egy Sol* O 80624 0.00 0.00 0.00 + 0.00 0.00 0.00Intl Battery* O 276 0.14 0.11 0.13 - 0.01 0.69 0.10Intl Battery 285 0.19 0.15 0.17 - 0.02 0.89 0.13Intl Bethl Mng* O 13 0.02 0.02 0.02 unch 0.00 0.13 0.02Intl Bethl Mng V 307 0.05 0.04 0.05 + 0.01 0.17 0.03Intl Cobalt* O 137 0.05 0.03 0.03 - 0.02 0.31 0.04Intl Cobalt 687 0.06 0.04 0.05 - 0.02 0.45 0.05Intl Corona V 275 0.05 0.03 0.03 - 0.02 0.08 0.03Intl Lithium* O 88 0.05 0.04 0.04 - 0.00 0.18 0.04Intl Lithium V 363 0.06 0.05 0.05 - 0.01 0.23 0.05Intl Montoro* O 1 0.03 0.03 0.03 unch 0.00 0.06 0.03Intl Montoro V 202 0.05 0.05 0.05 unch 0.00 0.08 0.04Intl Prospect * O 15 0.11 0.11 0.11 + 0.02 0.25 0.10Intl Prospect V 16 0.20 0.15 0.20 + 0.01 0.38 0.12Intl Samuel Ex V 823 0.05 0.04 0.05 + 0.01 0.22 0.03Intl Star* O 30796 0.00 0.00 0.00 unch 0.00 0.00 0.00Intl Tower Hil* X 368 0.41 0.35 0.39 - 0.01 0.78 0.29Intl Tower Hil T 30 0.54 0.48 0.52 unch 0.00 0.99 0.38Intrepid Pots* N 2330 3.60 3.29 3.32 - 0.13 5.31 3.12INV Metals* O 3 0.32 0.32 0.32 - 0.00 0.61 0.26INV Metals T 78 0.45 0.42 0.45 unch 0.00 0.85 0.35Inventus Mg V 79 0.15 0.14 0.15 + 0.01 0.34 0.11Inventus Mg * O 100 0.09 0.09 0.09 unch 0.00 0.27 0.08InZinc Mining* O 144 0.04 0.04 0.04 - 0.00 0.19 0.03InZinc Mining V 686 0.06 0.05 0.05 unch 0.00 0.24 0.04Ireland* O 343 0.10 0.06 0.10 + 0.00 0.19 0.05Ironside Res V 200 0.14 0.14 0.14 unch 0.00 0.16 0.08Ironside Res * O 0 0.00 0.00 0.06 unch 0.00 0.12 0.06Irving Res 867 1.87 1.36 1.69 + 0.34 1.87 0.66Irving Res* O 644 1.42 1.05 1.27 + 0.25 1.42 0.52IsoEnergy Ltd V 182 0.44 0.38 0.42 + 0.02 0.73 0.27Itafos* O 132 0.91 0.00 0.87 - 0.06 2.25 0.87Itafos V 101 1.20 1.02 1.15 - 0.05 2.90 1.00Itoco Inc* O 0 0.00 0.00 0.20 unch 0.00 0.57 0.02Ivanhoe Mines* O 657 1.99 1.83 1.96 + 0.04 3.60 1.53Ivanhoe Mines T 3368 2.65 2.44 2.65 + 0.11 4.54 2.00Jade Leader* O 0 0.00 0.00 0.23 unch 0.00 0.38 0.14Jade Leader V 224 0.25 0.20 0.25 + 0.04 0.50 0.18Jaeger Res V 7 0.03 0.00 0.03 unch 0.00 0.05 0.02Jaguar Mng T 1421 0.21 0.18 0.19 - 0.02 0.41 0.18Jaguar Mng* O 571 0.15 0.00 0.14 - 0.02 0.33 0.13Japan Gold V 581 0.17 0.11 0.17 + 0.06 0.35 0.07Japan Gold* O 175 0.13 0.09 0.13 + 0.04 0.28 0.06Jasper Mng V 509 0.10 0.09 0.10 unch 0.00 0.29 0.07Jaxon Mining* O 89 0.08 0.05 0.07 unch 0.00 0.24 0.05Jaxon Mining V 1064 0.10 0.08 0.08 unch 0.00 0.29 0.07Jayden Res* O 0 0.00 0.00 0.08 unch 0.00 0.10 0.06Jayden Res V 150 0.13 0.12 0.13 unch 0.00 0.19 0.08Jiulian Res V 59 0.13 0.07 0.10 unch 0.00 0.18 0.02Jourdan Res V 146 0.05 0.04 0.05 unch 0.00 0.13 0.03Jubilee Gold V 0 0.00 0.00 0.64 unch 0.00 0.70 0.40Jubilee Metals* O 995 0.03 0.03 0.03 unch 0.00 0.06 0.03Juggernaut Exp V 1028 0.14 0.12 0.14 - 0.01 0.59 0.10Juggernaut Exp* O 103 0.11 0.10 0.10 - 0.00 1.10 0.10Jupiter Gold* O 0 0.00 0.00 2.25 unch 0.00 2.25 2.00K2 Gold V 146 0.20 0.17 0.17 - 0.03 0.33 0.17K92 Mng Inc* O 497 0.55 0.51 0.54 - 0.01 0.79 0.31K92 Mng Inc V 756 0.72 0.67 0.72 + 0.02 1.04 0.41Kaizen Discov V 760 0.05 0.05 0.05 unch 0.00 0.13 0.05Kapuskasing Gd* O 50 0.01 0.01 0.01 unch 0.00 0.03 0.01Kapuskasing Gd V 224 0.02 0.01 0.02 unch 0.00 0.04 0.01Karmin Expl V 58 0.79 0.71 0.71 - 0.07 1.10 0.62Karnalyte Res T 66 0.31 0.23 0.24 - 0.03 0.61 0.19Karoo Expl V 715 0.11 0.07 0.11 + 0.04 1.10 0.06KAT Expl* O 357704 0.00 0.00 0.00 + 0.00 0.00 0.00Katanga Mng T 1421 0.53 0.43 0.50 + 0.04 2.83 0.36Kenadyr Mining V 161 0.10 0.10 0.10 - 0.01 0.21 0.08Kenadyr Mining* O 25 0.06 0.06 0.06 unch 0.00 0.16 0.05Kermode Res V 1189 0.02 0.01 0.02 unch 0.00 0.03 0.01Kerr Mines* O 59 0.10 0.09 0.10 - 0.00 0.28 0.09Kerr Mines T 307 0.13 0.12 0.13 + 0.01 0.34 0.12Kesselrun Res V 287 0.05 0.04 0.04 + 0.01 0.15 0.04Kestrel Gold V 263 0.02 0.02 0.02 - 0.01 0.07 0.02Khan Res 174 0.06 0.06 0.06 unch 0.00 0.18 0.05Kilo Goldmines* O 130 0.02 0.01 0.01 - 0.01 0.06 0.01Kilo Goldmines V 3437 0.03 0.02 0.02 - 0.01 0.07 0.01Kincora Copper* O 110 0.08 0.00 0.08 - 0.04 0.23 0.10Kincora Copper V 135 0.14 0.10 0.10 - 0.03 0.32 0.11Kings Bay Res V 264 0.04 0.04 0.04 + 0.01 0.14 0.03Kingsmen Res V 31 0.35 0.00 0.33 + 0.04 0.38 0.10Kingsmen Res* O 11 0.25 0.00 0.25 + 0.03 0.29 0.07Kinross Gold T 15740 3.77 3.34 3.60 + 0.04 5.90 3.15Kinross Gold* N 60748 2.84 2.50 2.71 unch 0.00 4.78 2.38Kintavar Exp V 1933 0.15 0.11 0.14 - 0.01 0.65 0.10Kirkland Lake* N 4218 20.79 18.94 20.78 + 1.23 23.86 13.03Kirkland Lake T 3105 27.64 25.23 27.54 + 1.71 30.94 16.54Klondike Gold* O 230 0.15 0.13 0.15 + 0.01 0.34 0.13Klondike Gold V 657 0.20 0.18 0.19 + 0.01 0.44 0.18Klondike Silv* O 0 0.00 0.00 0.04 unch 0.00 0.08 0.02Klondike Silv V 274 0.06 0.05 0.05 - 0.01 0.10 0.04Knick Expl V 1745 0.01 0.00 0.01 unch 0.00 0.03 0.01Kombat Copper V 48 0.07 0.07 0.07 - 0.01 0.41 0.07Komet Resource V 192 0.22 0.18 0.22 + 0.02 0.48 0.16Kootenay Silvr* O 114 0.11 0.08 0.10 + 0.01 0.20 0.08Kootenay Silvr V 613 0.14 0.11 0.13 + 0.01 0.25 0.11Kootenay Zinc 686 0.08 0.05 0.06 unch 0.00 0.90 0.05Kootenay Zinc* O 31 0.06 0.03 0.05 - 0.00 0.66 0.03Kore Mining V 50 0.15 0.14 0.14 unch 0.00 5.00 0.14Kutcho Copper * O 87 0.22 0.19 0.19 - 0.02 0.84 0.19KWG Res 535 0.02 0.00 0.01 unch 0.00 0.02 0.01
LLabdr Iron Mns* O 111 0.00 0.00 0.00 - 0.00 0.11 0.00Labrador Gold V 279 0.17 0.16 0.17 + 0.01 0.35 0.16Labrador Iron T 2065 30.05 25.80 26.59 - 3.56 31.36 20.44Lara Expl V 113 0.52 0.48 0.48 - 0.07 0.88 0.48Laramide Res T 1905 0.49 0.37 0.49 + 0.12 0.55 0.24Laredo Res* O 1966 0.01 0.01 0.01 + 0.00 0.05 0.00Largo Res T 19858 3.69 2.75 3.66 + 0.06 4.65 0.83Largo Res* O 7738 2.81 2.07 2.76 + 0.02 3.56 0.64Lateral Gold V 170 0.40 0.28 0.40 + 0.11 0.94 0.28Latin Am Mnls V 483 0.02 0.02 0.02 unch 0.00 0.15 0.02Latin Am Mnls* O 25 0.02 0.02 0.02 unch 0.00 0.11 0.01Laurion Mnl Ex* O 20 0.06 0.06 0.06 unch 0.00 0.08 0.02Laurion Mnl Ex V 207 0.09 0.07 0.09 + 0.01 0.11 0.03Le Mare Gold* O 5 0.07 0.06 0.06 - 0.01 0.63 0.00LeadFX Inc* O 6 0.73 0.00 0.73 - 0.04 1.57 0.65Leading Edge* O 286 0.22 0.18 0.18 - 0.03 0.80 0.19
Endeavour Mng* O 31 13.81 12.47 12.47 - 1.74 21.72 12.58Endeavr Silver* N 3601 1.98 1.76 1.85 - 0.08 3.35 1.76Endeavr Silver T 711 2.61 2.35 2.47 - 0.12 4.40 2.35Endurance Gold V 75 0.04 0.03 0.03 - 0.01 0.09 0.03Energy Fuels* X 3402 3.32 2.99 3.28 + 0.15 4.09 1.49Energy Fuels T 832 4.41 3.97 4.36 + 0.19 5.38 1.82Enforcer Gold* O 145 0.02 0.02 0.02 unch 0.00 0.07 0.02Enforcer Gold V 427 0.09 0.07 0.08 + 0.01 0.30 0.07Engineer Gold V 25 0.08 0.08 0.08 unch 0.00 0.12 0.08Engold Mines V 453 0.13 0.10 0.13 + 0.01 0.28 0.09Engold Mines* O 112 0.10 0.08 0.10 + 0.00 0.21 0.08Ensurge* O 110 0.04 0.03 0.03 - 0.02 0.09 0.02Entree Res* X 170 0.42 0.39 0.40 - 0.01 0.69 0.33Entree Res T 294 0.55 0.51 0.53 - 0.01 0.85 0.42ePower Metals* O 2 0.17 0.00 0.17 unch 0.00 0.55 0.12ePower Metals V 304 0.21 0.20 0.20 unch 0.00 0.75 0.14Equinox Gold V 1860 0.93 0.85 0.91 unch 0.00 1.39 0.85Equitorial Ex V 1532 0.05 0.04 0.05 + 0.01 0.14 0.02Erdene Res Dev T 561 0.24 0.21 0.24 + 0.01 0.61 0.21Erdene Res Dev* O 163 0.18 0.16 0.18 + 0.01 0.49 0.16Erin Ventures V 690 0.20 0.12 0.15 + 0.01 0.33 0.09Erin Ventures* O 3 0.11 0.11 0.11 + 0.01 0.23 0.08Ero Copper* O 1 7.80 7.22 7.22 - 0.58 9.17 5.00Ero Copper T 390 10.10 8.98 9.74 - 0.11 12.35 6.39Eros Res Corp* O 112 0.06 0.05 0.05 - 0.01 0.18 0.05Eros Res Corp V 2179 0.08 0.00 0.07 - 0.01 0.23 0.07Eros Res Corp V 2179 0.08 0.00 0.07 - 0.01 0.23 0.07Eskay Mng V 246 0.14 0.08 0.13 + 0.04 0.38 0.08Essex Minerals V 114 0.08 0.06 0.06 - 0.02 0.22 0.07Ethos Gold* O 51 0.17 0.15 0.17 + 0.02 0.23 0.09Ethos Gold V 273 0.25 0.19 0.23 + 0.02 0.30 0.12Euro Manganese V 1374 0.22 0.17 0.22 + 0.02 0.25 0.15Euro Sun Mg* O 20 0.51 0.00 0.44 - 0.07 1.40 0.42Euro Sun Mg T 327 0.70 0.56 0.56 - 0.12 1.82 0.55EurOmax Res* O 9 0.11 0.08 0.08 - 0.02 0.24 0.01EurOmax Res T 204 0.13 0.11 0.12 - 0.01 0.31 0.02European Elect* O 947 0.14 0.11 0.12 - 0.01 0.79 0.09European Elect V 838 0.19 0.16 0.16 - 0.02 0.93 0.12European Metal* O 1846 0.00 0.00 0.00 - 0.00 0.01 0.00Eurotin V 334 0.04 0.03 0.04 + 0.01 0.13 0.01Everton Res V 597 0.04 0.00 0.03 unch 0.00 0.06 0.02Everton Res* O 6 0.02 0.02 0.02 unch 0.00 0.05 0.02Evrim Res V 328 1.33 1.24 1.26 - 0.01 1.70 0.20Excellon Res T 239 0.77 0.69 0.72 - 0.07 2.15 0.68Excellon Res* O 129 0.56 0.52 0.53 - 0.06 1.72 0.52Excelsior Mng* O 145 0.75 0.69 0.71 - 0.03 1.21 0.62Excelsior Mng T 450 1.00 0.92 0.95 - 0.03 1.50 0.82ExGen Res Inc V 99 0.02 0.02 0.02 - 0.01 0.03 0.01Explor Res* O 102 0.02 0.01 0.02 + 0.00 0.06 0.01Explor Res V 635 0.02 0.02 0.02 unch 0.00 0.07 0.02Explorex Res 326 0.34 0.32 0.34 + 0.03 0.65 0.23Explorex Res* O 50 0.22 0.22 0.22 unch 0.00 0.31 0.19Fabled Copper V 44 0.09 0.08 0.09 unch 0.00 0.09 0.04Fairmont Res* O 5 0.00 0.00 0.00 unch 0.00 0.10 0.00Falco Res V 804 0.35 0.31 0.32 - 0.01 1.13 0.29Falco Res * O 10 0.25 0.23 0.23 + 0.00 0.89 0.18Falcon Gold V 168 0.04 0.03 0.04 + 0.01 0.08 0.03Fancamp Expl V 302 0.06 0.06 0.06 - 0.01 0.18 0.06Far Res 1137 0.09 0.08 0.08 - 0.01 1.10 0.07Far Res* O 225 0.07 0.05 0.05 - 0.01 0.88 0.05Fengro Industr V 121 0.08 0.05 0.06 - 0.02 0.26 0.06Filo Mg Corp V 22 2.30 2.25 2.25 unch 0.00 2.75 2.00Finlay Minrls V 80 0.03 0.03 0.03 unch 0.00 0.12 0.02Fiore Gold* O 718 0.29 0.22 0.22 - 0.04 0.95 0.16Fiore Gold V 709 0.38 0.28 0.29 - 0.03 1.18 0.21Fire River Gol* O 0 0.00 0.00 0.00 unch 0.00 2.41 0.00Firebird Res V 58 0.03 0.00 0.03 unch 0.00 0.09 0.02Firesteel Res V 571 0.12 0.10 0.10 - 0.01 0.17 0.07Firesteel Res* O 63 0.09 0.08 0.08 - 0.00 0.12 0.08Firestone Vent V 64 0.07 0.07 0.07 + 0.01 0.19 0.05Fireweed Zinc V 41 0.90 0.00 0.88 - 0.02 2.14 0.74Fireweed Zinc* O 3 0.68 0.65 0.65 - 0.05 1.67 0.56Firma Holdings* O 178 0.03 0.02 0.02 + 0.00 0.13 0.01First Bauxite V 33 0.04 0.04 0.04 unch 0.00 0.06 0.02First Cobalt * O 493 0.20 0.17 0.17 - 0.02 1.29 0.14First Cobalt V 1606 0.25 0.23 0.23 - 0.02 1.58 0.19First Colombia* O 12393 0.00 0.00 0.00 + 0.00 0.00 0.00First Energy V 8 0.25 0.00 0.25 unch 0.00 0.43 0.10First Energy* O 0 0.00 0.00 0.17 unch 0.00 0.32 0.10First Legacy V 65 0.22 0.20 0.22 unch 0.00 0.25 0.12First Majestic* N 15065 5.16 4.59 4.80 - 0.29 8.48 4.66First Majestic T 3410 6.81 6.12 6.38 - 0.38 11.09 6.21First Mexican V 517 0.02 0.02 0.02 unch 0.00 0.07 0.01First Mg Fin T 1404 0.28 0.26 0.26 - 0.02 0.64 0.25First Mg Fin * O 1609 0.21 0.19 0.20 - 0.01 0.51 0.18First Point* O 34 0.08 0.08 0.08 - 0.01 0.13 0.06First Quantum T 13437 12.93 11.15 12.20 + 0.40 23.05 10.55First Vanadium V 848 1.21 0.94 1.10 - 0.06 1.96 0.22First Vanadium* O 435 0.93 0.71 0.82 - 0.09 1.60 0.18Fission 3.0 V 1137 0.29 0.15 0.28 + 0.10 0.30 0.08Fission 3.0* O 146 0.21 0.11 0.21 + 0.08 0.22 0.02Fission Uran* O 978 0.50 0.43 0.49 + 0.02 0.72 0.43Fission Uran T 1995 0.66 0.58 0.64 + 0.02 0.89 0.57Five Star Diam V 112 0.08 0.06 0.06 - 0.01 0.25 0.06Fjordland Exp* O 60 0.10 0.08 0.08 - 0.00 0.25 0.06Fjordland Exp V 73 0.12 0.10 0.10 - 0.03 0.38 0.09Focus Graphite* O 1748 0.03 0.02 0.03 + 0.01 0.08 0.01Focus Graphite V 2562 0.04 0.03 0.04 + 0.01 0.10 0.02Foran Mng V 26 0.32 0.29 0.30 - 0.02 0.62 0.23Forsys Metals T 743 0.25 0.19 0.25 + 0.02 0.32 0.09Fort St J Nick V 205 0.30 0.21 0.24 - 0.07 0.59 0.15Fortescue Met* O 56 2.95 2.80 2.95 + 0.11 4.30 2.53Fortuna Silvr T 2157 4.60 4.22 4.27 - 0.21 7.78 4.22Fortuna Silvr* N 3757 3.48 3.16 3.21 - 0.18 6.08 3.16Fortune Bay V 3 0.22 0.00 0.21 - 0.01 0.50 0.21Fortune Bay* O 8 0.15 0.00 0.15 - 0.01 0.41 0.10Fortune Mnrls* O 139 0.09 0.07 0.07 - 0.00 0.33 0.00Fortune Mnrls T 653 0.12 0.11 0.11 - 0.01 0.38 0.09Forum Energy V 100 0.05 0.05 0.05 unch 0.00 0.09 0.04Forum Energy* O 250 0.04 0.04 0.04 unch 0.00 0.07 0.03Four Nines 65 0.22 0.22 0.22 unch 0.00 0.80 0.10Fox River Res 59 0.09 0.00 0.08 + 0.02 0.15 0.05Fox River Res* O 38 0.04 0.04 0.04 unch 0.00 0.05 0.04FPX Nickel V 1149 0.13 0.10 0.10 - 0.02 0.18 0.08Franco-Nevada* N 2170 69.90 66.70 68.91 + 0.36 82.61 58.26Franco-Nevada T 2716 92.34 88.94 92.00 + 0.82 106.28 76.53Franklin Mng* O 28 0.00 0.00 0.00 + 0.00 0.00 0.00Freedom Egy V 77 0.03 0.02 0.03 + 0.01 0.10 0.02Freegold Vent T 113 0.07 0.07 0.07 - 0.01 0.13 0.06Freeport McMoR* N 97048 12.00 10.71 11.94 + 1.17 20.25 10.59Freeport Res V 32 0.09 0.07 0.09 - 0.01 0.10 0.04Fremont Gold V 554 0.14 0.14 0.14 - 0.01 0.22 0.09Fremont Gold* O 86 0.11 0.10 0.11 - 0.00 0.17 0.07Fresnillo plc* O 25 10.09 9.35 9.35 - 0.50 19.93 9.45Frontier Lith V 58 0.35 0.32 0.32 - 0.02 0.85 0.30Frontline Gold V 132 0.02 0.01 0.02 + 0.01 0.03 0.01Full Metal Mnl* O 1 0.00 0.00 0.00 unch 0.00 0.12 0.00Fura Gems V 169 0.35 0.32 0.33 + 0.02 1.13 0.30Fura Gems* O 14 0.26 0.23 0.23 - 0.02 1.23 0.23Fusion Gold V 40 0.16 0.15 0.15 unch 0.00 0.30 0.14
G-HGabriel Res V 21 0.33 0.32 0.33 + 0.01 0.45 0.29Gabriel Res* O 13 0.25 0.23 0.25 + 0.01 0.34 0.22Gainey Capital V 379 0.07 0.05 0.05 - 0.03 0.15 0.04Galane Gold * O 7 0.05 0.04 0.04 - 0.01 0.06 0.03Galane Gold V 117 0.06 0.05 0.05 - 0.01 0.07 0.05Galantas Gold V 555 0.15 0.12 0.12 - 0.01 0.15 0.08Galantas Gold* O 90 0.10 0.08 0.09 - 0.01 0.10 0.06Galore Res V 60 0.05 0.04 0.05 unch 0.00 0.06 0.01Galway Gold * O 87 0.09 0.08 0.08 - 0.01 0.12 0.07Galway Gold V 67 0.12 0.11 0.11 - 0.01 0.64 0.10Galway Mtls* O 30 0.15 0.14 0.15 + 0.01 0.31 0.10Galway Mtls V 218 0.23 0.18 0.23 + 0.04 0.39 0.13GAR Limited 10532 0.16 0.11 0.12 - 0.04 0.65 0.07Garibaldi Res V 698 1.18 0.98 1.17 + 0.12 4.95 0.98Garibaldi Res * O 81 0.90 0.73 0.90 + 0.12 3.79 0.73Gatling Explor V 1146 0.58 0.37 0.39 - 0.05 0.58 0.13General Moly T 7 0.24 0.22 0.24 unch 0.00 0.63 0.22General Moly* X 1288 0.18 0.16 0.16 - 0.01 0.46 0.16Generation Min* O 8 0.03 0.03 0.03 unch 0.00 0.11 0.03Generation Min 95 0.11 0.10 0.10 - 0.01 0.20 0.08Generic Gold 266 0.07 0.04 0.04 - 0.02 0.32 0.04Genesis Mtls* O 844 0.06 0.05 0.05 - 0.01 0.12 0.04Genesis Mtls V 1004 0.08 0.06 0.07 - 0.01 0.15 0.05Genius Metals 99 0.23 0.16 0.18 - 0.06 0.25 0.12Gensource Pot V 1130 0.11 0.10 0.11 + 0.01 0.16 0.07Gentor Res V 426 0.08 0.07 0.08 unch 0.00 0.14 0.06Geomega Res V 231 0.09 0.08 0.08 - 0.01 0.20 0.06Geomega Res* O 20 0.06 0.06 0.06 unch 0.00 0.12 0.05Gespeg Cop Res V 207 0.04 0.03 0.04 unch 0.00 0.05 0.02Getty Copper V 630 0.04 0.04 0.04 unch 0.00 0.07 0.02GFG Resources V 656 0.26 0.18 0.19 + 0.01 0.60 0.17GFG Resources* O 287 0.19 0.14 0.14 - 0.01 0.44 0.14GGL Res* O 5 0.05 0.05 0.05 unch 0.00 0.13 0.05GGL Res V 58 0.10 0.07 0.07 - 0.01 0.18 0.07GGX Gold V 831 0.06 0.06 0.06 unch 0.00 0.16 0.05GGX Gold* O 105 0.04 0.04 0.04 unch 0.00 0.11 0.04Giga Metals V 221 0.20 0.19 0.20 unch 0.00 0.81 0.15Giga Metals* O 75 0.15 0.15 0.15 - 0.01 0.64 0.12Gitennes Expl V 206 0.03 0.03 0.03 unch 0.00 0.15 0.03Giyani Gold V 173 0.14 0.12 0.12 - 0.02 0.40 0.12
Giyani Gold* O 101 0.11 0.09 0.11 - 0.01 0.31 0.09Glacier Lake* O 10 0.02 0.02 0.02 unch 0.00 0.06 0.02Glacier Lake V 472 0.02 0.02 0.02 - 0.01 0.11 0.02Gldn Predator* O 258 0.19 0.15 0.16 - 0.03 0.74 0.16Gldn Predator V 369 0.25 0.21 0.21 - 0.04 0.87 0.21Glen Eagle Res V 82 0.15 0.13 0.13 - 0.01 0.25 0.11Glencore Plc* O 1260 7.53 7.11 7.40 + 0.24 11.68 7.11Global Atomic V 898 0.40 0.28 0.40 + 0.10 0.45 0.20Global Atomic* O 453 0.23 0.21 0.23 + 0.00 0.31 0.16Global Cobalt* O 310 0.00 0.00 0.00 + 0.00 0.43 0.00Global Energy V 94 0.07 0.00 0.06 - 0.01 0.27 0.06Global Energy* O 47 0.05 0.04 0.04 - 0.01 0.22 0.04Global Gold* O 0 0.00 0.00 1.85 unch 0.00 5.77 1.78Global Hunter* O 40 0.01 0.00 0.01 unch 0.00 0.10 0.00Global Li-Ion 36 0.09 0.08 0.09 + 0.01 0.70 0.08Global Li-Ion* O 4 0.06 0.00 0.06 + 0.01 0.55 0.06Global Vanad* O 1 0.16 0.16 0.16 - 0.01 0.16 0.16Global Vanad V 410 0.25 0.00 0.19 - 0.04 0.28 0.20GlobalMin Vent* O 7 1.16 1.00 1.05 - 0.25 140.00 0.55Globex Mng* O 11 0.26 0.23 0.26 + 0.02 0.40 0.19Globex Mng T 114 0.35 0.31 0.35 + 0.06 0.51 0.25GMV Minerals V 724 0.12 0.10 0.10 - 0.04 0.35 0.10GMV Minerals* O 30 0.11 0.07 0.08 - 0.03 0.26 0.07GNCC Capital* O 12500 0.00 0.00 0.00 unch 0.00 0.00 0.00Go Cobalt* O 3 0.18 0.18 0.18 unch 0.00 0.26 0.12Go Cobalt 221 0.33 0.28 0.30 unch 0.00 0.38 0.07GobiMin V 52 0.33 0.33 0.33 unch 0.00 0.44 0.30GoGold Res T 571 0.22 0.20 0.22 + 0.01 0.53 0.19Gold Dynamics* O 1342 0.00 0.00 0.00 - 0.00 0.01 0.00Gold Fields* O 10 2.97 2.97 2.97 unch 0.00 4.25 2.40Gold Fields* N 19019 3.14 2.90 2.93 - 0.12 4.54 2.20Gold Finder Ex* O 47 0.06 0.04 0.04 - 0.02 1.33 0.04Gold Finder Ex V 790 0.09 0.06 0.07 - 0.02 1.85 0.06Gold Lakes* O 5 0.04 0.00 0.04 + 0.02 0.10 0.02Gold Reserve* O 410 2.43 0.00 2.40 + 0.25 3.56 1.84Gold Reserve V 28 3.23 2.65 3.00 + 0.17 4.53 2.50Gold Resource* X 1506 3.90 3.61 3.82 - 0.02 7.33 3.61Gold Rush Cari V 216 0.11 0.10 0.11 + 0.01 0.35 0.10Gold Std Vents T 452 1.66 1.46 1.59 - 0.03 2.46 1.46Gold Std Vents* X 2059 1.25 1.09 1.21 - 0.01 2.01 1.09Goldbank Mng V 0 0.00 0.00 0.14 unch 0.00 0.21 0.13Goldcliff Res* O 6 0.07 0.06 0.07 + 0.01 0.41 0.04Goldcliff Res V 40 0.07 0.06 0.07 + 0.01 0.52 0.06Goldcorp T 12640 12.93 12.17 12.32 - 0.26 19.32 11.00Goldcorp* N 33713 9.80 9.13 9.28 - 0.14 15.55 8.42Golden Arrow V 447 0.29 0.26 0.27 - 0.02 0.72 0.22Golden Arrow* O 193 0.21 0.19 0.20 - 0.00 0.58 0.17Golden Band* O 30 0.00 0.00 0.00 unch 0.00 0.01 0.00Golden Dawn Ml V 276 0.04 0.00 0.04 unch 0.00 0.62 0.03Golden Dawn Ml* O 59 0.04 0.03 0.03 - 0.00 0.31 0.03Golden Goliath* O 101 0.02 0.01 0.02 + 0.02 0.05 0.00Golden Goliath V 100 0.03 0.03 0.03 unch 0.00 0.06 0.02Golden Harp* O 0 0.00 0.00 0.08 unch 0.00 0.10 0.08Golden Harp V 20 0.13 0.00 0.13 - 0.05 0.20 0.01Golden Hope V 44 0.08 0.00 0.08 - 0.01 0.11 0.06Golden Hope* O 35 0.07 0.07 0.07 unch 0.00 0.09 0.05Golden Mnls T 14 0.33 0.00 0.31 - 0.01 0.60 0.26Golden Mnls* X 436 0.26 0.23 0.23 - 0.01 0.49 0.19Golden Peak Mn* O 87 0.17 0.17 0.17 + 0.00 0.41 0.15Golden Peak Mn V 345 0.23 0.20 0.20 - 0.02 0.56 0.16Golden Pursuit V 113 0.10 0.10 0.10 - 0.01 0.21 0.08Golden Queen T 340 0.15 0.11 0.15 + 0.03 0.24 0.11Golden Queen* O 162 0.10 0.08 0.10 + 0.00 0.19 0.08Golden Ridge V 5560 0.15 0.09 0.09 - 0.04 0.54 0.09Golden Secret V 77 2.09 1.95 2.08 - 0.02 5.00 1.95Golden Share V 272 0.15 0.11 0.13 - 0.01 0.30 0.09Golden Star T 282 3.96 3.24 3.96 + 0.38 5.70 3.24Golden Star* X 1880 2.99 2.43 2.95 + 0.22 4.60 2.43Golden Tag V 105 0.07 0.06 0.06 - 0.02 0.08 0.03Golden Valley V 130 0.25 0.24 0.25 + 0.01 0.30 0.22Golden Valley* O 71 0.19 0.18 0.18 - 0.00 0.25 0.16Goldex Res* O 8 0.16 0.14 0.14 - 0.02 1.96 0.14Goldex Res V 64 0.23 0.19 0.19 unch 0.00 2.56 0.16Goldgroup Mng T 340 0.05 0.05 0.05 - 0.01 0.09 0.05Goldgroup Mng* O 108 0.04 0.03 0.03 + 0.00 0.07 0.03GoldMining T 676 0.87 0.78 0.83 + 0.03 1.54 0.73GoldMining* O 456 0.66 0.58 0.63 + 0.03 1.21 0.55GoldON Res V 99 0.15 0.13 0.15 unch 0.00 0.20 0.12GoldON Res* O 15 0.10 0.10 0.10 unch 0.00 0.13 0.09Goldplay Expl* O 16 0.18 0.16 0.16 - 0.02 0.20 0.16Goldplay Expl V 152 0.24 0.21 0.21 - 0.02 0.32 0.16GoldQuest Mng V 429 0.11 0.10 0.11 - 0.01 0.46 0.09Goldrea Res 10 0.05 0.00 0.05 unch 0.00 0.38 0.04Goldrea Res* O 30 0.04 0.03 0.03 - 0.01 0.30 0.03Goldrich Mng* O 89 0.02 0.02 0.02 - 0.00 0.04 0.02Goldsource Min* O 8 0.06 0.04 0.05 - 0.00 0.10 0.03Goldsource Min V 223 0.07 0.06 0.06 - 0.01 0.12 0.05Goldstar Mnls V 9 0.05 0.05 0.05 unch 0.00 0.12 0.03Goldstream Mnl V 78 0.08 0.07 0.07 unch 0.00 0.18 0.04Goldstrike Res V 444 0.10 0.07 0.10 + 0.02 0.25 0.07GoldTrain Res 8 0.14 0.13 0.13 unch 0.00 0.40 0.12Goliath Res V 750 0.09 0.08 0.09 + 0.02 0.33 0.07Goliath Res* O 494 0.07 0.00 0.06 - 0.00 0.21 0.06Gossan Res V 141 0.08 0.06 0.06 - 0.01 0.12 0.05GoviEx Uranium* O 742 0.15 0.13 0.15 + 0.02 0.27 0.13GoviEx Uranium V 1723 0.20 0.17 0.20 + 0.03 0.33 0.17Gowest Gold* O 533 0.03 0.02 0.02 - 0.01 0.14 0.03Gowest Gold V 1493 0.04 0.03 0.04 - 0.01 0.20 0.03GPM Metals V 1384 0.05 0.04 0.04 unch 0.00 0.08 0.04Gran Colombia* O 36 1.99 1.80 1.92 - 0.12 2.62 1.39Gran Colombia T 448 2.69 2.37 2.53 - 0.14 3.45 1.80Granada Gold V 222 0.17 0.00 0.15 - 0.02 0.42 0.12Granada Gold* O 13 0.13 0.12 0.12 - 0.01 0.33 0.10Grande Portage V 1394 0.18 0.10 0.11 - 0.05 0.34 0.12Grande Portage* O 38 0.13 0.08 0.08 - 0.05 0.25 0.11Graphite Egy* O 177 0.05 0.02 0.02 - 0.02 1.56 0.02Graphite Egy 46 0.06 0.03 0.03 - 0.04 1.76 0.03Graphite One* O 475 0.04 0.03 0.04 - 0.00 0.09 0.03Graphite One V 1629 0.05 0.04 0.04 - 0.01 0.12 0.04Gratomic V 6468 0.16 0.13 0.14 unch 0.00 0.32 0.08Gratomic* O 27 0.12 0.11 0.11 + 0.01 0.21 0.06Gray Rock Res V 291 0.10 0.06 0.10 + 0.04 0.25 0.05Great Atlantic V 5023 0.10 0.06 0.09 + 0.02 0.15 0.05Great Bear Res V 929 2.89 2.19 2.59 - 0.18 3.50 0.28Great Bear Res* O 124 2.13 1.65 1.94 - 0.28 2.65 0.21Great Lakes Gr* O 342 0.03 0.01 0.02 - 0.01 0.08 0.01Great Lakes Gr V 241 0.03 0.02 0.03 unch 0.00 0.08 0.02Great Panther T 667 0.82 0.72 0.82 + 0.02 1.86 0.70Great Panther* X 2125 0.62 0.54 0.62 + 0.05 1.45 0.54Great Thunder V 185 0.02 0.02 0.02 unch 0.00 0.05 0.01Great Western* O 55 0.00 0.00 0.00 - 0.00 0.01 0.00Green River 100 0.06 0.05 0.06 + 0.01 0.09 0.03Green Swan Cap V 906 0.03 0.03 0.03 - 0.01 0.09 0.03Greencastle Rs V 693 0.06 0.05 0.05 - 0.01 0.18 0.05Greenland M&En* O 418 0.06 0.05 0.06 - 0.00 0.09 0.05Greenshield Ex V 5 0.11 0.11 0.11 unch 0.00 0.15 0.10Grenville Gold 8 0.40 0.00 0.40 unch 0.00 0.70 0.12Grid Metals V 64 0.07 0.06 0.06 - 0.01 0.52 0.05Grid Metals* O 56 0.05 0.04 0.04 - 0.01 0.37 0.04Grizzly Discvr* O 170 0.07 0.06 0.06 - 0.01 0.11 0.03Grizzly Discvr V 177 0.09 0.07 0.08 - 0.02 0.15 0.04Group Eleven V 202 0.11 0.10 0.11 + 0.01 0.40 0.10Group Ten Mtls* O 3 0.12 0.12 0.12 unch 0.00 0.23 0.10Group Ten Mtls V 51 0.15 0.14 0.15 - 0.01 0.28 0.14GrowMax Res* O 395 0.07 0.06 0.06 - 0.01 0.13 0.05GrowMax Res V 212 0.09 0.08 0.09 - 0.01 0.19 0.08GT Gold V 4157 1.09 0.77 0.79 - 0.32 2.15 0.41GT Gold * O 192 0.82 0.58 0.61 - 0.24 1.62 0.31GTA Res & Mng V 348 0.03 0.02 0.02 - 0.01 0.06 0.02Guerrero Vents V 40 0.09 0.07 0.09 unch 0.00 0.30 0.07Guerrero Vents* O 3 0.09 0.09 0.09 unch 0.00 0.09 0.09Gungnir Res* O 135 0.07 0.00 0.06 + 0.00 0.29 0.05Gungnir Res V 263 0.09 0.08 0.09 unch 0.00 0.39 0.08Gunpoint Expl V 13 0.46 0.00 0.46 + 0.01 0.55 0.16Guyana Gldflds T 2210 1.37 1.24 1.35 + 0.02 5.42 1.24Guyana Goldstr V 353 0.28 0.25 0.28 + 0.03 0.39 0.19Guyana Goldstr* O 2 0.20 0.19 0.20 - 0.00 0.28 0.14Handa Mining* O 0 0.00 0.00 0.05 unch 0.00 0.10 0.04Handa Mining V 157 0.06 0.06 0.06 unch 0.00 0.18 0.05Handeni Gold* O 25 0.04 0.00 0.04 + 0.00 0.13 0.02Hannan Metals V 81 0.10 0.08 0.09 + 0.01 0.39 0.07Hannan Metals* O 35 0.07 0.05 0.07 + 0.02 0.31 0.05Happy Ck Mnrls V 48 0.16 0.15 0.16 + 0.02 0.23 0.13Harfang Explor V 42 0.21 0.19 0.19 unch 0.00 0.34 0.18Harmony Gold* N 9457 1.63 1.49 1.50 - 0.13 2.53 1.43Harte Gold T 1146 0.37 0.35 0.36 - 0.01 0.55 0.29Harte Gold* O 253 0.28 0.26 0.27 - 0.00 0.44 0.22Harvest Gold* O 208 0.05 0.03 0.04 - 0.00 0.08 0.03Harvest Gold V 830 0.06 0.05 0.05 unch 0.00 0.10 0.04Havilah Mining* O 16 0.24 0.00 0.22 - 0.01 0.35 0.20Havilah Mining V 72 0.31 0.31 0.31 unch 0.00 0.69 0.25Hawkeye Gld&Di* O 18 0.03 0.03 0.03 unch 0.00 0.06 0.03Hawkeye Gld&Di V 459 0.05 0.04 0.04 - 0.01 0.12 0.04Heatherdale Rs V 7 0.03 0.03 0.03 - 0.01 0.07 0.02Hecla Mining* N 23881 2.63 2.34 2.38 - 0.17 4.63 2.17Helio Res V 65 0.07 0.00 0.07 unch 0.00 0.38 0.07Helio Res* O 6 0.05 0.04 0.04 - 0.00 0.25 0.00Hellix Vent* O 92 0.01 0.01 0.01 unch 0.00 0.04 0.01Hemcare Health* O 5 1.12 0.75 1.09 - 0.01 1.38 0.05Heron Res* O 26 0.44 0.42 0.44 + 0.02 0.70 0.37HFX Holding V 50 0.06 0.06 0.06 unch 0.00 0.12 0.04Highbank Res V 258 0.02 0.02 0.02 unch 0.00 0.06 0.02Highland Copp V 76 0.10 0.09 0.10 + 0.01 0.16 0.06
20-22_DEC10_StockTables.indd 21 2018-12-04 1:39 PM

WWW.NORTHERNMINER.COM22 DECEMBER 10–23, 2018 / THE NORTHERN MINER
STO CK TABLES (100s) Week 12-month
Stock Exc Volume High Low Last Change High Low
(100s) Week 12-month
Stock Exc Volume High Low Last Change High Low
(100s) Week 12-month
Stock Exc Volume High Low Last Change High Low
(100s) Week 12-month
Stock Exc Volume High Low Last Change High Low
Sandfire Res* O 215 0.07 0.06 0.07 + 0.00 0.10 0.05Sandspring Res V 484 0.19 0.17 0.18 - 0.01 0.40 0.17Sandspring Res* O 298 0.15 0.13 0.13 - 0.02 0.32 0.13Sandstorm Gold T 1874 5.59 5.30 5.55 + 0.08 6.95 4.60Sandstorm Gold* X 4291 4.21 3.99 4.19 + 0.07 5.64 3.48Sandy Lake Gld V 420 0.09 0.08 0.09 unch 0.00 0.13 0.04Santa Fe Gold* O 438 0.08 0.04 0.08 - 0.00 0.20 0.04Santacruz Silv V 150 0.10 0.08 0.08 - 0.01 0.17 0.08Sarama Res V 585 0.06 0.06 0.06 - 0.01 0.15 0.06Sarissa Res* O 2428 0.00 0.00 0.00 - 0.00 0.00 0.00Satori Res V 310 0.06 0.05 0.06 + 0.01 0.15 0.05Satori Res* O 360 0.04 0.04 0.04 unch 0.00 0.11 0.04Saturn Mnrls V 930 0.22 0.19 0.21 - 0.01 0.30 0.11Savary Gold V 1533 0.06 0.05 0.05 + 0.01 0.08 0.04Saville Res V 58 0.04 0.04 0.04 - 0.01 0.12 0.04Scandium Intl* O 107 0.20 0.17 0.19 + 0.00 0.24 0.11Scandium Intl T 348 0.25 0.22 0.25 + 0.02 0.32 0.13Scorpio Gold V 313 0.02 0.01 0.01 - 0.01 0.04 0.01ScoZinc Mg V 9 0.64 0.00 0.64 - 0.01 1.53 0.57Seabridge Gld T 446 15.84 15.03 15.61 - 0.22 19.84 12.61Seabridge Gld* N 1388 12.00 11.25 11.72 - 0.03 15.30 9.80Search Mnls V 197 0.04 0.04 0.04 - 0.01 0.09 0.03Search Mnls* O 3 0.03 0.03 0.03 unch 0.00 0.07 0.03Searchlight* O 3 0.03 0.03 0.03 unch 0.00 0.16 0.01SearchlightMin* O 517 0.02 0.01 0.01 + 0.00 0.05 0.01SearchlightRes V 564 0.04 0.00 0.04 - 0.01 0.23 0.03Secova Mtls* O 61 0.03 0.02 0.02 - 0.01 0.10 0.01Secova Mtls V 4552 0.06 0.04 0.04 - 0.01 0.30 0.04Sego Res V 406 0.03 0.03 0.03 unch 0.00 0.09 0.03Select Sands V 808 0.09 0.08 0.08 - 0.01 0.60 0.08Semafo T 3472 2.77 2.37 2.40 - 0.35 4.14 2.53Senator Mnrls V 486 0.08 0.05 0.08 unch 0.00 0.90 0.04Senator Mnrls* O 0 0.00 0.00 0.06 unch 0.00 0.39 0.05Sennen Potash V 243 0.45 0.45 0.45 unch 0.00 0.55 0.30Sennen Potash* O 0 0.00 0.00 0.34 unch 0.00 0.40 0.34Serabi Gold T 62 0.50 0.50 0.50 + 0.01 1.60 0.50Serengeti Res V 2245 0.29 0.24 0.26 - 0.03 0.60 0.12Shamrock Ent 500 0.02 0.02 0.02 - 0.01 0.08 0.02Sherritt Intl T 11874 0.54 0.42 0.49 - 0.03 1.87 0.42Shoshoni Gold V 11 0.05 0.05 0.05 unch 0.00 0.08 0.04Sibanye-Stillw* N 7238 2.66 2.40 2.44 - 0.16 5.44 2.02Sibanye-Stillw* O 0 0.53 0.53 0.53 unch 0.00 1.25 0.58Sidney Resrces* O 65 0.00 0.00 0.00 - 0.00 0.01 0.00Sienna Res V 873 0.05 0.05 0.05 unch 0.00 0.39 0.04Sienna Res* O 23 0.04 0.03 0.03 - 0.00 0.32 0.03Sierra Metals* X 95 2.39 2.25 2.34 - 0.02 3.00 2.13Sierra Metals T 26 3.18 3.00 3.08 - 0.06 3.85 2.68Sigma Lithium V 459 2.15 2.07 2.15 + 0.09 2.40 1.20Signature Res V 277 0.08 0.07 0.08 unch 0.00 0.14 0.05Signature Res* O 84 0.06 0.06 0.06 + 0.00 0.11 0.04Silver Bear Rs* O 0 0.00 0.00 0.15 unch 0.00 0.26 0.09Silver Bear Rs T 18 0.18 0.17 0.17 unch 0.00 0.32 0.14Silver Bull Re* O 306 0.10 0.09 0.09 - 0.00 0.23 0.09Silver Bull Re T 758 0.13 0.12 0.12 unch 0.00 0.29 0.11Silver Grail V 303 0.04 0.04 0.04 unch 0.00 0.10 0.03Silver Hill* O 21 0.12 0.11 0.12 + 0.01 0.25 0.11Silver Mtn Mns* O 330 0.01 0.01 0.01 unch 0.00 0.03 0.01Silver Mtn Mns V 208 0.02 0.01 0.02 unch 0.00 0.03 0.01Silver Phoenix 163 0.15 0.02 0.15 + 0.13 0.22 0.02Silver Predatr V 65 0.08 0.00 0.08 - 0.01 0.19 0.07Silver Predatr* O 2 0.05 0.05 0.05 unch 0.00 0.14 0.05Silver Range V 78 0.12 0.10 0.11 - 0.01 0.19 0.09Silver Scott* O 41 0.03 0.03 0.03 - 0.00 0.24 0.01Silver Spruce V 413 0.02 0.00 0.02 unch 0.00 0.08 0.02Silver Spruce* O 141 0.02 0.01 0.01 - 0.01 0.06 0.01Silver Viper V 269 0.09 0.07 0.07 - 0.02 0.25 0.07Silvercorp Met T 878 2.64 2.43 2.59 + 0.02 4.02 2.43Silvercorp Met* X 1144 2.00 1.83 1.95 + 0.03 3.12 1.83SilverCrest Mt* X 400 2.59 2.21 2.48 + 0.25 3.07 0.87SilverCrest Mt V 742 3.39 2.93 3.27 + 0.28 3.80 1.12Silverstar Res* O 91 0.10 0.05 0.05 unch 0.00 1.60 0.02Sirios Res* O 7 0.10 0.10 0.10 unch 0.00 0.26 0.10Sirios Res V 453 0.16 0.14 0.15 unch 0.00 0.34 0.14Sitka Gold 49 0.11 0.11 0.11 - 0.01 0.30 0.06Skeena Res V 494 0.33 0.31 0.31 - 0.02 0.80 0.29Skeena Res* O 125 0.25 0.23 0.24 - 0.02 0.66 0.23Skyharbour Res* O 157 0.36 0.32 0.34 - 0.00 0.44 0.28Skyharbour Res V 583 0.49 0.43 0.46 + 0.01 0.57 0.35Slam Explor* O 10 0.01 0.01 0.01 unch 0.00 0.05 0.01Slam Explor V 829 0.03 0.02 0.02 unch 0.00 0.07 0.02Slave Lake Zn 101 0.11 0.00 0.11 + 0.01 0.11 0.06Sojourn Explor V 367 0.19 0.12 0.19 + 0.08 0.29 0.07Sojourn Explor* O 5 0.09 0.09 0.09 unch 0.00 0.21 0.08Sokoman Iron V 8337 0.21 0.16 0.20 + 0.01 0.58 0.03Sokoman Iron* O 139 0.15 0.12 0.15 + 0.01 0.45 0.00SolGold plc T 314 0.65 0.62 0.63 - 0.01 0.71 0.32SolGold plc* O 86 0.49 0.44 0.49 unch 0.00 0.58 0.27Solitario Ex&R* X 183 0.32 0.29 0.30 - 0.01 0.71 0.28Solitario Ex&R T 42 0.42 0.00 0.42 unch 0.00 0.88 0.37Solstice Gold V 82 0.17 0.00 0.14 - 0.02 0.38 0.12Sonora Gld & S V 700 0.07 0.06 0.06 - 0.01 0.20 0.06Sonoro Mtls* O 21 0.14 0.00 0.13 - 0.02 0.16 0.07Sonoro Mtls V 74 0.19 0.16 0.16 - 0.02 0.20 0.07South32* O 1 0.00 0.00 2.22 unch 0.00 3.10 2.22Southern Arc* O 3 0.26 0.20 0.26 + 0.06 0.57 0.20Southern Arc V 11 0.35 0.00 0.35 + 0.03 0.71 0.27Southern Copp* N 5954 34.29 31.50 33.48 + 1.36 58.09 31.17Southern Silvr* O 515 0.15 0.08 0.13 + 0.02 0.31 0.08Southern Silvr V 496 0.19 0.11 0.16 + 0.01 0.38 0.11SouthGobi Res T 19 0.11 0.11 0.11 unch 0.00 0.25 0.10Spanish Mtn Gd V 1825 0.05 0.05 0.05 unch 0.00 0.14 0.05Spanish Mtn Gd* O 750 0.05 0.03 0.04 - 0.01 0.12 0.04Sparton Res V 593 0.08 0.06 0.07 - 0.01 0.12 0.04Sparton Res* O 464 0.05 0.04 0.05 + 0.01 0.09 0.03Spearmint Res* O 18 0.04 0.00 0.03 + 0.01 0.11 0.00Spearmint Res 1836 0.04 0.04 0.04 unch 0.00 0.14 0.02Spey Resources 91 0.08 0.07 0.08 + 0.01 0.16 0.07Sphinx Res V 774 0.04 0.04 0.04 unch 0.00 0.08 0.04Sprott Res Hld T 204 1.31 1.24 1.28 - 0.02 3.40 1.24Spruce Ridge R V 471 0.05 0.04 0.05 - 0.01 0.06 0.01SRG Graphite V 96 0.78 0.71 0.75 - 0.01 2.25 0.70SSR Mining* D 2511 11.27 10.21 10.64 - 0.37 11.44 7.64SSR Mining T 1031 14.89 13.59 14.10 - 0.48 14.96 9.66St Augustine T 11 0.02 0.02 0.02 - 0.01 0.04 0.02St Elias Mns* O 457 0.00 0.00 0.00 unch 0.00 0.00 0.00St-Georges Eco* O 4 0.04 0.04 0.04 unch 0.00 2.20 0.03St-Georges Eco 567 0.07 0.06 0.06 - 0.01 2.90 0.04Stakeholdr Gld* O 14 0.06 0.05 0.06 + 0.01 0.45 0.05Stakeholdr Gld V 53 0.07 0.07 0.07 unch 0.00 0.64 0.06Standard Graph* O 1212 0.46 0.38 0.40 - 0.07 1.13 0.19Standard Lith V 365 1.29 1.12 1.20 - 0.02 2.61 0.80Standard Metal* O 16 0.12 0.06 0.12 + 0.00 0.23 0.02Stans Energy V 713 0.03 0.00 0.03 unch 0.00 0.05 0.02Stans Energy* O 305 0.02 0.01 0.02 - 0.00 0.04 0.01Star Diamond T 1244 0.23 0.21 0.23 + 0.01 0.38 0.15Star Diamond* O 81 0.18 0.16 0.17 - 0.01 0.29 0.12Star Gold* O 41 0.06 0.06 0.06 unch 0.00 0.10 0.02Star Mountain* O 24 0.02 0.02 0.02 + 0.00 0.04 0.01Starcore Intl T 329 0.10 0.09 0.09 - 0.01 0.30 0.09Starr Peak Exp V 25 0.14 0.12 0.14 unch 0.00 0.19 0.09Steele Oceanic* O 0 0.00 0.00 0.55 unch 0.00 1.98 0.55Stellar Africa V 151 0.02 0.02 0.02 unch 0.00 0.07 0.02Stelmine Can V 57 0.16 0.13 0.14 - 0.02 0.45 0.10Steppe Gold T 66 0.88 0.80 0.83 - 0.10 2.01 0.80Stornoway Diam T 6495 0.23 0.19 0.19 - 0.04 0.71 0.20Stornoway Diam* O 1470 0.16 0.15 0.15 - 0.02 0.54 0.15Stratabd Mnr V 160 0.03 0.03 0.03 - 0.01 0.08 0.02Strategic Metl* O 58 0.27 0.23 0.24 - 0.01 0.43 0.22Strategic Metl V 214 0.35 0.32 0.32 unch 0.00 0.52 0.31Strategic Res* O 0 0.00 0.00 0.12 unch 0.00 0.20 0.12Strategic Res V 9 0.27 0.00 0.27 - 0.01 0.27 0.16Stria Lithium V 345 0.03 0.02 0.03 unch 0.00 0.08 0.02Strikepoint Gd V 283 0.17 0.14 0.16 unch 0.00 0.29 0.14Strikepoint Gd* O 23 0.13 0.11 0.12 - 0.00 0.23 0.11Strongbow Expl V 95 0.17 0.14 0.17 - 0.04 0.28 0.10Strongbow Expl* O 7 0.13 0.12 0.13 + 0.01 0.22 0.09Stroud Res V 50 0.01 0.01 0.01 + 0.01 0.03 0.01Sulliden Mng T 1036 0.13 0.11 0.11 - 0.02 0.65 0.11Sun Metals V 1357 0.27 0.22 0.22 - 0.05 0.40 0.12Suncor Energy T 19887 43.98 42.73 42.84 - 0.21 55.47 40.49Suncor Energy* N 23484 33.14 32.00 32.29 - 0.39 42.55 31.33Sunvest Mnrls V 707 0.04 0.04 0.04 - 0.01 0.14 0.04Sunvest Mnrls* O 25 0.03 0.03 0.03 unch 0.00 0.18 0.02Superior Gold* O 25 0.64 0.64 0.64 unch 0.00 1.28 0.55Superior Gold V 252 0.92 0.84 0.84 - 0.07 1.62 0.67Superior Mng V 258 0.10 0.06 0.10 + 0.04 0.10 0.04Supreme Metals 366 0.02 0.02 0.02 - 0.01 0.08 0.02Surge Copper V 278 0.08 0.05 0.05 - 0.01 0.26 0.04Surge Explor* O 1328 0.08 0.05 0.06 - 0.01 0.36 0.06Surge Explor V 1285 0.10 0.08 0.08 - 0.02 0.28 0.08Sutter Gold* O 199 0.01 0.01 0.01 + 0.00 0.03 0.01Sutter Gold V 92 0.02 0.01 0.02 unch 0.00 0.03 0.01Syrah Res* O 35 1.23 1.11 1.14 - 0.16 3.85 0.97
TTahoe Res* N 21116 3.56 3.32 3.51 + 0.13 5.63 2.18Tahoe Res T 3972 4.73 4.41 4.70 + 0.28 7.27 2.88Taiga Gold 470 0.09 0.07 0.07 - 0.02 0.21 0.07Taiga Gold* O 107 0.06 0.05 0.05 - 0.01 0.16 0.05Taku Gold 201 0.06 0.00 0.05 unch 0.00 0.15 0.04Taku Gold* O 3 0.03 0.03 0.03 unch 0.00 0.12 0.02Talmora Diamd 130 0.03 0.02 0.03 + 0.01 0.06 0.01
Potash Ridge* O 30 0.03 0.03 0.03 - 0.00 0.13 0.02Potash Ridge T 986 0.04 0.04 0.04 - 0.01 0.17 0.03Power Metals V 1730 0.21 0.19 0.20 - 0.01 0.88 0.19Power Metals* O 74 0.16 0.14 0.15 - 0.00 0.70 0.14PowerOre V 34 0.05 0.05 0.05 - 0.01 0.45 0.05PPX Mining* O 5 0.06 0.06 0.06 - 0.00 0.08 0.05PPX Mining V 1505 0.09 0.09 0.09 unch 0.00 0.11 0.06Precipitate Gl* O 114 0.07 0.06 0.07 - 0.00 0.09 0.03Precipitate Gl V 395 0.09 0.08 0.08 - 0.01 0.12 0.04Premier Gold M T 2210 1.63 1.41 1.50 - 0.09 3.94 1.41Premium Expl* O 19 0.00 0.00 0.00 - 0.01 0.02 0.00Pretium Res* N 6177 7.82 6.76 7.11 - 0.57 11.90 6.17Pretium Res T 2179 10.33 9.01 9.45 - 0.79 14.94 7.93Primary Energy 483 0.05 0.03 0.03 - 0.03 0.15 0.03Prism Res V 240 0.04 0.04 0.04 unch 0.00 0.15 0.03Prize Mng* O 199 0.04 0.03 0.04 - 0.01 0.33 0.03Prize Mng V 2535 0.06 0.05 0.05 - 0.01 0.42 0.05ProAm Expl V 91 0.04 0.03 0.03 unch 0.00 0.04 0.02Probe Metals* O 187 0.82 0.75 0.75 - 0.01 1.23 0.69Probe Metals V 254 1.10 0.99 1.02 + 0.02 1.55 0.91Prog Planet V 389 0.06 0.05 0.05 unch 0.00 0.20 0.04Prog Planet* O 26 0.04 0.04 0.04 unch 0.00 0.15 0.03Promithian Gl * O 1 0.05 0.00 0.05 - 0.05 0.10 0.01Prophecy Coal T 4569 0.54 0.40 0.50 + 0.09 0.74 0.11Prophecy Coal* O 3765 0.41 0.30 0.39 + 0.06 3.65 0.09Prospector Res* O 75 0.43 0.37 0.37 - 0.07 0.83 0.37Prospector Res V 305 0.56 0.47 0.49 - 0.07 1.15 0.47Prosper Gold V 254 0.10 0.00 0.10 + 0.01 0.15 0.06Prospero Silvr V 325 0.07 0.07 0.07 - 0.01 0.15 0.07Prospero Silvr* O 20 0.05 0.05 0.05 unch 0.00 0.12 0.05Provenance Gld 32 0.17 0.12 0.16 + 0.04 0.39 0.12Providence V 668 0.13 0.10 0.11 - 0.02 0.19 0.09PUF Vent Inc * O 1270 0.13 0.10 0.12 - 0.01 0.37 0.06Puma Expl V 469 0.04 0.04 0.04 - 0.01 0.11 0.04Pure Energy* O 1008 0.07 0.05 0.05 - 0.01 0.50 0.06Pure Energy V 860 0.09 0.07 0.08 - 0.02 0.45 0.08Pure Gold Mg* O 505 0.47 0.39 0.43 + 0.04 0.56 0.36Pure Gold Mg V 833 0.61 0.52 0.56 + 0.03 0.71 0.46Pure Nickel* O 100 0.01 0.01 0.01 unch 0.00 0.04 0.01Pure Nickel V 196 0.02 0.02 0.02 unch 0.00 0.05 0.01Purepoint Uran V 816 0.07 0.07 0.07 + 0.01 0.10 0.06Q-Gold Res* O 1 0.15 0.15 0.15 unch 0.00 0.17 0.06Q-Gold Res V 17 0.19 0.00 0.19 unch 0.00 0.30 0.10QC Precious V 107 0.30 0.28 0.28 - 0.03 0.60 0.25QC Precious * O 14 0.22 0.20 0.21 - 0.01 0.33 0.20QMC Quantum Ml V 230 0.29 0.25 0.28 + 0.02 1.58 0.23QMC Quantum Ml* O 149 0.22 0.19 0.21 + 0.02 1.28 0.17QMX Gold* O 5 0.05 0.03 0.04 + 0.01 0.25 0.03QMX Gold V 250 0.06 0.05 0.06 + 0.01 0.32 0.05Quadro Res V 334 0.06 0.04 0.04 - 0.02 0.14 0.04Quantum Cobalt 336 0.08 0.05 0.07 - 0.01 1.85 0.05Quartz Mtn Res* O 0 0.00 0.00 0.31 unch 0.00 1.20 0.00Quartz Mtn Res V 91 0.42 0.33 0.33 - 0.09 1.50 0.33Quaterra Res V 72 0.07 0.05 0.07 + 0.02 0.09 0.05Quaterra Res* O 165 0.04 0.04 0.04 + 0.00 0.07 0.03Quest Rare Mnl* O 37 0.00 0.00 0.00 unch 0.00 0.02 0.00Quinto Res V 296 0.03 0.02 0.03 unch 0.00 0.14 0.02
RRackla Mtls V 3 0.11 0.00 0.11 unch 0.00 0.15 0.06Rackla Mtls* O 1 0.08 0.08 0.08 unch 0.00 0.11 0.07Radisson Mng V 347 0.12 0.11 0.11 - 0.02 0.25 0.09Radius Gold V 246 0.11 0.10 0.10 - 0.01 0.19 0.09Rainforest Res* O 1 7.85 0.00 7.84 unch 0.00 9.45 3.50Rainy Mtn Royl* O 117 0.01 0.01 0.01 + 0.00 0.08 0.01Rainy Mtn Royl V 360 0.02 0.02 0.02 unch 0.00 0.10 0.02Rambler Ml &Mg V 36 0.05 0.00 0.04 - 0.01 0.17 0.03Randgold Res* O 0 79.15 79.15 79.15 unch 0.00 101.90 62.16Randgold Res* D 3532 83.91 79.07 80.17 - 1.88 104.05 59.90Randsburg Int* O 259 0.05 0.00 0.03 + 0.03 0.05 0.00Rare Element* O 217 0.11 0.08 0.10 + 0.00 0.31 0.08Rathdowney Res V 89 0.10 0.09 0.10 - 0.01 0.21 0.09Ravencrest Res 693 0.65 0.54 0.60 - 0.04 1.93 0.38Razore Rock Res 33 0.07 0.07 0.07 unch 0.00 0.63 0.06RB Energy* O 238 0.00 0.00 0.00 unch 0.00 0.00 0.00Red Moon Res V 164 0.10 0.07 0.10 + 0.03 0.16 0.05Red Pine Expl V 1301 0.05 0.04 0.04 - 0.01 0.13 0.04Redstar Gold V 299 0.03 0.03 0.03 unch 0.00 0.10 0.03Redstar Gold* O 46 0.02 0.02 0.02 - 0.00 0.08 0.01Redzone Res V 180 0.09 0.08 0.08 - 0.01 0.75 0.09Redzone Res* O 480 0.08 0.07 0.08 unch 0.00 0.57 0.07Regency Gold V 173 0.23 0.00 0.22 + 0.03 0.28 0.14Regulus Res V 271 1.50 1.30 1.37 - 0.14 2.35 1.30Remington Res V 57 0.23 0.20 0.20 - 0.03 0.48 0.20Renaissance Gd* O 89 0.14 0.13 0.14 + 0.00 0.27 0.12Renaissance Gd V 154 0.20 0.18 0.18 unch 0.00 0.33 0.16Renforth Res 404 0.03 0.02 0.03 unch 0.00 0.06 0.02Resolve Vent V 71 0.08 0.08 0.08 unch 0.00 0.81 0.07Resource Cap V 1272 0.02 0.02 0.02 - 0.01 0.13 0.02Resource Cap* O 137 0.01 0.01 0.01 - 0.00 0.11 0.01Reunion Gold V 730 0.19 0.17 0.18 - 0.01 0.23 0.11Revelo Res V 379 0.02 0.01 0.02 + 0.01 0.06 0.01Revival Gold * O 26 0.51 0.45 0.48 - 0.03 0.73 0.42Revival Gold V 114 0.68 0.61 0.64 - 0.03 0.99 0.54Richmond Mnls V 228 0.04 0.03 0.04 + 0.01 0.07 0.02Ridgestone M’g V 100 0.30 0.27 0.30 + 0.03 0.32 0.19Rift Valley 97 0.09 0.08 0.08 - 0.01 0.15 0.05Rimrock Gold* O 54313 0.00 0.00 0.00 + 0.00 0.00 0.00Rio Tinto* O 1 52.81 52.81 52.81 - 6.03 65.30 50.48Rio Tinto* O 4 46.30 44.56 45.00 - 4.19 60.00 44.56Rio Tinto* N 16287 47.84 45.84 46.76 - 0.75 60.72 45.62Rise Gold Corp 610 0.08 0.06 0.07 unch 0.00 0.21 0.05Rise Gold Corp* O 359 0.06 0.05 0.05 - 0.00 0.17 0.04River Wild Exp 463 0.70 0.50 0.70 + 0.07 0.70 0.02Riverside Res* O 93 0.11 0.10 0.10 - 0.02 0.42 0.10Riverside Res V 456 0.16 0.13 0.13 - 0.03 0.36 0.14Rizal Res V 64 0.03 0.02 0.02 - 0.01 0.06 0.01RJK Explor V 2041 0.08 0.05 0.06 - 0.02 0.23 0.05RJK Explor* O 62 0.06 0.03 0.03 - 0.03 0.13 0.00Robex Res V 862 0.09 0.07 0.08 - 0.02 0.12 0.07Rochester Res V 0 0.00 0.00 0.03 unch 0.00 0.09 0.03Rock Tech Lith V 79 0.95 0.94 0.95 - 0.01 1.90 0.84Rock Tech Lith* O 5 0.71 0.71 0.71 unch 0.00 1.50 0.67Rockcliff Met V 155 0.14 0.12 0.12 - 0.01 0.24 0.08Rockex Mng 204 0.06 0.06 0.06 unch 0.00 0.10 0.02Rockhaven Res V 251 0.12 0.09 0.10 unch 0.00 0.18 0.09Rockshield Cap* O 28 0.10 0.08 0.09 - 0.01 0.67 0.08Rockshield Cap 704 0.12 0.11 0.11 - 0.01 0.84 0.11Rockwealth Res V 47 0.12 0.12 0.12 unch 0.00 0.30 0.11Rodinia Lithm V 57 0.08 0.07 0.07 - 0.01 0.46 0.05Rogue Res V 44 0.14 0.12 0.13 - 0.02 0.53 0.12Rokmaster Res V 121 0.08 0.07 0.08 unch 0.00 0.18 0.07Romios Gold Rs* O 185 0.04 0.04 0.04 + 0.00 0.07 0.03Romios Gold Rs V 229 0.06 0.05 0.06 - 0.01 0.09 0.05RosCan Gold V 104 0.08 0.08 0.08 + 0.02 0.11 0.05Rosita Mg Corp V 2369 0.04 0.03 0.04 - 0.01 0.12 0.03Ross River* O 1 0.00 0.00 0.00 unch 0.00 0.14 0.00Rotation Mnls V 1425 0.10 0.08 0.08 unch 0.00 0.40 0.07Roughrider Exp V 60 0.11 0.11 0.11 unch 0.00 0.30 0.11Rover Metals V 606 0.04 0.03 0.03 - 0.01 0.11 0.03Roxgold T 1812 0.87 0.79 0.80 - 0.01 1.44 0.77Roxgold* O 103 0.65 0.60 0.61 + 0.01 1.13 0.59Royal Gold* D 1678 75.24 71.13 73.15 - 1.23 98.53 70.16Royal Mines &M* O 600 0.01 0.01 0.01 unch 0.00 0.01 0.00Royal Nickel* O 823 0.44 0.37 0.40 + 0.01 0.90 0.05Royal Nickel T 12431 0.59 0.48 0.54 + 0.01 1.18 0.07Royal Rd Mnrls V 158 0.08 0.00 0.07 - 0.01 0.18 0.08Royal Std Mnrl* O 1670 0.07 0.03 0.03 - 0.00 0.08 0.00RT Minerals V 94 0.07 0.06 0.06 - 0.01 0.90 0.06RT Minerals* O 245 0.04 0.04 0.04 unch 0.00 0.13 0.00RTG Mining T 104 0.16 0.13 0.14 + 0.02 0.55 0.09Rubicon Mnrls* O 42 1.00 0.94 0.95 - 0.04 1.47 0.81Rubicon Mnrls T 60 1.32 1.25 1.28 - 0.01 1.88 1.05Rugby Mng V 114 0.20 0.18 0.18 - 0.02 0.43 0.14Running Fox Rs* O 7 0.01 0.01 0.01 unch 0.00 0.03 0.01Running Fox Rs V 82 0.01 0.01 0.01 unch 0.00 0.04 0.01Rupert Res V 169 0.86 0.00 0.85 + 0.05 1.46 0.68Rusoro Mng* O 119 0.17 0.11 0.13 + 0.01 0.32 0.05Rusoro Mng V 5473 0.22 0.15 0.18 + 0.02 0.42 0.06
SSabina Gd&Slvr T 1036 1.47 1.35 1.38 - 0.03 2.62 1.11Sabina Gd&Slvr* O 131 1.07 1.01 1.04 - 0.04 2.00 0.85Sable Res* O 64 0.19 0.17 0.17 - 0.02 0.28 0.12Sable Res V 383 0.25 0.23 0.23 - 0.04 0.37 0.14Sage Gold* O 678 0.00 0.00 0.00 - 0.02 0.13 0.00Sailfish Rylty V 22 1.00 0.78 0.95 + 0.05 3.07 0.70Saint Jean* O 0 0.00 0.00 0.02 unch 0.00 0.05 0.01Saint Jean V 268 0.03 0.03 0.03 unch 0.00 0.24 0.02Salazar Res* O 13 0.07 0.07 0.07 unch 0.00 0.12 0.07Salazar Res V 771 0.11 0.10 0.11 - 0.01 0.18 0.10Salt Lake Pot* O 30 0.33 0.33 0.33 unch 0.00 0.47 0.32Sama Res V 300 0.34 0.30 0.32 - 0.01 0.50 0.24Sama Res* O 50 0.26 0.22 0.23 - 0.02 0.41 0.18Samco Gold V 50 0.03 0.03 0.03 unch 0.00 0.11 0.02Samex Mng* O 57 0.00 0.00 0.00 - 0.00 0.00 0.00San Gold Corp* O 33 0.00 0.00 0.00 unch 0.00 0.01 0.00San Marco Res* O 68 0.11 0.09 0.09 - 0.02 0.23 0.09San Marco Res V 299 0.14 0.12 0.12 - 0.02 0.30 0.12Sanatana Diam V 3436 0.06 0.03 0.06 + 0.02 0.07 0.02Sandfire Res V 49 0.09 0.00 0.09 unch 0.00 0.11 0.06
Nouveau Monde V 422 0.29 0.27 0.28 unch 0.00 0.50 0.25Nouveau Monde* O 32 0.22 0.20 0.21 - 0.01 0.39 0.18NovaGold Res T 1320 5.08 4.81 4.90 - 0.22 6.47 4.33NovaGold Res* X 5648 3.85 3.62 3.67 - 0.15 5.05 3.35Novo Res* O 408 1.78 1.49 1.53 - 0.25 5.00 1.42Novo Res V 539 2.44 1.96 2.02 - 0.29 6.42 1.89NRG Metals* O 987 0.08 0.06 0.07 - 0.01 0.49 0.07NRG Metals V 881 0.11 0.09 0.09 - 0.01 0.62 0.09Nrthn Graphite V 119 0.27 0.22 0.27 + 0.05 0.53 0.18Nrthn Graphite* O 160 0.20 0.16 0.20 + 0.04 0.42 0.16Nrthn Lion* O 1 0.15 0.15 0.15 unch 0.00 0.52 0.15Nrthn Mnrls &E* O 1 0.04 0.04 0.04 unch 0.00 0.10 0.02Nrthn Shield V 3348 0.07 0.05 0.06 + 0.01 0.09 0.02Nrthn Superior* O 44 0.02 0.02 0.02 + 0.00 0.04 0.02Nrthn Superior V 3770 0.04 0.03 0.03 - 0.01 0.05 0.02Nrthn Vertex* O 75 0.21 0.18 0.20 - 0.00 0.58 0.18Nrthn Vertex V 742 0.30 0.24 0.26 - 0.03 0.70 0.24NSGold V 6 0.08 0.08 0.08 unch 0.00 0.14 0.02NSS Res Inc 18 0.19 0.15 0.19 + 0.03 1.39 0.08Nthn Dynasty* X 3244 0.80 0.74 0.76 + 0.03 2.30 0.43Nthn Dynasty T 867 1.03 0.98 1.00 + 0.03 2.99 0.55Nthrn Sphere* O 100 0.04 0.03 0.03 unch 0.00 0.15 0.03Nthrn Sphere 128 0.04 0.03 0.04 - 0.01 0.24 0.03Nubian Res V 110 0.11 0.11 0.11 unch 0.00 0.31 0.09Nuinsco Res* O 804 0.00 0.00 0.00 + 0.00 0.01 0.00NuLegacy Gold V 310 0.13 0.11 0.12 + 0.01 0.22 0.10NuLegacy Gold* O 546 0.10 0.08 0.09 + 0.00 0.17 0.08Nutrien T 7797 68.99 66.57 68.44 + 0.65 76.17 55.27Nutrien* N 6995 51.96 49.85 51.56 + 0.93 58.99 40.41NV Gold* O 85 0.06 0.06 0.06 unch 0.00 0.92 0.05NV Gold V 62 0.09 0.08 0.08 - 0.01 1.22 0.07NX Uranium* O 81 0.11 0.04 0.06 + 0.03 0.11 0.01NxGold Ltd* O 64 0.06 0.06 0.06 - 0.01 0.25 0.06NxGold Ltd V 1030 0.08 0.07 0.07 - 0.01 0.40 0.06Nyrstar NV* O 13 0.00 0.00 1.69 unch 0.00 8.21 1.69O.T. Mining* O 43 0.10 0.08 0.10 + 0.02 0.24 0.04OceanaGold* O 7 2.95 2.79 2.80 + 0.04 3.08 2.23OceanaGold T 4733 4.02 3.79 3.87 - 0.10 4.19 2.92Oceanic Iron O V 172 0.06 0.05 0.05 - 0.01 0.16 0.05Oceanus Res* O 114 0.10 0.07 0.07 - 0.03 0.20 0.07Oceanus Res V 86 0.12 0.10 0.11 - 0.02 0.31 0.11OK2 Minerals V 968 0.03 0.02 0.03 unch 0.00 0.09 0.02Olivut Res V 77 0.12 0.10 0.11 + 0.01 0.20 0.07Olivut Res* O 32 0.09 0.06 0.08 + 0.01 0.15 0.05Omineca Mg &Ml V 1 0.00 0.00 0.03 unch 0.00 0.05 0.03One World Lith* O 1 0.11 0.11 0.11 unch 0.00 0.12 0.10One World Lith 788 0.20 0.14 0.17 + 0.02 0.20 0.10Opawica Expl* O 0 0.00 0.00 0.04 unch 0.00 0.08 0.04Opawica Expl V 76 0.05 0.05 0.05 unch 0.00 0.25 0.04Opus One Res V 1172 0.03 0.02 0.02 - 0.01 0.10 0.02Orbite Tech* O 25 0.01 0.00 0.00 - 0.01 0.05 0.00Orca Gold V 217 0.42 0.39 0.39 - 0.01 0.78 0.39Orca Gold* O 86 0.33 0.29 0.29 - 0.04 0.63 0.29Orefinders Res V 317 0.05 0.05 0.05 unch 0.00 0.17 0.05Orestone Mng V 24 0.15 0.11 0.11 - 0.02 0.17 0.06Orex Mnrls* O 9 0.08 0.07 0.08 + 0.00 0.15 0.05Orex Mnrls V 219 0.10 0.10 0.10 unch 0.00 0.18 0.08Orezone Gold V 286 0.60 0.55 0.55 - 0.05 1.02 0.52Orezone Gold* O 58 0.45 0.41 0.43 - 0.00 0.82 0.39Orford Mining V 249 0.18 0.16 0.16 - 0.02 0.44 0.16Organic Potash 977 0.03 0.02 0.03 - 0.01 0.08 0.02OrganiMax V 66 0.08 0.07 0.08 - 0.01 0.32 0.07OrganiMax* O 8 0.06 0.05 0.05 - 0.01 0.20 0.05Origin Gold V 57 0.10 0.08 0.10 + 0.02 0.19 0.08Original Sixtn* O 5 0.10 0.10 0.10 unch 0.00 0.20 0.06Orla Mng Ltd T 539 1.14 1.05 1.12 - 0.01 1.85 1.06Orla Mng Ltd* O 242 0.84 0.83 0.83 - 0.24 1.48 0.83Oro East Mg* O 201 0.00 0.00 0.00 unch 0.00 0.01 0.00Oroco Res V 410 0.20 0.18 0.20 unch 0.00 0.31 0.02Oroco Res* O 73 0.15 0.14 0.14 - 0.04 0.24 0.03Orocobre T 92 4.24 3.89 4.19 + 0.15 7.36 3.06Oronova Energy* O 256 0.09 0.08 0.09 + 0.01 0.10 0.08Oronova Energy V 343 0.12 0.10 0.12 + 0.02 0.22 0.06Oroplata Res* O 1305 0.20 0.18 0.20 + 0.01 0.42 0.06Orosur Mng T 64 0.11 0.09 0.09 - 0.02 0.23 0.02Orsu Metals V 179 0.29 0.23 0.25 + 0.05 0.29 0.14Orsu Metals* O 46 0.19 0.00 0.19 + 0.01 0.21 0.12Orvana Mnrls* O 35 0.11 0.00 0.11 + 0.00 0.23 0.09Orvana Mnrls T 242 0.14 0.00 0.14 unch 0.00 0.28 0.12Osino Res V 114 0.29 0.24 0.26 unch 0.00 0.64 0.20Osisko Gold* N 1832 7.68 7.27 7.51 - 0.03 12.10 7.00Osisko Gold T 1055 10.15 9.70 9.97 - 0.02 15.31 9.27Osisko Metals* O 90 0.41 0.41 0.41 unch 0.00 0.72 0.39Osisko Metals V 401 0.55 0.46 0.52 - 0.03 0.92 0.46Osisko Mng Inc T 2984 2.68 2.45 2.52 - 0.07 3.79 1.60Osprey Gold V 722 0.06 0.05 0.05 unch 0.00 0.11 0.04Otis Gold V 539 0.11 0.09 0.09 - 0.02 0.32 0.09Otis Gold* O 253 0.09 0.06 0.07 - 0.02 0.25 0.06OZ Minerals* O 0 0.00 0.00 6.58 unch 0.00 8.02 5.90
P-QPac Arc Res V 1 0.21 0.21 0.21 unch 0.00 0.82 0.16Pac Bay Mnrls V 28 0.03 0.03 0.03 unch 0.00 0.06 0.02Pac Booker Min* O 108 0.70 0.60 0.66 - 0.02 1.10 0.50Pac Booker Min V 36 0.93 0.80 0.82 - 0.08 1.35 0.65Pac Imperial V 913 0.04 0.02 0.03 + 0.01 0.07 0.02Pac Ridge Expl V 233 0.06 0.05 0.05 unch 0.00 0.07 0.04Pac Ridge Expl* O 50 0.03 0.03 0.03 unch 0.00 0.06 0.03Pac Wildcat* O 19 0.01 0.00 0.00 - 0.00 0.39 0.00Pacific Empire V 74 0.09 0.07 0.09 + 0.01 0.20 0.06Pacific Rim* O 122 0.14 0.09 0.10 + 0.00 1.25 0.07Pacific Rim 636 0.19 0.13 0.15 - 0.01 1.59 0.10Pacific Silk V 101 0.03 0.02 0.02 - 0.01 0.06 0.02Pacton Gold V 701 0.27 0.24 0.24 - 0.03 1.02 0.24Paladin Energy* O 224 0.18 0.13 0.14 - 0.01 0.50 0.01Palamina Corp* O 7 0.31 0.25 0.31 + 0.01 0.37 0.16Palamina Corp V 13 0.40 0.35 0.40 + 0.03 0.47 0.20Palladon Vent* O 30 0.00 0.00 0.00 unch 0.00 0.01 0.00Pan Am Silver T 1370 17.81 16.57 17.09 - 0.34 24.22 16.05Pan Am Silver* D 7433 13.48 12.42 12.90 - 0.28 18.75 12.12Pan Andean Min V 528 0.04 0.03 0.03 - 0.01 0.13 0.03Pan Global Res V 461 0.15 0.10 0.14 unch 0.00 0.30 0.10Pancontinental* O 18 0.04 0.04 0.04 unch 0.00 0.07 0.02Pancontinental V 48 0.07 0.06 0.07 unch 0.00 0.09 0.03Panex Res* O 690 0.00 0.00 0.00 unch 0.00 0.00 0.00Pangolin Dia V 417 0.05 0.04 0.05 + 0.01 0.08 0.04Panoro Mnrls V 47 0.23 0.20 0.23 + 0.02 0.44 0.13Pantheon Vent V 157 0.10 0.09 0.10 unch 0.00 0.15 0.07Para Resources V 144 0.15 0.14 0.15 unch 0.00 0.25 0.13Parallel Mng V 694 0.04 0.03 0.04 unch 0.00 0.08 0.03Parallel Mng * O 48 0.03 0.03 0.03 unch 0.00 0.05 0.03Paramount Gold* X 149 1.05 0.97 0.97 - 0.08 1.64 0.98Paringa Res* O 715 0.16 0.14 0.16 + 0.01 0.44 0.12Parlane Res V 213 0.07 0.05 0.06 - 0.01 0.30 0.05Pasinex Res 228 0.10 0.10 0.10 unch 0.00 0.27 0.08Patriot Gold* O 175 0.08 0.06 0.07 + 0.00 0.15 0.04Peabody Enrgy* N 6538 31.95 29.66 31.14 - 0.05 47.84 29.66Pelangio Expl* O 0 0.00 0.00 0.13 unch 0.00 0.18 0.02Pelangio Expl V 60 0.18 0.00 0.16 unch 0.00 0.60 0.12Pele Mtn Res* O 48 0.04 0.02 0.04 unch 0.00 0.25 0.02Peloton Mnrls* O 31 0.08 0.08 0.08 + 0.00 0.12 0.05Peloton Mnrls 69 0.10 0.10 0.10 unch 0.00 0.15 0.03PepinNini Lith* O 20 0.01 0.01 0.01 unch 0.00 0.07 0.00Perseus Mng T 116 0.36 0.33 0.34 - 0.01 0.50 0.25Pershing Gold T 5 1.31 1.23 1.24 - 0.07 3.92 1.06Pershing Gold* D 201 1.00 0.91 0.91 - 0.06 3.10 0.80Pershing Res* O 263 0.03 0.02 0.02 - 0.01 0.09 0.01Peruvian Metal* O 262 0.03 0.02 0.03 + 0.00 0.08 0.02Peruvian Metal V 110 0.04 0.04 0.04 unch 0.00 0.10 0.04Petra Diamonds* O 0 0.00 0.00 0.53 unch 0.00 1.10 0.41Philex Mng* O 5 0.03 0.02 0.02 - 0.07 0.15 0.02Philippine Mtl* O 50 0.04 0.04 0.04 unch 0.00 0.11 0.00Philippine Mtl V 3 0.07 0.00 0.07 + 0.01 0.15 0.06Phoenix Global* O 10 0.75 0.75 0.75 unch 0.00 0.75 0.75Pine Cliff En* O 38 0.25 0.23 0.24 + 0.01 0.44 0.21Pine Cliff En T 1338 0.36 0.31 0.32 unch 0.00 0.59 0.27Pinecrest Res * O 1 0.14 0.14 0.14 unch 0.00 0.25 0.14Pinecrest Res V 93 0.20 0.19 0.19 - 0.01 0.38 0.19Pistol Bay Mng V 184 0.05 0.03 0.03 - 0.02 0.18 0.04Pivit Explor 211 0.17 0.14 0.14 - 0.03 0.19 0.08PJSC Polyus Gd* O 2 38.50 0.00 36.00 + 4.00 45.15 29.00PJX Res V 25 0.18 0.16 0.16 - 0.01 0.25 0.11Plata Latina V 107 0.03 0.03 0.03 unch 0.00 0.05 0.03Plate Res V 56 0.05 0.05 0.05 - 0.01 0.10 0.05Plateau Energy V 155 0.91 0.80 0.91 + 0.09 1.69 0.48Plateau Energy* O 48 0.68 0.00 0.68 + 0.07 1.27 0.37Platinex Inc 502 0.06 0.04 0.05 - 0.02 0.30 0.05Platinum Gp Mt* X 2414 0.17 0.14 0.15 + 0.01 0.58 0.08Platinum Gp Mt T 502 0.22 0.19 0.21 + 0.01 0.72 0.12Plato Gold V 23 0.03 0.02 0.03 + 0.01 0.06 0.02Playfair Mng V 252 0.03 0.02 0.03 + 0.01 0.09 0.02PolyMet Mng* X 1379 0.86 0.81 0.81 - 0.02 1.36 0.62PolyMet Mng T 22 1.13 1.07 1.08 - 0.01 1.66 0.80Portage Res* O 2778 0.01 0.00 0.01 - 0.00 0.02 0.00Portex Mnrls* O 2 0.00 0.00 0.00 unch 0.00 0.00 0.00Portofino Res V 133 0.03 0.03 0.03 unch 0.00 0.15 0.03
Minco Silver T 18 0.47 0.45 0.47 + 0.01 0.98 0.42Minera Alamos * O 1604 0.08 0.00 0.07 - 0.02 0.16 0.07Minera Alamos V 1202 0.12 0.10 0.10 - 0.02 0.19 0.10Minera IRL 405 0.06 0.06 0.06 unch 0.00 0.14 0.05Mineral Hill V 48 0.12 0.10 0.11 - 0.01 0.29 0.10Mineral Mtn* O 82 0.11 0.09 0.10 + 0.00 0.60 0.05Mineral Mtn V 148 0.14 0.12 0.14 + 0.02 0.74 0.07MineralRite* O 2000 0.00 0.00 0.00 unch 0.00 0.00 0.00Mineworx Tech V 1786 0.14 0.11 0.13 - 0.01 0.40 0.11Mineworx Tech* O 363 0.11 0.08 0.11 - 0.00 0.33 0.08Minfocus Expl V 12 0.05 0.04 0.05 + 0.01 0.42 0.04Minfocus Expl* O 10 0.03 0.03 0.03 unch 0.00 0.04 0.03Mining Global* O 2030 0.00 0.00 0.00 unch 0.00 0.00 0.00Minnova Corp V 427 0.55 0.46 0.55 + 0.05 0.93 0.43Minsud Res V 150 0.05 0.05 0.05 unch 0.00 0.21 0.05Miramont Res 185 0.18 0.14 0.18 + 0.05 0.65 0.13Miranda Gold V 2184 0.02 0.01 0.02 unch 0.00 0.06 0.01Mirasol Res V 148 1.34 1.13 1.22 + 0.02 2.60 0.99Mistango River 102 0.04 0.02 0.02 - 0.01 0.07 0.01MK2 Ventures V 20 0.25 0.25 0.25 unch 0.00 0.39 0.15Mkango Res V 2 0.00 0.00 0.16 unch 0.00 0.24 0.10ML Gold* O 110 0.03 0.03 0.03 + 0.00 0.26 0.03ML Gold Corp V 1802 0.04 0.03 0.03 - 0.01 0.32 0.03Monarca Mnrls* O 250 0.03 0.03 0.03 unch 0.00 0.09 0.02Monarca Mnrls V 72 0.03 0.03 0.03 unch 0.00 0.11 0.03Monarques Res T 140 0.28 0.23 0.27 - 0.01 0.42 0.15Monarques Res* O 96 0.21 0.14 0.19 - 0.01 0.35 0.11Moneta Porcpn T 416 0.12 0.09 0.12 + 0.03 0.20 0.07Moneta Porcpn* O 120 0.09 0.06 0.09 + 0.02 0.15 0.06Monitor Vent* O 100 0.80 0.33 0.60 + 0.16 0.80 0.12Monitor Vent V 133 0.98 0.58 0.79 + 0.20 0.98 0.16Monster Uran* O 0 0.00 0.00 0.04 unch 0.00 0.06 0.02Monster Uran V 28 0.17 0.17 0.17 unch 0.00 1.15 0.13Montan Mg* O 200 0.03 0.03 0.03 unch 0.00 0.04 0.01Montan Mg V 470 0.04 0.03 0.04 unch 0.00 0.11 0.03Montego Res 361 0.10 0.05 0.08 - 0.02 0.55 0.05Montero Mg&Ex * O 7 0.07 0.06 0.06 - 0.01 0.27 0.08Montero Mg&Ex V 125 0.10 0.09 0.09 - 0.01 0.44 0.09Monument Mng V 1288 0.07 0.05 0.06 + 0.01 0.09 0.05Morien Res* O 44 0.41 0.39 0.40 unch 0.00 0.60 0.37Morien Res V 132 0.51 0.50 0.51 + 0.01 0.77 0.46Morumbi Res* O 4 0.40 0.40 0.40 unch 0.00 0.96 0.39Morumbi Res T 17 0.60 0.55 0.57 - 0.04 1.23 0.50Mosaic* N 17896 36.48 34.47 36.00 + 1.00 37.37 22.90Mountain Boy V 179 0.22 0.16 0.22 + 0.03 0.45 0.16Mountain Boy* O 81 0.18 0.12 0.12 - 0.07 0.18 0.03Mountain Prov T 896 1.79 1.54 1.69 - 0.08 3.72 1.54Mountain Prov* D 419 1.35 1.16 1.25 - 0.07 3.00 1.16Mundoro Cap* O 102 0.17 0.14 0.17 + 0.03 0.17 0.06Mundoro Cap V 449 0.23 0.19 0.20 - 0.01 0.22 0.09Murchison Min V 5 0.09 0.00 0.09 unch 0.00 0.25 0.08MX Gold* O 183 0.00 0.00 0.00 - 0.00 0.12 0.00
N-ONA Frac Sand* O 113 0.01 0.01 0.01 unch 0.00 0.02 0.01NACCO Ind* N 63 35.93 33.78 35.11 + 0.33 45.90 28.77Namibia Crit V 50 0.21 0.18 0.21 + 0.02 0.46 0.07Namibia Crit* O 51 0.17 0.13 0.17 + 0.02 2.77 0.07Napier Vent V 3 0.26 0.26 0.26 unch 0.00 0.51 0.20Napier Vent* O 7 0.23 0.19 0.23 - 0.00 0.40 0.19Natural Res Pt* N 267 37.50 35.52 37.00 + 1.41 37.75 24.06Nautilus Mnrls T 887 0.08 0.05 0.05 - 0.02 0.39 0.05Nautilus Mnrls* O 2147 0.06 0.04 0.04 - 0.02 0.31 0.04Navis Res Corp* O 0 0.00 0.00 0.27 unch 0.00 0.56 0.27Navis Res Corp 0 0.00 0.00 0.30 unch 0.00 0.95 0.23Navy Res V 20 0.17 0.17 0.17 unch 0.00 0.32 0.15Nemaska Lith T 5819 0.81 0.74 0.80 + 0.01 2.44 0.60Nemaska Lith* O 1477 0.61 0.55 0.58 - 0.02 1.96 0.46Neo Lithium V 635 0.99 0.83 0.86 - 0.12 2.75 0.83Neometals* O 31 0.21 0.16 0.19 + 0.02 0.80 0.10Network Expl* O 23 0.25 0.22 0.22 - 0.04 0.39 0.21Network Expl V 63 0.33 0.29 0.30 - 0.02 0.48 0.28Nevada Clean M V 286 0.05 0.04 0.04 - 0.01 0.06 0.03Nevada Clean M* O 129 0.04 0.03 0.04 - 0.00 0.04 0.02Nevada Copper T 572 0.40 0.36 0.40 + 0.03 0.84 0.35Nevada Energy* O 12 0.13 0.11 0.11 - 0.00 0.32 0.07Nevada Energy V 17 0.17 0.15 0.15 - 0.02 0.41 0.15Nevada Expl * O 388 0.35 0.28 0.31 - 0.03 0.39 0.09Nevada Expl V 454 0.47 0.39 0.42 - 0.03 0.50 0.12Nevada Sunrise* O 183 0.10 0.08 0.10 unch 0.00 0.19 0.04Nevada Sunrise V 99 0.13 0.12 0.13 + 0.01 0.25 0.06Nevada Zinc V 803 0.13 0.12 0.12 unch 0.00 0.25 0.12Nevado Res V 2502 0.01 0.01 0.01 - 0.01 0.05 0.01Nevsun Res* X 1538 4.54 4.36 4.48 - 0.02 4.54 2.00Nevsun Res T 15141 5.98 5.95 5.95 unch 0.00 5.98 2.50New Age Metals* O 515 0.05 0.04 0.05 - 0.00 0.15 0.03New Age Metals V 635 0.06 0.05 0.06 unch 0.00 0.19 0.05New Carolin Gd* O 64 0.13 0.11 0.13 - 0.00 0.58 0.11New Carolin Gd V 497 0.18 0.15 0.17 - 0.01 0.77 0.15New Destiny Mg V 253 0.16 0.15 0.16 + 0.01 0.35 0.10New Dimen Res V 282 0.06 0.00 0.06 unch 0.00 0.30 0.05New Egy Min* O 125 0.00 0.00 0.00 unch 0.00 0.05 0.00New Energy Met V 1509 0.09 0.07 0.09 + 0.02 0.90 0.05New Gold T 2713 1.15 1.00 1.03 - 0.06 4.45 0.90New Gold* X 11655 0.87 0.76 0.76 - 0.10 3.56 0.70New Jersey Mng* O 522 0.18 0.14 0.18 + 0.01 0.25 0.12New Jersey Mng 75 0.17 0.17 0.17 + 0.02 0.26 0.15New Milln Iron* O 551 0.04 0.04 0.04 - 0.00 0.10 0.04New Milln Iron T 1525 0.05 0.04 0.05 + 0.01 0.13 0.04New Nadina V 56 0.07 0.06 0.06 - 0.01 4.03 0.06New Nadina* O 3 0.07 0.07 0.07 unch 0.00 3.12 0.07New Oroperu V 2 0.31 0.00 0.31 - 0.02 0.53 0.27New Pac Metals* O 11 1.06 0.98 0.98 - 0.08 1.29 0.97New Pac Metals V 46 1.40 1.30 1.40 + 0.05 1.70 1.21New Tech Lith* O 0 0.00 0.00 0.03 unch 0.00 0.13 0.02New Tech Lith 1506 0.04 0.03 0.04 - 0.01 0.17 0.03New World Res V 40 0.25 0.20 0.20 unch 0.00 0.30 0.11New World Res* O 3 0.19 0.19 0.19 unch 0.00 0.20 0.18Newlox Gold 485 0.06 0.03 0.06 + 0.03 0.08 0.03Newmont Mng* N 25460 33.13 31.60 32.34 - 0.12 42.04 29.06Newport Expl V 186 0.24 0.23 0.24 + 0.02 0.38 0.22Newport Gold* O 50 0.03 0.03 0.03 unch 0.00 0.08 0.02NewRange Gold* O 24 0.13 0.13 0.13 - 0.01 0.34 0.05NewRange Gold V 326 0.19 0.15 0.15 - 0.03 0.38 0.07Nexa Resources T 13 17.26 16.27 16.59 - 0.05 26.70 13.90Nexa Resources* N 437 12.97 12.22 12.50 - 0.10 21.61 10.52Nexco Res 280 0.10 0.09 0.09 unch 0.00 0.40 0.09Nexgen Energy* X 1691 2.26 1.99 2.13 + 0.06 2.85 1.65Nexgen Energy T 8305 2.98 2.64 2.84 + 0.11 3.58 2.12NextSource Mat T 624 0.10 0.09 0.10 unch 0.00 0.22 0.05Nexus Gold* O 39 0.08 0.07 0.08 + 0.00 0.29 0.02Nexus Gold V 457 0.11 0.10 0.10 - 0.01 0.65 0.10NGEx Res* O 3 0.79 0.77 0.79 + 0.03 1.10 0.75NGEx Res T 72 1.06 1.00 1.00 - 0.01 1.49 0.91Nickel Creek T 1268 0.11 0.07 0.10 - 0.01 0.35 0.07Nickel Creek* O 2298 0.08 0.04 0.07 - 0.01 0.30 0.04Nickel North V 15 0.03 0.03 0.03 unch 0.00 0.07 0.02Nickel One Res V 1329 0.03 0.02 0.03 + 0.01 0.13 0.02Nicola Mg Inc* O 2 0.09 0.00 0.09 + 0.01 0.16 0.07Nicola Mg Inc V 389 0.12 0.10 0.10 - 0.01 0.21 0.09Nighthawk Gold T 397 0.38 0.35 0.37 unch 0.00 0.76 0.30Nighthawk Gold* O 52 0.28 0.26 0.27 - 0.01 0.63 0.22Niobay Metals V 131 0.29 0.25 0.26 - 0.02 0.43 0.15Niocan Inc V 729 0.36 0.16 0.18 + 0.02 0.36 0.06Niocorp Dev T 185 0.56 0.53 0.53 - 0.02 0.78 0.37Niocorp Dev* O 204 0.43 0.39 0.40 - 0.02 0.62 0.29Nippon Dragon V 207 0.02 0.00 0.02 - 0.01 0.07 0.02Nippon Dragon* O 56 0.01 0.01 0.01 - 0.00 0.05 0.01Nitinat Mnls* O 40 0.05 0.05 0.05 unch 0.00 0.36 0.03Nitinat Mnls V 203 0.07 0.00 0.06 - 0.01 0.51 0.05Noble Metal Gr V 50 0.01 0.01 0.01 unch 0.00 0.04 0.01Noble Mnl Expl* O 30 0.07 0.07 0.07 unch 0.00 0.13 0.04Noble Mnl Expl V 126 0.10 0.09 0.10 unch 0.00 0.17 0.06Noka Res* O 402 0.21 0.18 0.18 - 0.03 0.71 0.17Noram Vent* O 23 0.21 0.21 0.21 unch 0.00 0.64 0.09Noram Vent V 71 0.30 0.28 0.30 + 0.02 0.80 0.12Noranda Alum* O 165 0.03 0.02 0.03 + 0.00 0.17 0.01Noront Res V 515 0.27 0.25 0.26 - 0.01 0.45 0.25Norsemont Cap 14 0.38 0.38 0.38 unch 0.00 0.47 0.32Nortec Mnls* O 32 0.03 0.00 0.00 - 0.02 0.14 0.00Nortec Mnls V 14 0.05 0.04 0.05 + 0.01 0.18 0.04North Am Nickl V 315 0.05 0.05 0.05 + 0.01 0.10 0.04North Am Nickl* O 310 0.04 0.03 0.03 - 0.00 0.08 0.03North Am Pall T 42 11.72 10.10 11.00 - 0.50 13.35 6.99North Am Pall* O 45 8.90 7.68 8.28 - 0.37 10.11 5.48North Arrow Mn* O 160 0.08 0.08 0.08 unch 0.00 0.20 0.08North Arrow Mn V 110 0.12 0.11 0.11 - 0.01 0.26 0.11North Bay Res * O 13345 0.00 0.00 0.00 + 0.00 0.00 0.00Northcliff Res T 82 0.07 0.06 0.06 - 0.02 0.16 0.07Northern Light 270 0.09 0.04 0.08 + 0.02 0.15 0.04Northern Uran V 106 0.01 0.01 0.01 + 0.01 0.03 0.01Northern Uran* O 1 0.01 0.01 0.01 unch 0.00 0.01 0.01Northisle C&G V 215 0.10 0.09 0.09 unch 0.00 0.21 0.08Norvista Cap V 262 0.09 0.07 0.08 - 0.01 0.15 0.07NorZinc T 715 0.11 0.08 0.10 + 0.01 0.18 0.08NorZinc* O 150 0.08 0.07 0.08 + 0.01 0.15 0.05
20-22_DEC10_StockTables.indd 22 2018-12-04 1:39 PM
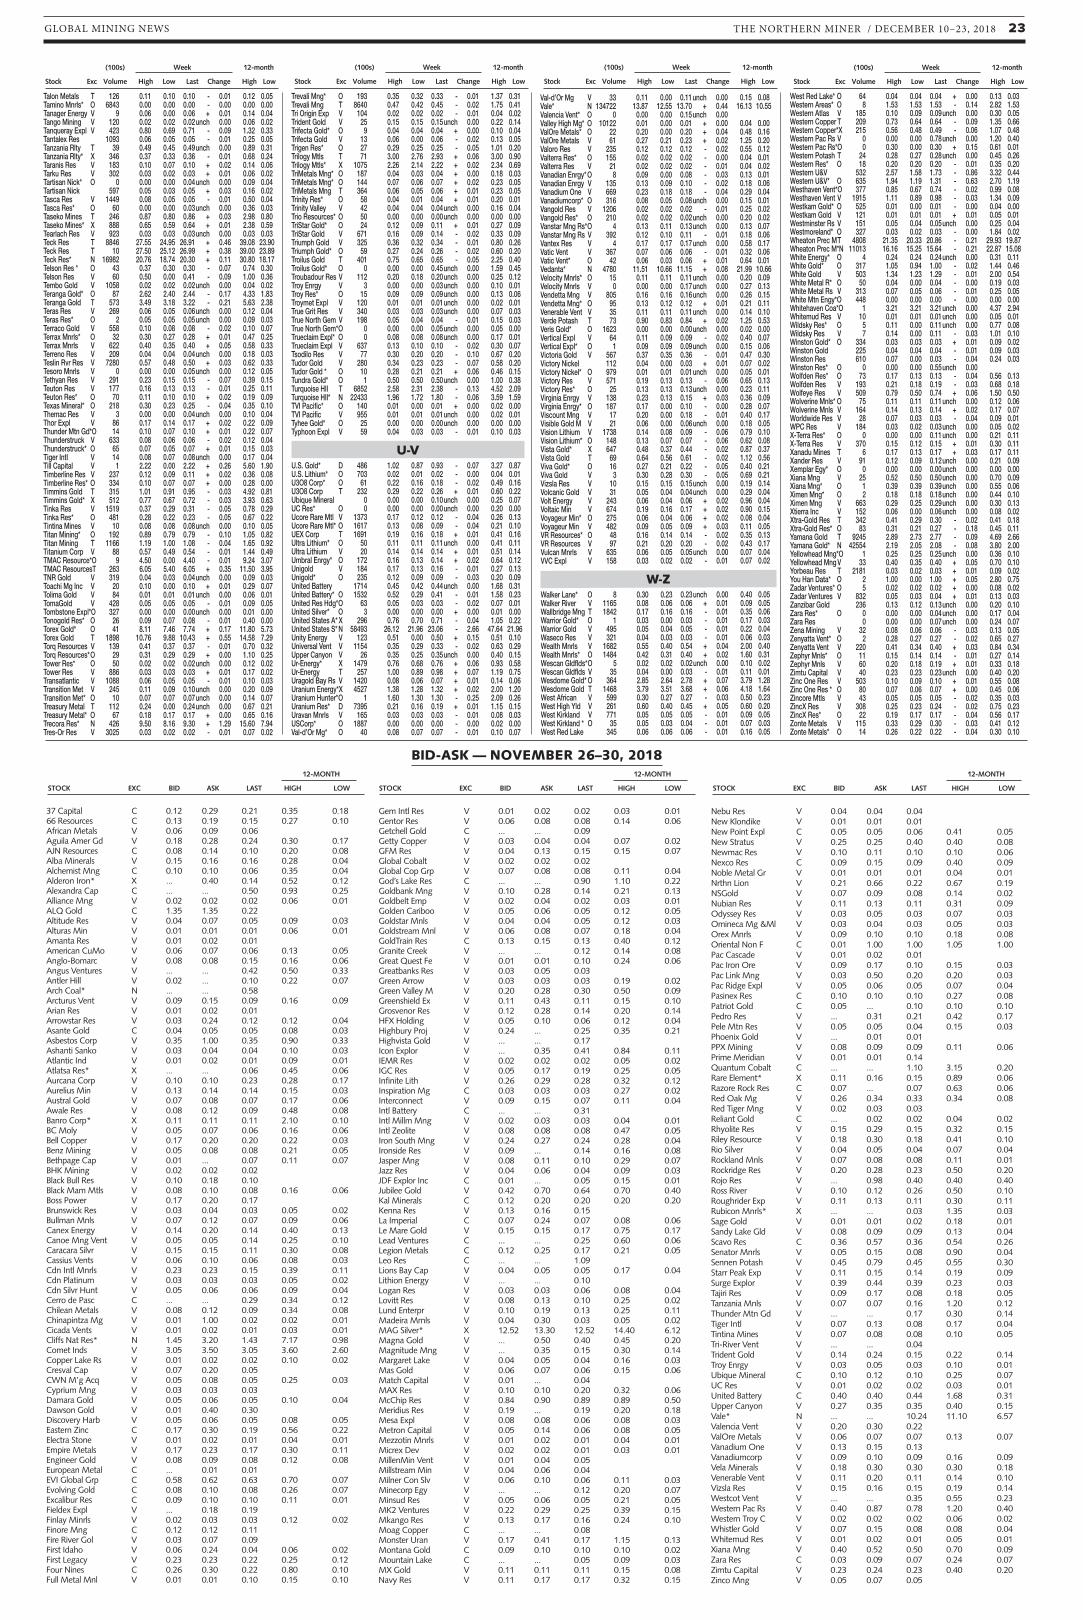
GLOBAL MINING NEWS THE NORTHERN MINER / DECEMBER 10–23, 2018 23
(100s) Week 12-month
Stock Exc Volume High Low Last Change High Low
(100s) Week 12-month
Stock Exc Volume High Low Last Change High Low
(100s) Week 12-month
Stock Exc Volume High Low Last Change High Low
(100s) Week 12-month
Stock Exc Volume High Low Last Change High Low
37 Capital C 0.12 0.29 0.21 0.35 0.1866 Resources C 0.13 0.19 0.15 0.27 0.10African Metals V 0.06 0.09 0.06 Aguila Amer Gd V 0.18 0.28 0.24 0.30 0.17AJN Resources C 0.08 0.14 0.10 0.20 0.08Alba Minerals V 0.15 0.16 0.16 0.28 0.04Alchemist Mng C 0.10 0.10 0.06 0.35 0.04Alderon Iron* X ... 0.40 0.14 0.52 0.12Alexandra Cap C ... ... 0.50 0.93 0.25Alliance Mng V 0.02 0.02 0.02 0.06 0.01ALQ Gold C 1.35 1.35 0.22 Altitude Res V 0.04 0.07 0.05 0.09 0.03Alturas Min V 0.01 0.01 0.01 0.06 0.01Amanta Res V 0.01 0.02 0.01 American CuMo V 0.06 0.07 0.06 0.13 0.05Anglo-Bomarc V 0.08 0.08 0.15 0.16 0.06Angus Ventures V ... ... 0.42 0.50 0.33Antler Hill V 0.02 ... 0.10 0.22 0.07Arch Coal* N ... ... 0.58 Arcturus Vent V 0.09 0.15 0.09 0.16 0.09Arian Res V 0.01 0.02 0.01 Arrowstar Res V 0.03 0.24 0.12 0.12 0.04Asante Gold C 0.04 0.05 0.05 0.08 0.03Asbestos Corp V 0.35 1.00 0.35 0.90 0.33Ashanti Sanko V 0.03 0.04 0.04 0.10 0.03Atlantic Ind V 0.01 0.02 0.01 0.09 0.01Atlatsa Res* X ... ... 0.06 0.45 0.06Aurcana Corp V 0.10 0.10 0.23 0.28 0.17Aurelius Min V 0.13 0.14 0.14 0.15 0.03Austral Gold V 0.07 0.08 0.07 0.17 0.06Awale Res V 0.08 0.12 0.09 0.48 0.08Banro Corp* X 0.11 0.11 0.11 2.10 0.10BC Moly V 0.05 0.07 0.06 0.16 0.06Bell Copper V 0.17 0.20 0.20 0.22 0.03Benz Mining V 0.05 0.08 0.08 0.21 0.05Bethpage Cap V 0.01 ... 0.07 0.11 0.07BHK Mining V 0.02 0.02 0.02 Black Bull Res V 0.10 0.18 0.10 Black Mam Mtls V 0.08 0.10 0.08 0.16 0.06Boss Power V 0.17 0.20 0.17 Brunswick Res V 0.03 0.04 0.03 0.05 0.02Bullman Mnls V 0.07 0.12 0.07 0.09 0.06Canex Energy V 0.14 0.20 0.14 0.40 0.13Canoe Mng Vent V 0.05 0.05 0.14 0.25 0.10Caracara Silvr V 0.15 0.15 0.11 0.30 0.08Cassius Vents V 0.06 0.10 0.06 0.08 0.03Cdn Intl Mnrls V 0.23 0.23 0.15 0.39 0.11Cdn Platinum V 0.03 0.03 0.03 0.05 0.02Cdn Silvr Hunt V 0.05 0.06 0.06 0.09 0.04Cerro de Pasc C ... ... 0.29 0.34 0.12Chilean Metals V 0.08 0.12 0.09 0.34 0.08Chinapintza Mg V 0.01 1.00 0.02 0.02 0.01Cicada Vents V 0.01 0.02 0.01 0.03 0.01Cliffs Nat Res* N 1.45 3.20 1.43 7.17 0.98Comet Inds V 3.05 3.50 3.05 3.60 2.60Copper Lake Rs V 0.01 0.02 0.02 0.10 0.02Cresval Cap V 0.07 0.20 0.05 CWN M’g Acq V 0.05 0.08 0.05 0.25 0.03Cyprium Mng V 0.03 0.03 0.03 Damara Gold V 0.05 0.06 0.05 0.10 0.04Dawson Gold V 0.01 0.40 0.30 Discovery Harb V 0.05 0.06 0.05 0.08 0.05Eastern Zinc C 0.17 0.30 0.19 0.56 0.22Electra Stone V 0.01 0.02 0.01 0.04 0.01Empire Metals V 0.17 0.23 0.17 0.30 0.11Engineer Gold V 0.08 0.09 0.08 0.12 0.08European Metal C ... 0.01 0.01 EVI Global Grp C 0.58 0.62 0.63 0.70 0.07Evolving Gold C 0.08 0.10 0.08 0.26 0.07Excalibur Res C 0.09 0.10 0.10 0.11 0.01Fieldex Expl V ... 0.18 0.19 Finlay Minrls V 0.02 0.03 0.03 0.12 0.02Finore Mng C 0.12 0.12 0.11 Fire River Gol V 0.03 0.07 0.09 First Idaho V 0.06 0.24 0.04 0.06 0.02First Legacy V 0.23 0.23 0.22 0.25 0.12Four Nines C 0.26 0.30 0.22 0.80 0.10Full Metal Mnl V 0.01 0.01 0.10 0.15 0.10
Gem Intl Res V 0.01 0.02 0.02 0.03 0.01Gentor Res V 0.06 0.08 0.08 0.14 0.06Getchell Gold C ... ... 0.09 Getty Copper V 0.03 0.04 0.04 0.07 0.02GFM Res V 0.04 0.13 0.15 0.15 0.07Global Cobalt V 0.02 0.02 0.02 Global Cop Grp V 0.07 0.08 0.08 0.11 0.04God’s Lake Res C ... ... 0.90 1.10 0.22Goldbank Mng V 0.10 0.28 0.14 0.21 0.13Goldbelt Emp V 0.02 0.04 0.02 0.03 0.01Golden Cariboo V 0.05 0.06 0.05 0.12 0.05Goldstar Mnls V 0.04 0.04 0.05 0.12 0.03Goldstream Mnl V 0.06 0.08 0.07 0.18 0.04GoldTrain Res C 0.13 0.15 0.13 0.40 0.12Granite Creek V ... ... 0.12 0.14 0.08Great Quest Fe V 0.01 0.01 0.10 0.24 0.06Greatbanks Res V 0.03 0.05 0.03 Green Arrow V 0.03 0.03 0.03 0.19 0.02Green Valley M V 0.20 0.28 0.30 0.50 0.09Greenshield Ex V 0.11 0.43 0.11 0.15 0.10Grosvenor Res V 0.12 0.28 0.14 0.20 0.14HFX Holding V 0.05 0.10 0.06 0.12 0.04Highbury Proj V 0.24 ... 0.25 0.35 0.21Highvista Gold V ... ... 0.17 Icon Explor V ... 0.35 0.41 0.84 0.11IEMR Res V 0.02 0.02 0.02 0.05 0.02IGC Res V 0.05 0.17 0.19 0.25 0.05Infinite Lith V 0.26 0.29 0.28 0.32 0.12Inspiration Mg C 0.03 0.03 0.03 0.27 0.02Interconnect V 0.09 0.15 0.07 0.11 0.04Intl Battery C ... ... 0.31 Intl Millm Mng V 0.02 0.03 0.03 0.04 0.01Intl Zeolite V 0.08 0.08 0.08 0.47 0.05Iron South Mng V 0.24 0.27 0.24 0.28 0.04Ironside Res V 0.09 ... 0.14 0.16 0.08Jasper Mng V 0.08 0.11 0.10 0.29 0.07Jazz Res V 0.04 0.06 0.04 0.09 0.03JDF Explor Inc C 0.01 ... 0.05 0.15 0.01Jubilee Gold V 0.42 0.70 0.64 0.70 0.40Kal Minerals C 0.12 0.20 0.20 0.20 0.20Kenna Res V 0.13 0.16 0.15 La Imperial C 0.07 0.24 0.07 0.08 0.06Le Mare Gold V 0.15 0.15 0.17 0.75 0.17Lead Ventures C ... ... 0.25 0.60 0.06Legion Metals C 0.12 0.25 0.17 0.21 0.05Leo Res C ... ... 1.09 Lions Bay Cap V 0.04 0.05 0.05 0.17 0.04Lithion Energy V ... ... 0.10 Logan Res V 0.03 0.03 0.06 0.08 0.04Lovitt Res V 0.08 0.13 0.10 0.25 0.02Lund Enterpr V 0.10 0.19 0.13 0.25 0.11Madeira Mrnls V 0.04 0.30 0.03 0.05 0.02MAG Silver* X 12.52 13.30 12.52 14.40 6.12Magna Gold V ... 0.50 0.40 0.45 0.20Magnitude Mng V ... 0.35 0.15 0.30 0.14Margaret Lake V 0.04 0.05 0.04 0.16 0.03Mas Gold V 0.06 0.07 0.06 0.15 0.06Match Capital V 0.01 ... 0.04 MAX Res V 0.10 0.10 0.20 0.32 0.06McChip Res V 0.84 0.90 0.89 0.89 0.50Meridius Res V 0.19 ... 0.19 0.20 0.18Mesa Expl V 0.08 0.08 0.06 0.08 0.03Metron Capital V 0.05 0.14 0.06 0.08 0.05Mezzotin Mnrls V 0.01 0.02 0.01 0.04 0.01Micrex Dev V 0.02 0.02 0.01 0.03 0.01MillenMin Vent V 0.01 0.04 0.05 Millstream Min V 0.04 0.06 0.04 Milner Con Slv V 0.06 0.10 0.06 0.11 0.03Minecorp Egy V ... ... 0.12 0.20 0.07Minsud Res V 0.05 0.06 0.05 0.21 0.05MK2 Ventures V 0.22 0.29 0.25 0.39 0.15Mkango Res V 0.13 0.17 0.16 0.24 0.10Moag Copper C ... ... 0.08 Monster Uran V 0.17 0.41 0.17 1.15 0.13Montana Gold C 0.09 0.10 0.10 0.10 0.02Mountain Lake C ... ... 0.05 0.09 0.03MX Gold V 0.11 0.11 0.11 0.15 0.08Navy Res V 0.11 0.17 0.17 0.32 0.15
Nebu Res V 0.04 0.04 0.04 New Klondike V 0.01 0.01 0.01 New Point Expl C 0.05 0.05 0.06 0.41 0.05New Stratus V 0.25 0.25 0.40 0.40 0.08Newmac Res V 0.10 0.11 0.10 0.10 0.06Nexco Res C 0.09 0.15 0.09 0.40 0.09Noble Metal Gr V 0.01 0.01 0.01 0.04 0.01Nrthn Lion V 0.21 0.66 0.22 0.67 0.19NSGold V 0.07 0.09 0.08 0.14 0.02Nubian Res V 0.11 0.13 0.11 0.31 0.09Odyssey Res V 0.03 0.05 0.03 0.07 0.03Omineca Mg &Ml V 0.03 0.04 0.03 0.05 0.03Orex Mnrls V 0.09 0.10 0.10 0.18 0.08Oriental Non F C 0.01 1.00 1.00 1.05 1.00Pac Cascade V 0.01 0.02 0.01 Pac Iron Ore V 0.09 0.17 0.10 0.15 0.03Pac Link Mng V 0.03 0.50 0.20 0.20 0.03Pac Ridge Expl V 0.05 0.06 0.05 0.07 0.04Pasinex Res C 0.10 0.10 0.10 0.27 0.08Patriot Gold C 0.05 ... 0.10 0.10 0.10Pedro Res V ... 0.31 0.21 0.42 0.17Pele Mtn Res V 0.05 0.05 0.04 0.15 0.03Phoenix Gold V ... 0.01 0.01 PPX Mining V 0.08 0.09 0.09 0.11 0.06Prime Meridian V 0.01 0.01 0.14 Quantum Cobalt C ... ... 1.10 3.15 0.20Rare Element* X 0.11 0.16 0.15 0.89 0.06Razore Rock Res C 0.07 ... 0.07 0.63 0.06Red Oak Mg V 0.26 0.34 0.33 0.34 0.08Red Tiger Mng V 0.02 0.03 0.03 Reliant Gold C ... 0.02 0.02 0.04 0.02Rhyolite Res V 0.15 0.29 0.15 0.32 0.15Riley Resource V 0.18 0.30 0.18 0.41 0.10Rio Silver V 0.04 0.05 0.04 0.07 0.04Rockland Mnls V 0.07 0.08 0.08 0.11 0.01Rockridge Res V 0.20 0.28 0.23 0.50 0.20Rojo Res V ... 0.98 0.40 0.40 0.40Ross River V 0.10 0.12 0.26 0.50 0.10Roughrider Exp V 0.11 0.13 0.11 0.30 0.11Rubicon Mnrls* X ... ... 0.03 1.35 0.03Sage Gold V 0.01 0.01 0.02 0.18 0.01Sandy Lake Gld V 0.08 0.09 0.09 0.13 0.04Scavo Res C 0.36 0.57 0.36 0.54 0.26Senator Mnrls V 0.05 0.15 0.08 0.90 0.04Sennen Potash V 0.45 0.79 0.45 0.55 0.30Starr Peak Exp V 0.11 0.15 0.14 0.19 0.09Surge Explor V 0.39 0.44 0.39 0.23 0.03Tajiri Res V 0.09 0.17 0.08 0.18 0.05Tanzania Mnls V 0.07 0.07 0.16 1.20 0.12Thunder Mtn Gd V ... ... 0.17 0.30 0.14Tiger Intl V 0.07 0.13 0.08 0.17 0.04Tintina Mines V 0.07 0.08 0.08 0.10 0.05Tri-River Vent V ... ... 0.04 Trident Gold V 0.14 0.24 0.15 0.22 0.14Troy Enrgy V 0.03 0.05 0.03 0.10 0.01Ubique Mineral C 0.10 0.12 0.10 0.25 0.07UC Res V 0.01 0.02 0.02 0.03 0.01United Battery C 0.40 0.40 0.44 1.68 0.31Upper Canyon V 0.27 0.35 0.35 0.40 0.15Vale* N ... ... 10.24 11.10 6.57Valencia Vent V 0.20 0.30 0.22 ValOre Metals V 0.06 0.07 0.07 0.13 0.07Vanadium One V 0.13 0.15 0.13 Vanadiumcorp V 0.09 0.10 0.09 0.16 0.09Vela Minerals V 0.18 0.30 0.30 0.30 0.18Venerable Vent V 0.11 0.20 0.11 0.14 0.10Vizsla Res V 0.15 0.16 0.15 0.19 0.14Westcot Vent V ... ... 0.35 0.55 0.23Western Pac Rs V 0.40 0.87 0.78 1.20 0.40Western Troy C V 0.02 0.02 0.02 0.06 0.02Whistler Gold V 0.07 0.15 0.08 0.08 0.04Whitemud Res V 0.01 0.02 0.01 0.05 0.01Xiana Mng V 0.40 0.52 0.50 0.70 0.09Zara Res C 0.03 0.09 0.07 0.24 0.07Zimtu Capital V 0.23 0.24 0.23 0.40 0.20Zinco Mng V 0.05 0.07 0.05
BID-ASK — NOVEMBER 26–30, 2018 12-MONTH
STOCK EXC BID ASK LAST HIGH LOW
12-MONTH
STOCK EXC BID ASK LAST HIGH LOW
12-MONTH
STOCK EXC BID ASK LAST HIGH LOW
West Red Lake* O 64 0.04 0.04 0.04 + 0.00 0.13 0.03Western Areas* O 8 1.53 1.53 1.53 - 0.14 2.82 1.53Western Atlas V 185 0.10 0.09 0.09 unch 0.00 0.30 0.05Western Copper T 209 0.73 0.64 0.64 - 0.09 1.35 0.66Western Copper* X 215 0.56 0.48 0.49 - 0.06 1.07 0.48Western Pac Rs V 0 0.00 0.00 0.78 unch 0.00 1.20 0.40Western Pac Rs* O 0 0.30 0.00 0.30 + 0.15 0.61 0.01Western Potash T 24 0.28 0.27 0.28 unch 0.00 0.45 0.26Western Res* O 18 0.20 0.20 0.20 - 0.01 0.35 0.20Western U&V 532 2.57 1.58 1.73 - 0.86 3.32 0.44Western U&V* O 635 1.94 1.19 1.31 - 0.63 2.70 1.19Westhaven Vent* O 377 0.85 0.67 0.74 - 0.02 0.99 0.08Westhaven Vent V 1915 1.11 0.89 0.98 - 0.03 1.34 0.09Westkam Gold* O 525 0.01 0.00 0.01 - 0.00 0.04 0.00Westkam Gold V 121 0.01 0.01 0.01 + 0.01 0.05 0.01Westminster Rs V 151 0.05 0.04 0.05 unch 0.00 0.25 0.04Westmoreland* O 327 0.03 0.02 0.03 - 0.00 1.84 0.02Wheaton Prec M T 4808 21.35 20.33 20.86 - 0.21 29.93 19.87Wheaton Prec M* N 11013 16.16 15.25 15.64 - 0.21 22.87 15.08White Energy* O 4 0.24 0.24 0.24 unch 0.00 0.31 0.11White Gold* O 317 1.05 0.94 1.00 - 0.02 1.44 0.46White Gold V 503 1.34 1.23 1.29 - 0.01 2.00 0.54White Metal R* O 50 0.04 0.00 0.04 - 0.00 0.19 0.03White Metal Rs V 313 0.07 0.05 0.06 - 0.01 0.25 0.05White Mtn Engy* O 448 0.00 0.00 0.00 - 0.00 0.00 0.00Whitehaven Coa* O 1 3.21 3.21 3.21 unch 0.00 4.37 2.94Whitemud Res V 10 0.01 0.01 0.01 unch 0.00 0.05 0.01Wildsky Res* O 5 0.11 0.00 0.11 unch 0.00 0.77 0.08Wildsky Res V 7 0.14 0.00 0.11 - 0.03 1.01 0.10Winston Gold* O 334 0.03 0.03 0.03 + 0.01 0.09 0.02Winston Gold 225 0.04 0.04 0.04 - 0.01 0.09 0.03Winston Res 610 0.07 0.00 0.03 - 0.04 0.24 0.03Winston Res* O 0 0.00 0.00 0.55 unch 0.00 Wolfden Res* O 73 0.17 0.13 0.13 - 0.04 0.56 0.13Wolfden Res V 193 0.21 0.18 0.19 - 0.03 0.68 0.18Wolfeye Res V 509 0.79 0.50 0.74 + 0.06 1.50 0.50Wolverine Mnls* O 75 0.11 0.11 0.11 unch 0.00 0.12 0.06Wolverine Mnls V 164 0.14 0.13 0.14 + 0.02 0.17 0.07Worldwide Res V 28 0.07 0.03 0.03 - 0.04 0.09 0.01WPC Res V 184 0.03 0.02 0.03 unch 0.00 0.05 0.02X-Terra Res* O 0 0.00 0.00 0.11 unch 0.00 0.21 0.11X-Terra Res V 370 0.15 0.12 0.15 + 0.01 0.30 0.11Xanadu Mines T 6 0.17 0.13 0.17 + 0.03 0.17 0.11Xander Res V 91 0.12 0.09 0.12 unch 0.00 0.21 0.09Xemplar Egy* O 0 0.00 0.00 0.00 unch 0.00 0.00 0.00Xiana Mng V 25 0.52 0.50 0.50 unch 0.00 0.70 0.09Xiana Mng* O 1 0.39 0.39 0.39 unch 0.00 0.55 0.06Ximen Mng* O 2 0.18 0.18 0.18 unch 0.00 0.44 0.10Ximen Mng V 663 0.29 0.25 0.29 unch 0.00 0.30 0.13Xtierra Inc V 152 0.06 0.00 0.06 unch 0.00 0.08 0.02Xtra-Gold Res T 342 0.41 0.29 0.30 - 0.02 0.41 0.18Xtra-Gold Res* O 83 0.31 0.21 0.27 - 0.18 0.45 0.11Yamana Gold T 9245 2.89 2.73 2.77 - 0.09 4.69 2.66Yamana Gold* N 42554 2.19 2.05 2.08 - 0.08 3.80 2.00Yellowhead Mng* O 1 0.25 0.25 0.25 unch 0.00 0.36 0.10Yellowhead Mng V 33 0.40 0.35 0.40 + 0.05 0.70 0.10Yorbeau Res T 2181 0.03 0.02 0.03 + 0.01 0.09 0.02You Han Data* O 2 1.00 0.00 1.00 + 0.05 2.80 0.75Zadar Ventures* O 5 0.02 0.02 0.02 + 0.00 0.08 0.02Zadar Ventures V 832 0.05 0.03 0.04 + 0.01 0.13 0.03Zanzibar Gold 236 0.13 0.12 0.13 unch 0.00 0.20 0.10Zara Res* O 0 0.00 0.00 0.04 unch 0.00 0.17 0.04Zara Res 0 0.00 0.00 0.07 unch 0.00 0.24 0.07Zena Mining V 32 0.08 0.06 0.06 - 0.03 0.13 0.05Zenyatta Vent* O 2 0.28 0.27 0.27 - 0.02 0.65 0.27Zenyatta Vent V 220 0.41 0.34 0.40 + 0.03 0.84 0.34Zephyr Mnls* O 11 0.15 0.14 0.14 - 0.01 0.27 0.14Zephyr Mnls V 60 0.20 0.18 0.19 + 0.01 0.33 0.18Zimtu Capital V 40 0.23 0.23 0.23 unch 0.00 0.40 0.20Zinc One Res V 503 0.10 0.09 0.10 + 0.01 0.55 0.08Zinc One Res * O 80 0.07 0.06 0.07 + 0.00 0.45 0.06Zincore Mtls V 43 0.05 0.05 0.05 - 0.02 0.35 0.03ZincX Res V 308 0.25 0.23 0.24 - 0.02 0.75 0.23ZincX Res* O 22 0.19 0.17 0.17 - 0.04 0.56 0.17Zonte Metals V 115 0.33 0.29 0.30 - 0.03 0.41 0.12Zonte Metals* O 14 0.26 0.22 0.22 - 0.04 0.30 0.10
Val-d’Or Mg V 33 0.11 0.00 0.11 unch 0.00 0.15 0.08Vale* N 134722 13.87 12.55 13.70 + 0.44 16.13 10.55Valencia Vent* O 0 0.00 0.00 0.15 unch 0.00 Valley High Mg* O 10122 0.01 0.00 0.01 + 0.00 0.04 0.00ValOre Metals* O 22 0.20 0.00 0.20 + 0.04 0.48 0.16ValOre Metals V 61 0.27 0.21 0.23 + 0.02 1.25 0.20Valoro Res V 235 0.12 0.12 0.12 - 0.02 0.55 0.12Valterra Res* O 155 0.02 0.02 0.02 - 0.00 0.04 0.01Valterra Res V 21 0.02 0.02 0.02 - 0.01 0.04 0.02Vanadian Enrgy* O 8 0.09 0.00 0.08 - 0.03 0.13 0.01Vanadian Enrgy V 135 0.13 0.09 0.10 - 0.02 0.18 0.06Vanadium One V 669 0.23 0.18 0.18 - 0.04 0.29 0.04Vanadiumcorp* O 316 0.08 0.05 0.08 unch 0.00 0.15 0.01Vangold Res V 1206 0.02 0.02 0.02 - 0.01 0.25 0.02Vangold Res* O 210 0.02 0.02 0.02 unch 0.00 0.20 0.02Vanstar Mng Rs* O 4 0.13 0.11 0.13 unch 0.00 0.13 0.07Vanstar Mng Rs V 392 0.12 0.10 0.11 - 0.01 0.18 0.06Vantex Res V 4 0.17 0.17 0.17 unch 0.00 0.58 0.17Vatic Vent V 367 0.07 0.06 0.06 - 0.01 0.32 0.06Vatic Vent* O 42 0.06 0.03 0.06 + 0.01 0.64 0.01Vedanta* N 4780 11.51 10.66 11.15 + 0.08 21.99 10.66Velocity Mnrls* O 15 0.11 0.11 0.11 unch 0.00 0.20 0.09Velocity Mnrls V 0 0.00 0.00 0.17 unch 0.00 0.27 0.13Vendetta Mng V 805 0.16 0.16 0.16 unch 0.00 0.26 0.15Vendetta Mng* O 95 0.13 0.12 0.12 + 0.01 0.21 0.11Venerable Vent V 35 0.11 0.11 0.11 unch 0.00 0.14 0.10Verde Potash T 73 0.90 0.83 0.84 + 0.02 1.25 0.53Veris Gold* O 1623 0.00 0.00 0.00 unch 0.00 0.02 0.00Vertical Expl V 64 0.11 0.09 0.09 - 0.02 0.40 0.07Vertical Expl* O 1 0.09 0.09 0.09 unch 0.00 0.15 0.06Victoria Gold V 567 0.37 0.35 0.36 - 0.01 0.47 0.30Victory Nickel 112 0.04 0.00 0.03 + 0.01 0.07 0.02Victory Nickel* O 979 0.01 0.01 0.01 unch 0.00 0.05 0.01Victory Res V 571 0.19 0.13 0.13 - 0.06 0.65 0.13Victory Res* O 25 0.13 0.13 0.13 unch 0.00 0.23 0.11Virginia Enrgy V 138 0.23 0.13 0.15 + 0.03 0.36 0.09Virginia Enrgy* O 187 0.17 0.00 0.10 - 0.00 0.28 0.07Viscount Mng V 17 0.20 0.00 0.18 - 0.01 0.40 0.17Visible Gold M V 21 0.06 0.00 0.06 unch 0.00 0.18 0.05Vision Lithium V 1738 0.14 0.08 0.09 - 0.06 0.79 0.10Vision Lithium* O 148 0.13 0.07 0.07 - 0.06 0.62 0.08Vista Gold* X 647 0.48 0.37 0.44 - 0.02 0.87 0.37Vista Gold T 69 0.64 0.56 0.61 - 0.02 1.12 0.56Viva Gold* O 16 0.27 0.21 0.22 - 0.05 0.40 0.21Viva Gold V 3 0.30 0.28 0.30 - 0.05 0.69 0.21Vizsla Res V 10 0.15 0.15 0.15 unch 0.00 0.19 0.14Volcanic Gold V 31 0.05 0.04 0.04 unch 0.00 0.29 0.04Volt Energy V 243 0.06 0.04 0.06 + 0.02 0.96 0.04Voltaic Min V 674 0.19 0.16 0.17 + 0.02 0.90 0.15Voyageur Min* O 275 0.06 0.04 0.06 + 0.02 0.08 0.04Voyageur Min V 482 0.09 0.05 0.09 + 0.03 0.11 0.05VR Resources* O 48 0.16 0.14 0.14 - 0.02 0.35 0.13VR Resources V 97 0.21 0.20 0.20 - 0.02 0.43 0.17Vulcan Mnrls V 635 0.06 0.05 0.05 unch 0.00 0.07 0.04VVC Expl V 158 0.03 0.02 0.02 - 0.01 0.07 0.02
W-ZWalker Lane* O 8 0.30 0.23 0.23 unch 0.00 0.40 0.05Walker River V 1165 0.08 0.06 0.06 + 0.01 0.09 0.05Wallbridge Mng T 1842 0.17 0.16 0.16 - 0.01 0.35 0.06Warrior Gold* O 1 0.03 0.00 0.03 - 0.01 0.17 0.03Warrior Gold V 495 0.05 0.04 0.05 - 0.01 0.22 0.04Waseco Res V 321 0.04 0.03 0.03 - 0.01 0.06 0.03Wealth Mnrls V 1682 0.55 0.40 0.54 + 0.04 2.00 0.40Wealth Mnrls* O 1484 0.42 0.31 0.40 + 0.02 1.60 0.31Wescan Gldflds* O 5 0.02 0.02 0.02 unch 0.00 0.10 0.02Wescan Gldflds V 35 0.04 0.00 0.03 - 0.01 0.11 0.01Wesdome Gold* O 364 2.85 2.64 2.78 + 0.07 3.79 1.28Wesdome Gold T 1468 3.79 3.51 3.68 + 0.06 4.18 1.64West African V 599 0.30 0.27 0.27 - 0.03 0.50 0.23West High Yld V 261 0.60 0.40 0.45 + 0.05 0.60 0.20West Kirkland V 771 0.05 0.05 0.05 - 0.01 0.09 0.05West Kirkland * O 35 0.05 0.03 0.04 - 0.01 0.07 0.03West Red Lake 345 0.06 0.06 0.06 - 0.01 0.16 0.05
Talon Metals T 126 0.11 0.10 0.10 - 0.01 0.12 0.05Tamino Mnrls* O 6843 0.00 0.00 0.00 - 0.00 0.00 0.00Tanager Energy V 9 0.06 0.00 0.06 + 0.01 0.14 0.04Tango Mining V 120 0.02 0.02 0.02 unch 0.00 0.06 0.02Tanqueray Expl V 423 0.80 0.69 0.71 - 0.09 1.32 0.33Tantalex Res 1093 0.06 0.05 0.05 - 0.01 0.25 0.05Tanzania Rlty T 39 0.49 0.45 0.49 unch 0.00 0.89 0.31Tanzania Rlty* X 346 0.37 0.33 0.36 - 0.01 0.68 0.24Taranis Res V 183 0.10 0.07 0.10 + 0.02 0.14 0.06Tarku Res V 302 0.03 0.02 0.03 + 0.01 0.06 0.02Tartisan Nick* O 0 0.00 0.00 0.04 unch 0.00 0.09 0.04Tartisan Nick 597 0.05 0.03 0.05 + 0.03 0.16 0.02Tasca Res V 1449 0.08 0.05 0.05 - 0.01 0.50 0.04Tasca Res* O 60 0.00 0.00 0.03 unch 0.00 0.36 0.03Taseko Mines T 246 0.87 0.80 0.86 + 0.03 2.98 0.80Taseko Mines* X 888 0.65 0.59 0.64 + 0.01 2.38 0.59Tearlach Res V 923 0.03 0.03 0.03 unch 0.00 0.03 0.03Teck Res T 8846 27.55 24.95 26.91 + 0.46 39.08 23.90Teck Res T 10 27.50 25.12 26.99 + 0.38 39.00 23.89Teck Res* N 16982 20.76 18.74 20.30 + 0.11 30.80 18.17Telson Res * O 43 0.37 0.30 0.30 - 0.07 0.74 0.30Telson Res V 60 0.50 0.00 0.41 - 0.09 1.00 0.36Tembo Gold V 1058 0.02 0.02 0.02 unch 0.00 0.04 0.02Teranga Gold* O 87 2.62 2.40 2.44 - 0.17 4.33 1.83Teranga Gold T 573 3.49 3.18 3.22 - 0.21 5.63 2.38Teras Res V 269 0.06 0.05 0.06 unch 0.00 0.12 0.04Teras Res* O 2 0.05 0.05 0.05 unch 0.00 0.09 0.03Terraco Gold V 558 0.10 0.08 0.08 - 0.02 0.10 0.07Terrax Mnrls* O 32 0.30 0.27 0.28 + 0.01 0.47 0.25Terrax Mnrls V 622 0.40 0.35 0.40 + 0.05 0.58 0.33Terreno Res V 209 0.04 0.04 0.04 unch 0.00 0.18 0.03Teslin Rvr Res V 7280 0.57 0.48 0.50 + 0.03 0.62 0.33Tesoro Mnrls V 0 0.00 0.00 0.05 unch 0.00 0.12 0.05Tethyan Res V 291 0.23 0.15 0.15 - 0.07 0.39 0.15Teuton Res V 177 0.16 0.13 0.13 - 0.01 0.25 0.11Teuton Res* O 70 0.11 0.10 0.10 + 0.02 0.19 0.09Texas Mineral* O 218 0.30 0.23 0.25 - 0.04 0.35 0.10Themac Res V 3 0.00 0.00 0.04 unch 0.00 0.10 0.04Thor Expl V 86 0.17 0.14 0.17 + 0.02 0.22 0.09Thunder Mtn Gd* O 14 0.10 0.07 0.10 + 0.01 0.22 0.07Thunderstruck V 633 0.08 0.06 0.06 - 0.02 0.12 0.04Thunderstruck* O 65 0.07 0.05 0.07 + 0.01 0.15 0.03Tiger Intl V 14 0.08 0.07 0.08 unch 0.00 0.17 0.04Till Capital V 1 2.22 0.00 2.22 + 0.26 5.60 1.90Timberline Res V 237 0.12 0.09 0.11 + 0.02 0.36 0.08Timberline Res* O 334 0.10 0.07 0.07 + 0.00 0.28 0.00Timmins Gold T 315 1.01 0.91 0.95 - 0.03 4.92 0.81Timmins Gold* X 512 0.77 0.67 0.72 - 0.03 3.93 0.63Tinka Res V 1519 0.37 0.29 0.31 - 0.05 0.78 0.29Tinka Res* O 481 0.28 0.22 0.23 - 0.05 0.67 0.22Tintina Mines V 10 0.08 0.08 0.08 unch 0.00 0.10 0.05Titan Mining* O 192 0.89 0.79 0.79 - 0.10 1.05 0.82Titan Mining T 1166 1.19 1.00 1.08 - 0.04 1.65 0.92Titanium Corp V 88 0.57 0.49 0.54 - 0.01 1.44 0.49TMAC Resource* O 9 4.50 0.00 4.40 - 0.01 9.24 3.07TMAC Resources T 263 6.05 5.40 6.05 + 0.35 11.50 3.95TNR Gold V 319 0.04 0.03 0.04 unch 0.00 0.09 0.03Toachi Mg Inc V 20 0.10 0.00 0.10 + 0.01 0.29 0.07Tolima Gold V 84 0.01 0.01 0.01 unch 0.00 0.06 0.01TomaGold V 428 0.05 0.05 0.05 - 0.01 0.09 0.05Tombstone Expl* O 327 0.00 0.00 0.00 unch 0.00 0.01 0.00Tonogold Res* O 26 0.09 0.07 0.08 - 0.01 0.40 0.00Torex Gold* O 41 8.11 7.46 7.74 + 0.17 11.80 5.73Torex Gold T 1898 10.76 9.88 10.43 + 0.55 14.58 7.29Torq Resources V 139 0.41 0.37 0.37 - 0.01 0.70 0.32Torq Resources* O 29 0.31 0.29 0.29 + 0.00 1.10 0.25Tower Res* O 50 0.02 0.02 0.02 unch 0.00 0.12 0.02Tower Res V 886 0.03 0.03 0.03 + 0.01 0.17 0.02Transatlantic V 1088 0.06 0.05 0.05 - 0.01 0.10 0.03Transition Met V 245 0.11 0.09 0.10 unch 0.00 0.20 0.09Transition Met* O 10 0.07 0.07 0.07 unch 0.00 0.14 0.07Treasury Metal T 112 0.24 0.00 0.24 unch 0.00 0.67 0.21Treasury Metal* O 67 0.18 0.17 0.17 + 0.00 0.65 0.16Trecora Res* N 426 9.50 8.16 9.30 + 1.29 15.60 7.94Tres-Or Res V 3025 0.03 0.02 0.02 - 0.01 0.07 0.02
Trevali Mng* O 193 0.35 0.32 0.33 - 0.01 1.37 0.31Trevali Mng T 8640 0.47 0.42 0.45 - 0.02 1.75 0.41Tri Origin Exp V 104 0.02 0.02 0.02 - 0.01 0.04 0.02Trident Gold V 25 0.15 0.15 0.15 unch 0.00 0.22 0.14Trifecta Gold* O 9 0.04 0.04 0.04 + 0.00 0.10 0.04Trifecta Gold V 13 0.06 0.00 0.06 - 0.02 0.13 0.05Trigen Res* O 27 0.29 0.25 0.25 - 0.05 1.01 0.20Trilogy Mtls T 71 3.00 2.76 2.93 + 0.06 3.00 0.90Trilogy Mtls* X 1075 2.26 2.14 2.22 + 0.02 2.34 0.69TriMetals Mng* O 187 0.04 0.03 0.04 + 0.00 0.18 0.03TriMetals Mng* O 144 0.07 0.06 0.07 + 0.02 0.23 0.05TriMetals Mng T 364 0.06 0.05 0.06 + 0.01 0.23 0.05Trinity Res* O 58 0.04 0.01 0.04 + 0.01 0.20 0.01Trinity Valley V 42 0.04 0.04 0.04 unch 0.00 0.16 0.04Trio Resources* O 50 0.00 0.00 0.00 unch 0.00 0.00 0.00TriStar Gold* O 24 0.12 0.09 0.11 + 0.01 0.27 0.09TriStar Gold V 671 0.16 0.09 0.14 - 0.02 0.33 0.09Triumph Gold V 325 0.36 0.32 0.34 - 0.01 0.80 0.26Triumph Gold* O 59 0.27 0.24 0.26 - 0.02 0.60 0.20Troilus Gold T 401 0.75 0.65 0.65 - 0.05 2.25 0.40Troilus Gold* O 0 0.00 0.00 0.45 unch 0.00 1.59 0.45Troubadour Res V 112 0.20 0.18 0.20 unch 0.00 0.25 0.12Troy Enrgy V 3 0.00 0.00 0.03 unch 0.00 0.10 0.01Troy Res* O 15 0.09 0.09 0.09 unch 0.00 0.13 0.06Troymet Expl V 120 0.01 0.01 0.01 unch 0.00 0.02 0.01True Grit Res V 340 0.03 0.03 0.03 unch 0.00 0.07 0.03True North Gem V 198 0.05 0.04 0.04 - 0.01 0.15 0.03True North Gem* O 0 0.00 0.00 0.05 unch 0.00 0.05 0.00Trueclaim Expl* O 0 0.08 0.08 0.08 unch 0.00 0.17 0.01Trueclaim Expl V 637 0.13 0.10 0.10 - 0.02 0.30 0.07Tsodilo Res V 77 0.30 0.20 0.20 - 0.10 0.67 0.20Tudor Gold V 280 0.34 0.23 0.23 - 0.07 0.58 0.20Tudor Gold * O 10 0.28 0.21 0.21 + 0.06 0.46 0.15Tundra Gold* O 1 0.50 0.50 0.50 unch 0.00 1.00 0.38Turquoise HIl T 6852 2.58 2.31 2.38 - 0.13 4.52 2.09Turquoise HIl* N 22433 1.96 1.72 1.80 - 0.06 3.59 1.59TVI Pacific* O 140 0.01 0.00 0.01 + 0.00 0.02 0.00TVI Pacific V 955 0.01 0.01 0.01 unch 0.00 0.02 0.01Tyhee Gold* O 25 0.00 0.00 0.00 unch 0.00 0.00 0.00Typhoon Expl V 59 0.04 0.03 0.03 - 0.01 0.10 0.03
U-VU.S. Gold* D 486 1.02 0.87 0.93 - 0.07 3.27 0.87U.S. Lithium* O 703 0.02 0.01 0.02 - 0.00 0.04 0.01U3O8 Corp* O 61 0.22 0.16 0.18 - 0.02 0.49 0.16U3O8 Corp T 232 0.29 0.22 0.26 + 0.01 0.60 0.22Ubique Mineral 0 0.00 0.00 0.10 unch 0.00 0.25 0.07UC Res* O 0 0.00 0.00 0.00 unch 0.00 0.20 0.00Ucore Rare Mtl V 1373 0.17 0.12 0.12 - 0.04 0.26 0.13Ucore Rare Mtl* O 1617 0.13 0.08 0.09 - 0.04 0.21 0.10UEX Corp T 1691 0.19 0.16 0.18 + 0.01 0.41 0.16Ultra Lithium* O 50 0.11 0.11 0.11 unch 0.00 0.41 0.11Ultra Lithium V 20 0.14 0.14 0.14 + 0.01 0.51 0.14Umbral Enrgy* O 172 0.16 0.13 0.14 + 0.02 0.64 0.12Unigold V 184 0.17 0.13 0.16 - 0.01 0.27 0.13Unigold* O 235 0.12 0.09 0.09 - 0.03 0.20 0.09United Battery 1714 0.45 0.42 0.44 unch 0.00 1.68 0.31United Battery* O 1532 0.52 0.29 0.41 - 0.01 1.58 0.23United Res Hdg* O 63 0.05 0.03 0.03 - 0.02 0.07 0.01United Silver* O 3 0.00 0.00 0.00 + 0.00 0.01 0.00United States A* X 296 0.76 0.70 0.71 - 0.04 1.05 0.22United States S* N 58493 26.12 21.96 23.06 - 2.66 47.64 21.96Unity Energy V 123 0.51 0.00 0.50 + 0.15 0.51 0.10Universal Vent V 1154 0.35 0.29 0.33 - 0.02 0.63 0.29Upper Canyon V 26 0.35 0.25 0.35 unch 0.00 0.40 0.15Ur-Energy* X 1479 0.76 0.68 0.76 + 0.06 0.93 0.58Ur-Energy T 257 1.00 0.89 0.98 + 0.07 1.19 0.75Uragold Bay Rs V 1420 0.08 0.06 0.07 + 0.01 0.14 0.06Uranium Energy* X 4527 1.38 1.28 1.32 + 0.02 2.00 1.20Uranium Hunter* O 1 1.60 1.30 1.30 - 0.25 2.09 0.26Uranium Res* D 7395 0.21 0.16 0.19 + 0.01 1.15 0.15Uravan Mnrls V 165 0.03 0.03 0.03 - 0.01 0.08 0.03USCorp* O 1887 0.00 0.00 0.00 - 0.00 0.02 0.00Val-d’Or Mg* O 40 0.08 0.07 0.07 - 0.01 0.10 0.07
20-22_DEC10_StockTables.indd 23 2018-12-04 1:39 PM

Related Documents