Portland State University Portland State University PDXScholar PDXScholar Geology Faculty Publications and Presentations Geology 9-2018 Decadal Topographic Change in the McMurdo Dry Decadal Topographic Change in the McMurdo Dry Valleys of Antarctica: Thermokarst Subsidence, Valleys of Antarctica: Thermokarst Subsidence, Glacier Thinning, and Transfer of Water Storage from Glacier Thinning, and Transfer of Water Storage from the Cryosphere to the Hydrosphere the Cryosphere to the Hydrosphere J. S. Levy Colgate University Andrew G. Fountain Portland State University, [email protected] M. K. Obryk U.S. Geological Survey Cascades Volcano Observatory J. Telling University of Houston Craig Glennie University of Houston See next page for additional authors Follow this and additional works at: https://pdxscholar.library.pdx.edu/geology_fac Part of the Geology Commons, Glaciology Commons, and the Hydrology Commons Let us know how access to this document benefits you. Citation Details Citation Details Levy, J. S., Fountain, A. G., Obryk, M. K., Telling, J., Glennie, C., Pettersson, R., ... & Van Horn, D. J. (2018). Decadal topographic change in the McMurdo Dry Valleys of Antarctica: Thermokarst subsidence, glacier thinning, and transfer of water storage from the cryosphere to the hydrosphere. Geomorphology, 323, 80-97. This Article is brought to you for free and open access. It has been accepted for inclusion in Geology Faculty Publications and Presentations by an authorized administrator of PDXScholar. Please contact us if we can make this document more accessible: [email protected].

Welcome message from author
This document is posted to help you gain knowledge. Please leave a comment to let me know what you think about it! Share it to your friends and learn new things together.
Transcript

Portland State University Portland State University
PDXScholar PDXScholar
Geology Faculty Publications and Presentations Geology
9-2018
Decadal Topographic Change in the McMurdo Dry Decadal Topographic Change in the McMurdo Dry
Valleys of Antarctica: Thermokarst Subsidence, Valleys of Antarctica: Thermokarst Subsidence,
Glacier Thinning, and Transfer of Water Storage from Glacier Thinning, and Transfer of Water Storage from
the Cryosphere to the Hydrosphere the Cryosphere to the Hydrosphere
J. S. Levy Colgate University
Andrew G. Fountain Portland State University, [email protected]
M. K. Obryk U.S. Geological Survey Cascades Volcano Observatory
J. Telling University of Houston
Craig Glennie University of Houston
See next page for additional authors
Follow this and additional works at: https://pdxscholar.library.pdx.edu/geology_fac
Part of the Geology Commons, Glaciology Commons, and the Hydrology Commons
Let us know how access to this document benefits you.
Citation Details Citation Details Levy, J. S., Fountain, A. G., Obryk, M. K., Telling, J., Glennie, C., Pettersson, R., ... & Van Horn, D. J. (2018). Decadal topographic change in the McMurdo Dry Valleys of Antarctica: Thermokarst subsidence, glacier thinning, and transfer of water storage from the cryosphere to the hydrosphere. Geomorphology, 323, 80-97.
This Article is brought to you for free and open access. It has been accepted for inclusion in Geology Faculty Publications and Presentations by an authorized administrator of PDXScholar. Please contact us if we can make this document more accessible: [email protected].

Authors Authors J. S. Levy, Andrew G. Fountain, M. K. Obryk, J. Telling, Craig Glennie, M. Gooseff, and David J. Van Horn
This article is available at PDXScholar: https://pdxscholar.library.pdx.edu/geology_fac/139

Decadal topographic change in the McMurdo Dry Valleys of Antarctica:Thermokarst subsidence, glacier thinning, and transfer of water storagefrom the cryosphere to the hydrosphere
J.S. Levy a,⁎, A.G. Fountain b, M.K. Obryk c, J. Telling d, C. Glennie d, R. Pettersson e, M. Gooseff f, D.J. Van Horn g
a Department of Geology, Colgate University, 13 Oak Ave., Hamilton, NY 13346, USAb Department of Geology, Portland State University, Portland, OR 97201, USAc U.S. Geological Survey Cascades Volcano Observatory, Vancouver, WA 98683, USAd National Center for Airborne Laser Mapping, Department of Civil & Environmental Engineering, University of Houston, Houston, TX 77004, USAe Department of Earth Sciences, Uppsala University, Geocentrum, Villav. 16, 752 36 Uppsala, Swedenf Department of Civil, Environmental, and Architectural Engineering, University of Colorado, Boulder, CO 80303, USAg Department of Biology, University of New Mexico, Albuquerque, NM 87131, USA
a b s t r a c ta r t i c l e i n f o
Article history:Received 29 May 2018Received in revised form 9 September 2018Accepted 10 September 2018Available online 13 September 2018
Recent local-scale observations of glaciers, streams, and soil surfaces in the McMurdo Dry Valleys of Antarctica(MDV) have documented evidence for rapid ice loss, glacial thinning, and ground surface subsidence associatedwithmelting of ground ice. To evaluate the extent, magnitude, and location of decadal-scale landscape change inthe MDV, we collected airborne lidar elevation data in 2014–2015 and compared these data to a 2001–2002 air-borne lidar campaign. This regional assessment of elevation change spans the recent acceleration ofwarming andmelting observed by long-term meteorological and ecosystem response experiments, allowing us to assess theresponse of MDV surfaces to warming and potential thawing feedbacks. We find that locations of thermokarstsubsidence are strongly associated with the presence of excess ground ice and with proximity to surface or shal-low subsurface (active layer) water. Subsidence occurs across soil types and landforms, in low-lying, low-slopeareaswith impeded drainage and also high on steep valleywalls. Glacier thinning iswidespread and is associatedwith the growth of fine-scale roughness. Pond levels are rising in most closed-basin lakes in the MDV, across allmicroclimate zones. These observations highlight the continued importance of insolation-driven melting in theMDV. The regionalmelt pattern is consistentwith an overall transition ofwater storage from the local cryosphere(glaciers, permafrost) to the hydrosphere (closed basin lakes andponds aswell as theRoss Sea).We interpret thisregional melting pattern to reflect a transition to Arctic and alpine-style, hydrologicallymediated permafrost andglacial melt.
© 2018 Published by Elsevier B.V.
Keywords:AntarcticPermafrostGlaciersLidar
1. Introduction
Changes to Earth's terrestrial cryosphere (glaciers, snow, perma-frost, and ground ice) can rapidly reorganize landscapes, leading tochanges in energy balance, runoff, and ecosystem functioning. Theseperturbations to topography drive further changes in glacial and groundice stability, generating positive feedbacks in frozen landscapes. For ex-ample, lidar and topographic studies of glacier surfaces in Arctic and al-pine regions have shown that ablation can drive sediment mobilizationand enhance melting (Irvine-Fynn et al., 2011), roughening ofsupraglacial channels can lead to enhanced melting (Rippin et al.,2015), and steepening of exposed glacier surfaces can enhance ablationand melt at low sun angles (Mölg, 2004). Hydrological and sediment
mobilization feedbacks are thought to be disintegrating the terminal re-gions of several Antarctic glaciers (Fountain et al., 2014).
Such positive melting feedbacks are also associated with permafrostdegradation, where changes in drainage, the geometry of thermokarstponds, channel stability, and active layer thermal properties can rapidlyalter the distribution of soils, ice, and carbon (Jorgenson et al., 2006;Gooseff et al., 2011; Arp et al., 2015; Kanevskiy et al., 2016; Levy andSchmidt, 2016; Strauss et al., 2016). Hydrologically mediated meltingof ground ice has led to thermokarst subsidence over broad studyareas containing continuous permafrost. For example, ~35% of tussocktundra sites in the Eight Mile Lake, a research watershed in Alaska,have experienced water-mediated subsurface thaw and subsidence(Belshe et al., 2013) similar to widespread thawing impacts at perma-frost research sites in Siberia (Czudek and Demek, 1970).
In the Arctic, mechanisms driving permafrost degradation are well-understood and include i) surface warming caused by warmer air
Geomorphology 323 (2018) 80–97
⁎ Corresponding author.E-mail address: [email protected] (J.S. Levy).
https://doi.org/10.1016/j.geomorph.2018.09.0120169-555X/© 2018 Published by Elsevier B.V.
Contents lists available at ScienceDirect
Geomorphology
j ourna l homepage: www.e lsev ie r .com/ locate /geomorph

temperatures, ii) reduction in albedo and ponding of surface waters,which is most pronounced in glacial drifts and eolian soils (Farquharsonet al., 2016), and iii) land cover disturbance (e.g., Shur and Jorgenson,2007). The magnitude and pattern of thermokarst subsidence is stronglycontrolled by where ground ice is abundant and subject tomelt (cryolithology) (French and Shur, 2010). In addition, enhancedthermokarst erosion occurs in lower-slope watersheds where pondingoccurs, implying surface slope may play a controlling role in subsidence(Farquharson et al., 2016). Finally, landscape age plays a key role in thedistribution of Arctic thermokarst-enhanced thermokarst reworking ismost prevalent on older landscapes (Jorgenson and Shur, 2007).Surface- and groundwater mediated permafrost thaw are hypothesized
to now be occurring in the ice-free polar deserts of Antarctica (Schmidtand Levy, 2017).
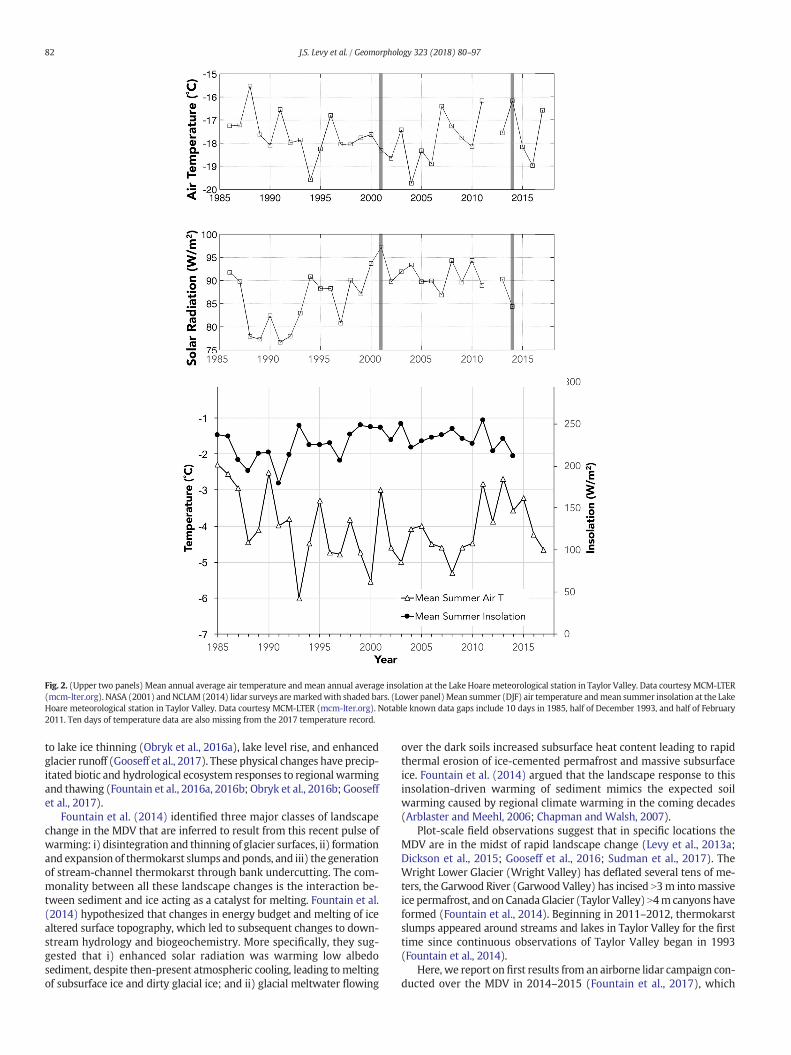
In contrast to rapidly changing Arctic and alpine cryosphere land-scapes, Antarctica's largest ice-sheet-free region, theMcMurdo Dry Val-leys (MDV) (Fig. 1), has been mostly shielded from abrupt change duecontinually cool, and in cases cooling, air temperatures during the1990s to early 2000s (Doran et al., 2002a; Shindell and Schmidt,2004). Counterintuitively, during this period, solar radiation had beenincreasing significantly (Fountain et al., 2014; Obryk et al., 2018). A no-table summer thaw in 2001–2002 coincidedwith a pivot in the cooling/brightening climate trajectory; since 2002, summer air temperaturesand elevated solar flux (Fig. 2) have remained largely constant, leading
Fig. 1. Context map and hillshade of the lidar data set over Landsat ImageMosaic of Antarctica (LIMA) data. Features of interest for the erosion/volume-change analyses are highlighted inblack. Note, feature area has been exaggerated one pixel to enhance visibility. Feature area and GIS shapefiles are available as supplementary files. Dot marked F5 indicates the location ofFig. 6. Dot marked F4 indicates the location of soil roughness analyses shown in Fig. 5. LB indicates Lake Bonney. SG indicates Seuss Glacier.
81J.S. Levy et al. / Geomorphology 323 (2018) 80–97
to lake ice thinning (Obryk et al., 2016a), lake level rise, and enhancedglacier runoff (Gooseff et al., 2017). These physical changes have precip-itated biotic and hydrological ecosystem responses to regional warmingand thawing (Fountain et al., 2016a, 2016b; Obryk et al., 2016b; Gooseffet al., 2017).
Fountain et al. (2014) identified three major classes of landscapechange in the MDV that are inferred to result from this recent pulse ofwarming: i) disintegration and thinning of glacier surfaces, ii) formationand expansion of thermokarst slumps and ponds, and iii) the generationof stream-channel thermokarst through bank undercutting. The com-monality between all these landscape changes is the interaction be-tween sediment and ice acting as a catalyst for melting. Fountain et al.(2014) hypothesized that changes in energy budget and melting of icealtered surface topography, which led to subsequent changes to down-stream hydrology and biogeochemistry. More specifically, they sug-gested that i) enhanced solar radiation was warming low albedosediment, despite then-present atmospheric cooling, leading to meltingof subsurface ice and dirty glacial ice; and ii) glacial meltwater flowing
over the dark soils increased subsurface heat content leading to rapidthermal erosion of ice-cemented permafrost and massive subsurfaceice. Fountain et al. (2014) argued that the landscape response to thisinsolation-driven warming of sediment mimics the expected soilwarming caused by regional climate warming in the coming decades(Arblaster and Meehl, 2006; Chapman and Walsh, 2007).
Plot-scale field observations suggest that in specific locations theMDV are in the midst of rapid landscape change (Levy et al., 2013a;Dickson et al., 2015; Gooseff et al., 2016; Sudman et al., 2017). TheWright Lower Glacier (Wright Valley) has deflated several tens of me-ters, the Garwood River (Garwood Valley) has incised N3m intomassiveice permafrost, and on CanadaGlacier (Taylor Valley) N4mcanyons haveformed (Fountain et al., 2014). Beginning in 2011–2012, thermokarstslumps appeared around streams and lakes in Taylor Valley for the firsttime since continuous observations of Taylor Valley began in 1993(Fountain et al., 2014).
Here, we report on first results from an airborne lidar campaign con-ducted over the MDV in 2014–2015 (Fountain et al., 2017), which
Fig. 2. (Upper two panels) Mean annual average air temperature andmean annual average insolation at the Lake Hoare meteorological station in Taylor Valley. Data courtesy MCM-LTER(mcm-lter.org). NASA (2001) andNCLAM (2014) lidar surveys aremarkedwith shaded bars. (Lower panel)Mean summer (DJF) air temperature andmean summer insolation at the LakeHoare meteorological station in Taylor Valley. Data courtesy MCM-LTER (mcm-lter.org). Notable known data gaps include 10 days in 1985, half of December 1993, and half of February2011. Ten days of temperature data are also missing from the 2017 temperature record.
82 J.S. Levy et al. / Geomorphology 323 (2018) 80–97

collected ground, glacier, and lake surface elevation data in order toevaluate the extent, magnitude, and location of landscape change inthe MDV relative to a 2001–2002 airborne lidar campaign (Schenket al., 2004; Csatho et al., 2005). This regional assessment of elevationchange captures the decadal response of the landscape to summertimemelting conditions since 2001–2002, which spans the recent increaseand leveling off of solar radiation and glacier melt and runoff observedby long-term meteorological records and ecosystem response experi-ments (Gooseff et al., 2017). These observations allow us to providean overview of the regional response of MDV surfaces to warming andpotential thawing feedbacks through geomorphic analysis supportedby field investigations involving sediment sampling and ground-penetrating radar imaging of the subsurface. In contrast to ground-based field studies, our airborne lidar intercomparison is the first timewe can document the three-dimensional evolution of the MDV inclose to its entirety.
2. Regional setting
The MDV (~77°S, ~162°E) are composed of a series of largely east-west trending valleys that separate the East Antarctic Ice Sheet fromthe Ross Sea (Fig. 1). The MDV encompass a region ~22,700 km2 inarea, of which ~4500 km2 is permafrost-affected soils and bedrock freeof surface ice (Levy, 2012). The remainder of the area is covered byperennial snow packs, outlet glaciers, alpine glaciers, and perenniallyice-covered lakes. A lack of vascular plants or continuous hydrologicalactivity (e.g., rainfall, streamflow)means that the distribution of micro-climates in theMDV exerts an unusually strong control on the landformevolution (Marchant and Head III, 2007). Cold temperatures and lack ofan energized hydrological cycle result in a largely stable landscape, withstability increasingwith elevation and distance inland. Indeed, the larg-est advance of the local alpine glacierswas only a fewhundredmeters atmost and occurred 70–130 thousand years ago (Higgins et al., 2000b).At high elevations surrounding the valleys, ~2000 m, bedrock erosionrates can be as low as b0.3 m Ma−1 (Brook et al., 1995; Marchant andHead III, 2007).
With a mean annual air temperature range between −14.8° and30.0 °C, and between 3 and 50 mm of annual precipitation (all ofwhich falls as snow) (Doran et al., 2002a; Fountain et al., 1999, 2009),the MDV are a cold, polar desert (Monaghan et al., 2005). Despitethese harsh climate conditions, an active,microbially dominated biolog-ical community inhabits the valleys, consisting of microbes and inverte-brates (nematodes, tardigrades, rotifers, etc.) in the soils, cyanobacteriaand mosses in the streams, and phytoplankton in the lakes, which hashelped motivate long-term studies of this melt-limited landscape(Priscu et al., 1998; Adams et al., 2006; Cary et al., 2010).
Valley soils preserve the legacy of the interactions of seawardflowing outlet glaciers and/or landward encroachment of groundedRoss Sea Ice Sheet (RSIS). Together they form a complexly interfingeredassortment of glacial tills and fluviolacustrine deposits (Stuiver et al.,1981; Denton et al., 1993; Hall and Denton, 2000; Hall et al., 2000;Higgins et al., 2000a, 2000b; Marchant et al., 2002; Ugolini andBockheim, 2008). Below ~300 m elevation, the MDV are dominated bysediments and buried ice associated with infilling of the valleys byRSIS material, mapped as Ross Sea Drift, during the last glacial maxi-mum (Stuiver et al., 1981; Hall et al., 2000, 2015). In regions above~300m, old surfaces (~1–8MY) dominate and include the QuartermainMountains, and the Asgard, and Olympus ranges (e.g., Marchant et al.,1993a, 1993b; Sugden et al., 1995).
TheMDV soils are characterized by continuous permafrost with sea-sonal active layers forming on nearly all surfaces. Active layer thick-nesses span 0–70 cm, with ~20–30 cm being most common in coastalvalley bottoms in Taylor Valley, Wright Valley, and Garwood Valley(Bockheim et al., 2007). Active layers ~0–5 cm thick dominate thecold, upland, inland regions such as Beacon Valley (Marchant andHead III, 2007; Fountain et al., 2014). Active layers form over dry and
ice-cemented permafrost, buried ground ice, debris-covered glaciers,and ice-cored moraines (Bockheim et al., 2007).
Permafrost is predominantly ice-cemented and ranges from ice-saturated to weakly cemented, although ‘dry-frozen,’ ice-free, perma-frost is common in the upper ~1 m along high valley walls above ice-cemented permafrost (Bockheim et al., 2007). Massive buried ice(ground ice) is common and has been mapped in alpine sections ofthe MDV, in the Quartermain Mountains, in Victoria Valley, and in ex-tensive ice-cored Ross Sea Drift deposits (Stuiver et al., 1981; Sugdenet al., 1995; Hagedorn et al., 2010; Swanger, 2017). All three types ofpermafrost (dry, ice-cemented, and buried massive ice) are potentiallysusceptible to warming-related degradation—either directly throughslumping of melt-lubricated sediments and surface ablation by melt orsublimation-driven ice removal, or indirectly, as ice-free permafrostand active layer sediments are preferentially removed by warming-induced fluvial erosion.
The thermal stability of permafrost, buried glacier ice, and otherground ice is controlled largely by regional microclimate conditions(Marchant and Head III, 2007; Hagedorn et al., 2010). Inland and high-elevation areas in the upland stable zone have summer air temperaturesb−10 °C and minimal to absent active layer (Fountain et al., 2014;Marchant and Head III, 2007). As a consequence, ablation of groundice in this zone is thought to be dominated by slow sublimation andvapor diffusion through dry overlying tills (Ng et al., 2005; Hagedornet al., 2007; Kowalewski et al., 2006, 2011a, 2011b; Lacelle et al., 2013;Marinova et al., 2013;). In contrast, coastal and low-elevation regions,Marchant and Head III's (2007) coastal thaw zone, experience meansummer air temperatures warmer than −5 °C (Fountain et al., 2014),leading to widespread active layer thawing and refreezing of groundice (Levy et al., 2011), as well as secular change in ground ice reservoirsas buried ice and frozen sediment melt (Healy, 1975; Campbell andClaridge, 2003; Levy et al., 2013a; Sudman et al., 2017).
3. Methods
3.1. Lidar processing
To detect landscape change in the MDV, we examined surface eleva-tion change across the valleys by differencing an aerial lidar survey flownin the austral summer of 2001–2002 (Schenk et al., 2004; Csatho et al.,2005; Martin et al., 2005) from one flown in 2014–2015 (Fountainet al., 2017). The 2001–2002 survey used NASA's Airborne TopographicMapper system that produced a point density in the valley bottom ofat least 0.14–0.32 returns m−2 (Schenk et al., 2004; Csatho et al.,2005). The 2014–2015 survey used the Optech Titan multiwavelengthairborne laser scanner (Fernandez-Diaz et al., 2016) that produced apoint density of at least 2 returns m−2. The footprint (diameter) of thelaser beam was ~0.3 m for channels 1 and 2 (1550 and 1064 nm) and~0.6 m for channel 3 (532 nm). An Optech Gemini airborne laser terrainmapper (ALTM) served as a backup to the Titan multiwavelength scan-ner,which uses a 1064 nm laser pulse at 33 to 166 kHz and a beamdiver-gence of 0.25mrad. Differential kinematic trajectories for the 2014–2015surveywere derived froma total of nineUNAVCOGlobal Positioning Sys-tem (GPS) stations recording data at a rate of 1 Hz. The aircraft was noN40 km from any station during mapping operations.
To compare the 2001 and 2014 point clouds, the original point cloudswere reprocessed using identical methods, and then irregularly spaceddata in the sparser 2001 data-set were interpolated using a Delaunay tri-angulation. Lidar data from the 2014–2015 survey were processed inthree main steps: trajectory determination, point cloud production, andpoint cloud processing. Differential trajectories for the aircraft were de-rived by blending solutions from at least three GPS stations using theKARS (Kinematic and Rapid Static) software (Mader, 1996), which werethen combined with orientation information collected from the onboardinertial measurement unit. Point cloud production combined laser rangedata with position data to produce geolocated point clouds of laser
83J.S. Levy et al. / Geomorphology 323 (2018) 80–97

returns using the sensormanufacturer's proprietary software LMS for theTitanMWandDASHmap for the Gemini. Each data returnwas positionedin three-dimensional space by horizontal coordinates in U.S. GeologicalSurvey Transantarctic Mountains Projection (epsg projection 3294) andvertical coordinate in meters above the World Geodetic Survey 1984(WGS84) ellipsoid.
The 2001 interpolated mesh was subtracted from the 2014 pointcloud at the resolution of the 2014 point cloud. The results were outputat a gridded difference DEM with a minimum spatial resolution of 1× 1m. Close inspection of the differenced values revealed some artifactsassociated with the NASA data caused by a mounting bias that causedrange errors to increase with increasing terrain slope (Martin et al.,2005). This bias of about ±20 cm root mean square error (RMSE) andthe accuracy of the 2014–2015 data of about ±7 cm RMSE togetheryield an uncertainty of±21 cm, close to our empirically derived estimateof ±25 cm. The latter was based on elimination of spurious noise in thedifferenced data. We applied the ±25 cm threshold to filter thedifferenced data before examining elevation changes. Therefore, all land-scape changes reported are larger than ±25 cm. Horizontal registrationuncertainties are lower.We used an iterative closest point (ICP) compar-ison of 500 m by 500 m blocks from Taylor Valley in areas where hori-zontal movement was not expected (bedrock, valley bottoms withoutstreams, etc.) in order to assess mismatch between point clouds. Morethan 50,000 points were compared, producing an average easting shiftof 0.011 m (standard deviation = 1.63 m) and an average northingshift of −0.009 m (standard deviation = 1.76 m). Based on the lack ofa mean bias, we concluded that the data was properly horizontallyregistered.
Seasonal snowpatches are common inMDV, and differences in patchthicknesses between lidar surveyswould produce spurious elevation dif-ferences. During the 2001–2002 survey few snow patches populated thevalleys as a consequence of the extremely warm air temperatures expe-rienced that summer (Doran et al., 2008; Barrett et al., 2008). In contrastthe 2014–2015 data-collection season was relatively cold and snowpatches were common. To eliminate the effect of snow patch changefrom the differenced elevations, panchromatic Landsat 8 (Morfitt et al.,
2015) imagery at 15 m spatial resolution was used to identify snowpatches. The imagery (LC80561162014353LGN00, 19 December 2014)was collected during the time of the 2014–2015 lidar surveys. Snow-or ice-covered pixels were identified by their reflective brightness ex-ceeding a threshold of ≥20% (Levy, 2012) and were removed from thedifference elevation raster. Snowpatches in theMDV tend to accumulateandpersist in the same locations because of relatively consistent patternsof wind deposition and erosion of snow (Eveland et al., 2013). Elimina-tion of the patches known to exist in 2014–2015would also eliminate re-sidual patches thatmayhave survived in 2001–2002. Snowpatcheswerenot eliminated from either lake ice or glacier surfaces for which it can bedifficult to algorithmically discern snow from underlying ice.
3.2. Change mapping
Landforms of interest were outlined using the 2014 DEM hillshade(Fig. 1) and were selected to explore elevation change within glacial,fluvial, lacustrine, and permafrost deposits. Landform type and locationwere used asmapping criteria—not elevation change (i.e., siteswere notpreselected for analysis based on elevation change between 2001 and2014). Fluviolacustrine features (e.g., streams, lakes, ponds) weremapped to include a portion of the banks adjacent to the feature thatmay have changed. Buried ice landforms (e.g., the Garwood buried icelobe; Stuiver et al., 1981) were mapped as close to the apparent land-form boundary as possible. For pond and lake level change calculations,the entire perimeter was mapped based on smoothing visible in thelidar hillshade at the contact between the lake and the surroundingsoil, and a transect of elevation across the long axis of the lake was ex-tracted and averaged. For glacier thinning measurements, the upper el-evations of the glaciers were not included due to the limited extent ofthe aerial surveys, restricting the differenced regions to the ablationzones. The location and extent of all selected features are included inthe Supplementary data as ESRI ArcMap shapefiles.
Nearest-neighbor point differencing between the areas of interestwithin the 2001 and 2014 lidar point clouds was converted into a site-specific difference raster by assigning each cell themaximumtriangulated
Fig. 3. Gross volume loss for the 28 features of interest. Ice loss is concentrated in the RSD (Alph, Garwood, Miers, Ward, Hjorth Marshall).
84 J.S. Levy et al. / Geomorphology 323 (2018) 80–97
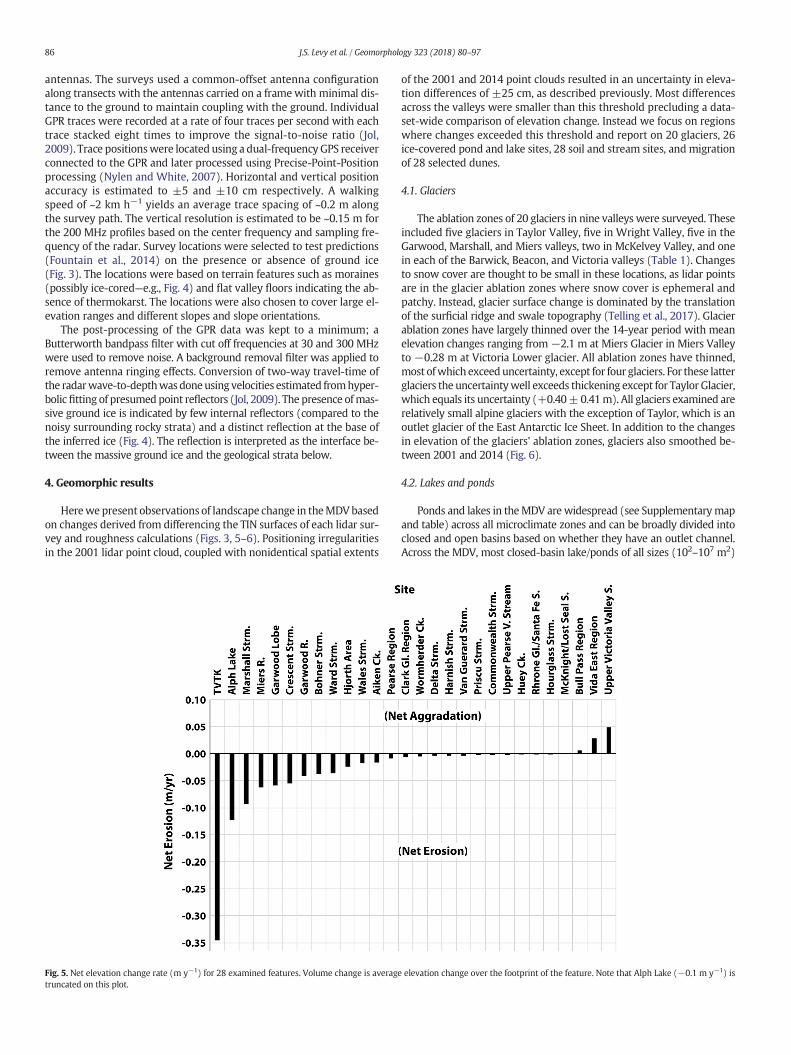
difference value within each 1 × 1 m grid cell. Note, the difference be-tween taking the minimum point in each cell and the mean point ineach cell is small, generally b5% as there was commonly only one differ-ence point pair in any 1× 1mgrid cell. Maximum, rather thanmean sub-sidence was selected for this analysis because it ensures that largesubsidence cells (e.g., N10 m subsidence, common in some extremethermokarst sites) are not truncated by the matching algorithm. This ap-proach also records aggradation, which, although not widespread in theMDV, is the dominant landscape change at some sites. Elevation differ-ences within each feature outline were used to generate a measure ofgross volume change with each landform footprint. Raster cells weresummed by landform to determine net volume change within each land-form footprint, and area-normalized net elevation change was deter-mined by dividing net volume change by feature area. Surface elevationchange rate was determined by dividing area-normalized net elevationchange by the 13-year time interval between lidar surveys.
To estimate changes in area and volume for the glaciers and lakes, apolygon defining the perimeter of each landform was drawn at thebreak in slope between the landform and the surrounding soil apparentin the 2014 lidar hillshade. The point clouds for the 2001 NASA data and2014 NCALM data were each converted to a surface of triangular cells(TIN) within their respective perimeters. Once the two surface modelswere created, the area of each was calculated. The volume change is the
volume between the two surfaces and a prismoidal calculation betweencells was used to calculate the volume (TerraModel by Terrasolid Oy).
Surface roughness was estimated on glacier, lake ice, and soil sur-faces for each of the lidar surveys by calculating the elevation differencebetween individual points within a circle 5 m in radius and the best fitplane to those points. The RMSEs from all nonoverlapping circlescontained within the landscape feature were binned according to themagnitude and the relative number within each bin. These were com-pared to the total population within that particular landscape featureand plotted as a function of the roughness magnitude. We examinedthe change in surface roughness for five glaciers, four lakes, and twosoil surfaces in Taylor Valley and one soil surface in each of theMcKelvey and Victoria valleys. Because of the mounting bias of theNASA lidar, we restricted the assessment of roughness change to rough-nesses larger than the 25 cm threshold,whichwas also applied to eleva-tion differencing.
3.3. Subsurface characterization
To assess the presence or absence ofmassive buried ice, groundpen-etrating radar (GPR) surveys were implemented in 2014–2015 on sur-faces from sea level to ~1 km elevation. The surveys were collected onfoot using a Malå ProEx impulse system with 200 MHz unshielded
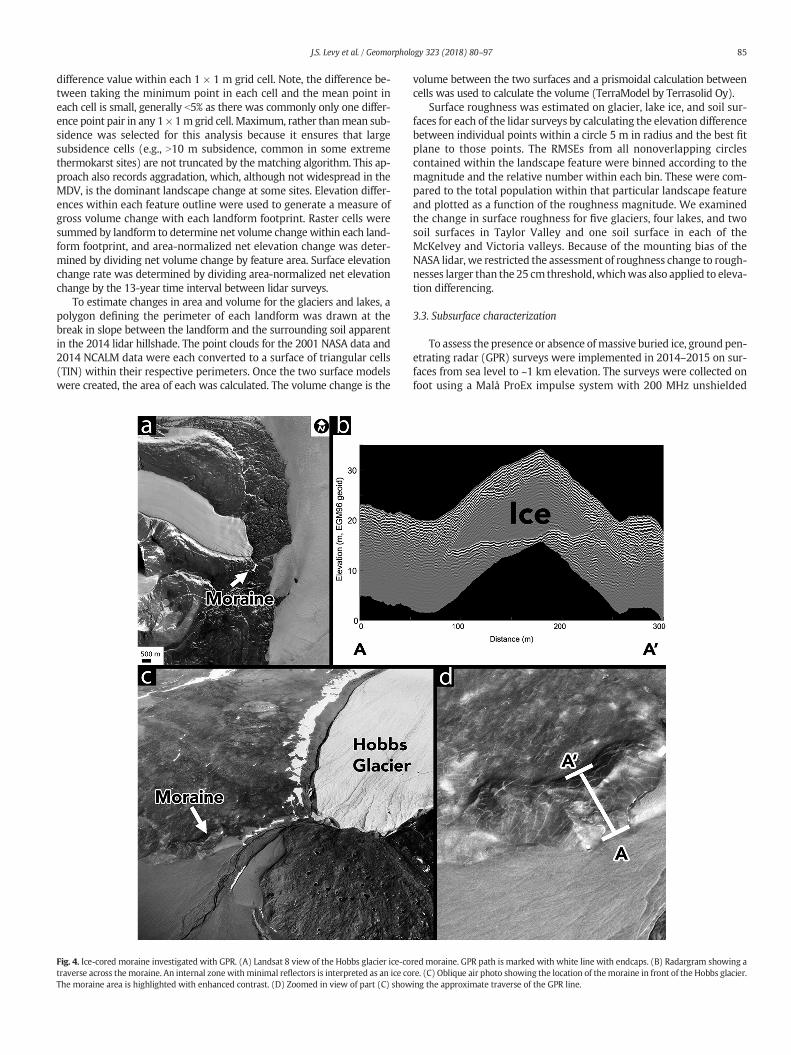
Fig. 4. Ice-cored moraine investigated with GPR. (A) Landsat 8 view of the Hobbs glacier ice-cored moraine. GPR path is marked with white line with endcaps. (B) Radargram showing atraverse across the moraine. An internal zonewithminimal reflectors is interpreted as an ice core. (C) Oblique air photo showing the location of themoraine in front of the Hobbs glacier.The moraine area is highlighted with enhanced contrast. (D) Zoomed in view of part (C) showing the approximate traverse of the GPR line.
85J.S. Levy et al. / Geomorphology 323 (2018) 80–97
antennas. The surveys used a common-offset antenna configurationalong transects with the antennas carried on a frame with minimal dis-tance to the ground to maintain coupling with the ground. IndividualGPR traces were recorded at a rate of four traces per second with eachtrace stacked eight times to improve the signal-to-noise ratio (Jol,2009). Trace positionswere located using a dual-frequency GPS receiverconnected to the GPR and later processed using Precise-Point-Positionprocessing (Nylen and White, 2007). Horizontal and vertical positionaccuracy is estimated to ±5 and ±10 cm respectively. A walkingspeed of ~2 km h−1 yields an average trace spacing of ~0.2 m alongthe survey path. The vertical resolution is estimated to be ~0.15 m forthe 200 MHz profiles based on the center frequency and sampling fre-quency of the radar. Survey locations were selected to test predictions(Fountain et al., 2014) on the presence or absence of ground ice(Fig. 3). The locations were based on terrain features such as moraines(possibly ice-cored—e.g., Fig. 4) and flat valley floors indicating the ab-sence of thermokarst. The locations were also chosen to cover large el-evation ranges and different slopes and slope orientations.
The post-processing of the GPR data was kept to a minimum; aButterworth bandpass filter with cut off frequencies at 30 and 300 MHzwere used to remove noise. A background removal filter was applied toremove antenna ringing effects. Conversion of two-way travel-time ofthe radarwave-to-depthwasdoneusing velocities estimated fromhyper-bolicfitting of presumed point reflectors (Jol, 2009). The presence ofmas-sive ground ice is indicated by few internal reflectors (compared to thenoisy surrounding rocky strata) and a distinct reflection at the base ofthe inferred ice (Fig. 4). The reflection is interpreted as the interface be-tween the massive ground ice and the geological strata below.
4. Geomorphic results
Herewe present observations of landscape change in theMDVbasedon changes derived from differencing the TIN surfaces of each lidar sur-vey and roughness calculations (Figs. 3, 5–6). Positioning irregularitiesin the 2001 lidar point cloud, coupled with nonidentical spatial extents
of the 2001 and 2014 point clouds resulted in an uncertainty in eleva-tion differences of ±25 cm, as described previously. Most differencesacross the valleys were smaller than this threshold precluding a data-set-wide comparison of elevation change. Instead we focus on regionswhere changes exceeded this threshold and report on 20 glaciers, 26ice-covered pond and lake sites, 28 soil and stream sites, and migrationof 28 selected dunes.
4.1. Glaciers
The ablation zones of 20 glaciers in nine valleys were surveyed. Theseincluded five glaciers in Taylor Valley, five in Wright Valley, five in theGarwood, Marshall, and Miers valleys, two in McKelvey Valley, and onein each of the Barwick, Beacon, and Victoria valleys (Table 1). Changesto snow cover are thought to be small in these locations, as lidar pointsare in the glacier ablation zones where snow cover is ephemeral andpatchy. Instead, glacier surface change is dominated by the translationof the surficial ridge and swale topography (Telling et al., 2017). Glacierablation zones have largely thinned over the 14-year period with meanelevation changes ranging from−2.1 m at Miers Glacier in Miers Valleyto −0.28 m at Victoria Lower glacier. All ablation zones have thinned,most ofwhich exceeduncertainty, except for four glaciers. For these latterglaciers the uncertaintywell exceeds thickening except for Taylor Glacier,which equals its uncertainty (+0.40±0.41m). All glaciers examined arerelatively small alpine glaciers with the exception of Taylor, which is anoutlet glacier of the East Antarctic Ice Sheet. In addition to the changesin elevation of the glaciers' ablation zones, glaciers also smoothed be-tween 2001 and 2014 (Fig. 6).
4.2. Lakes and ponds
Ponds and lakes in theMDV are widespread (see Supplementarymapand table) across all microclimate zones and can be broadly divided intoclosed and open basins based on whether they have an outlet channel.Across the MDV, most closed-basin lake/ponds of all sizes (102–107 m2)
Fig. 5. Net elevation change rate (m y−1) for 28 examined features. Volume change is average elevation change over the footprint of the feature. Note that Alph Lake (−0.1 m y−1) istruncated on this plot.
86 J.S. Levy et al. / Geomorphology 323 (2018) 80–97

have risen (Fig. 7). Notably, increased levels are present across all micro-climate zones, from the coastal thaw zone to the upland stable zone. Forexample, some closed-basin lakes (~107 m2) have risen by over 4 m(Fig. 7). We interpret an increase in closed-basin lake/pond levels as evi-dence of transfer of water reservoirs from cryosphere sources (glaciers,ground ice, and snow) to the hydrosphere (lakes and ponds).
In contrast, changing levels in open-basin lakes are not uniform andexhibit rising and falling trends (Fig. 7). Open-basin lake levels are tran-sient as a consequence of drainage through either ice dams or topo-graphic relief (e.g., Lake Miers, Buddha Lake) and have been observed
to rise and rapidly drain when ice dams fail or the topographic spillpoint is reached, leading to downstream flooding (Dickson et al.,2015; Fountain et al., 2014; Levy et al., 2013a). Such lakes may appearto rise or fall depending on when in their seasonal filling and drainingcycle theywere surveyed, consequently open-basin lakes/ponds cannotbe considered good indicators of climate-related elevation change inthis study. Likewise, thermokarst ponds that are confined by glacierice or ice-cored glacial till (e.g., Alph Lake) may be lowering becauseof melting of the underlying ice, even if the overlying water depth hasnot changed.
Fig. 6. Frequency histogram of roughness as a function of vertical offset (m) between each point and points in the surrounding 5m, for theNASA and NCALM surveys at Suess Glacier, LakeBonney, and the valleyfloor of eastern Taylor Valley. Gray shading indicates roughness below the±25 cmuncertainty threshold for intercomparison betweenNASA andNCALM data sets.
87J.S. Levy et al. / Geomorphology 323 (2018) 80–97

4.3. Stream and soil sites
We found substantial elevation changes at the 28 soil, stream, andbasin locations surveyed. Each site consists of ice-cemented or ice-coredpermafrost and active layer soil that has interactedwithmeltwater in dis-tinctways. The largest gross volume losses are at sites associatedwith ice-cored Ross Sea Drift (RSD): the Alph Lake basin, the Garwood lobe, theGarwood River, Miers River, Ward Stream, the Hjorth Hills area, andMarshall Valley (Fig. 3). These sites each have experienced the loss of105 to 106 m3 of ice and soil between surveys. These sites are largely inthe coastal thaw zone at elevations typically below 300 m. Elevationchange at these sites is associated with the formation of thermokarstponds (Alph Lake, Garwood Lobe) or the deep incision by streams intoburied ice deposits (Ward Stream, Garwood River, Miers and Marshallrivers, Commonwealth Stream) and the formation of thaw slumps orscarps (e.g., the Garwood Valley ice cliff, Levy et al., 2013a).
Sites exhibit a wide range of gross volume loss between surveys(Fig. 3). Alph Lake, a thermokarst pond basin with steep banks of ex-posed ice overlain by dark, volcanic sediments (Fig. 8), has the largestgross volume loss; while the smallest gross erosion site is Seuss GlacierGully, a small thermoerosional gully (e.g., Fortier et al., 2007) adjacentto Seuss Glacier. Located at ~288 m elevation, the Seuss Glacier Gullyis not associated with valley-mouth RSD, but rather with ice from avalley-wall debris-covered glacier or gelifluction lobe. Intriguingly,when net volume change (loss minus aggradation) is normalized bylandform area and time between surveys (Fig. 5), the Alph Lake basinremains the most actively melting and eroding landform; however,the Seuss Glacier Gully is then found to have the second largest area-normalized surface lowering rate (Fig. 5). This highlights the potentialfor ice loss and subsidence in small and large features, as well as high-and low-elevation ice deposits (e.g., Swanger and Marchant, 2007).
Erosion of stream channels in the southernMDV is greatest for thoseflowing over ice-cored RSD, e.g.,Ward,Marshall, Garwood (Figs. 3, 5, 9),and can reach tens of meters (Fig. 9). Where stream channels flow overice-cemented permafrost only, incision is generally low; where streams
flow over surfaces with pockets of massive ground ice, as is common inRSD, erosion can reach several meters in locations where excess ice isstill preserved.
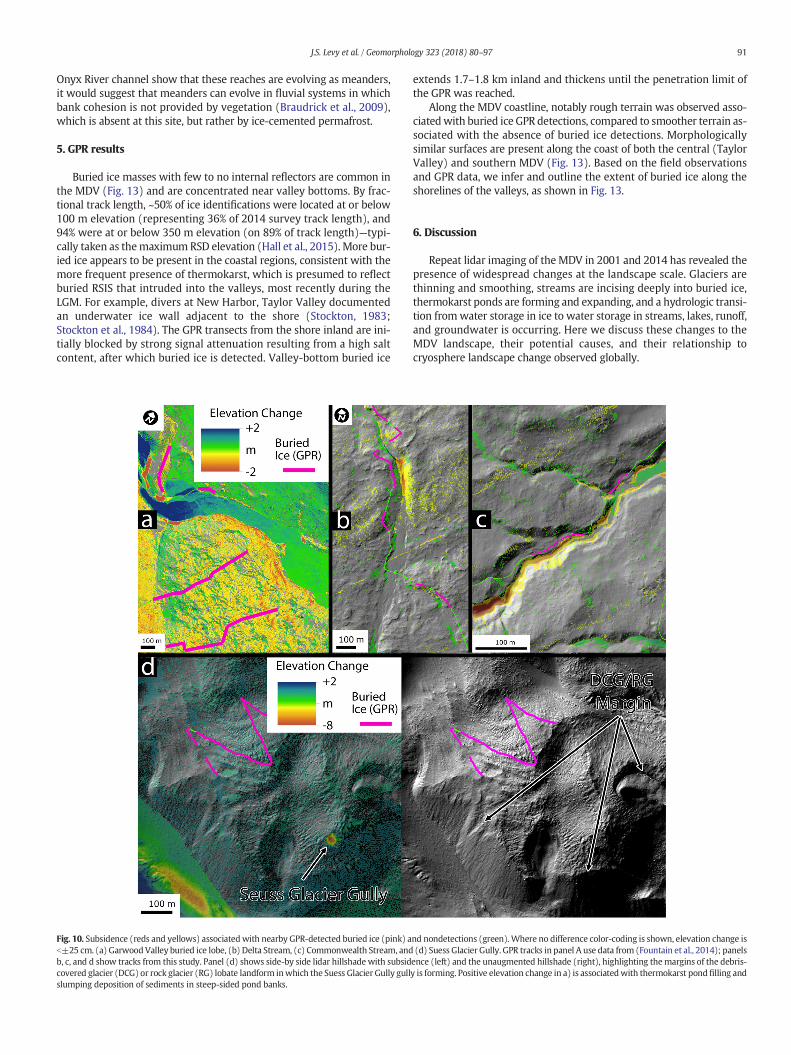
Similar stream erosion patterns are observed in Taylor Valley. Surfaceelevation change for stream channels and banks in central Taylor Valleybelow 300 m elevation (Wormherder Creek, Lake Bonney area, Crescentand Delta streams, etc.) is generally small, except where patchy, massiveground ice is present that is associated with locally large volume loss(Fig. 10) (Sudman et al., 2017). In contrast, wherewidespread, largely in-tact RSD buried ice is present (e.g., Commonwealth Stream), incision canreach several meters over long reaches of the stream channel (Fig. 10).
In contrast, some study sites are actively aggrading (Fig. 5). Positivevolume changes (aggradation) occur primarily on alluvial fan surfaces,such as Bull Pass area and Upper Victoria Valley stream, or in extremelysediment-rich fluvial channels, such as the proglacial McKnight/LostSeal system that dissects a sand sheet at the toe of CommonwealthGlacier. In these sites, sediments from upslope are inferred to be under-going deposition in the study site.
4.4. Other landscape changes
In terms of roughness, MDV surfaces are generally smoother (lowerroughness) in 2014 than in 2001 (Fig. 6). Roughness on Seuss Glacier,Lake Bonney, and eastern Taylor Valley soil surfaces are confined tosmaller magnitudes in the NCALM data-set, which could resulteither from smoothing of ice surfaces during widespread melting in2001–2002 (Gooseff et al., 2017) or from the formation of enhancedroughness at small scales through channel incision. For soil surfaces,we interpret the roughness changes not to reflect changes to the soil/permafrost surface, but rather, to reflect enhanced snow cover duringthe 2014 survey, which was excluded from volume change calculations(see Section 3.1).
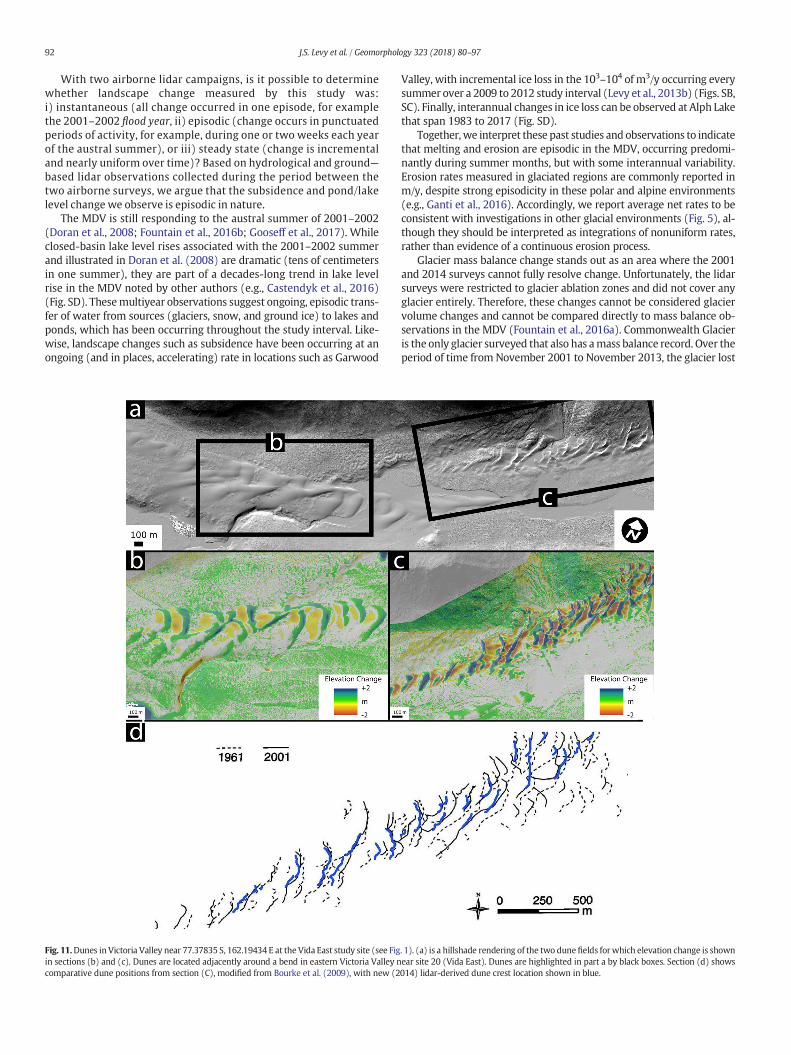
In addition to the landscape changes described above, two otherlandforms warrant consideration: sand dunes in Victoria Valley(Fig. 11) and the Onyx River braidplain (Fig. 12). These surfaces provide
Table 1Area and volume change calculations for the glacier ablation zones in the McMurdo Dry Valleysa.
Site name Area (m2) Volume change (m3) Volume changeuncertainty (m3)
Mean elevationchange (m)
Mean elevation changeuncertainty (m)
Taylor Valley sitesCommonwealth 7,819,365 −2,940,299 ±1,117,314 −0.38 ±0.38Canada 8,742,436 −5,134,633 ±1,951,161 −0.59 ±0.38Suess 1,906,315 −1,106,882 ±365,271 −0.58 ±0.33Rhone 1,653,101 −1,189,712 ±380,708 −0.72 ±0.32Taylor 88,993,027 35,866,247 ±14,705,161 0.40 ±0.41
Wright Valley sitesBartley 1,610,403 −1,616,094 ±404,024 −1.00 ±0.25Meserve 1,216,454 −539,125 ±156,346 −0.44 ±0.29Hart 1,186,942 −272,933 ±79,151 −0.23 ±0.29Goodspeed 2,519,629 42,604 ±12,355 0.02 ±0.29Denton 3,237,322 351,920 ±116,134 0.11 ±0.33
GMM ValleysGarwood 3,943,529 −4,438,757 ±2,485,704 −1.13 ±0.56Miers 4,773,513 −10,005,749 ±5,202,989 −2.10 ±0.52Joyce 1,559,768 −268,387 ±118,090 −1.72 ±0.44Adams 2,045,894 −3,253,292 ±715,724 −1.59 ±0.22
Barwick Valley sitesBarwick 4,090,972 −1,788,556 ±769,079 −0.44 ±0.43
Beacon Valley sitesFriedman 1,928,724 −447,487 ±116,347 −0.23 ±0.26
Victoria Valley sitesVictoria Upper 13,617,209 76,887 ±22,297 0.01 ±0.29Victoria Lower 5,385,597 −1,502,964 ±450,889 −0.28 ±0.30Packard 336,000 −181,870 ±49,105 −0.54 ±0.27
a Themean elevation change is the volume change divided by the area.Mean changes smaller than±25 cmare not distinguishable fromdata set intercomparison uncertainty. Reporteduncertainty is derived from the root mean square error of elevations from multiple control area around each glacier.
88 J.S. Levy et al. / Geomorphology 323 (2018) 80–97

information of landscape evolution in the MDV in which sedimenttransport, rather than ice loss, dominates. As with permafrost, glacier,and stream results reported above, these measurements provide anew baseline for future landform monitoring studies.
Sand saltation flux in the MDV is highest in Victoria Valley (Gillieset al., 2013), resulting in rapidly moving bedforms (1.5 m y−1) basedon the 2001/2002 lidar survey and on 1961 aerial photography(Bourke et al., 2009), which may result from enhanced sediment trans-port during the austral summers when sand is less cohesive as a conse-quence of moisture/ice ablation within the sand grains (Bristow et al.,2010). Victoria Valley, similarly to other McMurdo valleys, is subjected
to bimodal wind direction with predominantly westerly winds duringthe austral winters and easterly winds during the austral summers(Nylen and Fountain, 2004).
Two notable dune fields are present in the Victoria Valley: whalebackdunes located along the center of the valley axis and Packard dunes adja-cent to the north side of the valley (Bristow et al., 2010). The changes inboth landforms are visible in lidar elevation change observations as alter-nating aggradation/subsidence bands resulting from migration of thebedforms. In elevation difference images (e.g., Fig. 11), bedforms migratein the direction of negative to positive-color-coded change, showing ele-vation loss where the dune crest was and elevation gain where it has
Fig. 8. Ground view of Alph Lake basin. Debris-covered (RSD) ice is melting to form a thermokarst lake at this site. Cliff face is ~22 m tall. Photo credit: Logan Schmidt.
Fig. 7. Elevation changes of lakes and ponds in the McMurdo Dry Valleys between 2001 and 2002 and 2014–2015 lidar surveys.
89J.S. Levy et al. / Geomorphology 323 (2018) 80–97

migrated to. Notably, two adjacent dune fields in eastern Victoria Valley(Fig. 11) show opposite senses of migration over a ~1 km bend in the val-ley resulting from a combination of topographic wind-shadowing andseasonal wind flow directions (Bristow et al., 2010). Packard dunes mi-grate westward due to the combination of topographic sheltering (solarradiation) and a predominant exposure to easterly winds (Bristow et al.,2010). Conversely, topographically exposed whaleback dunes, located inthe center of the valley, are influenced by strong westerly katabatic andfoehn winds; consequently they migrate eastward (Bristow et al., 2010).The dichotomy in migration direction of proximally located dune fieldswithin the same valley highlights the complex surface process interac-tions with microclimate that can be resolved by this data-set.
The 2014–2015 lidar survey allows us to provide an update on previ-ously quantified migration rates of the Packard dune field only (forwhich previous migration rate data exist). Mean distance betweendune crests were determined using the following method: i) selecteddune crests were outlined based on hillshade DEMs from both lidar
surveys, ii) the polylines of the 2001 survey were converted to points(Feature Vertices to Points tool in ArcGIS), iii) distance between pointsand polylines were obtained (Near tool in ArcGIS), and iv) mean dis-tances were calculated using the Summary Statistics tool in ArcGIS. Be-tween the 2001–2002 and 2014–2015 lidar surveys, an averagemigration rate of Packard dunes was 1.4 m y−1, which is consistentwith the previously published migration rate of 1.5 m y−1 (Bourkeet al., 2009).
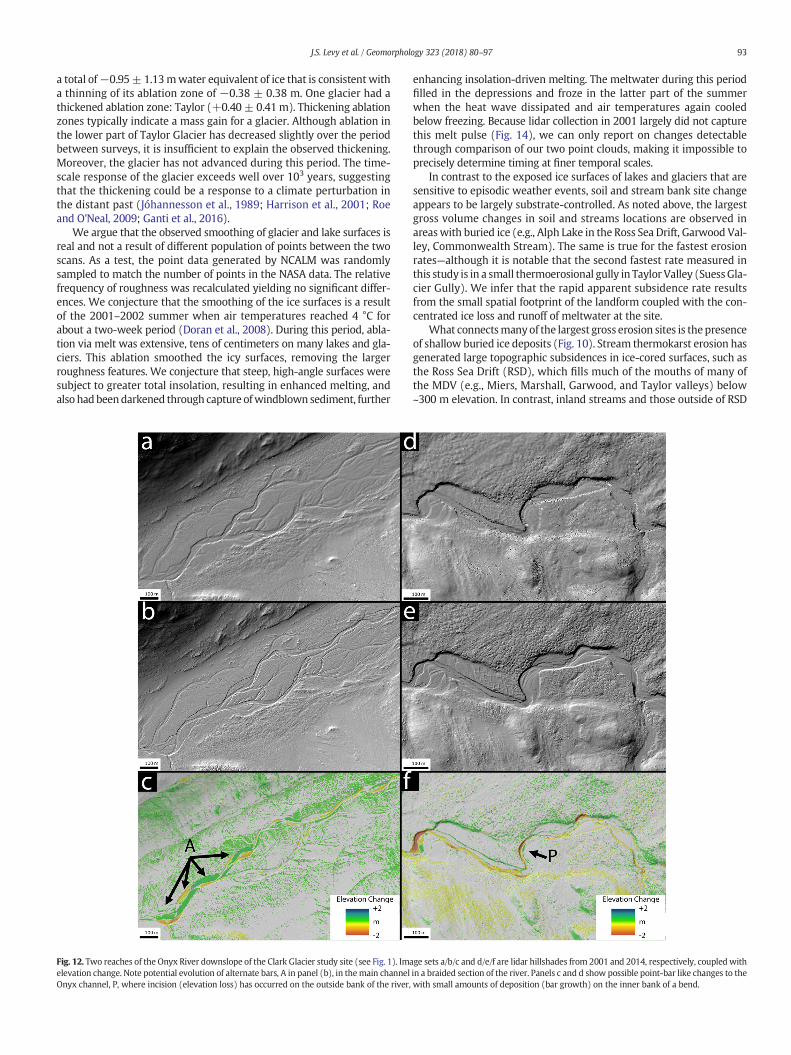
Finally, the Onyx River (the longest river in Antarctica) was not in-cluded in the above change detection observations owing to incompletecoverage of the river in the 2001 point cloud and notably sparse andnoisy coverage near its terminus in Lake Vanda. However, whereNASA and NCALM data sets overlap, details of channel morphologychange can be observed (Fig. 12). The Onyx consists largely of braidedand sinuous channel reaches with actively changing alternate bars—however, possible point bar growth and incipient meander formationare visible in some locations (Fig. 12). If future observations of the
Fig. 9. Elevation and surface elevation change for Ward Stream. Ward's upper reaches cross ice-cemented permafrost, while its downstream ~600 m of flow path cross ice-cored driftsurfaces. Note that the ~300 m elevation contour (maximum RSD elevation) and the ~1500 m along-track marker coincide, marking a transition from little elevation change tomoderate. Large elevation changes occur where ice-cored drift material is fully intact and actively being eroded (gray box).
90 J.S. Levy et al. / Geomorphology 323 (2018) 80–97
Onyx River channel show that these reaches are evolving as meanders,it would suggest that meanders can evolve in fluvial systems in whichbank cohesion is not provided by vegetation (Braudrick et al., 2009),which is absent at this site, but rather by ice-cemented permafrost.
5. GPR results
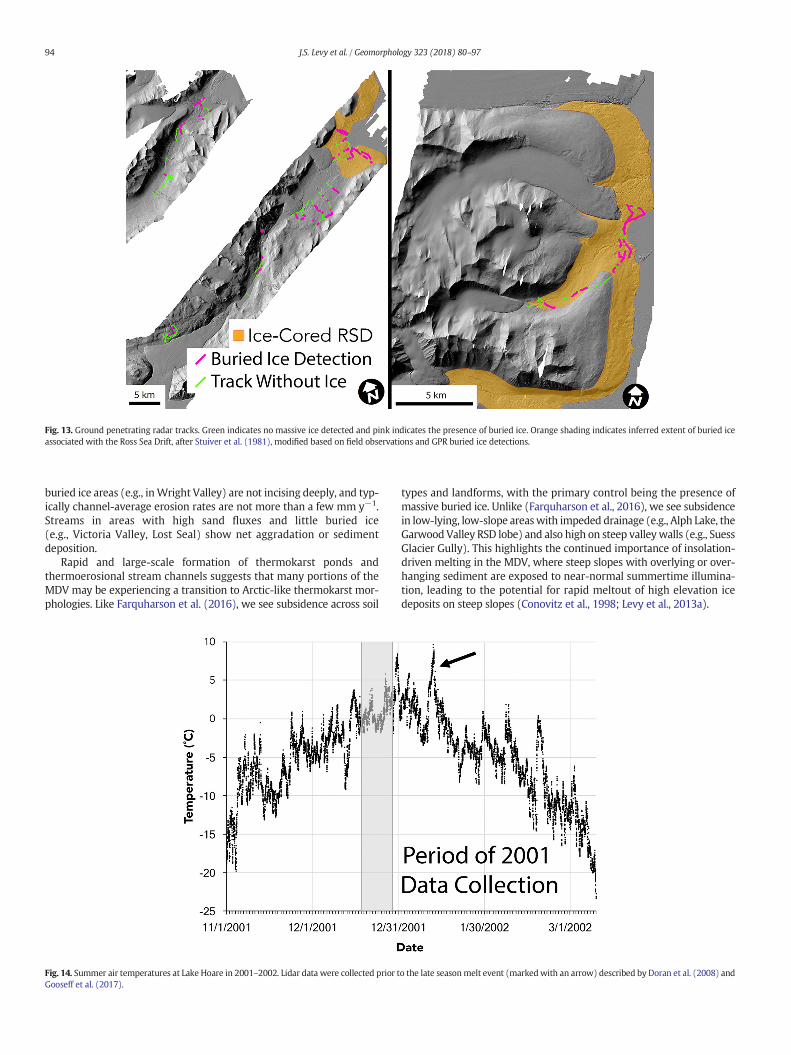
Buried ice masses with few to no internal reflectors are common inthe MDV (Fig. 13) and are concentrated near valley bottoms. By frac-tional track length, ~50% of ice identifications were located at or below100 m elevation (representing 36% of 2014 survey track length), and94% were at or below 350 m elevation (on 89% of track length)—typi-cally taken as themaximumRSD elevation (Hall et al., 2015). More bur-ied ice appears to be present in the coastal regions, consistent with themore frequent presence of thermokarst, which is presumed to reflectburied RSIS that intruded into the valleys, most recently during theLGM. For example, divers at New Harbor, Taylor Valley documentedan underwater ice wall adjacent to the shore (Stockton, 1983;Stockton et al., 1984). The GPR transects from the shore inland are ini-tially blocked by strong signal attenuation resulting from a high saltcontent, after which buried ice is detected. Valley-bottom buried ice
extends 1.7–1.8 km inland and thickens until the penetration limit ofthe GPR was reached.
Along the MDV coastline, notably rough terrain was observed asso-ciatedwith buried ice GPR detections, compared to smoother terrain as-sociated with the absence of buried ice detections. Morphologicallysimilar surfaces are present along the coast of both the central (TaylorValley) and southern MDV (Fig. 13). Based on the field observationsand GPR data, we infer and outline the extent of buried ice along theshorelines of the valleys, as shown in Fig. 13.
6. Discussion
Repeat lidar imaging of the MDV in 2001 and 2014 has revealed thepresence of widespread changes at the landscape scale. Glaciers arethinning and smoothing, streams are incising deeply into buried ice,thermokarst ponds are forming and expanding, and a hydrologic transi-tion fromwater storage in ice to water storage in streams, lakes, runoff,and groundwater is occurring. Here we discuss these changes to theMDV landscape, their potential causes, and their relationship tocryosphere landscape change observed globally.
Fig. 10. Subsidence (reds and yellows) associatedwith nearby GPR-detected buried ice (pink) and nondetections (green). Where no difference color-coding is shown, elevation change isb±25 cm. (a) Garwood Valley buried ice lobe, (b) Delta Stream, (c) Commonwealth Stream, and (d) Suess Glacier Gully. GPR tracks in panel A use data from (Fountain et al., 2014); panelsb, c, and d show tracks from this study. Panel (d) shows side-by side lidar hillshade with subsidence (left) and the unaugmented hillshade (right), highlighting themargins of the debris-covered glacier (DCG) or rock glacier (RG) lobate landform inwhich the Suess Glacier Gully gully is forming. Positive elevation change in a) is associatedwith thermokarst pond filling andslumping deposition of sediments in steep-sided pond banks.
91J.S. Levy et al. / Geomorphology 323 (2018) 80–97
With two airborne lidar campaigns, is it possible to determinewhether landscape change measured by this study was:i) instantaneous (all change occurred in one episode, for examplethe 2001–2002 flood year, ii) episodic (change occurs in punctuatedperiods of activity, for example, during one or two weeks each yearof the austral summer), or iii) steady state (change is incrementaland nearly uniform over time)? Based on hydrological and ground—based lidar observations collected during the period between thetwo airborne surveys, we argue that the subsidence and pond/lakelevel change we observe is episodic in nature.
The MDV is still responding to the austral summer of 2001–2002(Doran et al., 2008; Fountain et al., 2016b; Gooseff et al., 2017). Whileclosed-basin lake level rises associated with the 2001–2002 summerand illustrated in Doran et al. (2008) are dramatic (tens of centimetersin one summer), they are part of a decades-long trend in lake levelrise in the MDV noted by other authors (e.g., Castendyk et al., 2016)(Fig. SD). Thesemultiyear observations suggest ongoing, episodic trans-fer of water from sources (glaciers, snow, and ground ice) to lakes andponds, which has been occurring throughout the study interval. Like-wise, landscape changes such as subsidence have been occurring at anongoing (and in places, accelerating) rate in locations such as Garwood
Valley, with incremental ice loss in the 103–104 of m3/y occurring everysummer over a 2009 to 2012 study interval (Levy et al., 2013b) (Figs. SB,SC). Finally, interannual changes in ice loss can be observed at Alph Lakethat span 1983 to 2017 (Fig. SD).
Together,we interpret these past studies and observations to indicatethat melting and erosion are episodic in the MDV, occurring predomi-nantly during summer months, but with some interannual variability.Erosion rates measured in glaciated regions are commonly reported inm/y, despite strong episodicity in these polar and alpine environments(e.g., Ganti et al., 2016). Accordingly, we report average net rates to beconsistent with investigations in other glacial environments (Fig. 5), al-though they should be interpreted as integrations of nonuniform rates,rather than evidence of a continuous erosion process.
Glacier mass balance change stands out as an area where the 2001and 2014 surveys cannot fully resolve change. Unfortunately, the lidarsurveys were restricted to glacier ablation zones and did not cover anyglacier entirely. Therefore, these changes cannot be considered glaciervolume changes and cannot be compared directly to mass balance ob-servations in the MDV (Fountain et al., 2016a). Commonwealth Glacieris the only glacier surveyed that also has amass balance record. Over theperiod of time from November 2001 to November 2013, the glacier lost
Fig. 11.Dunes in Victoria Valley near 77.37835 S, 162.19434 E at the Vida East study site (see Fig. 1). (a) is a hillshade rendering of the two dunefields forwhich elevation change is shownin sections (b) and (c). Dunes are located adjacently around a bend in eastern Victoria Valley near site 20 (Vida East). Dunes are highlighted in part a by black boxes. Section (d) showscomparative dune positions from section (C), modified from Bourke et al. (2009), with new (2014) lidar-derived dune crest location shown in blue.
92 J.S. Levy et al. / Geomorphology 323 (2018) 80–97
a total of−0.95± 1.13mwater equivalent of ice that is consistent witha thinning of its ablation zone of −0.38 ± 0.38 m. One glacier had athickened ablation zone: Taylor (+0.40 ± 0.41m). Thickening ablationzones typically indicate a mass gain for a glacier. Although ablation inthe lower part of Taylor Glacier has decreased slightly over the periodbetween surveys, it is insufficient to explain the observed thickening.Moreover, the glacier has not advanced during this period. The time-scale response of the glacier exceeds well over 103 years, suggestingthat the thickening could be a response to a climate perturbation inthe distant past (Jóhannesson et al., 1989; Harrison et al., 2001; Roeand O'Neal, 2009; Ganti et al., 2016).
We argue that the observed smoothing of glacier and lake surfaces isreal and not a result of different population of points between the twoscans. As a test, the point data generated by NCALM was randomlysampled to match the number of points in the NASA data. The relativefrequency of roughness was recalculated yielding no significant differ-ences. We conjecture that the smoothing of the ice surfaces is a resultof the 2001–2002 summer when air temperatures reached 4 °C forabout a two-week period (Doran et al., 2008). During this period, abla-tion via melt was extensive, tens of centimeters on many lakes and gla-ciers. This ablation smoothed the icy surfaces, removing the largerroughness features. We conjecture that steep, high-angle surfaces weresubject to greater total insolation, resulting in enhanced melting, andalso hadbeendarkened through capture ofwindblown sediment, further
enhancing insolation-driven melting. The meltwater during this periodfilled in the depressions and froze in the latter part of the summerwhen the heat wave dissipated and air temperatures again cooledbelow freezing. Because lidar collection in 2001 largely did not capturethis melt pulse (Fig. 14), we can only report on changes detectablethrough comparison of our two point clouds, making it impossible toprecisely determine timing at finer temporal scales.
In contrast to the exposed ice surfaces of lakes and glaciers that aresensitive to episodic weather events, soil and stream bank site changeappears to be largely substrate-controlled. As noted above, the largestgross volume changes in soil and streams locations are observed inareaswith buried ice (e.g., Alph Lake in the Ross Sea Drift, Garwood Val-ley, Commonwealth Stream). The same is true for the fastest erosionrates—although it is notable that the second fastest rate measured inthis study is in a small thermoerosional gully in Taylor Valley (SuessGla-cier Gully). We infer that the rapid apparent subsidence rate resultsfrom the small spatial footprint of the landform coupled with the con-centrated ice loss and runoff of meltwater at the site.
What connectsmanyof the largest gross erosion sites is thepresenceof shallow buried ice deposits (Fig. 10). Stream thermokarst erosion hasgenerated large topographic subsidences in ice-cored surfaces, such asthe Ross Sea Drift (RSD), which fills much of the mouths of many ofthe MDV (e.g., Miers, Marshall, Garwood, and Taylor valleys) below~300 m elevation. In contrast, inland streams and those outside of RSD
Fig. 12. Two reaches of the Onyx River downslope of the Clark Glacier study site (see Fig. 1). Image sets a/b/c and d/e/f are lidar hillshades from 2001 and 2014, respectively, coupledwithelevation change. Note potential evolution of alternate bars, A in panel (b), in themain channel in a braided section of the river. Panels c and d show possible point-bar like changes to theOnyx channel, P, where incision (elevation loss) has occurred on the outside bank of the river, with small amounts of deposition (bar growth) on the inner bank of a bend.
93J.S. Levy et al. / Geomorphology 323 (2018) 80–97
buried ice areas (e.g., inWright Valley) are not incising deeply, and typ-ically channel-average erosion rates are not more than a few mm y−1.Streams in areas with high sand fluxes and little buried ice(e.g., Victoria Valley, Lost Seal) show net aggradation or sedimentdeposition.
Rapid and large-scale formation of thermokarst ponds andthermoerosional stream channels suggests that many portions of theMDV may be experiencing a transition to Arctic-like thermokarst mor-phologies. Like Farquharson et al. (2016), we see subsidence across soil
types and landforms, with the primary control being the presence ofmassive buried ice. Unlike (Farquharson et al., 2016), we see subsidencein low-lying, low-slope areaswith impeded drainage (e.g., Alph Lake, theGarwood Valley RSD lobe) and also high on steep valleywalls (e.g., SuessGlacier Gully). This highlights the continued importance of insolation-driven melting in the MDV, where steep slopes with overlying or over-hanging sediment are exposed to near-normal summertime illumina-tion, leading to the potential for rapid meltout of high elevation icedeposits on steep slopes (Conovitz et al., 1998; Levy et al., 2013a).
Fig. 14. Summer air temperatures at Lake Hoare in 2001–2002. Lidar data were collected prior to the late seasonmelt event (markedwith an arrow) described by Doran et al. (2008) andGooseff et al. (2017).
Fig. 13. Ground penetrating radar tracks. Green indicates no massive ice detected and pink indicates the presence of buried ice. Orange shading indicates inferred extent of buried iceassociated with the Ross Sea Drift, after Stuiver et al. (1981), modified based on field observations and GPR buried ice detections.
94 J.S. Levy et al. / Geomorphology 323 (2018) 80–97

6.1. Proposed mechanisms controlling regional landscape change
We interpret these landscape changes to indicate that physical andhydrological processes associated with heat capture and transfer intothe subsurface are widespread in the MDV. At the top of MDVwatersheds, glaciers appear to be thinning and darkening, resulting inincreased runoff into stream channels. Numerical modeling of short-wave insolation capture indicates that albedo reductions of as little as3% are sufficient to explain observed changes in stream discharge(e.g., Hoffman et al., 2016).
Streams and groundwater in the MDV function as important path-ways for heat. Where ground ice is present in MDV stream banks, weobserve thermokarst erosion, bank undercutting, and release of nutri-ents, solutes, and sediments into streams (Gooseff et al., 2016;Sudman et al., 2017). Energy collected from glacial runoff is reachingMDV lakes and raising lake heat content (Gooseff et al., 2017).
Subsidence, sediment mobilization, and glacier/ground ice meltingmay bebeginning to drive positive feedbacks across theMDV landscape.When sediment on glacier ablation zones reduces albedo, solar energyabsorption and melt increase (Rippin et al., 2015; Hoffman et al.,2016) adding to surface fine-scale roughness, which slows the windspeed and captures more eolian sediment, further reducing albedoand heat loss to the atmosphere. Similar feedbacks exist for activelayer soils. When soils become wetted, either within stream and lakemargin hyporheic zones, or within water tracks or thermokarst drain-age pathways, soil thermal diffusivity can rise two- to eightfold (Levyand Schmidt, 2016), leading to enhanced delivery of heat to buried icein poorly drained soils. This exacerbates melt rates in stream hyporheiczones and in wet active layer soils. Together, we interpret these pro-cesses as potentially self-reinforcing drivers of the observed landscapechanges in the MDV. Hallmarks of this change in MDV hydrogeologyare i) enhanced heat transport into lakes, frozen ground, and othercold reservoirs in the MDV that have been largely unchanged sinceLGM time or earlier; and ii) a transition of water storage from groundice and glaciers to lakes and ponds.
We propose that two related processes are responsible for the land-scape changes observed: one trend operating at decadal timescales andanother discrete event triggering a decadal geomorphic response. First,between 1991 and 2000, mean summer solar radiation in MDV in-creased by 25% where it remained at elevated levels until 2012 (Obryket al., 2018). Although mean summer air temperatures were coolingthrough this period by almost 1 °C (Doran et al., 2002b; Gooseff et al.,2017), the increase in solar energymore than compensated for sensibleheat flux loss, at least for the sediment-covered surfaces with compara-tively lower albedo, and for wetted sediment surfaces.
The triggering event was a short warm episode duringmid-summer2001–2002. A drainage wind event adiabatically warmed the atmo-sphere in the MDV to temperatures several degrees above freezingand the temperatures remained elevated for almost two weeks(Doran et al., 2008). During that period glacier ice rapidly melted, ex-posing sediment entombed in the subsurface; and streams and riversflooded to a scale seen only twice before in the instrumented recordsince 1970 (Castendyk et al., 2016). During this period lake and pondlevels rose rapidly. The fast, relatively warm stream flow; mechanicallyand thermally eroded the streambeds down to the ice-cemented per-mafrost boundary beneath the streambeds. Where massive ice was en-countered, rapid erosion occurred followed by bank collapse andfurther erosion continued tunneling through the massive ice in somestream reaches (e.g., Garwood River). These processes set in motion asequence of geomorphic changes that have continued for anotherdecade.
We suggest that in the following years—under conditions of elevatedsolar radiation, constant summer air temperatures (Gooseff et al., 2017),and increased heat content of streams—landscape changes continued,partly responding to the flood event of 2001–2002 and partially fromthe elevated solar radiation. Insolation-driven glacial melt discharge
was elevated despite constantly cool temperatures, contributing to con-tinually increasing lake and pond levels.
7. Conclusions
Repeat lidar measurements of glacial, soil, stream, and lake surfacesin the McMurdo Dry Valleys show evidence of widespread ground sub-sidence, glacial ablation zone thinning and smoothing, and lake/pondlevel rise. The GPR observations indicate that soil subsidence is stronglyassociated with the presence of excess ground ice in the form of ice-cored moraines and tills. While not all locations of massive ground icewere found to be subject to subsidence, all notable subsidence observedis associated with massive ground ice. Thinning of glacier ablation zonesurfaces along with thermokarst subsidence of soil surfaces suggest thepossibility of widespread positive melting feedbacks, where melting ofglacier surfaces and wetting of soil surfaces results in additional heatcapture and delivery to ice, resulting in further darkening and meltingof glacier surfaces and wetting and darkening of soil surfaces. Whilelandscape changes are concentrated in locations with excess groundice in the coastal thaw zone, changes to lakes and ponds are occurringacross microclimate zones in the MDV. This expansion of thermokarstdisruption and glacial change provides the physical backdrop forinterpreting biotic change in the MDV, even in the stable upland zone.The widespread presence of massive ground ice indicates that manysurfaces in the MDV will potentially undergo rapid (years to decades)subsidence of decimeters to decameters, resulting in changes to drain-age, energy balance, and soil structure. Such potential for rapid andwidespread change in coming years suggests that collection of topo-graphic measurements on finer timescales than once per decade maybe necessary to effectively manage the MDV natural laboratory and toprioritize melt-threatened sites for research before they are trans-formed by melting and subsidence.
Acknowledgements
This work was supported by the National Science Foundation Officeof Polar Programs Antarctic Integrated Systems Science Program awardANT-1246342 to AGF, JSL, DVH, and MG. JT and CG were partially sup-ported byNSF EAR/IF award#1339015. Any opinions,findings, and con-clusions or recommendations expressed in thismaterial are those of theauthor(s) and do not necessarily reflect the views of the National Sci-ence Foundation (NSF). Thanks to Jay Dickson, Gonçalo Vieira, andtwo anonymous reviewers for their constructive reviews.
Data availability
Lidar data are available for download via the Polar GeospatialCenter at http://data.pgc.umn.edu/elev/dem/ncalm/2014/las/ andvia OpenTopography.
Appendix A. Supplementary data
Supplementary data to this article can be found online at https://doi.org/10.1016/j.geomorph.2018.09.012.
References
Adams, B.J., et al., 2006. Diversity and distribution of Victoria Land biota. Soil Biol.Biochem. 38, 3003–3018.
Arblaster, J.M., Meehl, G.A., 2006. Contributions of external forcings to southern annularmode trends. J. Clim. 19, 2896–2905.
Arp, C.D., Whitman, M.S., Jones, B.M., Grosse, G., Gaglioti, B.V., Heim, K.C., 2015. Distribu-tion and biophysical processes of beaded streams in Arctic permafrost landscapes.Biogeosciences 12, 29–47. https://doi.org/10.5194/bg-12-29-2015.
Barrett, J.E., Virginia, R.A., Wall, D.H., Doran, P.T., Fountain, A.G., Welch, K.A., Lyons, W.B.,2008. Persistent effects of a discrete warming event on a polar desert ecosystem.Glob. Chang. Biol. 14 (10), 2249–2261.
95J.S. Levy et al. / Geomorphology 323 (2018) 80–97

Belshe, E.F., Schuur, E.A.G., Grosse, G., 2013. Quantification of upland thermokarst featureswith high resolution remote sensing. Environ. Res. Lett. 8. https://doi.org/10.1088/1748-9326/8/3/035017 (doi:10.1088-1748-9326-8-3-035016).
Bockheim, J.G., Campbell, I.B., McLeod, M., 2007. Permafrost distribution and active-layerdepths in the McMurdo Dry Valleys, Antarctica. Permafr. Periglac. Process. 18,217–227. https://doi.org/10.1002/ppp.588.
Bourke,M.C., Ewing, R.C., Finnegan, D., McGowan, H.A., 2009. Sand dunemovement in theVictoria Valley, Antarctica. Geomorphology 109 (3–4), 148–160. https://doi.org/10.1016/j.geomorph.2009.02.028.
Braudrick, C.A., Dietrich, W.E., Leverich, G.T., Sklar, L.S., 2009. Experimental evidence forthe conditions necessary to sustain meandering in coarse-bedded rivers. Proc. Natl.Acad. Sci. 106 (40), 16936–16941. https://doi.org/10.1073/pnas.0909417106.
Bristow, C.S., Augustinus, P.C., Wallis, I.C., Jol, H.M., Rhodes, E.J., 2010. Investigation of theage and migration of reversing dunes in Antarctica using GPR and OSL, with implica-tions for GPR on Mars. Earth Planet. Sci. Lett. 289 (1–2), 30–42. https://doi.org/10.1016/j.epsl.2009.10.026.
Brook, E.J., Brown, E.T., Kurz, M.D., Ackert, R.P., Raisbeck, G.M., Yiou, F., 1995. Constraintson age, erosion, and uplift of Neogene glacial deposits in the Transantarctic Moun-tains determined from in situ cosmogenic 10Be and 26Al. Geology 23 (12),1063–1066.
Campbell, I.B., Claridge, G., 2003. In: Phillips, M., Springman, S.M., Arenson, L.U. (Eds.),Thermokarst landforms in the Transantarctic Mountains region of Antarctica. Pro-ceedings of the Eighth International Conference on Permafrost. Swets & Zeltinger,Lisse, pp. 119–123.
Cary, S.C., McDonald, I.R., Barrett, J.E., Cowan, D.A., 2010. On the rocks: themicrobiology ofAntarctic cold desert soils. Nat. Rev. Microbiol. 8, 129–138.
Castendyk, D.N., Obryk, M.K., Leidman, S.Z., Gooseff, M., Hawes, I., 2016. Lake Vanda: asentinel for climate change in the McMurdo Sound Region of Antarctica. Glob. Planet.Chang. 144, 213–227. https://doi.org/10.1016/j.gloplacha.2016.06.007.
Chapman, W.L., Walsh, J.E., 2007. A synthesis of Antarctic temperatures. J. Clim. 20,4096–4117. https://doi.org/10.1175/JCLI4236.1.
Conovitz, P.A., McKnight, D.M., MacDonald, L.H., Fountain, A.G., House, H.R., 1998. Hydro-logic processes influencing streamflow variation in Fryxell Basin, Antarctica. In:Priscu, J.C. (Ed.), Ecosystem Dynamics in a Polar Desert: The McMurdo Dry Valleys,Antarctica. American Geophysical Union, pp. 93–108.
Csatho, B.M., Schenk, T., Krabill, W.B., Wilson, T.J., Lyons, W.B., McKenzie, G., Hallam, C.,Manizade, S., Paulsen, T., 2005. Airborne laser scanning for high-resolution mappingof Antarctica. Eos 86, 237–238.
Czudek, T., Demek, J., 1970. Thermokarst in Siberia and its influence on the developmentof lowland relief. Quat. Res. 1, 103–120. https://doi.org/10.1016/0033-5894(70)90013-X.
Denton, G.H., Sugden, D.E., Marchant, D.R., Hall, B.L., Wilch, T.I., 1993. East Antarctic icesheet sensitivity to Pliocene climatic change from a Dry Valleys perspective. Geogr.Ann. Ser. A Phys. Geogr. 75, 155–204.
Dickson, J.L., Levy, J.S., Head, J.W., 2015. Time-lapse imaging in polar environments. EOSTrans. Am. Geophys. Union 95, 1–2. https://doi.org/10.3189/002214310793146313.
Doran, P.T., McKay, C.P., Clow, G.D., Dana, G.L., Fountain, A.G., Nylen, T., Lyons,W.B., 2002a.Valley floor climate observations from the McMurdo dry valleys, Antarctica,1986–2000. J. Geophys. Res. 107. https://doi.org/10.1029/2001JD002045 (DOI:10.1029-2001JD002045).
Doran, P.T., Priscu, J.C., Lyons, W.B., Walsh, J.E., Fountain, A.G., McKnight, D.M., Moorhead,D.L., Virginia, R.A., Wall, D.H., Clow, G.D., 2002b. Antarctic climate cooling and terres-trial ecosystem response. Nature 415, 517–520.
Doran, P.T., McKay, C.P., Fountain, A.G., Nylen, T., McKnight, D.M., Jaros, C., Barrett, J.E.,2008. Hydrologic response to extreme warm and cold summers in the McMurdoDry Valleys, East Antarctica. Antarct. Sci. 20 (5), 499–509.
Eveland, J., Gooseff,M.N., Lampkin, D.J., Barrett, J.E., Takacs-Vesbach, C., 2013. Spatial and tem-poral patterns of snow accumulation and aerial ablation across the McMurdo Dry Val-leys, Antarctica. Hydrol. Process. 22, 2864–2875. https://doi.org/10.1002/hyp.9407.
Farquharson, L.M., Mann, D.H., Grosse, G., Jones, B.M., Romanovsky, V.E., 2016. Spatial dis-tribution of thermokarst terrain in Arctic Alaska. Geomorphology 273, 116–133.https://doi.org/10.1016/j.geomorph.2016.08.007.
Fernandez-Diaz, J., Carter, W., Glennie, C., Shrestha, R., Pan, Z., Ekhtari, N., Singhania, A.,Hauser, D., Sartori, M., 2016. Capability assessment and performance metrics for theTitan multispectral mapping lidar. Remote Sens. 8. https://doi.org/10.3390/rs8110936.
Fortier, D., Allard, M., Shur, Y., 2007. Observation of rapid drainage system developmentby thermal erosion of ice wedges on Bylot Island, Canadian Arctic Archipelago.Permafr. Periglac. Process. 18, 229–243. https://doi.org/10.1002/ppp.595.
Fountain, A.G., Lyons, W.B., Burkins, M.B., Dana, G.L., Doran, P.T., Lewis, K.J., McKnight,D.M., Moorhead, D.L., Parsons, A.N., Priscu, J.C., 1999. Physical controls on the TaylorValley ecosystem, Antarctica. Bioscience 49, 961–971.
Fountain, A.G., Nylen, T.H., Monaghan, A., Basagic, H.J., Bromwich, D., 2009. Snow in theMcMurdo Dry Valleys, Antarctica. Int. J. Climatol. 30, 633–642. https://doi.org/10.1002/joc.1933.
Fountain, A.G., Levy, J.S., Gooseff, M.N., Van Horn, D., 2014. The McMurdo Dry Valleys: alandscape on the threshold of change. Geomorphology 225, 25–35. https://doi.org/10.1016/j.geomorph.2014.03.044.
Fountain, A.G., Basagic, H.J., Niebuhr, S., 2016a. Glaciers in equilibrium, McMurdo Dry Val-leys, Antarctica. J. Glaciol. 62, 976–989. https://doi.org/10.1017/jog.2016.86.
Fountain, A.G., Saba, G., Adams, B., Doran, P., Fraser, W., Gooseff, M., et al., 2016b. The im-pact of a large-scale climate event on Antarctic ecosystem processes. BioScience 66(10), 848–863. https://doi.org/10.1093/biosci/biw110.
Fountain, A.G., Fernandez-Diaz, J.C., Obryk, M., Levy, J., Gooseff, M., Van Horn, D.J., Morin,P., Shrestha, R., 2017. High-resolution elevation mapping of the McMurdo Dry Val-leys, Antarctica, and surrounding regions. Earth Syst. Sci. Data 9, 435–443. https://doi.org/10.5194/essd-9-435-2017.
French, H., Shur, Y., 2010. The principles of cryostratigraphy. Earth Sci. Rev. 101, 190–206.https://doi.org/10.1016/j.earscirev.2010.04.002.
Ganti, V., Von Hagke, C., Scherler, D., Lamb, M.P., Fischer, W.W., Avouac, J.P., 2016. Timescale bias in erosion rates of glaciated landscapes. Sci. Adv. 2 (10), e1600204.https://doi.org/10.1126/sciadv.1600204.
Gillies, J.A., Nickling, W.G., Tilson, M., 2013. Frequency, magnitude, and characteristics ofaeolian sediment transport: McMurdo Dry Valleys, Antarctica. J. Geophys. Res. EarthSurf. 118, 461–479. https://doi.org/10.1002/jgrf.20007.
Gooseff, M.N., McKnight, D.M., Doran, P., Fountain, A.G., Lyons, W.B., 2011. Hydrologicalconnectivity of the landscape of the McMurdo Dry Valleys, Antarctica. Geogr. Com-pass 5 (9), 666–681.
Gooseff, M.N., Van Horn, D., Sudman, Z., McKnight, D.M., Welch, K.A., Lyons, W.B., 2016.Stream biogeochemical and suspended sediment responses to permafrost degrada-tion in stream banks in Taylor Valley, Antarctica. Biogeosciences 13 (6), 1723–1732.https://doi.org/10.5194/bg-13-1723-2016.
Gooseff, M.N., Barrett, J.E., Adams, B.J., Doran, P.T., Fountain, A.G., Lyons, W.B., McKnight,D.M., Priscu, J.C., Sokol, E.R., Takacs-Vesbach, C., Vandegehuchte, M.L., Virginia, R.A.,Wall, D.H., 2017. Decadal ecosystem response to an anomalous melt season in apolar desert in Antarctica. Nat. Ecol. Evol. 1, 1334–1338. https://doi.org/10.1038/s41559-017-0253-0.
Hagedorn, B., Sletten, R.S., Hallet, B., 2007. Sublimation and ice condensation in hyperaridsoils: modeling results using field data from Victoria Valley, Antarctica. J. Geophys.Res. 112, F03017. https://doi.org/10.1029/2006JF000580.
Hagedorn, B., Sletten, R.S., Hallet, B., McTigue, D.F., Steig, E.J., 2010. Ground ice rechargevia brine transport in frozen soils of Victoria Valley, Antarctica: Insights from model-ing δ18O and δD profiles. Geochim. Cosmochim. Acta 74 (2), 435–448.
Hall, B.L., Denton, G.H., 2000. Radiocarbon chronology of Ross Sea drift, eastern Taylor Val-ley, Antarctica: evidence for a grounded ice sheet in the Ross Sea at the last glacialmaximum. Geogr. Ann. Ser. B 82, 305–336.
Hall, B.L., Denton, G.H., Hendy, C.H., 2000. Evidence from Taylor Valley for a grounded icesheet in the Ross Sea, Antarctica. Geogr. Ann. Ser. B 82A, 275–303.
Hall, B.L., Denton, G.H., Heath, S.L., Jackson, M.S., Koffman, T.N.B., 2015. Accumulation andmarine forcing of ice dynamics in the western Ross Sea during the last deglaciation.Nat. Geosci. 8, 625–628. https://doi.org/10.1038/ngeo2478.
Harrison, W.D., Elsberg, D.H., Echelmeyer, K.A., Krimmel, R.M., 2001. On the characteriza-tion of glacier response by a single time-scale. J. Glaciol. 47 (159), 659–664.
Healy, T.R., 1975. Thermokarst—a mechanism of de-icing ice-cored moraines. Boreas 4,19–23.
Higgins, S.M., Denton, G.H., Hendy, C.H., 2000a. Glacial geomorphology of Bonney drift,Taylor Valley, Antarctica. Geogr. Ann. Ser. A Phys. Geogr. 82A, 365–389.
Higgins, S.M., Hendy, C.H., Denton, G.H., 2000b. Geochronology of Bonney drift, TaylorValley, Antarctica: evidence for interglacial expansions of Taylor Glacier. Geogr.Ann. Ser. A Phys. Geogr. 82A, 391–409.
Hoffman, M.J., Fountain, A.G., Liston, G.E., 2016. Distributed modeling of ablation(1996–2011) and climate sensitivity on the glaciers of Taylor Valley, Antarctica.J. Glaciol. 62, 215–229. https://doi.org/10.1017/jog.2015.2.
Irvine-Fynn, T.D.L., Barrand, N.E., Porter, P.R., Hodson, A.J., Murray, T., 2011. Recent High-Arctic glacial sediment redistribution: a process perspective using airborne lidar.Geomorphology 125, 27–39. https://doi.org/10.1016/j.geomorph.2010.08.012.
Jóhannesson, T., Raymond, C., Waddington, E.D., 1989. Time–scale for adjustment of gla-ciers to changes in mass balance. J. Glaciol. 35 (121), 355–369.
Jol, H.M., 2009. Ground Penetrating Radar Theory and Applications. Elsevier Science,Amsterdam 9780444533487 (544p.).
Jorgenson, M.T., Shur, Y., 2007. Evolution of lakes and basins in northern Alaska and dis-cussion of the thaw lake cycle. J. Geophys. Res. 112, 78-12. https://doi.org/10.1029/2006JF000531.
Jorgenson, M.T., Shur, Y.L., Pullman, E.R., 2006. Abrupt increase in permafrost degradationin Arctic Alaska. Geophys. Res. Lett. 33, 180–184. https://doi.org/10.1029/2005GL024960.
Kanevskiy, M., Shur, Y., Strauss, J., Jorgenson, T., Fortier, D., Stephani, E., Vasiliev, A., 2016. Pat-terns and rates of riverbank erosion involving ice-rich permafrost (yedoma) in northernAlaska. Geomorphology 253, 370–384. https://doi.org/10.1016/j.geomorph.2015.10.023.
Kowalewski, D.E., Marchant, D.R., Levy, J.S., Head, J.W., 2006. Quantifying low rates ofsummertime sublimation for buried glacier ice in Beacon Valley, Antarctica. Antarct.Sci. 18. https://doi.org/10.1017/S0954102006000460.
Kowalewski, D.E., Marchant, D.R., Head III, J.W., Jackson, D.W., 2011a. A 2D model forcharacterising first-order variability in sublimation of buried glacier ice, Antarctica:assessing the influence of polygon troughs, desert pavements and shallow subsurfacesalts. Permafr. Periglac. Process. 23, 1–14. https://doi.org/10.1002/ppp.731.
Kowalewski, D.E., Marchant, D.R., Swanger, K.M., James W Head, I., 2011b. Modelingvapor diffusion within cold and dry supraglacial tills of Antarctica: Implications forthe preservation of ancient ice. Geomorphology 126, 159–173. https://doi.org/10.1016/j.geomorph.2010.11.001.
Lacelle, D., Davila, A.F., Fisher, D., Pollard, W.H., DeWitt, R., Heldmann, J., Marinova, M.M.,McKay, C.P., 2013. Excess ground ice of condensation–diffusion origin in UniversityValley, Dry Valleys of Antarctica: evidence from isotope geochemistry and numericalmodeling. Geochim. Cosmochim. Acta 120, 280–297. https://doi.org/10.1016/j.gca.2013.06.032.
Levy, J., 2012. Howbig are theMcMurdoDry Valleys? Estimating ice-free area using Landsatimage data. Antarct. Sci. 25, 119–120. https://doi.org/10.1017/S0954102012000727.
Levy, J.S., Schmidt, L.S., 2016. Thermal properties of Antarctic soils: wetting controls sub-surface thermal state. Antarct. Sci. 28, 361–370.
Levy, J.S., Fountain, A.G., Gooseff, M.N., Welch, K.A., Lyons, W.B., 2011. Water tracks andpermafrost in Taylor Valley, Antarctica: extensive and shallow groundwater connec-tivity in a cold desert ecosystem. Geol. Soc. Am. Bull. 123, 2295–2311. https://doi.org/10.1130/B30436.1.
96 J.S. Levy et al. / Geomorphology 323 (2018) 80–97
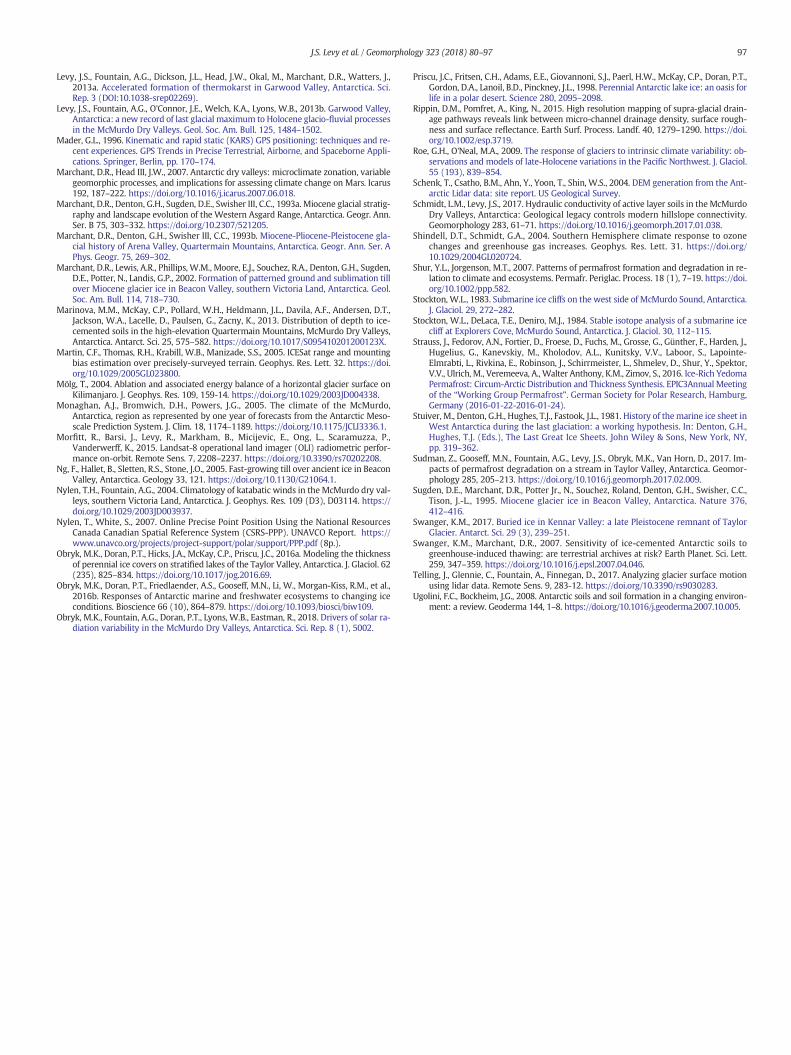
Levy, J.S., Fountain, A.G., Dickson, J.L., Head, J.W., Okal, M., Marchant, D.R., Watters, J.,2013a. Accelerated formation of thermokarst in Garwood Valley, Antarctica. Sci.Rep. 3 (DOI:10.1038-srep02269).
Levy, J.S., Fountain, A.G., O'Connor, J.E., Welch, K.A., Lyons, W.B., 2013b. Garwood Valley,Antarctica: a new record of last glacial maximum to Holocene glacio-fluvial processesin the McMurdo Dry Valleys. Geol. Soc. Am. Bull. 125, 1484–1502.
Mader, G.L., 1996. Kinematic and rapid static (KARS) GPS positioning: techniques and re-cent experiences. GPS Trends in Precise Terrestrial, Airborne, and Spaceborne Appli-cations. Springer, Berlin, pp. 170–174.
Marchant, D.R., Head III, J.W., 2007. Antarctic dry valleys: microclimate zonation, variablegeomorphic processes, and implications for assessing climate change on Mars. Icarus192, 187–222. https://doi.org/10.1016/j.icarus.2007.06.018.
Marchant, D.R., Denton, G.H., Sugden, D.E., Swisher III, C.C., 1993a. Miocene glacial stratig-raphy and landscape evolution of the Western Asgard Range, Antarctica. Geogr. Ann.Ser. B 75, 303–332. https://doi.org/10.2307/521205.
Marchant, D.R., Denton, G.H., Swisher III, C.C., 1993b. Miocene-Pliocene-Pleistocene gla-cial history of Arena Valley, Quartermain Mountains, Antarctica. Geogr. Ann. Ser. APhys. Geogr. 75, 269–302.
Marchant, D.R., Lewis, A.R., Phillips, W.M., Moore, E.J., Souchez, R.A., Denton, G.H., Sugden,D.E., Potter, N., Landis, G.P., 2002. Formation of patterned ground and sublimation tillover Miocene glacier ice in Beacon Valley, southern Victoria Land, Antarctica. Geol.Soc. Am. Bull. 114, 718–730.
Marinova, M.M., McKay, C.P., Pollard, W.H., Heldmann, J.L., Davila, A.F., Andersen, D.T.,Jackson, W.A., Lacelle, D., Paulsen, G., Zacny, K., 2013. Distribution of depth to ice-cemented soils in the high-elevation Quartermain Mountains, McMurdo Dry Valleys,Antarctica. Antarct. Sci. 25, 575–582. https://doi.org/10.1017/S095410201200123X.
Martin, C.F., Thomas, R.H., Krabill, W.B., Manizade, S.S., 2005. ICESat range and mountingbias estimation over precisely-surveyed terrain. Geophys. Res. Lett. 32. https://doi.org/10.1029/2005GL023800.
Mölg, T., 2004. Ablation and associated energy balance of a horizontal glacier surface onKilimanjaro. J. Geophys. Res. 109, 159-14. https://doi.org/10.1029/2003JD004338.
Monaghan, A.J., Bromwich, D.H., Powers, J.G., 2005. The climate of the McMurdo,Antarctica, region as represented by one year of forecasts from the Antarctic Meso-scale Prediction System. J. Clim. 18, 1174–1189. https://doi.org/10.1175/JCLI3336.1.
Morfitt, R., Barsi, J., Levy, R., Markham, B., Micijevic, E., Ong, L., Scaramuzza, P.,Vanderwerff, K., 2015. Landsat-8 operational land imager (OLI) radiometric perfor-mance on-orbit. Remote Sens. 7, 2208–2237. https://doi.org/10.3390/rs70202208.
Ng, F., Hallet, B., Sletten, R.S., Stone, J.O., 2005. Fast-growing till over ancient ice in BeaconValley, Antarctica. Geology 33, 121. https://doi.org/10.1130/G21064.1.
Nylen, T.H., Fountain, A.G., 2004. Climatology of katabatic winds in the McMurdo dry val-leys, southern Victoria Land, Antarctica. J. Geophys. Res. 109 (D3), D03114. https://doi.org/10.1029/2003JD003937.
Nylen, T., White, S., 2007. Online Precise Point Position Using the National ResourcesCanada Canadian Spatial Reference System (CSRS-PPP). UNAVCO Report. https://www.unavco.org/projects/project-support/polar/support/PPP.pdf (8p.).
Obryk, M.K., Doran, P.T., Hicks, J.A., McKay, C.P., Priscu, J.C., 2016a. Modeling the thicknessof perennial ice covers on stratified lakes of the Taylor Valley, Antarctica. J. Glaciol. 62(235), 825–834. https://doi.org/10.1017/jog.2016.69.
Obryk, M.K., Doran, P.T., Friedlaender, A.S., Gooseff, M.N., Li, W., Morgan-Kiss, R.M., et al.,2016b. Responses of Antarctic marine and freshwater ecosystems to changing iceconditions. Bioscience 66 (10), 864–879. https://doi.org/10.1093/biosci/biw109.
Obryk, M.K., Fountain, A.G., Doran, P.T., Lyons, W.B., Eastman, R., 2018. Drivers of solar ra-diation variability in the McMurdo Dry Valleys, Antarctica. Sci. Rep. 8 (1), 5002.
Priscu, J.C., Fritsen, C.H., Adams, E.E., Giovannoni, S.J., Paerl, H.W., McKay, C.P., Doran, P.T.,Gordon, D.A., Lanoil, B.D., Pinckney, J.L., 1998. Perennial Antarctic lake ice: an oasis forlife in a polar desert. Science 280, 2095–2098.
Rippin, D.M., Pomfret, A., King, N., 2015. High resolution mapping of supra-glacial drain-age pathways reveals link between micro-channel drainage density, surface rough-ness and surface reflectance. Earth Surf. Process. Landf. 40, 1279–1290. https://doi.org/10.1002/esp.3719.
Roe, G.H., O'Neal, M.A., 2009. The response of glaciers to intrinsic climate variability: ob-servations and models of late-Holocene variations in the Pacific Northwest. J. Glaciol.55 (193), 839–854.
Schenk, T., Csatho, B.M., Ahn, Y., Yoon, T., Shin, W.S., 2004. DEM generation from the Ant-arctic Lidar data: site report. US Geological Survey.
Schmidt, L.M., Levy, J.S., 2017. Hydraulic conductivity of active layer soils in the McMurdoDry Valleys, Antarctica: Geological legacy controls modern hillslope connectivity.Geomorphology 283, 61–71. https://doi.org/10.1016/j.geomorph.2017.01.038.
Shindell, D.T., Schmidt, G.A., 2004. Southern Hemisphere climate response to ozonechanges and greenhouse gas increases. Geophys. Res. Lett. 31. https://doi.org/10.1029/2004GL020724.
Shur, Y.L., Jorgenson, M.T., 2007. Patterns of permafrost formation and degradation in re-lation to climate and ecosystems. Permafr. Periglac. Process. 18 (1), 7–19. https://doi.org/10.1002/ppp.582.
Stockton, W.L., 1983. Submarine ice cliffs on the west side of McMurdo Sound, Antarctica.J. Glaciol. 29, 272–282.
Stockton, W.L., DeLaca, T.E., Deniro, M.J., 1984. Stable isotope analysis of a submarine icecliff at Explorers Cove, McMurdo Sound, Antarctica. J. Glaciol. 30, 112–115.
Strauss, J., Fedorov, A.N., Fortier, D., Froese, D., Fuchs, M., Grosse, G., Günther, F., Harden, J.,Hugelius, G., Kanevskiy, M., Kholodov, A.L., Kunitsky, V.V., Laboor, S., Lapointe-Elmrabti, L., Rivkina, E., Robinson, J., Schirrmeister, L., Shmelev, D., Shur, Y., Spektor,V.V., Ulrich, M., Veremeeva, A., Walter Anthony, K.M., Zimov, S., 2016. Ice-Rich YedomaPermafrost: Circum-Arctic Distribution and Thickness Synthesis. EPIC3Annual Meetingof the “Working Group Permafrost”. German Society for Polar Research, Hamburg,Germany (2016-01-22-2016-01-24).
Stuiver, M., Denton, G.H., Hughes, T.J., Fastook, J.L., 1981. History of themarine ice sheet inWest Antarctica during the last glaciation: a working hypothesis. In: Denton, G.H.,Hughes, T.J. (Eds.), The Last Great Ice Sheets. John Wiley & Sons, New York, NY,pp. 319–362.
Sudman, Z., Gooseff, M.N., Fountain, A.G., Levy, J.S., Obryk, M.K., Van Horn, D., 2017. Im-pacts of permafrost degradation on a stream in Taylor Valley, Antarctica. Geomor-phology 285, 205–213. https://doi.org/10.1016/j.geomorph.2017.02.009.
Sugden, D.E., Marchant, D.R., Potter Jr., N., Souchez, Roland, Denton, G.H., Swisher, C.C.,Tison, J.-L., 1995. Miocene glacier ice in Beacon Valley, Antarctica. Nature 376,412–416.
Swanger, K.M., 2017. Buried ice in Kennar Valley: a late Pleistocene remnant of TaylorGlacier. Antarct. Sci. 29 (3), 239–251.
Swanger, K.M., Marchant, D.R., 2007. Sensitivity of ice-cemented Antarctic soils togreenhouse-induced thawing: are terrestrial archives at risk? Earth Planet. Sci. Lett.259, 347–359. https://doi.org/10.1016/j.epsl.2007.04.046.
Telling, J., Glennie, C., Fountain, A., Finnegan, D., 2017. Analyzing glacier surface motionusing lidar data. Remote Sens. 9, 283-12. https://doi.org/10.3390/rs9030283.
Ugolini, F.C., Bockheim, J.G., 2008. Antarctic soils and soil formation in a changing environ-ment: a review. Geoderma 144, 1–8. https://doi.org/10.1016/j.geoderma.2007.10.005.
97J.S. Levy et al. / Geomorphology 323 (2018) 80–97
Related Documents


