AREP GAW AQ forecasting examples GCl i ARIANET G. Calori, ARIANET

Welcome message from author
This document is posted to help you gain knowledge. Please leave a comment to let me know what you think about it! Share it to your friends and learn new things together.
Transcript

AREPGAW
AQ forecasting examples
G C l i ARIANETG. Calori, ARIANET

AREPGAW
The Rome airThe Rome airThe Rome air The Rome air qualityquality
forecast systemforecast system
2

AREPGAW
The Rome AQFS
Purpose & contextProvide daily information (48 hrs ahead) on air quality in Rome metropolitan area and in the surrounding region
M d b R i l EPA (ARPA L i ) ith ARIANET tManaged by Regional EPA (ARPA-Lazio), with ARIANET support
Support ARPA-Lazio in its institutional dutiesInformation to the publicInformation to the public
Currently being put on-line
3Project of EC 5th Framework Program http://fumapex.dmi.dk/
AREPGAW
The Rome AQFS
Computational domains
5000000
5500000
4500000
40000004800000
0 500000 1000000 1500000 2000000
35000004700000
4750000
4600000
4650000
RAMS
FARM
RAMS meteorological model
STAM/FARM air quality model
4600000 650000 700000 750000 800000 850000 900000 950000 1000000
4500000
4550000FARMSTAM/FARM air quality model

AREPGAW
The Rome AQFS
ArchitectureSynoptic meteorologicalforecast (NCEP)forecast (NCEP)
GAPMeteo model Interface
RAMS
Meteorological input
GAPSurfPRO
Geographic data
Emission input
EMMA 760000 780000 800000 820000
4620000
4630000
4640000
4650000
4660000
4670000
Emission proc. Air quality model
STEM/FARMEmission inventories
EMMA
National scale air qualityforecast (QualeAria)
5
Concentration fields
AREPGAW
The Rome AQFS
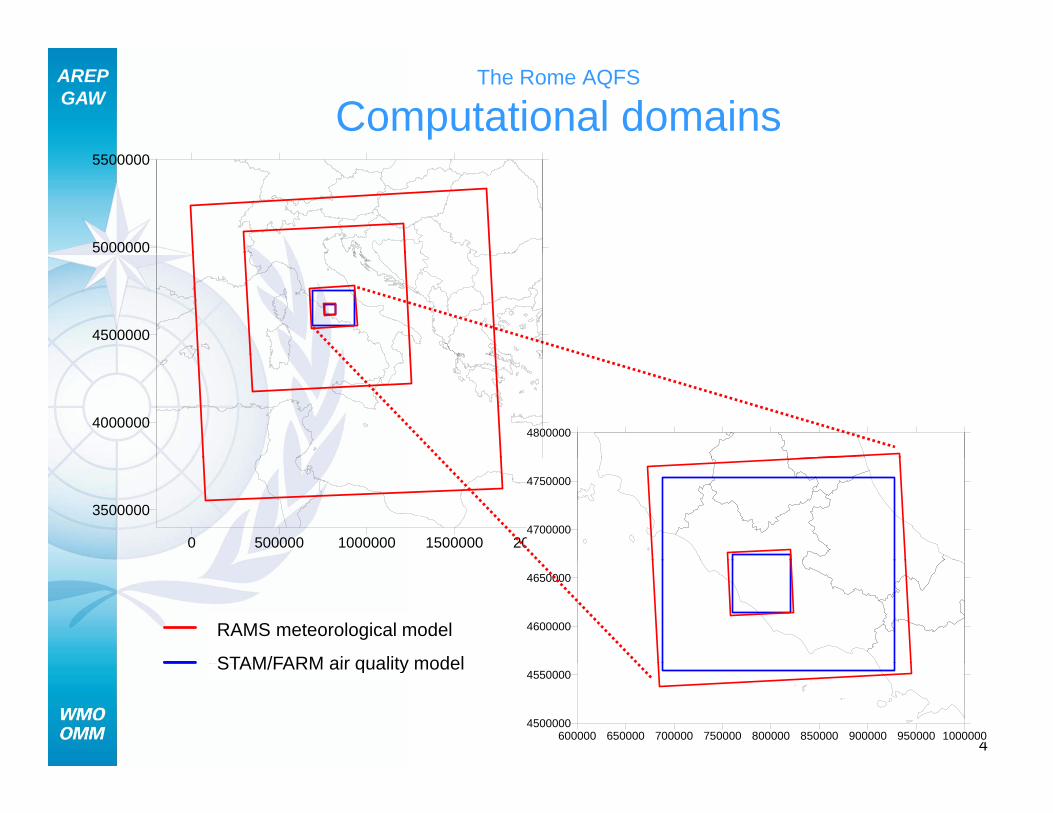
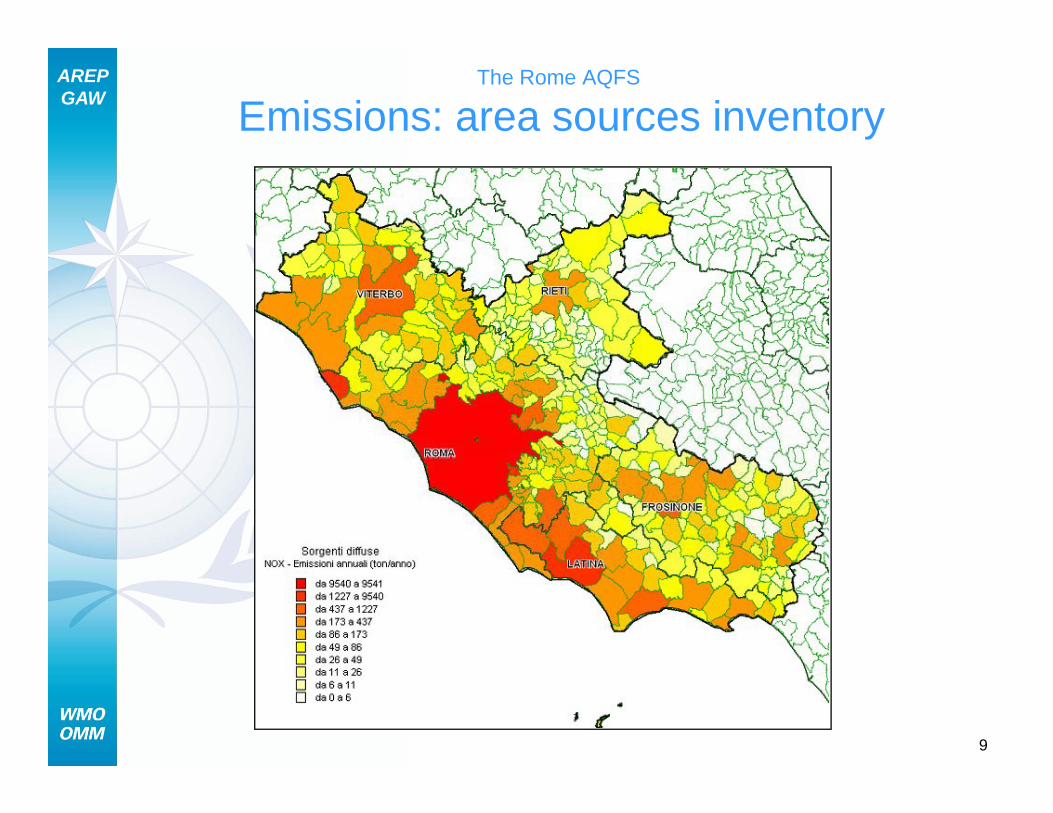
Emission inventory: sectors distribution
Province of Rome totals
90%
100%
OTHER SOURCES AND SINKS
AGRICULTURE
Province of Rome totals
60%
70%
80%AGRICULTURE
WASTE TREATMENT AND DISPOSAL
OTHER MOBILE SOURCES
ROAD TRANSPORT
30%
40%
50%SOLVENT
EXTRACTION AND DISTRIB.OF FOSSILFUELSPRODUCTION PROCESSES
COMBUSTION IN MANUFACTURING
0%
10%
20%
INDUSTRYNON-INDUSTRIAL COMBUSTION PLANTS
COMBUSTION IN ENERGY ANDTRANSFORMATION INDUSTRIES
6
0%CO NMVOC NH3 NOX PM10 SO2

AREPGAW
The Rome AQFS
Emissions: point sources inventory
For each stack:For each stack:
• location• height• diameter• diameter• exit speed &
temperature• pollutants
pemission rates
7

AREPGAW
The Rome AQFS
Emissions: line sources
Metropolitan area road network
• ~ 9000 links
• traffic assignment model+
• emissions module• emissions module
On each link:• vehicles flow & speedvehicles flow & speed• hourly emission rates by
vehicle category
8
AREPGAW
The Rome AQFS
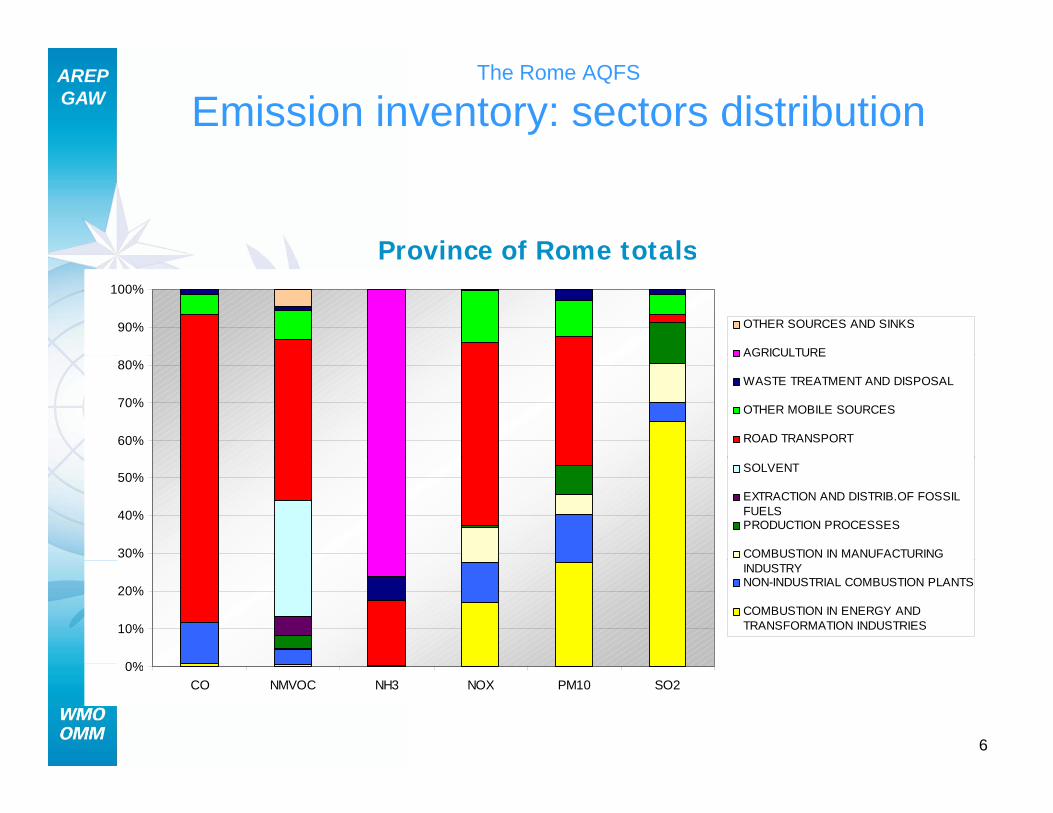
Emissions: area sources inventory
9
AREPGAW
The Rome AQFS
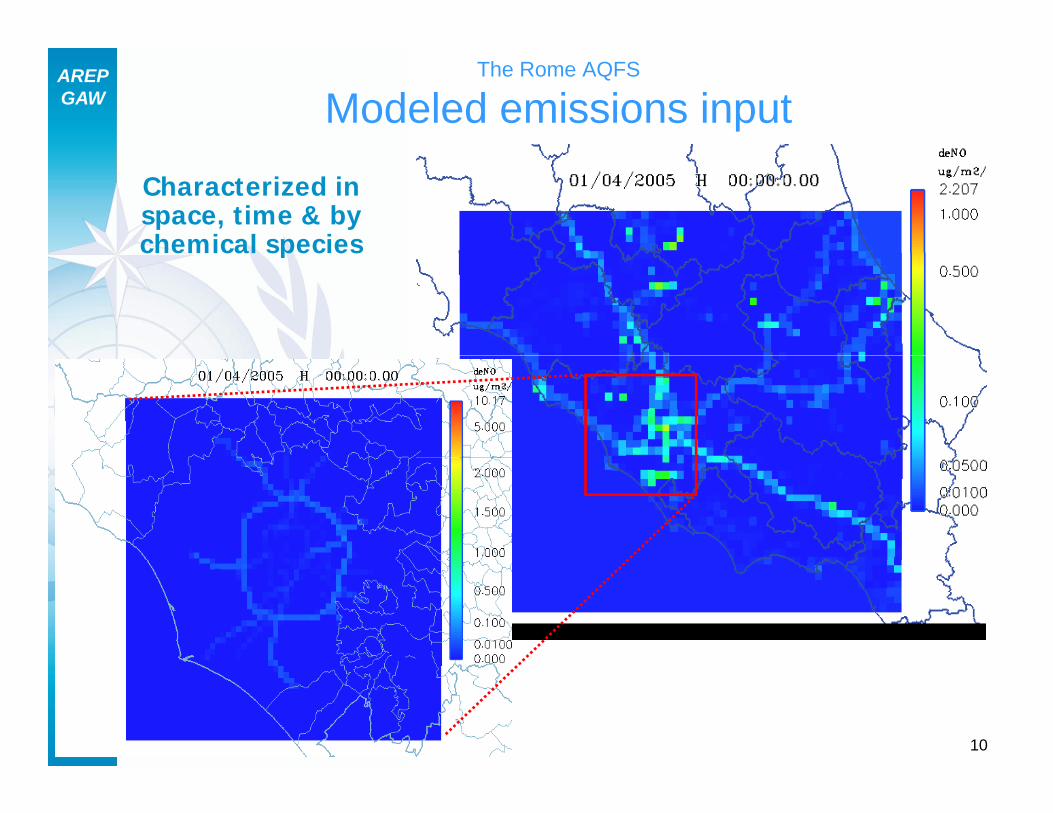
Modeled emissions input
Characterized in space, time & by chemical specieschemical species
10

AREPGAW
The Rome AQFS
Chemical boundary conditionsNONO22 -- 15 Nov 2008 hr 2015 Nov 2008 hr 20
QualeAria national system
11

AREPGAW
The Rome AQFS
Hourly concentration maps• STEM/FARM 3D Eulerian model• 48 hrs ahead• PM10, O3, NO2, CO, SO2, benzene, …• estimation of indicators according to legislation + exceedance
Regional domain
Rome metropolitan area
Mean 13 Feb 2008
12
Mean 13 Feb 2008

AREPGAW
The Rome AQFS
Maps distribution: 1 - web site
13http://www.aria-net.eu/ROMA/index.html

AREPGAW
The Rome AQFS
Maps distribution: 2 – Google Earth
14http://www.aria-net.eu/ROMA/lazio_link.kml http://www.aria-net.eu/ROMA/roma_link.kml
AREPGAW
The Rome AQFS
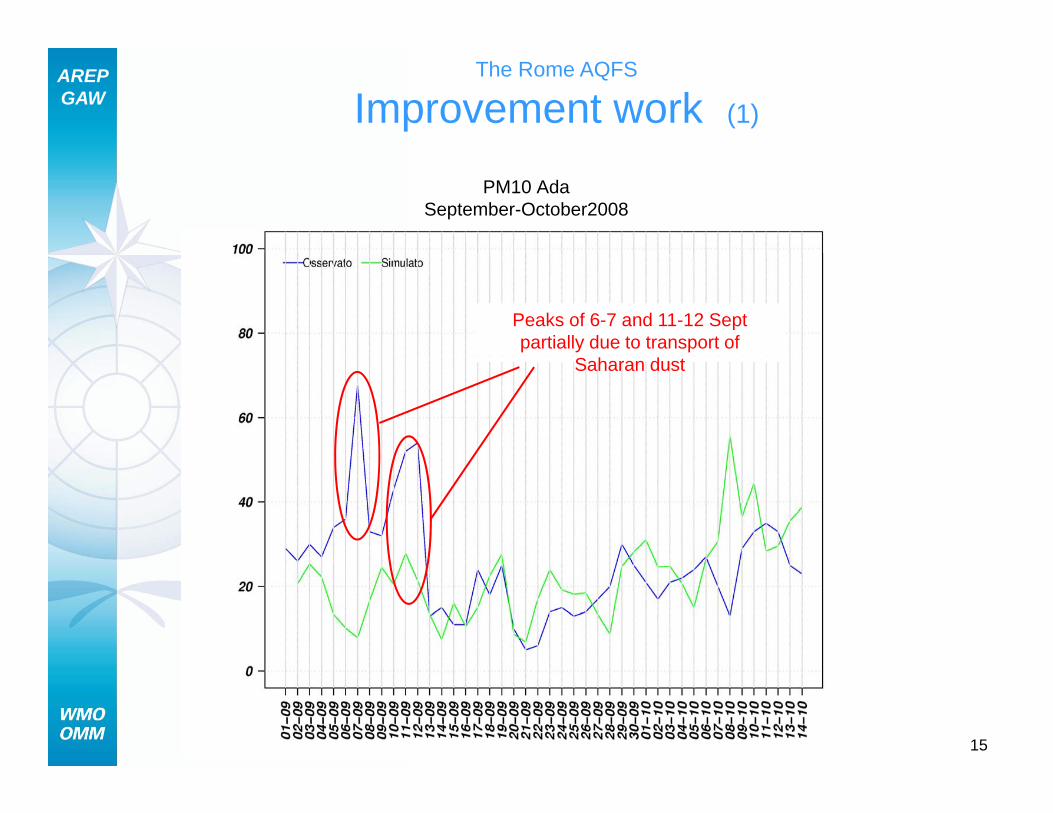
Improvement work (1)
PM10 AdaSeptember-October2008
Peaks of 6-7 and 11-12 Sept partially due to transport of
Saharan dust
15

AREPGAW
The Rome AQFS
Improvement work (2)Saharan dust events
I picchi di PM10 dei giorni 6-7 hanno luogo in condizioni perturbate, in corrispondenza di valori bassi osservati per NO2 e PM2.5 e sono attribuibili prevalentemente al trasporto di polveri sahariane.Nei giorni 11-12 settembre si osservano invece valori elevati di NO2 e rialzi di PM2.5 dovuti alla fase finale di un lungo periodo di alta
Saharan dust eventsTOMS satellite data
g g ppressione persistente. Si ha quindi sovrapposizione di contributo long range e di accumulo degli inquinanti emessi localmente.
16

AREPGAW
Saharan dust events
The Rome AQFS
Improvement work (3)Saharan dust events
DREAM modelled data
17

AREPGAW
The Turin air qualityThe Turin air qualityThe Turin air qualityThe Turin air qualityforecast systemforecast system
18

AREPGAW The Turin & Piemonte AQFS
• Operated since 2006
• Multiple years of historical data record
• Growing experience & understanding
• Confidence in performance
• Off-line counterpart for planning & emissions reduction programs
19

AREPGAW The Piemonte & Turin AQFS
g1 Piemonteg2 Novara
g2 Turin
20
24/02/2007- PM10 daily mean [μg/m3] (run 23/02/2007)

AREPGAW
The Piemonte & Turin AQFS
Architecture
21

AREPGAW
The Piemonte & Turin AQFS
Scheduling
Step1Input data processing
Step2Air quality simulation
• Forecast time: 48 hours (2 days forecasts, starting from today 01:00 a.m)
• Pollutants: SO2, NOx, NO2, CO, PM10, PM2.5, O3 and C6H6
• Time resolution: 1 hour;
22
• Post-processing: maps, air quality indicators and Torino metropolitan area Air Quality Index (IQA)
• Forecast dissemination: forecast products are delivered to Torino and Novara Provinces, where they can be browsed and redistributed to end users and public through the web (e.g. http://www.provincia.novara.it/arianova/WEB/index.html)

AREPGAW Novara Province
M b itMaps on web site
i Q li dAir Quality Index
http://www.provincia.novara.it/arianova/WEB/index.htmlhttp://www.provincia.novara.it/arianova/WEB/index.html
23
Road panels

AREPGAW
The Piemonte & Turin AQFS
Verification against measurements (1)Jul 2006 - Jul 2007Jul 2006 - Jul 2007
Forecasted Air Quality Index for Torino urban areaForecasted Air Quality Index for Torino urban area
AQI frequency distribution Predicted Observed
Satisfactory agreement
Underestimation of IQA in higher observed values (mainly due to PM10 underestimation during winter season)
24
g ( y 10 g )

AREPGAW
The Piemonte & Turin AQFS
Verification against measurements (2)Jul 2006 - Jul 2007Jul 2006 Jul 2007
PMPM1010TO Consolata
O3 daily maximum 8-hour running averageDruento – La Mandria
(+48 forecast, g2 grid)
TO Consolata Druento – La Mandria
25
• forecasted PM10 daily averages within the accuracy required by EU and Italian legislations (dotted red lines) at almost station locations
• greater underestimation for stations located outside the Torino metropolitan area

AREPGAW Resolution & comparison against measurements
“Domain A”Ivrea
(25x25 km)
“Domain B”Torino province(120x100 km)
As seen from domain B Domain A
60
80
112
49 51IvreaIvrea
NO
20
30
40
NO2Yearly
averages
26
0
10
ug/m31999Year of measured values: 2000

AREPGAW Multiple AQFS
National (ENEA/ARIANET)
ARPA Piemonte
ARPA Lazio
ARPA Puglia
CIPA
27

AREPGAW
Examples ofExamples ofExamples of Examples of Air QualityAir Quality
Forecast SystemsForecast Systems
28

AREPGAW Beijing AQFS
Partner: BMEMCTarget area: Beijing & Tianjin3 domains zooming: 45 → 15 → 5 kmMM5 + CHIMERE
29
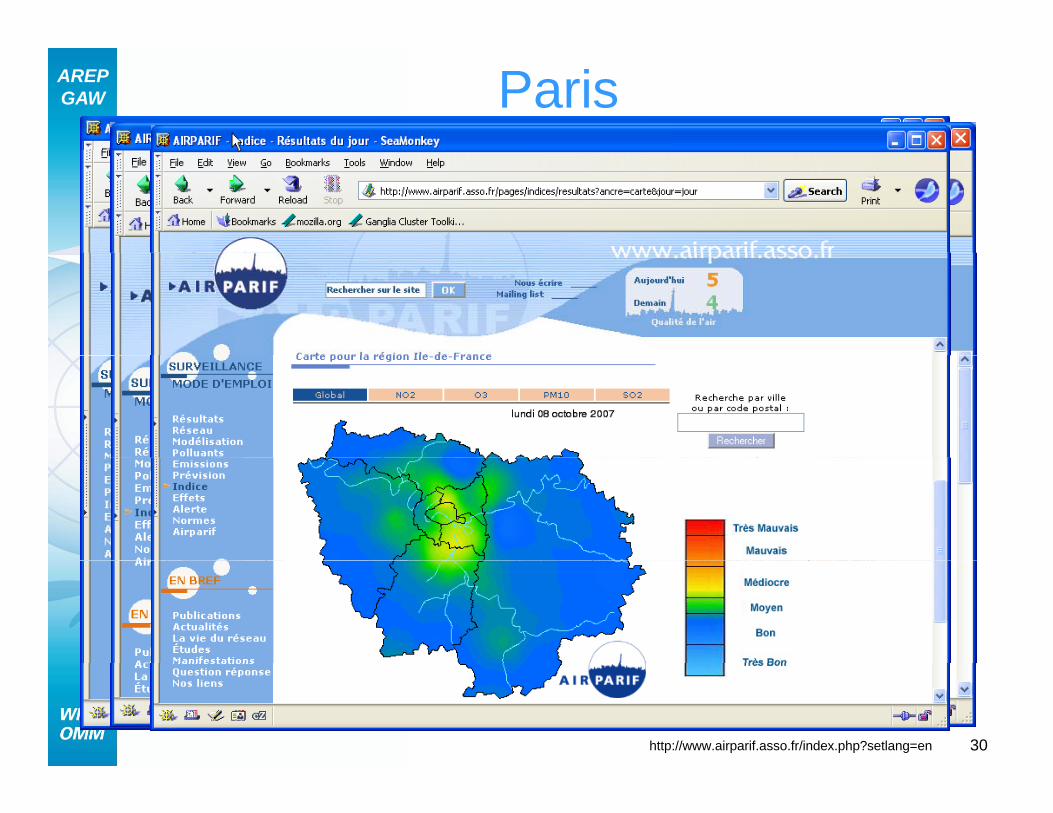
AREPGAW Paris
30http://www.airparif.asso.fr/index.php?setlang=en

AREPGAW Oslo
31http://www.luftkvalitet.info/Default.aspx?pageid=838&show=2

AREPGAW Northrhine-Westfalia
32http://www.eurad.uni-koeln.de/index_e.html

AREPGAW Pacific Northwest
33http://lar.wsu.edu/airpact-3//

AREPGAW Sussex AQFS
34http://www.sussex-air.net/air_quality_forecasts.html

AREPGAW Haifa
35
Link al sito web

AREPGAW Toronto
36http://www.weatheroffice.gc.ca/airquality/pages/onaq-001_e.html

AREPGAW Portugal
37http://www2.dao.ua.pt/gemac/previsao_qar/
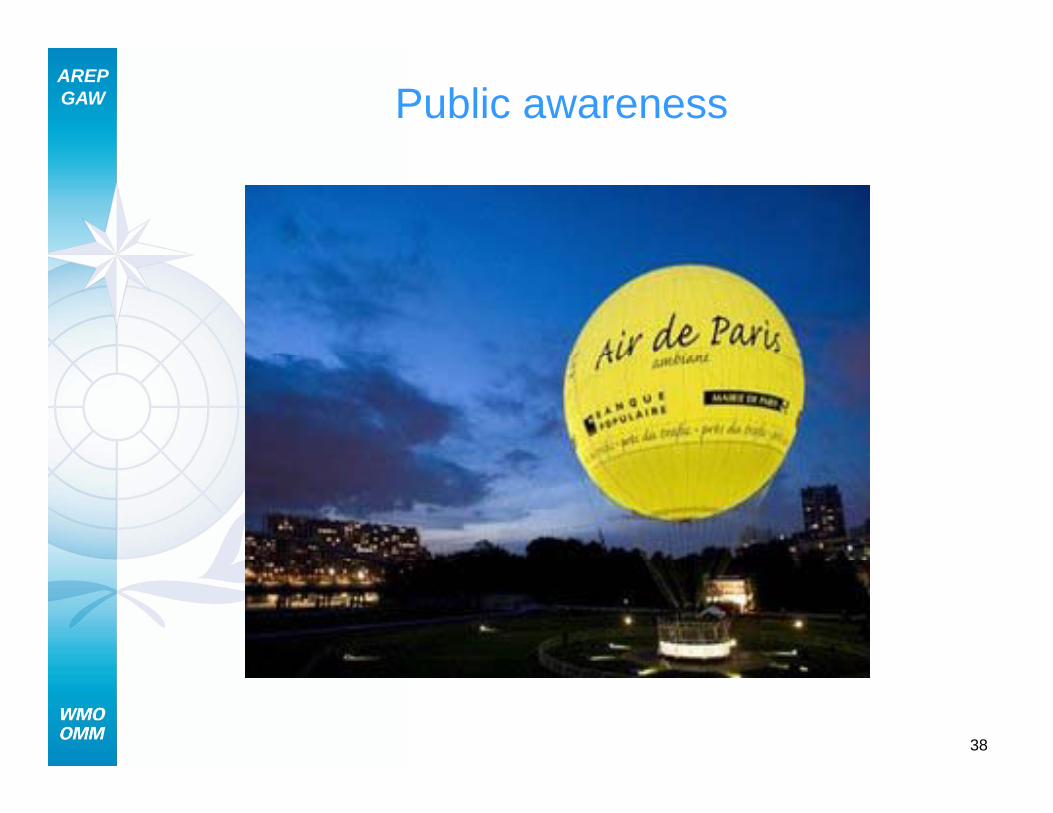
AREPGAW Public awareness
38

AREPGAW Communication
Media:• internet (web site, Google Earth …)
• TV newspapers• TV, newspapers• text/SMS, fax, voice mail, e-mail …• road panels• others …
Which quantity?• concentration values (max, 24 hrs avg., …)• synthetic indexes (AQI categories)
Information types:• messages bulletins• messages, bulletins • time series at selected locations• maps
39
… depending on the audience & purpose

AREPGAW Forecast purposes
• Public health notification
• Episodic control programs
• Specialized monitoring programs
• Knowledge base for planning & emissions reduction programs
40

AREPGAW Forecast for industrial sites
The PRIOLO industrial complexp
Milazzo
GelaPriolo
4600000
4800000
5000000
4130
4000000
4200000
4400000
4120
4125 Brucoli
Ogliastro
Villasmundo
Augusta
0 200000 400000 600000 800000 1000000 1200000 14000003600000
3800000
4110
4115
Nor
d (U
TM 3
3 km
)
CIPA
SanFocà
Farodromo
Melilli Bondife
41500 505 510 515 520 525 530Est (UTM33 - km)
4100
4105
Belvedere Floridia Siracusa

AREPGAW
The PRIOLO industrial complex
SARO – user interface
• Check modelling system computing status
42
• Check modelling system computing status
• Verify results of every step of the computational chain
• Visualise pollutant concentrations
AREPGAW
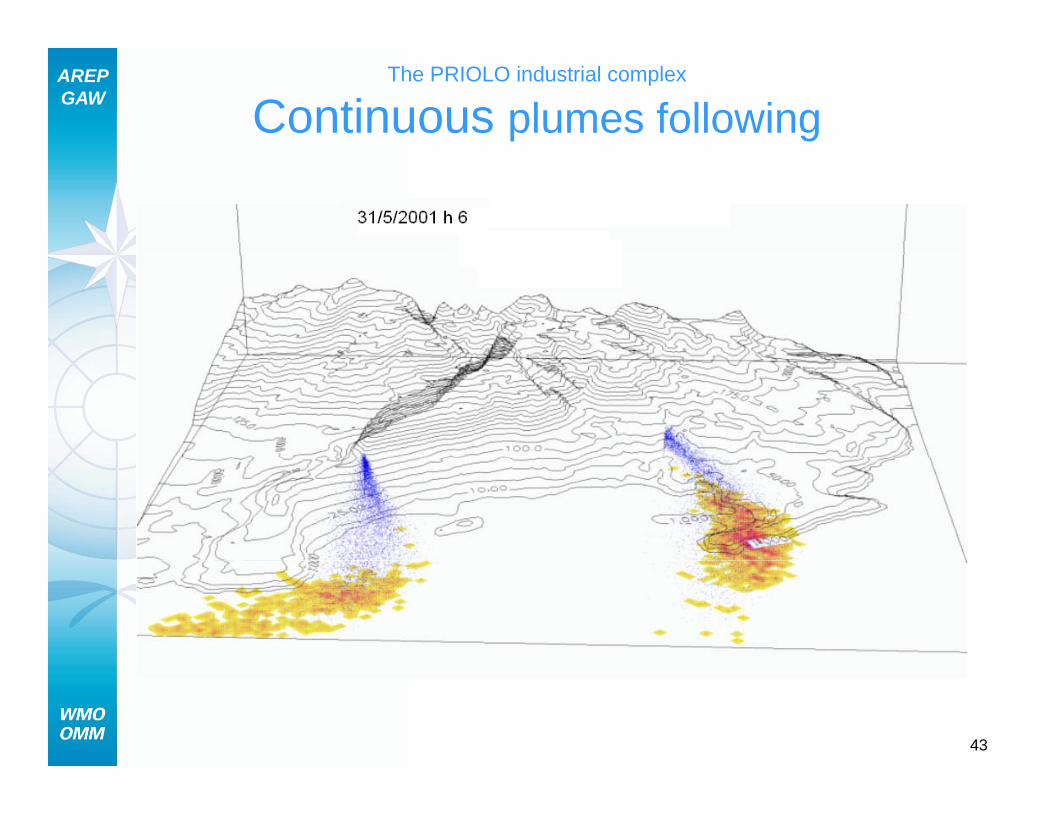
The PRIOLO industrial complex
Continuous plumes following
43

AREPGAW
The PRIOLO industrial complex
Accidental events
44
30 April 2006 Accident
AREPGAW Credits
Many thanks to colleagues from …• ARPA Lazio• ARPA Piemonte• CIPA• ENEAENEA• ARIA Technologies• ARIANET
45
http://www.chemicalweather.eu/
Related Documents