1 Debugging Reinvented: Asking and Answering Why and Why Not Questions about Program Behavior Andrew J. Ko and Brad A. Myers Human-Computer Interaction Institute School of Computer Science, Carnegie Mellon University 5000 Forbes Avenue, Pittsburgh, PA 15213 {ajko, bam}@cs.cmu.edu Abstract When software developers want to understand the reason for a program’s behavior, they must translate their questions about the behavior into a series of questions about code, speculating about the causes in the process. The Whyline is a new kind of debugging tool that avoids such speculation by instead enabling developers to select a question about program output from a set of why did and why didn’t questions derived from the program’s code and execution. The tool then finds one or more possible explanations for the output in question, using a combination of static and dynamic slicing, precise call graphs, and new algorithms for determining potential sources of values and explanations for why a line of code was not reached. Evaluations of the tool on one task showed that novice programmers with the Whyline were twice as fast as expert programmers without it. The tool has the potential to simplify debugging in many software development contexts. Categories and Subject Descriptors D.2.5 [Testing and Debugging]: Debugging aids, tracing H.5.2 [User Interfaces]: User centered design, interaction styles General Terms Reliability, Algorithms, Performance, Design, Human Factors. 1. INTRODUCTION Software developers have long struggled with understanding the causes of software behavior. And yet, despite decades of knowing that program understanding and debugging are some of the most challenging and time consuming aspects of software development, little has changed in how people work: these tasks still represent up to 70% of the time required to ship a software product [17]. A simple problem underlies this statistic: once a person sees an inappropriate behavior, they must then translate their questions about the behavior into a series of queries about the program’s code. In doing this translation, developers basically have to guess about what code is responsible [10]. This is worsened by the fact that bugs often manifest themselves in strange and unpredictable ways: a typo in a crucial conditional can dramatically alter program behavior. Even for experienced developers, speculation about the relationship between the symptoms of a problem and their cause is a serious issue. In our investigations, developers’ initial guesses were wrong almost 90% of the time [7,8]. Unfortunately, today’s debugging and program understanding tools do not help with this part of the task. Breakpoint debuggers require people to choose a line of code. Slicing tools require a choice of variable [2]. Querying tools require a person to write an executable expression about data [11]. As a result, all of these tools are subject to a ‘garbage-in garbage-out’ limitation: if a developer’s choice of code is irrelevant to the cause, the tool’s answer will be similarly irrelevant. Worse yet, none of today’s tools allow developers to ask why not questions about things that did not happen; such questions are often the majority of developers’ questions [10]. Of course, lots of things do not happen in a program, but developers tend only to ask about behaviors that a program is designed to do. In this paper, we present a new kind of program understanding and debugging tool called a Whyline, which overcomes these limitations. The idea is simple: rather than requiring people to translate their questions to code queries, the Whyline allows developers to choose a why did or why didn’t question about program output and then the Whyline generates an answer to the question using a variety of program analyses. This avoids the problems noted above because developers are much better at reasoning about program output, since unlike the execution of code, it is observable. Furthermore, in many cases, developers themselves define correctness in terms of the output. This work follows earlier prototypes. The Alice Whyline [8] supported a similar interaction technique, but for an extremely simple language with little need for procedures and a rigid definition of output (in a lab study, the Whyline for Alice decreased debugging time by a factor of 8). The Crystal framework [14], which supported questions in end-user applications, applied the same ideas, but limited the scope mostly to questions about commands and events that appear in an application’s undo stack (in lab studies of Crystal, participants were able to complete 30% more tasks, 20% faster). These successes inspired us to extend these ideas to an implementation for Java, which removes many of the limitations of our earlier work. We contribute (1) algorithms for deriving questions from code that are efficient and output-relevant, (2) algorithms for answering questions that provide near immediate feedback, and (3) a visualization of answers that is compact and simple to navigate. We achieve all of this with no limitations on the target program, other than that it uses standard Java I/O mechanisms and that the program does not run too long (given our trace-based approach). Permission to make digital or hard copies of all or part of this work for personal or classroom use is granted without fee provided that copies are not made or distributed for profit or commercial advantage and that copies bear this notice and the full citation on the first page. To copy otherwise, or republish, to post on servers or to redistribute to lists, requires prior specific permission and/or a fee. ICSE’08, May 10-18, 2008, Leipzig, Germany. Copyright 2008 ACM 978-1-60558-079-1/08/05...$5.00.

Welcome message from author
This document is posted to help you gain knowledge. Please leave a comment to let me know what you think about it! Share it to your friends and learn new things together.
Transcript
1
Debugging Reinvented: Asking and Answering Why and
Why Not Questions about Program Behavior
Andrew J. Ko and Brad A. MyersHuman-Computer Interaction Institute
School of Computer Science, Carnegie Mellon University
5000 Forbes Avenue, Pittsburgh, PA 15213
{ajko, bam}@cs.cmu.edu
AbstractWhen software developers want to understand the reason for a program’s behavior, they must translate their questions about the behavior into a series of questions about code, speculating about the causes in the process. The Whyline is a new kind of debugging tool that avoids such speculation by instead enabling developers to select a question about program output from a set of why did and why didn’t questions derived from the program’s code and execution. The tool then finds one or more possible explanations for the output in question, using a combination of static and dynamic slicing, precise call graphs, and new algorithms for determining potential sources of values and explanations for why a line of code was not reached. Evaluations of the tool on one task showed that novice programmers with the Whyline were twice as fast as expert programmers without it. The tool has the potential to simplify debugging in many software development contexts.
Categories and Subject DescriptorsD.2.5 [Testing and Debugging]: Debugging aids, tracingH.5.2 [User Interfaces]: User centered design, interaction styles
General TermsReliability, Algorithms, Performance, Design, Human Factors.
1. INTRODUCTIONSoftware developers have long struggled with understanding the causes of software behavior. And yet, despite decades of knowing that program understanding and debugging are some of the most challenging and time consuming aspects of software development, little has changed in how people work: these tasks still represent up to 70% of the time required to ship a software product [17].
A simple problem underlies this statistic: once a person sees an inappropriate behavior, they must then translate their questions about the behavior into a series of queries about the program’s code. In doing this translation, developers basically have to guess about what code is responsible [10]. This is worsened by the fact that bugs often manifest themselves in strange and unpredictable ways: a typo in a crucial conditional can dramatically alter program behavior. Even for experienced developers, speculation
about the relationship between the symptoms of a problem and their cause is a serious issue. In our investigations, developers’ initial guesses were wrong almost 90% of the time [7,8].
Unfortunately, today’s debugging and program understanding tools do not help with this part of the task. Breakpoint debuggers require people to choose a line of code. Slicing tools require a choice of variable [2]. Querying tools require a person to write an executable expression about data [11]. As a result, all of these tools are subject to a ‘garbage-in garbage-out’ limitation: if a developer’s choice of code is irrelevant to the cause, the tool’s answer will be similarly irrelevant. Worse yet, none of today’s tools allow developers to ask why not questions about things that did not happen; such questions are often the majority of developers’ questions [10]. Of course, lots of things do not happen in a program, but developers tend only to ask about behaviors that a program is designed to do.
In this paper, we present a new kind of program understanding and debugging tool called a Whyline, which overcomes these limitations. The idea is simple: rather than requiring people to translate their questions to code queries, the Whyline allows developers to choose a why did or why didn’t question about program output and then the Whyline generates an answer to the question using a variety of program analyses. This avoids the problems noted above because developers are much better at reasoning about program output, since unlike the execution of code, it is observable. Furthermore, in many cases, developers themselves define correctness in terms of the output.
This work follows earlier prototypes. The Alice Whyline [8] supported a similar interaction technique, but for an extremely simple language with little need for procedures and a rigid definition of output (in a lab study, the Whyline for Alice decreased debugging time by a factor of 8). The Crystal framework [14], which supported questions in end-user applications, applied the same ideas, but limited the scope mostly to questions about commands and events that appear in an application’s undo stack (in lab studies of Crystal, participants were able to complete 30% more tasks, 20% faster).
These successes inspired us to extend these ideas to an implementation for Java, which removes many of the limitations of our earlier work. We contribute (1) algorithms for deriving questions from code that are efficient and output-relevant, (2) algorithms for answering questions that provide near immediate feedback, and (3) a visualization of answers that is compact and simple to navigate. We achieve all of this with no limitations on the target program, other than that it uses standard Java I/O mechanisms and that the program does not run too long (given our trace-based approach).
Permission to make digital or hard copies of all or part of this work for personal or classroom use is granted without fee provided that copies are not made or distributed for profit or commercial advantage and that copies bear this notice and the full citation on the first page. To copy otherwise, or republish, to post on servers or to redistribute to lists, requires prior specific permission and/or a fee.ICSE’08, May 10-18, 2008, Leipzig, Germany.Copyright 2008 ACM 978-1-60558-079-1/08/05...$5.00.
2
In the rest of this paper, we will discuss interactive aspects of our prototype and then discuss its design and implementation. We then present empirical evaluations of the technique, one of which found that novice programmers with the Whyline were nearly twice as fast as experts without it. We end with a discussion of the Whyline’s limitations relative to prior work.
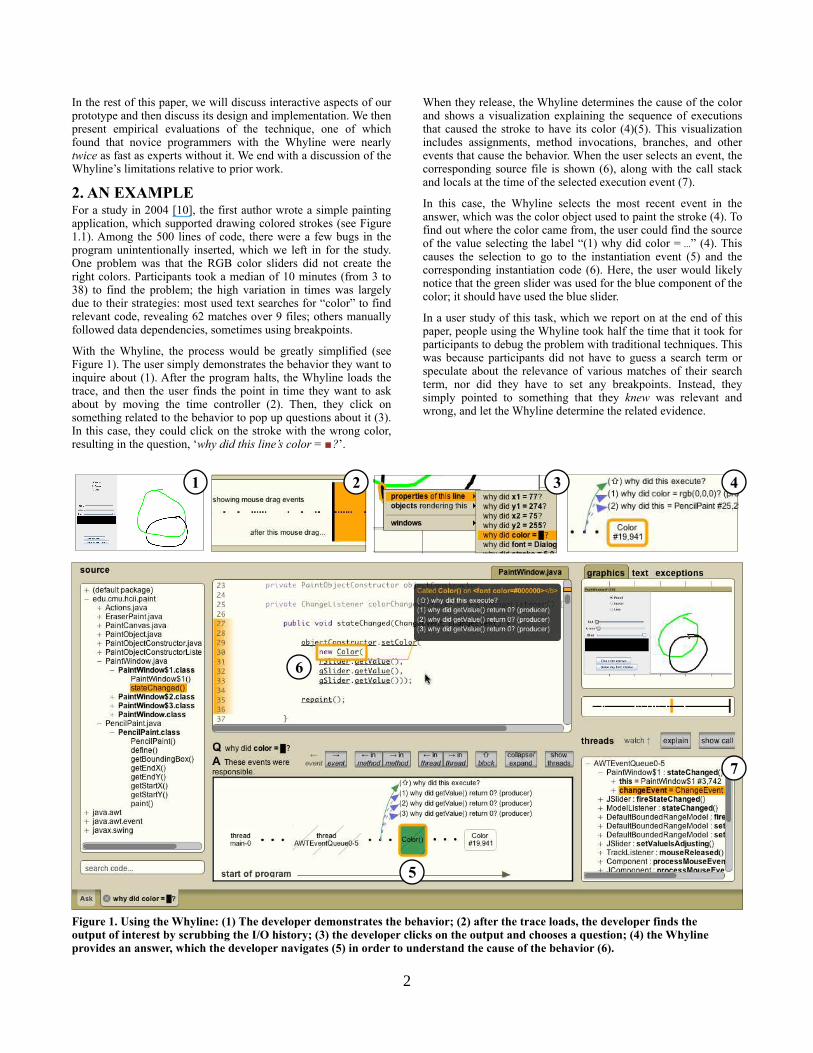
2. AN EXAMPLEFor a study in 2004 [10], the first author wrote a simple painting application, which supported drawing colored strokes (see Figure 1.1). Among the 500 lines of code, there were a few bugs in the program unintentionally inserted, which we left in for the study. One problem was that the RGB color sliders did not create the right colors. Participants took a median of 10 minutes (from 3 to 38) to find the problem; the high variation in times was largely due to their strategies: most used text searches for “color” to find relevant code, revealing 62 matches over 9 files; others manually followed data dependencies, sometimes using breakpoints.
With the Whyline, the process would be greatly simplified (see Figure 1). The user simply demonstrates the behavior they want to inquire about (1). After the program halts, the Whyline loads the trace, and then the user finds the point in time they want to ask about by moving the time controller (2). Then, they click on something related to the behavior to pop up questions about it (3). In this case, they could click on the stroke with the wrong color, resulting in the question, ‘why did this line’s color = !?’.
When they release, the Whyline determines the cause of the color and shows a visualization explaining the sequence of executions that caused the stroke to have its color (4)(5). This visualization includes assignments, method invocations, branches, and other events that cause the behavior. When the user selects an event, the corresponding source file is shown (6), along with the call stack and locals at the time of the selected execution event (7).
In this case, the Whyline selects the most recent event in the answer, which was the color object used to paint the stroke (4). To find out where the color came from, the user could find the source of the value selecting the label “(1) why did color = ...” (4). This causes the selection to go to the instantiation event (5) and the corresponding instantiation code (6). Here, the user would likely notice that the green slider was used for the blue component of the color; it should have used the blue slider.
In a user study of this task, which we report on at the end of this paper, people using the Whyline took half the time that it took for participants to debug the problem with traditional techniques. This was because participants did not have to guess a search term or speculate about the relevance of various matches of their search term, nor did they have to set any breakpoints. Instead, they simply pointed to something that they knew was relevant and wrong, and let the Whyline determine the related evidence.
Figure 1. Using the Whyline: (1) The developer demonstrates the behavior; (2) after the trace loads, the developer finds the output of interest by scrubbing the I/O history; (3) the developer clicks on the output and chooses a question; (4) the Whyline provides an answer, which the developer navigates (5) in order to understand the cause of the behavior (6).
1
5
6
2 3 4
7
3
3. DESIGN AND IMPLEMENTATIONThe Whyline is intended to support interactive debugging (unlike automated debuggers, which take a specification of correctness and find an cause [4]). Therefore, we had to develop new incremental and cache reliant algorithms to ensure near immediate feedback for most user actions. The Whyline also takes a post mortem approach to debugging, capturing a trace [19,20] and then analyzing it after the program has stopped, like modern profilers. This choice was based on evidence that bug fixing is generally a collaborative process [7], which could benefit from the ability to share executions of failures (a real-time approach would possible, but would require effort to support questions on real-time output).
3.1 Recording an Execution TraceA Whyline trace of an execution consists of a number of types of information: sequences of events that occurred in each thread, all class files executed and the source files that represent them, and other types of meta data recorded to interpret the data in the trace. A trace contains everything necessary for reproducing (but not necessarily reexecuting) a specific execution of a Java program.
To capture an execution trace, we use bytecode instrumentation. As each Java class is loaded, we intercept its byte array (using the !"#"$%"&'$(&)*+,-.&* package), instrument each of the methods in
the class, and return the modified code. We copy the uninstrumented version of each class in a trace folder, in case the class was loaded off a network. In order to keep track of code not executed (for answering why didn’t questions), we also keep track of each class referenced by the dynamically loaded class, and just before the program halts, we write each of these unexecuted class files to the same trace folder. Ideally, this would be done recursively, in order to get the complete call graph of all of the code that the program could have executed, but this would take considerable time and likely include all known classes.
As classes load, we skip those that the user has marked to skip, as well as a number of classes that are used in the instrumentation code itself. We also skip methods that, once instrumented, exceed the 65,536 byte length limit imposed by the JVM. Then, we cache instrumented versions of the class files and their modification date so that later executions of the target program or other programs that use the same classes can load faster.
Each execution thread has a separate trace file for its events. Each event has a header containing the following information:
• 1 bit )/(*01 flag to represent whether the event is the first
occurring after a thread switch. If it is set, a 32-bit serial event ID is recorded. The IDs for all subsequent events follow this ID in sequence, until the next switch. Switches are identified by checking whether the next event ID follows the last in a thread.
• A 1 bit (230"%%)*"04 flag; set to true if the code represents I/O
or is necessary for maintaining a call stack, which helps the trace loader know which events to process immediately.
• 6 bits to represent the event type (there are currently 55 types).
• 32 bits to represent an instruction ID, consisting of two parts: a 14 bit class ID (maintained for all instrumented classes, across all programs), and an 18 bit integer represent the index of the instruction as it appears in the class file. (The largest JDK class file contains fewer than 200,000 instructions and is an outlier).
Event types include assignments, invocations and returns, thread synchronization events, exception throws and catches, instantiations of objects and arrays, and some special events to
represent I/O events that are generated natively (such as mouse and keyboard events). Our studies also suggest that developers find concrete values essential for interpreting program state [7,8,10]. Therefore, unlike prior work [19,2], many of these events also include a value after their header. For example, for an invocation event, we would record values passed as arguments to the invocation, or for an assignment, the value assigned.
In every case where the value recorded is an object, we obtain a unique 64-bit ID for it, creating a new one if the object has yet to be encountered. These are stored in a thread safe weak reference hash table, so that objects can be garbage collected. For each new object encountered, we also write the type of the object (as a class ID) with its object ID to a separate file.
3.2 Loading the TraceWhen a Whyline trace is loaded, the loader performs a number of duties to prepare for question asking. First, the source files and class files are loaded, since these are used for nearly every aspect of question asking and answering. As they are loaded, the Whyline constructs lists of output instructions, which are later used to generate questions. After loading this static information, the Whyline generates a precise call graph, using all of the invocations found in class files. By precise, we mean that rather than using the type in the invocation instructions, we use a static analysis (described in Section 3.4) that conservatively finds all of the potential types of the actual instance used in the call, and resolves the method on these types. This omits many types of infeasible calls, increasing the precision of why didn’t answers.
Next, the loader reads the thread traces, loading events in order of their event IDs, switching between thread trace files as necessary using the )/(*01 flag in each event. This allows the Whyline to
have a complete ordering of the events in the execution. As events are read, events whose (230"%%)*"04 flag are set are processed
immediately (essentially output and events needed to maintain a call stack); others are loaded on demand. As call stacks are maintained, they are cached at equal intervals to provide semi-random access to the call stack state at any event. To improve the performance of question derivation and answering, the Whyline constructs lists of invocations, assignments to fields, and other types of events. These histories are stored as integer sequences of event IDs and are searched using binary search.
3.3 Creating an I/O HistoryThe creation of an I/O history is fundamental to the Whyline’s question support: it is how the Whyline establishes a connection between the pixels on screen and the data and logic used to paint the pixels. Our prototype assumes that a program uses standard Java I/O interfaces and their subclasses to produce output:5
!"#"$"/*$6+"71(0)89 for graphical output, !"#"$"/*$:(&;2/ to
represent windows and <.=>#.&* and ?2,).>#.&* for input events in
these windows, !"#"$(2$:+(*.+, @,*7,*A*+."-, B+(&*A*+."-, C.";.+
and D&7,*A*+."- for console and file I/O, and !"#"$%"&'$E1+2/"F%.
for exception output. The Java Whyline does not trace executions of native I/O (such as those used in some Java look and feels).
The Whyline creates output events from the low-level events described in previous sections. For example, a call to 6+"71(0)89$;+"/C.0*GH and its arguments are combined into an I/O
event representing the rectangle drawn. The Whyline then uses these I/O events to construct a user interface for navigating the output history. The console output is relatively straightforward to create, as it is just a list of strings to show and make selectable. The graphical history, like the one seen in Figure 1, is more
4
complicated. To recreate this history, we created an emulator for the 6+"71(0)89 class, including special support for the use of
double buffering, in order to track precisely when and where each render event occurred on screen. As these events are read from the trace, we also track when they occlude other render events, to enable random access to the graphical history by only drawing render events that would be visible at a particular time.
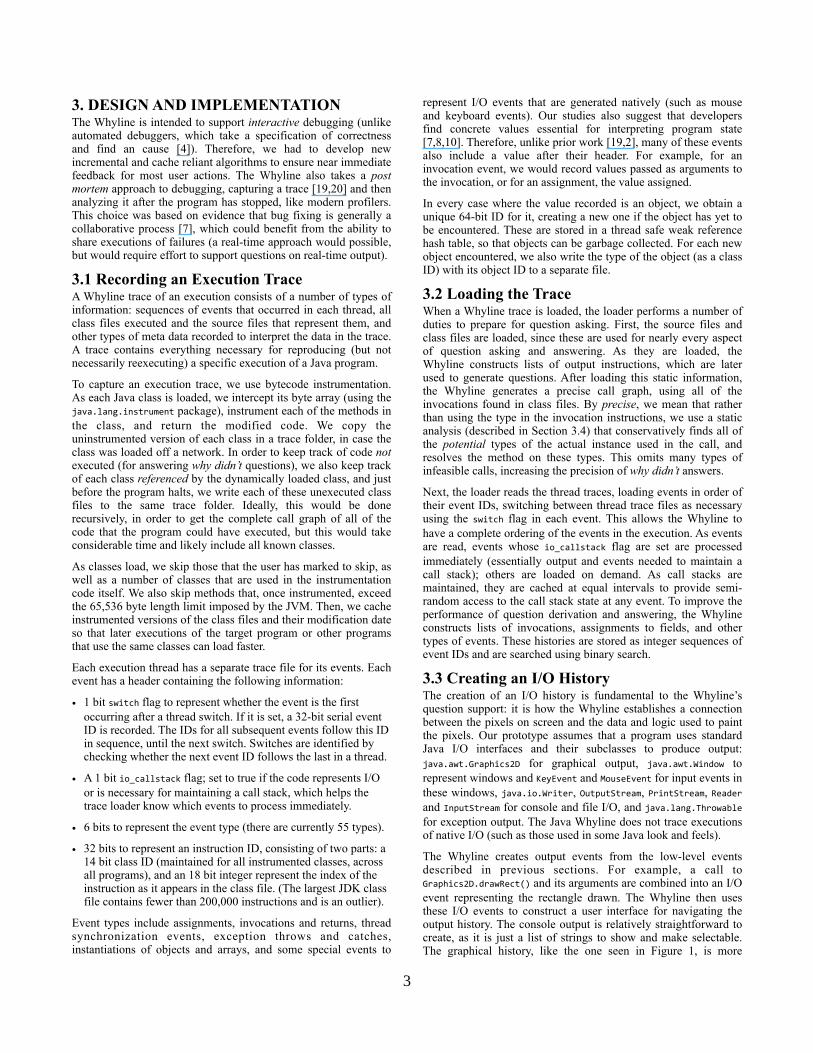
Before the user can ask questions, the Whyline handles the output instructions gathered during class loading. After parsing the output, the Whyline finds fields and invocations could have affected output, using the first algorithm in Figure 2. For example, the color of a rectangle might be affected by some field in an object, or by the return value of a call to some method. To find
these fields and invocations, the algorithm follows upstream static data dependencies, marking fields and methods along the way. Next, if the output instruction directly invokes output (such as drawing a rectangle, unlike setting the color, which merely affects appearance), all potential indirect callers to the output instructions method are marked as output invoking. This is done by simply following potential callers of a method, starting with the output instruction’s method (Figure 2). Each algorithm is run on each primitive output instruction, and halts either when reaching code already visited or code with no dependencies. Also, as we traverse instance methods, we track the class that we started in to filter out infeasible calls.
Intuitively, it would seem these algorithms mark everything; after all, what code is not responsible for affecting or invoking output? The insight here is that particular code is responsible for particular output. The Whyline uses these distinctions to generate and filter questions based on what the user expresses interest in.
3.4 Deriving QuestionsIn any program execution, many things happen, and many things do not. The Whyline uses both static and dynamic analyses to derive questions about these behaviors that the developer may or may not have expected.
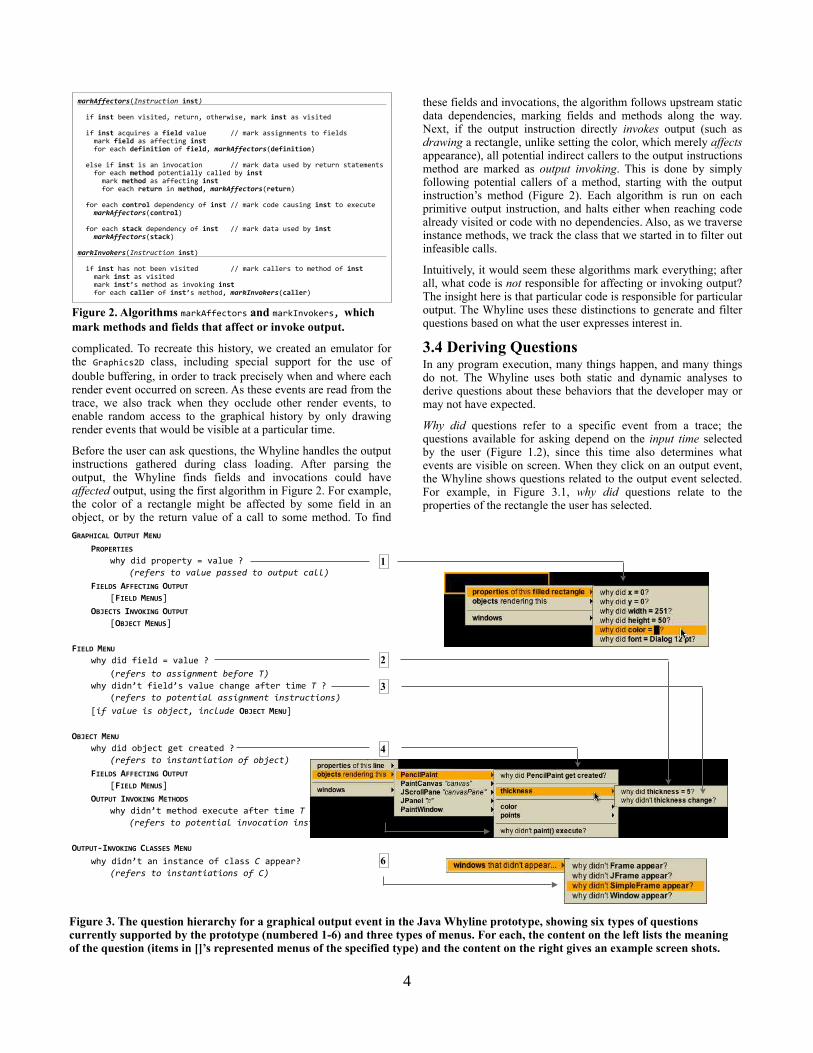
Why did questions refer to a specific event from a trace; the questions available for asking depend on the input time selected by the user (Figure 1.2), since this time also determines what events are visible on screen. When they click on an output event, the Whyline shows questions related to the output event selected. For example, in Figure 3.1, why did questions relate to the properties of the rectangle the user has selected.
!"#$%&&'()*#+G!"#$%&'$()"*!"#$+
55(I5!"#$5F..&5#()(*.;J5+.*,+&J52*1.+/().J5-"+45!"#$5")5#()(*.;
55(I5!"#$5"0K,(+.)5"5%!&'(5#"%,.555555LL5-"+45"))('&-.&*)5*25I(.%;)5555-"+45%!&'(5")5"II.0*(&'5!"#$))))I2+5."01)(&%!"!$!*"52I5%!&'(J)!"#$%&&'()*#+G(&%!"!$!*"H
55.%).5(I5!"#$5()5"&5("*(2&5555555LL5-"+45;"*"5,).;5F=5+.*,+&5)*"*.-.&*)5555I2+5."015+&$,*(572*.&*("%%=50"%%.;5F=5!"#$555555-"+45+&$,*(5")5"II.0*(&'5!"#$555555I2+5."015-&$.-"5(&5+&$,*(J5!"#$%&&'()*#+G-&$.-"H
55I2+5."015/*"$-*');.7.&;.&0=52I5!"#$5LL5-"+4502;.50",)(&'5!"#$5*25.M.0,*.))))!"#$%&&'()*#+G/*"$-*'H
55I2+5."015#$0/1);.7.&;.&0=52I5!"#$)))LL5-"+45;"*"5,).;5F=5!"#$))))!"#$%&&'()*#+G#$0/1H
!"#$,-.*$'#+G!"#$%&'$()"5!"#$H
55(I5!"#$51")5&2*5F..&5#()(*.;55555555LL5-"+450"%%.+)5*25-.*12;52I5!"#$5555-"+45!"#$5")5#()(*.;5555-"+45!"#$N)5-.*12;5")5((&'5!"#$5555I2+5."015/0''&-)2I5!"#$N)5-.*12;J5!"#$,-.*$'#+G/0''&-H
Figure 2. Algorithms -"+4OII.0*2+) and -"+4D.+)2)which
mark methods and fields that affect or invoke output.
Figure 3. The question hierarchy for a graphical output event in the Java Whyline prototype, showing six types of questions currently supported by the prototype (numbered 1-6) and three types of menus. For each, the content on the left lists the meaning of the question (items in []’s represented menus of the specified type) and the content on the right gives an example screen shots.
34567895:);<=6<=)>?@<
5 64;6?4=8?A
5 5 /1=5;(;57+27.+*=5P5#"%,.5Q
* * * ,%-.-%#*$)*/01&-*20##-3*$)*)&$2&$*'011+
5 B8?:CA)5BB?9=8@3);<=6<=
5 5 RB8?:C)>?@<AS
5 ;DE?9=A)8@F;G8@3);<=6<=
5 5 R;DE?9=)>?@<AS
B8?:C)>?@<
5 /1=5;(;5I(.%;5P5#"%,.5Q5
5 5 G%-.-%#*$)*0##(4"5-"$*6-.)%-*7+
T /1=5;(;&N*5I(.%;N)5#"%,.501"&'.5"I*.+5*(-.575Q
5 5 G%-.-%#*$)*2)$-"$(01*0##(4"5-"$*("#$%&'$()"#+
5 R(.*/01&-*(#*)68-'$9*("'1&3-*;DE?9=)>?@<S
;DE?9=)>?@<
5 /1=5;(;52F!.0*5'.*50+."*.;5Q
5 5 ,%-.-%#*$)*("#$0"$(0$()"*).*)68-'$+
5 B8?:CA)5BB?9=8@3);<=6<=
) ) RB8?:C)>?@<AS
) ;<=6<=)8@F;G8@3)>?=7;CA
H H /1=5;(;&N*5-.*12;5.M.0,*.5"I*.+5*(-.575Q
* * * ,%-.-%#*$)*2)$-"$(01*("/)'0$()"*("#$%&'$()"#+
;<=6<=I8@F;G8@3)9:5AA?A)>?@<
T /1=5;(;&N*5"&5(&)*"&0.52I50%"))5:5"77."+Q
5 5 ,%-.-%#*$)*("#$0"$(0$()"#*).*:+
1
2
3
4
5
6
5
In addition to questions about output primitives, it is also helpful to have questions about various widgets in a user interface toolkit, as well as any user defined classes that are represented by graphical output. Therefore, the user can ask about two types of higher level entities: object fields that influence the output primitive’s arguments and objects on the call stack that indirectly invoked the primitive output. These are entity questions, which allow the user to ask about output affecting fields and methods of the classes they may be familiar with. These questions refer to the specific instance of the class represented by the selected output primitive. An example would be a button, which often consists of filled rectangles and text.
In identifying such entities, it is important to include only objects that are relevant to output and that the user is likely to have created or used; we want to exclude intermediary and helper classes, such as look and feel classes that a UI widget might use to render itself, since the user may have never seen or created them. To achieve this, we inspect the call stack of the invocation that produced the selected output primitive. For each call stack entry that represents a call on an object, the object represents an output entity if it is an instance of a familiar class. A class is familiar if user owned code either defines or references the specific class. In our prototype, user owned code consists of those classes that were derived from source on the last compile (thus excluding APIs and libraries for which the developer has no source). One could imagine more sophisticated definitions for familiarity and ownership based on authorship, checkins, or other measures.
Once the Whyline identifies each entity represented by the selected output primitive, the Whyline generates questions for each entity. These include why did questions about each of the familiar, output affecting fields’ current values, such as why did this Button’s visible = true? (Figure 3.2) and also questions about why these fields were not assigned after the selected time (Figure 3.3). Familiarity is defined in a similar manner as for classes, where those fields that were referenced directly, or set by a setter method, are familiar. Each of these why did questions points to the most recent assignment to the field on that instance. The Whyline also generates questions about objects that indirectly invoked the selected output primitive, including questions about the creation of the object (Figure 3.4), about the objects output-affecting fields, and about output-invoking methods that the user believes did not execute (Figure 3.5).
The actual phrasing and presentation of questions depends on the type of output. Exceptions thrown by the program, caught or uncaught, are phrased as why did questions, and map to a throw event. Output in the console history supports questions about why a particular string was printed (mapping to the event that produced it). The questions supported for graphical output are a bit more diverse, because the output itself is more complex in nature. For primitive level output, such as a line, circle, or rectangle, users may ask why did questions about any of the properties used to render the output. These correspond to arguments passed to the render method, such as position and size, as well as state in the 6+"71(0)895object such as color and font.
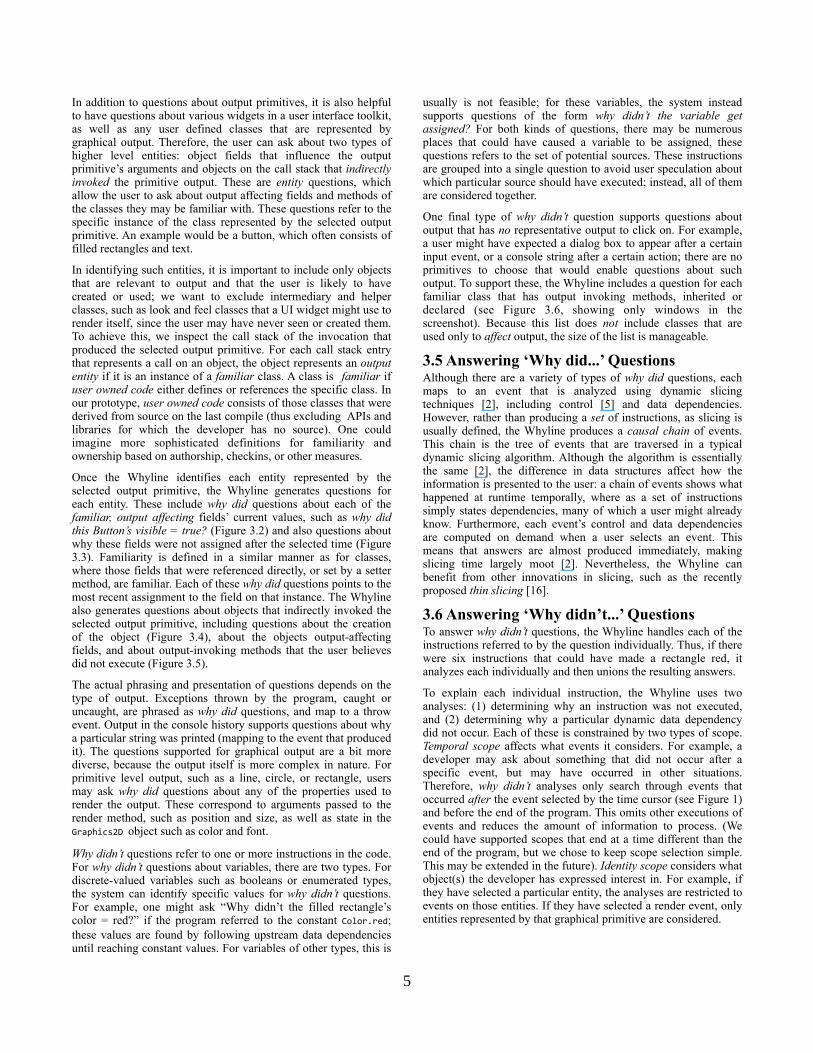
Why didn’t questions refer to one or more instructions in the code. For why didn’t questions about variables, there are two types. For discrete-valued variables such as booleans or enumerated types, the system can identify specific values for why didn’t questions. For example, one might ask “Why didn’t the filled rectangle’s color = red?” if the program referred to the constant U2%2+$+.;;
these values are found by following upstream data dependencies until reaching constant values. For variables of other types, this is
usually is not feasible; for these variables, the system instead supports questions of the form why didn’t the variable get assigned? For both kinds of questions, there may be numerous places that could have caused a variable to be assigned, these questions refers to the set of potential sources. These instructions are grouped into a single question to avoid user speculation about which particular source should have executed; instead, all of them are considered together.
One final type of why didn’t question supports questions about output that has no representative output to click on. For example, a user might have expected a dialog box to appear after a certain input event, or a console string after a certain action; there are no primitives to choose that would enable questions about such output. To support these, the Whyline includes a question for each familiar class that has output invoking methods, inherited or declared (see Figure 3.6, showing only windows in the screenshot). Because this list does not include classes that are used only to affect output, the size of the list is manageable.
3.5 Answering ‘Why did...’ QuestionsAlthough there are a variety of types of why did questions, each maps to an event that is analyzed using dynamic slicing techniques [2], including control [5] and data dependencies. However, rather than producing a set of instructions, as slicing is usually defined, the Whyline produces a causal chain of events. This chain is the tree of events that are traversed in a typical dynamic slicing algorithm. Although the algorithm is essentially the same [2], the difference in data structures affect how the information is presented to the user: a chain of events shows what happened at runtime temporally, where as a set of instructions simply states dependencies, many of which a user might already know. Furthermore, each event’s control and data dependencies are computed on demand when a user selects an event. This means that answers are almost produced immediately, making slicing time largely moot [2]. Nevertheless, the Whyline can benefit from other innovations in slicing, such as the recently proposed thin slicing [16].
3.6 Answering ‘Why didn’t...’ QuestionsTo answer why didn’t questions, the Whyline handles each of the instructions referred to by the question individually. Thus, if there were six instructions that could have made a rectangle red, it analyzes each individually and then unions the resulting answers.
To explain each individual instruction, the Whyline uses two analyses: (1) determining why an instruction was not executed, and (2) determining why a particular dynamic data dependency did not occur. Each of these is constrained by two types of scope. Temporal scope affects what events it considers. For example, a developer may ask about something that did not occur after a specific event, but may have occurred in other situations. Therefore, why didn’t analyses only search through events that occurred after the event selected by the time cursor (see Figure 1) and before the end of the program. This omits other executions of events and reduces the amount of information to process. (We could have supported scopes that end at a time different than the end of the program, but we chose to keep scope selection simple. This may be extended in the future). Identity scope considers what object(s) the developer has expressed interest in. For example, if they have selected a particular entity, the analyses are restricted to events on those entities. If they have selected a render event, only entities represented by that graphical primitive are considered.
6
Why was this instruction not executed? To explain why an instruction was not executed, the first thing the Whyline does is check if it did execute. Our prior studies [8,10] have shown that developers are often prone to misperceiving output, and believe something has occurred when it has not (for example, believing that something did not change color, when it did, but then changed back). By supporting why didn’t questions about things that did happen, the Whyline can reveal these assumptions. If the instruction did not execute, the Whyline uses an algorithm (which we call /1=&2*+."01.;) to explain why. Essentially, if the method
of the instruction being analyzed was not executed within the time chosen by the user, there are few potential reasons why:
• It has no known callers (although such a call may exist, but its class may not have been dynamically loaded).
• A caller of the instruction’s method’s did execute, but on a different instance.
• None of the method’s callers executed; the algorithm then recursively explains why each potential caller was not reached.
If the instruction’s method was executed, there are many possible reasons why the instruction was not reached:
• The method executed, but the instruction of interest had not yet.
• A caught exception jumped over the instruction of interest, or the method exited because of an uncaught exception.
• None of the instruction’s control dependencies executed (such as an (I or )/(*01); the algorithm recursively explains why
none of these control dependencies executed.
• One of the instruction’s control dependencies did execute, but jumped to the wrong target, skipping over the instruction.
For most questions, there are one or more objects of interest (for example, the button clicked on or the set of entities represented by a rectangle). In the algorithm above, if a call to a method is found, it is only analyzed if it executed using the object of interest as the instance invoked on or as an argument. For example, if the user has asked why a method did not execute on a particular button, and some upstream caller did execute, the algorithm checks to see if the specific button was referenced. As the algorithm traverses calls, the local variable that would reference the object of interest is tracked through invocations (for example, in one call the object may be the instance, but in an upstream call, it may be an argument). If at any point, the local is not a method argument, the algorithm stops tracking identity and analyzes all potential callers.
The result of the algorithm is a directed graph (not a tree, because of recursion), with nodes consisting of invocations and conditional instructions that were not reached. Nodes that involve an invocation on a different object or a conditional branching in the wrong direction also have a causal chain of events attached, explaining the source of the wrong object, or the values of the conditional’s expression (Figure 7.4), respectively.
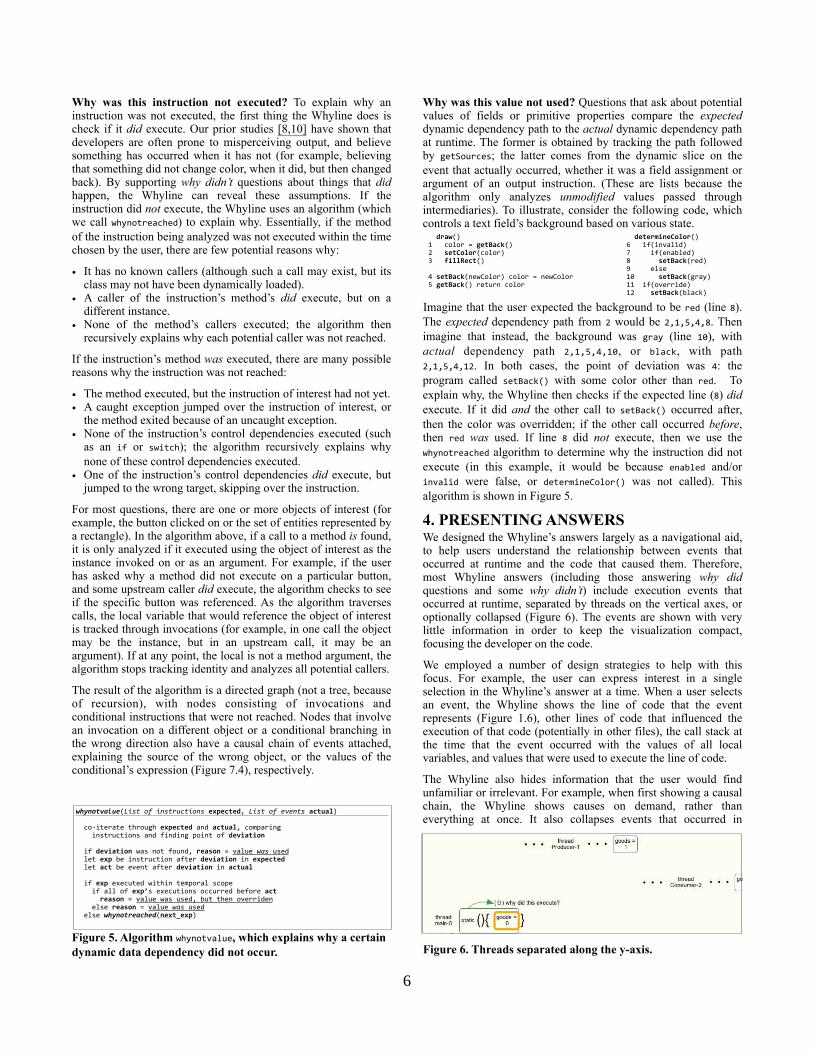
Why was this value not used? Questions that ask about potential values of fields or primitive properties compare the expected dynamic dependency path to the actual dynamic dependency path at runtime. The former is obtained by tracking the path followed by '.*A2,+0.); the latter comes from the dynamic slice on the
event that actually occurred, whether it was a field assignment or argument of an output instruction. (These are lists because the algorithm only analyzes unmodified values passed through intermediaries). To illustrate, consider the following code, which controls a text field’s background based on various state.
Imagine that the user expected the background to be +.; (line V).
The expected dependency path from 8 would be 8JWJXJYJV. Then
imagine that instead, the background was '+"= (line WZ), with
actual dependency path 8JWJXJYJWZ, or F%"04, with path
8JWJXJYJW8. In both cases, the point of deviation was Y: the
program called ).*["04GH with some color other than +.;. To
explain why, the Whyline then checks if the expected line (V) did
execute. If it did and the other call to ).*["04GH occurred after,
then the color was overridden; if the other call occurred before, then +.; was used. If line V did not execute, then we use the
/1=&2*+."01.; algorithm to determine why the instruction did not
execute (in this example, it would be because .&"F%.; and/or
(&#"%(; were false, or ;.*.+-(&.U2%2+GH was not called). This
algorithm is shown in Figure 5.
4. PRESENTING ANSWERSWe designed the Whyline’s answers largely as a navigational aid, to help users understand the relationship between events that occurred at runtime and the code that caused them. Therefore, most Whyline answers (including those answering why did questions and some why didn’t) include execution events that occurred at runtime, separated by threads on the vertical axes, or optionally collapsed (Figure 6). The events are shown with very little information in order to keep the visualization compact, focusing the developer on the code.
We employed a number of design strategies to help with this focus. For example, the user can express interest in a single selection in the Whyline’s answer at a time. When a user selects an event, the Whyline shows the line of code that the event represents (Figure 1.6), other lines of code that influenced the execution of that code (potentially in other files), the call stack at the time that the event occurred with the values of all local variables, and values that were used to execute the line of code.
The Whyline also hides information that the user would find unfamiliar or irrelevant. For example, when first showing a causal chain, the Whyline shows causes on demand, rather than everything at once. It also collapses events that occurred in
55(-0JGHW55502%2+5P5K&$D0/1GH8555#&$9*'*-G02%2+H\555%!''4&/$GH
Y5#&$D0/1G&./U2%2+H502%2+5P5&./U2%2+X5K&$D0/1GH5+.*,+&502%2+
55(&$&-+!"&9*'*-GH]555(IG(&#"%(;H^55555(IG.&"F%.;HV5555555#&$D0/1G+.;H_55555.%).WZ555555#&$D0/1G'+"=HWW55(IG2#.++(;.HW85555#&$D0/1GF%"04H
/01-*)."23'G;(#$*).*("#$%&'$()"#5&LM&/$&(J5;(#$*).*-/-"$#*0/$.0'H
5502`(*.+"*.5*1+2,'15&LM&/$&(5"&;50/$.0'J502-7"+(&'5555(&)*+,0*(2&)5"&;5I(&;(&'572(&*52I5(&N!0$!*"
55(I5(&N!0$!*"5/")5&2*5I2,&;J5-&0#*"5P5#"%,.5<0#5,).;55%.*5&LM)F.5(&)*+,0*(2&5"I*.+5(&N!0$!*"5(&5&LM&/$&(55%.*50/$5F.5.#.&*5"I*.+5(&N!0$!*"5(&50/$.0'
55(I5&LM5.M.0,*.;5/(*1(&5*.-72+"%5)027.5555(I5"%%52I5&LMN)5.M.0,*(2&))200,++.;5F.I2+.50/$555555-&0#*"5P5#"%,.5/")5,).;J5F,*5*1.&52#.++(;.&5555.%).5-&0#*"5P5#"%,.5<0#5,).;55.%).5/01-*)#'"(0'4G"&L$O&LMH
Figure 5. Algorithm /1=&2*#"%,., which explains why a certain
dynamic data dependency did not occur. Figure 6. Threads separated along the y-axis.
7
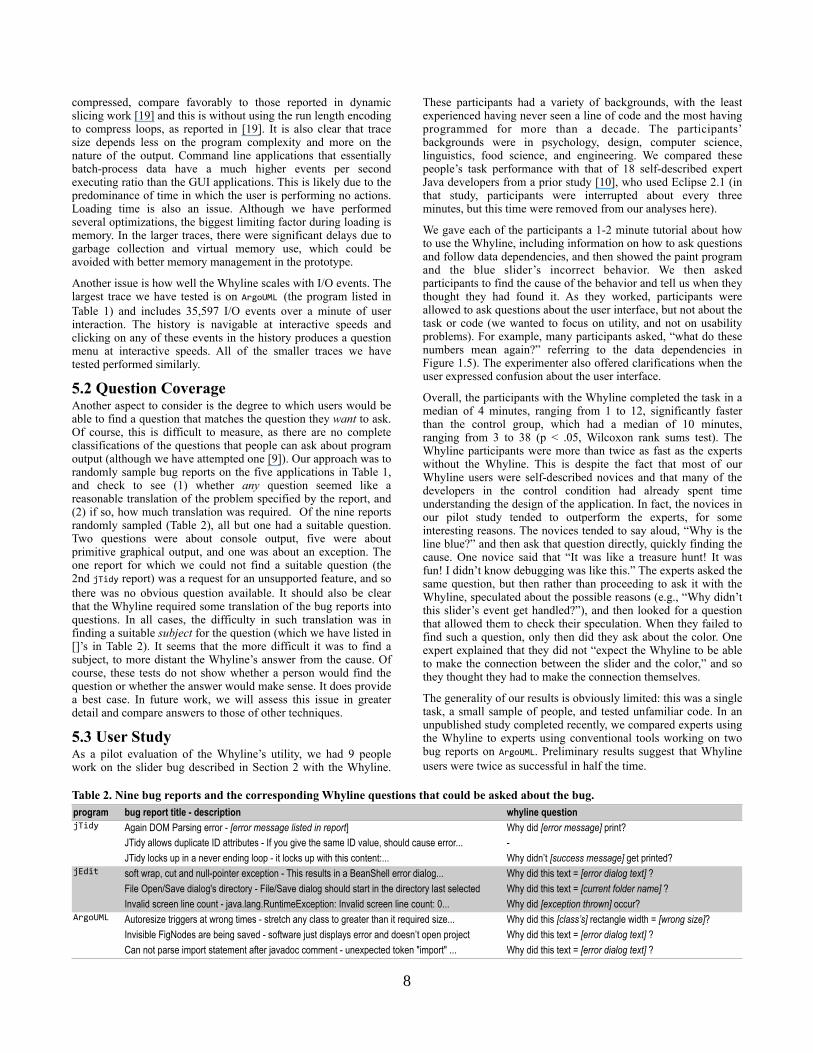
unfamiliar methods (using the same definition as in question derivation), effectively black boxing API calls and other code for which the developer has no source (Figure 7.1). In addition, if events from familiar code occur in methods that were called by unfamiliar methods (for example, a user-defined call back method called by an API), those events are shown, but the surrounding calling context is not (Figure 7.2). Both of these filtering mechanisms dramatically reduce the number of events presented in a dynamic slice (a major criticism of slicing in the past [2]). One could argue that it gives just the right amount of information, assuming the familiarity metric is right; after all, if everything in a slice is familiar, anything in that slice might be a candidate for a bug fix. Another form of filtering is to only include certain types of events in the causal chains. These include invocations, branches, returns, argument values, and assignments, but not uses of variables or the results of computation. These latter two are visible statically from the code, and thus redundant.
The Whyline also provides a simple navigational model for exploring an answer. The left and right arrows go back and forth in a causal chain. The down arrow acts like a breakpoint debugger’s “step into” command, going into the next method’s invocation. The up arrow goes back to the most recent conditional or invocation. Data dependencies for the current selection are always shown above or below the event, and in the source code (Figure 1.5, 1.6). To navigate to one, the user simply clicks the arrow or types the dependency number shown. By default, this command finds the “source” of a value, which is where the value was computed or instantiated (the direct data dependency is reached using a modifier key). For example, an argument may be passed through multiple methods, and ultimately come from a constant assigned to a field. This “go to source” command jumps to the constant, skipping argument passing. Finally, in a study of developers doing program understanding tasks [10], “peeking” at a control or data dependency, and then returning back to a line of code was quite common. Therefore, for every action affecting the selection in our prototype, backspace always goes back to the prior selection, giving users confidence that they will be able to return to their previous location after a navigation.
For why didn’t answers, the Whyline also includes instructions that were not executed (Figure 7.3). This represents a subgraph of the call graph that needed to execute for the output in question to occur. When selected, the Whyline shows the code for the unexecuted instruction, and draws arrows from the instructions that could have caused the selection to execute. The Whyline includes events when the answer includes a conditional or call that branched in the wrong direction. For example, in Figure 7.4, the Whyline shows that an instruction was not executed because the conditional evaluated to true.
5. EVALUATION
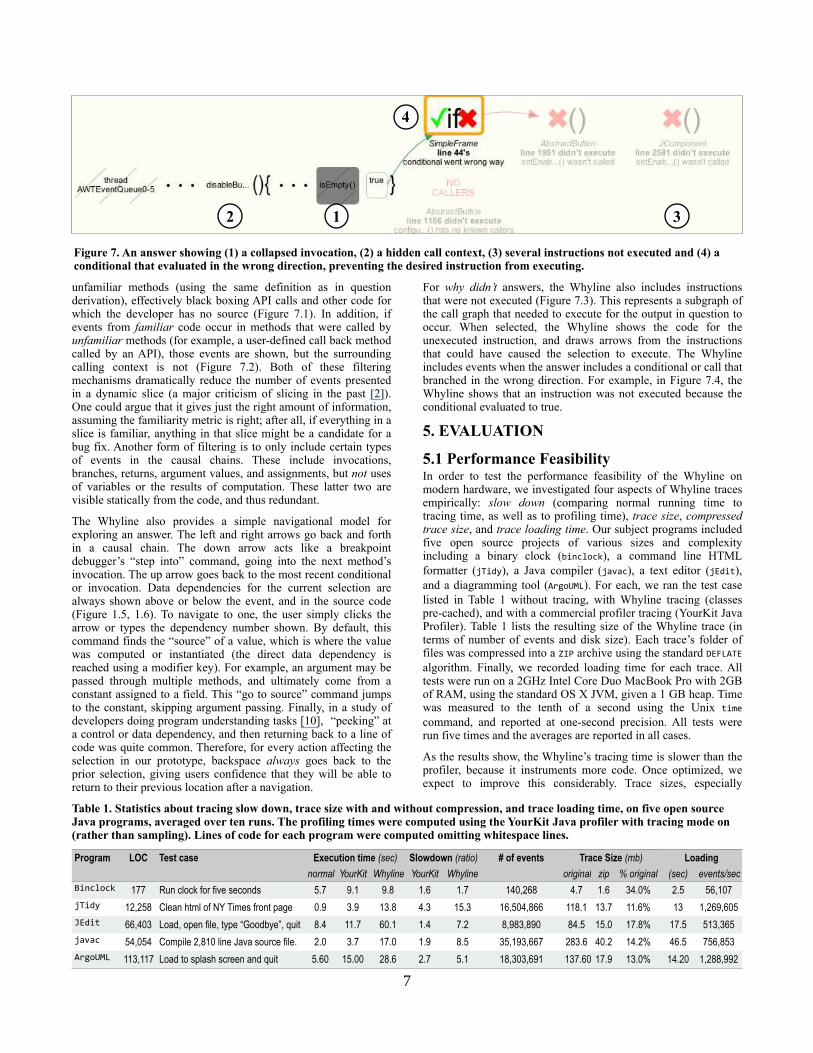
5.1 Performance FeasibilityIn order to test the performance feasibility of the Whyline on modern hardware, we investigated four aspects of Whyline traces empirically: slow down (comparing normal running time to tracing time, as well as to profiling time), trace size, compressed trace size, and trace loading time. Our subject programs included five open source projects of various sizes and complexity including a binary clock (F(&0%204), a command line HTML
formatter (!E(;=), a Java compiler (!"#"0), a text editor (!>;(*),
and a diagramming tool (O+'2a?b). For each, we ran the test case
listed in Table 1 without tracing, with Whyline tracing (classes pre-cached), and with a commercial profiler tracing (YourKit Java Profiler). Table 1 lists the resulting size of the Whyline trace (in terms of number of events and disk size). Each trace’s folder of files was compressed into a cDB archive using the standard 9>dbOE>
algorithm. Finally, we recorded loading time for each trace. All tests were run on a 2GHz Intel Core Duo MacBook Pro with 2GB of RAM, using the standard OS X JVM, given a 1 GB heap. Time was measured to the tenth of a second using the Unix *(-.
command, and reported at one-second precision. All tests were run five times and the averages are reported in all cases.
As the results show, the Whyline’s tracing time is slower than the profiler, because it instruments more code. Once optimized, we expect to improve this considerably. Trace sizes, especially
Figure 7. An answer showing (1) a collapsed invocation, (2) a hidden call context, (3) several instructions not executed and (4) a conditional that evaluated in the wrong direction, preventing the desired instruction from executing.
2 1
Program LOC Test case Execution time (sec) Slowdown (ratio) # of events Trace Size (mb) Loading
normal YourKit Whyline YourKit Whyline original zip % original (sec) events/sec
[(&0%204 177 Run clock for five seconds 5.7 9.1 9.8 1.6 1.7 140,268 4.7 1.6 34.0% 2.5 56,107
!E(;= 12,258 Clean html of NY Times front page 0.9 3.9 13.8 4.3 15.3 16,504,866 118.1 13.7 11.6% 13 1,269,605
e>;(* 66,403 Load, open file, type “Goodbye”, quit 8.4 11.7 60.1 1.4 7.2 8,983,890 84.5 15.0 17.8% 17.5 513,365
!"#"0 54,054 Compile 2,810 line Java source file. 2.0 3.7 17.0 1.9 8.5 35,193,667 283.6 40.2 14.2% 46.5 756,853
O+'2a?b 113,117 Load to splash screen and quit 5.60 15.00 28.6 2.7 5.1 18,303,691 137.60 17.9 13.0% 14.20 1,288,992
Table 1. Statistics about tracing slow down, trace size with and without compression, and trace loading time, on five open source Java programs, averaged over ten runs. The profiling times were computed using the YourKit Java profiler with tracing mode on (rather than sampling). Lines of code for each program were computed omitting whitespace lines.
3
4
8
compressed, compare favorably to those reported in dynamic slicing work [19] and this is without using the run length encoding to compress loops, as reported in [19]. It is also clear that trace size depends less on the program complexity and more on the nature of the output. Command line applications that essentially batch-process data have a much higher events per second executing ratio than the GUI applications. This is likely due to the predominance of time in which the user is performing no actions. Loading time is also an issue. Although we have performed several optimizations, the biggest limiting factor during loading is memory. In the larger traces, there were significant delays due to garbage collection and virtual memory use, which could be avoided with better memory management in the prototype.
Another issue is how well the Whyline scales with I/O events. The largest trace we have tested is on O+'2a?b5 (the program listed in
Table 1) and includes 35,597 I/O events over a minute of user interaction. The history is navigable at interactive speeds and clicking on any of these events in the history produces a question menu at interactive speeds. All of the smaller traces we have tested performed similarly.
5.2 Question CoverageAnother aspect to consider is the degree to which users would be able to find a question that matches the question they want to ask. Of course, this is difficult to measure, as there are no complete classifications of the questions that people can ask about program output (although we have attempted one [9]). Our approach was to randomly sample bug reports on the five applications in Table 1, and check to see (1) whether any question seemed like a reasonable translation of the problem specified by the report, and (2) if so, how much translation was required. Of the nine reports randomly sampled (Table 2), all but one had a suitable question. Two questions were about console output, five were about primitive graphical output, and one was about an exception. The one report for which we could not find a suitable question (the 2nd !E(;= report) was a request for an unsupported feature, and so
there was no obvious question available. It should also be clear that the Whyline required some translation of the bug reports into questions. In all cases, the difficulty in such translation was in finding a suitable subject for the question (which we have listed in []’s in Table 2). It seems that the more difficult it was to find a subject, to more distant the Whyline’s answer from the cause. Of course, these tests do not show whether a person would find the question or whether the answer would make sense. It does provide a best case. In future work, we will assess this issue in greater detail and compare answers to those of other techniques.
5.3 User StudyAs a pilot evaluation of the Whyline’s utility, we had 9 people work on the slider bug described in Section 2 with the Whyline.
These participants had a variety of backgrounds, with the least experienced having never seen a line of code and the most having programmed for more than a decade. The participants’ backgrounds were in psychology, design, computer science, linguistics, food science, and engineering. We compared these people’s task performance with that of 18 self-described expert Java developers from a prior study [10], who used Eclipse 2.1 (in that study, participants were interrupted about every three minutes, but this time were removed from our analyses here).
We gave each of the participants a 1-2 minute tutorial about how to use the Whyline, including information on how to ask questions and follow data dependencies, and then showed the paint program and the blue slider’s incorrect behavior. We then asked participants to find the cause of the behavior and tell us when they thought they had found it. As they worked, participants were allowed to ask questions about the user interface, but not about the task or code (we wanted to focus on utility, and not on usability problems). For example, many participants asked, “what do these numbers mean again?” referring to the data dependencies in Figure 1.5). The experimenter also offered clarifications when the user expressed confusion about the user interface.
Overall, the participants with the Whyline completed the task in a median of 4 minutes, ranging from 1 to 12, significantly faster than the control group, which had a median of 10 minutes, ranging from 3 to 38 (p < .05, Wilcoxon rank sums test). The Whyline participants were more than twice as fast as the experts without the Whyline. This is despite the fact that most of our Whyline users were self-described novices and that many of the developers in the control condition had already spent time understanding the design of the application. In fact, the novices in our pilot study tended to outperform the experts, for some interesting reasons. The novices tended to say aloud, “Why is the line blue?” and then ask that question directly, quickly finding the cause. One novice said that “It was like a treasure hunt! It was fun! I didn’t know debugging was like this.” The experts asked the same question, but then rather than proceeding to ask it with the Whyline, speculated about the possible reasons (e.g., “Why didn’t this slider’s event get handled?”), and then looked for a question that allowed them to check their speculation. When they failed to find such a question, only then did they ask about the color. One expert explained that they did not “expect the Whyline to be able to make the connection between the slider and the color,” and so they thought they had to make the connection themselves.
The generality of our results is obviously limited: this was a single task, a small sample of people, and tested unfamiliar code. In an unpublished study completed recently, we compared experts using the Whyline to experts using conventional tools working on two bug reports on O+'2a?b. Preliminary results suggest that Whyline
users were twice as successful in half the time.
program bug report title - description whyline question
!E(;= Again DOM Parsing error - [error message listed in report] Why did [error message] print?
JTidy allows duplicate ID attributes - If you give the same ID value, should cause error... -
JTidy locks up in a never ending loop - it locks up with this content:... Why didn’t [success message] get printed?
!>;(* soft wrap, cut and null-pointer exception - This results in a BeanShell error dialog... Why did this text = [error dialog text] ?
File Open/Save dialog's directory - File/Save dialog should start in the directory last selected Why did this text = [current folder name] ?
Invalid screen line count - java.lang.RuntimeException: Invalid screen line count: 0... Why did [exception thrown] occur?
O+'2a?b Autoresize triggers at wrong times - stretch any class to greater than it required size... Why did this [class’s] rectangle width = [wrong size]?
Invisible FigNodes are being saved - software just displays error and doesn’t open project Why did this text = [error dialog text] ?
Can not parse import statement after javadoc comment - unexpected token "import" ... Why did this text = [error dialog text] ?
Table 2. Nine bug reports and the corresponding Whyline questions that could be asked about the bug.
9
6. RELATED WORKIn the more than half a century of research on debuggers, there have been countless ideas of how to make program understanding easier [18]. Earlier ideas (such as core dumps) were constrained by performance needs, limiting the type and amount of information that a developer could obtain about a program’s execution. As performance became less of a concern, researchers proposed new ways of collecting data and replaying or explore it [12]. However, such techniques failed to consider how users might search through such data. The Whyline is different from other tools in its ability to elicit high relevance, high precision queries from users in an intuitive manner.
One notable approach is Cleve and Zeller’s Delta Debugging, [4] which, given a specification of success and failure, and successful and failing program inputs, can empirically deduce a small chain of failure-inducing events. Similar tools take successful and failing runs of a program and perform other kinds of differential diagnosis [13]. These approaches are quite powerful, but limited to circumstances where the success is simple to specify and possible to demonstrate (typically in situations where a new version of a program has regressed). These techniques could be integrated with the Whyline to provide higher precision answers.
Abraham and Erwig’s goal-directed debugging [1] allows a developer to choose a wrong value in a spreadsheet and specify the correct value. The tool then offers several change suggestions that would cause the program to compute the desired value. This is feasible because of the limited domain of spreadsheet functions and the functional aspect of spreadsheet languages. It remains to be seen if such change suggestions are feasible (or even useful) for more complex imperative languages.
Another area of work is that of static and dynamic program slicing [2], which the Whyline employs in many of its answering algorithms. The Whyline is less a competitor to these approaches and more of a consumer of them. It provides a more reliable way for users to select inputs to these techniques, providing queries of higher relevance than if users chose their queries unassisted. Furthermore, the Whyline is easily capable of taking advantage of advancements in slicing techniques [16]. Slicing is also related to other work in feature location tools, which have similar goals to the Whyline. For example, Eisenberg and De Volder discuss a test case approach to helping users identify portions of a system relevant to a particular behavior [6].
Finally, the Whyline would integrate well with tools that address other difficulties in bug fixing. For example, work on capturing failures in the field [3] could be used to automatically produce a Whyline trace. Bug reports could then contain replicas of failures observed directly by users, which could then be shared, annotated, and analyzed, not only leading to faster debugging, but a form of institutional knowledge that could then be mined for other issues. There may also be useful analyses from tools that focus on diagnosing particular kinds of failures, such as data structure integrity and threading issues [11,15]. The challenge will be to adapt the Whyline’s approach to queries to support these techniques input requirements.
7. LIMITATIONSThe Whyline approach has several limitations. First and foremost, because it is a trace based approach, it is not practical for executions that span more than a few minutes, or those that process or produce substantial amounts of data. It is also impractical for bugs that can only be reproduced without
interference from instrumentation. Tracing also makes the approach feel ‘heavier’ than tools like breakpoint debuggers, which require virtually no setup time compared to the time spent waiting for a Whyline trace to load. All of these issues are worsened by the fact that memory demands on a developer’s machine grows with the size of the trace. At a certain size, performance becomes an issue as the Whyline begins to rely on virtual memory. Better disk bandwidth would alleviate this. Also, there may also be ways to utilize multi core or distributed CPUs to provide dedicated support for trace capture and processing. Another possibility is that there may be ways to only trace at certain times, like today’s performance profilers; the challenge would be that the causes of events might not be captured, even if the effects were.
Because the Whyline extracts all of the knowledge about a program from the program itself, any limitation on the knowledge encoded in a program limits the Whyline’s utility. The simplest example is in identifier names: if a program’s method and field names are cryptic, the Whyline’s questions will be cryptic. In designing for Java, we also relied heavily on its object orientated and statically typed nature. Classes and objects compel developers to separate behaviors and store state in fields; it is the static declaration of such divisions that make it straightforward to reliably identify output-affecting state, to use identifiers in code to name such output, and to identify what code is familiar.
The programming language also effects the precision of the Whyline’s why didn’t answers, due to variations in the precision of call graphs. Dynamically typed languages such as Javascript are most problematic: even with runtime data, one cannot find all possible calls to a method without being conservative and losing precision. Even statically typed late binding languages pose problems: when analyzing why an instruction did not execute, it is necessary to know all of the feasible callers to a particular method. If the Java class containing the invocation that needed to be called was never loaded, the call will not be known, and will not be part of the Whyline’s answer. This can be mitigated by actively loading referenced classes, but traversing too many levels of depth in such a call graph becomes impractical.
Finally, in terms of the Whyline’s utility, the tool itself only helps a developer find code related to a behavior. It does not explain how to change that behavior, nor does it explain how APIs were used to cause the behavior. Answers to why didn’t questions are not intended to be a definitive explanation for why something did not occur, but rather a set of potential explanations. After all, there are many possible fixes to any given problem, and only the developer is capable of choosing the appropriate modification (although the obvious fix often appears as part of the answer, as in Figure 1). The Whyline will help users focus on these more important tasks, rather than wandering around source files, looking for relevant code [10].
8. DISCUSSIONIn designing the Whyline for Java, we were left with several issues to consider. For one, our prototype was limited to graphical, textual, and exception output, but there are obviously other kinds, such as audio, network traffic, and other forms that have yet to come. From our experience, it is clear that while the analyses used to answer questions may generalize, the analyses used to generate questions may not. The user interfaces we provide for querying graphical output are much more complex than for text and exceptions. We took advantage of specific characteristics of graphical output in order to organize and present questions in an
10
understandable manner. This suggests that understanding the user’s perceptions of the structure of output is essential to providing useable and precise ways of querying such output. For example, what characteristics of audio output make sense to inquire about? In other cases, such as network traffic, the structure may be well specified, but the right granularity of analysis may not be clear. Numbers are also an interesting case: should one be able to ask why an integer is not less than 0? How could this be answered? All of these cases deserve further consideration.
Because the Whyline has no special knowledge of user interface toolkits or other APIs, the specificity of the questions and answers is often lacking. For example, if a user is wondering, “why didn’t this window change?” users must choose a suitable substitute, such as “why didn’t this JFrame’s repaint() method get called?” It might be helpful if one could write plug-ins for the Whyline to add special knowledge and heuristics for certain APIs, to improve the specificity of questions and answers, and even offer recommendations about potential fixes for errors.
Although we succeeded in designing a Whyline for Java’s standard I/O interfaces, other languages may not have standard interfaces, or may be more difficult to instrument or prohibitively expensive to track. Furthermore, many programs are written in multiple languages, or produce output that cross machine boundaries. One very common modern example is a Javascript web application: the program that produces output (the browser) is not the same as the program that invokes the output. Execution environments may need special support for capturing such information, and researchers needs to explore capturing traces of programs that run across machines and multiple languages.
Another issue that we have yet to consider empirically is how various aspects of the Whyline might interact with a developer’s work, both in isolation, and in the larger context of collaborative software development. For example, our familiarity metric is fairly effective for a solo developer, but for a developer in an organization, code familiarity may be a rapidly changing thing, defined more by issues of ownership and team dependencies, than by whether they have the source for a method. Another issue is to what degree the Whyline needs to support people collaborating on bug fixing—not just in terms of sharing traces, but also in annotating and discussing them.
9. CONCLUSIONSDebugging remains one of the most challenging aspects of software engineering, partly because today’s tools require users to speculate about the causes of program behavior. We have presented an entirely new way to query program output, allowing the user to obtain evidence about the program’s execution before forming an explanation of the cause. Based on preliminary results, our approach enables people to debug failures substantially faster than traditional tools. In the future, we hope to release our prototype as open source, motivating people to explore the limits of our approach both for Java, and also for other languages and computing architectures.
10. ACKNOWLEDGMENTSThis work was supported by the National Science Foundation under NSF grant IIS-0329090 and the EUSES consortium under NSF grant ITR CCR-0324770. The first author was also supported by NDSEG and NSF Graduate Fellowships.
11. REFERENCES[1] Abraham R. & Erwig M. (2005). Goal-directed debugging of
spreadsheets, IEEE Symposium on Visual Languages and Human-Centric Computing, Dallas, Texas, 37-44.
[2] Baowen X., Ju Q., Xiaofang Z., Zhongqiang W., & Lin C. (2005). A brief survey of program slicing, SIGSOFT Software Engineering Notes, 30, 2, 1-36.
[3] Clause J. & Orso A. (2007). A technique for enabling and supporting debugging of field failures, International Conference on Software Engineering, Minneapolis, MN, 261-270.
[4] Cleve H. & Zeller A. (2005). Locating causes of program failures. International Conference on Software Engineering, St. Louis, MI, 342-351.
[5] Cooper K.D., Harvey T.J. & Kennedy K. (2001). A simple, fast dominance algorithm. Available at http://www.hipersoft.rice.edu/grads/publications/dom14.pdf.
[6] Eisenberg A. & De Volder K. (2005). Dynamic feature traces: finding features in unfamiliar code. International Conference on Software Maintenance, Budapest, Hungary, 337-346.
[7] Ko, A.J. DeLine, R., & Venolia, G. (2007). Information needs in collocated software development teams. International Conference on Software Engineering, Minneapolis, MN, 344-353.
[8] Ko, A.J. & Myers, B.A. (2004). Designing the Whyline: a debugging interface for asking questions about program failures. ACM Conference on Human Factors in Computing Systems, Vienna, Austria, 151-158.
[9] Ko. A. J., Myers, B.A., Chau, D.H. (2006). A linguistic analysis of how people describe software problems. IEEE Visual Languages and Human-Centric Computing, Brighton, UK, 127-134.
[10] Ko. A.J., Myers, B.A., Coblenz, M. & Aung, H.H. (2006). An exploratory study of how developers seek, relate, and collect relevant information during software maintenance tasks. IEEE Transactions on Software Engineering, 32(12), 971-987.
[11] Lencevicius R., Holzle U., & Singh A.K. (2003). Dynamic query-based debugging of object-oriented Programs, Journal of Automated Software Engineering, 10(1), 367-370.
[12] Lewis B. (2003). Debugging backwards in time, International Workshop on Automated Debugging, 225-235.
[13] Liblit B., Naik M., Zheng A., Aiken A. & Jordan M. (2005). Scalable statistical bug isolation. Programming Design and Implementation, Chicago, IL, USA, 15-26.
[14] Myers B.A., Weitzman D., Ko A.J., & Chau D. H. (2006). Answering why and why not questions in user interfaces. ACM Conference on Human Factors in Computing Systems, Montreal, Canada, 397-406.
[15] Potanin A., Noble J., & Biddle R. (2004). Snapshot query-based debugging. Australian Software Engineering Conference, 251.
[16] Sridharan M., Fink S.J., & Bodik R. (2007). Thin slicing. Programming Language Design and Implementation, San Diego, CA, 112-122.
[17] Tassey, G. (2002). The economic impacts of inadequate infrastructure for software testing. National Institute of Standards and Technology, RTI Project Number 7007.011, 2002.
[18] Ungar D., Lieberman H., & Fry C. (1997). Debugging and the experience of immediacy. Communications of the ACM, 40(4) 39-43.
[19] Wang T. & Roychoudhury A. (2004). Using compressed bytecode traces for slicing Java programs, International Conference on Software Engineering, Scotland, UK, 512-521.
[20] Zhang X. & Gupta R. (2005). Whole execution traces and their applications. ACM Transactions on Architecture and Code Optimization, 2(3), 301-334.
Related Documents