www.xedotnet.org Debugging Performance Issues Using Visual Studio Mirco Vanini Microsoft® MVP Windows Development AllSeen Alliance - AllJoyn® Ambassador Open Connectivity Foundation - OCF® Ambassador

Welcome message from author
This document is posted to help you gain knowledge. Please leave a comment to let me know what you think about it! Share it to your friends and learn new things together.
Transcript
www.xedotnet.org
DebuggingPerformanceIssues UsingVisualStudio
MircoVaniniMicrosoft®MVPWindowsDevelopmentAllSeenAlliance- AllJoyn®AmbassadorOpenConnectivityFoundation- OCF®Ambassador
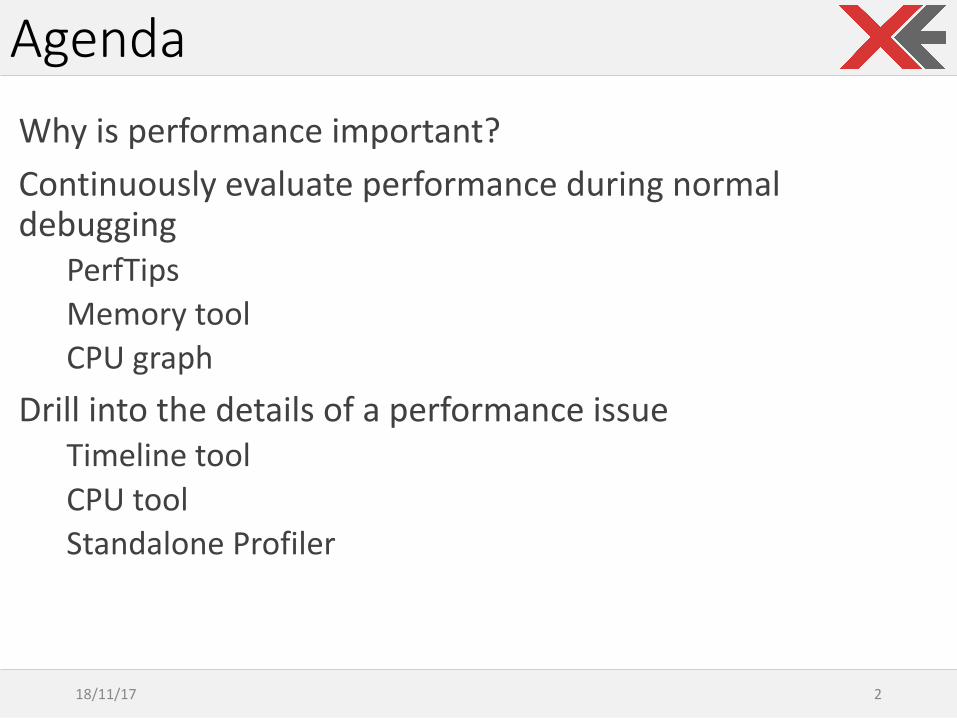
Why is performanceimportant?Continuously evaluate performanceduring normaldebugging
PerfTipsMemorytoolCPUgraph
Drill into thedetails ofaperformanceissueTimeline toolCPUtoolStandalone Profiler
18/11/17 2
Agenda
18/11/17 3
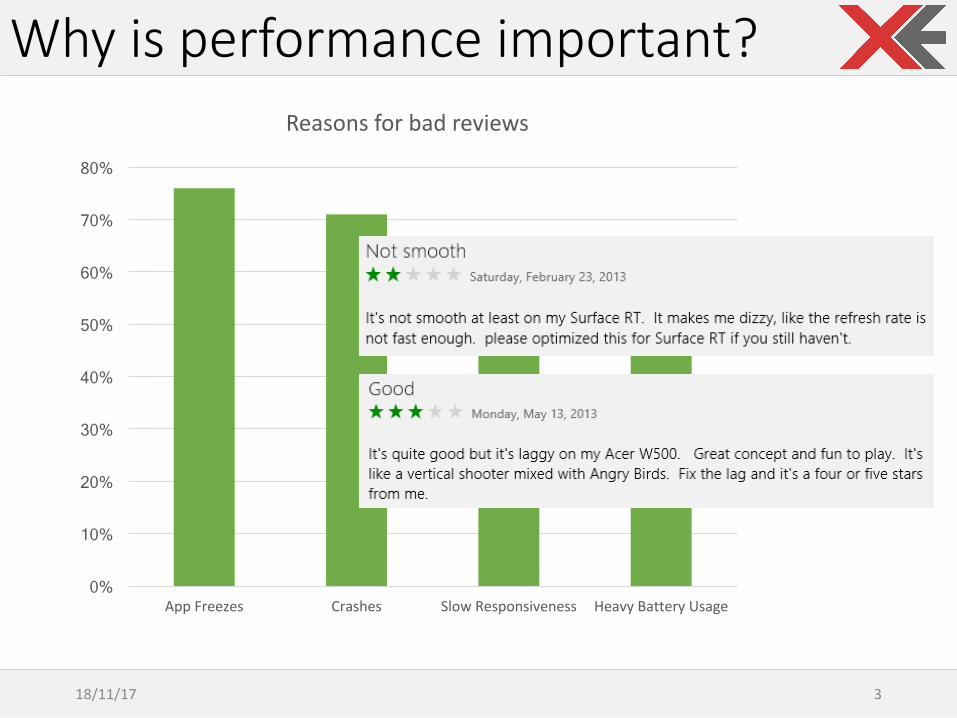
Why is performanceimportant?
0%
10%
20%
30%
40%
50%
60%
70%
80%
AppFreezes Crashes SlowResponsiveness HeavyBatteryUsage
Reasonsforbadreviews
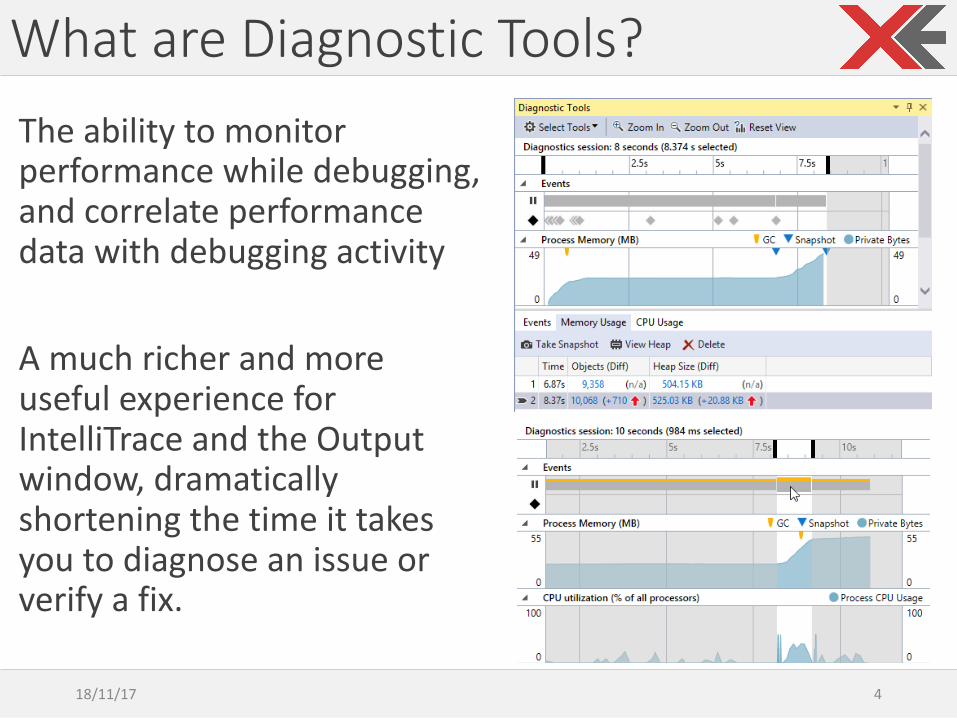
Theability tomonitorperformancewhile debugging,andcorrelateperformancedatawithdebugging activity
Amuch richer andmoreuseful experience forIntelliTrace andtheOutputwindow,dramaticallyshortening thetimeit takesyou todiagnose anissue orverify afix.
18/11/17 4
WhatareDiagnosticTools?
Demo
18/11/17 5
PerfTips(tooltips with performanceinformation)
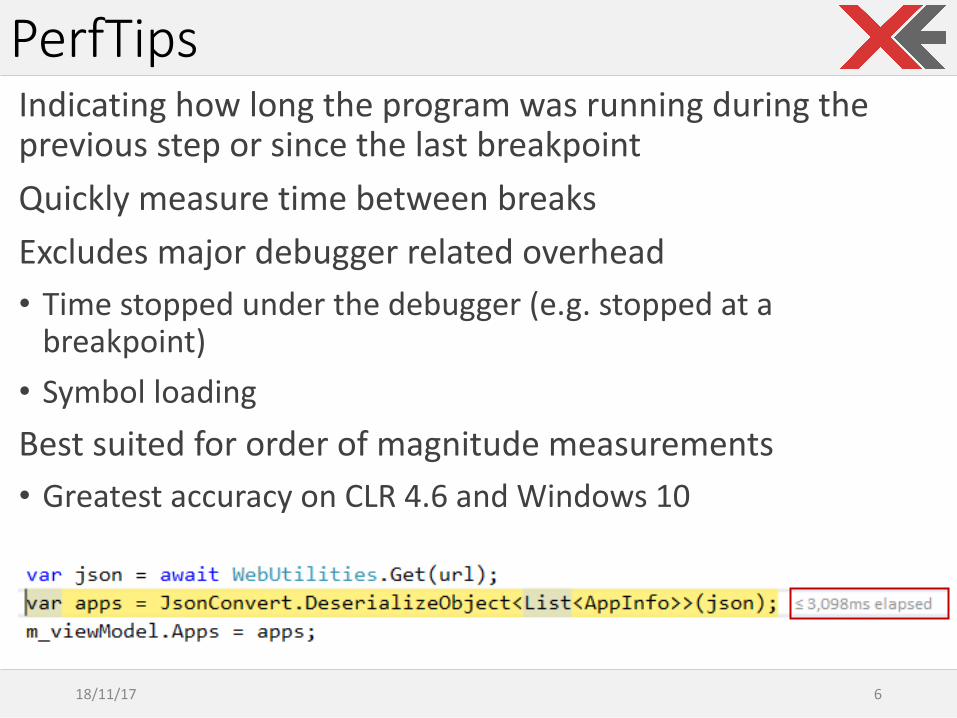
IndicatinghowlongtheprogramwasrunningduringtheprevioussteporsincethelastbreakpointQuickly measure timebetween breaksExcludes majordebugger related overhead• Timestopped underthedebugger (e.g.stopped at abreakpoint)• Symbol loadingBestsuited fororder ofmagnitude measurements• Greatest accuracy onCLR4.6andWindows10
18/11/17 6
PerfTips
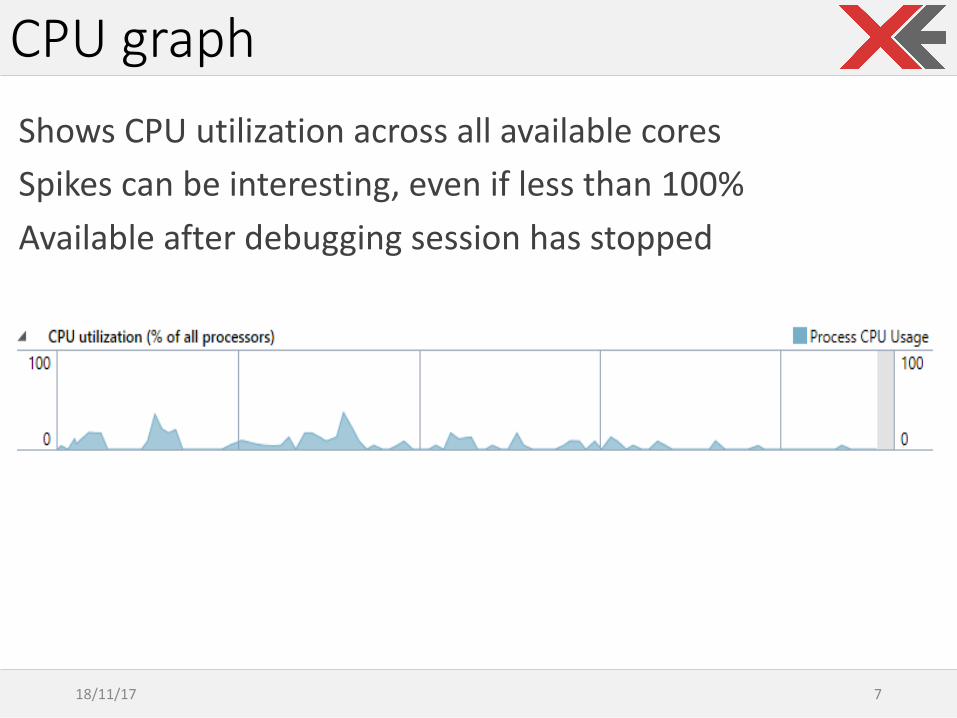
ShowsCPUutilization across all available coresSpikes canbeinteresting,even if less than 100%Available after debugging sessionhas stopped
18/11/17 7
CPUgraph
Thegarbagecollectorservesasanautomaticmemorymanager• Enables you todevelop your application without having tofreememory• Allocates objects onthemanaged heap efficiently• Reclaims objects that arenolonger being used,clears theirmemory,andkeeps thememory available forfutureallocations.Managed objects automatically get cleancontent tostartwith,sotheir constructors donot have toinitialize every datafield• Provides memory safety bymaking sure that anobjectcannot usethecontent ofanother object
18/11/17 8
FundamentalsofGarbageCollection
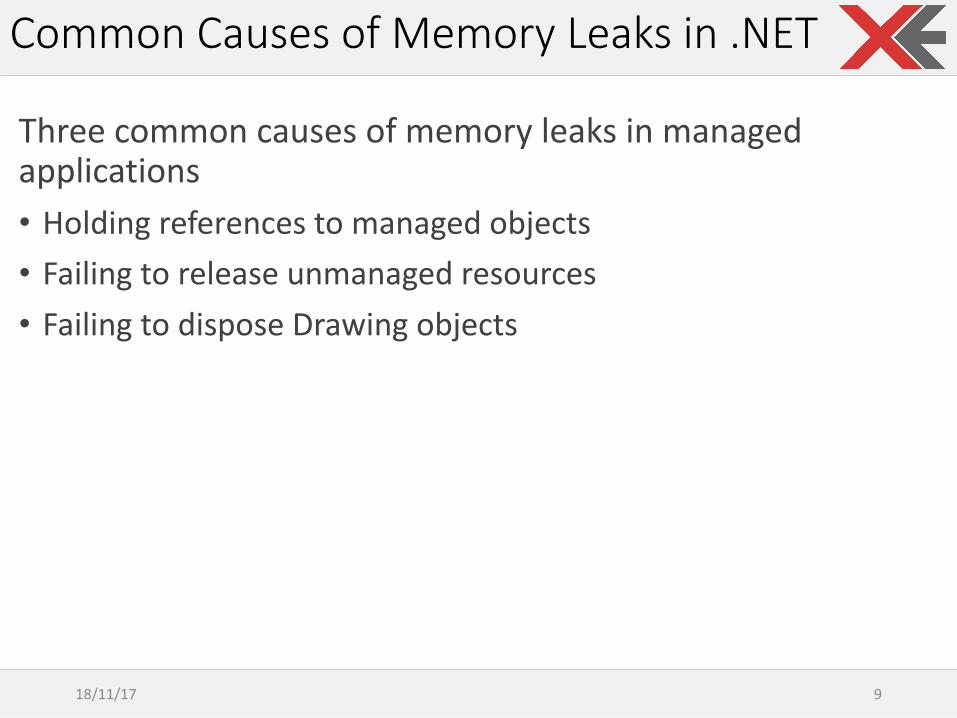
Threecommoncausesofmemoryleaksinmanagedapplications• Holdingreferencestomanagedobjects• Failingtoreleaseunmanagedresources• FailingtodisposeDrawingobjects
18/11/17 9
CommonCauses ofMemoryLeaks in.NET

Demo
18/11/17 10
MemoryTool
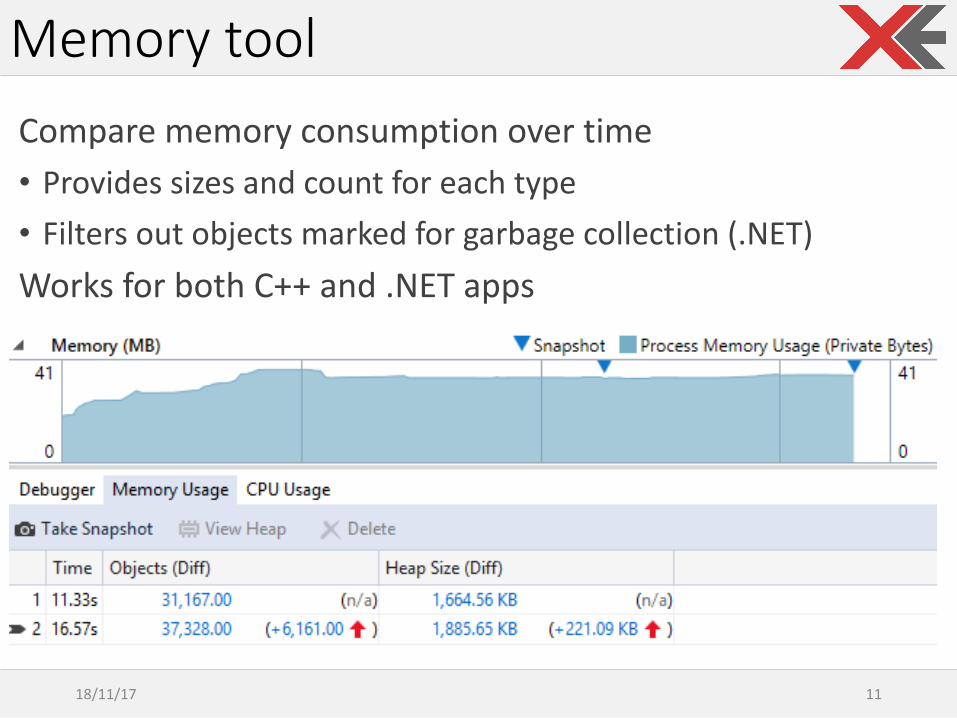
Comparememory consumption overtime• Provides sizes andcount foreach type• Filters outobjects marked forgarbage collection (.NET)Worksforboth C++and.NETapps
18/11/17 11
Memorytool
18/11/17 12
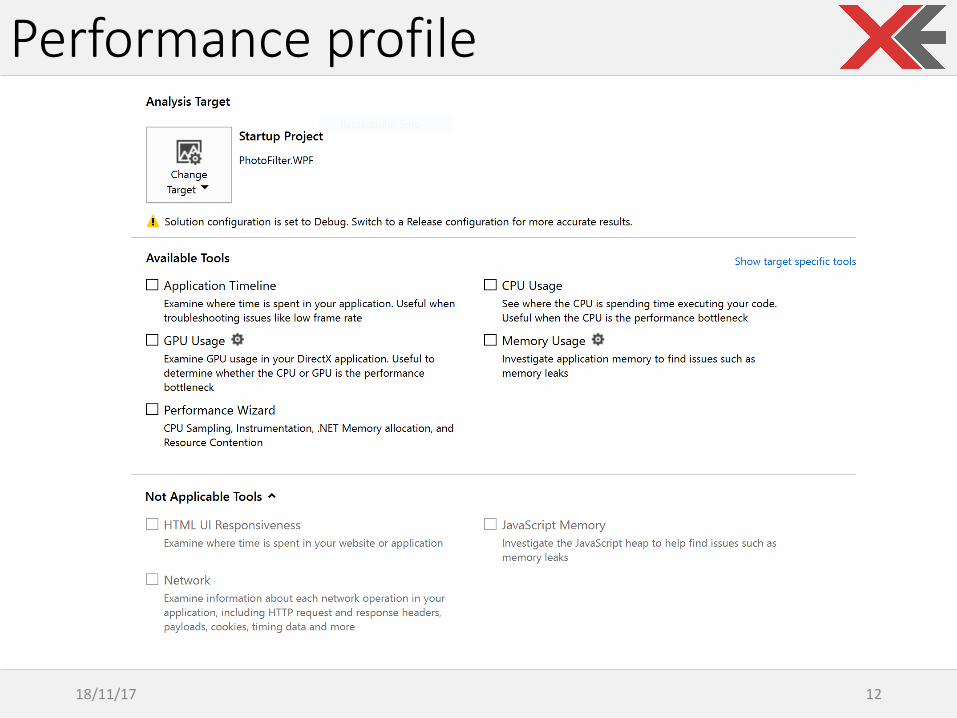
Performanceprofile
18/11/17 13
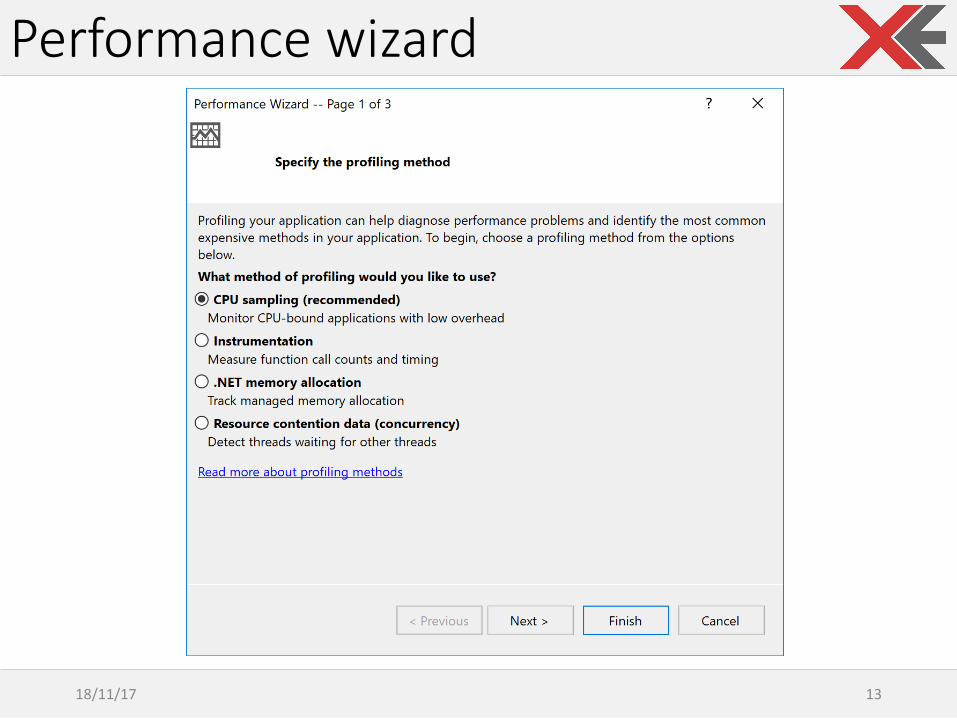
Performancewizard
Demo
18/11/17 14
Timeline Tool
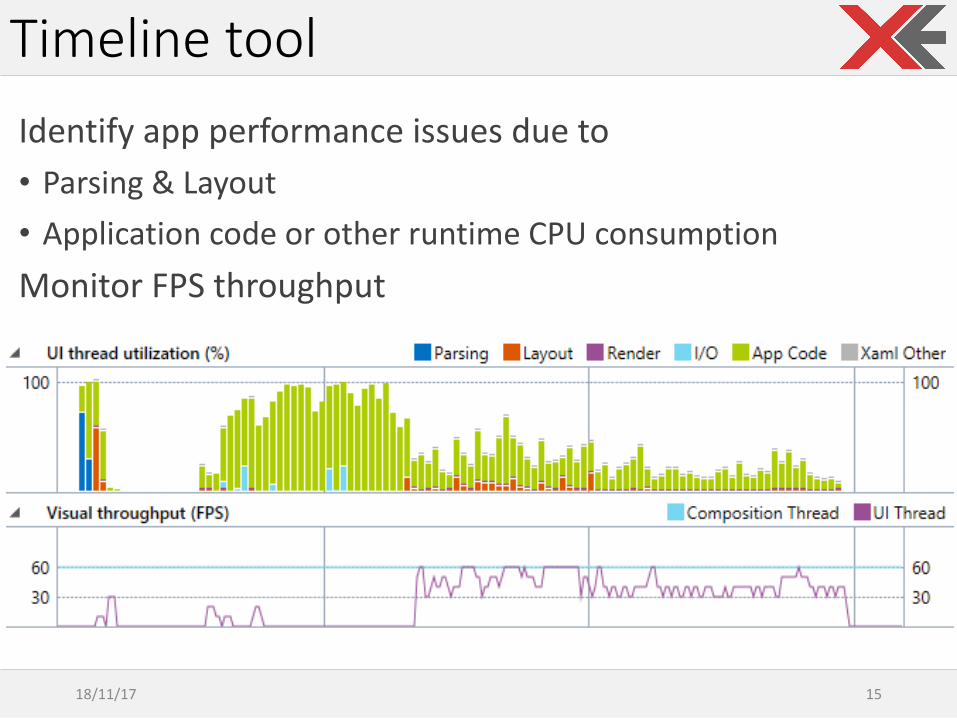
Identify app performanceissues dueto• Parsing &Layout• Applicationcodeorother runtime CPUconsumptionMonitorFPSthroughput
18/11/17 15
Timeline tool
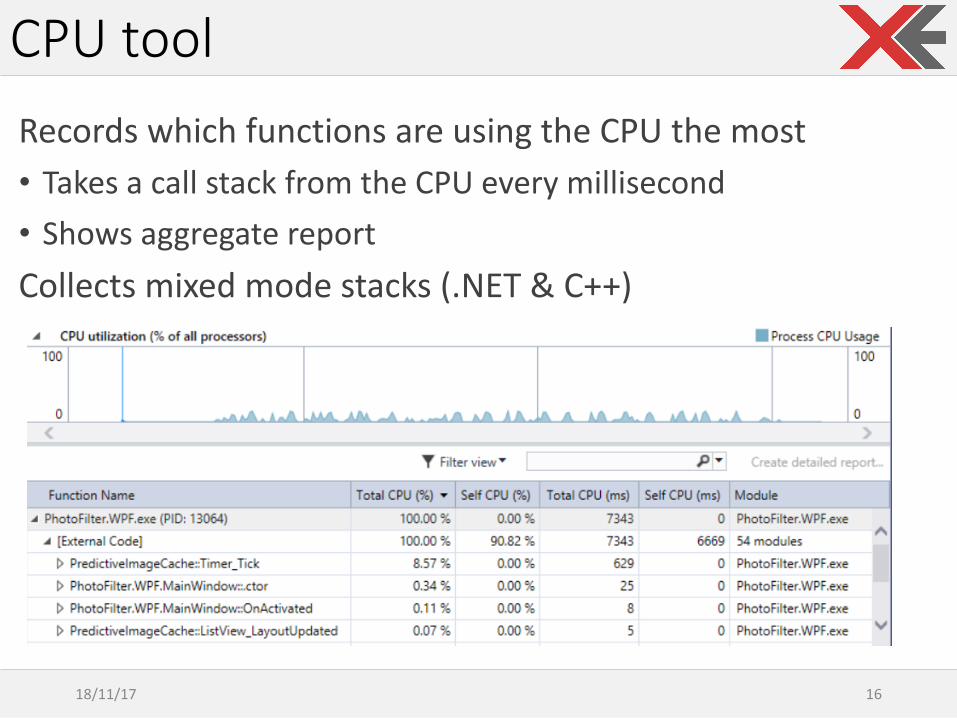
Records which functions areusing theCPUthemost• Takes acallstack fromtheCPUevery millisecond• ShowsaggregatereportCollects mixed modestacks (.NET&C++)
18/11/17 16
CPUtool
PartofVisualStudioRemotetoolsCPUsampling onWindows8+works withx-copyhttps://www.visualstudio.com/downloads/
18/11/17 17
Standalone Profiler
18/11/17 18
Who Iam
[email protected]@MircoVanini
MircoVaniniMicrosoft®MVPWindowsDevelopmentAllSeen Alliance- AllJoyn®AmbassadorOpenConnectivityFoundation- OCF®Ambassador
TinyCLR.it
Related Documents


